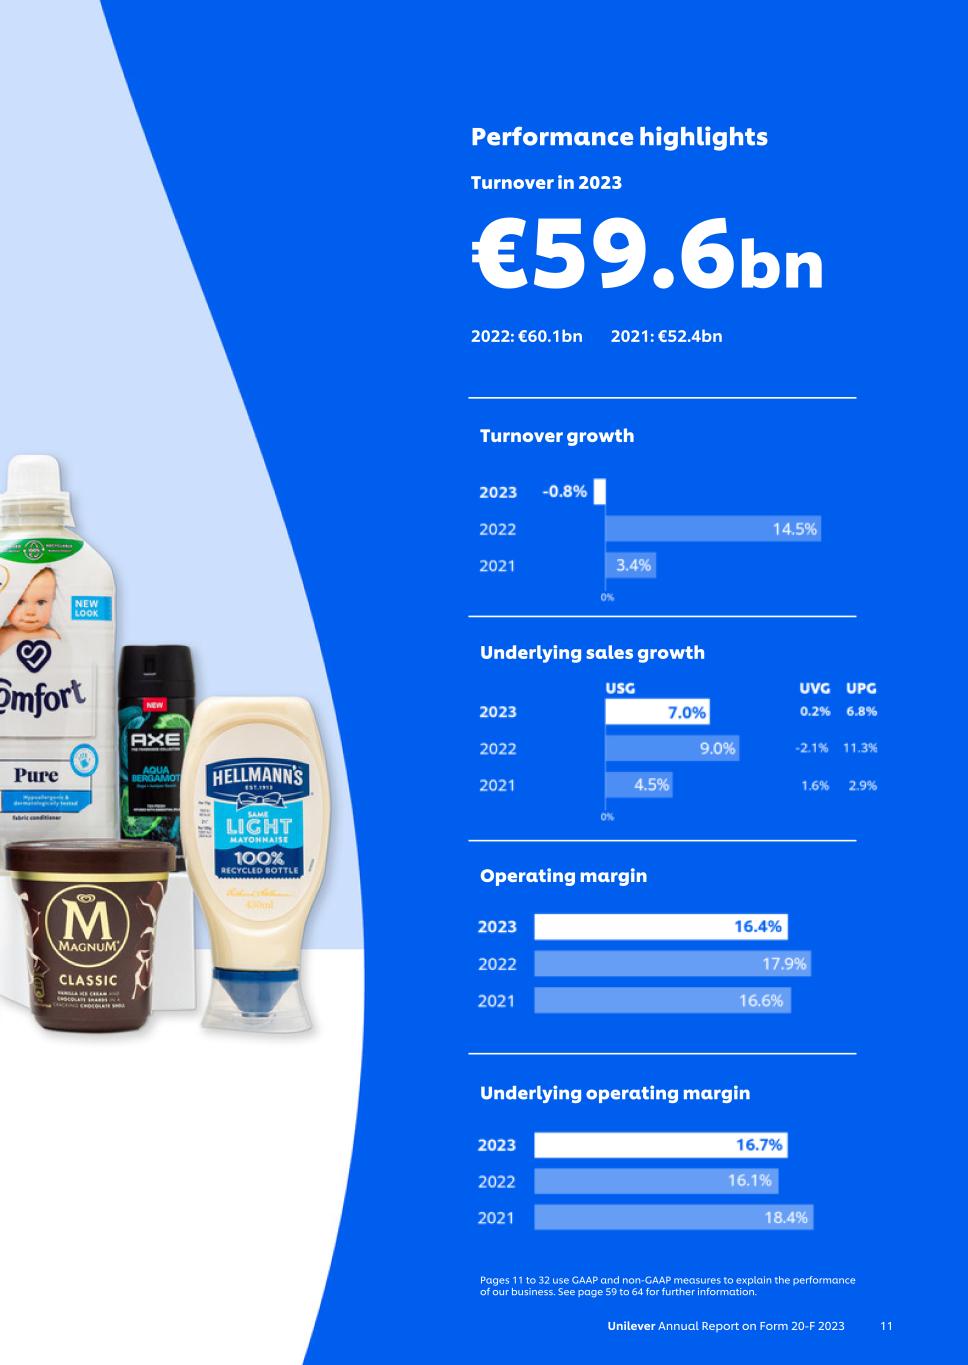
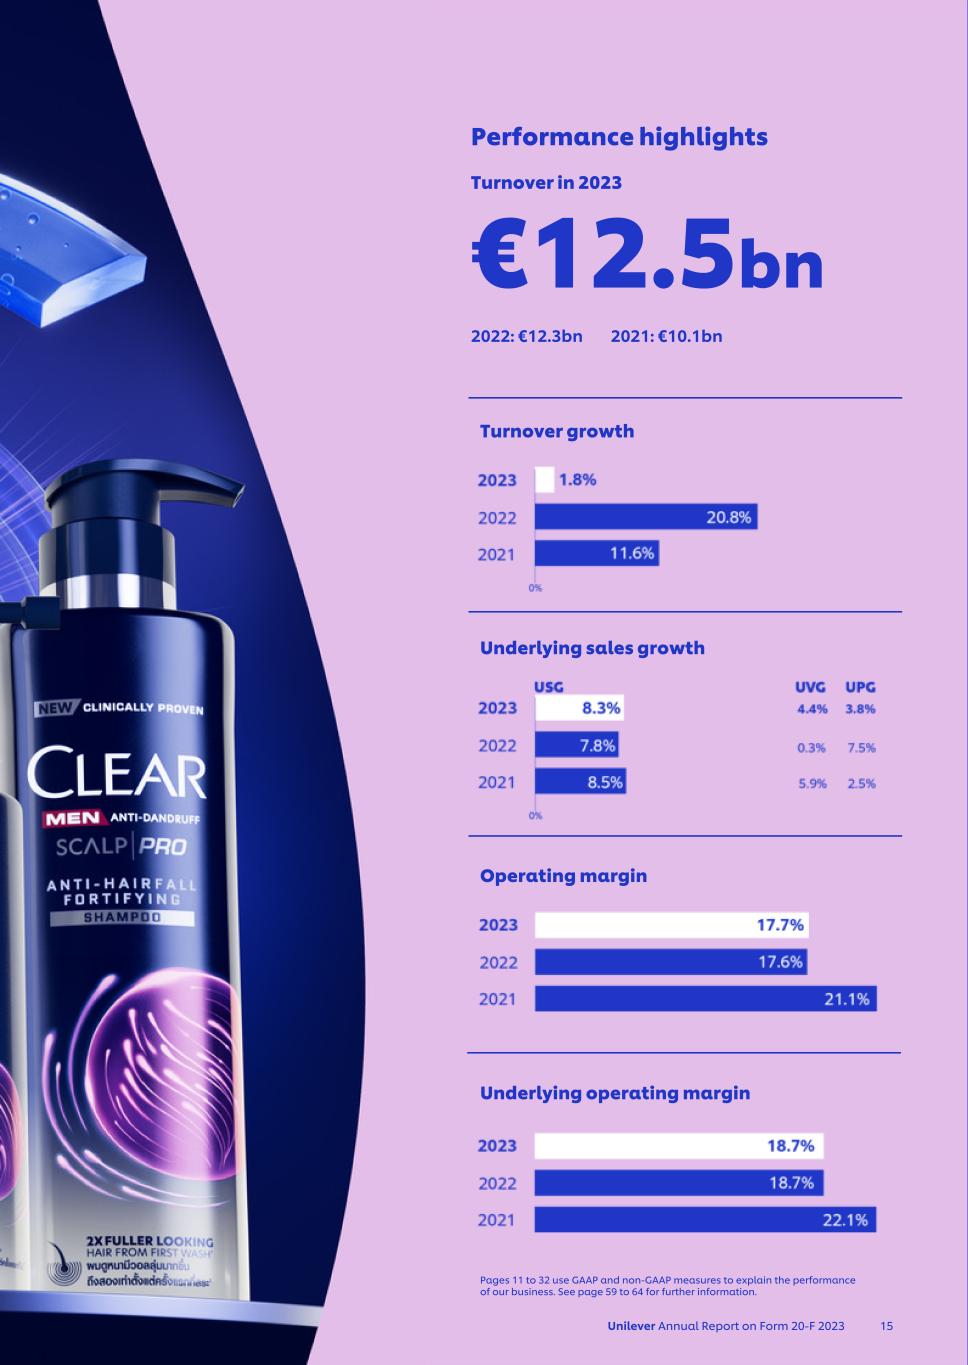
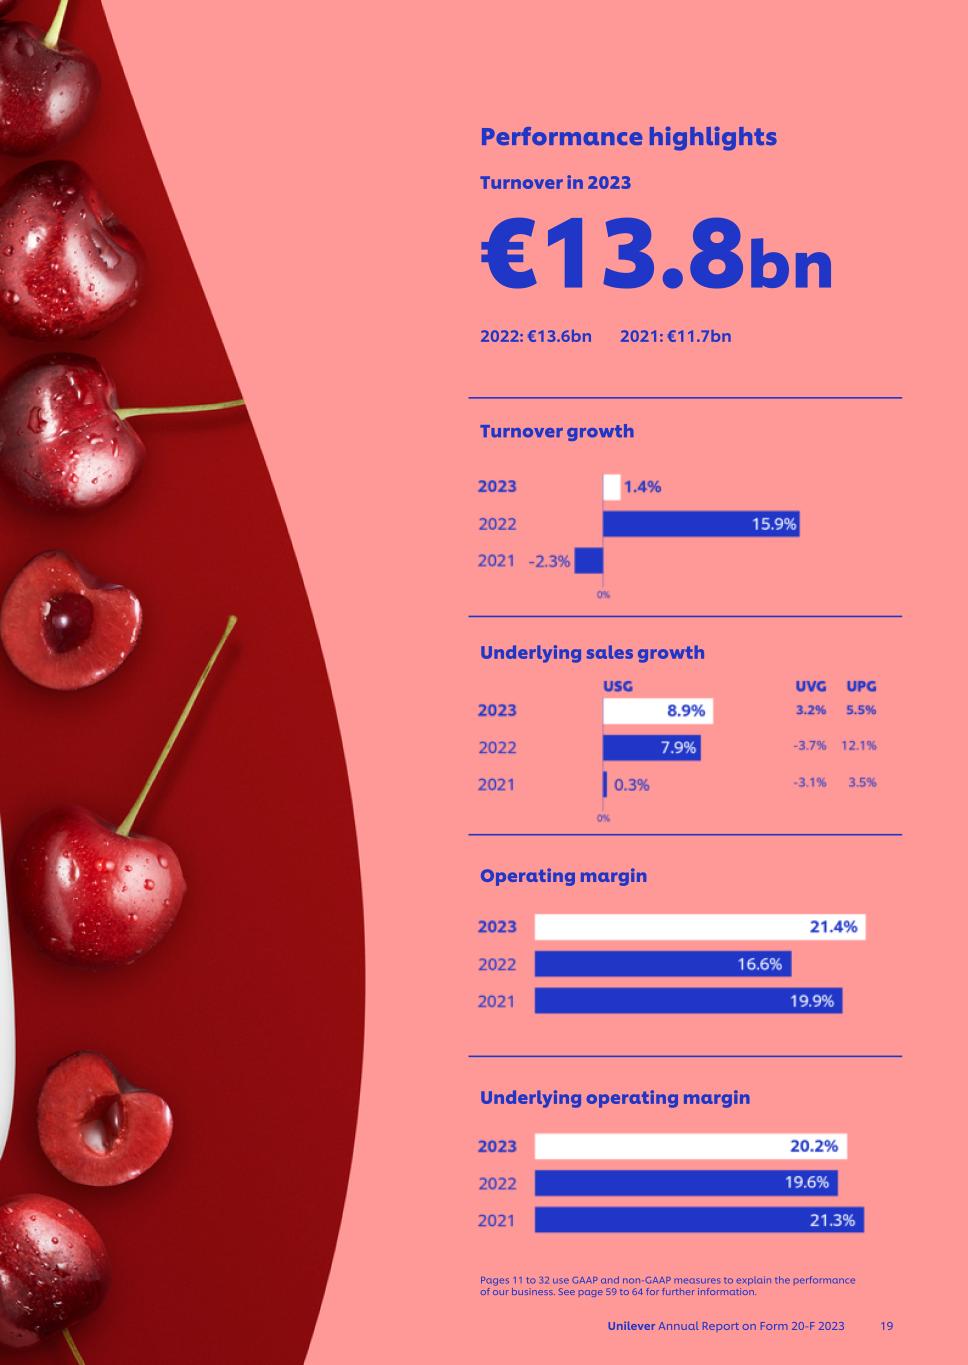
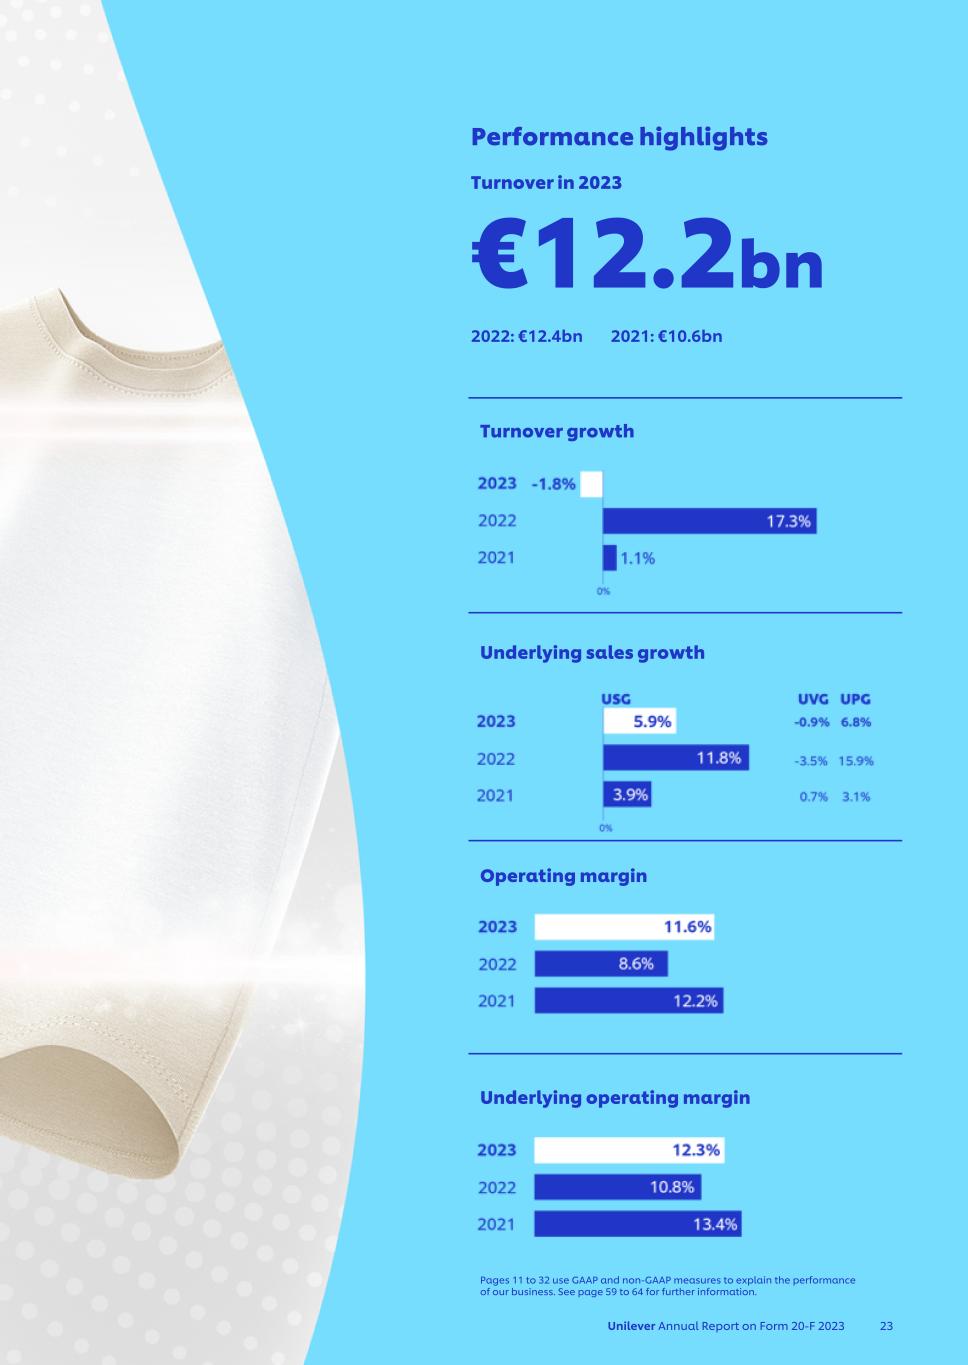
false2023FY000021741000002174102023-01-012023-12-310000217410dei:BusinessContactMember2023-01-012023-12-310000217410ifrs-full:OrdinarySharesMember2023-01-012023-12-310000217410ul:AmericanDepositorySharesMember2023-01-012023-12-3100002174102023-12-31xbrli:sharesiso4217:EUR00002174102022-01-012022-12-3100002174102021-01-012021-12-310000217410ul:EkaterraMember2023-01-012023-12-310000217410ul:EkaterraMember2022-01-012022-12-310000217410ul:EkaterraMember2021-01-012021-12-310000217410ul:SuaveMember2023-01-012023-12-310000217410ul:SuaveMember2022-01-012022-12-310000217410ul:SuaveMember2021-01-012021-12-31iso4217:EURxbrli:shares0000217410ifrs-full:IssuedCapitalMember2020-12-310000217410ifrs-full:SharePremiumMember2020-12-310000217410ul:UnificationReservesMember2020-12-310000217410ifrs-full:OtherReservesMember2020-12-310000217410ifrs-full:RetainedEarningsMember2020-12-310000217410ifrs-full:EquityAttributableToOwnersOfParentMember2020-12-310000217410ifrs-full:NoncontrollingInterestsMember2020-12-3100002174102020-12-310000217410ifrs-full:RetainedEarningsMember2021-01-012021-12-310000217410ifrs-full:EquityAttributableToOwnersOfParentMember2021-01-012021-12-310000217410ifrs-full:NoncontrollingInterestsMember2021-01-012021-12-310000217410ifrs-full:OtherReservesMember2021-01-012021-12-310000217410ifrs-full:SharePremiumMember2021-01-012021-12-310000217410ifrs-full:IssuedCapitalMember2021-12-310000217410ifrs-full:SharePremiumMember2021-12-310000217410ul:UnificationReservesMember2021-12-310000217410ifrs-full:OtherReservesMember2021-12-310000217410ifrs-full:RetainedEarningsMember2021-12-310000217410ifrs-full:EquityAttributableToOwnersOfParentMember2021-12-310000217410ifrs-full:NoncontrollingInterestsMember2021-12-3100002174102021-12-310000217410ifrs-full:RetainedEarningsMemberul:IncreaseDecreaseDueToAdjustmentToClosingEquityInRespectOfHyperinflationInTurkeyMember2021-12-310000217410ifrs-full:EquityAttributableToOwnersOfParentMemberul:IncreaseDecreaseDueToAdjustmentToClosingEquityInRespectOfHyperinflationInTurkeyMember2021-12-310000217410ul:IncreaseDecreaseDueToAdjustmentToClosingEquityInRespectOfHyperinflationInTurkeyMember2021-12-310000217410ifrs-full:IssuedCapitalMemberifrs-full:OpeningBalanceAfterAdjustmentCumulativeEffectAtDateOfInitialApplicationMember2021-12-310000217410ifrs-full:SharePremiumMemberifrs-full:OpeningBalanceAfterAdjustmentCumulativeEffectAtDateOfInitialApplicationMember2021-12-310000217410ul:UnificationReservesMemberifrs-full:OpeningBalanceAfterAdjustmentCumulativeEffectAtDateOfInitialApplicationMember2021-12-310000217410ifrs-full:OtherReservesMemberifrs-full:OpeningBalanceAfterAdjustmentCumulativeEffectAtDateOfInitialApplicationMember2021-12-310000217410ifrs-full:OpeningBalanceAfterAdjustmentCumulativeEffectAtDateOfInitialApplicationMemberifrs-full:RetainedEarningsMember2021-12-310000217410ifrs-full:EquityAttributableToOwnersOfParentMemberifrs-full:OpeningBalanceAfterAdjustmentCumulativeEffectAtDateOfInitialApplicationMember2021-12-310000217410ifrs-full:NoncontrollingInterestsMemberifrs-full:OpeningBalanceAfterAdjustmentCumulativeEffectAtDateOfInitialApplicationMember2021-12-310000217410ifrs-full:OpeningBalanceAfterAdjustmentCumulativeEffectAtDateOfInitialApplicationMember2021-12-310000217410ifrs-full:RetainedEarningsMember2022-01-012022-12-310000217410ifrs-full:EquityAttributableToOwnersOfParentMember2022-01-012022-12-310000217410ifrs-full:NoncontrollingInterestsMember2022-01-012022-12-310000217410ifrs-full:OtherReservesMember2022-01-012022-12-310000217410ifrs-full:IssuedCapitalMember2022-12-310000217410ifrs-full:SharePremiumMember2022-12-310000217410ul:UnificationReservesMember2022-12-310000217410ifrs-full:OtherReservesMember2022-12-310000217410ifrs-full:RetainedEarningsMember2022-12-310000217410ifrs-full:EquityAttributableToOwnersOfParentMember2022-12-310000217410ifrs-full:NoncontrollingInterestsMember2022-12-3100002174102022-12-310000217410ifrs-full:RetainedEarningsMember2023-01-012023-12-310000217410ifrs-full:EquityAttributableToOwnersOfParentMember2023-01-012023-12-310000217410ifrs-full:NoncontrollingInterestsMember2023-01-012023-12-310000217410ifrs-full:OtherReservesMember2023-01-012023-12-310000217410ifrs-full:IssuedCapitalMember2023-01-012023-12-310000217410ifrs-full:IssuedCapitalMember2023-12-310000217410ifrs-full:SharePremiumMember2023-12-310000217410ul:UnificationReservesMember2023-12-310000217410ifrs-full:OtherReservesMember2023-12-310000217410ifrs-full:RetainedEarningsMember2023-12-310000217410ifrs-full:EquityAttributableToOwnersOfParentMember2023-12-310000217410ifrs-full:NoncontrollingInterestsMember2023-12-310000217410ifrs-full:SharePremiumMember2021-06-152021-06-15iso4217:GBP0000217410ul:WellyHealthMember2021-01-012021-12-310000217410ul:NutrafolMemberifrs-full:OtherReservesMember2022-07-070000217410ul:NutrafolMember2022-07-070000217410ul:UnileverPLCMemberifrs-full:OrdinarySharesMember2023-01-012023-12-310000217410country:AR2023-12-310000217410country:TR2023-12-310000217410country:AR2023-01-012023-12-310000217410country:TR2023-01-012023-12-31xbrli:pure0000217410country:RU2022-12-3100002174102022-07-012022-12-31ul:business_groupul:divisionsul:product0000217410ul:HomeCareMemberul:FabricMember2023-01-012023-12-310000217410ul:HomeCareMemberul:FabricMember2022-01-012022-12-310000217410ul:HomeCareMemberul:FabricMember2021-01-012021-12-310000217410ul:IceCreamMemberul:IceCreamProductMember2023-01-012023-12-310000217410ul:IceCreamMemberul:IceCreamProductMember2022-01-012022-12-310000217410ul:IceCreamMemberul:IceCreamProductMember2021-01-012021-12-310000217410ul:BeautyAndWellbeingMemberul:HairCareMember2023-01-012023-12-310000217410ul:BeautyAndWellbeingMemberul:HairCareMember2022-01-012022-12-310000217410ul:BeautyAndWellbeingMemberul:HairCareMember2021-01-012021-12-310000217410ul:NutritionMemberul:ScratchCookingAidsMember2023-01-012023-12-310000217410ul:NutritionMemberul:ScratchCookingAidsMember2022-01-012022-12-310000217410ul:NutritionMemberul:ScratchCookingAidsMember2021-01-012021-12-310000217410ul:SkinCleasningMemberul:PersonalCareMember2023-01-012023-12-310000217410ul:SkinCleasningMemberul:PersonalCareMember2022-01-012022-12-310000217410ul:SkinCleasningMemberul:PersonalCareMember2021-01-012021-12-310000217410ul:DeodorantMemberul:PersonalCareMember2023-01-012023-12-310000217410ul:DeodorantMemberul:PersonalCareMember2022-01-012022-12-310000217410ul:DeodorantMemberul:PersonalCareMember2021-01-012021-12-310000217410ul:BeautyAndWellbeingMemberul:SkinCareMember2023-01-012023-12-310000217410ul:BeautyAndWellbeingMemberul:SkinCareMember2022-01-012022-12-310000217410ul:BeautyAndWellbeingMemberul:SkinCareMember2021-01-012021-12-310000217410ul:NutritionMemberul:DressingsMember2023-01-012023-12-310000217410ul:NutritionMemberul:DressingsMember2022-01-012022-12-310000217410ul:NutritionMemberul:DressingsMember2021-01-012021-12-310000217410ul:HomeCareMemberul:HomeAndHygieneMember2023-01-012023-12-310000217410ul:HomeCareMemberul:HomeAndHygieneMember2022-01-012022-12-310000217410ul:HomeCareMemberul:HomeAndHygieneMember2021-01-012021-12-310000217410ul:NutritionMemberul:TeaMember2023-01-012023-12-310000217410ul:NutritionMemberul:TeaMember2022-01-012022-12-310000217410ul:NutritionMemberul:TeaMember2021-01-012021-12-310000217410ul:OtherMember2023-01-012023-12-310000217410ul:OtherMember2022-01-012022-12-310000217410ul:OtherMember2021-01-012021-12-31ul:product_area0000217410ul:BeautyAndWellbeingMember2023-01-012023-12-310000217410ul:PersonalCareMember2023-01-012023-12-310000217410ul:HomeCareMember2023-01-012023-12-310000217410ul:NutritionMember2023-01-012023-12-310000217410ul:IceCreamMember2023-01-012023-12-310000217410ul:BeautyAndWellbeingMember2022-01-012022-12-310000217410ul:PersonalCareMember2022-01-012022-12-310000217410ul:HomeCareMember2022-01-012022-12-310000217410ul:NutritionMember2022-01-012022-12-310000217410ul:IceCreamMember2022-01-012022-12-310000217410ul:BeautyAndWellbeingMember2021-01-012021-12-310000217410ul:PersonalCareMember2021-01-012021-12-310000217410ul:HomeCareMember2021-01-012021-12-310000217410ul:NutritionMember2021-01-012021-12-310000217410ul:IceCreamMember2021-01-012021-12-310000217410ifrs-full:CountryOfDomicileMember2023-01-012023-12-310000217410country:US2023-01-012023-12-310000217410country:IN2023-01-012023-12-310000217410ul:OthersMember2023-01-012023-12-310000217410ifrs-full:CountryOfDomicileMember2023-12-310000217410country:US2023-12-310000217410country:IN2023-12-310000217410ul:OthersMember2023-12-310000217410ifrs-full:CountryOfDomicileMember2022-01-012022-12-310000217410country:US2022-01-012022-12-310000217410country:IN2022-01-012022-12-310000217410ul:OthersMember2022-01-012022-12-310000217410ifrs-full:CountryOfDomicileMember2022-12-310000217410country:US2022-12-310000217410country:IN2022-12-310000217410ul:OthersMember2022-12-310000217410ifrs-full:CountryOfDomicileMember2021-01-012021-12-310000217410country:US2021-01-012021-12-310000217410country:IN2021-01-012021-12-310000217410ul:OthersMember2021-01-012021-12-310000217410ifrs-full:CountryOfDomicileMember2021-12-310000217410country:US2021-12-310000217410country:IN2021-12-310000217410ul:OthersMember2021-12-310000217410ul:AsiaPacificAndAfricaMember2023-01-012023-12-310000217410ul:AsiaPacificAndAfricaMember2022-01-012022-12-310000217410ul:AsiaPacificAndAfricaMember2021-01-012021-12-310000217410srt:AmericasMember2023-01-012023-12-310000217410srt:AmericasMember2022-01-012022-12-310000217410srt:AmericasMember2021-01-012021-12-310000217410srt:EuropeMember2023-01-012023-12-310000217410srt:EuropeMember2022-01-012022-12-310000217410srt:EuropeMember2021-01-012021-12-310000217410srt:NorthAmericaMember2023-01-012023-12-310000217410srt:NorthAmericaMember2022-01-012022-12-310000217410srt:NorthAmericaMember2021-01-012021-12-310000217410srt:LatinAmericaMember2023-01-012023-12-310000217410srt:LatinAmericaMember2022-01-012022-12-310000217410srt:LatinAmericaMember2021-01-012021-12-310000217410ul:EmergingMarketsMember2023-01-012023-12-310000217410ul:EmergingMarketsMember2022-01-012022-12-310000217410ul:EmergingMarketsMember2021-01-012021-12-310000217410ul:DevelopedMarketsMember2023-01-012023-12-310000217410ul:DevelopedMarketsMember2022-01-012022-12-310000217410ul:DevelopedMarketsMember2021-01-012021-12-310000217410ul:NutrafolMember2023-01-012023-12-310000217410ul:ElidaBeautyMember2023-01-012023-12-310000217410ul:DollarShaveClubMember2022-01-012022-12-310000217410ul:TheLaundressMember2023-01-012023-12-310000217410ul:TheLaundressMember2022-01-012022-12-310000217410ul:LegalProvisionsForOngoingCompetitionInvestigationsMember2023-01-012023-12-310000217410ul:LegalProvisionsForOngoingCompetitionInvestigationsMember2022-01-012022-12-31ul:Employees0000217410ul:ExecutiveDirectorMemberifrs-full:KeyManagementPersonnelOfEntityOrParentMember2023-01-012023-12-310000217410ul:ExecutiveDirectorMemberifrs-full:KeyManagementPersonnelOfEntityOrParentMember2022-01-012022-12-310000217410ul:ExecutiveDirectorMemberifrs-full:KeyManagementPersonnelOfEntityOrParentMember2021-01-012021-12-310000217410ifrs-full:KeyManagementPersonnelOfEntityOrParentMemberul:OtherLeadershipExecutiveExcludingExecutiveDirectorMember2023-01-012023-12-310000217410ifrs-full:KeyManagementPersonnelOfEntityOrParentMemberul:OtherLeadershipExecutiveExcludingExecutiveDirectorMember2022-01-012022-12-310000217410ifrs-full:KeyManagementPersonnelOfEntityOrParentMemberul:OtherLeadershipExecutiveExcludingExecutiveDirectorMember2021-01-012021-12-310000217410ifrs-full:KeyManagementPersonnelOfEntityOrParentMember2023-01-012023-12-310000217410ifrs-full:KeyManagementPersonnelOfEntityOrParentMember2022-01-012022-12-310000217410ifrs-full:KeyManagementPersonnelOfEntityOrParentMember2021-01-012021-12-310000217410ul:ExecutiveDirectorWhoHaveLeftOrWillLeaveDuringTheYearMember2023-01-012023-12-310000217410ifrs-full:PresentValueOfDefinedBenefitObligationMember2023-01-012023-12-310000217410ul:PensionLiabilitiesMember2023-01-012023-12-310000217410ul:DefinedBenefitPensionPlansMember2023-12-310000217410ul:OtherPostEmploymentBenefitPlansMember2023-12-310000217410ul:DefinedBenefitPensionPlansMember2022-12-310000217410ul:OtherPostEmploymentBenefitPlansMember2022-12-310000217410ifrs-full:BottomOfRangeMemberul:OtherPostEmploymentBenefitPlansMember2023-12-310000217410ifrs-full:TopOfRangeMemberul:OtherPostEmploymentBenefitPlansMember2023-12-310000217410ul:OtherPostEmploymentBenefitPlansMember2023-01-012023-12-310000217410ul:UKAndNetherlandsMember2023-01-012023-12-310000217410country:GB2023-12-310000217410country:GB2022-12-310000217410country:NL2023-12-310000217410country:NL2022-12-310000217410country:GBul:PensionsInPaymentMember2023-12-310000217410country:GBul:PensionsInPaymentMember2022-12-310000217410ul:PensionsInPaymentMembercountry:NL2023-12-310000217410ul:PensionsInPaymentMembercountry:NL2022-12-310000217410country:GBul:PensionsInDefermentMember2023-12-310000217410country:GBul:PensionsInDefermentMember2022-12-310000217410ul:PensionsInDefermentMembercountry:NL2023-12-310000217410ul:PensionsInDefermentMembercountry:NL2022-12-310000217410country:GB2023-01-012023-12-310000217410country:GB2022-01-012022-12-310000217410country:NL2023-01-012023-12-310000217410country:NL2022-01-012022-12-310000217410ul:OperatingCostsMember2023-01-012023-12-310000217410ul:OperatingCostsMember2022-01-012022-12-310000217410ul:OperatingCostsMember2021-01-012021-12-310000217410ul:FinanceIncomeCostMember2023-01-012023-12-310000217410ul:FinanceIncomeCostMember2022-01-012022-12-310000217410ul:FinanceIncomeCostMember2021-01-012021-12-310000217410ul:OtherPostEmploymentBenefitPlansMember2023-12-310000217410ul:OtherPostEmploymentBenefitPlansMember2022-12-310000217410ul:DefinedBenefitPensionPlansMemberul:WhollyOrPartlyFundedDefinedBenefitPlansInSurplusMember2023-12-310000217410ul:OtherPostEmploymentBenefitPlansMemberul:WhollyOrPartlyFundedDefinedBenefitPlansInSurplusMember2023-12-310000217410ul:DefinedBenefitPensionPlansMemberul:WhollyOrPartlyFundedDefinedBenefitPlansInSurplusMember2022-12-310000217410ul:OtherPostEmploymentBenefitPlansMemberul:WhollyOrPartlyFundedDefinedBenefitPlansInSurplusMember2022-12-310000217410ul:DefinedBenefitPensionPlansMemberul:WhollyOrPartlyFundedDefinedBenefitPlansInDeficitMember2023-12-310000217410ul:OtherPostEmploymentBenefitPlansMemberul:WhollyOrPartlyFundedDefinedBenefitPlansInDeficitMember2023-12-310000217410ul:DefinedBenefitPensionPlansMemberul:WhollyOrPartlyFundedDefinedBenefitPlansInDeficitMember2022-12-310000217410ul:OtherPostEmploymentBenefitPlansMemberul:WhollyOrPartlyFundedDefinedBenefitPlansInDeficitMember2022-12-310000217410ul:DefinedBenefitPensionPlansMemberifrs-full:WhollyUnfundedDefinedBenefitPlansMember2023-12-310000217410ul:OtherPostEmploymentBenefitPlansMemberifrs-full:WhollyUnfundedDefinedBenefitPlansMember2023-12-310000217410ul:DefinedBenefitPensionPlansMemberifrs-full:WhollyUnfundedDefinedBenefitPlansMember2022-12-310000217410ul:OtherPostEmploymentBenefitPlansMemberifrs-full:WhollyUnfundedDefinedBenefitPlansMember2022-12-310000217410country:GBul:PlanAssetsBeforeIrrecoverableSurplusMember2022-12-310000217410ul:PlanAssetsBeforeIrrecoverableSurplusMembercountry:NL2022-12-310000217410ul:AllOtherCountriesMemberul:PlanAssetsBeforeIrrecoverableSurplusMember2022-12-310000217410ul:PlanAssetsBeforeIrrecoverableSurplusMember2022-12-310000217410country:GBul:PlanAssetsBeforeIrrecoverableSurplusMember2021-12-310000217410ul:PlanAssetsBeforeIrrecoverableSurplusMembercountry:NL2021-12-310000217410ul:AllOtherCountriesMemberul:PlanAssetsBeforeIrrecoverableSurplusMember2021-12-310000217410ul:PlanAssetsBeforeIrrecoverableSurplusMember2021-12-310000217410country:GBul:IrrecoverableSurplusMember2022-12-310000217410ul:IrrecoverableSurplusMembercountry:NL2022-12-310000217410ul:AllOtherCountriesMemberul:IrrecoverableSurplusMember2022-12-310000217410ul:IrrecoverableSurplusMember2022-12-310000217410country:GBul:IrrecoverableSurplusMember2021-12-310000217410ul:IrrecoverableSurplusMembercountry:NL2021-12-310000217410ul:AllOtherCountriesMemberul:IrrecoverableSurplusMember2021-12-310000217410ul:IrrecoverableSurplusMember2021-12-310000217410country:GBul:PlanAssetsAfterIrrecoverableSurplusMember2022-12-310000217410country:NLul:PlanAssetsAfterIrrecoverableSurplusMember2022-12-310000217410ul:AllOtherCountriesMemberul:PlanAssetsAfterIrrecoverableSurplusMember2022-12-310000217410ul:PlanAssetsAfterIrrecoverableSurplusMember2022-12-310000217410country:GBul:PlanAssetsAfterIrrecoverableSurplusMember2021-12-310000217410country:NLul:PlanAssetsAfterIrrecoverableSurplusMember2021-12-310000217410ul:AllOtherCountriesMemberul:PlanAssetsAfterIrrecoverableSurplusMember2021-12-310000217410ul:PlanAssetsAfterIrrecoverableSurplusMember2021-12-310000217410country:GBifrs-full:PlanAssetsMember2023-01-012023-12-310000217410country:NLifrs-full:PlanAssetsMember2023-01-012023-12-310000217410ul:AllOtherCountriesMemberifrs-full:PlanAssetsMember2023-01-012023-12-310000217410ifrs-full:PlanAssetsMember2023-01-012023-12-310000217410country:GBifrs-full:PlanAssetsMember2022-01-012022-12-310000217410country:NLifrs-full:PlanAssetsMember2022-01-012022-12-310000217410ul:AllOtherCountriesMemberifrs-full:PlanAssetsMember2022-01-012022-12-310000217410ifrs-full:PlanAssetsMember2022-01-012022-12-310000217410country:GBul:PlanAssetsAfterIrrecoverableSurplusMember2023-12-310000217410country:NLul:PlanAssetsAfterIrrecoverableSurplusMember2023-12-310000217410ul:AllOtherCountriesMemberul:PlanAssetsAfterIrrecoverableSurplusMember2023-12-310000217410ul:PlanAssetsAfterIrrecoverableSurplusMember2023-12-310000217410country:GBul:IrrecoverableSurplusMember2023-12-310000217410ul:IrrecoverableSurplusMembercountry:NL2023-12-310000217410ul:AllOtherCountriesMemberul:IrrecoverableSurplusMember2023-12-310000217410ul:IrrecoverableSurplusMember2023-12-310000217410country:GBul:PlanAssetsBeforeIrrecoverableSurplusMember2023-12-310000217410ul:PlanAssetsBeforeIrrecoverableSurplusMembercountry:NL2023-12-310000217410ul:AllOtherCountriesMemberul:PlanAssetsBeforeIrrecoverableSurplusMember2023-12-310000217410ul:PlanAssetsBeforeIrrecoverableSurplusMember2023-12-310000217410country:GBifrs-full:PresentValueOfDefinedBenefitObligationMember2022-12-310000217410ifrs-full:PresentValueOfDefinedBenefitObligationMembercountry:NL2022-12-310000217410ul:AllOtherCountriesMemberifrs-full:PresentValueOfDefinedBenefitObligationMember2022-12-310000217410ifrs-full:PresentValueOfDefinedBenefitObligationMember2022-12-310000217410country:GBifrs-full:PresentValueOfDefinedBenefitObligationMember2021-12-310000217410ifrs-full:PresentValueOfDefinedBenefitObligationMembercountry:NL2021-12-310000217410ul:AllOtherCountriesMemberifrs-full:PresentValueOfDefinedBenefitObligationMember2021-12-310000217410ifrs-full:PresentValueOfDefinedBenefitObligationMember2021-12-310000217410country:GBifrs-full:PresentValueOfDefinedBenefitObligationMember2023-01-012023-12-310000217410ifrs-full:PresentValueOfDefinedBenefitObligationMembercountry:NL2023-01-012023-12-310000217410ul:AllOtherCountriesMemberifrs-full:PresentValueOfDefinedBenefitObligationMember2023-01-012023-12-310000217410country:GBifrs-full:PresentValueOfDefinedBenefitObligationMember2022-01-012022-12-310000217410ifrs-full:PresentValueOfDefinedBenefitObligationMembercountry:NL2022-01-012022-12-310000217410ul:AllOtherCountriesMemberifrs-full:PresentValueOfDefinedBenefitObligationMember2022-01-012022-12-310000217410ifrs-full:PresentValueOfDefinedBenefitObligationMember2022-01-012022-12-310000217410country:GBifrs-full:PresentValueOfDefinedBenefitObligationMember2023-12-310000217410ifrs-full:PresentValueOfDefinedBenefitObligationMembercountry:NL2023-12-310000217410ul:AllOtherCountriesMemberifrs-full:PresentValueOfDefinedBenefitObligationMember2023-12-310000217410ifrs-full:PresentValueOfDefinedBenefitObligationMember2023-12-310000217410ul:AllOtherCountriesMember2022-12-310000217410country:GB2021-12-310000217410country:NL2021-12-310000217410ul:AllOtherCountriesMember2021-12-310000217410ul:AllOtherCountriesMember2023-01-012023-12-310000217410ul:AllOtherCountriesMember2022-01-012022-12-310000217410ul:AllOtherCountriesMember2023-12-310000217410country:GBul:IrrecoverableSurplusMember2023-01-012023-12-310000217410ul:IrrecoverableSurplusMembercountry:NL2023-01-012023-12-310000217410ul:AllOtherCountriesMemberul:IrrecoverableSurplusMember2023-01-012023-12-310000217410ul:IrrecoverableSurplusMember2023-01-012023-12-310000217410country:GBul:IrrecoverableSurplusMember2022-01-012022-12-310000217410ul:IrrecoverableSurplusMembercountry:NL2022-01-012022-12-310000217410ul:AllOtherCountriesMemberul:IrrecoverableSurplusMember2022-01-012022-12-310000217410ul:IrrecoverableSurplusMember2022-01-012022-12-310000217410ifrs-full:BottomOfRangeMember2023-01-012023-12-310000217410ifrs-full:TopOfRangeMember2023-01-012023-12-310000217410ifrs-full:BottomOfRangeMember2022-01-012022-12-310000217410ifrs-full:TopOfRangeMember2022-01-012022-12-310000217410country:GBul:ActiveEmployeesMember2023-01-012023-12-310000217410ul:ActiveEmployeesMembercountry:NL2023-01-012023-12-310000217410ul:AllOtherCountriesMemberul:ActiveEmployeesMember2023-01-012023-12-310000217410ul:ActiveEmployeesMember2023-01-012023-12-310000217410country:GBul:ActiveEmployeesMember2022-01-012022-12-310000217410ul:ActiveEmployeesMembercountry:NL2022-01-012022-12-310000217410ul:AllOtherCountriesMemberul:ActiveEmployeesMember2022-01-012022-12-310000217410ul:ActiveEmployeesMember2022-01-012022-12-310000217410country:GBul:DeferredEmployeesMember2023-01-012023-12-310000217410ul:DeferredEmployeesMembercountry:NL2023-01-012023-12-310000217410ul:AllOtherCountriesMemberul:DeferredEmployeesMember2023-01-012023-12-310000217410ul:DeferredEmployeesMember2023-01-012023-12-310000217410country:GBul:DeferredEmployeesMember2022-01-012022-12-310000217410ul:DeferredEmployeesMembercountry:NL2022-01-012022-12-310000217410ul:AllOtherCountriesMemberul:DeferredEmployeesMember2022-01-012022-12-310000217410ul:DeferredEmployeesMember2022-01-012022-12-310000217410country:GBul:RetiredEmployeesMember2023-01-012023-12-310000217410country:NLul:RetiredEmployeesMember2023-01-012023-12-310000217410ul:AllOtherCountriesMemberul:RetiredEmployeesMember2023-01-012023-12-310000217410ul:RetiredEmployeesMember2023-01-012023-12-310000217410country:GBul:RetiredEmployeesMember2022-01-012022-12-310000217410country:NLul:RetiredEmployeesMember2022-01-012022-12-310000217410ul:AllOtherCountriesMemberul:RetiredEmployeesMember2022-01-012022-12-310000217410ul:RetiredEmployeesMember2022-01-012022-12-310000217410ul:DefinedBenefitPensionPlansMembercountry:GB2023-12-310000217410ul:DefinedBenefitPensionPlansMembercountry:NL2023-12-310000217410ul:AllOtherCountriesMemberul:DefinedBenefitPensionPlansMember2023-12-310000217410ul:DefinedBenefitPensionPlansMembercountry:GB2022-12-310000217410ul:DefinedBenefitPensionPlansMembercountry:NL2022-12-310000217410ul:AllOtherCountriesMemberul:DefinedBenefitPensionPlansMember2022-12-310000217410ul:DefinedBenefitPensionPlansMembersrt:EuropeMembercountry:GB2023-12-310000217410ul:DefinedBenefitPensionPlansMembersrt:EuropeMembercountry:NL2023-12-310000217410ul:AllOtherCountriesMemberul:DefinedBenefitPensionPlansMembersrt:EuropeMember2023-12-310000217410ul:DefinedBenefitPensionPlansMembersrt:EuropeMember2023-12-310000217410ul:DefinedBenefitPensionPlansMembersrt:EuropeMembercountry:GB2022-12-310000217410ul:DefinedBenefitPensionPlansMembersrt:EuropeMembercountry:NL2022-12-310000217410ul:AllOtherCountriesMemberul:DefinedBenefitPensionPlansMembersrt:EuropeMember2022-12-310000217410ul:DefinedBenefitPensionPlansMembersrt:EuropeMember2022-12-310000217410srt:NorthAmericaMemberul:DefinedBenefitPensionPlansMembercountry:GB2023-12-310000217410srt:NorthAmericaMemberul:DefinedBenefitPensionPlansMembercountry:NL2023-12-310000217410srt:NorthAmericaMemberul:AllOtherCountriesMemberul:DefinedBenefitPensionPlansMember2023-12-310000217410srt:NorthAmericaMemberul:DefinedBenefitPensionPlansMember2023-12-310000217410srt:NorthAmericaMemberul:DefinedBenefitPensionPlansMembercountry:GB2022-12-310000217410srt:NorthAmericaMemberul:DefinedBenefitPensionPlansMembercountry:NL2022-12-310000217410srt:NorthAmericaMemberul:AllOtherCountriesMemberul:DefinedBenefitPensionPlansMember2022-12-310000217410srt:NorthAmericaMemberul:DefinedBenefitPensionPlansMember2022-12-310000217410ul:DefinedBenefitPensionPlansMemberul:OtherCountriesMembercountry:GB2023-12-310000217410ul:DefinedBenefitPensionPlansMemberul:OtherCountriesMembercountry:NL2023-12-310000217410ul:AllOtherCountriesMemberul:DefinedBenefitPensionPlansMemberul:OtherCountriesMember2023-12-310000217410ul:DefinedBenefitPensionPlansMemberul:OtherCountriesMember2023-12-310000217410ul:DefinedBenefitPensionPlansMemberul:OtherCountriesMembercountry:GB2022-12-310000217410ul:DefinedBenefitPensionPlansMemberul:OtherCountriesMembercountry:NL2022-12-310000217410ul:AllOtherCountriesMemberul:DefinedBenefitPensionPlansMemberul:OtherCountriesMember2022-12-310000217410ul:DefinedBenefitPensionPlansMemberul:OtherCountriesMember2022-12-310000217410ul:DefinedBenefitPensionPlansMemberul:GovernmentBondsMembercountry:GB2023-12-310000217410ul:DefinedBenefitPensionPlansMemberul:GovernmentBondsMembercountry:NL2023-12-310000217410ul:AllOtherCountriesMemberul:DefinedBenefitPensionPlansMemberul:GovernmentBondsMember2023-12-310000217410ul:DefinedBenefitPensionPlansMemberul:GovernmentBondsMember2023-12-310000217410ul:DefinedBenefitPensionPlansMemberul:GovernmentBondsMembercountry:GB2022-12-310000217410ul:DefinedBenefitPensionPlansMemberul:GovernmentBondsMembercountry:NL2022-12-310000217410ul:AllOtherCountriesMemberul:DefinedBenefitPensionPlansMemberul:GovernmentBondsMember2022-12-310000217410ul:DefinedBenefitPensionPlansMemberul:GovernmentBondsMember2022-12-310000217410ul:InvestmentGradeCorporateBondsMemberul:DefinedBenefitPensionPlansMembercountry:GB2023-12-310000217410ul:InvestmentGradeCorporateBondsMemberul:DefinedBenefitPensionPlansMembercountry:NL2023-12-310000217410ul:AllOtherCountriesMemberul:InvestmentGradeCorporateBondsMemberul:DefinedBenefitPensionPlansMember2023-12-310000217410ul:InvestmentGradeCorporateBondsMemberul:DefinedBenefitPensionPlansMember2023-12-310000217410ul:InvestmentGradeCorporateBondsMemberul:DefinedBenefitPensionPlansMembercountry:GB2022-12-310000217410ul:InvestmentGradeCorporateBondsMemberul:DefinedBenefitPensionPlansMembercountry:NL2022-12-310000217410ul:AllOtherCountriesMemberul:InvestmentGradeCorporateBondsMemberul:DefinedBenefitPensionPlansMember2022-12-310000217410ul:InvestmentGradeCorporateBondsMemberul:DefinedBenefitPensionPlansMember2022-12-310000217410ul:DefinedBenefitPensionPlansMembercountry:GBul:OtherFixedIncomeMember2023-12-310000217410ul:DefinedBenefitPensionPlansMembercountry:NLul:OtherFixedIncomeMember2023-12-310000217410ul:AllOtherCountriesMemberul:DefinedBenefitPensionPlansMemberul:OtherFixedIncomeMember2023-12-310000217410ul:DefinedBenefitPensionPlansMemberul:OtherFixedIncomeMember2023-12-310000217410ul:DefinedBenefitPensionPlansMembercountry:GBul:OtherFixedIncomeMember2022-12-310000217410ul:DefinedBenefitPensionPlansMembercountry:NLul:OtherFixedIncomeMember2022-12-310000217410ul:AllOtherCountriesMemberul:DefinedBenefitPensionPlansMemberul:OtherFixedIncomeMember2022-12-310000217410ul:DefinedBenefitPensionPlansMemberul:OtherFixedIncomeMember2022-12-310000217410ul:OtherPostEmploymentBenefitPlansMembercountry:GB2023-12-310000217410ul:OtherPostEmploymentBenefitPlansMembercountry:NL2023-12-310000217410ul:OtherPostEmploymentBenefitPlansMemberul:AllOtherCountriesMember2023-12-310000217410ul:OtherPostEmploymentBenefitPlansMembercountry:GB2022-12-310000217410ul:OtherPostEmploymentBenefitPlansMembercountry:NL2022-12-310000217410ul:OtherPostEmploymentBenefitPlansMemberul:AllOtherCountriesMember2022-12-310000217410country:GB2023-12-310000217410country:NL2023-12-310000217410ul:AllOtherCountriesMember2023-12-310000217410country:GB2022-12-310000217410country:NL2022-12-310000217410ul:AllOtherCountriesMember2022-12-310000217410srt:MinimumMembercountry:GBul:InflationRateRiskMember2023-01-012023-12-310000217410srt:MinimumMembercountry:GBifrs-full:InterestRateRiskMember2023-01-012023-12-310000217410ifrs-full:InterestRateRiskMembercountry:NL2023-01-012023-12-310000217410country:NLul:InflationRateRiskMember2023-01-012023-12-310000217410ul:UnileverSecuritiesMember2023-12-310000217410ul:UnileverSecuritiesMember2022-12-310000217410ul:PropertyAndLeasesOccupiedByUnileverMember2023-12-310000217410ul:PropertyAndLeasesOccupiedByUnileverMember2022-12-310000217410ul:SpecialBenefitsTrustMember2023-12-310000217410ul:SpecialBenefitsTrustMember2022-12-310000217410ifrs-full:ActuarialAssumptionOfDiscountRatesMember2023-12-310000217410country:GBifrs-full:ActuarialAssumptionOfDiscountRatesMember2023-12-310000217410country:NLifrs-full:ActuarialAssumptionOfDiscountRatesMember2023-12-310000217410ifrs-full:ActuarialAssumptionOfExpectedRatesOfInflationMember2023-12-310000217410country:GBifrs-full:ActuarialAssumptionOfExpectedRatesOfInflationMember2023-12-310000217410ifrs-full:ActuarialAssumptionOfExpectedRatesOfInflationMembercountry:NL2023-12-310000217410ifrs-full:ActuarialAssumptionOfLifeExpectancyAfterRetirementMember2023-12-310000217410ifrs-full:ActuarialAssumptionOfLifeExpectancyAfterRetirementMembercountry:GB2023-12-310000217410ifrs-full:ActuarialAssumptionOfLifeExpectancyAfterRetirementMembercountry:NL2023-12-310000217410ifrs-full:ActuarialAssumptionOfMedicalCostTrendRatesMember2023-12-310000217410ul:FutureEstimateMemberul:FundedPlansMember2024-01-012024-12-310000217410ul:FundedPlansMember2023-01-012023-12-310000217410ul:FundedPlansMember2022-01-012022-12-310000217410ul:FundedPlansMember2021-01-012021-12-310000217410ul:FutureEstimateMemberul:UnfundedPlansMember2024-01-012024-12-310000217410ul:UnfundedPlansMember2023-01-012023-12-310000217410ul:UnfundedPlansMember2022-01-012022-12-310000217410ul:UnfundedPlansMember2021-01-012021-12-310000217410ul:FutureEstimateMember2024-01-012024-12-310000217410country:USul:FundedPlansMember2023-01-012023-12-31iso4217:USD0000217410ul:FutureEstimateMemberul:FundedPlansMembercountry:NL2024-01-012024-12-310000217410ul:FutureEstimateMemberul:FundedPlansMembercountry:GB2024-01-012024-12-310000217410ul:PerformanceSharePlansMember2023-01-012023-12-310000217410ul:PerformanceSharePlansMember2022-01-012022-12-310000217410ul:PerformanceSharePlansMember2021-01-012021-12-310000217410ul:ManagementCoInvestmentPlanMember2023-01-012023-12-310000217410ul:ExecutiveDirectorMemberifrs-full:BottomOfRangeMemberul:ManagementCoInvestmentPlanMember2023-01-012023-12-310000217410ul:ExecutiveDirectorMemberifrs-full:TopOfRangeMemberul:ManagementCoInvestmentPlanMember2023-01-012023-12-310000217410ul:PerformanceSharePlansMember2022-12-31ul:share0000217410ul:PerformanceSharePlansMember2021-12-310000217410ul:PerformanceSharePlansMember2020-12-310000217410ul:PerformanceSharePlansMember2023-12-310000217410ul:UnileverPLCMember2023-01-012023-12-310000217410ul:UnileverPLCMember2022-01-012022-12-310000217410ul:UnileverPLCMember2023-12-310000217410ul:UnileverPLCMember2022-12-3100002174102024-01-012024-02-130000217410ul:ForeignExchangeDerivativesMember2023-01-012023-12-310000217410ul:ForeignExchangeDerivativesMember2022-01-012022-12-310000217410ul:ForeignExchangeDerivativesMember2021-01-012021-12-310000217410ul:ExchangeDifferencesOnTranslationMember2023-01-012023-12-310000217410ul:ExchangeDifferencesOnTranslationMember2022-01-012022-12-310000217410ul:ExchangeDifferencesOnTranslationMember2021-01-012021-12-310000217410ul:PensionsAndSimilarObligationsNettingMember2022-12-310000217410ul:PensionsAndSimilarObligationsNettingMember2023-01-012023-12-310000217410ul:PensionsAndSimilarObligationsNettingMember2023-12-310000217410ul:PensionsAndSimilarObligationsNettingMember2021-12-310000217410ul:PensionsAndSimilarObligationsNettingMember2022-01-012022-12-310000217410ul:ProvisionsAndAccrualsNettingMember2022-12-310000217410ul:ProvisionsAndAccrualsNettingMember2023-01-012023-12-310000217410ul:ProvisionsAndAccrualsNettingMember2023-12-310000217410ul:ProvisionsAndAccrualsNettingMember2021-12-310000217410ul:ProvisionsAndAccrualsNettingMember2022-01-012022-12-310000217410ul:GoodwillAndIntangibleAssetsNettingMember2022-12-310000217410ul:GoodwillAndIntangibleAssetsNettingMember2023-01-012023-12-310000217410ul:GoodwillAndIntangibleAssetsNettingMember2023-12-310000217410ul:GoodwillAndIntangibleAssetsNettingMember2021-12-310000217410ul:GoodwillAndIntangibleAssetsNettingMember2022-01-012022-12-310000217410ul:AcceleratedTaxDepreciationNettingMember2022-12-310000217410ul:AcceleratedTaxDepreciationNettingMember2023-01-012023-12-310000217410ul:AcceleratedTaxDepreciationNettingMember2023-12-310000217410ul:AcceleratedTaxDepreciationNettingMember2021-12-310000217410ul:AcceleratedTaxDepreciationNettingMember2022-01-012022-12-310000217410ul:TaxLossesNettingMember2022-12-310000217410ul:TaxLossesNettingMember2023-01-012023-12-310000217410ul:TaxLossesNettingMember2023-12-310000217410ul:TaxLossesNettingMember2021-12-310000217410ul:TaxLossesNettingMember2022-01-012022-12-310000217410ul:FairValueGainsNettingMember2022-12-310000217410ul:FairValueGainsNettingMember2023-01-012023-12-310000217410ul:FairValueGainsNettingMember2023-12-310000217410ul:FairValueGainsNettingMember2021-12-310000217410ul:FairValueGainsNettingMember2022-01-012022-12-310000217410ul:FairValueLossesNettingMember2022-12-310000217410ul:FairValueLossesNettingMember2023-01-012023-12-310000217410ul:FairValueLossesNettingMember2023-12-310000217410ul:FairValueLossesNettingMember2021-12-310000217410ul:FairValueLossesNettingMember2022-01-012022-12-310000217410ul:ShareBasedPaymentArrangementsNettingMember2022-12-310000217410ul:ShareBasedPaymentArrangementsNettingMember2023-01-012023-12-310000217410ul:ShareBasedPaymentArrangementsNettingMember2023-12-310000217410ul:ShareBasedPaymentArrangementsNettingMember2021-12-310000217410ul:ShareBasedPaymentArrangementsNettingMember2022-01-012022-12-310000217410ifrs-full:LeaseLiabilitiesMember2022-12-310000217410ifrs-full:LeaseLiabilitiesMember2023-01-012023-12-310000217410ifrs-full:LeaseLiabilitiesMember2023-12-310000217410ifrs-full:LeaseLiabilitiesMember2021-12-310000217410ifrs-full:LeaseLiabilitiesMember2022-01-012022-12-310000217410ifrs-full:RightofuseAssetsMember2022-12-310000217410ifrs-full:RightofuseAssetsMember2023-01-012023-12-310000217410ifrs-full:RightofuseAssetsMember2023-12-310000217410ifrs-full:RightofuseAssetsMember2021-12-310000217410ifrs-full:RightofuseAssetsMember2022-01-012022-12-310000217410ifrs-full:OtherTemporaryDifferencesMember2022-12-310000217410ifrs-full:OtherTemporaryDifferencesMember2023-01-012023-12-310000217410ifrs-full:OtherTemporaryDifferencesMember2023-12-310000217410ifrs-full:OtherTemporaryDifferencesMember2021-12-310000217410ifrs-full:OtherTemporaryDifferencesMember2022-01-012022-12-310000217410ul:LeaseLiabilitiesNettingMember2023-12-310000217410ul:LeaseLiabilitiesNettingMember2022-12-310000217410ul:RightOfUseAssetsNettingMember2023-12-310000217410ul:RightOfUseAssetsNettingMember2022-12-310000217410ul:OtherTemporaryDifferencesNettingMember2023-12-310000217410ul:OtherTemporaryDifferencesNettingMember2022-12-310000217410ifrs-full:LaterThanOneYearMember2023-12-310000217410ifrs-full:LaterThanOneYearMember2022-12-310000217410ul:UnileverPLCMember2021-01-012021-12-31ul:interim_dividendiso4217:GBPxbrli:shares0000217410ul:UnileverPLCMember2024-02-082024-02-080000217410ul:UnileverPLCMember2023-02-092023-02-090000217410ifrs-full:GoodwillMemberifrs-full:GrossCarryingAmountMember2022-12-310000217410ifrs-full:IntangibleAssetsWithIndefiniteUsefulLifeMemberifrs-full:GrossCarryingAmountMember2022-12-310000217410ifrs-full:GrossCarryingAmountMemberifrs-full:ComputerSoftwareMember2022-12-310000217410ifrs-full:OtherIntangibleAssetsMemberifrs-full:GrossCarryingAmountMember2022-12-310000217410ifrs-full:GrossCarryingAmountMember2022-12-310000217410ifrs-full:GoodwillMemberifrs-full:GrossCarryingAmountMember2023-01-012023-12-310000217410ifrs-full:IntangibleAssetsWithIndefiniteUsefulLifeMemberifrs-full:GrossCarryingAmountMember2023-01-012023-12-310000217410ifrs-full:GrossCarryingAmountMemberifrs-full:ComputerSoftwareMember2023-01-012023-12-310000217410ifrs-full:OtherIntangibleAssetsMemberifrs-full:GrossCarryingAmountMember2023-01-012023-12-310000217410ifrs-full:GrossCarryingAmountMember2023-01-012023-12-310000217410ifrs-full:GoodwillMemberifrs-full:GrossCarryingAmountMember2023-12-310000217410ifrs-full:IntangibleAssetsWithIndefiniteUsefulLifeMemberifrs-full:GrossCarryingAmountMember2023-12-310000217410ifrs-full:GrossCarryingAmountMemberifrs-full:ComputerSoftwareMember2023-12-310000217410ifrs-full:OtherIntangibleAssetsMemberifrs-full:GrossCarryingAmountMember2023-12-310000217410ifrs-full:GrossCarryingAmountMember2023-12-310000217410ifrs-full:GoodwillMemberifrs-full:AccumulatedDepreciationAmortisationAndImpairmentMember2022-12-310000217410ifrs-full:IntangibleAssetsWithIndefiniteUsefulLifeMemberifrs-full:AccumulatedDepreciationAmortisationAndImpairmentMember2022-12-310000217410ifrs-full:AccumulatedDepreciationAmortisationAndImpairmentMemberifrs-full:ComputerSoftwareMember2022-12-310000217410ifrs-full:AccumulatedDepreciationAmortisationAndImpairmentMemberifrs-full:OtherIntangibleAssetsMember2022-12-310000217410ifrs-full:AccumulatedDepreciationAmortisationAndImpairmentMember2022-12-310000217410ifrs-full:GoodwillMemberifrs-full:AccumulatedDepreciationAmortisationAndImpairmentMember2023-01-012023-12-310000217410ifrs-full:IntangibleAssetsWithIndefiniteUsefulLifeMemberifrs-full:AccumulatedDepreciationAmortisationAndImpairmentMember2023-01-012023-12-310000217410ifrs-full:AccumulatedDepreciationAmortisationAndImpairmentMemberifrs-full:ComputerSoftwareMember2023-01-012023-12-310000217410ifrs-full:AccumulatedDepreciationAmortisationAndImpairmentMemberifrs-full:OtherIntangibleAssetsMember2023-01-012023-12-310000217410ifrs-full:AccumulatedDepreciationAmortisationAndImpairmentMember2023-01-012023-12-310000217410ifrs-full:GoodwillMemberifrs-full:AccumulatedDepreciationAmortisationAndImpairmentMember2023-12-310000217410ifrs-full:IntangibleAssetsWithIndefiniteUsefulLifeMemberifrs-full:AccumulatedDepreciationAmortisationAndImpairmentMember2023-12-310000217410ifrs-full:AccumulatedDepreciationAmortisationAndImpairmentMemberifrs-full:ComputerSoftwareMember2023-12-310000217410ifrs-full:AccumulatedDepreciationAmortisationAndImpairmentMemberifrs-full:OtherIntangibleAssetsMember2023-12-310000217410ifrs-full:AccumulatedDepreciationAmortisationAndImpairmentMember2023-12-310000217410ifrs-full:GoodwillMember2023-12-310000217410ifrs-full:IntangibleAssetsWithIndefiniteUsefulLifeMember2023-12-310000217410ifrs-full:ComputerSoftwareMember2023-12-310000217410ifrs-full:OtherIntangibleAssetsMember2023-12-310000217410ifrs-full:GoodwillMemberifrs-full:GrossCarryingAmountMember2021-12-310000217410ifrs-full:IntangibleAssetsWithIndefiniteUsefulLifeMemberifrs-full:GrossCarryingAmountMember2021-12-310000217410ifrs-full:GrossCarryingAmountMemberifrs-full:ComputerSoftwareMember2021-12-310000217410ifrs-full:OtherIntangibleAssetsMemberifrs-full:GrossCarryingAmountMember2021-12-310000217410ifrs-full:GrossCarryingAmountMember2021-12-310000217410ifrs-full:GoodwillMemberifrs-full:GrossCarryingAmountMember2022-01-012022-12-310000217410ifrs-full:IntangibleAssetsWithIndefiniteUsefulLifeMemberifrs-full:GrossCarryingAmountMember2022-01-012022-12-310000217410ifrs-full:GrossCarryingAmountMemberifrs-full:ComputerSoftwareMember2022-01-012022-12-310000217410ifrs-full:OtherIntangibleAssetsMemberifrs-full:GrossCarryingAmountMember2022-01-012022-12-310000217410ifrs-full:GrossCarryingAmountMember2022-01-012022-12-310000217410ifrs-full:GoodwillMemberifrs-full:AccumulatedDepreciationAmortisationAndImpairmentMember2021-12-310000217410ifrs-full:IntangibleAssetsWithIndefiniteUsefulLifeMemberifrs-full:AccumulatedDepreciationAmortisationAndImpairmentMember2021-12-310000217410ifrs-full:AccumulatedDepreciationAmortisationAndImpairmentMemberifrs-full:ComputerSoftwareMember2021-12-310000217410ifrs-full:AccumulatedDepreciationAmortisationAndImpairmentMemberifrs-full:OtherIntangibleAssetsMember2021-12-310000217410ifrs-full:AccumulatedDepreciationAmortisationAndImpairmentMember2021-12-310000217410ifrs-full:GoodwillMemberifrs-full:AccumulatedDepreciationAmortisationAndImpairmentMember2022-01-012022-12-310000217410ifrs-full:IntangibleAssetsWithIndefiniteUsefulLifeMemberifrs-full:AccumulatedDepreciationAmortisationAndImpairmentMember2022-01-012022-12-310000217410ifrs-full:AccumulatedDepreciationAmortisationAndImpairmentMemberifrs-full:ComputerSoftwareMember2022-01-012022-12-310000217410ifrs-full:AccumulatedDepreciationAmortisationAndImpairmentMemberifrs-full:OtherIntangibleAssetsMember2022-01-012022-12-310000217410ifrs-full:AccumulatedDepreciationAmortisationAndImpairmentMember2022-01-012022-12-310000217410ifrs-full:GoodwillMember2022-12-310000217410ifrs-full:IntangibleAssetsWithIndefiniteUsefulLifeMember2022-12-310000217410ifrs-full:ComputerSoftwareMember2022-12-310000217410ifrs-full:OtherIntangibleAssetsMember2022-12-31ul:company0000217410ul:HorlicksMember2023-12-310000217410ul:HorlicksMember2022-12-310000217410ul:KnorrMember2023-12-310000217410ul:KnorrMember2022-12-310000217410ul:PaulasChoiceMember2023-12-310000217410ul:PaulasChoiceMember2022-12-310000217410ul:CarverKoreaMember2023-12-310000217410ul:CarverKoreaMember2022-12-310000217410ul:HellmannMember2023-12-310000217410ul:HellmannMember2022-12-310000217410ul:ElidaBeautyMember2023-01-012023-12-310000217410ul:BeautyAndWellbeingMember2023-12-310000217410ul:BeautyAndWellbeingMember2022-12-310000217410ul:PersonalCareMember2023-12-310000217410ul:PersonalCareMember2022-12-310000217410ul:HomeCareMember2023-12-310000217410ul:HomeCareMember2022-12-310000217410ul:NutritionMember2023-12-310000217410ul:NutritionMember2022-12-310000217410ul:IceCreamMember2023-12-310000217410ul:IceCreamMember2022-12-310000217410ul:AggregateSignificantIndividualAssetsOrCashGeneratingUnitsMember2023-12-310000217410ul:AggregateSignificantIndividualAssetsOrCashGeneratingUnitsMember2022-12-310000217410ul:SouthAsiaMemberul:NutritionMember2023-12-310000217410ul:SouthAsiaMemberul:NutritionMember2022-12-310000217410ul:EuropeAustraliaNewZealandAndMETUMemberul:NutritionMember2023-12-310000217410ul:EuropeAustraliaNewZealandAndMETUMemberul:NutritionMember2022-12-310000217410srt:NorthAmericaMemberul:NutritionMember2023-12-310000217410srt:NorthAmericaMemberul:NutritionMember2022-12-310000217410ul:BeautyAndWellbeingPrestigeMember2023-12-310000217410ul:BeautyAndWellbeingPrestigeMember2022-12-310000217410ul:BeautyAndWellbeingMemberul:NorthAsiaMember2023-12-310000217410ul:BeautyAndWellbeingMemberul:NorthAsiaMember2022-12-310000217410ul:BeautyAndWellbeingHealthAndWellnessMember2023-12-310000217410ul:BeautyAndWellbeingHealthAndWellnessMember2022-12-310000217410ifrs-full:AggregateNotSignificantIndividualAssetsOrCashgeneratingUnitsMember2023-12-310000217410ifrs-full:AggregateNotSignificantIndividualAssetsOrCashgeneratingUnitsMember2022-12-310000217410ul:BeautyAndWellbeingMember2023-01-012023-12-310000217410ul:PersonalCareMember2023-01-012023-12-310000217410ul:HomeCareMember2023-01-012023-12-310000217410ul:NutritionMember2023-01-012023-12-310000217410ul:IceCreamMember2023-01-012023-12-310000217410ul:SouthAsiaMemberul:NutritionMember2023-01-012023-12-310000217410ul:EuropeAustraliaNewZealandAndMETUMemberul:NutritionMember2023-01-012023-12-310000217410srt:NorthAmericaMemberul:NutritionMember2023-01-012023-12-310000217410ul:BeautyAndWellbeingPrestigeMember2023-01-012023-12-310000217410ul:BeautyAndWellbeingMemberul:NorthAsiaMember2023-01-012023-12-310000217410ul:BeautyAndWellbeingHealthAndWellnessMember2023-01-012023-12-310000217410ul:BeautyAndWellbeingMember2022-01-012022-12-310000217410ul:PersonalCareMember2022-01-012022-12-310000217410ul:HomeCareMember2022-01-012022-12-310000217410ul:NutritionMember2022-01-012022-12-310000217410ul:IceCreamMember2022-01-012022-12-310000217410ul:SouthAsiaMemberul:NutritionMember2022-01-012022-12-310000217410ul:EuropeAustraliaNewZealandAndMETUMemberul:NutritionMember2022-01-012022-12-310000217410srt:NorthAmericaMemberul:NutritionMember2022-01-012022-12-310000217410ul:BeautyAndWellbeingPrestigeMember2022-01-012022-12-310000217410ul:BeautyAndWellbeingMemberul:NorthAsiaMember2022-01-012022-12-310000217410ul:BeautyAndWellbeingHealthAndWellnessMember2022-01-012022-12-310000217410ifrs-full:BottomOfRangeMember2023-12-310000217410ifrs-full:TopOfRangeMember2023-12-310000217410ifrs-full:BottomOfRangeMember2022-12-310000217410ifrs-full:TopOfRangeMember2022-12-310000217410ul:FreeholdBuildingsMember2023-01-012023-12-310000217410ifrs-full:LandAndBuildingsMember2023-01-012023-12-310000217410ul:PlantAndEquipmentMemberifrs-full:BottomOfRangeMember2023-01-012023-12-310000217410ul:PlantAndEquipmentMemberifrs-full:TopOfRangeMember2023-01-012023-12-310000217410ifrs-full:LandAndBuildingsMemberifrs-full:GrossCarryingAmountMemberul:OwnedAssetsMember2022-12-310000217410ul:PlantAndEquipmentMemberifrs-full:GrossCarryingAmountMemberul:OwnedAssetsMember2022-12-310000217410ifrs-full:GrossCarryingAmountMemberul:OwnedAssetsMember2022-12-310000217410ifrs-full:LandAndBuildingsMemberifrs-full:GrossCarryingAmountMemberul:OwnedAssetsMember2023-01-012023-12-310000217410ul:PlantAndEquipmentMemberifrs-full:GrossCarryingAmountMemberul:OwnedAssetsMember2023-01-012023-12-310000217410ifrs-full:GrossCarryingAmountMemberul:OwnedAssetsMember2023-01-012023-12-310000217410ifrs-full:LandAndBuildingsMemberifrs-full:GrossCarryingAmountMemberul:OwnedAssetsMember2023-12-310000217410ul:PlantAndEquipmentMemberifrs-full:GrossCarryingAmountMemberul:OwnedAssetsMember2023-12-310000217410ifrs-full:GrossCarryingAmountMemberul:OwnedAssetsMember2023-12-310000217410ifrs-full:LandAndBuildingsMemberul:OwnedAssetsMemberifrs-full:AccumulatedDepreciationAndAmortisationMember2022-12-310000217410ul:PlantAndEquipmentMemberul:OwnedAssetsMemberifrs-full:AccumulatedDepreciationAndAmortisationMember2022-12-310000217410ul:OwnedAssetsMemberifrs-full:AccumulatedDepreciationAndAmortisationMember2022-12-310000217410ifrs-full:LandAndBuildingsMemberul:OwnedAssetsMemberifrs-full:AccumulatedDepreciationAndAmortisationMember2023-01-012023-12-310000217410ul:PlantAndEquipmentMemberul:OwnedAssetsMemberifrs-full:AccumulatedDepreciationAndAmortisationMember2023-01-012023-12-310000217410ul:OwnedAssetsMemberifrs-full:AccumulatedDepreciationAndAmortisationMember2023-01-012023-12-310000217410ifrs-full:LandAndBuildingsMemberul:OwnedAssetsMemberifrs-full:AccumulatedDepreciationAndAmortisationMember2023-12-310000217410ul:PlantAndEquipmentMemberul:OwnedAssetsMemberifrs-full:AccumulatedDepreciationAndAmortisationMember2023-12-310000217410ul:OwnedAssetsMemberifrs-full:AccumulatedDepreciationAndAmortisationMember2023-12-310000217410ifrs-full:LandAndBuildingsMemberul:OwnedAssetsMember2023-12-310000217410ul:PlantAndEquipmentMemberul:OwnedAssetsMember2023-12-310000217410ul:OwnedAssetsMember2023-12-310000217410ul:FreeholdLandMember2023-12-310000217410ifrs-full:LandAndBuildingsMemberifrs-full:GrossCarryingAmountMemberul:OwnedAssetsMember2021-12-310000217410ul:PlantAndEquipmentMemberifrs-full:GrossCarryingAmountMemberul:OwnedAssetsMember2021-12-310000217410ifrs-full:GrossCarryingAmountMemberul:OwnedAssetsMember2021-12-310000217410ifrs-full:LandAndBuildingsMemberifrs-full:GrossCarryingAmountMemberul:OwnedAssetsMember2022-01-012022-12-310000217410ul:PlantAndEquipmentMemberifrs-full:GrossCarryingAmountMemberul:OwnedAssetsMember2022-01-012022-12-310000217410ifrs-full:GrossCarryingAmountMemberul:OwnedAssetsMember2022-01-012022-12-310000217410ifrs-full:LandAndBuildingsMemberul:OwnedAssetsMemberifrs-full:AccumulatedDepreciationAndAmortisationMember2021-12-310000217410ul:PlantAndEquipmentMemberul:OwnedAssetsMemberifrs-full:AccumulatedDepreciationAndAmortisationMember2021-12-310000217410ul:OwnedAssetsMemberifrs-full:AccumulatedDepreciationAndAmortisationMember2021-12-310000217410ifrs-full:LandAndBuildingsMemberul:OwnedAssetsMemberifrs-full:AccumulatedDepreciationAndAmortisationMember2022-01-012022-12-310000217410ul:PlantAndEquipmentMemberul:OwnedAssetsMemberifrs-full:AccumulatedDepreciationAndAmortisationMember2022-01-012022-12-310000217410ul:OwnedAssetsMemberifrs-full:AccumulatedDepreciationAndAmortisationMember2022-01-012022-12-310000217410ifrs-full:LandAndBuildingsMemberul:OwnedAssetsMember2022-12-310000217410ul:PlantAndEquipmentMemberul:OwnedAssetsMember2022-12-310000217410ul:OwnedAssetsMember2022-12-310000217410ul:FreeholdLandMember2022-12-310000217410ifrs-full:LandAndBuildingsMemberul:LeasedAssetsMemberifrs-full:GrossCarryingAmountMember2022-12-310000217410ul:PlantAndEquipmentMemberul:LeasedAssetsMemberifrs-full:GrossCarryingAmountMember2022-12-310000217410ul:LeasedAssetsMemberifrs-full:GrossCarryingAmountMember2022-12-310000217410ifrs-full:LandAndBuildingsMemberul:LeasedAssetsMemberifrs-full:GrossCarryingAmountMember2023-01-012023-12-310000217410ul:PlantAndEquipmentMemberul:LeasedAssetsMemberifrs-full:GrossCarryingAmountMember2023-01-012023-12-310000217410ul:LeasedAssetsMemberifrs-full:GrossCarryingAmountMember2023-01-012023-12-310000217410ifrs-full:LandAndBuildingsMemberul:LeasedAssetsMemberifrs-full:GrossCarryingAmountMember2023-12-310000217410ul:PlantAndEquipmentMemberul:LeasedAssetsMemberifrs-full:GrossCarryingAmountMember2023-12-310000217410ul:LeasedAssetsMemberifrs-full:GrossCarryingAmountMember2023-12-310000217410ifrs-full:LandAndBuildingsMemberul:LeasedAssetsMemberifrs-full:AccumulatedDepreciationAndAmortisationMember2022-12-310000217410ul:PlantAndEquipmentMemberul:LeasedAssetsMemberifrs-full:AccumulatedDepreciationAndAmortisationMember2022-12-310000217410ul:LeasedAssetsMemberifrs-full:AccumulatedDepreciationAndAmortisationMember2022-12-310000217410ifrs-full:LandAndBuildingsMemberul:LeasedAssetsMemberifrs-full:AccumulatedDepreciationAndAmortisationMember2023-01-012023-12-310000217410ul:PlantAndEquipmentMemberul:LeasedAssetsMemberifrs-full:AccumulatedDepreciationAndAmortisationMember2023-01-012023-12-310000217410ul:LeasedAssetsMemberifrs-full:AccumulatedDepreciationAndAmortisationMember2023-01-012023-12-310000217410ifrs-full:LandAndBuildingsMemberul:LeasedAssetsMemberifrs-full:AccumulatedDepreciationAndAmortisationMember2023-12-310000217410ul:PlantAndEquipmentMemberul:LeasedAssetsMemberifrs-full:AccumulatedDepreciationAndAmortisationMember2023-12-310000217410ul:LeasedAssetsMemberifrs-full:AccumulatedDepreciationAndAmortisationMember2023-12-310000217410ifrs-full:LandAndBuildingsMemberul:LeasedAssetsMember2023-12-310000217410ul:PlantAndEquipmentMemberul:LeasedAssetsMember2023-12-310000217410ul:LeasedAssetsMember2023-12-310000217410ifrs-full:LandAndBuildingsMemberul:LeasedAssetsMemberifrs-full:GrossCarryingAmountMember2021-12-310000217410ul:PlantAndEquipmentMemberul:LeasedAssetsMemberifrs-full:GrossCarryingAmountMember2021-12-310000217410ul:LeasedAssetsMemberifrs-full:GrossCarryingAmountMember2021-12-310000217410ifrs-full:LandAndBuildingsMemberul:LeasedAssetsMemberifrs-full:GrossCarryingAmountMember2022-01-012022-12-310000217410ul:PlantAndEquipmentMemberul:LeasedAssetsMemberifrs-full:GrossCarryingAmountMember2022-01-012022-12-310000217410ul:LeasedAssetsMemberifrs-full:GrossCarryingAmountMember2022-01-012022-12-310000217410ifrs-full:LandAndBuildingsMemberul:LeasedAssetsMemberifrs-full:AccumulatedDepreciationAndAmortisationMember2021-12-310000217410ul:PlantAndEquipmentMemberul:LeasedAssetsMemberifrs-full:AccumulatedDepreciationAndAmortisationMember2021-12-310000217410ul:LeasedAssetsMemberifrs-full:AccumulatedDepreciationAndAmortisationMember2021-12-310000217410ifrs-full:LandAndBuildingsMemberul:LeasedAssetsMemberifrs-full:AccumulatedDepreciationAndAmortisationMember2022-01-012022-12-310000217410ul:PlantAndEquipmentMemberul:LeasedAssetsMemberifrs-full:AccumulatedDepreciationAndAmortisationMember2022-01-012022-12-310000217410ul:LeasedAssetsMemberifrs-full:AccumulatedDepreciationAndAmortisationMember2022-01-012022-12-310000217410ifrs-full:LandAndBuildingsMemberul:LeasedAssetsMember2022-12-310000217410ul:PlantAndEquipmentMemberul:LeasedAssetsMember2022-12-310000217410ul:LeasedAssetsMember2022-12-310000217410ul:DiscountsDueToCustomersMember2023-12-310000217410ul:DiscountsDueToCustomersMember2022-12-310000217410ul:FinancialAssetMember2023-12-310000217410ul:FinancialAssetMember2022-12-310000217410ul:NonFinancialAssetMember2023-12-310000217410ul:NonFinancialAssetMember2022-12-310000217410ul:NotOverDueMember2023-12-310000217410ul:NotOverDueMember2022-12-310000217410ul:PastDueLessThanThreeMonthsMember2023-12-310000217410ul:PastDueLessThanThreeMonthsMember2022-12-310000217410ul:PastDueMoreThanThreeMonthsButLessThanSixMonthsMember2023-12-310000217410ul:PastDueMoreThanThreeMonthsButLessThanSixMonthsMember2022-12-310000217410ul:PastDueMoreThanSixMonthsButLessThanOneYearMember2023-12-310000217410ul:PastDueMoreThanSixMonthsButLessThanOneYearMember2022-12-310000217410ul:PastDueMoreThanOneYearMember2023-12-310000217410ul:PastDueMoreThanOneYearMember2022-12-310000217410ul:CurrentTradeReceivablesMember2023-12-310000217410ul:CurrentTradeReceivablesMember2022-12-310000217410ul:OtherCurrentReceivablesMember2023-12-310000217410ul:OtherCurrentReceivablesMember2022-12-310000217410ul:NonCurrentTradeAndOtherReceivablesMember2023-12-310000217410ul:NonCurrentTradeAndOtherReceivablesMember2022-12-310000217410ul:UnileverPLCMemberifrs-full:OrdinarySharesMember2023-12-310000217410ul:UnileverPLCMemberifrs-full:OrdinarySharesMember2022-12-310000217410ul:UnileverPLCMember2020-01-012020-11-28iso4217:EURiso4217:GBP0000217410ul:HindustanUnileverLimitedMemberifrs-full:SubsidiariesWithMaterialNoncontrollingInterestsMember2023-12-310000217410ul:HindustanUnileverLimitedMemberifrs-full:SubsidiariesWithMaterialNoncontrollingInterestsMember2022-12-310000217410ul:HindustanUnileverLimitedMemberifrs-full:SubsidiariesWithMaterialNoncontrollingInterestsMember2023-01-012023-12-310000217410ul:HindustanUnileverLimitedMemberifrs-full:SubsidiariesWithMaterialNoncontrollingInterestsMember2022-01-012022-12-310000217410ul:HindustanUnileverLimitedMemberifrs-full:SubsidiariesWithMaterialNoncontrollingInterestsMemberifrs-full:NoncontrollingInterestsMember2022-12-310000217410ul:HindustanUnileverLimitedMemberifrs-full:SubsidiariesWithMaterialNoncontrollingInterestsMemberifrs-full:NoncontrollingInterestsMember2021-12-310000217410ul:HindustanUnileverLimitedMemberifrs-full:SubsidiariesWithMaterialNoncontrollingInterestsMemberifrs-full:NoncontrollingInterestsMember2023-01-012023-12-310000217410ul:HindustanUnileverLimitedMemberifrs-full:SubsidiariesWithMaterialNoncontrollingInterestsMemberifrs-full:NoncontrollingInterestsMember2022-01-012022-12-310000217410ul:HindustanUnileverLimitedMemberifrs-full:SubsidiariesWithMaterialNoncontrollingInterestsMemberifrs-full:NoncontrollingInterestsMember2023-12-310000217410ul:BankLoansAndOverdraftsMember2022-12-310000217410ul:BankLoansAndOverdraftsMember2023-01-012023-12-310000217410ul:BankLoansAndOverdraftsMember2023-12-310000217410ul:BondsAndOtherLoansMember2022-12-310000217410ul:BondsAndOtherLoansMember2023-01-012023-12-310000217410ul:BondsAndOtherLoansMember2023-12-310000217410ifrs-full:LeaseLiabilitiesMember2022-12-310000217410ifrs-full:LeaseLiabilitiesMember2023-01-012023-12-310000217410ifrs-full:LeaseLiabilitiesMember2023-12-310000217410ul:DerivativeLiabilitiesMember2022-12-310000217410ul:DerivativeLiabilitiesMember2023-01-012023-12-310000217410ul:DerivativeLiabilitiesMember2023-12-310000217410ul:OtherFinancialLiabilitiesMember2022-12-310000217410ul:OtherFinancialLiabilitiesMember2023-01-012023-12-310000217410ul:OtherFinancialLiabilitiesMember2023-12-310000217410ul:BankLoansAndOverdraftsMember2021-12-310000217410ul:BankLoansAndOverdraftsMember2022-01-012022-12-310000217410ul:BondsAndOtherLoansMember2021-12-310000217410ul:BondsAndOtherLoansMember2022-01-012022-12-310000217410ifrs-full:LeaseLiabilitiesMember2021-12-310000217410ifrs-full:LeaseLiabilitiesMember2022-01-012022-12-310000217410ul:DerivativeLiabilitiesMember2021-12-310000217410ul:DerivativeLiabilitiesMember2022-01-012022-12-310000217410ul:OtherFinancialLiabilitiesMember2021-12-310000217410ul:OtherFinancialLiabilitiesMember2022-01-012022-12-310000217410ul:OverdraftsMember2023-01-012023-12-310000217410ul:OverdraftsMember2022-01-012022-12-310000217410ul:UnileverPLCMemberul:A1375Notes2024Membercurrency:GBP2023-12-310000217410ul:UnileverPLCMemberul:A1375Notes2024Membercurrency:GBP2022-12-310000217410ul:A1875Notes2029Memberul:UnileverPLCMembercurrency:GBP2023-12-310000217410ul:A1875Notes2029Memberul:UnileverPLCMembercurrency:GBP2022-12-310000217410ul:A1500Notes2026Memberul:UnileverPLCMembercurrency:GBP2023-12-310000217410ul:A1500Notes2026Memberul:UnileverPLCMembercurrency:GBP2022-12-310000217410ul:A1500Notes2039Memberul:UnileverPLCMembercurrency:EUR2023-12-310000217410ul:A1500Notes2039Memberul:UnileverPLCMembercurrency:EUR2022-12-310000217410ul:UnileverPLCMemberul:A2125Notes2028Membercurrency:GBP2023-12-310000217410ul:UnileverPLCMemberul:A2125Notes2028Membercurrency:GBP2022-12-310000217410country:NLcurrency:EURul:OtherGroupCompaniesMemberul:A1625Notes2033Member2023-12-310000217410country:NLcurrency:EURul:OtherGroupCompaniesMemberul:A1625Notes2033Member2022-12-310000217410country:NLcurrency:EURul:A1375Notes2029Memberul:OtherGroupCompaniesMember2023-12-310000217410country:NLcurrency:EURul:A1375Notes2029Memberul:OtherGroupCompaniesMember2022-12-310000217410country:NLul:A1125Bonds2027Membercurrency:EURul:OtherGroupCompaniesMember2023-12-310000217410country:NLul:A1125Bonds2027Membercurrency:EURul:OtherGroupCompaniesMember2022-12-310000217410ul:A1125Bonds2028Membercountry:NLcurrency:EURul:OtherGroupCompaniesMember2023-12-310000217410ul:A1125Bonds2028Membercountry:NLcurrency:EURul:OtherGroupCompaniesMember2022-12-310000217410ul:A0875Notes2025Membercountry:NLcurrency:EURul:OtherGroupCompaniesMember2023-12-310000217410ul:A0875Notes2025Membercountry:NLcurrency:EURul:OtherGroupCompaniesMember2022-12-310000217410country:NLcurrency:EURul:A0500Bonds2025Memberul:OtherGroupCompaniesMember2023-12-310000217410country:NLcurrency:EURul:A0500Bonds2025Memberul:OtherGroupCompaniesMember2022-12-310000217410ul:A1375Notes2030Membercountry:NLcurrency:EURul:OtherGroupCompaniesMember2023-12-310000217410ul:A1375Notes2030Membercountry:NLcurrency:EURul:OtherGroupCompaniesMember2022-12-310000217410country:NLcurrency:EURul:A0375Notes2023Memberul:OtherGroupCompaniesMember2023-12-310000217410country:NLcurrency:EURul:A0375Notes2023Memberul:OtherGroupCompaniesMember2022-12-310000217410ul:A1000Notes2027Membercountry:NLcurrency:EURul:OtherGroupCompaniesMember2023-12-310000217410ul:A1000Notes2027Membercountry:NLcurrency:EURul:OtherGroupCompaniesMember2022-12-310000217410ul:A1000Notes2023Membercountry:NLcurrency:EURul:OtherGroupCompaniesMember2023-12-310000217410ul:A1000Notes2023Membercountry:NLcurrency:EURul:OtherGroupCompaniesMember2022-12-310000217410ul:A0500Notes2023Membercountry:NLcurrency:EURul:OtherGroupCompaniesMember2023-12-310000217410ul:A0500Notes2023Membercountry:NLcurrency:EURul:OtherGroupCompaniesMember2022-12-310000217410ul:A0500Notes2024Membercountry:NLcurrency:EURul:OtherGroupCompaniesMember2023-12-310000217410ul:A0500Notes2024Membercountry:NLcurrency:EURul:OtherGroupCompaniesMember2022-12-310000217410country:NLul:OnePointTwoFiveZeroPercentageNotesTwoThousandTwentyFiveMembercurrency:EURul:OtherGroupCompaniesMember2023-12-310000217410country:NLul:OnePointTwoFiveZeroPercentageNotesTwoThousandTwentyFiveMembercurrency:EURul:OtherGroupCompaniesMember2022-12-310000217410ul:OnePointSevenFiveZeroPercentageNotesTwoThousandThirtyMembercountry:NLcurrency:EURul:OtherGroupCompaniesMember2023-12-310000217410ul:OnePointSevenFiveZeroPercentageNotesTwoThousandThirtyMembercountry:NLcurrency:EURul:OtherGroupCompaniesMember2022-12-310000217410country:NLcurrency:EURul:A1250Notes2031Memberul:OtherGroupCompaniesMember2023-12-310000217410country:NLcurrency:EURul:A1250Notes2031Memberul:OtherGroupCompaniesMember2022-12-310000217410country:NLul:A2250Notes2034Membercurrency:EURul:OtherGroupCompaniesMember2023-12-310000217410country:NLul:A2250Notes2034Membercurrency:EURul:OtherGroupCompaniesMember2022-12-310000217410country:NLul:A0750Notes2026Membercurrency:EURul:OtherGroupCompaniesMember2023-12-310000217410country:NLul:A0750Notes2026Membercurrency:EURul:OtherGroupCompaniesMember2022-12-310000217410country:NLcurrency:EURul:A1750Notes2028Memberul:OtherGroupCompaniesMember2023-12-310000217410country:NLcurrency:EURul:A1750Notes2028Memberul:OtherGroupCompaniesMember2022-12-310000217410ul:A3250Notes2031Membercountry:NLcurrency:EURul:OtherGroupCompaniesMember2023-12-310000217410ul:A3250Notes2031Membercountry:NLcurrency:EURul:OtherGroupCompaniesMember2022-12-310000217410ul:A3500Notes2035Membercountry:NLcurrency:EURul:OtherGroupCompaniesMember2023-12-310000217410ul:A3500Notes2035Membercountry:NLcurrency:EURul:OtherGroupCompaniesMember2022-12-310000217410ul:A5900Bonds2032Membercurrency:USDcountry:USul:OtherGroupCompaniesMember2023-12-310000217410ul:A5900Bonds2032Membercurrency:USDcountry:USul:OtherGroupCompaniesMember2022-12-310000217410ul:A2900Notes2027Membercurrency:USDcountry:USul:OtherGroupCompaniesMember2023-12-310000217410ul:A2900Notes2027Membercurrency:USDcountry:USul:OtherGroupCompaniesMember2022-12-310000217410ul:A3500Notes2028Membercurrency:USDcountry:USul:OtherGroupCompaniesMember2023-12-310000217410ul:A3500Notes2028Membercurrency:USDcountry:USul:OtherGroupCompaniesMember2022-12-310000217410currency:USDcountry:USul:A2000Notes2026Memberul:OtherGroupCompaniesMember2023-12-310000217410currency:USDcountry:USul:A2000Notes2026Memberul:OtherGroupCompaniesMember2022-12-310000217410currency:USDcountry:USul:A3125Notes2023Memberul:OtherGroupCompaniesMember2023-12-310000217410currency:USDcountry:USul:A3125Notes2023Memberul:OtherGroupCompaniesMember2022-12-310000217410ul:A3250Notes2024Membercurrency:USDcountry:USul:OtherGroupCompaniesMember2023-12-310000217410ul:A3250Notes2024Membercurrency:USDcountry:USul:OtherGroupCompaniesMember2022-12-310000217410currency:USDcountry:USul:A3100Notes2025Memberul:OtherGroupCompaniesMember2023-12-310000217410currency:USDcountry:USul:A3100Notes2025Memberul:OtherGroupCompaniesMember2022-12-310000217410ul:A2600Notes2024OneMembercurrency:USDcountry:USul:OtherGroupCompaniesMember2023-12-310000217410ul:A2600Notes2024OneMembercurrency:USDcountry:USul:OtherGroupCompaniesMember2022-12-310000217410currency:USDcountry:USul:A3500Bonds2028Memberul:OtherGroupCompaniesMember2023-12-310000217410currency:USDcountry:USul:A3500Bonds2028Memberul:OtherGroupCompaniesMember2022-12-310000217410currency:USDul:A3375Notes2025Membercountry:USul:OtherGroupCompaniesMember2023-12-310000217410currency:USDul:A3375Notes2025Membercountry:USul:OtherGroupCompaniesMember2022-12-310000217410currency:USDcountry:USul:A7250Bonds2026Memberul:OtherGroupCompaniesMember2023-12-310000217410currency:USDcountry:USul:A7250Bonds2026Memberul:OtherGroupCompaniesMember2022-12-310000217410ul:A6625Bonds2028Membercurrency:USDcountry:USul:OtherGroupCompaniesMember2023-12-310000217410ul:A6625Bonds2028Membercurrency:USDcountry:USul:OtherGroupCompaniesMember2022-12-310000217410currency:USDul:A5600Bonds2097Membercountry:USul:OtherGroupCompaniesMember2023-12-310000217410currency:USDul:A5600Bonds2097Membercountry:USul:OtherGroupCompaniesMember2022-12-310000217410currency:USDcountry:USul:OtherGroupCompaniesMemberul:A2125Notes2029Member2023-12-310000217410currency:USDcountry:USul:OtherGroupCompaniesMemberul:A2125Notes2029Member2022-12-310000217410ul:A2600Notes2024TwoMembercurrency:USDcountry:USul:OtherGroupCompaniesMember2023-12-310000217410ul:A2600Notes2024TwoMembercurrency:USDcountry:USul:OtherGroupCompaniesMember2022-12-310000217410ul:A1375Notes2030Membercurrency:USDcountry:USul:OtherGroupCompaniesMember2023-12-310000217410ul:A1375Notes2030Membercurrency:USDcountry:USul:OtherGroupCompaniesMember2022-12-310000217410currency:USDcountry:USul:A0375Notes2023Memberul:OtherGroupCompaniesMember2023-12-310000217410currency:USDcountry:USul:A0375Notes2023Memberul:OtherGroupCompaniesMember2022-12-310000217410currency:USDcountry:USul:OtherGroupCompaniesMemberul:A0626Notes2024Member2023-12-310000217410currency:USDcountry:USul:OtherGroupCompaniesMemberul:A0626Notes2024Member2022-12-310000217410ul:A2625Notes2051Membercurrency:USDcountry:USul:OtherGroupCompaniesMember2023-12-310000217410ul:A2625Notes2051Membercurrency:USDcountry:USul:OtherGroupCompaniesMember2022-12-310000217410currency:USDcountry:USul:A1750Notes2031Memberul:OtherGroupCompaniesMember2023-12-310000217410currency:USDcountry:USul:A1750Notes2031Memberul:OtherGroupCompaniesMember2022-12-310000217410country:USul:A3300Notes2029Membercurrency:EURul:OtherGroupCompaniesMember2023-12-310000217410country:USul:A3300Notes2029Membercurrency:EURul:OtherGroupCompaniesMember2022-12-310000217410country:UScurrency:EURul:OtherGroupCompaniesMemberul:A3.400Notes2033Member2023-12-310000217410country:UScurrency:EURul:OtherGroupCompaniesMemberul:A3.400Notes2033Member2022-12-310000217410ul:A4.875Notes2028Membercurrency:USDcountry:USul:OtherGroupCompaniesMember2023-12-310000217410ul:A4.875Notes2028Membercurrency:USDcountry:USul:OtherGroupCompaniesMember2022-12-310000217410ul:A5.000Notes2033Membercurrency:USDcountry:USul:OtherGroupCompaniesMember2023-12-310000217410ul:A5.000Notes2033Membercurrency:USDcountry:USul:OtherGroupCompaniesMember2022-12-310000217410currency:USDcountry:USul:CommercialPaperMemberul:OtherGroupCompaniesMember2023-12-310000217410currency:USDcountry:USul:CommercialPaperMemberul:OtherGroupCompaniesMember2022-12-310000217410country:CHul:OtherGroupCompaniesMember2023-12-310000217410country:CHul:OtherGroupCompaniesMember2022-12-310000217410ul:OtherCountriesMemberul:OtherGroupCompaniesMember2023-12-310000217410ul:OtherCountriesMemberul:OtherGroupCompaniesMember2022-12-310000217410ul:OtherGroupCompaniesMember2023-12-310000217410ul:OtherGroupCompaniesMember2022-12-310000217410ul:RevolvingCreditFacilityMember2023-01-012023-12-310000217410ul:RevolvingCreditFacilityMember2023-12-310000217410ul:RevolvingCreditFacilityMember2022-12-310000217410ifrs-full:NotLaterThanOneYearMember2023-12-310000217410ifrs-full:LaterThanOneYearAndNotLaterThanTwoYearsMember2023-12-310000217410ifrs-full:LaterThanTwoYearsAndNotLaterThanThreeYearsMember2023-12-310000217410ifrs-full:LaterThanThreeYearsAndNotLaterThanFourYearsMember2023-12-310000217410ifrs-full:LaterThanFourYearsAndNotLaterThanFiveYearsMember2023-12-310000217410ifrs-full:LaterThanFiveYearsMember2023-12-310000217410ul:CarryingValueMember2023-12-310000217410ul:InterestRateDerivativesMemberul:CarryingValueMember2023-12-310000217410ul:InterestRateDerivativesMemberifrs-full:NotLaterThanOneYearMember2023-12-310000217410ul:InterestRateDerivativesMemberifrs-full:LaterThanOneYearAndNotLaterThanTwoYearsMember2023-12-310000217410ul:InterestRateDerivativesMemberifrs-full:LaterThanTwoYearsAndNotLaterThanThreeYearsMember2023-12-310000217410ul:InterestRateDerivativesMemberifrs-full:LaterThanThreeYearsAndNotLaterThanFourYearsMember2023-12-310000217410ul:InterestRateDerivativesMemberifrs-full:LaterThanFourYearsAndNotLaterThanFiveYearsMember2023-12-310000217410ul:InterestRateDerivativesMemberifrs-full:LaterThanFiveYearsMember2023-12-310000217410ul:InterestRateDerivativesMember2023-12-310000217410ul:CarryingValueMemberul:ForeignExchangeDerivativesMember2023-12-310000217410ul:ForeignExchangeDerivativesMemberifrs-full:NotLaterThanOneYearMember2023-12-310000217410ul:ForeignExchangeDerivativesMemberifrs-full:LaterThanOneYearAndNotLaterThanTwoYearsMember2023-12-310000217410ifrs-full:LaterThanTwoYearsAndNotLaterThanThreeYearsMemberul:ForeignExchangeDerivativesMember2023-12-310000217410ifrs-full:LaterThanThreeYearsAndNotLaterThanFourYearsMemberul:ForeignExchangeDerivativesMember2023-12-310000217410ifrs-full:LaterThanFourYearsAndNotLaterThanFiveYearsMemberul:ForeignExchangeDerivativesMember2023-12-310000217410ul:ForeignExchangeDerivativesMemberifrs-full:LaterThanFiveYearsMember2023-12-310000217410ul:ForeignExchangeDerivativesMember2023-12-310000217410ul:CarryingValueMemberul:CommodityDerivativesMember2023-12-310000217410ifrs-full:NotLaterThanOneYearMemberul:CommodityDerivativesMember2023-12-310000217410ifrs-full:LaterThanOneYearAndNotLaterThanTwoYearsMemberul:CommodityDerivativesMember2023-12-310000217410ifrs-full:LaterThanTwoYearsAndNotLaterThanThreeYearsMemberul:CommodityDerivativesMember2023-12-310000217410ifrs-full:LaterThanThreeYearsAndNotLaterThanFourYearsMemberul:CommodityDerivativesMember2023-12-310000217410ifrs-full:LaterThanFourYearsAndNotLaterThanFiveYearsMemberul:CommodityDerivativesMember2023-12-310000217410ifrs-full:LaterThanFiveYearsMemberul:CommodityDerivativesMember2023-12-310000217410ul:CommodityDerivativesMember2023-12-310000217410ifrs-full:NotLaterThanOneYearMember2022-12-310000217410ifrs-full:LaterThanOneYearAndNotLaterThanTwoYearsMember2022-12-310000217410ifrs-full:LaterThanTwoYearsAndNotLaterThanThreeYearsMember2022-12-310000217410ifrs-full:LaterThanThreeYearsAndNotLaterThanFourYearsMember2022-12-310000217410ifrs-full:LaterThanFourYearsAndNotLaterThanFiveYearsMember2022-12-310000217410ifrs-full:LaterThanFiveYearsMember2022-12-310000217410ul:CarryingValueMember2022-12-310000217410ul:InterestRateDerivativesMemberul:CarryingValueMember2022-12-310000217410ul:InterestRateDerivativesMemberifrs-full:NotLaterThanOneYearMember2022-12-310000217410ul:InterestRateDerivativesMemberifrs-full:LaterThanOneYearAndNotLaterThanTwoYearsMember2022-12-310000217410ul:InterestRateDerivativesMemberifrs-full:LaterThanTwoYearsAndNotLaterThanThreeYearsMember2022-12-310000217410ul:InterestRateDerivativesMemberifrs-full:LaterThanThreeYearsAndNotLaterThanFourYearsMember2022-12-310000217410ul:InterestRateDerivativesMemberifrs-full:LaterThanFourYearsAndNotLaterThanFiveYearsMember2022-12-310000217410ul:InterestRateDerivativesMemberifrs-full:LaterThanFiveYearsMember2022-12-310000217410ul:InterestRateDerivativesMember2022-12-310000217410ul:CarryingValueMemberul:ForeignExchangeDerivativesMember2022-12-310000217410ul:ForeignExchangeDerivativesMemberifrs-full:NotLaterThanOneYearMember2022-12-310000217410ul:ForeignExchangeDerivativesMemberifrs-full:LaterThanOneYearAndNotLaterThanTwoYearsMember2022-12-310000217410ifrs-full:LaterThanTwoYearsAndNotLaterThanThreeYearsMemberul:ForeignExchangeDerivativesMember2022-12-310000217410ifrs-full:LaterThanThreeYearsAndNotLaterThanFourYearsMemberul:ForeignExchangeDerivativesMember2022-12-310000217410ifrs-full:LaterThanFourYearsAndNotLaterThanFiveYearsMemberul:ForeignExchangeDerivativesMember2022-12-310000217410ul:ForeignExchangeDerivativesMemberifrs-full:LaterThanFiveYearsMember2022-12-310000217410ul:ForeignExchangeDerivativesMember2022-12-310000217410ul:CarryingValueMemberul:CommodityDerivativesMember2022-12-310000217410ifrs-full:NotLaterThanOneYearMemberul:CommodityDerivativesMember2022-12-310000217410ifrs-full:LaterThanOneYearAndNotLaterThanTwoYearsMemberul:CommodityDerivativesMember2022-12-310000217410ifrs-full:LaterThanTwoYearsAndNotLaterThanThreeYearsMemberul:CommodityDerivativesMember2022-12-310000217410ifrs-full:LaterThanThreeYearsAndNotLaterThanFourYearsMemberul:CommodityDerivativesMember2022-12-310000217410ifrs-full:LaterThanFourYearsAndNotLaterThanFiveYearsMemberul:CommodityDerivativesMember2022-12-310000217410ifrs-full:LaterThanFiveYearsMemberul:CommodityDerivativesMember2022-12-310000217410ul:CommodityDerivativesMember2022-12-310000217410ul:NetCarryingAmountMember2023-12-310000217410ul:NetCarryingAmountMember2022-12-310000217410ifrs-full:CommodityPriceRiskMember2023-12-310000217410ifrs-full:CommodityPriceRiskMember2022-12-310000217410ifrs-full:CommodityPriceRiskMember2023-01-012023-12-310000217410ifrs-full:CommodityPriceRiskMember2022-01-012022-12-310000217410ifrs-full:CommodityPriceRiskMemberul:AdjustmentBasisToInventoryPurchasedMember2023-01-012023-12-310000217410ifrs-full:CommodityPriceRiskMemberul:AdjustmentBasisToInventoryPurchasedMember2022-01-012022-12-310000217410ifrs-full:CashFlowHedgesMemberifrs-full:CommodityPriceRiskMember2023-12-310000217410ifrs-full:CashFlowHedgesMemberifrs-full:CommodityPriceRiskMember2022-12-310000217410ifrs-full:CurrencyRiskMember2023-12-310000217410ifrs-full:CurrencyRiskMember2022-12-310000217410ifrs-full:CurrencyRiskMember2023-01-012023-12-310000217410ifrs-full:CurrencyRiskMember2022-01-012022-12-310000217410ifrs-full:CashFlowHedgesMemberifrs-full:CurrencyRiskMember2023-01-012023-12-310000217410ifrs-full:CashFlowHedgesMemberifrs-full:CurrencyRiskMember2022-01-012022-12-310000217410ifrs-full:CashFlowHedgesMembercurrency:EUR2023-12-310000217410ifrs-full:CashFlowHedgesMembercurrency:EUR2022-12-310000217410ifrs-full:CashFlowHedgesMembercurrency:GBP2023-12-310000217410ifrs-full:CashFlowHedgesMembercurrency:GBP2022-12-310000217410currency:USDifrs-full:CashFlowHedgesMember2023-12-310000217410currency:USDifrs-full:CashFlowHedgesMember2022-12-310000217410ifrs-full:CashFlowHedgesMembercurrency:SEK2023-12-310000217410ifrs-full:CashFlowHedgesMembercurrency:SEK2022-12-310000217410ifrs-full:CashFlowHedgesMembercurrency:CAD2023-12-310000217410ifrs-full:CashFlowHedgesMembercurrency:CAD2022-12-310000217410ifrs-full:CashFlowHedgesMembercurrency:PLN2023-12-310000217410ifrs-full:CashFlowHedgesMembercurrency:PLN2022-12-310000217410ifrs-full:CashFlowHedgesMembersrt:OtherCurrencyMember2023-12-310000217410ifrs-full:CashFlowHedgesMembersrt:OtherCurrencyMember2022-12-310000217410ifrs-full:CashFlowHedgesMember2023-12-310000217410ifrs-full:CashFlowHedgesMember2022-12-310000217410ifrs-full:HedgesOfNetInvestmentInForeignOperationsMemberifrs-full:CurrencyRiskMember2023-12-310000217410ifrs-full:HedgesOfNetInvestmentInForeignOperationsMemberifrs-full:CurrencyRiskMember2022-12-310000217410ifrs-full:HedgesOfNetInvestmentInForeignOperationsMember2023-12-310000217410ifrs-full:HedgesOfNetInvestmentInForeignOperationsMember2022-12-310000217410ifrs-full:HedgesOfNetInvestmentInForeignOperationsMemberifrs-full:CurrencyRiskMember2023-01-012023-12-310000217410ifrs-full:HedgesOfNetInvestmentInForeignOperationsMemberifrs-full:CurrencyRiskMember2022-01-012022-12-310000217410ifrs-full:InterestRateRiskMemberul:TwoThousandAndTwentyThreeMember2023-01-012023-12-310000217410ifrs-full:InterestRateRiskMemberul:TwoThousandAndTwentyFourMember2023-01-012023-12-310000217410ul:TwoThousandAndTwentyTwoMemberifrs-full:InterestRateRiskMember2022-01-012022-12-310000217410ifrs-full:InterestRateRiskMemberul:TwoThousandAndTwentyThreeMember2022-01-012022-12-310000217410ifrs-full:InterestRateRiskMember2023-12-310000217410ifrs-full:InterestRateRiskMember2023-01-012023-12-310000217410ifrs-full:InterestRateRiskMember2022-01-012022-12-310000217410ifrs-full:CashFlowHedgesMemberifrs-full:InterestRateRiskMember2023-01-012023-12-310000217410ifrs-full:CashFlowHedgesMemberifrs-full:InterestRateRiskMember2022-01-012022-12-310000217410ifrs-full:InterestRateSwapContractMemberifrs-full:CashFlowHedgesMemberifrs-full:InterestRateRiskMember2023-12-310000217410ifrs-full:InterestRateSwapContractMemberifrs-full:CashFlowHedgesMemberifrs-full:InterestRateRiskMember2022-12-310000217410ifrs-full:InterestRateSwapContractMemberifrs-full:CashFlowHedgesMemberifrs-full:InterestRateRiskMembercurrency:EUR2023-12-310000217410ifrs-full:InterestRateSwapContractMemberifrs-full:CashFlowHedgesMemberifrs-full:InterestRateRiskMembercurrency:EUR2022-12-310000217410currency:USDifrs-full:InterestRateSwapContractMemberifrs-full:CashFlowHedgesMemberifrs-full:InterestRateRiskMember2023-12-310000217410currency:USDifrs-full:InterestRateSwapContractMemberifrs-full:CashFlowHedgesMemberifrs-full:InterestRateRiskMember2022-12-310000217410ifrs-full:InterestRateSwapContractMemberifrs-full:InterestRateRiskMemberifrs-full:FairValueHedgesMember2023-12-310000217410ifrs-full:InterestRateSwapContractMemberifrs-full:InterestRateRiskMemberifrs-full:FairValueHedgesMember2022-12-310000217410ifrs-full:InterestRateSwapContractMemberifrs-full:InterestRateRiskMemberifrs-full:FairValueHedgesMembercurrency:EUR2023-12-310000217410ifrs-full:InterestRateSwapContractMemberifrs-full:InterestRateRiskMemberifrs-full:FairValueHedgesMembercurrency:EUR2022-12-310000217410currency:USDifrs-full:InterestRateSwapContractMemberifrs-full:InterestRateRiskMemberifrs-full:FairValueHedgesMember2023-12-310000217410currency:USDifrs-full:InterestRateSwapContractMemberifrs-full:InterestRateRiskMemberifrs-full:FairValueHedgesMember2022-12-310000217410ifrs-full:InterestRateSwapContractMemberifrs-full:InterestRateRiskMemberifrs-full:FairValueHedgesMembercurrency:GBP2023-12-310000217410ifrs-full:InterestRateSwapContractMemberifrs-full:InterestRateRiskMemberifrs-full:FairValueHedgesMembercurrency:GBP2022-12-310000217410ul:FixedAndFloatingInterestRateMember2023-12-310000217410ul:FixedAndFloatingInterestRateMember2022-12-310000217410ifrs-full:FairValueHedgesMemberul:ForeignExchangeDerivativesMemberul:DerivativeUsedToHedgeMember2023-12-310000217410ifrs-full:CashFlowHedgesMemberul:ForeignExchangeDerivativesMemberul:DerivativeUsedToHedgeMember2023-12-310000217410ifrs-full:HedgesOfNetInvestmentInForeignOperationsMemberul:ForeignExchangeDerivativesMemberul:DerivativeUsedToHedgeMember2023-12-310000217410ul:HedgeAccountingNotAppliedMemberul:ForeignExchangeDerivativesMemberul:DerivativeUsedToHedgeMember2023-12-310000217410ul:InterestRateDerivativesMemberifrs-full:FairValueHedgesMemberul:DerivativeUsedToHedgeMember2023-12-310000217410ul:InterestRateDerivativesMemberifrs-full:CashFlowHedgesMemberul:DerivativeUsedToHedgeMember2023-12-310000217410ul:InterestRateDerivativesMemberul:HedgeAccountingNotAppliedMemberul:DerivativeUsedToHedgeMember2023-12-310000217410ifrs-full:CashFlowHedgesMemberul:CommodityContractsMemberul:DerivativeUsedToHedgeMember2023-12-310000217410ul:CommodityContractsMemberul:HedgeAccountingNotAppliedMemberul:DerivativeUsedToHedgeMember2023-12-310000217410ul:DerivativeUsedToHedgeMember2023-12-310000217410ifrs-full:FairValueHedgesMemberul:ForeignExchangeDerivativesMemberul:DerivativeUsedToHedgeMember2022-12-310000217410ifrs-full:CashFlowHedgesMemberul:ForeignExchangeDerivativesMemberul:DerivativeUsedToHedgeMember2022-12-310000217410ifrs-full:HedgesOfNetInvestmentInForeignOperationsMemberul:ForeignExchangeDerivativesMemberul:DerivativeUsedToHedgeMember2022-12-310000217410ul:HedgeAccountingNotAppliedMemberul:ForeignExchangeDerivativesMemberul:DerivativeUsedToHedgeMember2022-12-310000217410ul:InterestRateDerivativesMemberifrs-full:FairValueHedgesMemberul:DerivativeUsedToHedgeMember2022-12-310000217410ul:InterestRateDerivativesMemberifrs-full:CashFlowHedgesMemberul:DerivativeUsedToHedgeMember2022-12-310000217410ul:InterestRateDerivativesMemberul:HedgeAccountingNotAppliedMemberul:DerivativeUsedToHedgeMember2022-12-310000217410ifrs-full:CashFlowHedgesMemberul:CommodityContractsMemberul:DerivativeUsedToHedgeMember2022-12-310000217410ul:CommodityContractsMemberul:HedgeAccountingNotAppliedMemberul:DerivativeUsedToHedgeMember2022-12-310000217410ul:DerivativeUsedToHedgeMember2022-12-310000217410ul:DerivativeFinancialAssetsMember2023-12-310000217410ul:DerivativeFinancialAssetsMember2022-12-310000217410ul:DerivativeFinancialLiabilitiesMember2023-12-310000217410ul:DerivativeFinancialLiabilitiesMember2022-12-310000217410ifrs-full:DerivativesMember2023-12-310000217410ifrs-full:DerivativesMember2022-12-310000217410ul:OtherFinancialAssetsMember2023-12-310000217410ul:OtherFinancialAssetsMember2022-12-310000217410ul:JudicialDepositMember2023-12-310000217410ul:JudicialDepositMember2022-12-310000217410ul:CashMember2023-12-310000217410ul:CashMember2022-12-310000217410ul:BondSecuritiesMember2023-12-310000217410ul:BondSecuritiesMember2022-12-310000217410ifrs-full:AtFairValueMember2023-12-310000217410ifrs-full:AtFairValueMember2022-12-310000217410ifrs-full:AtFairValueMemberifrs-full:DerivativesMember2023-12-310000217410ifrs-full:AtFairValueMemberifrs-full:DerivativesMember2022-12-310000217410ul:CarryingValueMemberifrs-full:DerivativesMember2023-12-310000217410ul:CarryingValueMemberifrs-full:DerivativesMember2022-12-310000217410ul:OtherFinancialAssetsMemberifrs-full:AtFairValueMember2023-12-310000217410ul:OtherFinancialAssetsMemberifrs-full:AtFairValueMember2022-12-310000217410ul:CarryingValueMemberul:OtherFinancialAssetsMember2023-12-310000217410ul:CarryingValueMemberul:OtherFinancialAssetsMember2022-12-310000217410ifrs-full:Level1OfFairValueHierarchyMemberifrs-full:AtFairValueMember2023-12-310000217410ifrs-full:Level1OfFairValueHierarchyMemberifrs-full:AtFairValueMember2022-12-310000217410ifrs-full:Level2OfFairValueHierarchyMemberifrs-full:AtFairValueMember2023-12-310000217410ifrs-full:Level2OfFairValueHierarchyMemberifrs-full:AtFairValueMember2022-12-310000217410ifrs-full:Level3OfFairValueHierarchyMemberifrs-full:AtFairValueMember2023-12-310000217410ifrs-full:Level3OfFairValueHierarchyMemberifrs-full:AtFairValueMember2022-12-310000217410ifrs-full:Level1OfFairValueHierarchyMemberul:OtherFinancialAssetsMemberifrs-full:AtFairValueMember2023-12-310000217410ifrs-full:Level1OfFairValueHierarchyMemberul:OtherFinancialAssetsMemberifrs-full:AtFairValueMember2022-12-310000217410ifrs-full:Level2OfFairValueHierarchyMemberul:OtherFinancialAssetsMemberifrs-full:AtFairValueMember2023-12-310000217410ifrs-full:Level2OfFairValueHierarchyMemberul:OtherFinancialAssetsMemberifrs-full:AtFairValueMember2022-12-310000217410ifrs-full:Level3OfFairValueHierarchyMemberul:OtherFinancialAssetsMemberifrs-full:AtFairValueMember2023-12-310000217410ifrs-full:Level3OfFairValueHierarchyMemberul:OtherFinancialAssetsMemberifrs-full:AtFairValueMember2022-12-310000217410ifrs-full:Level1OfFairValueHierarchyMemberifrs-full:FinancialLiabilitiesAtFairValueMemberifrs-full:AtFairValueMember2023-12-310000217410ifrs-full:Level1OfFairValueHierarchyMemberifrs-full:FinancialLiabilitiesAtFairValueMemberifrs-full:AtFairValueMember2022-12-310000217410ifrs-full:FinancialLiabilitiesAtFairValueMemberifrs-full:Level2OfFairValueHierarchyMemberifrs-full:AtFairValueMember2023-12-310000217410ifrs-full:FinancialLiabilitiesAtFairValueMemberifrs-full:Level2OfFairValueHierarchyMemberifrs-full:AtFairValueMember2022-12-310000217410ifrs-full:FinancialLiabilitiesAtFairValueMemberifrs-full:Level3OfFairValueHierarchyMemberifrs-full:AtFairValueMember2023-12-310000217410ifrs-full:FinancialLiabilitiesAtFairValueMemberifrs-full:Level3OfFairValueHierarchyMemberifrs-full:AtFairValueMember2022-12-310000217410ifrs-full:FinancialLiabilitiesAtFairValueMemberifrs-full:AtFairValueMember2023-12-310000217410ifrs-full:FinancialLiabilitiesAtFairValueMemberifrs-full:AtFairValueMember2022-12-310000217410ifrs-full:Level3OfFairValueHierarchyMember2023-01-012023-12-310000217410ifrs-full:Level3OfFairValueHierarchyMember2022-01-012022-12-310000217410ifrs-full:Level3OfFairValueHierarchyMemberifrs-full:AtFairValueMember2021-12-310000217410ifrs-full:Level3OfFairValueHierarchyMemberifrs-full:AtFairValueMember2023-01-012023-12-310000217410ifrs-full:Level3OfFairValueHierarchyMemberifrs-full:AtFairValueMember2022-01-012022-12-310000217410ul:NutrafolMember2023-12-310000217410ul:NutrafolMember2022-12-310000217410ifrs-full:Level3OfFairValueHierarchyMember2023-12-310000217410ifrs-full:Level3OfFairValueHierarchyMember2022-12-310000217410ifrs-full:RestructuringProvisionMember2022-12-310000217410ifrs-full:LegalProceedingsProvisionMember2022-12-310000217410ul:BrazilIndirectTaxesMember2022-12-310000217410ifrs-full:MiscellaneousOtherProvisionsMember2022-12-310000217410ifrs-full:RestructuringProvisionMember2023-01-012023-12-310000217410ifrs-full:LegalProceedingsProvisionMember2023-01-012023-12-310000217410ul:BrazilIndirectTaxesMember2023-01-012023-12-310000217410ifrs-full:MiscellaneousOtherProvisionsMember2023-01-012023-12-310000217410ifrs-full:RestructuringProvisionMember2023-12-310000217410ifrs-full:LegalProceedingsProvisionMember2023-12-310000217410ul:BrazilIndirectTaxesMember2023-12-310000217410ifrs-full:MiscellaneousOtherProvisionsMember2023-12-310000217410ifrs-full:LaterThanOneYearAndNotLaterThanFiveYearsMember2023-12-310000217410ifrs-full:LaterThanOneYearAndNotLaterThanFiveYearsMember2022-12-310000217410country:BR2023-12-310000217410country:BR2022-12-310000217410ul:ZywieVenturesPrivateLimitedMember2023-01-100000217410ul:YassoHoldingsMember2023-08-010000217410ul:SuaveMember2023-05-012023-05-010000217410ifrs-full:BottomOfRangeMemberul:ElidaBeautyMember2023-12-18ul:brand0000217410ul:NutrafolMember2022-07-072022-07-070000217410ul:NutrafolMember2022-07-062022-07-060000217410ifrs-full:BusinessCombinationsMember2023-12-310000217410ifrs-full:BusinessCombinationsMember2022-12-310000217410ifrs-full:BusinessCombinationsMember2021-12-310000217410ifrs-full:DiscontinuedOperationsMember2023-12-310000217410ifrs-full:DiscontinuedOperationsMember2022-12-310000217410ifrs-full:DiscontinuedOperationsMemberul:DollarShaveClubMember2023-12-310000217410ifrs-full:DiscontinuedOperationsMemberul:SuaveAndDollarShaveClubMember2023-12-310000217410ifrs-full:NoncurrentAssetsHeldForSaleMember2023-12-310000217410ifrs-full:NoncurrentAssetsHeldForSaleMember2022-12-310000217410ifrs-full:DisposalGroupsClassifiedAsHeldForSaleMember2023-12-310000217410ifrs-full:DisposalGroupsClassifiedAsHeldForSaleMember2022-12-310000217410ifrs-full:JointVenturesMember2023-01-012023-12-310000217410ifrs-full:JointVenturesMember2022-01-012022-12-310000217410ifrs-full:JointVenturesMember2023-12-310000217410ifrs-full:JointVenturesMember2022-12-310000217410ifrs-full:AssociatesMemberul:LangholmCapitalIIMember2022-12-310000217410ifrs-full:TopOfRangeMember2022-02-102022-02-100000217410ifrs-full:ParentMember2023-01-012023-12-310000217410ifrs-full:ParentMember2022-01-012022-12-310000217410ifrs-full:ParentMember2021-01-012021-12-310000217410ifrs-full:SubsidiariesMember2023-01-012023-12-310000217410ifrs-full:SubsidiariesMember2022-01-012022-12-310000217410ifrs-full:SubsidiariesMember2021-01-012021-12-310000217410ifrs-full:TopOfRangeMember2021-01-012021-12-310000217410ul:DividendDeclarationMemberul:UnileverPLCMember2024-02-082024-02-080000217410ul:A3.25Notes2032Memberifrs-full:EnteringIntoSignificantCommitmentsOrContingentLiabilitiesMember2024-02-150000217410ifrs-full:EnteringIntoSignificantCommitmentsOrContingentLiabilitiesMemberul:A3.50Notes2037Member2024-02-150000217410ul:UnileverDeArgentinaSAMembercountry:AR2023-01-012023-12-310000217410ul:UnileverAustraliaLimitedMembercountry:AU2023-01-012023-12-310000217410country:BDul:UnileverBangladeshLimitedMember2023-01-012023-12-310000217410country:BRul:UnileverBrasilLimitadaMember2023-01-012023-12-310000217410ul:UnileverCanadaIncMembercountry:CA2023-01-012023-12-310000217410ul:UnileverServicesHefeiCoLimitedMembercountry:CN2023-01-012023-12-310000217410country:CNul:WallsChinaCoLimitedMember2023-01-012023-12-310000217410ul:EnglandAndWalesMemberul:UnileverUKAndCNHoldingsLimitedMember2023-01-012023-12-310000217410ul:EnglandAndWalesMemberul:UnileverGlobalIpLtdMember2023-01-012023-12-310000217410ul:EnglandAndWalesMemberul:UnileverUKHoldingsLimitedMember2023-01-012023-12-310000217410ul:EnglandAndWalesMemberul:UnileverUkLimitedMember2023-01-012023-12-310000217410ul:EnglandAndWalesMemberul:UnileverUkCentralResourcesLimitedMember2023-01-012023-12-310000217410ul:UnileverFranceMembercountry:FR2023-01-012023-12-310000217410country:DEul:UnileverDeutschlandGmbhMember2023-01-012023-12-310000217410ul:UnileverDeutschlandHoldingGmbhMembercountry:DE2023-01-012023-12-310000217410country:INul:HindustanUnileverLimitedMember2023-01-012023-12-310000217410country:IDul:PTUnileverIndonesiaTbkMember2023-01-012023-12-310000217410ul:UnileverItaliaMktOperationsSRLMembercountry:IT2023-01-012023-12-310000217410ul:UnileverDeMexicoSDeRLDeCVMembercountry:MX2023-01-012023-12-310000217410country:NLul:MixholdBvMember2023-01-012023-12-310000217410country:NLul:UnileverFinanceNetherlandsBvMember2023-01-012023-12-310000217410country:NLul:UnileverIpHoldingsBvMember2023-01-012023-12-310000217410country:NLul:UnileverNederlandBVMember2023-01-012023-12-310000217410ul:UnileverEuropeBvMembercountry:NL2023-01-012023-12-310000217410ul:UnusHoldingBvMembercountry:NL2023-01-012023-12-310000217410country:PKul:UnileverPakistanLimitedMember2023-01-012023-12-310000217410ul:UnileverPhilippinesIncMembercountry:PH2023-01-012023-12-310000217410country:RUul:OOOUnileverRusMember2023-01-012023-12-310000217410ul:UnileverAsiaPrivateLimitedMembercountry:SG2023-01-012023-12-310000217410country:ZAul:UnileverSouthAfricaPtyLimitedMember2023-01-012023-12-310000217410ul:UnileverEspanaSAMembercountry:ES2023-01-012023-12-310000217410ul:UnileverFinanceInternationalAGMembercountry:CH2023-01-012023-12-310000217410country:THul:UnileverThaiTradingLimitedMember2023-01-012023-12-310000217410country:TRul:UnileverSanayiVeTicaretTurkASMember2023-01-012023-12-310000217410ul:ConopcoIncMembercountry:US2023-01-012023-12-310000217410ul:UnileverCapitalCorporationMembercountry:US2023-01-012023-12-310000217410country:USul:UnileverNorthAmericaSupplyChainCompanyLlcMember2023-01-012023-12-310000217410country:USul:UnileverUnitedStatesIncMember2023-01-012023-12-310000217410ul:BenJerrysHomemadeIncMembercountry:US2023-01-012023-12-310000217410country:USul:PaulasChoiceMember2023-01-012023-12-310000217410country:USul:TheLIVGroupIncMember2023-01-012023-12-310000217410country:VNul:UnileverVietnamInternationalCompanyLimitedMember2023-01-012023-12-31

Disclaimer This is a PDF version of the Annual Report on Form 20-F 2023 and is an exact copy of the document filed with the SEC at www.sec.gov. The Annual Report and Accounts 2023 was also filed with the National Storage Mechanism and the Dutch Authority for the Financial Markets in European Single Electronic Format, including a human readable XHMTL version of the Annual Report and Accounts 2023 (the ESEF Format). The Annual Report and Accounts 2023 in ESEF Format is also available on Unilever’s website at www.unilever.com. Only the Annual Report and Accounts 2023 in ESEF Format is the official version of the annual report for purposes of the ESEF Regulation. Certain sections of the Annual Report on Form 20-F 2023 have been audited. These are on pages 173 to 226. The maintenance and integrity of the Unilever website is the responsibility of the Directors; the work carried out by the auditors does not involve consideration of these matters. Accordingly, the auditors accept no responsibility for any changes that may have occurred to the financial statements since they were initially placed on the website. Legislation in the United Kingdom governing the preparation and dissemination of financial statements may differ from legislation in other jurisdictions. Except where you are a shareholder, this material is provided for information purposes only and is not, in particular, intended to confer any legal rights on you. This Annual Report on Form 20-F does not constitute an invitation to invest in Unilever shares. Any decisions you make in reliance on this information are solely your responsibility. The information is given as of the dates specified, is not updated, and any forward- looking statements are made subject to the reservations specified in the cautionary statement on the inside back cover of the Annual Report on Form 20-F 2023. Unilever accepts no responsibility for any information on other websites that may be accessed from this site by hyperlinks.

UNITED STATES
SECURITIES AND EXCHANGE COMMISSION
WASHINGTON, D.C. 20549
FORM 20-F
(Mark one)
| | | | | | | | | | | | | | | | | |
| | | | | |
| ☐ | REGISTRATION STATEMENT PURSUANT TO SECTION 12(b) OR (g) OF THE SECURITIES EXCHANGE ACT OF 1934 |
| OR |
| ☒ | ANNUAL REPORT PURSUANT TO SECTION 13 OR 15(d) OF THE SECURITIES EXCHANGE ACT OF 1934 |
FOR THE FISCAL YEAR ENDED DECEMBER 31, 2023 |
| OR |
| ☐ | TRANSITION REPORT PURSUANT TO SECTION 13 OR 15(d) OF THE SECURITIES EXCHANGE ACT OF 1934 |
| OR |
| ☐ | SHELL COMPANY REPORT PURSUANT TO SECTION 13 OR 15(d) OF THE SECURITIES EXCHANGE ACT OF 1934 |
Date of event requiring this shell company report
For the transition period from 1 January 2023 to 31 December 2023
Commission file number 001-04546
(Exact name of Registrant as specified in its charter)
| | | | | | | | | | | | | | |
| (Translation of Registrant’s name into English)
ENGLAND | | | |
| | | | |
| | |
| | |
(Jurisdiction of incorporation or organization)
100 Victoria Embankment, London, England
(Address of principal executive offices)
Maria Varsellona, Chief Legal Officer and Group Secretary
Tel: +44 7795 562319, Email: maria.varsellona@unilever.com
100 Victoria Embankment, London EC4Y 0DY, UK
(Name, Telephone Number, E-mail and/or Facsimile number and Address of Company Contact Person)
Securities registered or to be registered pursuant to Section 12(b) of the Act:
| | | | | | | | | | | | | | | | | | | | | | | | | | | | | | | | | | | | | | | | | | | | | | | |
| | | | | | | | | | | | | | |
| Title of each class | | Trading Symbol(s) | | Name of each exchange on which registered |
| Ordinary shares, nominal value of 3 1/9 pence per share | | ULVR | | New York Stock Exchange* |
| American Depositary Shares (evidenced by Depositary Receipts) each representing one ordinary share of the nominal amount of 3 1/9p each | | UL | | New York Stock Exchange |
*Not for trading, but only in connection with the registration of the American Depositary Shares pursuant to the requirements of the Securities and Exchange Commission.
Securities registered or to be registered pursuant to Section 12(g) of the Act: None
Securities for which there is a reporting obligation pursuant to Section 15(d) of the Act: | | | | | | | | | | | | | | | | | | | | | | | | | | |
| | | | | | | | |
| Title of each class | | |
0.626% Notes due 2024 3.250% Notes due 2024 2.600% Notes due 2024 3.250% Notes due 2024 3.100% Notes due 2025 3.375% Notes due 2025 2.000% Notes due 2026 2.900% Notes due 2027 3.500% Notes due 2028 4.875% Notes due 2028 2.125% Notes due 2029 3.300% Notes due 2029 1.375% Notes due 2030 1.750% Notes due 2031 5.900% Notes due 2032 5.000% Notes due 2033 3.400% Notes due 2033 2.625% Notes due 2051
| | | | | | |
Indicate the number of outstanding shares of each of the issuer’s classes of capital or common stock as of the close of the period covered by the annual report.
The total number of outstanding shares of the issuer’s capital stock at the close of the period covered by the annual report was: 2,521,497,338
Indicate by check mark if the registrant is a well-known seasoned issuer, as defined in Rule 405 of the Securities Act:
Yes x No o
If this report is an annual or transition report, indicate by check mark if the registrant is not required to file reports pursuant to Section 13 or 15(d) of the Securities Exchange Act of 1934:
Yes o No x
Note – Checking the box above will not relieve any registrant required to file reports pursuant to Section 13 or 15(d) of the
Securities Exchange Act of 1934 from their obligations under those Sections.
Indicate by check mark whether the registrant: (1) has filed all reports required to be filed by Section 13 or 15(d) of the Securities Exchange Act of 1934 during the preceding 12 months (or for such shorter period that the registrant was required to file such reports), and (2) has been subject to such filing requirements for the past 90 days.
Yes x No o
Indicate by check mark whether the registrant has submitted electronically every Interactive Data File required to be submitted pursuant to Rule 405 of Regulation S-T (§232.405 of this chapter) during the preceding 12 months (or for such shorter period that the registrant was required to submit such files).
Yes x No o
Indicate by check mark whether the registrant is a large accelerated filer, an accelerated filer, a non-accelerated filer, or an emerging growth company. See definition of “large accelerated filer,” accelerated filer,” and “emerging growth company” in Rule 12b-2 of the Exchange Act.
Large Accelerated filer x Accelerated filer o Non-accelerated filer o Emerging Growth Company o
If an emerging growth company that prepares its financial statements in accordance with U.S. GAAP, indicate by check mark if the registrant has elected not to use the extended transition period for complying with any new or revised financial accounting standards* provided pursuant to Section 13(a) of the Exchange Act. o
*The term ‘‘new or revised financial accounting standard’’ refers to any update issued by the Financial Accounting Standards Board to its Accounting Standards Codification after April 5, 2012.
Indicate by check mark whether the registrant has filed a report on and attestation to its management’s assessment of the effectiveness of its internal control over financial reporting under Section 404(b) of the Sarbanes-Oxley Act (15 U.S.C. 7262(b)) by the registered public accounting firm that prepared or issued its audit report. x
If securities are registered pursuant to Section 12(b) of the Act, indicate by check mark whether the financial statements of the registrant included in the filing reflect the correction of an error to previously issued financial statements. o
Indicate by check mark whether any of those error corrections are restatements that required a recovery analysis of incentive based compensation received by any of the registrant’s executive officers during the relevant recovery period pursuant to §240.10D-1(b). o
Indicate by check mark which basis of accounting the registrant has used to prepare the financial statements included in this filing:
| | | | | | | | | | | | | | |
U.S. GAAP ☐ | | International Financial Reporting Standards as issued by the International Accounting Standards Board ☒ | | Other ☐ |
If ‘Other’ has been checked in response to the previous question, indicate by check mark which financial statement item the registrant has elected to follow. Item 17 o Item 18 o
If this is an annual report, indicate by check mark whether the registrant is a shell company (as defined in Rule 12b-2 of the Exchange Act):
Yes o No x
Cautionary Statement This document may contain forward-looking statements, including ‘forward-looking statements’ within the meaning of the United States Private Securities Litigation Reform Act of 1995, concerning the financial condition, results of operations and businesses of the Unilever Group (the ‘Group’). All statements other than statements of historical fact are, or may deemed to be, forward-looking statements. Words such as ‘will’, ‘aim’, ‘expects’, ‘anticipates’, ‘intends’, ‘looks’, ‘believes’, ‘vision’, ‘ambition’, ‘target’, ‘goal’, ‘plan’, ‘potential’, ‘work towards’, ‘may’, ‘milestone’, ‘objectives’, ‘outlook’, ‘probably’, ‘project’, ‘risk’, ‘seek’, ‘continue’, ‘projected’, ‘estimate’, ‘achieve’ or the negative of these terms, and other similar expressions of future performance or results and their negatives, are intended to identify such forward-looking statements. Forward-looking statements also include, but are not limited to, statements and information regarding the Group’s emissions reduction targets and other climate change related matters (including actions, potential impacts and risks associated therewith). Forward-looking statements can be made in writing but also may be made verbally by directors, officers and employees of the Group (including during management presentations) in connection with this document. These forward-looking statements are based upon current expectations and assumptions regarding anticipated developments and other factors affecting the Group. They are not historical facts, nor are they guarantees of future performance or outcomes. All forward-looking statements contained in this document are expressly qualified in their entirety by the cautionary statements contained or referred to in this section. Readers should not place undue reliance on forward-looking statements. Because these forward-looking statements involve known and unknown risks and uncertainties, a number of which may be beyond the Group's control, there are important factors that could cause actual results to differ materially from those expressed or implied by these forward-looking statements. Among other risks and uncertainties, the material or principal factors which could cause actual results to differ materially from those expressed in the forward-looking statements included in this document are: Unilever’s global brands not meeting consumer preferences; Unilever’s ability to innovate and remain competitive; Unilever’s investment choices in its portfolio management; the effect of climate change on Unilever’s business; Unilever’s ability to find sustainable solutions to its plastic packaging; significant changes or deterioration in customer relationships; the recruitment and retention of talented employees; disruptions in Unilever's supply chain and distribution; increases or volatility in the cost of raw materials and commodities; the production of safe and high quality products; secure and reliable IT infrastructure; execution of acquisitions, divestitures and business transformation projects; economic, social and political risks and natural disasters; financial risks; failure to meet high and ethical standards; and managing regulatory, tax and legal matters. Also see "Our Principal Risks" on pages 70-78 for additional risks and further discussion. The forward-looking statements are based on our beliefs, assumptions and expectations of our future performance, taking into account all information currently available to us. Forward-looking statements are not predictions of future events. These beliefs, assumptions, and expectations can change as a result of many possible events or factors, not all of which are known to us. If a change occurs, our business, financial condition, liquidity and results of operations may vary materially from those expressed in our forward-looking statements. The forward-looking statements speak only as of the date of this document. Except as required by any applicable law or regulation, the Group expressly disclaims any obligation or undertaking to release publicly any updates or revisions to any forward-looking statements contained herein to reflect any change in the Group’s expectations with regard thereto or any change in events, conditions or circumstances on which any such statement is based. New risks and uncertainties arise over time, and it is not possible for us to predict those events or how they may affect us. In addition, we cannot assess the impact of each factor on our business or the extent to which any factor, or combination of factors, may cause actual results to differ materially from those contained in any forward-looking statements. This document also contains data on the Group’s Scope 1, 2 and 3 emissions. Some of this data is based on estimates, assumptions and uncertainties. Scope 1 and 2 emissions data relates to emissions from the Group’s own activities and supplied heat, power and cooling and is generally easier for the Group to gather than Scope 3 emissions data. Scope 3 emissions relate to other organisations’ emissions and is therefore subject to a range of additional uncertainties, including that: data used to model lifecycle footprints is typically industry-standard data or estimates rather than relating to individual suppliers; and lifecycle models such as the Group’s cover many but not all products and markets. In addition, international standards and protocols relating to Scope 1, 2, and 3 emissions calculations and categorisations also continue to evolve, as do accepted norms regarding terminology such as carbon neutral and net zero which may affect the emissions data the Group reports. As Scope 3 emissions data improves, shifting over time from generic modelled data to more specific data, the data reported in this document is likely to evolve. Throughout this report, we include non-GAAP financial measures to explain the performance of our business, including underlying sales growth, underlying volume growth, underlying price growth, not-underlying items, underlying operating profit, underlying operating margin, underlying earnings per share, underlying effective tax rate, constant underlying earnings per share, free cash flow, cash conversion, underlying return on assets, net debt and underlying return on invested capital. Such non-GAAP financial measures are defined in "Additional financial disclosures" and a reconciliation of these measures to their most directly comparable GAAP financial measures are included within "Additional financial disclosures." See pages 59-64. Further details of potential risks and uncertainties affecting the Group are described in the Group’s filings with the London Stock Exchange, Euronext Amsterdam and the US Securities and Exchange Commission, including in the Annual Report on Form 20-F 2023. This document is not prepared in accordance with US GAAP and should not therefore be relied upon by readers as such. The Annual Report on Form 20-F 2023 is separately filed with the US Securities and Exchange Commission and is available on our corporate website. www.unilever.com In addition, a printed copy of the Annual Report on Form 20-F 2023 is available, free of charge, upon request to Unilever, Investor Relations Department, 100 Victoria Embankment, London EC4Y 0DY, United Kingdom. This document comprises regulated information within the meaning of Sections 1:1 and 5:25c of the Act on Financial Supervision (‘Wet op het financieel toezicht (Wft)’) in the Netherlands. The brand names shown in this report are trademarks owned by or licensed to companies within the Group. References in this document to information on websites (and/or social media sites) are included as an aid to their location and such information is not incorporated in, and does not form part of, the Unilever Annual Report and Accounts 2023.
In this report Strategic Report About Unilever 2 Unilever at a glance 4 Our strategy & Growth Action Plan Review of the Year 6 Chair’s statement 8 Chief Executive Officer’s statement 10 Unilever Group Financial Review 14 Business Group Review 34 Our People & Culture 38 Planet & Society Our Performance 56 Financial performance 65 Non-financial performance Our Principal Risks 70 Risk management approach 71 Principal risks 79 Viability statement Governance Report 82 Chair’s Governance statement 84 Board of Directors 86 Unilever Leadership Executive (ULE) 88 Corporate Governance overview 102 Report of the Nominating and Corporate Governance Committee 107 Report of the Audit Committee 112 Report of the Corporate Responsibility Committee 116 Directors’ Remuneration Report Financial Statements 156 Statement of Directors’ responsibilities 157 Report of Independent Registered Public Accounting Firm 173 Consolidated Financial Statements Unilever Group 177 Notes to the Consolidated Financial Statements 227 Company Accounts Unilever PLC 230 Notes to the Company Accounts Unilever PLC 234 Group Companies 245 Shareholder information – Financial calendar 246 Additional Information for US Listing Purposes Online You can find more information about Unilever online at www.unilever.com The Unilever Annual Report on Form 20-F 2023 (including the Additional Information for US Listing Purposes) along with other relevant documents can be downloaded at www.unilever.com/investors/annual-report-and-accounts References to information on websites in this document are included as an aid to their location and such information is not incorporated in, and does not form part of this document. Any website URL is included as text only and is not an active link.
Realising our full potential Unilever is a company with many strengths. We have a portfolio of iconic global and local brands serving consumers in almost every part of the world. Our talent base is engaged and diverse. And we have industry-leading capabilities in science, innovation and sustainability. Our category-focused organisation is fully operational, with our five Business Groups organised to accelerate our growth, supported by a digital and technology- enabled Business Operations team. Nevertheless, our business performance in recent years has not matched our full potential, and so we have set out a Growth Action Plan to close that gap. Our action plan outlines the steps we will take to deliver faster growth, drive productivity and simplicity, and dial up our performance culture. We are stepping up our execution across each area, with relentless focus: fewer things, done better, with greater impact. This Annual Report and Accounts sets out the work we have already started and our priorities for the year ahead.
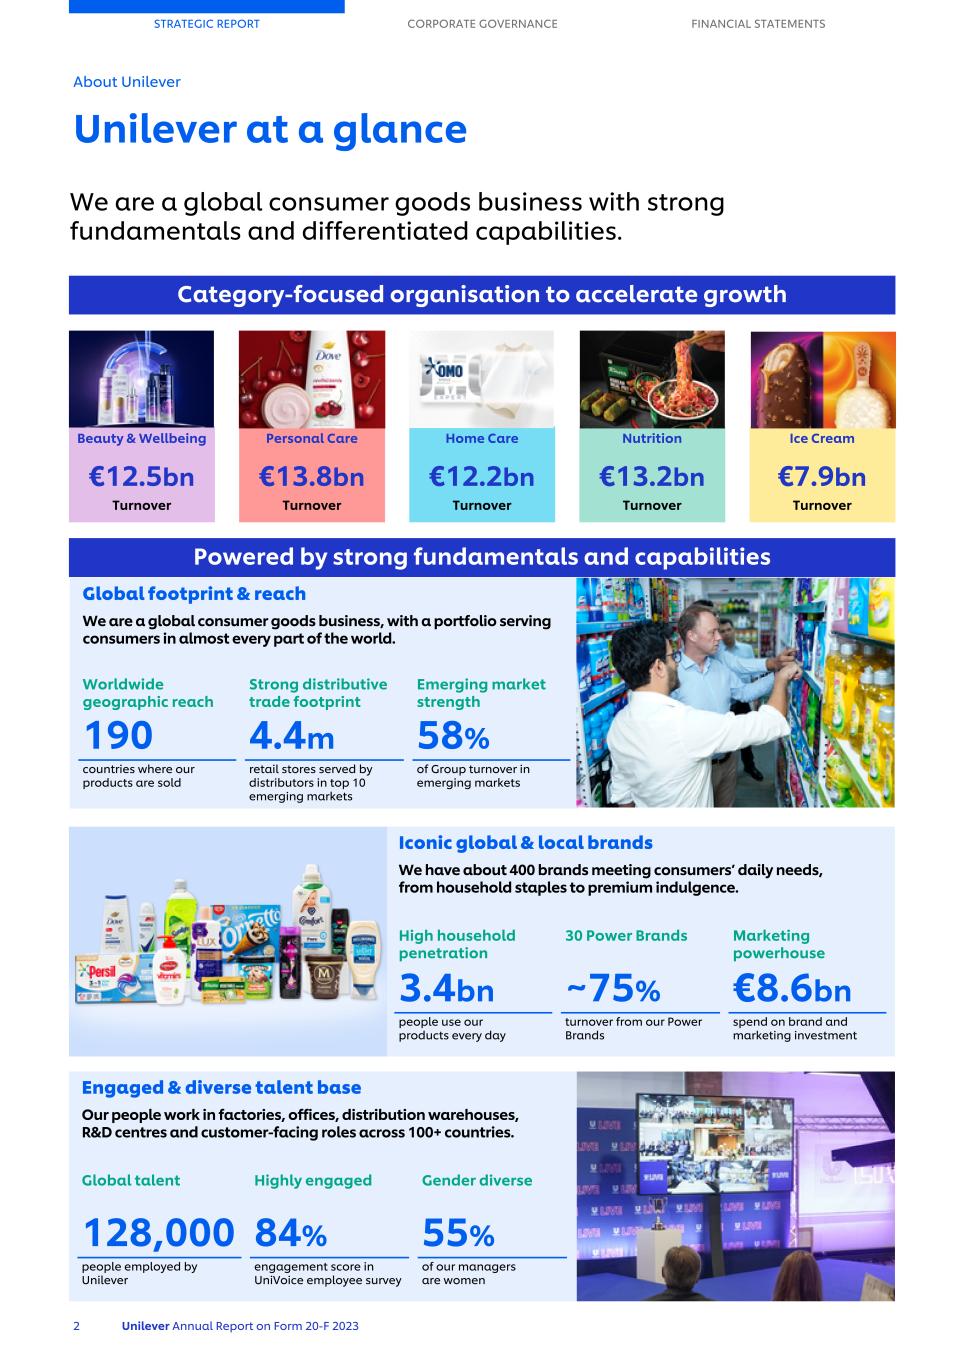
Category-focused organisation to accelerate growth Beauty & Wellbeing Personal Care Home Care Nutrition Ice Cream €12.5bn €13.8bn €12.2bn €13.2bn €7.9bn Turnover Turnover Turnover Turnover Turnover Powered by strong fundamentals and capabilities STRATEGIC REPORT CORPORATE GOVERNANCE FINANCIAL STATEMENTS About Unilever Unilever at a glance 2 Unilever Annual Report on Form 20-F 2023 We are a global consumer goods business with strong fundamentals and differentiated capabilities. Global footprint & reach We are a global consumer goods business, with a portfolio serving consumers in almost every part of the world. Worldwide geographic reach Strong distributive trade footprint Emerging market strength 190 4.4m 58% countries where our products are sold retail stores served by distributors in top 10 emerging markets of Group turnover in emerging markets Iconic global & local brands We have about 400 brands meeting consumers’ daily needs, from household staples to premium indulgence. High household penetration 30 Power Brands Marketing powerhouse 3.4bn ~75% €8.6bn people use our products every day turnover from our Power Brands spend on brand and marketing investment Engaged & diverse talent base Our people work in factories, offices, distribution warehouses, R&D centres and customer-facing roles across 100+ countries. Global talent Highly engaged Gender diverse 128,000 84% 55% people employed by Unilever engagement score in UniVoice employee survey of our managers are women
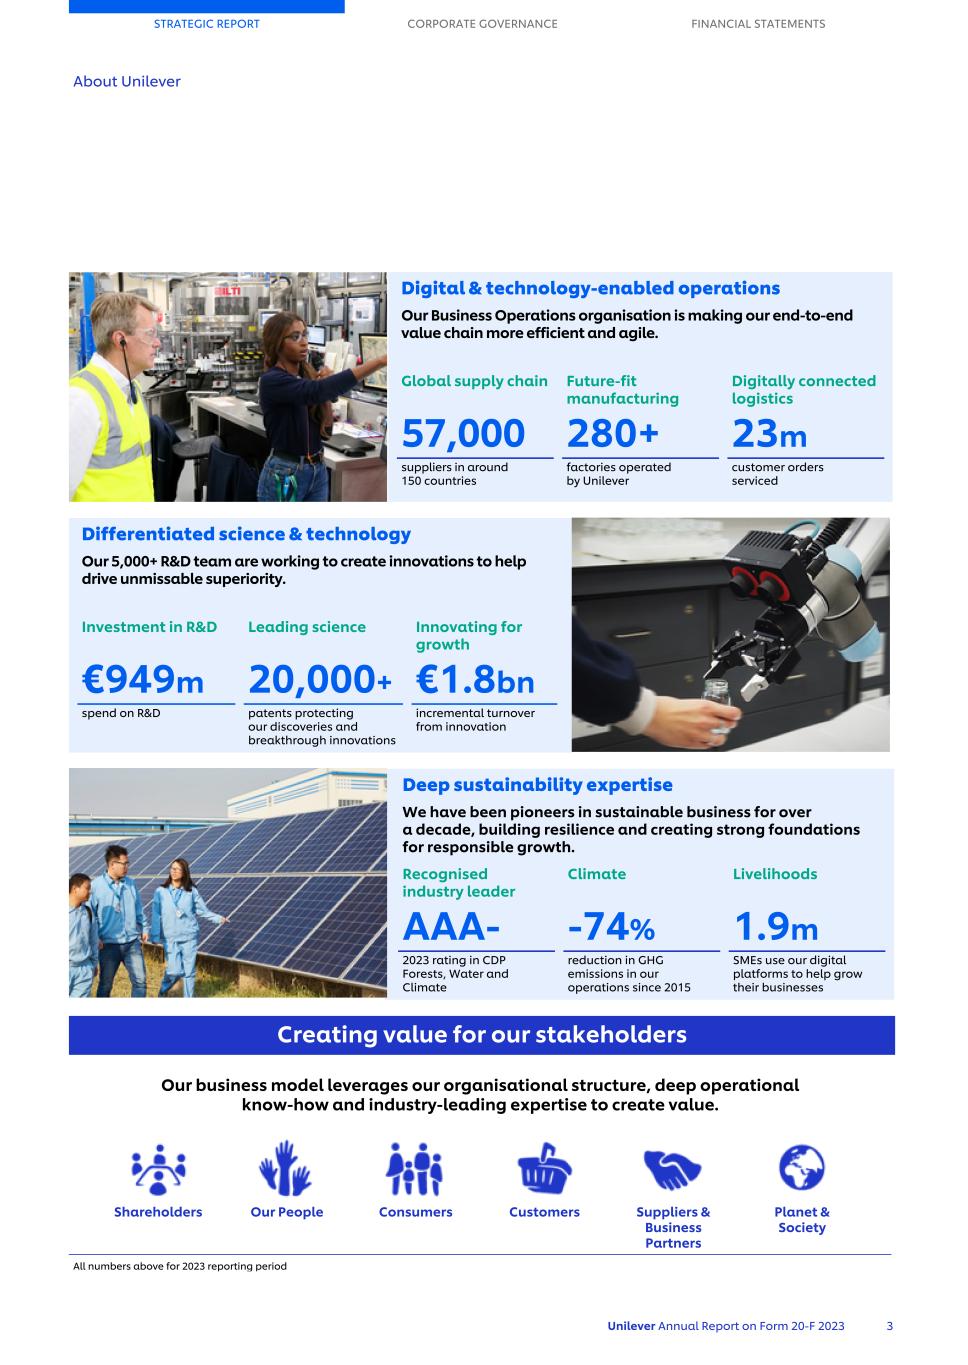
Digital & technology-enabled operations Our Business Operations organisation is making our end-to-end value chain more efficient and agile. Global supply chain Future-fit manufacturing Digitally connected logistics 57,000 280+ 23m suppliers in around 150 countries factories operated by Unilever customer orders serviced Differentiated science & technology Our 5,000+ R&D team are working to create innovations to help drive unmissable superiority. Investment in R&D Leading science Innovating for growth €949m 20,000+ €1.8bn spend on R&D patents protecting our discoveries and breakthrough innovations incremental turnover from innovation Deep sustainability expertise We have been pioneers in sustainable business for over a decade, building resilience and creating strong foundations for responsible growth. Recognised industry leader Climate Livelihoods AAA- -74% 1.9m 2023 rating in CDP Forests, Water and Climate reduction in GHG emissions in our operations since 2015 SMEs use our digital platforms to help grow their businesses Creating value for our stakeholders Our business model leverages our organisational structure, deep operational know-how and industry-leading expertise to create value. Shareholders Our People Consumers Customers Suppliers & Business Partners Planet & Society All numbers above for 2023 reporting period STRATEGIC REPORT CORPORATE GOVERNANCE FINANCIAL STATEMENTS About Unilever Unilever Annual Report on Form 20-F 2023 3
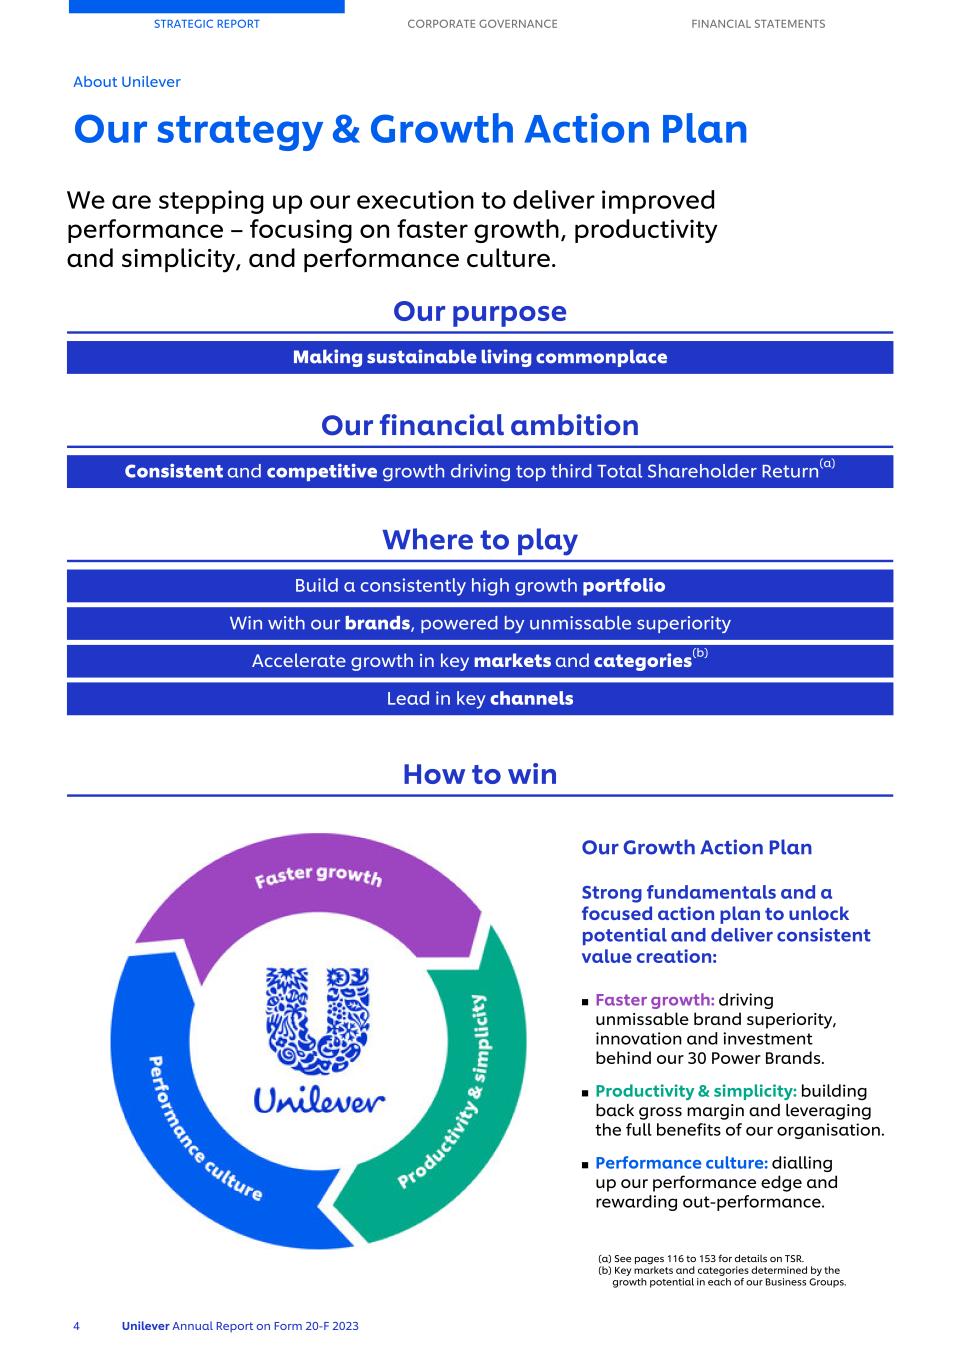
STRATEGIC REPORT CORPORATE GOVERNANCE FINANCIAL STATEMENTS About Unilever Our strategy & Growth Action Plan 4 Unilever Annual Report on Form 20-F 2023 We are stepping up our execution to deliver improved performance – focusing on faster growth, productivity and simplicity, and performance culture. Our purpose Making sustainable living commonplace Our financial ambition Consistent and competitive growth driving top third Total Shareholder Return(a) Where to play Build a consistently high growth portfolio Win with our brands, powered by unmissable superiority Accelerate growth in key markets and categories(b) Lead in key channels How to win Our Growth Action Plan Strong fundamentals and a focused action plan to unlock potential and deliver consistent value creation: ■ Faster growth: driving unmissable brand superiority, innovation and investment behind our 30 Power Brands. ■ Productivity & simplicity: building back gross margin and leveraging the full benefits of our organisation. ■ Performance culture: dialling up our performance edge and rewarding out-performance. (a) See pages 116 to 153 for details on TSR. (b) Key markets and categories determined by the growth potential in each of our Business Groups.
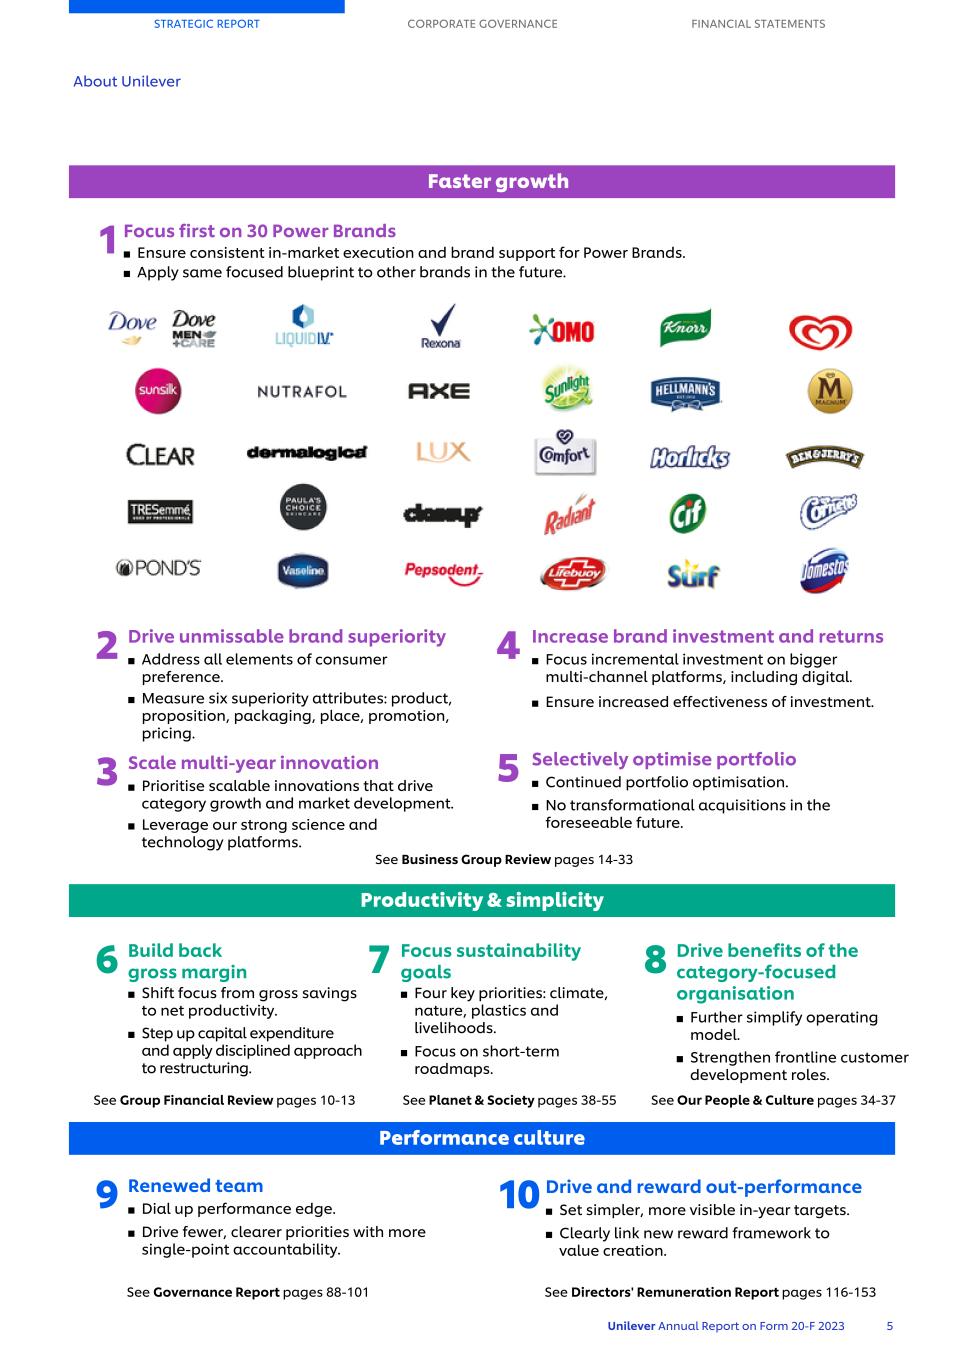
STRATEGIC REPORT CORPORATE GOVERNANCE FINANCIAL STATEMENTS About Unilever Unilever Annual Report on Form 20-F 2023 5 1Focus first on 30 Power Brands ■ Ensure consistent in-market execution and brand support for Power Brands. ■ Apply same focused blueprint to other brands in the future. 2 Drive unmissable brand superiority ■ Address all elements of consumer preference. ■ Measure six superiority attributes: product, proposition, packaging, place, promotion, pricing. 3 Scale multi-year innovation ■ Prioritise scalable innovations that drive category growth and market development. ■ Leverage our strong science and technology platforms. Productivity & simplicity 6 Build back gross margin ■ Shift focus from gross savings to net productivity. ■ Step up capital expenditure and apply disciplined approach to restructuring. 7 Focus sustainability goals ■ Four key priorities: climate, nature, plastics and livelihoods. ■ Focus on short-term roadmaps. 8 Drive benefits of the category-focused organisation ■ Further simplify operating model. ■ Strengthen frontline customer development roles. 4 Increase brand investment and returns ■ Focus incremental investment on bigger multi-channel platforms, including digital. ■ Ensure increased effectiveness of investment. 5 Selectively optimise portfolio ■ Continued portfolio optimisation. ■ No transformational acquisitions in the foreseeable future. Performance culture 9 Renewed team ■ Dial up performance edge. ■ Drive fewer, clearer priorities with more single-point accountability. 10 Drive and reward out-performance ■ Set simpler, more visible in-year targets. ■ Clearly link new reward framework to value creation. See Business Group Review pages 14-33 See Group Financial Review pages 10-13 See Planet & Society pages 38-55 See Our People & Culture pages 34-37 See Governance Report pages 88-101 See Directors' Remuneration Report pages 116-153 Faster growth
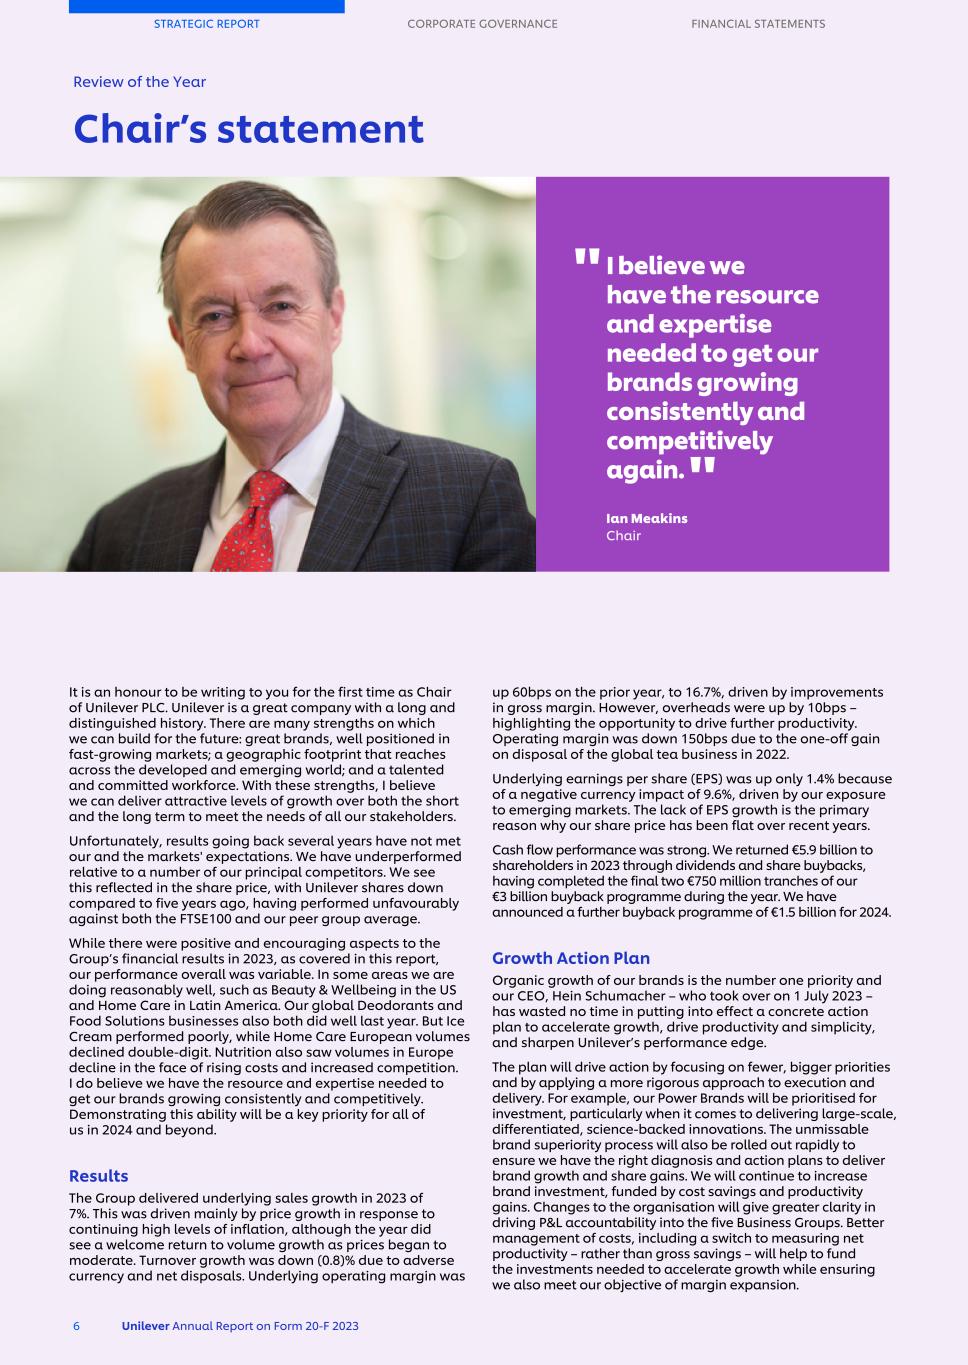
It is an honour to be writing to you for the first time as Chair of Unilever PLC. Unilever is a great company with a long and distinguished history. There are many strengths on which we can build for the future: great brands, well positioned in fast-growing markets; a geographic footprint that reaches across the developed and emerging world; and a talented and committed workforce. With these strengths, I believe we can deliver attractive levels of growth over both the short and the long term to meet the needs of all our stakeholders. Unfortunately, results going back several years have not met our and the markets' expectations. We have underperformed relative to a number of our principal competitors. We see this reflected in the share price, with Unilever shares down compared to five years ago, having performed unfavourably against both the FTSE100 and our peer group average. While there were positive and encouraging aspects to the Group’s financial results in 2023, as covered in this report, our performance overall was variable. In some areas we are doing reasonably well, such as Beauty & Wellbeing in the US and Home Care in Latin America. Our global Deodorants and Food Solutions businesses also both did well last year. But Ice Cream performed poorly, while Home Care European volumes declined double-digit. Nutrition also saw volumes in Europe decline in the face of rising costs and increased competition. I do believe we have the resource and expertise needed to get our brands growing consistently and competitively. Demonstrating this ability will be a key priority for all of us in 2024 and beyond. Results The Group delivered underlying sales growth in 2023 of 7%. This was driven mainly by price growth in response to continuing high levels of inflation, although the year did see a welcome return to volume growth as prices began to moderate. Turnover growth was down (0.8)% due to adverse currency and net disposals. Underlying operating margin was up 60bps on the prior year, to 16.7%, driven by improvements in gross margin. However, overheads were up by 10bps – highlighting the opportunity to drive further productivity. Operating margin was down 150bps due to the one-off gain on disposal of the global tea business in 2022. Underlying earnings per share (EPS) was up only 1.4% because of a negative currency impact of 9.6%, driven by our exposure to emerging markets. The lack of EPS growth is the primary reason why our share price has been flat over recent years. Cash flow performance was strong. We returned €5.9 billion to shareholders in 2023 through dividends and share buybacks, having completed the final two €750 million tranches of our €3 billion buyback programme during the year. We have announced a further buyback programme of €1.5 billion for 2024. Growth Action Plan Organic growth of our brands is the number one priority and our CEO, Hein Schumacher – who took over on 1 July 2023 – has wasted no time in putting into effect a concrete action plan to accelerate growth, drive productivity and simplicity, and sharpen Unilever’s performance edge. The plan will drive action by focusing on fewer, bigger priorities and by applying a more rigorous approach to execution and delivery. For example, our Power Brands will be prioritised for investment, particularly when it comes to delivering large-scale, differentiated, science-backed innovations. The unmissable brand superiority process will also be rolled out rapidly to ensure we have the right diagnosis and action plans to deliver brand growth and share gains. We will continue to increase brand investment, funded by cost savings and productivity gains. Changes to the organisation will give greater clarity in driving P&L accountability into the five Business Groups. Better management of costs, including a switch to measuring net productivity – rather than gross savings – will help to fund the investments needed to accelerate growth while ensuring we also meet our objective of margin expansion. STRATEGIC REPORT CORPORATE GOVERNANCE FINANCIAL STATEMENTS Review of the Year Chair’s statement 6 Unilever Annual Report on Form 20-F 2023 I believe we have the resource and expertise needed to get our brands growing consistently and competitively again. Ian Meakins Chair " " Image to be updated
While organic growth is the number one priority, the Board will continue to evaluate opportunities to improve Unilever’s portfolio to deliver faster growth, as we have done most recently, for example, with the agreement to acquire the fast- growing K18 prestige hair care brand in the US and with the planned disposal of the non-strategic Elida Beauty personal care brands. Until we have delivered faster organic growth, we do not think we should be considering large-scale acquisitions. We know that accelerated growth through the disciplined implementation of the Growth Action Plan is by far the best route to value creation. Climate Transition Action Plan We will continue to work hard to become a more sustainable business having made progress again in 2023. We go into 2024 with a sharpened focus around four major platforms that most support our sustainability agenda and our commercial objectives – climate, nature, plastics and livelihoods. Our plans are now fully integrated into the Business Group strategies, which we believe will enable us to make progress on sustainability while also delivering better performance. Climate change represents one of the biggest threats to the global economy and in March 2024 we published our updated Climate Transition Action Plan (CTAP), in advance of an advisory shareholder vote at our Annual General Meeting in May 2024. While there was overwhelming support for our first CTAP at our AGM in 2021, we take nothing for granted and know that the updated CTAP will need to measure up to the higher levels of accelerated delivery now demanded. Board and Governance Responsibility for transforming Unilever’s performance will be driven by Hein Schumacher and his Executive team. The Board’s role will be to provide appropriate support and challenge to Hein and his team. Ensuring we have a high- calibre Board that approaches this task with energy and conviction will be a key priority for me in 2024 and beyond. Good governance is vital for all businesses. At times of geopolitical and economic instability like this, it plays a particularly important role in building and retaining trust among a diverse base of stakeholders. Unilever operates to a high level of governance and the Board will maintain this approach going forward. Following widespread consultation, we will bring forward a revised Remuneration Policy for shareholders to consider at the 2024 AGM. The proposals address the constructive feedback we have received, and will form an important part of the measures being taken to sharpen Unilever’s performance. I would like to thank the Board members for their work in 2023. A special thank you to those colleagues who will be stepping down from the Board at the 2024 AGM: Nils Andersen as our former Chair, Judith Hartmann, Youngme Moon and Strive Masiyiwa. Thanks also to Feike Sijbesma, who stepped down in October 2023. Finally, thank you to our two Executive Directors who stood down in 2023: Alan Jope as CEO, on 30 June, and Graeme Pitkethly as Chief Financial Officer, on 31 December. The Board is delighted to be working with the new Executive team that Hein has put together, and especially our new CFO, Fernando Fernandez, who was appointed after an extensive internal and external search. From 1 March 2024, we are also very pleased to welcome Judith McKenna to the Board. Judith brings a wealth of experience, most recently as President and CEO of Walmart International. Looking ahead The Board and management of the company are all totally committed to deliver a significant step-up in Unilever’s long- term performance, starting in 2024. We have the necessary talent and resources and by focusing hard on driving growth, I am confident we can achieve the step-up required. I am delighted and honoured to be taking up this role and excited about the possibilities ahead. Unilever is a business with great assets, not least our talented and dedicated workforce. I want to thank each and every one of them for their considerable efforts in 2023. I look forward to meeting more of our Unilever team and working alongside them in 2024. Ian Meakins Chair STRATEGIC REPORT CORPORATE GOVERNANCE FINANCIAL STATEMENTS Review of the Year Unilever Annual Report on Form 20-F 2023 7
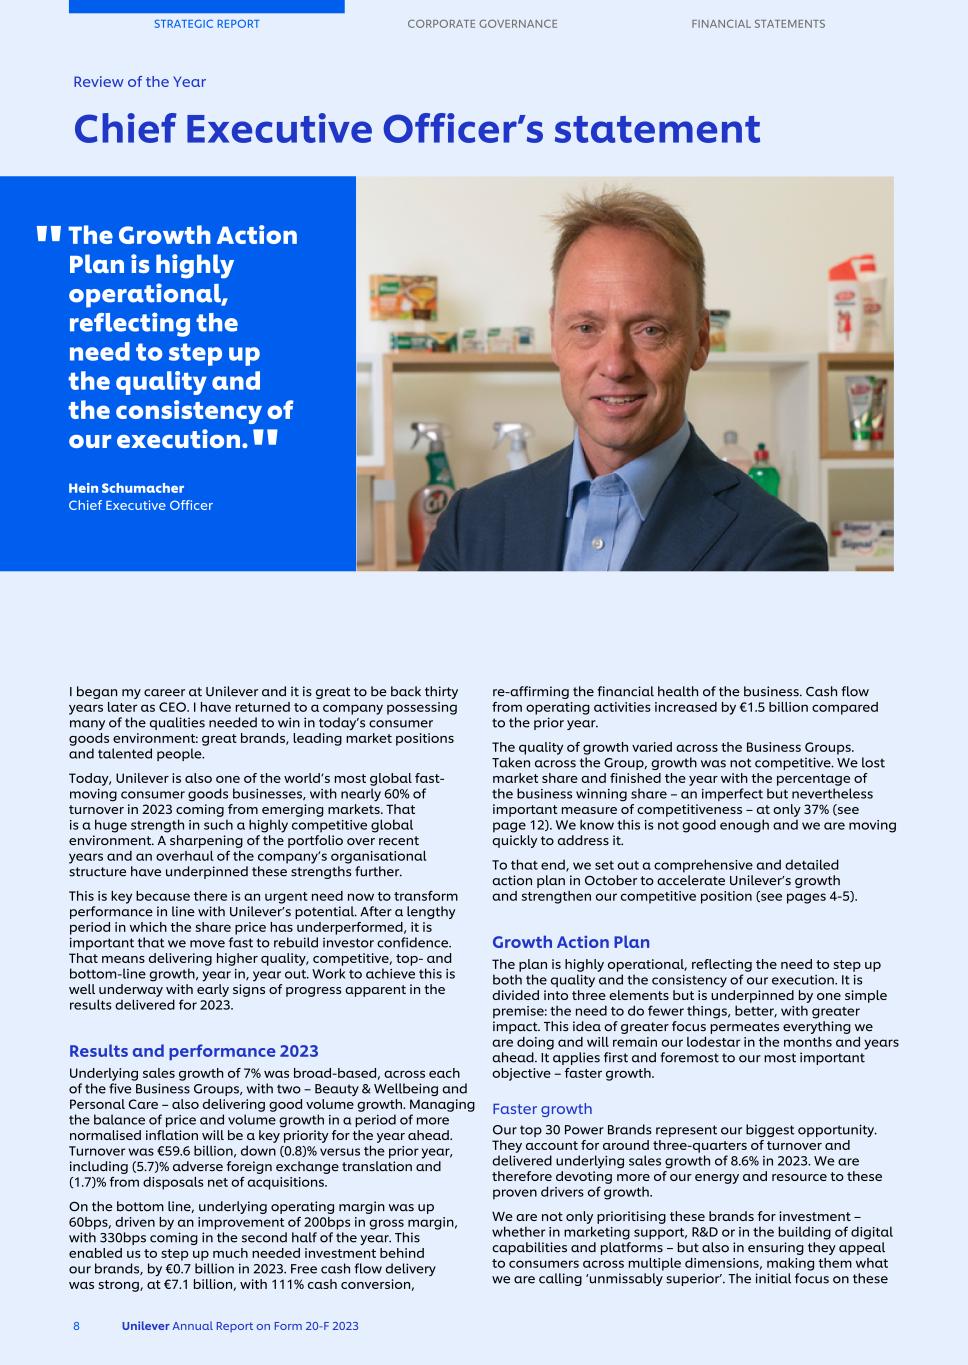
I began my career at Unilever and it is great to be back thirty years later as CEO. I have returned to a company possessing many of the qualities needed to win in today’s consumer goods environment: great brands, leading market positions and talented people. Today, Unilever is also one of the world’s most global fast- moving consumer goods businesses, with nearly 60% of turnover in 2023 coming from emerging markets. That is a huge strength in such a highly competitive global environment. A sharpening of the portfolio over recent years and an overhaul of the company’s organisational structure have underpinned these strengths further. This is key because there is an urgent need now to transform performance in line with Unilever’s potential. After a lengthy period in which the share price has underperformed, it is important that we move fast to rebuild investor confidence. That means delivering higher quality, competitive, top- and bottom-line growth, year in, year out. Work to achieve this is well underway with early signs of progress apparent in the results delivered for 2023. Results and performance 2023 Underlying sales growth of 7% was broad-based, across each of the five Business Groups, with two – Beauty & Wellbeing and Personal Care – also delivering good volume growth. Managing the balance of price and volume growth in a period of more normalised inflation will be a key priority for the year ahead. Turnover was €59.6 billion, down (0.8)% versus the prior year, including (5.7)% adverse foreign exchange translation and (1.7)% from disposals net of acquisitions. On the bottom line, underlying operating margin was up 60bps, driven by an improvement of 200bps in gross margin, with 330bps coming in the second half of the year. This enabled us to step up much needed investment behind our brands, by €0.7 billion in 2023. Free cash flow delivery was strong, at €7.1 billion, with 111% cash conversion, re-affirming the financial health of the business. Cash flow from operating activities increased by €1.5 billion compared to the prior year. The quality of growth varied across the Business Groups. Taken across the Group, growth was not competitive. We lost market share and finished the year with the percentage of the business winning share – an imperfect but nevertheless important measure of competitiveness – at only 37% (see page 12). We know this is not good enough and we are moving quickly to address it. To that end, we set out a comprehensive and detailed action plan in October to accelerate Unilever’s growth and strengthen our competitive position (see pages 4-5). Growth Action Plan The plan is highly operational, reflecting the need to step up both the quality and the consistency of our execution. It is divided into three elements but is underpinned by one simple premise: the need to do fewer things, better, with greater impact. This idea of greater focus permeates everything we are doing and will remain our lodestar in the months and years ahead. It applies first and foremost to our most important objective – faster growth. Faster growth Our top 30 Power Brands represent our biggest opportunity. They account for around three-quarters of turnover and delivered underlying sales growth of 8.6% in 2023. We are therefore devoting more of our energy and resource to these proven drivers of growth. We are not only prioritising these brands for investment – whether in marketing support, R&D or in the building of digital capabilities and platforms – but also in ensuring they appeal to consumers across multiple dimensions, making them what we are calling ‘unmissably superior’. The initial focus on these STRATEGIC REPORT CORPORATE GOVERNANCE FINANCIAL STATEMENTS Review of the Year Chief Executive Officer’s statement 8 Unilever Annual Report on Form 20-F 2023 The Growth Action Plan is highly operational, reflecting the need to step up the quality and the consistency of our execution. Hein Schumacher Chief Executive Officer " "

30 brands is to ensure our plans are executed brilliantly. We will then drive the plans across the wider portfolio. Under the Growth Action Plan, we will also scale our innovations more systematically and over longer time horizons, leveraging Unilever’s strengths in science and technology more effectively. This will help to fuel the growth of our brands, not least by ensuring we develop and expand the categories in which they compete. We have world-leading brands, which we are convinced – with the right focus and attention – can drive accelerated levels of growth. Hence, we see no need to pursue transformational acquisitions at this stage. However, we will continue to take opportunities wherever we can to optimise the portfolio. We did this last year with the acquisition of the premium ice cream brand, Yasso, and with the agreement to acquire the prestige hair care brand, K18 (completed in February 2024). We sharpened the portfolio further in 2023 with the disposal of Suave in North America and Dollar Shave Club, and we expect to complete the sale of the Elida Beauty brands by the middle of 2024. Productivity and simplicity Stronger growth will be enabled through a combination of higher productivity and reduced complexity – the second pillar of our action plan. We are making a number of interventions here, first by restoring gross margin to pre-pandemic levels. This is being done through tighter cost control, including shifting focus from gross savings to net productivity, thereby enabling us to determine more accurately the true level – and impact – of costs on profitability. We made progress towards this objective last year with gross margin rising to 42.2%, but have a lot more to do to meet our ambitions and return to more competitive levels. By highlighting more clearly where the accountability for costs lies, our new organisational structure is facilitating the delivery of this goal. The implementation of the changes to the organisation are now complete and we are squarely focused on reaping the full benefits of the new simplified model. The concept of fewer things, done better, with greater impact applies equally to our sustainability goals. That is why we are honing our sustainability efforts around four critical platforms – climate, nature, plastics and livelihoods – and doing so on the basis of exacting, short-term, measurable and transparent goals, complementing our more long-term objectives. In many ways this is a natural extension of the pioneering work led by my predecessors, which has established Unilever as a leader in the field. I am determined we should retain that leadership role, primarily through enhancing our reputation for delivery and for demonstrating even more clearly how progress on sustainability drives business performance. Leadership changes and performance culture We are approaching the opportunities and challenges ahead with a refreshed leadership team having made a significant number of changes at the most senior levels of the company. I am excited to be working alongside our new and highly experienced Chair, Ian Meakins. We share a belief in Unilever’s potential, as well as a desire to turn potential into performance as soon as possible. I am also delighted to be partnered by our new CFO, Fernando Fernandez, whose experience and knowledge of the consumer goods industry make him well placed to help lead a step-up in Unilever’s performance. Fernando is one of a number of changes to the executive team. We have assembled a top team eminently capable of unlocking Unilever’s potential through a combination of promoting exceptionally capable internal candidates, by matching experience closely to requirements, as with Peter ter Kulve’s appointment as President Ice Cream, and by bringing in world leading talent from outside – such as the announced appointments of Heiko Schipper as President Nutrition and Mairead Nayager as Chief People Officer. See page 87 for more on ULE appointments. Leadership changes are a necessary condition for achieving the step-up in performance we need, but are not enough by themselves. A key task for the new executive team will be to oversee a dialling-up of Unilever’s performance edge. We will do this by making some important shifts in the way we think about, approach and reward performance. Going forward, the emphasis will be on a series of actions designed to achieve a stronger link between performance and reward. Our work here will also be shaped and guided by a streamlined set of leadership behaviours. Again, fewer things, done better, with greater impact. Outlook It is likely the world economy will remain in a state of flux over the year ahead. The increased volatility brought about by geopolitical tensions and the effects of climate change will continue to bear down on global growth. Consumers across the world will continue to feel the effects of multi-year inflation, although we see inflation easing to more normalised and historic levels in most of our markets. Some of our emerging market geographies were hit last year by significant currency devaluations. We expect to see a slow recovery there in 2024. In Europe, growth will remain subdued, although we remain positive in our outlook for this important Unilever market. We have a robust plan and set of responses in place, not just to weather the economic storms, but to put Unilever on the road to more sustained levels of volume-led, competitive growth. The potential at Unilever is significant. We are all focused on doing what is needed to unlock that potential and ensure we deliver improved returns to shareholders. Acknowledgements Finally, I want to thank my predecessor, Alan Jope, and our outgoing CFO, Graeme Pitkethly, for all their support and for their long service to Unilever. My thanks also to Nils Andersen for his guidance and support during his time as Chair. In re-joining Unilever, I have received a very warm and generous reception from colleagues across the company. My appreciation goes to everyone at Unilever for that, as well as for the hard work and commitment that went into delivering the results for 2023. I am confident that together we can go on to achieve great things in the years ahead. Hein Schumacher Chief Executive Officer STRATEGIC REPORT CORPORATE GOVERNANCE FINANCIAL STATEMENTS Review of the Year Unilever Annual Report on Form 20-F 2023 9
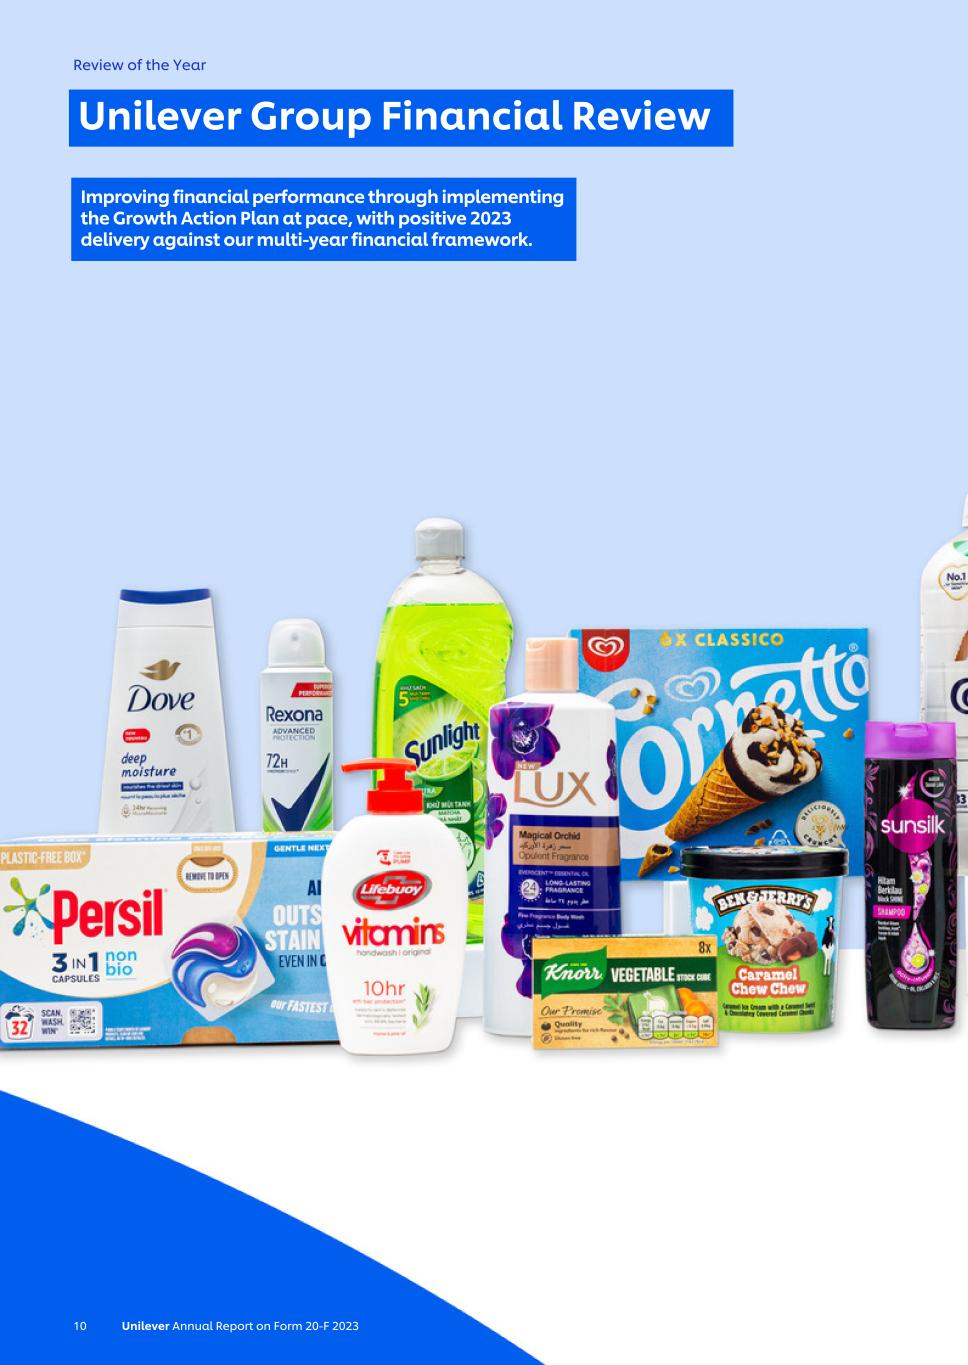
Review of the Year Unilever Group Financial Review 10 Unilever Annual Report on Form 20-F 2023 Improving financial performance through implementing the Growth Action Plan at pace, with positive 2023 delivery against our multi-year financial framework.
Unilever Annual Report on Form 20-F 2023 11 Performance highlights Turnover in 2023 €59.6bn 2022: €60.1bn 2021: €52.4bn Turnover growth Underlying sales growth Operating margin Underlying operating margin Pages 11 to 32 use GAAP and non-GAAP measures to explain the performance of our business. See page 59 to 64 for further information.

2023 saw a return to volume growth and gross margin expansion, however our competitiveness was disappointing. We are now focused on executing the Growth Action Plan, to realise Unilever's full potential. Fernando Fernandez Chief Financial Officer Highlights Turnover growth down 0.8% due to adverse currency and net disposals. USG of 7.0% with a return to positive volumes of 0.2%. 30 Power Brands accretive to growth and margins, with underlying sales up 8.6% and increased brand and marketing investment behind them. Strong cash conversion of 111% with Free Cash Flow up €1.9 billion to €7.1 billion. Year in summary Economic volatility, continued inflationary and cost of living pressures continued in 2023. While these eased in the second half of the year, uncertainty remained amid geopolitical tensions. Against this backdrop, we delivered an improving financial performance, with the return to volume growth and margin rebuilding. The Group generated turnover of €59.6 billion, operating profit of €9.8 billion, net profit of €7.1 billion and free cash flow of €7.1 billion during the year. Growth Turnover for the year was €59.6 billion, down (0.8)% versus 2022. Underlying sales growth contributed 7.0%, and we saw a negative impact from acquisitions and disposals of (1.7)%, with the disposals of Tea and Suave partially offset by the inclusion of Nutrafol and Yasso. Beauty & Wellbeing grew underlying sales by 8.3%, with strong volume growth of 4.4%. Prestige Beauty and Health & Wellbeing continued to grow double-digit and now account for a quarter of Beauty & Wellbeing’s turnover. Personal Care grew underlying sales 8.9%, with 3.2% from volume and 5.5% from price, led by strong sales growth of Deodorants. Home Care grew underlying sales 5.9%, driven by 6.8% from price and (0.9)% from volume, with positive volumes in emerging markets offset by a double-digit decline in Europe. Nutrition grew underlying sales 7.7%, with 10.1% from price and volumes down (2.2)% as we responded to higher input costs and a challenging European market. Ice Cream’s underlying sales growth was disappointing at 2.3%, with price growth of 8.8% and a volume decline of (6.0)%, reflecting the impact of downtrading in the in-home channels. See page 14 to 33 for more on Business Group performance. Our 30 Power Brands, identified as a key focus in the Growth Action Plan, contributed around 75% of the Group’s turnover and grew 8.6%. The percentage of our business winning market share(a) on a rolling 12-month basis was disappointing at 37%. This poor performance reflects share losses to private label in Europe, consumer shifts to super-premium segments in North America and a significant reduction of unprofitable active SKUs globally. Our competitiveness is not good enough and we are moving quickly to address it. Acquisition and disposal activities had a negative impact of (1.7)% to turnover, driven by the Tea business disposal partly offset by strong growth in Nutrafol, which we acquired in 2022. More details on acquisitions and disposals are in note 21 on pages 220 to 222. Emerging markets (58% of Group turnover) grew underlying sales 8.5%, with 1.6% from volume and 6.9% from price. Latin America, Turkey and Africa delivered double-digit growth. India grew mid- single digit led by volume, with lower input costs that led to negative pricing in the fourth quarter. Sales in China grew low- single digit led by volume while the market recovery continued to be uneven and slower than expected. Growth in South East Asia was impacted by a sales decline in Indonesia in the fourth quarter as consumers avoided the brands of multinational companies in response to the geopolitical situation in the Middle East. Underlying sales in developed markets (42% of Group turnover) grew 4.8% in the full year with 6.7% from price and (1.8)% from volume. North America delivered strong growth of 5.8% with 2.5% from volume and 3.3% from price, with continued double-digit underlying sales growth in Prestige Beauty and Health & Wellbeing. Volume growth in North America accelerated throughout the year leading to volume growth of 6.3% in the fourth quarter. In Europe, underlying sales growth was 4.1%, driven by 12.8% from price given its higher exposure to categories with significant cost inflation, and a volume decline of (7.7)%. Review of the Year 12 Unilever Annual Report on Form 20-F 2023 " " Group Financial Review (a) Competitiveness % Business Winning measures the aggregate turnover of the portfolio components (country/category cells) gaining value market share as a % of the total turnover measured by market data. It assesses what percentage of our revenue is being generated in areas where we are gaining market share.
Margin Operating profit was €9.8 billion which included a gain on disposal of €0.5 billion mainly related to the disposal of our Suave portfolio spread across Beauty & Wellbeing and Personal Care categories. Meanwhile, there were €0.5 billion in restructuring costs from transformation technology and supply chain projects, and continued investment to embed the Group’s category-focused organisation model. This was down (9.3)% from the prior year primarily due to a gain of €2.3 billion recognised on the disposal of the global tea business in 2022. Underlying operating profit was €9.9 billion, up 2.6% versus the prior year. Underlying operating margin increased 60bps to 16.7%, with gross margin improving by 200bps to 42.2%. The impact of net material inflation, of around €1.8 billion was more than mitigated through improved productivity, price and mix. Brand and marketing investment was 14.3% of turnover which was an increase of 130bps. Overheads marginally increased as we continued to invest in the expansion of our Prestige Beauty and Health & Wellbeing businesses. Cash, capital allocation and earnings We delivered strong cash conversion of 111% and generated free cash flow of €7.1 billion, an increase of €1.9 billion compared to 2022. This increase was largely driven by higher underlying operating profit and improved working capital, and included €0.4 billion linked to a tax refund in India. In 2023, we returned €5.9 billion to shareholders through dividends and share buybacks. We completed the final two €750 million tranches of our €3 billion share buyback programme. Dividend payments were maintained in line with prior year. Reflecting the Group's continued strong cash generation we announced a share buyback programme of €1.5 billion to be conducted during 2024. Diluted earnings per share were €2.56, a (14.2)% reduction versus prior year which included the gain on the disposal of our Tea business. Underlying earnings per share increased 1.4% to €2.60, including (9.6)% of adverse currency. Constant EPS increased by 11.0%, reflecting strong operational performance, lower net finance costs and a reduction in the number of shares as a result of the share buyback programme, partially offset by a higher underlying effective tax rate of 25.6%. Portfolio reshaping We continued to reshape the portfolio, allocating capital to premium segments through selective bolt-on acquisitions and divesting lower-growth businesses while balancing investment in the business and shareholder returns. We acquired Yasso Holdings, Inc., a premium frozen Greek yogurt brand in the US, which completed on 1 August, and K18, a premium biotech hair care brand, which completed on 1 February 2024. We also announced three disposals during the year: Suave in North America, which completed on 1 May; Dollar Shave Club, which completed on 1 November; and Elida Beauty, which is expected to complete by mid-2024. Looking forward We are confident that the Growth Action Plan, which we set out in October 2023, will strengthen our performance within our multi- year financial framework. We will focus on further rebuilding gross margin to reinvest behind our 30 Power Brands, stepping up volume growth and delivering improved competitiveness. Our financial ambition is to deliver Total Shareholder Return (TSR) in the top third of our peer group. STRATEGIC REPORT CORPORATE GOVERNANCE FINANCIAL STATEMENTS Review of the Year Unilever Annual Report on Form 20-F 2023 13 Modest margin expansion 100% cash conversion '+60bps 111% See pages 56 to 64 See pages 56 to 64 Mid-teens ROIC EPS growth and an attractive dividend Delivering TSR in top third of our peer group 16.2% UEPS growth 1.4% Dividend payout* 66% Bottom third See pages 56 to 64 See pages 56 to 64 See pages 116 to 153 Our Multi-Year Financial Framework Our financial framework is to deliver long-term value creation through our Growth Action Plan which will drive earnings growth, a strong cash flow and a growing dividend. Our 2023 results against the framework are below: *Calculated as dividend per share / underlying earnings per share

Review of the Year Beauty & Wellbeing 14 Unilever Annual Report on Form 20-F 2023 We want to shape a new era of inclusive beauty and wellbeing. Our commitment to ‘Purpose, Science, Desire’ sits at the heart of our brands and guides us in delivering high-performing and appealing products for consumers.
Unilever Annual Report on Form 20-F 2023 15 Performance highlights Turnover in 2023 €12.5bn 2022: €12.3bn 2021: €10.1bn Turnover growth Underlying sales growth Operating margin Underlying operating margin Pages 11 to 32 use GAAP and non-GAAP measures to explain the performance of our business. See page 59 to 64 for further information.

We continued to embed our 'Purpose, Science, Desire' framework into our brand propositions this year, alongside a focus on volume growth and premiumisation. Priya Nair President, Beauty & Wellbeing* Highlights Hair Care grew mid-single digit through a combination of price and volume led growth. Prestige Beauty and Health & Wellbeing grew double-digit and now represent 25% of turnover. Vaseline, one of our Power Brands, reached €1 billion of turnover in 2023. * Fernando Fernandez, now CFO, was President of Beauty & Wellbeing until 31st December 2023. About Beauty & Wellbeing We are a global player in the fast-growing beauty and health & wellbeing markets. In Hair Care we compete for global leadership, and our Skin Care portfolio is particularly strong in Asia. Our Prestige Beauty and Health & Wellbeing businesses have a strong presence in high-growth areas including Prestige Skin Care and Hair Care, Colour Cosmetics, and Vitamins, Minerals and Supplements. Our performance in 2023 In 2023 we delivered a strong full year performance. Turnover increased by 1.8%, while underlying sales growth was 8.3% balanced between good volume growth at 4.4% and price at 3.8%, with an unfavourable currency impact of (6.2)% driven by the weakening of currencies in key markets such as India and US. The strong full year performance reflects continued double- digit growth in Prestige Beauty and Health & Wellbeing as well as innovations in our Skin Care and Hair Care brands. Europe delivered strong growth driven by price with slightly negative volume. Operating profit was €2.2 billion, which was flat compared to the prior year. Non-underlying items were €122 million from acquisition and disposal related costs, and restructuring spend, offset by a gain from the disposal of our Suave business in North America. Underlying operating profit was flat compared to the prior year at €2.3 billion. Our strategic priorities The enduring consumer trends which make beauty and wellbeing an attractive industry remained in 2023, notably demand for more premium science-backed products, and a desire for inclusive beauty. Our strategy is firmly rooted in these trends and focuses on three key priorities: premiumising our core Hair Care and Skin Care brands; accelerating our high-growth Prestige Beauty and Health & Wellbeing portfolios; and ongoing focus on gross margin through productivity, complexity reduction and strengthening operational execution. Improving our competitiveness in terms of value is a key priority for the year ahead. Premiumising our Power Brands Our Hair Care and Skin Care Power Brands – Sunsilk, TRESemmé, Dove, Clear, POND's and Vaseline – continue to use science and technology to elevate their superiority credentials, alongside market making to scale innovations. This year we prioritised investment in these brands across our key markets. Sunsilk’s strong multi-market execution shows the effectiveness of this approach, with strong growth this year. Breakthrough science Multi-year innovations which support premiumisation provide a key growth platform for our brands – and will help to restore competitiveness in Hair Care, especially in the US and India. This year we rolled out a number of new breakthrough innovations to support the ongoing premiumisation of our Hair Care and Skin Care portfolios. Clear continued its transformation to a premium holistic scalp care offering with a new anti-dandruff formula – Clear Men Scalp Pro Anti-Hair Fall – which was first launched in China last year leading to market share gains. Along with Clear Scalpceuticals Hair Fall Resist, the brand has now expanded the range to three other key markets – Thailand, Turkey and Brazil. POND’s also successfully launched an innovation in Indonesia, with further launches in 2024 planned. The POND'S Bright Miracle range includes patented technology for micro-repair. Review of the Year 16 Unilever Annual Report on Form 20-F 2023 Purpose, Science, Desire " "
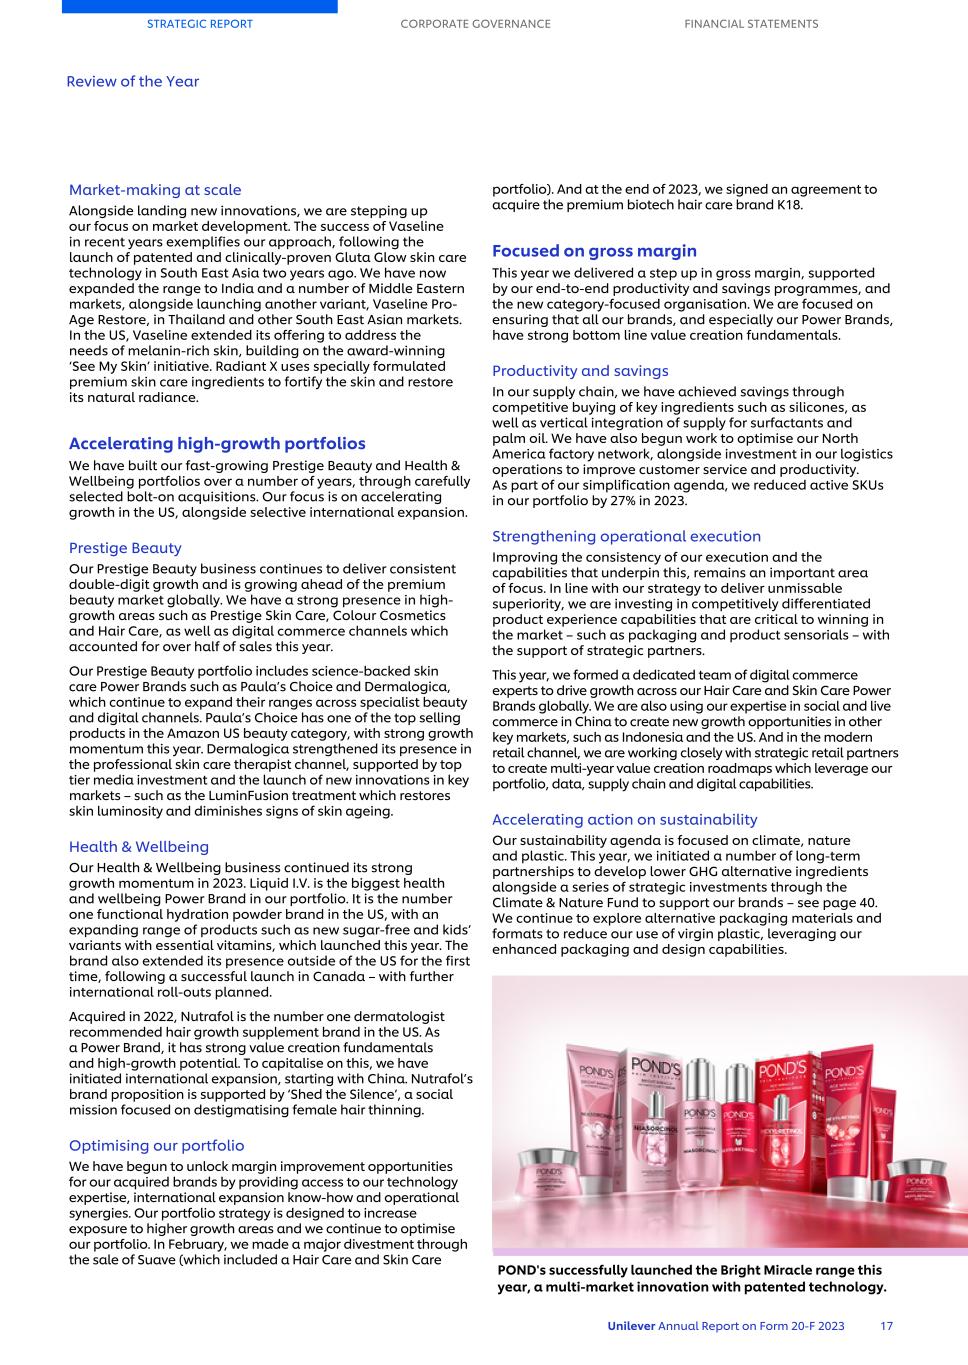
Market-making at scale Alongside landing new innovations, we are stepping up our focus on market development. The success of Vaseline in recent years exemplifies our approach, following the launch of patented and clinically-proven Gluta Glow skin care technology in South East Asia two years ago. We have now expanded the range to India and a number of Middle Eastern markets, alongside launching another variant, Vaseline Pro- Age Restore, in Thailand and other South East Asian markets. In the US, Vaseline extended its offering to address the needs of melanin-rich skin, building on the award-winning ‘See My Skin’ initiative. Radiant X uses specially formulated premium skin care ingredients to fortify the skin and restore its natural radiance. Accelerating high-growth portfolios We have built our fast-growing Prestige Beauty and Health & Wellbeing portfolios over a number of years, through carefully selected bolt-on acquisitions. Our focus is on accelerating growth in the US, alongside selective international expansion. Prestige Beauty Our Prestige Beauty business continues to deliver consistent double-digit growth and is growing ahead of the premium beauty market globally. We have a strong presence in high- growth areas such as Prestige Skin Care, Colour Cosmetics and Hair Care, as well as digital commerce channels which accounted for over half of sales this year. Our Prestige Beauty portfolio includes science-backed skin care Power Brands such as Paula’s Choice and Dermalogica, which continue to expand their ranges across specialist beauty and digital channels. Paula’s Choice has one of the top selling products in the Amazon US beauty category, with strong growth momentum this year. Dermalogica strengthened its presence in the professional skin care therapist channel, supported by top tier media investment and the launch of new innovations in key markets – such as the LuminFusion treatment which restores skin luminosity and diminishes signs of skin ageing. Health & Wellbeing Our Health & Wellbeing business continued its strong growth momentum in 2023. Liquid I.V. is the biggest health and wellbeing Power Brand in our portfolio. It is the number one functional hydration powder brand in the US, with an expanding range of products such as new sugar-free and kids’ variants with essential vitamins, which launched this year. The brand also extended its presence outside of the US for the first time, following a successful launch in Canada – with further international roll-outs planned. Acquired in 2022, Nutrafol is the number one dermatologist recommended hair growth supplement brand in the US. As a Power Brand, it has strong value creation fundamentals and high-growth potential. To capitalise on this, we have initiated international expansion, starting with China. Nutrafol’s brand proposition is supported by ‘Shed the Silence’, a social mission focused on destigmatising female hair thinning. Optimising our portfolio We have begun to unlock margin improvement opportunities for our acquired brands by providing access to our technology expertise, international expansion know-how and operational synergies. Our portfolio strategy is designed to increase exposure to higher growth areas and we continue to optimise our portfolio. In February, we made a major divestment through the sale of Suave (which included a Hair Care and Skin Care portfolio). And at the end of 2023, we signed an agreement to acquire the premium biotech hair care brand K18. Focused on gross margin This year we delivered a step up in gross margin, supported by our end-to-end productivity and savings programmes, and the new category-focused organisation. We are focused on ensuring that all our brands, and especially our Power Brands, have strong bottom line value creation fundamentals. Productivity and savings In our supply chain, we have achieved savings through competitive buying of key ingredients such as silicones, as well as vertical integration of supply for surfactants and palm oil. We have also begun work to optimise our North America factory network, alongside investment in our logistics operations to improve customer service and productivity. As part of our simplification agenda, we reduced active SKUs in our portfolio by 27% in 2023. Strengthening operational execution Improving the consistency of our execution and the capabilities that underpin this, remains an important area of focus. In line with our strategy to deliver unmissable superiority, we are investing in competitively differentiated product experience capabilities that are critical to winning in the market – such as packaging and product sensorials – with the support of strategic partners. This year, we formed a dedicated team of digital commerce experts to drive growth across our Hair Care and Skin Care Power Brands globally. We are also using our expertise in social and live commerce in China to create new growth opportunities in other key markets, such as Indonesia and the US. And in the modern retail channel, we are working closely with strategic retail partners to create multi-year value creation roadmaps which leverage our portfolio, data, supply chain and digital capabilities. Accelerating action on sustainability Our sustainability agenda is focused on climate, nature and plastic. This year, we initiated a number of long-term partnerships to develop lower GHG alternative ingredients alongside a series of strategic investments through the Climate & Nature Fund to support our brands – see page 40. We continue to explore alternative packaging materials and formats to reduce our use of virgin plastic, leveraging our enhanced packaging and design capabilities. STRATEGIC REPORT CORPORATE GOVERNANCE FINANCIAL STATEMENTS Review of the Year Unilever Annual Report on Form 20-F 2023 17 POND's successfully launched the Bright Miracle range this year, a multi-market innovation with patented technology.
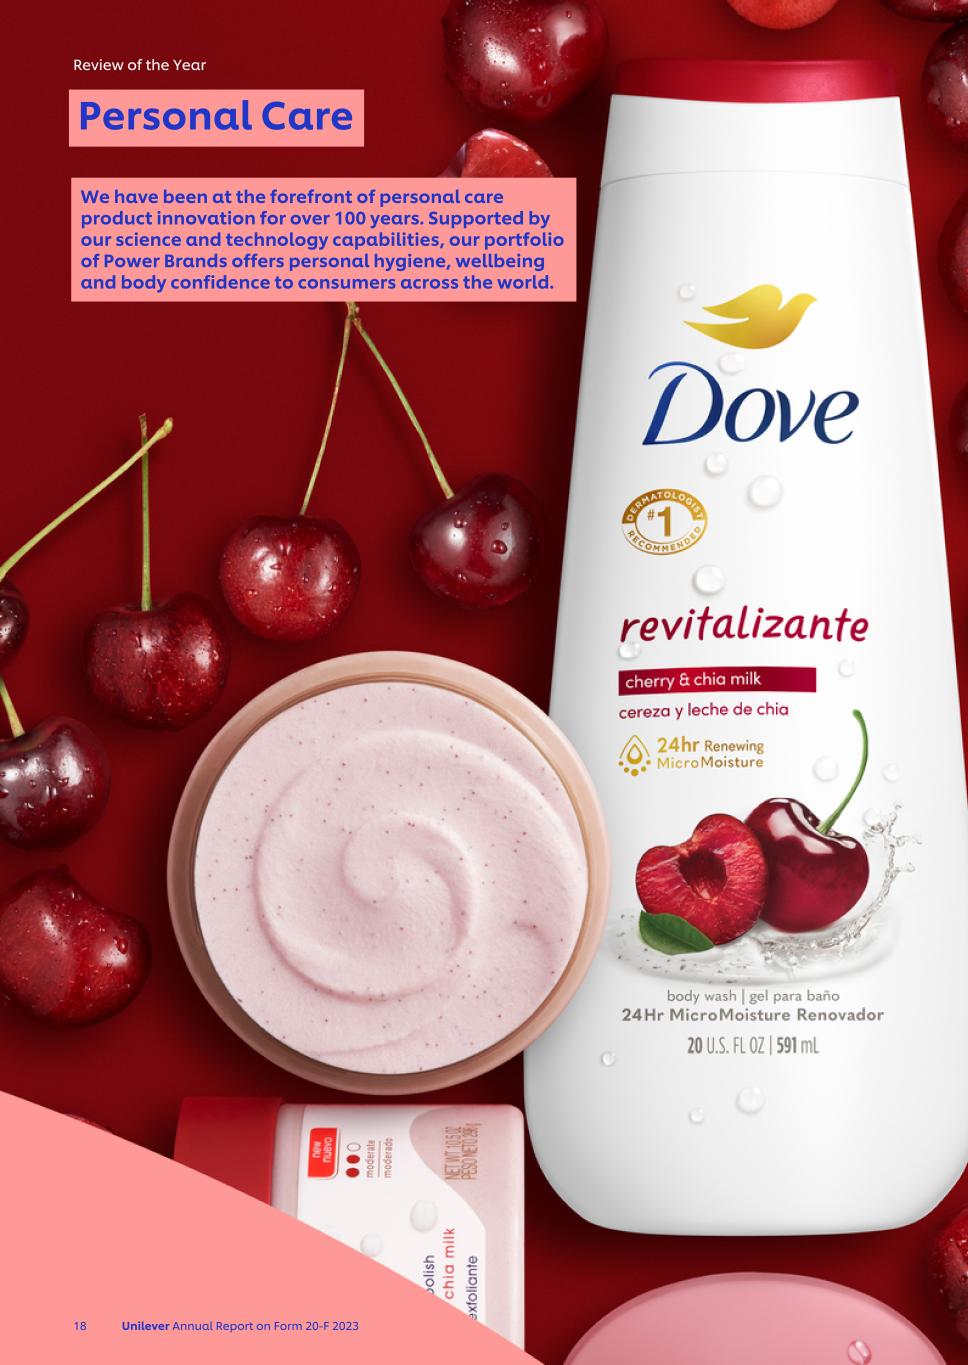
Review of the Year Personal Care 18 Unilever Annual Report on Form 20-F 2023 We have been at the forefront of personal care product innovation for over 100 years. Supported by our science and technology capabilities, our portfolio of Power Brands offers personal hygiene, wellbeing and body confidence to consumers across the world.
Unilever Annual Report on Form 20-F 2023 19 Performance highlights Turnover in 2023 €13.8bn 2022: €13.6bn 2021: €11.7bn Turnover growth Underlying sales growth Operating margin Underlying operating margin Pages 11 to 32 use GAAP and non-GAAP measures to explain the performance of our business. See page 59 to 64 for further information.
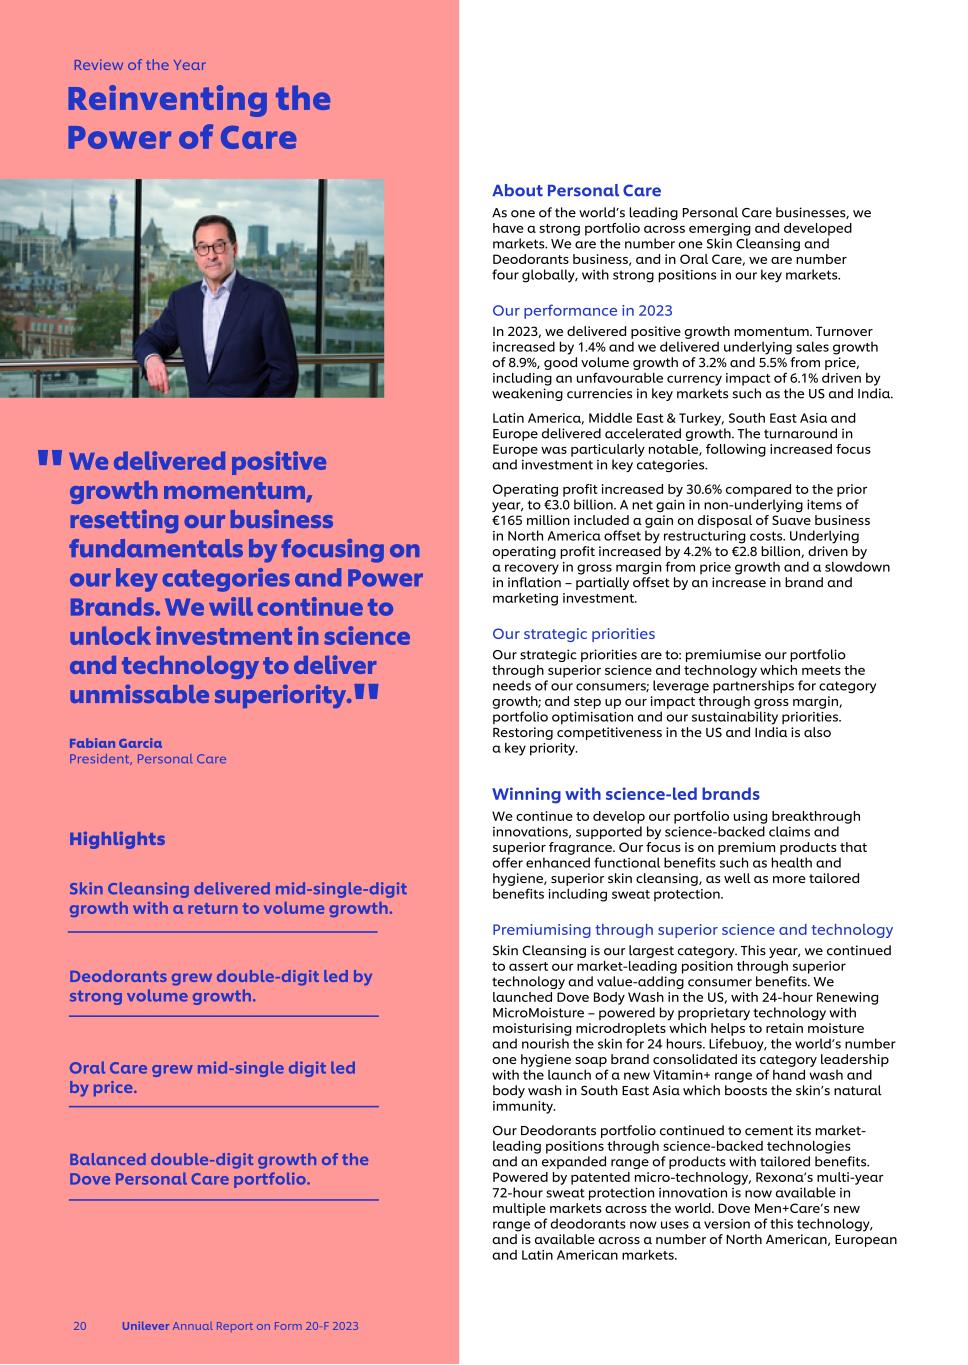
We delivered positive growth momentum, resetting our business fundamentals by focusing on our key categories and Power Brands. We will continue to unlock investment in science and technology to deliver unmissable superiority. Fabian Garcia President, Personal Care Highlights Skin Cleansing delivered mid-single-digit growth with a return to volume growth. Deodorants grew double-digit led by strong volume growth. Oral Care grew mid-single digit led by price. Balanced double-digit growth of the Dove Personal Care portfolio. About Personal Care As one of the world’s leading Personal Care businesses, we have a strong portfolio across emerging and developed markets. We are the number one Skin Cleansing and Deodorants business, and in Oral Care, we are number four globally, with strong positions in our key markets. Our performance in 2023 In 2023, we delivered positive growth momentum. Turnover increased by 1.4% and we delivered underlying sales growth of 8.9%, good volume growth of 3.2% and 5.5% from price, including an unfavourable currency impact of 6.1% driven by weakening currencies in key markets such as the US and India. Latin America, Middle East & Turkey, South East Asia and Europe delivered accelerated growth. The turnaround in Europe was particularly notable, following increased focus and investment in key categories. Operating profit increased by 30.6% compared to the prior year, to €3.0 billion. A net gain in non-underlying items of €165 million included a gain on disposal of Suave business in North America offset by restructuring costs. Underlying operating profit increased by 4.2% to €2.8 billion, driven by a recovery in gross margin from price growth and a slowdown in inflation – partially offset by an increase in brand and marketing investment. Our strategic priorities Our strategic priorities are to: premiumise our portfolio through superior science and technology which meets the needs of our consumers; leverage partnerships for category growth; and step up our impact through gross margin, portfolio optimisation and our sustainability priorities. Restoring competitiveness in the US and India is also a key priority. Winning with science-led brands We continue to develop our portfolio using breakthrough innovations, supported by science-backed claims and superior fragrance. Our focus is on premium products that offer enhanced functional benefits such as health and hygiene, superior skin cleansing, as well as more tailored benefits including sweat protection. Premiumising through superior science and technology Skin Cleansing is our largest category. This year, we continued to assert our market-leading position through superior technology and value-adding consumer benefits. We launched Dove Body Wash in the US, with 24-hour Renewing MicroMoisture – powered by proprietary technology with moisturising microdroplets which helps to retain moisture and nourish the skin for 24 hours. Lifebuoy, the world’s number one hygiene soap brand consolidated its category leadership with the launch of a new Vitamin+ range of hand wash and body wash in South East Asia which boosts the skin’s natural immunity. Our Deodorants portfolio continued to cement its market- leading positions through science-backed technologies and an expanded range of products with tailored benefits. Powered by patented micro-technology, Rexona’s multi-year 72-hour sweat protection innovation is now available in multiple markets across the world. Dove Men+Care’s new range of deodorants now uses a version of this technology, and is available across a number of North American, European and Latin American markets. Review of the Year 20 Unilever Annual Report on Form 20-F 2023 Reinventing the Power of Care " "
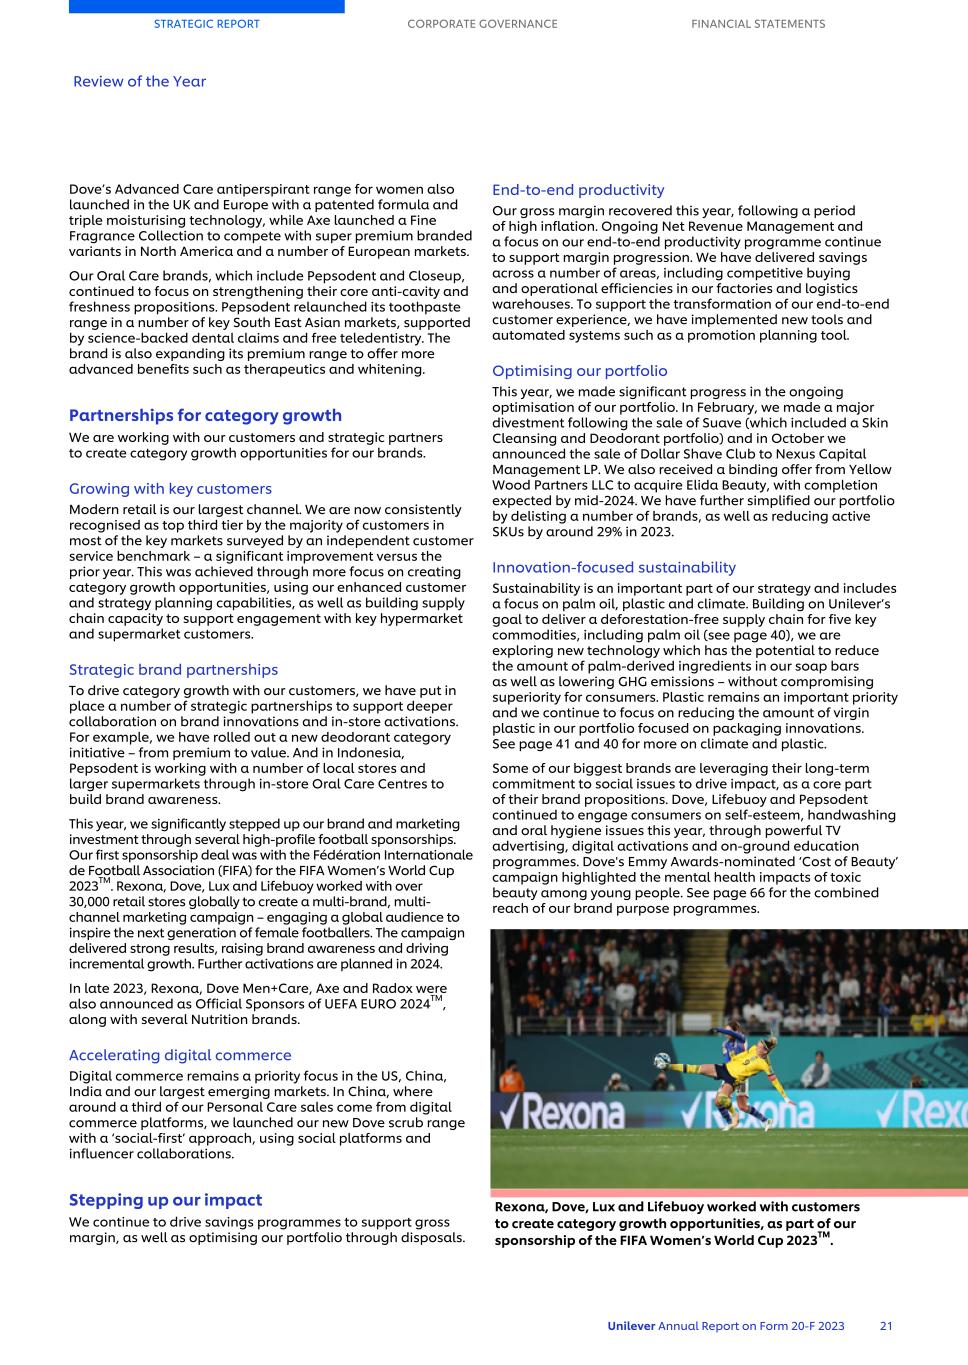
Dove’s Advanced Care antiperspirant range for women also launched in the UK and Europe with a patented formula and triple moisturising technology, while Axe launched a Fine Fragrance Collection to compete with super premium branded variants in North America and a number of European markets. Our Oral Care brands, which include Pepsodent and Closeup, continued to focus on strengthening their core anti-cavity and freshness propositions. Pepsodent relaunched its toothpaste range in a number of key South East Asian markets, supported by science-backed dental claims and free teledentistry. The brand is also expanding its premium range to offer more advanced benefits such as therapeutics and whitening. Partnerships for category growth We are working with our customers and strategic partners to create category growth opportunities for our brands. Growing with key customers Modern retail is our largest channel. We are now consistently recognised as top third tier by the majority of customers in most of the key markets surveyed by an independent customer service benchmark – a significant improvement versus the prior year. This was achieved through more focus on creating category growth opportunities, using our enhanced customer and strategy planning capabilities, as well as building supply chain capacity to support engagement with key hypermarket and supermarket customers. Strategic brand partnerships To drive category growth with our customers, we have put in place a number of strategic partnerships to support deeper collaboration on brand innovations and in-store activations. For example, we have rolled out a new deodorant category initiative – from premium to value. And in Indonesia, Pepsodent is working with a number of local stores and larger supermarkets through in-store Oral Care Centres to build brand awareness. This year, we significantly stepped up our brand and marketing investment through several high-profile football sponsorships. Our first sponsorship deal was with the Fédération Internationale de Football Association (FIFA) for the FIFA Women’s World Cup 2023TM. Rexona, Dove, Lux and Lifebuoy worked with over 30,000 retail stores globally to create a multi-brand, multi- channel marketing campaign – engaging a global audience to inspire the next generation of female footballers. The campaign delivered strong results, raising brand awareness and driving incremental growth. Further activations are planned in 2024. In late 2023, Rexona, Dove Men+Care, Axe and Radox were also announced as Official Sponsors of UEFA EURO 2024TM, along with several Nutrition brands. Accelerating digital commerce Digital commerce remains a priority focus in the US, China, India and our largest emerging markets. In China, where around a third of our Personal Care sales come from digital commerce platforms, we launched our new Dove scrub range with a ‘social-first’ approach, using social platforms and influencer collaborations. Stepping up our impact We continue to drive savings programmes to support gross margin, as well as optimising our portfolio through disposals. End-to-end productivity Our gross margin recovered this year, following a period of high inflation. Ongoing Net Revenue Management and a focus on our end-to-end productivity programme continue to support margin progression. We have delivered savings across a number of areas, including competitive buying and operational efficiencies in our factories and logistics warehouses. To support the transformation of our end-to-end customer experience, we have implemented new tools and automated systems such as a promotion planning tool. Optimising our portfolio This year, we made significant progress in the ongoing optimisation of our portfolio. In February, we made a major divestment following the sale of Suave (which included a Skin Cleansing and Deodorant portfolio) and in October we announced the sale of Dollar Shave Club to Nexus Capital Management LP. We also received a binding offer from Yellow Wood Partners LLC to acquire Elida Beauty, with completion expected by mid-2024. We have further simplified our portfolio by delisting a number of brands, as well as reducing active SKUs by around 29% in 2023. Innovation-focused sustainability Sustainability is an important part of our strategy and includes a focus on palm oil, plastic and climate. Building on Unilever’s goal to deliver a deforestation-free supply chain for five key commodities, including palm oil (see page 40), we are exploring new technology which has the potential to reduce the amount of palm-derived ingredients in our soap bars as well as lowering GHG emissions – without compromising superiority for consumers. Plastic remains an important priority and we continue to focus on reducing the amount of virgin plastic in our portfolio focused on packaging innovations. See page 41 and 40 for more on climate and plastic. Some of our biggest brands are leveraging their long-term commitment to social issues to drive impact, as a core part of their brand propositions. Dove, Lifebuoy and Pepsodent continued to engage consumers on self-esteem, handwashing and oral hygiene issues this year, through powerful TV advertising, digital activations and on-ground education programmes. Dove's Emmy Awards-nominated ‘Cost of Beauty’ campaign highlighted the mental health impacts of toxic beauty among young people. See page 66 for the combined reach of our brand purpose programmes. STRATEGIC REPORT CORPORATE GOVERNANCE FINANCIAL STATEMENTS Review of the Year Unilever Annual Report on Form 20-F 2023 21 Rexona, Dove, Lux and Lifebuoy worked with customers to create category growth opportunities, as part of our sponsorship of the FIFA Women’s World Cup 2023TM.

Review of the Year Home Care 22 Unilever Annual Report on Form 20-F 2023 We are on a mission to deliver a Clean Future through superior, sustainable and great value household cleaning and laundry products. Our global brands provide the foundation to deliver this ambition.
Unilever Annual Report on Form 20-F 2023 23 Performance highlights Turnover in 2023 €12.2bn 2022: €12.4bn 2021: €10.6bn Turnover growth Underlying sales growth Operating margin Underlying operating margin Pages 11 to 32 use GAAP and non-GAAP measures to explain the performance of our business. See page 59 to 64 for further information.
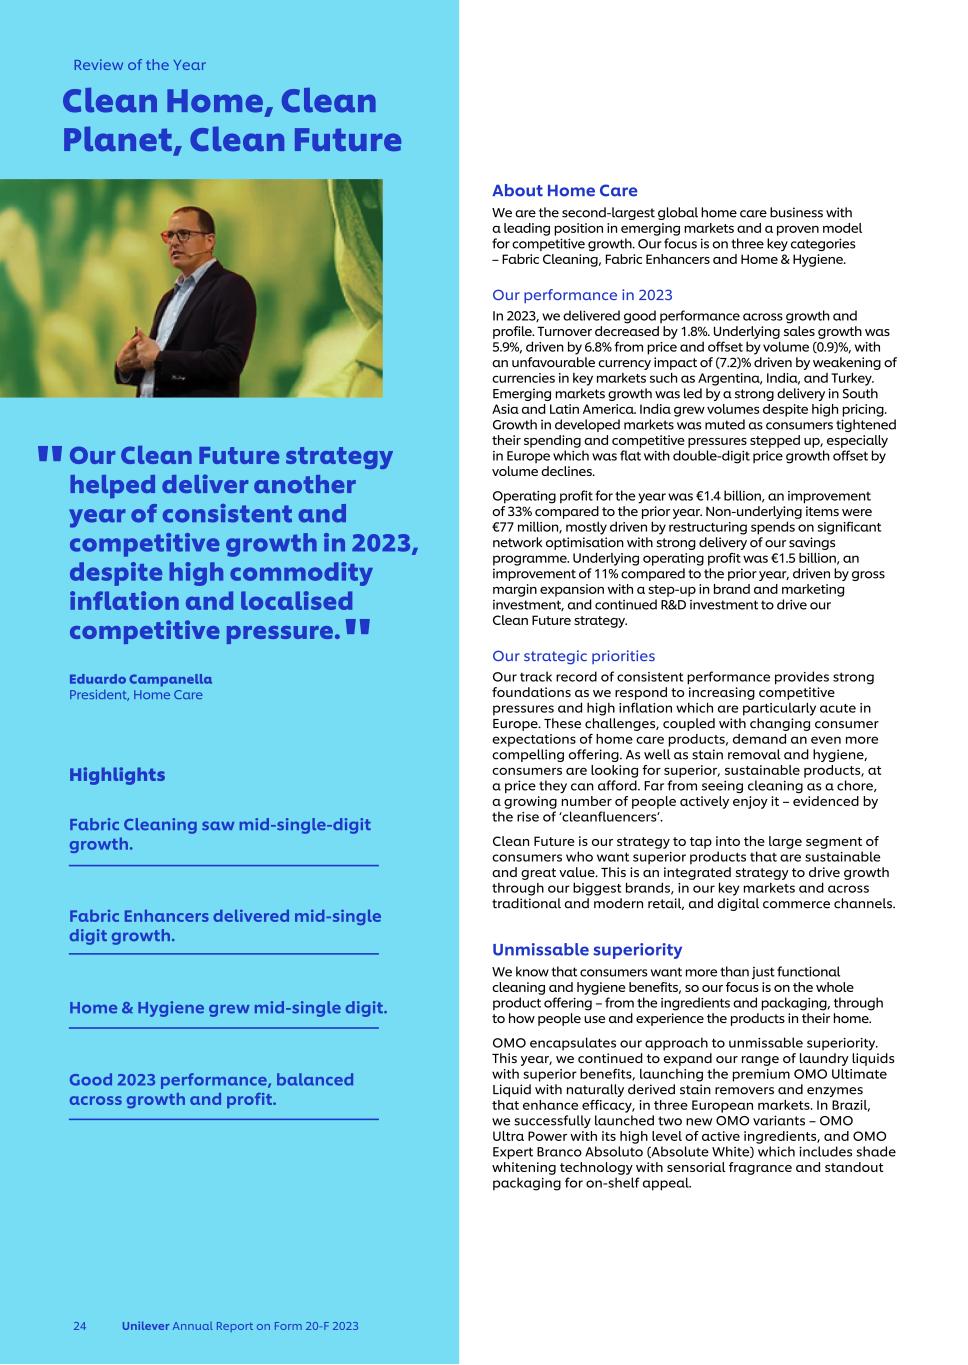
Our Clean Future strategy helped deliver another year of consistent and competitive growth in 2023, despite high commodity inflation and localised competitive pressure. Eduardo Campanella President, Home Care Highlights Fabric Cleaning saw mid-single-digit growth. Fabric Enhancers delivered mid-single digit growth. Home & Hygiene grew mid-single digit. Good 2023 performance, balanced across growth and profit. About Home Care We are the second-largest global home care business with a leading position in emerging markets and a proven model for competitive growth. Our focus is on three key categories – Fabric Cleaning, Fabric Enhancers and Home & Hygiene. Our performance in 2023 In 2023, we delivered good performance across growth and profile. Turnover decreased by 1.8%. Underlying sales growth was 5.9%, driven by 6.8% from price and offset by volume (0.9)%, with an unfavourable currency impact of (7.2)% driven by weakening of currencies in key markets such as Argentina, India, and Turkey. Emerging markets growth was led by a strong delivery in South Asia and Latin America. India grew volumes despite high pricing. Growth in developed markets was muted as consumers tightened their spending and competitive pressures stepped up, especially in Europe which was flat with double-digit price growth offset by volume declines. Operating profit for the year was €1.4 billion, an improvement of 33% compared to the prior year. Non-underlying items were €77 million, mostly driven by restructuring spends on significant network optimisation with strong delivery of our savings programme. Underlying operating profit was €1.5 billion, an improvement of 11% compared to the prior year, driven by gross margin expansion with a step-up in brand and marketing investment, and continued R&D investment to drive our Clean Future strategy. Our strategic priorities Our track record of consistent performance provides strong foundations as we respond to increasing competitive pressures and high inflation which are particularly acute in Europe. These challenges, coupled with changing consumer expectations of home care products, demand an even more compelling offering. As well as stain removal and hygiene, consumers are looking for superior, sustainable products, at a price they can afford. Far from seeing cleaning as a chore, a growing number of people actively enjoy it – evidenced by the rise of ‘cleanfluencers’. Clean Future is our strategy to tap into the large segment of consumers who want superior products that are sustainable and great value. This is an integrated strategy to drive growth through our biggest brands, in our key markets and across traditional and modern retail, and digital commerce channels. Unmissable superiority We know that consumers want more than just functional cleaning and hygiene benefits, so our focus is on the whole product offering – from the ingredients and packaging, through to how people use and experience the products in their home. OMO encapsulates our approach to unmissable superiority. This year, we continued to expand our range of laundry liquids with superior benefits, launching the premium OMO Ultimate Liquid with naturally derived stain removers and enzymes that enhance efficacy, in three European markets. In Brazil, we successfully launched two new OMO variants – OMO Ultra Power with its high level of active ingredients, and OMO Expert Branco Absoluto (Absolute White) which includes shade whitening technology with sensorial fragrance and standout packaging for on-shelf appeal. Review of the Year 24 Unilever Annual Report on Form 20-F 2023 Clean Home, Clean Planet, Clean Future " "
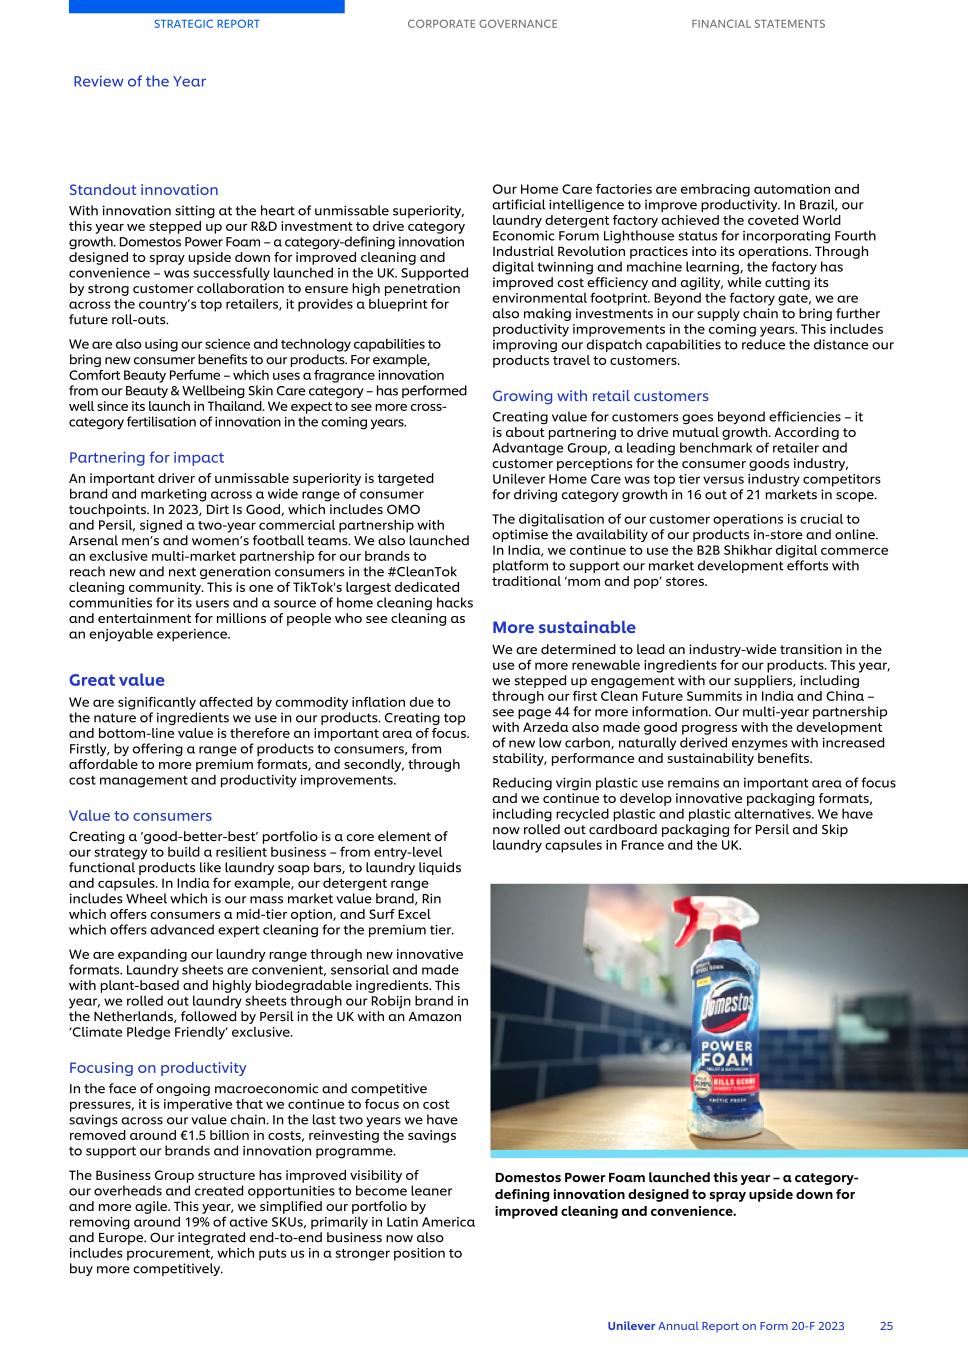
Standout innovation With innovation sitting at the heart of unmissable superiority, this year we stepped up our R&D investment to drive category growth. Domestos Power Foam – a category-defining innovation designed to spray upside down for improved cleaning and convenience – was successfully launched in the UK. Supported by strong customer collaboration to ensure high penetration across the country’s top retailers, it provides a blueprint for future roll-outs. We are also using our science and technology capabilities to bring new consumer benefits to our products. For example, Comfort Beauty Perfume – which uses a fragrance innovation from our Beauty & Wellbeing Skin Care category – has performed well since its launch in Thailand. We expect to see more cross- category fertilisation of innovation in the coming years. Partnering for impact An important driver of unmissable superiority is targeted brand and marketing across a wide range of consumer touchpoints. In 2023, Dirt Is Good, which includes OMO and Persil, signed a two-year commercial partnership with Arsenal men’s and women’s football teams. We also launched an exclusive multi-market partnership for our brands to reach new and next generation consumers in the #CleanTok cleaning community. This is one of TikTok's largest dedicated communities for its users and a source of home cleaning hacks and entertainment for millions of people who see cleaning as an enjoyable experience. Great value We are significantly affected by commodity inflation due to the nature of ingredients we use in our products. Creating top and bottom-line value is therefore an important area of focus. Firstly, by offering a range of products to consumers, from affordable to more premium formats, and secondly, through cost management and productivity improvements. Value to consumers Creating a ‘good-better-best’ portfolio is a core element of our strategy to build a resilient business – from entry-level functional products like laundry soap bars, to laundry liquids and capsules. In India for example, our detergent range includes Wheel which is our mass market value brand, Rin which offers consumers a mid-tier option, and Surf Excel which offers advanced expert cleaning for the premium tier. We are expanding our laundry range through new innovative formats. Laundry sheets are convenient, sensorial and made with plant-based and highly biodegradable ingredients. This year, we rolled out laundry sheets through our Robijn brand in the Netherlands, followed by Persil in the UK with an Amazon ‘Climate Pledge Friendly’ exclusive. Focusing on productivity In the face of ongoing macroeconomic and competitive pressures, it is imperative that we continue to focus on cost savings across our value chain. In the last two years we have removed around €1.5 billion in costs, reinvesting the savings to support our brands and innovation programme. The Business Group structure has improved visibility of our overheads and created opportunities to become leaner and more agile. This year, we simplified our portfolio by removing around 19% of active SKUs, primarily in Latin America and Europe. Our integrated end-to-end business now also includes procurement, which puts us in a stronger position to buy more competitively. Our Home Care factories are embracing automation and artificial intelligence to improve productivity. In Brazil, our laundry detergent factory achieved the coveted World Economic Forum Lighthouse status for incorporating Fourth Industrial Revolution practices into its operations. Through digital twinning and machine learning, the factory has improved cost efficiency and agility, while cutting its environmental footprint. Beyond the factory gate, we are also making investments in our supply chain to bring further productivity improvements in the coming years. This includes improving our dispatch capabilities to reduce the distance our products travel to customers. Growing with retail customers Creating value for customers goes beyond efficiencies – it is about partnering to drive mutual growth. According to Advantage Group, a leading benchmark of retailer and customer perceptions for the consumer goods industry, Unilever Home Care was top tier versus industry competitors for driving category growth in 16 out of 21 markets in scope. The digitalisation of our customer operations is crucial to optimise the availability of our products in-store and online. In India, we continue to use the B2B Shikhar digital commerce platform to support our market development efforts with traditional ‘mom and pop’ stores. More sustainable We are determined to lead an industry-wide transition in the use of more renewable ingredients for our products. This year, we stepped up engagement with our suppliers, including through our first Clean Future Summits in India and China – see page 44 for more information. Our multi-year partnership with Arzeda also made good progress with the development of new low carbon, naturally derived enzymes with increased stability, performance and sustainability benefits. Reducing virgin plastic use remains an important area of focus and we continue to develop innovative packaging formats, including recycled plastic and plastic alternatives. We have now rolled out cardboard packaging for Persil and Skip laundry capsules in France and the UK. STRATEGIC REPORT CORPORATE GOVERNANCE FINANCIAL STATEMENTS Review of the Year Unilever Annual Report on Form 20-F 2023 25 Domestos Power Foam launched this year – a category- defining innovation designed to spray upside down for improved cleaning and convenience.

Review of the Year Nutrition 26 Unilever Annual Report on Form 20-F 2023 We are experts in food and nutrition. Our ambition is to deliver superior tasting products that are healthier for people and planet, through our global and local brands, and Unilever Food Solutions.
Unilever Annual Report on Form 20-F 2023 27 Performance highlights Turnover in 2023 €13.2bn 2022: €13.9bn 2021: €13.1bn Turnover growth Underlying sales growth Operating margin Underlying operating margin Pages 11 to 32 use GAAP and non-GAAP measures to explain the performance of our business. See page 59 to 64 for further information.
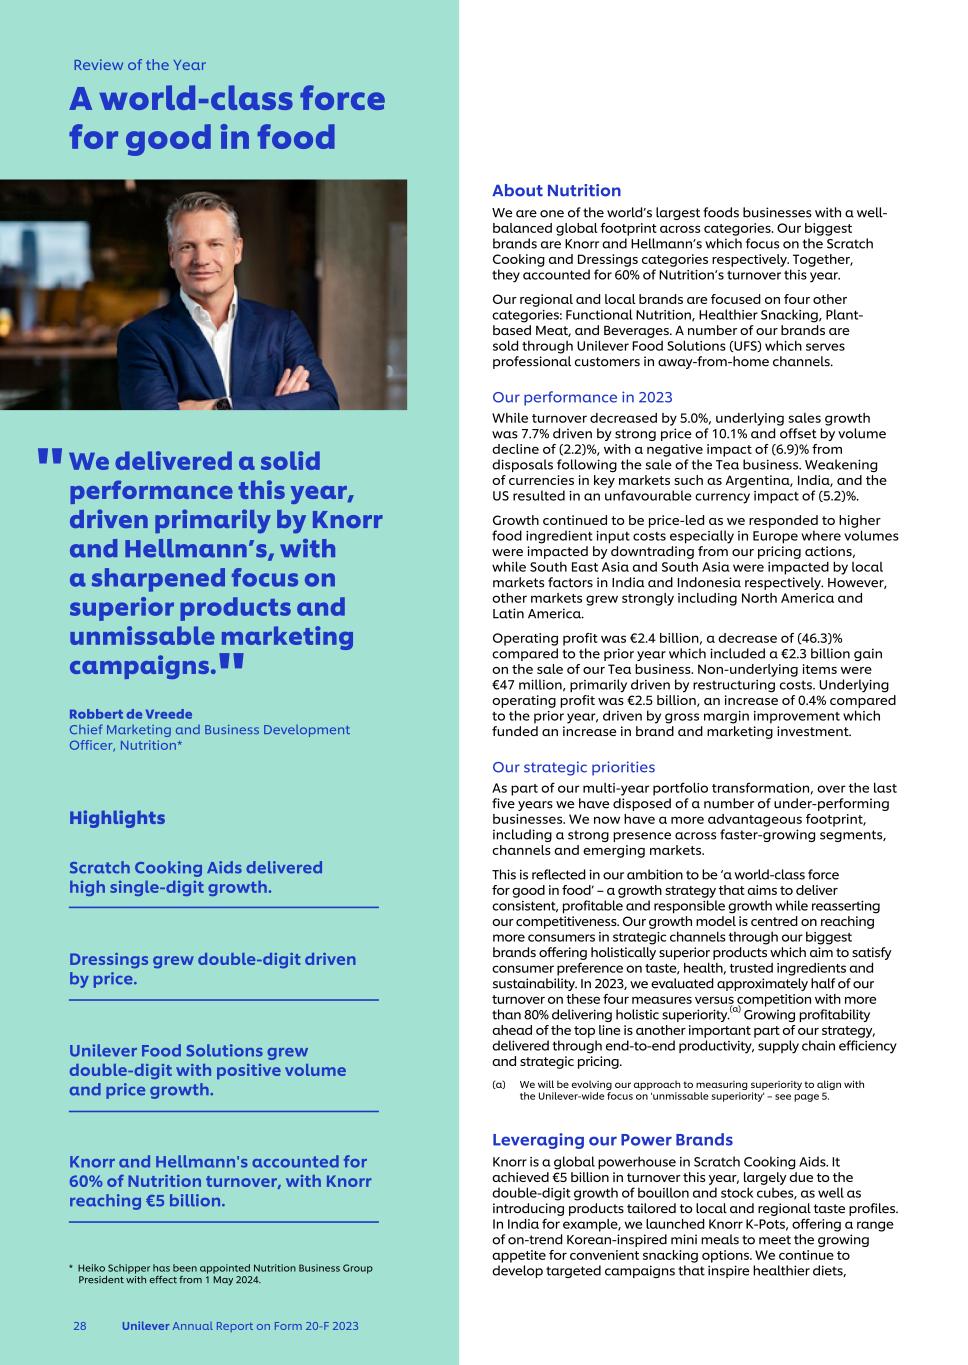
We delivered a solid performance this year, driven primarily by Knorr and Hellmann’s, with a sharpened focus on superior products and unmissable marketing campaigns. Robbert de Vreede Chief Marketing and Business Development Officer, Nutrition* Highlights Scratch Cooking Aids delivered high single-digit growth. Dressings grew double-digit driven by price. Unilever Food Solutions grew double-digit with positive volume and price growth. Knorr and Hellmann's accounted for 60% of Nutrition turnover, with Knorr reaching €5 billion. * Heiko Schipper has been appointed Nutrition Business Group President with effect from 1 May 2024. About Nutrition We are one of the world’s largest foods businesses with a well- balanced global footprint across categories. Our biggest brands are Knorr and Hellmann’s which focus on the Scratch Cooking and Dressings categories respectively. Together, they accounted for 60% of Nutrition’s turnover this year. Our regional and local brands are focused on four other categories: Functional Nutrition, Healthier Snacking, Plant- based Meat, and Beverages. A number of our brands are sold through Unilever Food Solutions (UFS) which serves professional customers in away-from-home channels. Our performance in 2023 While turnover decreased by 5.0%, underlying sales growth was 7.7% driven by strong price of 10.1% and offset by volume decline of (2.2)%, with a negative impact of (6.9)% from disposals following the sale of the Tea business. Weakening of currencies in key markets such as Argentina, India, and the US resulted in an unfavourable currency impact of (5.2)%. Growth continued to be price-led as we responded to higher food ingredient input costs especially in Europe where volumes were impacted by downtrading from our pricing actions, while South East Asia and South Asia were impacted by local markets factors in India and Indonesia respectively. However, other markets grew strongly including North America and Latin America. Operating profit was €2.4 billion, a decrease of (46.3)% compared to the prior year which included a €2.3 billion gain on the sale of our Tea business. Non-underlying items were €47 million, primarily driven by restructuring costs. Underlying operating profit was €2.5 billion, an increase of 0.4% compared to the prior year, driven by gross margin improvement which funded an increase in brand and marketing investment. Our strategic priorities As part of our multi-year portfolio transformation, over the last five years we have disposed of a number of under-performing businesses. We now have a more advantageous footprint, including a strong presence across faster-growing segments, channels and emerging markets. This is reflected in our ambition to be ‘a world-class force for good in food’ – a growth strategy that aims to deliver consistent, profitable and responsible growth while reasserting our competitiveness. Our growth model is centred on reaching more consumers in strategic channels through our biggest brands offering holistically superior products which aim to satisfy consumer preference on taste, health, trusted ingredients and sustainability. In 2023, we evaluated approximately half of our turnover on these four measures versus competition with more than 80% delivering holistic superiority.(a) Growing profitability ahead of the top line is another important part of our strategy, delivered through end-to-end productivity, supply chain efficiency and strategic pricing. (a) We will be evolving our approach to measuring superiority to align with the Unilever-wide focus on 'unmissable superiority' – see page 5. Leveraging our Power Brands Knorr is a global powerhouse in Scratch Cooking Aids. It achieved €5 billion in turnover this year, largely due to the double-digit growth of bouillon and stock cubes, as well as introducing products tailored to local and regional taste profiles. In India for example, we launched Knorr K-Pots, offering a range of on-trend Korean-inspired mini meals to meet the growing appetite for convenient snacking options. We continue to develop targeted campaigns that inspire healthier diets, Review of the Year 28 Unilever Annual Report on Form 20-F 2023 A world-class force for good in food " "
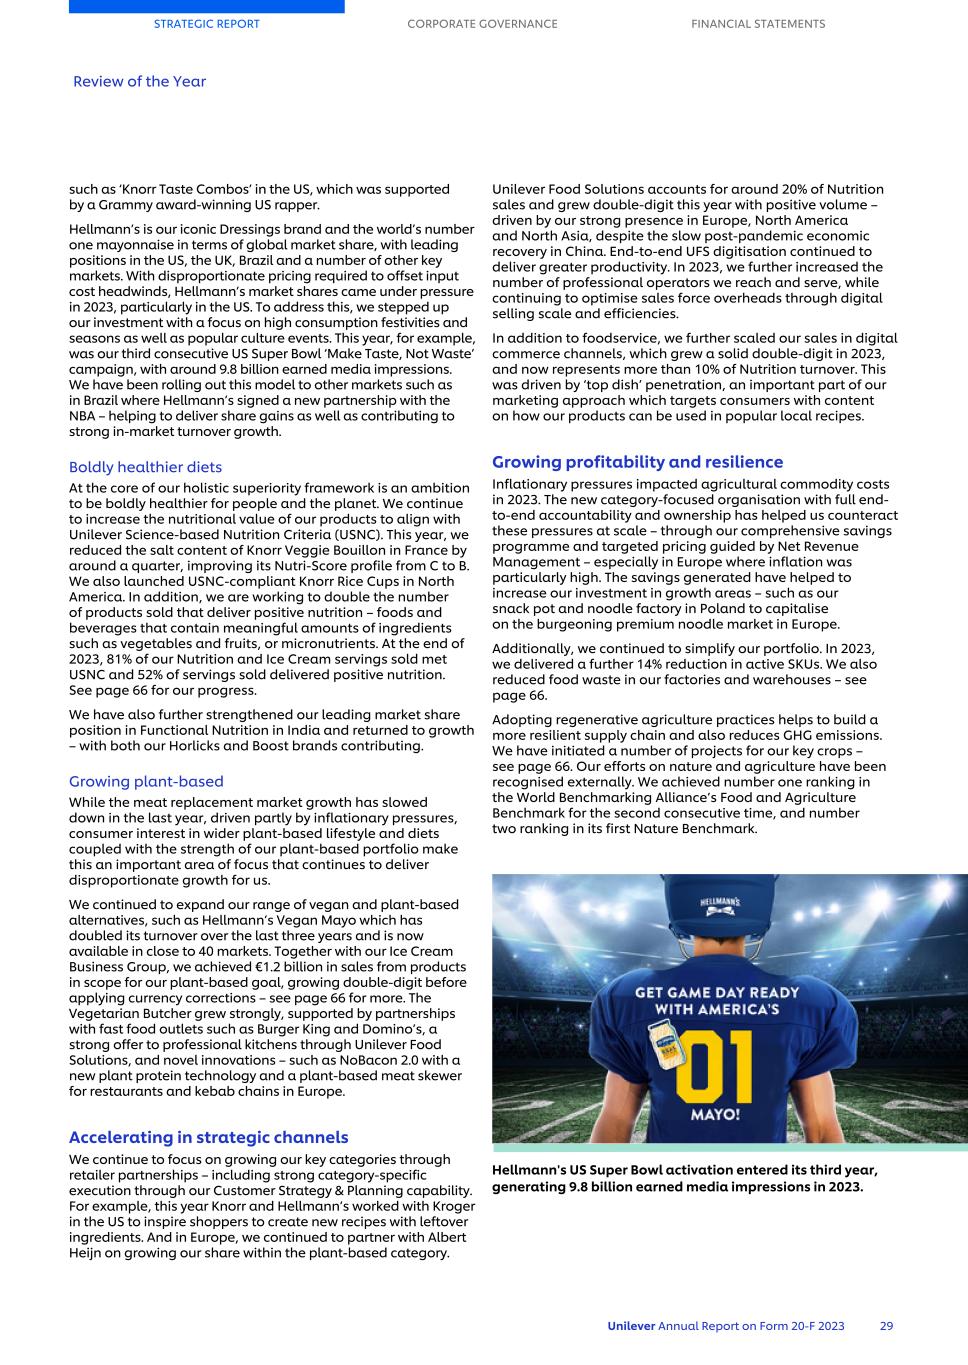
such as ‘Knorr Taste Combos’ in the US, which was supported by a Grammy award-winning US rapper. Hellmann’s is our iconic Dressings brand and the world’s number one mayonnaise in terms of global market share, with leading positions in the US, the UK, Brazil and a number of other key markets. With disproportionate pricing required to offset input cost headwinds, Hellmann’s market shares came under pressure in 2023, particularly in the US. To address this, we stepped up our investment with a focus on high consumption festivities and seasons as well as popular culture events. This year, for example, was our third consecutive US Super Bowl ‘Make Taste, Not Waste’ campaign, with around 9.8 billion earned media impressions. We have been rolling out this model to other markets such as in Brazil where Hellmann’s signed a new partnership with the NBA – helping to deliver share gains as well as contributing to strong in-market turnover growth. Boldly healthier diets At the core of our holistic superiority framework is an ambition to be boldly healthier for people and the planet. We continue to increase the nutritional value of our products to align with Unilever Science-based Nutrition Criteria (USNC). This year, we reduced the salt content of Knorr Veggie Bouillon in France by around a quarter, improving its Nutri-Score profile from C to B. We also launched USNC-compliant Knorr Rice Cups in North America. In addition, we are working to double the number of products sold that deliver positive nutrition – foods and beverages that contain meaningful amounts of ingredients such as vegetables and fruits, or micronutrients. At the end of 2023, 81% of our Nutrition and Ice Cream servings sold met USNC and 52% of servings sold delivered positive nutrition. See page 66 for our progress. We have also further strengthened our leading market share position in Functional Nutrition in India and returned to growth – with both our Horlicks and Boost brands contributing. Growing plant-based While the meat replacement market growth has slowed down in the last year, driven partly by inflationary pressures, consumer interest in wider plant-based lifestyle and diets coupled with the strength of our plant-based portfolio make this an important area of focus that continues to deliver disproportionate growth for us. We continued to expand our range of vegan and plant-based alternatives, such as Hellmann’s Vegan Mayo which has doubled its turnover over the last three years and is now available in close to 40 markets. Together with our Ice Cream Business Group, we achieved €1.2 billion in sales from products in scope for our plant-based goal, growing double-digit before applying currency corrections – see page 66 for more. The Vegetarian Butcher grew strongly, supported by partnerships with fast food outlets such as Burger King and Domino’s, a strong offer to professional kitchens through Unilever Food Solutions, and novel innovations – such as NoBacon 2.0 with a new plant protein technology and a plant-based meat skewer for restaurants and kebab chains in Europe. Accelerating in strategic channels We continue to focus on growing our key categories through retailer partnerships – including strong category-specific execution through our Customer Strategy & Planning capability. For example, this year Knorr and Hellmann’s worked with Kroger in the US to inspire shoppers to create new recipes with leftover ingredients. And in Europe, we continued to partner with Albert Heijn on growing our share within the plant-based category. Unilever Food Solutions accounts for around 20% of Nutrition sales and grew double-digit this year with positive volume – driven by our strong presence in Europe, North America and North Asia, despite the slow post-pandemic economic recovery in China. End-to-end UFS digitisation continued to deliver greater productivity. In 2023, we further increased the number of professional operators we reach and serve, while continuing to optimise sales force overheads through digital selling scale and efficiencies. In addition to foodservice, we further scaled our sales in digital commerce channels, which grew a solid double-digit in 2023, and now represents more than 10% of Nutrition turnover. This was driven by ‘top dish’ penetration, an important part of our marketing approach which targets consumers with content on how our products can be used in popular local recipes. Growing profitability and resilience Inflationary pressures impacted agricultural commodity costs in 2023. The new category-focused organisation with full end- to-end accountability and ownership has helped us counteract these pressures at scale – through our comprehensive savings programme and targeted pricing guided by Net Revenue Management – especially in Europe where inflation was particularly high. The savings generated have helped to increase our investment in growth areas – such as our snack pot and noodle factory in Poland to capitalise on the burgeoning premium noodle market in Europe. Additionally, we continued to simplify our portfolio. In 2023, we delivered a further 14% reduction in active SKUs. We also reduced food waste in our factories and warehouses – see page 66. Adopting regenerative agriculture practices helps to build a more resilient supply chain and also reduces GHG emissions. We have initiated a number of projects for our key crops – see page 66. Our efforts on nature and agriculture have been recognised externally. We achieved number one ranking in the World Benchmarking Alliance’s Food and Agriculture Benchmark for the second consecutive time, and number two ranking in its first Nature Benchmark. STRATEGIC REPORT CORPORATE GOVERNANCE FINANCIAL STATEMENTS Review of the Year Unilever Annual Report on Form 20-F 2023 29 Hellmann's US Super Bowl activation entered its third year, generating 9.8 billion earned media impressions in 2023.

Review of the Year Ice Cream 30 Unilever Annual Report on Form 20-F 2023 We have strong fundamentals, with innovations that have led the industry for many years. Our portfolio is designed for in-home and out-of-home consumption and includes premium indulgence and iconic mainstream brands.
Unilever Annual Report on Form 20-F 2023 31 Performance highlights Turnover in 2023 €7.9bn 2022: €7.9bn 2021: €6.9bn Turnover growth Underlying sales growth Operating margin Underlying operating margin Pages 11 to 32 use GAAP and non-GAAP measures to explain the performance of our business. See page 59 to 64 for further information.
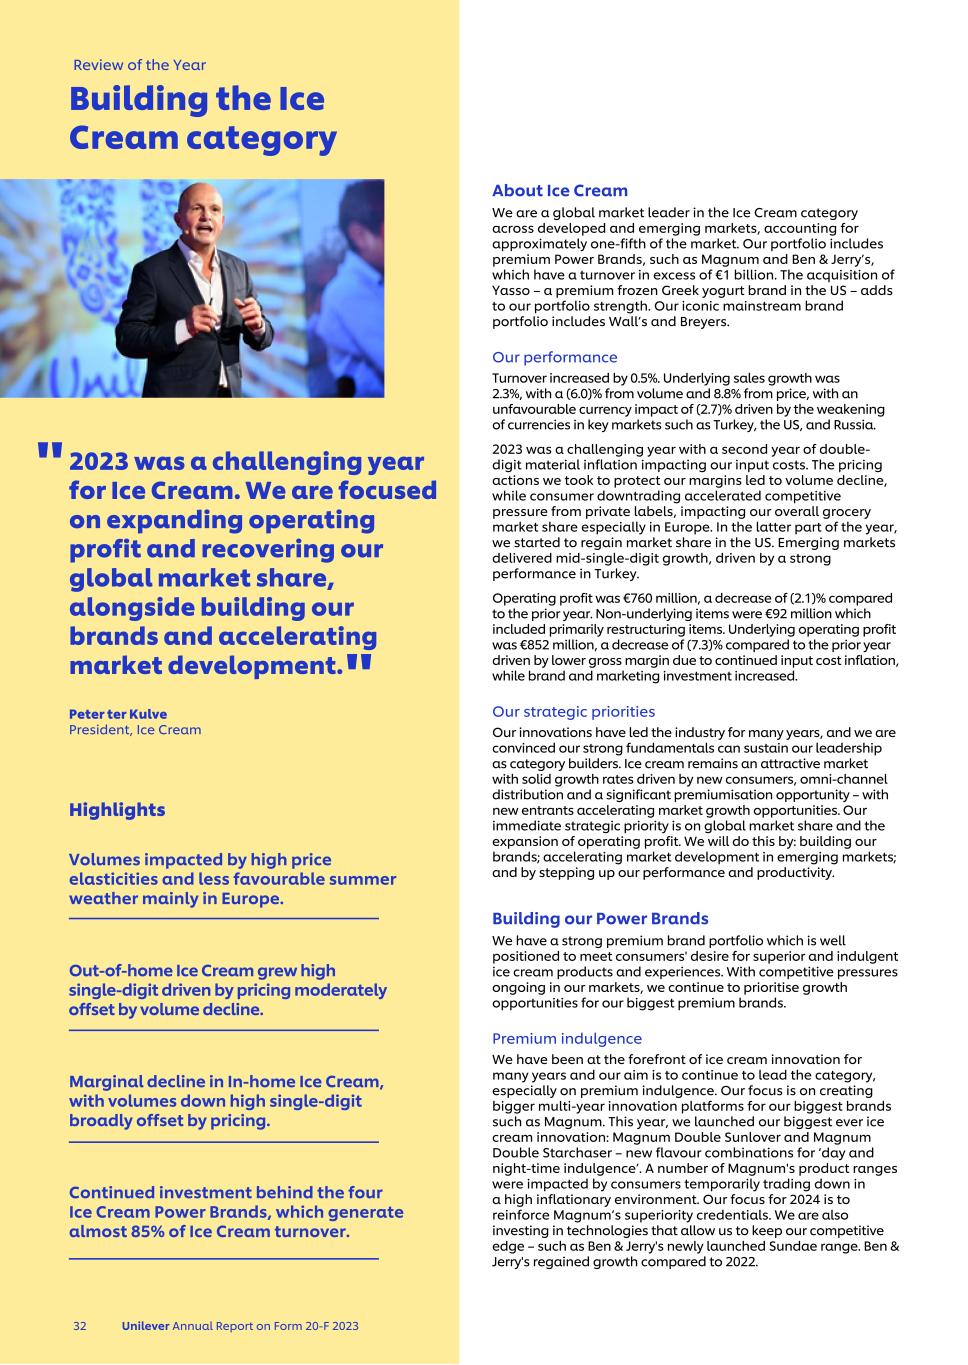
2023 was a challenging year for Ice Cream. We are focused on expanding operating profit and recovering our global market share, alongside building our brands and accelerating market development. Peter ter Kulve President, Ice Cream Highlights Volumes impacted by high price elasticities and less favourable summer weather mainly in Europe. Out-of-home Ice Cream grew high single-digit driven by pricing moderately offset by volume decline. Marginal decline in In-home Ice Cream, with volumes down high single-digit broadly offset by pricing. Continued investment behind the four Ice Cream Power Brands, which generate almost 85% of Ice Cream turnover. About Ice Cream We are a global market leader in the Ice Cream category across developed and emerging markets, accounting for approximately one-fifth of the market. Our portfolio includes premium Power Brands, such as Magnum and Ben & Jerry’s, which have a turnover in excess of €1 billion. The acquisition of Yasso – a premium frozen Greek yogurt brand in the US – adds to our portfolio strength. Our iconic mainstream brand portfolio includes Wall’s and Breyers. Our performance Turnover increased by 0.5%. Underlying sales growth was 2.3%, with a (6.0)% from volume and 8.8% from price, with an unfavourable currency impact of (2.7)% driven by the weakening of currencies in key markets such as Turkey, the US, and Russia. 2023 was a challenging year with a second year of double- digit material inflation impacting our input costs. The pricing actions we took to protect our margins led to volume decline, while consumer downtrading accelerated competitive pressure from private labels, impacting our overall grocery market share especially in Europe. In the latter part of the year, we started to regain market share in the US. Emerging markets delivered mid-single-digit growth, driven by a strong performance in Turkey. Operating profit was €760 million, a decrease of (2.1)% compared to the prior year. Non-underlying items were €92 million which included primarily restructuring items. Underlying operating profit was €852 million, a decrease of (7.3)% compared to the prior year driven by lower gross margin due to continued input cost inflation, while brand and marketing investment increased. Our strategic priorities Our innovations have led the industry for many years, and we are convinced our strong fundamentals can sustain our leadership as category builders. Ice cream remains an attractive market with solid growth rates driven by new consumers, omni-channel distribution and a significant premiumisation opportunity – with new entrants accelerating market growth opportunities. Our immediate strategic priority is on global market share and the expansion of operating profit. We will do this by: building our brands; accelerating market development in emerging markets; and by stepping up our performance and productivity. Building our Power Brands We have a strong premium brand portfolio which is well positioned to meet consumers' desire for superior and indulgent ice cream products and experiences. With competitive pressures ongoing in our markets, we continue to prioritise growth opportunities for our biggest premium brands. Premium indulgence We have been at the forefront of ice cream innovation for many years and our aim is to continue to lead the category, especially on premium indulgence. Our focus is on creating bigger multi-year innovation platforms for our biggest brands such as Magnum. This year, we launched our biggest ever ice cream innovation: Magnum Double Sunlover and Magnum Double Starchaser – new flavour combinations for ‘day and night-time indulgence’. A number of Magnum's product ranges were impacted by consumers temporarily trading down in a high inflationary environment. Our focus for 2024 is to reinforce Magnum’s superiority credentials. We are also investing in technologies that allow us to keep our competitive edge – such as Ben & Jerry's newly launched Sundae range. Ben & Jerry's regained growth compared to 2022. Review of the Year 32 Unilever Annual Report on Form 20-F 2023 Building the Ice Cream category " "
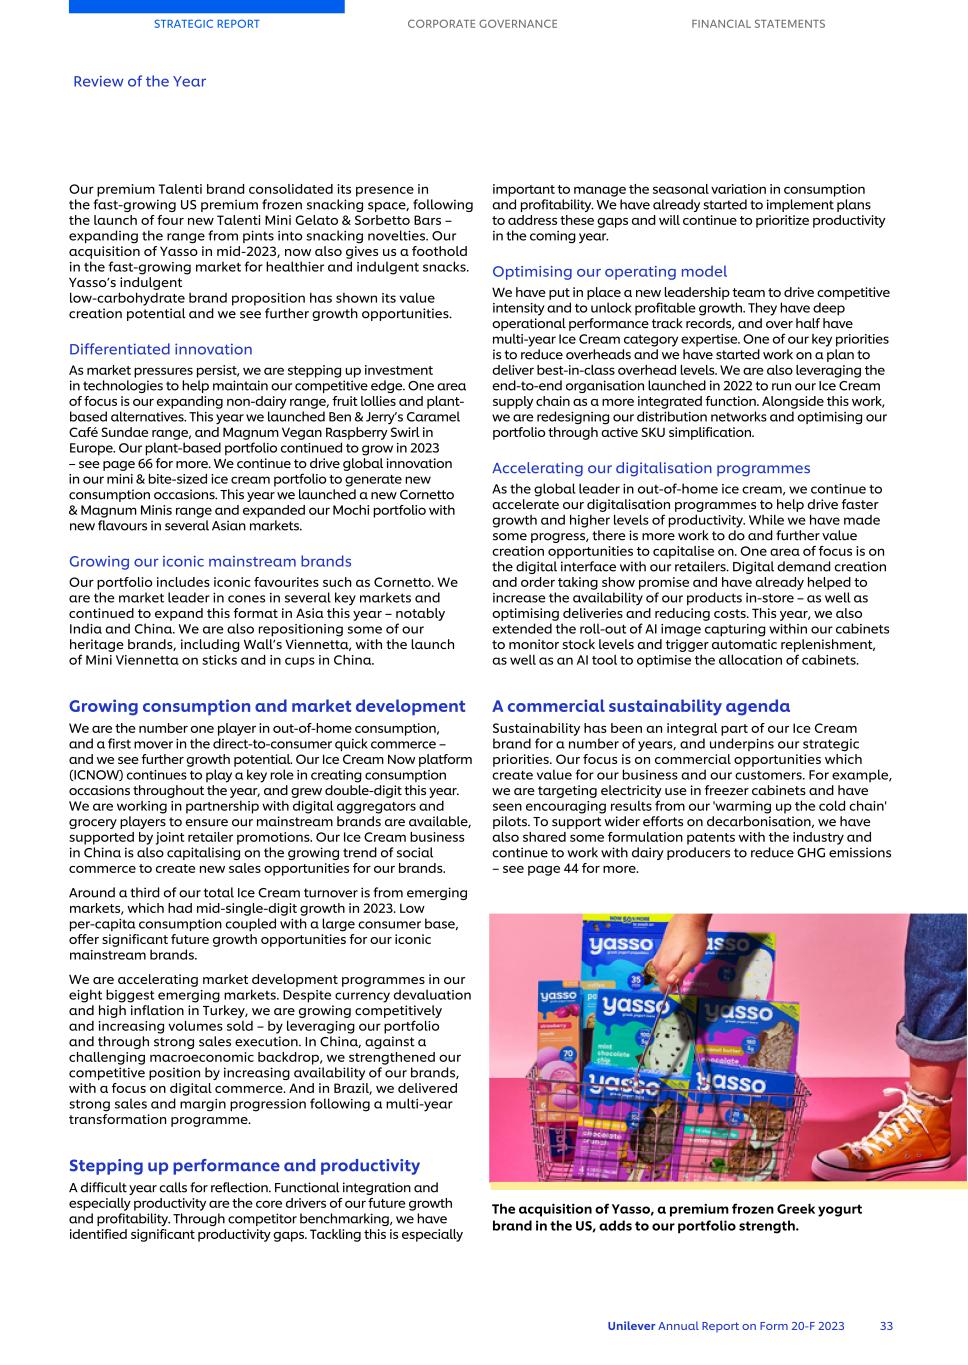
Our premium Talenti brand consolidated its presence in the fast-growing US premium frozen snacking space, following the launch of four new Talenti Mini Gelato & Sorbetto Bars – expanding the range from pints into snacking novelties. Our acquisition of Yasso in mid-2023, now also gives us a foothold in the fast-growing market for healthier and indulgent snacks. Yasso’s indulgent low-carbohydrate brand proposition has shown its value creation potential and we see further growth opportunities. Differentiated innovation As market pressures persist, we are stepping up investment in technologies to help maintain our competitive edge. One area of focus is our expanding non-dairy range, fruit lollies and plant- based alternatives. This year we launched Ben & Jerry’s Caramel Café Sundae range, and Magnum Vegan Raspberry Swirl in Europe. Our plant-based portfolio continued to grow in 2023 – see page 66 for more. We continue to drive global innovation in our mini & bite-sized ice cream portfolio to generate new consumption occasions. This year we launched a new Cornetto & Magnum Minis range and expanded our Mochi portfolio with new flavours in several Asian markets. Growing our iconic mainstream brands Our portfolio includes iconic favourites such as Cornetto. We are the market leader in cones in several key markets and continued to expand this format in Asia this year – notably India and China. We are also repositioning some of our heritage brands, including Wall’s Viennetta, with the launch of Mini Viennetta on sticks and in cups in China. Growing consumption and market development We are the number one player in out-of-home consumption, and a first mover in the direct-to-consumer quick commerce – and we see further growth potential. Our Ice Cream Now platform (ICNOW) continues to play a key role in creating consumption occasions throughout the year, and grew double-digit this year. We are working in partnership with digital aggregators and grocery players to ensure our mainstream brands are available, supported by joint retailer promotions. Our Ice Cream business in China is also capitalising on the growing trend of social commerce to create new sales opportunities for our brands. Around a third of our total Ice Cream turnover is from emerging markets, which had mid-single-digit growth in 2023. Low per-capita consumption coupled with a large consumer base, offer significant future growth opportunities for our iconic mainstream brands. We are accelerating market development programmes in our eight biggest emerging markets. Despite currency devaluation and high inflation in Turkey, we are growing competitively and increasing volumes sold – by leveraging our portfolio and through strong sales execution. In China, against a challenging macroeconomic backdrop, we strengthened our competitive position by increasing availability of our brands, with a focus on digital commerce. And in Brazil, we delivered strong sales and margin progression following a multi-year transformation programme. Stepping up performance and productivity A difficult year calls for reflection. Functional integration and especially productivity are the core drivers of our future growth and profitability. Through competitor benchmarking, we have identified significant productivity gaps. Tackling this is especially important to manage the seasonal variation in consumption and profitability. We have already started to implement plans to address these gaps and will continue to prioritize productivity in the coming year. Optimising our operating model We have put in place a new leadership team to drive competitive intensity and to unlock profitable growth. They have deep operational performance track records, and over half have multi-year Ice Cream category expertise. One of our key priorities is to reduce overheads and we have started work on a plan to deliver best-in-class overhead levels. We are also leveraging the end-to-end organisation launched in 2022 to run our Ice Cream supply chain as a more integrated function. Alongside this work, we are redesigning our distribution networks and optimising our portfolio through active SKU simplification. Accelerating our digitalisation programmes As the global leader in out-of-home ice cream, we continue to accelerate our digitalisation programmes to help drive faster growth and higher levels of productivity. While we have made some progress, there is more work to do and further value creation opportunities to capitalise on. One area of focus is on the digital interface with our retailers. Digital demand creation and order taking show promise and have already helped to increase the availability of our products in-store – as well as optimising deliveries and reducing costs. This year, we also extended the roll-out of AI image capturing within our cabinets to monitor stock levels and trigger automatic replenishment, as well as an AI tool to optimise the allocation of cabinets. A commercial sustainability agenda Sustainability has been an integral part of our Ice Cream brand for a number of years, and underpins our strategic priorities. Our focus is on commercial opportunities which create value for our business and our customers. For example, we are targeting electricity use in freezer cabinets and have seen encouraging results from our 'warming up the cold chain' pilots. To support wider efforts on decarbonisation, we have also shared some formulation patents with the industry and continue to work with dairy producers to reduce GHG emissions – see page 44 for more. STRATEGIC REPORT CORPORATE GOVERNANCE FINANCIAL STATEMENTS Review of the Year Unilever Annual Report on Form 20-F 2023 33 The acquisition of Yasso, a premium frozen Greek yogurt brand in the US, adds to our portfolio strength.

Review of the Year Our People & Culture 34 Unilever Annual Report and Accounts 2023 34 Unilever Annual Report on Form 20-F 2023 Our business is powered by over 128,000 people who work in factories, offices, distribution warehouses, R&D centres and across a variety of customer-facing roles. We have a clear plan to dial up the performance edge in our culture, to deliver consistent and competitive performance.
Unilever Annual Report on Form 20-F 2023 35 Performance highlights Employee engagement % engagement rate in annual UniVoice survey Total Recordable Frequency Rate Accidents per million hours worked Gender diversity in senior management % employees in senior leadership roles one work level below ULE Gender diversity in management % employees in management roles including senior management and ULE
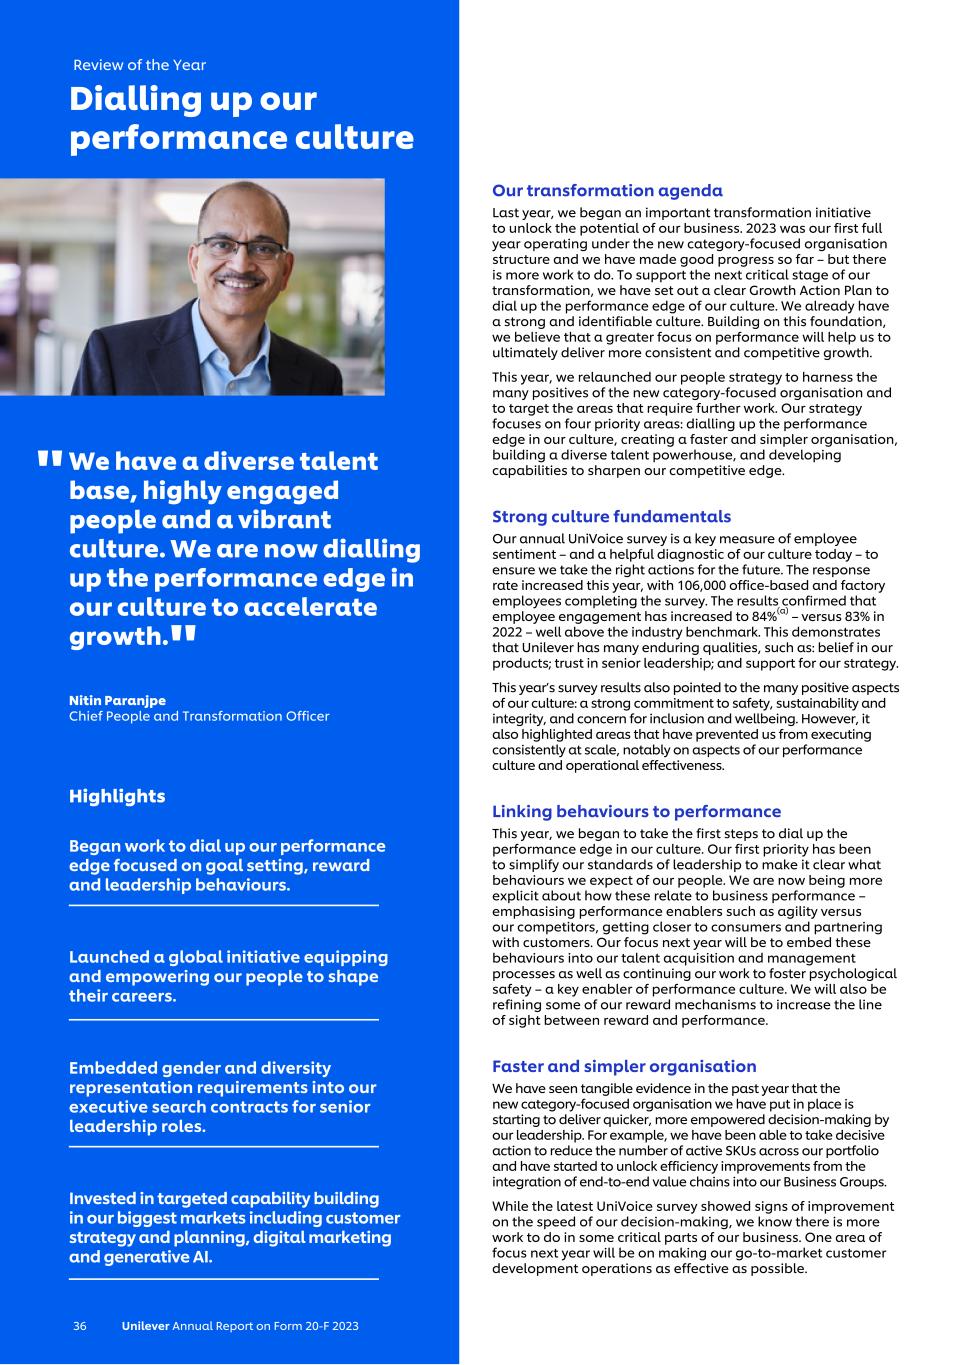
We have a diverse talent base, highly engaged people and a vibrant culture. We are now dialling up the performance edge in our culture to accelerate growth. Nitin Paranjpe Chief People and Transformation Officer Highlights Began work to dial up our performance edge focused on goal setting, reward and leadership behaviours. Launched a global initiative equipping and empowering our people to shape their careers. Embedded gender and diversity representation requirements into our executive search contracts for senior leadership roles. Invested in targeted capability building in our biggest markets including customer strategy and planning, digital marketing and generative AI. Our transformation agenda Last year, we began an important transformation initiative to unlock the potential of our business. 2023 was our first full year operating under the new category-focused organisation structure and we have made good progress so far – but there is more work to do. To support the next critical stage of our transformation, we have set out a clear Growth Action Plan to dial up the performance edge of our culture. We already have a strong and identifiable culture. Building on this foundation, we believe that a greater focus on performance will help us to ultimately deliver more consistent and competitive growth. This year, we relaunched our people strategy to harness the many positives of the new category-focused organisation and to target the areas that require further work. Our strategy focuses on four priority areas: dialling up the performance edge in our culture, creating a faster and simpler organisation, building a diverse talent powerhouse, and developing capabilities to sharpen our competitive edge. Strong culture fundamentals Our annual UniVoice survey is a key measure of employee sentiment – and a helpful diagnostic of our culture today – to ensure we take the right actions for the future. The response rate increased this year, with 106,000 office-based and factory employees completing the survey. The results confirmed that employee engagement has increased to 84%(a) – versus 83% in 2022 – well above the industry benchmark. This demonstrates that Unilever has many enduring qualities, such as: belief in our products; trust in senior leadership; and support for our strategy. This year’s survey results also pointed to the many positive aspects of our culture: a strong commitment to safety, sustainability and integrity, and concern for inclusion and wellbeing. However, it also highlighted areas that have prevented us from executing consistently at scale, notably on aspects of our performance culture and operational effectiveness. Linking behaviours to performance This year, we began to take the first steps to dial up the performance edge in our culture. Our first priority has been to simplify our standards of leadership to make it clear what behaviours we expect of our people. We are now being more explicit about how these relate to business performance – emphasising performance enablers such as agility versus our competitors, getting closer to consumers and partnering with customers. Our focus next year will be to embed these behaviours into our talent acquisition and management processes as well as continuing our work to foster psychological safety – a key enabler of performance culture. We will also be refining some of our reward mechanisms to increase the line of sight between reward and performance. Faster and simpler organisation We have seen tangible evidence in the past year that the new category-focused organisation we have put in place is starting to deliver quicker, more empowered decision-making by our leadership. For example, we have been able to take decisive action to reduce the number of active SKUs across our portfolio and have started to unlock efficiency improvements from the integration of end-to-end value chains into our Business Groups. While the latest UniVoice survey showed signs of improvement on the speed of our decision-making, we know there is more work to do in some critical parts of our business. One area of focus next year will be on making our go-to-market customer development operations as effective as possible. Review of the Year 36 Unilever Annual Report on Form 20-F 2023 Dialling up our performance culture " "
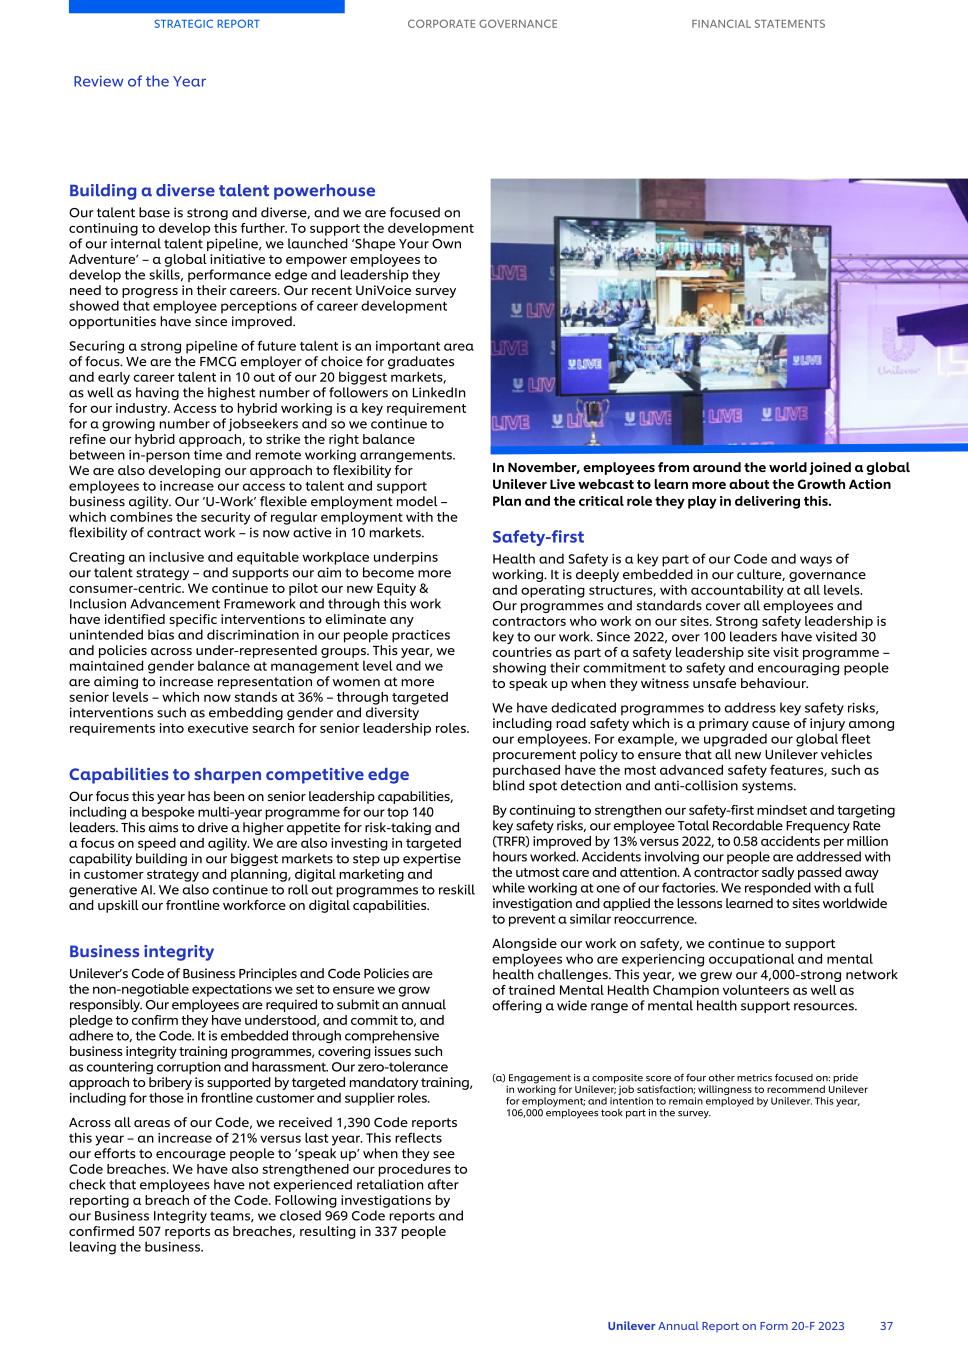
Building a diverse talent powerhouse Our talent base is strong and diverse, and we are focused on continuing to develop this further. To support the development of our internal talent pipeline, we launched ‘Shape Your Own Adventure’ – a global initiative to empower employees to develop the skills, performance edge and leadership they need to progress in their careers. Our recent UniVoice survey showed that employee perceptions of career development opportunities have since improved. Securing a strong pipeline of future talent is an important area of focus. We are the FMCG employer of choice for graduates and early career talent in 10 out of our 20 biggest markets, as well as having the highest number of followers on LinkedIn for our industry. Access to hybrid working is a key requirement for a growing number of jobseekers and so we continue to refine our hybrid approach, to strike the right balance between in-person time and remote working arrangements. We are also developing our approach to flexibility for employees to increase our access to talent and support business agility. Our ‘U-Work’ flexible employment model – which combines the security of regular employment with the flexibility of contract work – is now active in 10 markets. Creating an inclusive and equitable workplace underpins our talent strategy – and supports our aim to become more consumer-centric. We continue to pilot our new Equity & Inclusion Advancement Framework and through this work have identified specific interventions to eliminate any unintended bias and discrimination in our people practices and policies across under-represented groups. This year, we maintained gender balance at management level and we are aiming to increase representation of women at more senior levels – which now stands at 36% – through targeted interventions such as embedding gender and diversity requirements into executive search for senior leadership roles. Capabilities to sharpen competitive edge Our focus this year has been on senior leadership capabilities, including a bespoke multi-year programme for our top 140 leaders. This aims to drive a higher appetite for risk-taking and a focus on speed and agility. We are also investing in targeted capability building in our biggest markets to step up expertise in customer strategy and planning, digital marketing and generative AI. We also continue to roll out programmes to reskill and upskill our frontline workforce on digital capabilities. Business integrity Unilever’s Code of Business Principles and Code Policies are the non-negotiable expectations we set to ensure we grow responsibly. Our employees are required to submit an annual pledge to confirm they have understood, and commit to, and adhere to, the Code. It is embedded through comprehensive business integrity training programmes, covering issues such as countering corruption and harassment. Our zero-tolerance approach to bribery is supported by targeted mandatory training, including for those in frontline customer and supplier roles. Across all areas of our Code, we received 1,390 Code reports this year – an increase of 21% versus last year. This reflects our efforts to encourage people to ‘speak up’ when they see Code breaches. We have also strengthened our procedures to check that employees have not experienced retaliation after reporting a breach of the Code. Following investigations by our Business Integrity teams, we closed 969 Code reports and confirmed 507 reports as breaches, resulting in 337 people leaving the business. Safety-first Health and Safety is a key part of our Code and ways of working. It is deeply embedded in our culture, governance and operating structures, with accountability at all levels. Our programmes and standards cover all employees and contractors who work on our sites. Strong safety leadership is key to our work. Since 2022, over 100 leaders have visited 30 countries as part of a safety leadership site visit programme – showing their commitment to safety and encouraging people to speak up when they witness unsafe behaviour. We have dedicated programmes to address key safety risks, including road safety which is a primary cause of injury among our employees. For example, we upgraded our global fleet procurement policy to ensure that all new Unilever vehicles purchased have the most advanced safety features, such as blind spot detection and anti-collision systems. By continuing to strengthen our safety-first mindset and targeting key safety risks, our employee Total Recordable Frequency Rate (TRFR) improved by 13% versus 2022, to 0.58 accidents per million hours worked. Accidents involving our people are addressed with the utmost care and attention. A contractor sadly passed away while working at one of our factories. We responded with a full investigation and applied the lessons learned to sites worldwide to prevent a similar reoccurrence. Alongside our work on safety, we continue to support employees who are experiencing occupational and mental health challenges. This year, we grew our 4,000-strong network of trained Mental Health Champion volunteers as well as offering a wide range of mental health support resources. (a) Engagement is a composite score of four other metrics focused on: pride in working for Unilever; job satisfaction; willingness to recommend Unilever for employment; and intention to remain employed by Unilever. This year, 106,000 employees took part in the survey. STRATEGIC REPORT CORPORATE GOVERNANCE FINANCIAL STATEMENTS Review of the Year Unilever Annual Report on Form 20-F 2023 37 In November, employees from around the world joined a global Unilever Live webcast to learn more about the Growth Action Plan and the critical role they play in delivering this.

Review of the Year Planet & Society 38 Unilever Annual Report on Form 20-F 2023 We continue to embed sustainability into the core of our business. Our focus from 2024 will be on accelerating progress against our four key priorities: climate, nature, plastics and livelihoods.
Unilever Annual Report on Form 20-F 2023 39 Performance highlights For additional information on these metrics see page 65. (a) Deforestation-free refers to the meeting of Unilever's deforestation-free requirements. 97.5% GHG emissions reduction in our operations % change in GHG emissions from energy and refrigerant use since 2015 Virgin plastic reduction % change in total tonnes of virgin plastic used vs 2019 baseline Scope 3 GHG emissions Million tonnes CO2e in scope of our net zero ambition Deforestation-free supply chain % of palm oil, paper and board, tea, soy and cocoa order volumes which were deforestation-free by the end of 2023(a) Diverse supplier spend Total spend in €

Our approach to sustainability is evolving to accelerate progress on four key priorities: climate, nature, plastics and livelihoods. We will focus on short-term actions to deliver more impact. Rebecca Marmot Chief Sustainability Officer Highlights Achieved interim GHG emissions reduction target in our operations and continued to build supplier capability to enable future Scope 3 emissions reduction. Set up infrastructure, monitoring and verification systems to manage a deforestation-free supply chain by the end of 2023. Reduced use of virgin plastic, alongside investment in new Packaging R&D Centre. Supplier diversity programme is now active in 25 markets, broadening access to suppliers with the potential to benefit our business. Building on our sustainability commitment We have been driving an ambitious and wide-reaching sustainability agenda since 2010. During that time, we have taken decisive action to embed sustainability into the core of our business. This Annual Report provides a review of our progress this year against the goals we set in 2021. We are more certain than ever that it is the right time to focus our sustainability efforts on the four key priorities where we are best placed to drive impact: climate, nature, plastics and livelihoods. We will focus our resources on accelerating progress against these, and we intend to publish a smaller number of new or updated medium-term goals in 2024. Human rights will continue to underpin our sustainability agenda and we remain committed to issues such as Equity, Diversity & Inclusion – see page 42. Climate Our Climate Transition Action Plan (CTAP) outlines the actions we are taking to reduce GHG emissions in our business and across our value chain, to reach net zero by 2039. This Annual Report contains our third CTAP Progress Report – see pages 43 to 47. We published our updated CTAP in March 2024, in advance of an advisory shareholder vote at our Annual General Meeting in May 2024. Nature Our business depends on nature, including land, forests and water systems. We also recognise biodiversity loss as an emerging risk, so protecting these systems is important to ensure the resilience of our business and the communities where we operate. This year, we stepped up our efforts to deliver a deforestation-free supply chain and continued to make investments to protect and regenerate nature. Deforestation-free supply chain In 2020, we set a goal to achieve a deforestation-free supply chain in palm oil, paper and board, tea, soy and cocoa. By the end of 2023, we had put in place the infrastructure, monitoring and verification systems to manage a deforestation-free supply chain. For example, we have strengthened the traceability and transparency of our palm oil supply chain by using satellite imagery and geolocation data to measure deforestation. Additionally, 97.5% of our palm oil, paper and board, tea, soy and cocoa order volumes were deforestation- free by the end of 2023, based on Unilever's deforestation-free requirements. We initiated a large-scale transformation programme within our supply chain to reach this milestone, including independently verifying our suppliers through audits. Strategic investments have helped to drive change – including a €131 million ($142 million) total investment in our Unilever Oleochemicals facility to source deforestation-free palm oil and palm kernel oil directly in the coming years. We have also worked with suppliers to support the transformation in our soy supply chain, including investment in a ‘Green Refinery’ in Brazil which will increase the availability of deforestation-free soy for our business and the wider industry. Protecting and regenerating nature Our Climate & Nature Fund continues to support our work to protect and regenerate 1.5 million hectares of land, forests and oceans by 2030. By the end of 2023, the Fund had spent and committed €0.3 billion, which has helped to protect and regenerate 0.3 million hectares since 2021 – an increase of 0.1 million hectares since 2022. In partnership with the Rimba Review of the Year 40 Unilever Annual Report on Form 20-F 2023 More focus for bigger impact " "
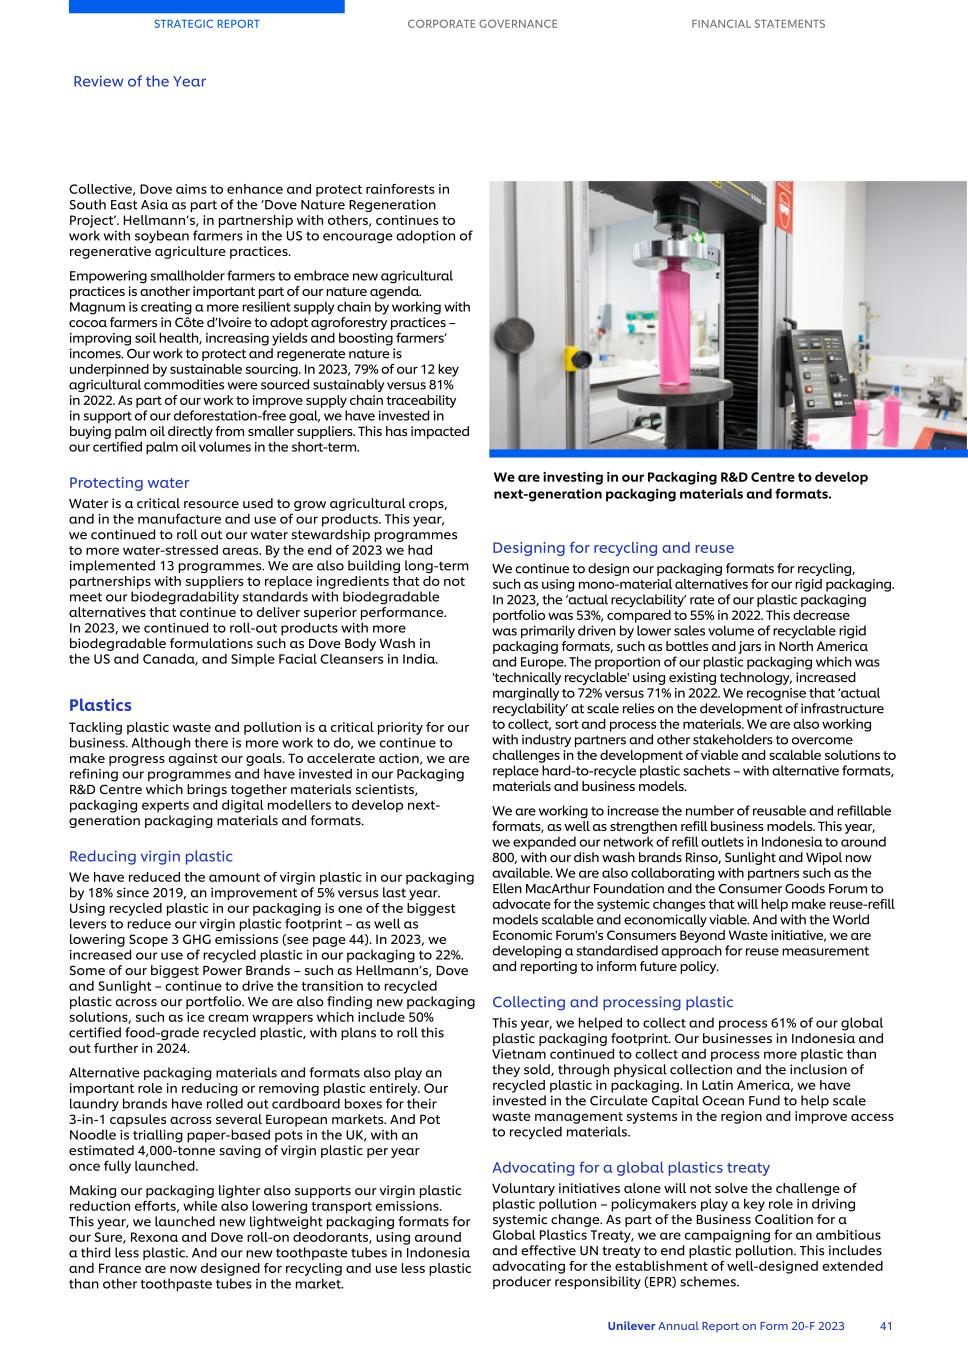
Collective, Dove aims to enhance and protect rainforests in South East Asia as part of the ‘Dove Nature Regeneration Project’. Hellmann’s, in partnership with others, continues to work with soybean farmers in the US to encourage adoption of regenerative agriculture practices. Empowering smallholder farmers to embrace new agricultural practices is another important part of our nature agenda. Magnum is creating a more resilient supply chain by working with cocoa farmers in Côte d’Ivoire to adopt agroforestry practices – improving soil health, increasing yields and boosting farmers’ incomes. Our work to protect and regenerate nature is underpinned by sustainable sourcing. In 2023, 79% of our 12 key agricultural commodities were sourced sustainably versus 81% in 2022. As part of our work to improve supply chain traceability in support of our deforestation-free goal, we have invested in buying palm oil directly from smaller suppliers. This has impacted our certified palm oil volumes in the short-term. Protecting water Water is a critical resource used to grow agricultural crops, and in the manufacture and use of our products. This year, we continued to roll out our water stewardship programmes to more water-stressed areas. By the end of 2023 we had implemented 13 programmes. We are also building long-term partnerships with suppliers to replace ingredients that do not meet our biodegradability standards with biodegradable alternatives that continue to deliver superior performance. In 2023, we continued to roll-out products with more biodegradable formulations such as Dove Body Wash in the US and Canada, and Simple Facial Cleansers in India. Plastics Tackling plastic waste and pollution is a critical priority for our business. Although there is more work to do, we continue to make progress against our goals. To accelerate action, we are refining our programmes and have invested in our Packaging R&D Centre which brings together materials scientists, packaging experts and digital modellers to develop next- generation packaging materials and formats. Reducing virgin plastic We have reduced the amount of virgin plastic in our packaging by 18% since 2019, an improvement of 5% versus last year. Using recycled plastic in our packaging is one of the biggest levers to reduce our virgin plastic footprint – as well as lowering Scope 3 GHG emissions (see page 44). In 2023, we increased our use of recycled plastic in our packaging to 22%. Some of our biggest Power Brands – such as Hellmann’s, Dove and Sunlight – continue to drive the transition to recycled plastic across our portfolio. We are also finding new packaging solutions, such as ice cream wrappers which include 50% certified food-grade recycled plastic, with plans to roll this out further in 2024. Alternative packaging materials and formats also play an important role in reducing or removing plastic entirely. Our laundry brands have rolled out cardboard boxes for their 3-in-1 capsules across several European markets. And Pot Noodle is trialling paper-based pots in the UK, with an estimated 4,000-tonne saving of virgin plastic per year once fully launched. Making our packaging lighter also supports our virgin plastic reduction efforts, while also lowering transport emissions. This year, we launched new lightweight packaging formats for our Sure, Rexona and Dove roll-on deodorants, using around a third less plastic. And our new toothpaste tubes in Indonesia and France are now designed for recycling and use less plastic than other toothpaste tubes in the market. Designing for recycling and reuse We continue to design our packaging formats for recycling, such as using mono-material alternatives for our rigid packaging. In 2023, the ‘actual recyclability’ rate of our plastic packaging portfolio was 53%, compared to 55% in 2022. This decrease was primarily driven by lower sales volume of recyclable rigid packaging formats, such as bottles and jars in North America and Europe. The proportion of our plastic packaging which was 'technically recyclable' using existing technology, increased marginally to 72% versus 71% in 2022. We recognise that ‘actual recyclability’ at scale relies on the development of infrastructure to collect, sort and process the materials. We are also working with industry partners and other stakeholders to overcome challenges in the development of viable and scalable solutions to replace hard-to-recycle plastic sachets – with alternative formats, materials and business models. We are working to increase the number of reusable and refillable formats, as well as strengthen refill business models. This year, we expanded our network of refill outlets in Indonesia to around 800, with our dish wash brands Rinso, Sunlight and Wipol now available. We are also collaborating with partners such as the Ellen MacArthur Foundation and the Consumer Goods Forum to advocate for the systemic changes that will help make reuse-refill models scalable and economically viable. And with the World Economic Forum's Consumers Beyond Waste initiative, we are developing a standardised approach for reuse measurement and reporting to inform future policy. Collecting and processing plastic This year, we helped to collect and process 61% of our global plastic packaging footprint. Our businesses in Indonesia and Vietnam continued to collect and process more plastic than they sold, through physical collection and the inclusion of recycled plastic in packaging. In Latin America, we have invested in the Circulate Capital Ocean Fund to help scale waste management systems in the region and improve access to recycled materials. Advocating for a global plastics treaty Voluntary initiatives alone will not solve the challenge of plastic pollution – policymakers play a key role in driving systemic change. As part of the Business Coalition for a Global Plastics Treaty, we are campaigning for an ambitious and effective UN treaty to end plastic pollution. This includes advocating for the establishment of well-designed extended producer responsibility (EPR) schemes. STRATEGIC REPORT CORPORATE GOVERNANCE FINANCIAL STATEMENTS Review of the Year Unilever Annual Report on Form 20-F 2023 41 We have invested €[325] million at our Unilever Oleochemicals facility in Indonesia to help us source deforestation-free palm kernel oil. We are investing in our Packaging R&D Centre to develop next-generation packaging materials and formats.

Livelihoods Our Livelihoods agenda aims to positively impact the lives of people across our value chain, including suppliers, and small and medium-sized businesses. In 2023, our livelihoods priorities were to: ensure our suppliers pay their employees a living wage; helping small and medium-sized businesses grow; and to advance equity, diversity and inclusion through our advertising and with our suppliers. Underpinning our livelihoods agenda is an ongoing commitment to embedding and promoting respect for human rights throughout our value chain. Championing a living wage One of the most impactful ways we can improve livelihoods is by ensuring workers who directly provide goods and services to us are paid a living wage. Since 2021, we have focused our efforts on ensuring that the contracts we sign with dedicated collaborative manufacturers include a requirement to pay a living wage. We plan to make a living wage a mandatory requirement in our Responsible Partner Policy (RPP). In advance of this, we have asked priority suppliers to voluntarily sign our Living Wage Promise. To help create a level playing field and mainstream living wage, we are also advocating for change through industry forums such as the UN Global Compact as well as supporting free, publicly accessible living wage data. Helping small retailers grow Our work with small and medium-sized retailers focuses on scaling our digital commerce platforms so that they can buy directly from us. In 2023, 1.9 million small retailers across eight emerging markets were active on these platforms – for example, our long-running Shakti initiative now includes digital ordering through the Shikhar platform. Opportunities for under-represented groups Our supplier diversity programme aims to enhance access to new capabilities at the same time as supporting our livelihoods work – and is focused on diverse businesses that are owned, managed and controlled by members of under- represented or minority groups. The programme is now active in 25 markets following expansion to Colombia, Chile and the Philippines, with our total spend reaching €1.1 billion in 2023. In Latin America, we have partnered with an accelerator programme that supports diverse suppliers who are developing sustainability solutions, with potential to benefit our business. We are one of the world’s largest advertisers by spend. Our long-running Act 2 Unstereotype initiative aims to strengthen the participation of under-represented communities in our advertising. In 2023, we have focused on under-representation of people with disabilities in advertising production, launching an Inclusive Set Commitment to increase access and opportunities across the industry. Human Rights Respecting human rights is fundamental to how we operate and underpins our four sustainability priorities. The United Nations Guiding Principles (UNGPs) on Business and Human Rights continue to inform our approach. This year, we commissioned an external review of our human rights issues and concluded that the eight we identified in 2015 remain the most salient. However, we have broadened the scope of some salient issues such as harassment which now includes bullying, and health and safety which considers impacts beyond the workplace. We now also formally recognise the human rights impact of climate and gender across all our salient issues. In response to growing pressure on human rights defenders we published new Principles in support of human rights defenders in our agriculture supply chain. Alongside targeted policy interventions, our RPP continues to play a key role in setting mandatory requirements for our suppliers across a range of human rights and sustainability issues. In 2023, 85% of our spend was with suppliers meeting RPP requirements, up from 76% in 2022. STRATEGIC REPORT CORPORATE GOVERNANCE FINANCIAL STATEMENTS Review of the Year 42 Unilever Annual Report on Form 20-F 2023 We have helped 1.9 million small and medium-sized retailers grow by providing access to our digital commerce platforms such as Shikhar in India.
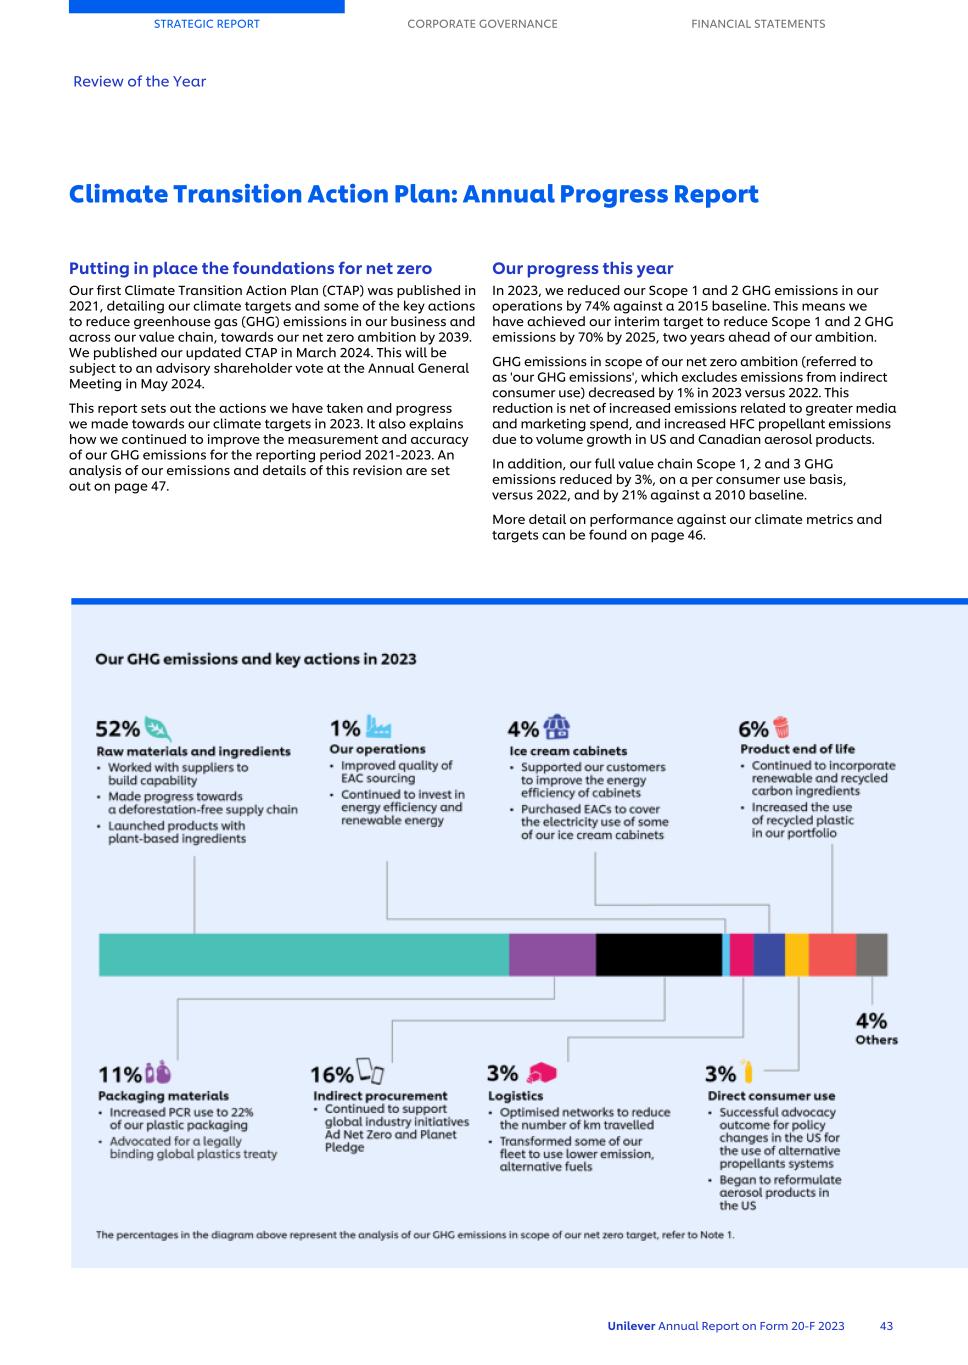
Climate Transition Action Plan: Annual Progress Report Putting in place the foundations for net zero Our first Climate Transition Action Plan (CTAP) was published in 2021, detailing our climate targets and some of the key actions to reduce greenhouse gas (GHG) emissions in our business and across our value chain, towards our net zero ambition by 2039. We published our updated CTAP in March 2024. This will be subject to an advisory shareholder vote at the Annual General Meeting in May 2024. This report sets out the actions we have taken and progress we made towards our climate targets in 2023. It also explains how we continued to improve the measurement and accuracy of our GHG emissions for the reporting period 2021-2023. An analysis of our emissions and details of this revision are set out on page 47. Our progress this year In 2023, we reduced our Scope 1 and 2 GHG emissions in our operations by 74% against a 2015 baseline. This means we have achieved our interim target to reduce Scope 1 and 2 GHG emissions by 70% by 2025, two years ahead of our ambition. GHG emissions in scope of our net zero ambition (referred to as 'our GHG emissions', which excludes emissions from indirect consumer use) decreased by 1% in 2023 versus 2022. This reduction is net of increased emissions related to greater media and marketing spend, and increased HFC propellant emissions due to volume growth in US and Canadian aerosol products. In addition, our full value chain Scope 1, 2 and 3 GHG emissions reduced by 3%, on a per consumer use basis, versus 2022, and by 21% against a 2010 baseline. More detail on performance against our climate metrics and targets can be found on page 46. STRATEGIC REPORT CORPORATE GOVERNANCE FINANCIAL STATEMENTS Review of the Year Unilever Annual Report on Form 20-F 2023 43
Raw materials and ingredients Raw materials and ingredients account for 52% of our GHG emissions and represent our largest emissions source. Raw material and ingredient emissions from Forest, Land and Agriculture (FLAG) decreased by 1% in 2023 while Energy and Industrial (E&I) related emissions decreased by 2%. In 2023, we started to establish the foundations for accelerated GHG emissions reductions in future years by scaling up our Supplier Climate Programme, reaching a key milestone in our deforestation-free goal, and by continuing to develop lower-emission ingredients in our cleaning and laundry products. Supplier Climate Programme We continue to support suppliers of raw materials, ingredients and packaging to deliver long-term reductions in GHG emissions. In 2023, we expanded our Supplier Climate Programme to reach more than 100 suppliers, with around 80 delivering on our asks. Our focus is on providing suppliers with access to tools and expert support to build key climate capabilities and to better measure their impact. Our suppliers with more mature climate programmes have now sent us around 240 Product Carbon Footprint (PCF) data points that meet industry standards and can be incorporated into our GHG measurement in the future. Alongside this, we are helping to shape industry standards for PCF data through the World Business Council for Sustainable Development’s Partnership for Carbon Transparency programme. Deforestation-free supply chain and regenerative agriculture To achieve our goal of a deforestation-free supply chain, we have fundamentally reshaped the way we source the five key commodities in scope – palm oil, paper and board, tea, soy and cocoa. By the end of 2023, we had put in place the infrastructure, monitoring and verification systems to manage a deforestation- free supply chain. Additionally, by the end of 2023 97.5% of palm oil, paper and board, tea, soy and cocoa order volumes were deforestation-free, based on Unilever's deforestation-free requirements. Our regenerative agriculture programme plays an important role in transforming our value chain and reducing land-based emissions from raw material production, as well as increasing resilience within our supply chain. Some of our climate actions including deforestation-free supply chain and regenerative agriculture are closely linked to delivering our nature goals. See pages 40 to 41 for more information on the progress we have made this year. Lower-carbon dairy Reducing emissions from dairy products is a priority for our Ice Cream Business Group. Through our Ben & Jerry’s brand, we have expanded a lower-carbon dairy pilot to 17 farms, to further test new technology and regenerative agricultural practices. The initiative, which began in 2022, aims to reduce GHG emissions from these dairy farms to half the industry average by 2025. We are supporting each farm to build a tailored roadmap based on their knowledge and experience of emissions reduction and the farming conditions at each location. We have also tested a feed additive that has the potential to reduce total GHG emissions by 12-15% per kilogram of milk. Chemical ingredients Our Home Care Business Group relies on chemicals derived from fossil fuels and is working to reduce emissions by transitioning to ingredients that use renewable or recycled carbon. In 2023, we successfully launched hand dish wash products with plant-based surfactants and zero petrochemical active agents in Indonesia. We also made good progress in developing lower carbon proteins and enzymes for use in our products in the future. In August, we ran an event with suppliers based in India – including a number who are part of our Supplier Climate Programme – to accelerate research into innovative ingredients and production processes. 18 of these suppliers pledged to reduce their GHG emissions and develop GHG- reduction roadmaps. We are also working with two chemical companies to develop lower GHG soda ash and surfactants for use in laundry powders. Initial findings suggest that this could result in significant GHG emissions reductions. Packaging materials Emissions associated with our packaging materials account for 11% of our GHG emissions. In 2023, GHG emissions from packaging decreased by 4% versus 2022, driven by a reduction in product volumes for the period measured (1 October 2022 to 30 September 2023), increased use of recycled plastic (PCR) and further lightweighting in our packaging formats. See page 41 for more on plastic. Indirect procurement Emissions associated with indirect procurement make up 16% of our GHG emissions – and include emissions from media and marketing suppliers. In 2023, we conducted a more detailed review of our indirect procurement spend and the associated emissions in this category. The largest category of spend here is our advertising and media spend. We need to work with third parties and suppliers in these areas to reduce these emissions. Unilever has been encouraging the advertising industry to reduce media and marketing related emissions, helping to establish and continuing to support the industry initiatives Ad Net Zero with the Advertising Association, and the Planet Pledge with the World Federation of Advertisers. Our operations Although our operations represent just 1% of our overall GHG emissions, it is the area where we have the most direct impact. By moving to renewable electricity and renewable heat, and focusing on energy efficiency improvements, we have reduced Scope 1 and 2 emissions by 74% versus our 2015 baseline. Since 2015, energy efficiency in our manufacturing sites has improved by 15%. In 2023, we spent an additional €42 million of capital expenditure on sustainability investments in our factories, including energy efficiency and renewable energy projects. Renewable electricity In 2023, 92% of our electricity came from renewable sources, a decrease of 1% versus 2022. This was partly driven by more accurate data from our combined heat and power plants and increased on-site non-renewable electricity generation at some sites due to market conditions – such as grid electricity rationing in South Asia (known as ‘load shedding’). We have also improved the quality of our Energy Attribute Certificate (EAC) sourcing and continue to align with RE100 criteria, meaning we only report electricity as ‘renewable’ when the certificate is issued from the same market in which the energy is used. In markets where EACs are not available, we purchase the equivalent amount of EACs from neighbouring markets to cover the energy used. STRATEGIC REPORT CORPORATE GOVERNANCE FINANCIAL STATEMENTS Review of the Year 44 Unilever Annual Report on Form 20-F 2023
Renewable thermal energy In 2023, 37% of our thermal energy came from renewable sources. We continue to switch to electric-powered heating technologies, such as heat pumps and to biofuels sourced in line with our Biofuel Sourcing Principles. For example, in 2023, we commissioned a new biomass-fuelled hot air generator at our Min Buri factory in Thailand which is expected to deliver a reduction in Scope 1 GHG emissions of over 8,000 tonnes per year. Logistics Logistics emissions from upstream transport and distribution accounts for 3% of our GHG emissions and decreased by 13% versus 2022. In 2023 we reduced our total logistics emissions by 14% versus 2020. We are working to minimise the number and length of journeys, as well as maximising the number of pallets carried per truck – shipping directly to consumers where possible. This has resulted in a 7% reduction in kilometres travelled per tonne of products sold in 2023, versus 2022. We have reduced total kilometres travelled by 19% since 2020. We have started to transition the fuel used for some of our truck fleet in the US, UK, Netherlands, Italy and the United Arab Emirates to alternatives such as biofuels. Ice cream cabinets The ice cream cabinets that we lease to retail stores account for 4% of our GHG emissions. In 2023, cabinet emissions decreased by 22% versus 2022. This was partly driven by energy grid decarbonisation in the US, UK and some countries in the European Union. Reductions also came from the purchase of EACs to cover some of our cabinet electricity consumption in Turkey and Indonesia – which accounts for approximately half of the emission reduction from cabinets in 2023. We will continue to evaluate EACs and other options to support the transition of our cabinet fleet towards renewable energy sources. Additionally, we continue to invest in more energy-efficient freezers, which has reduced average cabinet energy consumption by around 2% in 2023. We have launched a guide for our operating sales teams to train customers on how to run our freezers more efficiently, helping them to cut energy use and reduce their running costs. Direct consumer use In the majority of our markets, we use natural hydrocarbon propellant gases with a low global warming potential (GWP) – primarily in hairsprays, body sprays and spray deodorant. However, in the US and Canada, regulation on Volatile Organic Compounds (VOCs) restricts the use of these propellants. Instead, hydrofluorocarbon (HFC) propellants with a higher GWP tend to be used by industry to lower VOC levels. HFC propellant accounted for 3% of our GHG emissions in 2023, and make up the majority of our GHG emissions from direct consumer use of sold products. In 2023, GHG emissions from direct consumer use of sold products increased by 1% versus 2022. This was driven by product volume growth in the US and Canada, and the use of a propellant system in our dry shampoo products, to comply with 2023 reduction VOC regulation targets in the USA. After many years of working with the California Air Resources Board to advocate for change, VOC regulations were updated in the US in 2022 to include provisions permitting the use of alternative propellant systems with lower GWPs. This will allow us to begin reformulating some of our aerosol products in the US and will be a priority action to deliver GHG emission reductions in the future. Product end of life The disposal of product residuals and packaging, including the biodegradation of product formulations after their use, accounts for 6% of our GHG emissions. In 2023, our product end-of-life emissions fell by 2% versus 2022. We remain focused on increasing the use of renewable and recycled ingredients which lower GHG emissions as our products biodegrade. See chemical ingredients and packaging on page 44. Indirect consumer use Around a half of our products’ full value chain GHG emissions are indirect emissions associated with consumer use of our products. In 2023, indirect consumer use emissions decreased by 18% from 2022, as a result of reductions in product volumes for the period measured (1 October 2022 to 30 September 2023) and ongoing grid energy decarbonisation in the US, UK and European Union. In the run-up to COP28, we advocated for greater investment in renewable electricity generation to triple current capacity by the end of the decade. GHG impact of products across product lifecycle Our full value chain GHG emissions target includes both direct and indirect consumer use emissions across the product lifecycle. This is calculated using Scope 1, 2 and 3 emissions across the full value chain, and the number of consumer uses of our products (expressed as ‘per consumer use’ – single use, portion or serving). In 2023, our GHG emissions per consumer use reduced by 3% versus 2022, and by 21% since 2010 – primarily due to reductions in indirect consumer use emissions. Using our influence We continue to engage on policy areas that will help limit global temperature rise to 1.5°C and unlock faster emissions reduction in our value chain. In 2023, this included: ■ Working with RE100 to advocate for investment in zero carbon electricity grids and the introduction of market- based renewable electricity mechanisms. ■ Commissioning research by the University of Oxford identifying the policy interventions needed to address the carbon emissions of everyday cleaning, laundry, and home care products. ■ Ahead of COP28, we endorsed a 'call to action' with other organisations for the transition to include food systems in national climate plans. We also announced the Action Agenda on Regenerative Landscapes to accelerate the transition of large agri-food businesses to regenerative agriculture. Governance and disclosure Details on climate governance can be found in our TCFD statement on page 48. In addition to the climate disclosures in our Annual Report and Accounts, we provide annual submissions to CDP. In 2023, we received a rating of AAA- for our CDP Forests, Water and Climate disclosures (based on 2022 data). STRATEGIC REPORT CORPORATE GOVERNANCE FINANCIAL STATEMENTS Review of the Year Unilever Annual Report on Form 20-F 2023 45

Our climate metrics and targets We use several key metrics and targets to assess and manage climate risks and opportunities across our full value chain. Two of our near-term targets are validated as science-based by the Science Based Targets initiative ('SBTi'): ■ Reduce in absolute terms our operational (Scope 1 and 2) emissions by 100% by 2030 against a 2015 baseline and; ■ Halve the full value chain emissions (Scope 1 to 3) of our products on a per consumer use basis by 2030 against a 2010 baseline. In addition, we have an interim target to reduce in absolute terms our operational emissions (Scope 1 and 2) by 70% by 2025 against a 2015 baseline. While our operational target is validated by the SBTi as aligned with the 1.5°C ambition of the Paris Agreement, our full value chain target is validated by SBTi as aligned with limiting temperature increase to 2°C. This is because it was set in 2010 and validated by the SBTi before the 1.5°C validation was introduced. We intend to retire this target in 2024 once our new, more ambitious near-term 1.5°C-aligned Scope 3 targets have been validated by the SBTi. These are as follows: ■ Reduce absolute energy and industrial Scope 3 GHG emissions from Purchased Goods and Services (associated with ingredients and packaging), Fuel and Energy Related Activities, Upstream Transport and Distribution, direct emissions from Use of Sold Products (associated with HFC propellants), End-of-Life Treatment of Sold Products, and Downstream Leased Assets (associated with ice cream retail cabinets) by 42% by 2030 from a 2021 baseline year. ■ Reduce absolute Scope 3 Forest, Land and Agriculture (FLAG) GHG emissions from Purchased Goods and Services (associated with ingredients) by 30.3% by 2030 from a 2021 baseline year. For more details about this change, see our updated CTAP which is available on our website, and will be subject to an advisory shareholder vote at our 2024 AGM. We also set an ambition to achieve net zero emissions by 2039 and have additional nature and plastic goals which play an important role in tackling climate change.  Progress against climate metrics and targets The table below shows our progress against the key climate metrics and targets – see pages 43 to 45 for progress commentary. Additionally, see page 66 for progress against our plant-based and food waste goals. Metrics and targets Note 2023 2022 2021 GHG emissions in scope of net zero ambition (million tonnes CO2e)(a) 1 52.86 53.63(b) 56.25(b) Scope 1 and 2 GHG emissions (Unilever operations) Reduce GHG emissions in our operations by 100% by 2030 (reduction in emissions from energy and refrigerant use in our operations since 2015)(a)(c) -74% '-68% -64% 100% renewable electricity in our operations(a)(d) 92% 93% 86% 100% renewable heat in our operations by 2030(a)(e) 37% – – Energy use in GJ per tonne of production in our manufacturing sites(a) 1.15 1.22 1.23 CO2 emissions from energy use in kg per tonne of production in our manufacturing sites(a) 25.94 30.35 34.06 Scope 1, 2 and 3 GHG emissions (Unilever operations, upstream and downstream) 40%-50% reduction in logistics emissions by 2030 (% change since 2020) -14% -9% – Halve GHG impact of our products across the lifecycle by 2030 (% change since 2010)(f) 3 -21% '-19% '-14% Nature Deforestation-free supply chain in palm oil, paper & board, tea, soy and cocoa by 2023(g) 97.5%(h) – – 100% sustainable sourcing for key agricultural crops(i) 79% 81% 79% Implement water stewardship programmes in 100 locations in water-stressed areas by 2030 13 8 – Help protect and regenerate 1.5 million hectares of land, forests and oceans by 2030 (hectares) 0.3m† 0.2m 0.1m Plastics 25% recycled plastic by 2025(a)(j) 22% 21% 18% Supported by: €1 billion Climate & Nature Fund – spent and committed €0.3bn €0.2bn 0 (a) Measured for the 12-month period ended 30 September. (b) Restated for 2021 and 2022. See Note 1 for further detail. (c) These emissions exclude Scope 1 & 2 emissions related to small office and logistics sites, fuel consumption from company vehicles, methane and N2O from both fossil fuels and biofuels, and SF6 from electrical insulators in grid connections. (d) Excludes electricity related to small office and logistic sites. (e) Excludes heat related to small office and logistic sites. (f) Measured for the 12-month period ended 30 June. (g) Deforestation-free refers to the meeting of Unilever's deforestation-free requirements. (h) Measured for all commodity volumes ordered for the 3-month period October to December 2023 except for order volumes of palm oil for India measured only for December 2023. (i) Comprising 66% key agricultural crops purchased from suppliers that comply with the requirements set out in Unilever’s Sustainable Agriculture Code 2017 (71% in 2022, 69% in 2021) and, 13% purchased from non-sustainable suppliers but have been matched by Credits purchased for raw materials (10% in 2022, 10% in 2021). (j) Scope of reporting on our plastic goals is 27 countries. STRATEGIC REPORT CORPORATE GOVERNANCE FINANCIAL STATEMENTS Review of the Year 46 Unilever Annual Report on Form 20-F 2023

Notes on metrics and targets Note 1: Analysis of GHG emissions GHG emissions (million tonnes CO2e) 2023 2022 2021 2023 – 2022 % change Scope 1 and 2 GHG emissions: Unilever operations (Note 2)(a) 0.73 0.81(b) 0.91(b) -10% Scope 3 GHG emissions in scope of our net zero ambition(a) 52.13 52.82(b) 55.34(b) -1% Purchased goods and services 41.47 41.15 43.35 1% Raw materials and ingredients – Forest Land and Agriculture (FLAG) 12.18 12.32 13.09 -1% Raw materials and ingredients – Energy and Industrial (E&I) 15.35 15.71 16.93 -2% Packaging materials 5.60 5.84 6.06 -4% Indirect procurement 8.34 7.28 7.27 15% Upstream transport and distribution (logistics) 1.57 1.81 1.91 -13% Ice cream cabinets 2.30 2.93 3.09 -22% Direct consumer use 1.48 1.46 1.23 1% Product end of life 3.25 3.32 3.54 -2% Others(c) 2.06 2.15 2.22 -4% Total Scope 1, 2 and 3 GHG emissions in scope of net zero ambition 52.86 53.63 56.25 -1% Scope 3 GHG emissions – indirect consumer use 47.07 57.54 64.87 -18% Total Scope 1, 2 and 3 GHG emissions 99.93 111.17 121.12 -10% (a) Measured for the 12-month period ended 30 September. (b) Restated for 2021 and 2022. See below for further detail. (c) Includes Fuel and Energy related services, Capital goods, Waste generated in operations, Employee commuting, Business travel, Franchises, Downstream Transport and Distribution. In 2023, we implemented improvements in our GHG emissions measurement and restated our 2021 and 2022 GHG emissions measurement to reflect these changes. The revised 2021 emissions are the baseline for our new 2030 Scope 3 emissions reduction targets. We improved our Scope 1 and 2 emissions measurement with more complete and accurate data related to small office and logistics sites, fuel consumption from company vehicles, methane and N2O gases from both fossil fuels and biofuels and SF6 gas from electrical insulators in grid connections. We also implemented a new measurement system for our most material Scope 3 emission categories which measures emissions from procured goods and services, using data on real volumes of procured raw materials/packaging and services combined with standard emissions factors for these materials, applying the latest guidance on the use of emissions factors (IPCC AR6) and the draft GHG Protocol Land Sector guidance. As well as measuring emissions on a procurement basis, we are still using product footprint data – based on a representative sample of products including the impact on indirect consumer use emissions – as part of our product innovation decisions. Over time, we expect the new measurement system to be able to incorporate this data and provide product footprint information. Note 2: Analysis of GHG emissions in our operations Scope 1 and 2 GHG emissions (million tonnes CO2e) 2023 2022 2021 Scope 1 GHG emissions(a) 0.62 0.66(b) 0.73(b) Renewable energy 0.04 0.03 0.04 Non-renewable energy 0.56 0.61 0.67 Refrigerants and other gases (c) 0.02 0.02 0.02 Scope 2 GHG emissions(a) 0.11 0.15(b) 0.18(b) Purchased renewable electricity 0 0 0 Purchased non-renewable electricity 0.03 0.06 0.09 Purchased renewable thermal energy 0 0 0 Purchased non-renewable thermal energy 0.08 0.09 0.09 Total Scope 1 and 2 GHG emissions 0.73 0.81 0.91 (a) Measured for the 12-month period ended 30 September. (b) Restated for 2021 and 2022. See Note 1 for further detail. (c) Other gases include SF6, PFCs and NF3. Note 3: Analysis of GHG emissions per consumer use GHG per consumer use 2023 2022 2021 GHG impact per consumer use (grams CO2e)(a) 40.0 41.4 43.6 Reduction in GHG impact per consumer use since 2010 (%)(a) -21% '-19% '-14% (a) Measured for the 12-month period ended 30 June. STRATEGIC REPORT CORPORATE GOVERNANCE FINANCIAL STATEMENTS Review of the Year Unilever Annual Report on Form 20-F 2023 47
Task Force on Climate-related Financial Disclosures statement The following statement, which Unilever believes is consistent with the Task Force on Climate-related Financial Disclosures (TCFD) Recommendations and Recommended Disclosures, details the risks and opportunities arising from climate change, the potential impact on our business and the actions we are taking to respond. We also integrate climate-related disclosures throughout this Annual Report and Accounts, including in our Climate Transition Action Plan (CTAP) Annual Progress Report on pages 43 to 47. A detailed breakdown of our emissions can be found on page 47. We have updated our CTAP, in advance of an advisory shareholder vote at our Annual General Meeting in May 2024. See our website for the latest CTAP. Governance The overall governance structure for managing Unilever’s climate risks and opportunities is the same as for any of Unilever’s other key risks and opportunities i.e. all of the following play a key role in governance: the Board, the Board subcommittees, ULE, ULE subcommittees, Business Group leadership teams, specialist management governance groups and specialist teams together with the support of relevant policies and procedures applied by everyone in the business (see page 88). Whilst the Board takes overall accountability for the management of all risks and opportunities, including climate change (see page 70), our CEO is ultimately responsible for oversight of our climate change agenda. The Board delegates specific climate change matters to each of the Board subcommittees: ■ The Corporate Responsibility Committee – oversees the development of Unilever’s sustainability agenda (which includes climate matters), and the progress against that agenda, including performance against specific targets, whilst also reviewing sustainability-related risks, developments and opportunities (see page 114). ■ The Audit Committee – oversees the non-financial disclosures in our Annual Report and Accounts, which includes climate-related disclosures. This includes reviewing the scope and results of any internal and external assurance activities obtained over the disclosures (see page 109). ■ The Compensation Committee – supports the sustainability strategy which includes the climate strategy through alignment of Unilever’s incentive plan to the sustainability agenda and ambitions (see page 128). ■ The Nominating and Corporate Governance Committee – is responsible for ensuring that the composition of the Board provides sufficient skills and experience in sustainability matters including climate change to deliver on the sustainability agenda (see page 105). ■ The Board is supported by the ULE and the Sustainability Advisory Council. The Council is made up of seven independent external specialists in social and environmental matters, and it convened in 2023 to guide and critique our strategy. The ULE discuss key strategic sustainability matters at least quarterly. During 2023, climate change matters were discussed at each meeting including progress against our climate-related Compass goals. The specific topics discussed included our GHG emissions measurement and setting a new baseline for our total emissions, GHG reduction plans for our Business Groups, and implications of the changes in the SBTi guidelines on setting new targets. Additional ULE subcommittees are also in place to support our climate agenda and ULE decision-making, including: ■ Business Operations Sustainability Steering Committee: Provides strategic guidance on implementation of our climate, nature and livelihoods goals within our extended supply chain. Chaired by our Chief Business Operations Officer, attended together with our Chief Sustainability Officer (CSO), Chief Procurement Officer and Head of Sustainable Business and Reporting. ■ Climate and Nature Investment Committee: Evaluates and approves investment proposals and reviews progress against key milestones for the Climate & Nature Fund, our €1 billion commitment to fund disruptive transformations across our value chain. Chaired by our Chief Business Operations Officer together with our CSO, Chief R&D Officer, Head of Sustainable Business and Reporting, and our five Business Group Presidents. Each Business Group has a sustainability lead to ensure that sustainability risks and opportunities are embedded into their strategies and performance is monitored. We also have a specialist corporate team, the Global Sustainability Function, led by our CSO. This team supports the Business Group teams in developing their business strategies whilst also driving transformational change across markets through advocacy and partnerships. In addition, included within the Supply Chain, R&D and Finance corporate functions, we have teams of experts who are focused on the sustainability agenda which includes climate- related matters. Their activities include developing relevant policies and procedures, e.g. responsible sourcing and metric definitions (scope and calculation methodologies). We regularly engage with our investors on a wide range of sustainability matters including our climate strategy. In 2021, we achieved shareholder support for our CTAP through an advisory vote at our AGM. During the fourth quarter of 2023, we commenced our engagement with investors on our updated CTAP. We engaged with more than 20 of our largest institutional investors and have used their feedback to help shape the updated CTAP. Remuneration for management employees – up to and including the ULE – continues to be formally linked to performance against climate change goals. Their reward packages include fixed pay, a bonus as a percentage of fixed pay and eligibility to participate in a long-term Performance Share Plan (PSP). The PSP is linked to financial and sustainability performance, guided by our Sustainability Progress Index (SPI), which accounts for 25% of the total PSP award. The SPI in 2023 was determined by considering performance against a number of sustainability goals – see page 136 for details. See pages 136 to 137 for more on PSP including the role of the Board’s Compensation Committee and Corporate Responsibility Committee in determining how the PSP operates, and the SPI outcome each year. STRATEGIC REPORT CORPORATE GOVERNANCE FINANCIAL STATEMENTS Review of the Year 48 Unilever Annual Report on Form 20-F 2023
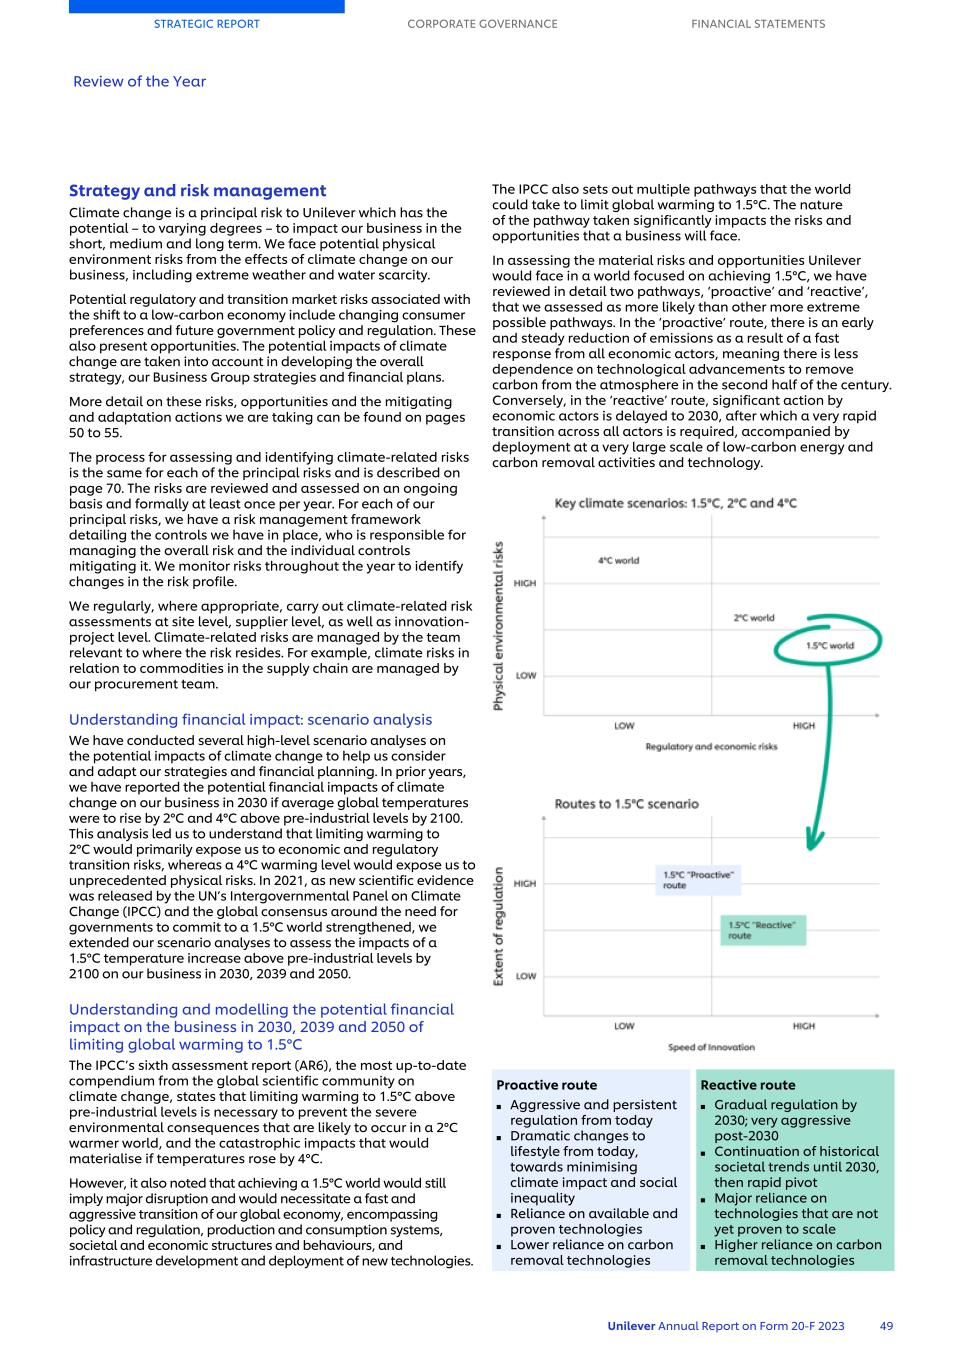
Strategy and risk management Climate change is a principal risk to Unilever which has the potential – to varying degrees – to impact our business in the short, medium and long term. We face potential physical environment risks from the effects of climate change on our business, including extreme weather and water scarcity. Potential regulatory and transition market risks associated with the shift to a low-carbon economy include changing consumer preferences and future government policy and regulation. These also present opportunities. The potential impacts of climate change are taken into account in developing the overall strategy, our Business Group strategies and financial plans. More detail on these risks, opportunities and the mitigating and adaptation actions we are taking can be found on pages 50 to 55. The process for assessing and identifying climate-related risks is the same for each of the principal risks and is described on page 70. The risks are reviewed and assessed on an ongoing basis and formally at least once per year. For each of our principal risks, we have a risk management framework detailing the controls we have in place, who is responsible for managing the overall risk and the individual controls mitigating it. We monitor risks throughout the year to identify changes in the risk profile. We regularly, where appropriate, carry out climate-related risk assessments at site level, supplier level, as well as innovation- project level. Climate-related risks are managed by the team relevant to where the risk resides. For example, climate risks in relation to commodities in the supply chain are managed by our procurement team. Understanding financial impact: scenario analysis We have conducted several high-level scenario analyses on the potential impacts of climate change to help us consider and adapt our strategies and financial planning. In prior years, we have reported the potential financial impacts of climate change on our business in 2030 if average global temperatures were to rise by 2°C and 4°C above pre-industrial levels by 2100. This analysis led us to understand that limiting warming to 2°C would primarily expose us to economic and regulatory transition risks, whereas a 4°C warming level would expose us to unprecedented physical risks. In 2021, as new scientific evidence was released by the UN’s Intergovernmental Panel on Climate Change (IPCC) and the global consensus around the need for governments to commit to a 1.5°C world strengthened, we extended our scenario analyses to assess the impacts of a 1.5°C temperature increase above pre-industrial levels by 2100 on our business in 2030, 2039 and 2050. Understanding and modelling the potential financial impact on the business in 2030, 2039 and 2050 of limiting global warming to 1.5°C The IPCC’s sixth assessment report (AR6), the most up-to-date compendium from the global scientific community on climate change, states that limiting warming to 1.5°C above pre-industrial levels is necessary to prevent the severe environmental consequences that are likely to occur in a 2°C warmer world, and the catastrophic impacts that would materialise if temperatures rose by 4°C. However, it also noted that achieving a 1.5°C world would still imply major disruption and would necessitate a fast and aggressive transition of our global economy, encompassing policy and regulation, production and consumption systems, societal and economic structures and behaviours, and infrastructure development and deployment of new technologies. The IPCC also sets out multiple pathways that the world could take to limit global warming to 1.5°C. The nature of the pathway taken significantly impacts the risks and opportunities that a business will face. In assessing the material risks and opportunities Unilever would face in a world focused on achieving 1.5°C, we have reviewed in detail two pathways, ‘proactive’ and ‘reactive’, that we assessed as more likely than other more extreme possible pathways. In the ‘proactive’ route, there is an early and steady reduction of emissions as a result of a fast response from all economic actors, meaning there is less dependence on technological advancements to remove carbon from the atmosphere in the second half of the century. Conversely, in the ‘reactive’ route, significant action by economic actors is delayed to 2030, after which a very rapid transition across all actors is required, accompanied by deployment at a very large scale of low-carbon energy and carbon removal activities and technology. Proactive route Reactive route ■ Aggressive and persistent regulation from today ■ Dramatic changes to lifestyle from today, towards minimising climate impact and social inequality ■ Reliance on available and proven technologies ■ Lower reliance on carbon removal technologies ■ Gradual regulation by 2030; very aggressive post-2030 ■ Continuation of historical societal trends until 2030, then rapid pivot ■ Major reliance on technologies that are not yet proven to scale ■ Higher reliance on carbon removal technologies STRATEGIC REPORT CORPORATE GOVERNANCE FINANCIAL STATEMENTS Review of the Year Unilever Annual Report on Form 20-F 2023 49
Risks and opportunities assessed in creating our 1.5°C scenario In creating our 1.5°C scenario analysis, we took the two pathways and considered the five broad types of risks and opportunities using the TCFD risk framework: Regulatory risks; Market risks; Physical environment risks; Innovative products and services opportunities; and Resource efficiency, resilience, and market opportunities. We identified approximately 40 specific risk and opportunity areas which could impact us in 2030, 2039 and 2050, each of which we assessed qualitatively, supported where possible with high-level quantitative assessments. The assessments are based on financial scenarios and do not represent financial forecasts. They exclude any actions that we might undertake to mitigate or adapt to these risks. The quantitative assessments were developed to understand high-level materiality and order of magnitude financial impact rather than perform detailed simulations or forecasts on the long-term future of markets and products. The data used was from internal environmental, operational, and financial data and external science-based data, and assumptions from reputable and broadly used sources such as the IPCC or the International Energy Agency (IEA). Key risks and opportunities Out of all the risks and opportunities we assessed as part of our 1.5°C scenario assessment, there are 11 which we believe are significant and could at some time in the future be material to our business. We have combined the outputs from the ‘proactive’ and ‘reactive’ analyses since the risks and opportunities are similar, with the differences only being in the size and timing of impact. Due to the nature of climate risks and opportunities we are monitoring them across a number of time horizons. Short term (up to three years) – this aligns with our three-year strategic plans, medium term (three to ten years) and long term (beyond ten years). Where we have been able to quantify the risk, the ranges represent potential impacts of the different pathways. Actions to mitigate and adapt to the risks and to capitalise on the opportunities have been consolidated into our sustainability goals (pages 65 to 66) and our CTAP progress update (pages 43 to 47). Below we summarise the 11 risks and opportunities. Given the nature of our products, all of the risks noted below are applicable to all our Business Groups and there are only modest variations in their relative significance for each Business Group. For more details on key targets and goals, see pages 65 to 66. Risk Management of risk Carbon tax This includes carbon taxes and voluntary removal costs. Tightening regional or national regulations as well as climate commitments across individual businesses could drive widespread implementation of these taxes or market schemes. This could translate into rising direct and indirect costs linked to carbon emissions, where the strongest impact would likely be on costs of sales linked to raw materials, production, and distribution emissions. Carbon taxes on household emissions or costs passed through to our consumers linked to household emissions may impact their disposable income and ultimately their purchasing power. Impact on Business Groups: All Business Groups could be impacted by carbon taxes or voluntary removal costs. Per unit of consumption, our Ice Cream business has the highest carbon emissions from the use of dairy ingredients and the energy used in ice cream storage/transport/point-of-sale freezer cabinets. The highest absolute carbon emissions from sourcing materials, production and distribution is in Home Care whereas it is lowest in Beauty & Wellbeing. Timeframe: Medium term to long term Actions: We have a CTAP which sets out in detail activities to reduce our carbon emissions. For example, our eco-design programmes will reformulate our products with alternative less carbon-intensive ingredients and, through our Supplier Climate Programme, we are working with our largest suppliers to help them build plans to decarbonise the products they supply to us. We also aim to cut emissions from energy use in more than 3 million point-of-sale ice cream cabinets. In 2023, we submitted a new 2030 absolute emissions reduction target to the SBTi which is awaiting approval. We support the use of internal carbon pricing as a tool to help us achieve our net zero emissions goal. We use an internal carbon price of €70 per tonne to inform our investment decision-making. Key targets: ■ Zero GHG emissions in our operations by 2030 ■ Reduce absolute Scope 3 energy and industrial GHG emissions from Purchased Goods and Services (direct procurement), Fuel and Energy related activities, Upstream Transport and Distribution, direct emissions from Use of Sold Products (HFC propellants), End-of-Life Treatment of Sold Products, and Downstream Leased Assets (ice cream cabinets) by 42% by 2030 from a 2021 base year. ■ Reduce absolute Scope 3 FLAG (Forest, Land and Agriculture) GHG emissions from Purchased Goods and Services (ingredients) by 30.3% by 2030 from a 2021 base year. ■ Net zero GHG emissions ambition across our value chain by 2039 Regulatory risks STRATEGIC REPORT CORPORATE GOVERNANCE FINANCIAL STATEMENTS Review of the Year 50 Unilever Annual Report on Form 20-F 2023
Risk Management of risk Land use regulations These could drive reforms to radically restructure current global land use patterns to conserve and expand forest land, serving as the main natural carbon removal solution. This could reduce land available for food crops, pasture and timber and hence access to our primary commodities which could drive reduced crop output and increase raw material prices. Impact on Business Groups: All Business Groups could be impacted by land use regulation. The majority of our products are derived from agricultural raw materials and thus any limitations placed on land use would have a similar impact across each Business Group. Specific land use regulations vis- à-vis certain usages/crops could impact the Business Groups differently e.g. if dairy farming land was restricted and nothing else, then the Ice Cream business would be most impacted. Timeframe: Medium term to long term Actions: We monitor potential land use regulations to ensure we understand their implications so that we can adapt our raw material supply strategy. By the end of 2023 we had put in place the infrastructure, monitoring and verification systems to manage a deforestation-free supply chain. In addition, we are working with farmers across our supply chain to drive sustainable sourcing and regenerative agriculture. Key goals: ■ Deforestation-free supply chain in palm oil, paper and board, tea, soy and cocoa by 2023 ■ Help protect and regenerate 1.5 million hectares of land, forests and oceans by 2030 Product composition regulations These could restrict or ban the use of certain GHG-intensive components and ingredients in everyday products. This would require the redesign of products and packaging to comply, which could increase costs. Impact on Business Groups: All Business Groups could be impacted by product composition regulations. If there was a ban on the use of GHG-intensive ingredients/components, then there is a greater likelihood that the impact on our Personal Care and Home Care businesses would be greater than on our other businesses, as some personal care products in certain countries use HFC propellants and in home care, various chemicals such as soda ash are used. Timeframe: Medium term to long term Actions: We monitor regulatory developments to ensure that our product composition is compliant and that future innovations/products are designed to consider forthcoming climate-related legislation. As part of our CTAP, we are committed to reducing the GHG impact of our products and as part of this, we are reviewing our intensive GHG components and ingredients and looking for substitutions or how changes in their production processes can reduce their GHG emissions. We have a diverse portfolio of products and offer a range of formats to meet consumers' needs and this helps mitigate the potential impact of restrictions or bans on specific GHG- intensive materials. Specifically, on HFC propellants, we have successfully advocated for a change in regulations in the US to allow the use of alternative less carbon-intensive propellants. Key goals: ■ Reduce emissions from aerosol propellants in the US and Canada Sourcing transparency and product labelling regulations These could increase significantly through pressure from regulators, consumers, and investors. This could lead to disclosure compliance risks and rising commodity costs linked to radical transition to transparent supply chains, as well as a potential loss of market share to more transparent competitors. Impact on Business Groups: All Business Groups could be impacted by sourcing transparency and product labelling regulations and, given the nature of all the raw materials used, the risk to each Business Group is equal. Timeframe: Medium term to long term Actions: We monitor regulatory developments to ensure that our product labelling is compliant and that future innovations/ products are designed to consider forthcoming climate- related legislation. As part of our CTAP we are committed to improving sourcing transparency, through collaboration with our suppliers, and transparency with consumers through product labelling. We are currently working with the EcoBeautyScore Consortium to develop a common labelling convention that will allow consumers to compare the environmental impact of products. We have a diverse portfolio of products and offer a range of formats to meet consumers' needs and this helps mitigate the potential impact of product labelling regulations. Key goals: ■ 100% sustainable sourcing for key agricultural crops Regulatory risks continued STRATEGIC REPORT CORPORATE GOVERNANCE FINANCIAL STATEMENTS Review of the Year Unilever Annual Report on Form 20-F 2023 51
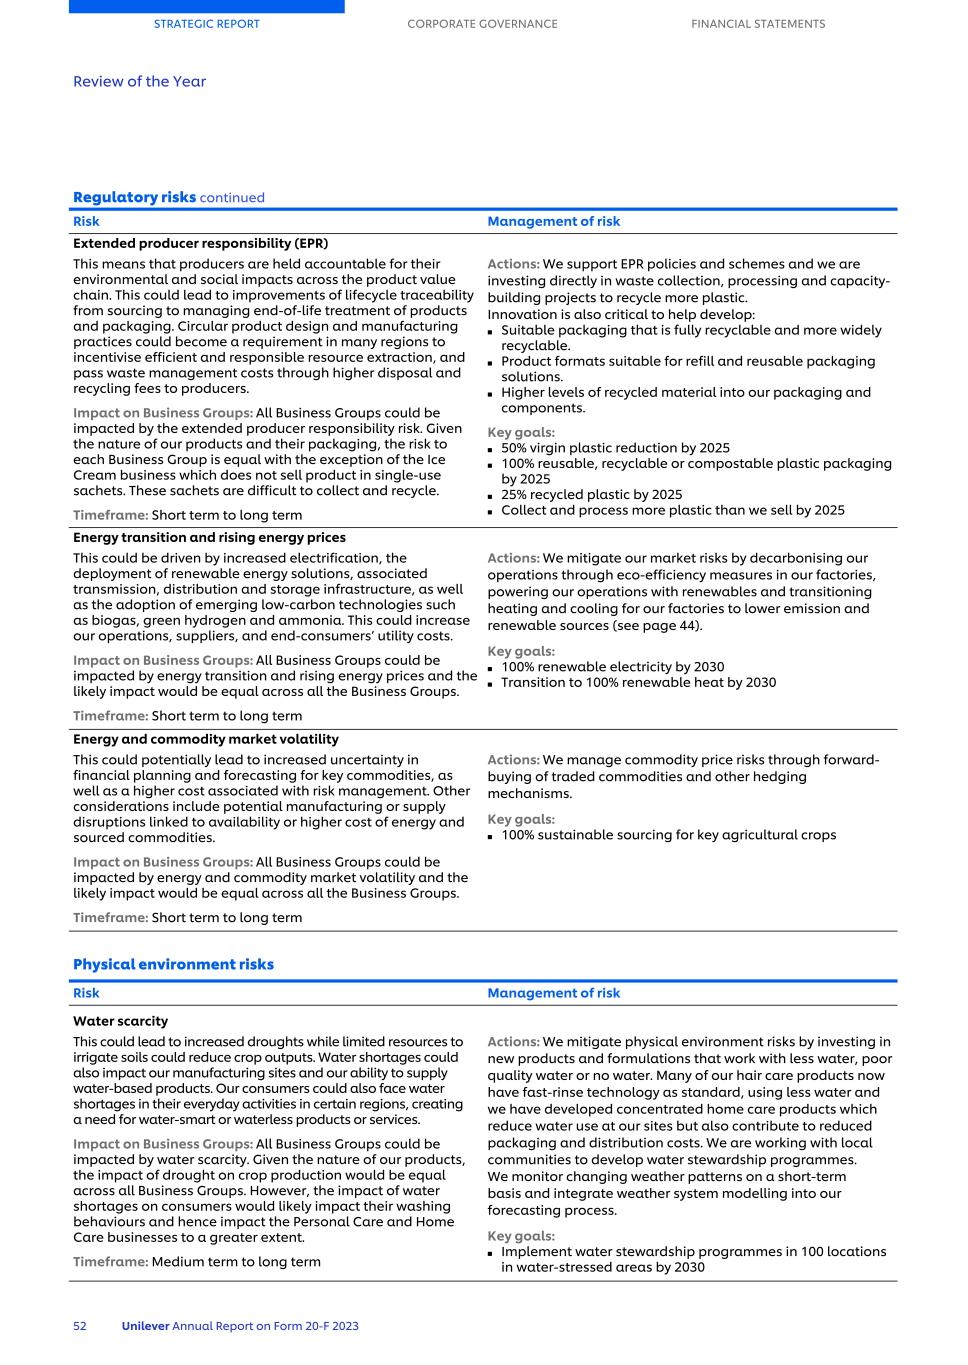
Risk Management of risk Extended producer responsibility (EPR) This means that producers are held accountable for their environmental and social impacts across the product value chain. This could lead to improvements of lifecycle traceability from sourcing to managing end-of-life treatment of products and packaging. Circular product design and manufacturing practices could become a requirement in many regions to incentivise efficient and responsible resource extraction, and pass waste management costs through higher disposal and recycling fees to producers. Impact on Business Groups: All Business Groups could be impacted by the extended producer responsibility risk. Given the nature of our products and their packaging, the risk to each Business Group is equal with the exception of the Ice Cream business which does not sell product in single-use sachets. These sachets are difficult to collect and recycle. Timeframe: Short term to long term Actions: We support EPR policies and schemes and we are investing directly in waste collection, processing and capacity- building projects to recycle more plastic. Innovation is also critical to help develop: ■ Suitable packaging that is fully recyclable and more widely recyclable. ■ Product formats suitable for refill and reusable packaging solutions. ■ Higher levels of recycled material into our packaging and components. Key goals: ■ 50% virgin plastic reduction by 2025 ■ 100% reusable, recyclable or compostable plastic packaging by 2025 ■ 25% recycled plastic by 2025 ■ Collect and process more plastic than we sell by 2025 Energy transition and rising energy prices This could be driven by increased electrification, the deployment of renewable energy solutions, associated transmission, distribution and storage infrastructure, as well as the adoption of emerging low-carbon technologies such as biogas, green hydrogen and ammonia. This could increase our operations, suppliers, and end-consumers’ utility costs. Impact on Business Groups: All Business Groups could be impacted by energy transition and rising energy prices and the likely impact would be equal across all the Business Groups. Timeframe: Short term to long term Actions: We mitigate our market risks by decarbonising our operations through eco-efficiency measures in our factories, powering our operations with renewables and transitioning heating and cooling for our factories to lower emission and renewable sources (see page 44). Key goals: ■ 100% renewable electricity by 2030 ■ Transition to 100% renewable heat by 2030 Energy and commodity market volatility This could potentially lead to increased uncertainty in financial planning and forecasting for key commodities, as well as a higher cost associated with risk management. Other considerations include potential manufacturing or supply disruptions linked to availability or higher cost of energy and sourced commodities. Impact on Business Groups: All Business Groups could be impacted by energy and commodity market volatility and the likely impact would be equal across all the Business Groups. Timeframe: Short term to long term Actions: We manage commodity price risks through forward- buying of traded commodities and other hedging mechanisms. Key goals: ■ 100% sustainable sourcing for key agricultural crops Regulatory risks continued Risk Management of risk Water scarcity This could lead to increased droughts while limited resources to irrigate soils could reduce crop outputs. Water shortages could also impact our manufacturing sites and our ability to supply water-based products. Our consumers could also face water shortages in their everyday activities in certain regions, creating a need for water-smart or waterless products or services. Impact on Business Groups: All Business Groups could be impacted by water scarcity. Given the nature of our products, the impact of drought on crop production would be equal across all Business Groups. However, the impact of water shortages on consumers would likely impact their washing behaviours and hence impact the Personal Care and Home Care businesses to a greater extent. Timeframe: Medium term to long term Actions: We mitigate physical environment risks by investing in new products and formulations that work with less water, poor quality water or no water. Many of our hair care products now have fast-rinse technology as standard, using less water and we have developed concentrated home care products which reduce water use at our sites but also contribute to reduced packaging and distribution costs. We are working with local communities to develop water stewardship programmes. We monitor changing weather patterns on a short-term basis and integrate weather system modelling into our forecasting process. Key goals: ■ Implement water stewardship programmes in 100 locations in water-stressed areas by 2030 Physical environment risks STRATEGIC REPORT CORPORATE GOVERNANCE FINANCIAL STATEMENTS Review of the Year 52 Unilever Annual Report on Form 20-F 2023
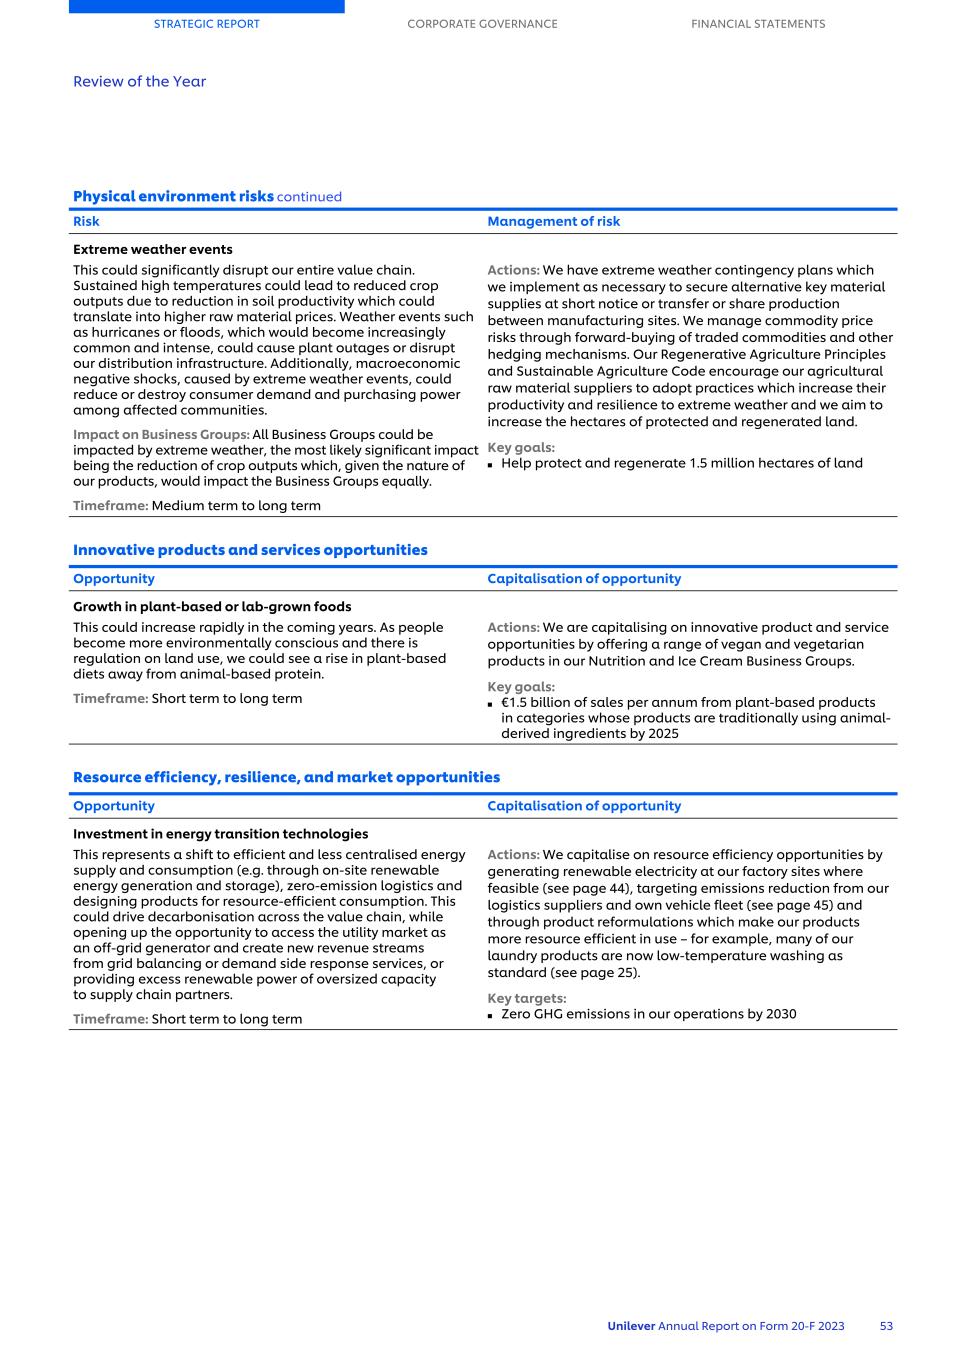
Risk Management of risk Extreme weather events This could significantly disrupt our entire value chain. Sustained high temperatures could lead to reduced crop outputs due to reduction in soil productivity which could translate into higher raw material prices. Weather events such as hurricanes or floods, which would become increasingly common and intense, could cause plant outages or disrupt our distribution infrastructure. Additionally, macroeconomic negative shocks, caused by extreme weather events, could reduce or destroy consumer demand and purchasing power among affected communities. Impact on Business Groups: All Business Groups could be impacted by extreme weather, the most likely significant impact being the reduction of crop outputs which, given the nature of our products, would impact the Business Groups equally. Timeframe: Medium term to long term Actions: We have extreme weather contingency plans which we implement as necessary to secure alternative key material supplies at short notice or transfer or share production between manufacturing sites. We manage commodity price risks through forward-buying of traded commodities and other hedging mechanisms. Our Regenerative Agriculture Principles and Sustainable Agriculture Code encourage our agricultural raw material suppliers to adopt practices which increase their productivity and resilience to extreme weather and we aim to increase the hectares of protected and regenerated land. Key goals: ■ Help protect and regenerate 1.5 million hectares of land Physical environment risks continued Opportunity Capitalisation of opportunity Growth in plant-based or lab-grown foods This could increase rapidly in the coming years. As people become more environmentally conscious and there is regulation on land use, we could see a rise in plant-based diets away from animal-based protein. Timeframe: Short term to long term Actions: We are capitalising on innovative product and service opportunities by offering a range of vegan and vegetarian products in our Nutrition and Ice Cream Business Groups. Key goals: ■ €1.5 billion of sales per annum from plant-based products in categories whose products are traditionally using animal- derived ingredients by 2025 Innovative products and services opportunities Opportunity Capitalisation of opportunity Investment in energy transition technologies This represents a shift to efficient and less centralised energy supply and consumption (e.g. through on-site renewable energy generation and storage), zero-emission logistics and designing products for resource-efficient consumption. This could drive decarbonisation across the value chain, while opening up the opportunity to access the utility market as an off-grid generator and create new revenue streams from grid balancing or demand side response services, or providing excess renewable power of oversized capacity to supply chain partners. Timeframe: Short term to long term Actions: We capitalise on resource efficiency opportunities by generating renewable electricity at our factory sites where feasible (see page 44), targeting emissions reduction from our logistics suppliers and own vehicle fleet (see page 45) and through product reformulations which make our products more resource efficient in use – for example, many of our laundry products are now low-temperature washing as standard (see page 25). Key targets: ■ Zero GHG emissions in our operations by 2030 Resource efficiency, resilience, and market opportunities STRATEGIC REPORT CORPORATE GOVERNANCE FINANCIAL STATEMENTS Review of the Year Unilever Annual Report on Form 20-F 2023 53
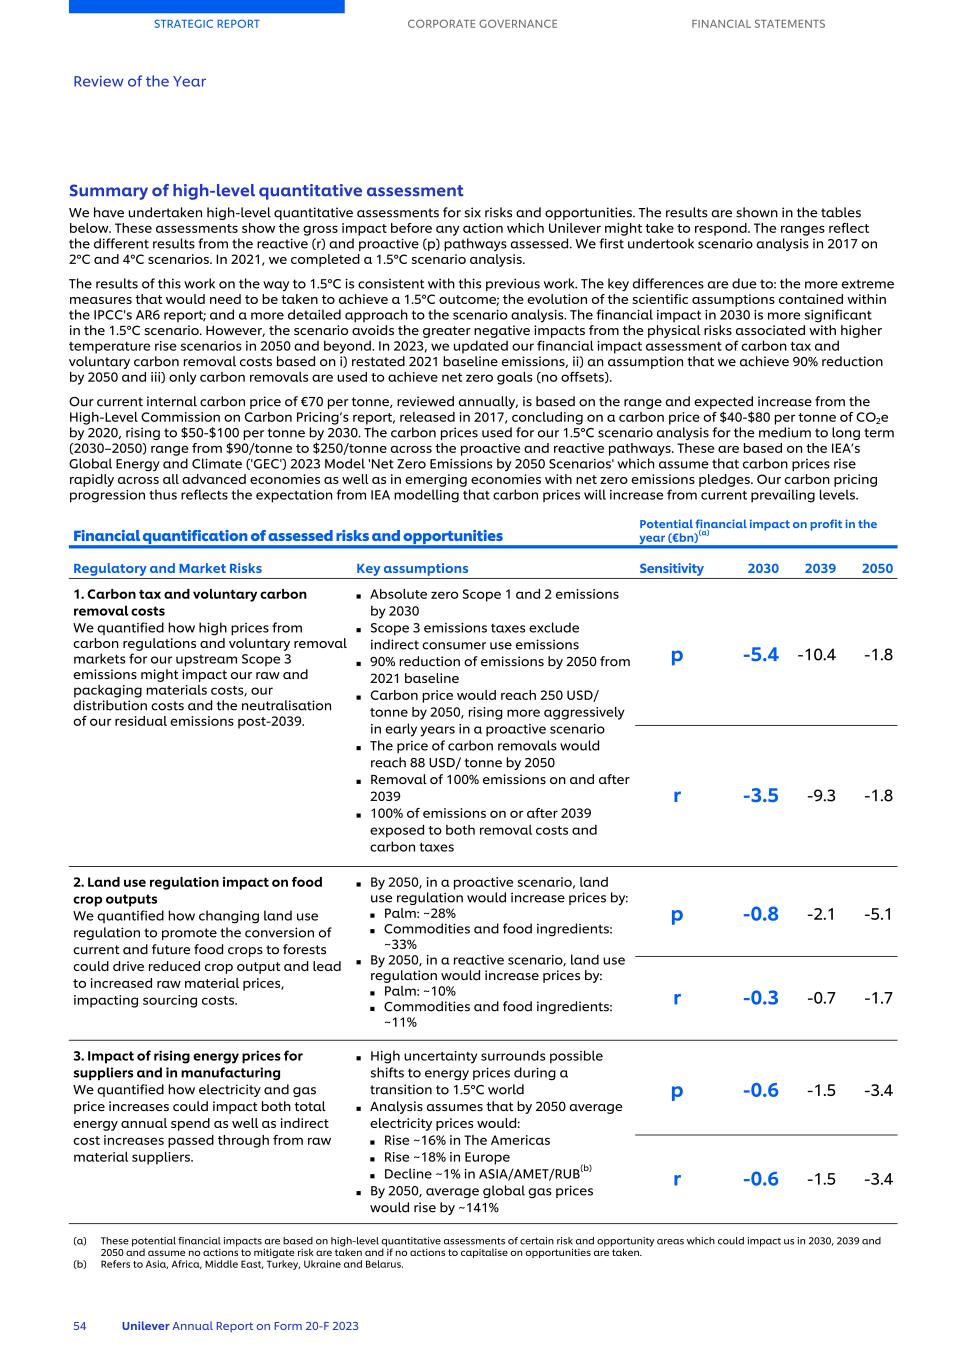
Summary of high-level quantitative assessment We have undertaken high-level quantitative assessments for six risks and opportunities. The results are shown in the tables below. These assessments show the gross impact before any action which Unilever might take to respond. The ranges reflect the different results from the reactive (r) and proactive (p) pathways assessed. We first undertook scenario analysis in 2017 on 2°C and 4°C scenarios. In 2021, we completed a 1.5°C scenario analysis. The results of this work on the way to 1.5°C is consistent with this previous work. The key differences are due to: the more extreme measures that would need to be taken to achieve a 1.5°C outcome; the evolution of the scientific assumptions contained within the IPCC's AR6 report; and a more detailed approach to the scenario analysis. The financial impact in 2030 is more significant in the 1.5°C scenario. However, the scenario avoids the greater negative impacts from the physical risks associated with higher temperature rise scenarios in 2050 and beyond. In 2023, we updated our financial impact assessment of carbon tax and voluntary carbon removal costs based on i) restated 2021 baseline emissions, ii) an assumption that we achieve 90% reduction by 2050 and iii) only carbon removals are used to achieve net zero goals (no offsets). Our current internal carbon price of €70 per tonne, reviewed annually, is based on the range and expected increase from the High-Level Commission on Carbon Pricing’s report, released in 2017, concluding on a carbon price of $40-$80 per tonne of CO2e by 2020, rising to $50-$100 per tonne by 2030. The carbon prices used for our 1.5°C scenario analysis for the medium to long term (2030–2050) range from $90/tonne to $250/tonne across the proactive and reactive pathways. These are based on the IEA’s Global Energy and Climate ('GEC') 2023 Model 'Net Zero Emissions by 2050 Scenarios' which assume that carbon prices rise rapidly across all advanced economies as well as in emerging economies with net zero emissions pledges. Our carbon pricing progression thus reflects the expectation from IEA modelling that carbon prices will increase from current prevailing levels. Regulatory and Market Risks Key assumptions Sensitivity 2030 2039 2050 1. Carbon tax and voluntary carbon removal costs We quantified how high prices from carbon regulations and voluntary removal markets for our upstream Scope 3 emissions might impact our raw and packaging materials costs, our distribution costs and the neutralisation of our residual emissions post-2039. ■ Absolute zero Scope 1 and 2 emissions by 2030 ■ Scope 3 emissions taxes exclude indirect consumer use emissions ■ 90% reduction of emissions by 2050 from 2021 baseline ■ Carbon price would reach 250 USD/ tonne by 2050, rising more aggressively in early years in a proactive scenario ■ The price of carbon removals would reach 88 USD/ tonne by 2050 ■ Removal of 100% emissions on and after 2039 ■ 100% of emissions on or after 2039 exposed to both removal costs and carbon taxes p -5.4 -10.4 -1.8 r -3.5 -9.3 -1.8 2. Land use regulation impact on food crop outputs We quantified how changing land use regulation to promote the conversion of current and future food crops to forests could drive reduced crop output and lead to increased raw material prices, impacting sourcing costs. ■ By 2050, in a proactive scenario, land use regulation would increase prices by: ■ Palm: ~28% ■ Commodities and food ingredients: ~33% ■ By 2050, in a reactive scenario, land use regulation would increase prices by: ■ Palm: ~10% ■ Commodities and food ingredients: ~11% p -0.8 -2.1 -5.1 r -0.3 -0.7 -1.7 3. Impact of rising energy prices for suppliers and in manufacturing We quantified how electricity and gas price increases could impact both total energy annual spend as well as indirect cost increases passed through from raw material suppliers. ■ High uncertainty surrounds possible shifts to energy prices during a transition to 1.5°C world ■ Analysis assumes that by 2050 average electricity prices would: ■ Rise ~16% in The Americas ■ Rise ~18% in Europe ■ Decline ~1% in ASIA/AMET/RUB(b) ■ By 2050, average global gas prices would rise by ~141% p -0.6 -1.5 -3.4 r -0.6 -1.5 -3.4 (a) These potential financial impacts are based on high-level quantitative assessments of certain risk and opportunity areas which could impact us in 2030, 2039 and 2050 and assume no actions to mitigate risk are taken and if no actions to capitalise on opportunities are taken. (b) Refers to Asia, Africa, Middle East, Turkey, Ukraine and Belarus. Financial quantification of assessed risks and opportunities Potential financial impact on profit in the year (€bn)(a) STRATEGIC REPORT CORPORATE GOVERNANCE FINANCIAL STATEMENTS Review of the Year 54 Unilever Annual Report on Form 20-F 2023
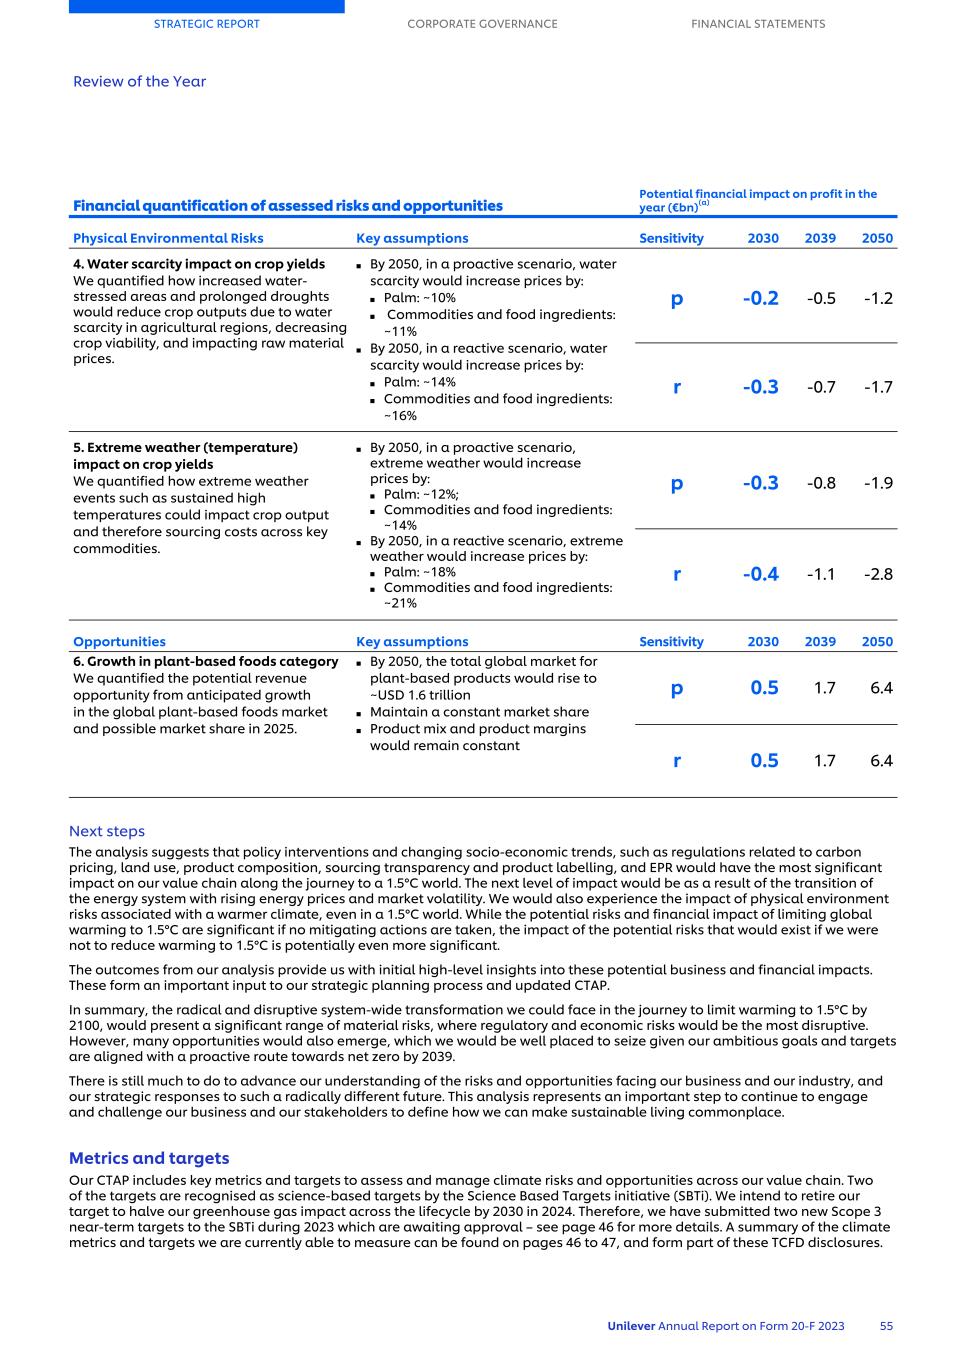
Physical Environmental Risks Key assumptions Sensitivity 2030 2039 2050 4. Water scarcity impact on crop yields We quantified how increased water- stressed areas and prolonged droughts would reduce crop outputs due to water scarcity in agricultural regions, decreasing crop viability, and impacting raw material prices. ■ By 2050, in a proactive scenario, water scarcity would increase prices by: ■ Palm: ~10% ■ Commodities and food ingredients: ~11% ■ By 2050, in a reactive scenario, water scarcity would increase prices by: ■ Palm: ~14% ■ Commodities and food ingredients: ~16% p -0.2 -0.5 -1.2 r -0.3 -0.7 -1.7 5. Extreme weather (temperature) impact on crop yields We quantified how extreme weather events such as sustained high temperatures could impact crop output and therefore sourcing costs across key commodities. ■ By 2050, in a proactive scenario, extreme weather would increase prices by: ■ Palm: ~12%; ■ Commodities and food ingredients: ~14% ■ By 2050, in a reactive scenario, extreme weather would increase prices by: ■ Palm: ~18% ■ Commodities and food ingredients: ~21% p -0.3 -0.8 -1.9 r -0.4 -1.1 -2.8 Opportunities Key assumptions Sensitivity 2030 2039 2050 6. Growth in plant-based foods category We quantified the potential revenue opportunity from anticipated growth in the global plant-based foods market and possible market share in 2025. ■ By 2050, the total global market for plant-based products would rise to ~USD 1.6 trillion ■ Maintain a constant market share ■ Product mix and product margins would remain constant p 0.5 1.7 6.4 r 0.5 1.7 6.4 Financial quantification of assessed risks and opportunities Potential financial impact on profit in the year (€bn)(a) Next steps The analysis suggests that policy interventions and changing socio-economic trends, such as regulations related to carbon pricing, land use, product composition, sourcing transparency and product labelling, and EPR would have the most significant impact on our value chain along the journey to a 1.5°C world. The next level of impact would be as a result of the transition of the energy system with rising energy prices and market volatility. We would also experience the impact of physical environment risks associated with a warmer climate, even in a 1.5°C world. While the potential risks and financial impact of limiting global warming to 1.5°C are significant if no mitigating actions are taken, the impact of the potential risks that would exist if we were not to reduce warming to 1.5°C is potentially even more significant. The outcomes from our analysis provide us with initial high-level insights into these potential business and financial impacts. These form an important input to our strategic planning process and updated CTAP. In summary, the radical and disruptive system-wide transformation we could face in the journey to limit warming to 1.5°C by 2100, would present a significant range of material risks, where regulatory and economic risks would be the most disruptive. However, many opportunities would also emerge, which we would be well placed to seize given our ambitious goals and targets are aligned with a proactive route towards net zero by 2039. There is still much to do to advance our understanding of the risks and opportunities facing our business and our industry, and our strategic responses to such a radically different future. This analysis represents an important step to continue to engage and challenge our business and our stakeholders to define how we can make sustainable living commonplace. Metrics and targets Our CTAP includes key metrics and targets to assess and manage climate risks and opportunities across our value chain. Two of the targets are recognised as science-based targets by the Science Based Targets initiative (SBTi). We intend to retire our target to halve our greenhouse gas impact across the lifecycle by 2030 in 2024. Therefore, we have submitted two new Scope 3 near-term targets to the SBTi during 2023 which are awaiting approval – see page 46 for more details. A summary of the climate metrics and targets we are currently able to measure can be found on pages 46 to 47, and form part of these TCFD disclosures. STRATEGIC REPORT CORPORATE GOVERNANCE FINANCIAL STATEMENTS Review of the Year Unilever Annual Report on Form 20-F 2023 55

Unilever Group performance Unilever 2023 2022 2021 Turnover growth (0.8) % 14.5 % 3.4 % Underlying sales growth* 7.0 % 9.0 % 4.5 % Underlying volume growth* 0.2 % (2.1) % 1.6 % Operating margin 16.4 % 17.9 % 16.6 % Underlying operating margin* 16.7 % 16.1 % 18.4 % Cash flow from operating activities €11.6bn €10.1bn €10.3bn Free cash flow* €7.1bn €5.2bn €6.4bn Net cash flow (used in)/from investing activities €(2.3)bn €2.5bn €(3.2)bn Net cash flow (used in)/from financing activities €(7.2)bn €(8.9)bn €(7.1)bn Business Group performance Beauty & Wellbeing 2023 2022 2021 Turnover €12.5bn €12.3bn €10.1bn Turnover growth 1.8 % 20.8 % 11.6 % Underlying sales growth* 8.3 % 7.8 % 8.5 % Operating margin 17.7 % 17.6 % 21.1 % Underlying operating margin* 18.7 % 18.7 % 22.1 % Personal Care 2023 2022 2021 Turnover €13.8bn €13.6bn €11.7bn Turnover growth 1.4 % 15.9 % (2.3) % Underlying sales growth* 8.9 % 7.9 % 0.3 % Operating margin 21.4 % 16.6 % 19.9 % Underlying operating margin* 20.2 % 19.6 % 21.3 % STRATEGIC REPORT CORPORATE GOVERNANCE FINANCIAL STATEMENTS Our Performance Financial performance 56 Unilever Annual Report on Form 20-F 2023
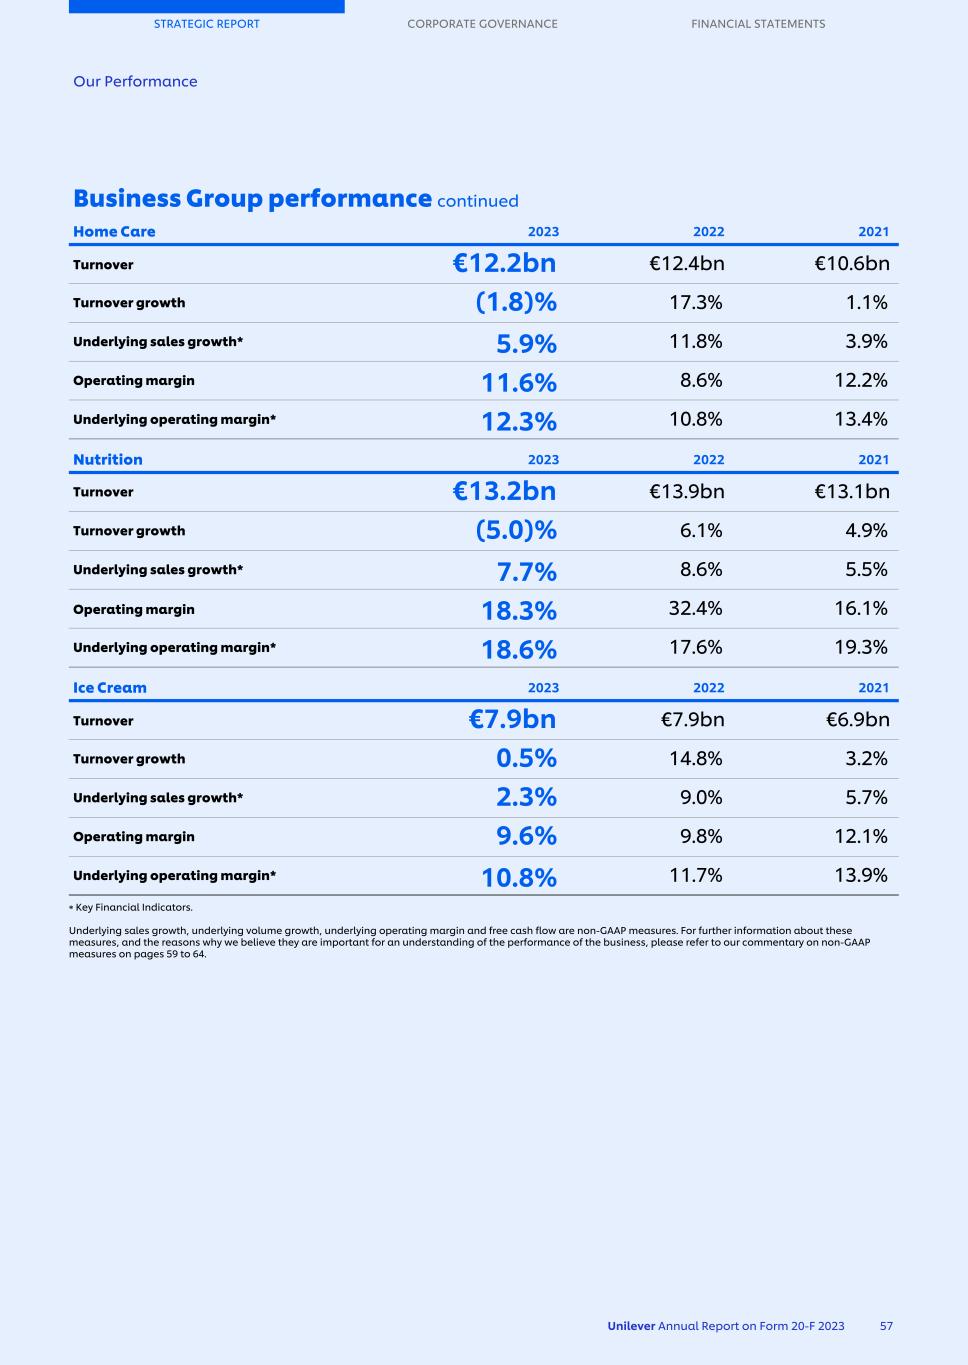
Business Group performance continued Home Care 2023 2022 2021 Turnover €12.2bn €12.4bn €10.6bn Turnover growth (1.8) % 17.3 % 1.1 % Underlying sales growth* 5.9 % 11.8 % 3.9 % Operating margin 11.6 % 8.6 % 12.2 % Underlying operating margin* 12.3 % 10.8 % 13.4 % Nutrition 2023 2022 2021 Turnover €13.2bn €13.9bn €13.1bn Turnover growth (5.0) % 6.1 % 4.9 % Underlying sales growth* 7.7 % 8.6 % 5.5 % Operating margin 18.3 % 32.4 % 16.1 % Underlying operating margin* 18.6 % 17.6 % 19.3 % Ice Cream 2023 2022 2021 Turnover €7.9bn €7.9bn €6.9bn Turnover growth 0.5 % 14.8 % 3.2 % Underlying sales growth* 2.3 % 9.0 % 5.7 % Operating margin 9.6 % 9.8 % 12.1 % Underlying operating margin* 10.8 % 11.7 % 13.9 % ∗ Key Financial Indicators. Underlying sales growth, underlying volume growth, underlying operating margin and free cash flow are non-GAAP measures. For further information about these measures, and the reasons why we believe they are important for an understanding of the performance of the business, please refer to our commentary on non-GAAP measures on pages 59 to 64. STRATEGIC REPORT CORPORATE GOVERNANCE FINANCIAL STATEMENTS Our Performance Unilever Annual Report on Form 20-F 2023 57
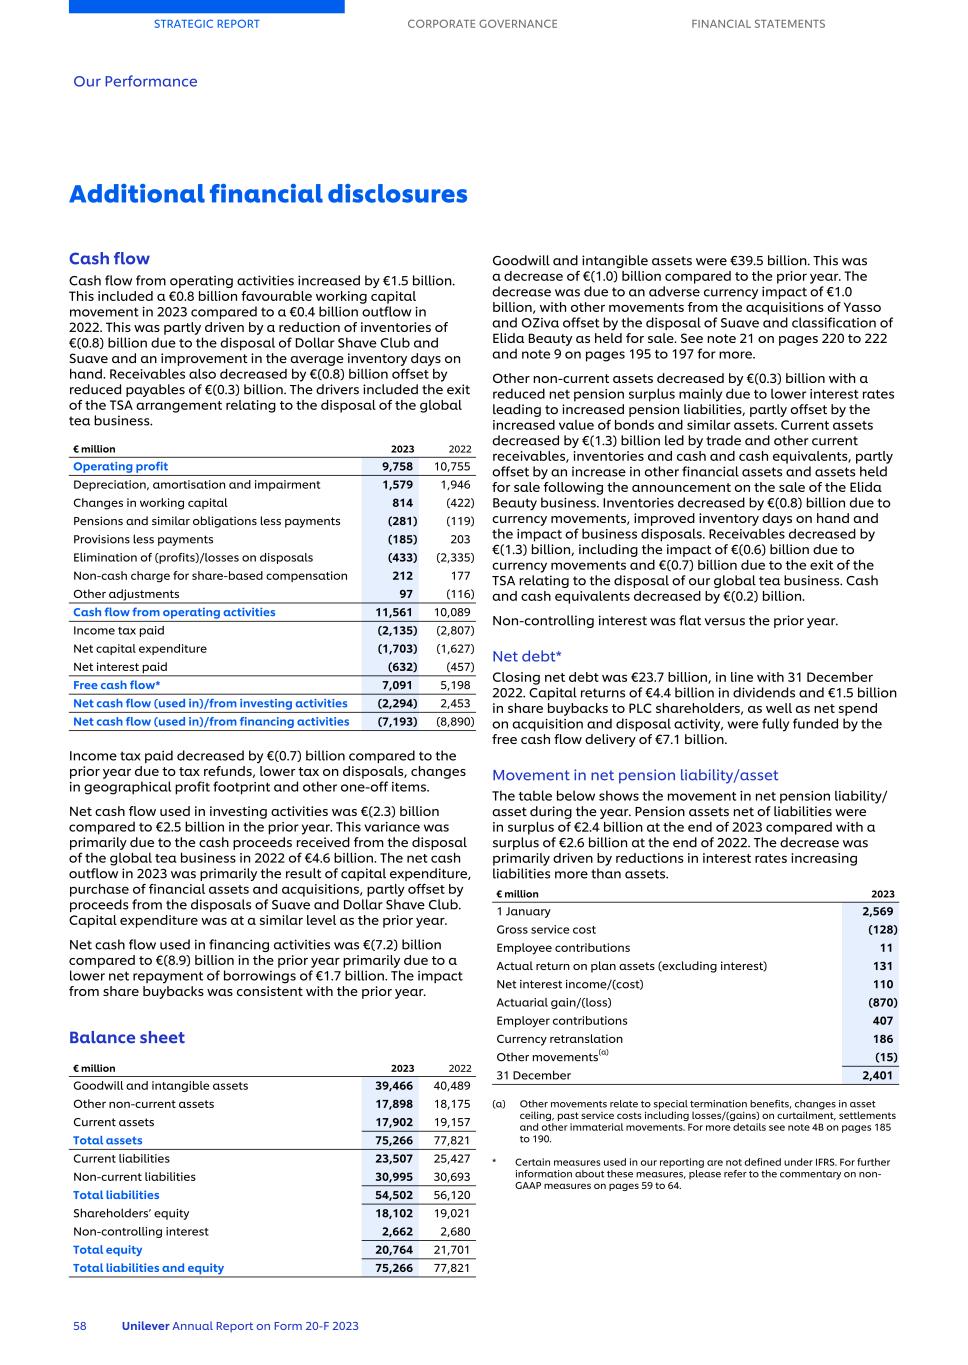
Additional financial disclosures Cash flow Cash flow from operating activities increased by €1.5 billion. This included a €0.8 billion favourable working capital movement in 2023 compared to a €0.4 billion outflow in 2022. This was partly driven by a reduction of inventories of €(0.8) billion due to the disposal of Dollar Shave Club and Suave and an improvement in the average inventory days on hand. Receivables also decreased by €(0.8) billion offset by reduced payables of €(0.3) billion. The drivers included the exit of the TSA arrangement relating to the disposal of the global tea business. € million 2023 2022 Operating profit 9,758 10,755 Depreciation, amortisation and impairment 1,579 1,946 Changes in working capital 814 (422) Pensions and similar obligations less payments (281) (119) Provisions less payments (185) 203 Elimination of (profits)/losses on disposals (433) (2,335) Non-cash charge for share-based compensation 212 177 Other adjustments 97 (116) Cash flow from operating activities 11,561 10,089 Income tax paid (2,135) (2,807) Net capital expenditure (1,703) (1,627) Net interest paid (632) (457) Free cash flow* 7,091 5,198 Net cash flow (used in)/from investing activities (2,294) 2,453 Net cash flow (used in)/from financing activities (7,193) (8,890) Income tax paid decreased by €(0.7) billion compared to the prior year due to tax refunds, lower tax on disposals, changes in geographical profit footprint and other one-off items. Net cash flow used in investing activities was €(2.3) billion compared to €2.5 billion in the prior year. This variance was primarily due to the cash proceeds received from the disposal of the global tea business in 2022 of €4.6 billion. The net cash outflow in 2023 was primarily the result of capital expenditure, purchase of financial assets and acquisitions, partly offset by proceeds from the disposals of Suave and Dollar Shave Club. Capital expenditure was at a similar level as the prior year. Net cash flow used in financing activities was €(7.2) billion compared to €(8.9) billion in the prior year primarily due to a lower net repayment of borrowings of €1.7 billion. The impact from share buybacks was consistent with the prior year. Balance sheet € million 2023 2022 Goodwill and intangible assets 39,466 40,489 Other non-current assets 17,898 18,175 Current assets 17,902 19,157 Total assets 75,266 77,821 Current liabilities 23,507 25,427 Non-current liabilities 30,995 30,693 Total liabilities 54,502 56,120 Shareholders’ equity 18,102 19,021 Non-controlling interest 2,662 2,680 Total equity 20,764 21,701 Total liabilities and equity 75,266 77,821 Goodwill and intangible assets were €39.5 billion. This was a decrease of €(1.0) billion compared to the prior year. The decrease was due to an adverse currency impact of €1.0 billion, with other movements from the acquisitions of Yasso and OZiva offset by the disposal of Suave and classification of Elida Beauty as held for sale. See note 21 on pages 220 to 222 and note 9 on pages 195 to 197 for more. Other non-current assets decreased by €(0.3) billion with a reduced net pension surplus mainly due to lower interest rates leading to increased pension liabilities, partly offset by the increased value of bonds and similar assets. Current assets decreased by €(1.3) billion led by trade and other current receivables, inventories and cash and cash equivalents, partly offset by an increase in other financial assets and assets held for sale following the announcement on the sale of the Elida Beauty business. Inventories decreased by €(0.8) billion due to currency movements, improved inventory days on hand and the impact of business disposals. Receivables decreased by €(1.3) billion, including the impact of €(0.6) billion due to currency movements and €(0.7) billion due to the exit of the TSA relating to the disposal of our global tea business. Cash and cash equivalents decreased by €(0.2) billion. Non-controlling interest was flat versus the prior year. Net debt* Closing net debt was €23.7 billion, in line with 31 December 2022. Capital returns of €4.4 billion in dividends and €1.5 billion in share buybacks to PLC shareholders, as well as net spend on acquisition and disposal activity, were fully funded by the free cash flow delivery of €7.1 billion. Movement in net pension liability/asset The table below shows the movement in net pension liability/ asset during the year. Pension assets net of liabilities were in surplus of €2.4 billion at the end of 2023 compared with a surplus of €2.6 billion at the end of 2022. The decrease was primarily driven by reductions in interest rates increasing liabilities more than assets. € million 2023 1 January 2,569 Gross service cost (128) Employee contributions 11 Actual return on plan assets (excluding interest) 131 Net interest income/(cost) 110 Actuarial gain/(loss) (870) Employer contributions 407 Currency retranslation 186 Other movements(a) (15) 31 December 2,401 (a) Other movements relate to special termination benefits, changes in asset ceiling, past service costs including losses/(gains) on curtailment, settlements and other immaterial movements. For more details see note 4B on pages 185 to 190. * Certain measures used in our reporting are not defined under IFRS. For further information about these measures, please refer to the commentary on non- GAAP measures on pages 59 to 64. STRATEGIC REPORT CORPORATE GOVERNANCE FINANCIAL STATEMENTS Our Performance 58 Unilever Annual Report on Form 20-F 2023
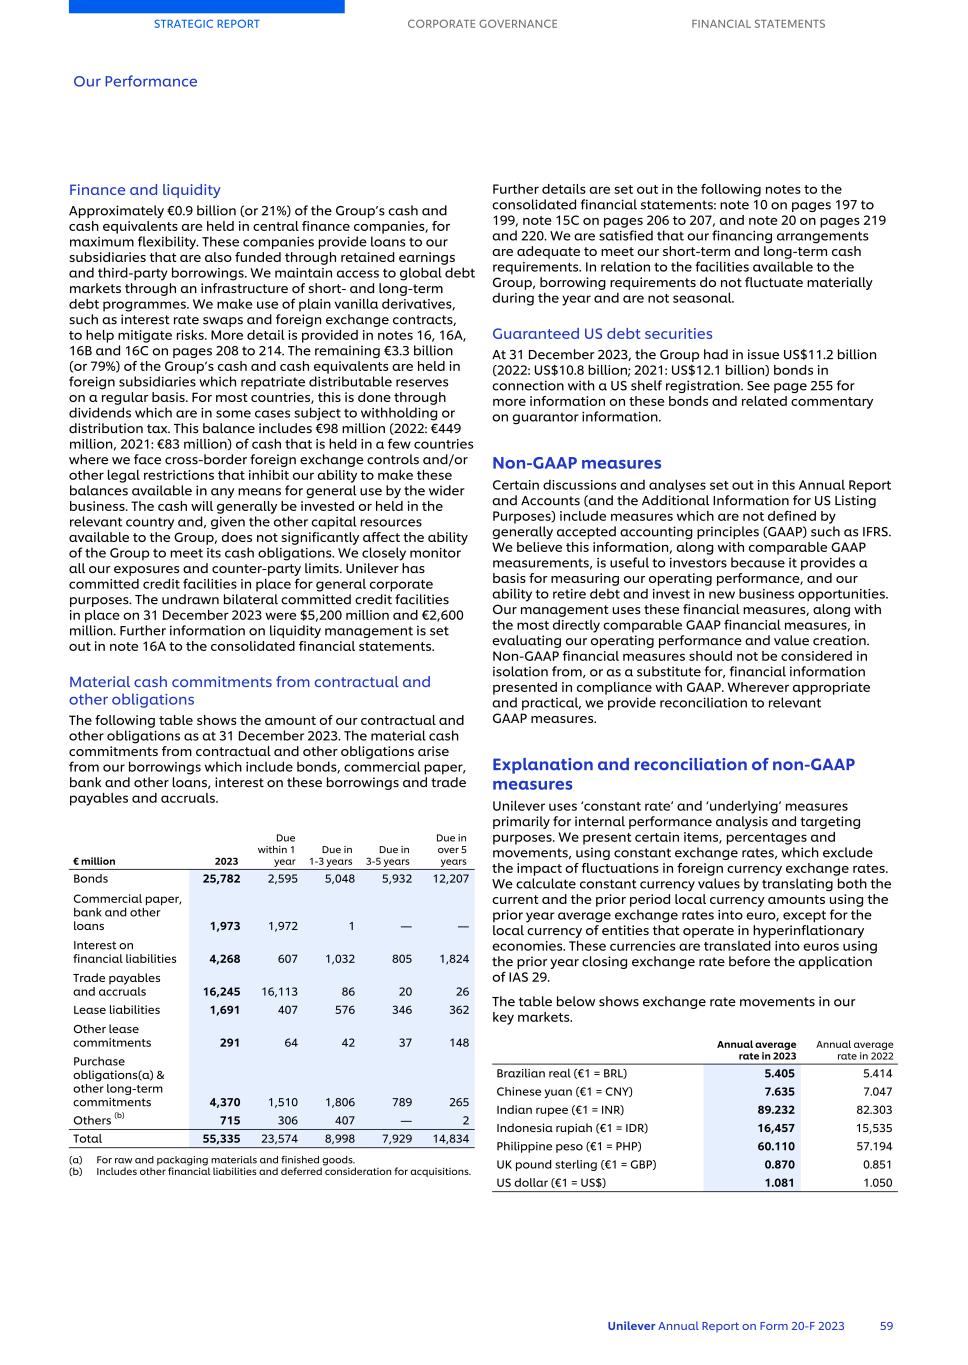
Finance and liquidity Approximately €0.9 billion (or 21%) of the Group’s cash and cash equivalents are held in central finance companies, for maximum flexibility. These companies provide loans to our subsidiaries that are also funded through retained earnings and third-party borrowings. We maintain access to global debt markets through an infrastructure of short- and long-term debt programmes. We make use of plain vanilla derivatives, such as interest rate swaps and foreign exchange contracts, to help mitigate risks. More detail is provided in notes 16, 16A, 16B and 16C on pages 208 to 214. The remaining €3.3 billion (or 79%) of the Group’s cash and cash equivalents are held in foreign subsidiaries which repatriate distributable reserves on a regular basis. For most countries, this is done through dividends which are in some cases subject to withholding or distribution tax. This balance includes €98 million (2022: €449 million, 2021: €83 million) of cash that is held in a few countries where we face cross-border foreign exchange controls and/or other legal restrictions that inhibit our ability to make these balances available in any means for general use by the wider business. The cash will generally be invested or held in the relevant country and, given the other capital resources available to the Group, does not significantly affect the ability of the Group to meet its cash obligations. We closely monitor all our exposures and counter-party limits. Unilever has committed credit facilities in place for general corporate purposes. The undrawn bilateral committed credit facilities in place on 31 December 2023 were $5,200 million and €2,600 million. Further information on liquidity management is set out in note 16A to the consolidated financial statements. Material cash commitments from contractual and other obligations The following table shows the amount of our contractual and other obligations as at 31 December 2023. The material cash commitments from contractual and other obligations arise from our borrowings which include bonds, commercial paper, bank and other loans, interest on these borrowings and trade payables and accruals. € million 2023 Due within 1 year Due in 1-3 years Due in 3-5 years Due in over 5 years Bonds 25,782 2,595 5,048 5,932 12,207 Commercial paper, bank and other loans 1,973 1,972 1 — — Interest on financial liabilities 4,268 607 1,032 805 1,824 Trade payables and accruals 16,245 16,113 86 20 26 Lease liabilities 1,691 407 576 346 362 Other lease commitments 291 64 42 37 148 Purchase obligations(a) & other long-term commitments 4,370 1,510 1,806 789 265 Others (b) 715 306 407 — 2 Total 55,335 23,574 8,998 7,929 14,834 (a) For raw and packaging materials and finished goods. (b) Includes other financial liabilities and deferred consideration for acquisitions. Further details are set out in the following notes to the consolidated financial statements: note 10 on pages 197 to 199, note 15C on pages 206 to 207, and note 20 on pages 219 and 220. We are satisfied that our financing arrangements are adequate to meet our short-term and long-term cash requirements. In relation to the facilities available to the Group, borrowing requirements do not fluctuate materially during the year and are not seasonal. Guaranteed US debt securities At 31 December 2023, the Group had in issue US$11.2 billion (2022: US$10.8 billion; 2021: US$12.1 billion) bonds in connection with a US shelf registration. See page 255 for more information on these bonds and related commentary on guarantor information. Non-GAAP measures Certain discussions and analyses set out in this Annual Report and Accounts (and the Additional Information for US Listing Purposes) include measures which are not defined by generally accepted accounting principles (GAAP) such as IFRS. We believe this information, along with comparable GAAP measurements, is useful to investors because it provides a basis for measuring our operating performance, and our ability to retire debt and invest in new business opportunities. Our management uses these financial measures, along with the most directly comparable GAAP financial measures, in evaluating our operating performance and value creation. Non-GAAP financial measures should not be considered in isolation from, or as a substitute for, financial information presented in compliance with GAAP. Wherever appropriate and practical, we provide reconciliation to relevant GAAP measures. Explanation and reconciliation of non-GAAP measures Unilever uses ‘constant rate’ and ‘underlying’ measures primarily for internal performance analysis and targeting purposes. We present certain items, percentages and movements, using constant exchange rates, which exclude the impact of fluctuations in foreign currency exchange rates. We calculate constant currency values by translating both the current and the prior period local currency amounts using the prior year average exchange rates into euro, except for the local currency of entities that operate in hyperinflationary economies. These currencies are translated into euros using the prior year closing exchange rate before the application of IAS 29. The table below shows exchange rate movements in our key markets. Annual average rate in 2023 Annual average rate in 2022 Brazilian real (€1 = BRL) 5.405 5.414 Chinese yuan (€1 = CNY) 7.635 7.047 Indian rupee (€1 = INR) 89.232 82.303 Indonesia rupiah (€1 = IDR) 16,457 15,535 Philippine peso (€1 = PHP) 60.110 57.194 UK pound sterling (€1 = GBP) 0.870 0.851 US dollar (€1 = US$) 1.081 1.050 STRATEGIC REPORT CORPORATE GOVERNANCE FINANCIAL STATEMENTS Our Performance Unilever Annual Report on Form 20-F 2023 59
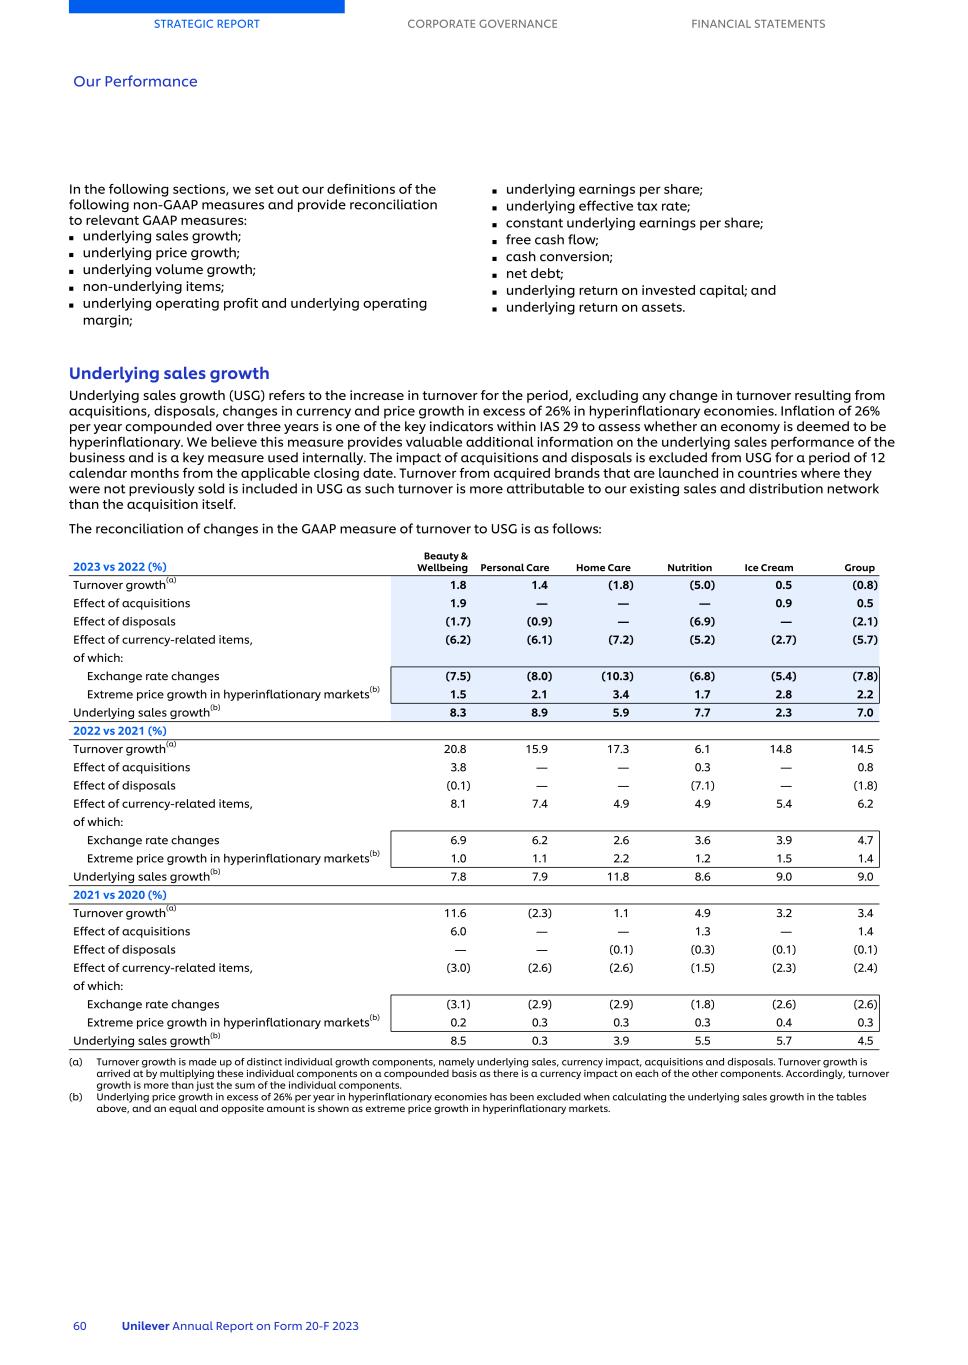
In the following sections, we set out our definitions of the following non-GAAP measures and provide reconciliation to relevant GAAP measures: ■ underlying sales growth; ■ underlying price growth; ■ underlying volume growth; ■ non-underlying items; ■ underlying operating profit and underlying operating margin; ■ underlying earnings per share; ■ underlying effective tax rate; ■ constant underlying earnings per share; ■ free cash flow; ■ cash conversion; ■ net debt; ■ underlying return on invested capital; and ■ underlying return on assets. Underlying sales growth Underlying sales growth (USG) refers to the increase in turnover for the period, excluding any change in turnover resulting from acquisitions, disposals, changes in currency and price growth in excess of 26% in hyperinflationary economies. Inflation of 26% per year compounded over three years is one of the key indicators within IAS 29 to assess whether an economy is deemed to be hyperinflationary. We believe this measure provides valuable additional information on the underlying sales performance of the business and is a key measure used internally. The impact of acquisitions and disposals is excluded from USG for a period of 12 calendar months from the applicable closing date. Turnover from acquired brands that are launched in countries where they were not previously sold is included in USG as such turnover is more attributable to our existing sales and distribution network than the acquisition itself. The reconciliation of changes in the GAAP measure of turnover to USG is as follows: 2023 vs 2022 (%) Beauty & Wellbeing Personal Care Home Care Nutrition Ice Cream Group Turnover growth(a) 1.8 1.4 (1.8) (5.0) 0.5 (0.8) Effect of acquisitions 1.9 — — — 0.9 0.5 Effect of disposals (1.7) (0.9) — (6.9) — (2.1) Effect of currency-related items, (6.2) (6.1) (7.2) (5.2) (2.7) (5.7) of which: Exchange rate changes (7.5) (8.0) (10.3) (6.8) (5.4) (7.8) Extreme price growth in hyperinflationary markets(b) 1.5 2.1 3.4 1.7 2.8 2.2 Underlying sales growth(b) 8.3 8.9 5.9 7.7 2.3 7.0 2022 vs 2021 (%) Turnover growth(a) 20.8 15.9 17.3 6.1 14.8 14.5 Effect of acquisitions 3.8 — — 0.3 — 0.8 Effect of disposals (0.1) — — (7.1) — (1.8) Effect of currency-related items, 8.1 7.4 4.9 4.9 5.4 6.2 of which: Exchange rate changes 6.9 6.2 2.6 3.6 3.9 4.7 Extreme price growth in hyperinflationary markets(b) 1.0 1.1 2.2 1.2 1.5 1.4 Underlying sales growth(b) 7.8 7.9 11.8 8.6 9.0 9.0 2021 vs 2020 (%) Turnover growth(a) 11.6 (2.3) 1.1 4.9 3.2 3.4 Effect of acquisitions 6.0 — — 1.3 — 1.4 Effect of disposals — — (0.1) (0.3) (0.1) (0.1) Effect of currency-related items, (3.0) (2.6) (2.6) (1.5) (2.3) (2.4) of which: Exchange rate changes (3.1) (2.9) (2.9) (1.8) (2.6) (2.6) Extreme price growth in hyperinflationary markets(b) 0.2 0.3 0.3 0.3 0.4 0.3 Underlying sales growth(b) 8.5 0.3 3.9 5.5 5.7 4.5 (a) Turnover growth is made up of distinct individual growth components, namely underlying sales, currency impact, acquisitions and disposals. Turnover growth is arrived at by multiplying these individual components on a compounded basis as there is a currency impact on each of the other components. Accordingly, turnover growth is more than just the sum of the individual components. (b) Underlying price growth in excess of 26% per year in hyperinflationary economies has been excluded when calculating the underlying sales growth in the tables above, and an equal and opposite amount is shown as extreme price growth in hyperinflationary markets. STRATEGIC REPORT CORPORATE GOVERNANCE FINANCIAL STATEMENTS Our Performance 60 Unilever Annual Report on Form 20-F 2023
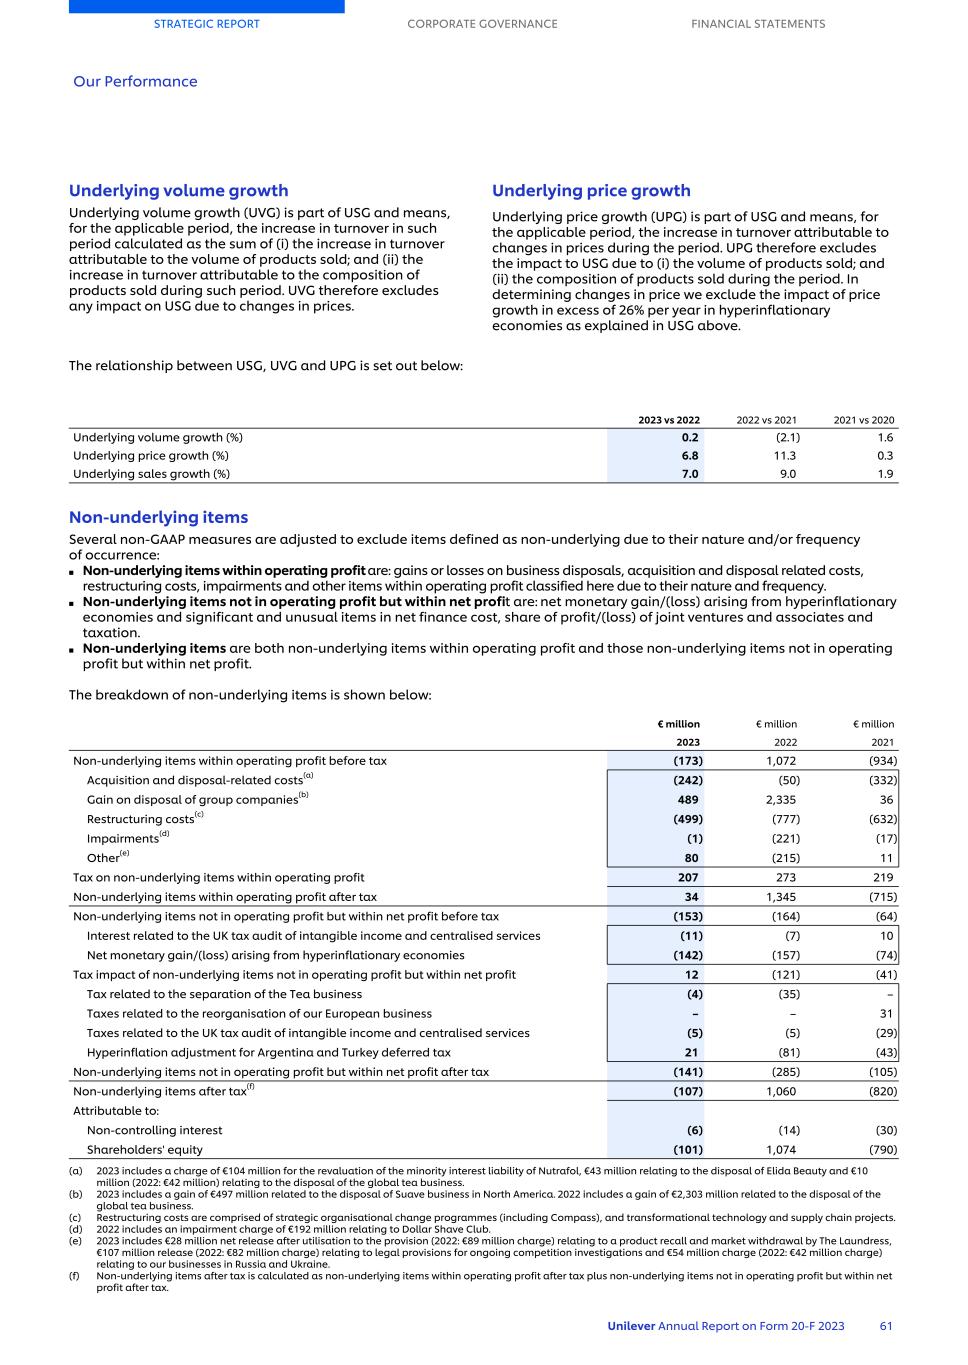
Underlying volume growth Underlying volume growth (UVG) is part of USG and means, for the applicable period, the increase in turnover in such period calculated as the sum of (i) the increase in turnover attributable to the volume of products sold; and (ii) the increase in turnover attributable to the composition of products sold during such period. UVG therefore excludes any impact on USG due to changes in prices. Underlying price growth Underlying price growth (UPG) is part of USG and means, for the applicable period, the increase in turnover attributable to changes in prices during the period. UPG therefore excludes the impact to USG due to (i) the volume of products sold; and (ii) the composition of products sold during the period. In determining changes in price we exclude the impact of price growth in excess of 26% per year in hyperinflationary economies as explained in USG above. The relationship between USG, UVG and UPG is set out below: 2023 vs 2022 2022 vs 2021 2021 vs 2020 Underlying volume growth (%) 0.2 (2.1) 1.6 Underlying price growth (%) 6.8 11.3 0.3 Underlying sales growth (%) 7.0 9.0 1.9 Non-underlying items Several non-GAAP measures are adjusted to exclude items defined as non-underlying due to their nature and/or frequency of occurrence: ■ Non-underlying items within operating profit are: gains or losses on business disposals, acquisition and disposal related costs, restructuring costs, impairments and other items within operating profit classified here due to their nature and frequency. ■ Non-underlying items not in operating profit but within net profit are: net monetary gain/(loss) arising from hyperinflationary economies and significant and unusual items in net finance cost, share of profit/(loss) of joint ventures and associates and taxation. ■ Non-underlying items are both non-underlying items within operating profit and those non-underlying items not in operating profit but within net profit. The breakdown of non-underlying items is shown below: € million € million € million 2023 2022 2021 Non-underlying items within operating profit before tax (173) 1,072 (934) Acquisition and disposal-related costs(a) (242) (50) (332) Gain on disposal of group companies(b) 489 2,335 36 Restructuring costs(c) (499) (777) (632) Impairments(d) (1) (221) (17) Other(e) 80 (215) 11 Tax on non-underlying items within operating profit 207 273 219 Non-underlying items within operating profit after tax 34 1,345 (715) Non-underlying items not in operating profit but within net profit before tax (153) (164) (64) Interest related to the UK tax audit of intangible income and centralised services (11) (7) 10 Net monetary gain/(loss) arising from hyperinflationary economies (142) (157) (74) Tax impact of non-underlying items not in operating profit but within net profit 12 (121) (41) Tax related to the separation of the Tea business (4) (35) – Taxes related to the reorganisation of our European business – – 31 Taxes related to the UK tax audit of intangible income and centralised services (5) (5) (29) Hyperinflation adjustment for Argentina and Turkey deferred tax 21 (81) (43) Non-underlying items not in operating profit but within net profit after tax (141) (285) (105) Non-underlying items after tax(f) (107) 1,060 (820) Attributable to: Non-controlling interest (6) (14) (30) Shareholders' equity (101) 1,074 (790) (a) 2023 includes a charge of €104 million for the revaluation of the minority interest liability of Nutrafol, €43 million relating to the disposal of Elida Beauty and €10 million (2022: €42 million) relating to the disposal of the global tea business. (b) 2023 includes a gain of €497 million related to the disposal of Suave business in North America. 2022 includes a gain of €2,303 million related to the disposal of the global tea business. (c) Restructuring costs are comprised of strategic organisational change programmes (including Compass), and transformational technology and supply chain projects. (d) 2022 includes an impairment charge of €192 million relating to Dollar Shave Club. (e) 2023 includes €28 million net release after utilisation to the provision (2022: €89 million charge) relating to a product recall and market withdrawal by The Laundress, €107 million release (2022: €82 million charge) relating to legal provisions for ongoing competition investigations and €54 million charge (2022: €42 million charge) relating to our businesses in Russia and Ukraine. (f) Non-underlying items after tax is calculated as non-underlying items within operating profit after tax plus non-underlying items not in operating profit but within net profit after tax. STRATEGIC REPORT CORPORATE GOVERNANCE FINANCIAL STATEMENTS Our Performance Unilever Annual Report on Form 20-F 2023 61
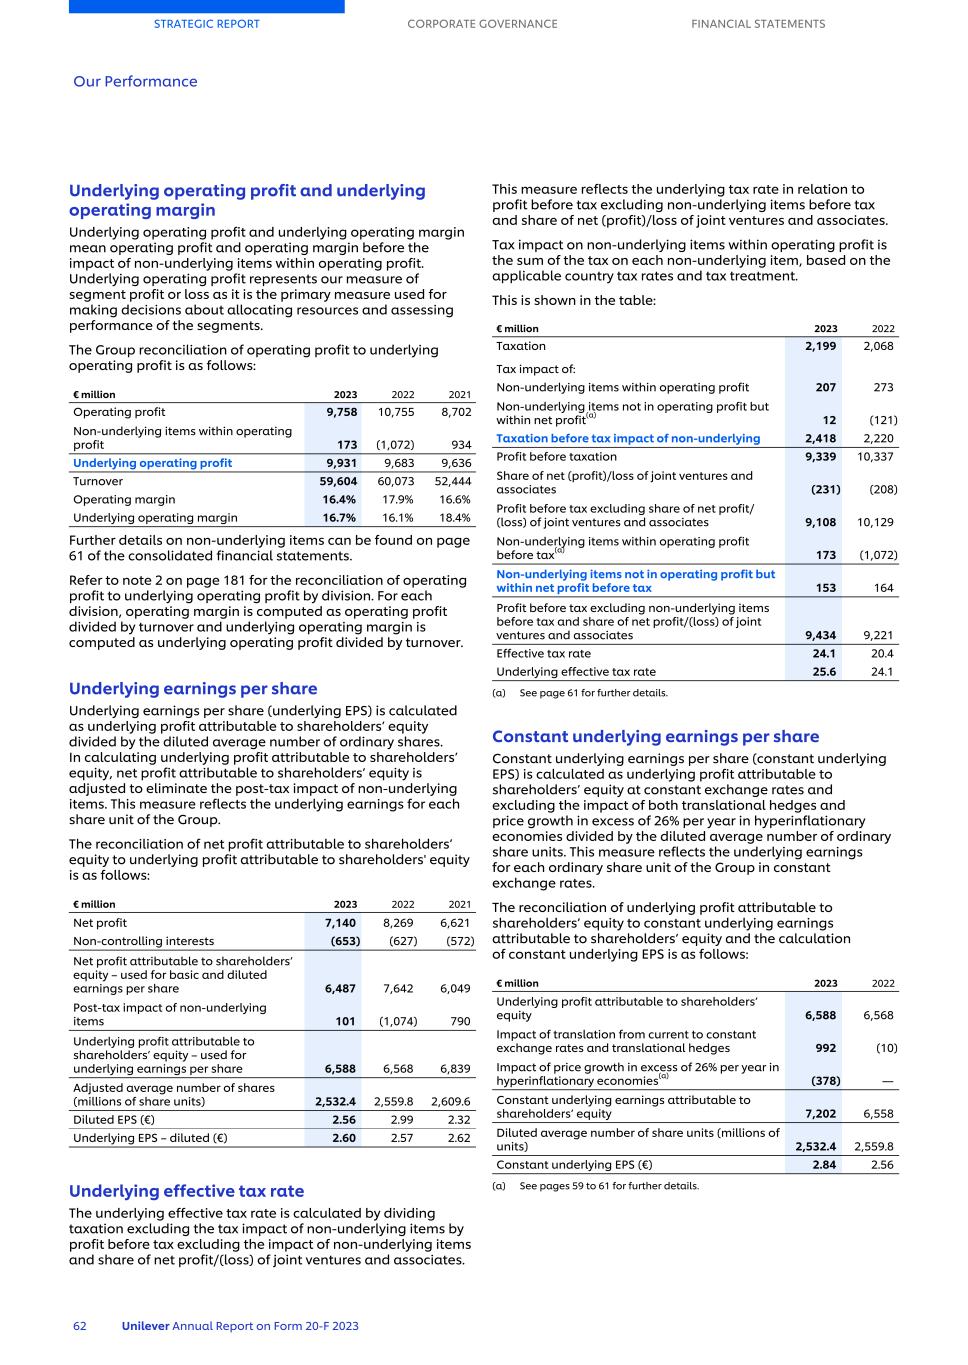
Underlying operating profit and underlying operating margin Underlying operating profit and underlying operating margin mean operating profit and operating margin before the impact of non-underlying items within operating profit. Underlying operating profit represents our measure of segment profit or loss as it is the primary measure used for making decisions about allocating resources and assessing performance of the segments. The Group reconciliation of operating profit to underlying operating profit is as follows: € million 2023 2022 2021 Operating profit 9,758 10,755 8,702 Non-underlying items within operating profit 173 (1,072) 934 Underlying operating profit 9,931 9,683 9,636 Turnover 59,604 60,073 52,444 Operating margin 16.4% 17.9% 16.6% Underlying operating margin 16.7% 16.1% 18.4% Further details on non-underlying items can be found on page 61 of the consolidated financial statements. Refer to note 2 on page 181 for the reconciliation of operating profit to underlying operating profit by division. For each division, operating margin is computed as operating profit divided by turnover and underlying operating margin is computed as underlying operating profit divided by turnover. Underlying earnings per share Underlying earnings per share (underlying EPS) is calculated as underlying profit attributable to shareholders’ equity divided by the diluted average number of ordinary shares. In calculating underlying profit attributable to shareholders’ equity, net profit attributable to shareholders’ equity is adjusted to eliminate the post-tax impact of non-underlying items. This measure reflects the underlying earnings for each share unit of the Group. The reconciliation of net profit attributable to shareholders’ equity to underlying profit attributable to shareholders' equity is as follows: € million 2023 2022 2021 Net profit 7,140 8,269 6,621 Non-controlling interests (653) (627) (572) Net profit attributable to shareholders’ equity – used for basic and diluted earnings per share 6,487 7,642 6,049 Post-tax impact of non-underlying items 101 (1,074) 790 Underlying profit attributable to shareholders’ equity – used for underlying earnings per share 6,588 6,568 6,839 Adjusted average number of shares (millions of share units) 2,532.4 2,559.8 2,609.6 Diluted EPS (€) 2.56 2.99 2.32 Underlying EPS – diluted (€) 2.60 2.57 2.62 Underlying effective tax rate The underlying effective tax rate is calculated by dividing taxation excluding the tax impact of non-underlying items by profit before tax excluding the impact of non-underlying items and share of net profit/(loss) of joint ventures and associates. This measure reflects the underlying tax rate in relation to profit before tax excluding non-underlying items before tax and share of net (profit)/loss of joint ventures and associates. Tax impact on non-underlying items within operating profit is the sum of the tax on each non-underlying item, based on the applicable country tax rates and tax treatment. This is shown in the table: € million 2023 2022 Taxation 2,199 2,068 Tax impact of: Non-underlying items within operating profit 207 273 Non-underlying items not in operating profit but within net profit(a) 12 (121) Taxation before tax impact of non-underlying 2,418 2,220 Profit before taxation 9,339 10,337 Share of net (profit)/loss of joint ventures and associates (231) (208) Profit before tax excluding share of net profit/ (loss) of joint ventures and associates 9,108 10,129 Non-underlying items within operating profit before tax(a) 173 (1,072) Non-underlying items not in operating profit but within net profit before tax 153 164 Profit before tax excluding non-underlying items before tax and share of net profit/(loss) of joint ventures and associates 9,434 9,221 Effective tax rate 24.1 20.4 Underlying effective tax rate 25.6 24.1 (a) See page 61 for further details. Constant underlying earnings per share Constant underlying earnings per share (constant underlying EPS) is calculated as underlying profit attributable to shareholders’ equity at constant exchange rates and excluding the impact of both translational hedges and price growth in excess of 26% per year in hyperinflationary economies divided by the diluted average number of ordinary share units. This measure reflects the underlying earnings for each ordinary share unit of the Group in constant exchange rates. The reconciliation of underlying profit attributable to shareholders’ equity to constant underlying earnings attributable to shareholders’ equity and the calculation of constant underlying EPS is as follows: € million 2023 2022 Underlying profit attributable to shareholders’ equity 6,588 6,568 Impact of translation from current to constant exchange rates and translational hedges 992 (10) Impact of price growth in excess of 26% per year in hyperinflationary economies(a) (378) — Constant underlying earnings attributable to shareholders’ equity 7,202 6,558 Diluted average number of share units (millions of units) 2,532.4 2,559.8 Constant underlying EPS (€) 2.84 2.56 (a) See pages 59 to 61 for further details. STRATEGIC REPORT CORPORATE GOVERNANCE FINANCIAL STATEMENTS Our Performance 62 Unilever Annual Report on Form 20-F 2023
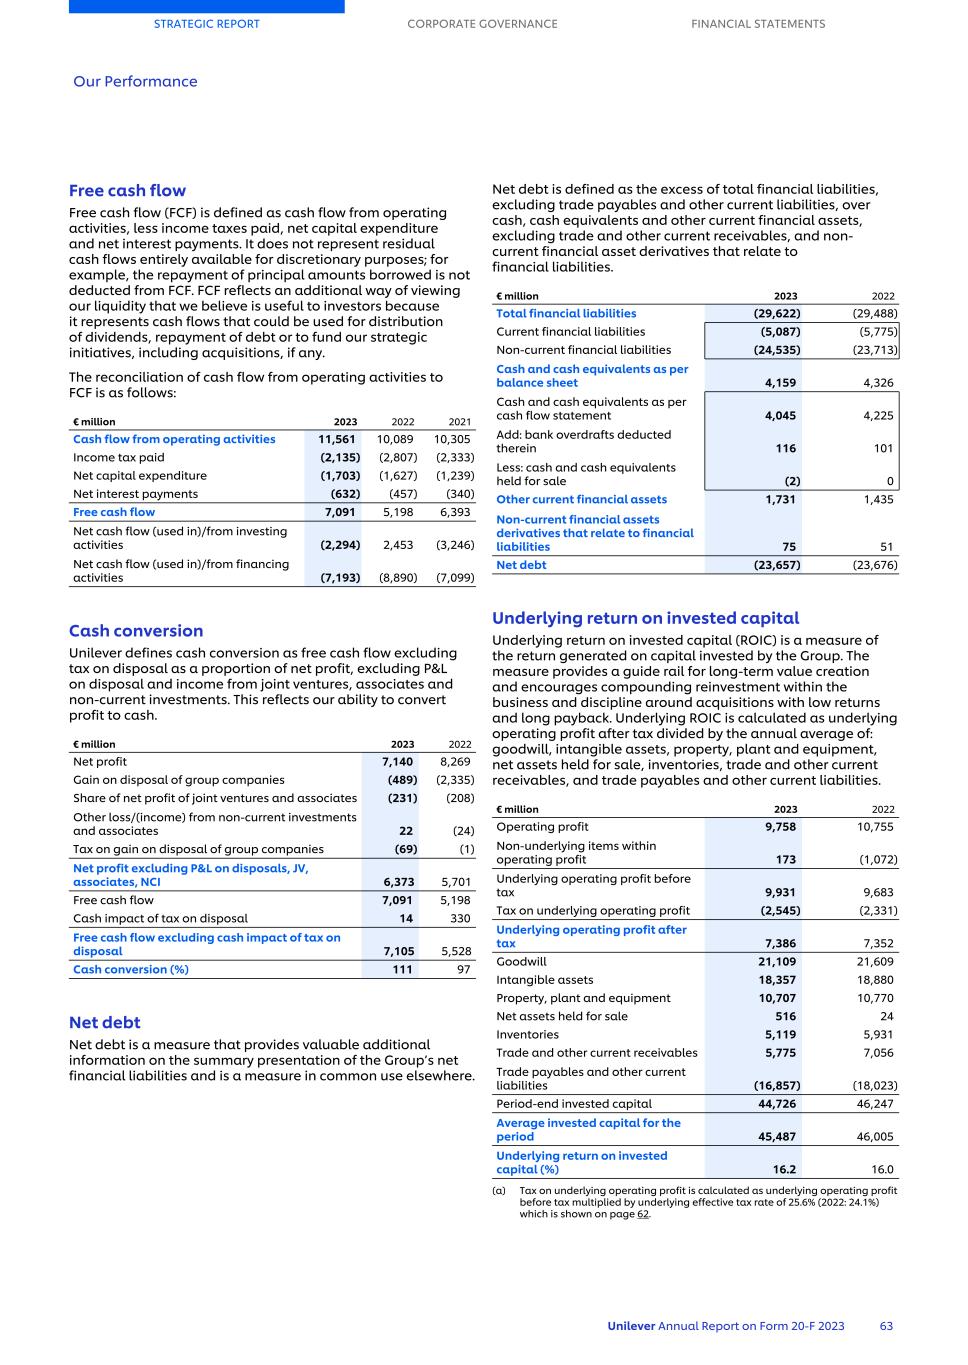
Free cash flow Free cash flow (FCF) is defined as cash flow from operating activities, less income taxes paid, net capital expenditure and net interest payments. It does not represent residual cash flows entirely available for discretionary purposes; for example, the repayment of principal amounts borrowed is not deducted from FCF. FCF reflects an additional way of viewing our liquidity that we believe is useful to investors because it represents cash flows that could be used for distribution of dividends, repayment of debt or to fund our strategic initiatives, including acquisitions, if any. The reconciliation of cash flow from operating activities to FCF is as follows: € million 2023 2022 2021 Cash flow from operating activities 11,561 10,089 10,305 Income tax paid (2,135) (2,807) (2,333) Net capital expenditure (1,703) (1,627) (1,239) Net interest payments (632) (457) (340) Free cash flow 7,091 5,198 6,393 Net cash flow (used in)/from investing activities (2,294) 2,453 (3,246) Net cash flow (used in)/from financing activities (7,193) (8,890) (7,099) Cash conversion Unilever defines cash conversion as free cash flow excluding tax on disposal as a proportion of net profit, excluding P&L on disposal and income from joint ventures, associates and non-current investments. This reflects our ability to convert profit to cash. € million 2023 2022 Net profit 7,140 8,269 Gain on disposal of group companies (489) (2,335) Share of net profit of joint ventures and associates (231) (208) Other loss/(income) from non-current investments and associates 22 (24) Tax on gain on disposal of group companies (69) (1) Net profit excluding P&L on disposals, JV, associates, NCI 6,373 5,701 Free cash flow 7,091 5,198 Cash impact of tax on disposal 14 330 Free cash flow excluding cash impact of tax on disposal 7,105 5,528 Cash conversion (%) 111 97 Net debt Net debt is a measure that provides valuable additional information on the summary presentation of the Group’s net financial liabilities and is a measure in common use elsewhere. Net debt is defined as the excess of total financial liabilities, excluding trade payables and other current liabilities, over cash, cash equivalents and other current financial assets, excluding trade and other current receivables, and non- current financial asset derivatives that relate to financial liabilities. € million 2023 2022 Total financial liabilities (29,622) (29,488) Current financial liabilities (5,087) (5,775) Non-current financial liabilities (24,535) (23,713) Cash and cash equivalents as per balance sheet 4,159 4,326 Cash and cash equivalents as per cash flow statement 4,045 4,225 Add: bank overdrafts deducted therein 116 101 Less: cash and cash equivalents held for sale (2) 0 Other current financial assets 1,731 1,435 Non-current financial assets derivatives that relate to financial liabilities 75 51 Net debt (23,657) (23,676) Underlying return on invested capital Underlying return on invested capital (ROIC) is a measure of the return generated on capital invested by the Group. The measure provides a guide rail for long-term value creation and encourages compounding reinvestment within the business and discipline around acquisitions with low returns and long payback. Underlying ROIC is calculated as underlying operating profit after tax divided by the annual average of: goodwill, intangible assets, property, plant and equipment, net assets held for sale, inventories, trade and other current receivables, and trade payables and other current liabilities. € million 2023 2022 Operating profit 9,758 10,755 Non-underlying items within operating profit 173 (1,072) Underlying operating profit before tax 9,931 9,683 Tax on underlying operating profit (2,545) (2,331) Underlying operating profit after tax 7,386 7,352 Goodwill 21,109 21,609 Intangible assets 18,357 18,880 Property, plant and equipment 10,707 10,770 Net assets held for sale 516 24 Inventories 5,119 5,931 Trade and other current receivables 5,775 7,056 Trade payables and other current liabilities (16,857) (18,023) Period-end invested capital 44,726 46,247 Average invested capital for the period 45,487 46,005 Underlying return on invested capital (%) 16.2 16.0 (a) Tax on underlying operating profit is calculated as underlying operating profit before tax multiplied by underlying effective tax rate of 25.6% (2022: 24.1%) which is shown on page 62. STRATEGIC REPORT CORPORATE GOVERNANCE FINANCIAL STATEMENTS Our Performance Unilever Annual Report on Form 20-F 2023 63

Underlying return on assets Underlying return on assets is a measure of the return generated on assets for each Business Group. This measure provides additional insight on the performance of the Business Groups and assists in formulating long-term strategies with respect to allocation of capital across Business Groups. Business Group underlying return on assets is calculated as underlying operating profit after tax for the Business Group divided by the annual average of: property, plant and equipment, net assets held for sale (excluding goodwill and intangibles), inventories, trade and other current receivables, and trade payables and other current liabilities for each Business Group. The annual average is computed by adding the amounts at the beginning and the end of the calendar year and dividing by two. € million 2023 Beauty & Wellbeing Personal Care Home Care Nutrition Ice Cream Total Underlying operating profit before tax 2,331 2,792 1,496 2,460 852 9,931 Tax on underlying operating profit (597) (716) (383) (631) (218) (2,545) Underlying operating profit after tax 1,734 2,076 1,113 1,829 634 7,386 Property plant and equipment 1,773 2,340 1,979 1,976 2,639 10,707 Net assets held for sale — (31) — 15 — (16) Inventories 1,179 1,128 785 1,090 937 5,119 Trade and other receivables 1,208 1,340 1,180 1,279 768 5,775 Trade payables and other current liabilities (3,439) (3,746) (3,626) (3,646) (2,400) (16,857) Period-end assets (net) 721 1,031 318 714 1,944 4,728 Average assets for the period (net) 880 1,164 420 866 1,910 5,241 Underlying return on assets (%) 197 178 265 211 33 141 2022 Underlying operating profit before tax 2,292 2,679 1,344 2,449 919 9,683 Tax on underlying operating profit (552) (644) (324) (590) (221) (2,331) Underlying operating profit after tax 1,740 2,035 1,020 1,859 698 7,352 Property plant and equipment 1,775 2,259 2,112 2,196 2,428 10,770 Net assets held for sale — 2 — 20 — 22 Inventories 1,386 1,352 909 1,267 1,017 5,931 Trade and other receivables 1,439 1,601 1,457 1,632 927 7,056 Trade payables and other current liabilities (3,562) (3,918) (3,955) (4,095) (2,493) (18,023) Period-end assets (net) 1,038 1,296 523 1,020 1,879 5,756 Average assets for the period (net) 979 1,403 558 1,295 1,780 6,015 Underlying return on assets (%) 178 145 183 144 39 122 Other information Accounting standards and critical accounting policies The consolidated financial statements have been prepared in accordance with IFRS as adopted by the UK and IFRS as issued by the International Accounting Standards Board. The accounting policies are consistent with those applied in 2022 except for the recent accounting developments as set out in note 1 on pages 177 to 179. The critical accounting estimates and judgements and those that are most significant in connection with our financial reporting are set out in note 1 on pages 177 to 179. Auditor's report The Report of Independent Registered Public Accounting Firm issued by KPMG LLP on the consolidated results of the Group, as set out in the financial statements, was unqualified and contained no exceptions or emphasis of matter. For more details see pages 157 to 172. 2022 financial review The financial review for the year ended 31 December 2022 can be found on pages 54 to 59 of our Annual Report and Accounts on Form 20-F filed with the United States Securities and Exchange Commission on 13 March 2023. STRATEGIC REPORT CORPORATE GOVERNANCE FINANCIAL STATEMENTS Our Performance 64 Unilever Annual Report on Form 20-F 2023
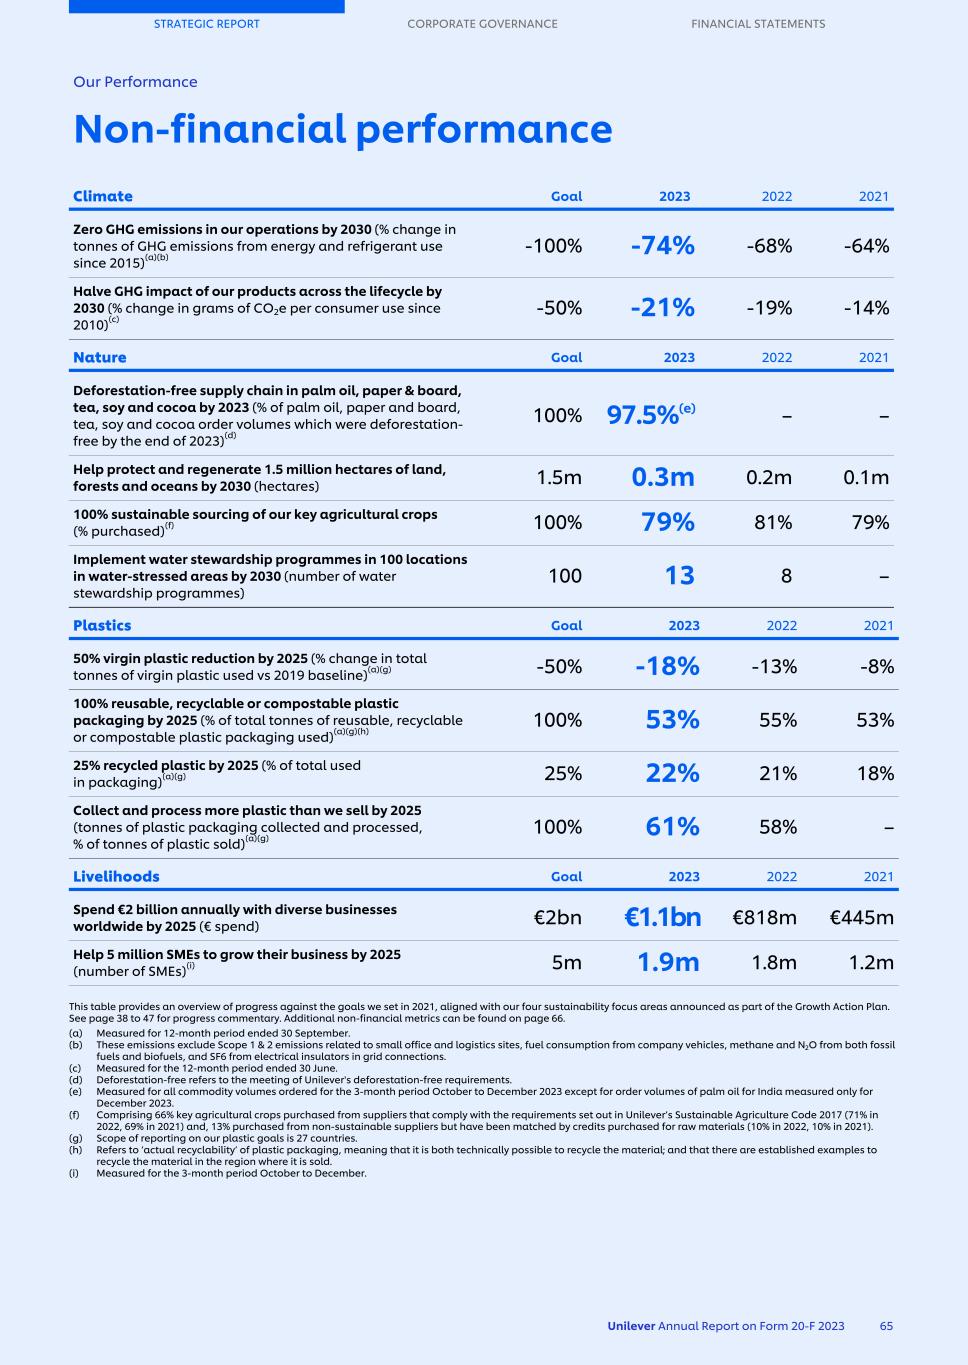
Climate Goal 2023 2022 2021 Zero GHG emissions in our operations by 2030 (% change in tonnes of GHG emissions from energy and refrigerant use since 2015)(a)(b) -100% '-74% '-68% -64% Halve GHG impact of our products across the lifecycle by 2030 (% change in grams of CO2e per consumer use since 2010)(c) -50% '-21% -19% '-14% Nature Goal 2023 2022 2021 Deforestation-free supply chain in palm oil, paper & board, tea, soy and cocoa by 2023 (% of palm oil, paper and board, tea, soy and cocoa order volumes which were deforestation- free by the end of 2023)(d) 100% 97.5%(e) – – Help protect and regenerate 1.5 million hectares of land, forests and oceans by 2030 (hectares) 1.5m 0.3m 0.2m 0.1m 100% sustainable sourcing of our key agricultural crops (% purchased)(f) 100% 79% 81% 79% Implement water stewardship programmes in 100 locations in water-stressed areas by 2030 (number of water stewardship programmes) 100 13 8 – Plastics Goal 2023 2022 2021 50% virgin plastic reduction by 2025 (% change in total tonnes of virgin plastic used vs 2019 baseline)(a)(g) -50% -18% '-13% '-8% 100% reusable, recyclable or compostable plastic packaging by 2025 (% of total tonnes of reusable, recyclable or compostable plastic packaging used)(a)(g)(h) 100% 53% 55% 53% 25% recycled plastic by 2025 (% of total used in packaging)(a)(g) 25% 22% 21% 18% Collect and process more plastic than we sell by 2025 (tonnes of plastic packaging collected and processed, % of tonnes of plastic sold)(a)(g) 100% 61% 58% – Livelihoods Goal 2023 2022 2021 Spend €2 billion annually with diverse businesses worldwide by 2025 (€ spend) €2bn €1.1bn €818m €445m Help 5 million SMEs to grow their business by 2025 (number of SMEs)(i) 5m 1.9m 1.8m 1.2m Δ This table provides an overview of progress against the goals we set in 2021, aligned with our four sustainability focus areas announced as part of the Growth Action Plan. See page 38 to 47 for progress commentary. Additional non-financial metrics can be found on page 66. (a) Measured for 12-month period ended 30 September. (b) These emissions exclude Scope 1 & 2 emissions related to small office and logistics sites, fuel consumption from company vehicles, methane and N2O from both fossil fuels and biofuels, and SF6 from electrical insulators in grid connections. (c) Measured for the 12-month period ended 30 June. (d) Deforestation-free refers to the meeting of Unilever's deforestation-free requirements. (e) Measured for all commodity volumes ordered for the 3-month period October to December 2023 except for order volumes of palm oil for India measured only for December 2023. (f) Comprising 66% key agricultural crops purchased from suppliers that comply with the requirements set out in Unilever’s Sustainable Agriculture Code 2017 (71% in 2022, 69% in 2021) and, 13% purchased from non-sustainable suppliers but have been matched by credits purchased for raw materials (10% in 2022, 10% in 2021). (g) Scope of reporting on our plastic goals is 27 countries. (h) Refers to ‘actual recyclability’ of plastic packaging, meaning that it is both technically possible to recycle the material; and that there are established examples to recycle the material in the region where it is sold. (i) Measured for the 3-month period October to December. STRATEGIC REPORT CORPORATE GOVERNANCE FINANCIAL STATEMENTS Our Performance Non-financial performance Unilever Annual Report on Form 20-F 2023 65
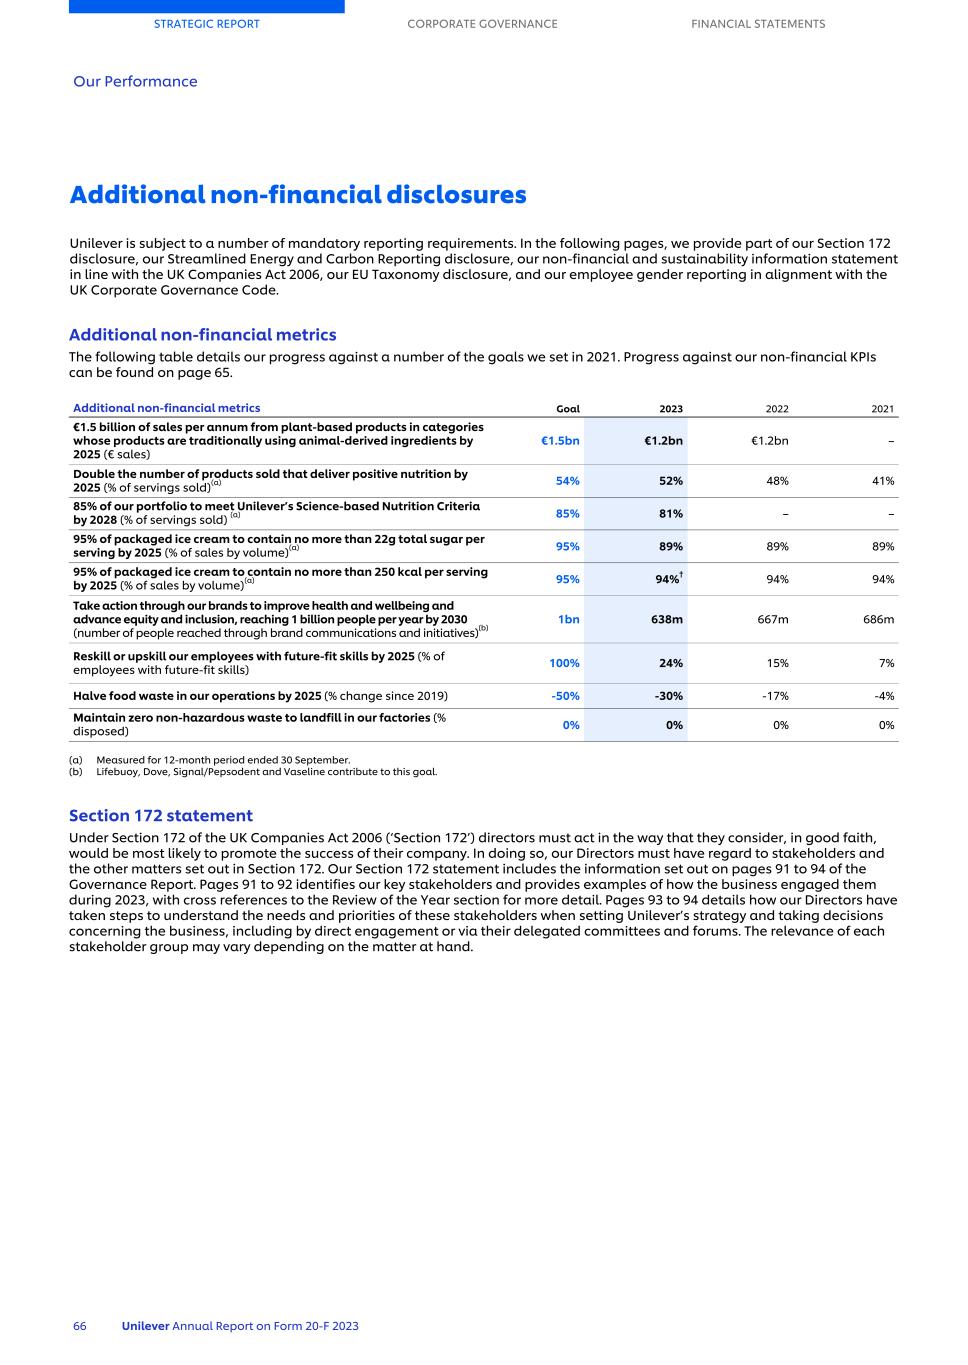
Additional non-financial metrics The following table details our progress against a number of the goals we set in 2021. Progress against our non-financial KPIs can be found on page 65. Additional non-financial metrics Goal 2023 2022 2021 €1.5 billion of sales per annum from plant-based products in categories whose products are traditionally using animal-derived ingredients by 2025 (€ sales) €1.5bn €1.2bn €1.2bn – Double the number of products sold that deliver positive nutrition by 2025 (% of servings sold)(a) 54% 52% 48% 41% 85% of our portfolio to meet Unilever’s Science-based Nutrition Criteria by 2028 (% of servings sold) (a) 85% 81% – – 95% of packaged ice cream to contain no more than 22g total sugar per serving by 2025 (% of sales by volume)(a) 95% 89% 89% 89% 95% of packaged ice cream to contain no more than 250 kcal per serving by 2025 (% of sales by volume)(a) 95% 94%† 94% 94% Take action through our brands to improve health and wellbeing and advance equity and inclusion, reaching 1 billion people per year by 2030 (number of people reached through brand communications and initiatives)(b) 1bn 638m 667m 686m Reskill or upskill our employees with future-fit skills by 2025 (% of employees with future-fit skills) 100% 24% 15% 7% Halve food waste in our operations by 2025 (% change since 2019) -50% '-30% -17% -4% Maintain zero non-hazardous waste to landfill in our factories (% disposed) 0% 0% 0% 0% (a) Measured for 12-month period ended 30 September. (b) Lifebuoy, Dove, Signal/Pepsodent and Vaseline contribute to this goal. Section 172 statement Under Section 172 of the UK Companies Act 2006 (‘Section 172’) directors must act in the way that they consider, in good faith, would be most likely to promote the success of their company. In doing so, our Directors must have regard to stakeholders and the other matters set out in Section 172. Our Section 172 statement includes the information set out on pages 91 to 94 of the Governance Report. Pages 91 to 92 identifies our key stakeholders and provides examples of how the business engaged them during 2023, with cross references to the Review of the Year section for more detail. Pages 93 to 94 details how our Directors have taken steps to understand the needs and priorities of these stakeholders when setting Unilever’s strategy and taking decisions concerning the business, including by direct engagement or via their delegated committees and forums. The relevance of each stakeholder group may vary depending on the matter at hand. STRATEGIC REPORT CORPORATE GOVERNANCE FINANCIAL STATEMENTS Our Performance 66 Unilever Annual Report on Form 20-F 2023 Additional non-financial disclosures Unilever is subject to a number of mandatory reporting requirements. In the following pages, we provide part of our Section 172 disclosure, our Streamlined Energy and Carbon Reporting disclosure, our non-financial and sustainability information statement in line with the UK Companies Act 2006, our EU Taxonomy disclosure, and our employee gender reporting in alignment with the UK Corporate Governance Code.
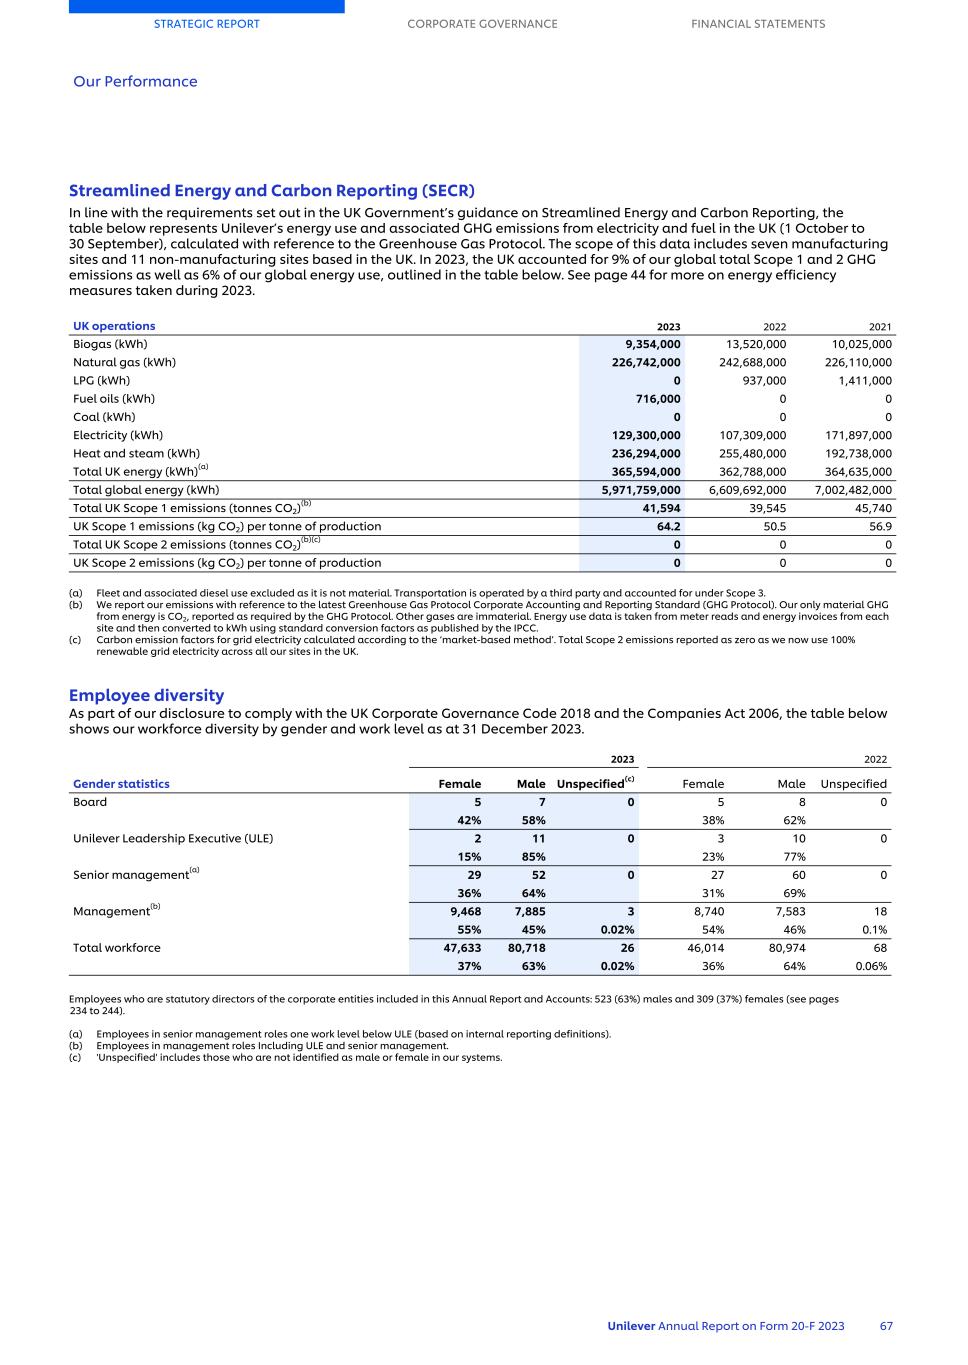
Streamlined Energy and Carbon Reporting (SECR) In line with the requirements set out in the UK Government’s guidance on Streamlined Energy and Carbon Reporting, the table below represents Unilever’s energy use and associated GHG emissions from electricity and fuel in the UK (1 October to 30 September), calculated with reference to the Greenhouse Gas Protocol. The scope of this data includes seven manufacturing sites and 11 non-manufacturing sites based in the UK. In 2023, the UK accounted for 9% of our global total Scope 1 and 2 GHG emissions as well as 6% of our global energy use, outlined in the table below. See page 44 for more on energy efficiency measures taken during 2023. UK operations 2023 2022 2021 Biogas (kWh) 9,354,000 13,520,000 10,025,000 Natural gas (kWh) 226,742,000 242,688,000 226,110,000 LPG (kWh) 0 937,000 1,411,000 Fuel oils (kWh) 716,000 0 0 Coal (kWh) 0 0 0 Electricity (kWh) 129,300,000 107,309,000 171,897,000 Heat and steam (kWh) 236,294,000 255,480,000 192,738,000 Total UK energy (kWh)(a) 365,594,000 362,788,000 364,635,000 Total global energy (kWh) 5,971,759,000 6,609,692,000 7,002,482,000 Total UK Scope 1 emissions (tonnes CO2)(b) 41,594 39,545 45,740 UK Scope 1 emissions (kg CO2) per tonne of production 64.2 50.5 56.9 Total UK Scope 2 emissions (tonnes CO2)(b)(c) 0 0 0 UK Scope 2 emissions (kg CO2) per tonne of production 0 0 0 (a) Fleet and associated diesel use excluded as it is not material. Transportation is operated by a third party and accounted for under Scope 3. (b) We report our emissions with reference to the latest Greenhouse Gas Protocol Corporate Accounting and Reporting Standard (GHG Protocol). Our only material GHG from energy is CO2, reported as required by the GHG Protocol. Other gases are immaterial. Energy use data is taken from meter reads and energy invoices from each site and then converted to kWh using standard conversion factors as published by the IPCC. (c) Carbon emission factors for grid electricity calculated according to the ‘market-based method’. Total Scope 2 emissions reported as zero as we now use 100% renewable grid electricity across all our sites in the UK. Employee diversity As part of our disclosure to comply with the UK Corporate Governance Code 2018 and the Companies Act 2006, the table below shows our workforce diversity by gender and work level as at 31 December 2023. 2023 2022 Gender statistics Female Male Unspecified(c) Female Male Unspecified Board 5 7 0 5 8 0 42% 58% 38% 62% Unilever Leadership Executive (ULE) 2 11 0 3 10 0 15% 85% 23% 77% Senior management(a) 29 52 0 27 60 0 36% 64% 31% 69% Management(b) 9,468 7,885 3 8,740 7,583 18 55% 45% 0.02% 54% 46% 0.1% Total workforce 47,633 80,718 26 46,014 80,974 68 37% 63% 0.02% 36% 64% 0.06% Employees who are statutory directors of the corporate entities included in this Annual Report and Accounts: 523 (63%) males and 309 (37%) females (see pages 234 to 244). (a) Employees in senior management roles one work level below ULE (based on internal reporting definitions). (b) Employees in management roles Including ULE and senior management. (c) 'Unspecified' includes those who are not identified as male or female in our systems. STRATEGIC REPORT CORPORATE GOVERNANCE FINANCIAL STATEMENTS Our Performance Unilever Annual Report on Form 20-F 2023 67

Non-financial and sustainability information statement In accordance with sections 414CA and 414CB of the Companies Act 2006 which outline requirements for non-financial reporting, the table below is intended to provide our stakeholders with the content they need to understand our development, performance, position and the impact of our activities with regards to specified non-financial matters. Our business model can be found on pages 2 to 3, which identifies our stakeholder groups, and our principal risks can be found on pages 70 to 78. Further information on these matters can be found on our website and in our Human Rights Report, including relevant policies. Non-financial matter and relevant sections of Annual Report Annual Report page reference Environmental matters Relevant sections of Annual Report and Accounts: ■ Climate ■ Plastics ■ Nature ■ Our Climate Transition Action Plan: Annual Progress Report ■ Task Force on Climate-related Financial Disclosures statement ■ EU Taxonomy disclosures ■ Policies and due diligence: pages 40 to 41 and 43 to 47 ■ Position and performance (including relevant non- financial KPIs): pages 46 to 47 and 65 to 66 ■ Risk: pages 48 to 55 and 72 and 73 ■ Impact: pages 40 and 41 and 48 to 55 Social and community matters Relevant sections of Annual Report and Accounts: ■ Livelihoods ■ Policies and due diligence: page 42 ■ Position and performance (including relevant non-financial KPIs): page 65 ■ Risk: pages 42 and 77 ■ Impact: page 42 Employee matters Relevant sections of Annual Report and Accounts: ■ Our People & Culture ■ Equity, diversity and inclusion ■ Livelihoods ■ Future of work ■ Employee health and wellbeing ■ Safety at work ■ Policies and due diligence: pages 34 to 37 ■ Position and performance (including relevant non-financial KPIs): pages 34 to 37 and 65 and 66 ■ Risk: pages 34 to 37 and 74 ■ Impact: pages 34 to 37 Human rights matters Relevant sections of Annual Report and Accounts: ■ Livelihoods ■ Human Rights ■ Policies and due diligence: page 42 ■ Position and performance (including relevant non-financial KPIs): pages 42 and 65 ■ Risk: pages 42 and 77 ■ Impact: page 42 Anti-corruption and bribery matters Relevant sections of Annual Report and Accounts: ■ Our People & Culture ■ Policies and due diligence: page 37 ■ Position and performance (including relevant non-financial KPIs): page 37 ■ Risk: pages 37 and 77 ■ Impact: page 37 STRATEGIC REPORT CORPORATE GOVERNANCE FINANCIAL STATEMENTS Our Performance 68 Unilever Annual Report on Form 20-F 2023
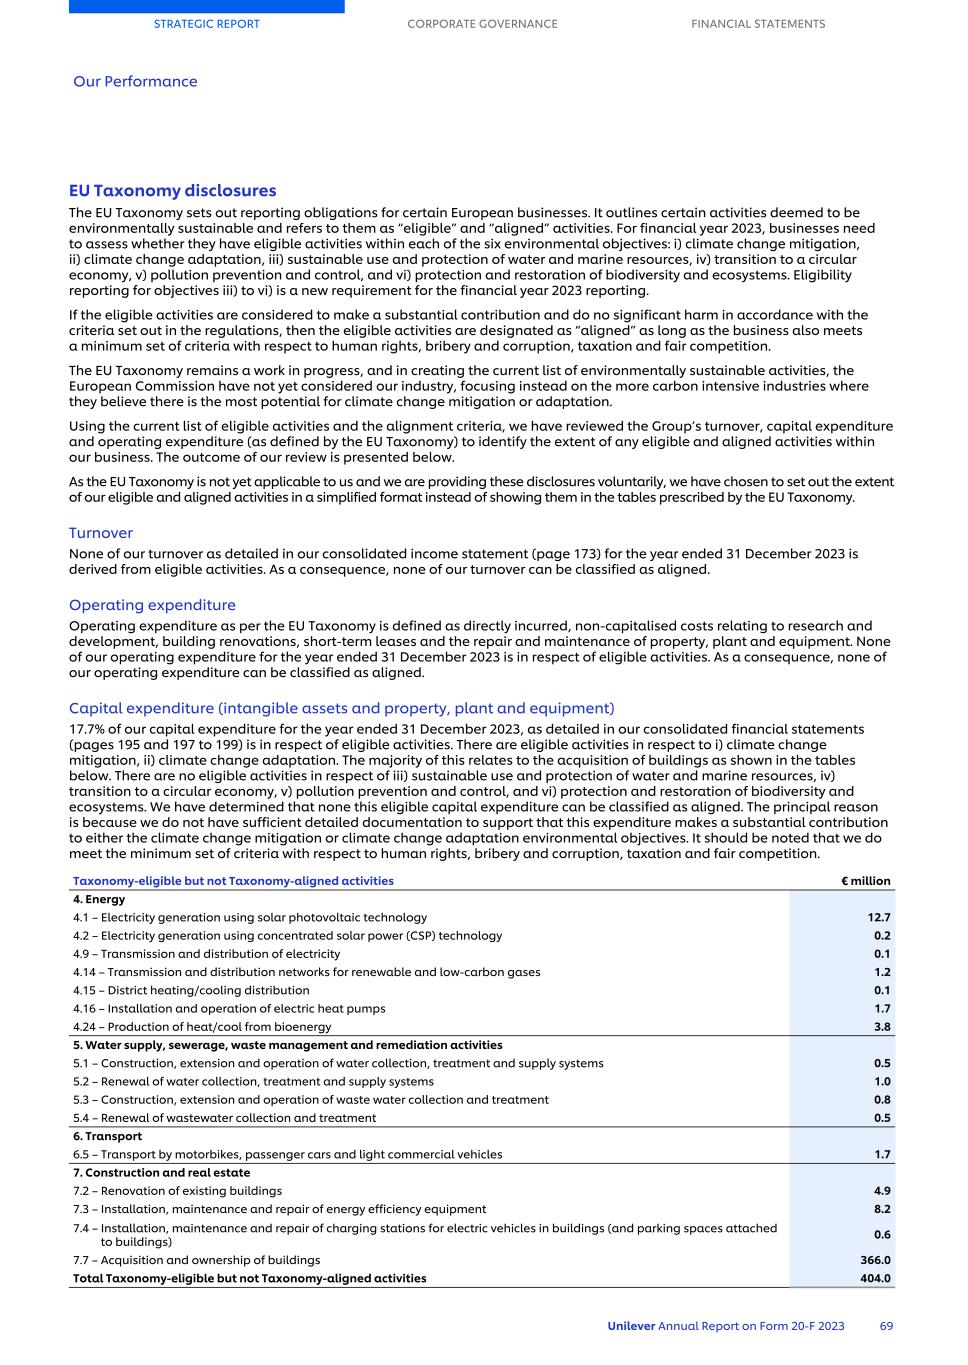
EU Taxonomy disclosures The EU Taxonomy sets out reporting obligations for certain European businesses. It outlines certain activities deemed to be environmentally sustainable and refers to them as “eligible” and “aligned” activities. For financial year 2023, businesses need to assess whether they have eligible activities within each of the six environmental objectives: i) climate change mitigation, ii) climate change adaptation, iii) sustainable use and protection of water and marine resources, iv) transition to a circular economy, v) pollution prevention and control, and vi) protection and restoration of biodiversity and ecosystems. Eligibility reporting for objectives iii) to vi) is a new requirement for the financial year 2023 reporting. If the eligible activities are considered to make a substantial contribution and do no significant harm in accordance with the criteria set out in the regulations, then the eligible activities are designated as “aligned” as long as the business also meets a minimum set of criteria with respect to human rights, bribery and corruption, taxation and fair competition. The EU Taxonomy remains a work in progress, and in creating the current list of environmentally sustainable activities, the European Commission have not yet considered our industry, focusing instead on the more carbon intensive industries where they believe there is the most potential for climate change mitigation or adaptation. Using the current list of eligible activities and the alignment criteria, we have reviewed the Group’s turnover, capital expenditure and operating expenditure (as defined by the EU Taxonomy) to identify the extent of any eligible and aligned activities within our business. The outcome of our review is presented below. As the EU Taxonomy is not yet applicable to us and we are providing these disclosures voluntarily, we have chosen to set out the extent of our eligible and aligned activities in a simplified format instead of showing them in the tables prescribed by the EU Taxonomy. Turnover None of our turnover as detailed in our consolidated income statement (page 173) for the year ended 31 December 2023 is derived from eligible activities. As a consequence, none of our turnover can be classified as aligned. Operating expenditure Operating expenditure as per the EU Taxonomy is defined as directly incurred, non-capitalised costs relating to research and development, building renovations, short-term leases and the repair and maintenance of property, plant and equipment. None of our operating expenditure for the year ended 31 December 2023 is in respect of eligible activities. As a consequence, none of our operating expenditure can be classified as aligned. Capital expenditure (intangible assets and property, plant and equipment) 17.7% of our capital expenditure for the year ended 31 December 2023, as detailed in our consolidated financial statements (pages 195 and 197 to 199) is in respect of eligible activities. There are eligible activities in respect to i) climate change mitigation, ii) climate change adaptation. The majority of this relates to the acquisition of buildings as shown in the tables below. There are no eligible activities in respect of iii) sustainable use and protection of water and marine resources, iv) transition to a circular economy, v) pollution prevention and control, and vi) protection and restoration of biodiversity and ecosystems. We have determined that none this eligible capital expenditure can be classified as aligned. The principal reason is because we do not have sufficient detailed documentation to support that this expenditure makes a substantial contribution to either the climate change mitigation or climate change adaptation environmental objectives. It should be noted that we do meet the minimum set of criteria with respect to human rights, bribery and corruption, taxation and fair competition. Taxonomy-eligible but not Taxonomy-aligned activities € million 4. Energy 4.1 – Electricity generation using solar photovoltaic technology 12.7 4.2 – Electricity generation using concentrated solar power (CSP) technology 0.2 4.9 – Transmission and distribution of electricity 0.1 4.14 – Transmission and distribution networks for renewable and low-carbon gases 1.2 4.15 – District heating/cooling distribution 0.1 4.16 – Installation and operation of electric heat pumps 1.7 4.24 – Production of heat/cool from bioenergy 3.8 5. Water supply, sewerage, waste management and remediation activities 5.1 – Construction, extension and operation of water collection, treatment and supply systems 0.5 5.2 – Renewal of water collection, treatment and supply systems 1.0 5.3 – Construction, extension and operation of waste water collection and treatment 0.8 5.4 – Renewal of wastewater collection and treatment 0.5 6. Transport 6.5 – Transport by motorbikes, passenger cars and light commercial vehicles 1.7 7. Construction and real estate 7.2 – Renovation of existing buildings 4.9 7.3 – Installation, maintenance and repair of energy efficiency equipment 8.2 7.4 – Installation, maintenance and repair of charging stations for electric vehicles in buildings (and parking spaces attached to buildings) 0.6 7.7 – Acquisition and ownership of buildings 366.0 Total Taxonomy-eligible but not Taxonomy-aligned activities 404.0 STRATEGIC REPORT CORPORATE GOVERNANCE FINANCIAL STATEMENTS Our Performance Unilever Annual Report on Form 20-F 2023 69
Our risk appetite and approach to risk management Risk management is integral to Unilever’s strategy and the achievement of Unilever’s long-term goals. Our success as an organisation depends on our ability to identify and exploit the opportunities generated by our business and in our markets. In doing this, we take an embedded approach to risk management which puts risk at the core of the Board agenda, which is where we believe it should be. Unilever’s appetite for risk is driven by the following: ■ Our growth should be consistent, competitive, profitable and responsible. ■ Our actions on issues such as plastic and climate change must reflect their urgency, and not be constrained by the uncertainty of potential impacts. ■ Our behaviours must be in line with our Code of Business Principles and Code Policies. ■ Our ambition to continuously improve our operational efficiency and effectiveness. ■ Our aim to maintain a minimum A/A2 credit rating on a long-term basis. Our approach to risk management is designed to provide reasonable, but not absolute, assurance that our assets are safeguarded, the risks facing the business are being assessed, and all information that may be required to be disclosed is reported to Unilever’s senior management including, where appropriate, the CEO and CFO. Organisation The Board has overall accountability for the management of risk and reviewing the effectiveness of Unilever’s risk management and internal control systems. The Board has established a clear organisational structure with well-defined accountabilities for the principal risks that Unilever faces in the short, medium and long term. In this structure, the Board has delegated the overall accountability for risk management to both the CEO and CFO. The distribution of accountabilities and responsibilities ensures that every segment (either Business Group or country) through which we operate has specific resources and processes for risk reviews. This is supported by the ULE, which takes active responsibility for focusing on the principal areas of risk to Unilever, including any emerging areas of risks. The Board regularly review these risk areas, including consideration of environmental, social and governance matters, and retain responsibility for determining the nature and extent of the significant risks that Unilever is prepared to take to achieve its strategic objectives. Foundation and principles Unilever’s approach to doing business is framed by our purpose and values (see page 4). Our Code of Business Principles sets out the standards of behaviour that we expect all employees to adhere to. Day-to-day responsibility for ensuring these principles are applied rests with senior management across Business Groups, geographies and functions. A network of Business Integrity Officers and Committees supports the activities necessary to communicate the Code, deliver training, maintain processes and procedures (including support lines) to report and respond to alleged breaches, and to capture and communicate learnings. We have a framework of Code Policies that underpins the Code of Business Principles and sets out the non-negotiable standards of behaviour expected from all our employees. For each of our principal risks we have a risk management framework detailing the controls we have in place and who is responsible for managing the overall risk. Unilever’s functional standards define mandatory requirements across a range of specialist areas. Examples include health and safety, cyber, accounting and reporting, and financial risk management. Our assessment of risk considers both short-term and long- term risks, including how these risks are changing, together with emerging risk areas. These are reviewed on an ongoing basis, and formally by senior management and the Board at least once a year. Processes Unilever operates a wide range of processes and activities across all its operations covering strategy, planning, execution and performance management. Risk management is integrated into every stage. Assurance and re-assurance Assurance on compliance with the Code of Business Principles and our Code Policies is obtained annually from Unilever management via a formal Code declaration. In addition, there are specialist awareness and training programmes which are run throughout the year and vary depending on the business priorities. These specialist compliance programmes supplement the Code declaration. An integrated assurance map is maintained across the principal risks to confirm the mitigation in place through the three lines of defence. Our Corporate Audit function plays a vital role in providing to both management and the Board an objective and independent review of the effectiveness of risk management and internal control systems throughout Unilever. Board assessment of compliance with the risk management frameworks The Board, advised by the Committees where appropriate, regularly review the significant risks and decisions that could have a material impact on Unilever. These reviews consider the level of risk that Unilever is prepared to take in pursuit of the business strategy and the effectiveness of the management controls in place to respond to the risk exposure. The Board, through the Audit Committee, has reviewed the assessment of risks, internal controls and disclosure controls and procedures in operation within Unilever. They have also considered the effectiveness of any remedial actions taken for the year covered by this Annual Report and Accounts and up to the date of its approval by the Board. Details of the activities of the Audit Committee in relation to this can be found in the Report of the Audit Committee on pages 107 to 111. Further statements on compliance with the specific risk management and control requirements in the UK Corporate Governance Code (2018), the US Securities Exchange Act (1934) and the US Sarbanes-Oxley Act (2002) can be found on pages 100 to 101. STRATEGIC REPORT CORPORATE GOVERNANCE FINANCIAL STATEMENTS Our Principal Risks Our Principal Risks 70 Unilever Annual Report on Form 20-F 2023
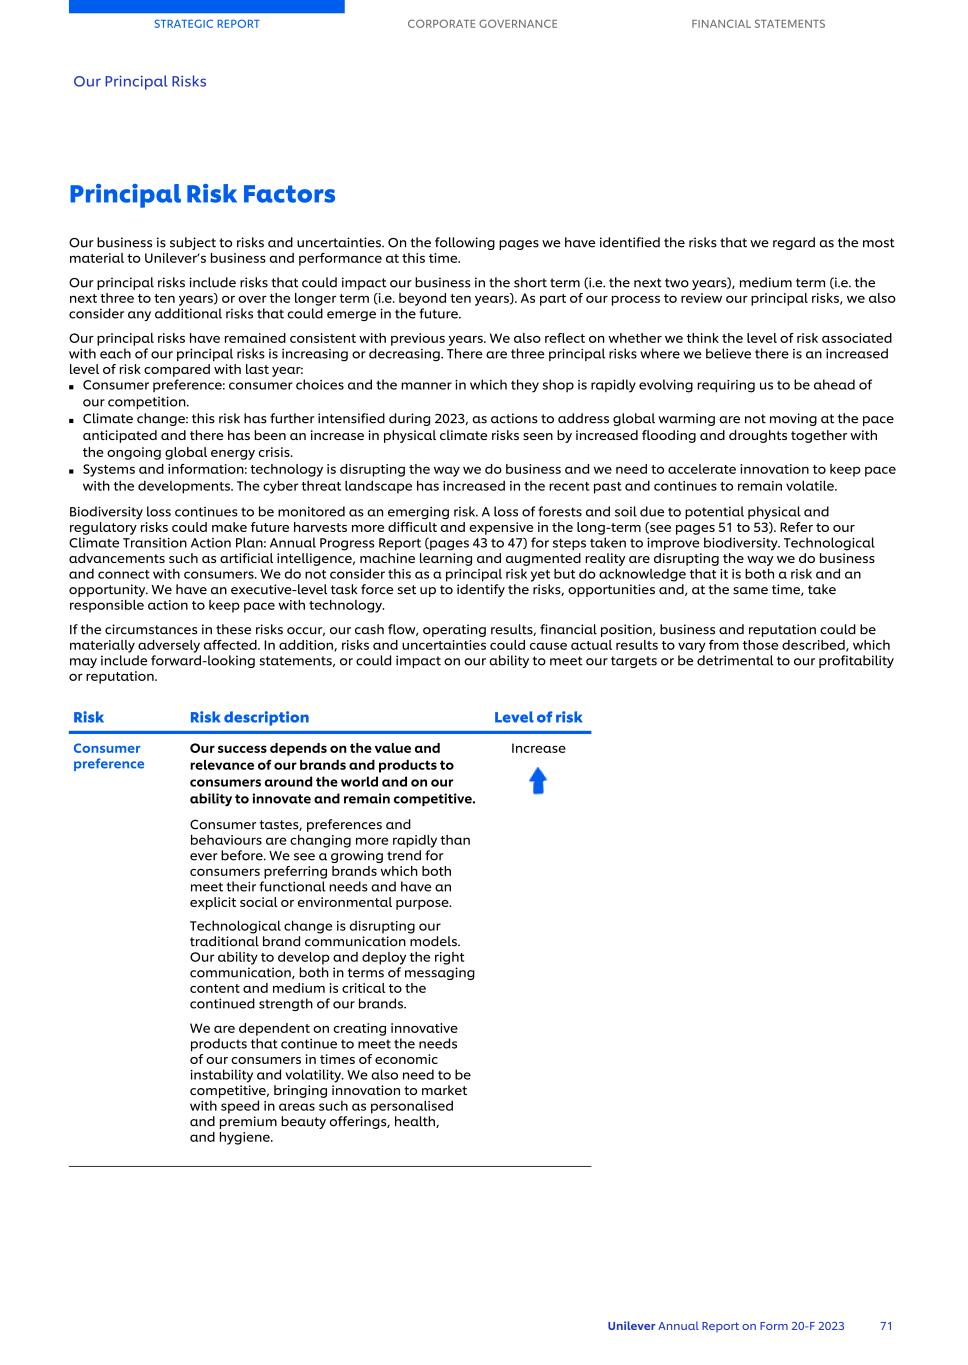
Principal Risk Factors Our business is subject to risks and uncertainties. On the following pages we have identified the risks that we regard as the most material to Unilever’s business and performance at this time. Our principal risks include risks that could impact our business in the short term (i.e. the next two years), medium term (i.e. the next three to ten years) or over the longer term (i.e. beyond ten years). As part of our process to review our principal risks, we also consider any additional risks that could emerge in the future. Our principal risks have remained consistent with previous years. We also reflect on whether we think the level of risk associated with each of our principal risks is increasing or decreasing. There are three principal risks where we believe there is an increased level of risk compared with last year: ■ Consumer preference: consumer choices and the manner in which they shop is rapidly evolving requiring us to be ahead of our competition. ■ Climate change: this risk has further intensified during 2023, as actions to address global warming are not moving at the pace anticipated and there has been an increase in physical climate risks seen by increased flooding and droughts together with the ongoing global energy crisis. ■ Systems and information: technology is disrupting the way we do business and we need to accelerate innovation to keep pace with the developments. The cyber threat landscape has increased in the recent past and continues to remain volatile. Biodiversity loss continues to be monitored as an emerging risk. A loss of forests and soil due to potential physical and regulatory risks could make future harvests more difficult and expensive in the long-term (see pages 51 to 53). Refer to our Climate Transition Action Plan: Annual Progress Report (pages 43 to 47) for steps taken to improve biodiversity. Technological advancements such as artificial intelligence, machine learning and augmented reality are disrupting the way we do business and connect with consumers. We do not consider this as a principal risk yet but do acknowledge that it is both a risk and an opportunity. We have an executive-level task force set up to identify the risks, opportunities and, at the same time, take responsible action to keep pace with technology. If the circumstances in these risks occur, our cash flow, operating results, financial position, business and reputation could be materially adversely affected. In addition, risks and uncertainties could cause actual results to vary from those described, which may include forward-looking statements, or could impact on our ability to meet our targets or be detrimental to our profitability or reputation. Risk Risk description Level of risk Consumer preference Our success depends on the value and relevance of our brands and products to consumers around the world and on our ability to innovate and remain competitive. Consumer tastes, preferences and behaviours are changing more rapidly than ever before. We see a growing trend for consumers preferring brands which both meet their functional needs and have an explicit social or environmental purpose. Technological change is disrupting our traditional brand communication models. Our ability to develop and deploy the right communication, both in terms of messaging content and medium is critical to the continued strength of our brands. We are dependent on creating innovative products that continue to meet the needs of our consumers in times of economic instability and volatility. We also need to be competitive, bringing innovation to market with speed in areas such as personalised and premium beauty offerings, health, and hygiene. Increase STRATEGIC REPORT CORPORATE GOVERNANCE FINANCIAL STATEMENTS Our Principal Risks Unilever Annual Report on Form 20-F 2023 71

Risk Risk description Level of risk Portfolio management Unilever’s strategic investment choices will affect the long-term growth and profits of our business. Unilever’s growth and profitability are determined by our portfolio of Business Groups, geographies and channels and how these evolve over time. If Unilever does not make optimal strategic investment decisions, then opportunities for growth and improved margin could be missed. No change Climate change Climate change and governmental actions to reduce such change may disrupt our operations and/or reduce consumer demand for our products. Climate change is already impacting our business in various ways. Government action to reduce climate change – such as the introduction of a carbon tax, land use regulations or product composition regulations which restrict or ban certain GHG-intensive ingredients – could impact our business through higher costs or reduced flexibility of operations. Physical environment risks such as water scarcity could impact our operations or reduce demand for our products that require water during consumer use. Increased frequency of extreme weather events such as high temperatures, hurricanes or floods could cause increased incidence of disruption to our supply chain, manufacturing and distribution network. If we do not take action, climate change could result in increased costs, reduced profit and reduced growth. Increase STRATEGIC REPORT CORPORATE GOVERNANCE FINANCIAL STATEMENTS Our Principal Risks 72 Unilever Annual Report on Form 20-F 2023
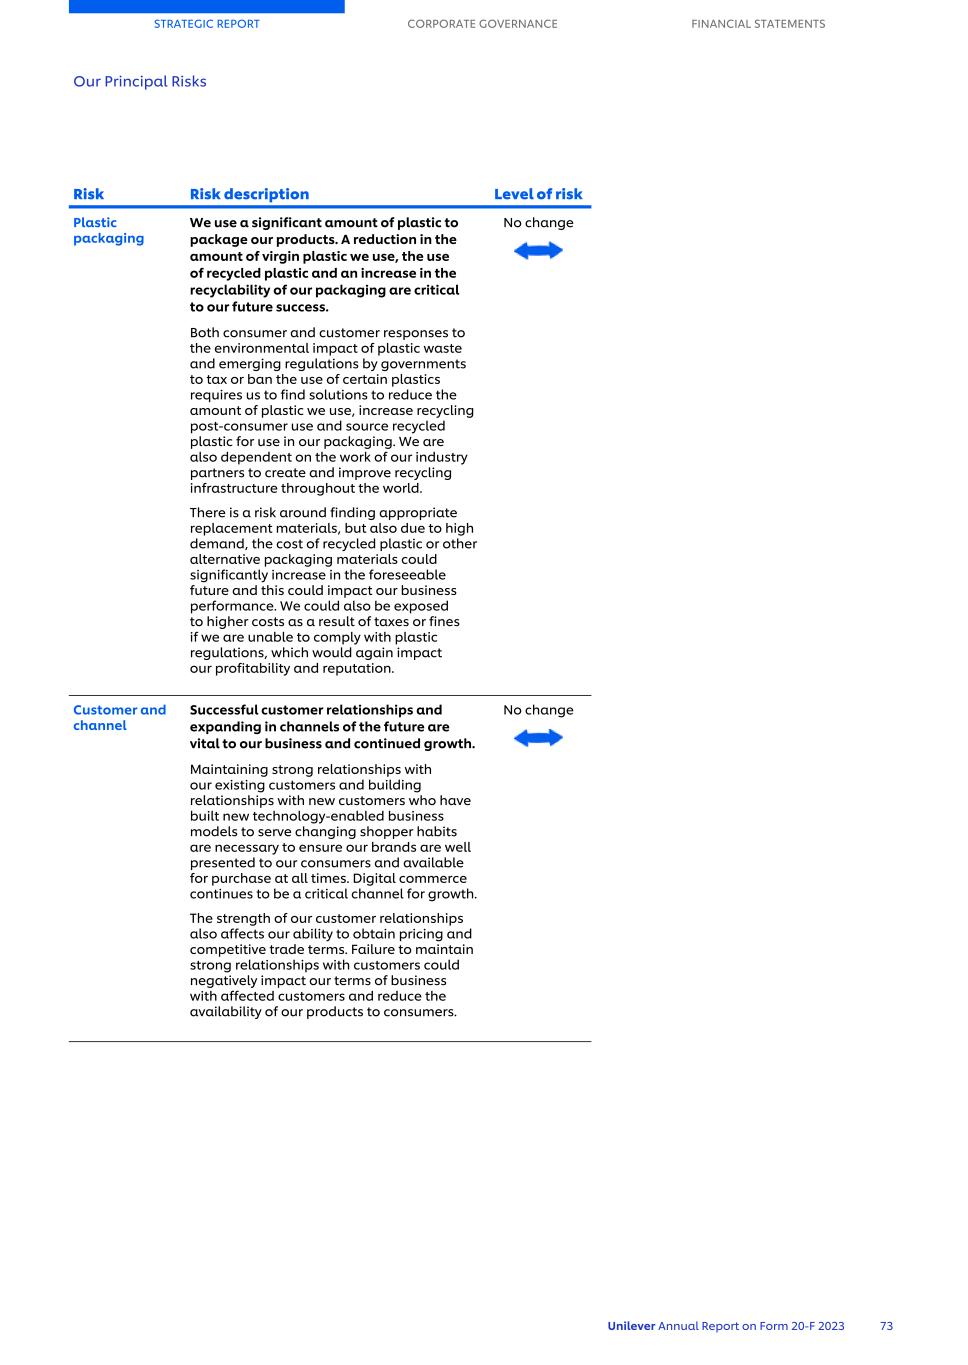
Risk Risk description Level of risk Plastic packaging We use a significant amount of plastic to package our products. A reduction in the amount of virgin plastic we use, the use of recycled plastic and an increase in the recyclability of our packaging are critical to our future success. Both consumer and customer responses to the environmental impact of plastic waste and emerging regulations by governments to tax or ban the use of certain plastics requires us to find solutions to reduce the amount of plastic we use, increase recycling post-consumer use and source recycled plastic for use in our packaging. We are also dependent on the work of our industry partners to create and improve recycling infrastructure throughout the world. There is a risk around finding appropriate replacement materials, but also due to high demand, the cost of recycled plastic or other alternative packaging materials could significantly increase in the foreseeable future and this could impact our business performance. We could also be exposed to higher costs as a result of taxes or fines if we are unable to comply with plastic regulations, which would again impact our profitability and reputation. No change Customer and channel Successful customer relationships and expanding in channels of the future are vital to our business and continued growth. Maintaining strong relationships with our existing customers and building relationships with new customers who have built new technology-enabled business models to serve changing shopper habits are necessary to ensure our brands are well presented to our consumers and available for purchase at all times. Digital commerce continues to be a critical channel for growth. The strength of our customer relationships also affects our ability to obtain pricing and competitive trade terms. Failure to maintain strong relationships with customers could negatively impact our terms of business with affected customers and reduce the availability of our products to consumers. No change STRATEGIC REPORT CORPORATE GOVERNANCE FINANCIAL STATEMENTS Our Principal Risks Unilever Annual Report on Form 20-F 2023 73
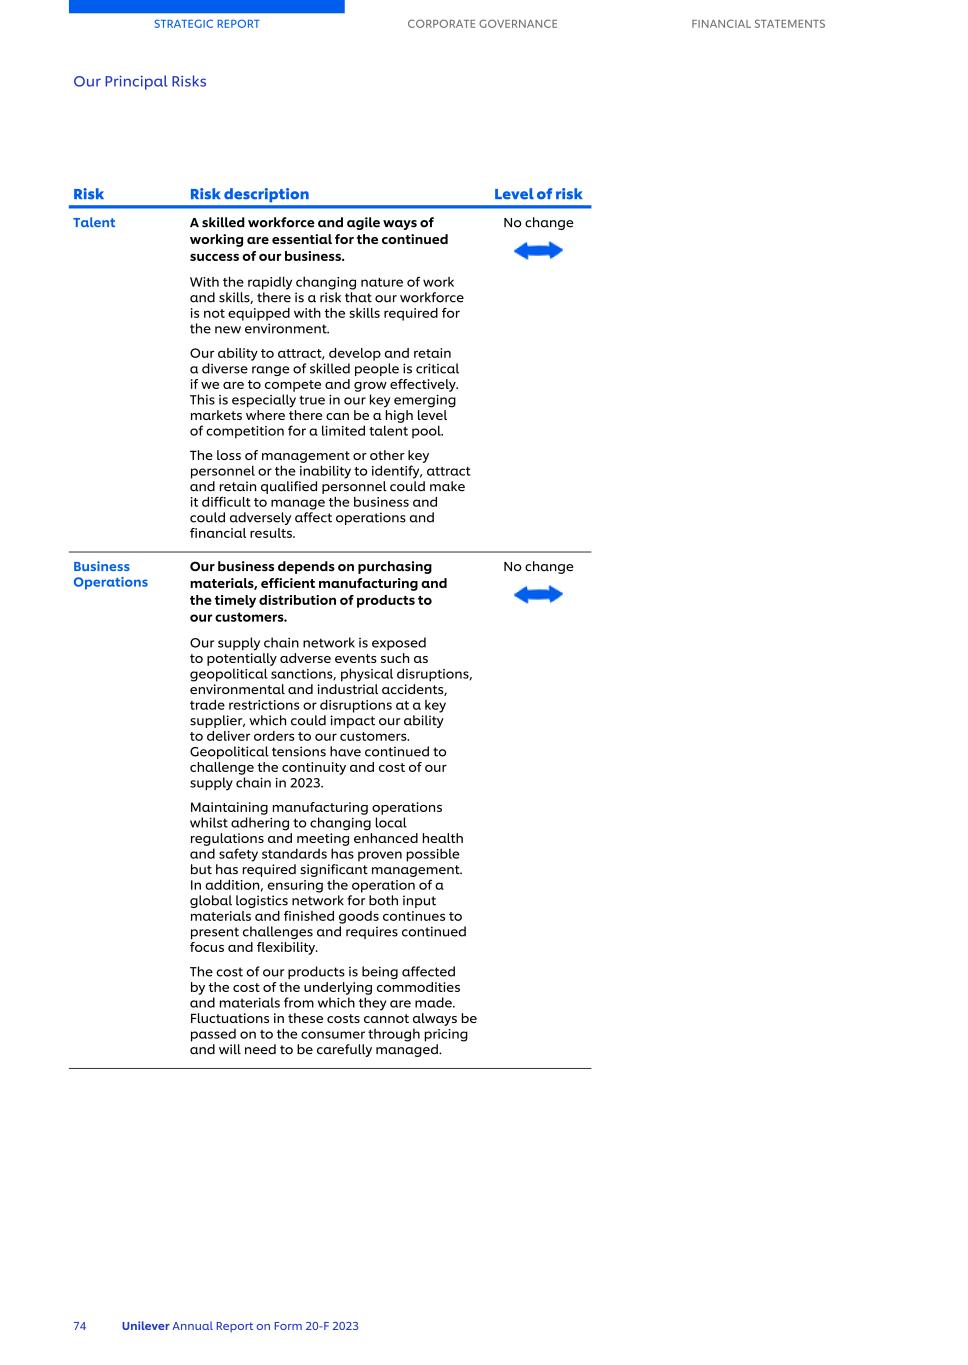
Risk Risk description Level of risk Talent A skilled workforce and agile ways of working are essential for the continued success of our business. With the rapidly changing nature of work and skills, there is a risk that our workforce is not equipped with the skills required for the new environment. Our ability to attract, develop and retain a diverse range of skilled people is critical if we are to compete and grow effectively. This is especially true in our key emerging markets where there can be a high level of competition for a limited talent pool. The loss of management or other key personnel or the inability to identify, attract and retain qualified personnel could make it difficult to manage the business and could adversely affect operations and financial results. No change Business Operations Our business depends on purchasing materials, efficient manufacturing and the timely distribution of products to our customers. Our supply chain network is exposed to potentially adverse events such as geopolitical sanctions, physical disruptions, environmental and industrial accidents, trade restrictions or disruptions at a key supplier, which could impact our ability to deliver orders to our customers. Geopolitical tensions have continued to challenge the continuity and cost of our supply chain in 2023. Maintaining manufacturing operations whilst adhering to changing local regulations and meeting enhanced health and safety standards has proven possible but has required significant management. In addition, ensuring the operation of a global logistics network for both input materials and finished goods continues to present challenges and requires continued focus and flexibility. The cost of our products is being affected by the cost of the underlying commodities and materials from which they are made. Fluctuations in these costs cannot always be passed on to the consumer through pricing and will need to be carefully managed. No change STRATEGIC REPORT CORPORATE GOVERNANCE FINANCIAL STATEMENTS Our Principal Risks 74 Unilever Annual Report on Form 20-F 2023

Risk Risk description Level of risk Safe and high-quality products The quality and safety of our products are of paramount importance for our brands and our reputation. The risk that raw materials are accidentally or maliciously contaminated throughout the supply chain or that product defects occur due to human error, equipment failure or other factors cannot be excluded. Labelling errors can have potentially serious consequences for both consumer safety and brand reputation. Therefore, on-pack labelling needs to provide clear and accurate ingredient information in order that consumers can make informed decisions regarding the products they buy. No change Systems and information Unilever’s operations are increasingly dependent on IT systems and safeguarding the confidentiality, integrity of data and the management of information. The cyber-attack threat of unauthorised access and misuse of sensitive information or disruption to operations continues to increase with the level of incidents rising year-on-year. Such an attack could inhibit our business operations in a number of ways, including disruption to sales, production and cash flows, ultimately impacting our results. In addition, increasing digital interactions with customers, suppliers and consumers place ever greater emphasis on the need for secure and reliable IT systems and infrastructure and careful management of the information that is in our possession to ensure data privacy. Increase STRATEGIC REPORT CORPORATE GOVERNANCE FINANCIAL STATEMENTS Our Principal Risks Unilever Annual Report on Form 20-F 2023 75
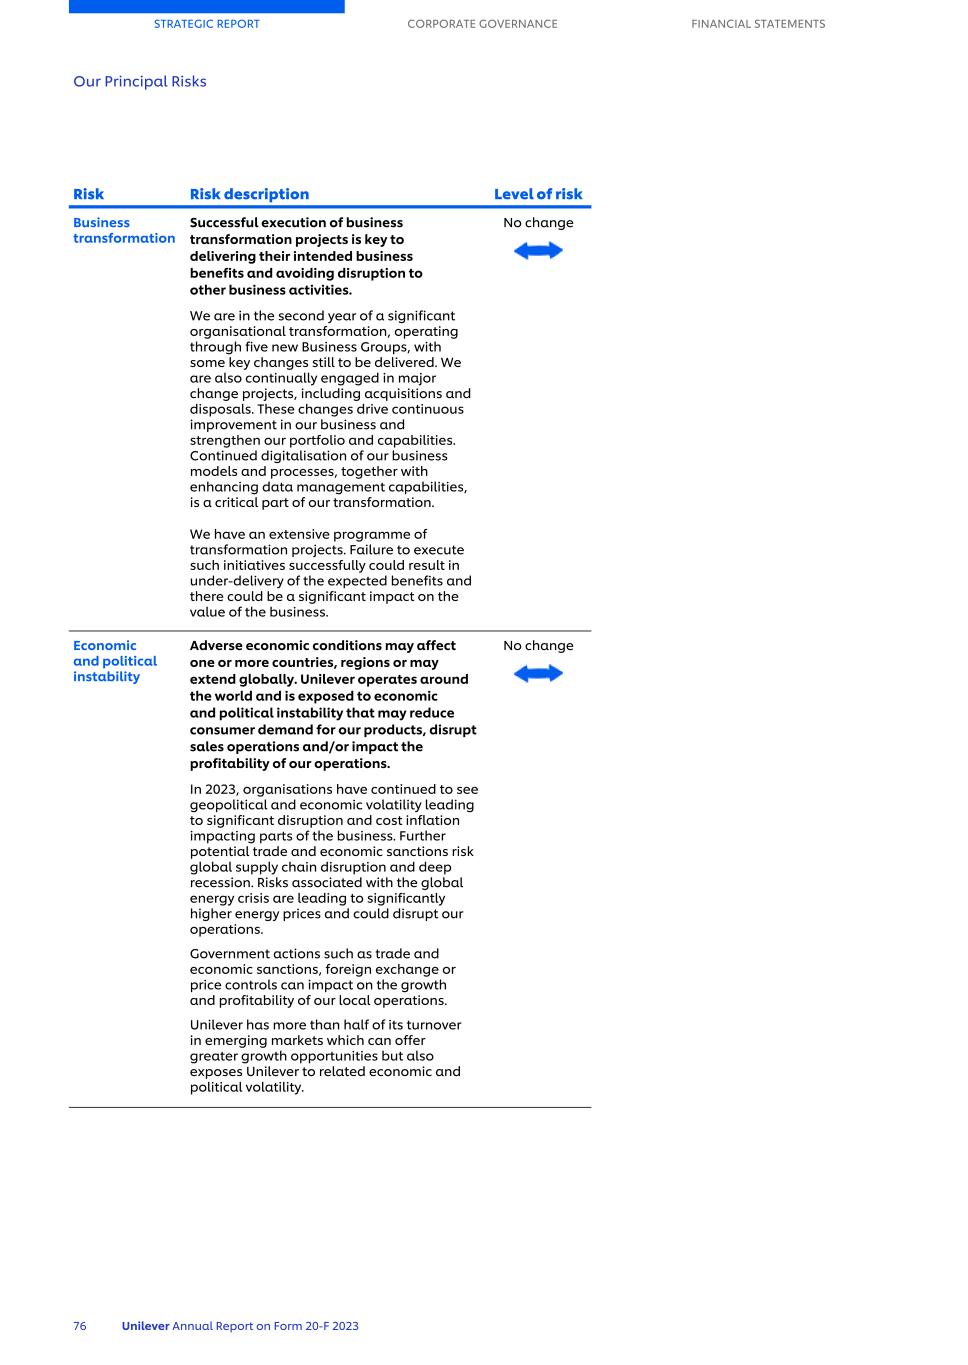
Risk Risk description Level of risk Business transformation Successful execution of business transformation projects is key to delivering their intended business benefits and avoiding disruption to other business activities. We are in the second year of a significant organisational transformation, operating through five new Business Groups, with some key changes still to be delivered. We are also continually engaged in major change projects, including acquisitions and disposals. These changes drive continuous improvement in our business and strengthen our portfolio and capabilities. Continued digitalisation of our business models and processes, together with enhancing data management capabilities, is a critical part of our transformation. We have an extensive programme of transformation projects. Failure to execute such initiatives successfully could result in under-delivery of the expected benefits and there could be a significant impact on the value of the business. No change Economic and political instability Adverse economic conditions may affect one or more countries, regions or may extend globally. Unilever operates around the world and is exposed to economic and political instability that may reduce consumer demand for our products, disrupt sales operations and/or impact the profitability of our operations. In 2023, organisations have continued to see geopolitical and economic volatility leading to significant disruption and cost inflation impacting parts of the business. Further potential trade and economic sanctions risk global supply chain disruption and deep recession. Risks associated with the global energy crisis are leading to significantly higher energy prices and could disrupt our operations. Government actions such as trade and economic sanctions, foreign exchange or price controls can impact on the growth and profitability of our local operations. Unilever has more than half of its turnover in emerging markets which can offer greater growth opportunities but also exposes Unilever to related economic and political volatility. No change STRATEGIC REPORT CORPORATE GOVERNANCE FINANCIAL STATEMENTS Our Principal Risks 76 Unilever Annual Report on Form 20-F 2023
Risk Risk description Level of risk Treasury and tax Unilever is exposed to a variety of external financial risks in relation to Treasury and Tax. The relative value of currencies can fluctuate widely and could have a significant impact on business results. Further, because Unilever consolidates its financial statements in euros it is subject to exchange risks associated with the translation of the underlying net assets and earnings of its foreign subsidiaries. We are also subject to the imposition of exchange controls by individual countries which could limit our ability to import materials paid in foreign currency or to remit dividends to the parent company. A material shortfall in our cash flow could undermine Unilever’s credit rating, impair investor confidence and restrict Unilever’s ability to raise funds. In times of financial crisis, there is a further risk that we may not be able to raise funds due to market illiquidity. We are exposed to counter-party risks with banks, suppliers and customers, which could result in financial losses. Tax is a complex and evolving area where laws and their interpretation are changing regularly, leading to the risk of unexpected tax exposures. International tax reform remains a key focus of attention. No change Ethical Unilever’s brands and reputation are valuable assets and the way in which we operate, contribute to society and engage with the world around us is always under scrutiny both internally and externally. Acting in an ethical manner, consistent with the expectations of customers, consumers and other stakeholders, is essential for the protection of the reputation of Unilever and its brands. A key element of our ethical approach to business is to reduce inequality and promote fairness. Our activities touch the lives of millions of people and it is our responsibility to protect their rights and help them live well. The safety of our employees and the people and communities we work with is critical. Failure to meet these high standards could result in damage to Unilever’s corporate reputation and business results. No change STRATEGIC REPORT CORPORATE GOVERNANCE FINANCIAL STATEMENTS Our Principal Risks Unilever Annual Report on Form 20-F 2023 77
Risk Risk description Level of risk Legal and regulatory Compliance with laws and regulations is an essential part of Unilever’s business operations. Unilever is subject to national and regional laws and regulations in such diverse areas as regulations relating to environmental compliance (e.g. greenwashing), product safety, product claims, trademarks, copyright, patents, competition, health and safety, data privacy, corporate governance, listing and disclosure, employment and taxes. Failure to comply with laws and regulations could expose Unilever to civil and/or criminal actions leading to damages, fines and criminal sanctions against us and/or our employees with possible consequences for our corporate reputation. Changes to laws and regulations could have a material impact on the cost of doing business. No change STRATEGIC REPORT CORPORATE GOVERNANCE FINANCIAL STATEMENTS Our Principal Risks 78 Unilever Annual Report on Form 20-F 2023

Viability statement The Directors have reviewed the long-term prospects of the Group in order to assess its viability. This review incorporated the activities and key risks of the Group together with the factors likely to affect the Group’s future development, performance, financial position, cash flows, liquidity position and borrowing facilities as described on pages 1 to 64. In addition, we describe in notes 15 to 18 on pages 203 to 218 the Group’s objectives, policies and processes for managing its capital, its financial risk management objectives, details of its financial instruments and hedging activities and its exposures to credit and liquidity risk. Assessment In order to report on the long-term viability of the Group, the Directors reviewed the overall funding capacity and headroom available to withstand severe events and carried out a robust assessment of the principal risks facing the Group, including those that would threaten its business model, future performance, solvency or liquidity. This includes consideration of external factors such as rises in inflation and slowing GDP growth. The risks and mitigating factors are summarised on pages 71 to 78. The viability assessment has three parts: ■ First, the Directors considered the period over which they have a reasonable expectation that the Group will continue to operate and meet its liabilities; ■ Second, they considered the current debt facilities and debt headroom over the viability period, assuming that any debt maturing can be re-financed at commercially acceptable terms; and ■ Third, they considered the potential impact of severe but plausible scenarios over this period including: ■ assessing scenarios for each individual principal risk, for example the termination of our relationships with the three largest global customers; the loss of all material litigation cases; a major IT data breach; the lost cost and growth opportunities from not keeping up with technological changes and increase in physical climate risks including its impact on operational costs; and ■ assessing scenarios that involve more than one principal risk including the following multi-risk scenarios: Multi-risk scenarios modelled Level of severity reviewed Link to principal risk Contamination issue with one of our brands caused by regulated ingredients and the temporary closure of three of our largest factories. Significant reduction in sales for some of the Business Groups along with percolating impact on other brands and closure of three of our largest factories for a period of six months. ■ Safe and high-quality products ■ Brand preference ■ Supply chain Geopolitical tensions leading to a major global incident affecting the availability of key materials from a location and increasing polarisation of issues leading to loss of reputation. Closure of a key geographic market impacting availability of raw materials and impact on turnover arising from reputational loss due to polarisation of issues. ■ Economic and political instability ■ Supply chain Climate change-related flooding driving closure of a key sourcing unit and significant water shortages in key markets. Closure of a sourcing unit for a period of six months and significant water shortages causing supply chain disruption in water-stressed sites and changing consumer preference towards water-efficient products. ■ Climate change ■ Supply chain ■ Brand preference Cyber-attack causing a sustained shutdown of manufacturing systems and the impact on profit if management failed to deliver a major transformation project. Loss of turnover coupled with reduced margins and ongoing reputational damage and loss of confidence from our customers and consumers. ■ Systems and information ■ Business transformation Findings ■ Firstly, a three-year period is considered appropriate for this viability assessment because it is the period covered by the strategic plan; and it enables a high level of confidence in assessing viability, even in extreme adverse events, due to factors such as: ■ the Group has considerable financial resources together with established business relationships with many customers and suppliers in countries throughout the world; ■ high cash generation by the Group’s operations and access to the external debt markets; ■ flexibility of cash outflow with respect to significant marketing programmes and capital expenditure projects which usually have a two-to-three year horizon; and ■ the Group’s diverse product and geographical activities which are impacted by continuously evolving technology and innovation. ■ Secondly, the Group’s debt headroom and funding profile was assessed. None of the future outlooks considered resulted in significant liquidity headroom issues, primarily because: ■ the Group has a healthy balance of short-term and long-term debt programmes, with repayment profiles ensuring short- term commercial paper maturities do not exceed €0.5 billion in any given week and long-term debt maturities do not exceed €4.0 billion in any given calendar year ■ the Group has the equivalent of €7.3 billion in committed credit facilities with a maturity of 364 days which are used for backing up our commercial paper programmes. ■ Thirdly, for each of our 14 principal risks, one of which is climate, worst-case plausible scenarios have been assessed together with multi-risk scenarios. None of the scenarios reviewed, either individually or in aggregate would cause Unilever to cease to be viable. Conclusion On the basis described above, the Directors have a reasonable expectation that the Group will be able to continue in operation and meet its liabilities as they fall due over the three-year period of their assessment. STRATEGIC REPORT CORPORATE GOVERNANCE FINANCIAL STATEMENTS Our Principal Risks Unilever Annual Report on Form 20-F 2023 79
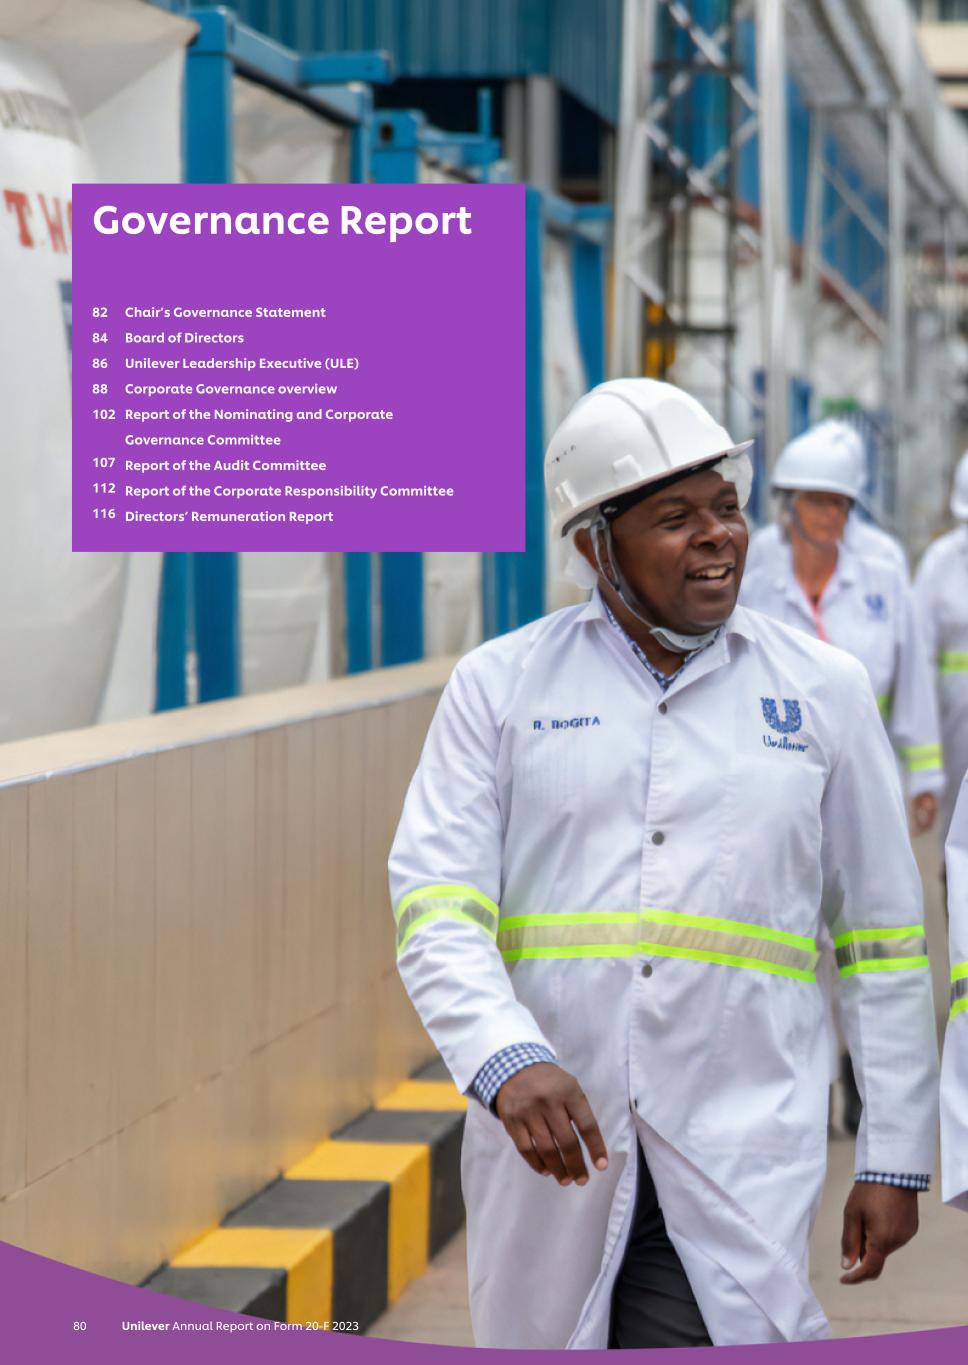
Governance Report 82 Chair’s Governance Statement 84 Board of Directors 86 Unilever Leadership Executive (ULE) 88 Corporate Governance overview 102 Report of the Nominating and Corporate Governance Committee 107 Report of the Audit Committee 112 Report of the Corporate Responsibility Committee 116 Directors’ Remuneration Report 80 Unilever Annual Report on Form 20-F 2023
Unilever Annual Report on Form 20-F 2023 81
Ian Meakins Chair I am pleased to present the Governance Report for 2023. In doing so I must give further thanks to Nils Andersen, as Chair of the Company until the end of November, for the legacy of strong corporate governance at Unilever that he passes on to me. The priority of the Board in relation to governance in the past year has been establishing effective succession and providing support to the Board changes. As I mentioned in my Chair's statement, Hein Schumacher became CEO on 1 July 2023 and I became Chair on 1 December 2023. We are also delighted that Fernando Fernandez became CFO on 1 January 2024. I am grateful for all the support that I have received and continue to receive from the other Board members in my new role and the Board gives its full support to Hein and Fernando. Alongside succession, the Board has conducted a review of strategy and approved the Growth Action Plan for the business as already set out in this report. The Growth Action Plan is designed to take Unilever on the next stage of its growth journey. Alongside this our sustainability goals have been clarified which are key to good stewardship and these are set out in our updated Climate Transition Action Plan which we are putting to shareholders at the 2024 AGM. We have a continued commitment to strong corporate governance The culture of strong governance within Unilever is a strength that I will strive to maintain. Looking externally we have consulted with shareholders this year on executive remuneration, including the revised Remuneration Policy, and the revised Climate Transition Action Plan and this has informed the changes that are being put to shareholders at the 2024 AGM. In addition, our Code of Business Principles establishes the foundation of our culture within the company, strengthened by our historical roots, and informs our way of working in everything that we do. We are committed to diversity and inclusion as not only reflecting our values but also what is best for the business. My responsibility as Chair is to provide the leadership to ensure that the Board works effectively with the executive team to focus on the forward looking strategy of the Company and achieving high standards of corporate governance. I believe that the Board changes we have made together with the Growth Action Plan for performance provide a strong basis for success. Our refocused work on sustainability is designed to support both our corporate governance and our Growth Action Plan. Ian Meakins Chair STRATEGIC REPORT CORPORATE GOVERNANCE FINANCIAL STATEMENTS Chair's Governance statement 82 Unilever Annual Report on Form 20-F 2023
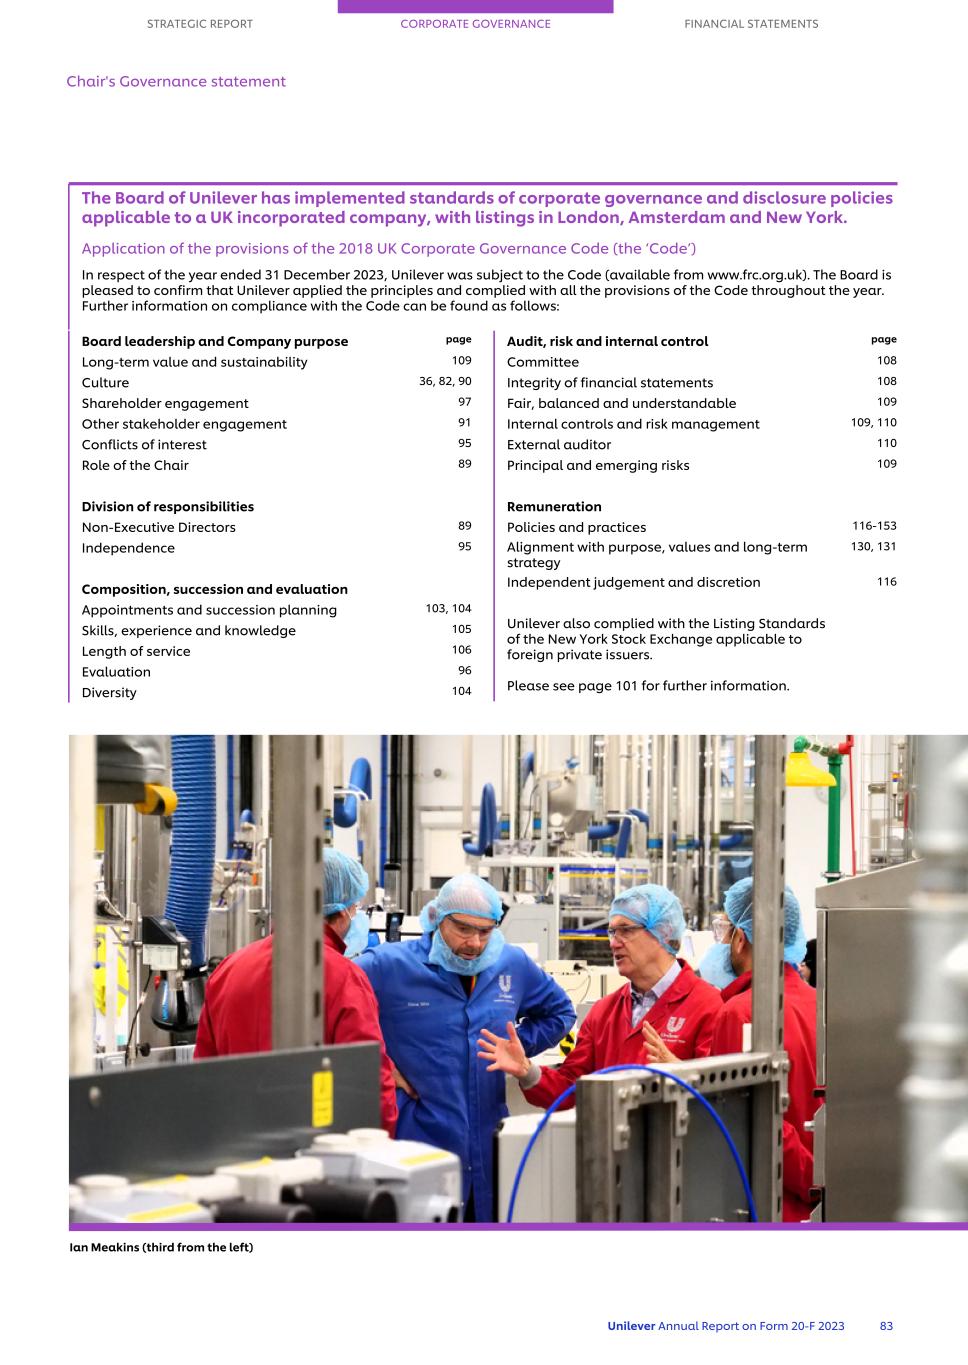
The Board of Unilever has implemented standards of corporate governance and disclosure policies applicable to a UK incorporated company, with listings in London, Amsterdam and New York. Application of the provisions of the 2018 UK Corporate Governance Code (the ‘Code’) In respect of the year ended 31 December 2023, Unilever was subject to the Code (available from www.frc.org.uk). The Board is pleased to confirm that Unilever applied the principles and complied with all the provisions of the Code throughout the year. Further information on compliance with the Code can be found as follows: STRATEGIC REPORT CORPORATE GOVERNANCE FINANCIAL STATEMENTS Chair's Governance statement Unilever Annual Report on Form 20-F 2023 83 Board leadership and Company purpose page Long-term value and sustainability 109 Culture 36, 82, 90 Shareholder engagement 97 Other stakeholder engagement 91 Conflicts of interest 95 Role of the Chair 89 Division of responsibilities Non-Executive Directors 89 Independence 95 Composition, succession and evaluation Appointments and succession planning 103, 104 Skills, experience and knowledge 105 Length of service 106 Evaluation 96 Diversity 104 Audit, risk and internal control page Committee 108 Integrity of financial statements 108 Fair, balanced and understandable 109 Internal controls and risk management 109, 110 External auditor 110 Principal and emerging risks 109 Remuneration Policies and practices 116-153 Alignment with purpose, values and long-term strategy 130, 131 Independent judgement and discretion 116 Unilever also complied with the Listing Standards of the New York Stock Exchange applicable to foreign private issuers. Please see page 101 for further information. Ian Meakins (third from the left)
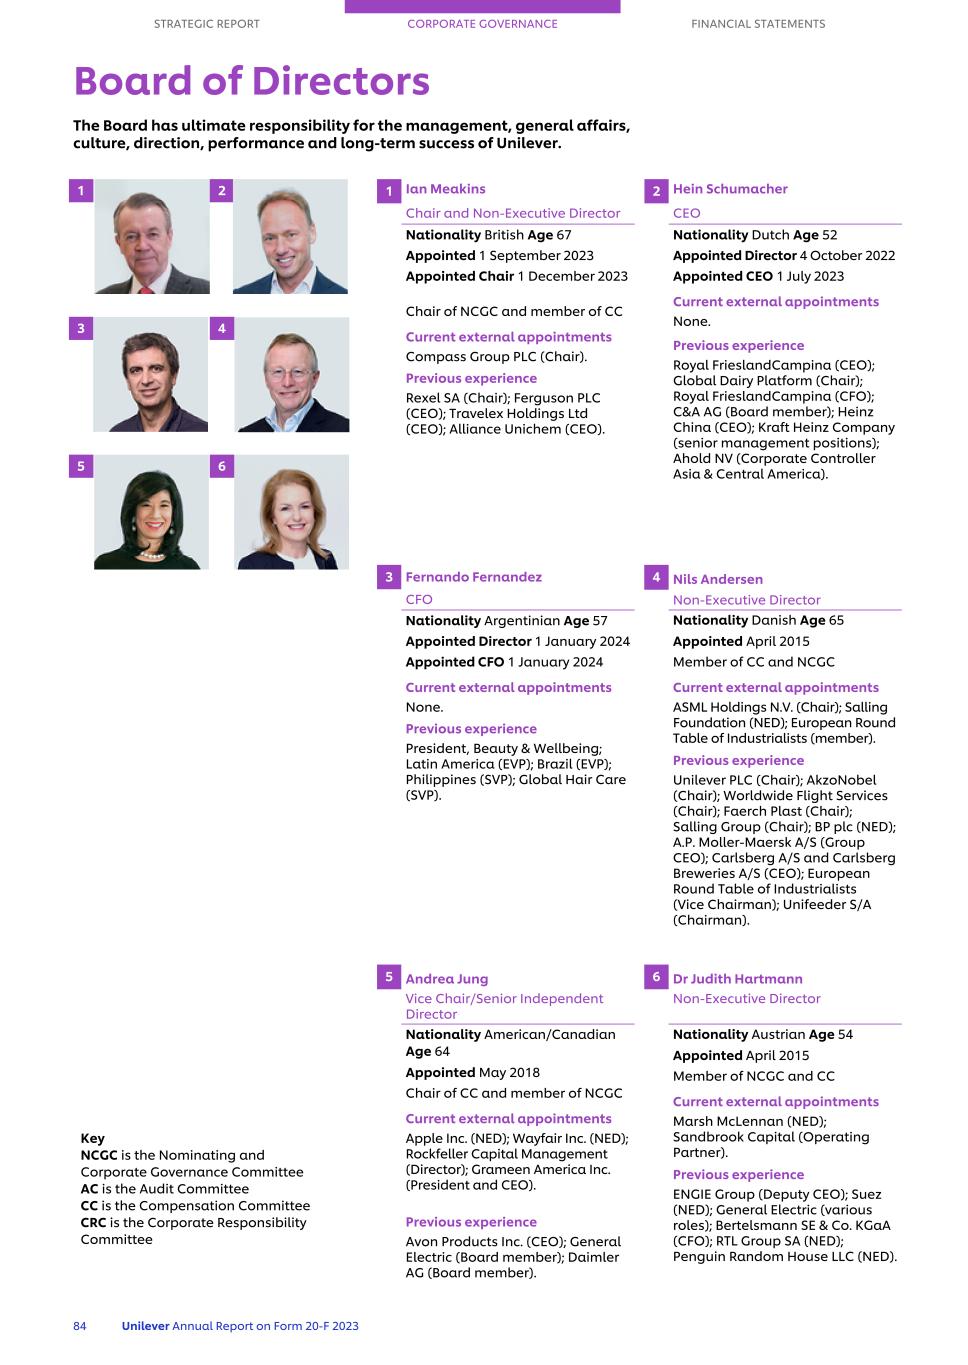
STRATEGIC REPORT CORPORATE GOVERNANCE FINANCIAL STATEMENTS Board of Directors The Board has ultimate responsibility for the management, general affairs, culture, direction, performance and long-term success of Unilever. 84 Unilever Annual Report on Form 20-F 2023 5 6 3 4 1 2 1 Ian Meakins Chair and Non-Executive Director Nationality British Age 67 Appointed 1 September 2023 Appointed Chair 1 December 2023 Chair of NCGC and member of CC Current external appointments Compass Group PLC (Chair). Previous experience Rexel SA (Chair); Ferguson PLC (CEO); Travelex Holdings Ltd (CEO); Alliance Unichem (CEO). 3 Fernando Fernandez CFO Nationality Argentinian Age 57 Appointed Director 1 January 2024 Appointed CFO 1 January 2024 Current external appointments None. Previous experience President, Beauty & Wellbeing; Latin America (EVP); Brazil (EVP); Philippines (SVP); Global Hair Care (SVP). 4 Nils Andersen Non-Executive Director Nationality Danish Age 65 Appointed April 2015 Member of CC and NCGC Current external appointments ASML Holdings N.V. (Chair); Salling Foundation (NED); European Round Table of Industrialists (member). Previous experience Unilever PLC (Chair); AkzoNobel (Chair); Worldwide Flight Services (Chair); Faerch Plast (Chair); Salling Group (Chair); BP plc (NED); A.P. Moller-Maersk A/S (Group CEO); Carlsberg A/S and Carlsberg Breweries A/S (CEO); European Round Table of Industrialists (Vice Chairman); Unifeeder S/A (Chairman). 6 Dr Judith Hartmann Non-Executive Director Nationality Austrian Age 54 Appointed April 2015 Member of NCGC and CC Current external appointments Marsh McLennan (NED); Sandbrook Capital (Operating Partner). Previous experience ENGIE Group (Deputy CEO); Suez (NED); General Electric (various roles); Bertelsmann SE & Co. KGaA (CFO); RTL Group SA (NED); Penguin Random House LLC (NED). 2 Hein Schumacher CEO Nationality Dutch Age 52 Appointed Director 4 October 2022 Appointed CEO 1 July 2023 Current external appointments None. Previous experience Royal FrieslandCampina (CEO); Global Dairy Platform (Chair); Royal FrieslandCampina (CFO); C&A AG (Board member); Heinz China (CEO); Kraft Heinz Company (senior management positions); Ahold NV (Corporate Controller Asia & Central America). 5 Andrea Jung Vice Chair/Senior Independent Director Nationality American/Canadian Age 64 Appointed May 2018 Chair of CC and member of NCGC Current external appointments Apple Inc. (NED); Wayfair Inc. (NED); Rockfeller Capital Management (Director); Grameen America Inc. (President and CEO). Previous experience Avon Products Inc. (CEO); General Electric (Board member); Daimler AG (Board member). Key NCGC is the Nominating and Corporate Governance Committee AC is the Audit Committee CC is the Compensation Committee CRC is the Corporate Responsibility Committee

STRATEGIC REPORT CORPORATE GOVERNANCE FINANCIAL STATEMENTS Board of Directors Unilever Annual Report on Form 20-F 2023 85 9 10 11 12 7 87 Adrian Hennah Non-Executive Director Nationality British Age 66 Appointed November 2021 Chair AC Current external appointments J Sainsbury plc (NED); Oxford Nanopore Technologies plc (NED). Previous experience Reckitt Benckiser Group plc (Executive Director & CFO); RELX plc (NED). 8 Susan Kilsby Non-Executive Director Nationality American/British Age 64 Appointed August 2019 Member of AC Current external appointments COFRA Holding AG (NED); Fortune Brands Innovations (Chair); Diageo plc (SID); UK Takeover Panel. Previous experience NHS England (NED); BBA Aviation (SID); BHP plc (SID); L’Occitane International (NED); Keurig Green Mountain (NED); Coca-Cola HBC AG (NED); Goldman Sachs International (NED); Shire plc (Chair); Mergers and Acquisitions, EMEA – Credit Suisse (Chair). 9 Ruby Lu Non-Executive Director Nationality Chinese Age 53 Appointed November 2021 Member of AC Current external appointments Uxin Limited (NED); Yum China Holdings Inc. (NED); Volvo Car AB (Board Member). Previous experience iKang Healthcare Group (NED); Blue City Holdings Limited (NED). 10 Strive Masiyiwa Non-Executive Director Nationality Zimbabwean Age 63 Appointed April 2016 Chair CRC Current external appointments Econet Global (Executive Chairman); Netflix Inc. (NED); International Advisory Board of Bank of America (Board member); Stanford University Advisory Board (Board member); National Geographic Society (Board member). Previous experience Africa Against Ebola Solidarity Trust (Co-Founder and Chairman); Grow Africa (Co-Chairman); Nutrition International (Chairman); Rockefeller Foundation (Trustee). 11 Professor Youngme Moon Non-Executive Director Nationality American, Age 59 Appointed April 2016 Member of CRC Current external appointments Mastercard Inc. (Board member); Sweetgreen Inc. (Board member); Jand Inc. (Warby Parker) (Board member); Harvard Business School (Professor). Previous experience Harvard Business School (Chair and Senior Associate Dean for the MBA Program); Massachusetts Institute of Technology (Professor); Avid Technology (NED); Rakuten Inc. (NED). 12 Nelson Peltz Non-Executive Director Nationality American, Age 81 Appointed July 2022 Member of CC Current external appointments Madison Square Garden Sports Corp. (NED); Trian Fund Management, L.P. (CEO & Founding Partner); The Wendy's Company (Non-Executive Chairman); Legg Mason, Inc. (NED). Previous experience Janus Henderson Group plc (NED); Invesco Ltd. (NED); The Procter & Gamble Company (NED); Sysco Corporation (NED); Ingersoll Rand plc (NED); H.J. Heinz Company (NED); Triarc Companies, Inc. (CEO & Chairman). Changes to the Board effective 31 December 2023 Graeme Pitkethly left role as Chief Financial Officer and retired as a Director. He remains with Unilever until 31 May 2024. Changes to the Board effective 1 March 2024 Judith McKenna joined the Board as a Non-Executive Director.
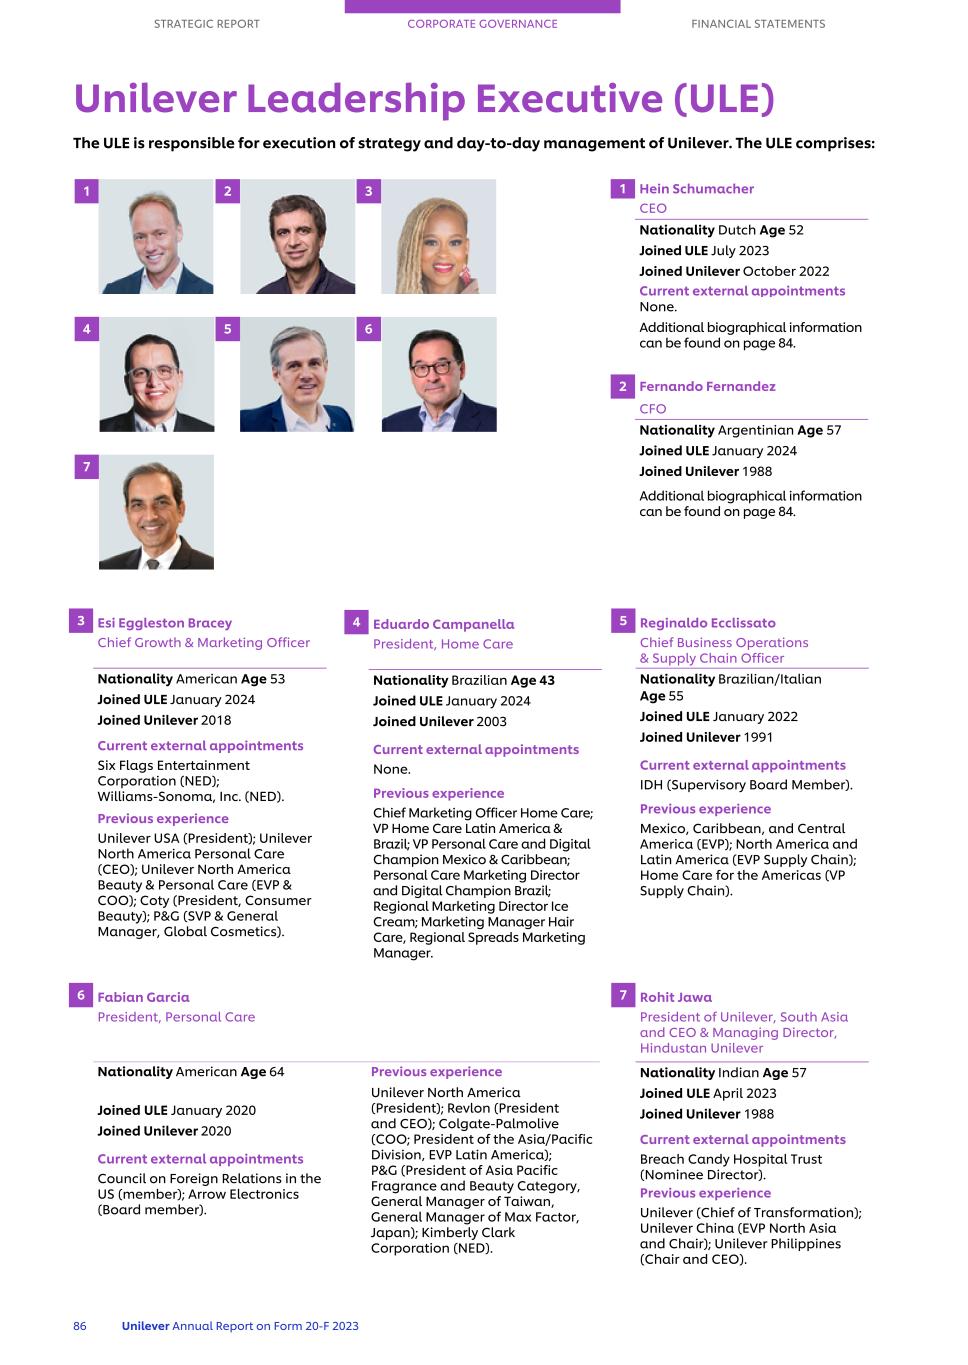
1 2 3 STRATEGIC REPORT CORPORATE GOVERNANCE FINANCIAL STATEMENTS Unilever Leadership Executive (ULE) The ULE is responsible for execution of strategy and day-to-day management of Unilever. The ULE comprises: 86 Unilever Annual Report on Form 20-F 2023 7 4 5 6 3 Esi Eggleston Bracey Chief Growth & Marketing Officer Nationality American Age 53 Joined ULE January 2024 Joined Unilever 2018 Current external appointments Six Flags Entertainment Corporation (NED); Williams-Sonoma, Inc. (NED). Previous experience Unilever USA (President); Unilever North America Personal Care (CEO); Unilever North America Beauty & Personal Care (EVP & COO); Coty (President, Consumer Beauty); P&G (SVP & General Manager, Global Cosmetics). 7 Rohit Jawa President of Unilever, South Asia and CEO & Managing Director, Hindustan Unilever Nationality Indian Age 57 Joined ULE April 2023 Joined Unilever 1988 Current external appointments Breach Candy Hospital Trust (Nominee Director). Previous experience Unilever (Chief of Transformation); Unilever China (EVP North Asia and Chair); Unilever Philippines (Chair and CEO). 4 Eduardo Campanella President, Home Care Nationality Brazilian Age 43 Joined ULE January 2024 Joined Unilever 2003 Current external appointments None. Previous experience Chief Marketing Officer Home Care; VP Home Care Latin America & Brazil; VP Personal Care and Digital Champion Mexico & Caribbean; Personal Care Marketing Director and Digital Champion Brazil; Regional Marketing Director Ice Cream; Marketing Manager Hair Care, Regional Spreads Marketing Manager. 5 Reginaldo Ecclissato Chief Business Operations & Supply Chain Officer Nationality Brazilian/Italian Age 55 Joined ULE January 2022 Joined Unilever 1991 Current external appointments IDH (Supervisory Board Member). Previous experience Mexico, Caribbean, and Central America (EVP); North America and Latin America (EVP Supply Chain); Home Care for the Americas (VP Supply Chain). 6 Fabian Garcia President, Personal Care Nationality American Age 64 Previous experience Unilever North America (President); Revlon (President and CEO); Colgate-Palmolive (COO; President of the Asia/Pacific Division, EVP Latin America); P&G (President of Asia Pacific Fragrance and Beauty Category, General Manager of Taiwan, General Manager of Max Factor, Japan); Kimberly Clark Corporation (NED). Joined ULE January 2020 Joined Unilever 2020 Current external appointments Council on Foreign Relations in the US (member); Arrow Electronics (Board member). 1 Hein Schumacher CEO Nationality Dutch Age 52 Joined ULE July 2023 Joined Unilever October 2022 Current external appointments None. Additional biographical information can be found on page 84. 2 Fernando Fernandez CFO Nationality Argentinian Age 57 Joined ULE January 2024 Joined Unilever 1988 Additional biographical information can be found on page 84.
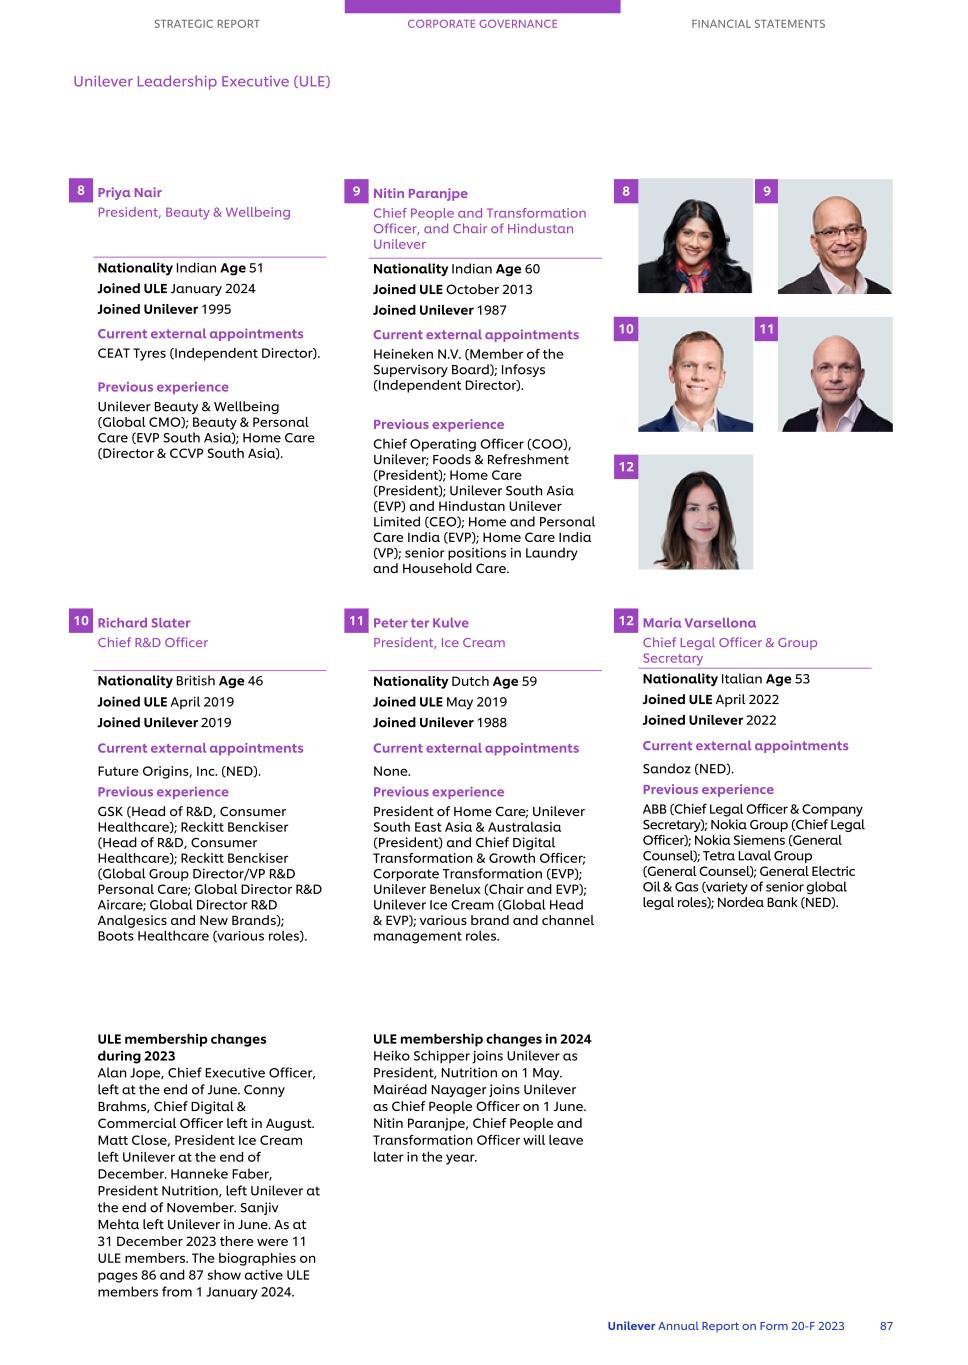
STRATEGIC REPORT CORPORATE GOVERNANCE FINANCIAL STATEMENTS Unilever Leadership Executive (ULE) Unilever Annual Report on Form 20-F 2023 87 8 9 12 10 11 9 Nitin Paranjpe Chief People and Transformation Officer, and Chair of Hindustan Unilever Nationality Indian Age 60 Joined ULE October 2013 Joined Unilever 1987 Current external appointments Heineken N.V. (Member of the Supervisory Board); Infosys (Independent Director). Previous experience Chief Operating Officer (COO), Unilever; Foods & Refreshment (President); Home Care (President); Unilever South Asia (EVP) and Hindustan Unilever Limited (CEO); Home and Personal Care India (EVP); Home Care India (VP); senior positions in Laundry and Household Care. 10 Richard Slater Chief R&D Officer Nationality British Age 46 Joined ULE April 2019 Joined Unilever 2019 Current external appointments Future Origins, Inc. (NED). Previous experience GSK (Head of R&D, Consumer Healthcare); Reckitt Benckiser (Head of R&D, Consumer Healthcare); Reckitt Benckiser (Global Group Director/VP R&D Personal Care; Global Director R&D Aircare; Global Director R&D Analgesics and New Brands); Boots Healthcare (various roles). 8 Priya Nair President, Beauty & Wellbeing Nationality Indian Age 51 Joined ULE January 2024 Joined Unilever 1995 Current external appointments CEAT Tyres (Independent Director). Previous experience Unilever Beauty & Wellbeing (Global CMO); Beauty & Personal Care (EVP South Asia); Home Care (Director & CCVP South Asia). 11 Peter ter Kulve President, Ice Cream Nationality Dutch Age 59 Joined ULE May 2019 Joined Unilever 1988 Current external appointments None. Previous experience President of Home Care; Unilever South East Asia & Australasia (President) and Chief Digital Transformation & Growth Officer; Corporate Transformation (EVP); Unilever Benelux (Chair and EVP); Unilever Ice Cream (Global Head & EVP); various brand and channel management roles. 12 Maria Varsellona Chief Legal Officer & Group Secretary Nationality Italian Age 53 Joined ULE April 2022 Joined Unilever 2022 Current external appointments Sandoz (NED). Previous experience ABB (Chief Legal Officer & Company Secretary); Nokia Group (Chief Legal Officer); Nokia Siemens (General Counsel); Tetra Laval Group (General Counsel); General Electric Oil & Gas (variety of senior global legal roles); Nordea Bank (NED). ULE membership changes during 2023 Alan Jope, Chief Executive Officer, left at the end of June. Conny Brahms, Chief Digital & Commercial Officer left in August. Matt Close, President Ice Cream left Unilever at the end of December. Hanneke Faber, President Nutrition, left Unilever at the end of November. Sanjiv Mehta left Unilever in June. As at 31 December 2023 there were 11 ULE members. The biographies on pages 86 and 87 show active ULE members from 1 January 2024. ULE membership changes in 2024 Heiko Schipper joins Unilever as President, Nutrition on 1 May. Mairéad Nayager joins Unilever as Chief People Officer on 1 June. Nitin Paranjpe, Chief People and Transformation Officer will leave later in the year.
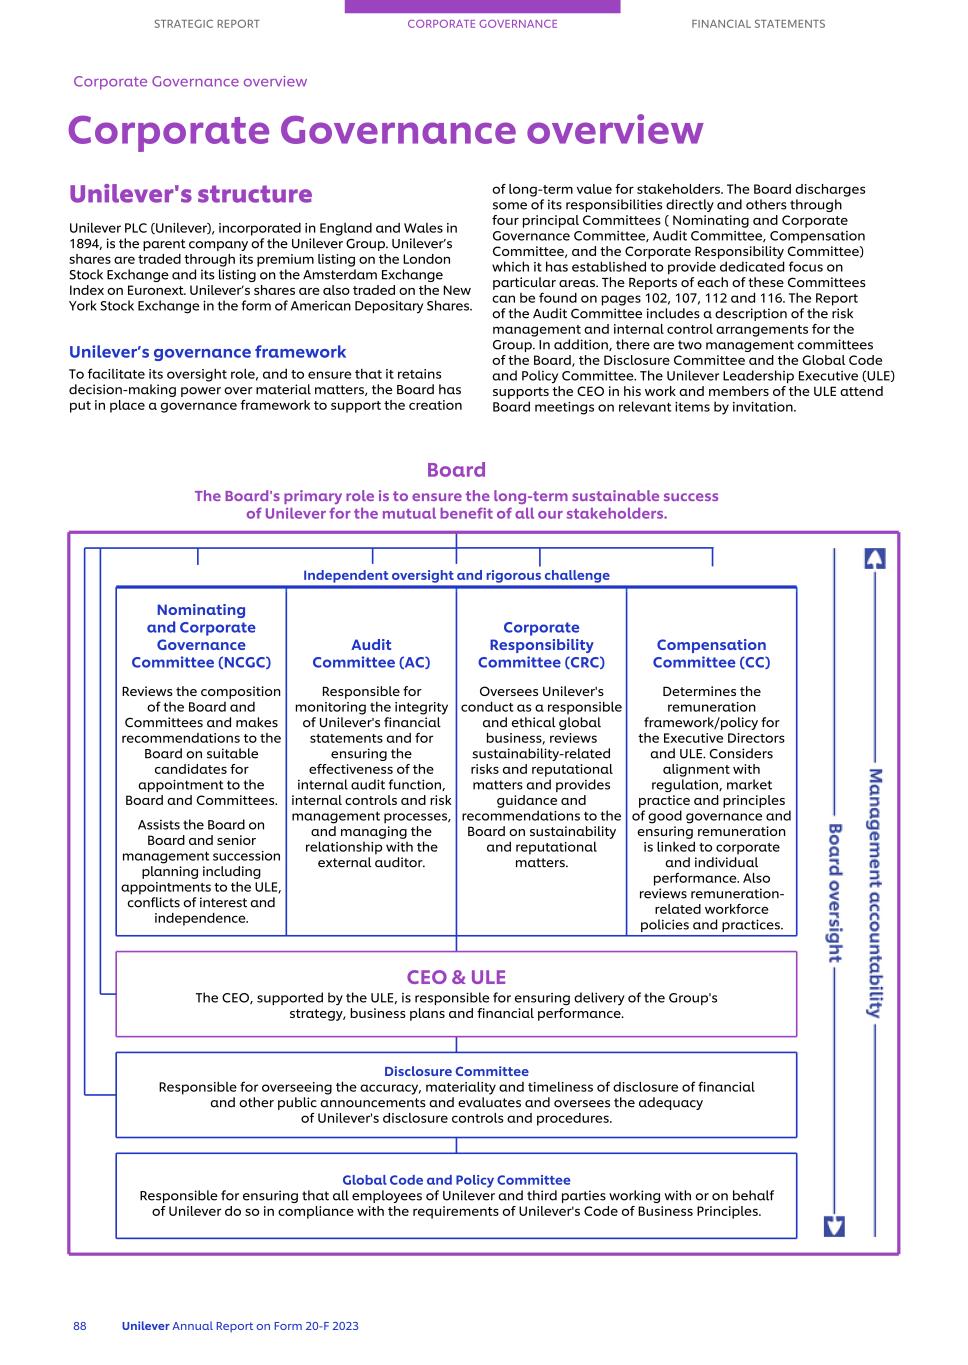
Unilever's structure Unilever PLC (Unilever), incorporated in England and Wales in 1894, is the parent company of the Unilever Group. Unilever’s shares are traded through its premium listing on the London Stock Exchange and its listing on the Amsterdam Exchange Index on Euronext. Unilever’s shares are also traded on the New York Stock Exchange in the form of American Depositary Shares. Unilever’s governance framework To facilitate its oversight role, and to ensure that it retains decision-making power over material matters, the Board has put in place a governance framework to support the creation of long-term value for stakeholders. The Board discharges some of its responsibilities directly and others through four principal Committees ( Nominating and Corporate Governance Committee, Audit Committee, Compensation Committee, and the Corporate Responsibility Committee) which it has established to provide dedicated focus on particular areas. The Reports of each of these Committees can be found on pages 102, 107, 112 and 116. The Report of the Audit Committee includes a description of the risk management and internal control arrangements for the Group. In addition, there are two management committees of the Board, the Disclosure Committee and the Global Code and Policy Committee. The Unilever Leadership Executive (ULE) supports the CEO in his work and members of the ULE attend Board meetings on relevant items by invitation. Board The Board's primary role is to ensure the long-term sustainable success of Unilever for the mutual benefit of all our stakeholders. Independent oversight and rigorous challenge Nominating and Corporate Governance Committee (NCGC) Audit Committee (AC) Corporate Responsibility Committee (CRC) Compensation Committee (CC) Reviews the composition of the Board and Committees and makes recommendations to the Board on suitable candidates for appointment to the Board and Committees. Assists the Board on Board and senior management succession planning including appointments to the ULE, conflicts of interest and independence. Responsible for monitoring the integrity of Unilever's financial statements and for ensuring the effectiveness of the internal audit function, internal controls and risk management processes, and managing the relationship with the external auditor. Oversees Unilever's conduct as a responsible and ethical global business, reviews sustainability-related risks and reputational matters and provides guidance and recommendations to the Board on sustainability and reputational matters. Determines the remuneration framework/policy for the Executive Directors and ULE. Considers alignment with regulation, market practice and principles of good governance and ensuring remuneration is linked to corporate and individual performance. Also reviews remuneration- related workforce policies and practices. CEO & ULE The CEO, supported by the ULE, is responsible for ensuring delivery of the Group's strategy, business plans and financial performance. Disclosure Committee Responsible for overseeing the accuracy, materiality and timeliness of disclosure of financial and other public announcements and evaluates and oversees the adequacy of Unilever's disclosure controls and procedures. Global Code and Policy Committee Responsible for ensuring that all employees of Unilever and third parties working with or on behalf of Unilever do so in compliance with the requirements of Unilever's Code of Business Principles. STRATEGIC REPORT CORPORATE GOVERNANCE FINANCIAL STATEMENTS Corporate Governance overview 88 Unilever Annual Report on Form 20-F 2023 Corporate Governance overview
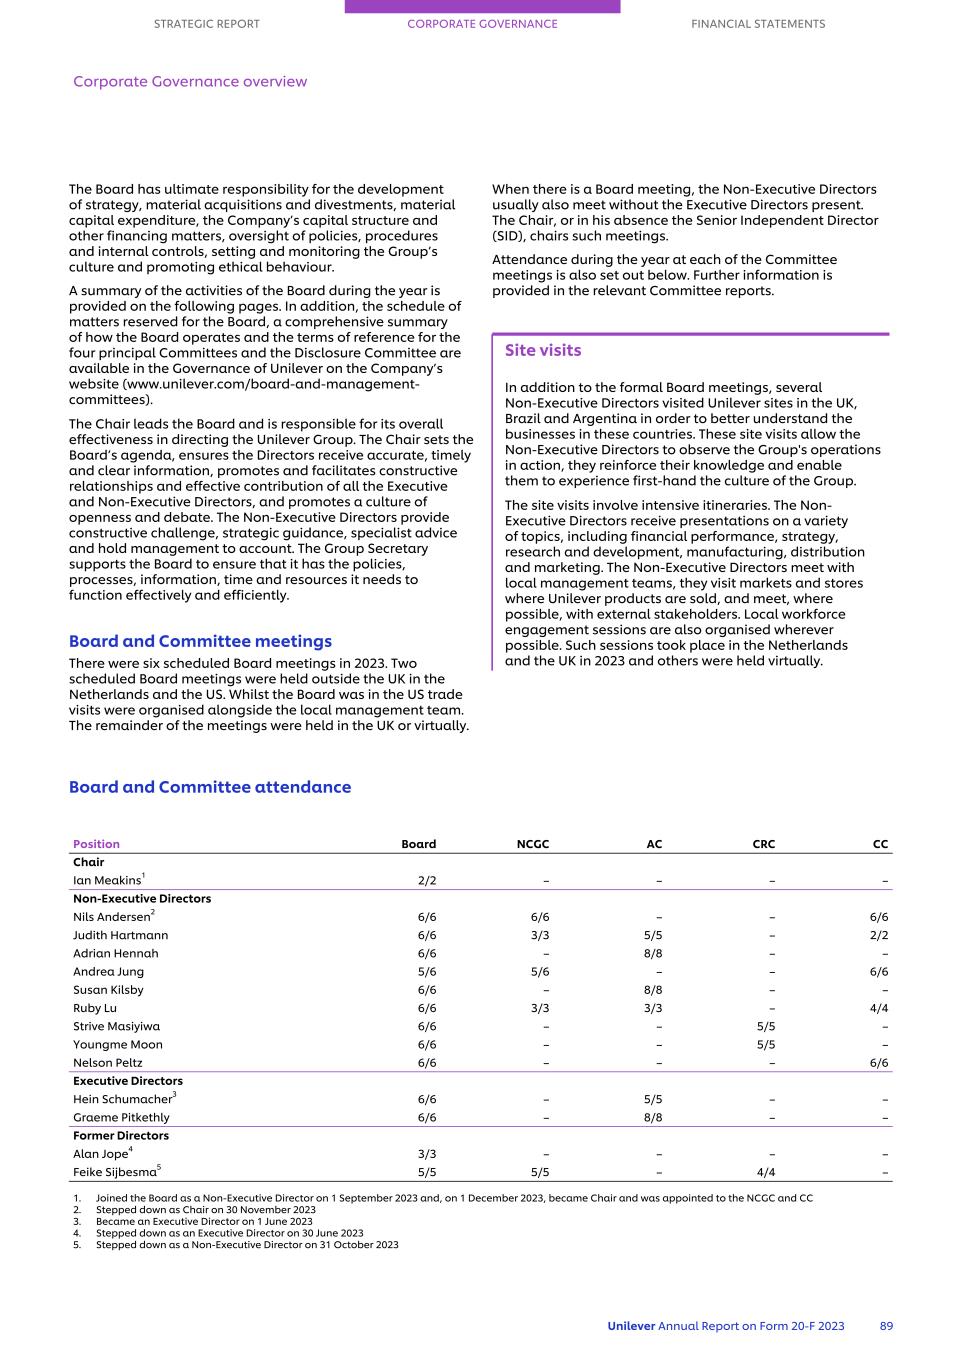
The Board has ultimate responsibility for the development of strategy, material acquisitions and divestments, material capital expenditure, the Company’s capital structure and other financing matters, oversight of policies, procedures and internal controls, setting and monitoring the Group’s culture and promoting ethical behaviour. A summary of the activities of the Board during the year is provided on the following pages. In addition, the schedule of matters reserved for the Board, a comprehensive summary of how the Board operates and the terms of reference for the four principal Committees and the Disclosure Committee are available in the Governance of Unilever on the Company’s website (www.unilever.com/board-and-management- committees). The Chair leads the Board and is responsible for its overall effectiveness in directing the Unilever Group. The Chair sets the Board’s agenda, ensures the Directors receive accurate, timely and clear information, promotes and facilitates constructive relationships and effective contribution of all the Executive and Non-Executive Directors, and promotes a culture of openness and debate. The Non-Executive Directors provide constructive challenge, strategic guidance, specialist advice and hold management to account. The Group Secretary supports the Board to ensure that it has the policies, processes, information, time and resources it needs to function effectively and efficiently. Board and Committee meetings There were six scheduled Board meetings in 2023. Two scheduled Board meetings were held outside the UK in the Netherlands and the US. Whilst the Board was in the US trade visits were organised alongside the local management team. The remainder of the meetings were held in the UK or virtually. When there is a Board meeting, the Non-Executive Directors usually also meet without the Executive Directors present. The Chair, or in his absence the Senior Independent Director (SID), chairs such meetings. Attendance during the year at each of the Committee meetings is also set out below. Further information is provided in the relevant Committee reports. Site visits In addition to the formal Board meetings, several Non-Executive Directors visited Unilever sites in the UK, Brazil and Argentina in order to better understand the businesses in these countries. These site visits allow the Non-Executive Directors to observe the Group's operations in action, they reinforce their knowledge and enable them to experience first-hand the culture of the Group. The site visits involve intensive itineraries. The Non- Executive Directors receive presentations on a variety of topics, including financial performance, strategy, research and development, manufacturing, distribution and marketing. The Non-Executive Directors meet with local management teams, they visit markets and stores where Unilever products are sold, and meet, where possible, with external stakeholders. Local workforce engagement sessions are also organised wherever possible. Such sessions took place in the Netherlands and the UK in 2023 and others were held virtually. Board and Committee attendance Position Board NCGC AC CRC CC Chair Ian Meakins1 2/2 – – – – Non-Executive Directors Nils Andersen2 6/6 6/6 – – 6/6 Judith Hartmann 6/6 3/3 5/5 – 2/2 Adrian Hennah 6/6 – 8/8 – – Andrea Jung 5/6 5/6 – – 6/6 Susan Kilsby 6/6 – 8/8 – – Ruby Lu 6/6 3/3 3/3 – 4/4 Strive Masiyiwa 6/6 – – 5/5 – Youngme Moon 6/6 – – 5/5 – Nelson Peltz 6/6 – – – 6/6 Executive Directors Hein Schumacher3 6/6 – 5/5 – – Graeme Pitkethly 6/6 – 8/8 – – Former Directors Alan Jope4 3/3 – – – – Feike Sijbesma5 5/5 5/5 – 4/4 – 1. Joined the Board as a Non-Executive Director on 1 September 2023 and, on 1 December 2023, became Chair and was appointed to the NCGC and CC 2. Stepped down as Chair on 30 November 2023 3. Became an Executive Director on 1 June 2023 4. Stepped down as an Executive Director on 30 June 2023 5. Stepped down as a Non-Executive Director on 31 October 2023 STRATEGIC REPORT CORPORATE GOVERNANCE FINANCIAL STATEMENTS Corporate Governance overview Unilever Annual Report on Form 20-F 2023 89

Board focus During the year, the Board considered a comprehensive programme of regular matters drawn from the schedule of matters reserved for the Board and the immediate and prospective operating environment. The Board also conducted a two day Strategy Review exercise in October 2023 including presentations and engagement sessions with both ULE members and other senior members of management. This focused in particular on: ■ the Company’s proposed Growth Action Plan and the constituent elements of this including business performance, the prioritisation of our power brands, productivity and simplicity, a more focused sustainability agenda and performance culture; ■ a review of each of our Business Groups; ■ the portfolio and a review of acquisitions; ■ the Company’s approach to research and development; and ■ our supply chain. The schedule below is not exhaustive and demonstrates the breadth of oversight provided by the Board. Some of the Board's key decisions in 2023 are discussed in more detail on pages 93 and 94. Strategy and business plan ■ Approved the Company’s Growth Action Plan to unlock potential through faster growth, productivity and simplicity including a new reward framework to dial up our performance culture; ■ Approved the acquisitions of Yasso Holdings Inc, a premium frozen Greek yoghurt brand in the USA, the premium haircare brand K18, and the disposals of Dollar Shave Club and Elida Beauty; ■ reviewed the Unilever strategy at Business Group level; and ■ reviewed the R&D strategy including the Group's innovation pipeline. Operational performance and financial management ■ regularly reviewed Unilever Group operational and financial performance and delivery against strategic objectives, business plans including budget and forecast, financial and non-financial KPIs and against analysts’ consensus and market guidance; ■ considered and approved quarterly dividends; ■ approved two share buy-back tranches in 2023 totalling €1.5bn and comprising the remaining part of the share buyback programme of up to €3bn in 2022 and 2023; and ■ considered and approved the issuance of new shares to be used to settle the vesting of share awards granted to employees under various employee share plans. Governance and external reporting ■ considered feedback from the Audit Committee in relation to significant judgements, fair, balanced and understandable assessment, going concern basis of preparation, viability statement and the reporting of non-financial KPIs in relation to sustainability reporting; ■ approved each of the quarterly results and the Annual Report and Accounts and Form 20-F; ■ approved the notice of meeting for the AGM; ■ following the 2023 AGM, where the resolution to receive and adopt the Directors’ Remuneration report had not been passed, oversaw consultation and communication with shareholders on executive pay; and ■ considered the work of the Nominating and Corporate Governance Committee on Board composition and succession planning and approved the appointments of Hein Schumacher as CEO, Ian Meakins as the Chair of the Company and Fernando Fernandez as the CFO. Culture and stakeholders ■ reviewed the 2023 workforce engagement programme covering both employees and employee representatives and considered feedback from the sessions; and ■ regularly reviewed investor feedback reports and analysts' reports. Society and sustainability ■ considered and approved the Modern Slavery Act Statement; ■ considered and supported preparation of the revised Climate Transition Action Plan to be put to shareholders at the 2024 AGM; and ■ reviewed the sustainability strategy and performance, including review of the regulatory development of sustainability reporting requirements and the Group's sustainability KPIs. Political and regulatory environment ■ received updates from external speakers on the macro environment from social and political perspectives and global security issues; and ■ received updates on emerging legislation and regulation. Risk and internal controls ■ considered feedback from the Audit Committee on its assessment of the ongoing effectiveness of the Group’s internal controls; and ■ reviewed the findings from the assessment of the Group’s register of principal risks and focus risks and approved the related risk management plans. STRATEGIC REPORT CORPORATE GOVERNANCE FINANCIAL STATEMENTS Corporate Governance overview 90 Unilever Annual Report on Form 20-F 2023 Andrea Jung, Vice Chair and Senior Independent Director

Stakeholder engagement Section 172: Company and Board engagement with stakeholders The information set out below, together with the information on pages 93 and 94 of this Governance Report, explains how the Board considers and engages with stakeholders. Together, these form our section 172 statement under the UK Companies Act 2006. Unilever at a glance on page 3 details the six stakeholder groups we have identified as critical to our future success: shareholders, our people, consumers, customers, suppliers & business partners and planet & society. Throughout the Strategic Report we have provided examples of how we engage with, and create value for, our stakeholders. Shareholders We aim to deliver consistent, competitive, profitable and responsible growth. ■ Quarterly results broadcasts ■ Conference presentations ■ Meetings and calls about aspects of business performance, consumer trends and sustainability issues. ■ Senior leaders and our Board speak directly to shareholders on a broad range of issues. For example, in 2023 we discussed our directors’ remuneration policy, our proposed updated Climate Transaction Plan and our Growth Action Plan with investors. ■ AGM ■ Meetings with shareholders on performance and key issues ■ The Board approve all quarterly results announcements and dividends ■ Unilever Investor Relations provide analysts' reports and investor feedback to the Board. See pages 93, 94 and 97 Our People Our 128,000 talented people give their skills and time in Unilever offices, factories and R&D laboratories – working in flexible and agile ways. ■ Through our UniVoice survey we engaged with around 106,000 office and factory-based employees in 2023 on topics such as culture, engagement, strategy, safety, careers and sustainability. ■ Continued our ‘Unilever Live’ sessions with our CEO and ULE members to give our workforce direct and regular access to our leadership team to ask questions on issues of concern to them as employees, such as financial performance strategy and reward. ■ At a market level, we held regular local, leader-led virtual townhall meetings to engage with employees on locally relevant topics and issues. ■ Under our Code of Business Principles we maintain whistleblowing procedures available to all employees wherever they are and however they work including anonymous helplines. ■ Review of UniVoice survey 2023 results and feedback to ULE on key issues ■ The CEO, together with other senior members of management including the CFO and ULE members, provide direct answers on the 'Unilever Live' open Questions sessions ■ Metrics on our Code of Business Principles cases are reviewed by the Corporate Responsibility Committee and the Board as appropriate. See pages 34 to 37, and pages 96 and 97 Consumers We aim to provide superior-quality products and purposeful brands that take action on the issues that matter to people and planet. ■ We use consumer research from partners such as Kantar, NielsenIQ and Ipsos, who we engage through their regular surveys and panels as well as ad hoc research. ■ We engage over three million consumers through our various consumer engagement platforms annually. ■ Board papers and presentations capturing consumer trends ■ Regular updates from Business Groups on opportunities and portfolio choices in line with consumer trends. See pages 14 to 33 Unilever stakeholders How Unilever engages with stakeholders How the Board interacts on stakeholder issues Further information STRATEGIC REPORT CORPORATE GOVERNANCE FINANCIAL STATEMENTS Corporate Governance overview Unilever Annual Report on Form 20-F 2023 91
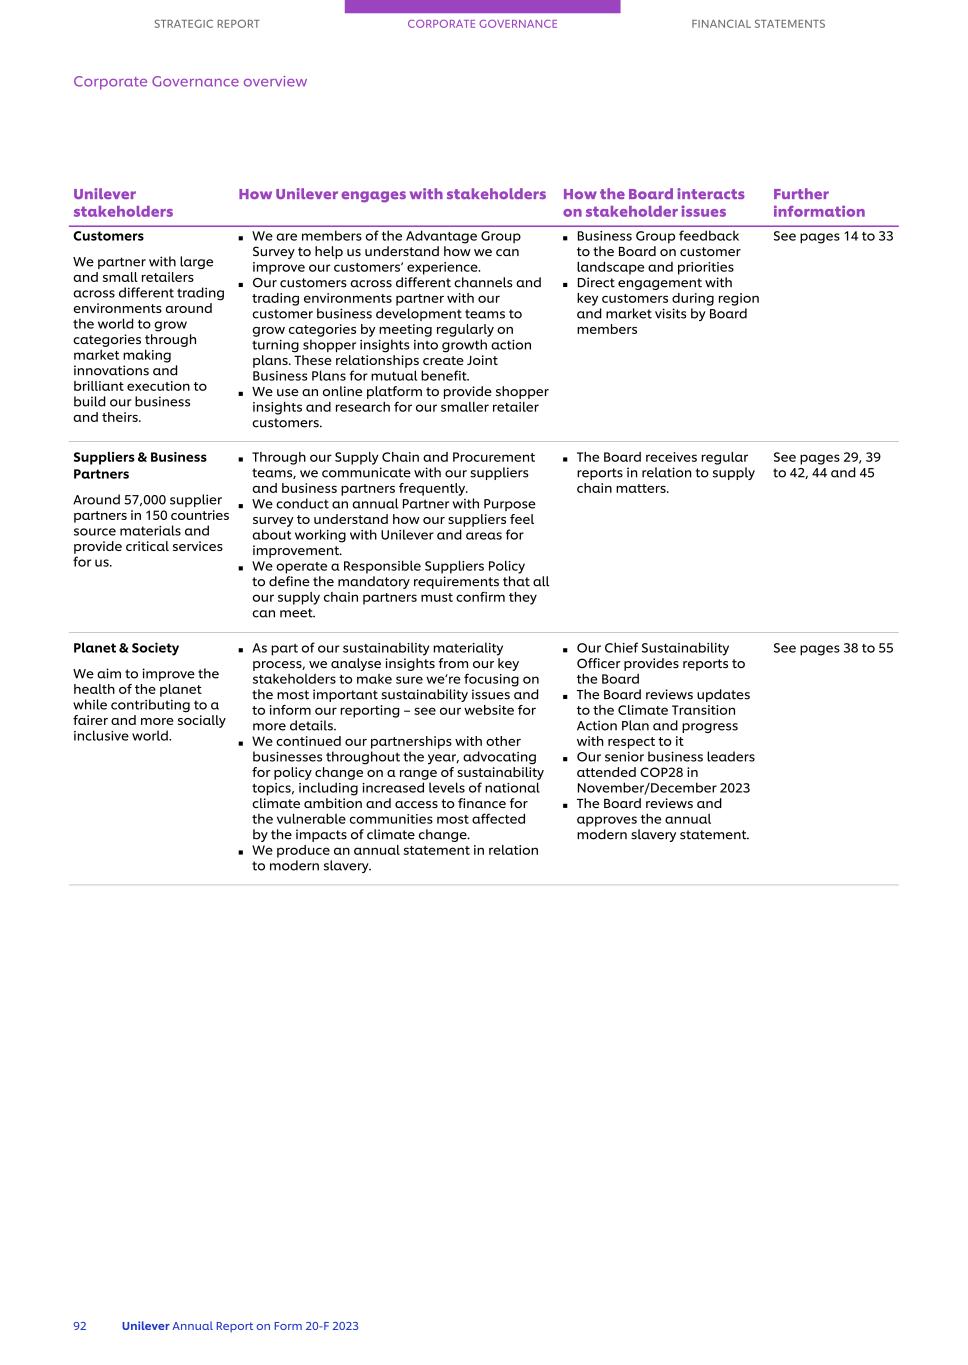
Customers We partner with large and small retailers across different trading environments around the world to grow categories through market making innovations and brilliant execution to build our business and theirs. ■ We are members of the Advantage Group Survey to help us understand how we can improve our customers’ experience. ■ Our customers across different channels and trading environments partner with our customer business development teams to grow categories by meeting regularly on turning shopper insights into growth action plans. These relationships create Joint Business Plans for mutual benefit. ■ We use an online platform to provide shopper insights and research for our smaller retailer customers. ■ Business Group feedback to the Board on customer landscape and priorities ■ Direct engagement with key customers during region and market visits by Board members See pages 14 to 33 Suppliers & Business Partners Around 57,000 supplier partners in 150 countries source materials and provide critical services for us. ■ Through our Supply Chain and Procurement teams, we communicate with our suppliers and business partners frequently. ■ We conduct an annual Partner with Purpose survey to understand how our suppliers feel about working with Unilever and areas for improvement. ■ We operate a Responsible Suppliers Policy to define the mandatory requirements that all our supply chain partners must confirm they can meet. ■ The Board receives regular reports in relation to supply chain matters. See pages 29, 39 to 42, 44 and 45 Planet & Society We aim to improve the health of the planet while contributing to a fairer and more socially inclusive world. ■ As part of our sustainability materiality process, we analyse insights from our key stakeholders to make sure we’re focusing on the most important sustainability issues and to inform our reporting – see our website for more details. ■ We continued our partnerships with other businesses throughout the year, advocating for policy change on a range of sustainability topics, including increased levels of national climate ambition and access to finance for the vulnerable communities most affected by the impacts of climate change. ■ We produce an annual statement in relation to modern slavery. ■ Our Chief Sustainability Officer provides reports to the Board ■ The Board reviews updates to the Climate Transition Action Plan and progress with respect to it ■ Our senior business leaders attended COP28 in November/December 2023 ■ The Board reviews and approves the annual modern slavery statement. See pages 38 to 55 Unilever stakeholders How Unilever engages with stakeholders How the Board interacts on stakeholder issues Further information STRATEGIC REPORT CORPORATE GOVERNANCE FINANCIAL STATEMENTS Corporate Governance overview 92 Unilever Annual Report on Form 20-F 2023
Key decisions by the Board including Section 172 considerations The table below shows some of the key decisions of the Board in 2023. The Directors confirm that the deliberations of the Board incorporated appropriate consideration of the matters detailed in Section 172 of the Companies Act 2006. The Board recognises that having regard to the needs and expectations of stakeholders is crucial, as it ensures that Unilever is well positioned to deliver long-term sustainable growth for the benefit of all its stakeholders. Strategy and business plan Background A Strategic Review of Unilever’s business was carried out by the Board led by the CEO and announced to the markets on 26th October 2023. The Strategic Review concluded that the business would implement an action plan for faster growth, greater productivity and simplicity with a stronger performance culture. The Board also reviewed M&A activity and confirmed that the approach of bolt-on acquisitions and strategic disposals of lesser performing businesses would continue. Stakeholder considerations The Strategic Review took into account the interests of shareholders in its aims to create value for shareholders. It also took in to account customers, consumers and employees in unlocking the potential for the business and in the continued development of a business model for long-term sustainable growth. Faster growth will involve greater focus on Unilever’s top 30 Power Brands to drive brand superiority and increase brand investment and returns. The move to greater productivity and simplicity will assist in the delivery of gross margin and a more focused sustainability agenda. A stronger performance culture will involve clearer priorities and accountability and alongside this more differentiated reward. Together these measures are intended to deliver greater returns for shareholders both in the short to medium term and also assist in building long-term sustainable brand positions through the investment in our brands. Society and sustainability Background Unilever has a long standing commitment to being at the forefront of global leadership in sustainable business and this is at the heart of what Unilever stands for. The Strategic Review by the Board looked at Unilever’s societal and climate approach as an integral part of our way of doing business. Our Climate Transition Action Plan, first publicised and approved by shareholders in 2021, has been updated and is being put again to shareholders at the 2024 AGM. The Strategic Review and the revised Climate Transition Action Plan have been reviewed by and have the full support of the Board and the Unilever Leadership Executive. Stakeholder considerations Climate change and environmental sustainability impact the lives and livelihoods of people all around the world and, as such, impact on all of the stakeholders of the Company from suppliers to customers and consumers. As stakeholders our employees wish to work in a company which values the environment and our shareholders benefit from best business practice in the area of sustainability. As a result of the Strategic Review, the Company will focus its sustainability efforts on areas of critical importance with the aim of achieving greater impact in a shorter time, the pillars of this focus being Climate, Nature, Plastics and Livelihoods. All of our brands will participate in this with each brand focusing its efforts on what is most meaningful for its brand purpose. Our approach to society and sustainability will therefore continue to assist, for example, our suppliers in the development of sustainable agriculture and our customers and consumers will continue to benefit from products that aim for the highest standards in sustainability. Ultimately we believe this will be good for our business with shareholders benefiting as a result. STRATEGIC REPORT CORPORATE GOVERNANCE FINANCIAL STATEMENTS Corporate Governance overview Unilever Annual Report on Form 20-F 2023 93
Appointments of new Non-Executive Director and Chair and new Chief Financial Officer Background The Board approved the appointment of Ian Meakins as a Non-Executive Director with effect from 1 September 2023 and Chair of the Company with effect from 1 December 2023. The Board also approved the appointment of Fernando Fernandez as an Executive Director and Chief Financial Officer of the Company with effect from 1 January 2024. Stakeholder considerations The Board considered Ian Meakins' significant global business experience leading companies as Chair and CEO across a diverse range of industries. The Board concluded that Unilever would benefit from this experience and that Ian would bring strong and effective leadership. The Board looked at Fernando Fernandez’s impressive track record in his Unilever career with his deep financial and business experience. The strategic acumen and leadership qualities that Fernando would bring to the role of CFO would be key in delivering the action plan that the Board had approved. Overall the Board concluded that both of these appointments would be beneficial to Unilever, its shareholders and wider stakeholders. Executive Pay Background At the 2023 AGM, the resolution to approve the advisory vote on the Directors’ Remuneration Report received 42% of the vote and was not passed. In accordance with the UK Corporate Governance Code 2018, the Company included in its AGM results announcement a commitment to listen to shareholder feedback and to publish a further statement detailing the outcome of such shareholder engagement and any actions taken as a result. The Company proceeded to conduct a wide ranging consultation with shareholders to understand the reasons behind this vote and the views of shareholders on executive remuneration. In addition further consultation with shareholders took place in relation to the proposed Directors' Remuneration Policy. Stakeholder considerations Following the shareholder consultation it was decided that the fixed pay of the CEO would not be increased in 2024 and 2025 and this was announced on 30 October 2023. This is also included in the Directors' Remuneration Policy to be put to shareholders at the 2024 AGM. The additional consultation with shareholders was also used in preparing the Directors' Remuneration Policy. STRATEGIC REPORT CORPORATE GOVERNANCE FINANCIAL STATEMENTS Corporate Governance overview 94 Unilever Annual Report on Form 20-F 2023
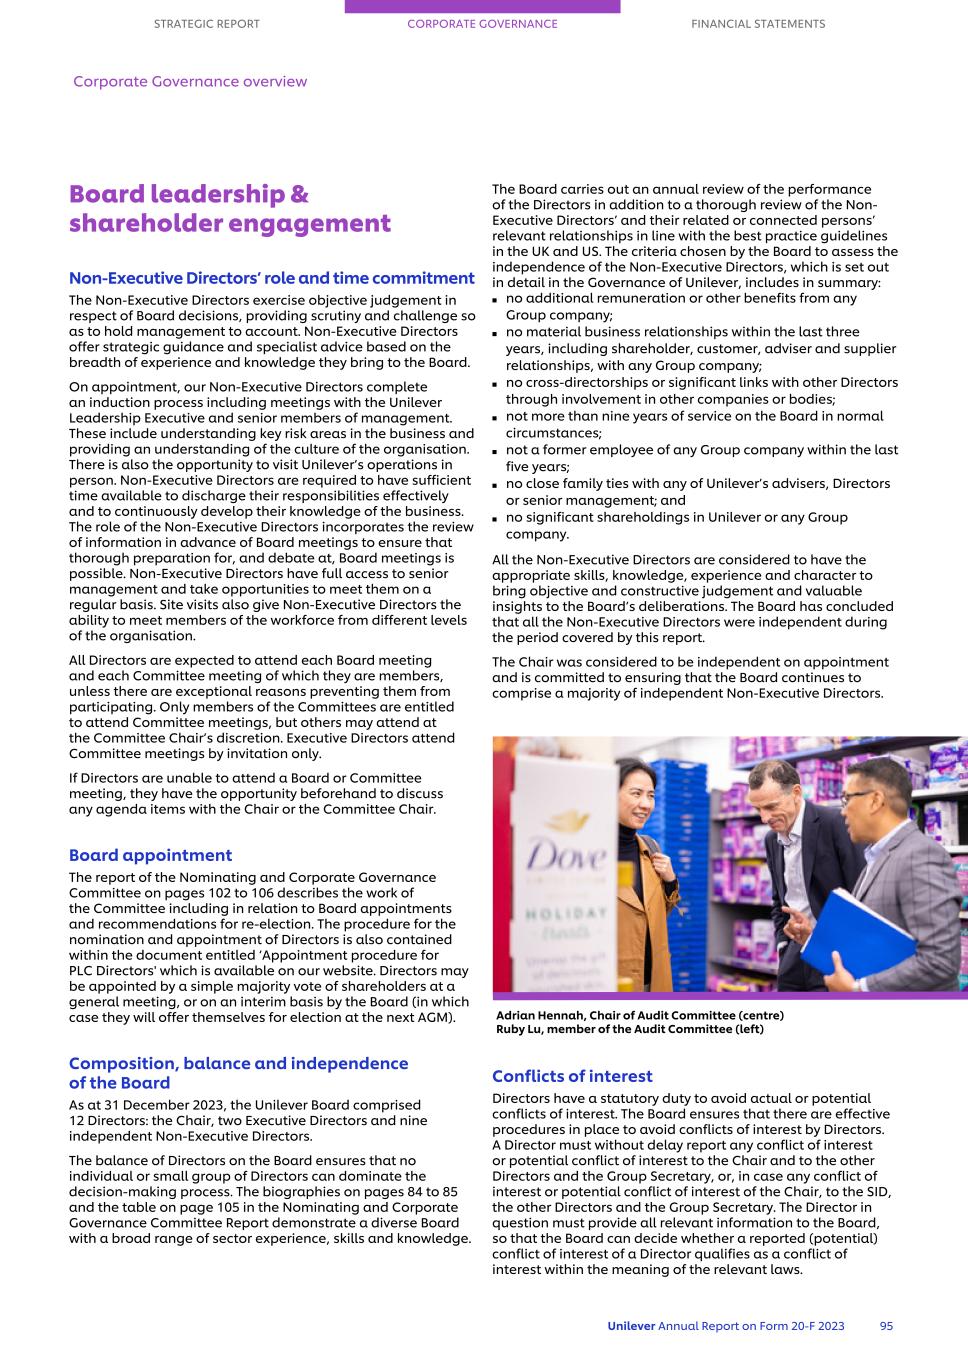
Board leadership & shareholder engagement Non-Executive Directors’ role and time commitment The Non-Executive Directors exercise objective judgement in respect of Board decisions, providing scrutiny and challenge so as to hold management to account. Non-Executive Directors offer strategic guidance and specialist advice based on the breadth of experience and knowledge they bring to the Board. On appointment, our Non-Executive Directors complete an induction process including meetings with the Unilever Leadership Executive and senior members of management. These include understanding key risk areas in the business and providing an understanding of the culture of the organisation. There is also the opportunity to visit Unilever’s operations in person. Non-Executive Directors are required to have sufficient time available to discharge their responsibilities effectively and to continuously develop their knowledge of the business. The role of the Non-Executive Directors incorporates the review of information in advance of Board meetings to ensure that thorough preparation for, and debate at, Board meetings is possible. Non-Executive Directors have full access to senior management and take opportunities to meet them on a regular basis. Site visits also give Non-Executive Directors the ability to meet members of the workforce from different levels of the organisation. All Directors are expected to attend each Board meeting and each Committee meeting of which they are members, unless there are exceptional reasons preventing them from participating. Only members of the Committees are entitled to attend Committee meetings, but others may attend at the Committee Chair’s discretion. Executive Directors attend Committee meetings by invitation only. If Directors are unable to attend a Board or Committee meeting, they have the opportunity beforehand to discuss any agenda items with the Chair or the Committee Chair. Board appointment The report of the Nominating and Corporate Governance Committee on pages 102 to 106 describes the work of the Committee including in relation to Board appointments and recommendations for re-election. The procedure for the nomination and appointment of Directors is also contained within the document entitled ‘Appointment procedure for PLC Directors' which is available on our website. Directors may be appointed by a simple majority vote of shareholders at a general meeting, or on an interim basis by the Board (in which case they will offer themselves for election at the next AGM). Composition, balance and independence of the Board As at 31 December 2023, the Unilever Board comprised 12 Directors: the Chair, two Executive Directors and nine independent Non-Executive Directors. The balance of Directors on the Board ensures that no individual or small group of Directors can dominate the decision-making process. The biographies on pages 84 to 85 and the table on page 105 in the Nominating and Corporate Governance Committee Report demonstrate a diverse Board with a broad range of sector experience, skills and knowledge. The Board carries out an annual review of the performance of the Directors in addition to a thorough review of the Non- Executive Directors’ and their related or connected persons’ relevant relationships in line with the best practice guidelines in the UK and US. The criteria chosen by the Board to assess the independence of the Non-Executive Directors, which is set out in detail in the Governance of Unilever, includes in summary: ■ no additional remuneration or other benefits from any Group company; ■ no material business relationships within the last three years, including shareholder, customer, adviser and supplier relationships, with any Group company; ■ no cross-directorships or significant links with other Directors through involvement in other companies or bodies; ■ not more than nine years of service on the Board in normal circumstances; ■ not a former employee of any Group company within the last five years; ■ no close family ties with any of Unilever’s advisers, Directors or senior management; and ■ no significant shareholdings in Unilever or any Group company. All the Non-Executive Directors are considered to have the appropriate skills, knowledge, experience and character to bring objective and constructive judgement and valuable insights to the Board’s deliberations. The Board has concluded that all the Non-Executive Directors were independent during the period covered by this report. The Chair was considered to be independent on appointment and is committed to ensuring that the Board continues to comprise a majority of independent Non-Executive Directors. Conflicts of interest Directors have a statutory duty to avoid actual or potential conflicts of interest. The Board ensures that there are effective procedures in place to avoid conflicts of interest by Directors. A Director must without delay report any conflict of interest or potential conflict of interest to the Chair and to the other Directors and the Group Secretary, or, in case any conflict of interest or potential conflict of interest of the Chair, to the SID, the other Directors and the Group Secretary. The Director in question must provide all relevant information to the Board, so that the Board can decide whether a reported (potential) conflict of interest of a Director qualifies as a conflict of interest within the meaning of the relevant laws. STRATEGIC REPORT CORPORATE GOVERNANCE FINANCIAL STATEMENTS Corporate Governance overview Unilever Annual Report on Form 20-F 2023 95 Adrian Hennah, Chair of Audit Committee (centre) Ruby Lu, member of the Audit Committee (left)

Unless authorised by the Board, together with compliance with any restrictions that have been required of such a Director, a Director may not take part in the decision-taking process of the Board in respect of any situation in which he or she has a conflict of interest. The Board consider the procedures that have been put in place to deal with conflicts of interest operate effectively. The interests of new Directors are reviewed during the recruitment process and authorised (if appropriate) by the Board at the time of their appointment. Directors have a continuing duty to update the Board on any changes to their external appointments which are also reviewed by the Board on a regular basis. Unilever recognises that the Executive Directors acting as directors of other companies is beneficial from a personal development perspective and therefore also beneficial to the Group. The number of external directorships of listed companies is generally limited to one per Executive Director to reduce the risk of excessive commitment and prior approval is required from the Chair. Board evaluation Each year, the Board formally assesses its own performance, including with respect to its composition, diversity and how effectively its members work together to achieve objectives. In 2023 a self-evaluation of the Board’s effectiveness was conducted. The evaluation consisted of a questionnaire completed by each of the Directors followed by a Board discussion in November 2023, covering both the outcome of the evaluation and the proposed actions to enhance the effectiveness of the Board. The outcome of such discussions is taken into account in the assessment of Directors when proposals for the re- election of Directors is considered. The evaluation looked at key areas of the functioning and operation of the Board. The directors considered the level of information provided to the Board and the timing and frequency of meetings. In particular the financial controls and risk assessments carried out by the Board and its Committees were reviewed. As succession planning had been a key part of the Board’s business in 2023, with the appointment of a new Chair, Chief Executive Officer and Chief Financial Officer, the Board succession procedures were also reviewed. The overall composition of the Board was also considered together with the relevant expertise of Board members in relation to the strategic and other material issues facing the Company. It was concluded that the Board operated effectively and that the Board processes on the provision of information worked well. The Board’s knowledge and assessment of financial controls and key risks was strong and the processes for succession planning and the execution of those plans had been effective in 2023. With the ongoing development of the business from a strategic and simplicity perspective and the continued external challenges from digital commerce and geopolitical events in key markets, there was the opportunity to develop Board composition further. An initial step on this was the enhancement of the skills and experience matrix for directors which is included in the report of the Nominating and Corporate Governance Committee on page 105. The Board would also like to focus more on the key performance indicators used in the business to support the new performance culture that has been introduced. The evaluation of the Board’s principal Committees was performed under the supervision of the respective Chairs and the Chief Legal Officer & Group Secretary, taking into account the views of respective Committee members and the Board members. The key actions arising from these Committee evaluations can be found in each of the Committee Reports. Board induction and training All new Directors participate in a comprehensive induction programme when they join the Board. The induction programme typically includes site visits, meetings with the Group’s businesses, with other Board Directors, senior executives and managers, advisers and the Group's internal and external auditors. This is supplemented with a wide range of information including historical Board and Committee papers, internal and external reports and presentations covering the key commercial, operational, financial and functional areas of the Group and relevant policies and governance procedures. The Chair ensures that ongoing training is provided for Directors by way of presentations and circulated updates at and between Board and Committee meetings. The training covers, among other things, Unilever’s business, environmental, social, corporate governance, regulatory developments and investor relations matters. For example, in 2023 the Directors received presentations on corporate governance reforms and Unilever's Code of Business Principles. In addition, outside of the scheduled Board meetings, several Directors visited Unilever businesses and met with local management in the UK, Brazil and Argentina. Workforce engagement The Board believes that taking into account feedback from the workforce widens the diversity of its views when making business decisions. In view of Unilever’s global footprint and scope of operations, the Board decided that the most effective way of organising its engagement with employees is to share the responsibility among all Non-Executive Directors. Unilever’s Workforce Engagement Policy provides for workforce engagement in a variety of ways both face-to-face and virtually through sessions with Non-Executive Directors, engaging with employee representatives, site visits, and employee surveys such as UniVoice (see below for further information). These engagement activities cover the entire workforce demographic in terms of geography, all Business Groups, length of service, work level/seniority and supply chain and office staff. STRATEGIC REPORT CORPORATE GOVERNANCE FINANCIAL STATEMENTS Corporate Governance overview 96 Unilever Annual Report on Form 20-F 2023 Hein Schumacher, CEO

In 2023, Non-Executive Directors participated in eight workforce engagement events, both virtually and in person, in the UK as well as in the Netherlands. A wide range of topics were discussed including those that are personal to the workforce and those of a more business and strategic nature. Topics included: future fit skills; safety; equality, diversity and inclusion; sustainability; and research and development. Perspectives from the workforce have been taken into consideration in decision making. For example, employee survey results from 2023 indicated some ambiguity in experience of our operational model. Management intends to further clarify decision rights and cost ownership to address some of these concerns and speed up decision-making. Further action has been taken in response to feedback collected in workforce engagement sessions. For example in Nutrition, cross-functional working groups have been established to co-create the 2024 innovation strategy in response to feedback from the workforce to speed up ways of working and increase collaboration between teams. The Board evaluates the effectiveness of workforce engagement on an annual basis and feedback is also sought from employees who take part in the workforce engagement sessions, thereby creating a feedback loop between the Board and employees. Shareholder engagement The Board values open and meaningful discussions with our shareholders on all matters. The CFO has lead responsibility for shareholder engagement, with the active involvement of the CEO and supported by the Investor Relations department. In 2023 the new Chair had introductory meetings with key shareholders comprising over 25% of the issued share capital of the Company. Following the announcement of the Company’s Growth Action Plan in October 2023, the CEO held a series of roadshows with investors in the Netherlands, the UK and the US. In addition the SID had meetings with a wide number of investors in relation to the remuneration of the executive directors and the CFO held a roadshow with investors following the first half-year results. The Board receives regular briefings on investor reactions to Unilever’s quarterly, half- and full-year results announcements, on key issues such as the Climate Transition Action Plan and on any issues raised by shareholders that are relevant to their responsibilities. We maintain a frequent dialogue with our principal institutional shareholders and regularly collect feedback. Private shareholders are encouraged to give feedback via shareholder.services@unilever.com. Our shareholders are also welcome to raise any issues directly with the Chair or the SID. The Chair, the SID, the Executive Directors and other Directors are also available to answer questions from the shareholders at the AGM each year. General meetings At the AGM, the Chair and CEO give their thoughts on governance aspects of the preceding year, the Group’s strategy together with a review of the performance of the Group over the last year. Shareholders are encouraged to attend the meeting and to ask questions at or in advance of the meeting. The external auditors attend the AGM and are entitled to address the meeting on any part of the business of the meeting which concerns them as auditors. Unilever’s AGM in 2023 was a physical meeting and the proceedings were also streamed via a live webcast for shareholders. The Chair, CEO, CFO, SID, Committee Chairs, Susan Kilsby and Hein Schumacher were present and following the statements from the Chair and CEO, questions submitted by shareholders prior to the meeting and received during the meeting were addressed. All 23 resolutions were put to a poll at the 2023 AGM to ensure an exact and definitive result and to facilitate maximum participation by Unilever’s geographically spread shareholders. Of these 22 resolutions were passed with in excess of 80% votes cast in favour. Resolution 2 was not passed as noted on page 94. The Company consulted with shareholders on this and issued a statement on this on 30 October 2023. This confirmed that CEO fixed pay would not be increased in 2024 or 2025. In addition the Remuneration Policy will be put to shareholders at the AGM in 2024. The 2024 AGM will be held on 1 May 2024 at Hilton, London Bankside, 2-8 Great Suffolk Street, London, SE1 0UG. The Notice of AGM and other documentation are enclosed with this Annual Report and Accounts and are available on the Company’s website at www.unilever.com for those shareholders who have opted for electronic communication. STRATEGIC REPORT CORPORATE GOVERNANCE FINANCIAL STATEMENTS Corporate Governance overview Unilever Annual Report on Form 20-F 2023 97 Strive Masiyiwa, Chair of the Corporate Responsibility Committee and Professor Youngme Moon, member of the Corporate Responsibility Committee
Additional disclosures The following disclosures are made in compliance with the Financial Conduct Authority’s Listing Rule 9.8.4C R: Results and dividends Unilever PLC publishes financial information on a quarterly basis and these reports can be found at www.unilever.com. Details of the quarterly dividends for the financial year ended 31 December 2023 are provided on page 194. Future developments Information on likely future developments in our business and an indication of our research and development activities is set out in the Strategic Report on pages 6 to 55. Articles of Association The current Articles of Association (Articles) were approved by shareholders at the 2021 AGM and adopted with effect from 5 May 2021. The Articles may only be amended by a special resolution of the shareholders. The Articles can be found on the Company's website at www.unilever.com. Disclosure of information to the external auditor Each of the Directors who held office at the date of approval of this report confirm that, to the best of each of the Directors’ knowledge and belief, and having made appropriate enquiries, all information relevant to enabling the auditors to provide their opinions on the Company’s consolidated and parent company accounts has been provided, and each of the Directors has taken all reasonable steps to ensure their awareness of any relevant audit information and to establish that the Company’s auditors are aware of any such information. This confirmation is given and should be interpreted in accordance with the provisions of Section 418 of the Companies Act 2006. Directors The Company’s Directors who served during the financial year ending 31 December 2023 are provided on pages 84 and 85. Details of director changes in the year are provided in the report of the Nominating and Corporate Governance Committee on pages 102 to 104. Appointment of Directors The rules governing the appointment and retirement of Directors are set out in the appointment procedure for PLC Directors available on the Company’s website and are summarised in the report of the Nominating and Corporate Governance Committee. All Directors must submit themselves for election or re-election as the case may be each year at the AGM. At the 2024 AGM, seven Directors will offer themselves for election or re-election. Details of the Directors standing for election or re-election are set out in the 2024 Notice of AGM. Information on the service agreements of Executive Directors can be found in the Directors’ Remuneration Report on pages 116 to 118 and 129 to 153. The letters of appointment of the Non-Executive Directors are available for inspection at the Company’s registered office. STRATEGIC REPORT CORPORATE GOVERNANCE FINANCIAL STATEMENTS Corporate Governance overview 98 Unilever Annual Report on Form 20-F 2023 Listing Rule 9.8.4C R Interest capitalised by the Group during the year None Publication of unaudited financial information Not applicable Details of any long-term incentive schemes See pages 116, 117, 130 to 132 and 135 to 144 Director waiver of emoluments Not applicable Director waiver of future emoluments: Not applicable Allotments for cash of equity securities made during the year None Allotment for cash of equity securities made by a major unlisted subsidiary during the year Not applicable Details of participation of parent undertaking in any placing made during the year Not applicable Details of relevant material contracts in which a Director or controlling shareholder was interested during the year Not applicable Contracts for the provision of services by a controlling shareholder during the year Not applicable Details of any arrangement under which a shareholder has waived or agreed to waive any dividends Unilever PLC holds 16,181,572 ordinary shares of 31/9p each as Treasury shares. No dividends are payable on these shares. As at 1 March 2024 Fidelity held 507,462 ordinary shares of 31/9p of Unilever PLC on behalf of the Company to be used in satisfaction of employee share scheme obligations. Fidelity has agreed to waive on an ongoing basis any dividends payable in respect of such shares. As at 1 March 2024 the Trustee of the Company's Employee Benefit Trust ('EBT') held 2,348,355 31/9p ordinary shares of 31/9p of Unilever PLC. The Trustee of the Company’s EBT has agreed to waive, on an ongoing basis,any dividends payable on shares it holds in trust for use under the Company’s employee share schemes. The practice of Fidelity and the Trustees of the EBT is to abstain from voting on the shares that they hold. Details of the employee share schemes can be found on pages 116, 117, 130 to 132 and 135 to 144. Details of where a shareholder has agreed to waive future dividends See below Statements relating to controlling shareholders and ensuring company independence Not applicable
Directors’ share interests Details of the Directors’ interests in shares can be found in the Directors’ Remuneration Report on pages 132, 138 to 143 and 148. Contracts of significance During the year, no Director had any interest in any shares or debentures in the Company’s subsidiaries, or any material interest in any contract with the Company or a subsidiary being a contract of significance in relation to the Company’s business. No member of the Group is party to any significant agreement that takes effect, alters or terminates upon a change of control or following a takeover of Unilever PLC. In addition, there are no agreements providing for compensation for loss of office or employment as the result of a takeover of Unilever PLC. There are no controlling shareholders of Unilever PLC. Powers of the Directors The Board of Directors is responsible for the management of the business of the Company and may exercise all powers of the Company subject to applicable legislation and regulation and the Company’s Articles. The Board has delegated certain of its powers, authorities and discretions to the CEO, CFO and to the Board Committees. Detailed information on the responsibilities and authorities of each of these is available in the Governance of Unilever on the Company's website. In addition, information on the Board's and the Committee's responsibilities and activities in the year to 31 December 2023 are available on pages 90, 103, 108 and 113. Directors’ indemnities and Directors’ and Officers' insurance The power to indemnify Directors, together with former Directors, the Company Secretary and the directors of subsidiary companies, is provided for in the Company's Articles of Association. Unilever maintains appropriate D&O insurance to the extent permitted by law. In addition, Unilever has granted indemnities to each Director and the Group Secretary, together with former Directors and Company Secretaries of Unilever and the directors of subsidiary companies, whereby the Company indemnifies these individuals in respect of any proceedings brought by third parties against them personally in their capacity as Directors or Officers of the Company or any Group company. These ''qualifying third party indemnity provisions'' were in force during the course of the financial year ended 31 December 2023 and remained in force at the date of this report. The Company would also fund ongoing costs in defending a legal action as they are incurred rather than after judgement has been given. In the event of an unsuccessful defence in an action against them, individual Directors would be liable to repay the Company for any damages and to repay defence costs to the extent funded by the Company. Neither the indemnity, nor the D&O insurance cover provides cover in the event a Director or Officer is proved to have acted fraudulently or dishonestly. In addition, the Company provides indemnities (including, where applicable, a qualifying pension scheme indemnity provision) to the Directors of three subsidiaries, each of which acts or acted as trustee of a Unilever UK pension fund. Appropriate trustee liability insurance is also in place. As above, these indemnities were in force during the course of the financial year ended 31 December 2023 and remained in place at the date of this report. Political donations At the 2023 AGM, shareholders passed a resolution to authorise the Company and its subsidiaries to make political donations to political parties or independent election candidates, to other political organisations, or to incur political expenditure (in each case as defined in the Companies Act 2006). As the authority granted at the 2023 AGM will expire, renewal of this authority will be sought at this year’s AGM. Further details are available in the Notice of AGM, available on the Company’s website. It is the policy of the Company not to make such political donations or to incur political expenditure (within the ordinary meaning of those words) and the Directors have no intention of changing that policy. However, as the definitions used in the Companies Act 2006 are broad, it is possible that normal business activities, which might not be thought to be political donations or expenditure in the usual sense, could be caught. On that basis, the authority is sought purely as a precaution. The Board members have each confirmed compliance with Unilever's Code of Business Principles, as is required on an annual basis, and that there has been no political activity or payments by the Unilever Group. Shares Share capital Unilever’s issued share capital on 31 December 2023 was made up of £78,294,139 split into 2,516,597,338 ordinary shares of 31/9p each and each carrying one vote. A total of 16,181,572 Unilever ordinary shares were held in treasury as at 31 December 2023 representing 0.64% of Unilever’s issued share capital. A total of 49,770,289 ordinary Unilever PLC shares held in Treasury from share buy-backs were cancelled on 2 August 2023. Share issues and purchase of shares At the 2023 AGM held on 3 May 2023, Unilever’s Directors were authorised to: ■ issue new shares, up to a maximum of £26,226,666 nominal value (which at the time represented approximately 33% of Unilever’s issued ordinary share capital); ■ disapply pre-emption rights up to a maximum of £3,935,735 nominal value (which at the time represented approximately 5% of Unilever’s issued ordinary share capital) for general corporate purposes and an additional 5% authority in connection with an acquisition or specified capital investment; and ■ make market purchases of its ordinary shares, up to a maximum of 253,000,000 ordinary shares (which at the time represented just under 10% of PLC’s issued ordinary share capital) and within the price limits prescribed in the resolution. In 2022, Unilever commenced a €3bn share buyback programme over two years. The purpose of the share buyback programme was to reduce the capital of Unilever and in 2022 Unilever bought back 34,217,605 Unilever ordinary shares of 31/9p each in two tranches, the total consideration for which was €1.5bn. Further in 2023, Unilever bought back 31,734,256 Unilever ordinary shares of 31/9p each in two tranches, the total consideration for which was €1.5bn to complete such share buyback programme. The shares repurchased in 2023 comprised 1.26% of Unilever's issued share capital as at 31 December 2023. Outside of this share buyback programme, no other company within the Group purchased any Unilever STRATEGIC REPORT CORPORATE GOVERNANCE FINANCIAL STATEMENTS Corporate Governance overview Unilever Annual Report on Form 20-F 2023 99

ordinary shares or American Depositary Shares during 2023. During 2023 there were 100,000 Unilever ordinary shares of 31/9p each issued in satisfaction of employee share scheme awards. Right to hold and transfer ordinary shares Unilever’s constitutional documents place no limitations on the right to hold or transfer Unilever ordinary shares. There are no limitations on the right to hold or exercise voting rights on the ordinary shares of Unilever imposed by English law. Unilever is not aware of any agreements between holders of securities which may result in restrictions on transfer or voting rights. Right to receive dividends The employee benefit trust, established by the Company to facilitate the settlement of various share plan awards, waives its entitlement to receive dividends in respect of shares that are the beneficial property of the trust. Listings Unilever has ordinary shares listed on the London Stock Exchange (ULVR), on Euronext Amsterdam (UNA) and, as American Depositary Receipts1 (UL), on the New York Stock Exchange. 1. One American Depositary Receipt represents one PLC ordinary share with a nominal value of 31/9p. Significant shareholders of Unilever As far as Unilever is aware, the only holders of more than 3% of, or 3% of voting rights attributable to, Unilever’s ordinary share capital (‘Disclosable Interests’) on 31 December 2023, were BlackRock, Inc. with a shareholding of 9.1% and Vanguard Holding with a shareholding of 4.9%. No Disclosable Interests have been notified to Unilever between 1 January 2024 and 22 February 2024 (being a date not more than one month prior to the date of the Company's Notice of Annual General Meeting). As far as Unilever is aware, between 1 January 2021 and 22 February 2024, only BlackRock, Inc. and Vanguard Holding have held more than 3% of, or 3% of voting rights attributable to, Unilever’s ordinary shares. Accounting policies, financial instruments and risk Details of the Group’s accounting policies, together with post balance sheet events and details of financial instruments and risk, are provided in Notes 1, 16, 18 and 26 to the Financial Statements. Branch offices Details of the Unilever Group's branches are listed on page 244. Employment of disabled people Disability inclusion is deeply important to Unilever. It is critical that our brands live up to our values by understanding the lives, experiences and stereotypes facing persons with disabilities and reflecting their stories in our brand communications. In addition, Unilever has a range of employment policies which clearly detail the standards, processes, expectations and responsibilities of its people and the organisation. These policies are designed to ensure that everyone – including those with existing or new disabilities and people of all backgrounds – is dealt with in an inclusive and fair way from the recruiting process and ongoing through their career at Unilever. This includes access to appropriate training, development opportunities or job progression. Further details can be found on page 37. Employee share plans The Company operates a number of employee share plans, details of which are set out in note 4C and in the Directors’ Remuneration Report on pages 116, 117, 130 to 132 and 135 to 144. Stakeholder engagement The Group’s stakeholders are our shareholders, our workforce, consumers, customers, our suppliers and business partners, and the planet and society as a whole. The Board is aware that its actions and decisions impact our stakeholders. Effective engagement with stakeholders is important to the Board as it strengthens the business and helps to deliver a positive result for all our stakeholders. In order to comply with Section 172 of the Companies Act, the Board is required to take into consideration the interests of stakeholders and it must also include a statement setting out the way in which Directors have discharged this duty during the year. The Group’s stakeholders are identified on pages 91 and 92 and information on how the Directors have had regard to the matters set out in Section 172 can be found on pages 93 and 94. Further information on workforce engagement can also be found on pages 96 and 97. Related party transactions Transactions with related parties are conducted in accordance with agreed transfer pricing policies and include sales to joint ventures and associates. Other than those disclosed in note 23 to the consolidated financial statements (and incorporated herein as above), there were no related party transactions that were material to the Group or to the related parties concerned that are required to be reported in 2023 up to 22 February 2024 (the latest practicable date for inclusion in this report). Corporate governance compliance We conduct our operations in accordance with internationally accepted principles of good governance and best practice, while ensuring compliance with the corporate governance requirements applicable in the countries in which we operate. Unilever is subject to corporate governance requirements STRATEGIC REPORT CORPORATE GOVERNANCE FINANCIAL STATEMENTS Corporate Governance overview 100 Unilever Annual Report on Form 20-F 2023 Susan Kilsby, member of the Audit Committee

(legislation, codes and/or standards) in the UK and the US and in this section, we report on our compliance against these. United Kingdom In 2023, Unilever has applied the principles and complied with the provisions of the UK Corporate Governance Code. Further information on how Unilever has applied the five overarching categories of principles can be found on the following pages – (i) Board Leadership: pages 82, 89, 93 to 95 and 97; (ii) Division of Responsibilities: pages 89 and 95; (iii) Composition, Succession and Evaluation: pages 95 to 97 and 103 to 104; (iv) Audit, Risk and Internal Controls: pages 107 to 111; and (v) Remuneration: pages 116 to 153. The UK Corporate Governance Code is available on the Financial Reporting Council’s (FRC) website. Risk Management and Control: Our approach to risk management and systems of internal control is in line with the recommendations in the FRC’s revised guidance ‘Risk management, internal control and related financial and business reporting’ (the Risk Guidance). It is Unilever’s practice to review acquired companies’ governance procedures and to align them to the Group’s governance procedures as soon as is practicable. Greenhouse Gas (GHG) Emissions: Information on GHG emissions can be found on page 47. Employee Involvement and Communication: Unilever’s UK companies maintain formal processes to inform, consult and involve employees and their representatives. A National Consultative Forum comprising employees and management representatives from key locations meets regularly to discuss issues relating to Unilever sites in the UK. We recognise collective bargaining on a number of sites and engage with employees via the Sourcing Unit Forum, which includes national officer representation from the three recognised trade unions. A European Works Council, embracing employee and management representatives from countries within Europe, has been in existence for several years and provides a forum for discussing issues that extend across national boundaries. Further details on how the Board has engaged with the workforce can be found on pages 96 and 97. Equal Opportunities and Diversity: Consistent with our Code of Business Principles, Unilever aims to ensure that applications for employment from everyone are given full and fair consideration and that everyone is given access to training, development and career opportunities. Every effort is made to reskill and support employees who become disabled while working within the Group. United States Unilever is listed on the New York Stock Exchange (NYSE). As such, Unilever must comply with the requirements of US legislation, regulations enacted under US securities laws and the Listing Standards of the NYSE, that are applicable to foreign private issuers, copies of which are available on their websites. We comply with the Listing Standards of the NYSE applicable to foreign private issuers. We are required to disclose any significant ways in which our corporate governance practices differ from those required of US domestic companies listed on the NYSE. Our corporate governance practices are primarily based on the requirements of the UK Listing Rules and the UK Corporate Governance Code but substantially conform to those required of US domestic companies listed on the NYSE. The only significant way in which our corporate governance practices differ from those required of US domestic companies under Section 303A Corporate Governance Standards of the NYSE is that the NYSE rules require that shareholders must be given the opportunity to vote on all equity-compensation plans and material revisions thereto, with certain limited exemptions. The UK Listing Rules require shareholder approval of equity compensation plans only if new or treasury shares are issued for the purpose of satisfying obligations under the plan or if the plan is a long- term incentive plan in which a director may participate. Amendments to plans approved by shareholders generally only require approval if they are to the advantage of the plan participants. Attention is drawn to the Report of the Audit Committee on pages 107 to 111. In addition, further details about our corporate governance are provided in the document entitled 'The Governance of Unilever’ which can be found on our website. All senior executives and senior financial officers have declared their understanding of and compliance with Unilever’s Code of Business Principles and the related Code Policies. No waiver from any provision of the Code of Business Principles or Code Policies was granted in 2023 to any of the persons falling within the scope of the SEC requirements. The Code of Business Principles and related Code Policies are published on our website. Risk Management and Control: Following a review by the Disclosure Committee, Audit Committee and Board, the CEO and the CFO concluded that the design and operation of the Group’s disclosure controls and procedures, including those defined in the US Securities Exchange Act of 1934 – Rule 13a – 15(e), as at 31 December 2023 were effective. Unilever is required by Section 404 of the US Sarbanes-Oxley Act of 2002 to report on the effectiveness of its internal control over financial reporting. This requirement is reported on within the section entitled ‘Management’s Report on Internal Control over Financial Reporting’ on page 254. The Directors' Report has been approved by The Board, and signed on its behalf by Maria Varsellona, Chief Legal Officer and Group Secretary. STRATEGIC REPORT CORPORATE GOVERNANCE FINANCIAL STATEMENTS Corporate Governance overview Unilever Annual Report on Form 20-F 2023 101 Ian Meakins, Chair (third from the left)

Ian Meakins Chair of the Nominating and Corporate Governance Committee I am pleased to present the report of the Nominating and Corporate Governance Committee for the year ended 31 December 2023. It has been a busy year for the Committee overseeing a number of Board changes. The Committee itself was led by Nils Andersen until my appointment on 1 December 2023 and Nils will continue as a valued member of the Committee until he steps down from the Board at the AGM in 2024, as previously announced. In 2023, the Committee had overseen the appointment of Hein Schumacher as CEO and this change became effective on 1 July 2023 with the retirement of Alan Jope at that time. In May 2023, Graeme Pitkethly informed the Board of his intention to retire from Unilever. The Committee has therefore also overseen the appointment of a new CFO, Fernando Fernandez, whose appointment took effect on 1 January 2024. Fernando has an extensive track record in a variety of financial, marketing and general management roles in Unilever. His deep financial and business experience, strategic acumen and leadership qualities will be critical in helping to drive the step-up in Unilever’s performance that we are all determined to deliver. Graeme Pitkethly remained as CFO until 31 December 2023, at which point he also stood down as a Director. Graeme is assisting with the transition of Fernando in to his new role until the end of May 2024. At the end of October 2023, Feike Sijbesma stepped down as a Non-Executive Director having served nine years on the Board. On behalf of the Committee, I would like to thank Feike for his service to Unilever. Further details of these Board changes are provided in this report on pages 103 and 104. The Committee was engaged in Board succession and talent development in the Unilever Leadership Executive A number of changes to the Unilever Leadership Executive were also announced on 26 October 2023 and were effective on 1 January 2024. The Committee was involved in the consideration of the candidates for the Unilever Leadership positions. A diverse and inclusive workplace is a priority for the Board and Committee, and it underpins the appointment and recruitment processes at all levels in Unilever. Diversity and inclusion metrics for the Board and ULE are included in the report and, as at 31 December 2023, the Board was 42% female with one third ethnic minority representation. In 2024 the Committee will continue to embed the new leadership and also continue to review Board succession in respect of independent Non-Executive Directors. The Committee will also monitor ongoing succession planning for the Unilever Leadership Executive. I would like to thank the members of the Committee through the year for their commitment and contribution. Ian Meakins Chair of the Nominating and Corporate Governance Committee STRATEGIC REPORT CORPORATE GOVERNANCE FINANCIAL STATEMENTS Report of the Nominating and Corporate Governance Committee 102 Unilever Annual Report on Form 20-F 2023
Committee members and attendance Attendance Ian Meakins Chair - Nils Andersen 6/6 Judith Hartmann (member from 3 May 2023) 3/3 Andrea Jung 5/6 Ruby Lu (member up to and including 3 May 2023) 3/3 Feike Sijbesma (stepped down as a Non- Executive Director on 31 October 2023) 5/5 The Chair of the Board, Ian Meakins, chairs the Nominating and Corporate Governance Committee. Nils Andersen, Judith Hartmann and Andrea Jung are independent Non-Executive Dircetors and members of the Committee. The Chief Legal Officer and Group Secretary is secretary to the Committee. Other attendees, including the CEO, the Chief People and Transformation Officer and Deputy Secretary, attend the meetings when invited to do so. There were six meetings of the Committee in 2023 and the table above shows attendance at meetings of the Committee in the year. Given changes in the Committee membership this year, attendance is expressed as the number of meetings attended out of the number able to be attended during each director’s respective tenure on the Committee during the year. Role of the Committee The Nominating and Corporate Governance Committee is primarily responsible for: ■ periodically assessing the structure, size and composition of the Board; ■ evaluating the balance of skills, experience, independence, diversity and knowledge on the Board; ■ ongoing succession planning (including the development of a diverse pipeline for succession); ■ drawing up selection criteria and appointment procedures for Directors; ■ reviewing the feedback in respect of the role and functioning of the Board Committees arising from Board and Board Committee evaluations; ■ periodically reviewing and assessing Unilever’s practices and procedures in relation to workforce engagement; and ■ considering current and developing corporate governance matters, which it brings to the attention of the Board where deemed necessary. The Committee’s terms of reference are set out in the Governance of Unilever, which can be found on the Company’s website. Activities of the Committee During the year, the Committee’s key areas of focus included: ■ following a review of the performance of the Directors and, where relevant their independence, the Committee recommended the election and re-election of all Directors at the AGM in May 2023; ■ review of the composition of the Board and its Committees taking into account the experience, skills, knowledge, diversity and attributes of the Directors and the length of tenure of the Non-Executive Directors resulting in changes to the Committee memberships; ■ appointed Spencer Stuart to support the Committee in the search for a new Chair of the Board, culminating in the appointment of Ian Meakins; ■ appointed Russell Reynolds to support the Committee in the search for a new Chief Financial Officer, culminating in the appointment of Fernando Fernandez; ■ assessed best practice guidelines and preferences of certain institutional investors in relation to overboarding; ■ reviewed the ULE succession plan and talent pipeline; ■ conducted an annual review of the diversity policy applicable to the Board and more widely, the workforce engagement activities in the year and the plan for the following year, the terms of reference for the Committee and the annual workplan for the Committee; ■ considered the process and timetable for the Board evaluation and maintained oversight of the process (see page 96 for further information on the Board evaluation); ■ received updates on current and emerging corporate governance legislation, regulation and best practice guidelines including in relation to directors’ duties; and ■ considered the Committee’s draft report for inclusion in the 2022 Annual Report and Accounts. Appointment and reappointment of Directors to the Board All Directors (unless they are retiring) are nominated by the Board for election or re-election at the AGM each year on the recommendation of the Committee. The Committee takes into consideration the outcomes of the Chair's discussions with each Director on individual performance and the evaluation of the Board and its Committees. Non-Executive Directors normally serve for a period of up to nine years. The Committee proposed the election or re-election of all Directors at the 2023 AGM. Nelson Peltz and Hein Schumacher had been appointed by the Board as independent Non-Executive Directors on 20 July 2022 and 4 October 2022 respectively and were therefore put forward for election by shareholders for the first time at the 2023 AGM. All the Directors were appointed by shareholders by a simple majority vote at the 2023 AGM. Subsequent to the 2023 AGM, Alan Jope stood down as a director and CEO on 1 July 2023. Hein Schumacher became an Executive Director on 1 June 2023 and took up the role of CEO on 1 July 2023 following a one month handover period. The Committee also reviews the composition of the Board Committees. During the year, the Committee recommended in May that Ruby Lu be appointed a member of the Audit Committee and that Judith Hartmann be appointed a member of the Nominating and Corporate Governance Committee and the Compensation Committee. The Committee further recommended in October that Ian Meakins be appointed as Chair of the Nominating and Corporate Governance Committee, as a member of the Compensation Committee and the Chair of the Company effective from 1 December 2023. On 31 October 2023, Feike Sijbesma stepped down as a Non-Executive Director of the Company, having served nine years on the Board. During the year, Graeme Pitkethly confirmed that he intended to step down from the Board as a Director and CFO by the end of 2023. The Committee appointed Russell Reynolds to assist it to identify suitable candidates for the position of CFO. Russell Reynolds is an independent executive search firm which has undertaken several executive, non-executive and management searches for the Group. Russell Reynolds do not have any connection to or provide any other services to the Directors or the Group except for normal course recruitment processes. STRATEGIC REPORT CORPORATE GOVERNANCE FINANCIAL STATEMENTS Report of the Nominating and Corporate Governance Committee Unilever Annual Report on Form 20-F 2023 103
In January 2023, Unilever announced the appointment of Fernando Fernandez as a director and CFO with effect from 1 January 2024. Graeme Pitkethly stepped down from the Board on 31 December 2023. The process to search for and appoint a new CFO was managed by the Committee, as summarised below: ■ the Committee agreed the appointment of a search firm which would be best placed to deliver a comprehensive candidate list; ■ a detailed candidate specification was agreed, setting out key responsibilities, experience and personal attributes together with a clearly defined search strategy; ■ a candidate longlist was mapped against the candidate specification taking into account Unilever's Board Diversity Policy; and ■ candidates with the strongest fit were reviewed by the Committee and met with the Chair and SID and preferred candidates were nominated to meet with members of the Board. Overboarding As part of the annual evaluation process for each Director, full consideration was given to the number of external positions held to ensure that the time commitment required did not compromise the Director’s commitment to Unilever. The Committee took into account the views of various investor bodies and certain institutional investors to anticipate any perception of overboarding. The Committee did not identify any instances of overboarding and concluded that all individual Directors had sufficient time to commit to their appointment as a Director of Unilever. The full list of external appointments held by our Directors can be found in their biographies on pages 84 and 85. Board Diversity Policy Unilever has long understood and actively promoted the importance of diversity and inclusion within our workforce. This commitment forms part of Unilever’s Code of Business Principles and is embedded in the way we do business and conduct ourselves at all levels in the organisation. Unilever’s Board Diversity policy, which is reviewed by the Committee each year, is available on the Company’s website. The objective of the Board Diversity policy is to guide that the composition and quality of the Board should be in keeping with the size and geographical spread of Unilever, its portfolio, culture and status as a listed company. The Board Diversity policy is taken into account when making appointments to the Board by considering candidates on merit, on the basis of wide-ranging experience, backgrounds, skills, knowledge and insight with a continuing emphasis on diversity including, but not limited to, factors set out by applicable regulation, guidance and industry and government best practice. The Board supports the recommendations of the FTSE Women Leaders Review on gender diversity and the Parker Review on ethnic diversity. Specifically: ■ As at 31 December 2023, we are proud to have a female Senior Independent Director and 42% female Board members (including Executive Directors). 11% of the Unilever Leadership Executive are female (excluding Executive Directors), due to two females stepping down from their roles prior to the end of 2023. However, as announced on 26 October 2023, two females have been appointed to the Unilever Leadership Executive from 1 January 2024. These appointments increase the female members of the Unilever Leadership Executive to 30% (excluding Executive Directors). There is also a promising pipeline of talent, with 45% of Senior Management (direct reports to the Unilever Leadership Executive) being female as at 31 October 2023. ■ We have 33% ethnic minority Board membership (including Executive Directors), exceeding the Parker Review recommendation of one ethnic minority Board member. Our ethnic minority membership of the ULE stands at 67% (excluding Executive Directors). In accordance with the extended scope of the Parker Review for 2023, we carried out an anonymous survey of Senior Management (direct reports to the Unilever Leadership Executive) via an independent third-party company to determine ethnicity. 24% responded as minority ethnic, 24% as white and 52% undisclosed (including those based in countries where there are legal or cultural restrictions on collecting ethnicity data). Under the extended scope of the Parker Review, we set an ethnic minority target of 24% for the Board, Unilever Leadership Executive and Senior Management by 31 December 2027. This is based on our available baseline data, 2021 UK census statistics, the global nature of Unilever’s business and benchmarking. We will keep this target under review and disclose progress against, and any revision of, the target in future annual reports. Our focus for 2024 is to increase the response rate for ethnicity data from Senior Management. Succession planning Board The Committee reviews the adequacy and effectiveness of succession planning processes and the Board reviews the succession plan in conjunction with the Committee. The succession plan is based on merit and objective criteria and is designed to promote diversity. The Board should comprise a majority of Non-Executive Directors who are independent of Unilever, free from any conflicts of interest and able to allocate sufficient time to carry out their responsibilities effectively. With respect to composition and capabilities, the Board should be in keeping with the size of Unilever, its strategy, portfolio, consumer base, culture, geographical spread and its status as a listed company and have sufficient understanding of the markets and business where Unilever is active in order to understand the key trends and developments relevant for Unilever. The Board believes that a diverse Board with a range of views enhances decision- making which is beneficial to the Company’s long-term success and is in the interests of Unilever’s stakeholders. The Board seeks to promote its diversity by objectively considering candidates on the basis of their experience, skills, knowledge, expertise, gender, race, ethnicity, cultural and geographical background and age. As can be seen in the biographies on pages 84 and 85 and the tables on page 105, the Board meets this profile. ULE In conjunction with the Committee, the Board reviews the succession plan for the ULE. In line with the approach to the Board succession plan, the succession plan for the ULE is also based on merit and objective criteria and is designed to promote diversity. Developing an internal talent pipeline for leadership roles is critical for Unilever. The succession plan identifies potential successors who are considered able to fulfil the roles in the short term and those in the longer term. Development initiatives for senior executives are put in place and usually include executive mentoring and coaching. Senior managers and executives are encouraged to take on a non-executive directorship role as part of their personal development. STRATEGIC REPORT CORPORATE GOVERNANCE FINANCIAL STATEMENTS Report of the Nominating and Corporate Governance Committee 104 Unilever Annual Report on Form 20-F 2023
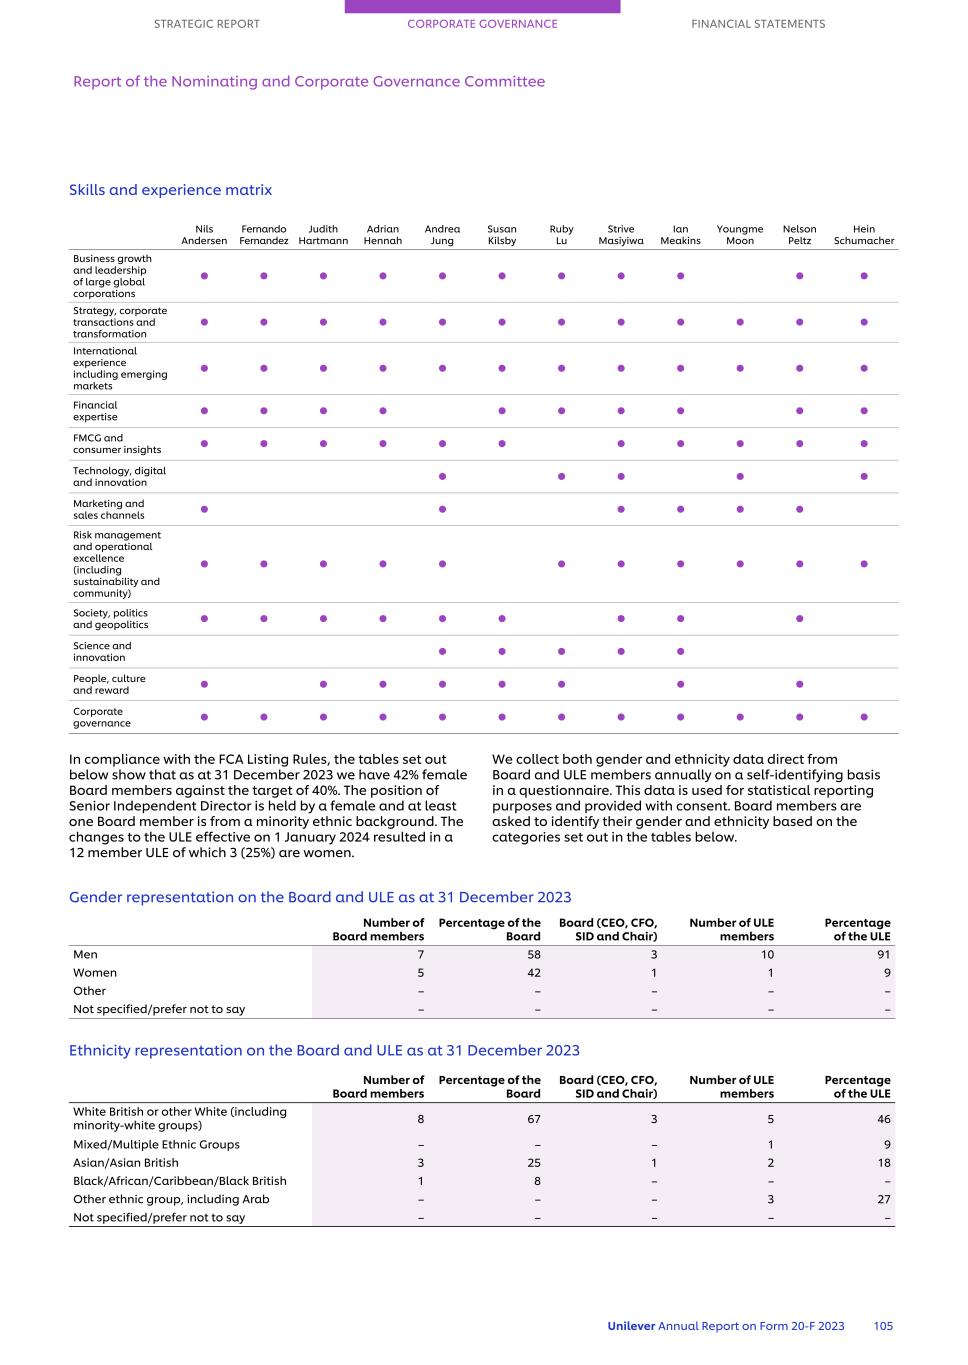
Skills and experience matrix Nils Andersen Fernando Fernandez Judith Hartmann Adrian Hennah Andrea Jung Susan Kilsby Ruby Lu Strive Masiyiwa Ian Meakins Youngme Moon Nelson Peltz Hein Schumacher Business growth and leadership of large global corporations • • • • • • • • • • • Strategy, corporate transactions and transformation • • • • • • • • • • • • International experience including emerging markets • • • • • • • • • • • • Financial expertise • • • • • • • • • • FMCG and consumer insights • • • • • • • • • • • Technology, digital and innovation • • • • • Marketing and sales channels • • • • • • Risk management and operational excellence (including sustainability and community) • • • • • • • • • • • Society, politics and geopolitics • • • • • • • • • Science and innovation • • • • • People, culture and reward • • • • • • • • Corporate governance • • • • • • • • • • • • In compliance with the FCA Listing Rules, the tables set out below show that as at 31 December 2023 we have 42% female Board members against the target of 40%. The position of Senior Independent Director is held by a female and at least one Board member is from a minority ethnic background. The changes to the ULE effective on 1 January 2024 resulted in a 12 member ULE of which 3 (25%) are women. We collect both gender and ethnicity data direct from Board and ULE members annually on a self-identifying basis in a questionnaire. This data is used for statistical reporting purposes and provided with consent. Board members are asked to identify their gender and ethnicity based on the categories set out in the tables below. Gender representation on the Board and ULE as at 31 December 2023 Number of Board members Percentage of the Board Board (CEO, CFO, SID and Chair) Number of ULE members Percentage of the ULE Men 7 58 3 10 91 Women 5 42 1 1 9 Other – – – – – Not specified/prefer not to say – – – – – Ethnicity representation on the Board and ULE as at 31 December 2023 Number of Board members Percentage of the Board Board (CEO, CFO, SID and Chair) Number of ULE members Percentage of the ULE White British or other White (including minority-white groups) 8 67 3 5 46 Mixed/Multiple Ethnic Groups – – – 1 9 Asian/Asian British 3 25 1 2 18 Black/African/Caribbean/Black British 1 8 – – – Other ethnic group, including Arab – – – 3 27 Not specified/prefer not to say – – – – – STRATEGIC REPORT CORPORATE GOVERNANCE FINANCIAL STATEMENTS Report of the Nominating and Corporate Governance Committee Unilever Annual Report on Form 20-F 2023 105
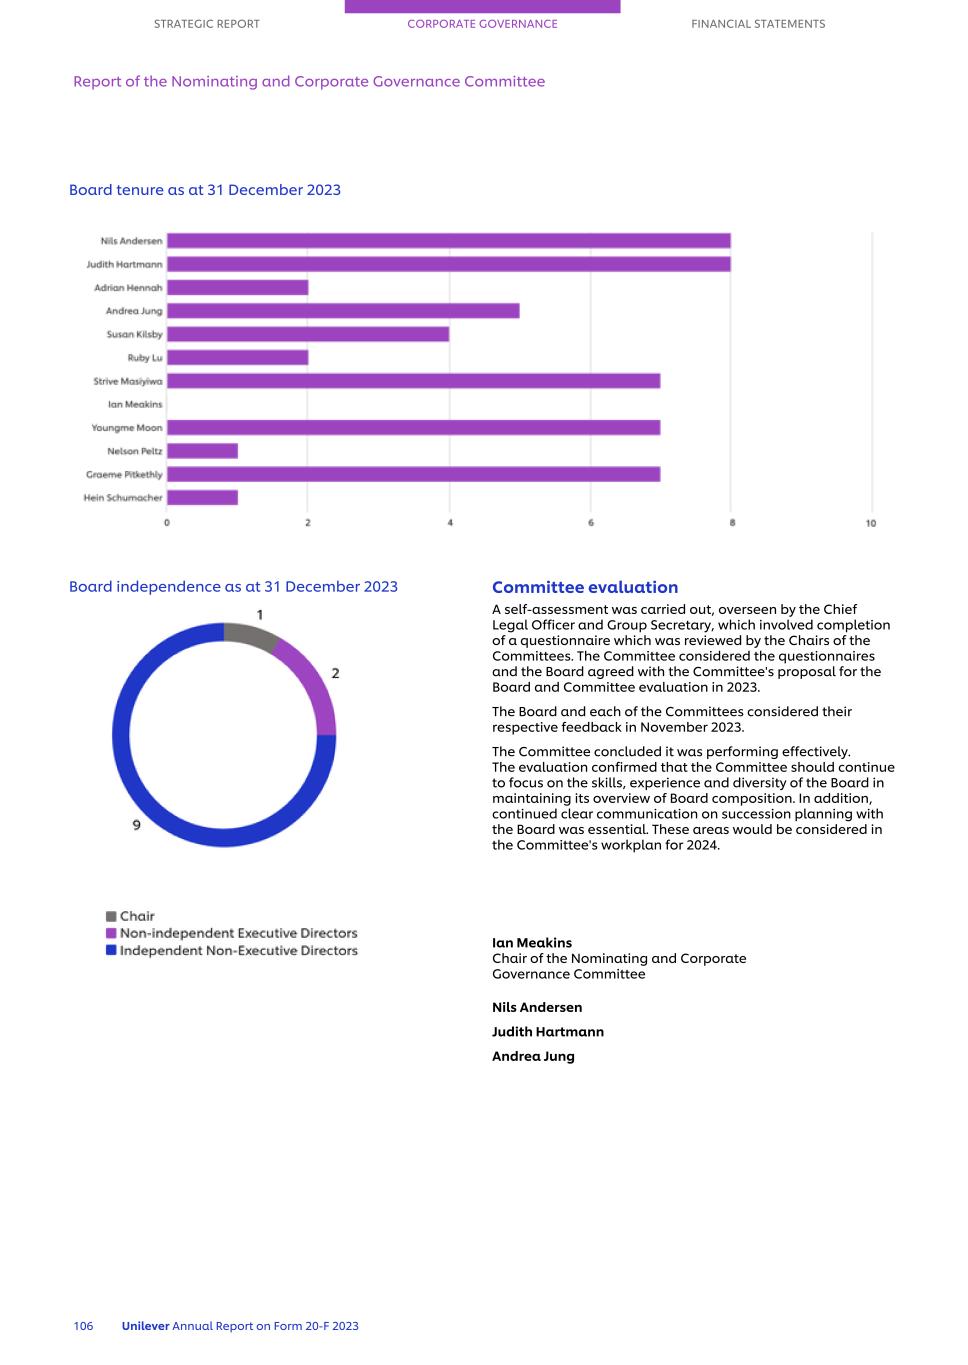
Board tenure as at 31 December 2023 Board independence as at 31 December 2023 Committee evaluation A self-assessment was carried out, overseen by the Chief Legal Officer and Group Secretary, which involved completion of a questionnaire which was reviewed by the Chairs of the Committees. The Committee considered the questionnaires and the Board agreed with the Committee's proposal for the Board and Committee evaluation in 2023. The Board and each of the Committees considered their respective feedback in November 2023. The Committee concluded it was performing effectively. The evaluation confirmed that the Committee should continue to focus on the skills, experience and diversity of the Board in maintaining its overview of Board composition. In addition, continued clear communication on succession planning with the Board was essential. These areas would be considered in the Committee's workplan for 2024. Ian Meakins Chair of the Nominating and Corporate Governance Committee Nils Andersen Judith Hartmann Andrea Jung STRATEGIC REPORT CORPORATE GOVERNANCE FINANCIAL STATEMENTS Report of the Nominating and Corporate Governance Committee 106 Unilever Annual Report on Form 20-F 2023
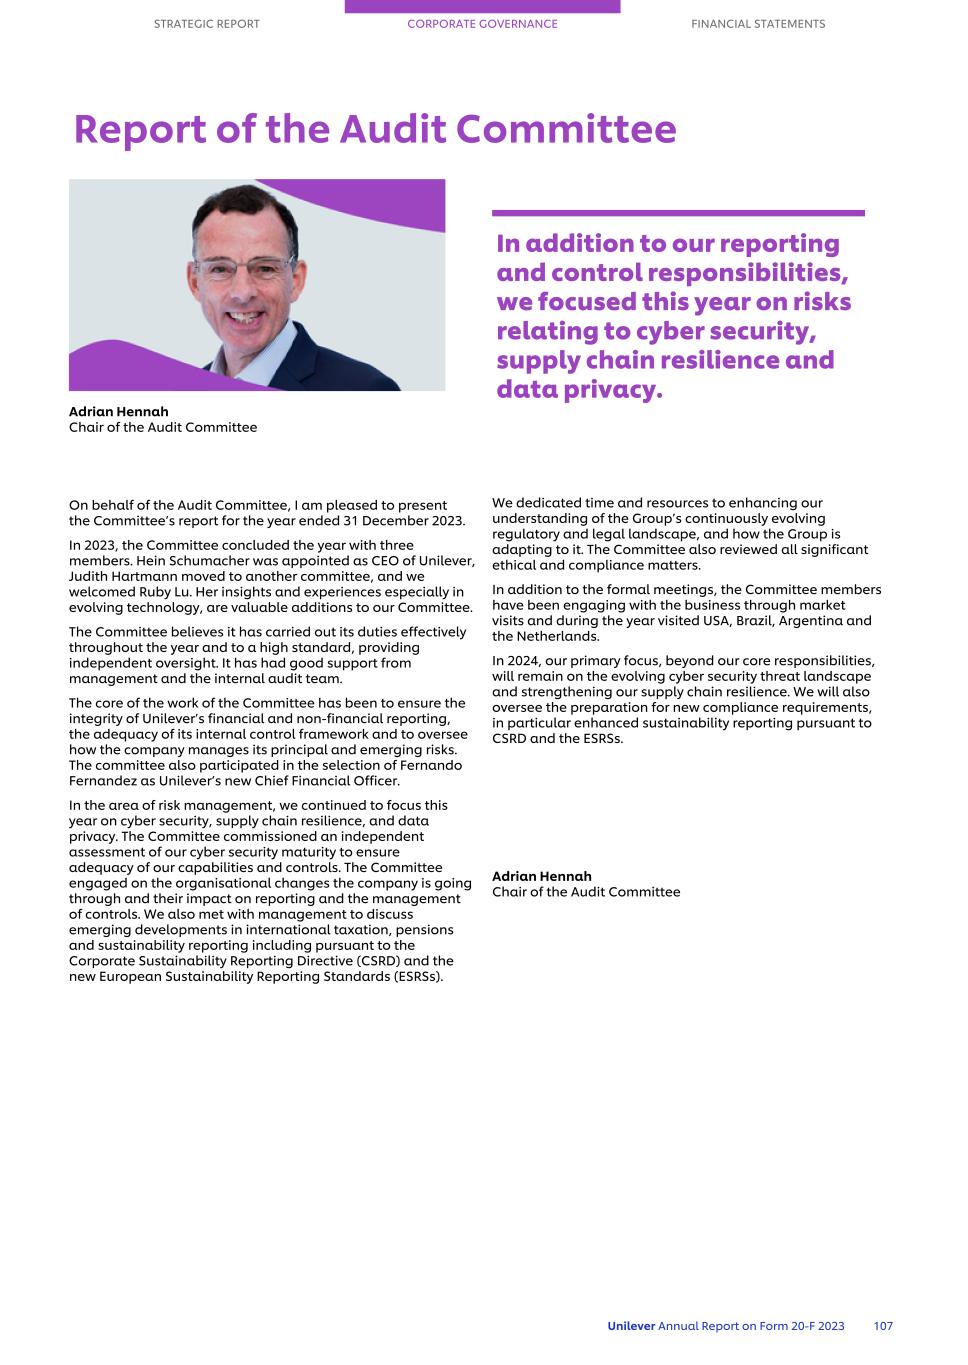
Adrian Hennah Chair of the Audit Committee On behalf of the Audit Committee, I am pleased to present the Committee’s report for the year ended 31 December 2023. In 2023, the Committee concluded the year with three members. Hein Schumacher was appointed as CEO of Unilever, Judith Hartmann moved to another committee, and we welcomed Ruby Lu. Her insights and experiences especially in evolving technology, are valuable additions to our Committee. The Committee believes it has carried out its duties effectively throughout the year and to a high standard, providing independent oversight. It has had good support from management and the internal audit team. The core of the work of the Committee has been to ensure the integrity of Unilever’s financial and non-financial reporting, the adequacy of its internal control framework and to oversee how the company manages its principal and emerging risks. The committee also participated in the selection of Fernando Fernandez as Unilever’s new Chief Financial Officer. In the area of risk management, we continued to focus this year on cyber security, supply chain resilience, and data privacy. The Committee commissioned an independent assessment of our cyber security maturity to ensure adequacy of our capabilities and controls. The Committee engaged on the organisational changes the company is going through and their impact on reporting and the management of controls. We also met with management to discuss emerging developments in international taxation, pensions and sustainability reporting including pursuant to the Corporate Sustainability Reporting Directive (CSRD) and the new European Sustainability Reporting Standards (ESRSs). In addition to our reporting and control responsibilities, we focused this year on risks relating to cyber security, supply chain resilience and data privacy. We dedicated time and resources to enhancing our understanding of the Group’s continuously evolving regulatory and legal landscape, and how the Group is adapting to it. The Committee also reviewed all significant ethical and compliance matters. In addition to the formal meetings, the Committee members have been engaging with the business through market visits and during the year visited USA, Brazil, Argentina and the Netherlands. In 2024, our primary focus, beyond our core responsibilities, will remain on the evolving cyber security threat landscape and strengthening our supply chain resilience. We will also oversee the preparation for new compliance requirements, in particular enhanced sustainability reporting pursuant to CSRD and the ESRSs. Adrian Hennah Chair of the Audit Committee STRATEGIC REPORT CORPORATE GOVERNANCE FINANCIAL STATEMENTS Report of the Audit Committee Unilever Annual Report on Form 20-F 2023 107
Committee membership and attendance Attendance Adrian Hennah Chair 8/8 Susan Kilsby 8/8 Judith Hartmann (member up to and including 2 May 2023 ) 5/5 Hein Schumacher (member up to and including 2 May 2023) 5/5 Ruby Lu (member from 3 May 2023) 3/3 The Audit Committee is comprised only of independent Non- Executive Directors with a minimum requirement of three such members. The Audit Committee was chaired by Adrian Hennah. The other Committee members are Susan Kilsby, and Ruby Lu who was appointed in July 2023 replacing Judith Hartmann who transitioned to another committee. Hein Schumacher was appointed to become CEO of Unilever as of July 2023. The Board is satisfied that the members of the Audit Committee are competent in financial matters and have recent and relevant experience. For the purposes of the US Sarbanes-Oxley Act of 2002, Adrian Hennah is the Audit Committee’s financial expert. Other attendees at Committee meetings included the Chief Financial Officer (CFO), Chief Auditor, Deputy CFO & Controller, Chief Legal Officer & Group Secretary, Deputy Group Secretary & Head of Corporate Legal, General Counsel Corporate Governance and Group Corporate Legal, Head of Secretariat, EVP Sustainable Business Performance and Reporting and the external auditors. Throughout the year, the Committee members met periodically without others present and also held separate private sessions with the Chief Financial Officer, Chief Auditor and the external auditors. There were eight scheduled meetings of the Committee during the year. Attendance at the scheduled meetings is shown above. Given changes in the Committee membership this year, attendance is expressed as the number of meetings attended out of the number able to be attended during each director’s respective tenure on the Committee during the year. Role of the Committee The role and responsibilities of the Audit Committee are set out in written terms of reference which are reviewed annually by the Committee, considering relevant legislation, and recommended good practices. The terms of reference are contained within the document entitled "The Governance of Unilever" which is available on our website. The Committee’s responsibilities include, but are not limited to, the following matters: ■ oversight of the integrity of Unilever’s financial statements; ■ review of Unilever’s half-yearly and annual financial statements (including clarity and completeness of disclosure) and of the quarterly trading statements for quarter 1 and quarter 3; ■ oversight of risk management and internal control arrangements; ■ oversight of compliance with legal and regulatory requirements; ■ oversight of the external auditors’ performance, objectivity, qualifications, and independence; ■ the approval process of non-audit services; ■ recommendation to the Board of the nomination of the external auditors for shareholder approval; and approval of their fees, refer to note 25 on page 225; and ■ performance of the internal audit function. All relevant matters arising are brought to the attention of the Board. Committee Reviews To help the Committee meet its oversight responsibilities, focused knowledge sessions are organised for committee members throughout the year. In 2023, sessions were held to review the impact of cost inflation, a review of group litigation, sustainability reporting and M&A performance and plans. In addition, Committee members visited the local businesses in the US, Argentina, Brazil, and the Netherlands providing them with an insight into local market challenges and local risk and control management. In Brazil special focus was given to existing tax liabilities, please refer to note 19 and 20 on page 219-220. In Argentina management’s approach to the challenges arising from the hyperinflationary economic context was focused on, and in the Netherlands the Committee spent time to understand the capabilities of the new R&D center co-located within the local University campus in Wageningen. The Committee also received presentations from management and held discussions on the business's risk management activities, the preparation of the financial statements, the overall control environment, and the operation of the financial reporting controls. Special focus has been given to critical IT systems and cyber security, data privacy, major transformation projects, management of manufacturing third parties as well as management of third-party service providers. In addition, the Committee has had engagements with management with regard to their assurance work on sustainability as well as the work done in the areas of tax, treasury and pension matters. Reporting and Financial Statements The Committee reviewed, prior to publication, the quarterly financial press releases together with the associated internal quarterly reports from the Chief Financial Officer and the Disclosure Committee and, with respect to the full-year results, the external auditor’s report. It also reviewed the Annual Report and Accounts and the Form 20-F 2022 These reviews incorporated the accounting policies and significant judgements and estimates underpinning the financial statements as disclosed within note 1 on page 178. Particular attention was paid to the following significant matters in relation to the financial statements: ■ indirect tax provisions and contingent liabilities related to Brazil, refer to notes 19 and 20 on pages 219-220. The Committee agreed that the tax provisions and judgements around the likelihood as well as the disclosures are appropriate in the Annual Report and Accounts; ■ revenue recognition. The Committee reviewed the adequacy of the policy around the cut off and appropriateness of discounts accruals; ■ impairment risk in Russia. The committee reviewed the disclosure of the impairment risk related to Russia; ■ the presentation of non-underlying items. The Committee took account of management’s responses to its review and of the reporting received from and observations made by the external Auditor. For each of the above areas, the Committee considered the key facts and judgements outlined by management. Members of management attended the section of the meeting of the Committee where their item was discussed to answer any questions or challenges posed by the Committee. The Committee's feedback has been incorporated into the final approach. The matters were also discussed with the external auditors and further information can be found on pages 157 to 172. STRATEGIC REPORT CORPORATE GOVERNANCE FINANCIAL STATEMENTS Report of the Audit Committee 108 Unilever Annual Report on Form 20-F 2023
The Committee specifically discussed with the external auditor how management’s judgement and assertions were challenged and how professional scepticism was demonstrated during their audit of these areas; this included the disclosures for each matter noted above. The Committee is satisfied that there are relevant accounting policies in place in relation to these significant matters and management has correctly applied these policies. In addition to the matters noted above our external auditors, as required by auditing standards, also consider the risk of management override of controls. Nothing has come to our attention to suggest any material misstatement with respect to suspected or actual fraud relating to management override of controls. At the request of the Board, the Committee undertook to: ■ review the appropriateness of adopting the going concern basis of accounting in preparing the annual and half-yearly financial statements; ■ assess whether the business was viable in accordance with the requirement of the UK Corporate Governance Code. The assessment included a review of the principal and emerging risks facing Unilever, their potential impact, how they were being managed, together with a discussion as to the appropriate period for the assessment. The Committee recommended to the Board that there is a reasonable expectation that the Group will be able to continue in operation and meet its liabilities as they fall due over the three-year period (consistent with the period of the strategic plan) of the assessment; and ■ consider whether the Unilever Annual Report on Form 20-F 2023 was fair, balanced, and understandable, and whether it provided the necessary information for shareholders to assess the Group’s year-end position and performance, business model and strategy. To make this assessment, the Committee received copies of the Annual Report and financial statements to review during the drafting process to ensure that the key messages were aligned with the Company’s position, performance, and strategy. The Committee also reviewed the processes and controls that are the basis for its preparation. The Committee was satisfied that, taken as a whole, the Unilever Annual Report on Form 20-F 2023 is fair, balanced, and understandable. Regulator Correspondence In 2023, Unilever did not receive any formal notifications or communications from either the U.S. Securities and Exchange Commission (SEC) or the UK Financial Reporting Council (FRC). Sustainability The Committee continued to oversee the reporting of sustainability performance, keeping itself updated on the changing regulatory requirements in this area by having separate knowledge sessions with management and PwC during the year. This included updates on changes in sustainability reporting requirements and changes in sustainability assurance. Historically, reporting on environmental and social matters has mostly been voluntary but this is rapidly changing and there is more and more mandatory reporting on these matters. The UK has required premium listed companies to disclose climate-related information based on the Taskforce on Climate-Related Financial Disclosures (TCFD) framework for the last couple of years. For the financial year beginning on 1 January 2024 we will also need to comply with the CSRD and disclose material sustainability information in accordance with the European Sustainability Reporting Standards. This is an extensive suite of disclosures on a range of environmental, social and governance matters which will be included in our 2024 Annual Report and Accounts. The Committee will be responsible together with the Corporate Responsibility Committee for overseeing compliance with these disclosure requirements. In future years there are also likely to be further mandatory non-financial reporting standards which will be applicable to the group as the International Sustainability Standards Board (ISSB) has issued a number of sustainability reporting standards and is working on additional ones, and these are currently going through the endorsement process for use in the UK. During 2023, the Committee reviewed the 2023 to 2026 sustainability assurance plan. Risk Management & Internal Controls (Assurance) The Committee reviewed Unilever’s overall approach to risk management and control, and its processes, outcomes, and disclosure. The assessment was undertaken through a review of: ■ the yearly report detailing the risk identification and assessment process, together with any emerging risks identified by management; ■ reports from senior management on risk areas for which the Committee had oversight responsibility: treasury, tax and pensions, information security, data privacy, legal and regulatory compliance, supply chain and key suppliers and business transformation; ■ the proposed risk areas identified by the ULE; ■ the Quarterly Risk and Control Status Reports, including Code of Business Principles cases relating to frauds and financial crimes; ■ a summary of control deficiencies identified through controls testing activities together with action plans to address underlying causes; ■ management’s improvements to reporting through further automation and centralisation; and ■ the annual financial plan and Unilever’s dividend policy and dividend proposals. The Committee reviewed the application of the requirements under Section 404 of the US Sarbanes-Oxley Act of 2002 with respect to internal controls over financial reporting. In fulfilling its oversight responsibilities in relation to risk management and internal control, the Committee met regularly with senior members of management and is satisfied with the key judgements taken. STRATEGIC REPORT CORPORATE GOVERNANCE FINANCIAL STATEMENTS Report of the Audit Committee Unilever Annual Report on Form 20-F 2023 109
The Committee has completed its review for 2023 on both risk management and internal control and was satisfied that the process had worked effectively and where specific areas for improvement were identified, there were alternative controls and that processes were under way to ensure sustainable improvements. An area of focus has been to ensure that the controls impacted by the transformation programmes are appropriately designed and are being implemented effectively. Through its review, the Committee also ensured that appropriate procedures are in place for the detection and prevention of fraud. The Committee continued to prepare for legislative or regulatory changes. Whilst many of the proposed audit and corporate governance reforms in the UK are not going to proceed in the short-term, changes to the UK's Corporate Governance, principally in relation to internal controls requirements, were published in January 2024 (with strengthened requirements relating to material internal controls coming into effect for financial years starting on/after 1 January 2026). The Committee will continue to monitor any upcoming legislation and their impact to Unilever. Internal Audit The Committee reviewed internal audit’s plan which is focused on Unilever’s risk areas including sustainability, cyber security, data privacy, financial control processes, product safety and supply chain resilience. The Committee ensured the necessary resources were in place to perform the audits effectively. Enhanced use of data and analytics has made the internal audits more efficient and effective, increasing the coverage. The Committee reviewed quarterly and year-end summary reports which included the results of audit activities and completion status of agreed actions. During the year, the Chief Auditor and his team undertook business visits in person, in particular in a number of the Group's more strategic markets. Most audits have been conducted as hybrid (combination of virtual and physical). Every five years, the Committee engages an independent third party to perform an effectiveness review of the function. This was last completed in 2022 and is planned for 2026. In 2023, the Committee evaluated the performance of the internal audit function through a questionnaire. The feedback was reviewed, and the Committee was satisfied with the effectiveness of the internal audit function. During the year, the Committee also met independently with the Chief Auditor and discussed the results of the audits performed and any additional insights obtained from the Chief Auditor. Audit of the annual accounts KPMG, Unilever’s external auditors and an independent registered public accounting firm, reported in depth to the Committee on the scope and outcome of the annual audit, including their audit of internal controls over financial reporting as required by Section 404 of the US Sarbanes-Oxley Act of 2002. Their reports included audit and accounting matters, governance and control, and accounting developments. The Committee held independent meetings with the external auditors during the year and reviewed, agreed, discussed, and challenged their audit plan, including the materiality applied, scope and assessment of the financial reporting risk profile of the Group. The Committee discussed the views and conclusions of KPMG regarding management’s treatment of significant transactions and areas of judgement during the year. The Committee considered these and is satisfied with the treatment in the financial statements. External Auditors KPMG has been the Group’s auditors since 2014 and shareholders approved their reappointment as the Group’s external auditors at the 2023 AGM. On the recommendation of the Committee, the Directors will be proposing the reappointment of KPMG at the AGM in May 2024. The Committee confirms that the Group is in compliance with The Statutory Audit Services for Large Companies Market Investigation (Mandatory Use of Competitive Tender Processes and Audit Committee Responsibilities) Order 2014, which requires Unilever to tender the audit every ten years. The last tender for the audit of the Annual Report and Accounts was performed in 2022 where the decision to reappoint KPMG was unanimously recommended by the Committee and approved by the Board of Unilever. At present, we are satisfied with the effectiveness of our current auditors and hence have no plans to re-tender the external auditor appointment for an earlier period. This position is re-evaluated each year. Both Unilever and KPMG have safeguards in place to avoid the possibility that the external auditors’ objectivity and independence could be compromised, such as audit partner rotation and the restriction on non-audit services that the external auditors can perform as described below. KPMG has issued a formal letter to the Committee outlining the general procedures to safeguard independence and objectivity, disclosing the relationship with the Company, and confirming their audit independence. Each year, the Committee assesses the effectiveness of the external audit process which includes discussing feedback from the members of the Committee and stakeholders at all levels across Unilever. Interviews are also held with key senior management within both Unilever and KPMG. The Committee also reviewed the statutory audit, other audit and non-audit services provided by KPMG and compliance with Unilever’s documented approach, which prescribes in detail the types of engagements, listed below, for which the external auditors can be used: ■ statutory audit services, including audit of subsidiaries; ■ other audit services – audits that are not required by law or regulation; ■ non-audit services – work that our external auditors are best placed to undertake, which may include: ■ services required by law or regulation to be performed by the audit firm; and ■ services where knowledge obtained during the audit is relevant to the service such as bond issue comfort letters. Unilever has for many years maintained a policy which prescribes in detail the types of engagements for which the external auditors can be used with all other engagements being prohibited. The policy is aligned with both UK and SEC regulations and is updated in line with these regulations. STRATEGIC REPORT CORPORATE GOVERNANCE FINANCIAL STATEMENTS Report of the Audit Committee 110 Unilever Annual Report on Form 20-F 2023

Audit Fees All engagements over €250,000 require specific advance approval by the Audit Committee Chair. The Committee further review all engagements which have been authorised by the Deputy CFO & Controller. These authorities are reviewed regularly and, where necessary, updated in the light of internal and external developments. Since the appointment of KPMG in 2014, the level of non-audit fees has been below 8% of the annual statutory audit fee, this is also the case for 2023. The level of other audit fees has been below 6% of the annual statutory audit fee except for 2017 (41%), 2018 (24%), 2020 (32%) and 2021 (21%) due to assurance work relating to the disposal of our Spreads business (2017 and 2018) and assurance work relating to the separation of our Tea business (2020 and 2021). Evaluation of the Committee The Committee carried out an assessment of its effectiveness and performance in the year. The process was overseen by the Chief Legal Officer & Group Secretary. The Committee considered the output from that process at its meeting in November 2023. Feedback was also provided to the Board as part of its evaluation of the overall effectiveness of the Board. The Committee concluded that it is performing effectively. Adrian Hennah Chair of the Audit Committee Susan Kilsby Ruby Lu STRATEGIC REPORT CORPORATE GOVERNANCE FINANCIAL STATEMENTS Report of the Audit Committee Unilever Annual Report on Form 20-F 2023 111

As a Committee, we guide Unilever’s strategy on sustainability, from climate change and plastics, to living wage and human rights. Strive Masiyiwa Chair of the Corporate Responsibility Committee On behalf of the Corporate Responsibility Committee (CRC), I am pleased to present our report for 2023. On reflection, this has been a year of progress despite an ever- changing and increasingly complex operating environment. The CRC is responsible for the oversight of Unilever’s conduct regarding its corporate and societal obligations, its reputation as a responsible corporate citizen and its culture. To execute this duty, the Committee worked closely with Unilever and the Board on a range of topics including climate litigation, Human Rights, and Equity, Diversity, and Inclusion (ED&I), and non- financial reporting, as well as Unilever’s performance against the Sustainability Progress Index (SPI), one of the performance measures for our long-term incentive plans. This year, external challenges reinforced the importance of the Committee’s role in protecting and enhancing Unilever’s reputation, a foundational element to the business's success. The Committee and management discussed at length geopolitical tensions and conflict as well as rising activism, and Unilever’s position, ensuring the business had robust processes in place to respond to such risks, especially those that emerge quickly. From these discussions, the CRC made recommendations to the Board to ensure that Unilever maintains the highest level of oversight of material issues. The Committee also focused on the Climate Transition Action Plan (CTAP) and specifically the Business Group emissions reduction roadmaps to 2030. With the external landscape a challenging mixture of activism, disclosure and physical climate risks, the Committee guided management ahead of the presentation of the CTAP to Unilever’s stakeholders. Throughout the year, it was clear Unilever’s leadership remains committed to delivering resilient, sustainable and superior performance. With the appointment of Hein Schumacher as CEO, and sustainability a key tenet of the Growth Action Plan, there is no doubt that the company remains committed to being a leader in sustainable business. In 2024, with the sustainability focus areas defined, the business is well positioned to use its scale and expertise to make progress on its most material issues. The CRC will continue to support the business to do so, by reviewing the sustainability strategy and challenging management to remain focussed on long-term impact and resilience. Lastly, on behalf of the Committee, thank you to Feike Sijbesma who retired from the CRC after eight years. I look forward to welcoming a new Corporate Responsibility Committee member in 2024. My thanks also go to Unilever’s leadership and the whole organisation for the commitment and drive to deliver sustainable, responsible growth. I look forward to the year ahead and further honest and constructive engagements with my fellow Committee members. Strive Masiyiwa Chair of the Corporate Responsibility Committee STRATEGIC REPORT CORPORATE GOVERNANCE FINANCIAL STATEMENTS Report of the Corporate Responsibility Committee 112 Unilever Annual Report on Form 20-F 2023
Committee members and attendance Attendance Strive Masiyiwa Chair 5/5 Youngme Moon 5/5 Feike Sijbesma 4/4 This table shows the membership of the Committee together with their attendance at meetings up to and including 31 October 2023. If Directors are unable to attend a meeting, they have the opportunity to discuss any agenda items beforehand with the Committee Chair. The Corporate Responsibility Committee comprises three Non-Executive Directors: Strive Masiyiwa (Chair), Youngme Moon and Feike Sijbesma. Feike Sijbesma retired from the Committee in October 2023. The Chief Research & Development Officer, the Chief Sustainability Officer and the Chief Business Integrity Officer attend the Committee’s meetings. The Chief Legal Officer & Group Secretary, and Head of Communications may also join the Committee's discussions. Role of the Committee The Corporate Responsibility Committee oversees Unilever’s conduct as a responsible global business. Core to this remit is its governance of progress on Unilever’s sustainability agenda. Part of this responsibility is reviewing and managing sustainability-related risks, opportunities and trends material to Unilever. The Committee also provides reviews and recommendations to the Board about the CTAP which sets out the actions we intend to take to reduce emissions in our business and progress on our net zero goal by 2039. The Committee is charged with ensuring that Unilever’s reputation is protected and enhanced, so it must consider the Company’s influence and impact on stakeholders. Central to this is the need to identify any external developments that are likely to impact Unilever’s corporate reputation, and to ensure that appropriate and effective communication policies are in place to support this. The Committee also oversees employee safety, security and wellbeing alongside Unilever’s Code of Business Principles and third-party compliance with our Responsible Partner Policy, ensuring that both Unilever’s direct employees and those working within the Company’s value chain comply with the expected standards of conduct. The Committee’s discussions are informed by the experience of the Unilever Leadership Executive which is accountable for driving responsible and sustainable growth through Unilever’s operations, Business Groups, value chain and brands. Senior leaders are invited to the Committee to share their perspectives and insights on key issues, challenges and external developments. Complementing the Committee’s role, the Audit Committee is responsible for reviewing the independent assurance programme of Unilever’s sustainability commitments, and significant breaches of the Code of Business Principles. The Committee’s terms of reference are set out at: www.unilever.com/corporategovernance During 2023, the Committee had detailed discussions on occupational health, non-financial reporting, climate litigation, the roadmap to net zero, CTAP 2.0, Human Rights, and Equity, Diversity, and Inclusion (ED&I). How the Committee has discharged its responsibilities In 2023, the Committee’s principal activities were as follows: Navigating an uncertain and volatile world The world is an increasingly turbulent place, facing unprecedented and mutually reinforcing environmental and social risks that impact our business, both directly and indirectly. Campaigners are leveraging technology and diverse strategic approaches – from shareholder activism to litigation – to amplify messages and mobilise people in support of their causes. Committee members closely scrutinised the processes for managing issues that present material risks to the reputation of the business, urging the business to remain proactive and transparent. The Committee also reviewed the risks and mitigating actions relating to climate activism, litigation and regulatory pressure, including the accuracy and completeness of climate disclosure, and the adequacy of the business’s climate strategy. Meanwhile, both new and on going geopolitical tensions and conflict created unique challenges for Unilever in 2023. The Committee discussed matters ranging from the war in Ukraine, safety on tea plantations, and activism by Ben & Jerry’s. The Committee remained in close consultation with management on these matters, escalating their recommendations to the Board when necessary. Overseeing Code of Business Principles compliance The Code and associated Code Policies set out the standards of conduct expected of all Unilever employees in their business endeavours. Compliance with these standards is an essential element of ensuring Unilever’s continued business success. Any breach is identified as an ethical, legal, and regulatory risk to the business (see pages 77 and 78). The Corporate Responsibility Committee is responsible for oversight of the Code and Code Policies, ensuring that they remain fit for purpose and are appropriately applied. It maintains scrutiny of the mechanisms for implementing the Code and Code Policies. This is vital as compliance is essential to promote and protect Unilever’s values and standards, and hence the good reputation of the business. At each meeting, the Committee reviews an analysis of investigations into non-compliance with the Code and Code Policies and discusses any trends or learnings arising from these investigations. The Committee also considers litigation and regulatory matters which may have a reputational impact and reviews a summary of any significant developments at each meeting. These matters include anti-bribery and corruption measures and competition law compliance. Human rights continued to be a focus of the Committee’s Code oversight. STRATEGIC REPORT CORPORATE GOVERNANCE FINANCIAL STATEMENTS Report of the Corporate Responsibility Committee Unilever Annual Report on Form 20-F 2023 113
Responsible Partner Policy (RPP) compliance Extending Unilever’s values to third parties is essential if Unilever is to generate responsible growth and a positive social impact on the industry and wider society. Breaches of third-party compliance can pose a risk to the business, so the Committee rigorously examines Unilever’s compliance programmes to minimise risks. At each meeting, the Committee tracks compliance with Unilever’s RPP. This policy sets out Unilever’s requirements that third parties conduct business with integrity and respect for human rights and core labour principles. In 2023, particular focus was given to compliance by some of our smaller businesses which are on stand-alone systems. Promoting safety and security Safety, Health and Environment (SHE) are key priorities at Unilever. Unilever remains focused on promoting a safety-first culture, evidenced by our UniVoice Survey where the top-rated statement for the last several years is “Unilever is committed to my safety”. Our employee-only TRFR was 0.58 accidents per million hours worked (1 October 2022 to 30 September 2023) versus 0.67 in 2022, which shows continued improvement. In 2023, we very sadly lost one contractor due to a steam exposure. The Committee oversaw Unilever’s approach to safety with particular emphasis on road safety, process safety and contractor management risks. The Committee noted the implementation of appropriate programmes to further reduce these risks. The Committee also examined Unilever’s approach to security. As a global business, Unilever operates in many countries, some of which have a high degree of vulnerability given their diminished capacity to absorb external shocks or tackle domestic challenges. Accordingly, Unilever must remain agile to the increased market volatility created by geopolitics, conflict, inflation, and environmental and social crises. Improving the health and wellbeing of employees The Committee focused on the progress of the health and wellbeing status of Unilever employees and commended the actions taken by the business to support employees. The Committee oversaw Unilever’s Healthier U programme which focuses on chronic conditions and has engaged over 13,000 frontline workers across different geographies. The programme showed significant improvements in biomedical parameters, nutrition, quality of life, sleep, mental health, and work productivity. The programme is moving from pilot to scale by expanding to office-based employees including those in Western Europe and North America. Psychological safety remains a foundation for the organisation. The business actively monitors perceptions of psychological safety among the workforce. Programmes focused on psychological safety include a Mental Health Champion programme and team energy assessments. Equity, diversity and inclusion Our approach to equity, diversity and inclusion is focused on building a strong, inclusive culture with our own workforce; on diversifying our supply chain and increasing our procurement spend with diverse businesses; on ending harmful stereotypes through our brands with consumers; and on building stronger, more equitable communities through partnerships and advocacy. Unilever is working to remove barriers to opportunity based on factors that have been used to exclude people around the world: gender, race and ethnicity, disability, socioeconomic status, and sexual orientation. We are developing new initiatives across the business which impact a wide range of communities. The Committee encouraged continual consultation to ensure a range of views on this work and requested that they be kept up to date with the Equity Advancement Framework, an enterprise-wide tool to help uncover systemic inequities within our business, identify their root causes, and understand how they are impacting our employees’ experiences, once this is finalised. Overseeing the Climate Transition Action Plan The impacts of climate change and nature loss are becoming ever more apparent, and the imperative to reduce emissions in our societies and protect and restore nature increasingly urgent. Unilever's first CTAP was approved by shareholders at the 2021 AGM. The CTAP set out Unilever's suite of climate targets, an analysis of our value chain emissions, and the actions we intended to take to address them. It also covered aspects such as portfolio evolution (e.g. plant-based foods), external advocacy and engagement, and governance. The Corporate Responsibility Committee is responsible for overseeing CTAP progress. The Board committed to develop the CTAP in line with best practice, reflecting external guidance such as the recommendations of the UK Transition Plan Taskforce and considering the European Sustainability Reporting Standards and International Financial Reporting Standards. An updated CTAP will be presented to our shareholders at the 2024 AGM for an advisory vote. The Committee also reviewed and approved the 2023 CTAP Progress Report which is set out in the Annual Report and Accounts, as well as our two new Scope 3 emissions reduction targets. As part of the Committee’s oversight of the CTAP, members also reviewed the Business Groups’ roadmaps that aim to achieve interim 2030 targets aligned to our net zero ambition. Complying with mandatory sustainability reporting Reporting on environmental and social matters is increasingly becoming mandatory. The UK has required premium listed companies to make climate-related financial disclosures based on the TCFD framework since 2021. From January 2024, we will also need to comply with the Corporate Sustainability Reporting Directive (CSRD) and disclose material sustainability information in accordance with the European Sustainability Reporting Standards (ESRS). This is an extensive suite of disclosures on a range of environmental, social and governance matters which will be included in our 2024 Annual Report and Accounts. Together with the Audit Committee, the Committee will be responsible for overseeing compliance with these disclosure requirements. In future years, there are likely to be further mandatory non- financial reporting standards which will apply to the Group. The International Sustainability Standards Board (ISSB) has issued a number of sustainability reporting standards which are currently going through the endorsement process for use in the UK. STRATEGIC REPORT CORPORATE GOVERNANCE FINANCIAL STATEMENTS Report of the Corporate Responsibility Committee 114 Unilever Annual Report on Form 20-F 2023
Sustainability Progress Index Unilever’s Reward Framework includes a Performance Share Plan (PSP). This long-term incentive plan is linked to financial performance, as well as performance against sustainability goals (see page 65). To come to a view on Unilever’s performance on its sustainability goals for the purposes of reward, the Corporate Responsibility Committee and the Compensation Committee jointly evaluate performance against a Sustainability Progress Index (SPI). 2023 SPI outcome In 2023, as in years before, this included a selection of eight equally weighted KPIs and targets, with one ‘anchor’ KPI/target from each of the pillars which underpin Unilever’s sustainability commitments. In making their rounded assessment, the Committees review both qualitative and quantitative progress across multiple elements of the pillar and delivery against the respective anchor KPI. This year, the assessment of the SPI performance moved to in- year reporting for two KPIs to close the gap between delivery and assessment. As a result, the Committees assessed six SPI KPIs based on performance in 2022 and two SPI KPIs on performance in 2023. The nutrition KPI was updated to reflect the updated Compass commitment scope, and the health and wellbeing target was revised to ensure it remained stretching. Following an in-depth discussion on the SPI, the Corporate Responsibility Committee agreed on a performance rating which was endorsed by the Compensation Committee. This joint assessment forms part of the Compensation Committee’s overall recommendation on the SPI outcome (see page 136). 2024-2026 SPI KPIs and targets Unilever’s historic approach to incorporating sustainability into employee long-term incentives has been at the forefront of market practice. The SPI has been an established feature of our Long-Term Incentive Plan (LTIP), the Performance Share Plan, and previously the Management Co-Investment Plan (MCIP) scheme since it was introduced in 2017. In 2023, as part of the Directors’ Remuneration Policy review, the Sustainability Progress Index (SPI) was revised to ensure it remains a relevant performance measure, in line with investor and best practice expectations, and drives the right internal behaviours and decisions. The Corporate Responsibility Committee, in collaboration with the Compensation Committee, reviewed the compensation plans of our peers, and conducted an investor consultation, to inform the new SPI scheme. As a result, the Committees selected four metrics that align with Unilever’s four sustainability focus areas. The targets and ranges are all numeric and will drive the outcome; however, the Committee will retain the ability to make a rounded assessment. The outcome of the PSP 2024-2026 will be assessed using 2026 actuals. In the meantime, for in-flight PSP schemes, the Corporate Responsibility Committee and Compensation Committee will determine the annual SPI outcome using interim KPIs and targets aligned to the 2024-2026 scorecard and in-year data. Evaluation of the Corporate Responsibility Committee The Committee carried out an assessment of its effectiveness and performance in the year. The process was administered by a questionnaire and overseen by the Chief Legal Officer & Group Secretary. The Committee considered the output from that process in January 2023. The Committee concluded that it is performing effectively and highlighted the importance of retaining flexibility to discuss emerging topics. This was incorporated into the Committee’s annual workplan for 2023. The feedback was also provided to the Board as part of its evaluation of the overall performance and effectiveness of the Board. Strive Masiyiwa Chair of the Corporate Responsibility Committee Youngme Moon STRATEGIC REPORT CORPORATE GOVERNANCE FINANCIAL STATEMENTS Report of the Corporate Responsibility Committee Unilever Annual Report on Form 20-F 2023 115
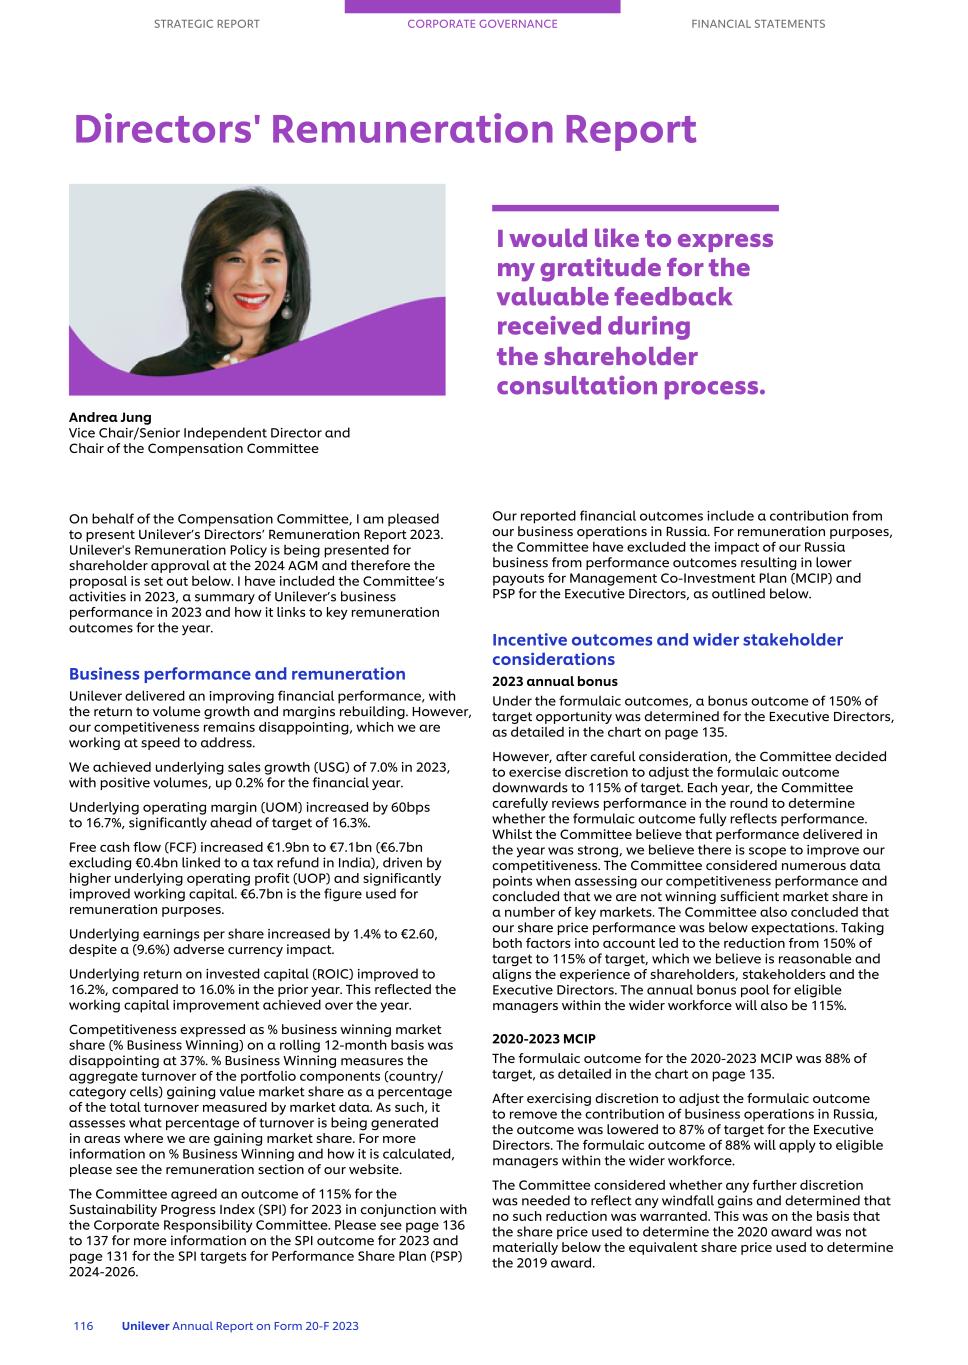
Andrea Jung Vice Chair/Senior Independent Director and Chair of the Compensation Committee On behalf of the Compensation Committee, I am pleased to present Unilever’s Directors’ Remuneration Report 2023. Unilever's Remuneration Policy is being presented for shareholder approval at the 2024 AGM and therefore the proposal is set out below. I have included the Committee’s activities in 2023, a summary of Unilever’s business performance in 2023 and how it links to key remuneration outcomes for the year. Business performance and remuneration Unilever delivered an improving financial performance, with the return to volume growth and margins rebuilding. However, our competitiveness remains disappointing, which we are working at speed to address. We achieved underlying sales growth (USG) of 7.0% in 2023, with positive volumes, up 0.2% for the financial year. Underlying operating margin (UOM) increased by 60bps to 16.7%, significantly ahead of target of 16.3%. Free cash flow (FCF) increased €1.9bn to €7.1bn (€6.7bn excluding €0.4bn linked to a tax refund in India), driven by higher underlying operating profit (UOP) and significantly improved working capital. €6.7bn is the figure used for remuneration purposes. Underlying earnings per share increased by 1.4% to €2.60, despite a (9.6%) adverse currency impact. Underlying return on invested capital (ROIC) improved to 16.2%, compared to 16.0% in the prior year. This reflected the working capital improvement achieved over the year. Competitiveness expressed as % business winning market share (% Business Winning) on a rolling 12-month basis was disappointing at 37%. % Business Winning measures the aggregate turnover of the portfolio components (country/ category cells) gaining value market share as a percentage of the total turnover measured by market data. As such, it assesses what percentage of turnover is being generated in areas where we are gaining market share. For more information on % Business Winning and how it is calculated, please see the remuneration section of our website. The Committee agreed an outcome of 115% for the Sustainability Progress Index (SPI) for 2023 in conjunction with the Corporate Responsibility Committee. Please see page 136 to 137 for more information on the SPI outcome for 2023 and page 131 for the SPI targets for Performance Share Plan (PSP) 2024-2026. I would like to express my gratitude for the valuable feedback received during the shareholder consultation process. Our reported financial outcomes include a contribution from our business operations in Russia. For remuneration purposes, the Committee have excluded the impact of our Russia business from performance outcomes resulting in lower payouts for Management Co-Investment Plan (MCIP) and PSP for the Executive Directors, as outlined below. Incentive outcomes and wider stakeholder considerations 2023 annual bonus Under the formulaic outcomes, a bonus outcome of 150% of target opportunity was determined for the Executive Directors, as detailed in the chart on page 135. However, after careful consideration, the Committee decided to exercise discretion to adjust the formulaic outcome downwards to 115% of target. Each year, the Committee carefully reviews performance in the round to determine whether the formulaic outcome fully reflects performance. Whilst the Committee believe that performance delivered in the year was strong, we believe there is scope to improve our competitiveness. The Committee considered numerous data points when assessing our competitiveness performance and concluded that we are not winning sufficient market share in a number of key markets. The Committee also concluded that our share price performance was below expectations. Taking both factors into account led to the reduction from 150% of target to 115% of target, which we believe is reasonable and aligns the experience of shareholders, stakeholders and the Executive Directors. The annual bonus pool for eligible managers within the wider workforce will also be 115%. 2020-2023 MCIP The formulaic outcome for the 2020-2023 MCIP was 88% of target, as detailed in the chart on page 135. After exercising discretion to adjust the formulaic outcome to remove the contribution of business operations in Russia, the outcome was lowered to 87% of target for the Executive Directors. The formulaic outcome of 88% will apply to eligible managers within the wider workforce. The Committee considered whether any further discretion was needed to reflect any windfall gains and determined that no such reduction was warranted. This was on the basis that the share price used to determine the 2020 award was not materially below the equivalent share price used to determine the 2019 award. STRATEGIC REPORT CORPORATE GOVERNANCE FINANCIAL STATEMENTS Directors' Remuneration Report 116 Unilever Annual Report on Form 20-F 2023
2021-2023 PSP The PSP was introduced in 2021 to replace MCIP. The performance period for the PSP is three years, compared to four years for MCIP. Therefore, there is a vesting of both the 2020-2023 MCIP and the 2021-2023 PSP in 2024 based on performance period to the end of 2023. The formulaic outcome for the 2021-2023 PSP was 65% of target, as detailed in the chart on page 136. Similarly to MCIP, after adjusting the formulaic outcome to remove the contribution from our business operations in Russia, this was reduced from 65% to 63% of target for the Executive Directors. The formulaic outcome of 65% will apply to eligible managers within the wider workforce. The Committee also considered whether any further discretion was needed to reflect any windfall gains and determined that no such reduction was warranted for the same reasons as for the 2020-2023 MCIP. Wider stakeholder considerations When considering the annual bonus, MCIP and PSP outcomes, the Committee carefully took into account the experiences of our wider stakeholders in order to ensure that outcomes were aligned. These considerations directly led to the discretionary adjustments as outlined above. Our new Directors' Remuneration Policy for 2024 Our Remuneration Policy was last approved at the May 2021 AGM. Consequently, it reaches the end of its three-year approval period, and a new remuneration policy is being presented for shareholder approval at the May 2024 AGM (New Remuneration Policy). The Committee carried out extensive consultation with shareholders and proxy advisers in June and September to discuss the 2023 AGM voting outcome on acceptance of the 2022 Directors' remuneration report and the proposed New Remuneration Policy. The feedback received during the consultation was valued by the Committee and taken into account in developing the proposed New Remuneration Policy. The Committee also monitored the external environment on pay and sought feedback from all management level employees on the current remuneration structure of fixed pay, benefits, annual bonus and PSP. 82% of respondents stated that PSP is competitive, 76% for retirement benefits, 74% for health benefits and 73% for annual bonus. Our New Remuneration Policy was developed in light of this process and feedback and provides for continuity in policy, but refinement of implementation. The key updates we are proposing to make to the implementation of our New Remuneration Policy are to: ■ freeze the CEO’s fixed pay for 2024 and 2025; ■ refocus the remuneration benchmarking peer group; and ■ update performance measures and weightings for annual bonus and PSP, as follows: ■ Annual bonus: USG 40%, UOP growth (adjusted for restructuring costs for the Executive Directors) 30% and FCF 30%. ■ PSP: USG 25%, relative total shareholder return (TSR) 30%, average underlying ROIC 30% and SPI 15%. The Committee is making these updates to: ■ retain the current remuneration structure of fixed pay, benefits, annual bonus and PSP, which is simple, previously approved by shareholders and reflects market norms of a European-listed company; ■ maintain incentive quantum, noting this results in overall pay for the Executive Directors at median level compared to peers; ■ narrow sector focus of remuneration benchmarking peer group to only include consumer goods companies and to reflect Unilever's talent pool; ■ support strong strategic alignment of incentive performance measures for 2024 and beyond; ■ simplify targets under the SPI performance measure; and ■ incorporate valued feedback received from shareholders during consultation. Having undertaken an extensive consultation exercise before finalising the New Remuneration Policy, the Committee believes it can be fully supported by the great majority of our shareholders. As with our previous reward framework, Unilever will cascade the same approach across our 15,000+ managers worldwide. However, to focus on individual performance for our managers at work levels 2 and 3, PSP will be replaced with restricted stock units and the size of the award linked to in-year performance. Executive Director changes As previously announced, Alan Jope stepped down as CEO and Executive Director on 30 June 2023 and retired from employment on 31 December 2023. Details of his remuneration are in line with the Remuneration Policy and were disclosed in last year's Directors' remuneration report. In particular, Alan remained eligible to receive a pro rata annual bonus from 1 January to 30 June 2023. As he was employed for the entirety of the performance periods, the Committee determined that his 2020-2023 MCIP and 2021-2023 awards would vest in full, subject to performance outcomes, as outlined above. Graeme Pitkethly stepped down as CFO and Executive Director with effect from 1 January 2024 and will retire from employment on 31 May 2024. He will continue to be paid in line with the Remuneration Policy until his retirement. Further details of Graeme’s leaving arrangements are set out on page 145. As announced on 26 October 2023, Fernando Fernandez was promoted to the role of CFO with effect from 1 January 2024. Fernando's fixed pay has been set at €1,175,000 with annual bonus and PSP opportunity in line with our Remuneration Policy. The Committee believes that the current positioning of the package represents an acceptable balance in view of various considerations, such as competitive external market pay rates across Unilever’s peer group, Fernando's extensive skills and experience with Unilever and salary increases awarded to the wider workforce. We also took on board previous feedback from shareholders in relation to the fixed pay of the incoming CEO and positioned Fernando's fixed pay lower than Graeme's fixed pay as current CFO. Fernando will receive a relocation allowance and the cost of temporary accommodation for a maximum of six months to support his move to the UK. Further details of Fernando's appointment are set out on page 144. STRATEGIC REPORT CORPORATE GOVERNANCE FINANCIAL STATEMENTS Directors' Remuneration Report Unilever Annual Report on Form 20-F 2023 117
Executive Director fixed pay increases The Committee considered investor feedback carefully and, as a result, the Board has decided to freeze the CEO’s fixed pay for 2024 and 2025. Given the announcement of Graeme to retire from employment at the end of May 2024, the Committee decided not to review his fixed pay for 2024. As outlined above, the Committee set the fixed pay for Fernando Fernandez as the incoming CFO, effective from 1 January 2024. The average wider workforce pay increase in 2023 was 7.62%. Non-Executive Director fees Non-Executive Director fees are in line with market rate and given the increase in fees in 2023, the Board decided not to further increase fees in 2024. We will keep Non-Executive Director fees under regular review. Engaging with shareholders As mentioned above, the Committee conducted comprehensive consultation with shareholders and proxy advisers in 2023 in respect of the 2022 Directors' remuneration report and the renewal of the Remuneration Policy. The Committee has taken into account their views, which have been invaluable in developing the final proposals. In particular, we took into account feedback in relation to the fixed pay of the incoming CEO and CFO, simplification of the SPI performance measure for PSP, introduction of relative TSR as a performance measure for PSP, UOP adjusted for restructuring costs for Executive Directors for annual bonus, composition of the benchmarking peer group, and weightings of performance measures. The Committee is committed to ensuring that remuneration performance measures for the Executive Directors align with the interests of shareholders. The Committee hopes that shareholders will be supportive of these changes and would very much welcome any further engagement on these proposals. Engaging with employees The Board shares the responsibility for workforce engagement among all the Non-Executive Directors to ensure that all Directors have a collective responsibility for bringing employee views into relevant Board discussion. We continued these engagements in 2023, see page 96 for a summary of the discussions that took place. In November 2023, the proposed New Remuneration Policy was shared with the European Works Council, followed by discussions with local works councils and trade unions where applicable. We took on board feedback to ensure Unilever focuses on long-term goals like sustainability, remains competitive to attract and retain talent, and extends share ownership to employees below management level. Along with another member of the Committee, I attended an engagement session with employees on the subject of reward and the proposed New Remuneration Policy in January 2024. Employees shared feedback on flexibility of variable remuneration, reward structures during high inflation, reward for work level 1 employees, communication of long-term incentives and culture of rewarding performance. Employees shared feedback that there has been an improvement in differentiation based on performance, which was a topic raised in the previous engagement session on reward. The Committee is periodically updated on matters impacting the workforce, including operation of annual bonus schemes, the talent review process, pay review budgets, distribution of performance ratings, diversity, living wage, the new long-term incentive plan for work levels 2 and 3, and alignment of incentives and rewards with Unilever's culture. In light of the above, the Committee believes the implementation of remuneration in 2023 is a fair reflection of employee experience. Implementation report The annual report on remuneration describes 2023 remuneration in detail as well as the planned implementation of the proposed New Remuneration Policy in 2024. On behalf of the Committee and the entire Board, I thank all shareholders and their representatives for their constructive engagement in 2023 and I hope we can rely on your vote at the 2024 Annual General Meeting. Andrea Jung Chair of the Compensation Committee STRATEGIC REPORT CORPORATE GOVERNANCE FINANCIAL STATEMENTS Directors' Remuneration Report 118 Unilever Annual Report on Form 20-F 2023
Directors’ Remuneration Policy 2024 Policy report The following sets out our New Directors’ Remuneration Policy. It fundamentally continues our existing policy with some key proposed updates to how the policy is implemented, which are discussed below. The New Remuneration Policy will be presented for approval by shareholders at the 2024 AGM and, if approved, will apply to payments made after that date and will replace the existing Remuneration Policy in its entirety. It is intended that the New Remuneration Policy will apply for three years, although the Committee may seek approval for a new policy at an earlier point if it is considered appropriate. The supporting information section provides the rationale for updates to the existing remuneration policy where appropriate as well as some information as to any changes to our approach to implementation. Remuneration payments and payments for loss of office to Directors can only be made if they are consistent with the approved Remuneration Policy or if an amendment to that remuneration policy authorising the payment has been approved by shareholders. Fixed pay Purpose and link to strategy Supports the recruitment and retention of Executive Directors of the calibre required to implement our strategy. Reflects the individual’s skills, experience, performance and seniority within the Group and the size and complexity of the role. Operation Set by the Board on the recommendation of the Committee and generally reviewed once a year, with any changes usually effective from 1 January (although changes may be made at any other time if the Committee considers that is appropriate). Fixed pay is paid in cash and is generally paid monthly. Fixed pay is set at an appropriate level to attract and retain Executive Directors of the required calibre, taking into account: ■ our policy generally to pay total compensation at around the median of an appropriate peer group of other global consumer companies of a similar financial size and complexity to Unilever;(a) ■ the individual’s skills, experience and performance; ■ the size and complexity of the role; ■ individual’s time in role; and ■ pay and conditions across the wider organisation. Performance measures n/a Opportunity Any increases will normally be in line with or below the range of increases awarded to other employees within the Group. Increases may be above this level or applied more frequently in certain circumstances, such as: ■ where there is, in the Committee’s opinion, a significant change in an Executive Director’s scope or role; ■ where a new Executive Director has been appointed to the Board at a rate lower than the typical market level for such a role and becomes established in the role; and ■ where it is considered necessary to reflect significant changes in market practice. The maximum aggregate increase for the current Executive Directors during the time in which this policy applies will be no higher than 25% for each Director. Supporting information There are no material changes relative to the previous Remuneration Policy. The peer group used to benchmark pay has been updated to better reflect the global footprint of the Group and to focus more narrowly on consumer companies. As previously communicated, the Committee has decided to freeze the fixed pay of Hein Schumacher as the incoming CEO up to the end of 2025. The Committee will next review his fixed pay level in 2026. (a) The proposed remuneration peer group for 2024 includes Anheuser-Busch InBev, Beiersdorf, British American Tobacco, Coca-Cola, Colgate-Palmolive, Danone, Diageo, Haleon, Heineken, Henkel, Kimberly-Clark, Kraft Heinz, L’Oréal, LVMH, Mondelēz, Nestlé, PepsiCo, Pernod Ricard, Procter and Gamble, and Reckitt Benckiser. The peer group used for pay benchmarking purposes is reviewed regularly and companies are added and/or removed at the Committee’s discretion to ensure that it remains appropriate. Benefits Purpose and link to strategy Provides certain benefits on a cost-effective basis to aid attraction and retention of Executive Directors. Operation Benefits include provision of death, disability and medical insurance cover, Directors’ liability insurance and actual tax return preparation costs. Other benefits may be provided in the future where it is considered necessary by the Committee and/or required by legislation. In the event that Unilever were to require an existing or new Executive Director to relocate, Unilever may pay appropriate relocation allowances for a specified time period of no more than three years. This may cover costs such as (but not limited to) relocation, cost of living, housing benefit, home leave, tax and social security equalisation and education assistance. Executive Directors are entitled to participate on the same terms as all UK employees in the Unilever PLC Sharebuy Plan. Opportunity Based on the cost to Unilever of providing the benefit and dependent on individual circumstances. Relocation allowances – the level of such benefits would be set at an appropriate level by the Committee, taking into account the circumstances of the individual and typical market practice. Awards under the all-employee Unilever PLC Sharebuy Plan may be up to HMRC-approved limits. The only change in the value of the current benefits (for single figure purposes) will reflect changes in the costs of providing those benefits. There is no separate benefit or allowance provided in respect of pension which is deemed to be included in fixed pay. Performance measures n/a Supporting information There are no changes relative to the previous Remuneration Policy. STRATEGIC REPORT CORPORATE GOVERNANCE FINANCIAL STATEMENTS Directors' Remuneration Report Unilever Annual Report on Form 20-F 2023 119
Annual bonus Purpose and link to strategy Incentivises year-on-year delivery of rigorous short-term financial, strategic and operational objectives selected to support our annual business strategy and the ongoing enhancement of shareholder value. The ability to recognise performance through annual bonus enables us to manage our cost base flexibly and react to events and market circumstances. Operation Each year, the Executive Directors may have the opportunity to participate in the annual bonus plan. The Executive Directors are set a target opportunity that is assessed against the business performance multiplier of up to 150% of target opportunity at the end of the year. Directors are required to defer 50% of their bonus into shares or share awards for three years. Deferred bonus awards can earn dividends or dividend equivalents during the vesting period and may be satisfied in cash and/or shares. Deferral may be effected under the Unilever Share Plan 2017, or by such other method as the Committee determines. Recovery, discretion, ultimate remedy, malus and claw-back provisions apply (see details on page 121). Opportunity The maximum annual bonus opportunity under this Policy is 225% of fixed pay. The normal target bonus opportunity for the CEO is 150% of fixed pay, and for the CFO is 120% of fixed pay. This results in normal maximums of 225% and 180% respectively. Achievement of threshold performance results in a payout of 0% of the maximum opportunity. Performance measures The business performance multiplier is based on a range of business metrics set by the Committee on an annual basis to ensure that they are appropriately stretching for the delivery of threshold, target and maximum performance. These performance measures may include underlying sales growth (USG), underlying operating profit (UOP) growth (adjusted for restructuring costs for the Executive Directors) and free cash flow (FCF), along with any other measures chosen by the Committee, as appropriate. The Committee also sets the weightings of the respective metrics on an annual basis. The Committee has discretion to adjust the formulaic outcome of the business performance multiplier, if it believes this better reflects the underlying performance of Unilever. In any event, the overall business performance multiplier will not exceed 150%. The use of any discretion will be fully disclosed in the Directors’ remuneration report for the year to which discretion relates. The Committee may introduce non-financial measures in the future, subject to a minimum of 70% of targets being financial in nature. Performance is normally measured over the financial year. Supporting information There are no changes relative to the previous Remuneration Policy. Performance measures for 2024 have been updated to replace underlying operating margin (UOM) with UOP growth (adjusted for restructuring costs for the Executive Directors). The proposed changes to measures are to ensure we use the most strategically aligned measures, see page 123. Performance Share Plan (PSP) Purpose and link to strategy Incentivises delivery of long-term financial, strategic and operational objectives of the Company and aligns the experience of shareholders and the Executive Directors. Rewards performance of the Executive Directors while controlling costs due to pre-determined performance measures and a maximum outcome. Also acts as a retention tool given PSP awards vest after three years. Operation Under the PSP, the Executive Directors are granted rights to receive free shares on vesting (awards) which normally vest after three years, to the extent performance conditions (see performance measures section on the right) are achieved. Upon vesting, the Executive Directors have an additional two-year retention period (during which shares cannot be sold) to ensure there is a five-year duration between the grant of the award and release of the shares. Claw-back, malus, recovery, ultimate remedy and discretion provisions apply (see details on page 121). Opportunity The maximum annual grant available under this Policy is 400% of fixed pay. The normal maximum award for the CEO is 400% of fixed pay, and for the CFO is 320% of fixed pay. At target, 50% of maximum vests, equating to 200% and 160% of fixed pay respectively. 0% of the award will vest for below threshold performance. The amount payable for threshold performance will be disclosed for each metric in the relevant directors’ remuneration report. Dividend equivalents may be earned (in cash or additional shares) on the award when and to the extent that the award vests. Dividends or dividend equivalents will also be payable in respect of dividends paid during the retention period. Performance measures The Committee sets performance measures for each PSP award. These will be tested over the three financial years starting with the financial year in which the award is granted. The performance measures for the PSP grants in 2024 will be: USG (25%), relative total shareholder return (TSR) (30%), average underlying return on invested capital (ROIC) (30%), and Sustainability Progress Index (SPI) (15%). The Committee retains the discretion to change these measures and/or weighting for future grants, based on strategic priorities for Unilever at that time. The Committee will ensure that the targets set are appropriately rigorous for the delivery of threshold, target and maximum performance. The Committee retains the discretion to adjust the formulaic outcome of these performance measures to reflect its assessment of the underlying long-term performance. The use of any discretion will be fully disclosed and explained in the Directors’ remuneration report for the year to which discretion relates. Supporting information There are no changes relative to the previous Remuneration Policy. Performance measures for 2024 have been updated to replace % Business Winning with USG and cumulative FCF with relative TSR. The proposed changes to measures are to ensure we use the most strategically aligned measures, see page 123. STRATEGIC REPORT CORPORATE GOVERNANCE FINANCIAL STATEMENTS Directors' Remuneration Report 120 Unilever Annual Report on Form 20-F 2023

Claw-back, malus, recovery, ultimate remedy and discretion Claw-back: Claw-back is the recovery of payments made under the annual bonus (including deferred bonus shares) or vested Long-Term Incentive Plan (LTIP) awards. The Committee may decide to apply claw-back for up to three years from the payment of bonus awards, and up to two years from vesting or the start of any retention period (which ever is later) for the LTIP awards, in the event of: ■ a significant downward restatement of the financial results of Unilever; ■ error in calculation or misleading data; or ■ corporate failure. Claw-back may apply to all or part of a participant’s payment or award and may be effected, among other means, by reducing outstanding awards, or requiring the return of the net value of vested awards to Unilever. Malus: Malus is the adjustment of bonus, unvested deferred bonus awards or unvested LTIP awards. The Committee may apply malus to reduce an award or determine that it will not vest or only vest in part. Malus applies to deferred bonus awards during the three-year deferral period and to unvested LTIP awards during the vesting period and retention period, in the event of: ■ a significant downward restatement of the financial results of Unilever; ■ gross misconduct or gross negligence; ■ material breach of Unilever’s Code of Business Principles or any of the Unilever Code Policies; ■ breach of restrictive covenants by which the individual has agreed to be bound, or conduct by the individual which results in significant losses or serious reputation damage to Unilever; and ■ error in calculation or misleading data or corporate failure. The annual bonus will also be subject to malus on the same grounds as apply for deferred bonus awards and unvested LTIP awards. This power is an addition to the normal discretion to adjust awards and the additional sustainability test outlined in the policy table. Recovery: Recovery applies to payments of variable remuneration which have been made in error as a result of a required accounting restatement. The Committee may require repayment of any amount of erroneously awarded variable remuneration in the event Unilever is required to prepare an accounting restatement due to material non-compliance with a financial reporting requirement under securities law in the United States. Any recovery will be in accordance with the Unilever Recovery Policy. Ultimate remedy: LTIP awards are subject to ultimate remedy. Upon vesting of an award, the Committee shall have the discretionary power to adjust the value of the award if the award, in the Committee’s opinion taking all circumstances into account, produces an unfair result. In exercising this discretion, the Committee may take into account Unilever’s performance against non-financial measures. These powers are in addition to the normal discretion to adjust awards. Ultimate remedy/malus and claw-back will not apply to an award which has been exchanged following a change of control and claw-back will not apply where an award vests on a change of control. Committee discretion to amend targets/measures: For LTIP awards and annual bonus, the Committee may change a performance measure or target (including replacing a measure) in accordance with the award’s terms or if anything happens which causes the Committee reasonably to consider it appropriate to do so. The Committee may also adjust the number or class of shares subject to MCIP, PSP and deferred bonus awards if certain corporate events (e.g. rights issues) occur. The Committee will continue to review targets on all unvested awards in the event of any material acquisitions or disposals that were not included in the financial plan, or were not anticipated at the time of target setting. The Committee may make adjustments if deemed appropriate to ensure that all targets remain relevant and equally stretching in light of any M&A activity, other corporate events, or any other event that the Committee considers to be material, that was not foreseen at the time of target setting. Legacy arrangements For the duration of this New Remuneration Policy, entitlements arising before the adoption of this New Remuneration Policy will continue to be honoured in line with the approved remuneration policy under which they were granted, or their contractual terms. Awards granted under a previous remuneration policy will continue to operate under the terms of that policy and the relevant plan rules. Further details of the terms of the awards made are included in the Directors’ remuneration reports for their respective years. This provision will cease to apply once all of these awards have vested, been exercised or been forfeited as appropriate, as per the relevant policy and plan rules. Additional details are set out below. The Committee reserves the right to make any remuneration payments and payments for loss of office (including exercising any relevant discretions) notwithstanding that they are not in line with the New Remuneration Policy where the terms of the payment were agreed before the New Remuneration Policy came into effect or at a time when the relevant individual was not a Director of Unilever and, in the opinion of the Committee, the payment was not in consideration for the individual becoming a Director of Unilever. For these purposes, ‘payments’ include the Committee satisfying awards of variable remuneration and, in relation to an award over shares, the terms of the payment are ‘agreed’ at the time the award is granted. STRATEGIC REPORT CORPORATE GOVERNANCE FINANCIAL STATEMENTS Directors' Remuneration Report Unilever Annual Report on Form 20-F 2023 121

Remuneration scenarios: our emphasis on performance-related pay It is Unilever’s policy that the total remuneration package for the Executive Directors should be competitive with other global companies and that a significant proportion should be performance related. For the remuneration scenarios below, the maximum and target pay opportunities have been chosen to be consistent with the current levels for the Executive Directors. In reviewing the appropriate level of pay opportunity for the Executive Directors, the Committee considers internal and external comparators. Although pay is not driven by benchmarking, the Committee is aware that pay needs to be within a reasonable range of competitive practice. The Committee notes that total target pay is slightly below median for the CEO and incoming CFO for the 2024 benchmark group proposed by the Committee(a). The Committee typically reviews, on at least an annual basis, the impact of different performance scenarios on the potential reward opportunity and payouts to be received by the Executive Directors and the alignment of these with the returns that might be received by shareholders. The Committee believes that the level of remuneration that can be delivered in the various scenarios is appropriate for the level of performance delivered and the value that would be delivered to shareholders. The charts below show hypothetical values of the remuneration package for the Executive Directors in the first full year of the New Remuneration Policy under below threshold, target and maximum performance scenarios. Details of fixed elements of remuneration for CEO and CFO and assumptions for scenario charts Fixed remuneration Assumptions as follows (for actual Executive Director pay details, please see the Directors’ Remuneration Report below): ■ Fixed pay for CEO effective from 1 January 2024 = €1,850,000. ■ Fixed pay for CFO effective from 1 January 2024 = €1,175,000. ■ Benefits assumed to be around €310,000 for CEO and €300,000 for CFO. Variable remuneration Below threshold No 2024 annual bonus payout and no vesting under the PSP. On target Target payout of the 2024 annual bonus (150% of fixed pay for the CEO and 120% of fixed pay for the CFO). 50% of the bonus would be deferred for three years. Target vesting of 2024 awards under the PSP (200% of fixed pay for the CEO and 160% of fixed pay for the CFO). Maximum Maximum payout of the 2024 annual bonus (225% of fixed pay for the CEO and 180% of fixed pay for the CFO). 50% of the bonus would be deferred for three years. Maximum vesting under 2024 awards under the PSP (400% of fixed pay for the CEO and 320% of fixed pay for the CFO). Maximum with 50% share price increase As per maximum above, and in addition shows the impact of a share price increase of 50% from the date of grant to the date of vesting of the PSP award. Notes to variable remuneration Dividends, dividend equivalents and (except as described above) share price movements are ignored for the purposes of the illustrations above. (a) Proposed remuneration peer group for 2024 includes Anheuser-Busch InBev, Beiersdorf, British American Tobacco, Coca-Cola, Colgate-Palmolive, Danone, Diageo, Haleon, Heineken, Henkel, Kimberly-Clark, Kraft Heinz, L’Oréal, LVMH, Mondelēz, Nestlé, PepsiCo, Pernod Ricard, Procter and Gamble, and Reckitt Benckiser. STRATEGIC REPORT CORPORATE GOVERNANCE FINANCIAL STATEMENTS Directors' Remuneration Report 122 Unilever Annual Report on Form 20-F 2023

Approach to target setting Performance measures are selected to align with Unilever’s short-term performance targets and long-term business strategy objectives. Unilever’s primary business objective is to create value in a sustainable way. Performance measures focus management on the delivery of a combination of top-line revenue growth and bottom-line profit growth that Unilever believes will build shareholder value over the longer term and that will benefit all of our stakeholders. The measures chosen for the incentives will support the delivery of this objective, with distinct measures for each of the short- and longer-term incentive programmes. The Committee sets performance targets for incentive plans, taking into account internal budgets, business priorities and external forecasts so that the targets are sufficiently stretching. Good performance results in target payout while maximum payout is only achieved for delivering exceptional performance. The following sets out the performance measures for short- and long-term incentive plans to be awarded in 2024, as well as the business performance and the behaviours that they drive. 2024 performance measures and the link to strategy Incentive plan Performance measure Link to strategy Short-term: Annual Bonus Underlying sales growth (USG) at constant FX rates (40%) Clear, simple and well-understood measure supporting the achievement of Unilever’s growth ambition. Underlying operating profit (UOP) growth at current FX rates (30%) (adjusted for restructuring costs for annual bonus for the Executive Directors) Provides a focus on absolute profitability as an indicator of driving shareholder value. Free cash flow (FCF) at current FX rates (30%) Provides clear focus on the achievement of Unilever’s cash generation ambition. Long-term: PSP Underlying sales growth (USG) at constant FX rates (25%) The primary driver of value creation in our multi-year financial growth model. USG is the principal growth metric in the long-term incentive programme as delivering consistently higher growth will be a key unlocker of shareholder value. While the USG measure in the annual bonus ensures focus on in- year delivery, the PSP measure focuses on cumulative and sustained importance. To avoid a dependency or focus on a single metric, the weightings have been rebalanced. Relative total shareholder return (TSR) versus a bespoke peer group(a) (30%) Aligns remuneration with shareholders' experience and allows us to measure relative performance. The proposed vesting schedule is in line with UK norms, with threshold vesting (50% of par) for median performance (Unilever ranked 10th), rising to maximum vesting (200% of par) for upper quartile performance (Unilever ranked 5th) Average underlying return on invested capital (ROIC) (30%) Supports disciplined investment of capital within the business and encourages acquisitions which create long- term value (an especially relevant measure for members of the Unilever Leadership Executive (ULE) who make investment decisions). Unilever Sustainability Progress Index (SPI) (15%) Unilever remains committed to demonstrating that our purpose-led, future-fit strategy drives superior performance, which protects our shareholders, people, consumers, customers, suppliers and business partners, and planet and society. To ensure focused progress on key areas in relation to SPI, the Corporate Responsibility Committee and Compensation Committee agree a number of key performance indicators (KPIs) to assess progress towards sustainability goals (see page 131). These KPIs illustrate how Unilever aims to address a number of its principal risks such as climate change and plastic packaging (see our risks on page 72 and 73). For the 2024 PSP award, progress will be measured against one social and three environmental KPIs and targets. We are moving from annualised SPI targets, disclosed retrospectively, to SPI targets set over a three-year period and disclosed prospectively, to align with the other PSP performance measures. (a) The proposed TSR peer group for 2024 includes Beiersdorf, Church & Dwight, Coca-Cola, Colgate-Palmolive, Danone, Estée Lauder, General Mills, Haleon, Henkel, Kenvue, Kimberly-Clark, Kraft Heinz, L’Oréal, Mondelēz, Nestlé, PepsiCo, Procter and Gamble, and Reckitt Benckiser. STRATEGIC REPORT CORPORATE GOVERNANCE FINANCIAL STATEMENTS Directors' Remuneration Report Unilever Annual Report on Form 20-F 2023 123
Application beyond the Board Remuneration arrangements are determined throughout the Group based on the same principle: that reward should support our business strategy and should be sufficient to attract and retain high-performing individuals without paying more than is necessary. Unilever is a global organisation with employees at a number of different levels of seniority and in a number of different countries and, while this principle underpins all reward arrangements, the way it is implemented varies by geography and level. Strategic Business Objectives (SBOs) form an additional performance measure for annual bonus for ULE members, resulting in weightings of 40% USG, 20% UOP growth, 20% FCF and 20% SBOs for 2024. Also, for Business Group (BG) Presidents on the ULE, annual bonus is assessed on 75% BG performance and 25% Unilever Group performance. In principle, all our managers participate in the same Unilever annual bonus scheme with generally the same performance measures and structure. Senior managers participate in the long-term PSP plan with a restricted share plan being operated for lower levels of management. Wherever possible, all other employees have the opportunity to participate in the global share purchase plan called ‘SHARES’, which is offered in more than 100 countries. Through these initiatives, we continue to encourage all our employees to adopt an owner’s mindset with the goal of achieving our growth ambition, so they can share in the future long-term success of Unilever. Stakeholders’ considerations Guided by our purpose-led and future-fit business model, the Committee has applied a multi-stakeholder approach in reviewing the current reward framework in view of the 2024 policy renewal. The Committee has therefore engaged with various stakeholders, both internally and externally as set out below. Consideration of conditions elsewhere in the Group When determining the pay of the Executive Directors, the Committee considers the pay arrangements for other employees in the Group, including considering the average global pay review budget for the management population, to ensure that remuneration arrangements for the Executive Directors remain reasonable. Unilever takes the views of its employees seriously and on an ongoing basis we conduct the ‘Rate-My-Reward’ survey to gauge the views of employees on the different parts of their reward package. In establishing its reward framework, Unilever sought feedback from all management-level employees on the current remuneration structure of fixed pay, benefits, annual bonus and PSP. Where appropriate, we have also engaged with employee representative groups. Fairness in the workplace is a core pillar of our sustainability goals and incorporates our Framework for Fair Compensation. As part of our Framework’s living wage element, we are committed to pay a living wage to all our direct employees, which we achieved in 2020. The Committee already upholds its obligation under Section 172 of the UK Companies Act 2006 (see pages 91 to 92) to consider the impact of what we do on our multiple stakeholders. These considerations shape the way the Committee looks at pay and sets pay rates for our Executive and Non-Executive Directors relative to our wider workforce. We will continue to advance these initiatives over the years ahead to enhance the livelihoods of all our employees. For more information visit: www.unilever.com/ planet-and-society Consideration of shareholder views The Committee takes the views of shareholders seriously. We maintain an open and regular dialogue with our shareholders on remuneration matters, including consulting with our largest investors and shareholder representative bodies, when we are considering making material changes to our remuneration policy. Accordingly, shareholders have been consulted extensively and their views have been influential in shaping this New Remuneration Policy. Their feedback informed our proposals in relation to the composition of our remuneration and TSR benchmarking peer groups and the performance measures and weightings for annual bonus and PSP, as well as our decision to leave the fundamental structure and quantum of our Remuneration Policy unchanged. Minimum shareholding requirement The remuneration arrangements applicable to our Executive Directors require them to build and retain a personal shareholding in Unilever (within five years from the date of appointment with extra time granted if requirements increase significantly) to align their interests with those of Unilever’s long-term shareholders. The current requirement is 500% fixed pay for the CEO and 400% fixed pay for the CFO. All shares beneficially owned and any awards not subject to performance conditions (but, for example, subject to retention or deferral periods) count towards the shareholding requirement (on an estimated net of tax basis if tax is expected to be payable). Incoming Executive Directors will be required to retain all shares vesting from any share awards (net of any sales to cover tax) until their minimum shareholding requirements have been met in full. Any Executive Director who leaves employment is required to maintain 100% of their minimum shareholding requirement for two years after leaving. These shares will be held in the Company nominee vested accounts. If the leaver has not yet met their shareholding requirements on departure, they will be required to retain the shares they do own up to these limits. This requirement can be waived in certain exceptional personal circumstances (e.g. death, disability, ill health). STRATEGIC REPORT CORPORATE GOVERNANCE FINANCIAL STATEMENTS Directors' Remuneration Report 124 Unilever Annual Report on Form 20-F 2023
Remuneration Policy for new hires Area Policy and operation Overall The Committee will pay new Executive Directors in accordance with the approved remuneration policy and all its elements as set out above. The terms of service contracts will not overall be more generous than those of the current CEO and CFO summarised below in the ‘service contracts’ paragraph. The ongoing annual remuneration arrangements for new Executive Directors will therefore comprise fixed pay, benefits, annual bonus and PSP. For internal promotions, any variable remuneration element awarded in respect of a prior role may be paid out according to its original terms. Fixed pay Fixed pay would be set at an appropriate level to attract and retain Executive Directors of the required calibre, in line with our remuneration policy. Benefits Benefits provision would be in line with the approved relevant remuneration policy. Where appropriate, the Executive Director may also receive relocation benefits or other benefits reflective of normal market practice in the territory in which the Executive Director is employed. In addition, the Committee may agree that Unilever will pay certain allowances linked to repatriation on termination of employment. Incentive awards Incentive awards would be made under the annual bonus and PSP in line with the relevant remuneration policy and off-cycle PSP awards may be made on joining for the year of joining. All incentive awards are subject to the normal maximum as set out in the relevant remuneration policy, excluding any buy-out awards (see below). Buy-out awards The Committee may grant awards to compensate Executive Directors hired from outside Unilever for any awards they lose by leaving previous employers broadly on a like-for-like basis. Incoming Executive Directors will be required to retain all shares vesting from any share awards until their minimum shareholding requirements have been met in full. If a buy-out award is required, the Committee would aim to reflect the nature, timing, and value of awards forgone in any replacement awards. Awards may be made in cash, shares or any other method as deemed appropriate by the Committee. Where possible, share awards will be replaced with share awards. Where performance measures applied to the forfeited awards, performance measures will be applied to the replacement award or the award size will be discounted accordingly. In establishing the appropriate value of any buy-out, the Committee would also take into account the value of the other elements of the new remuneration package. The Committee would aim to minimise the cost to Unilever, although buy-out awards are not subject to a formal maximum. Any awards would be broadly no more valuable than those being replaced. Service contracts Policy in relation to Executive Director service contracts and payments in the event of loss of office Service contracts and notice period Current Executive Directors’ service contracts are not for a fixed duration but are terminable upon notice (12 months’ notice from Unilever, six months’ notice from the Executive Director), and are available for shareholders to view at the AGM or on request from the Group Secretary. Starting dates of the service contracts for the current CEO and CFO: ■ CEO: 1 June 2023 (signed on 29 January 2023); and ■ CFO: 1 January 2024 (signed on 24 October 2023). Termination payments A payment in lieu of notice can be made, to the value of no more than 12 months’ fixed pay and other benefits (unless dictated by applicable law). Other elements ■ The Executive Directors may, at the discretion of the Board, remain eligible to receive an annual bonus for the financial year in which they cease employment. Such annual bonus will be determined by the Committee taking into account time in employment and performance. ■ Treatment of share awards is as set out in the section on leaver provisions below. ■ Any outstanding all-employee share arrangements will be treated in accordance with HMRC- approved terms. ■ Other payments, such as legal or other professional fees, repatriation or relocation costs and/or outplacement fees, may be paid if it is considered appropriate. Additional payments may be permitted at the proposal of the Committee if the Committee considers not allowing such a payment would be manifestly unreasonable given the circumstances. ■ The Committee reserves the discretion to approve gifts to Executive Directors who are retiring or who are considered by the Board to be otherwise leaving in good standing (e.g. those leaving office for any reason other than termination by Unilever or in the context of misconduct). If the value of any gift for any one Executive Director exceeds £5,000, it will be disclosed in the relevant Directors’ remuneration report. Where a tax liability is incurred on any such a gift, the Committee has the discretion to approve the payment of such liability on behalf of the Executive Director in addition to the value of the gift. STRATEGIC REPORT CORPORATE GOVERNANCE FINANCIAL STATEMENTS Directors' Remuneration Report Unilever Annual Report on Form 20-F 2023 125
Leaver provisions in share plan rules ‘Good leavers’ as determined by the Committee in accordance with the plan rules* Leavers in other circumstances Change of control PSP awards Awards will normally vest following the end of the original performance period, taking into account performance and (unless the Board on the proposal of the Committee determine otherwise) pro-rated for time in employment. Alternatively, the Board may determine that awards shall vest upon termination based on performance at that time and pro-rated for time in employment (unless the Board on the proposal of the Committee determine otherwise). If an Executive Director dies or leaves due to ill health, injury or disability, awards will vest at the time of death or leaving at the target level of vesting (in case of death pro-rated for time in employment if the Director had previously left as a good leaver). Awards will normally lapse upon termination. Awards will vest based on performance at the time of the change of control and the Board, on the proposal of the Committee, have the discretion to pro-rate for time. Alternatively, Executive Directors may be required to exchange the awards for equivalent awards over shares in the acquiring company. The retention period of a PSP award will end on a change of control. Deferred bonus awards Unvested deferred bonus awards will continue in effect and vest on the normal timescale unless the Executive Director is terminated for misconduct or breach of the terms of their employment, unless the Committee decides otherwise. Unvested deferred bonus awards vest in full. * An Executive Director will usually be treated as a good leaver if they leave due to ill health, injury or disability, retirement with Unilever’s agreement, redundancy, or death in service. The Board may decide to treat an Executive Director who leaves in other circumstances as a good leaver. An Executive Director will not be treated as a good leaver if they choose to leave for another job elsewhere unless the Board determines otherwise, if they are summarily dismissed or leave because of concerns about performance. In deciding whether or not to treat an Executive Director as a good leaver, the Board will have regard to their performance in the role. If Unilever is affected by a demerger, special distribution or other transaction which may affect the value of awards, the Committee may allow PSP awards and/or deferred bonus awards to vest early over such number of shares as it shall determine (to the extent any performance measures have been met) and awards may be pro-rated to reflect the acceleration of vesting at the Committee’s discretion. STRATEGIC REPORT CORPORATE GOVERNANCE FINANCIAL STATEMENTS Directors' Remuneration Report 126 Unilever Annual Report on Form 20-F 2023
Non-Executive Directors Key aspects of Unilever’s 2024 fee policy for the Non-Executive Directors Approach to setting fees The Non-Executive Directors receive annual fees from Unilever. The Board determine Non-Executive Director fee levels, which are limited to the aggregate amount permitted by the Company’s articles of association, as approved by shareholders from time to time (which is currently €5 million per year). Unilever’s policy is to set fees at a level which is sufficient to attract, motivate and retain high-class talent of the calibre required to direct the strategy of the business without paying more than necessary. The fees are set taking into account: ■ the commitment and contribution expected by the Group; ■ fee levels paid in other global companies; and ■ that fees are paid in cash. Operation Unilever applies a modular fee structure for the Non-Executive Directors to ensure we fairly reflect the roles and responsibilities of chair and committee membership. Our basic philosophy is to pay the Chair an all- inclusive fee. Other Board members receive a basic fee and additional fees for being Senior Independent Director and chairing or membership of various committees. The Board may decide to pay fees in any other currency based on such foreign exchange rates as the Board shall determine, provided total Non-Executive Director fees stay within the annual limits as approved by shareholders from time to time. The 2024 fee structure can be found in the Directors’ Remuneration Report on page 145. The fee structure may vary from year to year within the terms of this Remuneration Policy. Fees are normally reviewed annually but may be reviewed less frequently. Additional allowances are made available to the Non-Executive Directors where appropriate, to reflect any additional time commitment or duties. Other items The Non-Executive Directors are encouraged to build up a personal shareholding of at least 100% of their total annual fees over the five years from appointment. The Non-Executive Directors are not entitled to participate in any of the Group’s incentive plans. All reasonable travel and other expenses incurred by the Non-Executive Directors in the course of performing their duties are considered to be business expenses and are reimbursed together with any tax payable. The Non-Executive Directors also receive expenses relating to the attendance of the Director’s spouse or partner, when they are invited by Unilever. Other benefits or additional payments may be provided in the future if, in the view of the Board, this is considered appropriate. Such benefits and/or payments would be within the total annual limits as approved by shareholders as described above. The Committee reserves the discretion to approve gifts to Non-Executive Directors who are retiring or who are considered by the Board to be otherwise leaving in good standing (e.g. those leaving office for any reason other than termination by Unilever or in the context of misconduct). If the value of any gift for any one Non-Executive Director exceeds £5,000, it will be disclosed in the relevant Directors’ remuneration report. Where a tax liability is incurred on any such gift, the Committee has the discretion to approve the payment of such liability on behalf of the Non-Executive Director in addition to the value of the gift. Remuneration Policy for new Non-Executive Director hires In the event of hiring a new Non-Executive Director, the Committee will align the remuneration package with the New Remuneration Policy as set out above. Non-Executive Directors’ letters of appointment The terms of engagement of the Non-Executive Directors are set out in letters of appointment which each Non-Executive Director signs upon appointment. The Non-Executive Directors are currently appointed for a one-year term, subject to satisfactory performance, re-nomination at the discretion of the Board on the recommendation of the Nominating and Corporate Governance Committee and re-election at forthcoming annual shareholder meetings. It is Unilever’s expectation that all Non-Executive Directors serve for a minimum of three years. The letters of appointment allow for Unilever to terminate a Non- Executive Director’s appointment in cases of gross misconduct, failure to perform their duties competently, conduct bringing Unilever into disrepute, bankruptcy or where the Non-Executive Director is prevented from occupying such a position by law. The letters do not contain provision for notice periods or compensation if the Non-Executive Directors’ appointments are terminated by Unilever. The Non-Executive Directors may terminate their engagement upon three months’ notice. Except in exceptional circumstances, the Board will not propose Non-Executive Directors for re-nomination when nine years have elapsed since the date of their appointment. Letters of appointment are available for inspection on request from the Group Secretary. In considering appointments to the Board, the Directors and Unilever give due consideration to the time commitment required to fulfil the role appropriately. STRATEGIC REPORT CORPORATE GOVERNANCE FINANCIAL STATEMENTS Directors' Remuneration Report Unilever Annual Report on Form 20-F 2023 127

Committee members and attendance Attendance Andrea Jung Chair 6/6 Nils Andersen 6/6 Judith Hartmann (member since 3 May 2023) 2/2 Ruby Lu (member until 3 May 2023) 4/4 Ian Meakins (member since 1 December 2023) 0/0 Nelson Peltz 6/6 This table shows the membership of the Compensation Committee together with their attendance at meetings during 2023. Attendance is expressed as the number of meetings attended out of the number eligible to attend. The Committee is comprised of five Non-Executive Directors, including Andrea Jung as the Chair. Ruby Lu stepped down from the Committee at the AGM in May 2023 and was replaced by Judith Hartmann. Ian Meakins joined the Committee on 1 December 2023, although there were not any Committee meetings between then and 31 December 2023. Ian attended a Committee meeting in November 2023 to observe as part of his onboarding. Nils Andersen and Judith Hartmann will step down from the Committee when they retire from Unilever's Board at the AGM in May 2024. Other attendees at Committee meetings in 2023 included the CEO, Chief Legal Officer & Group Secretary, Chief Counsel Executive Compensation & Employment, Chief Employment Law Counsel, Chief People & Transformation Officer, Head of Expertise & Innovation, Chief R&D Officer, Chief Sustainability Officer, Global Head of Sustainable Business Performance & Reporting, Global Head of Sustainability Compass & Markets, Deputy Chief Financial Officer & Controller, and advisers to the Committee (see below). No individual Executive Director was present when their own remuneration was being determined to ensure there was no conflict of interest. The Committee has separately sought and obtained Executive Directors’ own views when determining the amount and structure of their remuneration before recommending individual packages to the Board for approval. Role of the Committee The Committee reviews and makes a proposal to the Board on the remuneration of the Executive and Non-Executive Directors. It also has responsibility for the design and terms of Executive and all employee share-based incentive plans and the remuneration policy for the ULE and senior managers. The Committee is also involved in the performance evaluation and remuneration of the ULE. The Committee's terms of reference are contained within 'The Governance of Unilever' which is available on our website. As part of the Board evaluation carried out in 2023, the Board evaluated the performance of the Committee. The Committee also carried out an assessment of its own performance in 2023. Overall, the Committee members concluded that the Committee is performing effectively. Activities of the Committee During 2023, the Committee met six times and its activities included: ■ determining the 2022 annual bonus outcome; ■ determining the vesting of the MCIP awards for the CEO, CFO and the ULE; ■ consultation with investors in respect of the directors' remuneration report vote at the 2023 AGM and renewal of the Directors' Remuneration Policy; ■ considering and approving the proposed New Remuneration Policy; ■ setting the 2023 annual bonus and Performance Share Plan (PSP) 2023-2025 performance measures and targets; ■ setting fixed pay for the CEO and CFO; ■ tracking external developments and assessing their impact on Unilever’s Remuneration Policy and its implementation, in particular in the context of geopolitical tensions, inflation, and regulatory requirements; ■ retirement of CFO and CFO succession planning; ■ approving introduction of a Recovery Policy to comply with New York Stock Exchange listing requirements; ■ reviewing pay gap data; ■ considering progress on the living wage commitment that is now extended to the wider supply chain; and ■ assessing SPI performance outcomes and setting measures and targets along with the Corporate Responsibility Committee (CRC). Advisers While it is the Committee’s responsibility to exercise independent judgement, the Committee requests advice from management and professional advisers, as appropriate, to ensure that its decisions are fully informed given the internal and external environment. Fiona Camenzuli of PricewaterhouseCoopers LLP (PwC) was appointed by the Committee to provide independent advice on various matters it considered. During 2023, the wider PwC network firms have also provided other tax and consultancy services to Unilever including tax compliance and other tax- related services, cyber security services, internal audit advice, secondees, third-party risk and compliance advice, and merger and acquisition support. PwC is a member of the Remuneration Consultants Group and, as such, voluntarily operates under the code of conduct in relation to executive remuneration consulting in the UK, which is available online at www.remunerationconsultantsgroup.com (Code of Conduct: Executive Remuneration Consulting). The Committee is satisfied that the advice of the PwC engagement partner and team, which provide remuneration advice to the Committee, was objective and independent. They do not have connections with Unilever that might impair their independence. The Committee reviewed the potential for conflicts of interest and judged that there were appropriate safeguards against such conflicts. The fees paid to PwC in relation to advice provided to the Committee in the year to 31 December 2023 were £277,557. This figure is calculated based on time spent and expenses incurred for the majority of advice provided, but on occasion, for specific projects, a fixed fee may be agreed. STRATEGIC REPORT CORPORATE GOVERNANCE FINANCIAL STATEMENTS Directors' Remuneration Report 128 Unilever Annual Report on Form 20-F 2023

Annual report on remuneration This section sets out how the Remuneration Policy (which was approved by shareholders at the AGM on 5 May 2021 and is available on our website) was implemented in 2023. The Remuneration Policy operated as intended in 2023 in terms of company performance, quantum and application of discretion, as set out in the Chair letter on page 116. Changes to the implementation of the policy from 2024 are set out in the proposed New Remuneration Policy on pages 119 to 127 and will be implemented if it receives shareholder approval at the 2024 AGM. Unilever's remuneration arrangements are aligned to its culture of rewarding performance through annual bonus and long-term incentive performance measures and remuneration is determined throughout Unilever based on the same principle as for the Executive Directors, as set out in the Remuneration Policy. Remuneration is controlled with pay at risk determined according to pre-determined performance measures with a maximum outcome. This results in predictability in the management of risks and costs. Executive remuneration is proportionate given the financial size and complexity of Unilever as determined through benchmarking with our peers. Unilever's arrangements provide for clarity and simplicity by consisting of fixed pay, benefits, annual bonus and long-term incentives, which are transparently detailed in the Remuneration Policy and the relevant directors' remuneration report. Implementation of the Remuneration Policy for Executive Directors If approved by shareholders, Unilever's proposed New Remuneration Policy, as set out below, will be implemented with effect from the 2024 AGM. If the proposed New Remuneration Policy is not approved, Unilever's existing Remuneration Policy will continue to apply. Alan Jope is treated as CEO from 1 January to 30 June 2023 and Hein Schumacher is treated as CEO from 1 June to 31 December 2023, given he performed the role of CEO Designate from 1 June 2023 and became CEO on 1 July 2023. Remuneration for the CFO for 2023 refers to Graeme Pitkethly. Please see page 144 for remuneration details for Fernando Fernandez as the incoming CFO. STRATEGIC REPORT CORPORATE GOVERNANCE FINANCIAL STATEMENTS Directors' Remuneration Report Unilever Annual Report on Form 20-F 2023 129

Elements of remuneration Fixed Pay Purpose and link to strategy Supports the recruitment and retention of Executive Directors of the calibre required to implement our strategy. Reflects the individual’s skills, experience, performance and role within the Group. Provides a simple competitive alternative to the separate provision of salary, fixed allowance and pension. At a glance Details of the rationale for our Executive Directors’ fixed pay amounts can be found on page 118. Implementation in 2023 ■ CEO (Alan Jope): €1,560,780 (effective 1 January 2023) ■ CEO (Hein Schumacher): €1,850,000 (pro rata from 1 June 2023) ■ CFO (Graeme Pitkethly): €1,246,262 (effective 1 January 2023) Planned for 2024 Effective from 1 January 2024: ■ CEO (Hein Schumacher): €1,850,000 (no change) ■ CFO (Fernando Fernandez): €1,175,000 (reduction of 5.72% compared to Graeme Pitkethly) Annual Bonus Purpose and link to strategy Incentivises year-on-year delivery of rigorous short-term financial, strategic and operational objectives selected to support our annual business strategy and the ongoing enhancement of shareholder value. 50% of the net annual bonus is deferred into shares or share awards to link to long-term performance. At a glance ■ Target annual bonus of 150% of fixed pay for the CEO and 120% of fixed pay for the CFO. ■ Maximum annual bonus is 225% of fixed pay for the CEO and 180% for the CFO. ■ Business performance multiplier of between 0% and 150% based on achievement against business targets over the year. ■ Performance target ranges are considered commercially sensitive and will be disclosed in full with the corresponding performance outcomes retrospectively following the end of the relevant performance year. ■ Requirement to defer 50% net annual bonus into shares, which vest after 3 years. ■ The annual bonus is subject to claw-back, malus, recovery, ultimate remedy and discretion provisions, as set out in the Remuneration Policy. Implementation in 2023 Implemented in line with the Remuneration Policy: ■ Underlying sales growth: 50% ■ Underlying operating margin improvement: 25% ■ Free cash flow: 25% Planned for 2024 Under the proposed New Remuneration Policy: ■ Underlying sales growth: 40% ■ Underlying operating profit growth adjusted for restructuring costs: 30% ■ Free cash flow: 30% Long-Term Incentive: Performance Share Plan (PSP) Purpose and link to strategy The PSP aligns senior management’s interests with shareholders by focusing on the sustained delivery of high-performance results over the long term. At a glance ■ PSP awards normally vest after three years, to the extent performance conditions are achieved. ■ The normal maximum award for the CEO is 400% of fixed pay and for the CFO is 320% of fixed pay. At target, 50% of maximum vests, equating to 200% and 160% of fixed pay respectively. ■ Upon vesting, Executive Directors will have a further two-year retention period. ■ The PSP is subject to claw-back, malus, recovery, ultimate remedy and discretion provisions, as set out in the Remuneration Policy. Implementation in 2023 Implemented in line with the Remuneration Policy: ■ % Business winning: 25% ■ Cumulative free cash flow: 25% ■ Underlying return on invested capital: 25% ■ Sustainability Progress Index: 25% Planned for 2024 Under the proposed New Remuneration Policy: ■ Underlying sales growth: 25% ■ Relative total shareholder return versus bespoke peer group(a): 30% ■ Underlying return on invested capital: 30% ■ Sustainability Progress Index: 15% (a) The proposed TSR peer group for 2024 includes Beiersdorf, Church & Dwight, Coca-Cola, Colgate-Palmolive, Danone, Estée Lauder, General Mills, Haleon, Henkel, Kenvue, Kimberly-Clark, Kraft Heinz, L’Oréal, Mondelēz, Nestlé, PepsiCo, Procter and Gamble, and Reckitt Benckiser. STRATEGIC REPORT CORPORATE GOVERNANCE FINANCIAL STATEMENTS Directors' Remuneration Report 130 Unilever Annual Report on Form 20-F 2023
Elements of remuneration continued Planned for 2024 The performance conditions and target ranges for 2024 awards under the PSP will be as follows: PSP 2024 – 2026 awards Weighting Threshold Max Underlying sales growth(a) 25% 3% 6% 50% 200% Relative total shareholder return(a) 30% 10th (median) 5th (upper quartile) 50% 200% Underlying return on invested capital (average) 30% 15.5% 17.5% 0% 200% Sustainability progress index (Committee assessment of SPI progress) 15% 0% 200% 0% 200% PSP awards (based on target performance) to be made on 8 March 2024 as follows: ■ CEO 200% Fixed Pay: €3,700,000. ■ CFO 160% Fixed Pay: €1,880,000. USG is the primary driver of value creation in our multi-year financial growth model. As such, the Committee believes that the target range of a threshold of 3% and a maximum of 6% to be appropriate. The Committee have set the payout for threshold at 50% of par for USG to reflect the level of stretch required, and that no payout is considered appropriate for performance below this level. Relative TSR aligns remuneration with shareholders' experience and allows us to measure relative performance. The proposed vesting schedule is in line with UK norms, with threshold vesting (50% of par) for median performance (Unilever ranked 10th), rising to maximum vesting (200% of par) for upper quartile performance (Unilever ranked 5th). The TSR peer group consists of: Beiersdorf, Church & Dwight, Coca-Cola, Colgate- Palmolive, Danone, Estée Lauder, General Mills, Haleon, Henkel, Kenvue, Kimberly-Clark, Kraft Heinz, L’Oréal, Mondelēz, Nestlé, PepsiCo, Procter and Gamble, and Reckitt Benckiser. Underlying ROIC measures the return generated on capital invested by the Group and is calculated as underlying operating profit after tax divided by the annual average of: goodwill, intangible assets, property, plant and equipment, net assets held for sale, inventories, trade and other current receivables, and trade payables and other current liabilities. Underlying ROIC will be calculated over a three-year average. The target range of a threshold of 15.5% and maximum of 17.5% expresses our commitment to deliver underlying ROIC at a level of mid to high teens, whilst continuing to reshape our portfolio through acquisitions and disposals. The SPI is an assessment made jointly by the CRC and the Committee. The 2024-26 SPI will be evaluated on progress against four core metrics, rather than the eight metrics used for the previous PSP schemes. Targets will be set for a three-year period and disclosed prospectively. KPIs will be subject to external review, or internal review where this is not possible. Each KPI will be subject to formulaic assessment, whilst retaining the ability to make a rounded assessment of overall progress. The SPI KPIs for the 2024-2026 PSP will be as follows with a threshold of 0% and maximum of 200%: (a) Climate: The percentage change in greenhouse gas emissions from energy and refrigerant use in our operations, in comparison to the same period in 2015. Target: 80% (threshold 79%, maximum 81%). (b) Plastics: The percentage change in the total tonnes of virgin plastics used in the packaging for our products, in comparison to the same period in 2019. Target: 30% (threshold 28%, maximum 32%). (c) Nature: The total hectares of land, forests, and oceans (as measured by ocean floor area) that Unilever programmes help protect and/or regenerate. Target: 1 million hectares (threshold 900,000 hectares, maximum 1.1 million hectares). (d) Living wage: the percentage of our procurement spend which is with suppliers who have signed the Living Wage Promise. Target: 50% (threshold 45%, maximum 55%). For in-flight PSP schemes (PSP 2022-2024 and PSP 2023-2025), there will continue to be annual SPI KPIs and targets with outcomes based on in-year results. The overall outcome will be an average of each annual score, and disclosed in the directors' remuneration reports for 2024 and 2025 as applicable. (a) There is zero payout below threshold. In addition to the three elements mentioned above, our Executive Directors are provided with non-monetary benefits. These include medical insurance cover, actual tax return preparation costs and provision of death-in-service benefits and administration. STRATEGIC REPORT CORPORATE GOVERNANCE FINANCIAL STATEMENTS Directors' Remuneration Report Unilever Annual Report on Form 20-F 2023 131
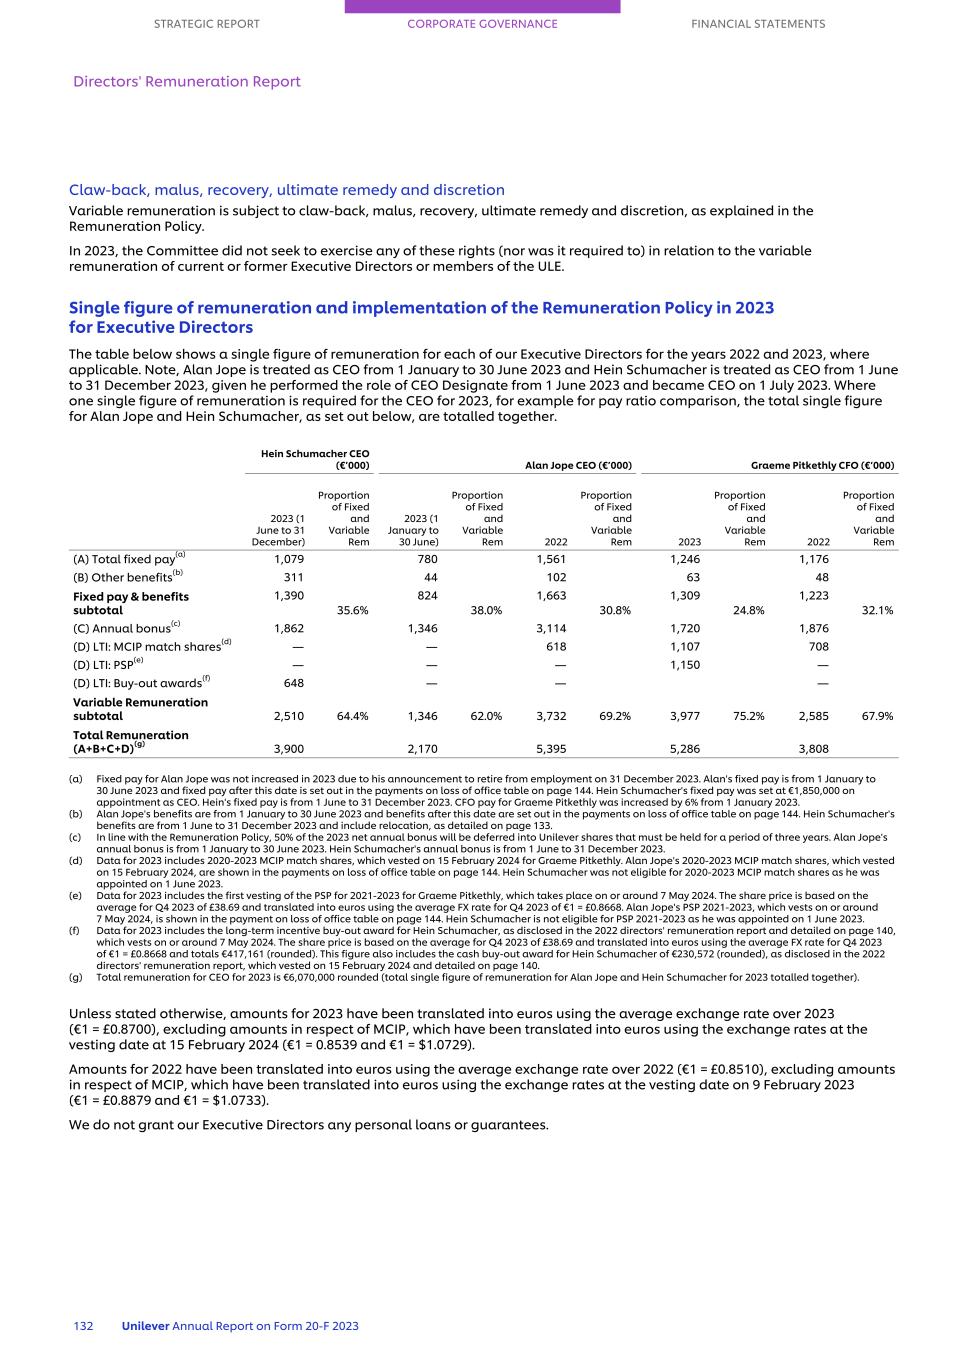
Claw-back, malus, recovery, ultimate remedy and discretion Variable remuneration is subject to claw-back, malus, recovery, ultimate remedy and discretion, as explained in the Remuneration Policy. In 2023, the Committee did not seek to exercise any of these rights (nor was it required to) in relation to the variable remuneration of current or former Executive Directors or members of the ULE. Single figure of remuneration and implementation of the Remuneration Policy in 2023 for Executive Directors The table below shows a single figure of remuneration for each of our Executive Directors for the years 2022 and 2023, where applicable. Note, Alan Jope is treated as CEO from 1 January to 30 June 2023 and Hein Schumacher is treated as CEO from 1 June to 31 December 2023, given he performed the role of CEO Designate from 1 June 2023 and became CEO on 1 July 2023. Where one single figure of remuneration is required for the CEO for 2023, for example for pay ratio comparison, the total single figure for Alan Jope and Hein Schumacher, as set out below, are totalled together. Hein Schumacher CEO (€’000) Alan Jope CEO (€’000) Graeme Pitkethly CFO (€’000) 2023 (1 June to 31 December) Proportion of Fixed and Variable Rem 2023 (1 January to 30 June) Proportion of Fixed and Variable Rem 2022 Proportion of Fixed and Variable Rem 2023 Proportion of Fixed and Variable Rem 2022 Proportion of Fixed and Variable Rem (A) Total fixed pay(a) 1,079 780 1,561 1,246 1,176 (B) Other benefits(b) 311 44 102 63 48 Fixed pay & benefits subtotal 1,390 35.6% 824 38.0% 1,663 30.8% 1,309 24.8% 1,223 32.1% (C) Annual bonus(c) 1,862 1,346 3,114 1,720 1,876 (D) LTI: MCIP match shares(d) — — 618 1,107 708 (D) LTI: PSP(e) — — — 1,150 — (D) LTI: Buy-out awards(f) 648 — — — Variable Remuneration subtotal 2,510 64.4% 1,346 62.0% 3,732 69.2% 3,977 75.2% 2,585 67.9% Total Remuneration (A+B+C+D)(g) 3,900 2,170 5,395 5,286 3,808 (a) Fixed pay for Alan Jope was not increased in 2023 due to his announcement to retire from employment on 31 December 2023. Alan's fixed pay is from 1 January to 30 June 2023 and fixed pay after this date is set out in the payments on loss of office table on page 144. Hein Schumacher's fixed pay was set at €1,850,000 on appointment as CEO. Hein's fixed pay is from 1 June to 31 December 2023. CFO pay for Graeme Pitkethly was increased by 6% from 1 January 2023. (b) Alan Jope's benefits are from 1 January to 30 June 2023 and benefits after this date are set out in the payments on loss of office table on page 144. Hein Schumacher's benefits are from 1 June to 31 December 2023 and include relocation, as detailed on page 133. (c) In line with the Remuneration Policy, 50% of the 2023 net annual bonus will be deferred into Unilever shares that must be held for a period of three years. Alan Jope's annual bonus is from 1 January to 30 June 2023. Hein Schumacher's annual bonus is from 1 June to 31 December 2023. (d) Data for 2023 includes 2020-2023 MCIP match shares, which vested on 15 February 2024 for Graeme Pitkethly. Alan Jope's 2020-2023 MCIP match shares, which vested on 15 February 2024, are shown in the payments on loss of office table on page 144. Hein Schumacher was not eligible for 2020-2023 MCIP match shares as he was appointed on 1 June 2023. (e) Data for 2023 includes the first vesting of the PSP for 2021-2023 for Graeme Pitkethly, which takes place on or around 7 May 2024. The share price is based on the average for Q4 2023 of £38.69 and translated into euros using the average FX rate for Q4 2023 of €1 = £0.8668. Alan Jope's PSP 2021-2023, which vests on or around 7 May 2024, is shown in the payment on loss of office table on page 144. Hein Schumacher is not eligible for PSP 2021-2023 as he was appointed on 1 June 2023. (f) Data for 2023 includes the long-term incentive buy-out award for Hein Schumacher, as disclosed in the 2022 directors' remuneration report and detailed on page 140, which vests on or around 7 May 2024. The share price is based on the average for Q4 2023 of £38.69 and translated into euros using the average FX rate for Q4 2023 of €1 = £0.8668 and totals €417,161 (rounded). This figure also includes the cash buy-out award for Hein Schumacher of €230,572 (rounded), as disclosed in the 2022 directors' remuneration report, which vested on 15 February 2024 and detailed on page 140. (g) Total remuneration for CEO for 2023 is €6,070,000 rounded (total single figure of remuneration for Alan Jope and Hein Schumacher for 2023 totalled together). Unless stated otherwise, amounts for 2023 have been translated into euros using the average exchange rate over 2023 (€1 = £0.8700), excluding amounts in respect of MCIP, which have been translated into euros using the exchange rates at the vesting date at 15 February 2024 (€1 = 0.8539 and €1 = $1.0729). Amounts for 2022 have been translated into euros using the average exchange rate over 2022 (€1 = £0.8510), excluding amounts in respect of MCIP, which have been translated into euros using the exchange rates at the vesting date on 9 February 2023 (€1 = £0.8879 and €1 = $1.0733). We do not grant our Executive Directors any personal loans or guarantees. STRATEGIC REPORT CORPORATE GOVERNANCE FINANCIAL STATEMENTS Directors' Remuneration Report 132 Unilever Annual Report on Form 20-F 2023
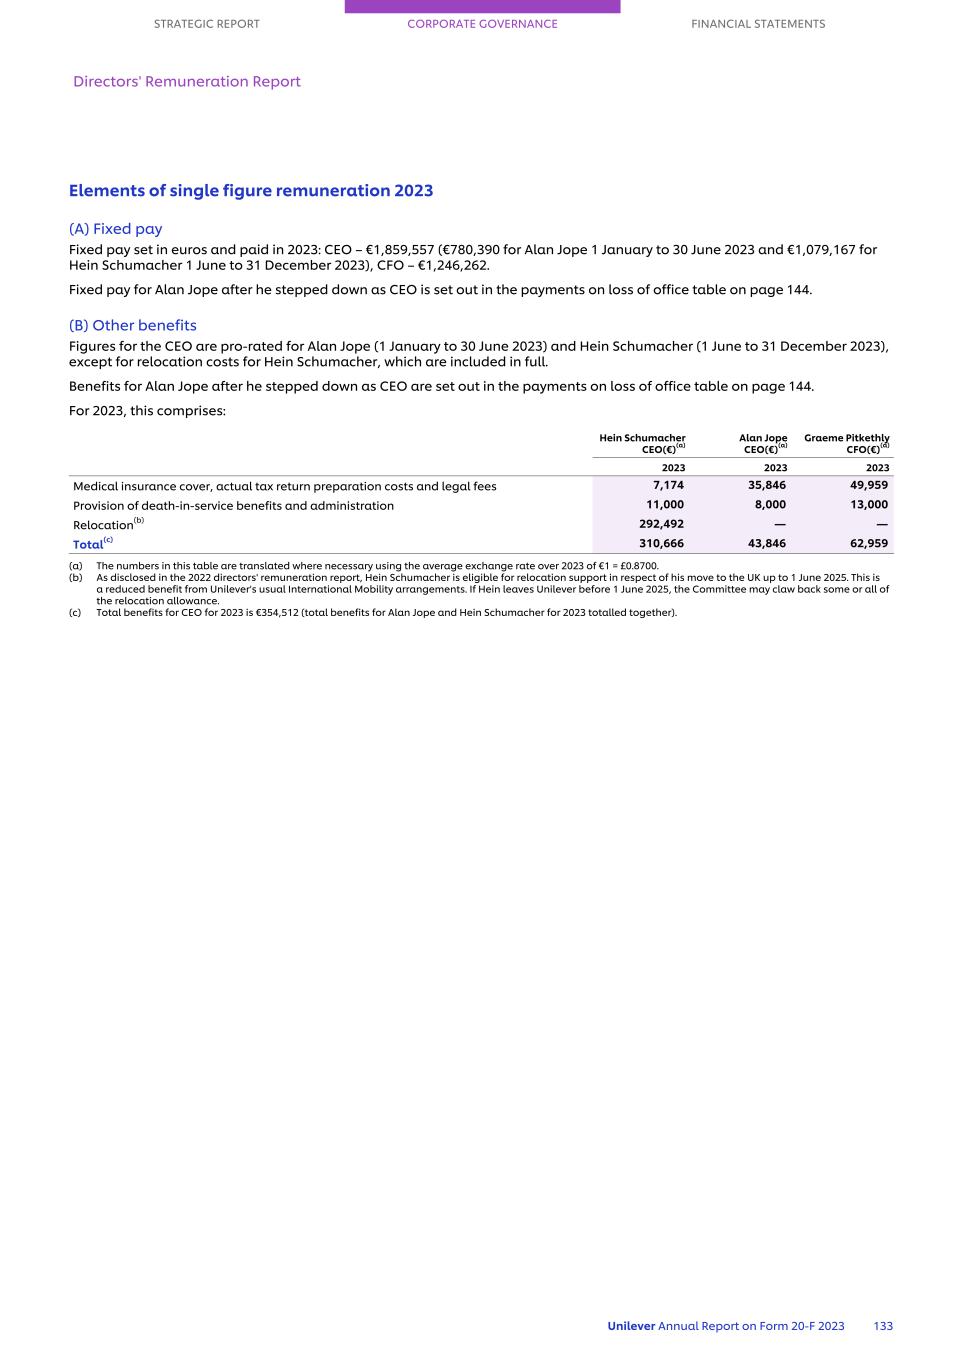
Elements of single figure remuneration 2023 (A) Fixed pay Fixed pay set in euros and paid in 2023: CEO – €1,859,557 (€780,390 for Alan Jope 1 January to 30 June 2023 and €1,079,167 for Hein Schumacher 1 June to 31 December 2023), CFO – €1,246,262. Fixed pay for Alan Jope after he stepped down as CEO is set out in the payments on loss of office table on page 144. (B) Other benefits Figures for the CEO are pro-rated for Alan Jope (1 January to 30 June 2023) and Hein Schumacher (1 June to 31 December 2023), except for relocation costs for Hein Schumacher, which are included in full. Benefits for Alan Jope after he stepped down as CEO are set out in the payments on loss of office table on page 144. For 2023, this comprises: Hein Schumacher CEO(€)(a) Alan Jope CEO(€)(a) Graeme Pitkethly CFO(€)(a) 2023 2023 2023 Medical insurance cover, actual tax return preparation costs and legal fees 7,174 35,846 49,959 Provision of death-in-service benefits and administration 11,000 8,000 13,000 Relocation(b) 292,492 — — Total(c) 310,666 43,846 62,959 (a) The numbers in this table are translated where necessary using the average exchange rate over 2023 of €1 = £0.8700. (b) As disclosed in the 2022 directors' remuneration report, Hein Schumacher is eligible for relocation support in respect of his move to the UK up to 1 June 2025. This is a reduced benefit from Unilever's usual International Mobility arrangements. If Hein leaves Unilever before 1 June 2025, the Committee may claw back some or all of the relocation allowance. (c) Total benefits for CEO for 2023 is €354,512 (total benefits for Alan Jope and Hein Schumacher for 2023 totalled together). STRATEGIC REPORT CORPORATE GOVERNANCE FINANCIAL STATEMENTS Directors' Remuneration Report Unilever Annual Report on Form 20-F 2023 133
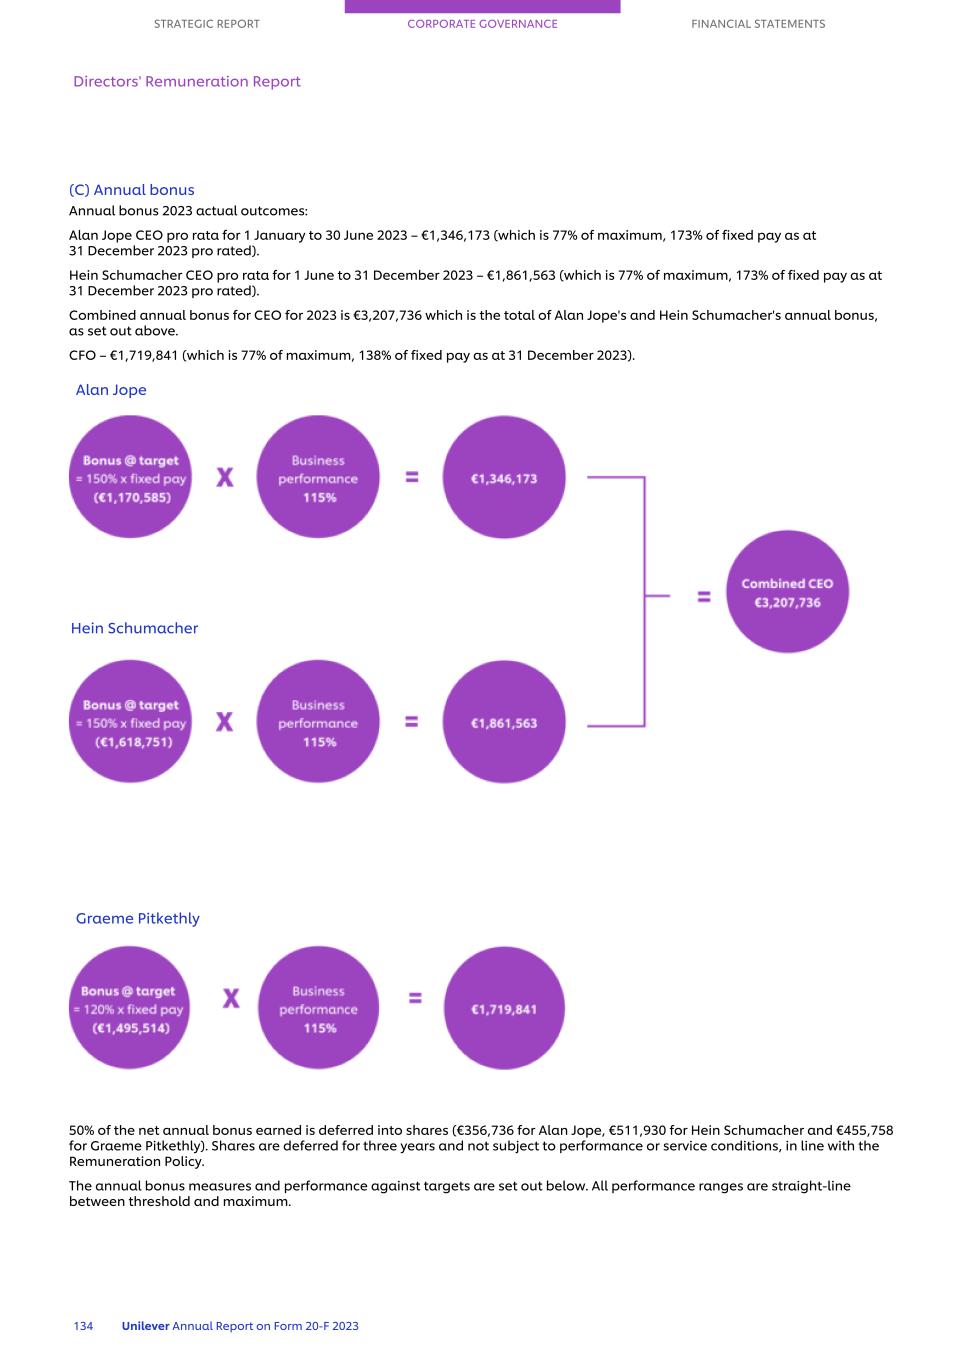
(C) Annual bonus Annual bonus 2023 actual outcomes: Alan Jope CEO pro rata for 1 January to 30 June 2023 – €1,346,173 (which is 77% of maximum, 173% of fixed pay as at 31 December 2023 pro rated). Hein Schumacher CEO pro rata for 1 June to 31 December 2023 – €1,861,563 (which is 77% of maximum, 173% of fixed pay as at 31 December 2023 pro rated). Combined annual bonus for CEO for 2023 is €3,207,736 which is the total of Alan Jope's and Hein Schumacher's annual bonus, as set out above. CFO – €1,719,841 (which is 77% of maximum, 138% of fixed pay as at 31 December 2023). 50% of the net annual bonus earned is deferred into shares (€356,736 for Alan Jope, €511,930 for Hein Schumacher and €455,758 for Graeme Pitkethly). Shares are deferred for three years and not subject to performance or service conditions, in line with the Remuneration Policy. The annual bonus measures and performance against targets are set out below. All performance ranges are straight-line between threshold and maximum. STRATEGIC REPORT CORPORATE GOVERNANCE FINANCIAL STATEMENTS Directors' Remuneration Report 134 Unilever Annual Report on Form 20-F 2023 Graeme Pitkethly Alan Jope Hein Schumacher

Performance: Annual Bonus Discretion was applied to adjust the formulaic outcome down to 115% for all eligible management employees including the Executive Directors, as described in the Committee Chair's letter on page 116, along with further details of the annual bonus outcome. (D) Long-Term Incentive 2023 Outcomes: MCIP This includes MCIP match shares (operated under the Unilever Share Plan 2017) granted to Alan Jope and Graeme Pitkethly on 24 April 2020, based on performance in the four-year period to 31 December 2023, which vested on 15 February 2024. The values included in the single figure table and payments on loss of office table for 2023 are calculated by multiplying the number of shares granted (including additional shares in respect of accrued dividends through to 31 December 2023) by the level of vesting (% of target award) and the share price on the date of vesting (PLC £39.81 and PLC EUR €46.55), translated into euros using the exchange rate on the date of vesting (€1 = £0.8539). Performance against targets: Performance: MCIP 2020-2023 (a) Underlying earnings per share growth excludes the benefit from share buyback of €3bn in 2021. 2022 share buyback of €1.5bn was executed to return ekaterra Tea Business proceeds, hence considered. Similarly, €1.5bn share buyback in 2023 has been included and contributed 1.1% to underlying earnings per share growth. Discretion was applied to adjust the formulaic outcome down to 87% (i.e. 44% of maximum) for the Executive Directors, as described in the Committee Chair's letter on page 116, along with further details of the MCIP outcome. Further detail on the SPI outcome is set out on pages 136 to 137. STRATEGIC REPORT CORPORATE GOVERNANCE FINANCIAL STATEMENTS Directors' Remuneration Report Unilever Annual Report on Form 20-F 2023 135
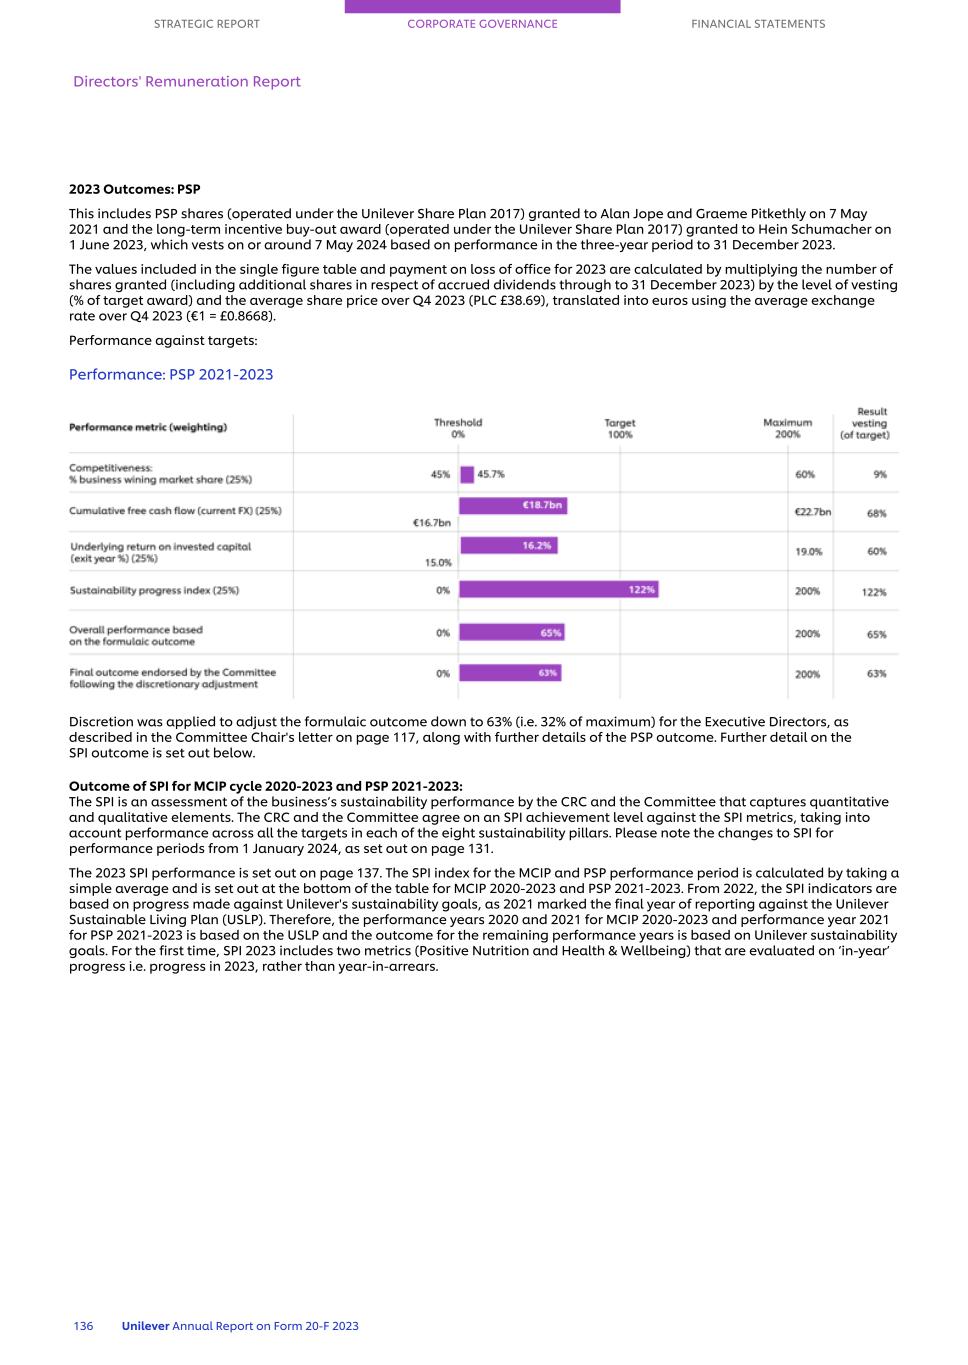
2023 Outcomes: PSP This includes PSP shares (operated under the Unilever Share Plan 2017) granted to Alan Jope and Graeme Pitkethly on 7 May 2021 and the long-term incentive buy-out award (operated under the Unilever Share Plan 2017) granted to Hein Schumacher on 1 June 2023, which vests on or around 7 May 2024 based on performance in the three-year period to 31 December 2023. The values included in the single figure table and payment on loss of office for 2023 are calculated by multiplying the number of shares granted (including additional shares in respect of accrued dividends through to 31 December 2023) by the level of vesting (% of target award) and the average share price over Q4 2023 (PLC £38.69), translated into euros using the average exchange rate over Q4 2023 (€1 = £0.8668). Performance against targets: Performance: PSP 2021-2023 Discretion was applied to adjust the formulaic outcome down to 63% (i.e. 32% of maximum) for the Executive Directors, as described in the Committee Chair's letter on page 117, along with further details of the PSP outcome. Further detail on the SPI outcome is set out below. Outcome of SPI for MCIP cycle 2020-2023 and PSP 2021-2023: The SPI is an assessment of the business’s sustainability performance by the CRC and the Committee that captures quantitative and qualitative elements. The CRC and the Committee agree on an SPI achievement level against the SPI metrics, taking into account performance across all the targets in each of the eight sustainability pillars. Please note the changes to SPI for performance periods from 1 January 2024, as set out on page 131. The 2023 SPI performance is set out on page 137. The SPI index for the MCIP and PSP performance period is calculated by taking a simple average and is set out at the bottom of the table for MCIP 2020-2023 and PSP 2021-2023. From 2022, the SPI indicators are based on progress made against Unilever's sustainability goals, as 2021 marked the final year of reporting against the Unilever Sustainable Living Plan (USLP). Therefore, the performance years 2020 and 2021 for MCIP 2020-2023 and performance year 2021 for PSP 2021-2023 is based on the USLP and the outcome for the remaining performance years is based on Unilever sustainability goals. For the first time, SPI 2023 includes two metrics (Positive Nutrition and Health & Wellbeing) that are evaluated on ‘in-year’ progress i.e. progress in 2023, rather than year-in-arrears. STRATEGIC REPORT CORPORATE GOVERNANCE FINANCIAL STATEMENTS Directors' Remuneration Report 136 Unilever Annual Report on Form 20-F 2023
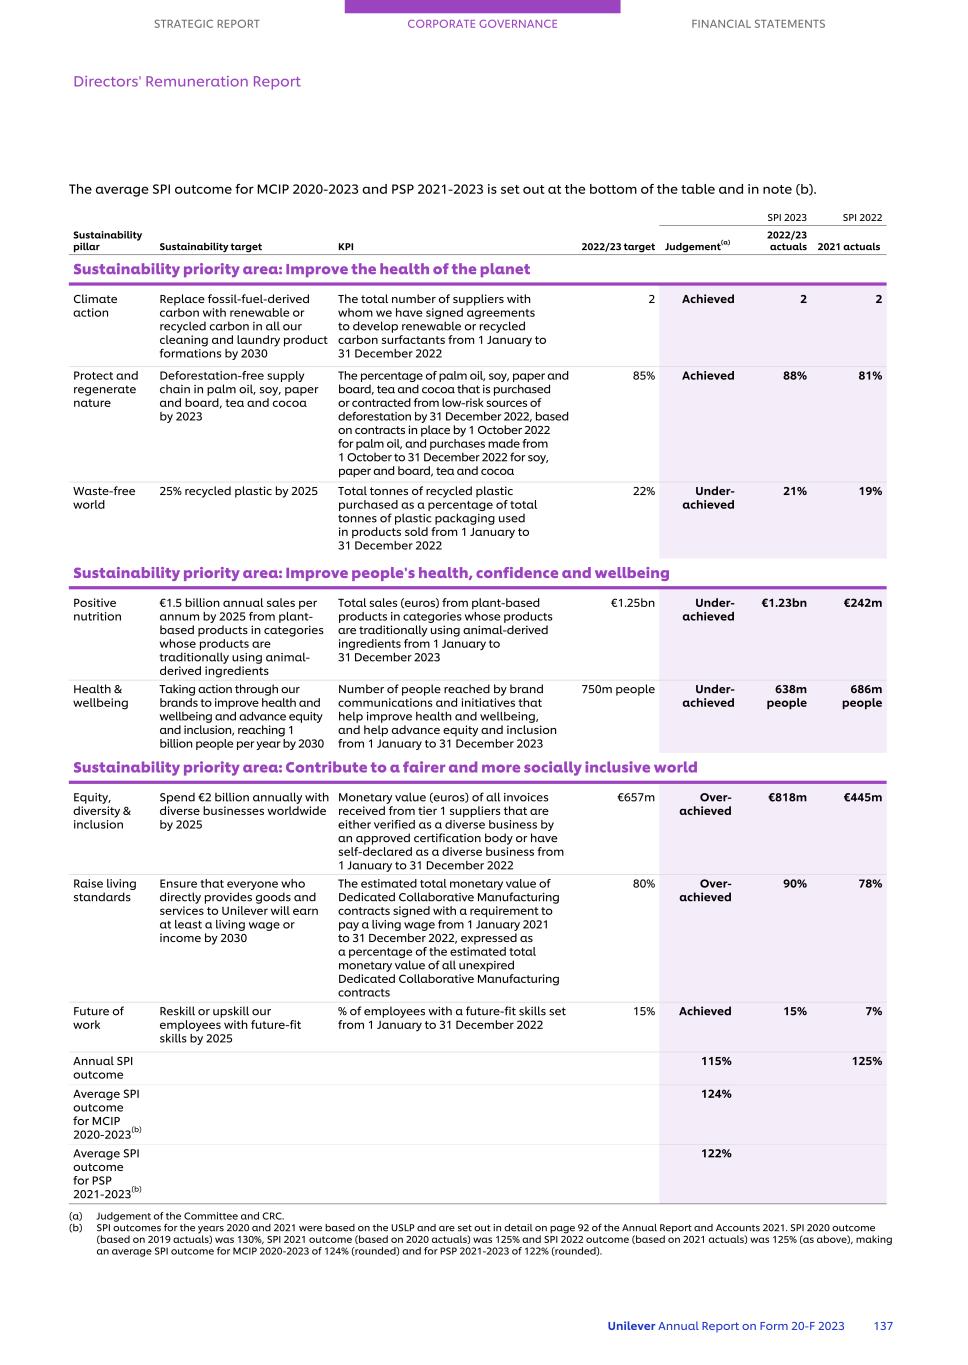
The average SPI outcome for MCIP 2020-2023 and PSP 2021-2023 is set out at the bottom of the table and in note (b). SPI 2023 SPI 2022 Sustainability pillar Sustainability target KPI 2022/23 target Judgement(a) 2022/23 actuals 2021 actuals Sustainability priority area: Improve the health of the planet Climate action Replace fossil-fuel-derived carbon with renewable or recycled carbon in all our cleaning and laundry product formations by 2030 The total number of suppliers with whom we have signed agreements to develop renewable or recycled carbon surfactants from 1 January to 31 December 2022 2 Achieved 2 2 Protect and regenerate nature Deforestation-free supply chain in palm oil, soy, paper and board, tea and cocoa by 2023 The percentage of palm oil, soy, paper and board, tea and cocoa that is purchased or contracted from low-risk sources of deforestation by 31 December 2022, based on contracts in place by 1 October 2022 for palm oil, and purchases made from 1 October to 31 December 2022 for soy, paper and board, tea and cocoa 85% Achieved 88% 81% Waste-free world 25% recycled plastic by 2025 Total tonnes of recycled plastic purchased as a percentage of total tonnes of plastic packaging used in products sold from 1 January to 31 December 2022 22% Under- achieved 21% 19% Sustainability priority area: Improve people's health, confidence and wellbeing Positive nutrition €1.5 billion annual sales per annum by 2025 from plant- based products in categories whose products are traditionally using animal- derived ingredients Total sales (euros) from plant-based products in categories whose products are traditionally using animal-derived ingredients from 1 January to 31 December 2023 €1.25bn Under- achieved €1.23bn €242m Health & wellbeing Taking action through our brands to improve health and wellbeing and advance equity and inclusion, reaching 1 billion people per year by 2030 Number of people reached by brand communications and initiatives that help improve health and wellbeing, and help advance equity and inclusion from 1 January to 31 December 2023 750m people Under- achieved 638m people 686m people Sustainability priority area: Contribute to a fairer and more socially inclusive world Equity, diversity & inclusion Spend €2 billion annually with diverse businesses worldwide by 2025 Monetary value (euros) of all invoices received from tier 1 suppliers that are either verified as a diverse business by an approved certification body or have self-declared as a diverse business from 1 January to 31 December 2022 €657m Over- achieved €818m €445m Raise living standards Ensure that everyone who directly provides goods and services to Unilever will earn at least a living wage or income by 2030 The estimated total monetary value of Dedicated Collaborative Manufacturing contracts signed with a requirement to pay a living wage from 1 January 2021 to 31 December 2022, expressed as a percentage of the estimated total monetary value of all unexpired Dedicated Collaborative Manufacturing contracts 80% Over- achieved 90% 78% Future of work Reskill or upskill our employees with future-fit skills by 2025 % of employees with a future-fit skills set from 1 January to 31 December 2022 15% Achieved 15% 7% Annual SPI outcome 115% 125% Average SPI outcome for MCIP 2020-2023(b) 124% Average SPI outcome for PSP 2021-2023(b) 122% (a) Judgement of the Committee and CRC. (b) SPI outcomes for the years 2020 and 2021 were based on the USLP and are set out in detail on page 92 of the Annual Report and Accounts 2021. SPI 2020 outcome (based on 2019 actuals) was 130%, SPI 2021 outcome (based on 2020 actuals) was 125% and SPI 2022 outcome (based on 2021 actuals) was 125% (as above), making an average SPI outcome for MCIP 2020-2023 of 124% (rounded) and for PSP 2021-2023 of 122% (rounded). STRATEGIC REPORT CORPORATE GOVERNANCE FINANCIAL STATEMENTS Directors' Remuneration Report Unilever Annual Report on Form 20-F 2023 137

Share price growth MCIP 2020–2023 (a) The conditional number of shares awarded (including decimals) at the share price on the award date at target performance. (b) The business performance ratio applied to the original conditional share award (including decimals) at the share price on the award date. (c) The dividends accrued on the original conditional share award (including decimals) at the share price on the award date. (d) The nominal movement in share price between the award date and the vesting date applied to the original conditional share award plus accrued dividends (including decimals) multiplied by the business performance ratio. The value attributable to share price growth over the vesting period is -€30,859 for the CFO (using exchange rate on day of vesting of €1 = £0.8539). (e) The final value of the award on the vesting date using the exchange rate on the day of vesting of €1 = £0.8539. The actual number of vested shares can be found on page 142. (f) Share price growth for Alan Jope's MCIP 2020-2023 can be found in the payments on loss of office table on page 144. Share price growth PSP 2021-2023 (a) The conditional number of shares awarded (including decimals) at the share price on the award date at target performance. (b) The business performance ratio applied to the original conditional share award (including decimals) at the share price on the award date. (c) The dividends accrued up to 31 December 2023 on the original conditional share award (including decimals) at the share price on the award date. (d) The nominal movement in share price between the award date and Q4 2023 average share price applied to the original conditional share award plus accrued dividends (including decimals) up to 31 December 2023 multiplied by the business performance ratio. The value attributable to share price growth is -€120,257 for the CFO (using Q4 2023 average exchange rate of €1 = £0.8668). (e) The final value of the award using Q4 2023 average share price of £38.69 and Q4 2023 average exchange rate of €1 = £0.8668. The actual number of vested shares will be reported in the 2024 directors' remuneration report. (f) Share price growth for Alan Jope's PSP 2021-2023 can be found in the payments on loss of office table on page 144. Hein Schumacher's cash buy-out award had an original value of €233,962, dividends of €4,458 and share price growth of -€7,848 resulting in an award of €230,572 (rounded) on vesting (using exchange rate on day of vesting of €1 = £0.8539). Share price growth for Hein Schumacher's long-term buy-out award is detailed below. STRATEGIC REPORT CORPORATE GOVERNANCE FINANCIAL STATEMENTS Directors' Remuneration Report 138 Unilever Annual Report on Form 20-F 2023
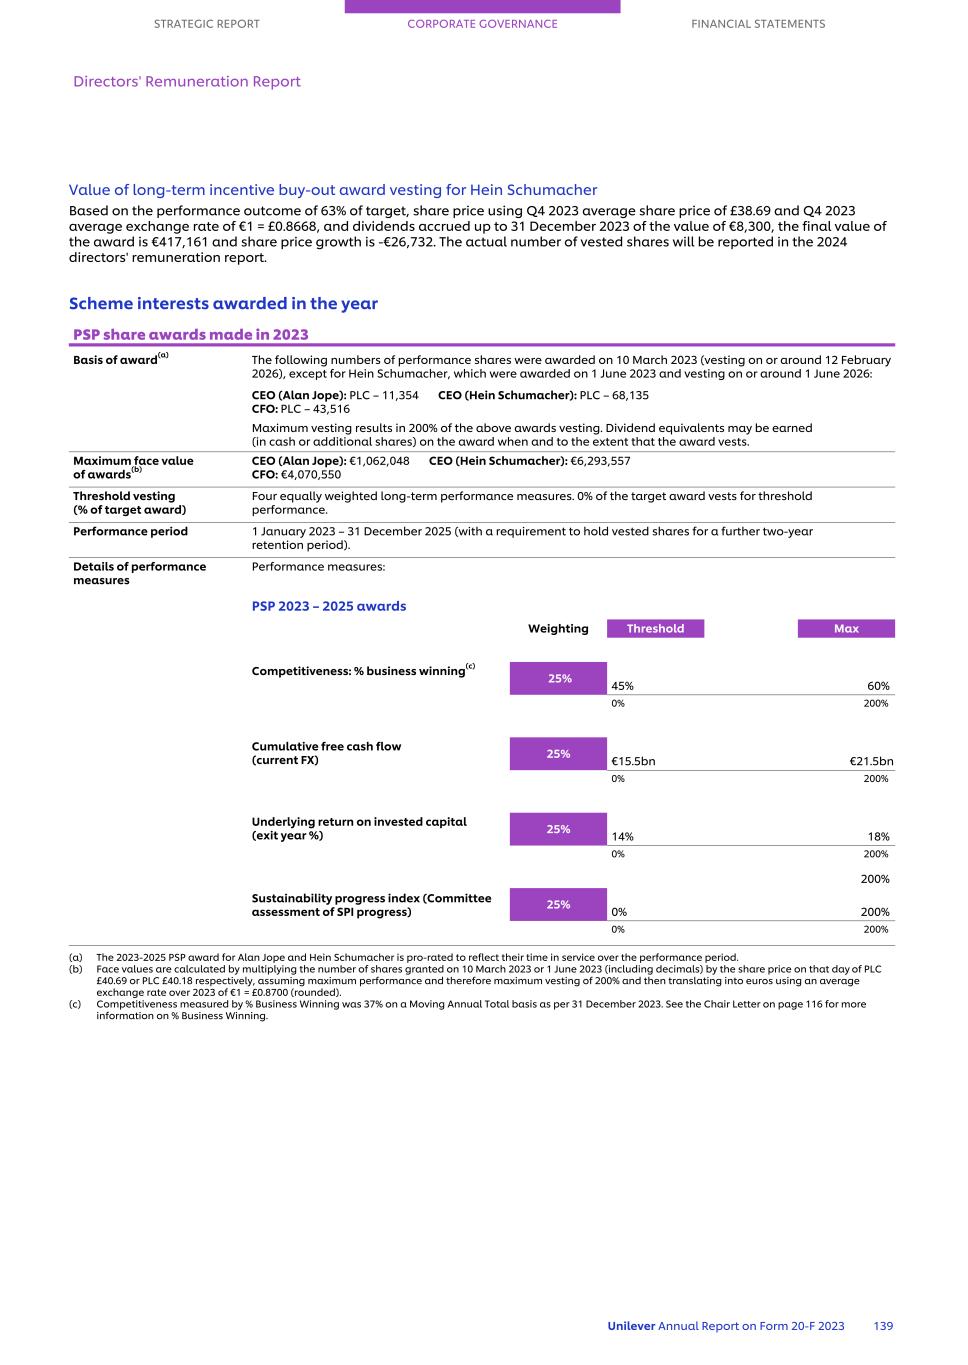
Value of long-term incentive buy-out award vesting for Hein Schumacher Based on the performance outcome of 63% of target, share price using Q4 2023 average share price of £38.69 and Q4 2023 average exchange rate of €1 = £0.8668, and dividends accrued up to 31 December 2023 of the value of €8,300, the final value of the award is €417,161 and share price growth is -€26,732. The actual number of vested shares will be reported in the 2024 directors' remuneration report. Scheme interests awarded in the year PSP share awards made in 2023 Basis of award(a) The following numbers of performance shares were awarded on 10 March 2023 (vesting on or around 12 February 2026), except for Hein Schumacher, which were awarded on 1 June 2023 and vesting on or around 1 June 2026: CEO (Alan Jope): PLC – 11,354 CEO (Hein Schumacher): PLC – 68,135 CFO: PLC – 43,516 Maximum vesting results in 200% of the above awards vesting. Dividend equivalents may be earned (in cash or additional shares) on the award when and to the extent that the award vests. Maximum face value of awards(b) CEO (Alan Jope): €1,062,048 CEO (Hein Schumacher): €6,293,557 CFO: €4,070,550 Threshold vesting (% of target award) Four equally weighted long-term performance measures. 0% of the target award vests for threshold performance. Performance period 1 January 2023 – 31 December 2025 (with a requirement to hold vested shares for a further two-year retention period). Details of performance measures Performance measures: PSP 2023 – 2025 awards Weighting Threshold Max Competitiveness: % business winning(c) 25% 45% 60% 0% 200% Cumulative free cash flow (current FX) 25% €15.5bn €21.5bn 0% 200% Underlying return on invested capital (exit year %) 25% 14% 18% 0% 200% 200% Sustainability progress index (Committee assessment of SPI progress) 25% 0% 200% 0% 200% (a) The 2023-2025 PSP award for Alan Jope and Hein Schumacher is pro-rated to reflect their time in service over the performance period. (b) Face values are calculated by multiplying the number of shares granted on 10 March 2023 or 1 June 2023 (including decimals) by the share price on that day of PLC £40.69 or PLC £40.18 respectively, assuming maximum performance and therefore maximum vesting of 200% and then translating into euros using an average exchange rate over 2023 of €1 = £0.8700 (rounded). (c) Competitiveness measured by % Business Winning was 37% on a Moving Annual Total basis as per 31 December 2023. See the Chair Letter on page 116 for more information on % Business Winning. STRATEGIC REPORT CORPORATE GOVERNANCE FINANCIAL STATEMENTS Directors' Remuneration Report Unilever Annual Report on Form 20-F 2023 139
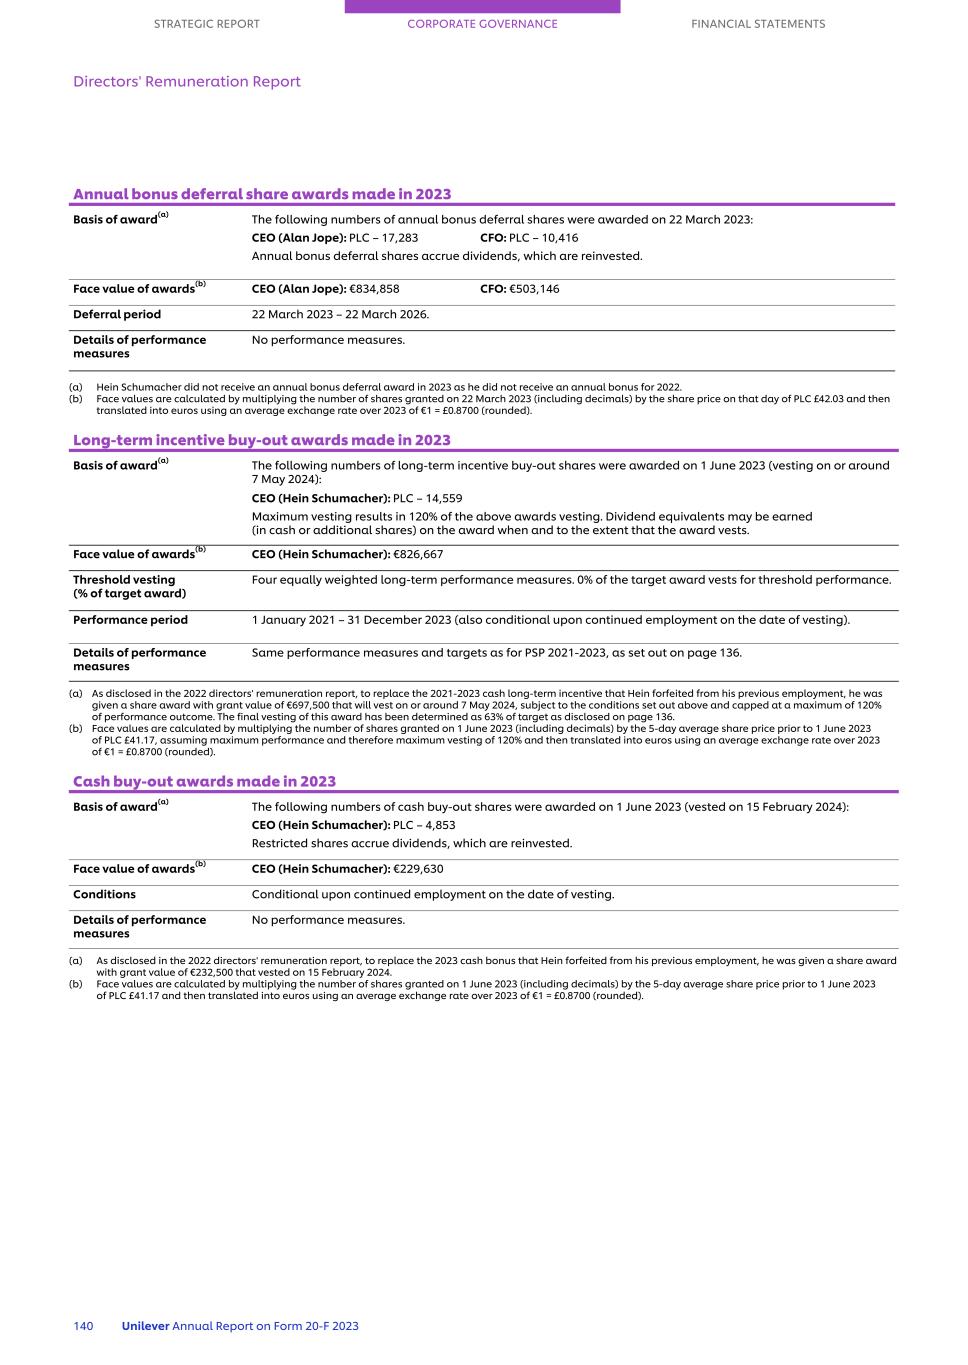
Annual bonus deferral share awards made in 2023 Basis of award(a) The following numbers of annual bonus deferral shares were awarded on 22 March 2023: CEO (Alan Jope): PLC – 17,283 CFO: PLC – 10,416 Annual bonus deferral shares accrue dividends, which are reinvested. Face value of awards(b) CEO (Alan Jope): €834,858 CFO: €503,146 Deferral period 22 March 2023 – 22 March 2026. Details of performance measures No performance measures. (a) Hein Schumacher did not receive an annual bonus deferral award in 2023 as he did not receive an annual bonus for 2022. (b) Face values are calculated by multiplying the number of shares granted on 22 March 2023 (including decimals) by the share price on that day of PLC £42.03 and then translated into euros using an average exchange rate over 2023 of €1 = £0.8700 (rounded). Long-term incentive buy-out awards made in 2023 Basis of award(a) The following numbers of long-term incentive buy-out shares were awarded on 1 June 2023 (vesting on or around 7 May 2024): CEO (Hein Schumacher): PLC – 14,559 Maximum vesting results in 120% of the above awards vesting. Dividend equivalents may be earned (in cash or additional shares) on the award when and to the extent that the award vests. Face value of awards(b) CEO (Hein Schumacher): €826,667 Threshold vesting (% of target award) Four equally weighted long-term performance measures. 0% of the target award vests for threshold performance. Performance period 1 January 2021 – 31 December 2023 (also conditional upon continued employment on the date of vesting). Details of performance measures Same performance measures and targets as for PSP 2021-2023, as set out on page 136. (a) As disclosed in the 2022 directors' remuneration report, to replace the 2021-2023 cash long-term incentive that Hein forfeited from his previous employment, he was given a share award with grant value of €697,500 that will vest on or around 7 May 2024, subject to the conditions set out above and capped at a maximum of 120% of performance outcome. The final vesting of this award has been determined as 63% of target as disclosed on page 136. (b) Face values are calculated by multiplying the number of shares granted on 1 June 2023 (including decimals) by the 5-day average share price prior to 1 June 2023 of PLC £41.17, assuming maximum performance and therefore maximum vesting of 120% and then translated into euros using an average exchange rate over 2023 of €1 = £0.8700 (rounded). Cash buy-out awards made in 2023 Basis of award(a) The following numbers of cash buy-out shares were awarded on 1 June 2023 (vested on 15 February 2024): CEO (Hein Schumacher): PLC – 4,853 Restricted shares accrue dividends, which are reinvested. Face value of awards(b) CEO (Hein Schumacher): €229,630 Conditions Conditional upon continued employment on the date of vesting. Details of performance measures No performance measures. (a) As disclosed in the 2022 directors' remuneration report, to replace the 2023 cash bonus that Hein forfeited from his previous employment, he was given a share award with grant value of €232,500 that vested on 15 February 2024. (b) Face values are calculated by multiplying the number of shares granted on 1 June 2023 (including decimals) by the 5-day average share price prior to 1 June 2023 of PLC £41.17 and then translated into euros using an average exchange rate over 2023 of €1 = £0.8700 (rounded). STRATEGIC REPORT CORPORATE GOVERNANCE FINANCIAL STATEMENTS Directors' Remuneration Report 140 Unilever Annual Report on Form 20-F 2023

Minimum shareholding requirement and Executive Director share interests Executive Directors are required to build and retain a personal shareholding in Unilever within five years of their date of appointment to align their interests with those of Unilever’s shareholders. Incoming Executive Directors will be required to retain all shares vesting from any share awards made since their appointment (after deduction of tax) until their minimum shareholding requirements have been met in full. If Executive Directors fail to achieve 100% of the shareholding requirement by the relevant time, they are not permitted to sell any Unilever shares and Unilever retains the right to block the sale of their shares until the required level of shareholding has been obtained. The table below shows the Executive Directors’ share ownership against the minimum shareholding requirements as at 31 December 2023 and the interest in PLC ordinary shares of the Executive Directors and their connected persons as at 31 December 2023. When calculating an Executive Director’s personal shareholding, the following methodology is used: ■ fixed pay at the date of measurement; ■ shares in PLC will qualify provided they are personally owned by the Executive Director, by a member of their immediate family or by certain corporate bodies, trusts or partnerships, as required by law from time to time (each a ‘connected person’); ■ shares purchased under the legacy MCIP, whether from the annual bonus or otherwise, will qualify as from the moment of purchase as these are held in the individual’s name and are not subject to further restrictions; ■ shares or entitlements to shares that are subject only to the Executive Director remaining in employment will qualify on a net of tax basis (including deferred bonus awards); ■ shares awarded on a conditional basis will not qualify until the moment of vesting (i.e. once the precise number of shares is fixed after the vesting period has elapsed); and ■ the shares will be valued on the date of measurement or, if that outcome fails the personal shareholding test, on the date of acquisition. The share price for the relevant measurement date will be based on the average closing share prices and the euro/sterling/US dollar exchange rates from the 60 calendar days prior to the measurement date. Executive Directors are required to maintain at least 100% of their minimum shareholding requirement for two years after leaving (or if less, their actual shareholding on the date of leaving). ULE members are required to build a shareholding of 400% of fixed pay (500% for the CEO). This requirement is 250% of fixed pay for the management layer below ULE. Executive Directors’ shareholdings are ring-fenced to ensure they meet the minimum shareholding requirement, including for two years after leaving employment. This means that even if the shares are vested, they are blocked until the end of the minimum shareholding requirement period (excluding any shares above the minimum shareholding requirement). Executive Directors’ and their connected persons’ interests in shares and share ownership Share ownership guideline as % of fixed pay (as at 31 December 2023) Have guidelines been met (as at 31 December 2023) Actual share ownership as a % of fixed pay (as at 31 December 2023)(a) Shares held as at 1 January 2023 Shares held as at 31 December 2023(b) PLC PLC ADS PLC PLC ADS CEO: Alan Jope 500% Yes 901% 55,271 237,881 79,608 238,362 CEO: Hein Schumacher(c) 500% No 13% — — 5,491 — CFO: Graeme Pitkethly 400% Yes 811% 206,108 229,128 — (a) Calculated based on the minimum shareholding requirements and methodology set out above and the headline fixed pay for the CEOs and CFO as at 31 December 2023 (€1,560,780 for the CEO (Alan Jope), €1,850,000 for the CEO (Hein Schumacher) and €1,246,262 for the CFO). (b) PLC shares are ordinary 31/9p shares. Includes annual bonus deferral shares dividend accrual, which is reinvested. (c) Hein Schumacher was appointed on 1 June 2023 and acquired shares after his appointment. In addition, his first share vesting took place on 15 February 2024, which is why his shareholding as at 31 December 2023 is 13%. Hein has five years from the date of his appointment to achieve his personal shareholding requirement. During the period between 1 January and 22 February 2024, the following changes in interests have occurred: ■ Graeme Pitkethly purchased 6 PLC shares under the Unilever PLC ShareBuy Plan: 3 on 9 January 2024 at a share price of £38.34, and a further 3 on 8 February 2024 at a share price of £40.14; and ■ as detailed on page 135 for Alan Jope and Graeme Pitkethly and page 140 for Hein Schumacher, on 15 February 2024: ■ Alan Jope acquired 20,924 PLC EUR shares following the vesting of his 2020 MCIP award; ■ Hein Schumacher acquired 2,621 PLC GBP shares following the vesting of his cash buy-out award; and ■ Graeme Pitkethly acquired 12,581 PLC GBP shares following the vesting of his 2020 MCIP award. Effective as of 1 January 2024, Fernando Fernandez was appointed as CFO replacing Graeme Pitkethly, who remained as CFO until 31 December 2023. As at 22 February 2024, Fernando Fernandez holds 84,496 PLC EUR shares and 190,072 PLC GBP shares. The voting rights of the Directors (Executive and Non-Executive) and members of the ULE who hold interests in the share capital of PLC are the same as for other holders of the class of shares indicated. As at 22 February 2024, none of the Directors’ (Executive and Non-Executive) or other ULE members’ shareholdings amounted to more than 1% of the issued shares in that class of share (except Nelson Peltz who owns 1.5% of the PLC issued share capital including via Trian Fund Management as a connected person). All shareholdings in the table above are beneficial. On page 99, the full share capital of PLC has been described. Pages 190 and 191 set out how many shares Unilever held to satisfy the awards under the share plans. STRATEGIC REPORT CORPORATE GOVERNANCE FINANCIAL STATEMENTS Directors' Remuneration Report Unilever Annual Report on Form 20-F 2023 141
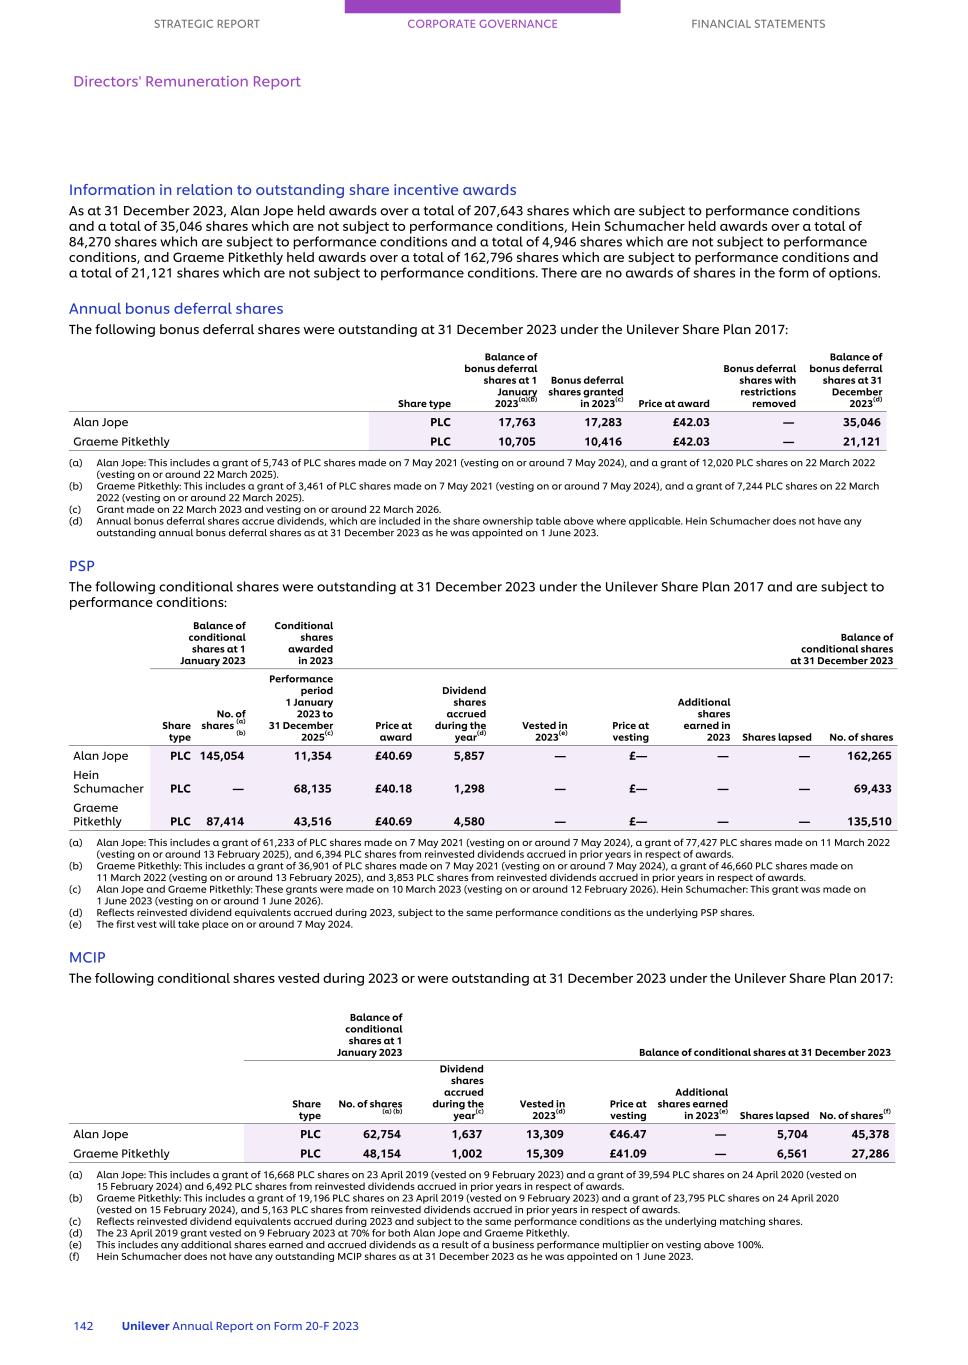
Information in relation to outstanding share incentive awards As at 31 December 2023, Alan Jope held awards over a total of 207,643 shares which are subject to performance conditions and a total of 35,046 shares which are not subject to performance conditions, Hein Schumacher held awards over a total of 84,270 shares which are subject to performance conditions and a total of 4,946 shares which are not subject to performance conditions, and Graeme Pitkethly held awards over a total of 162,796 shares which are subject to performance conditions and a total of 21,121 shares which are not subject to performance conditions. There are no awards of shares in the form of options. Annual bonus deferral shares The following bonus deferral shares were outstanding at 31 December 2023 under the Unilever Share Plan 2017: Share type Balance of bonus deferral shares at 1 January 2023(a)(b) Bonus deferral shares granted in 2023(c) Price at award Bonus deferral shares with restrictions removed Balance of bonus deferral shares at 31 December 2023(d) Alan Jope PLC 17,763 17,283 £42.03 — 35,046 Graeme Pitkethly PLC 10,705 10,416 £42.03 — 21,121 (a) Alan Jope: This includes a grant of 5,743 of PLC shares made on 7 May 2021 (vesting on or around 7 May 2024), and a grant of 12,020 PLC shares on 22 March 2022 (vesting on or around 22 March 2025). (b) Graeme Pitkethly: This includes a grant of 3,461 of PLC shares made on 7 May 2021 (vesting on or around 7 May 2024), and a grant of 7,244 PLC shares on 22 March 2022 (vesting on or around 22 March 2025). (c) Grant made on 22 March 2023 and vesting on or around 22 March 2026. (d) Annual bonus deferral shares accrue dividends, which are included in the share ownership table above where applicable. Hein Schumacher does not have any outstanding annual bonus deferral shares as at 31 December 2023 as he was appointed on 1 June 2023. PSP The following conditional shares were outstanding at 31 December 2023 under the Unilever Share Plan 2017 and are subject to performance conditions: Balance of conditional shares at 1 January 2023 Conditional shares awarded in 2023 Balance of conditional shares at 31 December 2023 Share type No. of shares (a) (b) Performance period 1 January 2023 to 31 December 2025(c) Price at award Dividend shares accrued during the year(d) Vested in 2023(e) Price at vesting Additional shares earned in 2023 Shares lapsed No. of shares Alan Jope PLC 145,054 11,354 £40.69 5,857 — £— — — 162,265 Hein Schumacher PLC — 68,135 £40.18 1,298 — £— — — 69,433 Graeme Pitkethly PLC 87,414 43,516 £40.69 4,580 — £— — — 135,510 (a) Alan Jope: This includes a grant of 61,233 of PLC shares made on 7 May 2021 (vesting on or around 7 May 2024), a grant of 77,427 PLC shares made on 11 March 2022 (vesting on or around 13 February 2025), and 6,394 PLC shares from reinvested dividends accrued in prior years in respect of awards. (b) Graeme Pitkethly: This includes a grant of 36,901 of PLC shares made on 7 May 2021 (vesting on or around 7 May 2024), a grant of 46,660 PLC shares made on 11 March 2022 (vesting on or around 13 February 2025), and 3,853 PLC shares from reinvested dividends accrued in prior years in respect of awards. (c) Alan Jope and Graeme Pitkethly: These grants were made on 10 March 2023 (vesting on or around 12 February 2026). Hein Schumacher: This grant was made on 1 June 2023 (vesting on or around 1 June 2026). (d) Reflects reinvested dividend equivalents accrued during 2023, subject to the same performance conditions as the underlying PSP shares. (e) The first vest will take place on or around 7 May 2024. MCIP The following conditional shares vested during 2023 or were outstanding at 31 December 2023 under the Unilever Share Plan 2017: Balance of conditional shares at 1 January 2023 Balance of conditional shares at 31 December 2023 Share type No. of shares (a) (b) Dividend shares accrued during the year(c) Vested in 2023(d) Price at vesting Additional shares earned in 2023(e) Shares lapsed No. of shares(f) Alan Jope PLC 62,754 1,637 13,309 €46.47 — 5,704 45,378 Graeme Pitkethly PLC 48,154 1,002 15,309 £41.09 — 6,561 27,286 (a) Alan Jope: This includes a grant of 16,668 PLC shares on 23 April 2019 (vested on 9 February 2023) and a grant of 39,594 PLC shares on 24 April 2020 (vested on 15 February 2024) and 6,492 PLC shares from reinvested dividends accrued in prior years in respect of awards. (b) Graeme Pitkethly: This includes a grant of 19,196 PLC shares on 23 April 2019 (vested on 9 February 2023) and a grant of 23,795 PLC shares on 24 April 2020 (vested on 15 February 2024), and 5,163 PLC shares from reinvested dividends accrued in prior years in respect of awards. (c) Reflects reinvested dividend equivalents accrued during 2023 and subject to the same performance conditions as the underlying matching shares. (d) The 23 April 2019 grant vested on 9 February 2023 at 70% for both Alan Jope and Graeme Pitkethly. (e) This includes any additional shares earned and accrued dividends as a result of a business performance multiplier on vesting above 100%. (f) Hein Schumacher does not have any outstanding MCIP shares as at 31 December 2023 as he was appointed on 1 June 2023. STRATEGIC REPORT CORPORATE GOVERNANCE FINANCIAL STATEMENTS Directors' Remuneration Report 142 Unilever Annual Report on Form 20-F 2023
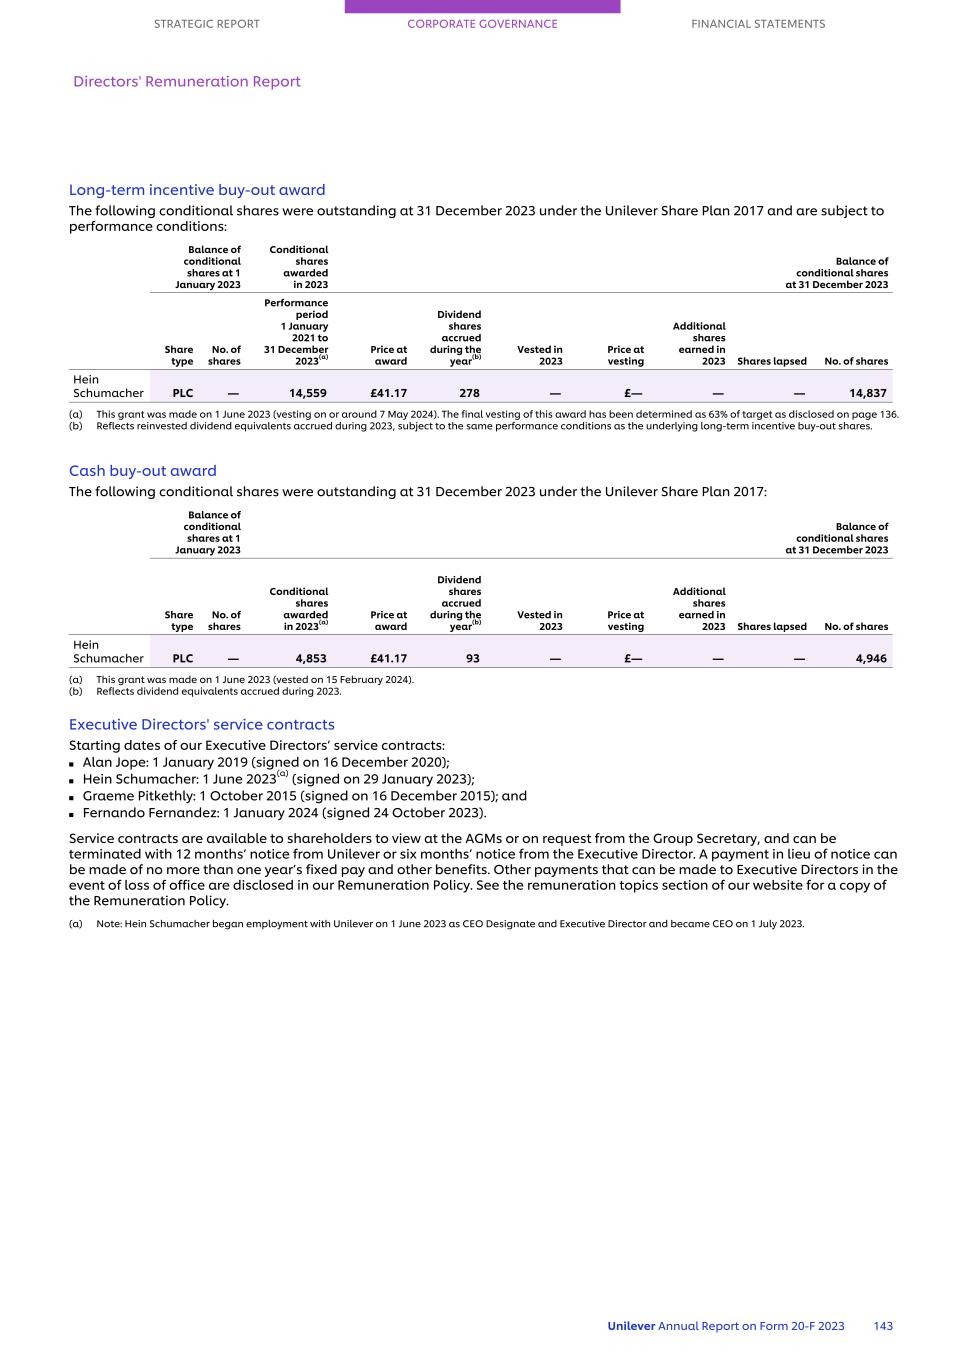
Long-term incentive buy-out award The following conditional shares were outstanding at 31 December 2023 under the Unilever Share Plan 2017 and are subject to performance conditions: Balance of conditional shares at 1 January 2023 Conditional shares awarded in 2023 Balance of conditional shares at 31 December 2023 Share type No. of shares Performance period 1 January 2021 to 31 December 2023(a) Price at award Dividend shares accrued during the year(b) Vested in 2023 Price at vesting Additional shares earned in 2023 Shares lapsed No. of shares Hein Schumacher PLC — 14,559 £41.17 278 — £— — — 14,837 (a) This grant was made on 1 June 2023 (vesting on or around 7 May 2024). The final vesting of this award has been determined as 63% of target as disclosed on page 136. (b) Reflects reinvested dividend equivalents accrued during 2023, subject to the same performance conditions as the underlying long-term incentive buy-out shares. Cash buy-out award The following conditional shares were outstanding at 31 December 2023 under the Unilever Share Plan 2017: Balance of conditional shares at 1 January 2023 Balance of conditional shares at 31 December 2023 Share type No. of shares Conditional shares awarded in 2023(a) Price at award Dividend shares accrued during the year(b) Vested in 2023 Price at vesting Additional shares earned in 2023 Shares lapsed No. of shares Hein Schumacher PLC — 4,853 £41.17 93 — £— — — 4,946 (a) This grant was made on 1 June 2023 (vested on 15 February 2024). (b) Reflects dividend equivalents accrued during 2023. Executive Directors' service contracts Starting dates of our Executive Directors’ service contracts: ■ Alan Jope: 1 January 2019 (signed on 16 December 2020); ■ Hein Schumacher: 1 June 2023(a) (signed on 29 January 2023); ■ Graeme Pitkethly: 1 October 2015 (signed on 16 December 2015); and ■ Fernando Fernandez: 1 January 2024 (signed 24 October 2023). Service contracts are available to shareholders to view at the AGMs or on request from the Group Secretary, and can be terminated with 12 months’ notice from Unilever or six months’ notice from the Executive Director. A payment in lieu of notice can be made of no more than one year’s fixed pay and other benefits. Other payments that can be made to Executive Directors in the event of loss of office are disclosed in our Remuneration Policy. See the remuneration topics section of our website for a copy of the Remuneration Policy. (a) Note: Hein Schumacher began employment with Unilever on 1 June 2023 as CEO Designate and Executive Director and became CEO on 1 July 2023. STRATEGIC REPORT CORPORATE GOVERNANCE FINANCIAL STATEMENTS Directors' Remuneration Report Unilever Annual Report on Form 20-F 2023 143
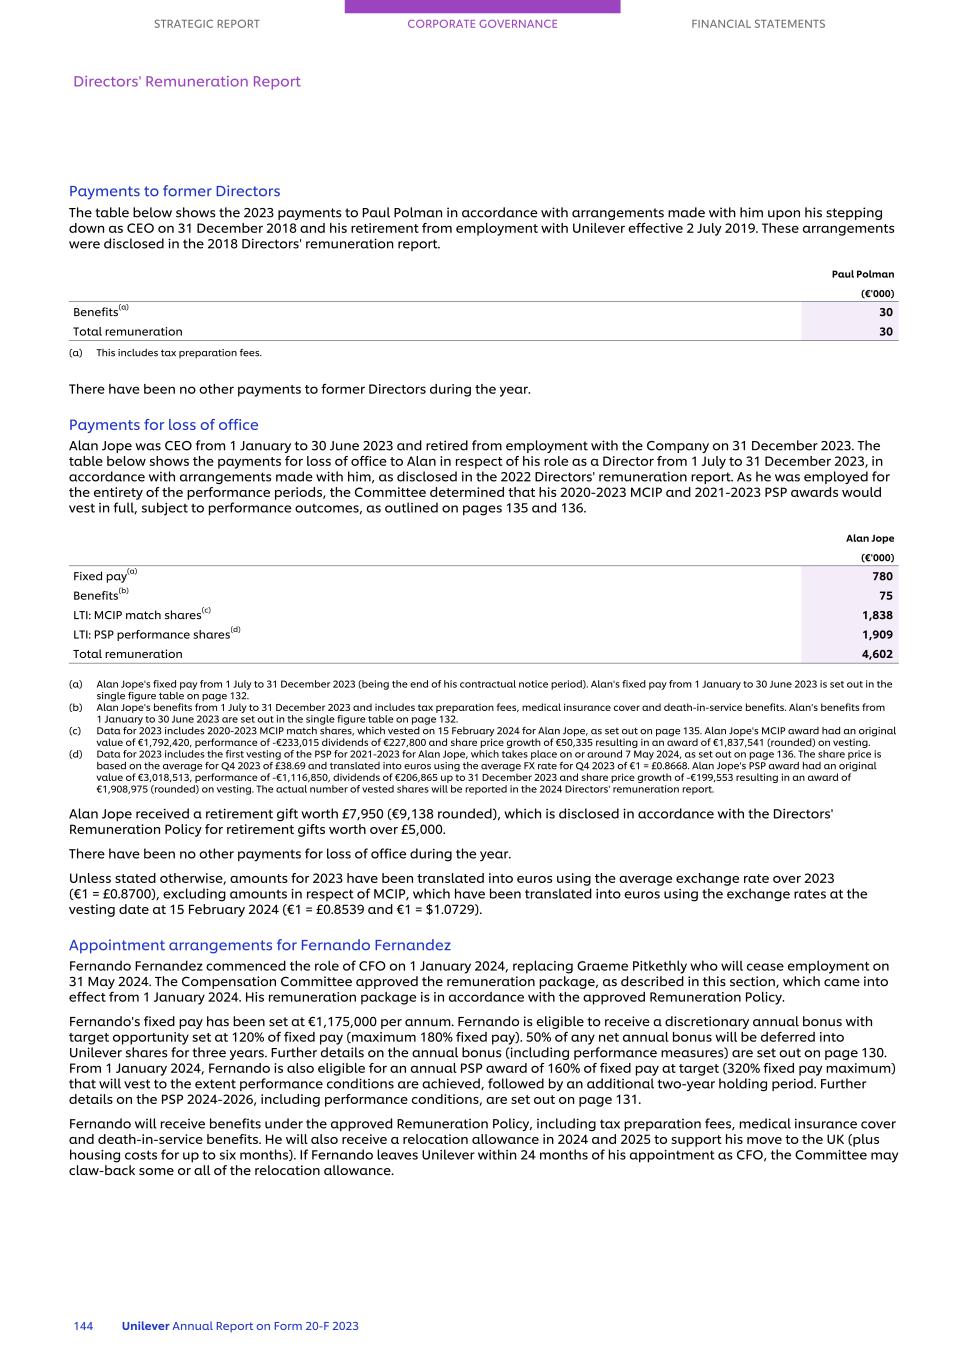
Payments to former Directors The table below shows the 2023 payments to Paul Polman in accordance with arrangements made with him upon his stepping down as CEO on 31 December 2018 and his retirement from employment with Unilever effective 2 July 2019. These arrangements were disclosed in the 2018 Directors' remuneration report. Paul Polman (€'000) Benefits(a) 30 Total remuneration 30 (a) This includes tax preparation fees. There have been no other payments to former Directors during the year. Payments for loss of office Alan Jope was CEO from 1 January to 30 June 2023 and retired from employment with the Company on 31 December 2023. The table below shows the payments for loss of office to Alan in respect of his role as a Director from 1 July to 31 December 2023, in accordance with arrangements made with him, as disclosed in the 2022 Directors' remuneration report. As he was employed for the entirety of the performance periods, the Committee determined that his 2020-2023 MCIP and 2021-2023 PSP awards would vest in full, subject to performance outcomes, as outlined on pages 135 and 136. Alan Jope (€'000) Fixed pay(a) 780 Benefits(b) 75 LTI: MCIP match shares(c) 1,838 LTI: PSP performance shares(d) 1,909 Total remuneration 4,602 (a) Alan Jope's fixed pay from 1 July to 31 December 2023 (being the end of his contractual notice period). Alan's fixed pay from 1 January to 30 June 2023 is set out in the single figure table on page 132. (b) Alan Jope's benefits from 1 July to 31 December 2023 and includes tax preparation fees, medical insurance cover and death-in-service benefits. Alan's benefits from 1 January to 30 June 2023 are set out in the single figure table on page 132. (c) Data for 2023 includes 2020-2023 MCIP match shares, which vested on 15 February 2024 for Alan Jope, as set out on page 135. Alan Jope's MCIP award had an original value of €1,792,420, performance of -€233,015 dividends of €227,800 and share price growth of €50,335 resulting in an award of €1,837,541 (rounded) on vesting. (d) Data for 2023 includes the first vesting of the PSP for 2021-2023 for Alan Jope, which takes place on or around 7 May 2024, as set out on page 136. The share price is based on the average for Q4 2023 of £38.69 and translated into euros using the average FX rate for Q4 2023 of €1 = £0.8668. Alan Jope's PSP award had an original value of €3,018,513, performance of -€1,116,850, dividends of €206,865 up to 31 December 2023 and share price growth of -€199,553 resulting in an award of €1,908,975 (rounded) on vesting. The actual number of vested shares will be reported in the 2024 Directors' remuneration report. Alan Jope received a retirement gift worth £7,950 (€9,138 rounded), which is disclosed in accordance with the Directors' Remuneration Policy for retirement gifts worth over £5,000. There have been no other payments for loss of office during the year. Unless stated otherwise, amounts for 2023 have been translated into euros using the average exchange rate over 2023 (€1 = £0.8700), excluding amounts in respect of MCIP, which have been translated into euros using the exchange rates at the vesting date at 15 February 2024 (€1 = £0.8539 and €1 = $1.0729). Appointment arrangements for Fernando Fernandez Fernando Fernandez commenced the role of CFO on 1 January 2024, replacing Graeme Pitkethly who will cease employment on 31 May 2024. The Compensation Committee approved the remuneration package, as described in this section, which came into effect from 1 January 2024. His remuneration package is in accordance with the approved Remuneration Policy. Fernando's fixed pay has been set at €1,175,000 per annum. Fernando is eligible to receive a discretionary annual bonus with target opportunity set at 120% of fixed pay (maximum 180% fixed pay). 50% of any net annual bonus will be deferred into Unilever shares for three years. Further details on the annual bonus (including performance measures) are set out on page 130. From 1 January 2024, Fernando is also eligible for an annual PSP award of 160% of fixed pay at target (320% fixed pay maximum) that will vest to the extent performance conditions are achieved, followed by an additional two-year holding period. Further details on the PSP 2024-2026, including performance conditions, are set out on page 131. Fernando will receive benefits under the approved Remuneration Policy, including tax preparation fees, medical insurance cover and death-in-service benefits. He will also receive a relocation allowance in 2024 and 2025 to support his move to the UK (plus housing costs for up to six months). If Fernando leaves Unilever within 24 months of his appointment as CFO, the Committee may claw-back some or all of the relocation allowance. STRATEGIC REPORT CORPORATE GOVERNANCE FINANCIAL STATEMENTS Directors' Remuneration Report 144 Unilever Annual Report on Form 20-F 2023
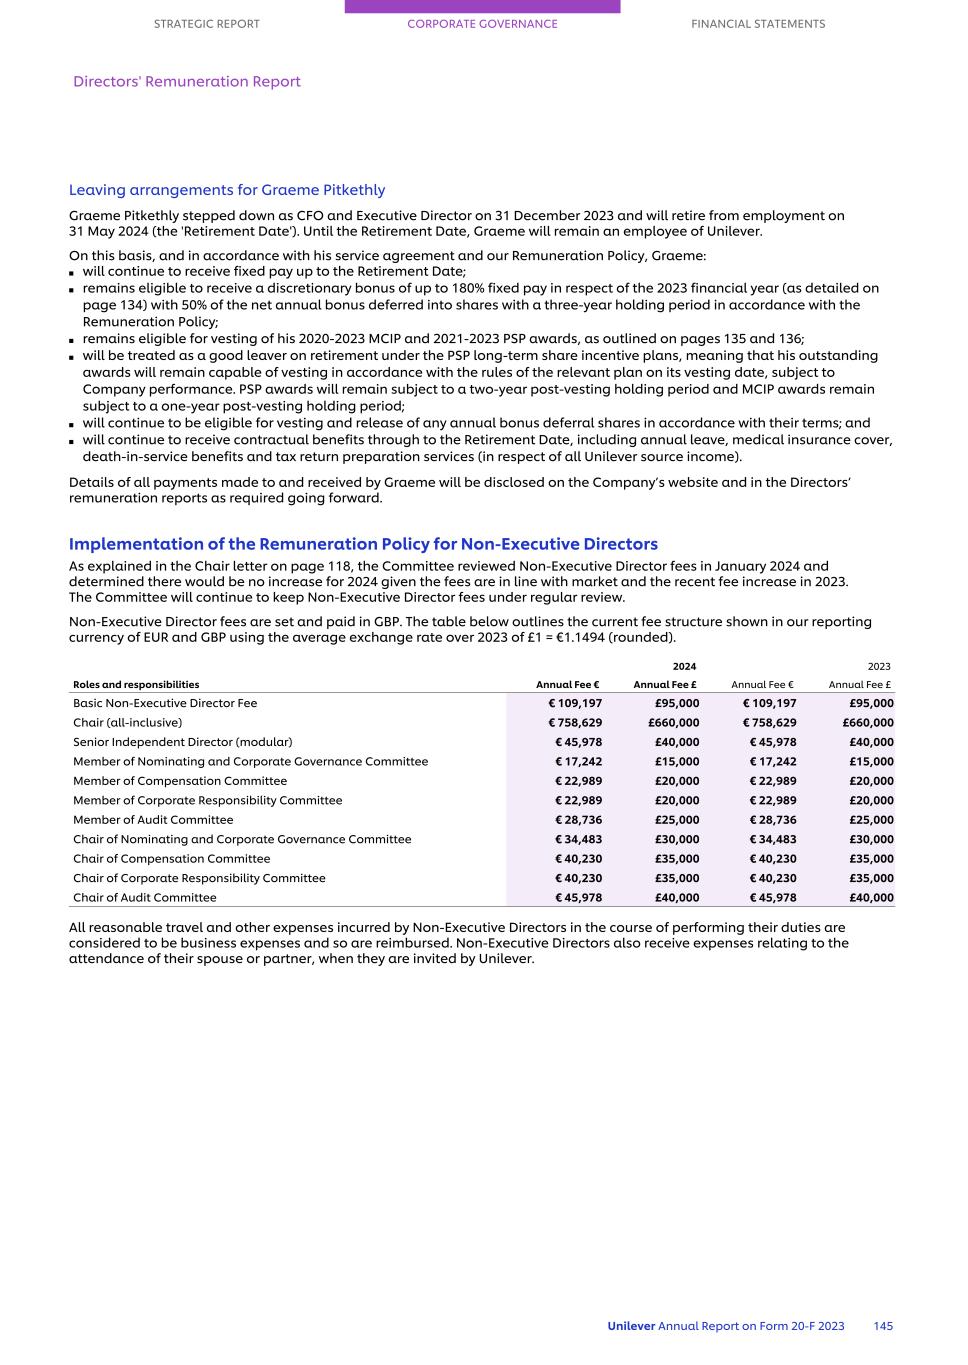
Leaving arrangements for Graeme Pitkethly Graeme Pitkethly stepped down as CFO and Executive Director on 31 December 2023 and will retire from employment on 31 May 2024 (the 'Retirement Date'). Until the Retirement Date, Graeme will remain an employee of Unilever. On this basis, and in accordance with his service agreement and our Remuneration Policy, Graeme: ■ will continue to receive fixed pay up to the Retirement Date; ■ remains eligible to receive a discretionary bonus of up to 180% fixed pay in respect of the 2023 financial year (as detailed on page 134) with 50% of the net annual bonus deferred into shares with a three-year holding period in accordance with the Remuneration Policy; ■ remains eligible for vesting of his 2020-2023 MCIP and 2021-2023 PSP awards, as outlined on pages 135 and 136; ■ will be treated as a good leaver on retirement under the PSP long-term share incentive plans, meaning that his outstanding awards will remain capable of vesting in accordance with the rules of the relevant plan on its vesting date, subject to Company performance. PSP awards will remain subject to a two-year post-vesting holding period and MCIP awards remain subject to a one-year post-vesting holding period; ■ will continue to be eligible for vesting and release of any annual bonus deferral shares in accordance with their terms; and ■ will continue to receive contractual benefits through to the Retirement Date, including annual leave, medical insurance cover, death-in-service benefits and tax return preparation services (in respect of all Unilever source income). Details of all payments made to and received by Graeme will be disclosed on the Company’s website and in the Directors’ remuneration reports as required going forward. Implementation of the Remuneration Policy for Non-Executive Directors As explained in the Chair letter on page 118, the Committee reviewed Non-Executive Director fees in January 2024 and determined there would be no increase for 2024 given the fees are in line with market and the recent fee increase in 2023. The Committee will continue to keep Non-Executive Director fees under regular review. Non-Executive Director fees are set and paid in GBP. The table below outlines the current fee structure shown in our reporting currency of EUR and GBP using the average exchange rate over 2023 of £1 = €1.1494 (rounded). 2024 2023 Roles and responsibilities Annual Fee € Annual Fee £ Annual Fee € Annual Fee £ Basic Non-Executive Director Fee € 109,197 £95,000 € 109,197 £95,000 Chair (all-inclusive) € 758,629 £660,000 € 758,629 £660,000 Senior Independent Director (modular) € 45,978 £40,000 € 45,978 £40,000 Member of Nominating and Corporate Governance Committee € 17,242 £15,000 € 17,242 £15,000 Member of Compensation Committee € 22,989 £20,000 € 22,989 £20,000 Member of Corporate Responsibility Committee € 22,989 £20,000 € 22,989 £20,000 Member of Audit Committee € 28,736 £25,000 € 28,736 £25,000 Chair of Nominating and Corporate Governance Committee € 34,483 £30,000 € 34,483 £30,000 Chair of Compensation Committee € 40,230 £35,000 € 40,230 £35,000 Chair of Corporate Responsibility Committee € 40,230 £35,000 € 40,230 £35,000 Chair of Audit Committee € 45,978 £40,000 € 45,978 £40,000 All reasonable travel and other expenses incurred by Non-Executive Directors in the course of performing their duties are considered to be business expenses and so are reimbursed. Non-Executive Directors also receive expenses relating to the attendance of their spouse or partner, when they are invited by Unilever. STRATEGIC REPORT CORPORATE GOVERNANCE FINANCIAL STATEMENTS Directors' Remuneration Report Unilever Annual Report on Form 20-F 2023 145
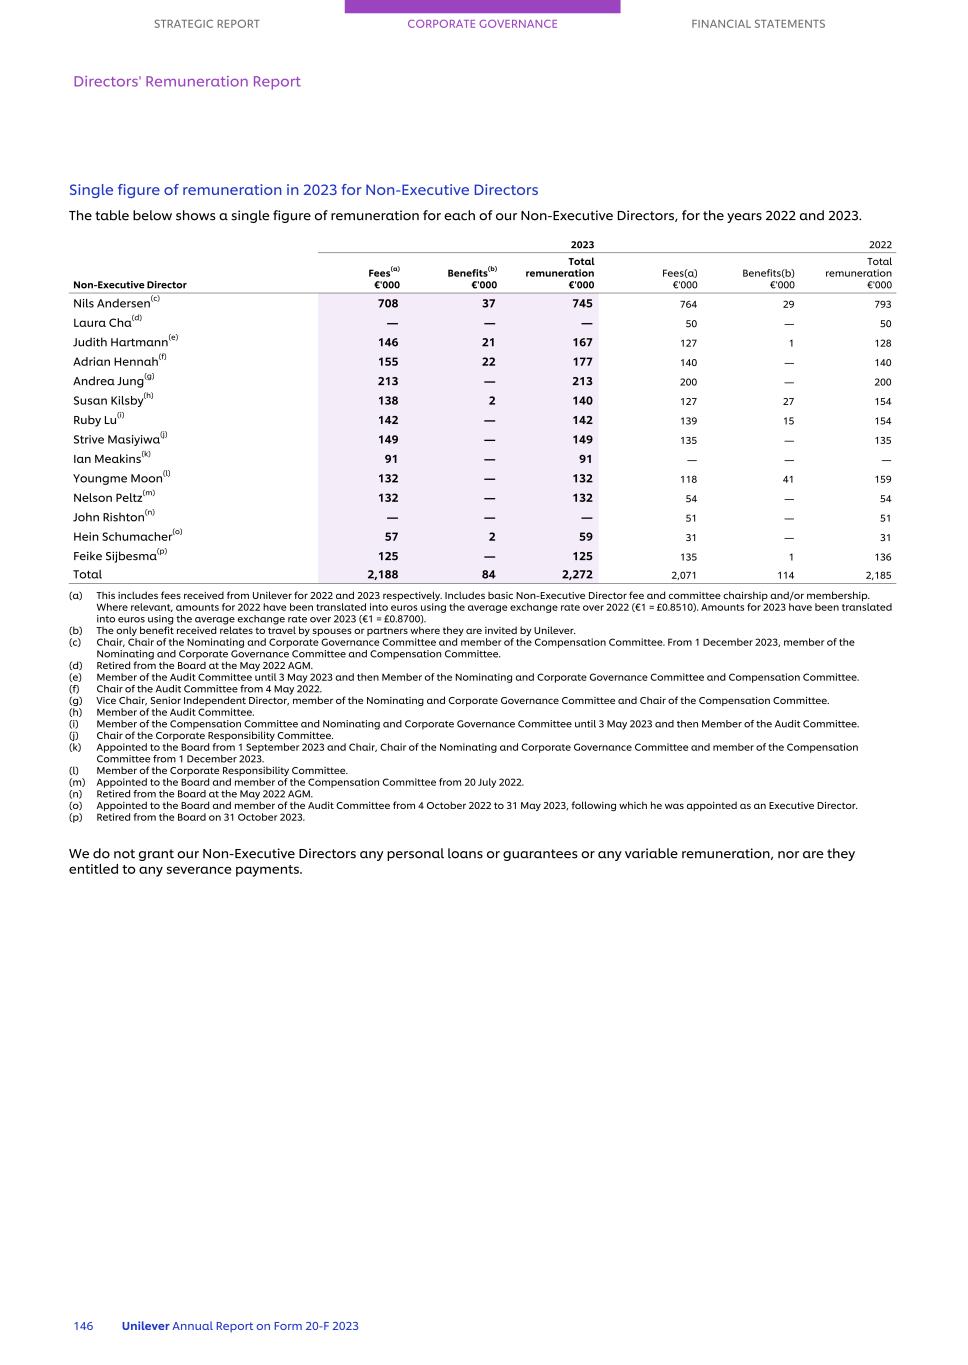
Single figure of remuneration in 2023 for Non-Executive Directors The table below shows a single figure of remuneration for each of our Non-Executive Directors, for the years 2022 and 2023. Non-Executive Director 2023 2022 Fees(a) €'000 Benefits(b) €'000 Total remuneration €'000 Fees(a) €'000 Benefits(b) €'000 Total remuneration €'000 Nils Andersen(c) 708 37 745 764 29 793 Laura Cha(d) — — — 50 — 50 Judith Hartmann(e) 146 21 167 127 1 128 Adrian Hennah(f) 155 22 177 140 — 140 Andrea Jung(g) 213 — 213 200 — 200 Susan Kilsby(h) 138 2 140 127 27 154 Ruby Lu(i) 142 — 142 139 15 154 Strive Masiyiwa(j) 149 — 149 135 — 135 Ian Meakins(k) 91 — 91 — — — Youngme Moon(l) 132 — 132 118 41 159 Nelson Peltz(m) 132 — 132 54 — 54 John Rishton(n) — — — 51 — 51 Hein Schumacher(o) 57 2 59 31 — 31 Feike Sijbesma(p) 125 — 125 135 1 136 Total 2,188 84 2,272 2,071 114 2,185 (a) This includes fees received from Unilever for 2022 and 2023 respectively. Includes basic Non-Executive Director fee and committee chairship and/or membership. Where relevant, amounts for 2022 have been translated into euros using the average exchange rate over 2022 (€1 = £0.8510). Amounts for 2023 have been translated into euros using the average exchange rate over 2023 (€1 = £0.8700). (b) The only benefit received relates to travel by spouses or partners where they are invited by Unilever. (c) Chair, Chair of the Nominating and Corporate Governance Committee and member of the Compensation Committee. From 1 December 2023, member of the Nominating and Corporate Governance Committee and Compensation Committee. (d) Retired from the Board at the May 2022 AGM. (e) Member of the Audit Committee until 3 May 2023 and then Member of the Nominating and Corporate Governance Committee and Compensation Committee. (f) Chair of the Audit Committee from 4 May 2022. (g) Vice Chair, Senior Independent Director, member of the Nominating and Corporate Governance Committee and Chair of the Compensation Committee. (h) Member of the Audit Committee. (i) Member of the Compensation Committee and Nominating and Corporate Governance Committee until 3 May 2023 and then Member of the Audit Committee. (j) Chair of the Corporate Responsibility Committee. (k) Appointed to the Board from 1 September 2023 and Chair, Chair of the Nominating and Corporate Governance Committee and member of the Compensation Committee from 1 December 2023. (l) Member of the Corporate Responsibility Committee. (m) Appointed to the Board and member of the Compensation Committee from 20 July 2022. (n) Retired from the Board at the May 2022 AGM. (o) Appointed to the Board and member of the Audit Committee from 4 October 2022 to 31 May 2023, following which he was appointed as an Executive Director. (p) Retired from the Board on 31 October 2023. We do not grant our Non-Executive Directors any personal loans or guarantees or any variable remuneration, nor are they entitled to any severance payments. STRATEGIC REPORT CORPORATE GOVERNANCE FINANCIAL STATEMENTS Directors' Remuneration Report 146 Unilever Annual Report on Form 20-F 2023
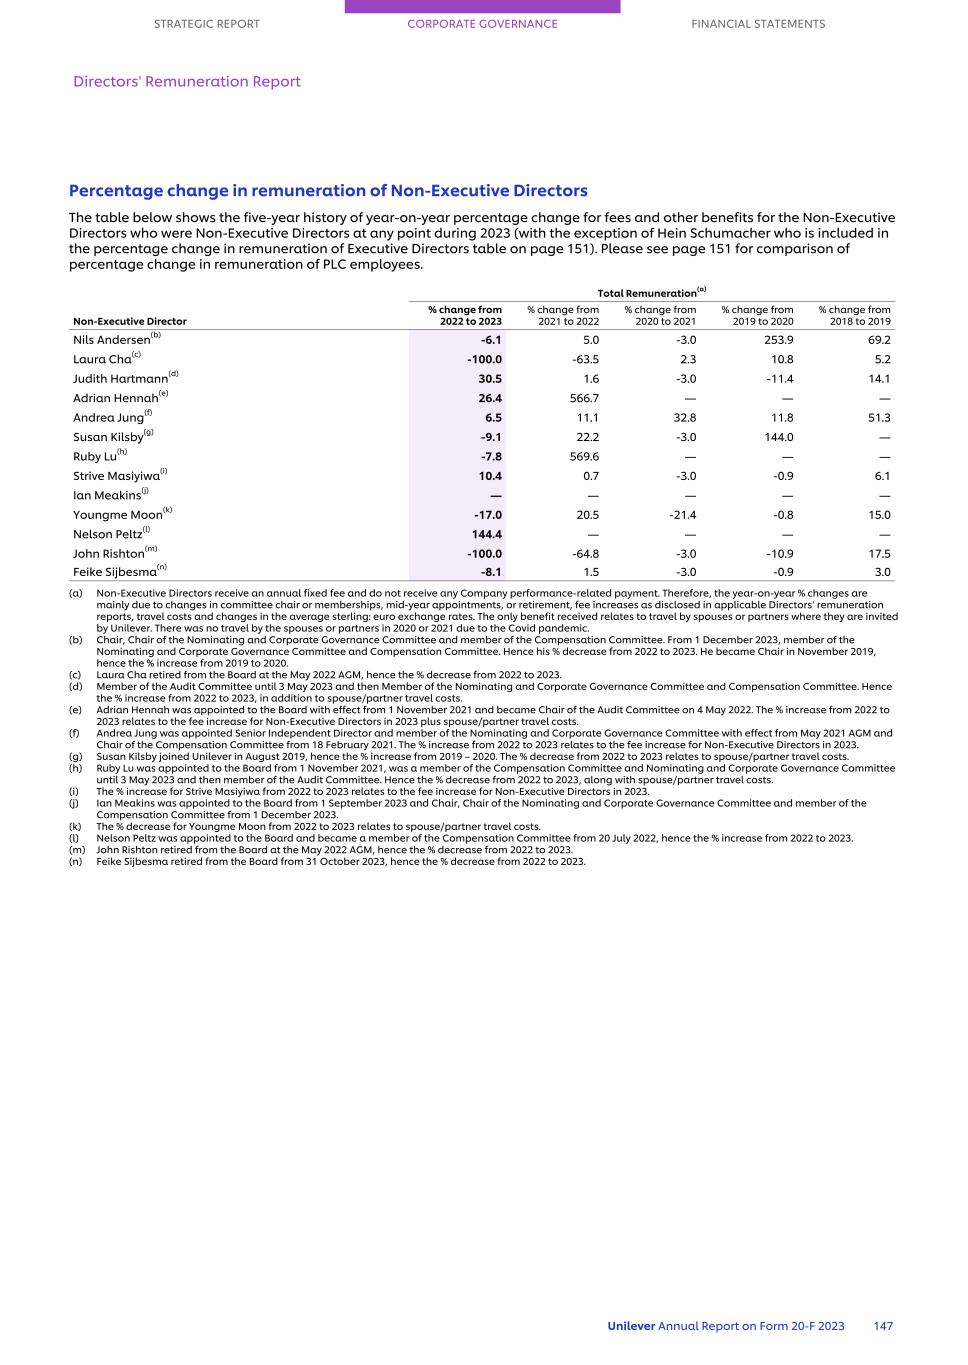
Percentage change in remuneration of Non-Executive Directors The table below shows the five-year history of year-on-year percentage change for fees and other benefits for the Non-Executive Directors who were Non-Executive Directors at any point during 2023 (with the exception of Hein Schumacher who is included in the percentage change in remuneration of Executive Directors table on page 151). Please see page 151 for comparison of percentage change in remuneration of PLC employees. Total Remuneration(a) Non-Executive Director % change from 2022 to 2023 % change from 2021 to 2022 % change from 2020 to 2021 % change from 2019 to 2020 % change from 2018 to 2019 Nils Andersen(b) -6.1 5.0 -3.0 253.9 69.2 Laura Cha(c) -100.0 -63.5 2.3 10.8 5.2 Judith Hartmann(d) 30.5 1.6 -3.0 -11.4 14.1 Adrian Hennah(e) 26.4 566.7 — — — Andrea Jung(f) 6.5 11.1 32.8 11.8 51.3 Susan Kilsby(g) -9.1 22.2 -3.0 144.0 — Ruby Lu(h) -7.8 569.6 — — — Strive Masiyiwa(i) 10.4 0.7 -3.0 -0.9 6.1 Ian Meakins(j) — — — — — Youngme Moon(k) -17.0 20.5 -21.4 -0.8 15.0 Nelson Peltz(l) 144.4 — — — — John Rishton(m) -100.0 -64.8 -3.0 -10.9 17.5 Feike Sijbesma(n) -8.1 1.5 -3.0 -0.9 3.0 (a) Non-Executive Directors receive an annual fixed fee and do not receive any Company performance-related payment. Therefore, the year-on-year % changes are mainly due to changes in committee chair or memberships, mid-year appointments, or retirement, fee increases as disclosed in applicable Directors’ remuneration reports, travel costs and changes in the average sterling: euro exchange rates. The only benefit received relates to travel by spouses or partners where they are invited by Unilever. There was no travel by the spouses or partners in 2020 or 2021 due to the Covid pandemic. (b) Chair, Chair of the Nominating and Corporate Governance Committee and member of the Compensation Committee. From 1 December 2023, member of the Nominating and Corporate Governance Committee and Compensation Committee. Hence his % decrease from 2022 to 2023. He became Chair in November 2019, hence the % increase from 2019 to 2020. (c) Laura Cha retired from the Board at the May 2022 AGM, hence the % decrease from 2022 to 2023. (d) Member of the Audit Committee until 3 May 2023 and then Member of the Nominating and Corporate Governance Committee and Compensation Committee. Hence the % increase from 2022 to 2023, in addition to spouse/partner travel costs. (e) Adrian Hennah was appointed to the Board with effect from 1 November 2021 and became Chair of the Audit Committee on 4 May 2022. The % increase from 2022 to 2023 relates to the fee increase for Non-Executive Directors in 2023 plus spouse/partner travel costs. (f) Andrea Jung was appointed Senior Independent Director and member of the Nominating and Corporate Governance Committee with effect from May 2021 AGM and Chair of the Compensation Committee from 18 February 2021. The % increase from 2022 to 2023 relates to the fee increase for Non-Executive Directors in 2023. (g) Susan Kilsby joined Unilever in August 2019, hence the % increase from 2019 – 2020. The % decrease from 2022 to 2023 relates to spouse/partner travel costs. (h) Ruby Lu was appointed to the Board from 1 November 2021, was a member of the Compensation Committee and Nominating and Corporate Governance Committee until 3 May 2023 and then member of the Audit Committee. Hence the % decrease from 2022 to 2023, along with spouse/partner travel costs. (i) The % increase for Strive Masiyiwa from 2022 to 2023 relates to the fee increase for Non-Executive Directors in 2023. (j) Ian Meakins was appointed to the Board from 1 September 2023 and Chair, Chair of the Nominating and Corporate Governance Committee and member of the Compensation Committee from 1 December 2023. (k) The % decrease for Youngme Moon from 2022 to 2023 relates to spouse/partner travel costs. (l) Nelson Peltz was appointed to the Board and became a member of the Compensation Committee from 20 July 2022, hence the % increase from 2022 to 2023. (m) John Rishton retired from the Board at the May 2022 AGM, hence the % decrease from 2022 to 2023. (n) Feike Sijbesma retired from the Board from 31 October 2023, hence the % decrease from 2022 to 2023. STRATEGIC REPORT CORPORATE GOVERNANCE FINANCIAL STATEMENTS Directors' Remuneration Report Unilever Annual Report on Form 20-F 2023 147
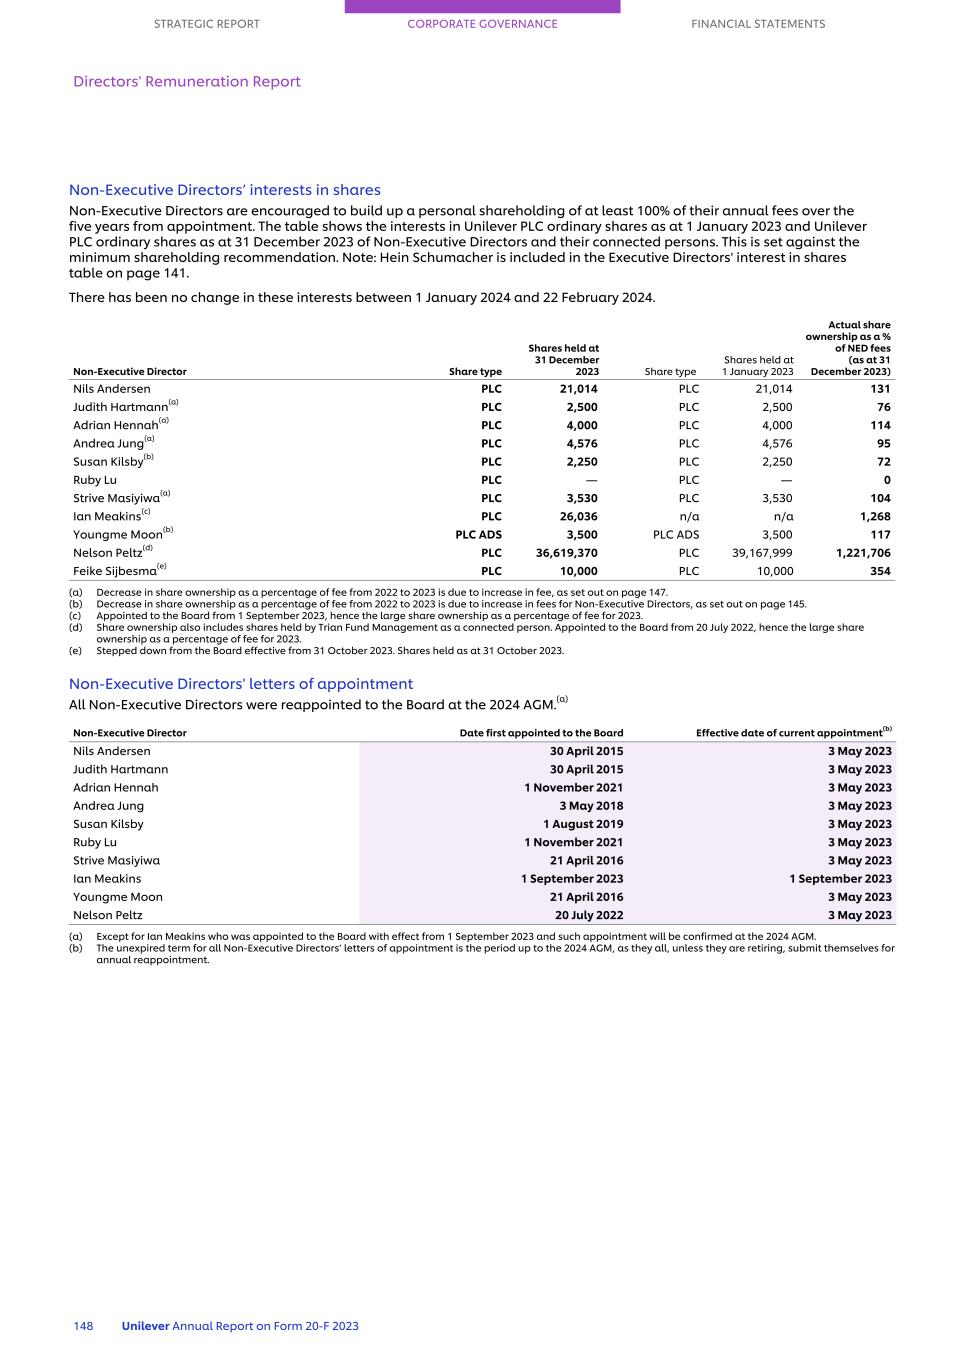
Non-Executive Directors’ interests in shares Non-Executive Directors are encouraged to build up a personal shareholding of at least 100% of their annual fees over the five years from appointment. The table shows the interests in Unilever PLC ordinary shares as at 1 January 2023 and Unilever PLC ordinary shares as at 31 December 2023 of Non-Executive Directors and their connected persons. This is set against the minimum shareholding recommendation. Note: Hein Schumacher is included in the Executive Directors' interest in shares table on page 141. There has been no change in these interests between 1 January 2024 and 22 February 2024. Non-Executive Director Share type Shares held at 31 December 2023 Share type Shares held at 1 January 2023 Actual share ownership as a % of NED fees (as at 31 December 2023) Nils Andersen PLC 21,014 PLC 21,014 131 Judith Hartmann(a) PLC 2,500 PLC 2,500 76 Adrian Hennah(a) PLC 4,000 PLC 4,000 114 Andrea Jung(a) PLC 4,576 PLC 4,576 95 Susan Kilsby(b) PLC 2,250 PLC 2,250 72 Ruby Lu PLC — PLC — 0 Strive Masiyiwa(a) PLC 3,530 PLC 3,530 104 Ian Meakins(c) PLC 26,036 n/a n/a 1,268 Youngme Moon(b) PLC ADS 3,500 PLC ADS 3,500 117 Nelson Peltz(d) PLC 36,619,370 PLC 39,167,999 1,221,706 Feike Sijbesma(e) PLC 10,000 PLC 10,000 354 (a) Decrease in share ownership as a percentage of fee from 2022 to 2023 is due to increase in fee, as set out on page 147. (b) Decrease in share ownership as a percentage of fee from 2022 to 2023 is due to increase in fees for Non-Executive Directors, as set out on page 145. (c) Appointed to the Board from 1 September 2023, hence the large share ownership as a percentage of fee for 2023. (d) Share ownership also includes shares held by Trian Fund Management as a connected person. Appointed to the Board from 20 July 2022, hence the large share ownership as a percentage of fee for 2023. (e) Stepped down from the Board effective from 31 October 2023. Shares held as at 31 October 2023. Non-Executive Directors' letters of appointment All Non-Executive Directors were reappointed to the Board at the 2024 AGM.(a) Non-Executive Director Date first appointed to the Board Effective date of current appointment(b) Nils Andersen 30 April 2015 3 May 2023 Judith Hartmann 30 April 2015 3 May 2023 Adrian Hennah 1 November 2021 3 May 2023 Andrea Jung 3 May 2018 3 May 2023 Susan Kilsby 1 August 2019 3 May 2023 Ruby Lu 1 November 2021 3 May 2023 Strive Masiyiwa 21 April 2016 3 May 2023 Ian Meakins 1 September 2023 1 September 2023 Youngme Moon 21 April 2016 3 May 2023 Nelson Peltz 20 July 2022 3 May 2023 (a) Except for Ian Meakins who was appointed to the Board with effect from 1 September 2023 and such appointment will be confirmed at the 2024 AGM. (b) The unexpired term for all Non-Executive Directors’ letters of appointment is the period up to the 2024 AGM, as they all, unless they are retiring, submit themselves for annual reappointment. STRATEGIC REPORT CORPORATE GOVERNANCE FINANCIAL STATEMENTS Directors' Remuneration Report 148 Unilever Annual Report on Form 20-F 2023
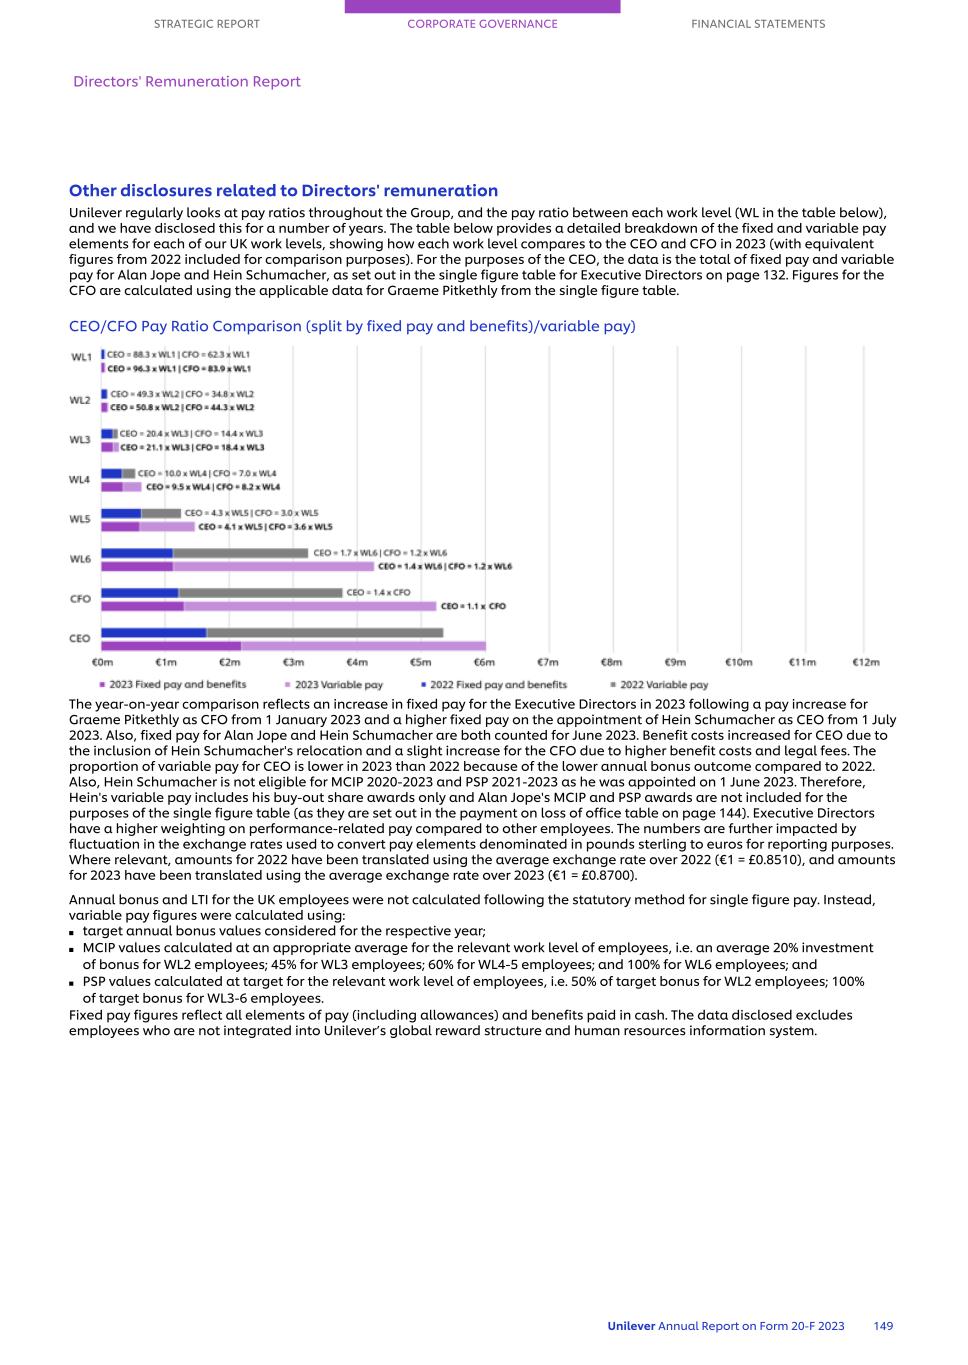
Other disclosures related to Directors' remuneration Unilever regularly looks at pay ratios throughout the Group, and the pay ratio between each work level (WL in the table below), and we have disclosed this for a number of years. The table below provides a detailed breakdown of the fixed and variable pay elements for each of our UK work levels, showing how each work level compares to the CEO and CFO in 2023 (with equivalent figures from 2022 included for comparison purposes). For the purposes of the CEO, the data is the total of fixed pay and variable pay for Alan Jope and Hein Schumacher, as set out in the single figure table for Executive Directors on page 132. Figures for the CFO are calculated using the applicable data for Graeme Pitkethly from the single figure table. CEO/CFO Pay Ratio Comparison (split by fixed pay and benefits)/variable pay) The year-on-year comparison reflects an increase in fixed pay for the Executive Directors in 2023 following a pay increase for Graeme Pitkethly as CFO from 1 January 2023 and a higher fixed pay on the appointment of Hein Schumacher as CEO from 1 July 2023. Also, fixed pay for Alan Jope and Hein Schumacher are both counted for June 2023. Benefit costs increased for CEO due to the inclusion of Hein Schumacher's relocation and a slight increase for the CFO due to higher benefit costs and legal fees. The proportion of variable pay for CEO is lower in 2023 than 2022 because of the lower annual bonus outcome compared to 2022. Also, Hein Schumacher is not eligible for MCIP 2020-2023 and PSP 2021-2023 as he was appointed on 1 June 2023. Therefore, Hein's variable pay includes his buy-out share awards only and Alan Jope's MCIP and PSP awards are not included for the purposes of the single figure table (as they are set out in the payment on loss of office table on page 144). Executive Directors have a higher weighting on performance-related pay compared to other employees. The numbers are further impacted by fluctuation in the exchange rates used to convert pay elements denominated in pounds sterling to euros for reporting purposes. Where relevant, amounts for 2022 have been translated using the average exchange rate over 2022 (€1 = £0.8510), and amounts for 2023 have been translated using the average exchange rate over 2023 (€1 = £0.8700). Annual bonus and LTI for the UK employees were not calculated following the statutory method for single figure pay. Instead, variable pay figures were calculated using: ■ target annual bonus values considered for the respective year; ■ MCIP values calculated at an appropriate average for the relevant work level of employees, i.e. an average 20% investment of bonus for WL2 employees; 45% for WL3 employees; 60% for WL4-5 employees; and 100% for WL6 employees; and ■ PSP values calculated at target for the relevant work level of employees, i.e. 50% of target bonus for WL2 employees; 100% of target bonus for WL3-6 employees. Fixed pay figures reflect all elements of pay (including allowances) and benefits paid in cash. The data disclosed excludes employees who are not integrated into Unilever’s global reward structure and human resources information system. STRATEGIC REPORT CORPORATE GOVERNANCE FINANCIAL STATEMENTS Directors' Remuneration Report Unilever Annual Report on Form 20-F 2023 149
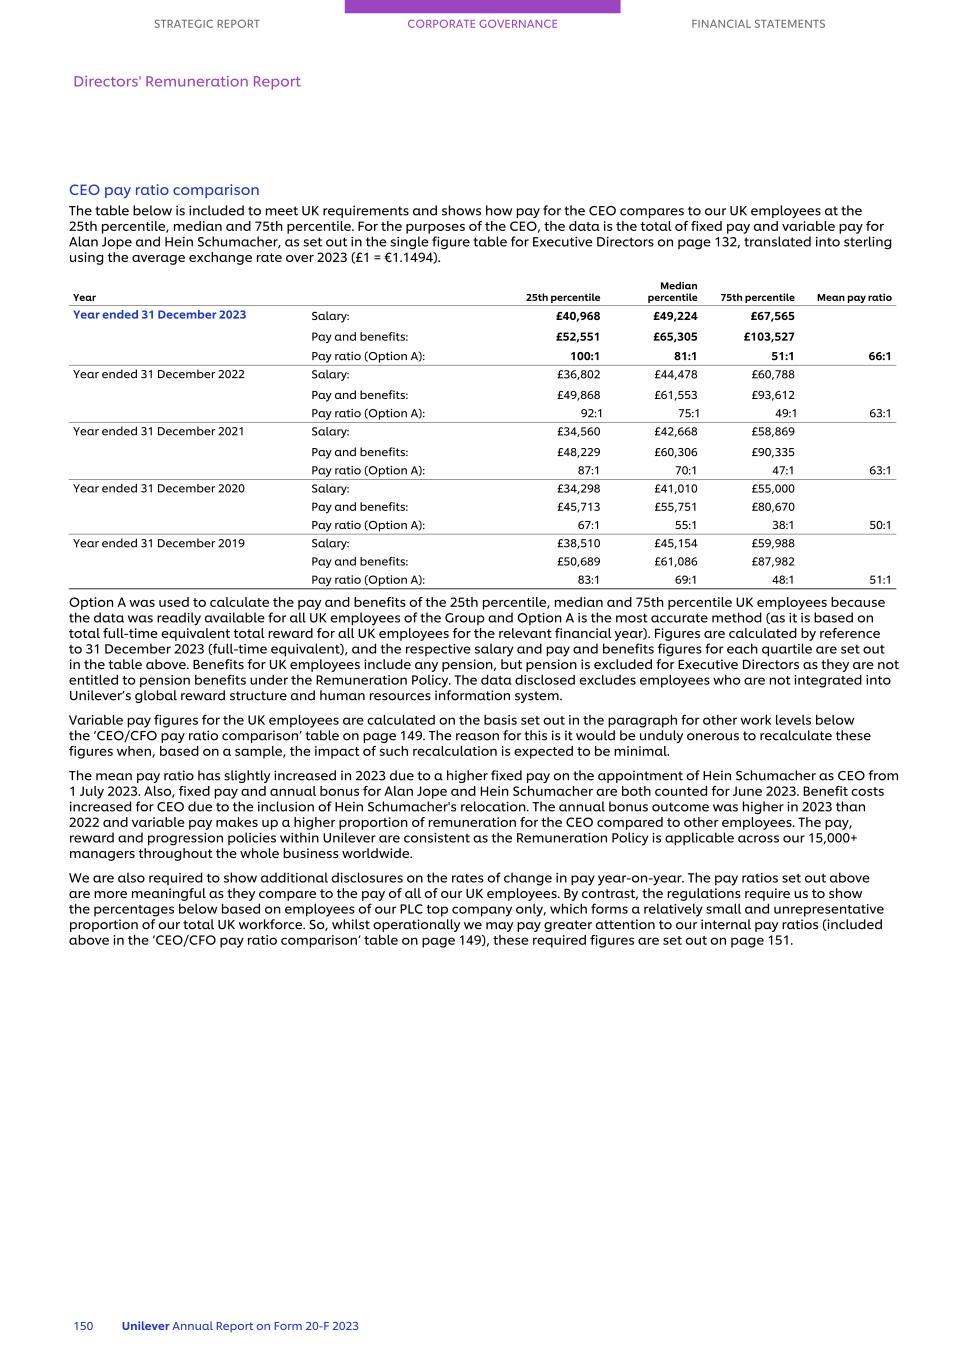
CEO pay ratio comparison The table below is included to meet UK requirements and shows how pay for the CEO compares to our UK employees at the 25th percentile, median and 75th percentile. For the purposes of the CEO, the data is the total of fixed pay and variable pay for Alan Jope and Hein Schumacher, as set out in the single figure table for Executive Directors on page 132, translated into sterling using the average exchange rate over 2023 (£1 = €1.1494). Year 25th percentile Median percentile 75th percentile Mean pay ratio Year ended 31 December 2023 Salary: £40,968 £49,224 £67,565 Pay and benefits: £52,551 £65,305 £103,527 Pay ratio (Option A): 100:1 81:1 51:1 66:1 Year ended 31 December 2022 Salary: £36,802 £44,478 £60,788 Pay and benefits: £49,868 £61,553 £93,612 Pay ratio (Option A): 92:1 75:1 49:1 63:1 Year ended 31 December 2021 Salary: £34,560 £42,668 £58,869 Pay and benefits: £48,229 £60,306 £90,335 Pay ratio (Option A): 87:1 70:1 47:1 63:1 Year ended 31 December 2020 Salary: £34,298 £41,010 £55,000 Pay and benefits: £45,713 £55,751 £80,670 Pay ratio (Option A): 67:1 55:1 38:1 50:1 Year ended 31 December 2019 Salary: £38,510 £45,154 £59,988 Pay and benefits: £50,689 £61,086 £87,982 Pay ratio (Option A): 83:1 69:1 48:1 51:1 Option A was used to calculate the pay and benefits of the 25th percentile, median and 75th percentile UK employees because the data was readily available for all UK employees of the Group and Option A is the most accurate method (as it is based on total full-time equivalent total reward for all UK employees for the relevant financial year). Figures are calculated by reference to 31 December 2023 (full-time equivalent), and the respective salary and pay and benefits figures for each quartile are set out in the table above. Benefits for UK employees include any pension, but pension is excluded for Executive Directors as they are not entitled to pension benefits under the Remuneration Policy. The data disclosed excludes employees who are not integrated into Unilever’s global reward structure and human resources information system. Variable pay figures for the UK employees are calculated on the basis set out in the paragraph for other work levels below the ‘CEO/CFO pay ratio comparison’ table on page 149. The reason for this is it would be unduly onerous to recalculate these figures when, based on a sample, the impact of such recalculation is expected to be minimal. The mean pay ratio has slightly increased in 2023 due to a higher fixed pay on the appointment of Hein Schumacher as CEO from 1 July 2023. Also, fixed pay and annual bonus for Alan Jope and Hein Schumacher are both counted for June 2023. Benefit costs increased for CEO due to the inclusion of Hein Schumacher's relocation. The annual bonus outcome was higher in 2023 than 2022 and variable pay makes up a higher proportion of remuneration for the CEO compared to other employees. The pay, reward and progression policies within Unilever are consistent as the Remuneration Policy is applicable across our 15,000+ managers throughout the whole business worldwide. We are also required to show additional disclosures on the rates of change in pay year-on-year. The pay ratios set out above are more meaningful as they compare to the pay of all of our UK employees. By contrast, the regulations require us to show the percentages below based on employees of our PLC top company only, which forms a relatively small and unrepresentative proportion of our total UK workforce. So, whilst operationally we may pay greater attention to our internal pay ratios (included above in the ‘CEO/CFO pay ratio comparison’ table on page 149), these required figures are set out on page 151. STRATEGIC REPORT CORPORATE GOVERNANCE FINANCIAL STATEMENTS Directors' Remuneration Report 150 Unilever Annual Report on Form 20-F 2023
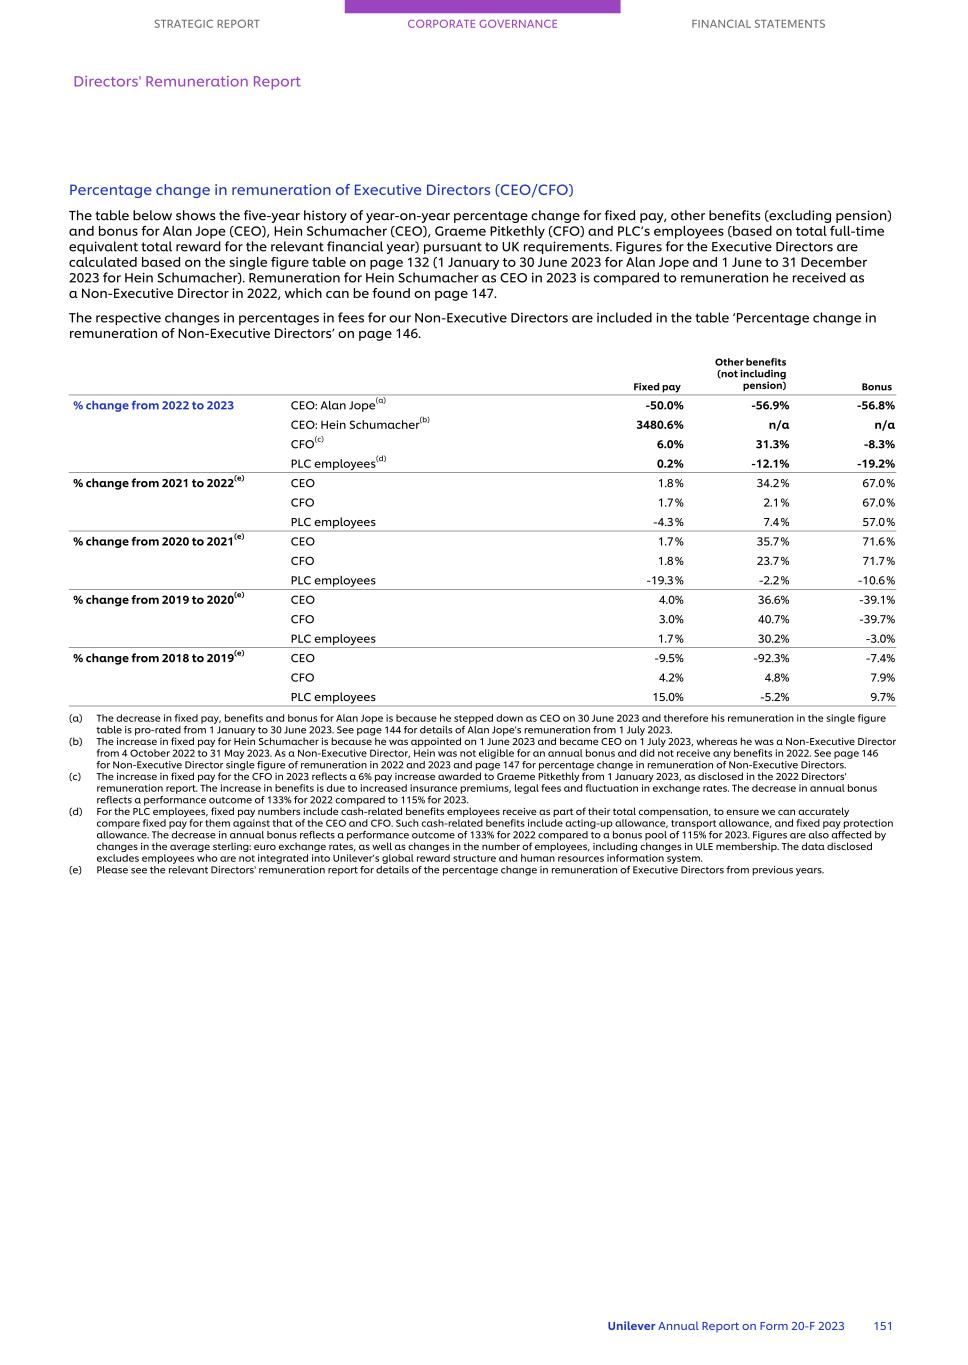
Percentage change in remuneration of Executive Directors (CEO/CFO) The table below shows the five-year history of year-on-year percentage change for fixed pay, other benefits (excluding pension) and bonus for Alan Jope (CEO), Hein Schumacher (CEO), Graeme Pitkethly (CFO) and PLC’s employees (based on total full-time equivalent total reward for the relevant financial year) pursuant to UK requirements. Figures for the Executive Directors are calculated based on the single figure table on page 132 (1 January to 30 June 2023 for Alan Jope and 1 June to 31 December 2023 for Hein Schumacher). Remuneration for Hein Schumacher as CEO in 2023 is compared to remuneration he received as a Non-Executive Director in 2022, which can be found on page 147. The respective changes in percentages in fees for our Non-Executive Directors are included in the table ‘Percentage change in remuneration of Non-Executive Directors’ on page 146. Fixed pay Other benefits (not including pension) Bonus % change from 2022 to 2023 CEO: Alan Jope(a) -50.0 % -56.9 % -56.8 % CEO: Hein Schumacher(b) 3480.6 % n/a n/a CFO(c) 6.0 % 31.3 % -8.3 % PLC employees(d) 0.2 % -12.1 % -19.2 % % change from 2021 to 2022(e) CEO 1.8 % 34.2 % 67.0 % CFO 1.7 % 2.1 % 67.0 % PLC employees -4.3 % 7.4 % 57.0 % % change from 2020 to 2021(e) CEO 1.7 % 35.7 % 71.6 % CFO 1.8 % 23.7 % 71.7 % PLC employees -19.3 % -2.2 % -10.6 % % change from 2019 to 2020(e) CEO 4.0% 36.6% -39.1% CFO 3.0% 40.7% -39.7% PLC employees 1.7 % 30.2% -3.0% % change from 2018 to 2019(e) CEO -9.5% -92.3% -7.4% CFO 4.2% 4.8% 7.9% PLC employees 15.0% -5.2% 9.7% (a) The decrease in fixed pay, benefits and bonus for Alan Jope is because he stepped down as CEO on 30 June 2023 and therefore his remuneration in the single figure table is pro-rated from 1 January to 30 June 2023. See page 144 for details of Alan Jope's remuneration from 1 July 2023. (b) The increase in fixed pay for Hein Schumacher is because he was appointed on 1 June 2023 and became CEO on 1 July 2023, whereas he was a Non-Executive Director from 4 October 2022 to 31 May 2023. As a Non-Executive Director, Hein was not eligible for an annual bonus and did not receive any benefits in 2022. See page 146 for Non-Executive Director single figure of remuneration in 2022 and 2023 and page 147 for percentage change in remuneration of Non-Executive Directors. (c) The increase in fixed pay for the CFO in 2023 reflects a 6% pay increase awarded to Graeme Pitkethly from 1 January 2023, as disclosed in the 2022 Directors' remuneration report. The increase in benefits is due to increased insurance premiums, legal fees and fluctuation in exchange rates. The decrease in annual bonus reflects a performance outcome of 133% for 2022 compared to 115% for 2023. (d) For the PLC employees, fixed pay numbers include cash-related benefits employees receive as part of their total compensation, to ensure we can accurately compare fixed pay for them against that of the CEO and CFO. Such cash-related benefits include acting-up allowance, transport allowance, and fixed pay protection allowance. The decrease in annual bonus reflects a performance outcome of 133% for 2022 compared to a bonus pool of 115% for 2023. Figures are also affected by changes in the average sterling: euro exchange rates, as well as changes in the number of employees, including changes in ULE membership. The data disclosed excludes employees who are not integrated into Unilever’s global reward structure and human resources information system. (e) Please see the relevant Directors' remuneration report for details of the percentage change in remuneration of Executive Directors from previous years. STRATEGIC REPORT CORPORATE GOVERNANCE FINANCIAL STATEMENTS Directors' Remuneration Report Unilever Annual Report on Form 20-F 2023 151
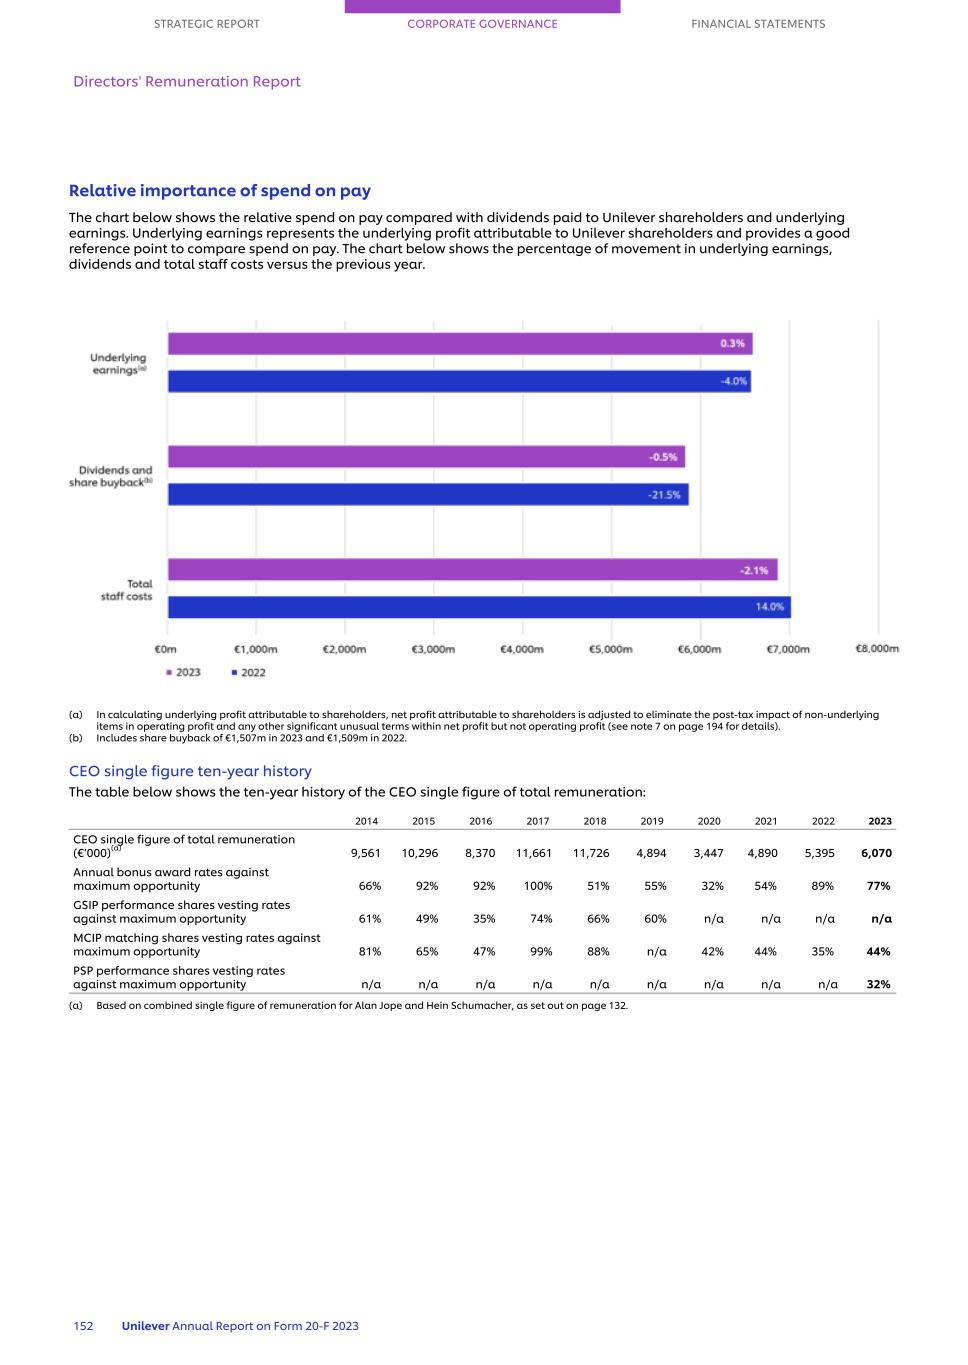
Relative importance of spend on pay The chart below shows the relative spend on pay compared with dividends paid to Unilever shareholders and underlying earnings. Underlying earnings represents the underlying profit attributable to Unilever shareholders and provides a good reference point to compare spend on pay. The chart below shows the percentage of movement in underlying earnings, dividends and total staff costs versus the previous year. (a) In calculating underlying profit attributable to shareholders, net profit attributable to shareholders is adjusted to eliminate the post-tax impact of non-underlying items in operating profit and any other significant unusual terms within net profit but not operating profit (see note 7 on page 194 for details). (b) Includes share buyback of €1,507m in 2023 and €1,509m in 2022. CEO single figure ten-year history The table below shows the ten-year history of the CEO single figure of total remuneration: 2014 2015 2016 2017 2018 2019 2020 2021 2022 2023 CEO single figure of total remuneration (€‘000)(a) 9,561 10,296 8,370 11,661 11,726 4,894 3,447 4,890 5,395 6,070 Annual bonus award rates against maximum opportunity 66% 92% 92% 100% 51% 55% 32% 54% 89% 77% GSIP performance shares vesting rates against maximum opportunity 61% 49% 35% 74% 66% 60% n/a n/a n/a n/a MCIP matching shares vesting rates against maximum opportunity 81% 65% 47% 99% 88% n/a 42% 44% 35% 44% PSP performance shares vesting rates against maximum opportunity n/a n/a n/a n/a n/a n/a n/a n/a n/a 32% (a) Based on combined single figure of remuneration for Alan Jope and Hein Schumacher, as set out on page 132. STRATEGIC REPORT CORPORATE GOVERNANCE FINANCIAL STATEMENTS Directors' Remuneration Report 152 Unilever Annual Report on Form 20-F 2023
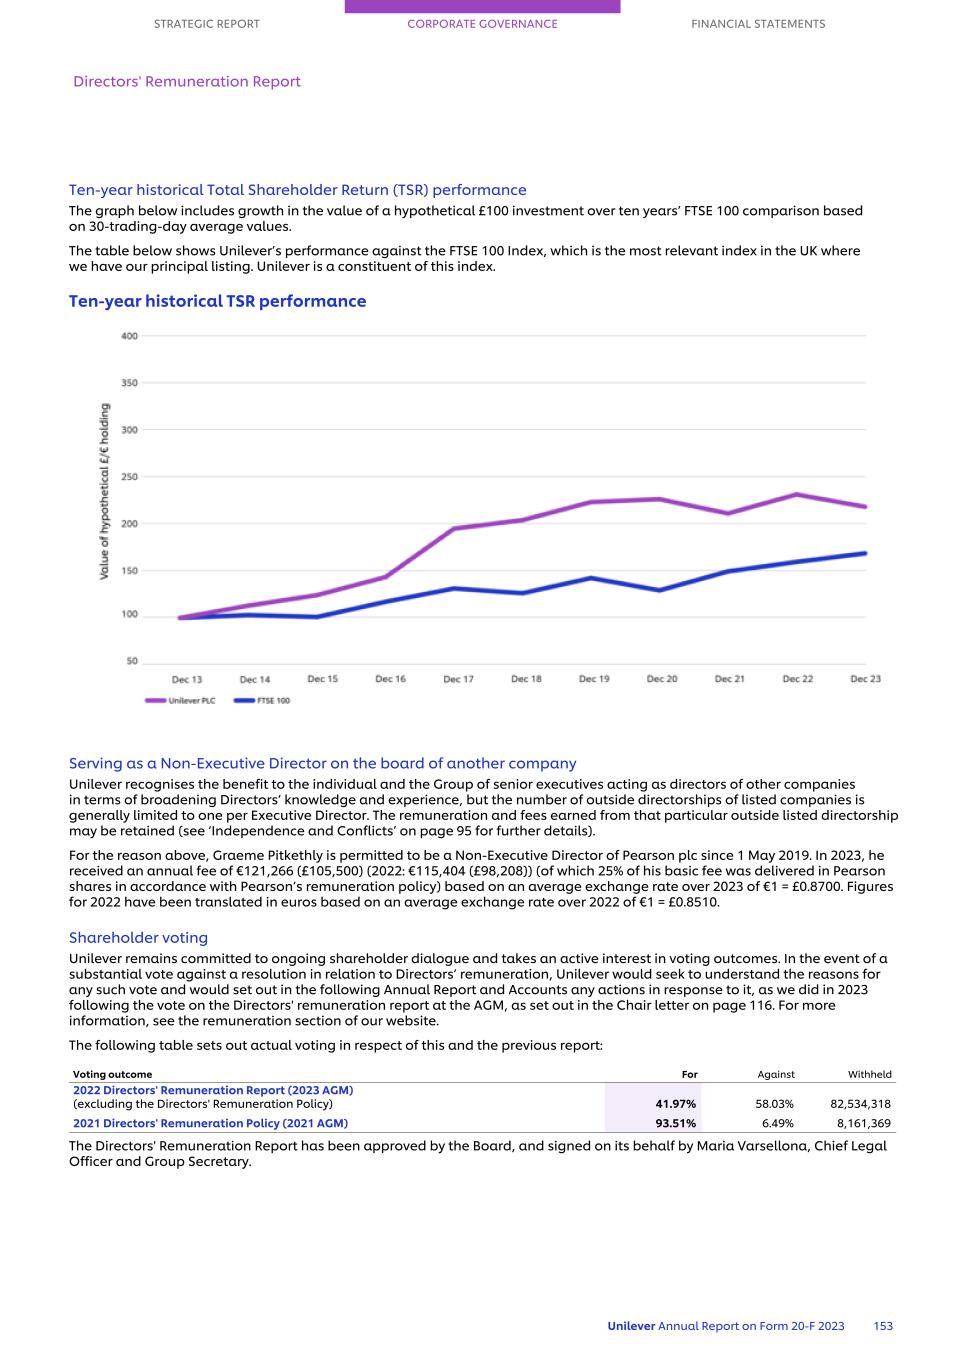
Ten-year historical Total Shareholder Return (TSR) performance The graph below includes growth in the value of a hypothetical £100 investment over ten years’ FTSE 100 comparison based on 30-trading-day average values. The table below shows Unilever’s performance against the FTSE 100 Index, which is the most relevant index in the UK where we have our principal listing. Unilever is a constituent of this index. Ten-year historical TSR performance Serving as a Non-Executive Director on the board of another company Unilever recognises the benefit to the individual and the Group of senior executives acting as directors of other companies in terms of broadening Directors’ knowledge and experience, but the number of outside directorships of listed companies is generally limited to one per Executive Director. The remuneration and fees earned from that particular outside listed directorship may be retained (see ‘Independence and Conflicts’ on page 95 for further details). For the reason above, Graeme Pitkethly is permitted to be a Non-Executive Director of Pearson plc since 1 May 2019. In 2023, he received an annual fee of €121,266 (£105,500) (2022: €115,404 (£98,208)) (of which 25% of his basic fee was delivered in Pearson shares in accordance with Pearson’s remuneration policy) based on an average exchange rate over 2023 of €1 = £0.8700. Figures for 2022 have been translated in euros based on an average exchange rate over 2022 of €1 = £0.8510. Shareholder voting Unilever remains committed to ongoing shareholder dialogue and takes an active interest in voting outcomes. In the event of a substantial vote against a resolution in relation to Directors’ remuneration, Unilever would seek to understand the reasons for any such vote and would set out in the following Annual Report and Accounts any actions in response to it, as we did in 2023 following the vote on the Directors' remuneration report at the AGM, as set out in the Chair letter on page 116. For more information, see the remuneration section of our website. The following table sets out actual voting in respect of this and the previous report: Voting outcome For Against Withheld 2022 Directors' Remuneration Report (2023 AGM) (excluding the Directors' Remuneration Policy) 41.97% 58.03% 82,534,318 2021 Directors' Remuneration Policy (2021 AGM) 93.51% 6.49% 8,161,369 The Directors' Remuneration Report has been approved by the Board, and signed on its behalf by Maria Varsellona, Chief Legal Officer and Group Secretary. STRATEGIC REPORT CORPORATE GOVERNANCE FINANCIAL STATEMENTS Directors' Remuneration Report Unilever Annual Report on Form 20-F 2023 153

154 Unilever Annual Report on Form 20-F 2023
Financial Statements 156 Statement of Directors’ Responsibilities 157 Report of Independent Registered Public Accounting Firm 173 Consolidated Financial Statements Unilever Group 176 Notes to the Consolidated Financial Statements 227 Company Accounts Unilever PLC 230 Notes to the Company Accounts Unilever PLC 234 Group Companies 245 Shareholder information – Financial calendar 246 Additional Information for US Listing Purposes Unilever Annual Report on Form 20-F 2023 155
| | | | | | | | |
| | |
| STRATEGIC REPORT | CORPORATE GOVERNANCE | FINANCIAL STATEMENTS |
| | | | | | | | |
| Statement of Directors' responsibilities |
Annual accounts
The Directors are responsible for preparing the Annual Report and Accounts in accordance with applicable law and regulations. The Directors are also required by the UK Companies Act 2006 to prepare accounts for each financial year which give a true and fair view of the state of affairs of the Unilever Group and PLC as at the end of the financial year and of the profit or loss and cash flows for that year.
The Directors consider that, in preparing the accounts, the Group and PLC have used the most appropriate accounting policies, consistently applied and supported by reasonable and prudent judgements and estimates, and that all international financial reporting standards (IFRS) as issued by the International Accounting Standards Board (IASB), and UK-adopted international accounting standards, which they consider to be applicable have been followed. In accordance with Disclosure Guidance and Transparency Rule (“DTR”) 4.1.16R, the financial statements will form part of the annual financial report prepared under Disclosure Guidance and Transparency Rule (“DTR”) 4.1.17R and 4.1.18R. The auditor's report on these financial statements provides no assurance over whether the annual financial report has been prepared in accordance with those requirements. The Directors are also responsible for preparing the Annual Report and Accounts including the consolidated financial statements in the European single electronic format in accordance with the requirements as set out in Commission Delegated Regulation (EU) 2019/815 with regard to regulatory technical standards on the specification of a single electronic reporting format.
The Directors have responsibility for ensuring that PLC keep accounting records which disclose with reasonable accuracy their financial position and which enable the Directors to ensure that the accounts comply with all relevant legislation. They are also responsible for such internal control as they determine is necessary to enable the preparation of financial statements that are free from material misstatement, whether due to fraud or error, and have a general responsibility for taking such steps as are reasonably open to them to safeguard the assets of the Group, and to prevent and detect fraud and other irregularities.
This statement, which should be read in conjunction with the Report of Independent Registered Public Accounting Firm, is made with a view to distinguishing for shareholders the respective responsibilities of the Directors and of the auditors in relation to the accounts.
A copy of the financial statements of the Unilever Group is placed on our website at www.unilever.com/investorrelations. The maintenance and integrity of the website are the responsibility of the Directors, and the work carried out by the auditors does not involve consideration of these matters. Accordingly, the auditors accept no responsibility for any changes that may have occurred to the financial statements since they were initially placed on the website. Legislation in the UK and the Netherlands governing the preparation and dissemination of financial statements may differ from legislation in other jurisdictions.
Independent auditors and disclosure of information to auditors
UK law sets out additional responsibilities for the Directors of PLC regarding disclosure of information to auditors. To the best of each of the Directors’ knowledge and belief, and having made appropriate enquiries, all information relevant to enabling the auditors to provide their opinions on PLC’s consolidated and parent company accounts has been provided. Each of the Directors has taken all reasonable steps to ensure their awareness of any relevant audit information and to establish that Unilever PLC’s auditors are aware of any such information.
Directors’ responsibility statement
Under company law the directors must not approve the financial statements unless they are satisfied that they give a true and fair view of the state of affairs of the Group and parent Company and of the Group’s profit or loss for that period.
Under applicable law and regulations, the directors are also responsible for preparing a Strategic Report, Directors’ Report, Directors’ Remuneration Report and Corporate Governance Statement that complies with that law and those regulations.
Each of the Directors confirms that, to the best of his or her knowledge:
■The Unilever Annual Report on Form 20-F 2023, taken as a whole, is fair, balanced and understandable, and provides the information necessary for shareholders to assess the Company’s position and performance, business model and strategy;
■The financial statements which have been prepared in accordance with international financial reporting standards (IFRS) as issued by the International Accounting Standards Board (IASB), and UK-adopted international accounting standards give a true and fair view of the assets, liabilities, financial position and profit or loss of the Company and the undertakings included in the consolidation taken as a whole; and
■The Management Report includes a fair review of the development and performance of the business and the position of PLC and the undertakings included in the consolidation taken as a whole, together with a description of the principal risks and uncertainties that they face.
The Directors and their roles are listed on pages 84 to 85.
Going concern
The activities of the Group, together with the factors likely to affect its future development, performance, the financial position of the Group, its cash flows, liquidity position and borrowing facilities are described on pages 1 to 64. In addition, we describe in notes 15 to 18 on pages 203 to 218 the Group’s objectives, policies and processes for managing its capital; its financial risk management objectives; details of its financial instruments and hedging activities, and its exposures to credit and liquidity risk. Although not assessed over the same period as going concern, the viability of the Group has been assessed on page 79. The Group has considerable financial resources together with established business relationships with many customers and suppliers in countries throughout the world. As a consequence, the Directors believe that the Group is well placed to manage its business risks successfully for at least 12 months from the date of approval of the financial statements.
After making enquiries, the Directors consider it appropriate to adopt the going concern basis of accounting in preparing this Annual Report and Accounts.
Internal and disclosure controls and procedures
Please refer to pages 71 to 78 for a discussion of Unilever’s principal risk factors and to pages 70 to 79 for commentary on the Group’s approach to risk management and control.
| | | | | |
| 156 | Unilever Annual Report on Form 20-F 2023 |
| | | | | | | | |
| | |
| STRATEGIC REPORT | CORPORATE GOVERNANCE | FINANCIAL STATEMENTS |
| | | | | | | | |
Report of Independent Registered Public Accounting Firm |
To the Shareholders and Board of Directors
Unilever PLC:
Opinions on the Consolidated Financial Statements and Internal Control Over Financial Reporting
We have audited the accompanying consolidated balance sheet of Unilever PLC and subsidiaries (the Company) as of December 31, 2023 and 2022, the related consolidated income statement, consolidated statement of comprehensive income, consolidated statement of changes in equity, and consolidated cash flow statement for each of the years in the three-year period ended December 31, 2023, and the related notes (collectively, the consolidated financial statements). We also have audited the Company’s internal control over financial reporting as of December 31, 2023, based on criteria established in Internal Control – Integrated Framework (2013) issued by the Committee of Sponsoring Organizations of the Treadway Commission.
In our opinion, the consolidated financial statements referred to above present fairly, in all material respects, the financial position of the Company as of December 31, 2023 and 2022, and the results of its operations and its cash flows for each of the years in the three-year period ended December 31, 2023, in conformity with International Financial Reporting Standards (IFRS) as issued by the International Accounting Standards Board. Also in our opinion, the Company maintained, in all material respects, effective internal control over financial reporting as of December 31, 2023 based on criteria established in Internal Control – Integrated Framework (2013) issued by the Committee of Sponsoring Organizations of the Treadway Commission.
The Company acquired Zywie Ventures Private Limited (“OZiva”) and Yasso Holdings, Inc. ("Yasso") during 2023, and management excluded from its assessment of the effectiveness of the Company’s internal control over financial reporting as of December 31, 2023, OZiva’s and Yasso's internal control over financial reporting associated with 1.09% of total assets and 0.14% of total turnover included in the consolidated financial statements of the Company as of and for the year ended December 31, 2023. Our audit of internal control over financial reporting of the Company also excluded an evaluation of the internal control over financial reporting of OZiva and Yasso.
Basis for Opinions
The Company’s management is responsible for these consolidated financial statements, for maintaining effective internal control over financial reporting, and for its assessment of the effectiveness of internal control over financial reporting, included in the accompanying Management’s report on internal control over financial reporting. Our responsibility is to express an opinion on the Company’s consolidated financial statements and an opinion on the Company’s internal control over financial reporting based on our audits. We are a public accounting firm registered with the Public Company Accounting Oversight Board (United States) (PCAOB) and are required to be independent with respect to the Company in accordance with the U.S. federal securities laws and the applicable rules and regulations of the Securities and Exchange Commission and the PCAOB.
We conducted our audits in accordance with the standards of the PCAOB. Those standards require that we plan and perform the audits to obtain reasonable assurance about whether the consolidated financial statements are free of material misstatement, whether due to error or fraud, and whether
effective internal control over financial reporting was maintained in all material respects.
Our audits of the consolidated financial statements included performing procedures to assess the risks of material misstatement of the consolidated financial statements, whether due to error or fraud, and performing procedures that respond to those risks. Such procedures included examining, on a test basis, evidence regarding the amounts and disclosures in the consolidated financial statements. Our audits also included evaluating the accounting principles used and significant estimates made by management, as well as evaluating the overall presentation of the consolidated financial statements. Our audit of internal control over financial reporting included obtaining an understanding of internal control over financial reporting, assessing the risk that a material weakness exists, and testing and evaluating the design and operating effectiveness of internal control based on the assessed risk. Our audits also included performing such other procedures as we considered necessary in the circumstances. We believe that our audits provide a reasonable basis for our opinions.
Definition and Limitations of Internal Control Over Financial Reporting
A company’s internal control over financial reporting is a process designed to provide reasonable assurance regarding the reliability of financial reporting and the preparation of financial statements for external purposes in accordance with generally accepted accounting principles. A company’s internal control over financial reporting includes those policies and procedures that (1) pertain to the maintenance of records that, in reasonable detail, accurately and fairly reflect the transactions and dispositions of the assets of the company; (2) provide reasonable assurance that transactions are recorded as necessary to permit preparation of financial statements in accordance with generally accepted accounting principles, and that receipts and expenditures of the company are being made only in accordance with authorizations of management and directors of the company; and (3) provide reasonable assurance regarding prevention or timely detection of unauthorized acquisition, use, or disposition of the company’s assets that could have a material effect on the financial statements.
Because of its inherent limitations, internal control over financial reporting may not prevent or detect misstatements. Also, projections of any evaluation of effectiveness to future periods are subject to the risk that controls may become inadequate because of changes in conditions, or that the degree of compliance with the policies or procedures may deteriorate.
Critical Audit Matter
The critical audit matter communicated below is a matter arising from the current period audit of the consolidated financial statements that was communicated or required to be communicated to the audit committee and that: (1) relates to accounts or disclosures that are material to the consolidated financial statements and (2) involved our especially challenging, subjective, or complex judgments. The communication of a critical audit matter does not alter in any way our opinion on the consolidated financial statements, taken as a whole, and we are not, by communicating the critical audit matter below, providing a separate opinion on the critical audit matter or on the accounts or disclosures to which it relates.
Indirect tax contingent liabilities in Brazil related to a 2001 corporate reorganisation
| | | | | | | | |
Unilever Annual Report on Form 20-F 2023 | 157 |
| | | | | | | | |
| | |
| STRATEGIC REPORT | CORPORATE GOVERNANCE | FINANCIAL STATEMENTS |
| | |
Report of Independent Registered Public Accounting Firm |
As discussed in note 20 to the consolidated financial statements, there are contingent liabilities reported for indirect taxes relating to disputes with the Brazilian authorities related to a 2001 corporate reorganisation. The total amount of the tax assessments received in respect of this matter is €3,757 million as of 31 December 2023. There also remains the possibility of further material tax assessments related to the same matter for periods not yet assessed.
We identified the evaluation of the indirect tax contingent liabilities in Brazil related to a 2001 corporate reorganisation as a critical audit matter. In Brazil, there is a high degree of complexity involved in the local indirect tax regimes (both state and federal) and jurisprudence. Due to these complexities, there is a high degree of judgement applied by the Company with respect to the uncertainty of the outcome of this matter. Complex auditor judgement and specialised skills were required in evaluating the possible future outcomes of investigations by the authorities for assessments received to ascertain if a liability exists, and in evaluating if the exposure of possible material tax assessments related to the same matter for periods not yet assessed can be estimated.
The following are the primary procedures we performed to address this critical audit matter:
■We evaluated the design and tested the operating effectiveness of certain internal controls related to the indirect tax process including controls related to the assessment of the outcome of investigations if a liability exists and around evaluating exposure to possible material tax assessments for periods not yet assessed.
■We involved local indirect tax professionals with specialised skills and knowledge who assisted in:
■assessing the appropriateness of the classification as contingent liabilities compared to the nature of the exposures, applicable regulations, and related correspondence with the tax authorities; and
■assessing the confirmations received from the Company’s external lawyers, considering any impact of legal precedent, case law and any historical and recent judgements passed by the court authorities which could impact likelihood of outflow of economic resources.
■We inspected assessments received from tax authorities and compared their consistency, occurrence and amounts retrospectively over time to previous management estimates made in the periods this matter was not yet assessed.
/s/ KPMG LLP
We have served as the Company’s auditor since 2014.
London, United Kingdom
March 7, 2024
| | | | | |
158 | Unilever Annual Report on Form 20-F 2023 |
| | | | | | | | |
| | |
| STRATEGIC REPORT | CORPORATE GOVERNANCE | FINANCIAL STATEMENTS |
| | |
Report of Independent Registered Public Accounting Firm |
THIS PAGE IS INTENTIONALLY LEFT BLANK
| | | | | | | | |
Unilever Annual Report on Form 20-F 2023 | 159 |
| | | | | | | | |
| | |
| STRATEGIC REPORT | CORPORATE GOVERNANCE | FINANCIAL STATEMENTS |
| | |
Report of Independent Registered Public Accounting Firm |
THIS PAGE IS INTENTIONALLY LEFT BLANK
| | | | | |
160 | Unilever Annual Report on Form 20-F 2023 |
| | | | | | | | |
| | |
| STRATEGIC REPORT | CORPORATE GOVERNANCE | FINANCIAL STATEMENTS |
| | |
Report of Independent Registered Public Accounting Firm |
THIS PAGE IS INTENTIONALLY LEFT BLANK
| | | | | | | | |
Unilever Annual Report on Form 20-F 2023 | 161 |
| | | | | | | | |
| | |
| STRATEGIC REPORT | CORPORATE GOVERNANCE | FINANCIAL STATEMENTS |
| | |
Report of Independent Registered Public Accounting Firm |
THIS PAGE IS INTENTIONALLY LEFT BLANK
| | | | | |
162 | Unilever Annual Report on Form 20-F 2023 |
| | | | | | | | |
| | |
| STRATEGIC REPORT | CORPORATE GOVERNANCE | FINANCIAL STATEMENTS |
| | |
Report of Independent Registered Public Accounting Firm |
THIS PAGE IS INTENTIONALLY LEFT BLANK
| | | | | | | | |
Unilever Annual Report on Form 20-F 2023 | 163 |
| | | | | | | | |
| | |
| STRATEGIC REPORT | CORPORATE GOVERNANCE | FINANCIAL STATEMENTS |
| | |
Report of Independent Registered Public Accounting Firm |
THIS PAGE IS INTENTIONALLY LEFT BLANK
| | | | | |
164 | Unilever Annual Report on Form 20-F 2023 |
| | | | | | | | |
| | |
| STRATEGIC REPORT | CORPORATE GOVERNANCE | FINANCIAL STATEMENTS |
| | |
Report of Independent Registered Public Accounting Firm |
THIS PAGE IS INTENTIONALLY LEFT BLANK
| | | | | | | | |
Unilever Annual Report on Form 20-F 2023 | 165 |
| | | | | | | | |
| | |
| STRATEGIC REPORT | CORPORATE GOVERNANCE | FINANCIAL STATEMENTS |
| | |
Report of Independent Registered Public Accounting Firm |
THIS PAGE IS INTENTIONALLY LEFT BLANK
| | | | | |
166 | Unilever Annual Report on Form 20-F 2023 |
| | | | | | | | |
| | |
| STRATEGIC REPORT | CORPORATE GOVERNANCE | FINANCIAL STATEMENTS |
| | |
Report of Independent Registered Public Accounting Firm |
THIS PAGE IS INTENTIONALLY LEFT BLANK
| | | | | | | | |
Unilever Annual Report on Form 20-F 2023 | 167 |
| | | | | | | | |
| | |
| STRATEGIC REPORT | CORPORATE GOVERNANCE | FINANCIAL STATEMENTS |
| | |
Report of Independent Registered Public Accounting Firm |
THIS PAGE IS INTENTIONALLY LEFT BLANK
| | | | | |
168 | Unilever Annual Report on Form 20-F 2023 |
| | | | | | | | |
| | |
| STRATEGIC REPORT | CORPORATE GOVERNANCE | FINANCIAL STATEMENTS |
| | |
Report of Independent Registered Public Accounting Firm |
THIS PAGE IS INTENTIONALLY LEFT BLANK
| | | | | | | | |
Unilever Annual Report on Form 20-F 2023 | 169 |
| | | | | | | | |
| | |
| STRATEGIC REPORT | CORPORATE GOVERNANCE | FINANCIAL STATEMENTS |
| | |
Report of Independent Registered Public Accounting Firm |
THIS PAGE IS INTENTIONALLY LEFT BLANK
| | | | | |
170 | Unilever Annual Report on Form 20-F 2023 |
| | | | | | | | |
| | |
| STRATEGIC REPORT | CORPORATE GOVERNANCE | FINANCIAL STATEMENTS |
| | |
Report of Independent Registered Public Accounting Firm |
THIS PAGE IS INTENTIONALLY LEFT BLANK
| | | | | | | | |
Unilever Annual Report on Form 20-F 2023 | 171 |
| | | | | | | | |
| | |
| STRATEGIC REPORT | CORPORATE GOVERNANCE | FINANCIAL STATEMENTS |
| | |
Report of Independent Registered Public Accounting Firm |
THIS PAGE IS INTENTIONALLY LEFT BLANK
| | | | | |
172 | Unilever Annual Report on Form 20-F 2023 |
| | | | | | | | |
| | |
| STRATEGIC REPORT | CORPORATE GOVERNANCE | FINANCIAL STATEMENTS |
| | | | | | | | |
| Consolidated Financial Statements Unilever Group |
Consolidated income statement
for the year ended 31 December
| | | | | | | | | | | | | | |
| | € million | € million | € million |
| Notes | 2023 | 2022 | 2021 |
| Turnover | 2 | 59,604 | | 60,073 | | 52,444 | |
| Operating profit | 2 | 9,758 | | 10,755 | | 8,702 | |
| which includes: | | | | |
| Gain on disposal of ekaterra | 21 | – | | 2,303 | | – | |
| Gain on disposal of Suave | 21 | 497 | | – | | – | |
| Net finance costs | 5 | (486) | | (493) | | (354) | |
| Pensions and similar obligations | | 110 | | 44 | | (10) | |
| Finance income | | 442 | | 281 | | 147 | |
| Finance costs | | (1,038) | | (818) | | (491) | |
| Net monetary gain/(loss) arising from hyperinflationary economies | 1 | (142) | | (157) | | (74) | |
| Share of net profit/(loss) of joint ventures and associates | 11 | 231 | | 208 | | 191 | |
| Other income/(loss) from non-current investments and associates | | (22) | | 24 | | 91 | |
| Profit before taxation | | 9,339 | | 10,337 | | 8,556 | |
| Taxation | 6A | (2,199) | | (2,068) | | (1,935) | |
| Net profit | | 7,140 | | 8,269 | | 6,621 | |
| Attributable to: | | | | |
| Non-controlling interests | | 653 | | 627 | | 572 | |
| Shareholders’ equity | | 6,487 | | 7,642 | | 6,049 | |
| Earnings per share | 7 | | | |
| Basic earnings per share (€) | | 2.58 | | 3.00 | | 2.33 | |
| Diluted earnings per share (€) | | 2.56 | | 2.99 | | 2.32 | |
Consolidated statement of comprehensive income
for the year ended 31 December
| | | | | | | | | | | | | | |
| | € million | € million | € million |
| Notes | 2023 | 2022 | 2021 |
| Net profit | | 7,140 | | 8,269 | | 6,621 | |
| Other comprehensive income | 6C | | | |
| Items that will not be reclassified to profit or loss, net of tax: | | | | |
| Gains/(losses) on equity instruments measured at fair value through other comprehensive income | | (28) | | 36 | | 166 | |
| Remeasurement of defined benefit pension plans | 15B | (510) | | (473) | | 1,734 | |
| Items that may be reclassified subsequently to profit or loss, net of tax: | | | | |
| Gains/(losses) on cash flow hedges | | (27) | | (91) | | 279 | |
| Currency retranslation gains/(losses) | 15B | (1,461) | | 614 | | 1,177 | |
| Total comprehensive income | | 5,114 | | 8,355 | | 9,977 | |
| Attributable to: | | | | |
| Non-controlling interests | | 524 | | 507 | | 749 | |
| Shareholders’ equity | | 4,590 | | 7,848 | | 9,228 | |
Note references in the consolidated income statement, consolidated statement of comprehensive income, consolidated statement of changes in equity, consolidated balance sheet and consolidated cash flow statement relate to notes on pages 177 to 226 which form an integral part of the consolidated financial statements. | | | | | | | | |
Unilever Annual Report on Form 20-F 2023 | 173 |
| | | | | | | | |
| | |
| STRATEGIC REPORT | CORPORATE GOVERNANCE | FINANCIAL STATEMENTS |
| | |
Consolidated Financial Statements Unilever Group |
Consolidated statement of changes in equity
for the year ended 31 December
| | | | | | | | | | | | | | | | | | | | | | | | | | |
€ million
| Called
up share
capital | Share
premium
account | Unification
reserve | Other
reserves | Retained
profit | Total | Non-controlling
interests | Total
equity |
| 31 December 2020 | 92 | | 73,472 | | (73,364) | | (7,482) | | 22,548 | | 15,266 | | 2,389 | | 17,655 | |
| Profit or loss for the period | – | | – | | – | | – | | 6,049 | | 6,049 | | 572 | | 6,621 | |
| Other comprehensive income, net of tax: | | | | | | | | |
| Equity instruments gains/(losses) | – | | – | | – | | 147 | | – | | 147 | | 19 | | 166 | |
| Cash flow hedges gains/(losses) | – | | – | | – | | 276 | | – | | 276 | | 3 | | 279 | |
| Remeasurements of defined benefit pension plans | – | | – | | – | | – | | 1,728 | | 1,728 | | 6 | | 1,734 | |
| Currency retranslation gains/(losses) | – | | – | | – | | 1,025 | | 3 | | 1,028 | | 149 | | 1,177 | |
| Total comprehensive income | – | | – | | – | | 1,448 | | 7,780 | | 9,228 | | 749 | | 9,977 | |
| Dividends on ordinary capital | – | | – | | – | | – | | (4,458) | | (4,458) | | – | | (4,458) | |
| | | | | | | | |
| | | | | | | | |
| | | | | | | | |
| | | | | | | | |
Share capital reduction(a) | – | | (20,626) | | – | | – | | 20,626 | | – | | – | | – | |
Repurchase of shares(b) | – | | – | | – | | (3,018) | | – | | (3,018) | | – | | (3,018) | |
Movements in treasury shares(c) | – | | – | | – | | 95 | | (143) | | (48) | | – | | (48) | |
Share-based payment credit(d) | – | | – | | – | | – | | 161 | | 161 | | – | | 161 | |
| Dividends paid to non-controlling interests | – | | – | | – | | – | | – | | – | | (503) | | (503) | |
| | | | | | | | |
| Hedging gain/(loss) transferred to non-financial assets | – | | – | | – | | (171) | | – | | (171) | | (3) | | (174) | |
| | | | | | | | |
Other movements in equity(e) | – | | (2) | | – | | (82) | | 231 | | 147 | | 7 | | 154 | |
| 31 December 2021 | 92 | | 52,844 | | (73,364) | | (9,210) | | 46,745 | | 17,107 | | 2,639 | | 19,746 | |
| Hyperinflation restatement to 1 January 2022 | – | | – | | – | | – | | 154 | | 154 | | – | | 154 | |
| Adjusted opening balance | 92 | | 52,844 | | (73,364) | | (9,210) | | 46,899 | | 17,261 | | 2,639 | | 19,900 | |
| Profit or loss for the period | – | | – | | – | | – | | 7,642 | | 7,642 | | 627 | | 8,269 | |
| Other comprehensive income, net of tax: | | | | | | | | |
| Equity instruments gains/(losses) | – | | – | | – | | 45 | | – | | 45 | | (9) | | 36 | |
| Cash flow hedges gains/(losses) | – | | – | | – | | (92) | | – | | (92) | | 1 | | (91) | |
| Remeasurements of defined benefit pension plans | – | | – | | – | | – | | (474) | | (474) | | 1 | | (473) | |
Currency retranslation gains/(losses)(f) | – | | – | | – | | 240 | | 487 | | 727 | | (113) | | 614 | |
| Total comprehensive income | – | | – | | – | | 193 | | 7,655 | | 7,848 | | 507 | | 8,355 | |
| Dividends on ordinary capital | – | | – | | – | | – | | (4,356) | | (4,356) | | – | | (4,356) | |
| | | | | | | | |
| | | | | | | | |
Repurchase of shares(b) | – | | – | | – | | (1,509) | | – | | (1,509) | | – | | (1,509) | |
Movements in treasury shares(c) | – | | – | | – | | 106 | | (137) | | (31) | | – | | (31) | |
Share-based payment credit(d) | – | | – | | – | | – | | 177 | | 177 | | – | | 177 | |
| Dividends paid to non-controlling interests | – | | – | | – | | – | | – | | – | | (572) | | (572) | |
| Hedging gain/(loss) transferred to non-financial assets | – | | – | | – | | (126) | | – | | (126) | | (1) | | (127) | |
Other movements in equity(g) | – | | – | | – | | (258) | | 15 | | (243) | | 107 | | (136) | |
| 31 December 2022 | 92 | | 52,844 | | (73,364) | | (10,804) | | 50,253 | | 19,021 | | 2,680 | | 21,701 | |
| | | | | | | | |
| | | | | | | | |
| Profit or loss for the period | – | | – | | – | | – | | 6,487 | | 6,487 | | 653 | | 7,140 | |
| Other comprehensive income, net of tax: | | | | | | | | |
| Equity instruments gains/(losses) | – | | – | | – | | (27) | | – | | (27) | | (1) | | (28) | |
| Cash flow hedges gains/(losses) | – | | – | | – | | (27) | | – | | (27) | | – | | (27) | |
| Remeasurements of defined benefit pension plans | – | | – | | – | | – | | (508) | | (508) | | (2) | | (510) | |
Currency retranslation gains/(losses)(h) | – | | – | | – | | (1,629) | | 294 | | (1,335) | | (126) | | (1,461) | |
| Total comprehensive income | – | | – | | – | | (1,683) | | 6,273 | | 4,590 | | 524 | | 5,114 | |
| Dividends on ordinary capital | – | | – | | – | | – | | (4,327) | | (4,327) | | – | | (4,327) | |
Cancellation of treasury shares(i) | (4) | | – | | – | | 5,282 | | (5,278) | | – | | – | | – | |
Repurchase of shares(b) | – | | – | | – | | (1,507) | | – | | (1,507) | | – | | (1,507) | |
Movements in treasury shares(c) | – | | – | | – | | 75 | | (98) | | (23) | | – | | (23) | |
Share-based payment credit(d) | – | | – | | – | | – | | 212 | | 212 | | – | | 212 | |
| Dividends paid to non-controlling interests | – | | – | | – | | – | | – | | – | | (521) | | (521) | |
| | | | | | | | |
| Hedging gain/(loss) transferred to non-financial assets | – | | – | | – | | 117 | | – | | 117 | | – | | 117 | |
| Other movements in equity | – | | – | | – | | 2 | | 17 | | 19 | | (21) | | (2) | |
| 31 December 2023 | 88 | | 52,844 | | (73,364) | | (8,518) | | 47,052 | | 18,102 | | 2,662 | | 20,764 | |
| | | | | | | | |
| | | | | | | | |
(a)Share premium has been adjusted to reflect the legal share capital of the PLC company, which reduced by £18,400 million following court approval on 15 June 2021.
(b)Repurchase of shares reflects the cost of acquiring ordinary shares as part of the share buyback programme announced on 29 April 2021 and 10 February 2022.
(c)Includes purchases and sales of treasury shares, and transfer from treasury shares to retained profit of share-settled schemes arising from prior years and differences between exercise and grant price of share options.
(d)The share-based payment credit relates to the non-cash charge recorded against operating profit in respect of the fair value of share options and awards granted to employees.
(e)Includes a hyperinflation adjustment of €280 million and €82 million related to the Welly acquisition.
(f)Includes a hyperinflation adjustment of €514 million in relation to Argentina and Turkey.
(g)Includes the following items related to the acquisition of Nutrafol: €(269) million non-controlling interest purchase option in other reserves and €99 million non-controlling interest recognised on acquisition.
(h)Includes a hyperinflation adjustment of €308 million in relation to Argentina and Turkey.
(i)During 2023, 112,746,434 PLC ordinary shares held as treasury shares were cancelled. The amount paid to repurchase these shares was initially recognised in other reserves and is transferred to retained profit on cancellation.
| | | | | |
174 | Unilever Annual Report on Form 20-F 2023 |
| | | | | | | | |
| | |
| STRATEGIC REPORT | CORPORATE GOVERNANCE | FINANCIAL STATEMENTS |
| | |
Consolidated Financial Statements Unilever Group |
Consolidated balance sheet
for the year ended 31 December
| | | | | | | | | | | |
| | € million | € million |
| Notes | 2023 | 2022 |
Assets | | | |
| Non-current assets | | | |
| Goodwill | 9 | 21,109 | | 21,609 | |
| Intangible assets | 9 | 18,357 | | 18,880 | |
| Property, plant and equipment | 10 | 10,707 | | 10,770 | |
| Pension asset for funded schemes in surplus | 4B | 3,781 | | 4,260 | |
| Deferred tax assets | 6B | 1,113 | | 1,049 | |
| Financial assets | 17A | 1,386 | | 1,154 | |
| Other non-current assets | 11 | 911 | | 942 | |
| | 57,364 | | 58,664 | |
| Current assets | | | |
| Inventories | 12 | 5,119 | | 5,931 | |
| Trade and other current receivables | 13 | 5,775 | | 7,056 | |
| Current tax assets | | 427 | | 381 | |
| Cash and cash equivalents | 17A | 4,159 | | 4,326 | |
| Other financial assets | 17A | 1,731 | | 1,435 | |
| Assets held for sale | 22 | 691 | | 28 | |
| | 17,902 | | 19,157 | |
| Total assets | | 75,266 | | 77,821 | |
| Liabilities | | | |
| Current liabilities | | | |
| Financial liabilities | 15C | 5,087 | | 5,775 | |
| Trade payables and other current liabilities | 14 | 16,857 | | 18,023 | |
| Current tax liabilities | | 851 | | 877 | |
| Provisions | 19 | 537 | | 748 | |
| Liabilities held for sale | 22 | 175 | | 4 | |
| | 23,507 | | 25,427 | |
| Non-current liabilities | | | |
| Financial liabilities | 15C | 24,535 | | 23,713 | |
| Non-current tax liabilities | | 384 | | 94 | |
| Pensions and post-retirement healthcare liabilities: | | | |
| Funded schemes in deficit | 4B | 351 | | 613 | |
| Unfunded schemes | 4B | 1,029 | | 1,078 | |
| Provisions | 19 | 563 | | 550 | |
| Deferred tax liabilities | 6B | 3,995 | | 4,375 | |
| Other non-current liabilities | 14 | 138 | | 270 | |
| | 30,995 | | 30,693 | |
| Total liabilities | | 54,502 | | 56,120 | |
| | | |
| Equity | | | |
| Shareholders’ equity | | 18,102 | | 19,021 | |
| Non-controlling interests | | 2,662 | | 2,680 | |
| Total equity | | 20,764 | | 21,701 | |
| Total liabilities and equity | | 75,266 | | 77,821 | |
Note references in the consolidated income statement, consolidated statement of comprehensive income, consolidated statement of changes in equity, consolidated balance sheet and consolidated cash flow statement relate to notes on pages 177 to 226, which form an integral part of the consolidated financial statements.
These financial statements have been approved by the Directors and signed on their behalf by Fernando Fernandez.
F Fernandez on behalf of The Board of Directors
7 March 2024
| | | | | | | | |
Unilever Annual Report on Form 20-F 2023 | 175 |
| | | | | | | | |
| | |
| STRATEGIC REPORT | CORPORATE GOVERNANCE | FINANCIAL STATEMENTS |
| | |
Consolidated Financial Statements Unilever Group |
Consolidated cash flow statement
for the year ended 31 December
| | | | | | | | | | | | | | |
| | € million | € million | € million |
| Notes | 2023 | 2022 | 2021 |
| Net profit | | 7,140 | | 8,269 | | 6,621 | |
| Taxation | | 2,199 | | 2,068 | | 1,935 | |
| Share of net profit of joint ventures/associates and other income/(loss) from non-current investments | | (209) | | (232) | | (282) | |
| Net monetary (gain)/loss arising from hyperinflationary economies | | 142 | | 157 | | 74 | |
| Net finance costs | 5 | 486 | | 493 | | 354 | |
| Operating profit | | 9,758 | | 10,755 | | 8,702 | |
| Depreciation, amortisation and impairment | | 1,579 | | 1,946 | | 1,763 | |
| Changes in working capital: | | 814 | | (422) | | (47) | |
| Inventories | | 340 | | (1,398) | | (458) | |
| Trade and other receivables | | 768 | | (1,852) | | (307) | |
| Trade payables and other liabilities | | (294) | | 2,828 | | 718 | |
| Pensions and similar obligations less payments | | (281) | | (119) | | (183) | |
| Provisions less payments | | (185) | | 203 | | (61) | |
| Elimination of (profits)/losses on disposals | | (433) | | (2,335) | | 23 | |
| Non-cash charge for share-based compensation | | 212 | | 177 | | 161 | |
| Other adjustments | | 97 | | (116) | | (53) | |
| Cash flow from operating activities | | 11,561 | | 10,089 | | 10,305 | |
| Income tax paid | | (2,135) | | (2,807) | | (2,333) | |
| Net cash flow from operating activities | | 9,426 | | 7,282 | | 7,972 | |
| Interest received | | 267 | | 287 | | 148 | |
| Purchase of intangible assets | | (243) | | (253) | | (232) | |
| Purchase of property, plant and equipment | | (1,502) | | (1,456) | | (1,108) | |
| Disposal of property, plant and equipment | | 42 | | 82 | | 101 | |
| Acquisition of businesses and investments in joint ventures and associates | | (704) | | (979) | | (2,131) | |
| Disposal of businesses, joint ventures and associates | | 436 | | 4,622 | | 43 | |
| Acquisition of other non-current investments | | (533) | | (170) | | (142) | |
| Disposal of other non-current investments | | 62 | | 266 | | 137 | |
| Dividends from joint ventures, associates and other non-current investments | | 239 | | 185 | | 185 | |
| (Purchase)/sale of financial assets | | (358) | | (131) | | (247) | |
| Net cash flow (used in)/from investing activities | | (2,294) | | 2,453 | | (3,246) | |
| Dividends paid on ordinary share capital | | (4,363) | | (4,329) | | (4,483) | |
| Interest paid | | (899) | | (744) | | (488) | |
| Net change in short-term borrowings | | (570) | | (545) | | 656 | |
| Additional financial liabilities | | 4,972 | | 7,776 | | 4,748 | |
| Repayment of financial liabilities | | (3,905) | | (8,440) | | (3,550) | |
| Capital element of lease rental payments | | (394) | | (518) | | (464) | |
| Repurchase of shares | 24 | (1,507) | | (1,509) | | (3,018) | |
| | | | |
Other financing activities(a) | | (527) | | (581) | | (500) | |
| Net cash flow (used in)/from financing activities | | (7,193) | | (8,890) | | (7,099) | |
| Net increase/(decrease) in cash and cash equivalents | | (61) | | 845 | | (2,373) | |
| Cash and cash equivalents at the beginning of the year | | 4,225 | | 3,387 | | 5,475 | |
| Effect of foreign exchange rate changes | | (119) | | (7) | | 285 | |
| Cash and cash equivalents at the end of the year | 17A | 4,045 | | 4,225 | | 3,387 | |
(a)Other financing activities include cash paid for the purchase of non-controlling interests and dividends paid to minority interests.
The cash flows of pension funds (other than contributions and other direct payments made by the Group in respect of pensions and similar obligations) are not included in the Group cash flow statement.
| | | | | |
176 | Unilever Annual Report on Form 20-F 2023 |
| | | | | | | | |
| | |
| STRATEGIC REPORT | CORPORATE GOVERNANCE | FINANCIAL STATEMENTS |
| | | | | | | | |
| Notes to the Consolidated Financial Statements Unilever Group |
1. Accounting information and policies
Basis of consolidation
Group companies included in the consolidated financial statements for 2023 are PLC and all subsidiary undertakings, which are those entities controlled by PLC. Control exists when the Group has the power to direct the activities of an entity so as to affect the return on investment.
The net assets and results of acquired businesses are included in the consolidated financial statements from their respective dates of acquisition, being the date on which the Group obtains control.
The results of disposed businesses are included in the consolidated financial statements up to their date of disposal, being the date control ceases.
Intra-group transactions and balances are eliminated.
Company legislation and accounting standards
The consolidated financial statements have been prepared in accordance with international financial reporting standards (IFRS) as issued by the International Accounting Standards Board (IASB), and UK-adopted international accounting standards.
These financial statements are prepared under the historical cost convention unless otherwise indicated.
Going concern
These financial statements have been prepared on a going concern basis. The Group has considerable financial resources together with established business relationships with many customers and suppliers in countries throughout the world. The Directors also consider the Group's overall financial position, exposure to principal risks and future business forecasts. We describe in notes 15 to 18 on pages 203 to 218 the Group’s objectives, policies and processes for managing its capital; its financial risk management objectives; details of its financial instruments and hedging activities and its exposures to credit and liquidity risk. As a consequence, the Group is well placed to manage its business risks successfully for at least twelve months from the date of approval of the financial statements. Accounting policies
The accounting policies adopted are the same as those which were applied for the previous financial year except as set out below under the heading ‘Recent accounting developments’.
Accounting policies are included in the relevant notes to the consolidated financial statements. These are presented as text highlighted in grey on pages 177 to 226. The accounting policies below are applied throughout the financial statements. Foreign currencies
The consolidated financial statements are presented in euros. As at 31 December 2023, the functional currency of PLC was the pound sterling. Items included in the financial statements of individual group companies are recorded in their respective functional currency which is the currency of the primary economic environment in which each entity operates.
Foreign currency transactions in individual group companies are translated into functional currency using exchange rates at the date of the transaction. Foreign exchange gains and losses from settlement of these transactions, and from translation of monetary assets and liabilities at year-end exchange rates, are recognised in the income statement except when deferred in equity as qualifying hedges.
In preparing the consolidated financial statements, the balances in individual group companies are translated from their functional currency into euros. Apart from the financial statements of group companies in hyperinflationary economies (see below), the income statement, the cash flow statement and all other movements in assets and liabilities are translated at average rates of exchange as a proxy for the transaction rate, or at the transaction rate itself if more appropriate. Assets and liabilities are translated at year-end exchange rates.
The financial statements of group companies whose functional currency is the currency of a hyperinflationary economy are adjusted for inflation and then translated into euros using the balance sheet exchange rate. Amounts shown for prior years for comparative purposes are not modified. To determine the existence of hyperinflation, the Group assesses the qualitative and quantitative characteristics of the economic environment of the country, such as the cumulative inflation rate over the previous three years.
As at 31 December 2023, the ordinary share capital of PLC was translated to euro using the historical rate at the date the shares were issued (see note 15B on page 204). The effect of exchange rate changes during the year on net assets of foreign operations is recorded in equity. For this purpose, net assets include loans between group companies and any related foreign exchange contracts where settlement is neither planned nor likely to occur in the foreseeable future.
The Group applies hedge accounting to certain exchange differences arising between the functional currencies of a foreign operation and the functional currency of the parent entity, regardless of whether the net investment is held directly or through an intermediate parent. Differences arising on retranslation of a financial liability designated as a foreign currency net investment hedge are recorded in equity to the extent that the hedge is effective. These differences are reported within profit or loss to the extent that the hedge is ineffective.
Cumulative exchange differences arising since the date of transition to IFRS of 1 January 2004 are reported as a separate component of other reserves. In the event of disposal or part disposal of an interest in a group company either through sale or as a result of a repayment of capital, the cumulative exchange difference is recognised in the income statement as part of the profit or loss on disposal of group companies.
Hyperinflationary economies
The Argentinian economy was designated as hyperinflationary from 1 July 2018 and the Turkish economy was designated as hyperinflationary from 1 July 2022. As a result, application of IAS 29 ‘Financial Reporting in Hyperinflationary Economies’ has been applied to all Unilever entities whose functional currency is the Argentinian peso or the Turkish lira. The application of IAS 29 includes:
■adjustment of historical cost non-monetary assets and liabilities for the change in purchasing power caused by inflation from the date of initial recognition to the balance sheet date;
■adjustment of the income statement for inflation during the reporting period;
■translation of income statement at the period-end foreign exchange rate instead of an average rate; and
■adjustment of the income statement to reflect the impact of inflation and exchange rate movement on holding monetary assets and liabilities in local currency.
The main effects on the Group consolidated financial statements for 2023 are:
| | | | | | | | | | | |
| € million | Argentina | Turkey | Total |
| Total assets increase/(reduction) | (205) | | 8 | | (197) | |
| Turnover increase/(reduction) | (440) | | 12 | | (428) | |
| Operating profit increase/(reduction) | (112) | | (12) | | (124) | |
| Net monetary gain/(loss) | (203) | | 61 | | (142) | |
| | | | | | | | |
Unilever Annual Report on Form 20-F 2023 | 177 |
| | | | | | | | |
| | |
| STRATEGIC REPORT | CORPORATE GOVERNANCE | FINANCIAL STATEMENTS |
| | |
Notes to the Consolidated Financial Statements Unilever Group |
Climate change
In preparing these consolidated financial statements we have considered the impact of both physical and transition climate change risks as well as our plans to mitigate against those risks on the current valuation of our assets and liabilities. Where possible we have performed quantitative assessments of these risks and opportunities based on various scenarios for the years 2030, 2039 and 2050. These potential financial impacts are based on high-level quantitative assessments and do not include any assumptions on the impact of actions that we would undertake to mitigate against these climate-related risks. Therefore, these quantifications do not represent any type of financial forecast and thus are not directly incorporated into any projections of long-term cash flows.
To determine if there is a material impact on the financial reporting judgements and estimates as of the reporting period, we have reviewed each balance sheet line item and identified those line items that have the potential to be significantly impacted by climate-related risks and our plans to mitigate against these risks. Those line items that have the potential to be significantly impacted have then been reviewed in detail to confirm:
■that the growth rates and projected cash flows, used in assessing whether our goodwill and indefinite-life intangibles are impaired, are consistent with our climate-related risk assumptions and the actions we are taking to mitigate against those risks and
■that the useful lives of our property, plant and equipment are appropriate given the potential physical and obsolescence risks associated with climate change and the actions we are taking to mitigate against those risks.
In addition it should be noted that climate-related risks could affect the financial position of our defined benefit pension plan assets. The Trustees operate diversified investment strategies and are continuously assessing investment risks. The Trustees consider climate risk as one of the key investment risks and are continually evolving their investments to lower the overall climate risk.
Based on these reviews, we do not believe that there is a material impact on the financial reporting judgements and estimates arising from our considerations and as a result the valuations of our assets or liabilities have not been significantly impacted by these risks as at 31 December 2023. We have not identified any significant impact from climate-related risks on the Group’s going concern assessment nor the viability of the Group over the next three years.
For many years Unilever has placed sustainability at the centre of its strategy and has been working on becoming a more sustainable business. This has included implementing hundreds of actions to help mitigate and adapt against climate-related risks. The costs and benefits of such actions are embedded into the cost structures of the business and are not separately identifiable. None of these actions have significantly impacted the value of the Group's assets or their useful lives and whilst there is still much to do, our aim is to continue to reduce our exposure to climate-related risks without impacting the value of the Group’s assets. However we recognise that the climate emergency is deepening and government policies are likely to evolve as a result of commitments to limit global warning to 1.5°C and thus we will continue to carefully monitor potential implications on the valuations of our assets and liabilities that could arise in future years.
Critical accounting estimates and judgements
The preparation of financial statements requires management to make estimates and judgements in the application of accounting policies that affect the reported amounts of assets, liabilities, income and expenses. Actual results may differ from these estimates. Estimates and judgements are continuously evaluated and are based on historical experience and other factors, including expectations of future events that are believed to be reasonable. Revisions to accounting estimates are recognised in the period in which the estimate is revised and in any future period affected.
The following estimates are those that management believe have the most significant risk of causing a material adjustment to the carrying amounts of assets and liabilities within the next financial year:
■Measurement of defined benefit obligations – the valuations of the Group’s defined benefit pension plan obligations are dependent on a number of assumptions. These include discount rates, inflation, and life expectancy of scheme members. Details of these assumptions and sensitivities are in note 4B.
■Impairment risk in Russia – in 2023 the Russian business contributed approximately 1% of the Group's turnover and net profit, and as at 31 December 2023 had approximately €600 million of net assets. While the potential impacts of the war remain uncertain, there is a risk that the operations in Russia are unable to continue, leading to a loss of turnover, profit and a write-down of assets.
The following judgements are those that management believe have the most significant effect on the amounts recognised in the Group’s financial statements:
■Utilisation of tax losses and recognition of other deferred tax assets
– the Group operates in many countries and is subject to taxes in numerous jurisdictions. Management uses judgement to assess the recoverability of tax assets such as whether there will be sufficient future taxable profits to utilise losses – see note 6B.
■Likelihood of occurrence of provisions and contingent liabilities – events can occur where there is uncertainty over future obligations. Judgement is required to determine if an outflow of economic resources is probable, or possible but not probable. Where it is probable, a liability is recognised and further judgement is used to determine the level of the provision. Where it is possible but not probable, further judgement is used to determine if the likelihood is remote, in which case no disclosures are provided; if the likelihood is not remote then judgement is used to determine the contingent liability disclosed. Unilever does not have provisions and contingent liabilities for the same matters. External advice is obtained for any material cases. See notes 6A, 19 and 20.
■Recognition of pension surplus – where there is an accounting surplus on a defined benefit plan, management uses judgement to determine whether the Group can realise the surplus through refunds, reductions in future contributions or a combination of both.
| | | | | |
178 | Unilever Annual Report on Form 20-F 2023 |
| | | | | | | | |
| | |
| STRATEGIC REPORT | CORPORATE GOVERNANCE | FINANCIAL STATEMENTS |
| | |
Notes to the Consolidated Financial Statements Unilever Group |
Accounting developments adopted by the Group
Recent accounting developments adopted by the Group
The Group applied for the first-time amendments to the following standards from 1 January 2023.
| | | | | | | | |
| Applicable standard | Key requirements | Impact on Group |
| IFRS 17 ‘Insurance Contracts’ | The standard introduces a new model for accounting for insurance contracts. | We have reviewed existing arrangements and concluded that IFRS 17 has no impact to the consolidated Group financial statements. |
| IAS 12 ‘Income Taxes’ | As of 23 May 2023, amendments to IAS 12 came into effect relating to International Tax Reform – Pillar Two Model Rules, whereby an entity shall disclose qualitative and quantitative information about its exposure to Pillar Two income taxes at the end of the reporting period. The amendments also provide a temporary mandatory exemption from deferred tax accounting for the top-up tax, which is effective immediately. | As of 31 December 2023, we have applied the exemption to not recognise any deferred tax relating to top-up tax arising from the Pillar Two legislation.
We have disclosed the Group's potential exposure to Pillar Two legislation in note 6. |
All other standards or amendments to standards that have been issued by the IASB and were effective by 1 January 2023 were not applicable or material to Unilever.
New standards, amendments and interpretations of existing standards that are not yet effective and have not been early adopted by the Group
The following standards have been released but are not yet adopted by the Group. Based on initial review the Group does not currently believe adoption of the following standards/amendments will have a material impact on the consolidation results or financial position of the Group.
| | | | | |
| Applicable standard | Key requirements or changes in accounting policy |
Amendments to IAS 7 and IFRS 7 – 'Supplier Finance Arrangements'
Effective from the year ended 31 December 2024. | The amendments introduce additional disclosure requirements for companies that enter into supplier finance arrangements. The amendments require qualitative and quantitative information to be disclosed about those arrangements. |
Amendments to IAS 21 ‘The Effects of Changes in Foreign Exchange Rates’
Effective from the year ended 31 December 2025 | In August 2023, the International Accounting Standards Board (IASB) amended IAS 21 to clarify whether a currency is exchangeable, and how to determine a spot rate if it is not.
|
All other new standards or amendments that are not yet effective that have been issued by the IASB are not applicable or material to Unilever.
| | | | | | | | |
Unilever Annual Report on Form 20-F 2023 | 179 |
| | | | | | | | |
| | |
| STRATEGIC REPORT | CORPORATE GOVERNANCE | FINANCIAL STATEMENTS |
| | |
Notes to the Consolidated Financial Statements Unilever Group |
2. Segment information
| | | | | |
Segmental reporting The Group's operating and reportable segments are the five Business Groups of Beauty & Wellbeing, Personal Care, Home Care, Nutrition and Ice Cream. Prior to 2022, segmental reporting was done on the basis of three Divisions: Beauty & Personal Care, Home Care and Foods & Refreshment. The comparative information has been reclassified to reflect the new reporting segments. |
| Beauty & Wellbeing | ■primarily sales of hair care (shampoo, conditioner, styling), skin care (face, hand and body moisturisers) and includes Prestige Beauty and Health & Wellbeing. |
| Personal Care | ■primarily sales of skin cleansing (soap, shower), deodorant and oral care (toothpaste, toothbrush, mouthwash) products. |
| Home Care | ■primarily sales of fabric care (washing powders and liquids, rinse conditioners) and a wide range of cleaning products. |
| Nutrition | ■primarily sales of scratch cooking aids (soups, bouillons, seasonings), dressings (mayonnaise, ketchup) and tea products. |
| Ice Cream | ■primarily ice cream products. |
Revenue Turnover comprises sales of goods after the deduction of discounts, sales taxes and estimated returns. It does not include sales between group companies. Discounts given by Unilever include rebates, price reductions and incentives given to customers, promotional couponing and trade communication costs and are based on the contractual arrangements with each customer. Discounts can either be immediately deducted from the sales value on the invoice or off-invoice and settled later through credit notes when the precise amounts are known. Rebates are generally off-invoice. Amounts provided for discounts at the end of a period require estimation; historical data and accumulated experience is used to estimate the provision using the most likely amount method and in most instances, the discount can be estimated using known facts with a high level of accuracy. Any differences between actual amounts settled and the amounts provided are not material and recognised in the subsequent reporting period. Customer contracts generally contain a single performance obligation and turnover is recognised when control of the products being sold has transferred to our customer as there are no longer any unfulfilled obligations to the customer. This is generally on delivery to the customer but depending on individual customer terms, this can be at the time of dispatch, delivery or upon formal customer acceptance. This is considered the appropriate point where the performance obligations in our contracts are satisfied as Unilever no longer has control over the inventory. Our customers have the contractual right to return goods only when authorised by Unilever. At 31 December 2023, an estimate has been made of goods that will be returned and a liability has been recognised for this amount. An asset has also been recorded for the corresponding inventory that is estimated to return to Unilever using a best estimate based on accumulated experience. Some of our customers are distributors who may be able to return unsold goods in consignment arrangements. Underlying operating profit Underlying operating profit means operating profit before the impact of non-underlying items within operating profit. Underlying operating profit represents our measure of segment profit or loss as it is the primary measure used for the purpose of making decisions about allocating resources and assessing performance of segments. Items are classified as non-underlying due to their nature and/or frequency of occurrence. |
Our segments are comprised of similar product categories. 8 categories (2022: 8; 2021: 10) individually accounted for 5% or more of our revenue in one or more of the last three years. The following table shows the relevant contribution of these categories to Group revenue for the periods shown:
| | | | | | | | | | | | | | |
| Category | Segment | 2023 | 2022 | 2021 |
| Fabric | Home Care | 15 | % | 15 | % | 14 | % |
| Ice Cream | Ice Cream | 13 | % | 13 | % | 13 | % |
| Hair Care | Beauty & Wellbeing | 10 | % | 11 | % | 11 | % |
| Scratch Cooking Aids | Nutrition | 10 | % | 10 | % | 10 | % |
| Skin Cleansing | Personal Care | 10 | % | 10 | % | 11 | % |
| Deodorant | Personal Care | 9 | % | 8 | % | 7 | % |
| Skin Care | Beauty & Wellbeing | 7 | % | 7 | % | 7 | % |
| Dressings | Nutrition | 7 | % | 6 | % | 6 | % |
| Home & Hygiene | Home Care | 4 | % | 4 | % | 5 | % |
| Tea* | Nutrition | 2 | % | 3 | % | 5 | % |
| Other | | 13 | % | 13 | % | 11 | % |
* 2023 includes retained tea business. 2021 and 2022 includes ekaterra tea business as well as retained business.
| | | | | |
180 | Unilever Annual Report on Form 20-F 2023 |
| | | | | | | | |
| | |
| STRATEGIC REPORT | CORPORATE GOVERNANCE | FINANCIAL STATEMENTS |
| | |
Notes to the Consolidated Financial Statements Unilever Group |
2. Segment information continued
The Group operating segment information is provided based on five product areas: Beauty & Wellbeing, Personal Care, Home Care, Nutrition and Ice Cream.
| | | | | | | | | | | | | | | | | | | | | | | |
| | € million | € million | € million | € million | € million | € million |
| Notes | Beauty & Wellbeing | Personal Care | Home Care | Nutrition | Ice Cream | Total |
| 2023 | | | | | | | |
| Turnover | | 12,466 | | 13,829 | | 12,181 | | 13,204 | | 7,924 | | 59,604 | |
| Operating profit | 3 | 2,209 | | 2,957 | | 1,419 | | 2,413 | | 760 | | 9,758 | |
Non-underlying items(a) | | 122 | | (165) | | 77 | | 47 | | 92 | | 173 | |
| Underlying operating profit | | 2,331 | | 2,792 | | 1,496 | | 2,460 | | 852 | | 9,931 | |
| Share of net profit/(loss) of joint ventures and associates | | 1 | | 3 | | 3 | | 221 | | 3 | | 231 | |
| Significant non-cash charges: | | | | | | | |
| Within underlying operating profit: | | | | | | | |
| Depreciation and amortisation | | 257 | | 328 | | 279 | | 283 | | 431 | | 1,578 | |
Share-based compensation and other non-cash charges(b) | | 73 | | 87 | | 64 | | 89 | | 47 | | 360 | |
| Within non-underlying items: | | | | | | | |
Impairment and other non-cash charges(c) | | (6) | | 4 | | (40) | | (18) | | (1) | | (61) | |
| 2022 | | | | | | | |
| Turnover | | 12,250 | | 13,636 | | 12,401 | | 13,898 | | 7,888 | | 60,073 | |
| Operating profit | 3 | 2,154 | | 2,264 | | 1,064 | | 4,497 | | 776 | | 10,755 | |
Non-underlying items(a) | | 138 | | 415 | | 280 | | (2,048) | | 143 | | (1,072) | |
| Underlying operating profit | | 2,292 | | 2,679 | | 1,344 | | 2,449 | | 919 | | 9,683 | |
| Share of net profit/(loss) of joint ventures and associates | | 1 | | 3 | | 4 | | 196 | | 4 | | 208 | |
| Significant non-cash charges: | | | | | | | |
| Within underlying operating profit: | | | | | | | |
| Depreciation and amortisation | | 282 | | 350 | | 327 | | 349 | | 417 | | 1,725 | |
Share-based compensation and other non-cash charges(b) | | 43 | | 55 | | 36 | | 51 | | 33 | | 218 | |
| Within non-underlying items: | | | | | | | |
Impairment and other non-cash charges(c) | | 49 | | 259 | | 152 | | 87 | | 60 | | 607 | |
| 2021 | | | | | | | |
| Turnover | | 10,138 | | 11,763 | | 10,572 | | 13,104 | | 6,867 | | 52,444 | |
| Operating profit | 3 | 2,135 | | 2,336 | | 1,294 | | 2,104 | | 833 | | 8,702 | |
Non-underlying items(a) | | 102 | | 169 | | 123 | | 421 | | 119 | | 934 | |
| Underlying operating profit | | 2,237 | | 2,505 | | 1,417 | | 2,525 | | 952 | | 9,636 | |
| Share of net profit/(loss) of joint ventures and associates | | 4 | | 6 | | 7 | | 170 | | 4 | | 191 | |
| Significant non-cash charges: | | | | | | | |
| Within underlying operating profit: | | | | | | | |
| Depreciation and amortisation | | 256 | | 368 | | 304 | | 413 | | 405 | | 1,746 | |
Share-based compensation and other non-cash charges(b) | | 46 | | 56 | | 44 | | 69 | | 34 | | 249 | |
| Within non-underlying items: | | | | | | | |
Impairment and other non-cash charges(c) | | 1 | | 12 | | 12 | | 17 | | 16 | | 58 | |
(a)Non-underlying items include gain on disposal of group companies, impairment, restructuring costs, acquisition and disposal related costs and other one-off items classified separately due to their nature and/or frequency of occurrence. Refer to note 3.
(b)Other non-cash charges within underlying operating profit include movements in provisions from underlying activities, excluding movements arising from
non-underlying activities.
(c)Other non-cash charges within non-underlying items includes movements in restructuring provisions and movements in certain legal provisions.
| | | | | | | | |
Unilever Annual Report on Form 20-F 2023 | 181 |
| | | | | | | | |
| | |
| STRATEGIC REPORT | CORPORATE GOVERNANCE | FINANCIAL STATEMENTS |
| | |
Notes to the Consolidated Financial Statements Unilever Group |
2. Segment information continued
The Unilever Group is not reliant on turnover from transactions with any single customer and does not receive 10% or more of its turnover from transactions with any single customer.
Segment assets and liabilities are not provided because they are not reported to or reviewed by our chief operating decision-maker, which is the Unilever Leadership Executive (ULE).
Turnover and non-current assets for the country of domicile, the United States and India (being the two largest countries outside the home country) and for all other countries are:
| | | | | | | | | | | | | | | | | |
| € million | € million | € million | € million | € million |
| United
Kingdom | United
States | India | Others | Total |
| 2023 | | | | | |
| Turnover | 2,523 | | 12,250 | | 6,691 | | 38,140 | | 59,604 | |
Non-current assets(a) | 3,567 | | 18,205 | | 6,436 | | 22,876 | | 51,084 | |
| 2022 | | | | | |
| Turnover | 2,498 | | 12,122 | | 6,872 | | 38,581 | | 60,073 | |
Non-current assets(a) | 3,621 | | 18,109 | | 6,500 | | 23,971 | | 52,201 | |
| 2021 | | | | | |
| Turnover | 2,443 | | 9,864 | | 5,618 | | 34,519 | | 52,444 | |
Non-current assets(a) | 3,858 | | 16,692 | | 6,755 | | 22,607 | | 49,912 | |
(a)For the purpose of this table, non-current assets include goodwill, intangible assets, property, plant and equipment and other non-current assets as shown on the consolidated balance sheet. Goodwill is attributed to countries where acquired business operated at the time of acquisition; all other assets are attributed to the countries where they were acquired.
No other country had turnover or non-current assets (as shown above) greater than 10% of the Group total.
Additional information by geographies
Although the Group’s operations are managed by product area, we provide additional information based on geographies.
| | | | | | | | | | | |
| € million | € million | € million |
| 2023 | 2022 | 2021 |
| Asia Pacific Africa | 26,234 | | 27,504 | | 24,264 | |
The Americas(a) | 21,531 | | 20,905 | | 16,844 | |
| Europe | 11,839 | | 11,664 | | 11,336 | |
| Total | 59,604 | | 60,073 | | 52,444 | |
(a)Americas sales in North America were €13,130 million (2022: €13,000 million; 2021: €10,627 million) and in Latin America were €8,401 million (2022: €7,905 million; 2021: €6,217 million).
The Group's turnover classified by markets is:
| | | | | | | | | | | |
| € million | € million | € million |
| 2023 | 2022 | 2021 |
| Emerging markets | 34,714 | | 35,324 | | 30,407 | |
| Developed markets | 24,890 | | 24,749 | | 22,037 | |
Transactions between the Unilever Group’s geographical regions are immaterial and are carried out on at arm’s length basis.
| | | | | |
182 | Unilever Annual Report on Form 20-F 2023 |
| | | | | | | | |
| | |
| STRATEGIC REPORT | CORPORATE GOVERNANCE | FINANCIAL STATEMENTS |
| | |
Notes to the Consolidated Financial Statements Unilever Group |
3. Operating costs
| | |
Operating costs Operating costs include cost of sales, brand and marketing investment, overheads and other items including gains and losses on business disposals, acquisition and disposal-related costs, restructuring costs, impairments and other items within operating profit recognised separately due to their nature and/or frequency. (i) Cost of sales Cost of sales includes the cost of inventories sold during the period and distribution costs. The cost of inventories are raw and packaging materials and related production costs. Distribution costs are charged to the income statement as incurred. (ii) Brand and marketing investment Brand and marketing investment include costs related to creating and maintaining brand equity and brand awareness. This includes media, advertising production, promotional materials and engagement with consumers. These costs are charged to the income statement as incurred. (iii) Overheads Overheads include staff costs associated with sales activities and central functions such as finance, human resources, and research and development costs. Research and development costs are staff costs, material costs, depreciation of property, plant and equipment, patent costs and other costs that are directly attributable to research and product development activities. These costs are charged to the income statement as incurred. (iv) Restructuring costs Restructuring costs are charges associated with transformational activities planned by management that significantly change either the scope of the business or the way it is conducted. (v) Others Others relates to those one-off costs that are classified separately due to their nature and/or frequency of occurrence. |
| | | | | | | | | | | |
| € million | € million | € million |
| 2023 | 2022 | 2021 |
| Turnover | 59,604 | | 60,073 | | 52,444 | |
| Cost of sales | (34,429) | | (35,906) | | (30,259) | |
| of which: | | | |
| Distribution costs | (3,549) | | (3,787) | | (3,313) | |
| Production costs | (3,969) | | (3,995) | | (3,678) | |
| Raw and packaging materials and goods purchased for resale | (25,084) | | (26,360) | | (21,799) | |
| Other | (1,827) | | (1,764) | | (1,469) | |
| Gross profit | 25,175 | | 24,167 | | 22,185 | |
| Selling and administrative expenses | (15,244) | | (14,484) | | (12,549) | |
| of which: | | | |
| Brand and marketing investment | (8,546) | | (7,821) | | (6,873) | |
| Overheads | (6,698) | | (6,663) | | (5,676) | |
of which: Research and development(a) | (949) | | (908) | | (847) | |
| | | |
| | | |
Gain on disposal of group companies(b) | 489 | | 2,335 | | 36 | |
Acquisition and disposal-related costs(c) | (242) | | (50) | | (332) | |
Restructuring costs(d) | (499) | | (777) | | (632) | |
Impairments(e) | (1) | | (221) | | (17) | |
Other(f) | 80 | | (215) | | 11 | |
| Operating profit | 9,758 | | 10,755 | | 8,702 | |
(a)From 2022, research and development costs include patent costs. 2023 include patent costs of €29 million (2022: €28 million). 2021 has not been restated. Patent cost in 2021 were €27 million.
(b)2023 includes a gain of €497 million related to the disposal of Suave business in North America. 2022 includes a gain of €2,303 million related to the disposal of the global tea business.
(c)2023 includes a charge of €104 million for the revaluation of the minority interest liability of Nutrafol, €43 million relating to the disposal of Elida Beauty and €10 million (2022: €42 million) relating to the disposal of the global tea business.
(d)Restructuring costs are comprised of strategic organisational change programmes (including Compass), and transformational technology and supply chain projects.
(e)2022 includes an impairment charge of €192 million relating to Dollar Shave Club.
(f)2023 includes €28 million net release after utilisation to the provision (2022: €89 million charge) relating to a product recall and market withdrawal by The Laundress, €107 million release (2022: €82 million charge) relating to legal provisions for ongoing competition investigations and €54 million charge (2022: €42 million charge) relating to our businesses in Russia and Ukraine.
Exchange losses within operating costs in 2023 are €(249) million (2022: €(225) million; 2021: nil).
| | | | | | | | |
Unilever Annual Report on Form 20-F 2023 | 183 |
| | | | | | | | |
| | |
| STRATEGIC REPORT | CORPORATE GOVERNANCE | FINANCIAL STATEMENTS |
| | |
Notes to the Consolidated Financial Statements Unilever Group |
4. Employees
4A. Staff and management costs
| | | | | | | | | | | |
| € million | € million | € million |
| Staff costs | 2023 | 2022 | 2021 |
| Wages and salaries | (5,722) | | (5,857) | | (5,062) | |
| Social security costs | (591) | | (587) | | (529) | |
| Other pension costs | (348) | | (396) | | (401) | |
| Share-based compensation costs | (212) | | (177) | | (161) | |
| (6,873) | | (7,017) | | (6,153) | |
| | | |
| | | |
| ‘000 | ‘000 | ‘000 |
Average number of employees during the year (a) | 2023 | 2022 | 2021 |
| Asia Pacific Africa | 64 | | 73 | | 84 | |
| The Americas | 38 | | 38 | | 37 | |
| Europe | 26 | | 27 | | 28 | |
| 128 | | 138 | | 149 | |
(a)Reduction in average number of employees is primarily driven by disposal of ekaterra in 2022. |
| | | | | | | | | | | |
| € million | € million | € million |
| Key management compensation | 2023 | 2022 | 2021 |
| Salaries and short-term employee benefits | (41) | | (41) | | (29) | |
Share-based benefits(a) | (13) | | (15) | | (10) | |
| (54) | | (56) | | (39) | |
| Of which: Executive Directors | (13) | | (12) | | (8) | |
Other(b) | (41) | | (44) | | (31) | |
| | | |
| Non-Executive Directors’ fees | (2) | | (2) | | (2) | |
| (56) | | (58) | | (41) | |
(a)Share-based benefits are expenses recognised for the period. Share-based benefits compensation on a vesting basis is €8 million (2022: €12 million; 2021: €6 million).
(b)Other includes all members of the Unilever Leadership Executive, other than Executive Directors.
Key management are defined as the members of Unilever Leadership Executive (ULE) and the Non-Executive Directors. Compensation for ULE members are pro-rated based on time actively spent in a ULE role. In addition to the above, €11 million was recognised in 2023 relating to members of the ULE who have either left, or where it has been announced that they will leave during the year.
| | | | | |
184 | Unilever Annual Report on Form 20-F 2023 |
| | | | | | | | |
| | |
| STRATEGIC REPORT | CORPORATE GOVERNANCE | FINANCIAL STATEMENTS |
| | |
Notes to the Consolidated Financial Statements Unilever Group |
4B. Pensions and similar obligations
| | | | | | | | | | | | | | |
For defined benefit plans, operating and finance costs are recognised separately in the income statement. The amount charged to operating cost in the income statement is the cost of accruing pension benefits promised to employees over the year, administration costs (other than costs of managing plan assets), plus the costs of individual events such as past service benefit changes, settlements and curtailments (such events are recognised immediately in the income statement). The amount charged or credited to finance costs is a net interest expense calculated by applying the liability discount rate to the surplus or deficit. Any differences between the expected interest on assets and the return actually achieved, and any changes in the liabilities over the year due to changes in assumptions or experience within the plans, are recognised immediately in the statement of comprehensive income. The defined benefit plan surplus or deficit on the balance sheet comprises the total for each plan of the fair value of plan assets less the present value of the defined benefit liabilities (using a discount rate based on high-quality corporate bonds, or a suitable alternative where there is no active corporate bond market) adjusted for irrecoverable surpluses. All defined benefit plans are subject to regular actuarial review using the projected unit method by external consultants. The Group policy is that the most material plans, representing approximately 82% of the defined benefit liabilities, are formally valued every year. Other material plans, accounting for a further 14% of the liabilities, have their liabilities updated each year. Group policy for the remaining plans requires a full actuarial valuation at least every three years. Asset values for all plans are updated every year. For defined contribution plans, the charges to the income statement are the company contributions payable, as the company’s obligation is limited to the contributions paid into the plans. The assets and liabilities of such plans are not included in the balance sheet of the Group. |
|
|
|
|
Description of plans
The Group increasingly operates a number of defined contribution plans, the assets of which are held in external funds. In certain countries, the Group operates defined benefit pension plans based on employee pensionable remuneration and length of service. The majority of defined benefit plans are either career average, final salary or hybrid plans and operate on a funded basis with assets held in external funds. Benefits are determined by the plan rules and are linked to inflation in some countries. Our largest plans are in the UK and the Netherlands. In the UK, we operate a career average defined benefit plan (with a salary limit for benefit accrual) which is closed to new entrants from October 2021, and a defined contribution plan. In the Netherlands, we operate a collective defined contribution plan for all new benefit accrual and a closed career average defined benefit plan for benefits built up to April 2015.
The Group also provides other post-employment benefits, mainly post-employment healthcare plans in the US, closed to new entrants from January 2014. These plans are predominantly unfunded.
Governance
The majority of the Group’s externally funded plans are established as trusts, foundations or similar entities. The operation of these entities is governed by local regulations and practice in each country, as is the nature of the relationship between the Group and the Trustees (or equivalent) and their composition. Where Trustees (or equivalent) are in place to operate plans, they are generally required to act on behalf of the plan’s stakeholders. They are tasked with periodic reviews of the solvency of the plan in accordance with local legislation and play a role in the long-term investment and funding strategy. The Group also has an internal body, the Pensions and Equity Committee, that is responsible for setting the company’s policies and decision-making on plan matters, including but not limited to design, funding, investments, risk management and governance.
Investment strategy
The Group’s investment strategy in respect of its funded plans is implemented within the framework of the various statutory requirements of the territories where the plans are based. The Group has developed policy guidelines for the allocation of assets to different classes with the objective of controlling risk and maintaining the right balance between risk and long-term returns in order to limit the cost to the Group of the benefits provided. To achieve this, investments are diversified, such that the failure of any single investment should not have a material impact on the overall level of assets. The plans expose the Group to a number of actuarial risks such as investment risk, interest rate risk, longevity risk and, in certain countries, inflation risk. There are no unusual entity or plan-specific risks to the Group. The plans invest a reducing proportion of assets in equities and, for risk control, an increasing proportion in liability matching assets (bonds). There are also investments in property and other alternative assets; additionally, the Group uses derivatives to further mitigate the impact of the risks outlined above. However, the portfolio leverage is relatively low. The majority of assets are managed by a number of external fund managers with a small proportion managed in-house. Unilever has a pooled investment vehicle (Univest) which it believes offers its pension plans around the world a simplified externally managed investment vehicle to implement their strategic asset allocation models, currently for bonds, equities and alternative assets. The aim is to provide high-quality, well diversified, cost-effective, risk-controlled vehicles. The pension plans’ investments are overseen by Unilever’s internal investment company, the Univest Company.
Assumptions
With the objective of presenting the assets and liabilities of the pensions and other post-employment benefit plans at their fair value on the balance sheet, assumptions under IAS 19 are set by reference to market conditions at the valuation date. The actuarial assumptions used to calculate the benefit liabilities vary according to the country in which the plan is situated. The following table shows the assumptions, weighted by liabilities, used to value the principal defined benefit plans (representing approximately 96% of total pension liabilities and other post-employment benefit liabilities).
| | | | | | | | | | | | | | | | | |
| 31 December 2023 | | 31 December 2022 |
| Defined benefit
pension plans | Other post- employment
benefit plans | | Defined benefit
pension plans | Other post- employment
benefit plans |
| Discount rate | 4.4 | % | 5.9 | % | | 4.6 | % | 5.9 | % |
| Inflation | 2.8 | % | n/a | | 2.8 | % | n/a |
| Rate of increase in salaries | 3.4 | % | 2.9 | % | | 3.3 | % | 3.0 | % |
| Rate of increase for pensions in payment (where provided) | 2.6 | % | n/a | | 2.4 | % | n/a |
| Rate of increase for pensions in deferment (where provided) | 2.8 | % | n/a | | 2.6 | % | n/a |
| Long-term medical cost inflation | n/a | 5.5 | % | | n/a | 5.1 | % |
For the most material other post-employment benefit plan in the US a higher initial level of medical cost inflation is assumed which falls from the initial rate of 7% to the long-term rate of 5% after 8 years. Assumed healthcare cost trend rates have a significant effect on the amounts reported for healthcare plans.
| | | | | | | | |
Unilever Annual Report on Form 20-F 2023 | 185 |
| | | | | | | | |
| | |
| STRATEGIC REPORT | CORPORATE GOVERNANCE | FINANCIAL STATEMENTS |
| | |
Notes to the Consolidated Financial Statements Unilever Group |
4B. Pensions and similar obligations continued
For the UK and Netherlands pension plans, representing approximately 66% of all defined benefit pension liabilities, the assumptions used at 31 December 2023 and 2022 were:
| | | | | | | | | | | | | | | | | |
| United Kingdom | | Netherlands |
| 2023 | 2022 | | 2023 | 2022 |
| Discount rate | 4.7 | % | 5.0 | % | | 3.2 | % | 3.7 | % |
| Inflation | 3.0 | % | 3.1 | % | | 2.1 | % | 2.2 | % |
| Rate of increase in salaries | 3.6 | % | 3.6 | % | | 2.6 | % | 2.7 | % |
| Rate of increase for pensions in payment (where provided) | 2.8 | % | 2.9 | % | | 2.1 | % | 2.2 | % |
| Rate of increase for pensions in deferment (where provided) | 2.8 | % | 2.9 | % | | 2.1 | % | 2.2 | % |
| Number of years a current pensioner is expected to live beyond age 65: | | | | | |
| Men | 21.5 | 21.8 | | 21.9 | 21.8 |
| Women | 23.1 | 23.6 | | 24.1 | 24.0 |
| Number of years a future pensioner currently aged 45 is expected to live beyond age 65: | | | | | |
| Men | 22.4 | 22.9 | | 23.9 | 23.8 |
| Women | 24.2 | 24.8 | | 26.1 | 26.0 |
Demographic assumptions, such as mortality rates, are set having regard to the latest trends in life expectancy (including expectations of future improvements), plan experience and other relevant data. These assumptions are reviewed and updated as necessary as part of the periodic actuarial valuation of the pension plans. The years of life expectancy for 2023 above have been translated from the following tables:
UK: Standard life expectancy tables Series S3, adjusted to reflect the experience of our plan members analysed as part of the 2022 actuarial valuation. Future improvements in longevity have been allowed for in line with the core CMI 2022 Mortality Projections Model with a 1% p.a. long-term improvement rate.
Netherlands: The Dutch Actuarial Society’s AG Prognosetafel 2022 table is used with correction factors (2020) to allow for the typically longer life expectancy for fund members relative to the general population. This table has an in-built allowance for future improvements in longevity.
The impact from changes to the assumptions of the remaining defined benefit plans are considered immaterial. Their assumptions vary due to a number of factors including the currency and long-term economic conditions of the countries where they are situated.
Income statement
The charge to the income statement comprises:
| | | | | | | | | | | | | | |
| | € million | € million | € million |
| Notes | 2023 | 2022 | 2021 |
| Charged to operating profit: | | | | |
| Defined benefit pension and other benefit plans: | | | | |
| Gross service cost | | (128) | | (186) | | (228) | |
| Employee contributions | | 11 | | 12 | | 13 | |
| Special termination benefits | | (14) | | (11) | | (15) | |
| Past service cost including (losses)/gains on curtailments | | 3 | | – | | 18 | |
| Settlements | | 2 | | 1 | | 1 | |
| Defined contribution plans | | (222) | | (212) | | (190) | |
| Total operating cost | 4A | (348) | | (396) | | (401) | |
Finance income/(cost)(a) | 5 | 110 | | 44 | | (10) | |
| Net impact on the income statement (before tax) | | (238) | | (352) | | (411) | |
(a)This includes the impact of interest on asset ceiling.
Statement of comprehensive income
Amounts recognised in the statement of comprehensive income on the remeasurement of the surplus/(deficit).
| | | | | | | | | | | |
| € million | € million | € million |
| 2023 | 2022 | 2021 |
| Return on plan assets excluding amounts included in net finance income/(cost) | 131 | | (6,483) | | 1,958 | |
| Change in asset ceiling excluding amounts included in finance cost | (6) | | (184) | | (17) | |
| Actuarial gains/(losses) arising from changes in demographic assumptions | 98 | | (24) | | (4) | |
| Actuarial gains/(losses) arising from changes in financial assumptions | (552) | | 6,914 | | 342 | |
| Experience gains/(losses) arising on pension plan and other benefit plan liabilities | (416) | | (760) | | 126 | |
| Total of defined benefit costs recognised in other comprehensive income | (745) | | (537) | | 2,405 | |
| | | | | |
186 | Unilever Annual Report on Form 20-F 2023 |
| | | | | | | | |
| | |
| STRATEGIC REPORT | CORPORATE GOVERNANCE | FINANCIAL STATEMENTS |
| | |
Notes to the Consolidated Financial Statements Unilever Group |
4B. Pensions and similar obligations continued
Balance sheet
The assets, liabilities and surplus/(deficit) position of the pension and other post-employment benefit plans at the balance sheet date were:
| | | | | | | | | | | | | | | | | |
| € million 2023 | | € million 2022 |
| Pension plans | Other post- employment
benefit plans | | Pension plans | Other post- employment
benefit plans |
| Fair value of assets | 20,174 | | 4 | | | 19,361 | | 6 | |
| Present value of liabilities | (17,174) | | (348) | | | (16,199) | | (365) | |
| Computed surplus/(deficit) | 3,000 | | (344) | | | 3,162 | | (359) | |
Irrecoverable surplus(a) | (255) | | – | | | (234) | | – | |
| Surplus/(deficit) | 2,745 | | (344) | | | 2,928 | | (359) | |
| Of which in respect of: | | | | | |
| Funded plans in surplus: | | | | | |
| Liabilities | (13,739) | | – | | | (12,030) | | – | |
| Assets | 17,775 | | – | | | 16,524 | | – | |
| Aggregate surplus | 4,036 | | – | | | 4,494 | | – | |
Irrecoverable surplus(a) | (255) | | – | | | (234) | | – | |
| Surplus/(deficit) | 3,781 | | – | | | 4,260 | | – | |
| Funded plans in deficit: | | | | | |
| Liabilities | (2,715) | | (39) | | | (3,417) | | (39) | |
| Assets | 2,399 | | 4 | | | 2,837 | | 6 | |
| Surplus/(deficit) | (316) | | (35) | | | (580) | | (33) | |
| Unfunded plans: | | | | | |
| Pension liability | (720) | | (309) | | | (752) | | (326) | |
(a)A surplus is deemed recoverable to the extent that the Group is able to benefit economically from the surplus. Unilever assesses the maximum economic benefit available through a combination of refunds and reductions in future contributions in accordance with local legislation and individual financing arrangements with each of our funded defined benefit plans.
Reconciliation of change in assets and liabilities
The group of plans within ‘Rest of world’ category in the tables below are not materially different with respect to their risks that would require disaggregated disclosure.
Movements in assets during the year:
| | | | | | | | | | | | | | | | | | | | | | | | | | |
| | | Rest of | € million | | | Rest of | € million |
| UK | Netherlands | world | 2023 Total | UK | Netherlands |
world | 2022 Total |
| 1 January fair value of assets | 8,704 | | 5,343 | | 5,320 | | 19,367 | | 14,332 | | 6,099 | | 6,262 | | 26,693 | |
| 1 January irrecoverable surplus | – | | – | | (234) | | (234) | | – | | – | | (50) | | (50) | |
| 1 January (after irrecoverable surplus) | 8,704 | | 5,343 | | 5,086 | | 19,133 | | 14,332 | | 6,099 | | 6,212 | | 26,643 | |
| Employee contributions | – | | – | | 11 | | 11 | | 1 | | – | | 11 | | 12 | |
| Settlements | – | | – | | (1) | | (1) | | – | | – | | – | | – | |
| Actual return on plan assets (excluding amounts in net finance income/charge) | (227) | | 146 | | 212 | | 131 | | (4,870) | | (668) | | (945) | | (6,483) | |
| Change in asset ceiling excluding amounts included in interest expenses | – | | – | | (6) | | (6) | | – | | – | | (184) | | (184) | |
Interest income(a) | 432 | | 194 | | 233 | | 859 | | 264 | | 66 | | 166 | | 496 | |
| Employer contributions | 50 | | 9 | | 348 | | 407 | | 66 | | 8 | | 229 | | 303 | |
| Benefit payments | (459) | | (178) | | (485) | | (1,122) | | (511) | | (161) | | (512) | | (1,184) | |
Other (b) | – | | – | | 371 | | 371 | | – | | (1) | | (1) | | (2) | |
| Currency retranslation | 179 | | – | | (39) | | 140 | | (578) | | – | | 110 | | (468) | |
| 31 December (after irrecoverable surplus) | 8,679 | | 5,514 | | 5,730 | | 19,923 | | 8,704 | | 5,343 | | 5,086 | | 19,133 | |
| 31 December irrecoverable surplus | – | | – | | (255) | | (255) | | – | | – | | (234) | | (234) | |
| 31 December fair value of assets | 8,679 | | 5,514 | | 5,985 | | 20,178 | | 8,704 | | 5,343 | | 5,320 | | 19,367 | |
(a)This includes the impact of interest on asset ceiling.
(b)The majority of 'Other' during 2023 is explained by reclassification of India HUL and GSK Provident Funds from Defined Contribution to Defined Benefit reporting adding €368 million to both assets and liabilities at year end 2023. The impact on the overall (deficit)/surplus is nil.
| | | | | | | | |
Unilever Annual Report on Form 20-F 2023 | 187 |
| | | | | | | | |
| | |
| STRATEGIC REPORT | CORPORATE GOVERNANCE | FINANCIAL STATEMENTS |
| | |
Notes to the Consolidated Financial Statements Unilever Group |
4B. Pensions and similar obligations continued
Movements in liabilities during the year:
| | | | | | | | | | | | | | | | | | | | | | | | | | |
| | | Rest of | € million | | | Rest of | € million |
| UK | Netherlands | world | 2023 Total | UK | Netherlands |
world | 2022 Total |
| 1 January | (6,838) | | (3,734) | | (5,992) | | (16,564) | | (11,453) | | (4,937) | | (7,260) | | (23,650) | |
| Gross service cost | (42) | | (5) | | (81) | | (128) | | (86) | | (4) | | (96) | | (186) | |
| Special termination benefits | – | | – | | (14) | | (14) | | – | | – | | (11) | | (11) | |
| Past service costs including losses/(gains) on curtailments | – | | – | | 3 | | 3 | | – | | – | | – | | – | |
| Settlements | – | | – | | 3 | | 3 | | – | | – | | 1 | | 1 | |
| Interest cost | (335) | | (135) | | (279) | | (749) | | (210) | | (54) | | (188) | | (452) | |
| Actuarial gain/(loss) arising from changes in demographic assumptions | 104 | | – | | (6) | | 98 | | 1 | | (50) | | 25 | | (24) | |
| Actuarial gain/(loss) arising from changes in financial assumptions | (243) | | (236) | | (73) | | (552) | | 4,196 | | 1,527 | | 1,191 | | 6,914 | |
| Actuarial gain/(loss) arising from experience adjustments | (220) | | (99) | | (97) | | (416) | | (276) | | (377) | | (107) | | (760) | |
| Benefit payments | 459 | | 178 | | 485 | | 1,122 | | 511 | | 161 | | 512 | | 1,184 | |
Other(a) | – | | – | | (371) | | (371) | | – | | – | | 15 | | 15 | |
| Currency retranslation | (135) | | – | | 181 | | 46 | | 479 | | – | | (74) | | 405 | |
| 31 December | (7,250) | | (4,031) | | (6,241) | | (17,522) | | (6,838) | | (3,734) | | (5,992) | | (16,564) | |
(a)The majority of 'Other' during 2023 is explained by reclassification of India HUL and GSK Provident Funds from Defined Contribution to Defined Benefit reporting adding €368 million to both assets and liabilities at year end 2023. The impact on the overall (deficit)/surplus is nil.
Movements in (deficit)/surplus during the year:
| | | | | | | | | | | | | | | | | | | | | | | | | | |
| | | Rest of | € million | | | Rest of | € million |
| UK | Netherlands | world | 2023 Total | UK | Netherlands | world | 2022 Total |
| 1 January | 1,866 | | 1,609 | | (906) | | 2,569 | | 2,879 | | 1,162 | | (1,048) | | 2,993 | |
| Gross service cost | (42) | | (5) | | (81) | | (128) | | (86) | | (4) | | (96) | | (186) | |
| Employee contributions | – | | – | | 11 | | 11 | | 1 | | – | | 11 | | 12 | |
| Special termination benefits | – | | – | | (14) | | (14) | | – | | – | | (11) | | (11) | |
| Past service costs including losses/(gains) on curtailments | – | | – | | 3 | | 3 | | – | | – | | – | | – | |
| Settlements | – | | – | | 2 | | 2 | | – | | – | | 1 | | 1 | |
| Actual return on plan assets (excluding amounts in net finance income/charge) | (227) | | 146 | | 212 | | 131 | | (4,870) | | (668) | | (945) | | (6,483) | |
| Change in asset ceiling excluding amounts included in interest expenses | – | | – | | (6) | | (6) | | – | | – | | (184) | | (184) | |
| Interest cost | (335) | | (135) | | (279) | | (749) | | (210) | | (54) | | (188) | | (452) | |
Interest income(a) | 432 | | 194 | | 233 | | 859 | | 264 | | 66 | | 166 | | 496 | |
| Actuarial gain/(loss) arising from changes in demographic assumptions | 104 | | – | | (6) | | 98 | | 1 | | (50) | | 25 | | (24) | |
| Actuarial gain/(loss) arising from changes in financial assumptions | (243) | | (236) | | (73) | | (552) | | 4,196 | | 1,527 | | 1,191 | | 6,914 | |
| Actuarial gain/(loss) arising from experience adjustments | (220) | | (99) | | (97) | | (416) | | (276) | | (377) | | (107) | | (760) | |
| Employer contributions | 50 | | 9 | | 348 | | 407 | | 66 | | 8 | | 229 | | 303 | |
| Benefit payments | – | | – | | – | | – | | – | | – | | – | | – | |
| Other | – | | – | | – | | – | | – | | (1) | | 14 | | 13 | |
| Currency retranslation | 44 | | – | | 142 | | 186 | | (99) | | – | | 36 | | (63) | |
| 31 December | 1,429 | | 1,483 | | (511) | | 2,401 | | 1,866 | | 1,609 | | (906) | | 2,569 | |
(a)This includes the impact of interest on asset ceiling.
The actual return on recognised plan assets during 2023 was €990 million, being €131 million of asset returns and €859 million of interest income shown in the tables above (2022: €(5,987) million).
Movements in irrecoverable surplus during the year:
| | | | | | | | | | | | | | | | | | | | | | | | | | |
| | | Rest of | € million | | | Rest of | € million |
| UK | Netherlands | world | 2023 Total | UK | Netherlands | world | 2022 Total |
| 1 January | – | | – | | (234) | | (234) | | – | | – | | (50) | | (50) | |
| Interest income | – | | – | | (7) | | (7) | | – | | – | | 2 | | 2 | |
| Change in irrecoverable surplus in excess of interest | – | | – | | (6) | | (6) | | – | | – | | (184) | | (184) | |
| Currency retranslations | – | | – | | (8) | | (8) | | – | | – | | (2) | | (2) | |
| 31 December | – | | – | | (255) | | (255) | | – | | – | | (234) | | (234) | |
| | | | | |
188 | Unilever Annual Report on Form 20-F 2023 |
| | | | | | | | |
| | |
| STRATEGIC REPORT | CORPORATE GOVERNANCE | FINANCIAL STATEMENTS |
| | |
Notes to the Consolidated Financial Statements Unilever Group |
4B. Pensions and similar obligations continued
The duration of the principal defined benefit plan liabilities (representing 96% of total pension liabilities and other post-employment benefit liabilities) and the split of liabilities between different categories of plan participants are:
| | | | | | | | | | | | | | | | | | | | | | | | | | |
| | | Rest of | | | | Rest of | |
| UK | Netherlands | world(a) | 2023 Total | UK | Netherlands | world(a) | 2022 Total |
| Duration (years) | 12 | 14 | 10 | 0 to 22 | 13 | 15 | 11 | 4 to 18 |
| Active members | 7 | % | 7 | % | 23 | % | 12 | % | 8 | % | 8 | % | 19 | % | 11 | % |
| Deferred members | 31 | % | 38 | % | 14 | % | 27 | % | 31 | % | 38 | % | 14 | % | 28 | % |
| Retired members | 62 | % | 55 | % | 63 | % | 61 | % | 61 | % | 54 | % | 67 | % | 61 | % |
(a)Rest of world numbers shown are weighted averages by liabilities.
Plan assets
The group of plans within ‘Rest of world’ category in the tables below are not materially different with respect to their risks that would require disaggregated disclosure.
| | | | | | | | | | | | | | | | | | | | | | | | | | | | | |
| € million | | € million |
| 31 December 2023 | | 31 December 2022 |
| UK | Netherlands | Rest of world | 2023 Total | | UK | Netherlands | Rest of world | 2022 Total |
| Total Pension Plans Assets | 8,679 | | 5,514 | | 5,981 | | 20,174 | | | 8,704 | | 5,343 | | 5,314 | | 19,361 | |
| Equities Total | 224 | | 1,095 | | 1,424 | | 2,743 | | | 284 | | 983 | | 1,363 | | 2,630 | |
| – Europe | 43 | | 171 | | 431 | | 645 | | | 61 | | 165 | | 440 | | 666 | |
| – North America | 133 | | 670 | | 617 | | 1,420 | | | 160 | | 604 | | 594 | | 1,358 | |
| – Other | 48 | | 254 | | 376 | | 678 | | | 63 | | 214 | | 329 | | 606 | |
| Fixed Income Total | 6,640 | | 3,521 | | 3,344 | | 13,505 | | | 5,757 | | 3,269 | | 2,696 | | 11,722 | |
| – Government bonds | 4,773 | | 1,461 | | 1,546 | | 7,780 | | | 3,795 | | 1,297 | | 1,215 | | 6,307 | |
| – Investment grade corporate bonds | 791 | | 620 | | 1,197 | | 2,608 | | | 871 | | 530 | | 905 | | 2,306 | |
| – Other Fixed Income | 1,076 | | 1,440 | | 601 | | 3,117 | | | 1,091 | | 1,442 | | 576 | | 3,109 | |
| Derivatives | (237) | | 145 | | 16 | | (76) | | | (333) | | 254 | | 18 | | (61) | |
| Private Equity | 559 | | 95 | | 36 | | 690 | | | 500 | | 90 | | 40 | | 630 | |
| Property and Real Estate | 674 | | 321 | | 412 | | 1,407 | | | 930 | | 422 | | 387 | | 1,739 | |
| Hedge Funds | 136 | | – | | 69 | | 205 | | | 225 | | – | | 76 | | 301 | |
| Other | 683 | | 337 | | 391 | | 1,411 | | | 1,341 | | 325 | | 317 | | 1,983 | |
| Other Pension Plans | – | | – | | 289 | | 289 | | | – | | – | | 417 | | 417 | |
| Other Post-Employment Benefit Plans Assets | – | | – | | 4 | | 4 | | | – | | – | | 6 | | 6 | |
| Total Assets | 8,679 | | 5,514 | | 5,985 | | 20,178 | | | 8,704 | | 5,343 | | 5,320 | | 19,367 | |
The fair values of the above equity and fixed income instruments are determined based on quoted market prices in active markets. The fair value of private equity, properties, derivatives and hedge funds are not based on quoted market prices in active markets. Properties are primarily valued by a professional third party valuer on an open market basis, as defined by the Royal Institute of Chartered Surveyors. The Group uses derivatives and other instruments to hedge some of its exposure to inflation and interest rate risk – the degree of this hedging of liabilities was over 100% for both interest rate and inflation for the UK plan and approximately 90% for interest rate and 20% for inflation for the Netherlands plan at year end. Foreign currency exposures, in part, are also hedged by the use of forward foreign exchange contracts. Assets included in the Other category are cash and insurance contracts which are also unquoted assets.
No Unilever securities were held at 31 December 2023. At 31 December 2022, €1 million (0.003% of total plan assets) of Unilever securities were held. Property includes property occupied by Unilever amounting to €80 million and €77 million at 31 December 2023 and 2022 respectively.
The pension assets above exclude the assets in a Special Benefits Trust amounting to €33 million (2022: €39 million) to fund pension and similar obligations in the US (see also note 17A on page 216). Sensitivities
The sensitivity of the overall pension liabilities to changes in the weighted key assumptions are:
| | | | | | | | | | | | | | | | | |
| | | Change in liabilities |
| Change in assumption | | UK | Netherlands | Total |
| Discount rate | Increase by 0.5% | | -6 | % | -7 | % | -5 | % |
| Inflation rate | Increase by 0.5% | | 4 | % | 8 | % | 5 | % |
| Life expectancy | Increase by 1 year | | 4 | % | 4 | % | 4 | % |
Long-term medical cost inflation(a) | Increase by 1.0% | | n/a | n/a | 4 | % |
(a)Long-term medical cost inflation only relates to post-retirement medical plans and its impact on these liabilities.
A decrease in each assumption would have a comparable and opposite impact on liabilities.
The sensitivity analyses above have been determined based on reasonably possible changes of the respective assumptions occurring at the end of the reporting period and may not be representative of the actual change. It is based on a change in the key assumption while holding all other assumptions constant. When calculating the sensitivity to the assumption, the same method used to calculate the liability recognised in the balance sheet has been applied. The methods and types of assumptions used in preparing the sensitivity analysis did not change compared with the previous period.
| | | | | | | | |
Unilever Annual Report on Form 20-F 2023 | 189 |
| | | | | | | | |
| | |
| STRATEGIC REPORT | CORPORATE GOVERNANCE | FINANCIAL STATEMENTS |
| | |
Notes to the Consolidated Financial Statements Unilever Group |
4B. Pensions and similar obligations continued
Cash flow
Group cash flow in respect of pensions and similar post-employment benefits comprises company contributions paid to funded plans and benefits paid by the company in respect of unfunded plans. The table below sets out these amounts:
| | | | | | | | | | | | | | |
| € million | € million | € million | € million |
| 2024 Estimate | 2023 | 2022 | 2021 |
| Company contributions to funded plans: | | | | |
Defined Benefit (a) | 70 | | 291 | | 176 | | 286 | |
| Defined Contribution | 225 | | 222 | | 212 | | 190 | |
| Benefits paid by the Company in respect of unfunded plans: | | | | |
| Defined Benefit | 110 | | 116 | | 127 | | 108 | |
| Group cash flow in respect of pensions and similar benefits | 405 | | 629 | | 515 | | 584 | |
(a)The Group contributed a one-off contribution of $110 million into the US Pension Plan in 2023.
The Group is due to receive a partial refund of €115 million from the Netherlands Plan in 2024, per a formal agreement with the Plan allowing a return of surplus provided specific funding conditions are satisfied.
Following conclusion of the 2022 triennial valuation of the UK pension fund, the Group, in agreement with the Trustees, implemented an updated Schedule of Contributions. Deficit contributions to this fund will continue to be nil for the next few years.
The Group’s funding policy is to periodically review the contributions made to the plans while taking account of local legislation.
4C. Share-based compensation plans
| | | | | | | | | | | | | | |
| The fair value of awards at grant date is calculated using observable market price. This value is expensed over their vesting period, with a corresponding credit to equity. The expense is reviewed and adjusted to reflect changes to the level of awards expected to vest, except where this arises from a failure to meet a market condition. Any cancellations are recognised immediately in the income statement. |
|
As at 31 December 2023, the Group had share-based compensation plans in the form of performance shares and other share awards.
The numbers in this note include those for Executive Directors and key management shown in note 4A on page 184. Non-Executive Directors do not participate in any of the share-based compensation plans. The charge to income statement related to equity-settled share-based compensation plan is €212 million (2022: €177 million; 2021: €161 million).
Performance share plans
Performance share awards are made in respect of the Performance Share Plan (PSP). Awards for the Global Share Incentive Plan (GSIP) were last made in February 2018 and vested in February 2021. Awards for MCIP were last made in 2020 and will vest in 2024. No further MCIP or GSIP awards will be made. The awards of each plan will vest between 0% and 200% of grant level, subject to the level of satisfaction of performance measures (limits for Executive Directors may vary).
The MCIP allowed Unilever’s managers to invest up to 100% of their annual bonus (a minimum of 33% and maximum of 67% for Executive Directors) in shares in Unilever, and to receive a corresponding award of performance-related shares. From 2021, under the PSP, Unilever’s managers receive annual awards of PLC shares. The performance measures for MCIP are underlying sales growth, underlying EPS growth, underlying return on invested capital, sustainability progress index and for PSP are percentage business winning, free cash flow, underlying return on invested capital and sustainability progress index. MCIP awards made will vest after 4 years, while PSP awards vest after 3 years.
A summary of the status of the Performance Share Plans as at 31 December 2023, 2022 and 2021 and changes during the years ended on these dates is presented below: | | | | | | | | | | | |
| 2023 | 2022 | 2021 |
| Number of shares | Number of shares | Number of shares |
| Outstanding at 1 January | 17,923,890 | | 14,318,564 | | 11,371,436 | |
| Awarded | 7,479,544 | | 10,032,321 | | 7,667,929 | |
| Vested | (2,021,439) | | (3,101,598) | | (3,425,232) | |
| Forfeited | (2,052,057) | | (3,325,397) | | (1,295,569) | |
| Outstanding at 31 December | 21,329,938 | | 17,923,890 | | 14,318,564 | |
| | | | | | | | | | | |
| 2023 | 2022 | 2021 |
| Share award value information | | | |
| Fair value per share award during the year | €45.71 | | €41.56 | | €47.64 | |
| | | | | |
190 | Unilever Annual Report on Form 20-F 2023 |
| | | | | | | | |
| | |
| STRATEGIC REPORT | CORPORATE GOVERNANCE | FINANCIAL STATEMENTS |
| | |
Notes to the Consolidated Financial Statements Unilever Group |
4C. Share-based compensation plans continued
Additional information
At 31 December 2023, shares in PLC totalling 21,696,344 (2022: 18,842,270) were outstanding in respect of share-based compensation plans of PLC and its subsidiaries, including North American plans.
At 31 December 2023, the employee share ownership trust held 1,361,032 (2022: 2,727,097) PLC shares and PLC and its subsidiaries held 36,903 (2022: 327,303) PLC shares which are held as treasury shares.
The book value of €207 million (2022: €282 million) of the shares held by the trust and by Unilever PLC and its subsidiaries in respect of share-based compensation plans is eliminated on consolidation by deduction from other reserves. Their market value at 31 December 2023 was €60 million (2022: €144 million).
Shares held to satisfy awards are accounted for in accordance with IAS 32 ‘Financial Instruments: Presentation’. All differences between the purchase price of the shares held to satisfy awards granted and the proceeds received for the shares, whether on exercise or lapse, are charged to reserves.
Between 31 December 2023 and 22 February 2024 (the latest practicable date for inclusion in this report), nil shares were granted, 5,851,739 shares vested and 2,277,975 shares were forfeited related to the Performance Share Plans.
5. Net finance costs
| | | | | | | | | | | | | | |
Net finance costs are comprised of finance costs and finance income, including net finance costs in relation to pensions and similar obligations. Finance income includes income on cash and cash equivalents and income on other financial assets. Finance costs include interest costs in relation to financial liabilities. This includes interest on lease liabilities which represents the unwind of the discount rate applied to lease liabilities. Borrowing costs are recognised based on the effective interest method. |
|
| | | | | | | | | | | | | | |
| | € million | € million | € million |
| Net finance costs | Notes | 2023 | 2022 | 2021 |
| Finance costs | | (1,038) | | (818) | | (491) | |
| Bank loans and overdrafts | | (82) | | (44) | | (34) | |
Interest on bonds and other loans(a) | | (921) | | (673) | | (392) | |
| Interest on lease liabilities | | (72) | | (72) | | (72) | |
Net gain/(loss) on transactions for which hedge accounting is not applied(b) | | 37 | | (29) | | 7 | |
| On foreign exchange derivatives | | 86 | | 123 | | (68) | |
| Exchange difference on underlying items | | (49) | | (152) | | 75 | |
| | | | |
| Finance income | | 442 | | 281 | | 147 | |
| Pensions and similar obligations | 4B | 110 | | 44 | | (10) | |
| | | | |
| | | | |
| | | | |
| | (486) | | (493) | | (354) | |
(a)Interest on bonds and other loans includes the impact of interest rate derivatives that are part of hedge accounting relationships and the related recycling of results from the hedge accounting reserve. Includes an amount of €(16) million (2022: €(20) million) relating to unwinding of discount on deferred consideration for acquisitions.
(b)For further details of derivatives for which hedge accounting is not applied, please refer to note 16C.
| | | | | | | | |
Unilever Annual Report on Form 20-F 2023 | 191 |
| | | | | | | | |
| | |
| STRATEGIC REPORT | CORPORATE GOVERNANCE | FINANCIAL STATEMENTS |
| | |
Notes to the Consolidated Financial Statements Unilever Group |
6. Taxation
6A. Income tax
| | | | | | | | | | | | | | |
Income tax on the profit for the year comprises current and deferred tax. Income tax is recognised in the income statement except to the extent that it relates to items recognised directly in equity. Current tax is the expected tax payable on the taxable income for the year, using tax rates enacted or substantively enacted at the balance sheet date, and any adjustments to tax payable in respect of previous years. Current tax in the consolidated income statement will differ from the income tax paid in the consolidated cash flow statement primarily because of deferred tax arising on temporary differences and payment dates for income tax occurring after the balance sheet date. Unilever is subject to taxation in the many countries in which it operates. The tax legislation of these countries differs, is often complex and is subject to interpretation by management and the government authorities. These matters of judgement give rise to the need to create provisions for tax payments that may arise in future years with respect to transactions already undertaken. Provisions are made against individual exposures and take into account the specific circumstances of each case, including the strength of technical arguments, recent case law decisions or rulings on similar issues and relevant external advice. The provision is estimated based on one of two methods, the expected value method (the sum of the probability-weighted amounts in a range of possible outcomes) or the single most likely amount method, depending on which is expected to better predict the resolution of the uncertainty. |
|
|
|
|
|
|
| | | | | | | | | | | |
| € million | € million | € million |
| Tax charge in income statement | 2023 | 2022 | 2021 |
| Current tax | | | |
| Current year | (2,261) | | (2,206) | | (2,399) | |
| Over/(under) provided in prior years | 9 | | (61) | | 245 | |
| (2,252) | | (2,267) | | (2,154) | |
| Deferred tax | | | |
| Origination and reversal of temporary differences | 22 | | 153 | | 189 | |
| Changes in tax rates | 7 | | 28 | | 15 | |
| Recognition of previously unrecognised losses brought forward | 24 | | 18 | | 15 | |
| 53 | | 199 | | 219 | |
| (2,199) | | (2,068) | | (1,935) | |
The reconciliation between the computed weighted average rate of income tax expense, which is generally applicable to Unilever companies, and the actual rate of taxation charged is as follows:
| | | | | | | | | | | |
Reconciliation of effective tax rate | % 2023 | % 2022 | % 2021 |
Computed rate of tax(a) | 25 | | 25 | | 23 | |
| Differences between computed rate of tax and effective tax rate due to: | | | |
| Incentive tax credits | (2) | | (2) | | (2) | |
| Withholding tax on dividends | 2 | | 2 | | 2 | |
| Expenses not deductible for tax purposes | 1 | | 1 | | 1 | |
| Irrecoverable withholding tax | 1 | | 1 | | 1 | |
| Income tax reserve adjustments – current and prior year | (1) | | – | | (1) | |
| Impact of disposals | (2) | | (6) | | – | |
| Others | – | | (1) | | (1) | |
| Effective tax rate | 24 | | 20 | | 23 | |
(a)The computed tax rate used is the average of the standard rate of tax applicable in the countries in which Unilever operates, weighted by the amount of profit before taxation generated in each of those countries. For this reason, the rate may vary from year to year according to the mix of profit and related tax rates.
Our tax rate is reduced by incentive tax credits, the benefit from preferential tax regimes that have been legislated by the countries and provinces concerned in order to promote economic development and investment. The tax rate is increased by business expenses which are not deductible for tax, such as entertainment costs and some interest expense and by irrecoverable withholding taxes on dividends paid by subsidiary companies and on other cross-border payments such as royalties and service fees, which cannot be offset against other taxes due. Uncertain tax provisions excluding the related interest amounted to €820 million (2022: €822 million). This includes €434 million (2022: €374 million) related to the Horlicks intangible amortisation in India.
The Group's future tax charge and effective tax rate could be affected by several factors, including changes in tax laws and their interpretation, the implementation of the OECD Pillars 1 and 2, EU and US tax changes, as well as the impact of acquisitions, disposals and restructuring of our business.
Pillar Two legislation has been enacted or substantively enacted in certain jurisdictions in which the Group operates and the legislation will be effective for the Group’s financial year beginning 1 January 2024. We have performed an assessment of the Group’s potential exposure to Pillar Two income taxes based on the most recent financial information available regarding the constituent entities in the Group. Based on the assessment, the Pillar Two effective tax rates in most of the jurisdictions in which the Group operates are above 15%. However, there are a limited number of jurisdictions where the transitional safe harbour relief is unlikely to apply and the Pillar Two effective tax rate is expected to be below 15%. We estimate that the combined impact of the implementation by countries of qualified domestic minimum top-up taxes and the income inclusion rule in the UK will be in the range of 0-0.2% increase to the Group ETR for 2024.
| | | | | |
192 | Unilever Annual Report on Form 20-F 2023 |
| | | | | | | | |
| | |
| STRATEGIC REPORT | CORPORATE GOVERNANCE | FINANCIAL STATEMENTS |
| | |
Notes to the Consolidated Financial Statements Unilever Group |
6B. Deferred tax
| | | | | | | | | | | | | | |
Deferred tax is recognised using the liability method on taxable temporary differences between the tax base and the accounting base of items included in the balance sheet of the Group. Certain temporary differences are not provided for as follows: ■goodwill not deductible for tax purposes; ■the initial recognition of assets or liabilities that affect neither accounting nor taxable profit; and ■differences relating to investments in subsidiaries to the extent that it is probable that they will not reverse in the foreseeable future. The amount of deferred tax provided is based on the expected manner of realisation or settlement of the carrying amount of assets and liabilities, using tax rates enacted, or substantively enacted, at the year end. A deferred tax asset is recognised only to the extent that it is probable that future taxable profits will be available against which the asset can be utilised. Deferred tax assets are reduced to the extent that it is no longer probable that the related tax benefit will be realised. |
|
|
|
|
|
| | | | | | | | | | | | | | | | | | | | | | | | | | |
| € million | € million | € million | € million | € million | € million | € million | € million |
| Movements in 2023 and 2022 | As at 1 January 2023 | Income statement | Other | As at 31 December 2023 | As at 1 January 2022 | Income Statement | Other | As at 31 December 2022 |
| Pensions and similar obligations | (613) | | (90) | | 189 | | (514) | | (654) | | (44) | | 85 | | (613) | |
| Provisions and accruals | 741 | | 103 | | (39) | | 805 | | 726 | | 12 | | 3 | | 741 | |
| Goodwill and intangible assets | (3,848) | | (10) | | 161 | | (3,697) | | (3,448) | | 135 | | (535) | | (3,848) | |
| Accelerated tax depreciation | (700) | | 47 | | 81 | | (572) | | (600) | | (60) | | (40) | | (700) | |
| Tax losses | 231 | | (3) | | 6 | | 234 | | 172 | | 100 | | (41) | | 231 | |
| Fair value gains | (42) | | 0 | | 2 | | (40) | | (60) | | (11) | | 29 | | (42) | |
| Fair value losses | 36 | | (2) | | (11) | | 23 | | 2 | | 6 | | 28 | | 36 | |
| Share-based payments | 194 | | 30 | | 22 | | 246 | | 166 | | 18 | | 10 | | 194 | |
| Lease liability | 237 | | (34) | | (14) | | 189 | | 295 | | (55) | | (3) | | 237 | |
| Right of use asset | (201) | | 30 | | 5 | | (166) | | (244) | | 42 | | 1 | | (201) | |
Other(a) | 639 | | (18) | | (11) | | 610 | | 580 | | 56 | | 3 | | 639 | |
| (3,326) | | 53 | | 391 | | (2,882) | | (3,065) | | 199 | | (460) | | (3,326) | |
(a)The deferred tax-other includes the recognition of an asset of €300 million (2022: €311 million) relating to the impact of the expected outcome of the Mutual Agreement Procedure which Unilever applied for following the conclusion of the UK tax audit for the tax years 2011-2018.
At the balance sheet date, the Group had unused tax losses of €1,313 million (2022: €1,352 million) and tax credits amounting to €832 million (2022: €893 million) available for offset against future taxable profits. Deferred tax assets have not been recognised in respect of unused tax losses of €602 million (2022: €668 million) and tax credits of €418 million (2022: €448 million), as it is not probable that there will be future taxable profits within the entities against which the losses and credits can be utilised. Of these losses, €168 million (2022: €196 million) have expiry dates, being corporate income tax losses in the US, Korea and China which expire between now and 2042.
Where deferred tax assets have been recognised in respect of losses, the evidence considered includes the reason for the loss, potential planning strategies to utilise the loss, including where permitted merger with other profitable entities and the availability of future taxable profits against which the losses can be utilised. Profit forecasts used are consistent with those used in other areas of the business.
Deferred tax assets have not been recognised in respect of other deductible temporary differences of €515 million (2022: €269 million) as it is not expected they will be utilised. Of these differences, €409 million (2022: €199 million) relates to limitation on the deduction of interest expenses. There is no expiry date for these differences.
At the balance sheet date, the aggregate amount of temporary differences associated with undistributed earnings of subsidiaries for which deferred tax liabilities have not been recognised was €2,610 million (2022: €2,420 million). No liability has been recognised in respect of these differences because the Group is in a position to control the timing of the reversal of the temporary differences, and it is probable that such differences will not reverse in the foreseeable future.
Deferred tax assets and liabilities are offset when there is a legally enforceable right to set off current tax assets against current tax liabilities and when the deferred income taxes relate to the same fiscal authority. The following amounts, determined after appropriate offsetting, are shown in the consolidated balance sheet:
| | | | | | | | | | | | | | | | | | | | |
| € million | € million | € million | € million | € million | € million |
| Deferred tax assets and liabilities | Assets 2023 | Assets 2022 | Liabilities 2023 | Liabilities 2022 | Total 2023 | Total 2022 |
| Pensions and similar obligations | 199 | | 195 | | (713) | | (808) | | (514) | | (613) | |
| Provisions and accruals | 503 | | 489 | | 302 | | 252 | | 805 | | 741 | |
| Goodwill and intangible assets | 51 | | 105 | | (3,748) | | (3,953) | | (3,697) | | (3,848) | |
| Accelerated tax depreciation | (18) | | (93) | | (554) | | (607) | | (572) | | (700) | |
| Tax losses | 201 | | 188 | | 33 | | 43 | | 234 | | 231 | |
| Fair value gains | (1) | | 1 | | (39) | | (43) | | (40) | | (42) | |
| Fair value losses | – | | – | | 23 | | 36 | | 23 | | 36 | |
| Share-based payments | 84 | | 51 | | 162 | | 143 | | 246 | | 194 | |
| Lease liability | 94 | | 102 | | 95 | | 135 | | 189 | | 237 | |
| Right of use asset | (92) | | (92) | | (74) | | (109) | | (166) | | (201) | |
| Other | 92 | | 103 | | 518 | | 536 | | 610 | | 639 | |
| 1,113 | | 1,049 | | (3,995) | | (4,375) | | (2,882) | | (3,326) | |
| Of which deferred tax to be recovered/(settled) after more than 12 months | 756 | | 700 | | (4,199) | | (4,492) | | (3,443) | | (3,792) | |
| | | | | | | | |
Unilever Annual Report on Form 20-F 2023 | 193 |
| | | | | | | | |
| | |
| STRATEGIC REPORT | CORPORATE GOVERNANCE | FINANCIAL STATEMENTS |
| | |
Notes to the Consolidated Financial Statements Unilever Group |
6C. Tax on items recognised in equity or other comprehensive income
| | | | | | | | | | | | | | |
| Income tax is recognised in equity or other comprehensive income for items recognised directly in equity or other comprehensive income. |
Tax effects directly recognised in equity or other comprehensive income were as follows:
| | | | | | | | | | | | | | | | | | | | |
| € million | € million | € million | € million | € million | € million |
| Movements in 2023 and 2022 | Before tax 2023 | Tax (charge)/credit 2023 | After tax 2023 | Before tax 2022 | Tax (charge)/credit 2022 | After tax 2022 |
| Gains/(losses) on: | | | | | | |
| Equity instruments at fair value through other comprehensive income | (38) | | 10 | | (28) | | 31 | | 5 | | 36 | |
| Cash flow hedges | (10) | | (17) | | (27) | | (121) | | 30 | | (91) | |
| Remeasurement of defined benefit pension plans | (745) | | 235 | | (510) | | (537) | | 64 | | (473) | |
| Currency retranslation gains/(losses) | (1,460) | | (1) | | (1,461) | | 547 | | 67 | | 614 | |
| (2,253) | | 227 | | (2,026) | | (80) | | 166 | | 86 | |
7. Earnings per share
| | | | | | | | | | | | | | |
The earnings per share calculations are based on the average number of share units representing the ordinary shares of PLC in issue during the period, less the average number of shares held as treasury shares. In calculating diluted earnings per share, a number of adjustments are made to the number of shares, principally, the exercise of share plans by employees. |
|
|
Earnings per share for total operations for the 12 months were as follows:
| | | | | | | | | | | |
| € | € | € |
| 2023 | 2022 | 2021 |
| Basic earnings per share | 2.58 | | 3.00 | | 2.33 | |
| Diluted earnings per share | 2.56 | | 2.99 | | 2.32 | |
| | | | | | | | | | | |
| Millions of share units |
| Calculation of average number of share units | 2023 | 2022 | 2021 |
| Average number of shares | 2,587.0 | | 2,629.2 | | 2,629.2 | |
| | | |
| Less: treasury shares held by employee share trusts and companies | (71.1) | | (81.0) | | (29.3) | |
| Average number of shares – used for basic earnings per share | 2,515.9 | | 2,548.2 | | 2,599.9 | |
| Add: dilutive effect of share-based compensation plans | 16.5 | | 11.6 | | 9.7 | |
| Diluted average number of shares – used for diluted and underlying earnings per share | 2,532.4 | | 2,559.8 | | 2,609.6 | |
| | | | | | | | | | | |
| € million | € million | € million |
| Calculation of earnings | 2023 | 2022 | 2021 |
| Net profit | 7,140 | | 8,269 | | 6,621 | |
| Non-controlling interests | (653) | | (627) | | (572) | |
| Net profit attributable to shareholders’ equity – used for basic and diluted earnings per share | 6,487 | | 7,642 | | 6,049 | |
8. Dividends on ordinary capital
| | | | | | | | | | | | | | |
Dividends are recognised on the date that the shareholder’s right to receive payment is established. This is generally the date when the dividend is declared. |
| | | | | | | | | | | |
| € million | € million | € million |
| 2023 | 2022 | 2021 |
| Dividends on ordinary capital during the year | (4,327) | | (4,356) | | (4,458) | |
Four quarterly interim dividends were declared and paid during 2023, totalling £1.50 (2022: £1.45) per PLC ordinary share.
A quarterly dividend of €1,067 million (2022: €1,086 million) was declared on 8 February 2024, to be paid in March 2024; £0.36 per PLC ordinary share (2022: £0.38). Total dividends declared in relation to 2023 were £1.48 (2022: £1.48) per PLC ordinary share.
| | | | | |
194 | Unilever Annual Report on Form 20-F 2023 |
| | | | | | | | |
| | |
| STRATEGIC REPORT | CORPORATE GOVERNANCE | FINANCIAL STATEMENTS |
| | |
Notes to the Consolidated Financial Statements Unilever Group |
9. Goodwill and intangible assets
| | | | | | | | | | | | | | |
Goodwill Goodwill is initially recognised based on the accounting policy for business combinations (see note 21). Goodwill is subsequently measured at cost less amounts provided for impairment. Goodwill acquired in a business combination is assessed to determine whether new cash generating units (CGUs) are created, and if not, is allocated to the Group’s CGUs, or groups of CGUs (GCGUs) in line with the structure detailed below. These might not always be the same as the CGUs or GCGUs that include the assets and liabilities of the acquired business. |
Intangible assets Separately purchased intangible assets are initially measured at cost, being the purchase price as at the date of acquisition. On acquisition of new interests in group companies, Unilever recognises any specifically identifiable intangible assets separately from goodwill. These intangible assets are initially measured at fair value as at the date of acquisition. Expenditure to support development of internally produced intangible assets is recognised in profit or loss as incurred. Indefinite-life intangibles mainly comprise trademarks and brands, for which there is no foreseeable limit to the period over which they are expected to generate net cash inflows. These are considered to have an indefinite life, given the strength and durability of our brands and the level of marketing support. These assets are not amortised but are subject to a review for impairment annually, or more frequently if events or circumstances indicate this is necessary. Finite-life intangible assets mainly comprise software, patented and non-patented technology, know-how and customer lists. These assets are amortised on a straight-line basis in the income statement over the period of their expected useful lives, or the period of legal rights if shorter. None of the amortisation periods exceeds ten years. |
Cash generating units The Group’s assets are grouped into cash generating units (CGUs) which are the smallest identifiable group of assets that generates largely independent cash inflows. The Group's CGUs are aligned with our organisation structure of Business Units and Global Business Units. For impairment testing purposes, goodwill is allocated to groups of CGUs (GCGUs) which are based on the five Business Groups since the synergies acquired through a business combination benefit a Business Group as a whole rather than a specific Business Unit or Global Business Unit. Cash inflows relating to indefinite-life intangible assets are identifiable at Business Unit or Global Business Unit level and are therefore allocated to individual CGUs. |
Impairment review The impairment test is performed by comparing the carrying value of the CGUs or GCGUs with their recoverable value. The recoverable value is primarily based on value in use but also considers fair value less costs of disposal where relevant. Any impairment is charged to the income statement as it arises. |
| | | | | | | | | | | | | | | | | |
| € million | Goodwill | Indefinite-life
intangible assets | Finite-life intangible assets | Total |
| Movements during 2023 | Software | Other |
| Cost | | | | | |
| 1 January 2023 | 22,766 | | 18,516 | | 3,317 | | 1,137 | | 45,736 | |
Additions through business combinations(a) | 326 | | 430 | | – | | – | | 756 | |
| Disposal of businesses | (56) | | – | | – | | (7) | | (63) | |
| Reclassification to held for sale | (65) | | (467) | | – | | – | | (532) | |
| Additions | – | | 2 | | 239 | | 2 | | 243 | |
| Disposals and other movements | – | | (2) | | (71) | | 7 | | (66) | |
| Hyperinflationary adjustment | (173) | | (12) | | (5) | | – | | (190) | |
| Currency retranslation | (532) | | (500) | | 3 | | (15) | | (1,044) | |
| 31 December 2023 | 22,266 | | 17,967 | | 3,483 | | 1,124 | | 44,840 | |
| Accumulated amortisation and impairment | | | | | |
| 1 January 2023 | (1,157) | | (350) | | (2,730) | | (1,010) | | (5,247) | |
| Amortisation/impairment for the year | – | | – | | (187) | | (41) | | (228) | |
| Disposals and other movements | (1) | | – | | 72 | | 7 | | 78 | |
| Currency retranslation | 1 | | 5 | | 4 | | 13 | | 23 | |
| 31 December 2023 | (1,157) | | (345) | | (2,841) | | (1,031) | | (5,374) | |
Net book value 31 December 2023(b) | 21,109 | | 17,622 | | 642 | | 93 | | 39,466 | |
| | | | | | | | |
Unilever Annual Report on Form 20-F 2023 | 195 |
| | | | | | | | |
| | |
| STRATEGIC REPORT | CORPORATE GOVERNANCE | FINANCIAL STATEMENTS |
| | |
Notes to the Consolidated Financial Statements Unilever Group |
9. Goodwill and intangible assets continued
| | | | | | | | | | | | | | | | | |
| € million | Goodwill | Indefinite-life
intangible assets | Finite-life intangible assets | Total |
| Movements during 2022 | Software | Other |
| Cost | | | | | |
| 1 January 2022 | 21,489 | | 17,681 | | 3,189 | | 1,114 | | 43,473 | |
| Additions through business combinations | 585 | | 603 | | – | | – | | 1,188 | |
| Disposal of businesses | (16) | | (4) | | (3) | | – | | (23) | |
| Reclassification to held for sale(c) | – | | (25) | | (4) | | – | | (29) | |
| Additions | – | | – | | 251 | | 2 | | 253 | |
| Disposals and other movements | – | | (2) | | (24) | | (5) | | (31) | |
| Hyperinflationary adjustment | 116 | | 17 | | – | | – | | 133 | |
| Currency retranslation | 592 | | 246 | | (92) | | 26 | | 772 | |
| 31 December 2022 | 22,766 | | 18,516 | | 3,317 | | 1,137 | | 45,736 | |
| Accumulated amortisation and impairment | | | | | |
| 1 January 2022 | (1,159) | | (211) | | (2,609) | | (903) | | (4,882) | |
| Amortisation/impairment for the year | – | | (146) | | (216) | | (93) | | (455) | |
| Disposals and other movements | 1 | | – | | 32 | | 5 | | 38 | |
| Currency retranslation | 1 | | 7 | | 63 | | (19) | | 52 | |
| 31 December 2022 | (1,157) | | (350) | | (2,730) | | (1,010) | | (5,247) | |
| Net book value 31 December 2022 | 21,609 | | 18,166 | | 587 | | 127 | | 40,489 | |
(a)Includes the provisional fair value of goodwill and intangibles for acquisitions made in 2023 as well as subsequent changes in the fair value of goodwill and intangibles for the acquisitions made in 2022 where the initial acquisition accounting was provisional at the end of 2022. See note 21 for further details.
(b)Within indefinite-life intangible assets there are five existing brands that have a significant carrying value: Horlicks €2,640 million (2022: €2,759 million), Knorr €1,838 million (2022: €1,839 million), Paula's Choice €1,699 million (2022: €1,764 million), Carver Korea €1,370 million (2022: €1,456 million) and Hellmann’s €1,226 million (2022: €1,261 million).
(c)Goodwill and intangibles in relation to Elida Beauty amounting to €532 million were reclassified as held for sale.
Significant CGUs
The goodwill and indefinite-life assets held in the GCGUs and CGUs shown below are considered significant within the total carrying amounts of goodwill and indefinite-life intangible as at 31 December 2023.
| | | | | | | | |
| 2023 GCGUs | 2022 GCGUs |
| € billion | € billion |
| Goodwill | Goodwill |
| Beauty & Wellbeing | 4.6 | | 4.9 | |
| Personal Care | 3.9 | | 4.1 | |
| Home Care | 0.9 | | 0.9 | |
| Nutrition | 8.0 | | 8.3 | |
| Ice Cream | 3.7 | | 3.4 | |
| Total GCGUs | 21.1 | | 21.6 | |
| | | | | | | | |
| 2023 CGUs | 2022 CGUs |
| € billion | € billion |
| Indefinite- life intangible assets | Indefinite- life intangible assets |
| Nutrition South Asia | 3.2 | | 3.3 | |
| Nutrition Europe, ANZ & METU | 1.3 | | 1.4 | |
| Nutrition North America | 1.0 | | 1.0 | |
| Prestige | 2.7 | | 2.8 | |
| Beauty & Wellbeing North Asia | 1.4 | | 1.5 | |
| Health & Wellness | 1.6 | | 1.6 | |
| Total Significant CGUs | 11.2 | | 11.6 | |
Others(a) | 6.4 | | 6.6 | |
| Total CGUs | 17.6 | | 18.2 | |
(a)Included within Others are individually insignificant amounts of intangible assets.
| | | | | |
196 | Unilever Annual Report on Form 20-F 2023 |
| | | | | | | | |
| | |
| STRATEGIC REPORT | CORPORATE GOVERNANCE | FINANCIAL STATEMENTS |
| | |
Notes to the Consolidated Financial Statements Unilever Group |
9. Goodwill and intangible assets continued
Key assumptions
In performing our annual impairment testing, the recoverable amount of each CGU has been calculated based on its value in use, estimated as the present value of projected future cash flows. Each GCGU's value in use is based on the aggregated value in use of the CGUs grouped under the respective GCGU.
Projected cash flows include specific estimates for a period of five years. The growth rates and operating margins used to estimate cash flows for the five years are based on past performance and on the Group’s three-year strategic plan, de-risked to ensure reasonability and extended to years four and five. The Group's three-year strategic plan factors in initiatives we are undertaking to reduce carbon emissions in line with our CTAP and impacts of climate change on our operational costs. The growth rates used in this exercise for GCGUs and significant CGUs are set out below:
For the year 2023
| | | | | | | | | | | | | | | | | |
| Group of CGUs | Beauty & Wellbeing | Personal Care | Home Care | Nutrition | Ice Cream |
| Longer-term sustainable growth rates | 3 | % | 2 | % | 3 | % | 2 | % | 2 | % |
| Average near-term nominal growth rates | 6 | % | 4 | % | 3 | % | 3 | % | 6 | % |
| | | | | |
| | | | | | | | | | | | | | | | | | | | |
| Significant CGUs | Nutrition
South Asia | Nutrition
Europe, ANZ & METU | Nutrition
North America | Prestige | Beauty & Wellbeing
North Asia | Health & Wellness |
| Longer-term sustainable growth rates | 5 | % | 1 | % | 1 | % | 2 | % | 2 | % | 1 | % |
| Average near-term nominal growth rates | 5 | % | 1 | % | 4 | % | 11 | % | 2 | % | 12 | % |
| | | | | | |
For the year 2022
| | | | | | | | | | | | | | | | | |
| Group of CGUs | Beauty & Wellbeing | Personal Care | Home Care | Nutrition | Ice Cream |
| Longer-term sustainable growth rates | 3 | % | 3 | % | 4 | % | 3 | % | 3 | % |
| Average near-term nominal growth rates | 6 | % | 3 | % | 4 | % | 5 | % | 6 | % |
| | | | | |
| | | | | | | | | | | | | | | | | | | | |
| Significant CGUs | Nutrition
South Asia | Nutrition
Europe, ANZ & METU | Nutrition
North America | Prestige | Beauty & Wellbeing
North Asia | Health & Wellness |
| Longer-term sustainable growth rates | 7 | % | 2 | % | 2 | % | 2 | % | 4 | % | 2 | % |
| Average near-term nominal growth rates | 7 | % | 2 | % | 4 | % | 11 | % | 3 | % | 17 | % |
| | | | | | |
The estimated cash flows after year five are extrapolated using a longer-term sustainable growth rate, which is determined as the lower of our own three-year average growth projection and external forecasts for the relevant market.
In 2023, the projected cash flows are discounted using pre-tax discount rates. The discount rates are specific to each CGU and are determined based on the weighted average cost of capital, including a market and country risk premium. Given the higher number of CGUs spread across different markets, the CGU discount rates are in the range 8.4%–20.0% (2022: 7.4%–11.8%).
There are no reasonably possible changes in key assumptions that would cause the carrying amount of any CGU to exceed its recoverable amount.
10. Property, plant and equipment
| | | | | | | | | | | | | | |
The Group’s property, plant and equipment is comprised of owned assets (note 10A) and leased assets (note 10B). Property, plant and equipment is measured at cost including eligible borrowing costs less depreciation and accumulated impairment losses.
Property, plant and equipment is subject to review for impairment if triggering events or circumstances indicate that this is necessary. If an indication of impairment exists, the asset’s or cash generating unit’s recoverable amount is estimated and any impairment loss is charged to the income statement as it arises. |
Owned assets Owned assets are initially measured at historical cost. Depreciation is provided on a straight-line basis over the expected average useful lives of the assets. Residual values and useful lives are reviewed at least annually. The review of residual values and useful lives have taken into consideration the impacts of climate change and the actions we undertake to mitigate and adapt against these climate-related risks and there is no material impact on the income statement for this year. Estimated useful lives by major class of assets are as follows: |
■freehold buildings (no depreciation on freehold land) | 40 years |
■leasehold land and buildings | 40 years (or life of lease if less) |
■plant and equipment | 2-20 years |
Leased assets The cost of a leased asset is measured as the lease liability at inception of the lease contract and other direct costs less any incentives granted by the lessor. The Group has not capitalised leases which are less than 12 months or leases of low-value assets. These mainly relate to IT equipment, office equipment, furniture and fitting and other peripheral items. When a lease liability is remeasured, the related lease asset is adjusted by the same amount. Depreciation is provided on a straight-line basis from the commencement date of the lease to the end of the lease term.
|
| | | | | | | | |
Unilever Annual Report on Form 20-F 2023 | 197 |
| | | | | | | | |
| | |
| STRATEGIC REPORT | CORPORATE GOVERNANCE | FINANCIAL STATEMENTS |
| | |
Notes to the Consolidated Financial Statements Unilever Group |
10. Property, plant and equipment continued
| | | | | | | | | | | |
| | € million | € million |
Property, plant and equipment | Notes | 2023 | 2022 |
| Owned assets | 10A | 9,377 | | 9,416 | |
| Leased assets | 10B | 1,330 | | 1,354 | |
| Total | | 10,707 | | 10,770 | |
10A. Owned assets
| | | | | | | | | | | |
| € million | € million | € million |
| Movements during 2023 | Land and
buildings | Plant and
equipment | Total |
Cost | | | |
| 1 January 2023 | 4,708 | | 15,108 | | 19,816 | |
| Additions through business combinations | – | | 1 | | 1 | |
| Additions | 280 | | 1,222 | | 1,502 | |
| Disposals and other movements | (96) | | (766) | | (862) | |
| Hyperinflationary adjustment | 29 | | (111) | | (82) | |
| Reclassification as held for sale | 6 | | (13) | | (7) | |
| Currency retranslation | (256) | | (484) | | (740) | |
| 31 December 2023 | 4,671 | | 14,957 | | 19,628 | |
Accumulated depreciation | | | |
| 1 January 2023 | (1,599) | | (8,801) | | (10,400) | |
| Depreciation charge for the year | (116) | | (833) | | (949) | |
| Disposals and other movements | 80 | | 635 | | 715 | |
| Hyperinflationary adjustment | 6 | | 112 | | 118 | |
| Reclassification as held for sale | (6) | | 9 | | 3 | |
| Currency retranslation | 36 | | 226 | | 262 | |
| 31 December 2023 | (1,599) | | (8,652) | | (10,251) | |
Net book value 31 December 2023(a) | 3,072 | | 6,305 | | 9,377 | |
| Includes capital expenditures for assets under construction | 189 | | 1,057 | | 1,246 | |
(a)Includes €471 million of freehold land.
The Group has commitments to purchase property, plant and equipment of €583 million (2022: €356 million).
| | | | | | | | | | | |
| € million | € million | € million |
| Movements during 2022 | Land and
buildings | Plant and
equipment | Total |
| Cost | | | |
| 1 January 2022 | 4,266 | | 14,462 | | 18,728 | |
| Additions through business combinations | 0 | | 0 | | 0 | |
| Additions | 391 | | 1,065 | | 1,456 | |
| Disposals and other movements | (80) | | (858) | | (938) | |
| Hyperinflationary adjustment | 152 | | 536 | | 688 | |
| Reclassification as held for sale | (11) | | (56) | | (67) | |
| Currency retranslation | (10) | | (41) | | (51) | |
| 31 December 2022 | 4,708 | | 15,108 | | 19,816 | |
Accumulated depreciation | | | |
| 1 January 2022 | (1,508) | | (8,387) | | (9,895) | |
| Depreciation charge for the year | (120) | | (897) | | (1,017) | |
| Disposals and other movements | 66 | | 762 | | 828 | |
| Hyperinflationary adjustment | (36) | | (287) | | (323) | |
| Reclassification as held for sale | 6 | | 18 | | 24 | |
| Currency retranslation | (7) | | (10) | | (17) | |
| 31 December 2022 | (1,599) | | (8,801) | | (10,400) | |
Net book value 31 December 2022(a) | 3,109 | | 6,307 | | 9,416 | |
| Includes capital expenditures for assets under construction | 104 | | 960 | | 1,064 | |
(a)Includes €504 million of freehold land.
| | | | | |
198 | Unilever Annual Report on Form 20-F 2023 |
| | | | | | | | |
| | |
| STRATEGIC REPORT | CORPORATE GOVERNANCE | FINANCIAL STATEMENTS |
| | |
Notes to the Consolidated Financial Statements Unilever Group |
10B. Leased assets
| | | | | | | | | | | |
| € million | € million | € million |
| Movements during 2023 | Land and
buildings | Plant and
equipment | Total |
Cost | | | |
| 1 January 2023 | 2,655 | | 650 | | 3,305 | |
| Additions through business combinations | 2 | | – | | 2 | |
| Additions | 365 | | 175 | | 540 | |
| Disposals and other movements | (307) | | (216) | | (523) | |
| Hyperinflationary adjustment | (1) | | – | | (1) | |
| Reclassification as held for sale | (12) | | (3) | | (15) | |
| Currency retranslation | (77) | | (23) | | (100) | |
| 31 December 2023 | 2,625 | | 583 | | 3,208 | |
Accumulated depreciation | | | |
| 1 January 2023 | (1,580) | | (371) | | (1,951) | |
| Depreciation charge for the year | (292) | | (109) | | (401) | |
| Disposals and other movements | 245 | | 166 | | 411 | |
| Reclassification as held for sale | 9 | | 3 | | 12 | |
| Currency retranslation | 40 | | 11 | | 51 | |
| 31 December 2023 | (1,578) | | (300) | | (1,878) | |
| Net book value 31 December 2023 | 1,047 | | 283 | | 1,330 | |
| | | | | | | | | | | |
| € million | € million | € million |
| Movements during 2022 | Land and
buildings | Plant and
equipment | Total |
Cost | | | |
| 1 January 2022 | 2,667 | | 661 | | 3,328 | |
| Additions through business combinations | – | | – | | – | |
| Additions | 281 | | 111 | | 392 | |
| Disposals and other movements | (303) | | (108) | | (411) | |
| Hyperinflationary adjustment | 3 | | – | | 3 | |
| Reclassification as held for sale | 1 | | – | | 1 | |
| Currency retranslation | 6 | | (14) | | (8) | |
| 31 December 2022 | 2,655 | | 650 | | 3,305 | |
Accumulated depreciation | | | |
| 1 January 2022 | (1,461) | | (353) | | (1,814) | |
| Depreciation charge for the year | (322) | | (118) | | (440) | |
| Disposals and other movements | 205 | | 91 | | 296 | |
| Reclassification as held for sale | 2 | | – | | 2 | |
| Currency retranslation | (4) | | 9 | | 5 | |
| 31 December 2022 | (1,580) | | (371) | | (1,951) | |
| Net book value 31 December 2022 | 1,075 | | 279 | | 1,354 | |
Our leases mainly comprise of land and buildings and plant and equipment. The Group leases land and buildings for manufacturing, warehouse facilities and office space and also sublets some property. Plant and equipment includes leases for vehicles.
The Group has recognised in the income statement, a charge of €117 million (2022: €105 million) for short-term leases and €64 million (2022: €74 million) on leases for low-value assets.
During the year, the Group recognised income of €11 million (2022: €12 million) from sublet properties.
The total cash outflow relating to leases was €465 million (2022: €590 million).
Lease liabilities are shown in note 15 on pages 203 and 207.
| | | | | | | | |
Unilever Annual Report on Form 20-F 2023 | 199 |
| | | | | | | | |
| | |
| STRATEGIC REPORT | CORPORATE GOVERNANCE | FINANCIAL STATEMENTS |
| | |
Notes to the Consolidated Financial Statements Unilever Group |
11. Other non-current assets
| | | | | | | | | | | | | | |
Joint ventures are undertakings in which the Group has an interest and which are jointly controlled by the Group and one or more other parties. Associates are undertakings where the Group has an investment in which it does not have control or joint control but can exercise significant influence. Interests in joint ventures and associates are accounted for using the equity method and are stated in the consolidated balance sheet at cost, adjusted for the movement in the Group’s share of their net assets and liabilities. The Group’s share of the profit or loss after tax of joint ventures and associates is included in the Group’s consolidated profit before taxation. Where the Group’s share of losses exceeds its interest in the equity-accounted investee, the carrying amount of the investment is reduced to zero and the recognition of further losses is discontinued, except to the extent that the Group has an obligation to make payments on behalf of the investee. |
|
|
|
|
| | | | | | | | |
| € million | € million |
| 2023 | 2022 |
| Interest in net assets of joint ventures | 70 | | 65 | |
| Interest in net assets of associates | 24 | | 19 | |
Long-term trade and other receivables(a) | 394 | | 520 | |
Other non-current assets(b) | 423 | | 338 | |
| 911 | | 942 | |
(a)Including indirect tax receivables where we do not have the contractual right to receive payment within 12 months.
(b)Includes direct tax assets, withholding tax assets, interest on tax assets, contingent assets and investment properties.
| | | | | | | | |
| € million | € million |
| Movements during 2023 and 2022 | 2023 | 2022 |
Joint ventures(a) | | |
| 1 January | 65 | | 37 | |
| Additions | 10 | | 3 | |
| Dividends received/reductions | (241) | | (189) | |
| Share of net profit/(loss) | 235 | | 213 | |
| Currency retranslation | 1 | | 1 | |
| 31 December | 70 | | 65 | |
| Associates | | |
| 1 January | 19 | | 23 | |
| Additions | 8 | | 6 | |
| Dividend received/reductions | (5) | | (4) | |
| Share of net profit/(loss) | (4) | | (5) | |
| Currency retranslation | 6 | | (1) | |
| 31 December | 24 | | 19 | |
(a)Our principal joint ventures are Unilever FIMA LDA in Portugal, Binzagr Unilever Distribution in the Middle East, the Pepsi Lipton Tea Partnership in the US and Pepsi Lipton International Ltd for the rest of the world.
The joint ventures and associates have no contingent liabilities to which the Group is exposed, and the Group has no contingent liabilities in relation to its interests in the joint ventures and associates.
The Group has no outstanding capital commitments to joint ventures.
Outstanding balances with joint ventures and associates are shown in note 23 on page 224.
12. Inventories
| | | | | | | | | | | | | | |
Inventories are valued at the lower of weighted average cost and net realisable value. Cost comprises direct costs and, where appropriate, a proportion of attributable production overheads. Net realisable value is the estimated selling price less the estimated costs necessary to make the sale. |
|
| | | | | | | | |
| € million | € million |
| Inventories | 2023 | 2022 |
| Raw materials and consumables | 1,815 | | 2,062 | |
| Finished goods and goods for resale | 3,662 | | 4,248 | |
| Total inventories | 5,477 | | 6,310 | |
| Provision for inventories | (358) | | (379) | |
| 5,119 | | 5,931 | |
| | | | | |
200 | Unilever Annual Report on Form 20-F 2023 |
| | | | | | | | |
| | |
| STRATEGIC REPORT | CORPORATE GOVERNANCE | FINANCIAL STATEMENTS |
| | |
Notes to the Consolidated Financial Statements Unilever Group |
12. Inventories continued | | | | | | | | |
| € million | € million |
| Provision for inventories | 2023 | 2022 |
| 1 January | 379 | | 308 | |
| Charge to income statement | 80 | | 164 | |
| Reduction/(releases) | (63) | | (66) | |
| Currency translations | (32) | | (12) | |
Others(a) | (6) | | (15) | |
| 31 December | 358 | | 379 | |
(a)Others include the amount relating to the acquisition/disposal of businesses and transfers.
Inventories with a value of €173 million (2022: €189 million) are carried at net realisable value, this being lower than cost. During 2023, a total expense of €413 million (2022: €407 million) was recognised in the income statement for inventory write-downs and losses.
13. Trade and other current receivables
| | | | | | | | | | | | | | |
Trade and other current receivables are initially recognised at fair value plus any directly attributable transaction costs. Subsequently, except for derivatives (see note 16 on page 208), these assets are held at amortised cost, using the effective interest method and net of any impairment losses. Discounts payable to customers are shown as a reduction in trade receivables when there is a legal right and intent to settle them on a net basis. |
We do not consider the fair values of trade and other current receivables to be significantly different from their carrying values. Concentrations of credit risk with respect to trade receivables are limited, due to the Group’s customer base being large and diverse. Our historical experience of collecting receivables, supported by the level of default, is that credit risk is low across territories and so trade receivables are considered to be a single class of financial assets. Impairment for trade receivables are calculated for specific receivables with known or anticipated issues affecting the likelihood of recovery and for balances past due with a probability of default based on historical data as well as relevant forward-looking information.
| | | | | | | | |
| € million | € million |
| Trade and other current receivables | 2023 | 2022 |
| Due within one year | | |
| Trade receivables | 4,023 | | 4,544 | |
| Prepayments and accrued income | 516 | | 969 | |
| Other receivables | 1,236 | | 1,543 | |
| 5,775 | | 7,056 | |
Included within trade receivables are discounts due to our customers of €2,528 million (2022: €2,436 million). Other receivables comprise financial assets of €256 million (2022: €317 million) and non-financial assets of €979 million (2022: €1,226 million). Financial assets include supplier and customer deposits, employee advances and certain derivatives. Non-financial assets mainly consist of reclaimable sales tax of €581 million (2022: €753 million). | | | | | | | | |
| € million | € million |
| Ageing of trade receivables | 2023 | 2022 |
| Not overdue | 3,522 | | 3,919 | |
| Past due less than three months | 401 | | 498 | |
| Past due more than three months but less than six months | 67 | | 96 | |
| Past due more than six months but less than one year | 90 | | 69 | |
| Past due more than one year | 141 | | 150 | |
| Total trade receivables | 4,221 | | 4,732 | |
| Impairment provision for trade receivables | (198) | | (188) | |
| 4,023 | | 4,544 | |
The total impairment provision includes €198 million (2022: €188 million) for current trade receivables, €11 million (2022: €22 million) for other current receivables and €13 million (2022: €68 million) for non-current trade and other receivables.
| | | | | | | | |
| € million | € million |
| Impairment provision for total trade and other receivables | 2023 | 2022 |
| 1 January | 278 | | 286 | |
| Charge to income statement | 34 | | 27 | |
| Reduction/releases | (82) | | (44) | |
| Reclassifications | (3) | | 4 | |
| Currency translations | (5) | | 5 | |
| 31 December | 222 | | 278 | |
| | | | | | | | |
Unilever Annual Report on Form 20-F 2023 | 201 |
| | | | | | | | |
| | |
| STRATEGIC REPORT | CORPORATE GOVERNANCE | FINANCIAL STATEMENTS |
| | |
Notes to the Consolidated Financial Statements Unilever Group |
14. Trade payables and other liabilities
| | | | | | | | | | | | | | |
Trade payables Trade payables are initially recognised at fair value less any directly attributable transaction costs. Trade payables are subsequently measured at amortised cost, using the effective interest method. Other liabilities Other liabilities are initially recognised at fair value less any directly attributable transaction costs. Subsequent measurement depends on the type of liability: ■accruals are subsequently measured at amortised cost, using the effective interest method; ■social security and sundry taxes are subsequently measured at amortised cost, using the effective interest method; ■deferred consideration is subsequently measured at fair value with changes in the income statement as explained below; and ■others are subsequently measured either at amortised cost, using the effective interest method or at fair value, with changes being recognised in the income statement. |
Deferred consideration Deferred consideration represents any payments to the sellers of a business that occur after the acquisition date. These typically comprise contingent consideration and fixed deferred consideration: ■fixed deferred consideration is a payment with a due date after acquisition that is not dependent on future conditions; and ■contingent consideration is a payment which is dependent on certain conditions being met in the future and is often variable. All deferred consideration is initially recognised at fair value as at the acquisition date, which includes a present value discount. Subsequently, deferred consideration is measured to reflect the unwinding of discount on the liability, with changes recognised in finance cost within the income statement. In the balance sheet, it is remeasured to reflect the latest estimate of the achievement of the conditions on which the consideration is based; changes in value other than the discount unwind are recognised as acquisition and disposal-related costs in the income statement. |
We do not consider the fair values of trade payables and other liabilities to be significantly different from their carrying values.
| | | | | | | | |
| € million | € million |
| Trade payables and other liabilities | 2023 | 2022 |
| Current: due within one year | | |
| Trade payables | 10,355 | | 11,100 | |
| Accruals | 5,057 | | 5,232 | |
| Social security and sundry taxes | 512 | | 626 | |
| Deferred consideration | 167 | | 78 | |
| Others | 766 | | 987 | |
| 16,857 | | 18,023 | |
| Non-current: due after more than one year | | |
| Accruals | 105 | | 141 | |
| Deferred consideration | 5 | | 102 | |
| Others | 28 | | 27 | |
| 138 | | 270 | |
| Total trade payables and other liabilities | 16,995 | | 18,293 | |
Included within trade payables and other liabilities are discounts due to our customers of €2,294 million (2022: €2,121 million).
Included within others are IT and consulting services.
Deferred consideration
At 31 December 2023, the total balance of deferred consideration for acquisitions is €172 million (2022: €180 million), which includes contingent consideration of €157 million (2022: €164 million). These contingent consideration payments are dependent on acquired businesses achieving contractually agreed financial targets (mainly relates to cumulative increases in turnover and profit before tax) until 2025, with a maximum contractual amount of €681 million.
Supplier financing arrangements for trade payables
Some of our suppliers elect to factor some of their receivables from the Group with financial institutions. In some instances, we provide suppliers and/or banks with visibility of invoices approved for payment, which helps them receive cash from the bank before the invoice due date, if they choose to do so. Payment dates and terms for Unilever do not vary based on whether the supplier chooses to factor their receivable. If a receivable is purchased by a third-party bank, that third-party bank does not benefit from additional security when compared to the security originally enjoyed by the supplier. The Group evaluates these arrangements to assess if the payable holds the characteristics of a trade payable or should be classified as a financial liability. At 31 December 2023 and 31 December 2022, all such liabilities were classified as trade payables.
In May 2023, the IASB issued the final amendments to IAS 7 and IFRS 7 which address the disclosure requirements to enhance the transparency of supplier finance arrangements and their effects on a company’s liabilities, cash flows and exposure to liquidity risk. We will first make these disclosures in the 2024 Annual Report and Accounts.
| | | | | |
202 | Unilever Annual Report on Form 20-F 2023 |
| | | | | | | | |
| | |
| STRATEGIC REPORT | CORPORATE GOVERNANCE | FINANCIAL STATEMENTS |
| | |
Notes to the Consolidated Financial Statements Unilever Group |
15. Capital and funding
| | | | | | | | | | | | | | |
Ordinary shares Ordinary shares are classified as equity. Incremental costs directly attributable to the issue of ordinary shares are recognised as a deduction from equity, net of any tax effects. |
Share-based compensation The Group operates a number of share-based compensation plans involving awards of ordinary shares. Full details of these plans are given in note 4C on pages 190 and 191. |
Unification reserve The Group recognised a separate Unification Reserve within Equity as a result of PLC Share Premium that arose from Unification. |
Other reserves Other reserves include the fair value reserve, the foreign currency translation reserve, the capital redemption reserve and treasury shares. |
Shares held by employee share trusts and group companies An employee share trust and group companies purchase and hold shares to satisfy performance shares granted and other share awards (see note 4C). The assets and liabilities of the trust and shares held by the trust and group companies are included in the consolidated financial statements. The book value of shares held is deducted from other reserves, and the trust’s borrowings are included in the Group’s liabilities. The costs of the trust are included in the results of the Group. The shares held by the trust and group companies are excluded from the calculation of earnings per share. |
Financial liabilities Financial liabilities are initially recognised at fair value, less any directly related transaction costs. When bonds are designated as being part of a fair value hedge relationship, in those cases bonds are carried at amortised cost, adjusted for the fair value of the risk being hedged, with changes in value shown in the income statement. Put options are initially recognised at the present value of the expected gross obligation, with changes in value being recognised in the income statement. Other financial liabilities, which includes put options, are subsequently carried at amortised cost, with the exception of: ■financial liabilities which the Group has elected to measure at fair value through profit or loss; ■derivative financial liabilities – see note 16 on page 208; and ■contingent consideration recognised by an acquirer in a business combination to which IFRS 3 applies. Such contingent consideration is subsequently measured at fair value through profit or loss. |
Lease liabilities Lease liabilities are initially measured at the present value of the lease payments that are not yet paid at the start of the lease term. This is discounted using an appropriate borrowing rate determined by the Group, where none is readily available in the lease contract. The lease liability is subsequently reduced by cash payments and increased by interest costs. The lease liability is remeasured when the Group assesses that there will be a change in the amount expected to be paid during the lease term. |
The Group’s Treasury activities are designed to:
■maintain a competitive balance sheet in line with at least A/A2 rating (see below);
■secure funding at lowest costs for the Group’s operations, M&A activity and external dividend payments (see below);
■protect the Group’s financial results and position from financial risks (see note 16);
■maintain market risks within acceptable parameters, while optimising returns (see note 16); and
■protect the Group’s financial investments, while maximising returns (see note 17).
The Treasury department provides central deposit-taking, funding and foreign exchange management services for the Group’s operations. The department is governed by standards and processes which are approved by Unilever Leadership Executive (ULE). In addition to guidelines and exposure limits, a system of authorities and extensive independent reporting covers all major areas of activity. Performance is monitored closely by senior management. Reviews are undertaken periodically by corporate audit.
Key instruments used by the Treasury department are:
■short-term and long-term borrowings;
■cash and cash equivalents; and
■plain vanilla derivatives, including interest rate swaps and foreign exchange contracts.
The Treasury department maintains a list of approved financial instruments. The use of any new instrument must be approved by the Chief Financial Officer. The use of leveraged instruments is not permitted.
Unilever considers the following components of its balance sheet to be managed capital:
■total equity – retained profit, other reserves, share capital, share premium, non-controlling interests (notes 15A and 15B);
■short-term debt – current financial liabilities (note 15C); and
■long-term debt – non-current financial liabilities (note 15C).
The Group manages its capital so as to safeguard its ability to continue as a going concern and to optimise returns to our shareholders through an appropriate balance of debt and equity. The capital structure of the Group is based on management’s judgement of the appropriate balance of key elements in order to meet its strategic and day-to-day needs. We consider the amount of capital in proportion to risk and manage the capital structure in light of changes in economic conditions and the risk characteristics of the underlying assets.
Our current long-term credit rating is A+/A1 and our short-term credit rating is A1/P1. We aim to maintain a competitive balance sheet which we consider to be the equivalent of a credit rating of at least A/A2 in the long term. This provides us with:
■appropriate access to the debt and equity markets;
■sufficient flexibility for acquisitions;
■sufficient resilience against economic and financial uncertainty while ensuring ample liquidity; and
■optimal weighted average cost of capital, given the above constraints.
Unilever monitors the qualitative and quantitative factors utilised by the rating agencies. This information is publicly available and is updated by the credit rating agencies on a regular basis.
| | | | | | | | |
Unilever Annual Report on Form 20-F 2023 | 203 |
| | | | | | | | |
| | |
| STRATEGIC REPORT | CORPORATE GOVERNANCE | FINANCIAL STATEMENTS |
| | |
Notes to the Consolidated Financial Statements Unilever Group |
15A. Share capital
| | | | | | | | |
| £ million | £ million |
| Unilever PLC | 2023 | 2022 |
PLC ordinary shares of 31/9 p each(a) | 78.3 | | 81.8 | |
| | |
| | | | | | | | |
| Unilever Group | € million | € million |
Euro equivalent in millions(b) | 88 | | 92 | |
(a)At 31 December 2023, 2,516,597,338 (2022: 2,629,243,772) of PLC ordinary shares were in issue. During the year 100,000 new shares were issued and 112,746,434 shares were cancelled.
(b)The ordinary share capital of PLC is translated using the conversion rate as at the date of Unification of £1 = €1.121.
The Company's constitutional documents place no limitations on the right to hold or transfer the Company's shares. The Company's shares are fully paid and no further contribution of capital may be required by the Company from shareholders. All ordinary shares rank equally with regard to participation in dividends and to share in the proceeds of the Company's residual assets on a winding up of the Company. Shareholders may, by ordinary resolution, declare final dividends, but not in excess of the amount recommended by the board or directors of the Company. Shareholders are entitled to one vote per ordinary share.
15B. Equity
Basis of consolidation
Unilever is the majority shareholder of all material subsidiaries and has control in all cases. Information in relation to significant subsidiaries is provided in note 27 on page 226. Subsidiaries with significant non-controlling interests
Unilever has one subsidiary company which has a material non-controlling interest, Hindustan Unilever Limited (HUL). Summary financial information in relation to HUL is shown below.
| | | | | | | | |
| € million | € million |
| HUL balance sheet as at 31 December | 2023 | 2022 |
| Non-current assets | 6,221 | | 6,354 | |
| Current assets | 2,004 | | 1,604 | |
| Current liabilities | (1,315) | | (1,258) | |
| Non-current liabilities | (1,531) | | (1,152) | |
| HUL comprehensive income for the year ended 31 December | | |
| Turnover | 6,636 | | 6,828 | |
| Profit after tax | 1,147 | | 1,190 | |
| Total comprehensive income | 937 | | 940 | |
| | | | | | | | |
| € million | € million |
| HUL cash flow for the year ended 31 December | 2023 | 2022 |
| Net increase/(decrease) in cash and cash-equivalents | (22) | | 95 | |
| | |
| HUL non-controlling interest | | |
| 1 January | (2,115) | | (2,146) | |
| Share of (profit)/loss for the year ended 31 December | (437) | | (454) | |
| Other comprehensive income | (1) | | (3) | |
| Dividend paid to the non-controlling interest | 405 | | 395 | |
| Currency translation | 80 | | 97 | |
| Other movements in equity | 20 | | (4) | |
| 31 December | (2,048) | | (2,115) | |
Analysis of other reserves
| | | | | | | | | | | |
| € million | € million | € million |
| Total 2023 | Total 2022 | Total 2021 |
| Fair value reserves – see following table | 392 | | 329 | | 502 | |
| Currency retranslation of group companies – see following table | (7,432) | | (5,803) | | (6,043) | |
| Capital redemption reserve | 25 | | 21 | | 21 | |
| Book value of treasury shares – see following table | (207) | | (282) | | (388) | |
Repurchase of shares | (6,034) | | (4,527) | | (3,018) | |
| Cancellation of PLC shares | 5,282 | | — | | — | |
Other(a) | (544) | | (542) | | (284) | |
| (8,518) | | (10,804) | | (9,210) | |
(a)Relates primarily to options to purchase non-controlling interest in subsidiaries.
Unilever acquired 31,734,256 of its own shares (2022: 34,217,605) of its own shares through purchases on the stock exchanges during the year, which includes the share buyback programme as explained in note 24. 112,746,434 of PLC ordinary shares were cancelled during the year and the remaining shares were held as treasury shares as a separate component of other reserves.
At 31 December 2023, 1,361,032 shares were held by employee share ownership trust and 36,903 shares were held by other group companies in connection with share-based compensation plans. The shares held by the employee share trust are shown as a deduction from other reserves. The total number of treasury shares held in connection with share-based compensation plans at 31 December 2022 was 3,054,400 shares. (See note 4C on pages 190 and 191. | | | | | |
204 | Unilever Annual Report on Form 20-F 2023 |
| | | | | | | | |
| | |
| STRATEGIC REPORT | CORPORATE GOVERNANCE | FINANCIAL STATEMENTS |
| | |
Notes to the Consolidated Financial Statements Unilever Group |
15B. Equity continued
| | | | | | | | |
| € million | € million |
| Treasury shares – movements during the year | 2023 | 2022 |
| 1 January | (4,809) | | (3,406) | |
| Repurchase of shares | (1,507) | | (1,509) | |
| Cancellation of PLC shares | 5,282 | | — | |
| Other purchases and utilisations | 75 | | 106 | |
| 31 December | (959) | | (4,809) | |
| | | | | | | | |
| € million | € million |
| Currency retranslation reserves – movements during the year | 2023 | 2022 |
| 1 January | (5,803) | | (6,043) | |
| Currency retranslation of group companies' net assets and liabilities during the year | (1,514) | | 212 | |
| Movement in net investment hedges and exchange differences in net investments in foreign operations | (115) | | 28 | |
| 31 December | (7,432) | | (5,803) | |
| | | | | | | | |
| € million | € million |
| Fair value reserves – movements during the year | 2023 | 2022 |
| 1 January | 329 | | 502 | |
| Movements in Other comprehensive income, net of tax | | |
| Gains/(losses) on equity instruments | (27) | | 45 | |
| Gains/(losses) on cash flow hedges | (27) | | (92) | |
| Hedging gains/(losses) transferred to non-financial assets | 117 | | (126) | |
| 31 December | 392 | | 329 | |
Refer to the consolidated statement of comprehensive income on page 173, the consolidated statement of changes in equity on page 174, and note 6C on page 194. Remeasurement of defined benefit pension plans, net of tax
| | | | | | | | |
| € million | € million |
| 2023 | 2022 |
| 1 January | 330 | | 803 | |
| Movement during the year | (510) | | (473) | |
| 31 December | (180) | | 330 | |
Refer to the consolidated statement of comprehensive income on page 173, the consolidated statement of changes in equity on page 174, note 4B from pages 185 to 190 and note 6C on page 194. Currency retranslation gains/(losses) – movements during the year
| | | | | | | | |
| € million | € million |
| 2023 | 2022 |
| 1 January | (5,883) | | (6,497) | |
| Currency retranslation during the year: | | |
| Other reserves | (1,629) | | 240 | |
| Retained profit | 294 | | 487 | |
| Non-controlling interest | (126) | | (113) | |
| 31 December | (7,344) | | (5,883) | |
| | | | | | | | |
Unilever Annual Report on Form 20-F 2023 | 205 |
| | | | | | | | |
| | |
| STRATEGIC REPORT | CORPORATE GOVERNANCE | FINANCIAL STATEMENTS |
| | |
Notes to the Consolidated Financial Statements Unilever Group |
15C. Financial liabilities
| | | | | | | | | | | | | | | | | | | | |
| € million | € million | € million | € million | € million | € million |
Financial liabilities(a) | Current 2023 | Non-Current 2023 | Total 2023 | Current 2022 | Non-Current 2022 | Total 2022 |
Bank loans and overdrafts(b) | 501 | | 5 | | 506 | | 508 | | 11 | | 519 | |
| Bonds and other loans | 4,066 | | 22,626 | | 26,692 | | 4,723 | | 21,789 | | 26,512 | |
| Lease liabilities | 334 | | 1,061 | | 1,395 | | 340 | | 1,068 | | 1,408 | |
| Derivatives | 48 | | 446 | | 494 | | 102 | | 529 | | 631 | |
Other financial liabilities(c) | 138 | | 397 | | 535 | | 102 | | 316 | | 418 | |
| 5,087 | | 24,535 | | 29,622 | | 5,775 | | 23,713 | | 29,488 | |
(a)For the purposes of this note and note 17A, financial assets and liabilities exclude trade and other current receivables and trade payables and other liabilities which are covered in notes 13 and 14 respectively.
(b)Bank loans and overdrafts include €5 million (2022: €4 million) of secured liabilities.
(c)Includes options and financial liabilities to acquire non-controlling interests in the US, Myanmar, India, Italy and Hong Kong, refer to note 21.
Reconciliation of liabilities arising from financing activities
| | | | | | | | | | | | | | | | | | | | | | | |
| | | Non-cash movement | |
| | | | | | | |
Movements in 2023 and 2022 | Opening
balance at
1 January | Cash
movement | Business
acquisi-
tions/
disposals | Foreign
exchange
changes | Fair
value
changes | Other
movements | Closing
balance at
31 December |
| € million | € million | € million | € million | € million | € million | € million |
| 2023 | | | | | | | |
Bank loans and overdrafts(a) | (519) | | (98) | | (9) | | 130 | | – | | (10) | | (506) | |
Bonds and other loans(a) | (26,512) | | (413) | | (3) | | 403 | | (159) | | (8) | | (26,692) | |
Lease liabilities(b) | (1,408) | | 399 | | 12 | | 55 | | – | | (453) | | (1,395) | |
| Derivatives | (631) | | – | | – | | 7 | | 130 | | – | | (494) | |
Other financial liabilities(a) | (418) | | – | | (44) | | 19 | | (81) | | (11) | | (535) | |
| Total | (29,488) | | (112) | | (44) | | 614 | | (110) | | (482) | | (29,622) | |
| | | | | | | |
| 2022 | | | | | | | |
Bank loans and overdrafts(a) | (402) | | (129) | | – | | 29 | | – | | (17) | | (519) | |
Bonds and other loans(a) | (27,621) | | 1,343 | | – | | (727) | | 490 | | 3 | | (26,512) | |
Lease liabilities(b) | (1,649) | | 546 | | – | | 12 | | – | | (317) | | (1,408) | |
| Derivatives | (184) | | – | | – | | (2) | | (448) | | 3 | | (631) | |
Other financial liabilities(a) | (277) | | 4 | | – | | 17 | | 108 | | (270) | | (418) | |
| Total | (30,133) | | 1,764 | | – | | (671) | | 150 | | (598) | | (29,488) | |
| | | | | | | |
(a)These cash movements are included within the following lines in the consolidated cash flow statement: net change in short-term borrowings, additional financial liabilities and repayment of financial liabilities. The difference of €(14) million (2022: €9 million) represents cash movements in overdrafts that are not included in financing cash flows.
(b)Lease liabilities cash movement is included within capital element of lease payments in the consolidated cash flow statement. The difference of €5 million (2022: €28 million) represents gain or loss from termination and modification of lease contracts.
| | | | | |
206 | Unilever Annual Report on Form 20-F 2023 |
| | | | | | | | |
| | |
| STRATEGIC REPORT | CORPORATE GOVERNANCE | FINANCIAL STATEMENTS |
| | |
Notes to the Consolidated Financial Statements Unilever Group |
15C. Financial liabilities continued – Analysis of bonds and other loans
| | | | | | | | |
| € million | Total 2023 | Total 2022 |
Unilever PLC | | |
1.375% Notes 2024 (£) | 288 | | 282 | |
1.875% Notes 2029 (£) | 286 | | 281 | |
1.500% Notes 2026 (£) | 575 | | 563 | |
1.500% Notes 2039 (€) | 647 | | 646 | |
2.125% Notes 2028 (£)(a) | 320 | | 300 | |
| Total PLC | 2,116 | | 2,072 | |
Other group companies | | |
| The Netherlands | | |
1.625% Notes 2033 (€) | 794 | | 794 | |
1.375% Notes 2029 (€) | 746 | | 745 | |
1.125% Bonds 2027 (€) | 698 | | 698 | |
1.125% Bonds 2028 (€) | 697 | | 696 | |
0.875% Notes 2025 (€) | 649 | | 649 | |
0.500% Bonds 2025 (€) | 649 | | 648 | |
1.375% Notes 2030 (€) | 645 | | 644 | |
0.375% Notes 2023 (€) | – | | 600 | |
1.000% Notes 2027 (€) | 599 | | 599 | |
1.000% Notes 2023 (€) | – | | 500 | |
0.500% Notes 2023 (€) | – | | 500 | |
0.500% Notes 2024 (€) | 500 | | 498 | |
1.250% Notes 2025 (€) | 1,000 | | 999 | |
1.750% Notes 2030 (€) | 996 | | 995 | |
1.250% Notes 2031 (€)(a) | 576 | | 539 | |
2.250% Notes 2034 (€)(a) | 786 | | 735 | |
0.750% Notes 2026 (€)(a) | 475 | | 458 | |
1.750% Notes 2028 (€) | 645 | | 645 | |
3.250% Notes 2031 (€) | 495 | | – | |
3.500% Notes 2035 (€) | 496 | | – | |
| | |
| United States | | |
5.900% Bonds 2032 (US $) | 897 | | 932 | |
2.900% Notes 2027 (US $) | 897 | | 930 | |
3.500% Notes 2028 (US $) | 716 | | 742 | |
2.000% Notes 2026 (US $) | 629 | | 651 | |
3.125% Notes 2023 (US $) | – | | 516 | |
3.250% Notes 2024 (US $) | 452 | | 468 | |
3.100% Notes 2025 (US $) | 450 | | 467 | |
2.600% Notes 2024 (US $) | 451 | | 468 | |
3.500% Bonds 2028 (US $) | 449 | | 465 | |
3.375% Notes 2025 (US $) | 315 | | 327 | |
7.250% Bonds 2026 (US $) | 267 | | 276 | |
6.625% Bonds 2028 (US $) | 214 | | 221 | |
5.600% Bonds 2097 (US $) | 83 | | 86 | |
2.125% Notes 2029 (US $) | 762 | | 790 | |
2.600% Notes 2024 (US $) | 453 | | 473 | |
1.375% Notes 2030 (US $)(a) | 368 | | 368 | |
0.375% Notes 2023 (US $) | – | | 469 | |
0.626% Notes 2024 (US $) | 452 | | 469 | |
2.625% Notes 2051 (US $) | 576 | | 598 | |
1.750% Notes 2031 (US $)(a) | 640 | | 644 | |
3.300% Notes 2029 (€) | 549 | | – | |
3.400% Notes 2033 (€) | 694 | | – | |
4.875% Notes 2028 (US $) | 630 | | – | |
5.000% Notes 2033 (US $) | 714 | | – | |
| Commercial Paper (US $) | 1,465 | | 2,057 | |
| | |
| Other countries | | |
Switzerland | 6 | | 81 | |
Others | 1 | | – | |
| Total other group companies | 24,576 | | 24,440 | |
| Total bonds and other loans | 26,692 | | 26,512 | |
(a)Bonds includes €(378) million (2022: €(537)million) fair value adjustment following the fair value hedge accounting of fixed-for-floating interest rate swaps.
Information in relation to the derivatives used to hedge bonds and other loans within a fair value hedge relationship is shown in note 16.
| | | | | | | | |
Unilever Annual Report on Form 20-F 2023 | 207 |
| | | | | | | | |
| | |
| STRATEGIC REPORT | CORPORATE GOVERNANCE | FINANCIAL STATEMENTS |
| | |
Notes to the Consolidated Financial Statements Unilever Group |
16. Treasury risk management
| | | | | | | | | | | | | | |
Derivatives and hedge accounting Derivatives are measured at fair value with any related transaction costs expensed as incurred. The treatment of changes in the value of derivatives depends on their use as explained below. (i) Fair value hedges(a) Certain derivatives are held to hedge the risk of changes in value of a specific bond or other loan. In these situations, the Group designates the liability and related derivative to be part of a fair value hedge relationship. The carrying value of the bond is adjusted by the fair value of the risk being hedged, with changes going to the income statement. Gains and losses on the corresponding derivative are also recognised in the income statement. The amounts recognised are offset in the income statement to the extent that the hedge is effective. Ineffectiveness may occur if the critical terms do not exactly match, or if there is a value adjustment resulting from a change in credit risk (in either the Group or the counter-party to the derivative) that is not matched by the hedged item. When the relationship no longer meets the criteria for hedge accounting, the fair value hedge adjustment made to the bond is amortised to the income statement using the effective interest method. (ii) Cash flow hedges(a) Derivatives are also held to hedge the uncertainty in timing or amount of future forecast cash flows. Such derivatives are classified as being part of cash flow hedge relationships. For an effective hedge, gains and losses from changes in the fair value of derivatives are recognised in equity. Cost of hedging, where material and opted for, is recorded in a separate account within equity. Any ineffective elements of the hedge are recognised in the income statement. Ineffectiveness may occur if there are changes to the expected timing of the hedged transaction. If the hedged cash flow relates to a non-financial asset, the amount accumulated in equity is subsequently included within the carrying value of that asset. For other cash flow hedges, amounts deferred in equity are taken to the income statement at the same time as the related cash flow. When a derivative no longer qualifies for hedge accounting, any cumulative gain or loss remains in equity until the related cash flow occurs. When the cash flow takes place, the cumulative gain or loss is taken to the income statement. If the hedged cash flow is no longer expected to occur, the cumulative gain or loss is taken to the income statement immediately. (iii) Net investment hedges(a) Certain derivatives are designated as hedges of the currency risk on the Group’s investment in foreign subsidiaries. The accounting policy for these arrangements is set out in note 1. (iv) Derivatives for which hedge accounting is not applied Derivatives not classified as hedges are held in order to hedge certain balance sheet items and commodity exposures. No hedge accounting is applied to these derivatives, which are carried at fair value with changes being recognised in the income statement. |
|
|
|
|
|
|
|
|
|
|
|
|
|
|
|
|
|
(a)Applying hedge accounting has not led to material ineffectiveness being recognised in the income statement for both 2023 and 2022. Fair value changes on basis spread is recorded in a separate account within equity.
The Group is exposed to the following risks that arise from its use of financial instruments, the management of which is described in the following sections:
■liquidity risk (see note 16A);
■market risk (see note 16B); and
■credit risk (see note 17B).
The Group’s risk management framework is established to set appropriate risk limits and controls, and to maintain adherence to these limits.
16A. Management of liquidity risk
Liquidity risk is the risk that the Group will face in meeting its obligations associated with its financial liabilities. The Group’s approach to managing liquidity is to ensure that it will have sufficient funds to meet its liabilities when due without incurring unacceptable losses. In doing this, management considers both normal and stressed conditions. A material and sustained shortfall in our cash flow could undermine the Group’s credit rating, impair investor confidence and also restrict the Group’s ability to raise funds.
The Group’s funding strategy was supported by cash delivery from the business, coupled with the proceeds from bond issuances. Surplus cash balances have been invested conservatively with low-risk counter-parties at maturities of primarily less than six months. In its liquidity assessment, the Group does not consider any supplier financing arrangements as these arrangements are non-recourse to Unilever and supplier payment dates and terms for Unilever do not vary based on whether the supplier chooses to use such financing arrangements.
Cash flow from operating activities provides the funds to service the financing of financial liabilities on a day-to-day basis. The Group seeks to manage its liquidity requirements by maintaining access to global debt markets through short-term and long-term debt programmes. In addition, Unilever has committed credit facilities for general corporate use.
On 31 December 2023, Unilever had undrawn revolving 364-day bilateral credit facilities in aggregate of $5,200 million and €2,600 million (2022: $5,200 million and €2,550 million ) with a 364-day term out. As part of the regular annual process, the intention is that these facilities will again be renewed in 2024.
| | | | | |
208 | Unilever Annual Report on Form 20-F 2023 |
| | | | | | | | |
| | |
| STRATEGIC REPORT | CORPORATE GOVERNANCE | FINANCIAL STATEMENTS |
| | |
Notes to the Consolidated Financial Statements Unilever Group |
16A. Management of liquidity risk continued
The following table shows Unilever’s contractually agreed undiscounted cash flows, including expected interest payments, which are payable under financial liabilities at the balance sheet date:
| | | | | | | | | | | | | | | | | | | | | | | | | | |
| € million | € million | € million | € million | € million | € million | € million | € million |
| Undiscounted cash flows | Due
within
1 year | Due
between
1 and
2 years | Due
between
2 and
3 years | Due
between
3 and
4 years | Due
between
4 and
5 years | Due
after
5 years | Total | Net carrying
amount as
shown in
balance
sheet |
| 2023 | | | | | | | | |
| Non-derivative financial liabilities: | | | | | | | | |
| Bank loans and overdrafts | (524) | | (1) | | (1) | | (1) | | (1) | | (3) | | (531) | | (506) | |
| Bonds and other loans | (4,650) | | (3,599) | | (2,480) | | (2,643) | | (4,092) | | (14,028) | | (31,492) | | (26,692) | |
| Lease liabilities | (407) | | (316) | | (260) | | (193) | | (153) | | (362) | | (1,691) | | (1,395) | |
| Other financial liabilities | (138) | | (352) | | (50) | | – | | – | | (2) | | (542) | | (535) | |
| Trade payables, accruals and other liabilities | (16,113) | | (63) | | (23) | | (16) | | (4) | | (26) | | (16,245) | | (16,245) | |
| Deferred consideration | (168) | | (5) | | – | | – | | – | | – | | (173) | | (172) | |
| (22,000) | | (4,336) | | (2,814) | | (2,853) | | (4,250) | | (14,421) | | (50,674) | | (45,545) | |
| Derivative financial liabilities: | | | | | | | | |
| Interest rate derivatives: | | | | | | | | (452) | |
| Derivative contracts – receipts | 542 | | 84 | | 84 | | 971 | | 54 | | 192 | | 1,927 | | |
| Derivative contracts – payments | (648) | | (150) | | (125) | | (1,020) | | (95) | | (326) | | (2,364) | | |
| Foreign exchange derivatives: | | | | | | | | (85) | |
| Derivative contracts – receipts | 7,704 | | – | | – | | – | | – | | – | | 7,704 | | |
| Derivative contracts – payments | (7,806) | | – | | – | | – | | – | | – | | (7,806) | | |
| Commodity derivatives: | | | | | | | | (22) | |
| Derivative contracts – receipts | – | | – | | – | | – | | – | | – | | – | | |
| Derivative contracts – payments | (22) | | – | | – | | – | | – | | – | | (22) | | |
| (230) | | (66) | | (41) | | (49) | | (41) | | (134) | | (561) | | (559) | |
| Total | (22,230) | | (4,402) | | (2,855) | | (2,902) | | (4,291) | | (14,555) | | (51,235) | | (46,104) | |
| 2022 | | | | | | | | |
| Non-derivative financial liabilities: | | | | | | | | |
| Bank loans and overdrafts | (529) | | (5) | | – | | – | | – | | (7) | | (541) | | (519) | |
| Bonds and other loans | (5,220) | | (3,102) | | (3,494) | | (2,369) | | (2,541) | | (14,176) | | (30,902) | | (26,512) | |
| Lease liabilities | (397) | | (320) | | (245) | | (196) | | (144) | | (347) | | (1,649) | | (1,408) | |
| Other financial liabilities | (104) | | (27) | | (290) | | – | | – | | – | | (421) | | (418) | |
| Trade payables, accruals and other liabilities | (17,166) | | (74) | | (28) | | (16) | | (12) | | (38) | | (17,334) | | (17,334) | |
| Deferred consideration | (79) | | (96) | | (14) | | – | | – | | – | | (189) | | (180) | |
| (23,495) | | (3,624) | | (4,071) | | (2,581) | | (2,697) | | (14,568) | | (51,036) | | (46,371) | |
| Derivative financial liabilities: | | | | | | | | |
| Interest rate derivatives: | | | | | | | | (529) | |
| Derivative contracts – receipts | 59 | | 59 | | 59 | | 59 | | 55 | | 249 | | 540 | | |
| Derivative contracts – payments | (106) | | (159) | | (142) | | (133) | | (114) | | (483) | | (1,137) | | |
| Foreign exchange derivatives: | | | | | | | | (217) | |
| Derivative contracts – receipts | 8,244 | | – | | – | | – | | – | | – | | 8,244 | | |
| Derivative contracts – payments | (8,469) | | – | | – | | – | | – | | – | | (8,469) | | |
| Commodity derivatives: | | | | | | | | (38) | |
| Derivative contracts – receipts | – | | – | | – | | – | | – | | – | | – | | |
| Derivative contracts – payments | (38) | | – | | – | | – | | – | | – | | (38) | | |
| (310) | | (100) | | (83) | | (74) | | (59) | | (234) | | (860) | | (784) | |
| Total | (23,805) | | (3,724) | | (4,154) | | (2,655) | | (2,756) | | (14,802) | | (51,896) | | (47,155) | |
The Group has sublet a small proportion of leased properties. Related future minimum sublease payments are €23 million (2022: €42 million).
| | | | | | | | |
Unilever Annual Report on Form 20-F 2023 | 209 |
| | | | | | | | |
| | |
| STRATEGIC REPORT | CORPORATE GOVERNANCE | FINANCIAL STATEMENTS |
| | |
Notes to the Consolidated Financial Statements Unilever Group |
16A. Management of liquidity risk continued
The following table shows cash flows for which cash flow hedge accounting is applied. The derivatives in the cash flow hedge relationships are expected to have an impact on profit and loss in the same periods as the cash flows occur.
| | | | | | | | | | | | | | | | | | | | | | | | | | |
| € million | € million | € million | € million | € million | € million | € million | € million |
| Due
within
1 year | Due
between
1 and
2 years | Due
between
2 and
3 years | Due
between
3 and
4 years | Due
between
4 and
5 years | Due
after
5 years | Total | Net carrying amount of related derivatives(a) |
| 2023 | | | | | | | | |
| Foreign exchange cash inflows | 2,807 | | – | | – | | – | | – | | – | | 2,807 | | – | |
| Foreign exchange cash outflows | (2,842) | | – | | – | | – | | – | | – | | (2,842) | | (6) | |
| Interest rate swaps cash inflows | 526 | | 68 | | 68 | | 959 | | 42 | | 1,387 | | 3,050 | | 48 | |
| Interest rate swaps cash outflows | (528) | | (68) | | (68) | | (978) | | (55) | | (1,387) | | (3,084) | | – | |
| Commodity contracts cash inflows | 8 | | – | | – | | – | | – | | – | | 8 | | 8 | |
| Commodity contracts cash outflows | (22) | | – | | – | | – | | – | | – | | (22) | | (22) | |
| 2022 | | | | | | | | |
| Foreign exchange cash inflows | 3,100 | | – | | – | | – | | – | | – | | 3,100 | | – | |
| Foreign exchange cash outflows | (3,180) | | – | | – | | – | | – | | – | | (3,180) | | (48) | |
| Interest rate swaps cash inflows | 564 | | 502 | | 27 | | 27 | | 952 | | – | | 2,072 | | 119 | |
| Interest rate swaps cash outflows | (464) | | (473) | | (13) | | (13) | | (923) | | – | | (1,886) | | – | |
| Commodity contracts cash inflows | 6 | | – | | – | | – | | – | | – | | 6 | | 6 | |
| Commodity contracts cash outflows | (38) | | – | | – | | – | | – | | – | | (38) | | (38) | |
(a)See note 16C.
16B. Management of market risk
Unilever’s size and operations result in it being exposed to the following market risks that arise from its use of financial instruments:
■commodity price risk;
■currency risk; and
■interest rate risk.
The above risks may affect the Group’s income and expenses, or the value of its financial instruments. The objective of the Group’s management of market risk is to maintain this risk within acceptable parameters, while optimising returns. Generally, the Group applies hedge accounting to manage the volatility in income statement arising from market risk.
Where the Group uses hedge accounting to mitigate the above risks, it is normally implemented centrally by either the Treasury or Commodity Risk Management teams, in line with their respective frameworks and strategies. Hedge effectiveness is determined at the inception of the hedge relationship, and through periodic prospective effectiveness assessments to ensure that an economic relationship continues to exist between the hedged item and hedging instrument. The Group generally enters into hedge relationships where the critical terms of the hedging instrument match exactly with the hedged item, meaning that the economic relationship between the hedged item and hedging instrument is evident, so only a qualitative assessment is performed. When a qualitative assessment is not considered sufficient, for example when the critical terms of the hedging instrument do not match exactly with the hedged item, a quantitative assessment of hedge effectiveness will also be performed. The hedge ratio is set on inception for all hedge relationships and is dependent on the alignment of the critical terms of the hedging instrument to the hedged item (in most instances these are matched, so the hedge ratio is 1:1).
| | | | | |
210 | Unilever Annual Report on Form 20-F 2023 |
| | | | | | | | |
| | |
| STRATEGIC REPORT | CORPORATE GOVERNANCE | FINANCIAL STATEMENTS |
| | |
Notes to the Consolidated Financial Statements Unilever Group |
16B. Management of market risk continued
The Group’s exposure to, and management of, these risks is explained below. It often includes derivative financial instruments, the uses of which are described in note 16C.
| | | | | | | | | | | | | | | | | | | | |
| Potential impact of risk | | Management policy and
hedging strategy | | Sensitivity to the risk |
| | | | | | |
(i) Commodity price risk The Group is exposed to the risk of changes in commodity prices in relation to its purchase of certain raw materials. At 31 December 2023, the Group had hedged its exposure to future commodity purchases with commodity derivatives valued at €342 million (2022: €576 million). Hedges of future commodity purchases resulted in cumulative losses of €79 million (2022: gain of €197 million) being reclassified to the income statement and losses of €34 million (2022: gain of €103 million) being recognised as a basis adjustment to inventory purchased. | | The Group uses commodity forwards, futures, swaps and option contracts to hedge against this risk. All commodity forward contracts hedge future purchases of raw materials and the contracts are settled either in cash or by physical delivery. The Group also hedges risk components of commodities where it is not possible to hedge the commodity in full. This is done with reference to the contract to purchase the hedged commodity. Commodity derivatives are generally designated as hedging instruments in cash flow hedge accounting relations. All commodity derivative contracts are done in line with approvals from the Global Commodity Executive which is chaired by the Unilever Chief Business Operations Officer (CBOO) or the Global Commodity Operating Team which is chaired by the Chief Procurement Officer. | | A 10% increase in commodity prices as at 31 December 2023 would have led to a €40 million gain on the commodity derivatives in the cash flow hedge reserve (2022: €58 million gain in the cash flow hedge reserve). A decrease of 10% in commodity prices on a full-year basis would have the equal but opposite effect. |
(ii) Currency risk Currency risk on sales, purchases and borrowings Because of Unilever’s global reach, it is subject to the risk that changes in foreign currency values impact the Group’s sales, purchases and borrowings. At 31 December 2023, the exposure to the Group from companies holding financial assets and liabilities other than in their functional currency amounted to €254 million (2022: €315 million). | | The Group manages currency exposures within prescribed limits, mainly through the use of forward foreign currency exchange contracts. Operating companies manage foreign exchange exposures within prescribed limits. The aim of the Group’s approach to management of currency risk is to leave the Group with no material residual risk.
| | As an estimation of the approximate impact of the residual risk, with respect to financial instruments, the Group has calculated the impact of a 10% change in exchange rates. Impact on income statement A 10% strengthening of the foreign currencies against the respective functional currencies of group companies would have led to approximately an additional €25 million loss in the income statement (2022: €32 million loss). A 10% weakening of the foreign currencies against the respective functional currencies of group companies would have led to an equal but opposite effect. Impact on equity – trade-related cash flow hedges A 10% strengthening of foreign currencies against the respective functional currencies of group companies hedging future trade cash flows and applying cash flow hedge accounting, would have led to €142 million loss (2022: €99 million loss) in equity. A 10% weakening of the same would have led to an equal but opposite effect. |
| | | | | | | | | | | | | | | | | | | | |
| | | | As at year end, the Group had the below notional amount of currency derivatives outstanding to which cash flow hedge accounting is applied: |
| | | | Currency | 2023 | 2022 |
| | | | EUR* | (951) | | (958) | |
| | | | GBP | (372) | | (408) | |
| | | | USD | 363 | | 764 | |
| | | | SEK | (97) | | (103) | |
| | | | CAD | (136) | | (86) | |
| | | | PLN | (42) | | (64) | |
| | | | Others | (181) | | (136) | |
| | | | Total | (1,416) | | (991) | |
| | | | * Euro exposure relates to group companies having non-euro functional currencies. |
| | | | | | | | |
Unilever Annual Report on Form 20-F 2023 | 211 |
| | | | | | | | |
| | |
| STRATEGIC REPORT | CORPORATE GOVERNANCE | FINANCIAL STATEMENTS |
| | |
Notes to the Consolidated Financial Statements Unilever Group |
16B. Management of market risk continued
| | | | | | | | | | | | | | | | | | | | |
| Potential impact of risk | | Management policy and
hedging strategy | | Sensitivity to the risk |
| | | | | | |
Currency risk on the Group’s net investments The Group is also subject to currency risk in relation to the translation of the net investments of its foreign operations into euros for inclusion in its consolidated financial statements. These net investments include Group financial loans, which are monetary items that form part of our net investment in foreign operations, of €13.0 billion (2022: €13.0 billion), of which €9.0 billion (2022: €8.8 billion) is denominated in GBP. In accordance with IAS 21, the exchange differences on these financial loans are booked through reserves. Part of the currency exposure on the Group’s investments is also managed using USD net investment hedges with a nominal value of €2.6 billion (2022: €2.8 billion) for USD. At 31 December 2023, the net exposure of the net investments in foreign currencies amounts to €26.2 billion (2022: €23.7 billion).
| | Unilever aims to minimise this currency risk on the Group’s net investment exposure by borrowing in local currency in the operating companies themselves. In some locations, however, the Group’s ability to do this is inhibited by local regulations, lack of local liquidity or by local market conditions. Treasury may decide on a case-by-case basis to actively hedge the currency exposure from net investment in foreign operations. This is done either through additional borrowings in the related currency, or through the use of forward foreign exchange contracts. Where local currency borrowings, or forward contracts, are used to hedge the currency risk in relation to the Group’s net investment in foreign subsidiaries, these relationships are designated as net investment hedges for accounting purposes. Exchange risk related to the principal amount of the USD denominated debt either forms part of hedging relationship itself, or is hedged through forward contracts. | | Impact on equity – net investment hedges A 10% strengthening of the euro against other currencies would have led to €260 million (2022: €280 million) loss in the equity on the net investment hedges used to manage the currency exposure on the Group’s investments. A 10% weakening of the euro against other currencies would have led to an equal but opposite effect. Impact on equity – net investments in group companies A 10% strengthening of the euro against all other currencies would have led to €2,620 million negative retranslation effect (2022:€2,370 million negative retranslation effect). A 10% weakening of the euro against all other currencies would have led to an equal but opposite effect. In line with accepted hedge accounting treatment and our accounting policy for financial loans, the retranslation differences would be recognised in equity. |
(iii) Interest rate risk(a) The Group is exposed to market interest rate fluctuations on its floating-rate debt. Increases in benchmark interest rates could increase the interest cost of our floating-rate debt and increase the cost of future borrowings. The Group’s ability to manage interest costs also has an impact on reported results. The Group does not have any material floating interest-bearing financial assets or any significant long-term fixed interest-bearing financial assets. Consequently, the Group’s interest rate risk arises mainly from financial liabilities other than lease liabilities. Taking into account the impact of interest rate swaps, at 31 December 2023, interest rates were fixed on approximately 70% of the expected financial liabilities (excluding lease liabilities) for 2024, and 59% for 2025 (68% for 2023 and 59% for 2024 at 31 December 2022). As at year end, the Group had the below notional amount of interest rate derivatives outstanding on which hedge accounting is applied: | | Unilever’s interest rate management approach aims for an optimal balance between fixed- and floating-rate interest rate exposures on expected financial liabilities. The objective of this approach is to minimise annual interest costs. This is achieved either by issuing fixed- or floating-rate long-term debt, or by modifying interest rate exposure through the use of interest rate swaps. The majority of the Group’s existing interest rate derivatives are designated as fair value hedges and are expected to be effective. The fair value movement of these derivatives is recognised in the income statement, along with any changes in the relevant fair value of the underlying hedged asset or liability. | | Impact on income statement Assuming that all other variables remain constant, a 1.0 percentage point increase in floating interest rates on a full-year basis as at 31 December 2023 would have led to an additional €77 million of additional finance cost (2022: €85 million additional finance costs). A 1.0 percentage point decrease in floating interest rates on a full-year basis would have led to an equal but opposite effect. Impact on equity – cash flow hedges Assuming that all other variables remain constant, a 1.0 percentage point increase in interest rates on a full-year basis as at 31 December 2023 would have led to an additional €7 million debit in equity from derivatives in cash flow hedge relationships (2022: €1 million credit). A 1.0 percentage point decrease in interest rates on a full-year basis would have led to an additional €8 million credit in equity from derivatives in cash flow hedge relationships (2022: €1 million debit). |
| | | | | | | | | | | | | | | | | | | | |
| € million | € million | | | | |
| Cash flow hedge | 2023 | 2022 | | | | |
| Currency | 2,605 | | 1,923 | | | | | |
| EUR | 1,250 | | – | | | | | |
| USD | 1,355 | | 1,923 | | | | | |
| Fair value hedge | | | | | | |
| Currency | 3,566 | | 3,606 | | | | | |
| EUR | 2,000 | | 2,000 | | | | | |
| USD | 1,220 | | 1,267 | | | | | |
| GBP | 346 | | 339 | | | | | |
| | | | | | |
| | | | | | | | | | | | | | | | | | | | |
For interest management purposes, transactions with a maturity shorter than six months from inception date are not included as fixed interest transactions. The average interest rate on short-term borrowings in 2023 was 5.9% (2022: 1.2%). | | | |
|
(a)See the weighted average amount of financial liabilities with fixed-rate interest shown in the following table.
| | | | | |
212 | Unilever Annual Report on Form 20-F 2023 |
| | | | | | | | |
| | |
| STRATEGIC REPORT | CORPORATE GOVERNANCE | FINANCIAL STATEMENTS |
| | |
Notes to the Consolidated Financial Statements Unilever Group |
16B. Management of market risk continued
The following table shows the split in fixed- and floating-rate interest exposures, taking into account the impact of interest rate swaps:
| | | | | | | | |
| € million | € million |
| 2023 | 2022 |
| Current financial liabilities | (5,087) | | (5,775) | |
| Non-current financial liabilities | (24,535) | | (23,713) | |
| Total financial liabilities | (29,622) | | (29,488) | |
| Less: lease liabilities | (1,395) | | (1,408) | |
| Financial liabilities (excluding lease liabilities) | 28,227 | | 28,080 | |
| Of which: | | |
| Fixed rate (weighted average amount of fixing for the following year) | (20,527) | | (19,594) | |
16C. Derivatives and hedging
The Group does not use derivative financial instruments for speculative purposes. The uses of derivatives and the related values of derivatives are summarised in the following table. Derivatives used to hedge:
| | | | | | | | | | | | | | | | | | | | | | | | | | | | | |
| € million | € million | € million | € million | € million | € million | € million |
| Trade
and other
receivables |
Current
financial
assets | Non-Current
financial
assets | Trade
payables
and other
liabilities | Current
financial
liabilities | Non-Current
financial
liabilities | Total |
| 31 December 2023 | | | | | | | | | |
| Foreign exchange derivatives | | | | | | | | | |
| Fair value hedges | – | | – | | | – | | – | | – | | | – | | – | |
| Cash flow hedges | 22 | | – | | | – | | (28) | | – | | | – | | (6) | |
| Hedges on the net investment in foreign operations | – | | – | | | – | | – | | (42) | | (a) | – | | (42) | |
| Hedge accounting not applied | 7 | | 37 | | (a) | – | | (15) | | – | | | – | | 29 | |
| Interest rate derivatives | | | | | | | | | |
| Fair value hedges | – | | – | | | – | | – | | – | | | (425) | | (425) | |
| Cash flow hedges | – | | – | | | 75 | | – | | (6) | | | (21) | | 48 | |
| Hedge accounting not applied | – | | – | | | – | | – | | – | | | – | | – | |
| Commodity contracts | | | | | | | | | |
| Cash flow hedges | 8 | | – | | | – | | (22) | | – | | | – | | (14) | |
| Hedge accounting not applied | – | | – | | | – | | – | | – | | | – | | – | |
| 37 | | 37 | | | 75 | | (65) | | (48) | | | (446) | | (410) | |
| Total assets | | 149 | | Total liabilities | | (559) | | (410) | |
31 December 2022 | | | | | | | | | |
| Foreign exchange derivatives | | | | | | | | | |
| Fair value hedges | – | | – | | | – | | – | | – | | | – | | – | |
| Cash flow hedges | 32 | | – | | | – | | (80) | | – | | | – | | (48) | |
| Hedges on the net investment in foreign operations | – | | – | | | – | | – | | (92) | | (a) | – | | (92) | |
| Hedge accounting not applied | 51 | | 163 | | (a) | – | | (35) | | (10) | | (a) | – | | 169 | |
| Interest rate derivatives | | | | | | | | | |
| Fair value hedges | – | | – | | | – | | – | | – | | | (522) | | (522) | |
| Cash flow hedges | – | | 75 | | | 51 | | – | | – | | | (7) | | 119 | |
| Hedge accounting not applied | – | | – | | | – | | – | | – | | | – | | – | |
| Commodity contracts | | | | | | | | | |
| Cash flow hedges | 6 | | – | | | – | | (38) | | – | | | – | | (32) | |
| Hedge accounting not applied | – | | – | | | – | | – | | – | | | – | | – | |
| 89 | | 238 | | | 51 | | (153) | | (102) | | | (529) | | (406) | |
| Total assets | | 378 | | Total liabilities | | (784) | | (406) | |
(a)Swaps that hedge the currency risk on intra-group loans and offset ‘Hedges of net investments in foreign operations’ are included within ‘Hedge accounting not applied’. See below for further details.
| | | | | | | | |
Unilever Annual Report on Form 20-F 2023 | 213 |
| | | | | | | | |
| | |
| STRATEGIC REPORT | CORPORATE GOVERNANCE | FINANCIAL STATEMENTS |
| | |
Notes to the Consolidated Financial Statements Unilever Group |
16C. Derivatives and hedging continued
Master netting or similar agreements
A number of legal entities within the Group enter into derivative transactions under International Swaps and Derivatives Association (ISDA) master netting agreements. In general, under such agreements the amounts owed by each counter-party on a single day in respect of all transactions outstanding in the same currency are aggregated into a single net amount that is payable by one party to the other. In certain circumstances, such as when a credit event such as a default occurs, all outstanding transactions under the agreement are terminated, the termination value is assessed and only a single net amount is payable in settlement of all transactions.
The ISDA agreements do not meet the criteria for offsetting the positive and negative values in the consolidated balance sheet. This is because the Group does not have a legally enforceable right to offset recognised amounts against counterparties, as the right to offset is enforceable only upon the occurrence of credit events such as a default.
The column ‘Related amounts not set off in the balance sheet – Financial instruments’ shows the netting impact of our ISDA agreements, assuming the agreements are respected in the relevant jurisdiction.
(i) Financial assets
The following financial assets are subject to offsetting, enforceable master netting arrangements and similar agreements.
| | | | | | | | | | | | | | | | | | | | |
| | | | Related amounts not set
off in the balance sheet | |
| € million | € million | € million | € million | € million | € million |
| As at 31 December 2023 | Gross amounts of
recognised
financial assets | Gross amounts
of recognised
financial assets
set off in the
balance sheet | Net amounts of
financial assets
presented in the
balance sheet | Financial
instruments | Cash collateral
received | Net amount |
| Derivative financial assets | 191 | | (42) | | 149 | | (122) | | (6) | | 21 | |
| As at 31 December 2022 | | | | | | |
| Derivative financial assets | 449 | | (71) | | 378 | | (272) | | (81) | | 25 | |
(ii) Financial liabilities
The following financial liabilities are subject to offsetting, enforceable master netting arrangements and similar agreements.
| | | | | | | | | | | | | | | | | | | | |
| | | | Related amounts not set
off in the balance sheet | |
| € million | € million | € million | € million | € million | € million |
| As at 31 December 2023 | Gross amounts
of recognised
financial liabilities | Gross amounts
of recognised
financial liabilities
set off in the
balance sheet | Net amounts
of financial
liabilities
presented in the
balance sheet | Financial
instruments | Cash collateral
received | Net amount |
| Derivative financial liabilities | (601) | | 42 | | (559) | | 122 | | – | | (437) | |
| As at 31 December 2022 | | | | | | |
| Derivative financial liabilities | (855) | | 71 | | (784) | | 272 | | – | | (512) | |
| | | | | |
214 | Unilever Annual Report on Form 20-F 2023 |
| | | | | | | | |
| | |
| STRATEGIC REPORT | CORPORATE GOVERNANCE | FINANCIAL STATEMENTS |
| | |
Notes to the Consolidated Financial Statements Unilever Group |
17. Investment and return
| | | | | | | | | | | | | | |
Cash and cash equivalents Cash and cash equivalents in the balance sheet include deposits, investments in money market funds and highly liquid investments. To be classified as cash and cash equivalents, an asset must: ■be readily convertible into cash; ■have an insignificant risk of changes in value; and ■have a maturity period of typically three months or less at acquisition. Cash and cash equivalents in the cash flow statement also include bank overdrafts and are recorded at amortised cost. |
Other financial assets The Group classifies its financial assets into the following measurement categories: ■those to be measured subsequently at fair value (either through other comprehensive income, or through profit or loss), and ■those to be measured at amortised cost. This classification depends on our business model for managing the financial asset and the contractual terms of the cash flows. At initial recognition, the Group measures a financial asset at its fair value plus, in the case of a financial asset not at fair value through profit or loss, transaction costs that are directly attributable to the acquisition of the financial asset. Transaction costs of financial assets carried at fair value through profit or loss are expensed in the income statement. All financial assets are either debt instruments or equity instruments. Debt instruments are those that provide the Group with a contractual right to receive cash or another asset. Equity instruments are those where the Group has no contractual right to receive cash or another asset. |
Debt instruments The subsequent measurement of debt instruments depends on the Group’s business model for managing the asset and the cash flow characteristics of the asset. There are three measurement categories that debt instruments are classified as: ■financial assets at amortised cost; ■financial assets at fair value through other comprehensive income; or ■financial assets at fair value through profit or loss. (i) Amortised cost Assets measured at amortised cost are those which are held to collect contractual cash flows on the repayment of principal or interest (SPPI). A gain or loss on a debt investment recognised at amortised cost on derecognition or impairment is recognised in the income statement. Interest income is recognised within finance income using the effective interest rate method. (ii) Fair value through other comprehensive income Assets that are held at fair value through other comprehensive income are those that are held to collect contractual cash flows on the repayment of principal and interest and which are held to recognise a capital gain through the sale of the asset. Movements in the carrying amount are recognised in other comprehensive income except for the recognition of impairment, interest income and foreign exchange gains or losses which are recognised in the income statement. On derecognition, the cumulative gain or loss recognised in other comprehensive income is reclassified from equity to the income statement. Interest income is included in finance income using the effective interest rate method. (iii) Fair value through profit or loss Assets that do not meet the criteria for either amortised cost or fair value through other comprehensive income are measured as fair value through profit or loss. Related transaction costs are expensed as incurred. Unless they form part of a hedging relationship, these assets are held at fair value, with changes being recognised in the income statement. Interest income from these assets is included within finance income. |
Equity instruments The Group subsequently measures all equity instruments at fair value. Where the Group has elected to present fair value gains and losses on equity investments in other comprehensive income, there is no subsequent reclassification of fair value gains or losses to profit or loss. Dividends from these investments continue to be recognised in the income statement. |
Impairment of financial assets Financial instruments classified as amortised cost and debt instruments classified as fair value through other comprehensive income are assessed for impairment. The Group assesses the probability of default of an asset at initial recognition and then whether there has been a significant increase in credit risk on an ongoing basis. To assess whether there is a significant increase in credit risk, the Group compares the risk of a default occurring on the asset as at the reporting date with the risk of default as at the date of initial recognition. It considers available reasonable and supportive forwarding-looking information. Macroeconomic information (such as market interest rates or growth rates) is also considered. Financial assets are written off when there is no reasonable expectation of recovery, such as a debtor failing to engage in a repayment plan with the company. Impairment losses on assets classified as amortised cost are recognised in the income statement. When a later event causes the impairment losses to decrease, the reduction in impairment loss is also recognised in the income statement. Permanent impairment losses on debt instruments classified as fair value through other comprehensive income are recognised in the income statement. |
| | | | | | | | |
Unilever Annual Report on Form 20-F 2023 | 215 |
| | | | | | | | |
| | |
| STRATEGIC REPORT | CORPORATE GOVERNANCE | FINANCIAL STATEMENTS |
| | |
Notes to the Consolidated Financial Statements Unilever Group |
17A. Financial assets
The Group’s Treasury function aims to protect the Group’s financial investments, while maximising returns. The fair value of financial assets is considered to be the same as the carrying amount for 2023 and 2022. The Group’s cash resources and other financial assets are shown below.
| | | | | | | | | | | | | | | | | | | | |
| € million | € million | € million | € million | € million | € million |
| Current | Non-current | Total | Current | Non-current | Total |
Financial assets(a) | 2023 | 2023 | 2023 | 2022 | 2022 | 2022 |
| Cash and cash equivalents | | | | | | |
| Cash at bank and in hand | 2,862 | | – | | 2,862 | | 2,553 | | – | | 2,553 | |
Short-term deposits(b) | 1,181 | | – | | 1,181 | | 1,743 | | – | | 1,743 | |
| Other cash equivalents | 116 | | – | | 116 | | 30 | | – | | 30 | |
| 4,159 | | – | | 4,159 | | 4,326 | | – | | 4,326 | |
| Other financial assets | | | | | | |
Financial assets at amortised cost(c) | 961 | | 454 | | 1,415 | | 772 | | 232 | | 1,004 | |
Financial assets at fair value through other comprehensive income(d) | 151 | | 458 | | 609 | | – | | 407 | | 407 | |
| Financial assets at fair value through profit or loss: | | | | | | |
| Derivatives | 37 | | 75 | | 112 | | 238 | | 51 | | 289 | |
Other(e) | 582 | | 399 | | 981 | | 425 | | 464 | | 889 | |
| 1,731 | | 1,386 | | 3,117 | | 1,435 | | 1,154 | | 2,589 | |
| Total | 5,890 | | 1,386 | | 7,276 | | 5,761 | | 1,154 | | 6,915 | |
(a)For the purposes of this note and note 15C, financial assets and liabilities exclude trade and other current receivables and trade payables and other liabilities which are covered in notes 13 and 14 respectively.
(b)Short-term deposits typically have maturity of up to 3 months.
(c)Current financial assets at amortised cost include short-term deposits with banks with maturities longer than three months excluding deposits which are part of a recognised cash management process and loans to joint venture entities. Non-current financial assets at amortised cost include judicial deposits of €227 million (2022: €199 million).
(d)Included within non-current financial assets at fair value through other comprehensive income are equity investments. These investments are not held by Unilever for trading purposes and hence the Group has opted to recognise fair value movements through other comprehensive income. The fair value movement in 2023 of these equity investments was €(39) million (2022: €41 million).
(e)Current other financial assets at fair value through profit or loss include money market funds, marketable securities and other capital market instruments. Included within non-current financial assets at fair value through profit or loss are assets in a trust to fund benefit obligations in the US (see also note 4B) of €33 million (2022: €39 million), option to acquire non-controlling interest in subsidiaries of €31 million (2022: €41 million) and investments in financial institutions in North America, North Asia, South Asia and Europe.
There were no significant changes on account of change in business model in classification of financial assets since 31 December 2022.
There are no financial assets that are designated at fair value through profit or loss, which would otherwise have been measured at fair value through other comprehensive income.
| | | | | | | | |
| € million | € million |
| Cash and cash equivalents reconciliation to the cash flow statement | 2023 | 2022 |
| Cash and cash equivalents per balance sheet | 4,159 | | 4,326 | |
| Less: Bank overdrafts | (116) | | (101) | |
| Add: Cash and cash equivalents included in assets held for sale | 2 | | – | |
| Less: Bank overdraft included in liabilities held for sale | – | | – | |
| Cash and cash equivalents per cash flow statement | 4,045 | | 4,225 | |
Approximately €0.9 billion (or 21%) of the Group’s cash and cash equivalents are held in the parent and central finance companies, for maximum flexibility. These companies provide loans to our subsidiaries that are also funded through retained earnings and third-party borrowings. The Group maintain access to global debt markets through an infrastructure of short-and long-term debt programmes. The Group make use of plain vanilla derivatives, such as interest rate swaps and foreign exchange contracts, to help mitigate risks. More detail is provided in notes 16, 16A, 16B and 16C on pages 208 to 214. The remaining €3.3 billion (or 79%) of the Group’s cash and cash equivalents are held in foreign subsidiaries which repatriate distributable reserves on a regular basis. For most countries, this is done through dividends which are in some cases subject to withholding or distribution tax. This balance includes €98 million (2022: €449 million) of cash that is held in a few countries where we face cross-border foreign exchange controls and/or other legal restrictions that inhibit our ability to make these balances available for general use by the wider business. The cash will generally be invested or held in the relevant country and, given the other capital resources available to the Group, does not significantly affect the ability of the Group to meet its cash obligations.
| | | | | |
216 | Unilever Annual Report on Form 20-F 2023 |
| | | | | | | | |
| | |
| STRATEGIC REPORT | CORPORATE GOVERNANCE | FINANCIAL STATEMENTS |
| | |
Notes to the Consolidated Financial Statements Unilever Group |
17B. Credit risk
Credit risk is the risk of financial loss to the Group if a customer or counter-party fails to meet its contractual obligations. Additional information in relation to credit risk on trade receivables is given in note 13. These risks are generally managed by local controllers. Credit risk related to the use of treasury instruments, including those held at amortised cost and at fair value through other comprehensive income, is managed on a Group basis. This risk arises from transactions with financial institutions involving cash and cash equivalents, deposits and derivative financial instruments. The maximum exposure to credit risk at the reporting date is the carrying value of each class of financial assets. To reduce this risk, Unilever has concentrated its main activities with a limited number of counter-parties which have secure credit ratings. Individual risk limits are set for each counter-party based on financial position, credit rating and past experience. Credit limits and concentration of exposures are actively monitored by the Group’s Treasury department. Netting agreements are also put in place with Unilever’s principal counter-parties. In the case of a default, these arrangements would allow Unilever to net assets and liabilities across transactions with that counter-party. To further reduce the Group’s credit exposures on derivative financial instruments, Unilever has collateral agreements with Unilever’s principal counter-parties in relation to derivative financial instruments. Under these arrangements, counter-parties are required to deposit securities and/or cash as a collateral for their obligations in respect of derivative financial instruments. At 31 December 2023, the collateral held by Unilever under such arrangements amounted to €6 million (2022: €97 million), of which €6 million (2022: €81 million) was in cash, and nil in 2023 (2022: €16 million) was in the form of bond securities. The non-cash collateral has not been recognised as an asset in the Group’s balance sheet.
Further details in relation to the Group’s exposure to credit risk are shown in note 13 and note 16A.
18. Financial instruments fair value risk
The Group is exposed to the risk of changes in fair value of its financial assets and liabilities. The following table summarises the fair values and carrying amounts of financial instruments.
| | | | | | | | | | | | | | |
| € million | € million | € million | € million |
| Fair value | Fair value | Carrying
amount | Carrying
amount |
| Fair values of financial assets and financial liabilities | 2023 | 2022 | 2023 | 2022 |
| Financial assets | | | | |
| Cash and cash equivalents | 4,159 | | 4,326 | | 4,159 | | 4,326 | |
| Financial assets at amortised cost | 1,415 | | 1,004 | | 1,415 | | 1,004 | |
| Financial assets at fair value through other comprehensive income | 609 | | 407 | | 609 | | 407 | |
| Financial assets at fair value through profit or loss | | | | |
| Derivatives | 112 | | 289 | | 112 | | 289 | |
| Other | 981 | | 889 | | 981 | | 889 | |
| 7,276 | | 6,915 | | 7,276 | | 6,915 | |
| Financial liabilities | | | | |
| Bank loans and overdrafts | (506) | | (519) | | (506) | | (519) | |
| Bonds and other loans | (26,112) | | (25,136) | | (26,692) | | (26,512) | |
| Lease liabilities | (1,395) | | (1,408) | | (1,395) | | (1,408) | |
| Derivatives | (494) | | (631) | | (494) | | (631) | |
| Other financial liabilities | (535) | | (418) | | (535) | | (418) | |
| (29,042) | | (28,112) | | (29,622) | | (29,488) | |
The fair value of financial assets and financial liabilities (excluding listed bonds) is considered to be the same as the carrying amount for 2023
and 2022. The fair value of trade receivables and payables is considered to be equal to the carrying amount of these items due to their
short-term nature.
Fair value hierarchy
The fair values shown in notes 15C and 17A have been classified into three categories depending on the inputs used in the valuation technique.
The categories used are as follows:
■Level 1: quoted prices for identical instruments;
■Level 2: directly or indirectly observable market inputs, other than Level 1 inputs; and
■Level 3: inputs which are not based on observable market data.
| | | | | | | | |
Unilever Annual Report on Form 20-F 2023 | 217 |
| | | | | | | | |
| | |
| STRATEGIC REPORT | CORPORATE GOVERNANCE | FINANCIAL STATEMENTS |
| | |
Notes to the Consolidated Financial Statements Unilever Group |
18. Financial instruments fair value risk continued
For assets and liabilities which are carried at fair value, the classification of fair value calculations by category is summarised below:
| | | | | | | | | | | | | | | | | | | | | | | | | | | | | |
| | € million | € million | € million | € million | € million | € million | € million | € million |
| Notes | Level 1 2023 | Level 1 2022 | Level 2 2023 | Level 2 2022 | Level 3 2023 | Level 3 2022 | Total fair value 2023 | Total fair value 2022 |
| Assets at fair value | | | | | | | | | |
| | | | | | | | | |
| Financial assets at fair value through other comprehensive income | 17A | 163 | | 5 | | 4 | | 3 | | 442 | | 399 | | 609 | | 407 | |
| Financial assets at fair value through profit or loss: | | | | | | | | | |
Derivatives(a) | 16C | – | | – | | 149 | | 378 | | – | | – | | 149 | | 378 | |
| Other | 17A | 582 | | 428 | | – | | – | | 399 | | 461 | | 981 | | 889 | |
| | | | | | | | | |
| Liabilities at fair value | | | | | | | | | |
Derivatives(b) | 16C | – | | – | | (559) | | (784) | | – | | – | | (559) | | (784) | |
| Contingent consideration | 14 | – | | – | | – | | – | | (157) | | (164) | | (157) | | (164) | |
(a)Includes €37 million (2022: €89 million) derivatives, reported within trade receivables, that hedge trading activities.
(b)Includes €(65) million (2022: €(153) million) derivatives, reported within trade payables, that hedge trading activities.
There were no significant changes in classification of fair value of financial assets and financial liabilities since 31 December 2022. There were also no significant movements between the fair value levels since 31 December 2022.
The impact in 2023 income statement due to Level 3 instruments is a loss of €(68) million (2022: gain of €11 million).
Reconciliation of Level 3 fair value measurements of financial assets and financial liabilities is given below: | | | | | | | | |
| € million | € million |
| Reconciliation of movements in Level 3 valuations | 2023 | 2022 |
| 1 January | 696 | | 748 | |
| Gains/(losses) recognised in income statement | (68) | | 11 | |
| Gains/(losses) recognised in other comprehensive income | (8) | | 55 | |
| Purchases and new issues | 71 | | 94 | |
| Sales and settlements* | (7) | | (212) | |
| 31 December | 684 | | 696 | |
* Includes nil 2023 (2022: €(157) million) movement due to derecognition of Unilever Ventures' equity interest in Nutrafol before business combination (refer to note 21 for more details).
Significant unobservable inputs used in Level 3 fair values
Assets valued using Level 3 techniques include €584 million (2022: €623 million) relating to a number of unlisted investments within Unilever Ventures companies, none of which are individually material; €161 million (2022: €122 million) of long-term cash receivables under life insurance policies and €31 million (2022: €41 million) for option to acquire non-controlling interest. Valuation techniques used are specific to each asset and liability, a change in one or more of the inputs to reasonably possible alternative assumptions would not change the value significantly for all assets and liabilities.
Calculation of fair values
The fair values of the financial assets and liabilities are defined as the price that would be received to sell an asset or paid to transfer a liability in an orderly transaction between market participants at the measurement date. Methods and assumptions used to estimate the fair values are consistent with those used in the year ended 31 December 2022.
Assets and liabilities carried at fair value
■The fair values of quoted investments falling into Level 1 are based on current bid prices.
■The fair values of unquoted financial assets at fair value through other comprehensive income and at fair value through profit or loss are based on recent trades in liquid markets, observable market rates, discounted cash flow analysis and statistical modelling techniques such as the Monte Carlo simulation. If all significant inputs required to fair value an instrument are observable, the instrument is included in Level 2. If one or more of the significant inputs is not based on observable market data, the instrument is included in Level 3.
■Derivatives are valued using valuation techniques with market observable inputs. The models incorporate various inputs including the credit quality of counter-parties, foreign exchange spot and forward rates, interest rate curves and forward rate curves of the underlying commodities.
■For listed securities where the market is not liquid, and for unlisted securities, valuation techniques are used. These include the use of recent arm’s length transactions, reference to other instruments that are substantially the same and discounted cash flow calculations.
Other financial assets and liabilities (fair values for disclosure purposes only)
■Cash and cash equivalents, trade and other current receivables, bank loans and overdrafts, trade payables and other current liabilities have fair values that approximate to their carrying amounts due to their short-term nature.
■The fair values of listed bonds are based on their market value.
■Non-listed bonds, other loans, bank loans and non-current receivables and payables are based on the net present value of the anticipated future cash flows associated with these instruments using rates currently available for debt on similar terms, credit risk and remaining maturities.
Policies and processes used in relation to the calculation of Level 3 fair values
Assets valued using Level 3 valuation techniques are primarily made up of long-term cash receivables and unlisted investments. Valuation techniques used are specific to the circumstances involved. Unlisted investments include €584 million (2022: €623 million) of investments within Unilever Ventures companies.
| | | | | |
218 | Unilever Annual Report on Form 20-F 2023 |
| | | | | | | | |
| | |
| STRATEGIC REPORT | CORPORATE GOVERNANCE | FINANCIAL STATEMENTS |
| | |
Notes to the Consolidated Financial Statements Unilever Group |
19. Provisions
| | | | | | | | | | | | | | |
| Provisions are recognised where a legal or constructive obligation exists at the balance sheet date, as a result of a past event, where the amount of the obligation can be reliably estimated and where the outflow of economic benefit is probable. |
|
| | | | | | | | |
| € million | € million |
| Provisions | 2023 | 2022 |
| Due within one year | 537 | | 748 | |
| Due after one year | 563 | | 550 | |
| Total provisions | 1,100 | | 1,298 | |
| | | | | | | | | | | | | | | | | |
| € million | € million | € million | € million | € million |
| Movements during 2023 | Restructuring | Legal | Brazil indirect taxes | Other | Total |
| 1 January 2023 | 305 | | 321 | | 66 | | 606 | | 1,298 | |
| Additions through business combinations | – | | 1 | | – | | – | | 1 | |
| Income statement: | | | | | |
| Charges | 58 | | 91 | | 11 | | 209 | | 369 | |
| Releases | (40) | | (110) | | (2) | | (100) | | (252) | |
| Utilisation | (147) | | (37) | | (9) | | (82) | | (275) | |
| Currency translation | (1) | | (25) | | 2 | | (17) | | (41) | |
| 31 December 2023 | 175 | | 241 | | 68 | | 616 | | 1,100 | |
Restructuring provisions primarily include people costs such as redundancy costs and the cost of compensation where manufacturing, distribution, service or selling agreements are to be terminated. The Group expects these provisions to be substantially utilised within the next few years.
The Group is involved from time to time in legal and arbitration proceedings arising in the ordinary course of business. As previously disclosed, along with other consumer product companies and retail customers, Unilever is involved in a number of ongoing investigations by national competition authorities. These proceedings and investigations are at various stages and concern a variety of product markets. Where specific issues arise, provisions are made to the extent appropriate. Due to the nature of the legal cases, the timing of utilisation of these provisions is uncertain.
Provisions for Brazil indirect taxes are separate from the matters listed as contingent liabilities in note 20. Unilever does not have provisions and contingent liabilities for the same matters. Due to the nature of disputed indirect taxes, the timing of utilisation of these provisions is uncertain.
Other includes provisions for indirect taxes in countries other than Brazil, interest on tax provisions and provisions for various other matters. The timing of utilisation of these provisions is uncertain.
20. Commitments and contingent liabilities
Commitments
| | | | | | | | | | | | | | |
| Lease commitments are the future cash outflows from the lease contracts which are not recorded in the measurement of lease liabilities. These include potential future payments related to leases of low-value assets, leases which are less than twelve months, variable leases, extension and termination options and leases not yet commenced but which we have committed to. |
|
Other commitments principally comprise commitments under contract to purchase materials and services. They do not include commitments to purchase property, plant and equipment, which are reported in note 10 on pages 197 to 199. | | | | | | | | | | | | | | |
| € million | € million | € million | € million |
| Leases | Leases | Other Commitments | Other Commitments |
| Lease commitments and other commitments fall due as follows: | 2023 | 2022 | 2023 | 2022 |
| Within 1 year | 64 | | 64 | | 1,510 | | 1,806 | |
| Later than 1 year but not later than 5 years | 79 | | 91 | | 2,595 | | 2,020 | |
| Later than 5 years | 148 | | 164 | | 265 | | 231 | |
| 291 | | 319 | | 4,370 | | 4,057 | |
| | | | | | | | |
Unilever Annual Report on Form 20-F 2023 | 219 |
| | | | | | | | |
| | |
| STRATEGIC REPORT | CORPORATE GOVERNANCE | FINANCIAL STATEMENTS |
| | |
Notes to the Consolidated Financial Statements Unilever Group |
20. Commitments and contingent liabilities continued
Contingent liabilities
| | | | | | | | | | | | | | |
| Contingent liabilities are either possible obligations that will probably not require a transfer of economic benefits, or present obligations that may, but probably will not, require a transfer of economic benefits. It is not appropriate to make provisions for contingent liabilities, but there is a chance that they will result in an obligation in the future. Assessing the amount of liabilities that are not probable is highly judgemental, so contingent liabilities are disclosed on the basis of the known maximum exposure. |
Contingent liabilities arise in respect of litigations against group companies, investigations by competition, regulatory and fiscal authorities and obligations arising under environmental legislation. In many markets, there is a high degree of complexity involved in the local tax regimes. The majority of contingent liabilities are in respect of fiscal matters in Brazil, with no other contingent liability being individually material.
In the case of fiscal matters, the known maximum exposure is the amount included in a tax assessment.
| | | | | | | | |
| € million | € million |
| Summary of contingent liabilities | 2023 | 2022 |
| Corporate reorganisation – IPI, PIS and COFINS taxes and penalties | 3,757 | | 3,292 | |
| Inputs for PIS and COFINS taxes | 40 | | 40 | |
| Goodwill amortisation | 174 | | 154 | |
| Other tax assessments – approximately 700 cases | 983 | | 876 | |
| Total Brazil Tax | 4,954 | | 4,362 | |
| Other contingent liabilities | 575 | | 609 | |
| Total contingent liabilities | 5,529 | | 4,971 | |
Brazil tax
During 2004, and in common with many other businesses operating in Brazil, one of our Brazilian subsidiaries received a notice of infringement from the Federal Revenue Service in respect of indirect taxes regarding corporate reorganisation. The notice alleges that a 2001 reorganisation of our local corporate structure was undertaken without a valid business purpose. The 2001 reorganisation was comparable with restructuring done by many companies in Brazil. The original dispute was resolved in the courts in the Group’s favour. However, in 2013 a new assessment was raised in respect of a similar matter. Additionally, during the course of 2014 and between 2017 and 2023, other notices of infringement were issued based on the same grounds argued in the previous assessments. The total amount of the tax assessments in respect of this matter is €3,757 million (2022: €3,292 million).
The Group believes that the likelihood that the Brazilian tax authorities will ultimately prevail is low, however there can be no guarantee of success in court. In each case we believe our position is strong, so they have not been provided for and are considered to be contingent liabilities. Due to the fiscal environment in Brazil, there remains the possibility of material tax assessments related to the same matters for periods not yet assessed. We expect that tax litigation cases related to this matter may move from the Administrative to the Judicial Courts, although the exact timing is uncertain. In such case, we will be required to make a judicial deposit or provide a guarantee in respect of the disputed tax, interest and penalties. The judicial process in Brazil is likely to take a number of years to conclude.
The contingent liabilities reported for indirect taxes relating to disputes with the Brazilian authorities are separate from the provisions listed in note 19. Unilever does not hold provisions and contingent liabilities for the same matters.
21. Acquisitions and disposals
| | | | | | | | | | | | | | |
Business combinations are accounted for using the acquisition accounting method as at the acquisition date, which is the date at which control is transferred to the Group. Goodwill is measured at the acquisition date as the fair value of consideration transferred, plus non-controlling interests and the fair value of any previously held equity interests less the net recognised amount (which is generally fair value) of the identifiable assets and liabilities assumed. Goodwill is subject to an annual review for impairment (or more frequently if necessary) in accordance with our accounting policies. Any impairment is charged to the income statement as it arises. Detailed information relating to goodwill is provided in note 9 on pages 195 to 197. Non-controlling interests are valued based on the proportion of net assets of the acquired company at the date of acquisition. Transaction costs are expensed as incurred. Changes in ownership that do not result in a change of control are accounted for as equity transactions and therefore do not have any impact on goodwill. The difference between consideration and the non-controlling share of net assets acquired is recognised within equity. |
|
|
|
|
|
| | | | | |
220 | Unilever Annual Report on Form 20-F 2023 |
| | | | | | | | |
| | |
| STRATEGIC REPORT | CORPORATE GOVERNANCE | FINANCIAL STATEMENTS |
| | |
Notes to the Consolidated Financial Statements Unilever Group |
21. Acquisitions and disposals continued
2023
In 2023, the Group completed the business acquisitions and disposals as listed below. The net consideration for acquisitions in 2023 is €675 million (2022: €811 million for acquisitions completed during that year). More information related to the 2023 acquisitions is provided below.
| | | | | |
Deal completion date | Acquired/disposed business |
| |
| 10 January 2023 | Acquired 51% of Zywie Ventures Private Limited ('OZiva'), a leading plant-based, and clean-label consumer wellness brand focused on the need spaces such as Lifestyle Protein, Hair & Beauty Supplements and Women’s health. |
| 1 May 2023 | Sold Suave brand in North America to Yellow Wood Partners LLC. The Suave beauty and personal care brand includes hair care, skin care, skin cleansing and deodorant products. |
| 1 August 2023 | Acquired 100% of Yasso Holdings, Inc. ('Yasso'), a premium frozen Greek yogurt brand in the United States offering a high-quality range of low-calorie yet indulgent products. The acquisition is aligned to the premiumisation strategy of Unilever’s Ice Cream Business Group. |
| 1 November 2023 | Sold Dollar Shave Club to Nexus Capital Management LP. |
On 1 May 2023, Unilever sold the North America Suave business to Yellow Wood Partners LLC for consideration of €592 million. A gain on disposal of €497 million has been recognised (see note 3).
On 18 December 2023, Unilever announced that it has received a binding offer from Yellow Wood Partners LLC to acquire Elida Beauty. Elida Beauty comprises more than 20 beauty and personal care brands including Q-Tips, Caress, Timotei and TIGI. Completion is expected by mid-2024.
On 22 December 2023, the Group announced it had signed an agreement to acquire K18, a premium biotech hair care brand in the US. The transaction completed on 1 February 2024 and the provisional accounting for this transaction, including the valuation of assets and liabilities acquired, is expected to be completed by H1 2024. This acquisition is another step towards the optimisation of Unilever’s portfolio into premium segments.
2022
In 2022, the Group completed the business acquisitions and disposals as listed below. The net consideration for acquisitions in 2022 was €811 million. More information related to the 2022 acquisition is provided below.
| | | | | |
Deal completion date | Acquired/disposed business |
| |
| 25 April 2022 | Sold S3, Royale Ambrée and Petit Cheri brands in Spain to Sensogreen Healthcare. |
| 29 April 2022 | Sold Unilever Life, the direct-selling business in Thailand, to RS Group |
| 1 July 2022 | Sold ekaterra (global tea business excluding India, Indonesia, Nepal and Ready to Drink) to CVC Capital Partners. ekaterra includes brands such as Lipton, Brooke Bond and PG Tips. Further details are provided below. |
| 7 July 2022 | Acquired a further 67% of Nutraceutical Wellness, Inc. (Nutrafol) bringing total investment to 80%, a producer based in the US of hair growth solutions for men and women. The acquisition complements Unilever’s existing Health & Wellbeing portfolio, bringing to market a science-led approach to hair wellness. Further details are provided below. |
Nutrafol Acquisition
On 7 July 2022, Unilever acquired a further 67% of the shares of Nutrafol, a US-based hair wellness company in which Unilever Ventures previously held a minority stake (13%), to bring Unilever’s total equity interest to 80%. The fair value of Unilever Ventures' equity interest in Nutrafol before the business combination amounted to €157 million, with a gain of €149 million recognised as Other Comprehensive Income prior to derecognition of the investment. Strategically, Nutrafol expands our Health & Wellbeing portfolio, bringing to market a science-led approach to hair wellness supported by digital-first capabilities. We believe Unilever’s capabilities and sustainability principles will allow us to protect the legacy of the brand while strengthening it.
The total consideration paid for the 67% share of Nutrafol was €811 million, all of which was settled in cash on completion.
The fair value of net assets recognised on the balance sheet was €487 million. The main asset acquired was the brand intangible valued using an income approach model by estimating future cash flows generated by the brand and discounting them to present value using rates in line with a market participant expectation. The key assumptions in the brand valuation were revenue growth and discount rates. A deferred tax liability primarily related to the brand intangibles estimated at €153 million was also recognised. As part of the acquisition, goodwill of €580 million was recognised and was not deductible for tax purposes.
Effect on consolidated income statement
The acquisition deals completed in 2023 have contributed €82 million to the Group turnover and €18 million to the Group operating profit since the date of acquisition. If the acquisition deals completed in 2023 had all taken place at the beginning of the year, Group turnover would have been €59,709 million, and Group operating profit would have been €9,780 million. In 2022, the impact of acquisitions completed in the year was €174 million to Group turnover and €31 million to Group operating profit since the date of acquisition. If all of the acquisitions had taken place at the beginning of 2022, Group turnover for 2022 would have been €60,206 million and Group operating profit would have been €10,772 million.
| | | | | | | | |
Unilever Annual Report on Form 20-F 2023 | 221 |
| | | | | | | | |
| | |
| STRATEGIC REPORT | CORPORATE GOVERNANCE | FINANCIAL STATEMENTS |
| | |
Notes to the Consolidated Financial Statements Unilever Group |
21. Acquisitions and disposals continued
Effect on consolidated balance sheet
Acquisitions
The following table sets out the overall impact of acquisitions in 2023 as well as comparative years on the consolidated balance sheet. The fair values currently used for opening balances are provisional. These balances remain provisional due to there being outstanding relevant information in regard to facts and circumstances that existed as of the acquisition date and/or where valuation work is still ongoing.
| | | | | | | | | | | |
| € million | € million | € million |
| 2023 | 2022 | 2021 |
| Net assets acquired | 368 | | 487 | | 1,372 | |
| Non-controlling interest | (20) | | (99) | | (14) | |
| Goodwill | 327 | | 580 | | 759 | |
| Total consideration | 675 | | 968 | | 2,117 | |
In 2023, the net assets acquired and total payment for acquisitions consists of:
| | | | | |
| € million |
| 2023 |
| Intangible assets | 430 | |
| Other non-current assets | 4 | |
| Trade and other receivables | 25 | |
Other current assets(a) | 56 | |
Non-current liabilities(b) | (114) | |
| Current liabilities | (33) | |
| Net assets acquired | 368 | |
| Non-controlling interest | (20) | |
Goodwill(c) | 327 | |
| Total consideration | 675 | |
| Of which: | |
| Cash consideration paid | 652 | |
| Deferred consideration | 23 | |
(a)Other current assets include inventories of €18 million and cash and cash equivalents of €30 million.
(b)Non-current liabilities include deferred tax of €109 million.
(c)Goodwill not deductible for tax purposes.
Goodwill represents the future value that the Group believes it will obtain through operational synergies and the application of acquired company ideas to existing Unilever channels and businesses. Detailed information relating to goodwill is provided in note 9 on pages 195 to 197. Disposals
Total consideration for 2023 disposals is €578 million (2022: €4,606 million for disposals completed during that year). The following table sets out the effect of disposals in 2023 and comparative year on the consolidated balance sheet. The results of disposed businesses are included in the consolidated financial statements up until their date of disposal.
| | | | | | | | |
| € million | € million |
| 2023 | 2022 |
Goodwill and intangible assets(a) | 56 | | 948 | |
Other non-current assets(b) | 55 | | 1,075 | |
Current assets(c) | 108 | | 833 | |
Liabilities(d) | (144) | | (649) | |
| Net assets sold | 75 | | 2,207 | |
| (Gain)/loss on recycling of currency retranslation on disposal | 14 | | 65 | |
| Profit/(loss) on sale attributable to Unilever | 489 | | 2,334 | |
| Consideration | 578 | | 4,606 | |
| Of which: | | |
| Cash | 472 | | 4,606 | |
| Cash balances of businesses sold | 5 | | 20 | |
| Non-cash items and deferred consideration | 101 | | (20) | |
(a)2023 mainly related to the disposal of Suave and Dollar Shave Club.
(b)2023 includes PPE of €42 million and related to the disposal of Dollar Shave Club.
(c)2023 includes inventories of €88 million related to the disposals of Suave and Dollar Shave Club and trade and other receivables of €8 million related to Dollar Shave Club disposal.
(d)2023 includes €123 million of trade payables.
| | | | | |
222 | Unilever Annual Report on Form 20-F 2023 |
| | | | | | | | |
| | |
| STRATEGIC REPORT | CORPORATE GOVERNANCE | FINANCIAL STATEMENTS |
| | |
Notes to the Consolidated Financial Statements Unilever Group |
22. Assets and liabilities held for sale
| | | | | | | | | | | | | | |
Non-current assets and groups of assets and liabilities which comprise disposal groups are classified as ‘held for sale’ when all of the following criteria are met: a decision has been made to sell; the assets are available for sale immediately; the assets are being actively marketed; and a sale has been agreed or is expected to be concluded within 12 months of the balance sheet date. Immediately prior to classification as held for sale, the non-current assets or groups of assets are remeasured in accordance with the Group’s accounting policies. Subsequently, non-current assets and disposal groups classified as held for sale are valued at the lower of book value or fair value less disposal costs. Assets held for sale are neither depreciated nor amortised. Non-current assets and liabilities held for sale are recognised as current on the balance sheet. |
On 18 December 2023, Unilever announced that it has received a binding offer from Yellow Wood Partners LLC to acquire Elida Beauty. Elida Beauty comprises more than 20 beauty and personal care brands including Q-Tips, Caress, Timotei and TIGI. As a result, the assets and liabilities of Elida Beauty have been classified as held for sale as at 31 December 2023 and the completion is expected by mid-2024. Following the classification of assets and liabilities as held for sale, they are recognised as current on the balance sheet.
| | | | | | | | |
| € million | € million |
| 2023 | 2022 |
| Total | Total |
Property, plant and equipment held for sale(a) | 2 | | 4 | |
| | |
| Disposal groups held for sale | | |
| Non-current assets | | |
| Goodwill and intangibles | 534 | | 2 | |
| Property, plant and equipment | 21 | | 20 | |
| | |
| Other non-current assets | 1 | | – | |
| 556 | | 22 | |
| Current assets | | |
| Inventories | 80 | | – | |
| Trade and other receivables | 47 | | 2 | |
| Current tax assets | 4 | | – | |
| Cash and cash equivalents | 2 | | – | |
| | |
| 133 | | 2 | |
| Assets held for sale | 691 | | 28 | |
| | |
| Current liabilities | | |
| Trade payables and other current liabilities | 24 | | 2 | |
| Current tax liabilities | 2 | | – | |
Financial liabilities due within one year
| – | | 2 | |
| | |
| 26 | | 4 | |
| Non-current liabilities | | |
| | |
| Financial liabilities due after one year | 4 | | – | |
| | |
| Deferred tax liabilities | 145 | | – | |
| 149 | | – | |
| Liabilities held for sale | 175 | | 4 | |
(a)Includes manufacturing assets held for sale.
| | | | | | | | |
Unilever Annual Report on Form 20-F 2023 | 223 |
| | | | | | | | |
| | |
| STRATEGIC REPORT | CORPORATE GOVERNANCE | FINANCIAL STATEMENTS |
| | |
Notes to the Consolidated Financial Statements Unilever Group |
23. Related party transactions
| | | | | | | | | | | | | | |
| A related party is a person or entity that is related to the Group. These include both people and entities that have, or are subject to, the influence or control of the Group. |
|
|
Joint ventures
The following related party balances existed with joint venture businesses at 31 December:
| | | | | | | | |
| € million | € million |
| 2023 | 2022 |
Related party balances | Total | Total |
| Sales to joint ventures | 1,144 | | 1,158 | |
| Purchases from joint ventures | 134 | | 134 | |
| Receivables from joint ventures | 99 | | 78 | |
| Payables to joint ventures | 111 | | 33 | |
| Loans to joint ventures | 219 | | 226 | |
| Royalties and service fees | 19 | | 22 | |
Significant joint ventures are Unilever FIMA LDA in Portugal, Binzagr Unilever Distribution in the Middle East, the Pepsi Lipton Tea Partnership in the US and Pepsi Lipton International Ltd for the rest of the world.
Associates
There are no trading balances due to or from associates.
Langholm Capital II was launched in 2009 and liquidated during 2023. Unilever had invested €65 million in Langholm II, and all outstanding balances and commitments have been closed.
24. Share buyback
On 10 February 2022, we announced a share buyback programme of up to €3 billion to be completed over 2022 and 2023. During 2023, the Group repurchased 31,734,256 (2022: 34,217,605) ordinary shares which are held by Unilever as treasury shares. Consideration paid in 2023 for the repurchase of shares including transaction costs was €1,507 million (2022: €1,509 million) and was recognised in other reserves.
| | | | | |
224 | Unilever Annual Report on Form 20-F 2023 |
| | | | | | | | |
| | |
| STRATEGIC REPORT | CORPORATE GOVERNANCE | FINANCIAL STATEMENTS |
| | |
Notes to the Consolidated Financial Statements Unilever Group |
25. Remuneration of auditors
| | | | | | | | | | | | | | |
| € million | € million | € million |
| 2023 | 2022 | 2021 |
| Fees payable to the Group’s auditors for the audit of the consolidated and parent | | | | | | |
| company accounts of Unilever PLC | 7 | | | 6 | | | 5 | | |
| Fees payable to the Group’s auditors for the audit of accounts of subsidiaries of | | | | | | |
Unilever PLC pursuant to legislation(a)(b) | 16 | | | 17 | | | 17 | | |
| Total statutory audit fees | 23 | | | 23 | | | 22 | | |
| Fees payable to the Group’s auditors for the audit of non-statutory | | | | | | |
financial statements(c) | – | | | – | | | 5 | | |
Audit-related assurance services(d) | – | | | – | | | – | | |
| Other taxation advisory services | – | | | – | | | – | | |
| Services relating to corporate finance transactions | – | | | – | | | – | | |
Other assurance services(e) | 1 | | | 1 | | | 1 | | |
All other non-audit services(d) | – | | | – | | | – | | |
| Total fees payable | 24 | | | 24 | | | 28 | | |
(a)Comprises fees payable to the KPMG network of independent member firms affiliated with KPMG International Cooperative for audit work on statutory financial statements and Group reporting returns of subsidiary companies.
(b)Amount payable to KPMG in respect of services supplied to associated pension schemes was less than €1 million individually and in aggregate (2022: less than
€1 million individually and in aggregate; 2021: less than €1 million individually and in aggregate).
(c)2021 includes €5 million for the audit of carve-out financial statements of ekaterra.
(d)Amounts paid in relation to each type of service are less than €1 million individually and in aggregate (2022: less than €1 million and in aggregate; 2021: less than
€1 million and in aggregate).
(e)2023, 2022 and 2021 include various services, each less than €1 million individually.
26. Events after the balance sheet date
| | | | | | | | | | | | | | |
Where events occurring after the balance sheet date provide evidence of conditions that existed at the end of the reporting period, the impact
of these events is adjusted within the financial statements. Otherwise, events after the balance sheet date of a material size or nature are
disclosed below. |
|
Dividend
On 8 February 2024, Unilever announced a quarterly dividend with the 2023 fourth-quarter results of £0.3647 per PLC ordinary share. The total value of the announced dividend is €1,067 million.
Debt issuance
On 15 February 2024, Unilever issued €600 million 3.25% fixed rate notes maturing in 2032 and €600 million 3.50% fixed rate notes maturing in 2037.
Brand acquisition
As disclosed elsewhere in this report, the acquisition of K18 completed on 1 February 2024.
| | | | | | | | |
Unilever Annual Report on Form 20-F 2023 | 225 |
| | | | | | | | |
| | |
| STRATEGIC REPORT | CORPORATE GOVERNANCE | FINANCIAL STATEMENTS |
| | |
Notes to the Consolidated Financial Statements Unilever Group |
27. Significant subsidiaries
The following represents the significant subsidiaries of the Group at 31 December 2023, that principally affect the turnover, profit and net assets of the Group. The percentage of share capital shown below represents the aggregate percentage of equity capital directly or indirectly held by Unilever PLC in the company. The companies are incorporated and principally operated in the countries under which they are shown except where stated otherwise.
| | | | | | | | |
Country | Name of company | Shareholding % |
| Argentina | Unilever de Argentina S.A. | 100 | % |
| Australia | Unilever Australia Limited | 100 | % |
| Bangladesh | Unilever Bangladesh Limited | 61 | % |
| Brazil | Unilever Brasil Ltda. | 100 | % |
| Canada | Unilever Canada, Inc. | 100 | % |
| China | Unilever Services (Hefei) Co. Ltd | 100 | % |
| China | Wall's (China) Co. Limited | 100 | % |
| England and Wales | Unilever UK & CN Holdings Limited | 100 | % |
| England and Wales | Unilever Global IP Ltd | 100 | % |
| England and Wales | Unilever U.K. Holdings Limited | 100 | % |
| England and Wales | Unilever UK Limited | 100 | % |
| England and Wales | Unilever U.K. Central Resources Limited | 100 | % |
| France | Unilever France S.A.S. | 100 | % |
| Germany | Unilever Deutschland GmbH | 100 | % |
| Germany | Unilever Deutschland Holding GmbH | 100 | % |
| India | Hindustan Unilever Limited | 62 | % |
| Indonesia | PT Unilever Indonesia Tbk | 85 | % |
| Italy | Unilever Italia Mkt Operations S.R.L. | 100 | % |
| Mexico | Unilever de Mexico, S. de R.l. de C.V. | 100 | % |
| Netherlands | Mixhold B.V. | 100 | % |
| Netherlands | Unilever Finance Netherlands B.V. | 100 | % |
| Netherlands | Unilever IP Holdings B.V. | 100 | % |
| Netherlands | Unilever Nederland B.V. | 100 | % |
| Netherlands | Unilever Europe B.V. | 100 | % |
| Netherlands | UNUS Holding B.V. | 100 | % |
| Pakistan | Unilever Pakistan Limited | 99 | % |
| Philippines | Unilever Philippines, Inc. | 100 | % |
| Russia | OOO Unilever Rus | 100 | % |
| Singapore | Unilever Asia Private Limited | 100 | % |
| South Africa | Unilever South Africa (Pty) Limited | 100 | % |
| Spain | Unilever Espana S.A. | 100 | % |
| Switzerland | Unilever Finance International AG | 100 | % |
| Thailand | Unilever Thai Trading Limited | 100 | % |
| Turkey | Unilever Sanayi ve Ticaret Turk A.S. | 100 | % |
| United States of America | ConopCo, Inc. | 100 | % |
| United States of America | Unilever Capital Corporation | 100 | % |
| United States of America | Unilever North America Supply Chain Company LLC | 100 | % |
| United States of America | Unilever United States, Inc. | 100 | % |
| United States of America | Ben & Jerry's Homemade, Inc. | 100 | % |
| United States of America | Paula's Choice, Inc. | 100 | % |
| United States of America | The LIV Group, Inc. | 100 | % |
| Vietnam | Unilever Vietnam International Company Limited | 100 | % |
| | | | | |
226 | Unilever Annual Report on Form 20-F 2023 |
| | | | | | | | |
| | |
| STRATEGIC REPORT | CORPORATE GOVERNANCE | FINANCIAL STATEMENTS |
THIS PAGE IS INTENTIONALLY LEFT BLANK
| | | | | | | | |
Unilever Annual Report on Form 20-F 2023 | 227 |
| | | | | | | | |
| | |
| STRATEGIC REPORT | CORPORATE GOVERNANCE | FINANCIAL STATEMENTS |
THIS PAGE IS INTENTIONALLY LEFT BLANK
| | | | | |
228 | Unilever Annual Report on Form 20-F 2023 |
| | | | | | | | |
| | |
| STRATEGIC REPORT | CORPORATE GOVERNANCE | FINANCIAL STATEMENTS |
THIS PAGE IS INTENTIONALLY LEFT BLANK
| | | | | | | | |
Unilever Annual Report on Form 20-F 2023 | 229 |
| | | | | | | | |
| | |
| STRATEGIC REPORT | CORPORATE GOVERNANCE | FINANCIAL STATEMENTS |
THIS PAGE IS INTENTIONALLY LEFT BLANK
| | | | | |
230 | Unilever Annual Report on Form 20-F 2023 |
| | | | | | | | |
| | |
| STRATEGIC REPORT | CORPORATE GOVERNANCE | FINANCIAL STATEMENTS |
THIS PAGE IS INTENTIONALLY LEFT BLANK
| | | | | | | | |
Unilever Annual Report on Form 20-F 2023 | 231 |
| | | | | | | | |
| | |
| STRATEGIC REPORT | CORPORATE GOVERNANCE | FINANCIAL STATEMENTS |
THIS PAGE IS INTENTIONALLY LEFT BLANK
| | | | | |
232 | Unilever Annual Report on Form 20-F 2023 |
| | | | | | | | |
| | |
| STRATEGIC REPORT | CORPORATE GOVERNANCE | FINANCIAL STATEMENTS |
THIS PAGE IS INTENTIONALLY LEFT BLANK
| | | | | | | | |
Unilever Annual Report on Form 20-F 2023 | 233 |
| | | | | | | | |
| | |
| STRATEGIC REPORT | CORPORATE GOVERNANCE | FINANCIAL STATEMENTS |
In accordance with Section 409 of the Companies Act 2006, a list of subsidiaries, partnerships, associates and joint ventures as at 31 December 2023 is set out below. All subsidiary undertakings are subsidiary undertakings of their immediate parent undertaking(s) pursuant to section 1162 (2) (a) of the Companies Act 2006 unless otherwise indicated – see the notes on page 244. All subsidiary undertakings not included in the consolidation are not included because they are not material for such purposes. All associated undertakings are included in the Unilever Group’s financial statements using the equity method of accounting unless otherwise indicated – see the notes on page 244.
See page 226 of the Annual Report and Accounts for a list of the significant subsidiaries.
Companies are listed by country and under their registered office address. The aggregate percentage of capital held by the Unilever Group is shown after the subsidiary company name, except where it is 100%. If the Nominal Value field is blank, then the Share Class Note will identify the type of interest held in the entity.
Subsidiary undertakings included in the consolidation
| | | | | | | | | |
Name of
Undertaking | Nominal
Value | Share
Class
Note | |
| Algeria – Zone Industrielle Hassi Ameur Oran 31000 | |
| Unilever Algérie SPA (72.50) | DZD1,000.00 | 1 | |
| Argentina – Tucumán 1, Piso 4°, Cdad. de Buenos Aires | |
| Arisco S.A. | ARS1.00 | 1 | |
| Unilever De Argentina S.A. | ARS1.00 | 1 | |
| Club de beneficios S.A.U. | ARS1.00 | 1 | |
| Argentina – Martín Güemes 24 Sur, San Juan, Provincia de San Juan | |
| Helket S.A. | ARS1.00 | 1 | |
| Argentina – Juana Manso 205, 7mo. Piso, Ciudad Autónoma de Buenos Aires | |
| Compre Ahora S.A. | ARS1.00 | 1 | |
| Argentina – Alferez Hipolito Bouchard 4191, Munro, Provincia de Buenos Aires | |
| Urent S.A. | ARS1.00 | 1 | |
| Argentina – Tucumán 1, 4th floor, City of Buenos Aires | |
| Ulands S.A. | ARS1.00 | 1 | |
| Australia – 219 North Rocks Road, North Rocks NSW 2151 | |
| Ben & Jerry’s Franchising Australia Limited | AUD1.00 | 1 | |
| TIGI Australia Pty Limited | AUD1.00 | 2 | |
| AUD1.00 | 3 | |
| Unilever Australia (Holdings) Pty Limited | AUD1.00 | 1 | |
| Unilever Australia Group Pty Limited | AUD2.7414 | 1 | |
| Unilever Australia Limited | AUD1.00 | 1 | |
| Unilever Australia Supply Services Limited | AUD1.00 | 1 | |
| Unilever Australia Trading Limited | AUD1.00 | 1 | |
| Australia – 111-115 Chandos Street, Crows Nest, NSW 2065 | |
| Dermalogica Holdings Pty Limited | AUD1.00 | 1 | |
| Dermalogica Pty Limited | AUD2.00 | 1 | |
| Australia – Level 12, 60 Castlereagh Street, Sydney, New South Wales, 2000 | |
| Paula's Choice International Australia Pty Limited | AUD0.01 | 1 | |
| Australia – PO Box H237, Australia Square, NSW 1215 | |
| Brand Evangelists for Beauty Pty Ltd ∆ (68.03) | | 1 | |
| Austria – Jakov-Lind-Straße 5, 1020 Wien | |
| Delico Handels GmbH | EUR36,336.42 | 1 | |
| Unilever Austria GmbH | EUR10,000,000.00 | 1 | |
| Bangladesh – 51 Kalurghat Heavy Industrial Area, Kalurghat, Chittagong | |
| Unilever Bangladesh Limited (60.75) | BDT100.00 | 1 | |
| Bangladesh – Fouzderhat Industrial Area, North Kattali, Chattogram 4217 | |
| Unilever Consumer Care Limited (81.98) | BDT10.00 | 1 | |
| Belgium – Industrielaan 9, 1070 Brussels | |
| Unilever Belgium NV/SA | No Par Value | 1 | |
| Bolivia – Av. Blanco Galindo, Km. 10.5, Cochabamba | |
| Unilever Andina Bolivia S.A. | BOB100.00 | 1 | |
| Brazil – Rua Oscar Freire, n. 957, mezanino, room 1, Cerqueira Cesar, Zip Code 01426-003, São Paulo/SP | |
| Euphoria Ice Cream Comercio de Alimentos Limitada | BRL1.00 | 5 | |
| Brazil – Rua Gomes de Carvalho, 1666, conjunto 161, 16ª andar, Bairro Vila Olimpia, São Paulo, Zip Code 04547-006 | |
| E-UB Comércio Limitada | BRL1.00 | 5 | |
| Brazil – Cidade de Valinhos, Estado de São Paulo Rua Campos Salles, nº 20, Parte, Centro, Zip Code 13.271-900 | |
| Unilever Logistica Serviços Limitada | BRL1.00 | 5 | |
| | | | | | | | | |
Name of
Undertaking | Nominal
Value | Share
Class
Note | |
| Brazil – Av. das Nações Unidas, n. 14.261, 3rd floor, Parte – Gelados SP, Wing B, Vila Gertrudes, Zip Code 04794-000, São Paulo/SP | |
| Unilever Brasil Gelados Limitada | BRL1.00 | 5 | |
| Brazil – Av. das Nações Unidas, n. 14.261, 3rd to 6th floors, Wing B Vila Gertrudes, Zip Code 04794-000, São Paulo/SP | |
| Unilever Brasil Limitada | BRL1.00 | 5 | |
| Brazil – Av. das Nações Unidas, n. 14.261, 3rd floor, Wing A, Vila Gertrudes, Zip Code 04794-000, São Paulo/SP | |
| Unilever Brasil Industrial Limitada | BRL1.00 | 5 | |
Brazil – Rua Harmonia, 271, Sumarezinho, São Paulo/SP, CEP 05435-000 | |
| Mãe Terra Produtos Naturais Limitada | BRL1.00 | 5 | |
| Brazil – Rua Tenente Pena, No. 156, Bom Retiro, CEP 01127-020, São Paulo | |
| Smart Home Comércio E Locação De Equipamentos S.A (59.50) | No Par Value | 1 | |
| Brazil – São Paulo, Estado de São Paulo na Rua Demóstenes nº 1072, Bairro Campo Belo CEP 04614-010 | |
| Ole Franquia Limitada | BRL1.00 | 1 | |
| Brazil – Rua Gomes de Carvalho, 1666, conjunto 161, 5ª andar, locker 5D Bairro Vila Olimpia, São Paulo, Zip Code 04547-006 | |
| Compra Agora Serviços Digitais Limitada | BRL1.00 | 5 | |
| Bulgaria – City of Sofia, Borough Mladost, 1, Business Park, Building 3, Floor 1 | |
| Unilever Bulgaria EOOD | BGN1,000.00 | 1 | |
| Bulgaria – District Veliko Tarnovo, 5030, Debelets city, Promishlena Zona | |
| Unilever Ice Cream Bulgaria EOOD | BGN5,000.00 | 1 | |
| Cambodia – Morgan Tower Building, Level 15, No. 15F-8A/8B/9/10/11/12/13/14/15/16/17A, Street Sopheak Mongkul, Phum 14, Sangkat Tonle Bassac, Khan Chamkarmon, Phnom Penh | |
| Unilever (Cambodia) Limited | KHR20,000.00 | 1 | |
| Canada – c/o Austring, Fairman & Fekete, 3081, 3rd Avenue, Whitehorse, Yukon Territory, Y1A 4Z7 | |
| Dermalogica (Canada) Limited | No Par Value | 6 | |
| Canada – 800-885 West Georgia Street, Vancouver BC V6C 3H1 | |
| Seventh Generation Family & Home ULC | No Par Value | 7 | |
| Canada – 1000 rue de la Gauchetière Ouest, Bureau 2500, Montreal H3B 0A2 | |
| 4012208 Canada Inc. | No Par Value | 7 | |
| Canada – 160 Bloor Street East, Suite 1400, Toronto ON M4W 3R2 | |
| Unilever Canada Inc. | No Par Value | 8 | |
| No Par Value | 9 | |
| No Par Value | 10 | |
| No Par Value | 11 | |
| No Par Value | 12 | |
| Canada – McCarthy Tetrault LLP, 745 Thurlow Street, Suite 2400, Vancouver, BC, V6E 0C5 | |
| Hourglass Cosmetics Canada Limited | No Par Value | 1 | |
| Canada – Suite 1700, Park Place, 666 Burrard Street, Vancouver BC, V6C 2X8 | |
| Elida Beauty Canada Inc. | USD0.01 | 7 | |
| Chile – Av. Las Condes, 11.000, comuna de Viatcura, Santiago | |
| Unilever Chile Limitada | | 13 | |
China – Room 1001, No. 398, Caoxi Road (N), Xuhui District, Shanghai, 200030 | | |
| Blueair (Shanghai) Sales Co. Limited | CNY1.00 | 1 | |
| China – 1st Floor, No. 78 Binhai 2nd Road, Hangzhou Bay, New District, Ningbo City, Zhejiang Province | |
| Ningbo Hengjing Inspection Technology Co., Limited (67.71) | CNY1.00 | 1 | |
| | | | | |
234 | Unilever Annual Report on Form 20-F 2023 |
| | | | | | | | |
| | |
| STRATEGIC REPORT | CORPORATE GOVERNANCE | FINANCIAL STATEMENTS |
| | | | | | | | | |
Name of
Undertaking | Nominal
Value | Share
Class
Note | |
| China – No. 78, Road II of Seaside Avenue, Cixi Economic and Technical Development Zone, (Hangzhou Bay New Zone), Ningbo | |
| Qinyuan Group Co. Limited (67.71) | CNY1.00 | 1 | |
| China – Room 744, 9F, No. 583 Lingling Road, Xuhui District, Shanghai, 200030 | |
| Shanghai Qinyuan Environment Protection Technology Co. Limited (67.71) | CNY1.00 | 1 | |
| China – No.33 North Fuquan Road, Changning District, Shanghai, 200335 | |
| Unilever (China) Investing Company | USD1.00 | 1 | |
| China – 88 Jinxiu Avenue, Hefei Economic and Technology Development Zone, Anhui, 230601 | |
| Unilever (China) Limited | USD1.00 | 1 | |
| Unilever Services (Hefei) Co. Ltd. | CNY1.00 | 1 | |
| China – No. 225 Jingyi Road, Tianjin Airport Economic Area, Tianjin | |
| Unilever (Tianjin) Company Limited | USD1.00 | 1 | |
| China – 1068 Ting Wei Road, Jinshanzui Industrial Region, Jinshan District, Shanghai | |
| Unilever Foods (China) Co. Limited | USD1.00 | 1 | |
| China – No. 166, Lihua Avenue West, Qinglong Town, Pengshan District, Meishan City, Sichuan province 620800 | |
| Unilever (Sichuan) Company Limited | USD1.00 | 1 | |
| China – No.16 Wanyuan Road, Beijing E&T Development, Beijing 100076 | |
| Wall`s (China) Co. Limited | USD1.00 | 1 | |
| China – No. 358, Xingci 1 Road, Hangzhou Bay, New District, Ningbo, 315336 | |
| Zhejiang Qinyuan Water Treatment Technology Co. Limited (67.71) | CNY1.00 | 1 | |
| China – Room 326, 3rd Floor, Xinmao Building, 2 South Taizhong Road, (Shanghai) Pilot Free Trade Zone | |
| Uchieve Commerce (Shanghai) Co., Ltd. | CNY1.00 | 1 | |
| China – Floor 1, Building 2, No. 33, North Fuquan Road, Changning District, Shanghai, 200335 | |
| Shanghai CarverKorea Limited | USD1.00 | 1 | |
| China- 2F, No. 10, Lane 255, Xiaotang Road, Fengxian District, Shanghai | |
| Paula's Choice (Shanghai) Trading Co. Limited | CNY10,000,000 | 8 | |
| CNY10,000,000 | 9 | |
| China- Room 1436, No.1256 and 1258, Wanrong Road, Jingan District, Shanghai | |
| Paula's Choice (Shanghai) Technology Co. Limited | CNY1.00 | 1 | |
| China- Zibian 2105, No.63, Mingzhu Avenue (North), Conghua District, Guangzhou City | |
| Unilever (Guangzhou) Co. Limited | CNY1.00 | 1 | |
| China – Room 407, No 1256&1258 Wan Rong Road, Shanghai | |
| UPD China Limited | CNY1.00 | 1 | |
| Colombia – Avenida Carrera 45, 108-27 Torre 3 Piso, 5Y 6 Bogotá D.C. | |
| Unilever Andina Colombia Limitada | COP100.00 | 1 | |
| ULeX Colombia S.A.S. | COP100.00 | 1 | |
| Costa Rica – De la intersección Cariari, 400 mts. Oeste y 800 mts al Norte, frente a sede Testigos de Jehová, Planta Industrial Lizano, Heredia, Belén, La Asunción de Belén | |
| Unilever de Centroamerica S.A. | CRC1.00 | 1 | |
| Costa Rica – Provincia de Heredia, Cantón Belén, Distrito de la Asunción, de la intersección Cariari- Belén, 400 Mts. Oeste, 800 Mts., al Norte | |
| UL Costa Rica SCC S.A. | CRC1.00 | 1 | |
| Côte d'Ivoire – 01 BP 1751 Abidjan 01, Boulevard de Vridi | |
| Unilever-Côte d'Ivoire (99.33) | XOF2,650.00 | 1 | |
| Côte d'Ivoire – Abidjan-Marcory, Boulevard Valery Giscard d’Estaing, Immeuble Plein Ciel, Business Center, 26 BP 1377, Abidjan 26 | |
| Unilever Afrique de l’Ouest | XOF10,000.00 | 1 | |
| Croatia – Strojarska cesta 20, 10000 Zagreb | |
| Unilever Hrvatska d.o.o. | HRK1.00 | 1 | |
| Cuba – Zona Especial de Desarrollo Mariel, Provincia Artemisa | |
| Unilever Suchel, S.A. (60) | USD1,000.00 | 56 | |
| Cyprus – Head Offices, 195C Old Road Nicosia Limassol, CY-2540 Idalion Industrial Zone – Nicosia | |
| Unilever Tseriotis Cyprus Limited (84) | EUR1.00 | 1 | |
| Czech Republic – Voctářova 2497/18, 180 00 Praha 8 | |
| Unilever ČR, spol. s r.o. | CZK210,000.00 | 1 | |
| | | | | | | | | |
Name of
Undertaking | Nominal
Value | Share
Class
Note | |
| UNILEVER RETAIL ČR, spol. s r.o. v likvidaci (in liquidation) | CZK100,000.00 | 1 | |
| Denmark – Ørestads Boulevard 73, 2300 København S | |
| Unilever Danmark A/S | DKK1,000.00 | 1 | |
| Denmark – Petersmindevej 30, 5000 Odense C | |
| Unilever Produktion ApS | DKK100.00 | 1 | |
| Djibouti-Haramous, BP 169 | |
| Unilever Djibouti FZCO Limited | USD200.00 | 1 | |
| Dominican Republic – Av. Winston Churchill, Torre Acropolis, Piso 16, Santo Domingo | |
| Unilever Caribe, S.A. | DOP1,000.00 | 1 | |
| Ecuador – Km 25 Vía a Daule, Guayaquil | |
| Unilever Andina Ecuador S.A. | USD1.00 | 1 | |
| Egypt – 5th Floor, North Tower, Galleria 40 Business Complex, Sheikh Zayed, 6th of October City, Giza | |
| Unilever Mashreq for Manufacturing and Trading (SAE) | EGP10.00 | 1 | |
| Unilever Egypt for Shared Consultations Services | EGP10.00 | 1 | |
| Egypt – Public Free Zone, Alexandria | |
| Unilever Mashreq International Company | USD1,000.00 | 5 | |
| Egypt – 14 May Bridge, Sidi Gaber, Smouha – Alexandria | |
| Unilever Mashreq Trading LLC (in liquidation) | EGP1000.00 | 5 | |
| Commercial United for Import and Export LLC | EGP1000.00 | 1 | |
| Egypt – 15 Sphinx Square, El-Mohandsin, Giza | |
| Unilever Mashreq for Import and Export LLC | EGP100.00 | 1 | |
| El Salvador – Local 19 Nivel 19, Edificio Torre Futura, Calle El Mirador y 87 avenida norte, Colonia Escalón, San Salvador | |
| Unilever El Salvador, SCC S.A. de C.V. | USD1.00 | 1 | |
| Unilever de Centro America S.A. de C.V. | USD11.00 | 1 | |
| England and Wales – Unilever House, 100 Victoria Embankment, London, EC4Y 0DY | |
| Accantia Group Holdings (unlimited company) | GBP0.01 | 1 | |
| Alberto-Culver (Europe) Limited | GBP1.00 | 1 | |
| Alberto-Culver Group Limited | GBP1.00 | 1 | |
| Alberto-Culver UK Holdings Limited | GBP1.00 | 1 | |
| Alberto-Culver UK Products Limited | GBP1.00 | 1 | |
| GBP5.00 | 14 | |
| Associated Enterprises Limited° | GBP1.00 | 1 | |
| CPC (UK) Pension Trust Limited | | 16 | |
| GroNext Technologies Limited | GBP1.00 | 1 | |
| Hourglass Cosmetics UK Limited | GBP1.00 | 1 | |
| Margarine Union (1930) Limited° | GBP1.00 | 1 | |
| GBP1.00 | 18 | |
| GBP1.00 | 68 | |
| GBP1.00 | 69 | |
| MBUK Trading Limited | GBP1.00 | 1 | |
| Mixhold Investments Limited | GBP1.00 | 1 | |
| ND4A Limited | GBP1.00 | 1 | |
| TIGI Holdings Limited | GBP1.00 | 1 | |
| Toni & Guy Products Limited° | GBP0.001 | 1 | |
| UAC International Limited | GBP1.00 | 1 | |
| UML Limited | GBP1.00 | 1 | |
| Unidis Forty Nine Limited | GBP1.00 | 1 | |
| Unilever AC Limited | GBP1.00 | 1 | |
| Unilever Assam Estates Limited | GBP1.00 | 1 | |
| Unilever Company for Industrial Development Limited | GBP1.00 | 1 | |
| Unilever Company for Regional Marketing and Research Limited | GBP1.00 | 1 | |
| Unilever Corporate Holdings Limited° | GBP1.00 | 1 | |
| Unilever Employee Benefit Trustees Limited | GBP1.00 | 1 | |
| Unilever Group Limited° | GBP0.25 | 1 | |
| Unilever South India Estates Limited° | GBP1.00 | 1 | |
| GBP1.00 | 15 | |
| | | | | | | | |
Unilever Annual Report on Form 20-F 2023 | 235 |
| | | | | | | | |
| | |
| STRATEGIC REPORT | CORPORATE GOVERNANCE | FINANCIAL STATEMENTS |
| | | | | | | | | |
Name of
Undertaking | Nominal
Value | Share
Class
Note | |
| Unilever S.K. Holdings Limited | GBP1.00 | 1 | |
| Unilever Overseas Holdings Limited° | GBP1.00 | 1 | |
| Unilever Superannuation Trustees Limited | GBP1.00 | 1 | |
| Unilever U.K. Central Resources Limited | GBP1.00 | 1 | |
| Unilever U.K. Holdings Limited° | GBP1.00 | 1 | |
| Unilever UK & CN Holdings Limited | GBP1.00 | 2 | |
| GBP1.00 | 3 | |
| GBP10.00 | 24 | |
| Unilever UK Group Limited | GBP1.00 | 2 | |
| GBP1.00 | 3 | |
| GBP1.00 | 21 | |
| Unilever US Investments Limited° | GBP1.00 | 1 | |
| United Holdings Limited° | GBP1.00 | 1 | |
| England-Wales- C/O Bdo Llp 5 Temple Square, Temple Street, Liverpool, L2 5RH | |
| BBG Investments (France) Limited (in liquidation) | GBP1.00 | 1 | |
| Unilever Australia Investments Limited (in liquidation) | GBP1.00 | 1 | |
| Unilever Australia Partnership Limited (in liquidation) | GBP1.00 | 1 | |
| Unilever Australia Services Limited (in liquidation) | GBP1.00 | 1 | |
| Unilever Innovations Limited (in liquidation) | GBP0.10 | 1 | |
| England and Wales – The Manser Building, Thorncroft Manor, Thorncroft Drive, Dorking Road, Leatherhead, Surrey, KT22 8JB | |
| Dermalogica (UK) Limited | GBP1.00 | 1 | |
| England and Wales – 1st Floor, 16 Charles II Street, London, SW1Y 4QU | |
Twenty Nine Capital Partners Limited Partnership
∞ (80) | | 4 | |
| Unilever Ventures III Limited Partnership ∞ (86.25) | | 4 | |
| England and Wales – Union House, 182-194 Union Street, London, SE1 0LH | |
| REN Skincare Limited | GBP1.00 | 1 | |
| REN Limited | GBP0.01 | 1 | |
| Murad Europe Limited | GBP1.00 | 1 | |
| England and Wales – 3 St James Road, Kingston Upon Thames, Surrey, KT1 2BA | |
| Alberto-Culver Company (U.K.) Limited | GBP1.00 | 1 | |
| Nature Delivered Limited | GBP0.001 | 1 | |
| GBP0.001 | 79 | |
| GBP0.001 | 84 | |
| Marshfield Bakery Limited | GBP0.01 | 1 | |
| TIGI International Limited | GBP1.00 | 1 | |
| Unilever Pension Trust Limited | GBP1.00 | 1 | |
| Unilever UK Limited | GBP1.00 | 1 | |
| Unilever UK Pension Fund Trustees Limited | GBP1.00 | 1 | |
| USF Nominees Limited | GBP1.00 | 1 | |
| England and Wales – 1 More Place, London, SE1 2AF | |
| Accantia Health and Beauty Limited (in liquidation) | GBP0.25 | 1 | |
| Unilever Bestfoods UK Limited (in liquidation) | GBP1.00 | 1 | |
| England and Wales –C/O Tmf Group, 13th Floor, One Angel Court, London, EC2R 7HJ | |
| Twenty Nine Capital Partners (General Partner) Limited | GBP1.00 | 1 | |
| Unilever Ventures Limited | GBP1.00 | 1 | |
| Unilever Ventures General Partner Limited | GBP1.00 | 1 | |
| England and Wales – Port Sunlight, Wirral, Merseyside, CH62 4ZD | |
| Unilever Global IP Limited° | GBP1.00 | 1 | |
| England and Wales – Suite 1, 7th Floor 50 Broadway, London, United Kingdom, SW1H 0BL | |
| Paula`s Choice UK Limited | GBP1.00 | 1 | |
England and Wales – 3rd Floor, 1 Ashley Road, Altrincham, Cheshire, WA14 2DT
| |
| Brand Evangelists for Beauty Limited∆ (80.30) | GBP1.00 | 2 | |
| (100) | GBP1.00 | 58 | |
| (100) | GBP1.00 | 86 | |
| (66.47) | GBP1.00 | 71 | |
| | | | | | | | | |
Name of
Undertaking | Nominal
Value | Share
Class
Note | |
| (82.92) | GBP1.00 | 63 | |
| Estonia – Harju maakond, Tallinn, Haabersti linnaosa, Paldiski mnt 96, 13522 | |
| Unilever Eesti Aktsiaselts | EUR6.30 | 1 | |
| Ethiopia – Bole Sub City, Kebele 03/05, Lidiya Building, Addis Ababa | |
| Unilever Manufacturing PLC | ETB1,000.00 | 1 | |
| Finland – Post Box 254, 00101 Helsinki | |
| Unilever Finland Oy | EUR16.82 | 1 | |
| Unilever Ingman Production Oy | EUR1000.00 | 1 | |
| France – 20, rue des Deux Gares, 92500, Rueil-Malmaison | |
| Bestfoods France Industries S.A.S. (99.99) | No Par Value | 1 | |
| Cogesal-Miko S.A.S. (99.99) | No Par Value | 1 | |
| Fralib Sourcing Unit S.A.S. (99.99) | No Par Value | 1 | |
| Saphir S.A.S. (99.99) | EUR1.00 | 1 | |
| Tigi Services France S.A.S. (99.99) | No Par Value | 1 | |
| U-Labs S.A.S. (99.99) | No Par Value | 1 | |
| Unilever France S.A.S. (99.99) | No Par Value | 1 | |
| Unilever France Holdings S.A.S. (99.99) | EUR1.00 | 1 | |
| Unilever France HPC Industries S.A.S. (99.99) | EUR1.00 | 1 | |
| Unilever Retail Operations France (99.99) | No Par Value | 1 | |
| France – ZI de la Norge – Chevigny Saint-Sauveur, 21800 Quetigny | |
| Amora Maille Societe Industrielle S.A.S. (99.99) | No Par Value | 1 | |
France – 42, rue Jean de La Fontaine, Paris, 75016 | |
| Laboratoire Garancia | EUR62.50 | 1 | |
| UPD EU | EUR1.00 | 1 | |
| Germany – Wiesenstraße 21. 40549 Düsseldorf | |
| Dermalogica GmbH | EUR25,000.00 | 1 | |
| Germany – Spitaler Straße 16, 20095 Hamburg | |
| ProCepta Service GmbH | EUR28,340.00 | 1 | |
| EUR2.00 | 1 | |
| Germany – Neue Burg 1, 20457 Hamburg | |
| DU Gesellschaft für Arbeitnehmerüberlassung mbH (99.99) | DEM50,000.00 | 1 | |
| Unilever Deutschland GmbH | EUR90,000,000.00 | 1 | |
| EUR2,000,000.00 | 1 | |
| EUR1,000,000.00 | 1 | |
| EUR 100.000,00 | 1 | |
| Unilever Deutschland Holding GmbH | EUR39,000.00 | 1 | |
| EUR18,000.00 | 1 | |
| EUR14,300.00 | 1 | |
| EUR5,200.00 | 1 | |
| EUR6,500.00 | 1 | |
| Unilever Deutschland Produktions GmbH & Co. OHG | | 4 | |
| Unilever Deutschland Produktions Verwaltungs GmbH | EUR179,000.00 | 1 | |
| Unilever Deutschland Supply Chain Services GmbH | EUR51,150.00 | 1 | |
| T2 Germany GmbH | EUR1.00 | 1 | |
| Germany – Langnesestraße 1, 64646 Heppenheim | |
| Maizena Grundstücksverwaltung Gesellschaft mit beschränkter Haftung & Co. offene Handelsgesellschaft | | 4 | |
| Rizofoor Gesellschaft mit beschränkter Haftung | EUR15,350.00 | 1 | |
| EUR138,150.00 | 1 | |
| Schafft GmbH | EUR63,920.00 | 1 | |
| EUR100,000.00 | 1 | |
| Germany – Rotebühlplatz 21, 70178 Stuttgart | | | |
| TIGI Eurologistic GmbH | EUR100.00 | 1 | |
| EUR24,900.00 | 1 | |
| TIGI Haircare GmbH | EUR25,600.00 | 1 | |
| Germany – Wiesenstr. 21, 40549 Düsseldorf | | |
| Murad GmbH | EUR1.00 | 1 | |
| Ren GmbH | EUR1.00 | 1 | |
| | | | | |
236 | Unilever Annual Report on Form 20-F 2023 |
| | | | | | | | |
| | |
| STRATEGIC REPORT | CORPORATE GOVERNANCE | FINANCIAL STATEMENTS |
| | | | | | | | | |
Name of
Undertaking | Nominal
Value | Share
Class
Note | |
| Germany – Zehdenicker Str. 110119, Berlin | | |
| Paula’s Choice Germany GmbH | | 4 | |
| Ghana – Swanmill, Kwame Nkrumah Avenue, Accra | |
| Millers Swanzy (Ghana) Limited (74.50) | GHC1.00 | 1 | |
| Ghana – Plot No. Ind/A/3A-4, Heavy Industrial Area, Tema, PO Box 721, Tema | |
| Unilever Ghana PLC (74.50) | GHC0.0192 | 1 | |
| Greece – Kymis ave & 10, Seneka str. GR-145 64 Kifissia | |
| Elais Unilever Hellas SA | EUR10.00 | 1 | |
| Unilever Knorr SA | EUR10.00 | 1 | |
| Unilever Logistics SA | EUR10.00 | 1 | |
| Guatemala – Diagonal 6. 10-50 zona 10, Ciudad de Guatemala. Nivel 17 Torre Norte Ed. Interamericas World Financial Center | |
| Unilever de Centroamerica S.A. | GT60.00 | 1 | |
| Haiti – 115, Rue Panamericaine, Estabissement Número 1, Petion Ville | |
| Les Condiments Alimentaires, S.A. (61) | HTG1000.00 | 1 | |
| Honduras – Anillo Periférico 600 metros después de la colonia, Residencial, Las Uvas contigua acceso de residencial Roble Oeste, Tegucigalpa M.D.C. | |
| Unilever de Centroamerica S.A. | HNL10.00 | 1 | |
| Hong Kong – Suite 1106-8, 11/F, Tai Yau Building, 181 Johnston Road, Wanchai | |
| Blueair Asia Limited | HKD0.10 | 1 | |
| Hong Kong – 6 Dai Fu Street, Tai Po Industrial Estate | |
| Unilever Hong Kong Limited | No Par Value | 1 | |
| Hong Kong-Suite 907, 9/F, Silvercord Tower 2, 30 Canton Road, Tsim Sha Tsui, Kowloon | |
| Hourglass Cosmetics Hong Kong Limited | HKD1.00 | 1 | |
| Hong Kong – Room 1808, 18/F, Tower II Admiralty Centre, 18 Harcourt Road, Admiralty | |
| Hong Kong CarverKorea Limited | HKD1.00 | 7 | |
| Hong Kong – 14th Floor, One Taikoo Place, 979 King’s Road, Quarry Bay | |
| UPD Hong Kong Limited | HKD100.00 | 1 | |
| Hong Kong – 14/F, One Taikoo Place, 979 King’s Road, Quarry Bay | |
| Go-Uni Limited (67) | USD14.376.000 | 1 | |
| Hong Kong – Unit B, 17/F, United Centre, 95 Queensway, Admiralty | |
| Paula's Choice Hong Kong Limited | HKD1.00 | 1 | |
| Paula's Choice Hong Kong Distribution Services Limited | HKD1,000.00 | 1 | |
| Hungary – 1138-Budapest, Váci út 121-127. | |
| Unilever Magyarország Kft | HUF1.00 | 1 | |
| India – Unilever House, B. D. Sawant Marg, Chakala, Andheri (E), Mumbai 400099 | |
| Daverashola Estates Private Limited (61.90) | INR10.00 | 1 | |
| Hindlever Trust Limited (61.90) | INR10.00 | 1 | |
| Hindustan Unilever Limited° (61.90) | INR1.00 | 1 | |
| Jamnagar Properties Private Limited (61.90) | INR10.00 | 1 | |
| Lakme Lever Private Limited (61.90) | INR10.00 | 1 | |
| Levers Associated Trust Limited (61.90) | INR10.00 | 1 | |
| Levindra Trust Limited (61.90) | INR10.00 | 1 | |
| Pond’s Exports Limited (61.90) | INR1.00 | 1 | |
| Unilever India Limited (61.90) | INR1.00 | 1 | |
| Unilever India Exports Limited (61.90) | INR10.00 | 1 | |
| Unilever Industries Private Limited° | INR10.00 | 1 | |
| Unilever Ventures India Advisory Private Limited | INR1.00 | 1 | |
| India – S-327, Greater Kailash – II, New Delhi – 110048, Delhi | |
| Blueair India Private Limited | INR10. 00 | 1 | |
| India – C/o.Vaish Associates, 106, Peninsula Centre, Dr S.S. Rao Road, Parel, Mumbai, Maharashtra, 400012 | |
| Jech India Private Limited | INR10. 00 | 1 | |
| Indonesia – Grha Unilever, Green Office Park Kav 3, Jalan BSD Boulevard Barat, BSD City, Tangerang, 15345 | |
| PT Unilever Indonesia Tbk (84.99) | IDR2.00 | 1 | |
| PT Unilever Enterprises Indonesia (99.99) | IDR1,000.00 | 1 | |
| PT Unilever Trading Indonesia | IDR1,003,875.00 | 1 | |
| Indonesia – Gedung Pasaraya Blok M Gedung B Lantai 6 dan 7 Jalan Iskandarsyah II no. 2, DKI Jakarta | |
| | | | | | | | | |
Name of
Undertaking | Nominal
Value | Share
Class
Note | |
| PT Gerai Cepat Untung (88.19) | IDR100,000.00 | 1 | |
| Indonesia – KEK Sei Mangkei, Nagori Sei Mangkei, Kecamatan Bosar Maligas, Kabupaten Simalungun 21183, Sumatera Utara | |
| PT Unilever Oleochemical Indonesia | IDR1,000,000.00 | 1 | |
| Iran – No 23, Corner of 33rd Street, Zagros Street, Argentina Square, Tehran | |
| Unilever Iran (Private Joint Stock Company) (99.99) | IRR1,000,000.00 | 1 | |
| Ireland – 20 Riverwalk, National Digital Park, Citywest Business Campus, Dublin 24 | |
| Lipton Soft Drinks (Ireland) Limited | EUR1.26 | 1 | |
| Unilever Ireland (Holdings) Limited | EUR1.26 | 1 | |
| Unilever Ireland Limited | EUR1.26 | 1 | |
| Isle of Man – Bridge Chambers, West Quay, Ramsey, Isle of Man, IM8 1DL | |
| Rational International Enterprises Limited | USD1.00 | 1 | |
| Israel – 3 Gilboa St., Airport City, Ben Gurion Airport | |
| Beigel & Beigel Mazon (1985) Limited | ILS1.00 | 1 | |
| Israel – 52 Julius Simon Street, Haifa, 3296279 | |
| Bestfoods TAMI Holdings Ltd | ILS0.001 | 1 | |
| Israel Vegetable Oil Company Ltd | ILS0.0001 | 1 | |
| Unilever Israel Foods Ltd | ILS0.10 | 35 | |
| ILS0.10 | 79 | |
| ILS0.10 | 17 | |
| ILS0.0002 | 25 | |
| Unilever Israel Home and Personal Care Limited | ILS1.00 | 1 | |
| Unilever Israel Marketing Ltd | ILS0.0001 | 1 | |
| Unilever Shefa Israel Ltd | ILS1.00 | 1 | |
| Israel – Haharoshet 1, PO Box 2288, Akko, 2451704 | |
| Glidat Strauss Limited | ILS1.00 | 30 | |
| ILS1.00 | 1 | |
| ILS1.00 | 31 | |
| Italy – Piazza Paleocapa 1/D, 10100, Torino | |
| Gromart S.R.L. | EUR1,815,800.00 | 1 | |
| Italy – Viale Sarca 235, 20126 Milan | |
| Unilever Italia Administrative Services S.R.L. | EUR70,000.00 | 1 | |
| Italy – Via Paolo di Dono 3/A 00142 Roma | |
| Unilever Italia Logistics S.R.L. | EUR600,000.00 | 1 | |
| Unilever Italia Manufacturing S.R.L. | EUR10,000,000.00 | 1 | |
| Unilever Italia Mkt Operations S.R.L. | EUR25,000,000.00 | 1 | |
| Unilever Italy Holdings S.R.L. | EUR1,000.00 | 1 | |
| Italy – Via Plava, 74 10135 Torino | |
| Equilibra S.R.L. (75) | EUR1.00 | 1 | |
| Armores Srl (75) | EUR1.00 | 1 | |
| Syrio Srl (75) | EUR100,000 | 1 | |
| Italy – Business Center Monte Napoleone, Via Monte Napoleone 8, 20121 – Milano | |
| UPD Italia S.r.l. | EUR10,000.00 | 1 | |
| Japan – 2-1-1, Kamimeguro, Meguro-ku, Tokyo 153-8578 | |
| Unilever Japan Customer Marketing K.K. | JPY100,000,001.00 | 1 | |
| Unilever Japan Holdings G.K. | JPY10,000,000.00 | 1 | |
| Unilever Japan K.K. | JPY100,000,001.00 | 1 | |
| Unilever Japan Service K.K. | JPY50,000,000.00 | 1 | |
| Rafra Japan K.K. | JPY20,000,000.00 | 7 | |
| Japan – Ark Hills Sengokuyama Mori Tower 28F, 1-9-10 Roppongi, Minato-ku, Tokyo | |
| UPD Japan K.K. | JPY 50,000.00 | 1 | |
| Jersey – 13 Castle Street, St Helier, Jersey, JE4 5UT | |
| Unilever Chile Investments Limited | GBP1.00 | 1 | |
| Jordan – Ground floor- Office No.1, GH24 Building, Business Park, Development Zone, Amman | |
| Unilever Jordan for Marketing Services | JOD1000.00 | 1 | |
| Kazakhstan – Raimbek, Avenue 160 A, Office 401, Almaty | |
| Unilever Kazakhstan LLP | | 4 | |
| Kenya – Commercial Street, Industrial Area, PO Box 30062-00100, Nairobi | |
| | | | | | | | |
Unilever Annual Report on Form 20-F 2023 | 237 |
| | | | | | | | |
| | |
| STRATEGIC REPORT | CORPORATE GOVERNANCE | FINANCIAL STATEMENTS |
| | | | | | | | | |
Name of
Undertaking | Nominal
Value | Share
Class
Note | |
| Unilever Kenya Limited° | KES20.00 | 1 | |
| Korea – 443 Taeheran-ro, Samsung-dong, Kangnam-gu, Seoul | |
| Unilever Korea Chusik Hoesa | KRW10,000.00 | 1 | |
| Korea – 81, Tojeong 31-gil, Mapo-gu, Seoul | |
| CARVERKOREA Co., Limited (97.47) | KRW500.00 | 7 | |
| Korea – #1-313 #1-314, 48, Achasan-ro 17-gil, Seongdong-gu, Seoul | |
| Paula's Choice Korea, Limited | KRW1.00 | 1 | |
| Laos – Viengvang Tower, 4th Floor, Room no. 402A, Boulichan Road, Dongpalan Thong Village, Sisattanak District, Vientiane Capital | |
| Unilever Services (Lao) Sole Co. Limited | LAK80,000.00 | 1 | |
| Latvia – Kronvalda bulvāris 3-10, Rīga, LV-1010 | |
| Unilever Baltic LLC | EUR1.00 | 1 | |
| Lebanon – Sin El Fil, Dolphin Building, 3rd Floor, Beirut | |
| Unilever Levant s.a.r.l. | LBP1,000,000.00 | 1 | |
| Lithuania – Skuodo st. 28, Mazeikiai, LT-89100 | |
| UAB Unilever Lietuva distribucija | EUR3,620.25 | 1 | |
| UAB Unilever Lietuva ledu gamyba | EUR3,620.25 | 1 | |
| Malawi – Room 33, Gateway Mall, Area 47, Lilongwe Malawi | |
| Unilever South East Africa (Private) Limited | MWK2.00 | 1 | |
| Malaysia – Suite 2-1, Level 2, Vertical Corporate Tower B, Avenue 10, The Vertical, Bangsar South City, No. 8, Jalan Kerinchi, 59200 Kuala Lumpur, Wilayah Persekutuan | |
| Paula's Choice Malaysia SEA Sdn. Bhd. | No Par Value | 1 | |
| Unilever (Malaysia) Holdings Sdn. Bhd. | No Par Value | 1 | |
| Unilever (Malaysia) Services Sdn. Bhd. | No Par Value | 1 | |
| Mexico – Av. Tepalcapa No.2, Col. Rancho Santo Domingo, C.P. 54900 Tultitlán, Estado de México | |
| Unilever de Mexico S. de R.L. de C.V. | | 4 | |
| Unilever Holding Mexico S.de R.L. de C.V. | | 4 | |
| Unilever Manufacturera S.de R.L. de C.V. | | 4 | |
| Unilever Real Estate Mexico S.de R.L. de C.V. | | 4 | |
| Mexico – Fraccionamiento Parque Industrial Nexictoxus ADN2, Salinas Victoria, Nuevo Leon, 65559 | |
| Unilever NA Sourcing West S. de R.L. de C.V. | | 4 | |
| Moldova – 6A Uzinelor Street, Kishinev, MD -2023 | |
| Betty Ice Moldova S.R.L. | MDL7,809,036.00 | 1 | |
| Morocco – Km 10, Route Cotiere, Ain Sebaa, Casablanca | |
| Unilever Maghreb S.A. | MAD100.00 | 1 | |
| Mozambique – Avenida 24 de Julho, Edifício 24, nº 1097, 4º andar, Maputo | |
| Unilever Mocambique Limitada | USD0.01 | 1 | |
| Myanmar – Plot No (40,41,47), Min Thate Hti Kyaw Swar Road, 39 Ward, Shwe Pyi Thar Industrial Zone (2), Shwe Pyi Thar Township, Yangon Region, 11411 | |
| Unilever (Myanmar) Limited | MMK11,129,679,600.00 | 1 | |
| Unilever (Myanmar) Services Limited | MMK2,000,000.00 | 1 | |
| Myanmar – Lot No. 31, Bamaw Ahtwin Wun Street, Hlaing Thar Yar Industrial Zone 3, Hlaing Thar Yar Township, Yangon, 11401. | |
| Unilever EAC Myanmar Company Limited (60) | MMK500,000,000,000. 00 | 1 | |
| Nepal –Hetauda-3, Basamadi Makawnapur | |
| Unilever Nepal Limited (49.52) | NPR100.00 | 1 | |
| Netherlands – Weena 455, 3013 AL Rotterdam | |
| Alberto-Culver Netherlands B.V. | EUR1.00 | 2 | |
| EUR1.00 | 3 | |
| Argentina Investments B.V. | EUR454.00 | 1 | |
| BFO Holdings B.V. | EUR1.00 | 1 | |
| Brazinvest B.V. | EUR1.00 | 1 | |
| Chico-invest B.V. | EUR455.00 | 1 | |
| Doma B.V. | NLG1,000.00 | 1 | |
| Handelmaatschappij Noorda B.V. | NLG1,000.00 | 1 | |
| Hourglass Cosmetics Europe B.V. | EUR1.00 | 1 | |
| Unilever Foods & Refreshments Global B.V. | EUR453.78 | 1 | |
| Itaho B.V. | EUR1.00 | 1 | |
| Lipoma B.V. | NLG1,000.00 | 1 | |
| | | | | | | | | |
Name of
Undertaking | Nominal
Value | Share
Class
Note | |
| Marga B.V. | EUR1.00 | 1 | |
| Mavibel (Maatschappij voor Internationale Beleggingen) B.V. | EUR1.00 | 1 | |
| Mexinvest B.V. | EUR1.00 | 1 | |
| Mixhold B.V.° | EUR1.00 | 2 | |
| EUR1.00 | 3 | |
| EUR1.00 | 26 | |
| N.V. Elma | NLG1,000.00 | 1 | |
| NLG1,000.00 | 27 | |
| New Asia B.V. | EUR1.00 | 1 | |
| Nommexar B.V. | EUR1.00 | 1 | |
| Ortiz Finance B.V. | NLG100.00 | 1 | |
| Pabulum B.V. | NLG1,000.00 | 1 | |
| Rizofoor B.V. | NLG1,000.00 | 1 | |
| Rolf von den Baumen’s Vetsmelterij B.V. | EUR454.00 | 1 | |
| Rolon B.V. | NLG1,000.00 | 1 | |
| Saponia B.V. | NLG1,000.00 | 1 | |
| ThaiB1 B.V. | NLG1,000.00 | 1 | |
| ThaiB2 B.V. | NLG1,000.00 | 1 | |
| Unilever Administration Centre B.V. | EUR1.00 | 1 | |
| Unilever Alser B.V. | EUR1.00 | 1 | |
| Unilever Berran B.V. | EUR1.00 | 1 | |
| Unilever Canada Investments B.V. | EUR1.00 | 1 | |
| Unilever Caribbean Holdings B.V. | EUR1,800.00 | 1 | |
| Unilever Employment Services B.V. | NLG1,000.00 | 1 | |
| Unilever Europe B.V. | EUR1.00 | 1 | |
| Unilever Europe Business Center B.V. | EUR454.00 | 1 | |
| Unilever Finance International B.V. | EUR1.00 | 1 | |
Unilever Finance Netherlands B.V.o | EUR1.00 | 1 | |
| FoodServiceHub B.V. | EUR1.00 | 1 | |
| Unilever Global Services B.V. | EUR1.00 | 1 | |
| Unilever Holdings B.V. | EUR454.00 | 1 | |
| Unilever IP Holdings B.V. | EUR1.00 | 1 | |
| Unilever Indonesia Holding B.V. | EUR1.00 | 1 | |
| Unilever Insurances N.V. | EUR454.00 | 1 | |
| Unilever International Holdings B.V.° | EUR1.00 | 1 | |
| Unilever Netherlands Retail Operations B.V. | EUR1.00 | 1 | |
| Unilever Nederland Holdings B.V. | EUR454.00 | 1 | |
| Unilever Nederland Services B.V. | EUR460.00 | 1 | |
| Unilever PL Netherlands B.V. | EUR1.00 | 1 | |
| Unilever Turkey Holdings B.V. | EUR1.00 | 1 | |
| Unilever US Investments B.V.° | EUR1.00 | 1 | |
| Unilever Ventures Holdings B.V. | EUR453.79 | 1 | |
| Univest Company B.V. | EUR1.00 | 1 | |
| UNUS Holding B.V. | EUR0.10 | 2 | |
| EUR0.10 | 3 | |
| Non-voting† | | |
| Verenigde Zeepfabrieken B.V. | NLG1,000.00 | 1 | |
| Wemado B.V. | NLG1,000.00 | 1 | |
| Netherlands – Hofplein 19 3032 AC Rotterdam | |
| Unilever Nederland B.V. | EUR454.00 | 1 | |
| Netherlands – Valkweg 2 7447JL Hellendoorn | |
| Ben en Jerry’s Hellendoorn B.V. | EUR453.78 | 1 | |
| Netherlands – Markhek 5, 4824 AV Breda | |
| De Korte Weg B.V. | EUR1.00 | 1 | |
| EUR1.00 | 26 | |
| Non-voting† | | |
| Netherlands – Bronland 14, 6708 WH Wageningen | |
| Unilever Innovation Centre Wageningen B.V. | EUR460.00 | 1 | |
| Netherlands – Grote Koppel 7, 3813 AA Amersfoort | |
| Paula's Choice Europe B.V. | EUR1.00 | 1 | |
| | | | | |
238 | Unilever Annual Report on Form 20-F 2023 |
| | | | | | | | |
| | |
| STRATEGIC REPORT | CORPORATE GOVERNANCE | FINANCIAL STATEMENTS |
| | | | | | | | | |
Name of
Undertaking | Nominal
Value | Share
Class
Note | |
| Netherlands – Unilever House, 100 Victoria Embankment, London, EC4Y 0DY (Registered Seat: Rotterdam) | |
| Unilever Overseas Holdings B.V. | NLG1,000.00 | 1 | |
| New Zealand – Level 4, 103 Carlton Gore Rd, Newmarket, Auckland 1023 | |
| Ben & Jerry’s Franchising New Zealand Limited | No Par Value | 1 | |
| Unilever New Zealand Limited | NZD2.00 | 1 | |
| Nicaragua – Km 11.5, Carretera Vieja a León, 800 Mts Norte, 100 Mts Este, 300 Mts Norte, Managua | |
| Unilever de Centroamerica S.A. | NIC50.00 | 1 | |
| Niger – BP 10272 Niamey | |
| Unilever Niger S.A. (88.42) | XOF10,000.00 | 1 | |
| Nigeria – 1 Billings Way, Oregun, Ikeja, Lagos | |
| Unilever Nigeria Plc (76.41) | NGN0.50 | 1 | |
| West Africa Popular Foods Nigeria Limited (51) | NGN1.00 | 1 | |
| Norway – Martin Linges vei 25, Postbox 1, 1331 Fornebu | |
| Unilever Norge AS | NOK100.00 | 1 | |
| Pakistan – Avari Plaza, Fatima Jinnah Road, Karachi – 75530 | |
| Unilever Pakistan Foods Limited (76.57) | PKR10.00 | 1 | |
| Unilever Pakistan Limited (99.29) | PKR50.00 | 1 | |
| (71.78) | PKR100.00 | 14 | |
| Delivery Hub (Private) Limited (64.13) (in liquidation) | PKR10.00 | 1 | |
| Palestine – Ersal St. Awad Center, PO Box 3801, Al-Beireh, Ramallah | |
| Unilever Market Development Company (in liquidation) | JOD1.00 | 1 | |
| Palestine – Jamil Center, Al-Beireh, Ramallah | |
| Unilever Agencies Limited (99) (in liquidation) | JOD1.00 | 1 | |
| Panama –PH Dream Plaza, piso 10 y 13, Provincia de Panamá, corregimiento de Parque Lefevre, Costa del Este | |
| Unilever Regional Services Panama S.A. | USD1.00 | 1 | |
| Panama – Santa María Business District, Torre Argos, Piso 6, Distrito de Juan Diaz, Provincia de Panamá | |
| Unilever de Centroamerica S.A. | No Par Value | 1 | |
| Paraguay – 4544 Roque Centurión Miranda N° 1635 casi San Martin. Edificio Aymac II, Asunción | |
| Unilever de Paraguay S.A. | PYG1,000,000.00 | 1 | |
| Peru – Av. Paseo de la Republica, 5895 OF. 402, Miraflores, Lima 18 | |
| Unilever Andina Perú S.A. | PEN1.00 | 1 | |
| Philippines – Linares Road, Gateway Business Park, General Trias, Cavite | |
| Metrolab Industries, Inc. | PHP1.00 | 7 | |
| PHP10.00 | 22 | |
| Philippines – 7th Floor, Bonifacio Stopover Corporate Center, 31st Street corner 2nd Avenue, Bonifacio Global City, Taguig City | |
| Unilever Global Services, Inc. | PHP10.00 | 7 | |
| Unilever Philippines, Inc. | PHP50.00 | 7 | |
| Philippines – 11th Avenue, Corner 39th Street, Bonifacio Triangle, Bonifacio Global City, Taguig City, Manila | |
| Universal Philippines Body Care, Inc. | PHP100.00 | 7 | |
| Philippines – Manggahan Light Industrial Park, A. Rodriguez Avenue, Bo. Manggahan, Pasig City | |
| Unilever RFM Ice Cream, Inc. (50) | PHP1.00 | 29 | |
| PHP1.00 | 103 | |
| Philippines – Four/Neo, 12th Floor, Fourth Avenue, Bonifacio Global City, Barangay Fort Bonifacio, Taguig 1634, Metro Manila | |
| Gronext Technologies Phils., Inc. | PHP1.00 | 7 | |
| Poland – Jerozolimskie 134, 02-305, Warszawa | |
| Unilever Polska Sp. z o.o. | PLN50.00 | 1 | |
| Unilever Poland Services Sp. z o.o. | PLN50.00 | 1 | |
| Unilever Polska S.A. | PLN10.00 | 1 | |
| Puerto Rico – Professional Services Park 997, San Roberto St., Suite 7, San Juan | |
| Unilever de Puerto Rico, Inc° | USD100.00 | 1 | |
| Qatar – Almana & Partners WLL Building, Area No. 43, Al Mamoura, PO BOX 49 | |
| Unilever Qatar LLC | QAR1,000.00 | 1 | |
| Romania – Ploiesti, 291 Republicii Avenue, Prahova County | |
| Unilever Romania S.A. (99.93) | ROL0.10 | 1 | |
| | | | | | | | | |
Name of
Undertaking | Nominal
Value | Share
Class
Note | |
| Unilever South Central Europe S.A. | ROL260.50 | 1 | |
| Romania – 121 Cernăuţi Street, Suceava 720089 | |
| Betty Ice SRL | RON10.00 | 1 | |
| Romania – Bvd. Republicii 291 camera 15 corp C6 | |
| Betty Ice Distributie SRL | RON10.00 | 1 | |
| Romania – 9-9A Dimitrie Pompei Blvd, Iride Business Park Buildings 5 and 6, 2nd District, Bucuresti | |
| Good People SA (75) | RON10.00 | 1 | |
| Russia – 644031, 205, 10 let Oktyabrya, Omsk | |
| Inmarko-Trade LLC | RUB
1,000,000.00 | 13 | |
| Russia – 123022, Floor 7, Premise 19, Room 36, 13, Sergeya Makeeva Street, Moscow | |
| Unilever Rus LLC | RUB
28,847,390, 269.19 | 13 | |
| Russia – Tula region, Leninsky district, Ilyinskoye rural settlement, Varvarovka village, Varvarovsky pass, Building 15-F, Room 406, Floor 3 | |
| Gourmand LLC | RUB10,000.00 | 4 | |
| Russia – St. Petersburg, 1 Progonnaya St., Building 1, Literature A, Room 2-H, Floor 1, Office 114 | |
| Resheniya dlia Budushego LLC | RUB10,000.00 | 13 | |
| Rwanda – Sanlam Towers, PO Box 973, Kigali | |
| Unilever Rwanda Limited | RWF 1,000 | 1 | |
| Saudi Arabia – PO Box 5694, Jeddah 21432 | |
Binzagr Unilever LimitedX (49) | SAR1,000.00 | 1 | |
| Scotland – c/o Brodies LLP, Capital Square 58 Morrison Street, Edinburgh, EH3 8BP | |
| Twenty Nine Capital Partners (SLP) Limited Partnership∞ | | 4 | |
| Unilever Ventures (SLP) General Partner Limited | GBP1.00 | 1 | |
| Unilever Ventures III (SLP) Limited Partnership∞ (14.098) | | 4 | |
| Serbia – Belgrade, Serbia, Omladinskih brigada 90b – Novi Beograd | |
| Unilever Beograd d.o.o. | | 13 | |
| Singapore – 18 Nepal Park, 139407 | |
| Unilever Asia Private Limited | No Par Value | 1 | |
| Unilever Singapore Pte. Limited | No Par Value | 1 | |
| UPD Singapore Pte. Limited | SGD1.00 | 1 | |
| Gronext Technologies Pte. Ltd. | No Par Value | 1 | |
| Singapore – 201 Henderson Road, #07-25, Apex @ Henderson, 159545 | |
| Paula's Choice Singapore, SEA Pte. Ltd. | SGD1.00 | 1 | |
| Slovakia – Karadzicova 10, 821 08 Bratislava | |
| Unilever Slovensko, spol. s. r.o. | EUR1.00 | 1 | |
| South Africa – 15 Nollsworth Crescent, Nollsworth Park, La Lucia Ridge Office Estate, La Lucia, 4051 | |
| Unilever Market Development (Pty) Limited | ZAR1.00 | 1 | |
| Unilever South Africa (Pty) Limited | ZAR2.00 | 1 | |
| Unilever South Africa Holdings (Pty) Limited | ZAR1.00 | 1 | |
| ZAR1.00 | 2 | |
| ZAR1.00 | 3 | |
| South Africa – 4 Merchant Place, CNR Fredman Drive and Rivonia Road Sandton, 2196 | |
| Aconcagua 14 Investments (RF) (Pty) Limited | ZAR1.00 | 1 | |
| South Africa – Oakhurst Office Park, 11-13 St Andrews Road, Parktown, Johannesburg 2193 | |
| Dermalogica South Africa (Pty) Limited (60) | No Par Value | 1 | |
| Spain – C/ Tecnología 19, 08840 Viladecans | |
| Unilever Espana S.A. | EUR48.00 | 1 | |
| Spain – C/ Felipe del Río, 14 – 48940 Leioa | |
| Unilever Foods Industrial Espana, S.L.U. | EUR600.00 | 1 | |
| Sri Lanka – 258 M Vincent Perera Mawatha, Colombo 14 | |
| Unilever Merchandising Private Limited | No Par Value | 1 | |
| Ceytea (Private) Limited | No Par Value | 1 | |
| Lever Brothers (Exports and Marketing) (Private) Limited° | No Par Value | 1 | |
| Maddema Trading Company (Private) Limited | No Par Value | 1 | |
| | | | | | | | |
Unilever Annual Report on Form 20-F 2023 | 239 |
| | | | | | | | |
| | |
| STRATEGIC REPORT | CORPORATE GOVERNANCE | FINANCIAL STATEMENTS |
| | | | | | | | | |
Name of
Undertaking | Nominal
Value | Share
Class
Note | |
| Premium Exports Ceylon (Private) Limited | No Par Value | 1 | |
| R.O. Mennell & Co. (Ceylon) (Private) Limited | No Par Value | 1 | |
| Unilever Ceylon Services (Private) Limited | No Par Value | 1 | |
| Unilever Lanka Consumer Limited | No Par Value | 1 | |
| Unilever Sri Lanka Limited° | No Par Value | 1 | |
| Sudan – Property no. 125, block 2, Industrial Area, Kafuri District, Bahri, Kafori | |
| Unilever Sudanese Investment Company | SDG10,000.00 | 1 | |
| Sweden – Box 1056, Svetsarvägen 15, 171 22, Solna Stockholm | |
| Alberto Culver AB | SEK100.00 | 1 | |
| Unilever Holding AB | SEK100.00 | 1 | |
| Unilever Produktion AB | SEK50.00 | 1 | |
| Unilever Sverige AB | SEK100.00 | 1 | |
| Sweden – Karlavagen 108, 115 26 Stockholm | |
| Blueair AB | SEK100.00 | 1 | |
| Sweden – Karlavagen 108, 115 26, Stockholm | |
| Jonborsten AB | SEK1000.00 | 1 | |
| Sweden – Nordenskioldgatan 19, 413 09 Goteborg | |
| Nature Delivered Sweden AB | SEK1.00 | 1 | |
| Switzerland – Bahnhofstrasse 19, CH 8240 Thayngen | |
| Knorr-Nährmittel Aktiengesellschaft | CHF1,000.00 | 1 | |
| Unilever Schweiz GmbH | CHF100,000.00 | 1 | |
| Switzerland – Spitalstrasse 5, 8200, Schaffhausen | |
| Helmsman Capital AG | CHF1,000.00 | 1 | |
| Unilever Supply Chain Company AG | CHF1,000.00 | 1 | |
| Unilever ASCC AG | CHF1,000.00 | 1 | |
| Unilever Finance International AG | CHF1,000.00 | 1 | |
| Unilever Business and Marketing Support AG | CHF1,000.00 | 1 | |
| Unilever Overseas Holdings AG | CHF1,000.00 | 1 | |
| Unilever Schaffhausen Service AG | CHF1,000.00 | 1 | |
| Unilever Swiss Holdings AG | CHF1,000.00 | 1 | |
| Switzerland – Hinterbergstr. 30, CH-6312 Steinhausen | |
| Oswald Nahrungsmittel GmbH | CHF800,000.00 | 1 | |
| Taiwan – 15F, No. 39, Sec. 2, Dunhua S. Road, Da’an District, Taipei City | |
| Unilever Taiwan Limited (99.92) | TWD10.00 | 1 | |
| Taiwan – 8 F-1 & 8F-2, No. 186, Sec. 1, Zhangmei Rd., Changhua City, Changhua County 50062, Taiwan (R.O.C.) | |
| Paula's Choice Taiwan Co., Limited | NTD27.000 | 1 | |
| Tanzania – Plot No. 4A, Nyerere Road, Dar Es Salaam, PO Box 40383 | |
| Unilever Tanzania Limited | TZS20.00 | 1 | |
| Thailand – 161 Rama 9 Road, Huay Kwang, Bangkok 10310 | |
| Unilever Thai Holdings Limited | THB100.00 | 1 | |
| Unilever Thai Trading Limited | THB100.00 | 1 | |
| Thailand – 12 A Floor Unit B1-B2, Office No. 1225, 989 Siam Piwat Tower, Rama I Road, Pathumwan Sub-district, Pathumwan District, Bangkok 10330 | |
| UPD (Thailand) Co. Limited | THB100.00 | 1 | |
| Thailand– 21/39 Soi Lardprao 15, Jompol Sub-district, Jatujak District, Bangkok | |
| Gronext Technologies (Thailand) Limited | THB100.00 | 1 | |
| Trinidad & Tobago – Eastern Main Road, Champs Fleurs | |
| Unilever Caribbean Limited (50.01) | TTD1.00 | 1 | |
| Tunisia – Z.I. Voie Z4-2014 Mégrine Erriadh – Tunis | |
| Unilever Tunisia S.A. (99.78) | TND6.00 | 1 | |
| Unilever Maghreb Export S.A. (99.76) | TND5.00 | 1 | |
| Tunisia – Z.I. Voie Z4, Megrine Riadh, Tunis, 2014 | |
UTIC Distribution S.A. (99.78) | TND10.00 | 1 | |
| Turkey – Saray Mahallesi, Dr. Adnan Büyükdeniz Cad., No.13, 34768 Ümraniye – İstanbul | |
Unilever Gida Sanayi ve Ticaret AŞo (99.98) | TRY0.01 | 1 | |
Unilever Sanayi Ve Ticaret Türk AŞo (99.98) | TRY0.01 | 1 | |
| Besan Besin Sanayi ve Ticaret AŞ (99.99) | TRY0.01 | 1 | |
| Unilever Hizli Tuketim Urunleri Satis Pazarlama ve Ticaret Anonim Sirketi (99.99) | TRY1.00 | 1 | |
| | | | | | | | | |
Name of
Undertaking | Nominal
Value | Share
Class
Note | |
| Uganda – DFCU Towers, 5th Floor, Plot 26 Kyadondo Road, Industrial Area, PO Box 3515, Kampala | |
| Unilever Uganda Limited | UGX20.00 | 1 | |
| Ukraine – 04119, 27-T, Letter A, Dehtyarivska Str., Kyiv | |
| Unilever Ukraine LLC | UAH
1,151,329,851 | 13 | |
| United Arab Emirates – PO Box 17053, Jebel Ali, Dubai | |
Severn Gulf FZCOX (50) | AED100,000.00 | 1 | |
| Unilever Gulf FZE | AED1,000,000.00 | 1 | |
| United Arab Emirates – Office No. 901 owned by Easa Saleh AlGurg LLC- Deira- Riqqa AlBateeen | |
Unilever Binzagr Gulf General Trading LLCX (50) | AED1,000.00 | 1 | |
| Unilever General Trading LLC | AED1,000.00 | 1 | |
| United Arab Emirates – Warehouse No. 1.2, Dubai Industrial Park – Seeh Shwaib 2 | |
Unilever Home & Personal Care Products Manufacturing LLCX (49) | AED1,000.00 | 1 | |
| United States – 700 Sylvan Avenue, Englewood Cliffs, New Jersey 07632-3201 | |
| Alberto-Culver Company | No Par Value | 1 | |
| Alberto-Culver International, Inc. | USD1.00 | 1 | |
| Alberto-Culver USA, Inc. | No Par Value | 1 | |
| BC Cadence Holdings, Inc. | USD0.01 | 1 | |
| Ben & Jerry’s Gift Card, LLC | | 13 | |
| Conopco, Inc. | USD1.00 | 7 | |
| Kate Somerville Holdings, LLC | | 13 | |
| Kate Somerville Skincare LLC | | 13 | |
| Kensington & Sons, LLC | No Par Value | 13 | |
| Kirei Intermediate Holdings, LLC | | 13 | |
| Living Proof, Inc. | USD0.01 | 7 | |
| Pantresse, Inc. | USD120.00 | 1 | |
| Skin Health Experts, LLC | | 13 | |
| St. Ives Laboratories, Inc. | USD0.01 | 1 | |
| The Laundress, LLC | | 13 | |
| TIGI Linea Corp | No Par Value | 1 | |
| Unilever Bestfoods (Holdings) LLC | | 13 | |
| Unilever Capital Corporation | USD1.00 | 1 | |
| Unilever North America Supply Chain Company, LLC | | 13 | |
| Unilever United States, Inc. | USD0.3333 | 7 | |
| USD73.50 | 22 | |
| Unilever Ventures Advisory LLC | | 13 | |
| US Health & Wellbeing LLC | No Par Value | 13 | |
| Yasso, Inc. | USD0.01 | 7 | |
| United States – 1535 Beachey Pl Carson, CA 90746 | | | |
| Dermalogica, LLC | | 13 | |
| United States – 2121 Park Place, First Floor El Segundo, CA 90245 | |
| Murad LLC | | 13 | |
| United States – 1090 King Georges Post Road, Suite 505 Edison, NJ 08837 | |
| REN USA Inc. | No Par Value | 7 | |
| United States – 125 S Clark, Suite 2000, Chicago, IL 60603 | |
| Blueair Inc. | No Par Value | 1 | |
| United States – 2816 S. Kilbourne Avenue, Chicago IL 60624 | |
| Unilever Illinois Manufacturing, LLC | | 13 | |
| United States – 2900 W. Truman Boulevard, Jefferson City, MO 65109 | |
| Unilever Manufacturing (US), Inc. | No Par Value | 7 | |
| United States – 40 Merritt Boulevard, Trumbull, CT 06611 | |
| Unilever Trumbull Holdings, Inc. | USD1.00 | 7 | |
| Unilever Trumbull Research Services, Inc. | USD1.00 | 1 | |
| United States – 60 Lake Street, Suite 3N, Burlington, VT 05401 | |
| Seventh Generation Canada, Inc. | No Par Value | 7 | |
| Seventh Generation, Inc. | USD0.001 | 7 | |
| United States – 2711 Centerville Road, Suite 400, Wilmington, DE 19808 | |
| | | | | |
240 | Unilever Annual Report on Form 20-F 2023 |
| | | | | | | | |
| | |
| STRATEGIC REPORT | CORPORATE GOVERNANCE | FINANCIAL STATEMENTS |
| | | | | | | | | |
Name of
Undertaking | Nominal
Value | Share
Class
Note | |
| Paula's Choice, Inc. | USD0.001 | 7 | |
| United States – 705 5th Avenue South, Suite 200, Seattle, WA 98104 | |
| Paula's Choice, LLC | | 13 | |
| United States – CTC 1209 Orange Street Wilmington, DE19801 | |
| Nirvana Holdco LLC (80) | | 7 | |
| Nirvana Intermediate LLC (80) | | 7 | |
| Nutraceutical Wellness, Inc. (80) | | 7 | |
| The Uncovery, LLC | | 13 | |
| Yasso Holdings, Inc. | | 7 | |
| United States – 3770-1/2 Selby Avenue, Los Angeles, CA 90034 | |
| Kingdom Animalia, LLC | | 13 | |
| United States – 11 Ranick Drive South, Amityville, NY 11701 | |
| Sundial Brands, LLC | | 13 | |
| Madam C.J. Walker Enterprises, LLC | | 13 | |
| Nyakio, LLC | | 13 | |
| United States – 415 Jackson St., Floor 2, San Francisco, CA 94111 | |
| Olly Public Benefit Corporation | USD0.00001 | 7 | |
| United States – 208 Utah Street, Suite 300, San Francisco, CA, 94103 | |
| Tatcha, LLC | | 4 | |
| United States – 777 S Aviation Blvd, El Segundo, CA 90245 | |
| The LIV Group, Inc. | No Par Value | 13 | |
| United States – 4056 Del Rey Avenue, Marina Del Rey, CA 90292 | |
| SmartyPants, Inc. | USD0.00001 | 7 | |
| United States – 1169 Gorgas Avenue, Suite A, San Francisco, CA 94129 | |
| Welly Health PBC (51) | USD0.00001 | 7 | |
| USD0.00001 | 22 | |
| United States – 30 Community Drive, South Burlington, Vermont 05403 | |
| Ben & Jerry’s Franchising, Inc. | USD1.00 | 7 | |
| Ben & Jerry’s Homemade, Inc. | USD1.00 | 7 | |
| United States – 1675 South Street, Suite B, City of Dover, DE 19901 | |
| Onnit Labs, Inc. | USD0.0001 | 7 | |
| United States – 8 The Green STE R, City of Dover, Kent County, Delaware, 19901 | |
| Brand Evangelists for Beauty Inc.∆ (68.03) | USD 0.01 | 23 | |
| United States – c/o The Corporation Trust Company, Trust Center, 1209 Orange Street, Wilmington, Delaware, 19801, New Castle County | |
| Cocotier, Inc. | USD0.001 | 7 | |
| Uruguay – Camino Carrasco 5975, Montevideo | |
| Unilever Uruguay SCC S.A. | UYU1.00 | 1 | |
| Uruguay – Luis Bonavita 1294, Montevideo | |
| Unilever America Latina S.A. | UYU1.00 | 1 | |
| Venezuela – Torre BOD, Piso 15, La Castellana, Caracas, Bolivarian Republic of Venezuela | |
| Unilever Andina Venezuela S.A. | Bs0.000001 | 1 | |
| Vietnam – Lot A2-3, Tay Bac Cu Chi Industry Zone, Tan An Hoi Ward, Cu Chi District, Ho Chi Minh City | |
| Unilever Vietnam International Company Limited | VND863,104,820,000.00 | 13 | |
| Vietnam – No.156, Nguyen Luong Bang Street, Tan Phu Ward, District 7, Ho Chi Minh City | |
| Unicorn Market Place Vietnam Company Limited | VND207,819,496,311 | 13 | |
| Zambia – Stand 2375, Corner Addis Ababa Drive & Great East Road, Show Grounds, Lusaka | |
| Unilever South East Africa Zambia Limited | ZMK2.00 | 34 | |
| ZMK2.00 | 1 | |
| Zambia – Ellis & Co, Lusaka, Lusaka Province |
| Chesebrough-Ponds (Private) Limited | | 1 | |
| Zimbabwe – 2 Stirling Road, Workington, Harare | |
| Unilever – Zimbabwe (Pvt) Limited∆ | ZWD0.002 | 1 | |
| SUBSIDIARY UNDERTAKINGS NOT INCLUDED IN THE CONSOLIDATION | |
| Brazil – Av Das Nacoes Unidas, 14261 4º Andar Ala B, Vila Gertrudes, Cep 04792-000, Sao Paulo | |
| Unileverprev Sociedade De Previdencia Privada | No Par Value | 13 | |
| | | | | | | | | |
Name of
Undertaking | Nominal
Value | Share
Class
Note | |
| Canada – 100 King Street West, 1 First Canadian Place, Suite 1600, Toronto ON M5X 1G5 | |
| UPD Canada Inc. | No Par Value | 7 | |
| Egypt – Borg El-Arab, Alexandria | |
| Fine Foods Egypt SAE (in liquidation) | EGP10.00 | 1 | |
| Egypt – Shooting Club, Dokki, Giza | |
| United Beverages (in liquidation) | EGP10.00 | 1 | |
| England and Wales – 1 More London Place, London, SE1 2AF | |
| Unidis Twenty Six Limited (in liquidation) | GBP1.00 | 1 | |
| Unidis Sixty Four Limited (in liquidation) | GBP1.00 | 1 | |
| Lever Brothers Port Sunlight Limited (in liquidation) | GBP1.00 | 1 | |
| England-Wales – C/O Bdo Llp 5 Temple Square, Temple Street, Liverpool, L2 5RH | |
| TIGI Limited (in liquidation) | GBP1.00 | 1 | |
| England and Wales – Unilever House, 100 Victoria Embankment, London, EC4Y 0DY | |
| Elida Beauty Limited | GBP1.00 | 1 | |
| France – 20, rue des Deux Gares, 92500, Rueil-Malmaison | |
| Elida Beauty France S.A.S. (99.99) | EUR1.00 | 1 | |
| Ghana – Plot No. Ind/A/3A-4, Heavy Industrial Area, Tema, PO Box 721, Tema | |
| Unilever Oleo Ghana Limited | GHC2.250 | 1 | |
| Unilever Ghana Investments Limited (74.50) | GHC10.00 | 1 | |
| Haiti – Port-au-Prince | |
| Unilever Haiti S.A. | HTG500,000 | 56 | |
| India – Unilever House, B. D. Sawant Marg, Chakala, Andheri (E), Mumbai 400 099 | |
| Hindustan Unilever Foundation (61.90) | INR10.00 | 1 | |
| Ireland – Unit 50, The Swan Shopping Centre, Rathmines Road Lower, Dublin 6, D06 V9K5 | |
| Demalogica (Skin Care) Ireland Limited | EUR1.00 | 1 | |
| Jamaica – White Marl Street, Spanish Town, PO Box 809, Parish Saint Catherine | |
| Unilever Jamaica Limited | JMD1.00 | 1 | |
| Kenya – Commercial Street, PO Box 40592-00100, Nairobi | |
| Union East African Trust Limited | KES20.00 | 1 | |
| Myanmar – Shwe Gon Daing (West) 5th Street, No. 196, Mimosa Tower, Shwe Gon Daing (West) Ward, Bahan Township, Yangon, Myanmar 11201 | |
| Lever Brothers (Burma) Limited | MMK0.5 | 1 | |
| United States – CTC 1209 Orange Street, Wilmington, DE19801 | |
| Elida Beauty US Corp | USD1.00 | 1 | |
| Elida Beauty US (IP) LLC | | 13 | |
| United States – 700 Sylvan Avenue, Englewood Cliffs, New Jersey 07632-3201 | |
| Unilever AC Canada Holding, Inc. | USD10.00 | 1 | |
| Unilever United States Foundation, Inc. | | 13 | |
| Alberto-Culver (P.R.), Inc. (in liquidation) | No Par Value | 1 | |
| Chesebrough-Pond’s Manufacturing Company (in liquidation) | No Par Value | 1 | |
| ASSOCIATED UNDERTAKINGS | |
| Australia – Level 1, 569 Church Street, Richmond, VIC, 3121 | |
| SNDR PTY LTD∆◊ (72.98) | No Par Value | 58 | |
| Australia – Floor 1, 101 Moray Street, South Melbourne, 3205 | |
| Straand Pty Ltd∆◊ (100) | No Par Value | 107 | |
| (12.05) | No Par Value | 109 | |
| Bahrain – Shop 61 – Building 866 – Road 3618 – Block 436 Alseef Manama | |
| Unilever Bahrain Co. W.L.L. (49) | BHD50.00 | 1 | |
| Brazil – Avenue Engenheiro Luiz Carlos Berrini, 105, 16º andar, Ed. Berrini One, Itaim Bibi, CEP 0471/001-00, City of São Paulo, State of São Paulo | |
| Gallo Brasil Distribuição e comércio Limitada (55) | BRL1.00 | 5 | |
| Canada – Suite 300-171 West Esplanade, North Vancouver, British Columbia Canada V7M 3K9 | |
| A&W Root Beer Beverages Canada Inc.◊ (40) | No Par Value | 38 | |
| Canada – 229 Amesbury Gate, Bedford, Nova Scotia, B4B 0R8 | |
| The 7 Virtues Beauty Inc.∆◊ (64.29) | | 58 | |
| Canada – PO Box 49130, 2900 – 595 Burrard Street, Vancouver BC V7X 1J5 | |
| | | | | | | | |
Unilever Annual Report on Form 20-F 2023 | 241 |
| | | | | | | | |
| | |
| STRATEGIC REPORT | CORPORATE GOVERNANCE | FINANCIAL STATEMENTS |
| | | | | | | | | |
Name of
Undertaking | Nominal
Value | Share
Class
Note | |
| Dollar Shave Club Canada, Inc. (35) | CAD0.01 | 7 | |
| Cyprus – 2 Marcou Dracou Street, Engomi Industrial Estate, 2409 Nicosia | |
| Unilever PMT Limited∆ (49) | EUR1.71 | 3 | |
| England and Wales – 100 Victoria Embankment, Blackfriars, London, EC4Y 0DY | |
| Dollar Shave Club Limited (35) | GBP1.00 | 1 | |
| Uflexreward Holdings LimitedΔ (99.64) | GBP0.001 | 1 | |
Uflexreward LimitedΔ (99.64) | GBP0.001 | 35 | |
| England and Wales – Unit 1.8 & 1.9 The Shepherds Building, Charecroft Way, London, W14 0EE | |
| SCA Investments Holdings Limited∆◊ (15.61) | GBP0.001 | 40 | |
| (25.19) | GBP0.001 | 41 | |
| (3.63) | GBP0.001 | 42 | |
| (5.31) | GBP0.001 | 112 | |
| England and Wales – 2nd Floor, 5 Jubilee Place, Chelsea, London, SW3 3TD | |
| Trinny London Limited∆◊ (54.88) | GBP0.01 | 43 | |
| (32.32) | GBP0.01 | 77 | |
| England and Wales – 127 North Milton Park, Abingdon, Oxfordshire OX14 4SA | |
| P2i Limited∆◊ (12.89) | GBP0.000001 | 1 | |
| (5.44) | GBP0.000001 | 44 | |
| (5.44) | GBP0.000001 | 46 | |
| (4.20) | GBP0.000001 | 52 | |
| (4.20) | GBP0.000001 | 50 | |
| (2.44) | GBP0.000001 | 102 | |
| (50) | GBP1.0000 | 80 | |
| England and Wales – Level 1 Brockbourne House, 77 Mount Ephraim, Tunbridge Wells, Kent, TN4 8BS | |
| Clean Beauty Co Ltd∆◊ (69.76) | GBP0.0001 | 97 | |
| (26.72) | GBP0.0001 | 58 | |
| England and Wales – C4 Lab Psc Building, Unilever R&D Port Sunlight, Quarry Road East, Bebington, Wirral, CH63 3JW | |
| Penhros Bio Limited◊ (32) | GBP1.00 | 1 | |
| England and Wales- C/O Bcs Windsor House, Station Court, Station Road, Great Shelford, Cambridge, Cambridgeshire, England, CB22 5NE | |
| VHSquared Limited◊ (in liquidation) (39.47) | GBP0.01 | 1 | |
| (1.79) | GBP0.01 | 44 | |
| (17.86) | GBP0.01 | 101 | |
France – 13, avenue Morane Saulnier, 78140 Velizy Villacoublay | |
| Pegase S.A.S. (25) | EUR5,000.00 | 1 | |
| France – 7 rue Armand Peugeot, 92500 Rueil-Malmaison | |
| Relais D’or Centrale S.A.S. (49.99) | No Par Value | 1 | |
| Germany – Beerbachstraße 19, 91183 Abenberg | |
| Hans Henglein & Sohn GmbH◊ (50) | EUR100,000.00 | 1 | |
| Henglein & Co. Handels-und Beteiligungs GmbH & Co. KG◊ (50) | | 4 | |
| Henglein Geschäftsführungs GmbH◊ (50) | DEM50,000.00 | 1 | |
| Nürnberger Kloßteig NK GmbH & Co. KG◊ (50) | | 4 | |
| Henglein NRW GmbH◊ (50) | DEM250,000.00 | 1 | |
| Germany – Lauchaer Straße 1, 06647 An der Poststraße OT Klosterhaeseler | |
| Henglein GmbH & Co. KG◊ (50) | DEM50,000.00 | 1 | |
| Germany – Neue Burg 1, 20457 Hamburg | |
| Dollar Shave Club GmbH (in liquidation)(35) | EUR25,000.00 | 1 | |
| India – 1st & 2nd Floor, Kagalwala House, Plot No. 175, CST Road, Kalina, Bandra Kurla, Santacruz East Mumbai, Mumbai 400098 | |
| Peel-Works Private Limited∆◊ (48.15) | INR30.00 | 63 | |
| (16.67) | INR30.00 | 70 | |
| (14.65) | INR30.00 | 32 | |
| India – 1st Floor Lodha, i-Think Techno Campus, A Wing, Chirak Nagar, Thane. MH 400607 | |
| Pureplay Skin Sciences (India) Private Limited∆◊ (0.1) | INR10.00 | 75 | |
| (100) | INR100.00 | 73 | |
| (100) | INR100.00 | 64 | |
| | | | | | | | | |
Name of
Undertaking | Nominal
Value | Share
Class
Note | |
| (6.54) | INR100.00 | 65 | |
| (8.75) | INR100.00 | 106 | |
| India – 55 2nd Floor Community Centre, East of Kailash, New Delhi, East Delhi, DL 110065 | |
| Convosight Analytics Private Limited∆◊ (3.08) | INR1.00 | 75 | |
| (7.41) | INR1.00 | 99 | |
| (12.73) | INR 10.00 | 117 | |
| (11.15) | INR 10.00 | 116 | |
| India – Plot no. F-2109, RIICO Industrial Area, Ramchandra Pura, (Sitapura Extension) Jaipur, Rajasthan 303905 | |
| Uprising Science Private Limited∆◊ (2.50) | INR10.00 | 75 | |
| (27.27) | INR100.00 | 117 | |
| India –Plot No. D 5, Road No. 20, Marol MIDC, Andheri East, Mumbai City MH 400093 | |
| Scentials Beautycare & Wellness Ltd∆◊ (63.43) | | 73 | |
| (0.10) | | 75 | |
| India – 15 Ambika Nagar, Sector 4, Hiran Magri, Udaipur, Rajasthan, 313002 | |
| Derma Goodness Private Limited∆◊ (0.2) | | 75 | |
| (97.93) | | 110 | |
| India- Z -44, Panchasayar P -210-4-1, Panchasayar Kolkata WB 700094 | |
| Wellness Ville Private Limited∆◊ (0.01) | | 75 | |
| (92.11) | | 118 | |
| India – 28 B.T. Road, Cossipore Chiria, More Kolkata, WB 700002 | |
| Rabiko Lifestyle Private Limited ∆◊ (0.02) | | 75 | |
| (100.00) | | 114 | |
| India – A-2004, Floor-20, Plot-141, Phoenix Tower-A, S.B. Marg, Delisle Road, Lower Parel West, Mumbai, 400013 | |
| Nutritionalab Private Limited (13.31) | INR10.00 | 1 | |
| India – Ground Floor, Plot No 57, Industrial Area Phase I, Chandigarh 160002 | |
| Zywie Ventures Private Limited (33.02) | INR10.00 | 1 | |
| Indonesia – Jalan Srengseng Raya Nomor 55A, Rukun Tetangga 001, Rukun Warga 002, Kelurahan Srengseng, Kecamatan Kembangan, Jakarta Barat 11630, Provinsi Daerah Khusus Ibukota | |
| PT Anugrah Mutu Bersama◊ (40) | IDR1,000,000.00 | 1 | |
| Iran – Second floor, No. 23, Corner of 3rd Street, Zagros Street, Argentina Square, Tehran | |
| Unilever-Golestan Foods (Private Joint Stock Company)(51) | IRR1,000,000.00 | 1 | |
| Ireland – 70 Sir John Rogersons Quay, Dublin 2 | |
| Pepsi Lipton International Limited∆ | EUR1.00 | 52 | |
| EUR1.00 | 53 | |
| EUR1.00 | 54 | |
| EUR1.00 | 55 | |
| Israel – Kochav Yokneam Building, 4th Floor, PO Box 14, Yokneam Illit 20692 | |
| IB Ventures Limited∆ (99.74) | ILS1.00 | 14 | |
Israel – Park Zvaim Industrial Area, Beit Shean / Correspondance:
PO Box 787, Beit Shean, 1171601 | |
| Dollar Shave Club Israel Limited (35) | NIS0.10 | 1 | |
| Italy – Via Quercete, n.a. 81016, San Potito Sannitico (CE) | |
| P2P S.r.l (50) | EUR1.00 | 1 | |
| Luxembourg – 5 Heienhaff, L-1736 Senningerberg | |
| Helpling Group Holding S.à r.l.∆◊ (98.57) | EUR1.00 | 60 | |
| (2.34) | EUR1.00 | 33 | |
| Mauritius – c/o Apex Fund Services (Mauritius) Ltd, 4th Floor, 19 Bank Street, Cyber City, Ebene 72201 | |
| Capvent Asia Consumer Fund Limited∆ (40.40) | USD0.01 | 78 | |
| Oman – PO Box 1711, Ruwi, Postal code 112 | |
| Towell Unilever LLC (49) | OMR10.00 | 1 | |
| Philippines –11th Avenue Corner, 38th Street, Bonifacio Triangle, Bonifacio Global City, Taguig City, Metro Manila | |
| Sto Tomas Paco Land Corp∆◊ (40) | PHP1.00 | 7 | |
| (40) | PHP10.00 | 46 | |
| (40) | PHP20.00 | 44 | |
| Cavite Horizons Land, Inc.◊ (35.10) | PHP1.00 | 103 | |
| | | | | |
242 | Unilever Annual Report on Form 20-F 2023 |
| | | | | | | | |
| | |
| STRATEGIC REPORT | CORPORATE GOVERNANCE | FINANCIAL STATEMENTS |
| | | | | | | | | |
Name of
Undertaking | Nominal
Value | Share
Class
Note | |
| PHP10,000.00 | 46 | |
| Philippines – Manggahan Light Industrial Compound, A. Rodriguez Avenue, Bo. Manggahan, Pasig City | |
| WS Holdings Inc.∆◊ | PHP1.00 | 29 | |
| PHP1.00 | 103 | |
| Selecta Walls Land Corp∆◊ | PHP10.00 | 29 | |
| Portugal – Largo Monterroio Mascarenhas, 1,1099–081 Lisboa | |
| Fima Ola – Produtos Alimentares, S.A. (55) | EUR4,125,000 | 1 | |
| Gallo Worldwide, Limitada (55) | EUR550,000 | 5 | |
| Grop – Gelado Retail Operation Portugal, Unipessoal, Limitada (55) | EUR27,500 | 5 | |
| Transportadora Central do Infante, Limitada (54) | EUR27,000 | 1 | |
| Unilever Fima, Limitada (55) | EUR14,462,336.00 | 5 | |
| Victor Guedes – Industria e Comercio, S.A. (55) | EUR275,000 | 1 | |
| Fima Dressings Unipessoal, Limitada (55) | EUR27,500 | 5 | |
| Saudi Arabia – PO Box 22800, Jeddah 21416 | |
| Binzagr Unilever Distribution Company Limited (49) | SAR1,000.00 | 1 | |
| Singapore – 3 Phillip Street, #14-05 Royal Group Building, 048693 | |
| YOU Private Limited∆◊ (33.33) | | 76 | |
| (33.56) | | 45 | |
| Singapore – 20A Tanjong Pagar Road, 088443 | |
| ESQA Corp Pte Ltd∆◊ (60) | | 73 | |
| Sweden – Sturegatan 38, Stockholm, 11436 | |
| SachaJuan Haircare AB∆◊ (69.5) | SEK1.00 | 9 | |
| United Arab Emirates – PO Box 49, Dubai | |
| Al Gurg Unilever LLC (49) | AED1,000.00 | 1 | |
| United Arab Emirates – Po Box 49, Abu Dhabi | |
| Thani Murshid Unilever LLC (49) | AED1,000.00 | 1 | |
| United States – c/o Registered Agents Solutions, Inc., 838 Walker Road Suite 21-2, Dover, Kent, DE, 19904 | |
| Beauty Bakerie Cosmetics Brand Inc.∆◊ (50.05) | USD0.001 | 43 | |
| (16.24) | USD0.001 | 71 | |
| (24.88) | USD0.001 | 93 | |
| United States – c/o Resident Agents Inc. 8 The Green, STE R, Dover, Kent, Delaware, 19901 | |
| Discuss.io Inc.◊ (7.79) | USD0.0001 | 7 | |
| (16.78) | USD0.0001 | 55 | |
| (50.53) | USD0.0001 | 58 | |
| United States – 700 Sylvan Avenue, Englewood Cliffs, New Jersey 07632-3201 | |
| Pepsi Lipton Tea Partnership (50) | | 4 | |
| Food Service Direct Logistics, LLC (40) | | 13 | |
| | | | | | | | | |
Name of
Undertaking | Nominal
Value | Share
Class
Note | |
| (17.83) | USD0.0001 | 55 | |
| (17.83) | USD0.0001 | 58 | |
| United States – c/o The Company Corporation, 251 Little Falls Drive, Wilmington, DE, New Castle 19808 | |
| Equilibria, Inc.∆◊ (20.00) | USD0.00001 | 98 | |
| FabFitFun Inc.∆◊ (68.18) | USD0.001 | 6 | |
| (7.48) | USD0.001 | 100 | |
| Outliers, Inc.∆◊ (58.77) | | 62 | |
| (31.35) | | 113 | |
| Perelel, Inc.∆◊(64.71) | USD 0.00001 | 97 | |
| (73.18) | USD 0.00001 | 44 | |
| True Botanicals, Inc.∆◊ (51.23) | USD0.0001 | 62 | |
| Yati Inc.∆◊ (4.00) | USD0.00001 | 115 | |
| (100.00) | USD0.00001 | 47 | |
| United States – c/o Cogency Global Inc, 850 New Burton Road, in the City of Dover, County of Kent, Delaware | |
| Volition Beauty Inc.∆◊ (66.44) | USD0.0001 | 44 | |
| United States – c/o The Corporation Trust Company, Trust Center, 1209 Orange Street, Wilmington, Delaware, 19801. New Castle County | |
| Koco Life LLC∆◊(26.19) | | 104 | |
| (41.15) | | 105 | |
| New Voices Fund LP◊ (32.90) | | 4 | |
| Keli Network, Inc.∆◊ (28.24) | USD0.0001 | 88 | |
| United States – c/o A registered agent, Inc, 8 The Green, Ste A, Dover, Kent, DE, 19901 | |
| Clean Beauty for All, Inc.∆◊ (22.09) | USD0.0001 | 62 | |
| (41.99) | USD0.0001 | 95 | |
| (62.35) | USD0.0001 | 51 | |
| (67.85) | USD0.0001 | 96 | |
| United States – United Corporate Services, Inc., 800 North State Street Suite 304, Dover, Kent, DE, 19901 | |
| UOMA Beauty Inc.∆◊ (25) | | 62 | |
| (70.96) | | 95 | |
| (49.88) | | 51 | |
| United States –National Registered Agents Inc, 1209 Orange Street, Wilmington, New Castle, Delaware 19801 | |
| Mealogic, Inc.∆◊ (37.5) | | 58 | |
| United States – 13335 Maxella Ave. Marina del Rey, CA 90292 | |
| Dollar Shave Club, Inc. (35) | USD0.001 | 13 | |
| | | | | | | | |
Unilever Annual Report on Form 20-F 2023 | 243 |
| | | | | | | | |
| | |
| STRATEGIC REPORT | CORPORATE GOVERNANCE | FINANCIAL STATEMENTS |
Notes:
1: Ordinary, 2: Ordinary-A, 3: Ordinary-B, 4: Partnership, 5: Quotas, 6: Class-A Common, 7: Common, 8: Class A, 9: Class B, 10: Class C, 11: Class II Common, 12: Class III Common, 13: Membership Interest, 14: Preference, 15: Redeemable Preference, 16: Limited by Guarantee, 17: C Ordinary Shares, 18: Viscountcy, 19: B3 Ordinary, 20: Series C-1 Pref, 21: Ordinary-C, 22: Preferred, 23: Common Stock, 24: Redeemable Preference Class B, 25: Special, 26: Cumulative Preference, 27: 5% Cumulative Preference, 28: Non-Voting Ordinary B, 29: Common B, 30: Management, 31: Dormant, 32: Series C1 Preference, 33: Series D-2, 34: Cumulative Redeemable Preference, 35: A-Ordinary, 36: Preferred Ordinary, 37: Com, 38: Class Common-B, 39: Series A Participating Preference, 40: H-Ordinary, 41: I-Ordinary, 42: J-Ordinary, 43: Series A Preferred Convertible, 44: A Preference, 45: Series B1 CCPS, 46: B Preference, 47: Series A-5, 48: Series C-2 Preferred, 49: A-4 Com, 50: D Preference, 51: Series A-3 Preferred, 52: C Preference, 53: E Ordinary, 54: G Preferred, 55: Series Seed, 56: Nominal, 57: Preferred A, 58: Series A Preferred, 59: Series Seed-2 Preferred, 60: Series C-2, 61: Series D, 62: Series A-1 Preferred, 63: Series B-2 Preference, 64: Pre Series B CCPS, 65: Series B CCPS, 66: Series C1 CPPS, 67: Series C2, 68: Office Holders, 69: Security, 70: Series B-3 Preference, 71: Series B Preferred, 72: Series Seed B CPPS, 73: Series A CCPS, 74: Series A2 CPPS, 75: Equity, 76: Series B CCPS, 77: Series B Preferred Convertible, 78: Class A Redeemable Non Voting Ordinary, 79: B Ordinary, 80: N Ordinary, 81: A-1 Com, 82: A-2 Com, 83: A-3 Com, 84: Series A EIS, 85: Series A Convertible Preferred, 86: Series A2 Preferred, 87: Not in use, 88: Series C Preferred, 89: Series A1 CPPS, 90: D1 Preferred, 91: Series E, 92: Series C-2 Pref, 93: Series B-1 Preferred, 94: Series B-2 Preferred, 95: Series A-2 Preferred, 96: Series A-4 Preferred, 97: Preferred Seed, 98: Seed-3 Preferred, 99: CCPS,100: Series A Preferred Stock, 101: Ordinary Preferred, 102: E Preference, 103: Common A, 104: Series D-5 Preferred, 105: Series D-6 Preferred, 106: Series C CCPS, 107: Series Seed Convertible Preferred, 108: Series C-E Preferred, 109: Series Seed 2 Convertible Preferred Shares, 110: Seed CCPS, 111: Series Seed Preferred Shares, 112: M-Ordinary, 113: Series A-9 Preferred, 114: Series Seed CCPS, 115: Series A-1, 116: Pre-Series B CCCPS, 117: Series A CCCPS, 118: Series Seed A CCPS
Ο Indicates an undertaking directly held by PLC. All other undertakings are indirectly held. In the case of Hindustan Unilever Limited, 47.43% is directly held and the remainder of 14.47% is indirectly held. In the case of Unilever Kenya Limited, 39.13% is directly held and the remainder of 60.87% is indirectly held. In the case of Unilever Sri Lanka Limited, 18.32% is directly held and the remainder of 81.68% is indirectly held. In the case of Mixhold B.V., 27.71% is directly held and the remainder of 72.29% is indirectly held. In the cases of each of Unilever Gida Sanayi ve Ticaret A.Ş. and Unilever Sanayi ve Ticaret Turk A.Ş., a fractional amount is directly held and the remainder is indirectly held. In the case of Mixhold B.V., 55.37% of the ordinary – A shares are directly held, the remainder of 44.63% are indirectly held and the other share classes are indirectly held.
† Shares the undertaking holds in itself.
Δ Denotes an undertaking where other classes of shares are held by a third party.
Χ Binzagr Unilever Limited, Severn Gulf FZCO, Unilever Binzagr Gulf General Trading LLC, Unilever Home and Personal Care Products Manufacturing LLC are subsidiary undertakings pursuant to section 1162(2)(b) Companies Act 2006. The Unilever Group is entitled to 50% of the profits made by Binzagr Unilever Limited, Severn Gulf FZCO and Unilever Binzagr Gulf General Trading LLC. The Unilever Group is entitled to 80% of the profits made by Unilever Home and Personal Care Products Manufacturing LLC.
◊ Accounted for as non-current investments within non-current financial assets.
∞ Exemption pursuant to Regulation 7 of the Partnership (Accounts) Regulations 2008.
In addition, we have revenues either from our own operations or otherwise in the following locations: Afghanistan, Aland Islands, Albania, Americas, Andorra, Angola, Anguilla, Antigua and Barbuda, Armenia, Aruba, Azerbaijan, Bahamas, Barbados, Belize, Benin, Bhutan, Bonaire, Sint Eustatius & Saba, Bosnia and Herzegovina, Botswana, British Virgin Islands, Brunei Darussalam, Burkina Faso, Burundi, Cameroon, Cape Verde, Cayman Islands, Central African Republic, Chad, Christmas Island, Cocos (Keeling) Islands, Comoros, Congo, Cook Islands, Curacao, Democratic Republic of Congo, Dominica, Equatorial Guinea, Eritrea, Faroe Islands, Federated States of Micronesia, Fiji, French Guiana, French Polynesia, Gabon, Gambia, Georgia, Gibraltar, Greenland, Grenada, Guam, Guernsey, Guinea, Guinea-Bissau, Guyana, Heard Island and McDonald Islands, Iceland, Iraq, Kiribati, Kosovo, Kuwait, Kyrgyzstan, Lebanon, Lesotho, Liberia, Libya, Liechtenstein, Luxembourg, Macao, Macedonia, Madagascar, Maldives, Mali, Malta, Marshall Islands, Mauritania, Mauritius, Monaco, Mongolia, Montenegro, Montserrat, Namibia, Nauru, New Caledonia, Niue, Norfolk Island, Northern Ireland, Palau, Papua New Guinea, Saint Kitts and Nevis, Saint Lucia, Saint Martin (French part), Saint Vincent and the Grenadines, Samoa, San Marino, Senegal, Seychelles, Sierra Leone, Sint Maarten (Dutch part), Slovenia, Solomon Islands, Somalia, South Sudan, Suriname, Swaziland, Tajikistan, Timor Leste, Togo, Tokelau, Tonga, Turkmenistan, Tuvalu, Uzbekistan, Vanuatu and Yemen.
The Unilever Group has established branches in Azerbaijan, Belarus, Bosnia-Herzegovina, Burkina Faso, Côte d'Ivoire, Cuba, Jordan, Kazakhstan, Lebanon, Northern Ireland, the Philippines, Saudi Arabia, Turkey, UAE and the UK.
| | | | | |
244 | Unilever Annual Report on Form 20-F 2023 |
| | | | | | | | |
| | |
| STRATEGIC REPORT | CORPORATE GOVERNANCE | FINANCIAL STATEMENTS |
| | | | | | | | |
| Shareholder information Financial calendar |
Annual general meeting
| | | | | |
| Date | 1 May 2024 |
| Voting and Registration date | 29 April 2024 |
Quarterly dividends
| | | | | | | | | | | | | | | | | |
| Announcement date | Ex-dividend date
for ordinary shares | Ex-dividend
date for ADSs | Record date | Payment date |
Quarterly dividend announced with the Q4 2023 results | 8 February 2024 | 22 February 2024 | 22 February 2024 | 23 February 2024 | 22 March 2024 |
Quarterly dividend announced with the Q1 2024 results | 25 April 2024 | 16 May 2024 | 16 May 2024 | 17 May 2024 | 7 June 2024 |
Quarterly dividend announced with the Q2 2024 results | 25 July 2024 | 8 August 2024 | 9 August 2024 | 9 August 2024 | 6 September 2024 |
Quarterly dividend announced with the Q3 2024 results | 24 October 2024 | 7 November 2024 | 8 November 2024 | 8 November 2024 | 6 December 2024 |
Contact details
Unilever PLC
100 Victoria Embankment
London EC4Y 0DY
United Kingdom
Institutional Investors telephone +44 (0)20 7822 6830
Any queries can also be sent to us electronically via
www.unilever.com/contact/
Private Shareholders can email us at
shareholder.services@unilever.com
Shareholder Services
UK
| | | | | |
Computershare Investor Services PLC |
The Pavilions | |
Bridgwater Road | |
Bristol BS99 6ZZ | |
Telephone +44 (0) 370 600 3977 |
Website | www.investorcentre.co.uk |
FAQ and Contact Form | www.investorcentre.co.uk/contactus |
The Netherlands
| | | | | |
ABN AMRO Bank N.V. | |
Gustav Mahlerlaan 10 | |
1082 PP Amsterdam | |
Telephone +31 (0) 20 628 6070 |
Email | corporate.broking@nl.abnamro.com |
US
| | | | | |
American Stock Transfer & Trust Company |
Operations Center | |
6201 15th Avenue | |
Brooklyn, NY 11219 | |
Toll-free number +1 866 249 2593 |
Direct dial +1 718 921 8124 | |
Email | db@astfinancial.com |
Website
Shareholders are encouraged to visit our website which has a wealth of information about Unilever.
There is a section on our website designed specifically for investors. It includes detailed coverage of the Unilever share price, our quarterly and annual results, performance charts, financial news and investor relations speeches and presentations. It also includes details of the conference and investor/analyst presentations.
You can also view the Unilever Annual Report and Accounts 2023 (and the Additional Information for US Listing Purposes) on our website, and those for prior years.
Find out more at www.unilever.com
www.unilever.com/investorrelations
www.unilever.com/investor-relations/annual-report-and-accounts
References to information on websites in this document are included as an aid to their location and such information is not incorporated in, and does not form part of, this document. Any website URL is included as text only and is not an active link.
Publications
Copies of the Unilever Annual Report and Accounts 2023 (and the Additional Information for US Listing Purposes) and the Annual Report on Form 20-F 2023 can be accessed directly or ordered via the website.
www.unilever.com/investorrelations
Unilever Annual Report and Accounts 2023
The Unilever Annual Report and Accounts 2023 (and the Additional Information for US Listing Purposes) forms the basis for the Annual Report on Form 20-F that is filed with the United States Securities and Exchange Commission, which is also available free of charge from their website.
www.sec.gov
Quarterly results announcements
Unilever’s quarterly results announcements are in English with figures in euros.
| | | | | | | | |
Unilever Annual Report on Form 20-F 2023 | 245 |
| | | | | | | | |
| | |
| STRATEGIC REPORT | CORPORATE GOVERNANCE | FINANCIAL STATEMENTS |
| | | | | | | | |
Additional information for
US listing purposes |
Additional information for US listing purposes
| | | | | | | | | | | | | | | | | | | | | | | | | | |
Form 20-F references | | | | | |
| | | | | | | |
Item 1 | | Identity of Directors, Senior Management and Advisers | n/a |
| | | | | | | | |
Item 2 | | Offer Statistics and Expected Timetable | n/a |
| | | | | | | | |
Item 3 | | Key Information |
| | | | | | | | |
| | B. | Capitalisation and Indebtedness | n/a |
| | C. | Reasons for the offer and use of proceeds | n/a |
| | D. | Risk factors | 71-78 |
| | | | | | | | |
Item 4 | | Information on the Company | | | | | |
| | | | | | | | |
| | A. | History and development of the company | |
| | B. | Business overview | | | 2-5, 10-33, 38-47, 70-78, 180-182, 250 |
| | C. | Organisational structure | | | | 88, 226, 234-244 |
| | D. | Property, plant and equipment | | | | |
| | | | | | | | |
| Item 4A | | Unresolved Staff Comments | | | | | n/a |
| | | | | | | |
Item 5 | | Operating and Financial Review and Prospects | | | | | |
| | | | | | | | |
| | A. | Operating results | | | 10-13, 56-64, 72-78, 208-213 |
| | B. | Liquidity and capital resources | | 58-59, 77, 79, 156, 176, 197-199, 203, 206-220 |
| | C. | Research and development, patents and licences, etc. | 3, 14-33, 38, 40-45, 183, 250 |
| | D. | Trend information | | | 2, 6-33, 71 |
| | E. | Critical accounting estimates | | | | | n/a |
| | | | | | | | |
Item 6 | | Directors, Senior Management and Employees | | | | | |
| | | | | | | | |
| | A. | Directors and senior management | | | | 84-87, 248 |
| | B. | Compensation | | | | 116-153, 184-191 |
| | C. | Board practices | | | 84-97, 102-118, 248 |
| | D. | Employees | | | | 2, 67, 184, 248 |
| | E. | Share ownership | | | 129-153, 190-191, 248 |
| | F. | Disclosure of a registrant's actions to recover erroneously awarded compensation | | | | | n/a |
| | | | | | | | |
Item 7 | | Major Shareholders and Related Party Transactions | | | | | |
| | | | | | | | |
| | A. | Major shareholders | | | | | |
| | B. | Related party transactions | | | | | |
| | C. | Interest of experts and counsel | | | | | n/a |
| | | | | | | | |
Item 8 | | Financial Information | | | | | |
| | | | | | | | |
| | A. | Consolidated statements and other financial information | |
| | B. | Significant changes | | | | | |
| | | | | | | | |
Item 9 | | The Offer and Listing | | | | | |
| | | | | | | | |
| | A. | Offer and listing details | | | | 88,100, 249, 253-254 |
| | B. | Plan of distribution | | | | | n/a |
| | C. | Markets | | | | |
| | D. | Selling shareholders | | | | | n/a |
| | E. | Dilution | | | | | n/a |
| | F. | Expenses of the issue | | | | | n/a |
| | | | | | | | |
| | | | | |
246 | Unilever Annual Report on Form 20-F 2023 |
| | | | | | | | |
| | |
| STRATEGIC REPORT | CORPORATE GOVERNANCE | FINANCIAL STATEMENTS |
| | |
Additional information for US listings purpose |
| | | | | | | | | | | | | | | | | | | | | | | | | | |
Item 10 | | Additional Information | | | | | |
| | | | | | | | |
| | A. | Share capital | | | | | n/a |
| | B. | Articles of association | | | | 95-100,141, 253-254 |
| | C. | Material contracts | | | | | |
| | D. | Exchange controls | | | | | |
| | E. | Taxation | | | | | |
| | F. | Dividends and paying agents | | | | | n/a |
| | G. | Statement by experts | | | | | n/a |
| | H. | Documents on display | | | | | |
| | I. | Subsidiary information | | | | | n/a |
| | J. | Annual security report to security holders | | | | | n/a |
Item 11 | | Quantitative and Qualitative Disclosures About Market Risk | |
| | | | | | | |
Item 12 | | Description of Securities Other than Equity Securities | | | | | |
| | A. | Description of debt securities | | | | | n/a |
| | B. | Description of warrants and rights | | | | | n/a |
| | C. | Description of other securities | | | | | n/a |
| | D. | American Depository Shares | | | | | 253 |
| | | | | | | | |
Item 13 | | Defaults, Dividend Arrearages and Delinquencies | | | | | |
| | | | | | | | |
| | A. | Defaults | | | | | |
| | B. | Dividend arrearages and delinquencies | | | | | |
| | | | | | | | |
Item 14 | | Material Modifications to the Rights of Security Holders and Use of Proceeds | | | n/a |
| | | | | | | |
Item 15 | | Controls and Procedures | | |
|
| | | | | | | |
| | A. | Disclosure Controls and Procedures | | | | | 101 |
| | B | Annual report on Internal Control | | | | | 254 |
| | C | Attestation Report | | | | | 254 |
| | D | Changes in Internal Control over Financial Reporting | | | | | n/a |
Item 16 | | Reserved | | | | | |
| | | | | | | | |
| Item 16A. | | Audit Committee Financial Expert | | | | | 108 |
| Item 16B. | | Code of Ethics | | | 100-101, 113-114 |
| Item 16C. | | Principal Accountant Fees and Services | | | | | 108-111, 255 |
| Item 16D. | | Exemptions from The Listing Standards for Audit Committees | | | | | n/a |
| Item 16E. | | Purchases of Equity Securities by The Issuer and Affiliated Purchasers | | | | | 99, 224, 254 |
| Item 16F. | | Change in Registrant’s Certifying Accountant | | | | | n/a |
| Item 16G. | | Corporate Governance | | | | | 100-101 |
| Item 16H. | | Mine Safety Disclosures | | | | | n/a |
| Item 16I. | | Disclosure Regarding foreign Jurisdictions that Prevent Inspections | | | | | n/a |
| Item 16J. | | Insider Trading Policies | | | | | n/a |
| Item 16K. | | Cybersecurity | | | | | 251 |
| | | | | | | | |
Item 17 | | Financial Statements | | | |
| | | | | | | |
Item 18 | | Financial Statements | | | |
| | | | | | | |
Item 19 | | Exhibits Please refer to the Exhibit list located immediately before the signature page for this document as filed with the SEC. |
| | | | | | | | |
Unilever Annual Report on Form 20-F 2023 | 247 |
| | | | | | | | |
| | |
| STRATEGIC REPORT | CORPORATE GOVERNANCE | FINANCIAL STATEMENTS |
| | |
Additional information for US listings purpose |
Directors, senior management and employees
Employees
The average number of employees for the last three years is provided in note 4A on page 184. The average number of employees during 2023 included 129 seasonal workers. We believe our relationship with our employees and any labour unions of which they may be part is satisfactory in all material respects. Global employee share plans (SHARES)
In November 2014, Unilever’s global employee plan ‘SHARES’ was launched in 17 countries. SHARES gives eligible Unilever employees below management level the opportunity to invest between €10 and €200 per month from their net salary in Unilever shares. For every three shares our employees buy (Investment Shares), Unilever will give them one free Matching Share, which will vest if employees hold their Investment Shares for at least three years. The Matching Shares are not subject to any performance conditions. In 2015, SHARES was rolled out globally and is now offered in more than 100 countries. Executive Directors are not eligible to participate in SHARES. As of 22 February 2024 (the latest practicable date for inclusion in this report), awards for 331,195 PLC shares were outstanding under SHARES.
North American share plans
Unilever also maintains share plans for its North American employees that are governed by an umbrella plan referred to as the Unilever North America Omnibus Equity Compensation Plan, which was amended and restated as of 29 November 2022 to authorise the issue of newly issued Unilever Ordinary Shares under the Plan. These plans are the North American equivalents of the Unilever Share Plan 2017 and SHARES plans, as amended from time to time. The rules governing these share plans are materially the same as the rules governing the Unilever Share Plan 2017 and SHARES plans, respectively. However, the plans contain non-competition and non-solicitation covenants and they are subject to US and Canadian employment and tax laws. The plans are administered by the North America Compensation Committee of Unilever United States, Inc. and they are governed by New York law.
The foregoing description of the Unilever North America Omnibus Equity Compensation Plan does not purport to be complete and is qualified in its entirety by reference to the Unilever North America Omnibus Equity Compensation Plan, including all amendments thereto, filed as Exhibit 99.1 to the Form S-8 (File No. 333-185299) filed with the SEC on 12 December 2022.
Compensation Committee
The Committee is concerned with the remuneration of the Executive and Non-Executive Directors and the tier of management directly below the Board. The Committee also has responsibility for the cash and executive and all-employee share-based incentive plans, the Remuneration Policy and performance evaluation of the Unilever Leadership Executive and the periodic review of the remuneration and related policies of the wider workforce to assess alignment to PLC’s purpose, value and strategy.
Directors and senior management
Family relationship
There are no family relationships between any of our Executive Directors, members of the ULE or Non-Executive Directors.
Other arrangements
Except for as set out on pg.141 with regard to Mr. Peltz, none of our Non-Executive Directors, Executive Directors or other key management personnel are elected or appointed under any arrangement or understanding with any major shareholder, customer, supplier or others. As mentioned on page 141, Nelson Peltz, a Non-Executive Director, is the Chief Executive and founding partner of Trian Fund Management, LP, which held interests in approximately 1.5% of Unilever’s issued share capital as at 22 February 2024.
| | | | | |
248 | Unilever Annual Report on Form 20-F 2023 |
| | | | | | | | |
| | |
| STRATEGIC REPORT | CORPORATE GOVERNANCE | FINANCIAL STATEMENTS |
| | |
Additional information for US listings purpose |
Major shareholders and related party transactions
Major shareholders
The voting rights of the significant shareholders of the Company are the same as for other holders of the class of share held by such significant shareholders.
The principal trading market upon which the Company's ordinary shares are listed is the London Stock Exchange. The Company's ordinary shares are also listed and traded on Euronext Amsterdam.
In the United States, Unilever PLC American Depositary Receipts are traded on the New York Stock Exchange. Deutsche Bank Trust Company Americas (Deutsche Bank) acts for PLC as depositary.
At 22 February 2024 (the latest practicable date for inclusion in this report), there were 1,878 registered holders of Unilever PLC American Depositary Receipts in the United States. We estimate that approximately 40% of the Company’s ordinary shares (including shares underlying Unilever PLC American Depositary Receipts) were held in the United States in 2023.
If you are a shareholder of the Company, your interest is in a UK legal entity, your dividends will be paid in pound sterling (converted into US dollars if you have Unilever PLC American Depositary Receipts) and you may be subject to UK tax.
To Unilever’s knowledge, the Company is not owned or controlled, directly or indirectly, by another corporation, any foreign government or by any other legal or natural person, severally or jointly. The Company is not aware of any arrangements the operation of which may at any subsequent date result in a change of control of the Company.
Related party transactions
Transactions with related parties are conducted in accordance with agreed transfer pricing policies and include sales to joint ventures and associates. Other than those disclosed in note 23 to the consolidated financial statements (and incorporated herein as above), there were no related party transactions that were material to the Group or to the related parties concerned that are required to be reported in 2024 up to 22 February 2024 (the latest practicable date for inclusion in this report).
Dividend record
The following tables show the dividends declared and dividends paid by PLC for the last five years, expressed in terms of the revised share denominations which became effective from 22 May 2006.
| | | | | | | | | | | | | | | | | |
| 2023 | 2022 | 2021 | 2020 | 2019 |
| Dividends declared for the year | | | | | |
| PLC dividends | | | | | |
Dividend per 31/9 p | £1.48 | | £1.48 | | £1.46 | | £1.48 | | £1.43 | |
Dividend per 31/9 p (US Registry) | $1.86 | | $1.77 | | $2.00 | | $1.91 | | $1.83 | |
| Dividends paid during the year | | | | | |
| PLC dividends | | | | | |
Dividend per 31/9 p | £1.50 | | £1.45 | | £1.48 | | £1.45 | | £1.42 | |
Dividend per 31/9 p (US Registry) | $1.86 | | $1.80 | | $2.03 | | $1.85 | | $1.82 | |
| | | | | | | | |
Unilever Annual Report on Form 20-F 2023 | 249 |
| | | | | | | | |
| | |
| STRATEGIC REPORT | CORPORATE GOVERNANCE | FINANCIAL STATEMENTS |
| | |
Additional information for US listings purpose |
Material contracts
At the date of this Annual Report on Form 20-F, Unilever is not party to any contracts that are considered material to its results or operations.
Exchange controls
Other than certain economic sanctions which may be in place from time to time, there are currently no UK laws, decrees or regulations restricting the import or export of capital or affecting the remittance of dividends or other payments to holders of the PLC’s shares who are non-residents of the UK. Similarly, other than certain economic sanctions which may be in force from time to time, there are no limitations relating only to non-residents of the UK under English law or the PLC’s Articles of Association on the right to be a holder of, and to vote in respect of, the company’s shares.
Unilever Annual Report on Form 20-F 2023
Filed with the SEC on the SEC’s website. Printed copies are available, free of charge, upon request to Unilever PLC, Investor Relations department, 100 Victoria Embankment, London, EC4Y 0DY United Kingdom.
Documents on display in the United States
Unilever files and furnishes reports and information with the United States SEC. Certain of our reports and other information that we file or furnish to the SEC are also available to the public over the internet on the SEC’s website.
2022 compared to 2021 Financial Performance
We have not included a discussion of year-over-year comparisons between 2022 and 2021 in this Annual Report on Form 20-F. This discussion can be found in “Group Financial Review”, “Business Group Review”, "Planet & Society”, “Financial Performance” and “Financial Statements” in our annual report on Form 20-F for the year ended 31 December 2022, filed with the SEC on 13 March 2023.
Other information on the Company
Innovation, Research and Development
We have over 20,000 patents protecting the discoveries and breakthroughs that our global team of 5,000 world-leading experts produce. We have invested around €900m in R&D in each of the last three years.
We strive to create superior products, consumer-relevant innovation and help ensure efficiency and resilience in supply. Technology and consumers sit at the heart of our approach to innovation. We are building digital and automated technology into our innovation centres. For example, our UK Materials Innovation Factory has the highest concentration of robots doing material chemistry in the world. It delivers more accurate data many times faster than traditional methods. We run virtual tests and scenarios to optimise products before the lab and scale up stage, bringing efficiency and cutting time to market. Our new Agile Innovation hubs, including in Shanghai, China, use real time consumer data to develop new insights, then rapidly develop prototypes to test via eCommerce in a matter of days. This provides rapid and efficient, on-trend innovation.
We are investing in real science behind our focus areas. For example, our world-leading research and partnerships on the microbiome, where we have more than 100 patents. This is unlocking significant benefits and is leading to new scientific insights and product innovations, such as biome-friendly skin care products and superior, probiotic cleaning products for the home.
R&D also underpins our sustainability goals, helping to power our move away from petrochemicals, stop plastic pollution and ensuring we source ingredients in a sustainable way. Science, technology and innovation are required behind these goals, from renewable materials, to new bio-based ingredients, to next generation packaging materials.
Every Unilever product is based on an innovation crafted by our experts in collaboration with our network of partners. We translate our scientific discoveries into everyday products that improve people’s health, confidence, and wellbeing, while taking care to reduce our impact on the planet. We are constantly evolving alongside our consumers’ ever-changing lives and tastes, and to remain at the cutting-edge of science and technology.
Raw materials
Our products use a wide variety of raw and packaging materials which we source locally and internationally, and which may be subject to price volatility either directly or as a result of movements in foreign exchange rates.
In 2023, economic volatility and inflationary and cost of living pressures continued. We experienced net material inflation of around €1.8bn with lower net material inflation in the second half of the year. We more than mitigated the effect of such net material inflation through increased productivity, price and mix of our products.
Seasonality
Certain of our businesses, such as ice cream, are subject to significant seasonal fluctuations in sales. However, Unilever operates globally in many different markets and product categories, and no individual element of seasonality is likely to be material to the results of the Group as a whole.
Intellectual property
We have a large portfolio of patents and trademarks, and we conduct some of our operations under licences that are based on patents or trademarks owned or controlled by others. We are not dependent on any one patent or group of patents. We use all appropriate efforts to protect our brands and technology.
Competition
As a fast-moving consumer goods (FMCG) company, we are competing with a diverse set of competitors. Some of these operate on an international scale like ourselves, while others have a more regional or local focus. Our business model centres on building brands which consumers know, trust, like and buy in conscious preference to those of our competitors. Our brands command loyalty and affinity and deliver superior performance.
Information on market share
Unless otherwise stated, market share refers to value share as opposed to volume share. The market data and competitive position classifications are taken from independent industry sources in the markets in which Unilever operates.
Iran-related required disclosure
Unilever operates in Iran through a non-US subsidiary. In 2023, sales in Iran were significantly less than 0.5 per cent of Unilever’s worldwide turnover. During the year, this non-US subsidiary had approximately €3,273,897 in gross revenues and less than €1,442,981 in net profits attributable to the sale of personal care and home care products to entities affiliated with the Government of Iran. The entities were the Shahrvand Group and the Najm Khavarmianeh shopping mall. Income, payroll and other taxes, duties and fees (including for utilities) were payable to the Government of Iran and affiliated entities and significantly less than 0.5 per cent of our total raw material purchases were indirectly related to the Government of Iran in connection with our operations. These two suppliers were Jovein Agriculture Industry J.S.C and Amlah Madani Iran, which supplied raw materials used in personal care and home care products, including soap, shampoo and laundry products. Our non-US subsidiary maintains bank accounts in Iran with various banks to facilitate our business in the country and make any required payments to the Government of Iran and affiliated entities. While we currently continue our activities in Iran, we are continuously evaluating such activities in light of the evolving regulatory environment.
Property, plant and equipment
The Group has interests in properties in most of the countries where there are Unilever operations. None of these interests are individually material in the context of the Group as a whole. The properties are used predominantly to house production and distribution activities and as offices. There is a mixture of leased and owned property throughout the Group. We are not aware of any environmental issues affecting the properties which would have a material impact upon the Group, and there are no material encumbrances on our properties. Any difference between the market value of properties held by the Group and the amount at which they are included in the balance sheet is not significant. We believe our existing facilities are satisfactory for our current business and we currently have no plans to construct new facilities or expand or improve our current facilities in a manner that is material to the Group.
| | | | | |
250 | Unilever Annual Report on Form 20-F 2023 |
| | | | | | | | |
| | |
| STRATEGIC REPORT | CORPORATE GOVERNANCE | FINANCIAL STATEMENTS |
| | |
Additional information for US listings purpose |
Cyber Security risk management and strategy
Risk management and strategy
Unilever recognises the importance of cybersecurity and takes a
risk-based approach to the defence and resiliency of critical assets, business operations, technology and data:
■Unilever has an established Cyber Security Risk Management Framework aligned to industry-standard methodologies and control frameworks. We promote a company-wide culture of cybersecurity awareness and vigilance and provide regular reporting on the cybersecurity risk posture of the organisation to operational and business leaders, leadership executives and key non-executives, in order to influence and promote continuous improvement of our risk posture. The Cyber Security Risk Management approach is aligned to Unilever’s risk management framework, with cybersecurity risk forming a central part of the principal risk "Systems and Information" on page 75;
■Unilever has an established framework of Cyber Security Policies and Standards which are in alignment to cybersecurity industry frameworks. These apply to employees, third parties, contractors, data and technology across Unilever. Unilever Cyber Security Policies and Standards are subject to periodic review and modifications based on any changes in risk;
■A Cyber Security team dedicated to risk assurance, and the Internal Audit team conducting independent enterprise-wide risk reassurance, assess and report on the risk posture of our key systems, services, data, and operations. The scope and frequency of the evaluations are risk-based, with output used to influence and promote continuous improvement of Unilever’s resilience posture, as well as provide insights to the governance of cyber risk by the Audit Committee. The Cyber Security Assurance team is composed of internal and external expertise, including penetration testing services and a bug bounty program;
■Unilever’s Cyber Security function drives continuous improvement initiatives, leveraging people, processes and technology, to address emerging risks. We also conduct resilience planning and recovery testing, aiming to bolster preparedness for cybersecurity incidents; and
■Whilst Unilever’s cyber risk management activities are aimed at reducing the likelihood of a material cybersecurity incident happening, they cannot guarantee a material event will not occur. Should a material event occur, Unilever has a set of established and rehearsed incident response procedures. These set out a structured, phased, tiered response for the full incident lifecycle, including coordination with other corporate functions and relevant senior leaders (see below). Our procedures are designed to detect and respond in a timely manner to abnormal cyber activity in order to minimise business impact – for example by supporting rapid recovery of services and/or operations, enabling legal and regulatory obligations, or reducing reputational impact.
Our internal Cyber Security function is a global team of experienced professionals, with a multi-channeled talent pipeline, who carry various and multiple industry credentials, led by a seasoned, multi-industry experienced Chief Information Security Officer (CISO). Our internal team is complemented by the expertise and specialised knowledge of a range of external partners and providers. These external providers add support across select capabilities, all in alignment with cybersecurity industry good practice frameworks.
While we have and regularly continue to experience cyber-attacks, no known cybersecurity incidents have occurred that have, or are reasonably expected to, materially affect Unilever.
Governance
Cybersecurity risk is a component of Unilever's "Systems and Information" principal risk, reflecting the importance and priority given by the Board of Directors to this risk. The Audit Committee is central to the Board's oversight of cybersecurity risk at Unilever. Cybersecurity has continued to be an area of regular focus for the Audit Committee in 2023.
Management provides cybersecurity briefings to the Audit Committee on a regular (typically quarterly) basis, covering a range of topics including:
■Status of ongoing cybersecurity controls and risk posture, and continuous improvement initiatives
■Operational metrics, and reports and learnings, as applicable, from any cybersecurity events
■Education on our cybersecurity risk management frameworks, and regulatory trends and requirements
■Ongoing awareness of external threat landscape and trends.
The Audit Committee’s role in cybersecurity risk oversight is further supported by our Internal Audit function which provides independent re-assurance of the effectiveness of Management’s cybersecurity risk handling including internal controls systems.
Ownership of cybersecurity risk at Unilever sits with the Chief Financial Officer (CFO) and the Chief Business Operations Officer (CBOO), who are members of Unilever's executive leadership team. They receive regular, routine cybersecurity briefings as well as ad hoc updates, as needed. The broader executive leadership team members are informed of the cybersecurity risk posture of Unilever and participate in periodic education and awareness sessions.
The Chief Enterprise Technology Officer (CETO) and the Chief Information Security Officer (CISO) support the CFO and CBOO by monitoring and advising on Unilever's cybersecurity risk. Outputs from the cybersecurity risk management process, threat detection capability, vulnerability lifecycle management, and assurance and re-assurance activities drive enterprise-wide visibility and reporting of company performance on cybersecurity risk posture, influencing and prioritising continuous risk mitigation activities across the enterprise.
To make transparent and track the continuous risk mitigation activities across the enterprise, a council of senior individuals and executives meet regularly and are the membership of the Information Protection Council (IPC). This Council has expertise in cybersecurity, information technology, enterprise risk, privacy, legal, physical security, and internal audit. The IPC actively reviews enterprise-wide cybersecurity risk management prioritisation, progress and initiatives, providing key operational unlocks and risk prioritisation decisions. These senior individuals have significant experience and expertise across multiple industries, with specialty expertise in developing and executing cybersecurity strategy, driving digital transformation, managing information technology, overseeing and embedding data protection and data privacy good practices, embedment and oversight of financial controls, and operating within complex regulatory and compliance environments. The members of the IPC then drive, as appropriate to their role and responsibilities, first and second line of defence risk reduction activities, providing a whole-of-Unilever approach to the governance of cybersecurity risk, embedment of cybersecurity controls, assurance of those controls and risk posture, and independent re-assurance of our cybersecurity risk posture.
Taxation
The comments below in relation to United Kingdom and United States taxation are based on current United Kingdom and United States federal income tax law as applied in England and Wales and the United States respectively, and HM Revenue & Customs ('HMRC') and Internal Revenue Service (“IRS”) practice (which may not be binding on HMRC or the IRS) respectively, in each case as at the latest practicable date before the date of this document.
Taxation for US persons holding shares or American Depositary Shares in PLC
The following notes are provided for guidance. US persons should consult their local tax advisers, particularly in connection with potential liability to pay US taxes on disposal, lifetime gift or bequest of their shares or American Depositary Shares ('ADSs'). A US person is a US individual citizen or resident, a corporation organised under the laws of the United States, any state or the District of Columbia, or any other legal person subject to US Federal Income Tax on its worldwide income.
United Kingdom taxation on dividends
Under United Kingdom law, income tax is not withheld from dividends paid by most United Kingdom companies, including PLC. Shareholders of PLC, whether resident in the United Kingdom or not, receive the full amount of the dividend actually declared.
A non-UK resident shareholder or ADS holder holding their shares or ADSs otherwise than in connection with any trade, profession or vocation carried on through a branch, agency or permanent establishment in the UK will not generally be subject to UK tax in respect of dividends paid by PLC.
United States taxation on dividends
If you are a US person, the distribution up to the amount of PLC’s earnings and profits for US Federal Income Tax purposes will be ordinary dividend income.
Any portion of the distribution that exceeds PLC’s earnings and profits is subject to different rules. This portion is a tax-free return of capital to the extent of your basis in PLC’s shares or ADSs, and thereafter is treated as a gain on a disposition of the shares or ADSs. PLC does not maintain calculations of its earnings and profits in accordance with US Federal Income Tax accounting principles. You should therefore assume that any distribution by PLC with respect to the shares will be reported as ordinary dividend income. You should consult your own tax advisers
| | | | | | | | |
Unilever Annual Report on Form 20-F 2023 | 251 |
| | | | | | | | |
| | |
| STRATEGIC REPORT | CORPORATE GOVERNANCE | FINANCIAL STATEMENTS |
| | |
Additional information for US listings purpose |
with respect to the appropriate US Federal Income Tax treatment of any distribution received from us.
Dividends received by an individual will be taxed at a maximum rate of 15% or 20%, depending on the income level of the individual, provided the individual has held the shares or ADSs for more than 60 days during the 121-day period beginning 60 days before the ex-dividend date, that PLC is a qualified foreign corporation and certain other conditions are satisfied. PLC is a qualified foreign corporation for this purpose. In addition, an additional tax of 3.8% will apply to dividends and other investment income received by individuals with incomes exceeding certain thresholds. The dividend is not eligible for the dividends received deduction allowable to corporations. The dividend is foreign source income for US foreign tax credit purposes.
For US Federal Income Tax purposes, the amount of any dividend paid in a non-US currency will be included in income in a US dollar amount calculated by reference to the exchange rate in effect on the date the dividends are received by you or the depositary (in the case of ADSs), regardless of whether they are converted into US dollars at that time. If the non-US currency is converted into US dollars on the day they are received, you generally will not be required to recognise foreign currency gain or loss in respect of this dividend income.
UK taxation on capital gains
Under United Kingdom law, when you dispose of shares or ADSs you may be liable to pay United Kingdom tax in respect of any gain accruing on the disposal.
However, if you are either:
■an individual who is not resident in the United Kingdom for the year in question; or
■a company which is not resident in the United Kingdom when the gain accrues
you will generally not be liable to United Kingdom tax on any gains made on disposal of your shares or ADSs.
There are exceptions to this general rule, two of which are: if the shares or ADSs are held in connection with a trade or business which is conducted in the United Kingdom through a branch, agency or permanent establishment; or if the shares or ADSs are held by an individual who becomes resident in the UK having left the UK for a period of non-residence of five years or less and who was resident for at least four of the seven tax years prior to leaving the UK. In such cases, you may be liable to United Kingdom tax in respect of the disposal of shares or ADSs.
United States taxation on capital gains
If you are a US person generally you will recognise capital gain or loss for US Federal Income Tax purposes equal to the difference, if any, between the amount realised on the sale and your adjusted tax basis in the shares or ADSs, in each case as determined in US dollars. You should consult your own tax advisers about how to determine the US dollar value of any foreign currency received as proceeds on the sale of shares or ADSs and the treatment of any foreign currency gain or loss upon conversion of the foreign currency into US dollars. The capital gain or loss recognised on the sale will be long-term capital gain or loss if your holding period in the shares or ADSs exceeds one year. Non-corporate US persons are subject to tax on long-term capital gain at reduced rates. The deductibility of capital losses is subject to limitations.
UK inheritance tax
Under the current estate and gift tax convention between the United States and the United Kingdom, shares or ADSs (regardless of whether they are situated in the United Kingdom for inheritance tax purposes) held by an individual shareholder who is:
■domiciled for the purposes of the convention in the
United States; and
■not for the purposes of the convention a national of the
United Kingdom
will generally not be subject to United Kingdom inheritance tax:
■on the individual’s death; or
■on a gift of the shares during the individual’s lifetime.
Where shares or ADSs are held on trust, they will generally not be subject to United Kingdom inheritance tax where the settlor at the
time of the settlement:
■was domiciled for the purposes of the convention in the United States; and
■was not for the purposes of the convention a national of the United Kingdom.
An exception is if the shares or ADSs are part of the business property of a permanent establishment of the shareholder in the United Kingdom
or, in the case of a shareholder who performs independent personal services, pertain to a fixed base situated in the United Kingdom.
Where shares or ADSs are subject to United Kingdom inheritance tax and United States federal gift or federal estate tax, the amount of the tax paid in one jurisdiction can generally be credited against the tax due in the other jurisdiction.
Where a United Kingdom inheritance tax liability is prima facie not payable by virtue of the convention, that tax can become payable if any applicable federal gift or federal estate tax on the shares or ADSs in the United States is not paid.
Where shares are dealt with through a clearing system or in the form of ADSs, the situs of the shares may not be determinative of the situs of the interests held by holders through such system or of such ADSs for United Kingdom inheritance tax purposes. Where shares are dealt with through Euroclear Nederland, there are arguments that the interests of participants in Euroclear Nederland will be situated outside the United Kingdom for the purposes of United Kingdom inheritance tax so long as Euroclear Nederland maintains the book-entry register of such participants’ interests outside the United Kingdom, although HMRC
may not accept this analysis. Similarly, there are arguments that ADSs registered on a register outside the United Kingdom will be situated outside the United Kingdom for the purposes of United Kingdom inheritance tax, although again HMRC may not accept this analysis. Shareholders to whom this may be relevant should consult an appropriate professional adviser.
If the ADSs or the shares dealt with through Euroclear Nederland or both are not situated in the United Kingdom, a gift of such ADSs or such shares by, or the death of, an individual holder of such assets who is neither domiciled nor deemed to be domiciled (under certain rules relating to long residence or previous domicile) in the United Kingdom will not generally give rise to a liability to United Kingdom inheritance tax regardless of whether the estate and gift tax convention between the United States and the United Kingdom applies. Special rules may also apply to such ADSs or such shares dealt with through Euroclear Nederland which are held on trust.
UK stamp duty and stamp duty reserve tax
The statements in this section are intended as a general guide to the current United Kingdom stamp duty and stamp duty reserve tax ('SDRT') position. Special rules apply to certain transactions such as transfers of the shares to a company connected with the transferor and those rules are not described below. Investors should also note that certain categories of person are not liable to stamp duty or SDRT and others may be liable at a higher rate or may, although not primarily liable for tax, be required to notify and account for SDRT under the Stamp Duty Reserve Tax Regulations 1986.
Issue of shares
Subject to the points noted below in respect of shares issued to clearance services (such as Euroclear Nederland) or which are issued into a depositary receipt system where the shares are to be held in ADS form, no stamp duty or SDRT will arise on the issue of shares in registered form by PLC.
Transfer of shares
Except in relation to clearance services and depositary receipt systems (to which special rules outlined below apply), stamp duty at the rate of 0.5 per cent (rounded up to the next multiple of £5) of the amount or value of the consideration given will generally be payable on an instrument transferring PLC shares. A charge to SDRT will also generally arise on an unconditional agreement to transfer PLC shares (at the rate of 0.5 per cent of the amount or value of the consideration payable). However, if within six years of the date of the agreement becoming unconditional, an instrument of transfer is executed pursuant to the agreement, and stamp duty is paid on that instrument, any SDRT already paid will be refunded (generally, but not necessarily, with interest) provided that a claim for repayment is made, and any outstanding liability to SDRT will be cancelled. The liability to pay stamp duty or SDRT is generally satisfied by the purchaser or transferee.
Shares held through clearance services including Euroclear Nederland
Special rules apply where shares are issued or transferred to, or to a nominee or agent for, a person providing a clearance service. In such circumstances, SDRT or stamp duty may be charged at a rate of 1.5 per cent, with subsequent transfers within the clearance service then being free from SDRT and stamp duty (except in relation to clearance service
| | | | | |
252 | Unilever Annual Report on Form 20-F 2023 |
| | | | | | | | |
| | |
| STRATEGIC REPORT | CORPORATE GOVERNANCE | FINANCIAL STATEMENTS |
| | |
Additional information for US listings purpose |
providers that have made an election under section 97A(1) of the Finance Act 1986 which has been approved by HMRC, to which the special rules apply).
In light of EU case law, HMRC accepted that the 1.5 per cent charge is in breach of EU law so far as it applies to issues of shares or to transfers of shares that are an integral part of a share issue. This EU case law will continue to be recognised and followed pursuant to the provisions of the European Union (Withdrawal) Act 2018 (the 'EUWA').
HMRC’s published view is that the 1.5 per cent. SDRT or stamp duty charge continues to apply to other transfers of shares into a clearance service, although this has been disputed. In view of the continuing uncertainty, specific professional advice should be sought before incurring a 1.5 per cent stamp duty or SDRT charge in any circumstances. Any liability for stamp duty or SDRT in respect of a transfer of shares into a clearance service, or in respect of a transfer of shares within such a service, which does arise will strictly be accountable by the clearance service or its nominee but may, in practice, be payable by the relevant participant in the clearance service.
Shares held in ADS form
On the basis of EU case law referred to above and the EUWA, there should be no stamp duty or SDRT on an issuance of shares into a depositary receipt system where such transfer is an integral part of the raising of capital by the company concerned. A transfer of shares into a depositary receipt system may be subject to SDRT or stamp duty may be charged at a rate of 1.5 per cent, with subsequent transfers of depositary receipts then being free from SDRT.
Any liability for stamp duty or SDRT in respect of a transfer of shares into a depositary receipt system which does arise will strictly be accountable by the depositary receipt system operator or its nominee but may, in practice, be payable by the relevant holder of the depositary receipts.
An issue of ADSs by Deutsche Bank Trust Company Americas as depositary in respect of the ADSs will not be subject to stamp duty or SDRT. An agreement for the transfer of ADSs will not be subject to SDRT but a charge to stamp duty will technically arise on the transfer of ADSs if it is executed in the UK or relates to any property situated, or to any matter or thing done or to be done, in the UK. However, the only sanction for failing to pay such stamp duty is that the instrument of transfer cannot be produced as evidence in a UK court. Therefore, no UK stamp duty should in practice be payable on the acquisition or transfer of existing ADSs or transfer of beneficial ownership of ADSs.
US backup withholding and information reporting
Payments of dividends and other proceeds with respect to ordinary shares or ADSs by a US (or US connected) paying agent or a US (or US connected) intermediary will be reported to you and to the IRS as may be required under applicable regulations. Backup withholding may apply to these payments if you fail to provide an accurate taxpayer identification number or certification of exempt status or fail to comply with applicable certification requirements. Some holders are not subject to backup withholding. You should consult your tax adviser as to your qualification for an exemption from backup withholding and the procedure for obtaining an exemption.
Disclosure requirements for US individual holders
US individuals that hold certain specified non-US financial assets, including stock in a non-US corporation, with values in excess of certain thresholds are required to file Form 8938 with their US Federal Income Tax return. Such Form requires disclosure of information concerning such non-US assets, including the value of the assets. Failure to file the Form when required may subject you to penalties. An exemption from reporting applies to non-US assets held through a US financial institution generally including a non-US branch or subsidiary of a US institution and a US branch of a non-US institution. Investors are encouraged to consult with their own tax advisers regarding the possible application of this disclosure requirement to their investment in the shares or ADSs.
Description of securities other than equity securities
Deutsche Bank serves as the depositary (Depositary) for PLC’s American Depositary Receipt Programme.
Depositary fees and charges for PLC
Under the terms of the Deposit Agreement for the PLC American Depositary Shares (ADSs), an ADS holder may have to pay the following service fees to the depositary bank:
■Issuance of ADSs: up to US 5¢ per ADS issued.
■Cancellation of ADSs: up to US 5¢ per ADS cancelled.
■Processing of dividend and other cash distributions not made pursuant to a cancellation or withdrawal: up to US 5¢ per ADS held.
An ADS holder will also be responsible for paying certain fees and expenses incurred by the depositary bank and certain taxes and governmental charges such as:
■fees for the transfer and registration of shares charged by the registrar and transfer agent for the shares in the United Kingdom (i.e. upon deposit and withdrawal of shares);
■expenses incurred for converting foreign currency into US dollars;
■expenses for cable, telex and fax transmissions and for delivery of securities;
■taxes and duties upon the transfer of securities (i.e. when shares are deposited or withdrawn from deposit);
■fees and expenses incurred in connection with the delivery or servicing of shares on deposit; and
■fees incurred in connection with the distribution of dividends.
Depositary fees payable upon the issuance and cancellation of ADSs are typically paid to the depositary bank by the brokers (on behalf of their clients) receiving the newly issued ADSs from the depositary bank and by the brokers (on behalf of their clients) delivering the ADSs to the depositary bank for cancellation. The brokers in turn charge these transaction fees to their clients.
Note that the fees and charges an investor may be required to pay may vary over time and may be changed by us and by the depositary bank. Notice of any changes will be given to investors.
Depositary payments – fiscal year 2023
Deutsche Bank has been the depositary bank for its American Depositary Receipt Programme since 1 July 2014. Under the terms of the Deposit Agreement, PLC is entitled to certain reimbursements, including processing of cash distributions, reimbursement of listing fees (NYSE), reimbursement of settlement infrastructure fees (including DTC feeds), reimbursement of proxy process expenses (printing, postage and distribution), dividend fees and program-related expenses (that include expenses incurred from the requirements of the US Sarbanes-Oxley Act of 2002). In relation to 2023, PLC received $5,274,810 from Deutsche Bank.
Defaults, dividend arrearages and delinquencies
Defaults Programme
There has been no material default in the payment of principal, interest, a sinking or purchase fund instalment or any other material default relating to indebtedness of the Group.
Dividend arrearages and delinquencies
There have been no arrears in payment of dividends on, and material delinquency with respect to, any class of preferred stock of any significant subsidiary of the Group.
Articles of association
Lapse of distributions
Any PLC dividend unclaimed after 12 years from the date of the declaration of the dividend by PLC reverts to PLC. Any unclaimed dividends may be invested or otherwise applied for the benefit of PLC while they are claimed. PLC may also cease to send any cheque for any dividend on any shares normally paid in that manner if the cheques in respect of at least two consecutive dividends have been returned to PLC or remain uncashed.
Unilever N.V., the former parent company of the Unilever Group alongside PLC, was merged in to PLC and dissolved in November 2020 (Unification). The time periods for the right to claim cash dividends or the proceeds of share distributions declared by Unilever N.V. before Unification will remain at 5 and 20 years, respectively, after the first day the dividend or share distribution was obtainable from Unilever N.V. Any such unclaimed amounts will revert to Unilever PLC after the expiry of these time periods.
Redemption provisions and capital call
Outstanding PLC ordinary shares cannot be redeemed. PLC may make capital calls on money unpaid on shares and not payable on a fixed date. PLC has only fully paid shares in issue.
| | | | | | | | |
Unilever Annual Report on Form 20-F 2023 | 253 |
| | | | | | | | |
| | |
| STRATEGIC REPORT | CORPORATE GOVERNANCE | FINANCIAL STATEMENTS |
| | |
Additional information for US listings purpose |
Modification of rights
Modifications to PLC's Articles of Association must be approved by a general meeting of shareholders.
Modifications that prejudicially affect the rights and privileges of a class of PLC shareholders require the written consent of three-quarters of the affected holders (excluding treasury shares) or a special resolution passed at a general meeting of the class at which at least two persons holding or representing at least one-third of the paid-up capital (excluding treasury shares) must be present. Every shareholder is entitled to one vote per share held on a poll and may demand a poll vote. At any adjourned general meeting, present affected class holders may establish a quorum.
Required majorities
Resolutions are usually adopted at the Company's General Meetings by an absolute majority of votes cast, unless there are other requirements under the applicable laws or the Company's Articles. For example, there are special requirements for resolutions relating to the alteration of the Articles of Association and the liquidation of the Company. A proposal to alter the Articles of the Company can be made either by the Company's Board or by requisition of shareholders in accordance with the UK Companies Act 2006. Unless expressly specified to the contrary in the Company's Articles, the Company's Articles may be amended by a special resolution. The Company's Articles can be found on our website.
Purchases of equity securities
Share purchases during 2023
Please also refer to the ‘Shares’ section on page 99.
In 2023 31,734,256 PLC ordinary shares or ADSs were purchased by or on behalf of PLC or any 'affiliated purchaser', as defined in Section 10b-18(a)(3) of the US Securities Exchange Act of 1934, during the period covered by this annual report on Form 20-F.
The following table shows details of such purchases of shares made by the Company during 2023:
| | | | | | | | | | | | | | |
| 2023 | Total Number of Shares purchased | Average Price Paid Per Share (GBP) | Total Number of Shares Purchased as Part of Publicly Announced Plans or Programs | Maxium Number (or Approximate Dollar Value)
of Shares that May Yet be Purchased Under
the Plans or Programs |
| January | – | – | – | – |
| February | – | – | – | – |
| March | 4,475,280 | | 41.76 | 4,475,280 | | – |
| April | 2,835,489 | | 43.28 | 7,310,769 | | – |
| May | 6,611,950 | | 42.25 | 13,922,719 | | – |
| June | 1,629,965 | | 40.37 | | 15,552,684 | | – |
| July | – | – | – | – |
| August | – | – | – | – |
| September | 6,276,933 | | 40.69 | 21,829,617 | | – |
| October | 9,904,639 | | 39.69 | 31,734,256 | | – |
| November | – | – | – | – |
| December | – | – | – | – |
Between 31 December 2023 and 22 February 2024 (the latest practicable date for inclusion in this report), PLC did not conduct any share repurchases.
Management’s report on internal control over financial reporting
In accordance with the requirements of Section 404 of the US Sarbanes-Oxley Act of 2002, the following report is provided by management in respect of the Group’s internal control over financial reporting (as defined in rule 13a–15(f) or rule 15d–15(f) under the US Securities Exchange Act
of 1934):
■Unilever’s management is responsible for establishing and maintaining adequate internal control over financial reporting for the Group;
■Unilever’s management has used the Committee of Sponsoring Organizations of the Treadway Commission (COSO) framework (2013) to evaluate the effectiveness of our internal control over financial reporting. Management believes that the COSO framework (2013) is a suitable framework for its evaluation of our internal control over financial reporting because it is free from bias, permits reasonably consistent qualitative and quantitative measurements of internal controls, is sufficiently complete so that those relevant factors that would alter a conclusion about the effectiveness of internal controls are not omitted and is relevant to an evaluation of internal control over financial reporting;
■Management has assessed the effectiveness of internal control over financial reporting as of 31 December 2023, and has concluded that such internal control over financial reporting is effective. Management’s assessment and conclusion excludes Zywie Ventures Private Limited (“OZiva”) and Yasso Holdings, Inc. as they were acquired on 10 January 2023 and 1 August 2023, respectively. These entities are included in our 2023 consolidated financial statements, and together they constituted 1.09% of our total assets as at 31 December 2023 (of which 92% represented goodwill and intangible assets acquired) and 0.14% of total turnover for the year ended 31 December 2023; and
■KPMG LLP, who have audited the consolidated financial statements of the Group for the year ended 31 December 2023, have also audited the effectiveness of internal control over financial reporting as at 31 December 2023 and have issued an attestation report on internal control over financial reporting.
| | | | | |
254 | Unilever Annual Report on Form 20-F 2023 |
| | | | | | | | |
| | |
| STRATEGIC REPORT | CORPORATE GOVERNANCE | FINANCIAL STATEMENTS |
| | |
Additional information for US listings purpose |
Principal accountant fees and services
Our independent registered public accounting firm is KPMG LLP, London, United Kingdom, Auditor Firm ID: 1118
| | | | | | | | | | | |
| € million | € million | € million |
| 2023 | 2022 | 2021 |
Audit fees(a) | 23 | | 23 | | 22 | |
Audit-related fees(b)(c) | 1 | | 1 | | 6 | |
Tax fees(d) | – | | – | | – | |
All other fees(d) | – | | – | | – | |
(a)Amount payable to KPMG in respect of services supplied to associated pension schemes was less than €1 million individually and in aggregate (2022: less than €1 million individually and in aggregate; 2021: less than €1 million individually and in aggregate).
(b)Includes other audit services which comprise audit and similar work that regulations or agreements with third parties require the auditors to undertake.
(c)2021 includes audit of carve-out financial statements of ekaterra (€5 million).
(d)Amounts paid in relation to each type of service are individually less than €1 million. In aggregate the fees paid were less than €1 million (2022: less than €1 million, 2021: less than €1 million).
Guarantor statements
On 26 July 2023, Unilever Finance Netherlands B.V. and Unilever Capital Corporation (UCC) filed a US Shelf registration, which was unconditionally and fully guaranteed by Unilever PLC (PLC) and Unilever United States, Inc. (UNUS).
In relation to the US Shelf registration, US$11.2 billion of Notes were outstanding at 31 December 2023 (2022: US$10.75 billion; 2021: US$12.1 billion) with coupons ranging from 0.626% to 5.900%. These Notes are repayable between 7 March 2024 and 12 August 2051.
All debt securities issued by UCC are senior, unsecured, and unsubordinated and are fully and unconditionally guaranteed, on a joint and several basis, by PLC and UNUS.
UCC and UNUS are 100% subsidiaries of Unilever PLC and are consolidated in the financial statements of the Unilever Group. In addition, there are no material assets in the guarantor entities apart from intercompany investments and balances. Therefore, as allowed under Rule 13-01 of regulation S-X, we have excluded the summarised information for each issuer and guarantor.
The guarantees provide that, in case of the failure of the relevant issuer to punctually make payment of any principal, premium or interest, each guarantor agrees to ensure such payment is made when due whether at the stated maturity or by declaration of acceleration, call for redemption or otherwise. The guarantees also provide that the Trustee shall be paid any and all amounts due to it under the guarantee upon which the debt securities are endorsed.
| | | | | | | | |
Unilever Annual Report on Form 20-F 2023 | 255 |
For further information about
Unilever please visit our website:
www.unilever.com
Unilever PLC
Head Office
100 Victoria Embankment
London EC4Y 0DY
United Kingdom
T +44 (0)20 7438 2800
Registered Office
Unilever PLC
Port Sunlight
Wirral
Merseyside CH62 4ZD
United Kingdom
Registered in England and Wales
Company Number: 41424
UNILEVER PLC — 20-F EXHIBIT LIST
| | | | | | | | |
| Exhibit | Description of Exhibit | |
| | |
| 1.1 | | |
| | |
| 2.1 | | |
| | |
| 2.2 | | |
| | |
| 2.3 | | |
| | |
| 2.4 | | |
| | |
| 4.1 | | |
| | |
| 4.2 | | |
| | |
| 4.3 | | |
| | |
| 4.4 | | |
| | |
| 4.5 | | |
| | |
| 4.6 | | |
| | |
| 4.7 | | |
| | |
| 4.8 | | |
| | |
| 8.1 | | |
| | |
| 12.1 | | |
| | |
| 13.1 | | |
| | |
| 15.1 | | |
| | |
| 17.1 | | |
| | |
| 97.1 | | |
| | |
| 101 | The following financial information from Unilever PLC’s Annual Report on Form 20-F for the fiscal year ended December 31, 2023, formatted in iXBRL (Inline eXtensible Business Reporting Language): (i) consolidated income statement for the years ended December 31, 2023, 2022 and 2021, (ii) consolidated statement of comprehensive income for the years ended 31 December 2023, 2022 and 2021, (iii) consolidated statement of changes in equity for the year ended 31 December 2023, 2022 and 2021, (iv) consolidated balance sheet as of December 31, 2023 and 2022, (vi) consolidated cash flow statement for the years ended December 31, 2023, 2022 and 2021, and (vii) notes to the consolidated financial statements. | |
| | |
| 104 | Cover Page Interactive Data File (formatted in Inline XBRL and contained in Exhibit 101). | |
Certain instruments which define rights of holders of long-term debt of the Company and its subsidiaries are not being filed because the total amount of securities authorized under each such instrument does not exceed 10% of the total consolidated assets of the Company and its subsidiaries. The Company and its subsidiaries hereby agree to furnish a copy of each such instrument to the Securities and Exchange Commission upon request.
| | | | | |
| 1 | Incorporated by reference to Exhibit 1.1 of Form 20-F (File No: 001-04546) filed with the SEC on March 9, 2022. |
| |
| 2 | Incorporated by reference to Exhibit 2.1 of Form 20-F (File No: 001-04546) filed with the SEC on March 9, 2022. |
| |
| 3 | Incorporated by reference to Exhibit 99.1 of post-effective amendment to Form F-3 (File No: 333-245589) filed with the SEC on July 26, 2023. |
| |
| 4 | Incorporated by reference to Exhibit 99(A) of Form F-6 (File No: 333-196985) filed with the SEC on June 24, 2014. |
| |
| 5 | Incorporated by reference to Exhibit 2.5 of Form 20-F (File No: 001-04546) filed with the SEC on March 9, 2020. |
| |
| 6 | Incorporated by reference to Exhibit 99.1 of Form S-8 (File No: 333-185299) filed with the SEC on December 12, 2022. |
| |
| 7 | Incorporated by reference to Exhibit 4.5 of Form 20-F (File No: 001-04546) filed with the SEC on March 28, 2002. |
| |
| 8 | Incorporated by reference to Exhibit 4.7 of Form 20-F (File No: 001-04546) filed with the SEC on March 28, 2002. |
| |
| 9 | Incorporated by reference to Exhibit 4.8 of Form 20-F (File No: 001-04546) filed with the SEC on March 4, 2011. |
| |
| 10 | Incorporated by reference to Exhibit 4.7 of Form 20-F (File No: 001-04546) filed with the SEC on March 9, 2022. |
| |
| 11 | Incorporated by reference to Exhibit 4.9 of Form 20-F (File No: 001-04546) filed with the SEC on February 28, 2018. |
| |
| 12 | The required information is set forth on pages 226 of the Annual Report on Form 20-F 2023. |
SIGNATURES
The registrant hereby certifies that it meets all of the requirements for filing on Form 20-F and that it has duly caused and authorised the undersigned to sign this Annual Report on its behalf.
| | |
| Unilever PLC. |
| (Registrant) |
|
| /s/ M.Varsellona |
| M.Varsellona, |
| Chief Legal Officer and Group Secretary |
| Date: 14 March 2024 |