UNITED STATES SECURITIES AND EXCHANGE COMMISSION
WASHINGTON, D.C. 20549
FORM 10-K
(Mark One)
ANNUAL REPORT PURSUANT TO SECTION 13 OR 15(d) OF THE SECURITIES EXCHANGE ACT OF 1934 | |
For the fiscal year ended December 31, 2019
or
TRANSITION REPORT PURSUANT TO SECTION 13 OR 15(d) OF THE SECURITIES EXCHANGE ACT OF 1934 | |
For the transition period from to .
Commission File Number 1-644

(Exact name of registrant as specified in its charter)
(State or other jurisdiction of incorporation or organization) | (I.R.S. Employer Identification No.) | |
(Address of principal executive offices) | (Zip Code) | |
Registrant’s telephone number, including area code 212 -310-2000
Securities registered pursuant to Section 12(b) of the Act:
Title of each class | Trading Symbol(s) | Name of each exchange on which registered |
Indicate by check mark if the registrant is a well-known seasoned issuer, as defined in Rule 405 of the Securities Act.
Indicate by check mark if the registrant is not required to file reports pursuant to Section 13 or Section 15(d) of the Act.
Yes ☐ No ☒
Indicate by check mark whether the registrant: (1) has filed all reports required to be filed by Section 13 or 15(d) of the Securities Exchange Act of 1934 during the preceding 12 months (or for such shorter period that the registrant was required to file such reports), and (2) has been subject to such filing requirements for the past 90 days. Yes ☒ No ☐
Indicate by check mark whether the registrant has submitted electronically every Interactive Data File required to be submitted pursuant to Rule 405 of Regulation S-T (§232.405) during the preceding 12 months (or for such shorter period that the registrant was required to submit and post such files). Yes ☒ No ☐
Indicate by check mark whether the registrant is a large accelerated filer, an accelerated filer, a non-accelerated filer, a smaller reporting company, or an emerging growth company. See the definitions of “large accelerated filer,” “accelerated filer”, “smaller reporting company” and “emerging growth company” in Rule 12b-2 of the Exchange Act.
☒ | Accelerated filer | ☐ | |
Non-accelerated filer | ☐ | Smaller reporting company | |
Emerging growth company | |||
If an emerging growth company, indicate by check mark if the registrant has elected not to use the extended transition period for complying with any new or revised financial accounting standards provided pursuant to Section 13(a) of the Exchange Act. ☐
Indicate by check mark whether the registrant is a shell company (as defined in Rule 12b-2 of the Exchange Act).
Yes ☐ No ☒
The aggregate market value of Colgate-Palmolive Company Common Stock held by non-affiliates as of June 30, 2019 (the last business day of its most recently completed second quarter) was approximately $61.3 billion.
There were 855,029,777 shares of Colgate-Palmolive Company Common Stock outstanding as of January 31, 2020.
DOCUMENTS INCORPORATED BY REFERENCE:
Documents | Form 10-K Reference |
Portions of Proxy Statement for the 2020 Annual Meeting of Stockholders | Part III, Items 10 through 14 |
Colgate-Palmolive Company
Table of Contents
Part I | Page | |
Item 1. | Business | |
Item 1A. | Risk Factors | |
Item 1B. | Unresolved Staff Comments | |
Item 2. | Properties | |
Item 3. | Legal Proceedings | |
Item 4. | Mine Safety Disclosures | |
Part II | ||
Item 5. | Market for Registrant’s Common Equity, Related Stockholder Matters and Issuer Purchases of Equity Securities | |
Item 6. | Selected Financial Data | |
Item 7. | Management’s Discussion and Analysis of Financial Condition and Results of Operations | |
Item 7A. | Quantitative and Qualitative Disclosures About Market Risk | |
Item 8. | Financial Statements and Supplementary Data | |
Item 9. | Changes in and Disagreements with Accountants on Accounting and Financial Disclosure | |
Item 9A. | Controls and Procedures | |
Item 9B. | Other Information | |
Part III | ||
Item 10. | Directors, Executive Officers and Corporate Governance | |
Item 11. | Executive Compensation | |
Item 12. | Security Ownership of Certain Beneficial Owners and Management and Related Stockholder Matters | |
Item 13. | Certain Relationships and Related Transactions and Director Independence | |
Item 14. | Principal Accountant Fees and Services | |
Part IV | ||
Item 15. | Exhibits and Financial Statement Schedules | |
Item 16. | Form 10-K Summary | |
Signatures | ||
PART I
ITEM 1. BUSINESS
(a) General Development of the Business
Colgate-Palmolive Company (together with its subsidiaries, the “Company” or “Colgate”) is a leading consumer products company whose products are marketed in over 200 countries and territories throughout the world. Colgate was founded in 1806 and incorporated under the laws of the State of Delaware in 1923.
For recent business developments and other information, refer to the information set forth under the captions “Management’s Discussion and Analysis of Financial Condition and Results of Operations–Executive Overview,” “– Outlook,” “–Results of Operations,” “–Restructuring and Related Implementation Charges” and “– Liquidity and Capital Resources” in Part II, Item 7 of this report.
(c) Narrative Description of the Business
The Company operates in two product segments: Oral, Personal and Home Care; and Pet Nutrition. Colgate is a leader in Oral Care with global leadership in the toothpaste and manual toothbrush categories according to market share data. Colgate’s Oral Care products include Colgate Maximum Cavity Protection, Colgate Total, Colgate Triple Action, Darlie Double Action, Colgate Max Fresh, Colgate Optic White, Colgate Whitening and Colgate Max White toothpastes, Colgate 360°, Colgate Extra Clean and Colgate Slim Soft manual toothbrushes and Colgate Plax, meridol and Colgate Total mouthwashes. Colgate’s Oral Care business also includes pharmaceutical products for dentists and other oral health professionals.
Colgate is a leader in many product categories of the Personal Care market with global leadership in liquid hand soap, which it sells under the Softsoap, Palmolive and Protex brands according to market share data. Colgate’s Personal Care products also include Protex, Palmolive and Irish Spring bar soaps, Palmolive, Sanex and Softsoap shower gels, Speed Stick, Sanex and Lady Speed Stick deodorants and antiperspirants, Filorga, Elta MD and PCA Skin skin health products and Palmolive and Caprice shampoos and conditioners.
Colgate manufactures and markets a wide array of products for the Home Care market, including Palmolive and Ajax dishwashing liquids and Fabuloso, Murphy’s Oil Soap and Ajax household cleaners. Colgate is a market leader in fabric conditioners with leading brands, including Suavitel in Latin America, Soupline in Europe, and Cuddly in the South Pacific, according to market share data.
Sales of Oral, Personal and Home Care products accounted for 46%, 20% and 18%, respectively, of the Company’s total worldwide Net sales in 2019. Geographically, Oral Care is a significant part of the Company’s business in Asia Pacific, comprising approximately 82% of Net sales in that region for 2019.
Colgate, through its Hill’s Pet Nutrition segment (“Hill’s” or “Pet Nutrition”), is a world leader in specialty pet nutrition products for dogs and cats with products marketed in over 80 countries and territories worldwide. Hill’s markets pet foods primarily under two brands. Hill’s Science Diet, which is called Hill’s Science Plan in Europe, is a range of products for everyday nutritional needs. Hill’s Prescription Diet is a range of therapeutic products to help nutritionally manage disease conditions in dogs and cats. Sales of Pet Nutrition products accounted for 16% of the Company’s total worldwide Net sales in 2019.
For more information regarding the Company’s worldwide Net sales by product category, refer to Note 1, Nature of Operations and Note 14, Segment Information to the Consolidated Financial Statements.
For additional information regarding market share data, see “Market Share Information” in Part II, Item 7 of this report.
1
Distribution; Raw Materials; Competition; Trademarks and Patents
The Company’s Oral, Personal and Home Care products are sold to a variety of traditional and eCommerce retailers, wholesalers and distributors worldwide. Pet Nutrition products are sold by authorized pet supply retailers, veterinarians and eCommerce retailers. The Company’s sales to Wal-Mart, Inc. and its affiliates represent approximately 11% of the Company’s Net sales in 2019. No other customer represents more than 10% of the Company’s Net sales. The Company supports its products with advertising, promotion and other marketing (with increasing emphasis on digital) to build awareness and trial of the Company’s products. The Company’s products are marketed by a direct sales force at individual operating subsidiaries or business units, and by distributors or brokers.
The majority of raw and packaging materials used in the Company’s products is purchased from other companies and is available from several sources. No single raw or packaging material represents, and no single supplier provides, a significant portion of the Company’s total material requirements. For certain materials, however, new suppliers may have to be qualified under industry, governmental and Colgate standards, which can require additional investment and take some period of time. Raw and packaging material commodities, such as resins, essential oils, pulp, tropical oils, tallow, poultry, corn and soybeans, are subject to market price variations. For further information regarding the impact of changes in commodity prices, see Item 1A, “Risk Factors - Volatility in material and other costs could adversely impact our profitability” and Item 7, “Management’s Discussion and Analysis of Financial Condition and Results of Operations.”
The Company’s products are sold in a highly competitive global marketplace which has experienced increased trade concentration, the rapid growth of eCommerce, the integration of traditional and digital operations at key retailers and the growing presence of large-format retailers and discounters. Products similar to those produced and sold by the Company are available from multinational and local competitors in the U.S. and overseas. Certain of the Company’s competitors are larger and have greater resources than the Company. In certain geographies, the Company also faces strong local competitors, who may be more agile and have better local consumer insights than the Company. Private label brands sold by retailers are also a source of competition for certain of the Company’s products.
The retail landscape in many of the Company’s markets continues to be impacted by the rapid growth of eCommerce retailers, changing consumer preferences (as consumers increasingly shop online) and the emergence of alternative retail channels, such as subscription services and direct-to-customer businesses. The Company faces competition in several aspects of its business, including pricing, promotional activities, new product and brand introductions and expansion into new geographies and channels. Product quality, innovation, brand recognition, marketing capability and acceptance of new products and brands largely determine success in the Company’s operating segments.
The Company considers trademarks to be of material importance to its business. The Company follows a practice of seeking trademark protection in the U.S. and throughout the world where the Company’s products are sold. Principal global and regional trademarks include Colgate, Palmolive, elmex, meridol, Tom’s of Maine, Sorriso, Hello, Speed Stick, Lady Speed Stick, Softsoap, Irish Spring, Protex, Sanex, Filorga, Elta MD, PCA Skin, Ajax, Axion, Fabuloso, Soupline and Suavitel, as well as Hill’s Science Diet and Hill’s Prescription Diet. The Company’s rights in these trademarks endure for as long as they are used and/or registered. Although the Company actively develops and maintains a portfolio of patents, no single patent is considered significant to the business as a whole.
Environmental Matters
The Company has programs that are designed to ensure that its operations and facilities meet or exceed standards established by applicable environmental rules and regulations. Capital expenditures for environmental control facilities totaled approximately $46 million for 2019. For future years, expenditures are currently expected to be of a similar magnitude. For additional information regarding environmental matters refer to Note 13, Commitments and Contingencies, to the Consolidated Financial Statements.
2
Employees
As of December 31, 2019, the Company employed approximately 34,300 employees.
Information about our Executive Officers
The following is a list of executive officers as of February 21, 2020:
Name | Age | Date First Elected Officer | Present Title | |||
Ian Cook | 67 | 1996 | Executive Chairman | |||
Noel R. Wallace | 55 | 2009 | President and Chief Executive Officer | |||
Henning I. Jakobsen | 59 | 2017 | Chief Financial Officer | |||
John J. Huston | 65 | 2002 | Senior Vice President, Chief of Staff | |||
Daniel B. Marsili | 59 | 2005 | Chief Human Resources Officer | |||
Patricia Verduin | 60 | 2011 | Chief Technology Officer | |||
Jennifer M. Daniels | 56 | 2014 | Chief Legal Officer and Secretary | |||
Philip G. Shotts | 65 | 2018 | Vice President and Controller | |||
John W. Kooyman | 55 | 2019 | Chief Marketing Officer | |||
Prabha Parameswaran | 61 | 2019 | Group President, Global Innovation Group and Africa-Eurasia | |||
Panagiotis Tsourapas | 55 | 2019 | Group President, Latin America and Asia Pacific | |||
Each of the executive officers listed above has served the registrant or its subsidiaries in various executive capacities for the past five years.
Under the Company’s By-Laws, the officers of the corporation hold office until their respective successors are chosen and qualified or until they have resigned, retired or been removed by the affirmative vote of a majority of the Board of Directors of the Company (the “Board”). There are no family relationships between any of the executive officers, and there is no arrangement or understanding between any executive officer and any other person pursuant to which the executive officer was elected.
(e) Available Information
The Company’s website address is www.colgatepalmolive.com. The information contained on the Company’s website is not included as a part of, or incorporated by reference into, this Annual Report on Form 10-K. The Company makes available, free of charge, on its website its Annual Reports on Form 10-K, its Quarterly Reports on Form 10-Q, its interactive data files posted pursuant to Rule 405 of Regulation S-T, its Current Reports on Form 8-K and amendments to such reports filed or furnished pursuant to Section 13(a) or 15(d) of the Securities Exchange Act of 1934 (the “Exchange Act”) as soon as reasonably practicable after the Company has electronically filed such material with, or furnished it to, the United States Securities and Exchange Commission (the “SEC”). Also available on the Company’s website are the Company’s Code of Conduct and Board Guidelines on Significant Corporate Governance Issues, the charters of the Committees of the Board, Specialized Disclosure Reports on Form SD, reports under Section 16 of the Exchange Act of transactions in Company stock by directors and executive officers and its proxy statements.
3
ITEM 1A. RISK FACTORS
In addition to the risks described elsewhere in this report, set forth below is a summary of the material risks to an investment in our securities. These risks are not the only ones we face. Additional risks not presently known to us or that we currently deem immaterial may also have an adverse effect on us. If any of these risks actually occur, our business, results of operations, cash flows and financial condition could be materially and adversely impacted, which might cause the value of our securities to decline.
We face risks associated with significant international operations, including exposure to foreign currency fluctuations.
We operate on a global basis serving consumers in more than 200 countries and territories with approximately 70% of our Net sales originating in markets outside the U.S. While geographic diversity helps to reduce our exposure to risks in any one country or part of the world, it also means that we face risks associated with significant international operations, including, but not limited to:
▪ | changes in exchange rates for foreign currencies, which may reduce the U.S. dollar value of revenues, profits and cash flows from non-U.S. markets or increase our supply costs, as measured in U.S. dollars, in those markets; |
▪ | exchange controls and other limits on our ability to import or export raw materials or finished product or to repatriate earnings from overseas; |
▪ | political or economic instability, geopolitical events, environmental events, widespread health emergencies, such as the novel coronavirus or other pandemics or epidemics, natural disasters, or social or labor unrest; |
▪ | changing macroeconomic conditions in our markets, including as a result of volatile commodity prices, including the price of oil; |
▪ | lack of well-established, reliable and/or impartial legal systems in certain countries where we operate and difficulties in enforcing contractual, intellectual property or other legal rights; |
▪ | foreign ownership and investment restrictions and the potential for nationalization or expropriation of property or other resources; and |
▪ | changes to trade policies and agreements and other foreign or domestic legal and regulatory requirements, including those resulting in potentially adverse tax consequences or the imposition of and/or the increase in onerous trade restrictions and/or tariffs, sanctions, price controls, labor laws, travel or immigration restrictions, profit controls or other government controls. |
All of the foregoing risks could have a significant impact on our ability to sell our products on a competitive basis in international markets and may adversely affect our business, results of operations, cash flows and financial condition. In addition, a number of these risks may adversely impact consumer confidence and consumption, which could reduce sales volumes of our products or result in a shift in our product mix from higher margin to lower margin product offerings.
In addition, the impact of the United Kingdom’s exit from, and the related negotiations with, the European Union (commonly referred to as Brexit) are, at this time, unclear. Brexit has created legal, political and economic uncertainty, which could subject us to heightened risks in the region, including disruptions to trade and the free movement of goods, services and people to and from the United Kingdom, increased foreign exchange volatility with respect to the British pound and disruptions to our workforce and that of our suppliers and business partners. We do not, however, believe Brexit will have a material impact on our business, results of operations, cash flows or financial condition.
Furthermore, the recent imposition of tariffs and/or increase in tariffs on various products by the United States and other countries have introduced greater uncertainty with respect to trade policies and government regulations affecting trade between the United States and other countries and new and/or increased tariffs have subjected, and may continue in the future to subject, us to additional costs and expenditure of resources. Major developments in trade relations, including the imposition of new or increased tariffs by the United States and/or other countries, and any emerging nationalist trends in specific countries could alter the trade environment and consumer purchasing behavior which, in turn, could have a material effect on our business, results of operations, cash flows and financial condition.
4
In an effort to minimize the impact on earnings of foreign currency rate movements, we engage in a combination of selling price increases, where permitted, sourcing strategies, cost-containment measures and selective hedging of foreign currency transactions. However, the impact of these measures may not fully offset any negative impact of foreign currency rate movements on our business, results of operations, cash flows and financial condition.
Significant competition in our industry could adversely affect our business.
We face vigorous competition worldwide, including from strong local competitors and from other large, multinational companies, some of which may have greater resources than we do. In addition, the substantial growth in eCommerce has encouraged the entry of new competitors and business models.
We face competition in several aspects of our business, including pricing, promotional activities, new product introductions and expansion into new geographies and channels. Some of our competitors may spend more aggressively on or have more effective advertising and promotional activities than we do, introduce competing products more quickly and/or respond more effectively to changing consumer preferences and business and economic conditions. Such competition also extends to administrative and legal challenges of product claims and advertising. Our ability to compete also depends on the strength of our brands and on our ability to enforce and defend our intellectual property, including patent, trademark, copyright, trade secret and trade dress rights against infringement and legal challenges by competitors.
We may be unable to anticipate the timing and scale of such initiatives or challenges by competitors or to successfully respond to them, which could harm our business. In addition, the cost of responding to such initiatives and challenges, including management time, out-of-pocket expenses and price reductions, may affect our performance in the relevant period. A failure to compete effectively could adversely affect our business, results of operations, cash flows and financial condition.
Increasing dependence on key retailers in developed markets, changes in the policies of our retail trade customers, the emergence of alternative retail channels and the rapidly changing retail landscape may adversely affect our business.
Our products are sold in a highly competitive global marketplace which has experienced increased trade concentration and the growing presence of large-format retailers, discounters and eCommerce retailers. With the growing trend toward retail trade consolidation, the rapid growth of eCommerce and the integration of traditional and digital operations at key retailers, we are increasingly dependent on certain retailers, and some of these retailers have and may continue to have greater bargaining strength than we do. They have used and may continue to use this leverage to demand higher trade discounts, allowances or slotting fees, which could lead to reduced sales or profitability. The loss of a key customer or a significant reduction in sales to a key customer could adversely affect our business, results of operations, cash flows and financial condition. For additional information regarding our customers, see “Distribution; Raw Materials; Competition; Trademarks and Patents” in Item 1 “Business.”
We also have been and may continue to be negatively affected by changes in the policies or practices of our retail trade customers, such as inventory de-stocking, limitations on access to shelf space, delisting of our products, environmental or sustainability initiatives and other conditions. For example, a determination by a key retailer that any of our ingredients should not be used in certain consumer products or that our packaging does not comply with certain environmental standards or initiatives could adversely impact our business, results of operations, cash flows and financial condition. In addition, “private label” products sold by our retail customers, which are typically sold at lower prices than branded products, are a source of competition for certain of our products.
In addition, the retail landscape in many of our markets continues to be impacted by the rapid growth of eCommerce retailers, changing consumer preferences (as consumers increasingly shop online) and the emergence of alternative retail channels, such as subscription services and direct-to-customer businesses. The rapid growth in eCommerce and the emergence of alternative retail channels have created and may continue to create pricing pressures and/or adversely affect our relationships with our key retailers. If we are not successful in adapting or effectively reacting to changes in consumer preferences and market dynamics and/or expanding sales through eCommerce retailers and other alternative retail channels, our business, results of operations, cash flows and financial condition could be adversely affected.
5
Our business is subject to legal and regulatory risks in the U.S. and abroad.
Our business is subject to extensive legal and regulatory requirements in the U.S. and abroad. Such legal and regulatory requirements apply to most aspects of our products, including their development, ingredients, formulation, manufacture, packaging content, labeling, storage, transportation, distribution, export, import, advertising, sale and environmental impact. U.S. federal authorities, including the U.S. Food and Drug Administration (the “FDA”), the Federal Trade Commission, the Consumer Product Safety Commission and the Environmental Protection Agency, regulate different aspects of our business, along with parallel authorities at the state and local levels and comparable authorities overseas. In addition, our selling practices are regulated by competition law authorities in the U.S. and abroad.
New or more stringent legal or regulatory requirements, or more restrictive interpretations of existing requirements, could adversely impact our business, results of operations, cash flows and financial condition. For example, from time to time, various regulatory authorities in Europe, the U.S. and other countries review the use of various ingredients and packaging content in consumer products. A decision by a regulatory or governmental authority that any ingredient or packaging content in our products should be restricted or should otherwise be newly regulated, could adversely impact our business and reputation, as could negative reactions by our consumers, trade customers or non-governmental organizations to our current or prior use of such ingredients or packaging. Additionally, an inability to develop new or reformulated products containing alternative ingredients, to obtain regulatory approval of such products on a timely basis or to effectively market and sell such products could likewise adversely affect our business.
Because of our extensive international operations, we could be adversely affected by violations of worldwide anti-bribery laws, including those that prohibit companies and their intermediaries from making improper payments to government officials or other third parties for the purpose of obtaining or retaining business, such as the U.S. Foreign Corrupt Practices Act (the “FCPA”), and laws that prohibit commercial bribery. While our policies mandate compliance with these anti-bribery laws, we cannot provide assurance that our internal control policies and procedures will always protect us from reckless or criminal acts committed by our employees, joint venture partners or agents. Violations of these laws, or allegations of such violations, could disrupt our business and adversely affect our reputation and our business, results of operations, cash flows and financial condition.
While it is our policy and practice to comply with all legal and regulatory requirements applicable to our business, a finding that we are in violation of, or out of compliance with, applicable laws or regulations could subject us to civil remedies, including fines, damages, injunctions or product recalls, or criminal sanctions, any of which could adversely affect our business, results of operations, cash flows and financial condition. Even if a claim is unsuccessful, is without merit or is not fully pursued, the cost of responding to such a claim, including management time and out-of-pocket expenses, and the negative publicity surrounding such assertions regarding our products, processes or business practices could adversely affect our reputation, brand image and our business, results of operations, cash flows and financial condition. For information regarding our legal and regulatory matters, see Item 3 “Legal Proceedings” and Note 13, Commitments and Contingencies to the Consolidated Financial Statements.
6
The growth of our business depends on the successful identification, development and launch of innovative new products.
Our growth depends on the continued success of existing products, the successful identification, development and launch of innovative new and differentiated products and the expansion into adjacent categories, channels of distribution or geographies. Our ability to launch new products, to sustain existing products and to expand into adjacent categories, channels of distribution or geographies is affected by whether we can successfully:
▪ | identify, develop and fund technological innovations; |
▪ | obtain and maintain necessary intellectual property protection and avoid infringing intellectual property rights of others; |
▪ | obtain approvals and registrations of regulated products, including from the FDA and other regulatory bodies in the U.S. and abroad; and |
▪ | anticipate and quickly respond to consumer needs and preferences. |
The identification, development and introduction of innovative new products involves considerable costs and effort, and any new product may not generate sufficient customer and consumer interest and sales to become a profitable product or to cover the costs of its development and promotion. Our ability to achieve a successful launch of a new product could also be adversely affected by preemptive actions taken by competitors in response to the launch, such as increased promotional activities and advertising. In addition, new products may not be accepted quickly or significantly in the marketplace.
Our ability to quickly innovate and to adapt our products to meet evolving consumer preferences is an essential part of our business strategy. The failure to develop and launch successful new products could hinder the growth of our business and any delay in the development or launch of a new product could result in us not being the first to market, which could compromise our competitive position and adversely affect our business, results of operations, cash flows and financial condition.
If, in the course of identifying or developing new products, we are found to have infringed the trademark, trade secret, copyright, patent or other intellectual property rights of others, directly or indirectly, through the use of third-party ideas or technologies, such a finding could adversely affect our ability to develop innovative new products and adversely affect our business, results of operations, cash flows and financial condition. Even if we are not found to infringe a third party’s intellectual property rights, claims of infringement could adversely affect us, including by increasing costs and by delaying the launch of new products.
7
Damage to our reputation could have an adverse effect on our business.
Maintaining our strong reputation with consumers and our trade partners globally is critical to selling our branded products. Accordingly, we devote significant time and resources to programs designed to protect and preserve our reputation, such as our Ethics and Compliance, Sustainability, Brand Protection and Product Safety, Regulatory and Quality initiatives. Negative publicity about us, our brands, our products, our supply chain, our ingredients, our packaging or our employees, whether or not deserved, could jeopardize our reputation. Such negative publicity could relate to, among other things, health concerns, threatened or pending litigation or regulatory proceedings, environmental impacts (including packaging, energy and water use and waste management) or other sustainability or policy issues. In addition, widespread use of digital and social media by consumers has greatly increased the accessibility of information and the speed of its dissemination. Negative publicity, posts or comments on social media about us, our brands, our products, our packaging or our employees, whether true or untrue, could damage our brands and our reputation. The success of our brands could also suffer if our marketing initiatives do not have the desired impact on a brand’s image or its ability to attract consumers.
Additionally, due to the scale and scope of our business, we must rely on relationships with third parties, including our suppliers, distributors, contractors, joint venture partners and other external business partners, for certain functions. While we have policies and procedures for managing these relationships, they inherently involve a lesser degree of control over business operations, governance and compliance, thereby potentially increasing our reputational and legal risk.
In addition, third parties sell counterfeit versions of our products, which are inferior or may pose safety risks. As a result, consumers of our brands could confuse our products with these counterfeit products, which could cause them to refrain from purchasing our brands in the future and in turn could impair our brand equity and adversely affect our business, results of operations, cash flows and financial condition.
Damage to our reputation or loss of consumer confidence in our products for these or any other reasons could adversely affect our business, results of operations, cash flows and financial condition, as well as require resources to rebuild our reputation.
There is no guarantee that our ongoing efforts to reduce costs will be successful.
One way that we generate funds needed to support the growth of our business is through our continuous, Company-wide initiatives to lower costs and increase effective asset utilization, which we refer to as our funding-the-growth initiatives. These initiatives are designed to reduce costs associated with direct materials, indirect expenses, distribution and logistics, and advertising and promotional materials, among other things. The achievement of our funding-the-growth goals depends on our ability to successfully identify and realize additional savings opportunities. Events and circumstances, such as financial or strategic difficulties, delays and unexpected costs may occur that could result in our not realizing any or all of the anticipated benefits or our not realizing the anticipated benefits on our expected timetable. If we are unable to realize the anticipated savings of our funding-the-growth initiatives, our ability to fund other initiatives and achieve our profitability goals may be adversely affected. Any failure to implement our funding-the-growth initiatives in accordance with our expectations could adversely affect our business, results of operations, cash flows and financial condition. For additional information regarding our funding-the-growth initiatives, refer to Part II, Item 7 “Management’s Discussion and Analysis of Financial Condition and Results of Operations – Executive Overview.”
8
Volatility in material and other costs could adversely impact our profitability.
Raw and packaging material commodities, such as resins, essential oils, pulp, tropical oils, tallow, poultry, corn and soybeans, are subject to market price variations. Increases in the costs and/or a reduction in the availability of commodities, energy and transportation and other necessary services have affected and may continue to adversely affect our profit margins. If commodity and other cost increases continue in the future and we are unable to pass along such higher costs in the form of price increases, achieve cost efficiencies, such as in manufacturing and distribution, or otherwise manage the exposure through sourcing strategies, ongoing productivity initiatives and the limited use of commodity hedging contracts, our business, results of operations, cash flows and financial condition could be adversely impacted. In addition, even if we are able to increase the prices of our products in response to commodity and other cost increases, we may not be able to sustain the price increases. Also, sustained price increases may lead to declines in volume as competitors may not adjust their prices or consumers may decide not to pay higher prices, which could lead to sales declines and loss of market share and could adversely affect our business, results of operations, cash flows and financial condition. See “Disruption in our global supply chain or key office facilities could adversely impact our business” below for additional information.
Our success depends upon our ability to attract and retain key employees and the succession of senior management.
Our success largely depends on the performance of our management team and other key employees. If we are unable to attract and retain talented, highly qualified senior management and other key people, our business, results of operations, cash flows and financial condition could be adversely affected. Successfully executing organizational change, including management transitions at leadership levels of the Company and succession plans for senior management, is critical to our business success. While we follow a disciplined, ongoing succession planning process and have succession plans in place for senior management and other key executives, these do not guarantee that the services of qualified senior executives will continue to be available to us at particular moments in time. Further, changes in immigration laws and policies could also make it more difficult for us to recruit or relocate highly skilled technical, professional and management personnel to meet our business needs.
Legal claims and proceedings could adversely impact our business.
As a global company serving consumers in more than 200 countries and territories, we may be subject to a wide variety of legal claims and proceedings, including disputes relating to intellectual property, contracts, product liability, marketing, advertising, foreign exchange controls, antitrust and trade regulation, as well as labor and employment, pension, data privacy and security, environmental and tax matters and consumer class actions. Regardless of their merit, these claims can require significant time and expense to investigate and defend. Since litigation is inherently uncertain, there is no guarantee that we will be successful in defending ourselves against such claims or proceedings, or that our assessment of the materiality of these matters, including any reserves taken in connection therewith, will be consistent with the ultimate outcome of such matters. In addition, if one of our products, or an ingredient contained in our products, is perceived or found to be defective or unsafe, we may need to recall or reformulate some of our products. Whether or not a legal claim or proceeding is successful, or a recall or reformulation is required, such assertions could have an adverse effect on our business, results of operations, cash flows and financial condition, and the negative publicity surrounding them could harm our reputation and brand image. The resolution of, or increase in the reserves taken in connection with, one or more of these matters in any reporting period could have a material adverse effect on our business, results of operations, cash flows and financial condition for that period. See Item 3 “Legal Proceedings” and Note 13, Commitments and Contingencies to the Consolidated Financial Statements for additional information on certain of our legal claims and proceedings.
9
Disruption in our global supply chain or key office facilities could adversely impact our business.
We are engaged in manufacturing and sourcing of products and materials on a global scale. Our operations and those of our suppliers or contract manufacturers could be disrupted by a number of factors, including, but not limited to:
▪ | environmental events; |
▪ | widespread health emergencies, such as the novel coronavirus or other pandemics or epidemics; |
▪ | strikes and other labor disputes; |
▪ | disruptions in logistics; |
▪ | loss or impairment of key manufacturing sites; |
▪ | loss of key suppliers or contract manufacturers; |
▪ | supplier capacity constraints; |
▪ | raw material and product quality or safety issues; |
▪ | industrial accidents or other occupational health and safety issues; |
▪ | the impact on our suppliers of tighter credit or capital markets; |
▪ | the lack of availability of qualified personnel, such as truck drivers; |
▪ | governmental incentives and controls (including import and export restrictions, such as new or increased tariffs, sanctions, quotas or trade barriers); and |
▪ | natural disasters, including climatic events (including any potential effect of climate change) and earthquakes, acts of war or terrorism, political unrest or uncertainty, fires or explosions and other external factors over which we have no control. |
In addition, we purchase certain key raw and packaging materials from single-source suppliers or a limited number of suppliers and new suppliers may have to be qualified under industry, governmental and Colgate standards, which can require additional investment and take a significant period of time.
We believe that the supplies of raw materials needed to manufacture our products are adequate. In addition, we have business continuity and contingency plans in place for key manufacturing sites and the supply of raw and packaging materials. Nonetheless, a significant disruption to the manufacturing or sourcing of products or materials for any reason, including those mentioned above, could interrupt product supply and, if not remedied, could have an adverse impact on our business, results of operations, cash flows and financial condition.
In addition, as a result of our global shared service organizational model, certain of our functions, such as marketing, payroll, finance and accounting, customer service and logistics, and human resources, are concentrated in key office facilities. A significant disruption to any of our key office facilities for any reason, including those mentioned above, could adversely affect our business, results of operations, cash flows and financial condition.
10
A cyber-security incident, data breach or a failure of a key information technology system could adversely impact our business.
We rely extensively on information technology systems (“IT Systems”), including some which are managed, hosted, provided and/or used by third parties, including cloud-based service providers, and their vendors, in order to conduct our business. Our uses of these systems include, but are not limited to:
▪ | communicating within our company and with other parties, including our customers and consumers; |
▪ | ordering and managing materials from suppliers; |
▪ | converting materials to finished products; |
▪ | receiving and processing orders from, shipping products to and invoicing our customers and consumers; |
▪ | marketing products to consumers; |
▪ | collecting, storing, transferring and/or processing customer, consumer, employee, vendor, investor and other stakeholder information and personal data, including, but not limited to, such data from residents of the European Union who are covered by the General Data Protection Regulation, which went into effect on May 25, 2018, and residents of the State of California who are covered by the California Consumer Privacy Act of 2018, which went into effect on January 1, 2020; |
▪ | processing transactions, including but not limited to employee payroll, employee and retiree benefits and payments to customers and vendors; |
▪ | hosting, processing and sharing confidential and proprietary research, intellectual property, business plans and financial information; |
▪ | summarizing and reporting results of operations, including financial reporting; |
▪ | managing our banking and other cash liquidity systems and platforms; |
▪ | complying with legal, regulatory and tax requirements; |
▪ | providing data security; and |
▪ | handling other processes involved in managing our business. |
Although we have a broad array of information security measures in place, our IT Systems, including those of third-party service providers with whom we have contracted, have been, and will likely continue to be, subject to computer viruses or other malicious codes, unauthorized access attempts, phishing and other cyber-attacks. Cyber-attacks and other cyber incidents are occurring more frequently, are constantly evolving in nature, are becoming more sophisticated and are being made by groups, individuals and nation states with a wide range of expertise and motives. Such cyber-attacks and cyber incidents can take many forms, including cyber extortion, social engineering, password theft or introduction of viruses or malware, such as ransomware through phishing emails. We cannot guarantee that our security efforts will prevent breaches or breakdowns of our, or our third-party service providers’, IT Systems since the techniques used in these attacks change frequently and may be difficult to detect for periods of time. In addition, although we have policies and procedures in place to ensure that all personal information collected by us or our third-party service providers is securely maintained, data breaches due to human error or intentional or unintentional conduct have occurred and likely will continue to occur. Although we have seen no material impact on our business operations from the cyber-security attacks and data breaches we have experienced to date, if we suffer a loss or disclosure of confidential business or stakeholder information as a result of a breach of our IT Systems, including those of third-party service providers with whom we have contracted, we may suffer reputational, competitive and/or business harm, incur significant costs and be subject to government investigations, litigation, fines and/or damages, which may adversely impact our business, results of operations, cash flows and financial condition.
11
Furthermore, while we have disaster recovery and business continuity plans in place, if our IT Systems are damaged, breached or cease to function properly for any reason, including the poor performance of, failure of or cyber-attack on third-party service providers, catastrophic events, power outages, cyber-security breaches, network outages, failed upgrades or other similar events and, if the disaster recovery and business continuity plans do not effectively resolve such issues on a timely basis, we may suffer interruptions in our ability to manage or conduct business as well as reputational harm, and may be subject to governmental investigations and litigation, any of which may adversely impact our business, results of operations, cash flows and financial condition.
Uncertain global economic conditions, disruptions in the credit markets or changes to our credit ratings may adversely affect our business.
Uncertain global economic conditions could adversely affect our business. Unfavorable global economic conditions, such as a recession, economic slowdown and/or continued reduced category growth rates, have impacted and could continue to negatively impact our business and could result in declining revenues, profitability and cash flows. Although we continue to devote significant resources to support our brands and market our products at multiple price points, during periods of economic uncertainty consumers may reduce consumption or switch to “private label” or economy brands, which could reduce sales volumes of our products or result in a shift in our product mix from higher margin to lower margin product offerings. Additionally, our retailers may be impacted and they may increase pressure on our selling prices or increase promotional activity for lower-priced or value offerings as they seek to maintain sales volumes and margins.
While we currently generate significant cash flows from ongoing operations and have access to global credit markets through our various financing activities, a disruption in the credit markets, interest rate increases or changes to our credit ratings could negatively impact the availability or cost of funding. Reduced access to credit or increased costs could adversely affect our liquidity and capital resources or significantly increase our cost of capital. In addition, if any financial institutions that hold our cash or other investments or that are parties to our undrawn revolving credit facilities supporting our commercial paper programs or other financing arrangements, such as interest rate, foreign exchange or commodity hedging instruments, were to declare bankruptcy or become insolvent, they may be unable to perform under their agreements with us. This could leave us with reduced borrowing capacity or unhedged against certain interest rate, foreign currency or commodity price exposures. In addition, tighter credit markets may lead to business disruptions for certain of our suppliers, contract manufacturers or trade customers which could, in turn, adversely impact our business, results of operations, cash flows and financial condition.
12
We have pursued and may continue to pursue acquisitions and divestitures, which could adversely impact our business.
We have pursued and may continue to pursue acquisitions of brands, businesses or technologies from third parties. Acquisitions and their pursuit involve numerous potential risks, including, among other things:
▪ | realizing the full extent of the expected benefits or synergies as a result of a transaction, within the anticipated time frame, or at all; |
▪ | successfully integrating the operations, technologies, services, products and systems of the acquired brands or businesses in an effective, timely and cost-efficient manner; |
▪ | receiving necessary consents, clearances and approvals in connection with a transaction; |
▪ | diverting management’s attention from other business priorities; |
▪ | successfully operating in new lines of business, channels of distribution or markets; |
▪ | retaining key employees, partners, suppliers and customers of the acquired business; |
▪ | conforming standards, controls, procedures and policies of the acquired business with our own; |
▪ | developing or launching products with acquired technologies; and |
▪ | other unanticipated problems or liabilities. |
Moreover, acquisitions could result in substantial additional debt, exposure to contingent liabilities, such as litigation or earn-out obligations, the potential impairment of goodwill or other intangible assets, or transaction costs. Any of these risks, should they materialize, could adversely impact our business, results of operations, cash flows and financial condition.
We also may periodically divest brands or businesses. These divestitures may adversely impact our business, results of operations, cash flows and financial condition if we are unable to offset the dilutive impacts from the loss of revenue associated with the divested brands or businesses, or otherwise achieve the anticipated benefits or cost savings from the divestitures. In addition, businesses under consideration for, or otherwise subject to, divestiture may be adversely impacted prior to the divestiture, which could negatively impact our business, results of operations, cash flows and financial condition.
13
Tax matters, including changes in tax rates, disagreements with taxing authorities and imposition of new taxes could negatively impact our business.
We are subject to taxes in the U.S. and in the foreign jurisdictions where we do business. Due to economic and political conditions, tax rates in the U.S. and various foreign jurisdictions have been and may be subject to significant change. Changes in the mix of our earnings from countries with differing statutory tax rates, changes in the valuation of deferred tax assets and liabilities, changes in tax laws, including how existing tax laws are interpreted or enforced, or contemplated changes in long-standing tax principles, if finalized and adopted, could adversely impact our future effective tax rate and business, results of operations, cash flows and financial condition. For example, longstanding international tax norms that determine each country’s jurisdiction to tax cross-border international trade are evolving as a result of the Base Erosion and Profit Shifting reporting requirements (“BEPS”) recommended by the G8, G20 and Organization for Economic Cooperation and Development. In connection with BEPS, companies are required to disclose more information to tax authorities on operations around the world, which may lead to greater audit scrutiny of profits earned in countries outside of the U.S. As this and other tax laws and related regulations change, our business, results of operations, cash flows and financial condition could be materially impacted. For more information regarding U.S. tax reform, see Note 11, Income Taxes to the Consolidated Financial Statements.
Furthermore, we are subject to regular reviews, examinations and audits by the Internal Revenue Service and other taxing authorities with respect to taxes inside and outside of the U.S. Although we believe our tax positions are reasonable, if a taxing authority disagrees with the positions we have taken, we could face additional tax liabilities, including interest and penalties, in excess of reserves. The payment of such additional amounts upon final adjudication of any disputes could adversely impact our business, results of operations, cash flows and financial condition.
Climate change may have an adverse impact on our business and results of operations.
It has been reported that carbon dioxide and other greenhouse gases in the atmosphere have an adverse impact on global temperatures, weather patterns and the frequency and severity of extreme weather and natural disasters. The predicted effects of climate change may also exacerbate challenges regarding the availability and quality of water. In addition, concern over climate change may result in new or additional legal and regulatory requirements to reduce or mitigate the effects of climate change on the environment. Despite our sustainability efforts, any failure to achieve our sustainability goals to reduce our impact on the environment or the perception (whether or not valid) that we have failed to act responsibly with respect to the environment or to effectively respond to new or additional legal or regulatory requirements regarding climate change could result in adverse publicity and adversely affect our business and reputation. There is also increased focus, including by governmental and non-governmental organizations, investors, customers, consumers and other stakeholders on these and other sustainability matters, including deforestation and the use of plastic, energy and water. Our reputation could be damaged if we do not (or are perceived not to) act responsibly with respect to sustainability matters, which could adversely affect our business, results of operations, cash flows and financial condition.
ITEM 1B. UNRESOLVED STAFF COMMENTS
None.
14
ITEM 2. PROPERTIES
The Company owns or leases approximately 320 properties, which include manufacturing, distribution, research and office facilities worldwide. Our corporate headquarters is located in leased property at 300 Park Avenue, New York, New York.
In the U.S., the Company operates in approximately 60 properties, of which 13 are owned. Major U.S. manufacturing and warehousing facilities used by the Oral, Personal and Home Care product segment of our business are located in Greenwood, South Carolina; Morristown, Tennessee; and Cambridge, Ohio. The Pet Nutrition segment has major manufacturing and warehousing facilities in Bowling Green, Kentucky; Emporia, Kansas; Richmond, Indiana; and Topeka, Kansas.
Overseas, the Company operates in approximately 260 properties, of which 60 are owned, in over 80 countries. Major overseas manufacturing and warehousing facilities used by the Oral, Personal and Home Care product segment of our business are located in Australia, Brazil, China, Colombia, France, Greece, Guatemala, India, Italy, Mexico, Poland, South Africa, Thailand, Turkey and Venezuela. The Pet Nutrition segment has major manufacturing and warehousing facilities in the Czech Republic and the Netherlands.
The primary research center for Oral and Personal Care products is located in Piscataway, New Jersey, the primary research center for Home Care products is located in Mexico and the primary research center for Pet Nutrition products is located in Topeka, Kansas. Our global data center is also located in Piscataway, New Jersey.
The Company has shared business service centers in India, Mexico and Poland, which are located in leased properties.
All of the facilities we operate are well maintained and adequate for the purpose for which they are intended.
15
ITEM 3. LEGAL PROCEEDINGS
As a global company serving consumers in more than 200 countries and territories, the Company is routinely subject to a wide variety of legal proceedings. These include disputes relating to intellectual property, contracts, product liability, marketing, advertising, foreign exchange controls, antitrust and trade regulation, as well as labor and employment, pension, data privacy and security, environmental and tax matters, and consumer class actions. Management proactively reviews and monitors the Company’s exposure to, and the impact of, environmental matters. The Company is party to various environmental matters and, as such, may be responsible for all or a portion of the cleanup, restoration and post-closure monitoring of several sites.
The Company establishes accruals for loss contingencies when it has determined that a loss is probable and that the amount of loss, or range of loss, can be reasonably estimated. Any such accruals are adjusted thereafter as appropriate to reflect changes in circumstances.
The Company also determines estimates of reasonably possible losses or ranges of reasonably possible losses in excess of related accrued liabilities, if any, when it has determined that a loss is reasonably possible and it is able to determine such estimates. For those matters disclosed below for which the amount of any potential losses can be reasonably estimated, the Company currently estimates that the aggregate range of reasonably possible losses in excess of any accrued liabilities is $0 to approximately $225 million (based on current exchange rates). The estimates included in this amount are based on the Company’s analysis of currently available information and, as new information is obtained, these estimates may change. Due to the inherent subjectivity of the assessments and the unpredictability of outcomes of legal proceedings, any amounts accrued or included in this aggregate amount may not represent the ultimate loss to the Company. Thus, the Company’s exposure and ultimate losses may be higher or lower, and possibly significantly so, than the amounts accrued or the range disclosed above.
Based on current knowledge, management does not believe that the ultimate resolution of loss contingencies arising from the matters discussed herein will have a material effect on the Company’s consolidated financial position or its ongoing results of operations or cash flows. However, in light of the inherent uncertainties noted above, an adverse outcome in one or more matters could be material to the Company’s results of operations or cash flows for any particular quarter or year.
Brazilian Matters
There are certain tax and civil proceedings outstanding, as described below, related to the Company’s 1995 acquisition of the Kolynos oral care business from Wyeth (the “Seller”).
The Brazilian internal revenue authority has disallowed interest deductions and foreign exchange losses taken by the Company’s Brazilian subsidiary for certain years in connection with the financing of the Kolynos acquisition. The tax assessments with interest, penalties and any court-mandated fees, at the current exchange rate, are approximately $152 million. This amount includes additional assessments received from the Brazilian internal revenue authority in April 2016 relating to net operating loss carryforwards used by the Company’s Brazilian subsidiary to offset taxable income that had also been deducted from the authority’s original assessments. The Company has been disputing the disallowances by appealing the assessments since October 2001. There is one case currently on appeal at the administrative level. In the event the Company is ultimately unsuccessful in this administrative appeal, further appeals are available within the Brazilian federal courts.
In September 2015, the Company lost one of its appeals at the administrative level and filed a lawsuit in Brazilian federal court. In February 2017, the Company lost an additional administrative appeal and filed a lawsuit in Brazilian federal court. In April 2019, the Company lost another administrative appeal and filed a lawsuit in Brazilian federal court. Although there can be no assurances, management believes, based on the opinion of its Brazilian legal counsel, that the disallowances are without merit and that the Company should ultimately prevail. The Company is challenging these disallowances vigorously.
16
In July 2002, the Brazilian Federal Public Attorney filed a civil action against the federal government of Brazil, Laboratorios Wyeth-Whitehall Ltda. (the Brazilian subsidiary of the Seller) and the Company, as represented by its Brazilian subsidiary, in the 6th. Lower Federal Court in the City of São Paulo, seeking to annul an April 2000 decision by the Brazilian Board of Tax Appeals that found in favor of the Seller’s Brazilian subsidiary on the issue of whether it had incurred taxable capital gains as a result of the divestiture of Kolynos. The action seeks to make the Company’s Brazilian subsidiary jointly and severally liable for any tax due from the Seller’s Brazilian subsidiary. The case has been pending since 2002, and the Lower Federal Court has not issued a decision. Although there can be no assurances, management believes, based on the opinion of its Brazilian legal counsel, that the Company should ultimately prevail in this action. The Company is challenging this action vigorously.
In December 2005, the Brazilian internal revenue authority issued to the Company’s Brazilian subsidiary a tax assessment with interest, penalties and any court-mandated fees of approximately $63 million, at the current exchange rate, based on a claim that certain purchases of U.S. Treasury bills by the subsidiary and their subsequent disposition during the period 2000 to 2001 were subject to a tax on foreign exchange transactions. The Company had been disputing the assessment within the internal revenue authority’s administrative appeals process. However, in November 2015, the Superior Chamber of Administrative Tax Appeals denied the Company’s final administrative appeal and the Company has filed a lawsuit in the Brazilian federal court. In the event the Company is unsuccessful in this lawsuit, further appeals are available within the Brazilian federal courts. Although there can be no assurances, management believes, based on the opinion of its Brazilian legal counsel, that the tax assessment is without merit and that the Company should ultimately prevail. The Company is challenging this assessment vigorously.
Competition Matters
Certain of the Company’s subsidiaries have historically been subject to investigations, and, in some cases, fines, by governmental authorities in a number of countries related to alleged competition law violations. Substantially all of these matters also involved other consumer goods companies and/or retail customers. The Company’s policy is to comply with antitrust and competition laws and, if a violation of any such laws is found, to take appropriate remedial action and to cooperate fully with any related governmental inquiry. The status as of December 31, 2019 of competition law matters pending against the Company during the year ended December 31, 2019 is set forth below.
▪ | In December 2014, the French competition law authority found that 13 consumer goods companies, including the Company’s French subsidiary, exchanged competitively sensitive information related to the French home care and personal care sectors, for which the Company’s French subsidiary was fined $57 million. In addition, as a result of the Company’s acquisition of the Sanex personal care business in 2011 from Unilever N.V. and Unilever PLC (together with Unilever N.V., “Unilever”) pursuant to a Business and Share Sale and Purchase Agreement (the “Sale and Purchase Agreement”), the French competition law authority found that the Company’s French subsidiary, along with Hillshire Brands Company (formerly Sara Lee Corporation (“Sara Lee”)), were jointly and severally liable for fines of $25 million assessed against Sara Lee’s French subsidiary. The Company is indemnified for these fines by Unilever pursuant to the Sale and Purchase Agreement. The fines were confirmed by the Court of Appeal in October 2016. The Company appealed the decision of the Court of Appeal on behalf of the Company and Sara Lee in the French Supreme Court. In March 2019, the French Supreme Court denied the Company’s appeal. |
▪ | In July 2014, the Greek competition law authority issued a statement of objections alleging a restriction of parallel imports into Greece. The Company responded to this statement of objections. In July 2017, the Company received the decision from the Greek competition law authority in which the Company was fined $11 million. The Company appealed the decision to the Greek courts. In April 2019, the Greek courts affirmed the judgment against the Company’s Greek subsidiary, but reduced the fine to $10.5 and dismissed the case against Colgate-Palmolive Company. The Company’s Greek subsidiary has appealed the decision to the Greek Supreme Court. |
17
Talcum Powder Matters
The Company has been named as a defendant in civil actions alleging that certain talcum powder products that were sold prior to 1996 were contaminated with asbestos. Most of these actions involve a number of co-defendants from a variety of different industries, including suppliers of asbestos and manufacturers of products that, unlike the Company’s products, were designed to contain asbestos. As of December 31, 2019, there were 121 individual cases pending against the Company in state and federal courts throughout the United States, as compared to 239 cases as of December 31, 2018. During the year ended December 31, 2019, 110 new cases were filed and 228 cases were resolved by voluntary dismissal, dismissal by the court, judgment in the Company’s favor or settlement. During the year ended December 31, 2019, one case resulted in a jury verdict in favor of the Company after a trial, which is now pending appeal by the plaintiff, and one case resulted in an adverse jury verdict after a trial, which the Company is appealing. The value of the settlements and of the adverse jury verdict in the year presented was not material, either individually or in the aggregate, to such period’s results of operations.
The Company believes that a significant portion of its costs incurred in defending and resolving these claims will be covered by insurance policies issued by several primary, excess and umbrella insurance carriers, subject to deductibles, exclusions, retentions and policy limits.
While the Company and its legal counsel believe that these cases are without merit and intend to challenge them vigorously, there can be no assurances regarding the ultimate resolution of these matters. With the exception of the case where the Company received an adverse jury verdict, the range of reasonably possible losses in excess of accrued liabilities disclosed above does not include any amount relating to these cases because the amount of any possible losses from such cases currently cannot be reasonably estimated.
ERISA Matter
In June 2016, a putative class action claiming that residual annuity payments made to certain participants in the Colgate-Palmolive Company Employees’ Retirement Income Plan (the “Plan”) did not comply with the Employee Retirement Income Security Act was filed against the Plan, the Company and certain individuals in the United States District Court for the Southern District of New York. This action has been certified as a class action. The relief sought includes recalculation of benefits, pre- and post-judgment interest and attorneys’ fees. The Company is contesting this action vigorously. Since the amount of any potential loss from this case currently cannot be reasonably estimated, the range of reasonably possible losses in excess of accrued liabilities disclosed above does not include any amount relating to the case.
ITEM 4. MINE SAFETY DISCLOSURES
Not Applicable.
18
PART II
ITEM 5. | MARKET FOR REGISTRANT’S COMMON EQUITY, RELATED STOCKHOLDER MATTERS AND ISSUER PURCHASES OF EQUITY SECURITIES |
For information regarding the market for the Company’s common stock, including stock price performance graphs, refer to “Market Information” included in Part IV, Item 15 of this report. For information regarding the number of common shareholders of record, refer to “Historical Financial Summary” included in Part IV, Item 15 of this report. For information regarding the securities authorized for issuance under our equity compensation plans, refer to “Security Ownership of Certain Beneficial Owners and Management and Related Stockholder Matters” included in Part III, Item 12 of this report.
Issuer Purchases of Equity Securities
On June 18, 2018, the Board authorized the repurchase of shares of the Company’s common stock having an aggregate purchase price of up to $5 billion under a new share repurchase program (the “2018 Program”), which replaced a previously authorized share repurchase program (the "2015 Program"). The Board also has authorized share repurchases on an ongoing basis to fulfill certain requirements of the Company’s compensation and benefit programs. The shares are repurchased from time to time in open market or privately negotiated transactions at the Company’s discretion, subject to market conditions, customary blackout periods and other factors.
The following table shows the stock repurchase activity for the three months in the quarter ended December 31, 2019:
Month | Total Number of Shares Purchased(1) | Average Price Paid per Share | Total Number of Shares Purchased as Part of Publicly Announced Plans or Programs(2) | Approximate Dollar Value of Shares That May Yet Be Purchased Under the Plans or Programs(3) (in millions) | |||||||||
October 1 through 31, 2019 | 1,174,592 | $ | 69.14 | 1,134,000 | 3,366 | ||||||||
November 1 through 30, 2019 | 609,802 | $ | 66.60 | 608,630 | 3,325 | ||||||||
December 1 through 31, 2019 | 672,010 | $ | 67.92 | 642,039 | 3,282 | ||||||||
Total | 2,456,404 | $ | 68.18 | 2,384,669 | |||||||||
_______
(1) | Includes share repurchases under the 2018 Program and those associated with certain employee elections under the Company’s compensation and benefit programs. |
(2) | The difference between the total number of shares purchased and the total number of shares purchased as part of publicly announced plans or programs is 71,735 shares, which represents shares deemed surrendered to the Company to satisfy certain employee elections under the Company’s compensation and benefit programs. |
(3) | Includes approximate dollar value of shares that were available to be purchased under the publicly announced plans or programs that were in effect as of December 31, 2019. |
ITEM 6. SELECTED FINANCIAL DATA
Refer to the information set forth under the caption “Historical Financial Summary” included in Part IV, Item 15 of this report.
19
(Dollars in Millions Except Per Share Amounts)
ITEM 7. | MANAGEMENT’S DISCUSSION AND ANALYSIS OF FINANCIAL CONDITION AND RESULTS OF OPERATIONS |
Executive Overview
Colgate-Palmolive Company (together with its subsidiaries, “we,” the “Company” or “Colgate”) seeks to deliver strong, consistent business results and superior shareholder returns by providing consumers globally with products that make their lives healthier and more enjoyable.
To this end, we are tightly focused on two product segments: Oral, Personal and Home Care; and Pet Nutrition. Within these segments, we follow a closely defined business strategy to grow our key product categories and increase our overall market share. Within the categories in which we compete, we prioritize our efforts based on their capacity to maximize the use of the organization’s core competencies and strong global equities and to deliver sustainable long-term growth.
Operationally, we are organized along geographic lines with management teams having responsibility for the business and financial results in each region. We compete in more than 200 countries and territories worldwide with established businesses in all regions contributing to our sales and profitability. Approximately 70% of our Net sales are generated from markets outside the U.S., with approximately 50% of our Net sales coming from emerging markets (which consist of Latin America, Asia (excluding Japan), Africa/Eurasia and Central Europe). This geographic diversity and balance help to reduce our exposure to business and other risks in any one country or part of the world.
The Oral, Personal and Home Care product segment is managed geographically in five reportable operating segments: North America, Latin America, Europe, Asia Pacific and Africa/Eurasia, all of which sell primarily to a variety of traditional and eCommerce retailers, wholesalers and distributors. Through Hill’s Pet Nutrition, we also compete on a worldwide basis in the pet nutrition market, selling products principally through authorized pet supply retailers, veterinarians and eCommerce retailers.
On an ongoing basis, management focuses on a variety of key indicators to monitor business health and performance. These indicators include net sales (including volume, pricing and foreign exchange components), organic sales growth (net sales growth excluding, the impact of foreign exchange, acquisitions, and divestments), a non-GAAP financial measure, and gross profit margin, operating profit, net income and earnings per share, in each case, on a GAAP and non-GAAP basis, as well as measures used to optimize the management of working capital, capital expenditures, cash flow and return on capital. In addition, we review market share data to assess how our brands are performing within their categories on a global and regional basis. The monitoring of these indicators and our Code of Conduct and corporate governance practices help to maintain business health and strong internal controls. For additional information regarding non-GAAP financial measures and the Company's use of market share data and the limitations of such data, see “Non-GAAP Financial Measures” and "Market Share Information" below.
To achieve our business and financial objectives, we are focused on innovating our core businesses; improving our brand building activities with an elevated brand purpose model and the use of equity advertising; innovating to gain market share in high growth segments and adjacencies; expanding into new channels and markets; maximizing growth online; and investing to drive consumption in growing populations. We continue to develop initiatives to build strong relationships with consumers, dental, veterinary and skin health professionals and traditional and eCommerce retailers. In addition, we continue to invest behind our brands, not just in terms of advertising, but also to build key growth capabilities in areas such as innovation and data and analytics. We also continue to broaden our eCommerce offerings, including direct-to-consumer and subscription services. We continue to believe that growth opportunities are greater in those areas of the world in which economic development and rising consumer incomes expand the size and number of markets for the Company’s products. We are also working to integrate our sustainability strategy across our organization.
We are also changing the way we work to drive growth and how we approach innovation to respond to the dynamic retail landscape and the evolving preferences of our customers and consumers. The retail landscape, the ease of new entrants into the market in many of our categories and the evolving preferences of our customers and consumers demand that we work differently and faster in an agile, authentic and culturally relevant manner to drive innovation.
20
(Dollars in Millions Except Per Share Amounts)
The investments needed to support growth are developed through continuous, Company-wide initiatives to lower costs and increase effective asset utilization. Through these initiatives, which are referred to as our funding-the-growth initiatives, we seek to become even more effective and efficient throughout our businesses. These initiatives are designed to reduce costs associated with direct materials, indirect expenses, distribution and logistics, and advertising and promotional materials, among other things, and encompass a wide range of projects, examples of which include raw material substitution, reduction of packaging materials, consolidating suppliers to leverage volumes and increasing manufacturing efficiency through SKU reductions and formulation simplification. We also continue to prioritize our investments in high growth segments within our Oral Care, Personal Care and Pet Nutrition businesses, including by expanding our portfolio in premium skin health.
21
(Dollars in Millions Except Per Share Amounts)
Significant Items Impacting Comparability
On September 19, 2019, the Company acquired Laboratoires Filorga Cosmétiques S.A. (“Filorga”), a skin health business, for cash consideration of €1,548 (approximately $1,712). Filorga is a premium anti-aging skin health brand focused primarily on facial care. The acquisition was financed with a combination of debt and cash. This acquisition is part of our strategy to focus on high growth segments within our Oral Care, Personal Care and Pet Nutrition businesses, including by expanding our portfolio in premium skin health. See Note 3, Acquisitions to the Consolidated Financial Statements for additional information.
In December 2019, the Swiss government enacted changes to its corporate tax regime, which included, among other items, the repeal of certain preferential tax regimes and an increase to the cantonal tax rate for future periods. Additionally, the government provided transition rules which allowed companies to record goodwill for tax purposes, partially offsetting the impact on cash taxes of the higher cantonal rate over the next ten years. As a result of these changes, the Company recorded an estimated net benefit of $29 to the Provision for income taxes.
In 2019, the Company received a favorable judgment regarding certain value-added tax previously paid in Brazil. As a result of the favorable judgment, during the fourth quarter of 2019, the Company filed an application with the Brazilian government to recover value-added tax previously paid and recorded a benefit of $30 pretax ($20 aftertax). The recovery will be utilized to offset corporate income tax payments in Brazil in future periods.
In January 2018, the Company acquired all of the outstanding equity interests of Physicians Care Alliance, LLC and Elta MD Holdings, Inc., professional skin health businesses, for aggregate cash consideration of approximately $730. See Note 3, Acquisitions to the Consolidated Financial Statements for additional information.
As a result of the enactment of the Tax Cuts and Jobs Act (the “TCJA” or “U.S. tax reform”), in the fourth quarter of 2017, the Company recorded a provisional charge of $275 based on its initial analysis of the TCJA using information and estimates available as of February 15, 2018, the date on which the Company filed its Annual Report on Form 10-K for the year ended December 31, 2017. During 2018, the Company finalized its assessment of the impact of the TCJA and recognized an additional tax expense of $80 reflecting the impact of transition tax guidance issued by the U.S. Treasury and the update of certain estimates and calculations based on information available through the end of 2018.
Our restructuring program, known as the “Global Growth and Efficiency Program,” concluded on December 31, 2019. The program’s initiatives were designed to help us ensure sustained solid worldwide growth in unit volume, organic sales, operating profit and earnings per share and to enhance our global leadership positions in our core businesses. Substantially all initiatives under the program were implemented as of December 31, 2019.
The initiatives under the Global Growth and Efficiency Program focused on the following areas:
▪ | Expanding Commercial Hubs |
▪ | Extending Shared Business Services and Streamlining Global Functions |
▪ | Optimizing Global Supply Chain and Facilities |
Savings, substantially all of which have been realized, are projected to be in the range of $640 to $660 pretax ($580 to $590 aftertax) annually. Substantially all of the savings are expected to increase future cash flows. Total pretax charges resulting from the Global Growth and Efficiency Program were $1,854 pretax ($1,380 aftertax), in line with the previously disclosed range.
In 2019 and 2018, we incurred aftertax costs of $102 and $125, respectively, resulting from the Global Growth and Efficiency Program. For more information regarding the Global Growth and Efficiency Program, see “Restructuring and Related Implementation Charges” below and Note 4, Restructuring and Related Implementation Charges to the Consolidated Financial Statements.
22
(Dollars in Millions Except Per Share Amounts)
Effective January 1, 2019, as required by the Financial Accounting Standards Board ("FASB"), the Company adopted ASU No. 2016-02, "Leases (Topic 842)," which superseded Topic 840, "Leases," which was further modified in ASU No. 2018-10, "Codification Improvements to Topic 842, Leases," ASU No. 2018-11, "Leases (Topic 842) Targeted Improvements" and ASU No. 2019-01 "Leases (Topic 842) Codification Improvements" to clarify the implementation guidance. The new accounting standard required the recognition on the balance sheet of right-of-use assets and leases liabilities for all long-term leases, including operating leases. The Company elected the optional transition method and adopted the new guidance on January 1, 2019, on a modified retrospective basis, with no restatement of prior period amounts. As allowed under the new accounting standard, the Company elected to apply practical expedients to carry forward the original lease determinations, leases classifications and accounting of initial direct costs for all asset classes at the time of adoption. The Company also elected not to separate lease components from non-lease components and to exclude short-term leases from its Consolidated Balance Sheet. The Company's adoption of the new standard resulted in the recognition of right-of-use assets of $458 and liabilities of $574, with no material cumulative effect adjustment to equity as of the date of adoption. In connection with the adoption of this guidance, as required, the Company reclassified certain restructuring reserves incurred in connection with the Global Growth and Efficiency Program (see Note 4, Restructuring and Related Implementation Charges to the Consolidated Financial Statements for additional information) and deferred rent liabilities as reductions to lease assets. Adoption of the new standard did not have a material impact on the Company's Consolidated Statements of Income or Cash Flows. See Note 15, Leases to the Consolidated Financial Statements for additional information.
23
(Dollars in Millions Except Per Share Amounts)
Outlook
Looking forward, we expect global macroeconomic, political and market conditions to remain challenging. Although we have seen improvement in category growth rates, we expect category growth rates to remain below historical levels. While the global marketplace in which we operate has always been highly competitive, we continue to experience heightened competitive activity in certain markets from strong local competitors, from other large multinational companies, some of which have greater resources than we do, and from new entrants into the market in many of our categories. Such activities have included more aggressive product claims and marketing challenges, as well as increased promotional spending and geographic expansion. We have also been negatively affected by changes in the policies or practices of our retail trade customers in key markets, such as inventory de-stocking, limitations on access to shelf space or delisting of our products. In addition, the retail landscape in many of our markets continues to be impacted by the rapid growth of eCommerce retailers, changing consumer preferences (as consumers increasingly shop online) and the emergence of alternative retail channels, such as subscription services and direct-to-consumer businesses. This rapid growth in eCommerce and the emergence of alternative retail channels have created and may continue to create pricing pressures and/or adversely affect our relationships with our key retailers. In addition, given that approximately 70% of our Net sales originate in markets outside the U.S., we have experienced and will likely continue to experience volatile foreign currency fluctuations and higher raw and packaging material costs. While we have taken, and will continue to take, measures to mitigate the effect of these conditions, should they persist, they could adversely affect our future results. In addition, although we are taking steps to mitigate the impact of the novel coronavirus on our business, we expect it will negatively impact our business and results of operations in the near term. Because this situation is continuing to develop, the full extent of the impact is not yet known and will depend on, among other things, the duration of quarantines and other travel restrictions, both within China and into and out of China, and the degree to which the virus spreads beyond currently affected geographies. For more information about factors that could impact our business see Part I, Item 1A "Risk Factors."
In summary, we believe we are well prepared to meet the challenges ahead due to our strong financial condition, experience operating in challenging environments and continued focus on our key priorities: growing sales through engaging with consumers, developing world-class innovation and working with retail partners; driving efficiency on every line of the income statement to increase margins; generating strong cash flow performance and utilizing that cash effectively to enhance total shareholder return; and leading to win by staying true to the Company’s culture and focusing on its stakeholders. Our commitment to these priorities, together with the strength of our global brands, our broad international presence in both developed and emerging markets and cost-saving initiatives, such as our funding-the-growth initiatives, should position us well to increase shareholder value over the long term.
24
(Dollars in Millions Except Per Share Amounts)
Results of Operations
This section of this Annual Report on Form 10-K generally discusses 2019 and 2018 items and year-to-year comparisons between 2019 and 2018. Discussions of 2017 items and year-to-year comparisons between 2018 and 2017 that are not included in this Annual Report on Form 10-K can be found in "Management’s Discussion and Analysis of Financial Condition and Results of Operations" in Part II, Item 7 of the Company’s Annual Report on Form 10-K for the fiscal year ended December 31, 2018.
Net Sales
Worldwide Net sales were $15,693 in 2019, up 1.0% from 2018, as volume growth of 2.5% and net selling price increases of 2.0% were partially offset by negative foreign exchange of 3.5%. The Company’s acquisition of Filorga increased volume by 0.5%. Organic sales (Net sales excluding, as applicable, the impact of foreign exchange, acquisitions and divestments), a non-GAAP financial measure as discussed below, increased 4.0% in 2019.
Net sales in the Oral, Personal and Home Care product segment were $13,168 in 2019, even with 2018, as volume growth of 2.5% and net selling price increases of 1.5% were offset by negative foreign exchange of 4.0%. The Company’s acquisition of Filorga increased volume by 0.5%. Organic sales in the Oral, Personal and Home Care product segment increased 3.5% in 2019.
The increase in organic sales in 2019 versus 2018 was due to increases in Oral Care, Personal Care and Home Care organic sales. The increase in Oral Care was primarily due to organic sales growth in the toothpaste category. The increase in Personal Care was primarily due to organic sales growth in the skin health, body wash, bar soap, shampoo and underarm protection categories, partially offset by a decline in organic sales in the liquid hand soap category. The increase in Home Care was due to organic sales growth in the liquid cleaner and fabric softener categories.
The Company’s share of the global toothpaste market was 41.1% for full year 2019, down 0.7 share points from full year 2018, and its share of the global manual toothbrush market was 31.6% for full year 2019, down 0.5 share points from full year 2018. Full year 2019 market shares in toothpaste were flat in Europe and down in all other operating units versus full year 2018. In the manual toothbrush category, full year 2019 market shares were down in all operating units versus full year 2018. For additional information regarding the Company’s use of market share data and limitations of such data, see “Market Share Information” below.
Net sales for Hill’s Pet Nutrition were $2,525 in 2019, an increase of 6.0% from 2018, driven by volume growth of 3.5% and net selling price increases of 4.0%, partially offset by negative foreign exchange of 1.5%. Organic sales for Hill’s Pet Nutrition increased 7.5% in 2019.
The increase in organic sales in 2019 versus 2018 was primarily due to increases in organic sales in the Science Diet and Prescription Diet categories.
25
(Dollars in Millions Except Per Share Amounts)
Gross Profit/Margin
Worldwide Gross profit increased 1% to $9,325 in 2019 from $9,231 in 2018. Gross profit in both periods included charges resulting from the Global Growth and Efficiency Program. Excluding these charges in both periods and acquisition-related costs in 2019, Gross profit increased to $9,336 in 2019 from $9,262 in 2018, reflecting an increase of $90 resulting from higher Net sales, partially offset by a decrease of $16 resulting from lower Gross profit margin.
Worldwide Gross profit margin was 59.4% in 2019, even with 2018. Excluding charges resulting from the Global Growth and Efficiency Program in both periods and acquisition-related costs in 2019, Gross profit margin decreased by 10 basis points (bps) to 59.5% in 2019, from 59.6% in 2018. This decrease in Gross profit margin was primarily due to higher raw and packaging material costs (300 bps), which included foreign exchange transaction costs, largely offset by cost savings from the Company’s funding-the-growth initiatives (220 bps) and higher pricing (70 bps).
2019 | 2018 | |||||||
Gross profit, GAAP | $ | 9,325 | $ | 9,231 | ||||
Global Growth and Efficiency Program | 8 | 31 | ||||||
Acquisition-related costs | 3 | — | ||||||
Gross profit, non-GAAP | $ | 9,336 | $ | 9,262 | ||||
2019 | 2018 | Basis Point Change | |||||||
Gross profit margin, GAAP | 59.4 | % | 59.4 | % | — | ||||
Global Growth and Efficiency Program | 0.1 | 0.2 | |||||||
Acquisition-related costs | — | — | |||||||
Gross profit margin, non-GAAP | 59.5 | % | 59.6 | % | (10 | ) | |||
26
(Dollars in Millions Except Per Share Amounts)
Selling, General and Administrative Expenses
Selling, general and administrative expenses increased to $5,575 in 2019 from $5,389 in 2018. Selling, general and administrative expenses in both periods included charges resulting from the Global Growth and Efficiency Program. Excluding these charges in both periods, Selling, general and administrative expenses increased to $5,515 in 2019 from $5,356 in 2018, reflecting increased advertising investment of $104 and higher overhead expenses of $55.
Selling, general and administrative expenses as a percentage of Net sales increased to 35.5% in 2019 from 34.7% in 2018. Excluding charges resulting from the Global Growth and Efficiency Program in both periods, Selling, general and administrative expenses as a percentage of Net sales were 35.1% in 2019, an increase of 60 bps as compared to 2018. This increase in 2019 was due to increased advertising investment (60 bps) as a percentage of Net sales. In 2019, advertising investment increased as a percentage of Net sales to 10.8% from 10.2% in 2018 or 6.5% in absolute terms to $1,694 as compared with $1,590 in 2018.
2019 | 2018 | |||||||
Selling, general and administrative expenses, GAAP | $ | 5,575 | $ | 5,389 | ||||
Global Growth and Efficiency Program | (60 | ) | (33 | ) | ||||
Selling, general and administrative expenses, non-GAAP | $ | 5,515 | $ | 5,356 | ||||
2019 | 2018 | Basis Point Change | ||||||
Selling, general and administrative expenses as a percentage of Net sales, GAAP | 35.5 | % | 34.7 | % | 80 | |||
Global Growth and Efficiency Program | (0.4 | ) | (0.2 | ) | ||||
Selling, general and administrative expenses as a percentage of Net sales, non-GAAP | 35.1 | % | 34.5 | % | 60 | |||
27
(Dollars in Millions Except Per Share Amounts)
Other (Income) Expense, Net
Other (income) expense, net was $196 and $148 in 2019 and 2018, respectively. Other (income) expense, net in both periods included charges related to the Global Growth and Efficiency Program. Other (income) expense, net in 2019 also included acquisition-related costs and the benefit related to a value-added tax matter in Brazil.
2019 | 2018 | |||||||
Other (income) expense, net, GAAP | $ | 196 | $ | 148 | ||||
Global Growth and Efficiency Program | (57 | ) | (88 | ) | ||||
Acquisition-related costs | (21 | ) | — | |||||
Value-added tax matter in Brazil | 30 | — | ||||||
Other (income) expense, net, non-GAAP | $ | 148 | $ | 60 | ||||
Excluding the items described above in both periods, as applicable, Other (income) expense, net was $148 in 2019 and $60 in 2018, comprised of the following:
2019 | 2018 | |||||||
Amortization of intangible assets | 62 | 59 | ||||||
Equity income | (9 | ) | (10 | ) | ||||
Write-off of certain investments and fixed assets | 51 | 1 | ||||||
Charges for a change in go-to-market strategy in certain countries | 15 | — | ||||||
Other, net | 29 | 10 | ||||||
Total Other (income) expense, net | $ | 148 | $ | 60 | ||||
28
(Dollars in Millions Except Per Share Amounts)
Operating Profit
Operating profit decreased 4% to $3,554 in 2019 from $3,694 in 2018.
In 2019 and 2018, Operating profit included charges resulting from the Global Growth and Efficiency Program. In 2019, Operating profit also included acquisition-related costs and a benefit related to a value-added tax matter in Brazil. Excluding these items in both periods, as applicable, Operating profit in 2019 decreased 4% compared to 2018, due to a decrease in Gross profit and increases in both Selling, general and administrative expenses and Other (income) expense.
Operating profit margin was 22.6% in 2019, a decrease of 120 bps compared with 23.8% in 2018. Excluding charges resulting from the Global Growth and Efficiency Program in both periods and acquisition-related costs and a benefit related to a value-added tax matter in Brazil in 2019, Operating profit margin decreased 130 bps to 23.4% in 2019 compared to 24.7% in 2018. This decrease in Operating profit in 2019 was due to a decrease in Gross profit (10 bps) and increases in Selling, general and administrative expenses (60 bps) and Other (income) expense, net (60 bps), all as a percentage of Net sales.
2019 | 2018 | % Change | |||||||||
Operating profit, GAAP | $ | 3,554 | $ | 3,694 | (4 | )% | |||||
Global Growth and Efficiency Program | 125 | 152 | |||||||||
Acquisition-related costs | 24 | — | |||||||||
Value-added tax matter in Brazil | (30 | ) | — | ||||||||
Operating profit, non-GAAP | $ | 3,673 | $ | 3,846 | (4 | )% | |||||
2019 | 2018 | Basis Point Change | |||||||
Operating profit margin, GAAP | 22.6 | % | 23.8 | % | (120 | ) | |||
Global Growth and Efficiency Program | 0.8 | 0.9 | |||||||
Acquisition-related costs | 0.2 | — | |||||||
Value-added tax matter in Brazil | (0.2 | ) | — | ||||||
Operating profit margin, non-GAAP | 23.4 | % | 24.7 | % | (130 | ) | |||
Non-Service Related Postretirement Costs
Non-service related postretirement costs were $108 in 2019 compared to $87 in 2018. Non-service related postretirement costs in both periods included charges resulting from the Global Growth and Efficiency Program. Excluding these charges in both periods, Non-service related postretirement costs were $101 in 2019 compared to $78 in 2018. The increase in Non-service related postretirement costs in 2019 as compared to 2018 was primarily due to a lower expected return on plan assets and increased interest costs.
2019 | 2018 | |||||||
Non-service related postretirement costs, GAAP | $ | 108 | $ | 87 | ||||
Global Growth and Efficiency Program | (7 | ) | (9 | ) | ||||
Non-service related postretirement costs, non-GAAP | $ | 101 | $ | 78 | ||||
Interest (Income) Expense, Net
Interest (income) expense, net was $145 in 2019 compared with $143 in 2018. The increase in Interest (income) expense, net in 2019 as compared to 2018 was primarily due to lower interest income on investments held outside the United States.
29
(Dollars in Millions Except Per Share Amounts)
Income Taxes
The effective income tax rate was 23.4% in 2019 and 26.2% in 2018. As reflected in the table below, the non-GAAP effective income tax rate was 24.1% in 2019 and 24.2% in 2018.
2019 | |||||||||||
Income Before Income Taxes | Provision For Income Taxes(1) | Effective Income Tax Rate(2) | |||||||||
As Reported GAAP | $ | 3,301 | $ | 774 | 23.4 | % | |||||
Global Growth and Efficiency Program | 132 | 30 | — | ||||||||
Acquisition-related costs | 24 | 4 | — | ||||||||
Value-added tax matter in Brazil | (30 | ) | (10 | ) | (0.1 | ) | |||||
Swiss income tax reform | — | 29 | 0.8 | ||||||||
Non-GAAP | $ | 3,427 | $ | 827 | 24.1 | % | |||||
2018 | |||||||||||
Income Before Income Taxes | Provision For Income Taxes(1) | Effective Income Tax Rate(2) | |||||||||
As Reported GAAP | $ | 3,464 | $ | 906 | 26.2 | % | |||||
Global Growth and Efficiency Program | 161 | 37 | (0.1 | ) | |||||||
Benefit from a foreign tax matter | — | 15 | 0.4 | ||||||||
U.S. tax reform | — | (80 | ) | (2.3 | ) | ||||||
Non-GAAP | $ | 3,625 | $ | 878 | 24.2 | % | |||||
_______
(1) | The income tax effect on non-GAAP items is calculated based upon the tax laws and statutory income tax rates applicable in the tax jurisdiction(s) of the underlying non-GAAP adjustment. |
(2) | The impact of non-GAAP items on the Company’s effective tax rate represents the difference in the effective tax rate calculated with and without the non-GAAP adjustment on Income before income taxes and Provision for income taxes. |
As a result of the enactment of the TCJA in the fourth quarter of 2017, the Company recorded a provisional charge of $275, based on its initial analysis of the TCJA using information and estimates available as of February 15, 2018, the date on which the Company filed its Annual Report on Form 10-K for the year ended December 31, 2017. During 2018, the Company finalized its assessment of the impact of the TCJA and recognized an additional tax expense of $80 reflecting the impact of transition tax guidance issued by the U.S. Treasury and the update of certain estimates and calculations based on information available through the end of 2018.
The effective income tax rate in all years benefited from tax planning associated with the Company’s global business initiatives.
30
(Dollars in Millions Except Per Share Amounts)
Net income attributable to Colgate-Palmolive Company and Earnings per share
Net income attributable to Colgate-Palmolive Company was $2,367, or $2.75 per share on a diluted basis, in 2019 compared to $2,400, or $2.75 per share on a diluted basis, in 2018. In 2019 and 2018, Net income attributable to Colgate-Palmolive Company included aftertax charges related to the Global Growth and Efficiency Program. In 2019, Net income attributable to Colgate-Palmolive Company also included aftertax acquisition-related costs, an aftertax benefit related to a value-added tax matter in Brazil and a tax benefit related to Swiss income tax reform. In 2018, Net income attributable to Colgate-Palmolive Company also included a benefit from a foreign tax matter and a charge related to U.S. tax reform. See "Income Taxes" above for additional information.
Excluding the items described above in both periods, as applicable, Net income attributable to Colgate-Palmolive Company decreased 6% to $2,440 in 2019 and Diluted earnings per share decreased 5% to $2.83, as compared to 2018.
2019 | |||||||||||||||||||||||
Income Before Income Taxes | Provision For Income Taxes(1) | Net Income Including Noncontrolling Interests | Less: Income Attributable To Noncontrolling Interests | Net Income Attributable to Colgate-Palmolive Company | Diluted Earnings Per Share(2) | ||||||||||||||||||
As Reported GAAP | $ | 3,301 | $ | 774 | $ | 2,527 | $ | 160 | $ | 2,367 | $ | 2.75 | |||||||||||
Global Growth and Efficiency Program | 132 | 30 | 102 | — | 102 | 0.12 | |||||||||||||||||
Acquisition-related costs | 24 | 4 | 20 | — | 20 | 0.02 | |||||||||||||||||
Value-added tax matter in Brazil | (30 | ) | (10 | ) | (20 | ) | — | (20 | ) | (0.02 | ) | ||||||||||||
Swiss income tax reform | — | 29 | (29 | ) | — | (29 | ) | (0.04 | ) | ||||||||||||||
Non-GAAP | $ | 3,427 | $ | 827 | $ | 2,600 | $ | 160 | $ | 2,440 | $ | 2.83 | |||||||||||
2018 | |||||||||||||||||||||||
Income Before Income Taxes | Provision For Income Taxes(1) | Net Income Including Noncontrolling Interests | Less: Income Attributable To Noncontrolling Interests | Net Income Attributable to Colgate-Palmolive Company | Diluted Earnings Per Share(2) | ||||||||||||||||||
As Reported GAAP | $ | 3,464 | $ | 906 | $ | 2,558 | $ | 158 | $ | 2,400 | $ | 2.75 | |||||||||||
Global Growth and Efficiency Program | 161 | 37 | 124 | (1 | ) | 125 | 0.15 | ||||||||||||||||
Benefit from a foreign tax matter | — | 15 | (15 | ) | — | (15 | ) | (0.02 | ) | ||||||||||||||
U.S. tax reform | — | (80 | ) | 80 | — | 80 | 0.09 | ||||||||||||||||
Non-GAAP | $ | 3,625 | $ | 878 | $ | 2,747 | $ | 157 | $ | 2,590 | $ | 2.97 | |||||||||||
_______
(1) | The income tax effect on non-GAAP items is calculated based upon the tax laws and statutory income tax rates applicable in the tax jurisdiction(s) of the underlying non-GAAP adjustment. |
(2) | The impact of non-GAAP adjustments on diluted earnings per share may not necessarily equal the difference between “GAAP” and “non-GAAP” as a result of rounding. |
31
(Dollars in Millions Except Per Share Amounts)
Segment Results
The Company markets its products in over 200 countries and territories throughout the world in two product segments: Oral, Personal and Home Care; and Pet Nutrition. The Company evaluates segment performance based on several factors, including Operating profit. The Company uses Operating profit as a measure of the operating segment performance because it excludes the impact of corporate-driven decisions related to interest expense and income taxes.
Oral, Personal and Home Care
North America
2019 | 2018 | % Change | |||||||||
Net sales | $ | 3,424 | $ | 3,348 | 2.0 | % | |||||
Operating profit | $ | 982 | $ | 1,037 | (5 | ) | % | ||||
% of Net sales | 28.7 | % | 31.0 | % | (230 | ) | bps | ||||
Net sales in North America increased 2.0% in 2019 to $3,424, as volume growth of 2.0% and net selling price increases of 0.5% were partially offset by negative foreign exchange of 0.5%. Organic sales in North America increased 2.5% in 2019.
The increase in organic sales in North America in 2019 versus 2018 was due to increases in Oral Care, Personal Care and Home Care organic sales. The increase in Oral Care was primarily due to organic sales growth in the toothpaste category, partially offset by declines in organic sales in the manual toothbrush and mouthwash categories. The increase in Personal Care was primarily due to organic sales growth in the skin health, body wash and bar soap categories, partially offset by a decline in organic sales in the liquid hand soap category. The increase in Home Care was primarily due to organic sales growth in the liquid cleaner and fabric softener categories, partially offset by a decline in organic sales in the hand dish category.
Operating profit in North America decreased 5% in 2019 to $982, or 230 bps to 28.7% of Net sales. This decrease in Operating profit as a percentage of Net sales was due to a decrease in Gross profit (130 bps), an increase in Selling, general and administrative expenses (70 bps) and an increase in Other (income) expense, net (30 bps), all as a percentage of Net sales. This decrease in Gross profit was primarily due to higher raw and packaging material costs (300 bps), partially offset by cost savings from the Company’s funding-the-growth initiatives (210 bps). This increase in Selling, general and administrative expenses was due to increased advertising investment (50 bps) and higher overhead expenses (20 bps). This increase in Other (income) expense, net was primarily due to the write-off of certain fixed assets.
32
(Dollars in Millions Except Per Share Amounts)
Latin America
2019 | 2018 | % Change | |||||||||
Net sales | $ | 3,606 | $ | 3,605 | — | % | |||||
Operating profit | $ | 963 | $ | 995 | (3 | ) | % | ||||
% of Net sales | 26.7 | % | 27.6 | % | (90 | ) | bps | ||||
Net sales in Latin America were $3,606 in 2019, even with 2018, as volume growth of 3.0% and net selling price increases of 4.0% were offset by negative foreign exchange of 7.0%. Volume gains were led by Mexico, Brazil and Central America. Organic sales in Latin America increased 7.0% in 2019.
The increase in organic sales in Latin America in 2019 versus 2018 was due to increases in Oral Care, Personal Care and Home Care organic sales. The increase in Oral Care was primarily due to organic sales growth in the toothpaste and manual toothbrush categories. The increase in Personal Care was primarily due to organic sales growth in the bar soap and shampoo categories. The increase in Home Care was primarily due to organic sales growth in the liquid cleaner, fabric softener and hand dish categories.
Operating profit in Latin America decreased 3% in 2019 to $963, or 90 bps to 26.7% of Net sales. This decrease in Operating profit as a percentage of Net sales was primarily due to an increase in Selling, general and administrative expenses (80 bps), partially offset by an increase in Gross profit (10 bps), both as a percentage of Net sales. This increase in Gross profit was primarily due to cost savings from the Company’s funding-the-growth initiatives (240 bps) and higher pricing, which were partially offset by higher raw and packaging material costs (360 bps), which included foreign exchange transaction costs. This increase in Selling, general and administrative expenses was due to higher overhead expenses (70 bps) and increased advertising investment (10 bps).
33
(Dollars in Millions Except Per Share Amounts)
Europe
2019 | 2018 | % Change | |||||||||
Net sales | $ | 2,450 | $ | 2,502 | (2.0 | ) | % | ||||
Operating profit | $ | 624 | $ | 634 | (2 | ) | % | ||||
% of Net sales | 25.5 | % | 25.3 | % | 20 | bps | |||||
Net sales in Europe decreased 2.0% in 2019 to $2,450, as volume growth of 4.0% was more than offset by net selling price decreases of 0.5% and negative foreign exchange of 5.5%. Volume gains were led by France, Spain and the United Kingdom. The Filorga acquisition, which closed on September 19, 2019, contributed 3.0% to volume in Europe. Organic sales in Europe increased 0.5% in 2019.
The increase in organic sales in Europe in 2019 versus 2018 was primarily due to an increase in Oral Care organic sales, partially offset by a decline in Personal Care organic sales. The increase in Oral Care was driven by organic sales growth in the toothpaste category, partially offset by a decline in organic sales in the battery-powered toothbrush category. The decrease in Personal Care was primarily due to declines in organic sales in the liquid hand soap and shampoo categories.
Operating profit in Europe decreased 2% in 2019 to $624, while as a percentage of Net sales it increased 20 bps to 25.5%. This increase in Operating profit as a percentage of Net sales was primarily due to an increase in Gross profit (80 bps), partially offset by an increase in Selling, general and administrative expenses (50 bps), both as a percentage of Net sales. This increase in Gross profit was primarily due to cost savings from the Company’s funding-the-growth initiatives (170 bps) and mix (80 bps) primarily due to the Company's acquisition of Filorga, partially offset by higher raw and packaging material costs (140 bps). This increase in Selling, general and administrative expenses was due to higher overhead expenses (30 bps) and increased advertising investment (20 bps).
34
(Dollars in Millions Except Per Share Amounts)
Asia Pacific
2019 | 2018 | % Change | |||||||||
Net sales | $ | 2,707 | $ | 2,734 | (1.0 | ) | % | ||||
Operating profit | $ | 749 | $ | 777 | (4 | ) | % | ||||
% of Net sales | 27.7 | % | 28.4 | % | (70 | ) | bps | ||||
Net sales in Asia Pacific decreased 1.0% in 2019 to $2,707, as volume growth of 0.5% and net selling price increases of 1.0% were more than offset by negative foreign exchange of 2.5%. Volume gains were led by the Philippines, Australia and Thailand. Organic sales in Asia Pacific increased 1.5% in 2019.
The increase in organic sales in 2019 versus 2018 was primarily due to an increase in Oral Care organic sales. The increase in Oral Care was driven by organic sales growth in the toothpaste category, partially offset by a decline in organic sales in the manual toothbrush category.
Operating profit in Asia Pacific decreased 4% in 2019 to $749, or 70 bps to 27.7% of Net sales. This decrease in Operating profit as a percentage of Net sales was primarily due to a decrease in Gross profit (10 bps) and an increase in Selling, general and administrative expenses (70 bps), both as a percentage of Net sales. This decrease in Gross profit was primarily due to higher raw and packaging material costs (310 bps), largely offset by cost savings from the Company’s funding-the-growth initiatives (270 bps) and higher pricing. This increase in Selling, general and administrative expenses was due to increased advertising investment (80 bps), partially offset by lower overhead expenses (10 bps).
35
(Dollars in Millions Except Per Share Amounts)
Africa/Eurasia
2019 | 2018 | % Change | |||||||||
Net sales | $ | 981 | $ | 967 | 1.5 | % | |||||
Operating profit | $ | 187 | $ | 173 | 8 | % | |||||
% of Net sales | 19.1 | % | 17.9 | % | 120 | bps | |||||
Net sales in Africa/Eurasia increased 1.5% in 2019 to $981, as volume growth of 3.5% and net selling price increases of 4.0% were partially offset by negative foreign exchange of 6.0%. Volume gains were led by Russia, Kenya and the Gulf States. The Company’s acquisition of a 51% controlling interest in Colgate Toloram Pte. Ltd., a joint venture which owns the Nigeria-based Hypo Homecare Products Limited (the "Nigeria Joint Venture"), contributed 0.5% to volume in Africa/Eurasia. Organic sales in Africa/Eurasia increased 7.0% in 2019.
The increase in organic sales in 2019 versus 2018 was primarily due to an increase in Oral Care organic sales. The increase in Oral Care was primarily due to organic sales growth in the toothpaste and manual toothbrush categories.
Operating profit in Africa/Eurasia increased 8% in 2019 to $187, or 120 bps to 19.1% of Net sales. This increase in Operating profit as a percentage of Net sales was primarily due to an increase in Gross Profit (170 bps), partially offset by an increase in Selling, general and administrative expenses (50 bps), both as a percentage of Net sales. This increase in Gross profit was mainly driven by cost savings from the Company’s funding-the-growth initiatives (290 bps) and higher pricing, partially offset by higher raw and packaging material costs (380 bps), which included foreign exchange transaction costs. The increase in Selling, general and administrative expenses was due to increased advertising investment (130 bps), partially offset by lower overhead expenses (80 bps).
36
(Dollars in Millions Except Per Share Amounts)
Hill’s Pet Nutrition
2019 | 2018 | % Change | |||||||||
Net sales | $ | 2,525 | $ | 2,388 | 6.0 | % | |||||
Operating profit | $ | 703 | $ | 680 | 3 | % | |||||
% of Net sales | 27.8 | % | 28.5 | % | (70 | ) | bps | ||||
Net sales for Hill’s Pet Nutrition increased 6.0% in 2019 to $2,525, as volume growth of 3.5% and net selling price increases of 4.0% were partially offset by negative foreign exchange of 1.5%. Volume gains were led by the United States, Western Europe and Australia. Organic sales in Hill’s Pet Nutrition increased 7.5% in 2019.
The increase in organic sales in 2019 versus 2018 was due to organic sales growth in the Science Diet and Prescription Diet categories.
Operating profit in Hill’s Pet Nutrition increased to $703 in 2019 from $680 in 2018, while as a percentage of Net sales it decreased 70 bps to 27.8%. This decrease in Operating profit as a percentage of Net sales was due to a decrease in Gross profit (40 bps) and an increase in Selling, general and administrative expenses (30 bps), both as a percentage of Net sales. This decrease in Gross profit was primarily due to higher raw and packaging material costs (300 bps), partially offset by cost savings from the Company’s funding-the-growth initiatives (160 bps) and higher pricing. This increase in Selling, general and administrative expenses was due to increased advertising investment (140 bps), partially offset by lower overhead expenses (110 bps).
During the quarter ended March 31, 2019, Hill’s announced a voluntary recall, which was subsequently expanded, of select canned dog food products due to potentially elevated levels of Vitamin D resulting from a supplier error. In the United States, the voluntary recall was conducted in cooperation with the U.S. Food and Drug Administration. Following the announcement of the voluntary recall, and as of December 31, 2019, Hill’s and/or the Company have been named as defendants in 37 putative class action lawsuits, one putative class action filed on behalf of a European Union class and one individual action, all related to the voluntary recall and filed in various jurisdictions in the United States. In addition, two putative class actions related to the voluntary recall have been filed in Canada. Eight of the putative class actions lawsuits in the United States have been voluntarily dismissed. Hill’s is entitled to indemnification from the supplier related to the voluntary recall. Sales of products voluntarily recalled represent less than 2% of Hill’s annual Net sales. The sales loss and other costs associated with the voluntary recall and subsequent expansion did not have a material impact on the Company’s Net sales or Operating profit for the year ended December 31, 2019 and are not expected to have a material impact in future periods.
37
(Dollars in Millions Except Per Share Amounts)
Corporate
2019 | 2018 | % Change | ||||||||
Operating profit (loss) | $ | (654 | ) | $ | (602 | ) | 9 | % | ||
Corporate operations include Corporate overhead costs, research and development costs, stock-based compensation expense related to stock options and restricted stock unit awards, restructuring and related implementation costs and gains and losses on sales of non-core product lines. The components of Operating profit (loss) for the Corporate segment are presented as follows:
2019 | 2018 | |||||||
Global Growth and Efficiency Program | $ | (125 | ) | $ | (152 | ) | ||
Acquisition-related costs | (24 | ) | — | |||||
Value-added tax matter in Brazil | 30 | — | ||||||
Corporate overhead costs and other, net | (535 | ) | (450 | ) | ||||
Total Corporate Operating profit (loss) | $ | (654 | ) | $ | (602 | ) | ||
Excluding charges related to the Global Growth and Efficiency program in both years and acquisition-related costs and the benefit related to a value-added tax matter in Brazil in 2019, Corporate Operating profit (loss) increased in 2019 as compared to 2018, driven primarily by the write-off of certain investments and fixed assets and higher compensation expense.
Restructuring and Related Implementation Charges
Global Growth and Efficiency Program
In the fourth quarter of 2012, the Company commenced the Global Growth and Efficiency Program. The program was expanded in 2014, expanded and extended in each of 2015 and 2017 and expanded again on October 31, 2019 to take advantage of additional savings opportunities near the end of the program. The program concluded on December 31, 2019. Substantially all initiatives under the program have been implemented as of December 31, 2019.
Initiatives under the Global Growth and Efficiency Program were designed to help the Company ensure sustained solid worldwide growth in unit volume, organic sales, operating profit and earnings per share and to enhance its global leadership positions in its core businesses, producing significant benefits in the Company’s long-term business performance. The major objectives of the program included:
▪ | Becoming even stronger on the ground through the continued evolution and expansion of proven global and regional commercial capabilities. |
▪ | Simplifying and standardizing how work gets done by increasing technology-enabled collaboration and taking advantage of global data and analytic capabilities, leading to smarter and faster decisions. |
▪ | Reducing structural costs to continue to increase the Company’s gross and operating profit. |
▪ | Building on Colgate’s current position of strength to enhance its leading market share positions worldwide and ensure sustained sales and earnings growth. |
38
(Dollars in Millions Except Per Share Amounts)
The initiatives under the Global Growth and Efficiency Program were focused on the following areas:
▪ | Expanding Commercial Hubs – Building on the success of the hub structure implemented around the world, streamlining operations in order to drive smarter and faster decision-making, strengthen capabilities available on the ground and improve cost structure. |
▪ | Extending Shared Business Services and Streamlining Global Functions – Optimizing the Company’s shared service organizational model in all regions of the world and continuing to streamline global functions to improve cost structure. |
▪ | Optimizing Global Supply Chain and Facilities – Continuing to optimize manufacturing efficiencies, global warehouse networks and office locations for greater efficiency, lower cost and speed to bring innovation to market. |
Savings, substantially all of which have been realized, are projected to be in the range of $640 to $660 pretax ($580 to $590 aftertax) annually. Substantially all of the savings are expected to increase future cash flows. The Company achieved savings in 2019 of approximately $65 pretax ($60 aftertax). Total pretax charges resulting from the Global Growth and Efficiency Program were $1,854 pretax ($1,380 aftertax), in line with the previously disclosed range.
Total pretax charges resulting from the Global Growth and Efficiency Program were comprised of the following categories: Employee-Related Costs, including severance, pension and other termination benefits (40 %); asset-related costs, primarily Incremental Depreciation and Asset Impairments (10 %); and Other charges, which include contract termination costs, consisting primarily of related implementation charges resulting directly from exit activities (30 %) and the implementation of new strategies (20 %). Over the course of the Global Growth and Efficiency Program, approximately 80% of the charges resulted in cash expenditures.
Total pretax charges related to initiatives undertaken in North America (15%), Europe (20%), Latin America (5%), Asia Pacific (5%), Africa/Eurasia (5%), Hill’s Pet Nutrition (10%) and Corporate (40%), which includes substantially all of the costs related to the implementation of new strategies, noted above, on a global basis. The Global Growth and Efficiency Program contributed a net reduction of approximately 4,400 positions from the Company’s global employee workforce.
For the years ended December 31, 2019 and 2018, restructuring and related implementation charges are reflected in the Consolidated Statements of Income as follows:
2019 | 2018 | |||||||
Cost of sales | $ | 8 | $ | 31 | ||||
Selling, general and administrative expenses | 60 | 33 | ||||||
Other (income) expense, net | 57 | 88 | ||||||
Non-service related postretirement costs | 7 | 9 | ||||||
Total Global Growth and Efficiency Program charges, pretax | $ | 132 | $ | 161 | ||||
Total Global Growth and Efficiency Program charges, aftertax | $ | 102 | $ | 125 | ||||
Restructuring and related implementation charges in the preceding table are recorded in the Corporate segment as these initiatives were predominantly centrally directed and controlled and were not included in internal measures of segment operating performance.
39
(Dollars in Millions Except Per Share Amounts)
Total pretax charges incurred for the Global Growth and Efficiency Program related to initiatives undertaken by the following reportable operating segments:
Total Program | ||||||||
2019 | 2018 | Charges | ||||||
North America | 4 | % | 18 | % | 17 | % | ||
Latin America | 12 | % | 10 | % | 5 | % | ||
Europe | 4 | % | (2 | )% | 19 | % | ||
Asia Pacific | 6 | % | 13 | % | 4 | % | ||
Africa/Eurasia | (1 | )% | 5 | % | 5 | % | ||
Hill’s Pet Nutrition | 2 | % | 19 | % | 8 | % | ||
Corporate | 73 | % | 37 | % | 42 | % | ||
Total | 100 | % | 100 | % | 100 | % | ||
Over the course of the Global Growth and Efficiency Program, the Company incurred total pretax charges of $1,854 ($1,380 aftertax) in connection with the implementation of various projects as follows:
Total Program Charges | |||
as of December 31, 2019 | |||
Employee-Related Costs | $ | 706 | |
Incremental Depreciation | 128 | ||
Asset Impairments | 58 | ||
Other | 962 | ||
Total | $ | 1,854 | |
Over the course of the Global Growth and Efficiency Program, the majority of the costs incurred related to the following projects: the implementation of the Company’s overall hubbing strategy; the consolidation of facilities; the extension of shared business services and streamlining of global functions; the closing of the Morristown, New Jersey personal care facility; the simplification and streamlining of the Company’s research and development capabilities and oral care supply chain, both in Europe; redesigning the European commercial organization; restructuring how the Company will provide future retirement benefits to substantially all of the U.S.-based employees participating in the Company’s defined benefit retirement plan by shifting them to the Company’s defined contribution plan; and the implementation of a Corporate efficiencies program.
40
(Dollars in Millions Except Per Share Amounts)
The following table summarizes the activity for the restructuring and related implementation charges, in the respective periods, discussed above and the related accruals:
Employee-Related Costs | Incremental Depreciation | Asset Impairments | Other | Total | ||||||||||||||||
Balance at January 1, 2017 | $ | 56 | $ | — | $ | — | $ | 125 | $ | 181 | ||||||||||
Charges | 163 | 10 | 9 | 151 | 333 | |||||||||||||||
Cash payments | (74 | ) | — | — | (170 | ) | (244 | ) | ||||||||||||
Charges against assets | (21 | ) | (10 | ) | (9 | ) | — | (40 | ) | |||||||||||
Foreign exchange | 3 | — | — | 1 | 4 | |||||||||||||||
Other | — | — | — | — | — | |||||||||||||||
Balance at December 31, 2017 | $ | 127 | $ | — | $ | — | $ | 107 | $ | 234 | ||||||||||
Charges | 53 | 2 | 16 | 90 | 161 | |||||||||||||||
Cash payments | (107 | ) | — | — | (60 | ) | (167 | ) | ||||||||||||
Charges against assets | (9 | ) | (2 | ) | (16 | ) | — | (27 | ) | |||||||||||
Foreign exchange | (4 | ) | — | — | — | (4 | ) | |||||||||||||
Other | — | — | — | 5 | 5 | |||||||||||||||
Balance at December 31, 2018 | $ | 60 | $ | — | $ | — | $ | 142 | $ | 202 | ||||||||||
Charges | 25 | 36 | 6 | 65 | 132 | |||||||||||||||
Cash payments | (55 | ) | — | — | (58 | ) | (113 | ) | ||||||||||||
Charges against assets | (7 | ) | (36 | ) | (6 | ) | (27 | ) | (76 | ) | ||||||||||
Foreign exchange | 3 | — | — | — | 3 | |||||||||||||||
Other | — | — | — | (48 | ) | (48 | ) | |||||||||||||
Balance at December 31, 2019 | $ | 26 | $ | — | $ | — | $ | 74 | $ | 100 | ||||||||||
Employee-Related Costs primarily include severance and other termination benefits and were calculated based on long-standing benefit practices, local statutory requirements and, in certain cases, voluntary termination arrangements. Employee-Related Costs also include pension and other retiree benefit enhancements amounting to $7, $9, and $21 for the years ended December 31, 2019, 2018 and 2017, respectively, which are reflected as Charges against assets within Employee-Related Costs in the preceding table, as the corresponding balance sheet amounts are reflected as a reduction of pension assets or an increase in pension and other retiree benefit liabilities. See Note 10, Retirement Plans and Other Retiree Benefits to the Consolidated Financial Statements for additional information.
Incremental Depreciation was recorded to reflect changes in useful lives and estimated residual values for long-lived assets that will be taken out of service prior to the end of their normal service period. Asset Impairments were recorded to write down inventories and assets held for sale or disposal to their fair value based on amounts expected to be realized. Charges against assets within Asset Impairments were net of cash proceeds pertaining to the sale of certain assets.
Other charges consisted primarily of charges resulting directly from exit activities and the implementation of new strategies as a result of the Global Growth and Efficiency Program. These charges for the years ended December 31, 2019, 2018 and 2017 included third-party incremental costs related to the development and implementation of new business and strategic initiatives of $32, $42 and $145, respectively, and contract termination costs and charges resulting directly from exit activities of $5, $48 and $6, respectively. These charges were expensed as incurred. Also included in Other charges for the year ended December 31, 2019 were other exit costs of $28 related to the consolidation of facilities.
Other decreases to the restructuring accruals in 2019 reflect the reclassification of restructuring accruals to lease assets as a result of the Company’s adoption of ASU No. 2018-10, “Codification Improvements to Topic 842, Leases,” on January 1, 2019. See Note 2, Summary of Significant Accounting Policies and Note 15, Leases to the Consolidated Financial Statements for additional information.
41
(Dollars in Millions Except Per Share Amounts)
Non-GAAP Financial Measures
This Annual Report on Form 10-K discusses certain financial measures on both a GAAP and a non-GAAP basis. The Company uses the non-GAAP financial measures described below internally in its budgeting process, to evaluate segment and overall operating performance and as a factor in determining compensation. The Company believes that these non-GAAP financial measures are useful in evaluating the Company’s underlying business performance and trends; however, this information should be considered as supplemental in nature and is not meant to be considered in isolation or as a substitute for the related financial information prepared in accordance with GAAP. In addition, these non-GAAP financial measures may not be the same as similar measures presented by other companies.
Net sales growth (GAAP) and organic sales growth (Net sales growth excluding the impact of foreign exchange, acquisitions and divestments) (non-GAAP) are discussed in this Annual Report on Form 10-K. Management believes the organic sales growth measure provides investors and analysts with useful supplemental information regarding the Company’s underlying sales trends by presenting sales growth excluding, the external factor of foreign exchange, as well as the impact of acquisitions and divestments, as applicable. A reconciliation of organic sales growth to Net sales growth for the years ended December 31, 2019 and 2018 is provided below.
Worldwide Gross profit, Gross profit margin, Selling, general and administrative expenses, Selling, general and administrative expenses as a percentage of Net sales, Other (income) expense, net, Operating profit, Operating profit margin, Non-service related postretirement costs, effective income tax rate, Net income attributable to Colgate-Palmolive Company and Earnings per share on a diluted basis are discussed in this Annual Report on Form 10-K both on a GAAP basis and excluding the charges resulting from the Global Growth and Efficiency Program and, as applicable, acquisition-related costs, the benefits related to a value-added tax matter in Brazil and Swiss income tax reform, the benefit from a foreign tax matter and the charge related to U.S. tax reform (non-GAAP). These non-GAAP financial measures exclude items that, either by their nature or amount, management would not expect to occur as part of the Company’s normal business on a regular basis, such as restructuring charges, charges for certain litigation and tax matters, gains and losses from certain acquisitions, divestitures and certain unusual, non-recurring items. Investors and analysts use these financial measures in assessing the Company’s business performance and management believes that presenting these financial measures on a non-GAAP basis provides them with useful supplemental information to enhance their understanding of the Company’s underlying business performance and trends. These non-GAAP financial measures also enhance the ability to compare period-to-period financial results. A reconciliation of each of these non-GAAP financial measures to the most directly comparable GAAP financial measures for the years ended December 31, 2019 and 2018 is presented within the applicable section of Results of Operations.
42
(Dollars in Millions Except Per Share Amounts)
The following tables provide a quantitative reconciliation of Net sales growth to organic sales growth for the years ended December 31, 2019 and 2018 versus the prior year:
Year ended December 31, 2019 | Net Sales Growth (GAAP) | Foreign Exchange Impact | Acquisitions and Divestments Impact | Organic Sales Growth (Non-GAAP) |
Oral, Personal and Home Care | ||||
North America | 2.0% | (0.5)% | —% | 2.5% |
Latin America | —% | (7.0)% | —% | 7.0% |
Europe | (2.0)% | (5.5)% | 3.0% | 0.5% |
Asia Pacific | (1.0)% | (2.5)% | —% | 1.5% |
Africa/Eurasia | 1.5% | (6.0)% | 0.5% | 7.0% |
Total Oral, Personal and Home Care | —% | (4.0)% | 0.5% | 3.5% |
Pet Nutrition | 6.0% | (1.5)% | —% | 7.5% |
Total Company | 1.0% | (3.5)% | 0.5% | 4.0% |
Year ended December 31, 2018 | Net Sales Growth (GAAP) | Foreign Exchange Impact | Acquisitions and Divestments Impact | Organic Sales Growth (Non-GAAP) |
Oral, Personal and Home Care | ||||
North America | 7.5% | —% | 5.0% | 2.5% |
Latin America | (7.5)% | (6.5)% | —% | (1.0)% |
Europe | 4.5% | 4.0% | —% | 0.5% |
Asia Pacific | (1.5)% | —% | —% | (1.5)% |
Africa/Eurasia | (1.5)% | (4.0)% | —% | 2.5% |
Total Oral, Personal and Home Care | —% | (1.5)% | 1.5% | —% |
Pet Nutrition | 4.0% | 0.5% | —% | 3.5% |
Total Company | 0.5% | (1.0)% | 1.0% | 0.5% |
Market Share Information
Management uses market share information as a key indicator to monitor business health and performance. References to market share in this Annual Report on Form 10-K are based on a combination of consumption and market share data provided by third-party vendors, primarily Nielsen, and internal estimates. All market share references represent the percentage of the dollar value of sales of our products, relative to all product sales in the category in the countries in which the Company competes and purchases data (excluding Venezuela from all periods).
Market share data is subject to limitations on the availability of up-to-date information. In particular, market share data is currently not generally available for certain retail channels, such as eCommerce or certain discounters. The Company measures year-to-date market shares from January 1 of the relevant year through the most recent period for which market share data is available, which typically reflects a lag time of one or two months. We believe that the third-party vendors we use to provide data are reliable, but we have not verified the accuracy or completeness of the data or any assumptions underlying the data. In addition, market share information calculated by the Company may be different from market share information calculated by other companies due to differences in category definitions, the use of data from different countries, internal estimates and other factors.
43
(Dollars in Millions Except Per Share Amounts)
Liquidity and Capital Resources
The Company expects cash flow from operations and debt issuances will be sufficient to meet foreseeable business operating and recurring cash needs (including for debt service, dividends, capital expenditures, stock repurchases and acquisitions). The Company believes its strong cash generation and financial position should continue to allow it broad access to global credit and capital markets.
Cash Flow
Net cash provided by operations increased to $3,133 in 2019 as compared to $3,056 in 2018, primarily due to improved working capital and lower income tax payments, which were partially offset by higher voluntary contributions to the Company’s pension plans and lower net income. The Company’s working capital as a percentage of Net sales was (1.6)% in 2019 and (1.7)% in 2018. This change in working capital as a percentage of Net sales is primarily due to lower accrued income taxes, partially offset by the impact of the Company’s adoption of the new lease accounting standard effective January 1, 2019. See Note 15, Leases to the Consolidated Financial Statements for additional information. The Company defines working capital as the difference between current assets (excluding Cash and cash equivalents and marketable securities, the latter of which is reported in Other current assets) and current liabilities (excluding short-term debt).
In the fourth quarter of 2012, the Company commenced the Global Growth and Efficiency Program. The program was expanded in 2014, expanded and extended in each of 2015 and 2017, and expanded again on October 31, 2019 to take advantage of additional savings opportunities near the end of the program. The program concluded on December 31, 2019. Substantially all initiatives under the program were implemented as of December 31, 2019.
Total program charges resulting from the Global Growth and Efficiency Program were $1,854 pretax ($1,380 aftertax), in line with the previously disclosed range. Approximately 80% of total program charges resulting from the Global Growth and Efficiency Program resulted in cash expenditures. Savings from the Global Growth and Efficiency Program, substantially all of which have been realized, are projected to be in the range of $640 to $660 pretax ($580 to $590 aftertax) annually. Substantially all of the savings are expected to increase future cash flows. Total pretax charges for 2019 were $132 ($102 aftertax). Savings in 2019 were approximately $65 pretax ($60 aftertax). Approximately 85% of the restructuring accrual at December 31, 2019 is expected to be paid before year-end 2020.
Investing activities used $2,099 of cash in 2019 compared to $1,170 during 2018. As more fully described below, investing activities in 2019 include the Company’s acquisition of Filorga and the Nigeria Joint Venture. Investing activities in 2018 include the Company’s acquisition of the outstanding equity interests of Physicians Care Alliance, LLC and Elta MD Holdings, Inc. for aggregate cash consideration of approximately $730. Purchases of marketable securities and investments increased in 2019 to $184 from $169 in 2018. Proceeds from the sale of marketable securities and investments decreased in 2019 to $131 from $156 in 2018.
Capital expenditures in 2019 were $335, a decrease from $436 in 2018. Capital expenditures decreased in 2019 primarily due to lower spending on manufacturing facilities and capital projects related to the Global Growth and Efficiency Program. Capital expenditures for 2020 are expected to be approximately 2.5% to 3.0% of Net sales. The Company continues to focus its capital spending on projects that are expected to yield high aftertax returns.
On September 19, 2019, the Company acquired Filorga for cash consideration of €1,516 (approximately $1,674) plus additional consideration of €32 (approximately $38), the majority of which related to repayment of loans from former shareholders of Filorga. On August 15, 2019, the Company acquired a 51% controlling interest in the Nigeria Joint Venture for $31. These acquisitions were financed with a combination of debt and cash. As a result of the incremental debt related to these acquisitions, the Company moderated its share repurchases in the fourth quarter of 2019 and will continue to do so into 2021 in order to reduce debt levels.
On January 31, 2020, the Company acquired Hello Products LLC, an oral care business, for cash consideration of $351 million. The acquisition was financed with a combination of debt and cash. This acquisition is part of the Company’s continued strategy to focus on the high growth segments within its Oral Care, Personal Care and Pet Nutrition businesses.
44
(Dollars in Millions Except Per Share Amounts)
Financing activities used $870 of cash during 2019 compared to $2,679 during 2018. The decrease in cash used in 2019 as compared to 2018 was primarily due to higher net proceeds from the issuance of debt and higher proceeds from the exercise of stock options.
Long-term debt, including the current portion, increased to $7,587 as of December 31, 2019, as compared to $6,354 as of December 31, 2018 and total debt increased to $7,847 as of December 31, 2019 as compared to $6,366 as of December 31, 2018, in both cases due primarily to the acquisition of Filorga. During the first quarter of 2019, the Company issued €500 of seven-year notes at a fixed coupon rate of 0.500% and €500 of fifteen-year notes at a fixed coupon rate of 1.375%. During the fourth quarter of 2019, the Company issued €500 of two-year notes at a fixed coupon rate of 0.000% and €500 of twenty-year notes at a fixed coupon rate of 0.875%. The debt issuances were under the Company’s shelf registration statement. The debt issuances support the Company’s capital structure objectives of funding its business and growth initiatives while minimizing its risk-adjusted cost of capital. Proceeds from the debt issuances were used for general corporate purposes, which included the retirement of commercial paper and, in the case of the debt issuances in the first quarter of 2019, the repayment of the Company’s $500 1.75% fixed rate notes, which became due in March 2019, and €500 floating rate notes, which became due May 2019.
At December 31, 2019, the Company had access to unused domestic and foreign lines of credit of $4,594 (including under the facilities discussed below) and could also issue medium-term notes pursuant to an effective shelf registration statement. In November 2018, the Company entered into an amended and restated $2,650 revolving credit facility with a syndicate of banks that was scheduled to expire in November 2023. In August 2019, the term of the facility was extended by one year and it now expires in November 2024. In August 2019, the Company entered into a $1,500 364-day credit facility with a syndicate of banks that is scheduled to expire in August 2020. Commitment fees related to the credit facilities are not material.
Domestic and foreign commercial paper outstanding was $829 and $534 as of December 31, 2019 and December 31, 2018, respectively. The average daily balances outstanding of commercial paper in 2019 and 2018 were $1,868 and $1,773, respectively. The Company classifies commercial paper and certain current maturities of notes payable as long-term debt when it has the intent and ability to refinance such obligations on a long-term basis, including, if necessary, by utilizing its lines of credit of $4,150 (under the facilities discussed above).
The following is a summary of the Company’s commercial paper and global short-term borrowings as of December 31, 2019 and 2018:
2019 | 2018 | |||||||||||||||||
Weighted Average Interest Rate | Maturities | Outstanding | Weighted Average Interest Rate | Maturities | Outstanding | |||||||||||||
Global short-term borrowings | 1.8 | % | 2020 | $ | 10 | 5.3 | % | 2019 | $ | 12 | ||||||||
Commercial Paper (1) | (0.4 | )% | 2020 | 829 | 2.5 | % | 2019 | 534 | ||||||||||
Total | $ | 839 | $ | 546 | ||||||||||||||
(1) Commercial paper includes a current portion of $250, included in Notes and loans payable.
Certain of the agreements with respect to the Company’s bank borrowings contain financial and other covenants as well as cross-default provisions. Noncompliance with these requirements could ultimately result in the acceleration of amounts owed. The Company is in full compliance with all such requirements and believes the likelihood of noncompliance is remote. Refer to Note 6, Long-Term Debt and Credit Facilities to the Consolidated Financial Statements for further information about the Company’s long-term debt and credit facilities.
Dividend payments in 2019 were $1,614, an increase from $1,591 in 2018. Dividend payments increased to $1.71 per share in 2019 from $1.66 per share in 2018. In the first quarter of 2019, the Company increased the quarterly common stock dividend to $0.43 per share from $0.42 per share, effective in the second quarter of 2019.
45
(Dollars in Millions Except Per Share Amounts)
The Company repurchases shares of its common stock in the open market and in private transactions to maintain its targeted capital structure and to fulfill certain requirements of its compensation and benefit plans. On June 18, 2018, the Board authorized the repurchase of shares of the Company’s common stock having an aggregate purchase price of up to $5,000 under the 2018 Program, which replaced the 2015 Program. The Board also has authorized share repurchases on an ongoing basis to fulfill certain requirements of the Company’s compensation and benefit programs. The shares are repurchased from time to time in open market or privately negotiated transactions at the Company’s discretion, subject to market conditions, customary blackout periods and other factors.
Aggregate share repurchases in 2019 consisted of approximately 16.0 million common shares under the 2018 Program and 1.2 million common shares to fulfill the requirements of compensation and benefit plans, for a total purchase price of $1,202. Aggregate repurchases in 2018 consisted of 8.9 million common shares under the 2018 Program, 8.7 million common shares under the 2015 Program and 1.1 million common shares to fulfill the requirements of compensation and benefit plans, for a total purchase price of $1,238.
Cash and cash equivalents increased $157 during 2019 to $883 at December 31, 2019, compared to $726 at December 31, 2018. Cash and cash equivalents held by the Company’s foreign subsidiaries was $798 and $651, respectively, at December 31, 2019 and 2018.
The following represents the scheduled maturities of the Company’s contractual obligations as of December 31, 2019:
Total | 2020 | 2021 | 2022 | 2023 | 2024 | Thereafter | ||||||||||||||||||||||
Long-term debt including current portion(1) | $ | 7,018 | $ | 267 | $ | 860 | $ | 903 | $ | 895 | $ | 498 | $ | 3,595 | ||||||||||||||
Net cash interest payments on long-term debt(2) | 1,999 | 153 | 146 | 131 | 106 | 89 | 1,374 | |||||||||||||||||||||
Operating Leases | 735 | 167 | 127 | 101 | 63 | 36 | 241 | |||||||||||||||||||||
Purchase obligations(3) | 559 | 291 | 148 | 93 | 8 | 12 | 7 | |||||||||||||||||||||
U.S. tax reform payments | 220 | — | 10 | 25 | 46 | 62 | 77 | |||||||||||||||||||||
Total | $ | 10,531 | $ | 878 | $ | 1,291 | $ | 1,253 | $ | 1,118 | $ | 697 | $ | 5,294 | ||||||||||||||
_______
(1) | The Company classifies commercial paper and notes maturing within the next 12 months as long-term debt when it has the intent and ability to refinance such obligations on a long-term basis. The amounts in this table exclude such obligations. |
(2) | Includes the net interest payments on fixed and variable rate debt and associated interest rate swaps. Interest payments associated with floating rate instruments are based on management’s best estimate of projected interest rates for the remaining term of variable rate debt. |
(3) | The Company had outstanding contractual obligations with suppliers at the end of 2019 for the purchase of raw, packaging and other materials and services in the normal course of business. These purchase obligation amounts represent only those items which are based on agreements that are legally binding and that specify all significant terms including minimum quantity, price and term and do not represent total anticipated purchases. |
Long-term liabilities associated with the Company’s postretirement plans are excluded from the table above due to the uncertainty of the timing of these cash disbursements. The amount and timing of cash funding related to these benefit plans will generally depend on local regulatory requirements, various economic assumptions (the most significant of which are detailed in “Critical Accounting Policies and Use of Estimates” below) and voluntary Company contributions. Based on current information, the Company is not required to make a mandatory contribution to its qualified U.S. pension plan in 2020. The Company does not expect to make any voluntary contributions to its U.S. postretirement plans in 2020. In addition, total benefit payments to be paid to participants for the year ending December 31, 2020 from the Company’s assets are estimated to be approximately $55.
Additionally, liabilities for unrecognized income tax benefits are excluded from the table above as the Company is unable to reasonably predict the ultimate amount or timing of a settlement of such liabilities. See Note 11, Income Taxes to the Consolidated Financial Statements for more information.
As more fully described in Part I, Item 3 “Legal Proceedings” and Note 13, Commitments and Contingencies to the Consolidated Financial Statements, the Company has commitments and contingencies with respect to lawsuits, environmental matters, taxes and other matters arising in the ordinary course of business.
46
(Dollars in Millions Except Per Share Amounts)
Off-Balance Sheet Arrangements
The Company does not have off-balance sheet financing or unconsolidated special purpose entities.
Managing Foreign Currency, Interest Rate, Commodity Price and Credit Risk Exposure
The Company is exposed to market risk from foreign currency exchange rates, interest rates and commodity price fluctuations. Volatility relating to these exposures is managed on a global basis by utilizing a number of techniques, including working capital management, selling price increases, selective borrowings in local currencies and entering into selective derivative instrument transactions, issued with standard features, in accordance with the Company’s treasury and risk management policies. The Company’s treasury and risk management policies prohibit the use of derivatives for speculative purposes and leveraged derivatives for any purpose.
The sensitivity of our financial instruments to market fluctuations is discussed below. See Note 2, Summary of Significant Accounting Policies and Note 7, Fair Value Measurements and Financial Instruments to the Consolidated Financial Statements for further discussion of derivatives and hedging policies and fair value measurements.
Foreign Exchange Risk
As the Company markets its products in over 200 countries and territories, it is exposed to currency fluctuations related to manufacturing and selling its products in currencies other than the U.S. dollar. The Company manages its foreign currency exposures through a combination of cost-containment measures, sourcing strategies, selling price increases and the hedging of certain costs in an effort to minimize the impact on earnings of foreign currency rate movements. See the “Results of Operations” section above for discussion of the foreign exchange impact on Net sales in each operating segment.
The assets and liabilities of foreign subsidiaries are translated into U.S. dollars at year-end exchange rates with resulting translation gains and losses accumulated in a separate component of shareholders’ equity. Income and expense items are translated into U.S. dollars at average rates of exchange prevailing during the year.
The Company primarily utilizes foreign currency contracts, including forward and swap contracts, option contracts, foreign and local currency deposits and local currency borrowings to hedge portions of its exposures relating to foreign currency purchases, assets and liabilities created in the normal course of business and the net investment in certain foreign subsidiaries. The duration of foreign currency contracts generally does not exceed 12 months and the contracts are valued using observable market rates.
The Company’s foreign currency forward contracts that qualify for cash flow hedge accounting resulted in a net unrealized loss of $6 and a net unrealized gain of $9 at December 31, 2019 and 2018, respectively. Changes in the fair value of cash flow hedges are recorded in Other comprehensive income (loss) and are reclassified into earnings in the same period or periods during which the underlying hedged transaction is recognized in earnings. At the end of 2019, an unfavorable 10% change in exchange rates would have resulted in a net unrealized loss of $82.
47
(Dollars in Millions Except Per Share Amounts)
Interest Rate Risk
The Company manages its mix of fixed and floating rate debt against its target with debt issuances and by entering into interest rate swaps in order to mitigate fluctuations in earnings and cash flows that may result from interest rate volatility. The notional amount, interest payment and maturity date of the swaps generally match the principal, interest payment and maturity date of the related debt, and the swaps are valued using observable benchmark rates.
Based on year-end 2019 variable rate debt levels, a 1% increase in interest rates would have increased Interest (income) expense, net by $9 in 2019.
The Company is assessing the impact of the discontinuation of LIBOR as a benchmark interest rate on its current financial instruments and contractual arrangements, including debt outstanding, and believes it will not be material as the Company does not have significant exposure to LIBOR in either its debt or other financing arrangements. The Company will continue to monitor its exposure in subsequent periods.
Commodity Price Risk
The Company is exposed to price volatility related to raw materials used in production, such as resins, essential oils, pulp, tropical oils, tallow, poultry, corn and soybeans. The Company manages its raw material exposures through a combination of cost containment measures, ongoing productivity initiatives and the limited use of commodity hedging contracts. Futures contracts are used on a limited basis, primarily in the Hill’s Pet Nutrition segment, to manage volatility related to anticipated raw material inventory purchases of certain traded commodities.
At December 31, 2019 and 2018, the Company’s open commodity derivative contracts, which qualify for cash flow hedge accounting, were not material. At the end of 2019, an unfavorable 10% change in commodity futures prices would have resulted in a net unrealized loss of $1.
Credit Risk
The Company is exposed to the risk of credit loss in the event of nonperformance by counterparties to financial instrument contracts; however, nonperformance is considered unlikely and any nonperformance is unlikely to be material as it is the Company’s policy to contract with diverse, credit-worthy counterparties based upon both strong credit ratings and other credit considerations.
Recent Accounting Pronouncements
In January 2020, the Financial Accounting Standards Board (the “FASB”) issued Accounting Standards Update (“ASU”) No. 2020-01, “Investments-Equity Securities (Topic 321), Investments-Equity Method and Joint Ventures (Topic 323), and Derivatives and Hedging (Topic 815)-Clarifying the Interactions between Topic 321, Topic 323, and Topic 815.” The guidance provides clarification of the interaction of rules for equity securities, the equity method of accounting and forward contracts and purchase options on certain types of securities. This new guidance is effective for the Company beginning on January 1, 2021, with early adoption permitted. While the Company is currently assessing the impact of the new guidance, it is not expected to have a material impact on the Company’s Consolidated Financial Statements.
In December 2019, the FASB issued ASU No. 2019-12, “Income taxes (Topic 740): Simplifying the Accounting for Income Taxes.” This ASU simplifies the accounting for income taxes by removing certain exceptions to the general principles in ASC 740 and also clarifies and amends existing guidance to improve consistent application. This new guidance is effective for the Company beginning on January 1, 2021, with early adoption permitted. While the Company is currently assessing the impact of the new guidance, it is not expected to have a material impact on the Company’s Consolidated Financial Statements.
In November 2019, the FASB issued ASU No. 2019-11, “Codification Improvements to Topic 326, Financial Instruments- Credit Losses.” This ASU clarifies and addresses certain items related to amendments in ASU 2016-13. This new guidance is effective for the Company beginning on January 1, 2020. This new guidance is not expected to have a material impact on the Company’s Consolidated Financial Statements.
48
(Dollars in Millions Except Per Share Amounts)
In July 2019, the FASB issued ASU No. 2019-07, “Codification Updates to SEC Sections - Amendments to SEC Paragraphs Pursuant to SEC Final Rule Releases No. 33-10532, Disclosure Update and Simplification, and Nos. 33-10231 and 33-10442, Investment Company Reporting Modernization and Miscellaneous Updates.” ASU 2019-07 clarified or improved the disclosure and presentation requirements of a variety of codification topics by aligning them with the SEC’s regulations, thereby eliminating redundancies and making the codification easier to apply. This ASU was effective upon issuance and did not have a material impact on the Company’s Consolidated Financial Statements.
In April 2019, the FASB issued ASU No. 2019-04, “Codification Improvements to Financial Instruments-Credit Losses (Topic 326), Derivatives and Hedging (Topic 815), and Financial Instruments (Topic 825).” This ASU clarifies three topics related to financial instruments accounting. This new guidance is effective for the Company beginning on January 1, 2020. This new guidance is not expected to have a material impact on the Company’s Consolidated Financial Statements.
In October 2018, the FASB issued ASU No. 2018-16, “Derivatives and Hedging (Topic 815): Inclusion of the Secured Overnight Financing Rate (“SOFR”) Overnight Index Swap (“OIS”) Rate as Benchmark Interest Rate for Hedge Accounting Purposes.” The new guidance permits the use of the OIS rate based on the SOFR as a U.S. benchmark interest rate for hedge accounting purposes under Topic 815. This new guidance was effective for the Company on a prospective basis beginning on January 1, 2019, concurrently with the adoption of ASU 2017-12, and did not have a material impact on the Company’s Consolidated Financial Statements.
In August 2018, the FASB issued ASU No. 2018-15, “Intangibles-Goodwill and Other-Internal-Use Software (Topic 350): Customer’s Accounting for Implementation Costs Incurred in a Cloud Computing Arrangement that is a Service Contract.” This new guidance aligns the requirements for capitalizing implementation costs incurred in a hosting arrangement that is a service contract with the requirements for capitalizing implementation costs incurred to develop or obtain internal-use software. This new guidance was effective for the Company on a prospective or retrospective basis beginning on January 1, 2020, with early adoption permitted. The Company elected to adopt this guidance early, beginning on January 1, 2019, on a prospective basis. The new guidance did not have a material impact on the Company’s Consolidated Financial Statements.
In August 2018, the FASB issued ASU No. 2018-14, “Compensation-Retirement Benefits-Defined Benefit Plans-General (Topic 715): Disclosure Framework–Changes to the Disclosure Requirements for Defined Benefit Plans.” This new guidance removes certain disclosures that are not considered cost beneficial, clarifies certain required disclosures and requires certain additional disclosures. This new guidance was effective for the Company on a retrospective basis beginning on January 1, 2020, with early adoption permitted. The Company elected to adopt this guidance early, beginning on January 1, 2019, on a retrospective basis. The new guidance did not have a material impact on the Company’s Consolidated Financial Statements.
In August 2018, the FASB issued ASU No. 2018-13, “Fair Value Measurement (Topic 820): Disclosure Framework - Changes to the Disclosure Requirements for Fair Value Measurement.” This new guidance removes certain disclosure requirements related to the fair value hierarchy, modifies existing disclosure requirements related to measurement uncertainty and adds new disclosure requirements. The new disclosure requirements include disclosing the changes in unrealized gains and losses for the period included in other comprehensive income for recurring Level 3 fair value measurements held at the end of the reporting period and the range and weighted average of significant unobservable inputs used to develop Level 3 fair value measurements. This new guidance is effective for the Company beginning on January 1, 2020. Certain disclosure requirements in the new guidance will need to be applied on a retrospective basis and others on a prospective basis. This new guidance is not expected to have a material impact on the Company’s Consolidated Financial Statements.
In February 2018, the FASB issued ASU No. 2018-02, “Income Statement-Reporting Comprehensive Income (Topic 220): Reclassification of Certain Tax Effects from Accumulated Other Comprehensive Income” (“ASU 2018-02”), which permits the reclassification of stranded tax effects resulting from the Tax Cuts and Jobs Act (the “TCJA” or “U.S. tax reform”) from Accumulated other comprehensive income (loss) to Retained earnings. This new guidance was effective for the Company beginning on January 1, 2019, with early adoption permitted, and must be applied either in the period of adoption or retrospectively to periods in which the effects of the TCJA are recognized. The Company elected to adopt this new guidance early, beginning on January 1, 2018, and reclassified $163 during the first quarter of 2018.
49
(Dollars in Millions Except Per Share Amounts)
In August 2017, the FASB issued ASU No. 2017-12, “Derivatives and Hedging (Topic 815): Targeted Improvements to Accounting for Hedging Activities,” amending the eligibility criteria for hedged items and transactions to expand an entity’s ability to hedge nonfinancial and financial risk components. The new guidance eliminates the requirement to separately measure and present hedge ineffectiveness and aligns the presentation of hedge gains and losses with the underlying hedge item. The new guidance also simplifies the hedge documentation and hedge effectiveness assessment requirements. The amended presentation and disclosure requirements must be adopted on a prospective basis, while any amendments to cash flow and net investment hedge relationships that exist on the date of adoption must be applied on a “modified retrospective” basis, meaning a cumulative effect adjustment to the opening balance of retained earnings as of the beginning of the year of adoption. The new guidance was effective for the Company on January 1, 2019 and did not have a material impact on the Company’s Consolidated Financial Statements.
In May 2017, the FASB issued ASU No. 2017-09, “Compensation–Stock Compensation (Topic 718): Scope of Modification Accounting,” clarifying when a change to the terms or conditions of a stock-based payment award must be accounted for as a modification. The new guidance requires modification accounting if the fair value, vesting condition or the classification of the award is not the same immediately before and after a change to the terms and conditions of the award. The new guidance was effective for the Company on a prospective basis beginning on January 1, 2018 and did not impact the Company’s Consolidated Financial Statements, as it is not the Company’s practice to change either the terms or the conditions of stock-based payment awards once they are granted.
In March 2017, the FASB issued ASU No. 2017-07, “Compensation–Retirement Benefits (Topic 715): Improving the Presentation of Net Periodic Pension Cost and Net Periodic Postretirement Benefit Cost,” changing the presentation of the net periodic benefit cost on the Statement of Income and limiting the amount of net periodic benefit cost eligible for capitalization to assets. The new guidance permits only the service cost component of net periodic benefit cost to be eligible for capitalization. The new guidance also requires entities to present the service cost component of net periodic benefit cost together with compensation costs arising from services rendered by employees during the period. The non-service related components of net periodic benefit cost, which include interest, expected return on assets, amortization of prior service costs and actuarial gains and losses, are required to be presented outside of Operating profit. The line item or items used to present the other components of net periodic benefit cost must be disclosed in the Notes to the Consolidated Financial Statements, if not separately described on the Statement of Income. The new presentation requirement was adopted on a “full retrospective” basis, meaning the standard is applied to all of the periods presented in the financial statements, while the limitation on capitalization was adopted on a prospective basis. Effective January 1, 2018, as required, the Company adopted this standard on a retrospective basis. As permitted by the new guidance, the Company used the amounts disclosed in its pension and other postretirement benefit plan note for the prior comparative periods as the basis for applying the retrospective presentation requirements. As a result, for all periods presented, only the service related component of pension and other postretirement benefit costs is included in Operating profit.
In January 2017, the FASB issued ASU No. 2017-04, “Intangibles-Goodwill and Other (Topic 350): Simplifying the Test for Goodwill Impairment,” eliminating the requirement to calculate implied fair value, essentially eliminating step two from the goodwill impairment test. The new standard requires goodwill impairment to be based upon the results of step one of the impairment test, which is defined as the excess of the carrying value of a reporting unit over its fair value. The impairment charge will be limited to the amount of goodwill allocated to that reporting unit. The standard is effective for the Company on a prospective basis beginning on January 1, 2020. This new guidance is expected to have no impact on the Company’s Consolidated Financial Statements.
In January 2017, the FASB issued ASU No. 2017-01, “Business Combinations (Topic 805): Clarifying the Definition of a Business,” which provides additional guidance on evaluating whether transactions should be accounted for as acquisitions of assets or businesses. The guidance requires an entity to evaluate if substantially all of the fair value of the assets acquired is concentrated in a single identifiable asset or a group of similar identifiable assets. If this threshold is met, then the new guidance would define the transaction as an asset acquisition. If the threshold is not met, then the entity would, pursuant to the guidance, evaluate whether the assets meet the requirement that a business include, at a minimum, an input and substantive process that together significantly contribute to the ability to create outputs. The guidance was effective for the Company, on a prospective basis, beginning on January 1, 2018. This new guidance had no impact on the Company’s Consolidated Financial Statements.
50
(Dollars in Millions Except Per Share Amounts)
In August 2016, the FASB issued ASU No. 2016-15, “Statement of Cash Flows (Topic 230): Classification of Certain Cash Receipts and Cash Payments,” which clarifies how certain cash receipts and payments are to be presented in the statement of cash flows. The guidance was effective for the Company on January 1, 2018. This new guidance had no impact on the Company’s Consolidated Financial Statements.
In June 2016, the FASB issued ASU No. 2016-13, “Financial Instruments-Credit Losses (Topic 326).” This ASU introduces the current expected credit loss (CECL) model, which will require an entity to measure credit losses for certain financial instruments and financial assets, including trade receivables. Under this update, on initial recognition and at each reporting period, an entity will be required to recognize an allowance that reflects the entity’s current estimate of credit losses expected to be incurred over the life of the financial instrument. This new guidance is effective for the Company beginning on January 1, 2020 and is not expected to have a material impact on the Company’s Consolidated Financial Statements.
In February 2016, the FASB issued its final standard on lease accounting, ASU No. 2016-02, “Leases (Topic 842),” which superseded Topic 840, “Leases.” which was further modified in ASU No. 2018-10, “Codification Improvements to Topic 842, Leases,” ASU No. 2018-11, “Leases (Topic 842) Targeted Improvements” and ASU No. 2019-01 “Leases (Topic 842) Codification Improvements” to clarify the implementation guidance. The new accounting standard was effective for the Company beginning on January 1, 2019 and required the recognition on the balance sheet of right-of-use assets and lease liabilities for all long-term leases, including operating leases, on the balance sheet. The Company elected the optional transition method and adopted the new guidance on January 1, 2019, on a modified retrospective basis, with no restatement of prior period amounts. As allowed under the new accounting standard, the Company elected to apply practical expedients to carry forward the original lease determinations, lease classifications and accounting of initial direct costs for all asset classes at the time of adoption. The Company also elected not to separate lease components from non-lease components and to exclude short-term leases from its Consolidated Balance Sheet. The Company’s adoption of the new standard resulted in the recognition of right-of-use assets of $458 and liabilities of $574, with no material cumulative effect adjustment to equity as of the date of adoption. In connection with the adoption of this guidance, as required, the Company reclassified certain restructuring reserves incurred in connection with the Global Growth and Efficiency Program and deferred rent liabilities as reductions to lease assets. Adoption of the new standard did not have a material impact on the Company’s Consolidated Statements of Income or Cash Flows. See Note 15 Leases for additional information.
In May 2014, the FASB and the International Accounting Standards Board issued their final converged standard on revenue recognition. The standard, issued as ASU No. 2014-09, “Revenue from Contracts with Customers (Topic 606)” by the FASB, provides a comprehensive revenue recognition model for all contracts with customers and supersedes current revenue recognition guidance. The revenue standard contains principles that an entity will apply to determine the measurement of revenue and timing of when it is recognized. The underlying principle is that an entity will recognize revenue to depict the transfer of goods or services to its customers at an amount that the entity expects to be entitled to in exchange for those goods or services. The new standard also includes enhanced disclosures. During 2016, the FASB issued several accounting updates (ASU No. 2016-08, 2016-10 and 2016-12) to clarify implementation guidance and correct unintended application of the guidance. The standard allows for either full retrospective adoption or modified retrospective adoption. The Company adopted the new standard on January 1, 2018, on a “modified retrospective” basis, which did not have a material impact on the Company’s Consolidated Financial Statements. As required, the Company recognized the cumulative effect of initially applying the new revenue standard as an adjustment to the 2018 opening balance of retained earnings. Results for periods beginning on or after January 1, 2018 are presented under Topic 606, “Revenue from Contracts with Customers,” while prior period amounts are not adjusted and continue to be reported in accordance with the prior accounting guidance under Topic 605, “Revenue Recognition.”
51
(Dollars in Millions Except Per Share Amounts)
Critical Accounting Policies and Use of Estimates
The preparation of financial statements in accordance with accounting principles generally accepted in the United States of America requires management to use judgment and make estimates. The level of uncertainty in estimates and assumptions increases with the length of time until the underlying transactions are completed. Actual results could ultimately differ from those estimates. The accounting policies that are most critical in the preparation of the Company’s Consolidated Financial Statements are those that are both important to the presentation of the Consolidated Financial Statements and require significant or complex judgments and estimates on the part of management. The Company’s critical accounting policies are reviewed periodically with the Audit Committee of the Board of Directors.
In certain instances, accounting principles generally accepted in the United States of America allow for the selection of alternative accounting methods. The Company’s significant policies that involve the selection of alternative methods are accounting for inventories and shipping and handling costs.
▪ | The Company accounts for inventories using both the first-in, first-out (“FIFO”) method (80% of inventories) and the LIFO method (20% of inventories). There would have been no material impact on reported earnings for 2019 or 2018 had all inventories been accounted for under the FIFO method. |
▪ | Shipping and handling costs may be reported as either a component of Cost of sales or Selling, general and administrative expenses. The Company accounts for such costs, primarily related to warehousing and outbound freight, as fulfillment costs and reports them in the Consolidated Statements of Income as a component of Selling, general and administrative expenses. Accordingly, the Company's Gross profit margin is not comparable with the gross profit margin of those companies that include shipping and handling charges in cost of sales. If such costs had been included as a component of Cost of sales, the Company's Gross profit margin would have been lower by 810 bps in both 2019 and 2018 and 760 bps in 2017, with no impact on reported earnings. |
The areas of accounting that involve significant or complex judgments and estimates are pensions and other retiree benefit cost assumptions, stock-based compensation, asset impairments, uncertain tax positions, tax valuation allowances, legal and other contingency reserves.
▪ | In accounting for pension and other postretirement benefit costs, the most significant actuarial assumptions are the discount rate and the long-term rate of return on plan assets. The discount rate used to measure the benefit obligation for U.S. defined benefit plans was 3.40% and 4.38% as of December 31, 2019 and 2018, respectively. The discount rate used to measure the benefit obligation for other U.S. postretirement plans was 3.56%, and 4.43% as of December 31, 2019 and 2018, respectively. Discount rates used for the U.S. and international defined benefit and other postretirement plans are based on a yield curve constructed from a portfolio of high-quality bonds whose projected cash flows approximate the projected benefit payments of the plans. The assumed long-term rate of return on plan assets for U.S. plans was 6.30% as of December 31, 2019 and 6.60% as of 2018. In determining the long-term rate of return, the Company considers the nature of the plans’ investments and the historical rate of return. |
52
(Dollars in Millions Except Per Share Amounts)
Average annual rates of return for the U.S. plans for the most recent 1-year, 5-year, 10-year, 15-year and 25-year periods were 17%, 6%, 8%, 7% and 8%, respectively. In addition, the current assumed rate of return for the U.S. plans is based upon the nature of the plans’ investments with a target asset allocation of approximately 68% in fixed income securities, 24% in equity securities and 8% in real estate and other investments. A 1% change in the assumed rate of return on plan assets of the U.S. pension plans would impact future Net income attributable to Colgate-Palmolive Company by approximately $14. A 1% change in the discount rate for the U.S. pension plans would impact future Net income attributable to Colgate-Palmolive Company by approximately $3. A third assumption is the long-term rate of compensation increase, a change in which would partially offset the impact of a change in either the discount rate or the long-term rate of return. This rate was 3.50% as of December 31, 2019, and 2018. Refer to Note 10, Retirement Plans and Other Retiree Benefits to the Consolidated Financial Statements for further discussion of the Company’s pension and other postretirement plans.
▪ | The assumption requiring the most judgment in accounting for other postretirement benefits (other than the discount rate noted above) is the medical cost trend rate. The Company reviews external data and its own historical trends for health care costs to determine the medical cost trend rate. The assumed rate of increase for the U.S. postretirement benefit plans is 6.00% for 2020, declining to 4.75% by 2025 and remaining at 4.75% for the years thereafter. The effect on the total of service cost and interest costs components of a 1% increase in the assumed long-term medical cost trend rate would decrease Net income attributable to Colgate-Palmolive Company by $7. |
▪ | The Company recognizes the cost of employee services received in exchange for awards of equity instruments, such as stock options and restricted stock units (both performance-based and time-vested), based on the fair value of those awards at the date of grant. The Company uses the Black-Scholes-Merton (“Black-Scholes”) option pricing model to estimate the fair value of stock option awards. The weighted-average estimated fair value of each stock option award granted in the year ended December 31, 2019 was $10.48. The Black-Scholes model uses various assumptions to estimate the fair value of stock option awards. These assumptions include the expected term of stock option awards, expected volatility rate, risk-free interest rate and expected dividend yield. While these assumptions do not require significant judgment, as the significant inputs are determined from historical experience or independent third-party sources, changes in these inputs could result in significant changes in the fair value of stock option awards. A one-year change in expected term would result in a change in fair value of approximately 5%. A 1% change in volatility would change fair value by approximately 6%. The Company uses a Monte-Carlo simulation to determine the fair value of performance-based restricted stock units at the date of grant. The Monte-Carlo simulation model uses substantially the same inputs as the Black Scholes model. |
▪ | Goodwill and indefinite life intangible assets, such as the Company’s global brands, are subject to impairment tests at least annually or when events or changes in circumstances indicate an asset may be impaired. In assessing impairment, the Company performs either a quantitative or a qualitative analysis. |
Determining the fair value of the Company’s reporting units for goodwill and the fair value of its intangible assets requires significant estimates and judgments by management. When a quantitative analysis is performed, the Company generally uses the income approach, which requires several estimates, including future cash flows consistent with management’s strategic plans, sales growth rates, foreign exchange rates and the selection of royalty rates and a discount rate. Estimating sales growth rates requires significant judgment by management in areas such as future economic conditions, category growth rates, product pricing, consumer tastes and preferences and future expansion expectations. In selecting an appropriate royalty rate, the Company considers recent market transactions for similar brands and products. In determining an appropriate discount rate, the Company considers the current interest rate environment and its estimated cost of capital. Other qualitative factors the Company considers, in addition to those quantitative measures discussed above, include assessments of general macroeconomic conditions, industry-specific considerations and historical financial performance. The Company generally engages a third-party valuation firm to assist it in determining the fair value of intangible assets acquired in business combinations.
53
(Dollars in Millions Except Per Share Amounts)
In determining the fair value of the Company’s reporting units, fair value is also determined using the market approach, which is generally derived from metrics of comparable publicly traded companies. As multiple valuation methodologies are used, the Company also performs a qualitative analysis comparing the fair value of a reporting unit under each method to assess its reasonableness and ensure consistency of results.
Determining the expected life of a brand requires management judgment and is based on an evaluation of several factors including market share, brand history, future expansion expectations, the level of in-market support anticipated by management, legal or regulatory restrictions and the economic environment in the countries in which the brand is sold.
The estimated fair value of the Company’s intangible assets substantially exceeds the recorded carrying value, except for the intangible assets acquired in the Sanex acquisition in 2011 and the Filorga acquisition in 2019, which were recorded at fair value. Except for recently acquired businesses where there is inherently a lower surplus of fair value over carrying value, the estimated fair value of the Company’s reporting units also substantially exceeds the recorded carrying value. Therefore, it is not reasonably likely that significant changes in these estimates would occur that would result in an impairment charge related to these assets.
The Company determined that the fair value of the Sanex intangible assets exceeded their carrying value by more than 10% and concluded that such excess was reasonable considering the brand’s relatively recent acquisition. Based on this, the brand’s recent performance and the Company’s future plans for the brand, the Company does not believe there is a significant risk of impairment related to the Sanex intangible assets. Given the recent acquisition of Filorga, its performance since its acquisition and the Company’s future plans for Filorga, the Company does not believe there is a significant risk of impairment related to the Filorga intangible assets.
▪ | The recognition and measurement of uncertain tax positions involves consideration of the amounts and probabilities of various outcomes that could be realized upon ultimate resolution. |
▪ | Tax valuation allowances are established to reduce deferred tax assets, such as tax loss carryforwards, to net realizable value. Factors considered in estimating net realizable value include historical results by tax jurisdiction, carryforward periods, income tax strategies and forecasted taxable income. |
▪ | Legal and other contingency reserves are based on management’s assessment of the risk of potential loss, which includes consultation with outside legal counsel and other advisors. Such assessments are reviewed each period and revised based on current facts and circumstances, if necessary. While it is possible that the Company’s cash flows and results of operations in a particular quarter or year could be materially affected by the impact of such contingencies, based on current knowledge it is the opinion of management that these matters will not have a material effect on the Company’s financial position, or its ongoing results of operations or cash flows. Refer to Note 13, Commitments and Contingencies to the Consolidated Financial Statements for further discussion of the Company’s contingencies. |
The Company generates revenue through the sale of well-known consumer products to trade customers under established trading terms. While the recognition of revenue and receivables requires the use of estimates, there is a short time frame (typically less than 60 days) between the shipment of product and cash receipt, thereby reducing the level of uncertainty in these estimates. Refer to Note 2, Summary of Significant Accounting Policies to the Consolidated Financial Statements for further description of the Company’s significant accounting policies.
54
(Dollars in Millions Except Per Share Amounts)
Cautionary Statement on Forward-Looking Statements
This Annual Report on Form 10-K may contain forward-looking statements as that term is defined in the Private Securities Litigation Reform Act of 1995 or by the SEC in its rules, regulations and releases that set forth anticipated results based on management’s current plans and assumptions. Such statements may relate, for example, to sales or volume growth, net selling price increases, organic sales growth, profit or profit margin growth, earnings per share growth, financial goals, the impact of foreign exchange volatility, cost-reduction plans, tax rates, new product introductions, commercial investment levels, acquisitions and divestitures, or legal or tax proceedings, among other matters. These statements are made on the basis of the Company’s views and assumptions as of this time and the Company undertakes no obligation to update these statements whether as a result of new information, future events or otherwise, except as required by law or by the rules and regulations of the SEC. Moreover, the Company does not, nor does any other person, assume responsibility for the accuracy and completeness of those statements. The Company cautions investors that any such forward-looking statements are not guarantees of future performance and that actual events or results may differ materially from those statements. Actual events or results may differ materially because of factors that affect international businesses and global economic conditions, as well as matters specific to the Company and the markets it serves, including the uncertain economic and political environment in different countries and its effect on consumer spending habits, foreign currency rate fluctuations, exchange controls, tariffs, price or profit controls, labor relations, changes in foreign or domestic laws, or regulations or their interpretation, political and fiscal developments, including changes in trade, tax and immigration policies, increased competition and evolving competitive practices (including from the growth of eCommerce and the entry of new competitors and business models), disruptions in global supply chain, the availability and cost of raw and packaging materials, the ability to maintain or increase selling prices as needed, changes in the policies of retail trade customers, the emergence of new sales channels, the growth of eCommerce and the changing retail landscape (as consumers increasingly shop online), the ability to develop innovative new products, the ability to continue lowering costs and operate in an agile manner, the ability to maintain the security of our information technology systems from a cyber-security incident or data breach, the ability to achieve our sustainability goals, the ability to complete acquisitions and divestitures as planned, the ability to successfully integrate acquired businesses, the ability to attract and retain key employees, and the uncertainty of the outcome of legal proceedings, whether or not the Company believes they have merit. For information about these and other factors that could impact the Company’s business and cause actual results to differ materially from forward-looking statements, refer to Part I, Item 1A “Risk Factors.”
ITEM 7A. QUANTITATIVE AND QUALITATIVE DISCLOSURES ABOUT MARKET RISK
See “Managing Foreign Currency, Interest Rate, Commodity Price and Credit Risk Exposure” in Part II, Item 7.
55
ITEM 8. FINANCIAL STATEMENTS AND SUPPLEMENTARY DATA
See “Index to Financial Statements.”
ITEM 9. | CHANGES IN AND DISAGREEMENTS WITH ACCOUNTANTS ON ACCOUNTING AND FINANCIAL DISCLOSURE |
None.
ITEM 9A. CONTROLS AND PROCEDURES
Evaluation of Disclosure Controls and Procedures
The Company’s management, under the supervision and with the participation of the Company’s President and Chief Executive Officer and Chief Financial Officer, carried out an evaluation of the effectiveness of the design and operation of the Company’s disclosure controls and procedures as of December 31, 2019 (the “Evaluation”). Based upon the Evaluation, the Company’s President and Chief Executive Officer and Chief Financial Officer concluded that the Company’s disclosure controls and procedures (as defined in Rule 13a-15(e) of the Securities Exchange Act of 1934) are effective.
Management’s Annual Report on Internal Control Over Financial Reporting
The Company’s management is responsible for establishing and maintaining adequate internal control over financial reporting, as defined in Rules 13a-15(f) and 15d-15(f) under the Securities Exchange Act of 1934. Management, under the supervision and with the participation of the Company’s President and Chief Executive Officer and Chief Financial Officer, conducted an evaluation of the Company’s internal control over financial reporting based upon the framework in Internal Control – Integrated Framework (2013) issued by the Committee of Sponsoring Organizations of the Treadway Commission and concluded that it is effective as of December 31, 2019.
The Company’s independent registered public accounting firm, PricewaterhouseCoopers LLP, has audited the effectiveness of the Company’s internal control over financial reporting as of December 31, 2019, and has expressed an unqualified opinion in their report, which appears under “Index to Financial Statements – Report of Independent Registered Public Accounting Firm.”
Changes in Internal Control Over Financial Reporting
The Company is in the process of upgrading its enterprise IT system to SAP S/4 HANA. This change is not expected to have a material impact on the Company’s internal controls over financial reporting.
Except as noted above, there were no changes in the Company’s internal control over financial reporting that occurred during the Company’s most recent fiscal quarter that have materially affected, or are reasonably likely to materially affect, the Company’s internal control over financial reporting.
ITEM 9B. OTHER INFORMATION
None.
56
PART III
ITEM 10. DIRECTORS, EXECUTIVE OFFICERS AND CORPORATE GOVERNANCE
See “Information about our Executive Officers” in Part I, Item 1 of this report.
Additional information required by this Item relating to directors, executive officers and corporate governance of the Company is incorporated herein by reference to the Company’s Proxy Statement for its 2020 Annual Meeting of Stockholders (the “2020 Proxy Statement”).
Code of Ethics
The Company’s Code of Conduct promotes the highest ethical standards in all of the Company’s business dealings. The Code of Conduct satisfies the SEC’s requirements for a Code of Ethics for senior financial officers and applies to all Company employees, including the President and Chief Executive Officer, the Chief Financial Officer and the Vice President and Controller, and the Company’s directors. The Code of Conduct is available on the Company’s website at www.colgatepalmolive.com. Any amendment to the Code of Conduct will promptly be posted on the Company’s website. It is the Company’s policy not to grant waivers of the Code of Conduct. In the extremely unlikely event that the Company grants an executive officer a waiver from a provision of the Code of Conduct, the Company will promptly disclose such information by posting it on its website or by using other appropriate means in accordance with SEC rules.
ITEM 11. EXECUTIVE COMPENSATION
The information regarding executive compensation set forth in the 2020 Proxy Statement is incorporated herein by reference.
57
ITEM 12. | SECURITY OWNERSHIP OF CERTAIN BENEFICIAL OWNERS AND MANAGEMENT AND RELATED STOCKHOLDER MATTERS |
(a) | The information regarding security ownership of certain beneficial owners and management set forth in the 2020 Proxy Statement is incorporated herein by reference. |
(b) | The Registrant does not know of any arrangements that may at a subsequent date result in a change in control of the Registrant. |
(c) | Equity compensation plan information as of December 31, 2019: |
(a) | (b) | (c) | |||||||||
Plan Category | Number of securities to be issued upon exercise of outstanding options, warrants and rights (in thousands) | Weighted-average exercise price of outstanding options, warrants and rights | Number of securities remaining available for future issuance under equity compensation plans (excluding securities reflected in column (a)) (in thousands) | ||||||||
Equity compensation plans approved by security holders | 38,388 | (1) | $ | 65.04 | (2) | 50,958 | (3) | ||||
Equity compensation plans not approved by security holders | Not applicable | Not applicable | Not applicable | ||||||||
Total | 38,388 | $ | 65.04 | 50,958 | |||||||
_______
(1) | Consists of 36,185 options outstanding and 2,203 restricted stock units awarded but not yet vested under the Company’s 2013 Incentive Compensation Plan and the Company’s 2019 Incentive Compensation Plan, respectively, as more fully described in Note 8, Capital Stock and Stock-Based Compensation Plans to the Consolidated Financial Statements. |
(2) | Includes the weighted-average exercise price of stock options outstanding of $69.00 and restricted stock units of $0.00. |
(3) | Amount includes 37,758 options available for issuance and 13,200 restricted stock units available for issuance under the Company’s 2019 Incentive Compensation Plan. |
ITEM 13. | CERTAIN RELATIONSHIPS AND RELATED TRANSACTIONS AND DIRECTOR INDEPENDENCE |
The information regarding certain relationships and related transactions and director independence set forth in the 2020 Proxy Statement is incorporated herein by reference.
ITEM 14. PRINCIPAL ACCOUNTANT FEES AND SERVICES
The information regarding auditor fees and services set forth in the 2020 Proxy Statement is incorporated herein by reference.
58
PART IV
ITEM 15. EXHIBITS AND FINANCIAL STATEMENT SCHEDULES
(a) | Financial Statements and Financial Statement Schedules |
See “Index to Financial Statements.”
(b) | Exhibits: |
Exhibit No. | Description | |
3-A | ||
3-B | ||
4 | a) | |
b) | Indenture, dated as of November 15, 1992, between the Company and The Bank of New York Mellon (formerly known as The Bank of New York) as Trustee. (Registrant hereby incorporates by reference Exhibit 4.1 to its Registration Statement on Form S-3 and Post-Effective Amendment No. 1 filed on June 26, 1992, Registration No. 33-48840.)(1) | |
c) | ||
10-A | a) | |
b) | ||
c) | ||
10-B | a) | |
b) | ||
c) | ||
d) | ||
59
10-C | a) | Colgate-Palmolive Company Executive Incentive Compensation Plan Trust, as amended. (Registrant hereby incorporates by reference Exhibit 10-B (b) to its Annual Report on Form 10-K for the year ended December 31, 1987, File No. 1-644.)* |
b) | ||
10-D | ||
10-E | a) | |
b) | Colgate-Palmolive Company Executive Severance Plan Trust. (Registrant hereby incorporates by reference Exhibit 10-E (b) to its Annual Report on Form 10-K for the year ended December 31, 1987, File No. 1-644.)* | |
10-F | ||
10-G | a) | |
b) | ||
10-H | ||
10-I | ||
10-J | ||
10-K | ||
10-L | ||
10-M | ||
60
21 | ||
23 | ||
24 | ||
31-A | ||
31-B | ||
32 | ||
101 | The following materials from Colgate-Palmolive Company’s Annual Report on Form 10-K for the year ended December 31, 2019, formatted in Inline eXtensible Business Reporting Language (Inline XBRL): (i) the Consolidated Statements of Income, (ii) the Consolidated Balance Sheets, (iii) the Consolidated Statements of Changes in Shareholders’ Equity, (iv) the Consolidated Statements of Comprehensive Income, (v) the Consolidated Statements of Cash Flows, (vi) Notes to Consolidated Financial Statements, and (vii) Financial Statement Schedule.** | |
104 | Cover Page Interactive Data File (formatted as Inline XBRL and contained in Exhibit 101).** | |
__________
* | Indicates a management contract or compensatory plan or arrangement. |
** | Filed herewith. |
*** Furnished herewith.
(1) | Registrant hereby undertakes to furnish the Commission, upon request, with a copy of any instrument with respect to long-term debt where the total amount of securities authorized thereunder does not exceed 10% of the total assets of the Registrant and its subsidiaries on a consolidated basis. |
The exhibits indicated above that are not included with the Form 10-K are available upon request and payment of a reasonable fee approximating the registrant’s cost of providing and mailing the exhibits. Inquiries should be directed to:
Colgate-Palmolive Company | |
Office of the Secretary (10-K Exhibits) | |
300 Park Avenue | |
New York, NY 10022-7499 | |
61
ITEM 16. FORM 10-K SUMMARY
None.
62
COLGATE-PALMOLIVE COMPANY
SIGNATURES
Pursuant to the requirements of Section 13 or 15(d) of the Securities Exchange Act of 1934, the registrant has duly caused this report to be signed on its behalf by the undersigned, thereunto duly authorized.
Colgate-Palmolive Company (Registrant) | ||
Date: February 21, 2020 | By | /s/ Noel R. Wallace |
Noel R. Wallace President and Chief Executive Officer | ||
Pursuant to the requirements of the Securities Exchange Act of 1934, this report has been signed below on February 21, 2020, by the following persons on behalf of the registrant and in the capacities indicated.
(a) Principal Executive Officer | (d) All Other Directors: | |
/s/ Noel R. Wallace | /s/ Ian Cook | |
Noel R. Wallace President, Chief Executive Officer and Director | Ian Cook, Executive Chairman | |
(b) Principal Financial Officer | Charles A. Bancroft, John P. Bilbrey, John T. Cahill, Lisa M. Edwards, Helene D. Gayle, C. Martin Harris, Lorrie M. Norrington, Michael B. Polk, Stephen I. Sadove* | |
/s/ Henning I. Jakobsen | *By: /s/ Jennifer M. Daniels | |
Henning I. Jakobsen Chief Financial Officer | Jennifer M. Daniels As Attorney-in-Fact | |
(c) Principal Accounting Officer | ||
/s/ Philip G. Shotts | ||
Philip G. Shotts Vice President and Controller | ||
63
Index to Financial Statements
Page | |
Consolidated Financial Statements | |
Report of Independent Registered Public Accounting Firm | |
Consolidated Statements of Income for the years ended December 31, 2019, 2018 and 2017 | |
Consolidated Statements of Comprehensive Income for the years ended December 31, 2019, 2018 and 2017 | |
Consolidated Balance Sheets as of December 31, 2019 and 2018 | |
Consolidated Statements of Changes in Shareholders’ Equity for the years ended December 31, 2019, 2018 and 2017 | |
Consolidated Statements of Cash Flows for the years ended December 31, 2019, 2018 and 2017 | |
Notes to Consolidated Financial Statements | |
Financial Statement Schedule | |
Schedule II - Valuation and Qualifying Accounts for the years ended December 31, 2019, 2018 and 2017 | |
Selected Financial Data | |
Market Information | |
Historical Financial Summary | |
All other financial statements and schedules not listed have been omitted since the required information is included in the financial statements or the notes thereto or is not applicable or required.
64
Report of Independent Registered Public Accounting Firm
To the Board of Directors and Shareholders of Colgate-Palmolive Company:
Opinions on the Financial Statements and Internal Control over Financial Reporting
We have audited the consolidated financial statements, including the related notes and financial statement schedule, of Colgate-Palmolive Company and its subsidiaries (the “Company”) as listed in the accompanying index (collectively referred to as the “consolidated financial statements”). We also have audited the Company's internal control over financial reporting as of December 31, 2019, based on criteria established in Internal Control - Integrated Framework (2013) issued by the Committee of Sponsoring Organizations of the Treadway Commission (COSO).
In our opinion, the consolidated financial statements referred to above present fairly, in all material respects, the financial position of the Company as of December 31, 2019 and 2018, and the results of its operations and its cash flows for each of the three years in the period ended December 31, 2019 in conformity with accounting principles generally accepted in the United States of America. Also in our opinion, the Company maintained, in all material respects, effective internal control over financial reporting as of December 31, 2019, based on criteria established in Internal Control - Integrated Framework (2013) issued by the COSO.
Change in Accounting Principle
As discussed in Note 2 to the consolidated financial statements, the Company changed the manner in which it accounts for leases in 2019.
Basis for Opinions
The Company's management is responsible for these consolidated financial statements, for maintaining effective internal control over financial reporting, and for its assessment of the effectiveness of internal control over financial reporting, included in Management’s Annual Report on Internal Control Over Financial Reporting appearing under Item 9A. Our responsibility is to express opinions on the Company’s consolidated financial statements and on the Company's internal control over financial reporting based on our audits. We are a public accounting firm registered with the Public Company Accounting Oversight Board (United States) (PCAOB) and are required to be independent with respect to the Company in accordance with the U.S. federal securities laws and the applicable rules and regulations of the Securities and Exchange Commission and the PCAOB.
We conducted our audits in accordance with the standards of the PCAOB. Those standards require that we plan and perform the audits to obtain reasonable assurance about whether the consolidated financial statements are free of material misstatement, whether due to error or fraud, and whether effective internal control over financial reporting was maintained in all material respects.
Our audits of the consolidated financial statements included performing procedures to assess the risks of material misstatement of the consolidated financial statements, whether due to error or fraud, and performing procedures that respond to those risks. Such procedures included examining, on a test basis, evidence regarding the amounts and disclosures in the consolidated financial statements. Our audits also included evaluating the accounting principles used and significant estimates made by management, as well as evaluating the overall presentation of the consolidated financial statements. Our audit of internal control over financial reporting included obtaining an understanding of internal control over financial reporting, assessing the risk that a material weakness exists, and testing and evaluating the design and operating effectiveness of internal control based on the assessed risk. Our audits also included performing such other procedures as we considered necessary in the circumstances. We believe that our audits provide a reasonable basis for our opinions.
65
Definition and Limitations of Internal Control over Financial Reporting
A company’s internal control over financial reporting is a process designed to provide reasonable assurance regarding the reliability of financial reporting and the preparation of financial statements for external purposes in accordance with generally accepted accounting principles. A company’s internal control over financial reporting includes those policies and procedures that (i) pertain to the maintenance of records that, in reasonable detail, accurately and fairly reflect the transactions and dispositions of the assets of the company; (ii) provide reasonable assurance that transactions are recorded as necessary to permit preparation of financial statements in accordance with generally accepted accounting principles, and that receipts and expenditures of the company are being made only in accordance with authorizations of management and directors of the company; and (iii) provide reasonable assurance regarding prevention or timely detection of unauthorized acquisition, use, or disposition of the company’s assets that could have a material effect on the financial statements.
Because of its inherent limitations, internal control over financial reporting may not prevent or detect misstatements. Also, projections of any evaluation of effectiveness to future periods are subject to the risk that controls may become inadequate because of changes in conditions, or that the degree of compliance with the policies or procedures may deteriorate.
Critical Audit Matters
The critical audit matter communicated below is a matter arising from the current period audit of the consolidated financial statements that was communicated or required to be communicated to the audit committee and that (i) relates to accounts or disclosures that are material to the consolidated financial statements and (ii) involved our especially challenging, subjective, or complex judgments. The communication of critical audit matters does not alter in any way our opinion on the consolidated financial statements, taken as a whole, and we are not, by communicating the critical audit matter below, providing a separate opinion on the critical audit matter or on the accounts or disclosures to which it relates.
Acquisition of Laboratoires Filorga Cosmétiques - Valuation of Trademark Intangible Asset
As described in Note 3 to the consolidated financial statements, on September 19, 2019, the Company completed the acquisition of Laboratoires Filorga Cosmétiques for consideration of $1,712 million, of which $774 million of value was assigned to the trademark intangible asset. Management applied significant judgment in estimating the fair value of the trademark intangible asset acquired, which involved the use of significant estimates and assumptions with respect to the revenue growth rates, the royalty rate, and the discount rate.
The principal considerations for our determination that performing procedures relating to the valuation of the trademark intangible asset acquired is a critical audit matter are there was significant judgment and estimation by management when developing the fair value measurement of the trademark intangible asset acquired. This in turn led to a high degree of auditor judgment, subjectivity, and effort in performing procedures and in evaluating audit evidence relating to management’s significant assumptions and estimates, including revenue growth rates, the royalty rate, and the discount rate. In addition, the audit effort involved the use of professionals with specialized skill and knowledge to assist in performing these procedures and evaluating the audit evidence obtained.
Addressing the matter involved performing procedures and evaluating audit evidence in connection with forming our overall opinion on the consolidated financial statements. These procedures included testing the effectiveness of controls relating to acquisition accounting, including controls over management’s valuation of the trademark intangible asset acquired and controls over development of the assumptions and estimates, including the revenue growth rates, the royalty rate, and the discount rate. These procedures also included, among others, reading the purchase agreement and testing management’s process for estimating the fair value of the trademark intangible asset acquired. This included evaluating the appropriateness of the valuation method and the reasonableness of significant assumptions used by management, including the revenue growth rates, the royalty rate, and the discount rate for the trademark intangible asset acquired.
66
Evaluating the reasonableness of the revenue growth rates and the royalty rate involved evaluating whether the assumptions and estimates used by management were reasonable considering the past performance of the acquired business, market transactions for similar brands and products, and consistency with economic and industry forecasts. Professionals with specialized skill and knowledge were used to assist us in evaluating the appropriateness of the valuation method and the reasonableness of certain significant assumptions and estimates, including the royalty rate and the discount rate.
/s/ PricewaterhouseCoopers LLP | |
New York, New York February 21, 2020 | |
We have served as the Company’s auditor since 2002. | |
67
COLGATE-PALMOLIVE COMPANY
Consolidated Statements of Income
For the years ended December 31,
(Dollars in Millions Except Per Share Amounts)
2019 | 2018 | 2017 | |||||||||
Net sales | $ | $ | $ | ||||||||
Cost of sales | |||||||||||
Gross profit | |||||||||||
Selling, general and administrative expenses | |||||||||||
Other (income) expense, net | |||||||||||
Operating profit | |||||||||||
Non-service related postretirement costs | |||||||||||
Interest (income) expense, net | |||||||||||
Income before income taxes | |||||||||||
Provision for income taxes | |||||||||||
Net income including noncontrolling interests | |||||||||||
Less: Net income attributable to noncontrolling interests | |||||||||||
Net income attributable to Colgate-Palmolive Company | $ | $ | $ | ||||||||
Earnings per common share, basic | $ | $ | $ | ||||||||
Earnings per common share, diluted | $ | $ | $ | ||||||||
See Notes to Consolidated Financial Statements.
68
COLGATE-PALMOLIVE COMPANY
Consolidated Statements of Comprehensive Income
For the years ended December 31,
(Dollars in Millions)
2019 | 2018 | 2017 | |||||||||
Net income including noncontrolling interests | $ | $ | $ | ||||||||
Other comprehensive income (loss), net of tax: | |||||||||||
Cumulative translation adjustments | ( | ) | |||||||||
Retirement plan and other retiree benefit adjustments | ( | ) | |||||||||
Gains (losses) on cash flow hedges | ( | ) | ( | ) | |||||||
Total Other comprehensive income (loss), net of tax | ( | ) | ( | ) | |||||||
Total Comprehensive income including noncontrolling interests | |||||||||||
Less: Net income attributable to noncontrolling interests | |||||||||||
Less: Cumulative translation adjustments attributable to noncontrolling interests | ( | ) | ( | ) | |||||||
Total Comprehensive income attributable to noncontrolling interests | |||||||||||
Total Comprehensive income attributable to Colgate-Palmolive Company | $ | $ | $ | ||||||||
See Notes to Consolidated Financial Statements.
69
COLGATE-PALMOLIVE COMPANY
Consolidated Balance Sheets
As of December 31,
(Dollars in Millions Except Share and Per Share Amounts)
2019 | 2018 | ||||||
Assets | |||||||
Current Assets | |||||||
Cash and cash equivalents | $ | $ | |||||
Receivables (net of allowances of $76 and $82, respectively) | |||||||
Inventories | |||||||
Other current assets | |||||||
Total current assets | |||||||
Property, plant and equipment, net | |||||||
Goodwill | |||||||
Other intangible assets, net | |||||||
Deferred income taxes | |||||||
Other assets | |||||||
Total assets | $ | $ | |||||
Liabilities and Shareholders’ Equity | |||||||
Current Liabilities | |||||||
Notes and loans payable | $ | $ | |||||
Current portion of long-term debt | |||||||
Accounts payable | |||||||
Accrued income taxes | |||||||
Other accruals | |||||||
Total current liabilities | |||||||
Long-term debt | |||||||
Deferred income taxes | |||||||
Other liabilities | |||||||
Total liabilities | |||||||
Commitments and contingent liabilities | — | — | |||||
Shareholders’ Equity | |||||||
Common stock, $1 par value (2,000,000,000 shares authorized, 1,465,706,360 shares issued) | |||||||
Additional paid-in capital | |||||||
Retained earnings | |||||||
Accumulated other comprehensive income (loss) | ( | ) | ( | ) | |||
Unearned compensation | ( | ) | ( | ) | |||
Treasury stock, at cost | ( | ) | ( | ) | |||
Total Colgate-Palmolive Company shareholders’ equity | ( | ) | |||||
Noncontrolling interests | |||||||
Total equity | |||||||
Total liabilities and equity | $ | $ | |||||
See Notes to Consolidated Financial Statements.
70
COLGATE-PALMOLIVE COMPANY
Consolidated Statements of Changes in Shareholders’ Equity
(Dollars in Millions)
Colgate-Palmolive Company Shareholders’ Equity | ||||||||||||||||||||||||||||
Common Stock | Additional Paid-In Capital | Unearned Compensation | Treasury Stock | Retained Earnings | Accumulated Other Comprehensive Income (Loss) | Noncontrolling Interests | ||||||||||||||||||||||
Balance, January 1, 2017 | $ | $ | $ | ( | ) | $ | ( | ) | $ | $ | ( | ) | $ | |||||||||||||||
Net income | ||||||||||||||||||||||||||||
Other comprehensive income (loss), net of tax | ||||||||||||||||||||||||||||
Dividends ($1.59)/per share* | ( | ) | ( | ) | ||||||||||||||||||||||||
Stock-based compensation expense | ||||||||||||||||||||||||||||
Shares issued for stock options | ||||||||||||||||||||||||||||
Shares issued for restricted stock awards | ( | ) | ||||||||||||||||||||||||||
Treasury stock acquired | ( | ) | ||||||||||||||||||||||||||
Other | ( | ) | ||||||||||||||||||||||||||
Balance, December 31, 2017 | $ | $ | $ | ( | ) | $ | ( | ) | $ | $ | ( | ) | $ | |||||||||||||||
Net income | ||||||||||||||||||||||||||||
Other comprehensive income (loss), net of tax | ( | ) | ( | ) | ||||||||||||||||||||||||
Dividends ($1.66)/per share* | ( | ) | ( | ) | ||||||||||||||||||||||||
Stock-based compensation expense | ||||||||||||||||||||||||||||
Shares issued for stock options | ||||||||||||||||||||||||||||
Shares issued for restricted stock awards | ( | ) | ||||||||||||||||||||||||||
Treasury stock acquired | ( | ) | ||||||||||||||||||||||||||
Other | ( | ) | (1 | ) | ||||||||||||||||||||||||
Balance, December 31, 2018 | $ | $ | $ | ( | ) | $ | ( | ) | $ | $ | ( | ) | $ | |||||||||||||||
Net income | ||||||||||||||||||||||||||||
Other comprehensive income (loss), net of tax | ( | ) | ( | ) | ||||||||||||||||||||||||
Dividends ($1.71)/per share* | ( | ) | ( | ) | ||||||||||||||||||||||||
Stock-based compensation expense | ||||||||||||||||||||||||||||
Shares issued for stock options | ||||||||||||||||||||||||||||
Shares issued for restricted stock awards | ( | ) | ||||||||||||||||||||||||||
Noncontrolling interests assumed through acquisition | ||||||||||||||||||||||||||||
Treasury stock acquired | ( | ) | ||||||||||||||||||||||||||
Other | ( | ) | ||||||||||||||||||||||||||
Balance, December 31, 2019 | $ | $ | $ | ( | ) | $ | ( | ) | $ | $ | ( | ) | $ | |||||||||||||||
(1) As a result of the early adoption of ASU 2018-02, the Company reclassified the stranded tax effects in Accumulated other comprehensive income (loss) resulting from the TCJA to Retained earnings. See Note 2, Summary of Significant Accounting Policies for additional information.
* Two dividends were declared in each of the first quarters of 2019, 2018 and 2017
See Notes to Consolidated Financial Statements.
71
COLGATE-PALMOLIVE COMPANY
Consolidated Statements of Cash Flows
For the years ended December 31,
(Dollars in Millions)
2019 | 2018 | 2017 | |||||||||
Operating Activities | |||||||||||
Net income including noncontrolling interests | $ | $ | $ | ||||||||
Adjustments to reconcile net income including noncontrolling interests to net cash provided by operations: | |||||||||||
Depreciation and amortization | |||||||||||
Restructuring and termination benefits, net of cash | ( | ) | |||||||||
Stock-based compensation expense | |||||||||||
Charge for U.S. tax reform | |||||||||||
Deferred income taxes | |||||||||||
Voluntary benefit plan contributions | ( | ) | ( | ) | ( | ) | |||||
Cash effects of changes in: | |||||||||||
Receivables | ( | ) | ( | ) | |||||||
Inventories | ( | ) | ( | ) | ( | ) | |||||
Accounts payable and other accruals | ( | ) | |||||||||
Other non-current assets and liabilities | ( | ) | |||||||||
Net cash provided by operations | |||||||||||
Investing Activities | |||||||||||
Capital expenditures | ( | ) | ( | ) | ( | ) | |||||
Sale of property and non-core product lines | |||||||||||
Purchases of marketable securities and investments | ( | ) | ( | ) | ( | ) | |||||
Proceeds from sale of marketable securities and investments | |||||||||||
Payment for acquisitions, net of cash acquired | ( | ) | ( | ) | |||||||
Other | ( | ) | ( | ) | |||||||
Net cash used in investing activities | ( | ) | ( | ) | ( | ) | |||||
Financing Activities | |||||||||||
Principal payments on debt | ( | ) | ( | ) | ( | ) | |||||
Proceeds from issuance of debt | |||||||||||
Dividends paid | ( | ) | ( | ) | ( | ) | |||||
Purchases of treasury shares | ( | ) | ( | ) | ( | ) | |||||
Proceeds from exercise of stock options | |||||||||||
Net cash used in financing activities | ( | ) | ( | ) | ( | ) | |||||
Effect of exchange rate changes on Cash and cash equivalents | ( | ) | ( | ) | |||||||
Net (decrease) increase in Cash and cash equivalents | ( | ) | |||||||||
Cash and cash equivalents at beginning of year | |||||||||||
Cash and cash equivalents at end of year | $ | $ | $ | ||||||||
Supplemental Cash Flow Information | |||||||||||
Income taxes paid | $ | $ | $ | ||||||||
Interest paid | $ | $ | $ | ||||||||
See Notes to Consolidated Financial Statements.
72
COLGATE-PALMOLIVE COMPANY
Notes to Consolidated Financial Statements
(Dollars in Millions Except Share and Per Share Amounts)
1. Nature of Operations
The Company manufactures and markets a wide variety of products in the U.S. and around the world in two product segments: Oral, Personal and Home Care; and Pet Nutrition. Oral, Personal and Home Care products include toothpaste, toothbrushes, mouthwash, bar and liquid hand soaps, shower gels, shampoos, conditioners, deodorants and antiperspirants, skin health products, dishwashing detergents, fabric conditioners, household cleaners and other similar items. These products are sold primarily to a variety of traditional and eCommerce retailers, wholesalers and distributors worldwide. Pet Nutrition products include specialty pet nutrition products manufactured and marketed by Hill’s Pet Nutrition. The principal customers for Pet Nutrition products are authorized pet supply retailers, veterinarians and eCommerce retailers. Principal global and regional trademarks include Colgate, Palmolive, elmex, meridol, Tom’s of Maine, Sorriso, Hello, Speed Stick, Lady Speed Stick, Softsoap, Irish Spring, Protex, Sanex, Filorga, Elta MD, PCA Skin, Ajax, Axion, Fabuloso, Soupline and Suavitel, as well as Hill’s Science Diet and Hill’s Prescription Diet.
The Company’s principal classes of products accounted for the following percentages of worldwide Net sales for the past three years:
2019 | 2018 | 2017 | |||||||
Oral Care | % | % | % | ||||||
Personal Care | % | % | % | ||||||
Home Care | % | % | % | ||||||
Pet Nutrition | % | % | % | ||||||
Total | % | % | % | ||||||
73
COLGATE-PALMOLIVE COMPANY
Notes to Consolidated Financial Statements (continued)
(Dollars in Millions Except Share and Per Share Amounts)
2. Summary of Significant Accounting Policies
Principles of Consolidation
Use of Estimates
The preparation of financial statements in accordance with accounting principles generally accepted in the United States of America requires management to use judgment and make estimates that affect the reported amounts of assets and liabilities and disclosure of contingent gains and losses at the date of the financial statements and the reported amounts of revenues and expenses during the reporting period. The level of uncertainty in estimates and assumptions increases with the length of time until the underlying transactions are completed. As such, the most significant uncertainty in the Company’s assumptions and estimates involved in preparing the financial statements includes pension and other retiree benefit cost assumptions, stock-based compensation, asset impairments, uncertain tax positions, tax valuation allowances, legal and other contingency reserves and charges related to U.S. tax reform (see Note 11, Income Taxes). Additionally, the Company uses available market information and other valuation methodologies in assessing the fair value of financial instruments and retirement plan assets. Judgment is required in interpreting market data to develop the estimates of fair value and, accordingly, changes in assumptions or the estimation methodologies may affect the fair value estimates. Actual results could ultimately differ from those estimates.
Revenue Recognition
The Company’s revenue contracts represent a single performance obligation to sell its products to trade customers. Sales are recorded at the time control of the products is transferred to trade customers, in an amount that reflects the consideration the Company expects to be entitled to in exchange for the products. Control is the ability of trade customers to direct the “use of” and “obtain” the benefit from our products. In evaluating the timing of the transfer of control of products to trade customers, the Company considers several control indicators, including significant risks and rewards of products, the Company’s right to payment and the legal title of the products. Based on the assessment of control indicators, sales are generally recognized when products are delivered to trade customers.
Net sales reflect the transaction prices for contracts, which include units shipped at selling list prices reduced by variable consideration. Variable consideration includes expected sales returns and the cost of current and continuing promotional programs. Current promotional programs primarily include product listing allowances and co-operative advertising arrangements. Continuing promotional programs are predominantly consumer coupons and volume-based sales incentive arrangements. The cost of promotional programs is estimated using the expected value method considering all reasonably available information, including the Company’s historical experience and its current expectations, and is reflected in the transaction price when sales are recorded. Adjustments to the cost of promotional programs in subsequent periods are generally not material, as the Company’s promotional programs are typically of short duration, thereby reducing the uncertainty inherent in such estimates.
Sales returns are generally accepted at the Company’s discretion and are not material to the Company’s Consolidated Financial Statements. The Company’s contracts with trade customers do not have significant financing components or non-cash consideration and the Company does not have unbilled revenue or significant amounts of prepayments from customers. The Company records Net sales excluding taxes collected on its sales to its trade customers. Shipping and handling activities are accounted for as contract fulfillment costs and classified as Selling, general and administrative expenses.
74
COLGATE-PALMOLIVE COMPANY
Notes to Consolidated Financial Statements (continued)
(Dollars in Millions Except Share and Per Share Amounts)
Shipping and Handling Costs
Shipping and handling costs are classified as Selling, general and administrative expenses and were $1,275 , $1,255 and $1,183 for the years ended December 31, 2019, 2018 and 2017, respectively.
Marketing Costs
The Company markets its products through advertising and other promotional activities. Advertising costs are included in Selling, general and administrative expenses and are expensed as incurred. Certain consumer and trade promotional programs, such as consumer coupons, are recorded as a reduction of sales.
Cash and Cash Equivalents
The Company considers all highly liquid investments with original maturities of three months or less at the time of purchase to be cash equivalents.
Inventories
Property, Plant and Equipment
Land, buildings and machinery and equipment are stated at cost. Depreciation is provided, primarily using the straight-line method, over-estimated useful lives ranging from 3 to 15 years for machinery and equipment and up to 40 years for buildings. Depreciation attributable to manufacturing operations is included in Cost of sales. The remaining component of depreciation is included in Selling, general and administrative expenses.
Goodwill and Other Intangibles
Goodwill and indefinite life intangible assets, such as the Company’s global brands, are subject to impairment tests at least annually or when events or changes in circumstances indicate that an asset may be impaired. These tests were performed and did not result in an impairment charge. Other intangible assets with finite lives, such as local brands and trademarks, customer relationships and non-compete agreements, are amortized over their estimated useful lives, generally ranging from 5 to 40 years. Amortization expense related to intangible assets is included in Other (income) expense, net, which is included in Operating profit.
Income Taxes
The provision for income taxes is determined using the asset and liability method. Under this method, deferred tax assets and liabilities are recognized based upon the differences between the financial statement and tax bases of assets and liabilities using enacted tax rates that will be in effect at the time such differences are expected to reverse. Deferred tax assets are reduced by a valuation allowance when, in the opinion of management, it is more likely than not that some portion or all of the deferred tax assets will not be realized.
The Company uses a comprehensive model to recognize, measure, present and disclose in its financial statements uncertain tax positions that the Company has taken or expects to take on an income tax return. The Company recognizes interest expense and penalties related to unrecognized tax benefits within Provision for income taxes.
75
COLGATE-PALMOLIVE COMPANY
Notes to Consolidated Financial Statements (continued)
(Dollars in Millions Except Share and Per Share Amounts)
Derivative instruments are recorded as assets and liabilities at estimated fair value based on available market information. The Company’s derivative instruments that qualify for hedge accounting are designated as either fair value hedges, cash flow hedges or net investment hedges. For fair value hedges, changes in the fair value of the derivative, as well as the offsetting changes in the fair value of the hedged item, are recognized in earnings each period. For cash flow hedges, changes in the fair value of the derivative are recorded in Other comprehensive income (loss) and are recognized in earnings when the offsetting effect of the hedged item is also recognized in earnings. For hedges of the net investment in foreign subsidiaries, changes in the fair value of the derivative are recorded in Other comprehensive income (loss) to offset the change in the value of the net investment being hedged. Cash flows related to hedges are classified in the same category as the cash flows from the hedged item in the Consolidated Statements of Cash Flows.
The Company may also enter into certain foreign currency and interest rate instruments that economically hedge certain of its risks but do not qualify for hedge accounting. Changes in fair value of these derivative instruments, based on quoted market prices, are recognized in earnings each period. The Company’s derivative instruments and other financial instruments are more fully described in Note 7, Fair Value Measurements and Financial Instruments along with the related fair value measurement considerations.
Stock-Based Compensation
The Company recognizes the cost of employee services received in exchange for awards of equity instruments, such as stock options and restricted stock units (both performance-based and time-vested), based on the fair value of those awards at the date of grant over the requisite service period. The Company uses the Black-Scholes-Merton (“Black-Scholes”) option pricing model to estimate the fair value of stock option awards. In addition to performance conditions, performance-based restricted stock units also include a total shareholder return modifier. Because the total shareholder return modifier is considered a market condition, the Company uses a Monte-Carlo simulation model to determine the fair value of performance-based restricted stock units. The fair value of time-vested restricted stock units is determined based on the closing market price of the Company’s stock at the date of grant. Stock-based compensation plans, related expenses and assumptions used in the Black-Scholes option pricing model are more fully described in Note 8, Capital Stock and Stock-Based Compensation Plans.
Currency Translation
The assets and liabilities of foreign subsidiaries, other than those operating in highly inflationary environments, are translated into U.S. dollars at year-end exchange rates with resulting translation gains and losses accumulated in a separate component of shareholders’ equity. Income and expense items are translated into U.S. dollars at average rates of exchange prevailing during the year.
For subsidiaries operating in highly inflationary environments, local currency-denominated non-monetary assets, including inventories, goodwill and property, plant and equipment, are remeasured at their historical exchange rates, while local currency-denominated monetary assets and liabilities are remeasured at year-end exchange rates. Remeasurement adjustments for these operations are included in Net income attributable to Colgate-Palmolive Company.
Recent Accounting Pronouncements
In January 2020, the Financial Accounting Standards Board (the “FASB”) issued Accounting Standards Update (“ASU”) No. 2020-01, “Investments-Equity Securities (Topic 321), Investments-Equity Method and Joint Ventures (Topic 323), and Derivatives and Hedging (Topic 815)-Clarifying the Interactions between Topic 321, Topic 323, and Topic 815.” The guidance provides clarification of the interaction of rules for equity securities, the equity method of accounting and forward contracts and purchase options on certain types of securities. This new guidance is effective for the Company beginning on January 1, 2021, with early adoption permitted. While the Company is currently assessing the impact of the new guidance, it is not expected to have a material impact on the Company’s Consolidated Financial Statements.
76
COLGATE-PALMOLIVE COMPANY
Notes to Consolidated Financial Statements (continued)
(Dollars in Millions Except Share and Per Share Amounts)
In December 2019, the FASB issued ASU No. 2019-12, “Income taxes (Topic 740): Simplifying the Accounting for Income Taxes.” This ASU simplifies the accounting for income taxes by removing certain exceptions to the general principles in ASC 740 and also clarifies and amends existing guidance to improve consistent application. This new guidance is effective for the Company beginning on January 1, 2021, with early adoption permitted. While the Company is currently assessing the impact of the new guidance, it is not expected to have a material impact on the Company’s Consolidated Financial Statements.
In November 2019, the FASB issued ASU No. 2019-11, “Codification Improvements to Topic 326, Financial Instruments- Credit Losses.” This ASU clarifies and addresses certain items related to amendments in ASU 2016-13. This new guidance is effective for the Company beginning on January 1, 2020. This new guidance is not expected to have a material impact on the Company’s Consolidated Financial Statements.
In July 2019, the FASB issued ASU No. 2019-07, “Codification Updates to SEC Sections - Amendments to SEC Paragraphs Pursuant to SEC Final Rule Releases No. 33-10532, Disclosure Update and Simplification, and Nos. 33-10231 and 33-10442, Investment Company Reporting Modernization and Miscellaneous Updates.” ASU 2019-07 clarified or improved the disclosure and presentation requirements of a variety of codification topics by aligning them with the SEC’s regulations, thereby eliminating redundancies and making the codification easier to apply. This ASU was effective upon issuance and did not have a material impact on the Company’s Consolidated Financial Statements.
In April 2019, the FASB issued ASU No. 2019-04, “Codification Improvements to Financial Instruments-Credit Losses (Topic 326), Derivatives and Hedging (Topic 815), and Financial Instruments (Topic 825).” This ASU clarifies three topics related to financial instruments accounting. This new guidance is effective for the Company beginning on January 1, 2020. This new guidance is not expected to have a material impact on the Company’s Consolidated Financial Statements.
In October 2018, the FASB issued ASU No. 2018-16, “Derivatives and Hedging (Topic 815): Inclusion of the Secured Overnight Financing Rate (“SOFR”) Overnight Index Swap (“OIS”) Rate as Benchmark Interest Rate for Hedge Accounting Purposes.” The new guidance permits the use of the OIS rate based on the SOFR as a U.S. benchmark interest rate for hedge accounting purposes under Topic 815. This new guidance was effective for the Company on a prospective basis beginning on January 1, 2019, concurrently with the adoption of ASU 2017-12, and did not have a material impact on the Company’s Consolidated Financial Statements.
In August 2018, the FASB issued ASU No. 2018-15, “Intangibles-Goodwill and Other-Internal-Use Software (Topic 350): Customer’s Accounting for Implementation Costs Incurred in a Cloud Computing Arrangement that is a Service Contract.” This new guidance aligns the requirements for capitalizing implementation costs incurred in a hosting arrangement that is a service contract with the requirements for capitalizing implementation costs incurred to develop or obtain internal-use software. This new guidance was effective for the Company on a prospective or retrospective basis beginning on January 1, 2020, with early adoption permitted. The Company elected to adopt this guidance early, beginning on January 1, 2019 on a prospective basis. The new guidance did not have a material impact on the Company’s Consolidated Financial Statements.
In August 2018, the FASB issued ASU No. 2018-14, “Compensation-Retirement Benefits-Defined Benefit Plans-General (Topic 715): Disclosure Framework–Changes to the Disclosure Requirements for Defined Benefit Plans.” This new guidance removes certain disclosures that are not considered cost beneficial, clarifies certain required disclosures and requires certain additional disclosures. This new guidance was effective for the Company on a retrospective basis beginning on January 1, 2020, with early adoption permitted. The Company elected to adopt this guidance early, beginning on January 1, 2019, on a retrospective basis. The new guidance did not have a material impact on the Company’s Consolidated Financial Statements.
77
COLGATE-PALMOLIVE COMPANY
Notes to Consolidated Financial Statements (continued)
(Dollars in Millions Except Share and Per Share Amounts)
In August 2018, the FASB issued ASU No. 2018-13, “Fair Value Measurement (Topic 820): Disclosure Framework - Changes to the Disclosure Requirements for Fair Value Measurement.” This new guidance removes certain disclosure requirements related to the fair value hierarchy, modifies existing disclosure requirements related to measurement uncertainty and adds new disclosure requirements. The new disclosure requirements include disclosing the changes in unrealized gains and losses for the period included in other comprehensive income for recurring Level 3 fair value measurements held at the end of the reporting period and the range and weighted average of significant unobservable inputs used to develop Level 3 fair value measurements. This new guidance is effective for the Company beginning on January 1, 2020. Certain disclosure requirements in the new guidance will need to be applied on a retrospective basis and others on a prospective basis. This new guidance is not expected to have a material impact on the Company’s Consolidated Financial Statements.
In February 2018, the FASB issued ASU No. 2018-02, “Income Statement-Reporting Comprehensive Income (Topic 220): Reclassification of Certain Tax Effects from Accumulated Other Comprehensive Income” (“ASU 2018-02”), which permits the reclassification of stranded tax effects resulting from the Tax Cuts and Jobs Act (the “TCJA” or “U.S. tax reform”) from Accumulated other comprehensive income (loss) to Retained earnings. This new guidance was effective for the Company beginning on January 1, 2019, with early adoption permitted, and must be applied either in the period of adoption or retrospectively to periods in which the effects of the TCJA are recognized. The Company elected to adopt this new guidance early, beginning on January 1, 2018, and reclassified $163 during the first quarter of 2018.
In August 2017, the FASB issued ASU No. 2017-12, “Derivatives and Hedging (Topic 815): Targeted Improvements to Accounting for Hedging Activities,” amending the eligibility criteria for hedged items and transactions to expand an entity’s ability to hedge nonfinancial and financial risk components. The new guidance eliminates the requirement to separately measure and present hedge ineffectiveness and aligns the presentation of hedge gains and losses with the underlying hedge item. The new guidance also simplifies the hedge documentation and hedge effectiveness assessment requirements. The amended presentation and disclosure requirements must be adopted on a prospective basis, while any amendments to cash flow and net investment hedge relationships that exist on the date of adoption must be applied on a “modified retrospective” basis, meaning a cumulative effect adjustment to the opening balance of retained earnings as of the beginning of the year of adoption. The new guidance was effective for the Company on January 1, 2019 and did not have a material impact on the Company’s Consolidated Financial Statements.
In May 2017, the FASB issued ASU No. 2017-09, “Compensation–Stock Compensation (Topic 718): Scope of Modification Accounting,” clarifying when a change to the terms or conditions of a stock-based payment award must be accounted for as a modification. The new guidance requires modification accounting if the fair value, vesting condition or the classification of the award is not the same immediately before and after a change to the terms and conditions of the award. The new guidance was effective for the Company on a prospective basis beginning on January 1, 2018 and did not impact the Company’s Consolidated Financial Statements, as it is not the Company’s practice to change either the terms or the conditions of stock-based payment awards once they are granted.
In March 2017, the FASB issued ASU No. 2017-07, “Compensation–Retirement Benefits (Topic 715): Improving the Presentation of Net Periodic Pension Cost and Net Periodic Postretirement Benefit Cost,” changing the presentation of the net periodic benefit cost on the Statement of Income and limiting the amount of net periodic benefit cost eligible for capitalization to assets. The new guidance permits only the service cost component of net periodic benefit cost to be eligible for capitalization. The new guidance also requires entities to present the service cost component of net periodic benefit cost together with compensation costs arising from services rendered by employees during the period. The non-service related components of net periodic benefit cost, which include interest, expected return on assets, amortization of prior service costs and actuarial gains and losses, are required to be presented outside of Operating profit. The line item or items used to present the other components of net periodic benefit cost must be disclosed in the Notes to the Consolidated Financial Statements, if not separately described on the Statement of Income. The new presentation requirement was adopted on a “full retrospective” basis, meaning the standard is applied to all of the periods presented in the financial statements, while the limitation on capitalization was adopted on a prospective basis. Effective January 1, 2018, as required, the Company adopted this standard on a retrospective basis. As permitted by the new guidance, the Company used the amounts disclosed in its pension and other postretirement benefit plan note for the prior comparative periods as the basis for applying the retrospective presentation requirements. As a result, for all periods presented, only the service related component of pension and other postretirement benefit costs is included in Operating profit.
78
COLGATE-PALMOLIVE COMPANY
Notes to Consolidated Financial Statements (continued)
(Dollars in Millions Except Share and Per Share Amounts)
In January 2017, the FASB issued ASU No. 2017-04, “Intangibles-Goodwill and Other (Topic 350): Simplifying the Test for Goodwill Impairment,” eliminating the requirement to calculate implied fair value, essentially eliminating step two from the goodwill impairment test. The new standard requires goodwill impairment to be based upon the results of step one of the impairment test, which is defined as the excess of the carrying value of a reporting unit over its fair value. The impairment charge will be limited to the amount of goodwill allocated to that reporting unit. The standard is effective for the Company on a prospective basis beginning on January 1, 2020. This new guidance is expected to have no impact on the Company’s Consolidated Financial Statements.
In January 2017, the FASB issued ASU No. 2017-01, “Business Combinations (Topic 805): Clarifying the Definition of a Business,” which provides additional guidance on evaluating whether transactions should be accounted for as acquisitions of assets or businesses. The guidance requires an entity to evaluate if substantially all of the fair value of the assets acquired is concentrated in a single identifiable asset or a group of similar identifiable assets. If this threshold is met, then the new guidance would define the transaction as an asset acquisition. If the threshold is not met, then the entity would, pursuant to the guidance, evaluate whether the assets meet the requirement that a business include, at a minimum, an input and substantive process that together significantly contribute to the ability to create outputs. The guidance was effective for the Company, on a prospective basis, beginning on January 1, 2018. This new guidance had no impact on the Company’s Consolidated Financial Statements.
In August 2016, the FASB issued ASU No. 2016-15, “Statement of Cash Flows (Topic 230): Classification of Certain Cash Receipts and Cash Payments,” which clarifies how certain cash receipts and payments are to be presented in the statement of cash flows. The guidance was effective for the Company on January 1, 2018. This new guidance had no impact on the Company’s Consolidated Financial Statements.
In June 2016, the FASB issued ASU No. 2016-13, “Financial Instruments-Credit Losses (Topic 326).” This ASU introduces the current expected credit loss (CECL) model, which will require an entity to measure credit losses for certain financial instruments and financial assets, including trade receivables. Under this update, on initial recognition and at each reporting period, an entity will be required to recognize an allowance that reflects the entity’s current estimate of credit losses expected to be incurred over the life of the financial instrument. This new guidance is effective for the Company beginning on January 1, 2020 and is not expected to have a material impact on the Company’s Consolidated Financial Statements.
In February 2016, the FASB issued its final standard on lease accounting, ASU No. 2016-02, “Leases (Topic 842),” which superseded Topic 840, “Leases.” which was further modified in ASU No. 2018-10, “Codification Improvements to Topic 842, Leases,” ASU No. 2018-11, “Leases (Topic 842) Targeted Improvements” and ASU No. 2019-01 “Leases (Topic 842) Codification Improvements” to clarify the implementation guidance. The new accounting standard was effective for the Company beginning on January 1, 2019 and required the recognition on the balance sheet of right-of-use assets and lease liabilities for all long-term leases, including operating leases, on the balance sheet. The Company elected the optional transition method and adopted the new guidance on January 1, 2019, on a modified retrospective basis, with no restatement of prior period amounts. As allowed under the new accounting standard, the Company elected to apply practical expedients to carry forward the original lease determinations, lease classifications and accounting of initial direct costs for all asset classes at the time of adoption. The Company also elected not to separate lease components from non-lease components and to exclude short-term leases from its Consolidated Balance Sheet. The Company’s adoption of the new standard resulted in the recognition of right-of-use assets of $458 and liabilities of $574 , with no material cumulative effect adjustment to equity as of the date of adoption. In connection with the adoption of this guidance, as required, the Company reclassified certain restructuring reserves incurred in connection with the Global Growth and Efficiency Program and deferred rent liabilities as reductions to lease assets. Adoption of the new standard did not have a material impact on the Company’s Consolidated Statements of Income or Cash Flows. See Note 15 Leases for additional information.
79
COLGATE-PALMOLIVE COMPANY
Notes to Consolidated Financial Statements (continued)
(Dollars in Millions Except Share and Per Share Amounts)
In May 2014, the FASB and the International Accounting Standards Board issued their final converged standard on revenue recognition. The standard, issued as ASU No. 2014-09, “Revenue from Contracts with Customers (Topic 606)” by the FASB, provides a comprehensive revenue recognition model for all contracts with customers and supersedes current revenue recognition guidance. The revenue standard contains principles that an entity will apply to determine the measurement of revenue and timing of when it is recognized. The underlying principle is that an entity will recognize revenue to depict the transfer of goods or services to its customers at an amount that the entity expects to be entitled to in exchange for those goods or services. The new standard also includes enhanced disclosures. During 2016, the FASB issued several accounting updates (ASU No. 2016-08, 2016-10 and 2016-12) to clarify implementation guidance and correct unintended application of the guidance. The standard allows for either full retrospective adoption or modified retrospective adoption. The Company adopted the new standard on January 1, 2018, on a “modified retrospective” basis, which did not have a material impact on the Company’s Consolidated Financial Statements. As required, the Company recognized the cumulative effect of initially applying the new revenue standard as an adjustment to the 2018 opening balance of retained earnings. Results for periods beginning on or after January 1, 2018 are presented under Topic 606, “Revenue from Contracts with Customers,” while prior period amounts are not adjusted and continue to be reported in accordance with the prior accounting guidance under Topic 605, “Revenue Recognition.”
Reclassifications
80
COLGATE-PALMOLIVE COMPANY
Notes to Consolidated Financial Statements (continued)
(Dollars in Millions Except Share and Per Share Amounts)
3. Acquisitions
Acquisition of Laboratoires Filorga Cosmétiques ("Filorga")
On September 19, 2019 (the "Acquisition Date"), the Company acquired the Filorga skin health business for cash consideration of €1,516 (approximately $1,674 ), which included interest on the equity purchase price plus additional consideration of €32 (approximately $38 ), the majority of which related to repayment of loans from former shareholders of Filorga. Filorga is a premium anti-aging skin health brand focused primarily on facial care. This acquisition is part of the Company's strategy to focus on high growth segments within its Oral Care, Personal Care and Pet Nutrition businesses, including by expanding its portfolio in premium skin health.
The total purchase price consideration of $1,712 million has been allocated to the net assets acquired based on their respective estimated fair values as follows:
Cash | $ | ||
Receivables | |||
Inventories | |||
Other current assets | |||
Other intangible assets | |||
Goodwill | |||
Other current liabilities | ( | ) | |
Deferred income taxes | ( | ) | |
Noncontrolling interests | ( | ) | |
Fair value of net assets acquired | $ | ||
Other intangible assets acquired include trademarks of $774 , which are considered to have an indefinite useful life, and customer relationships of $277 , which have an estimated life of 14 years. Goodwill of $923 was allocated to the Europe segment. The Company expects that goodwill will not be deductible for tax purposes.
The preliminary estimates of the fair value of identifiable assets acquired and liabilities assumed are subject to revisions, which may result in adjustments to the preliminary values discussed above. The Company continues to evaluate potential contingencies that may have existed as of the acquisition date and expects to finalize the purchase price allocation no later than the third quarter of 2020.
In the fourth quarter of 2019, the Company revised its estimates of the fair value of intangible assets acquired and increased other intangible assets by $105 with a corresponding reduction to goodwill.
The results of operations of Filorga are reported on a lag basis. As such, Filorga’s results of operations from the Acquisition Date through November 30, 2019 are included in the Company’s Consolidated Results of Operations for the period ended December 31, 2019.
Pro forma results of operations have not been presented as the impact on the Company’s Consolidated Financial Statements is not material.
Nigeria Joint Venture
On August 15, 2019, the Company acquired a 51 % controlling interest in Colgate Tolaram Pte. Ltd., a joint venture which owns the Nigeria-based Hypo Homecare Products Limited, for $31 .
Pro forma results of operations have not been presented as the impact on the Company’s Consolidated Financial Statements is not material.
81
COLGATE-PALMOLIVE COMPANY
Notes to Consolidated Financial Statements (continued)
(Dollars in Millions Except Share and Per Share Amounts)
Physicians Care Alliance, LLC and Elta MD Holdings, Inc.
In January 2018, the Company acquired all of the outstanding equity interests of Physicians Care Alliance, LLC (“PCA Skin”) and Elta MD Holdings, Inc. (“Elta MD”), professional skin health businesses, for aggregate cash consideration of approximately $730 . With these acquisitions, the Company entered the professional skin health category, which complements its existing global personal care businesses and resulted in the recognition of additional goodwill.
Total purchase price consideration of $730 has been allocated to the net assets acquired based on their respective estimated fair values as follows:
Recognized amounts of assets acquired and liabilities assumed: | |||
Inventories | $ | ||
Other current assets | |||
Other intangible assets | |||
Goodwill | |||
Other current liabilities | ( | ) | |
Deferred income taxes | ( | ) | |
Fair value of net assets acquired | $ | ||
Other intangible assets acquired primarily include trademarks of $231 with useful lives of 25 years and customer relationships of $133 with useful lives ranging from 12 to 13 years.
Goodwill of $397 was allocated to the North America segment. The Company expects that approximately 45 % of the goodwill will be deductible for tax purposes.
Pro forma results of operations have not been presented as the impact on the Company's Consolidated Financial Statements is not material.
Hello Products LLC
On January 31, 2020, the Company acquired Hello Products LLC, an oral care business, for cash consideration of $351 . The acquisition was financed with a combination of debt and cash. This acquisition is part of the Company's strategy to focus on high growth segments within its Oral Care, Personal Care and Pet Nutrition businesses.
82
COLGATE-PALMOLIVE COMPANY
Notes to Consolidated Financial Statements (continued)
(Dollars in Millions Except Share and Per Share Amounts)
4. Restructuring and Related Implementation Charges
In the fourth quarter of 2012, the Company commenced a restructuring program (the “Global Growth and Efficiency Program”), which was expanded in 2014, expanded and extended in each of 2015 and 2017, and expanded again in 2019 to take advantage of additional savings opportunities near the end of the program. The program concluded on December 31, 2019.
Initiatives under the Global Growth and Efficiency Program fit within the program’s three focus areas of expanding commercial hubs, extending shared business services and streamlining global functions and optimizing the global supply chain and facilities.
At the conclusion of the Global Growth and Efficiency Program, total pretax charges were $1,854 ($1,380 aftertax). The Company incurred pretax charges for 2019 of $132 ($102 aftertax).
Total pretax charges resulting from the Global Growth and Efficiency Program were comprised of the following categories: Employee-Related Costs, including severance, pension and other termination benefits (40 %); asset-related costs, primarily Incremental Depreciation and Asset Impairments (10 %); and Other charges, which include contract termination costs, consisting primarily of related implementation charges resulting directly from exit activities (30 %) and the implementation of new strategies (20 %). Over the course of the Global Growth and Efficiency Program, approximately 80 % of the charges resulted in cash expenditures.
Total pretax charges related to initiatives undertaken in North America (15 %), Europe (20 %), Latin America (5 %), Asia Pacific (5 %), Africa/Eurasia (5 %), Hill’s Pet Nutrition (10 %) and Corporate (40 %) included substantially all of the costs related to the implementation of new strategies, noted above, on a global basis. The Global Growth and Efficiency Program contributed a net reduction of approximately 4,400 positions from the Company’s global employee workforce.
For the years ended December 31, 2019, 2018 and 2017, restructuring and related implementation charges are reflected in the Consolidated Statements of Income as follows:
2019 | 2018 | 2017 | |||||||||
Cost of sales | $ | $ | $ | ||||||||
Selling, general and administrative expenses | |||||||||||
Other (income) expense, net | |||||||||||
Non-service related postretirement costs | |||||||||||
Total Global Growth and Efficiency Program charges, pretax | $ | $ | $ | ||||||||
Total Global Growth and Efficiency Program charges, aftertax | $ | $ | $ | ||||||||
Restructuring and related implementation charges in the preceding table are recorded in the Corporate segment as these initiatives are predominantly centrally directed and controlled and are not included in internal measures of segment operating performance.
83
COLGATE-PALMOLIVE COMPANY
Notes to Consolidated Financial Statements (continued)
(Dollars in Millions Except Share and Per Share Amounts)
Total charges incurred for the Global Growth and Efficiency Program related to initiatives undertaken by the following reportable operating segments:
Total Program | |||||||||||
2019 | 2018 | 2017 | Charges | ||||||||
North America | % | % | % | % | |||||||
Latin America | % | % | % | % | |||||||
Europe | % | ( | )% | % | % | ||||||
Asia Pacific | % | % | % | % | |||||||
Africa/Eurasia | ( | )% | % | % | % | ||||||
Hill’s Pet Nutrition | % | % | % | % | |||||||
Corporate | % | % | % | % | |||||||
Total | % | % | % | % | |||||||
Over the course of the Global Growth and Efficiency Program, the Company incurred total pretax charges of $1,854 ($1,380 aftertax) in connection with the implementation of various projects as follows:
Total Program Charges | |||
as of December 31, 2019 | |||
Employee-Related Costs | $ | ||
Incremental Depreciation | |||
Asset Impairments | |||
Other | |||
Total | $ | ||
Over the course of the Global Growth and Efficiency Program, the majority of the costs incurred related to the following projects: the implementation of the Company’s overall hubbing strategy; the consolidation of facilities; the extension of shared business services and streamlining of global functions; the closing of the Morristown, New Jersey personal care facility; the simplification and streamlining of the Company’s research and development capabilities and oral care supply chain, both in Europe; redesigning the European commercial organization; restructuring how the Company will provide future retirement benefits to substantially all of the U.S.-based employees participating in the Company’s defined benefit retirement plan by shifting them to the Company’s defined contribution plan; and the implementation of a Corporate efficiencies program.
84
COLGATE-PALMOLIVE COMPANY
Notes to Consolidated Financial Statements (continued)
(Dollars in Millions Except Share and Per Share Amounts)
The following table summarizes the activity for the restructuring and related implementation charges, in the respective periods, discussed above and the related accruals:
Employee-Related Costs | Incremental Depreciation | Asset Impairments | Other | Total | ||||||||||||||||
Balance at January 1, 2017 | $ | $ | $ | $ | $ | |||||||||||||||
Charges | ||||||||||||||||||||
Cash payments | ( | ) | ( | ) | ( | ) | ||||||||||||||
Charges against assets | ( | ) | ( | ) | ( | ) | ( | ) | ||||||||||||
Foreign exchange | ||||||||||||||||||||
Other | ||||||||||||||||||||
Balance at December 31, 2017 | $ | $ | $ | $ | $ | |||||||||||||||
Charges | ||||||||||||||||||||
Cash payments | ( | ) | ( | ) | ( | ) | ||||||||||||||
Charges against assets | ( | ) | ( | ) | ( | ) | ( | ) | ||||||||||||
Foreign exchange | ( | ) | ( | ) | ||||||||||||||||
Other | ||||||||||||||||||||
Balance at December 31, 2018 | $ | $ | $ | $ | $ | |||||||||||||||
Charges | ||||||||||||||||||||
Cash payments | ( | ) | ( | ) | ( | ) | ||||||||||||||
Charges against assets | ( | ) | ( | ) | ( | ) | ( | ) | ( | ) | ||||||||||
Foreign exchange | ||||||||||||||||||||
Other | ( | ) | ( | ) | ||||||||||||||||
Balance at December 31, 2019 | $ | $ | $ | $ | $ | |||||||||||||||
Employee-Related Costs primarily included severance and other termination benefits and were calculated based on long-standing benefit practices, local statutory requirements and, in certain cases, voluntary termination arrangements. Employee-Related Costs also included pension and other retiree benefit enhancements amounting to $7 , $9 and $21 for the years ended December 31, 2019, 2018 and 2017, respectively, which are reflected as Charges against assets within Employee-Related Costs in the preceding table as the corresponding balance sheet amounts are reflected as a reduction of pension assets or an increase in pension and other retiree benefit liabilities. See Note 10, Retirement Plans and Other Retiree Benefits for additional information.
Incremental Depreciation was recorded to reflect changes in useful lives and estimated residual values for long-lived assets that will be taken out of service prior to the end of their normal service period. Asset Impairments were recorded to write down inventories and assets held for sale or disposal to their fair value based on amounts expected to be realized. Charges against assets within Asset Impairments are net of cash proceeds pertaining to the sale of certain assets.
Other charges consisted primarily of charges resulting directly from exit activities and the implementation of new strategies as a result of the Global Growth and Efficiency Program. These charges for the years ended December 31, 2019, 2018 and 2017 included third-party incremental costs related to the development and implementation of new business and strategic initiatives of $32 , $42 and $145 , respectively, and contract termination costs and charges resulting directly from exit activities of $5 , $48 and $6 , respectively. These charges were expensed as incurred. Also included in Other charges for the year ended December 31, 2019 were other exit costs of $28 related to the consolidation of facilities.
Other decreases to the restructuring accruals reflect the reclassification of restructuring accruals to lease assets as a result of the Company's adoption of ASU No. 2018-10, "Codification Improvement to Topic 842, Leases," on January 1, 2019. See Note 2, Summary of Significant Accounting Policies and Note 15 Leases for additional information.
85
COLGATE-PALMOLIVE COMPANY
Notes to Consolidated Financial Statements (continued)
(Dollars in Millions Except Share and Per Share Amounts)
5. Goodwill and Other Intangible Assets
The net carrying value of Goodwill as of December 31, 2019 and 2018 by segment was as follows:
2019 | 2018 | |||||||
Oral, Personal and Home Care | ||||||||
North America | $ | $ | ||||||
Latin America | ||||||||
Europe | ||||||||
Asia Pacific | ||||||||
Africa/Eurasia | ||||||||
Total Oral, Personal and Home Care | ||||||||
Pet Nutrition | ||||||||
Total Goodwill | $ | $ | ||||||
The change in the amount of Goodwill during 2019 is primarily due to the acquisition of Filorga (see Note 3, Acquisitions for further information) and the impact of foreign currency translation.
Other intangible assets as of December 31, 2019 and 2018 were comprised of the following:
2019 | 2018 | |||||||||||||||||||||||
Gross Carrying Amount | Accumulated Amortization | Net | Gross Carrying Amount | Accumulated Amortization | Net | |||||||||||||||||||
Trademarks - finite life | $ | $ | ( | ) | $ | $ | $ | ( | ) | $ | ||||||||||||||
Other finite life intangible assets | ( | ) | ( | ) | ||||||||||||||||||||
Indefinite life intangible assets | — | — | ||||||||||||||||||||||
Total Other intangible assets | $ | $ | ( | ) | $ | $ | $ | ( | ) | $ | ||||||||||||||
86
COLGATE-PALMOLIVE COMPANY
Notes to Consolidated Financial Statements (continued)
(Dollars in Millions Except Share and Per Share Amounts)
6. Long-Term Debt and Credit Facilities
Long-term debt consisted of the following at December 31:
Weighted Average Interest Rate | Maturities | 2019 | 2018 | |||||||||||
Notes | 2021 | - | 2078 | $ | $ | |||||||||
Commercial paper | ( | 2020 | ||||||||||||
Finance Lease Obligations | Various | Various | ||||||||||||
Less: Current portion of long-term debt | ( | ) | ||||||||||||
Total | $ | $ | ||||||||||||
The weighted-average interest rate on short-term borrowings included in Notes and loans payable in the Consolidated Balance Sheets as of December 31, 2019 and 2018 was 1.8 % and 5.3 %, respectively.
The Company classifies commercial paper and notes maturing within the next twelve months as long-term debt when it has the intent and ability to refinance such obligations on a long-term basis. Excluding such obligations, scheduled maturities of long-term debt and finance leases outstanding as of December 31, 2019, were as follows:
Years Ended December 31, | |||
2020 | $ | ||
2021 | |||
2022 | |||
2023 | |||
2024 | |||
Thereafter | |||
The Company has entered into interest rate swap agreements and foreign exchange contracts related to certain of these debt instruments. See Note 7, Fair Value Measurements and Financial Instruments for further information about the Company’s financial instruments.
The Company’s debt issuances support its capital structure strategy objectives of funding its business and growth initiatives while minimizing its risk-adjusted cost of capital. During the first quarter of 2019, the Company issued €500 of seven-year notes at a fixed coupon rate of 0.500 % and €500 of fifteen-year notes at a fixed coupon rate of 1.375 %. During the fourth quarter of 2019, the Company issued €500 of two-year notes at a fixed coupon rate of 0.000 % and €500 of twenty-year notes at a fixed coupon rate of 0.875 %. The debt issuances were under the Company’s shelf registration statement. Proceeds from the debt issuances were used for general corporate purposes, which included the retirement of commercial paper and, in the case of the debt issuances in the first quarter of 2019, the repayment of the Company’s $500 1.75 % fixed rate notes, which became due in March 2019, and €500 floating rate notes, which became due May 2019.
At December 31, 2019, the Company had access to unused domestic and foreign lines of credit of $4,594 (including under the facilities discussed below) and could also issue medium-term notes pursuant to an effective shelf registration statement. In November 2018, the Company entered into an amended and restated $2,650 revolving credit facility with a syndicate of banks that was scheduled to expire in November 2023. In August 2019, the term of the facility was extended by one year and it now expires in November 2024. In August 2019, the Company entered into a $1,500 364-day credit facility with a syndicate of banks that is scheduled to expire in August 2020. Commitment fees related to the credit facilities are not material.
87
COLGATE-PALMOLIVE COMPANY
Notes to Consolidated Financial Statements (continued)
(Dollars in Millions Except Share and Per Share Amounts)
Certain agreements with respect to the Company’s bank borrowings contain financial and other covenants as well as cross-default provisions. Noncompliance with these requirements could ultimately result in the acceleration of amounts owed. The Company is in full compliance with all such requirements and believes the likelihood of noncompliance is remote.
88
COLGATE-PALMOLIVE COMPANY
Notes to Consolidated Financial Statements (continued)
(Dollars in Millions Except Share and Per Share Amounts)
7. Fair Value Measurements and Financial Instruments
The Company uses available market information and other valuation methodologies in assessing the fair value of financial instruments. Judgment is required in interpreting market data to develop the estimates of fair value and, accordingly, changes in assumptions or the estimation methodologies may affect the fair value estimates. The Company is exposed to the risk of credit loss in the event of nonperformance by counterparties to financial instrument contracts; however, nonperformance is considered unlikely and any nonperformance is unlikely to be material, as it is the Company’s policy to contract only with diverse, credit-worthy counterparties based upon both strong credit ratings and other credit considerations.
The Company is exposed to market risk from foreign currency exchange rates, interest rates and commodity price fluctuations. Volatility relating to these exposures is managed on a global basis by utilizing a number of techniques, including working capital management, sourcing strategies, selling price increases, selective borrowings in local currencies and entering into selective derivative instrument transactions, issued with standard features, in accordance with the Company’s treasury and risk management policies, which prohibit the use of derivatives for speculative purposes and leveraged derivatives for any purpose. It is the Company’s policy to enter into derivative instrument contracts with terms that match the underlying exposure being hedged. Provided below are details of the Company’s exposures by type of risk and derivative instruments by type of hedge designation.
Valuation Considerations
The Company’s derivative instruments include interest rate swap contracts, foreign currency contracts and commodity contracts. The Company utilizes interest rate swap contracts to manage its targeted mix of fixed and floating rate debt, and these swaps are classified as follows:
Level 1: Based upon quoted market prices in active markets for identical assets or liabilities.
Level 2: Based upon observable market-based inputs or unobservable inputs that are corroborated by market data.
Level 3: Based upon unobservable inputs reflecting the reporting entity’s own assumptions.
Foreign Exchange Risk
As the Company markets its products in over 200 countries and territories, it is exposed to currency fluctuations related to manufacturing and selling its products in currencies other than the U.S. dollar. The Company manages its foreign currency exposures through a combination of cost containment measures, sourcing strategies, selling price increases and the hedging of certain costs in an effort to minimize the impact on earnings of foreign currency rate movements.
The Company primarily utilizes foreign currency contracts, including forward and swap contracts, option contracts, foreign and local currency deposits and local currency borrowings to hedge portions of its foreign currency purchases, assets and liabilities arising in the normal course of business and the net investment in certain foreign subsidiaries. The duration of foreign currency contracts generally does not exceed 12 months and the contracts are valued using observable market rates (Level 2 valuation).
Interest Rate Risk
The Company manages its targeted mix of fixed and floating rate debt with debt issuances and by entering into interest rate swaps in order to mitigate fluctuations in earnings and cash flows that may result from interest rate volatility. The notional amount, interest payment and maturity date of the swaps generally match the principal, interest payment and maturity date of the related debt, and the swaps are valued using observable benchmark rates (Level 2 valuation).
89
COLGATE-PALMOLIVE COMPANY
Notes to Consolidated Financial Statements (continued)
(Dollars in Millions Except Share and Per Share Amounts)
Commodity Price Risk
The Company is exposed to price volatility related to raw materials used in production, such as resins, essential oils, pulp, tropical oils, tallow, poultry, corn and soybeans. The Company manages its raw material exposures through a combination of cost containment measures, sourcing strategies, ongoing productivity initiatives and the limited use of commodity hedging contracts. Futures contracts are used on a limited basis, primarily in the Hill’s Pet Nutrition segment, to manage volatility related to raw material inventory purchases of certain traded commodities, and these contracts are measured using quoted commodity exchange prices (Level 1 valuation). The duration of the commodity contracts generally does not exceed 12 months.
Credit Risk
The Company is exposed to the risk of credit loss in the event of nonperformance by counterparties to financial instrument contracts; however, nonperformance is considered unlikely and any nonperformance is unlikely to be material as it is the Company’s policy to contract with diverse, credit-worthy counterparties based upon both strong credit ratings and other credit considerations.
The company adopted ASU No. 2017-12, "Derivatives and Hedging (Topic 815): Targeted Improvements to Accounting for Hedging Activities," beginning on January 1, 2019. Refer to Note 2, Summary of Significant Accounting Policies.
The following table summarizes the fair value of the Company’s derivative instruments and other financial instruments which are carried at fair value in the Company’s Consolidated Balance Sheets as of December 31, 2019 and December 31, 2018:
Assets | Liabilities | ||||||||||||||||||
Account | Fair Value | Account | Fair Value | ||||||||||||||||
Designated derivative instruments | December 31, 2019 | December 31, 2018 | December 31, 2019 | December 31, 2018 | |||||||||||||||
Interest rate swap contracts | Other current assets | $ | $ | Other accruals | $ | $ | |||||||||||||
Interest rate swap contracts | Other assets | Other liabilities | |||||||||||||||||
Foreign currency contracts | Other current assets | Other accruals | |||||||||||||||||
Foreign currency contracts | Other assets | Other liabilities | |||||||||||||||||
Commodity contracts | Other current assets | Other accruals | |||||||||||||||||
Total designated | $ | $ | $ | $ | |||||||||||||||
Other financial instruments | |||||||||||||||||||
Marketable securities | Other current assets | ||||||||||||||||||
Total other financial instruments | $ | $ | |||||||||||||||||
90
COLGATE-PALMOLIVE COMPANY
Notes to Consolidated Financial Statements (continued)
(Dollars in Millions Except Share and Per Share Amounts)
The carrying amount of cash, cash equivalents, accounts receivable and short-term debt approximated fair value as of December 31, 2019 and 2018. The estimated fair value of the Company’s long-term debt, including the current portion, as of December 31, 2019 and 2018, was $8,056 and $6,434 , respectively, and the related carrying value was $7,587 and $6,354 , respectively. The estimated fair value of long-term debt was derived principally from quoted prices on the Company’s outstanding fixed-term notes (Level 2 valuation).
The following amounts were recorded on the Consolidated Balance Sheet related to cumulative basis adjustment for fair value hedges as of:
December 31, 2019 | December 31, 2018 | ||||||
Long-term debt: | |||||||
Carrying amount of hedged item | $ | $ | |||||
Cumulative hedging adjustment included in the carrying amount | $ | $ | ( | ) | |||
The following tables present the notional values as of:
December 31, 2019 | |||||||||||||||||||
Foreign Currency Contracts | Foreign Currency Debt | Interest Rate Swaps | Commodity Contracts | Total | |||||||||||||||
Fair Value Hedges | $ | $ | $ | $ | $ | ||||||||||||||
Cash Flow Hedges | $ | $ | $ | $ | $ | ||||||||||||||
Net Investment Hedges | $ | $ | $ | $ | $ | ||||||||||||||
December 31, 2018 | |||||||||||||||||||
Foreign Currency Contracts | Foreign Currency Debt | Interest Rate Swaps | Commodity Contracts | Total | |||||||||||||||
Fair Value Hedges | $ | $ | $ | $ | $ | ||||||||||||||
Cash Flow Hedges | $ | $ | $ | $ | $ | ||||||||||||||
Net Investment Hedges | $ | $ | $ | $ | $ | ||||||||||||||
91
COLGATE-PALMOLIVE COMPANY
Notes to Consolidated Financial Statements (continued)
(Dollars in Millions Except Share and Per Share Amounts)
The following table presents the location and amount of gains (losses) recognized on the Company’s Consolidated Statements of Income:
Twelve Months Ended December 31, | |||||||||||||||||||||||
2019 | 2018 | ||||||||||||||||||||||
Cost of sales | Selling, general and administrative expenses | Interest (income) expense, net | Cost of sales | Selling, general and administrative expenses | Interest (income) expense, net | ||||||||||||||||||
Gain (loss) on hedges recognized in income: | |||||||||||||||||||||||
Interest rate swaps designated as fair value hedges: | |||||||||||||||||||||||
Derivative instrument | $ | $ | $ | ( | ) | $ | $ | $ | ( | ) | |||||||||||||
Hedged items | |||||||||||||||||||||||
Foreign currency contracts designated as fair value hedges: | |||||||||||||||||||||||
Derivative instrument | ( | ) | |||||||||||||||||||||
Hedged items | ( | ) | |||||||||||||||||||||
Foreign currency contracts designated as cash flow hedges: | |||||||||||||||||||||||
Amount reclassified from OCI | ( | ) | |||||||||||||||||||||
Commodity contracts designated as cash flow hedges: | |||||||||||||||||||||||
Amount reclassified from OCI | |||||||||||||||||||||||
Total gain (loss) on hedges recognized in income | $ | $ | $ | $ | ( | ) | $ | $ | |||||||||||||||
92
COLGATE-PALMOLIVE COMPANY
Notes to Consolidated Financial Statements (continued)
(Dollars in Millions Except Share and Per Share Amounts)
The following table presents the location and amount of unrealized gains (losses) included in OCI:
Twelve Months Ended | |||||||
December 31, | |||||||
2019 | 2018 | ||||||
Foreign currency contracts designated as cash flow hedges: | |||||||
Gain (loss) recognized in OCI | ( | ) | |||||
Commodity contracts designated as cash flow hedges: | |||||||
Gain (loss) recognized in OCI | |||||||
Foreign currency contracts designated as net investment hedges: | |||||||
Gain (loss) on instruments | |||||||
Gain (loss) on hedged items | ( | ) | ( | ) | |||
Foreign currency debt designated as net investment hedges: | |||||||
Gain (loss) on instruments | |||||||
Gain (loss) on hedged items | ( | ) | ( | ) | |||
Total unrealized gain (loss) on hedges recognized in OCI | $ | ( | ) | $ | |||
93
COLGATE-PALMOLIVE COMPANY
Notes to Consolidated Financial Statements (continued)
(Dollars in Millions Except Share and Per Share Amounts)
8. Capital Stock and Stock-Based Compensation Plans
Preference Stock
The Company has the authority to issue 50,262,150 shares of preference stock.
Stock Repurchases
On June 18, 2018, the Board authorized the repurchase of shares of the Company’s common stock having an aggregate purchase price of up to $5 billion under a new share repurchase program (the “2018 Program”), which replaced a previously authorized share repurchase program (the “2015 Program”). The Company commenced repurchases of shares of the Company’s common stock under the 2018 Program beginning June 19, 2018. The Board also has authorized share repurchases on an ongoing basis to fulfill certain requirements of the Company’s compensation and benefit programs. The shares are repurchased from time to time in open market or privately negotiated transactions at the Company’s discretion, subject to market conditions, customary blackout periods and other factors. The Company repurchased its common stock at a cost of $1,202 during 2019 under the 2018 Program.
The Company may use either authorized and unissued shares or treasury shares to meet share requirements resulting from the exercise of stock options and the vesting of restricted stock unit awards.
A summary of common stock and treasury stock activity for the three years ended December 31 is as follows:
Common Stock Outstanding | Treasury Stock | |||||
Balance, January 1, 2017 | ||||||
Common stock acquired | ( | ) | ||||
Shares issued for stock options | ( | ) | ||||
Shares issued for restricted stock units and other | ( | ) | ||||
Balance, December 31, 2017 | ||||||
Common stock acquired | ( | ) | ||||
Shares issued for stock options | ( | ) | ||||
Shares issued for restricted stock units and other | ( | ) | ||||
Balance, December 31, 2018 | ||||||
Common stock acquired | ( | ) | ||||
Shares issued for stock options | ( | ) | ||||
Shares issued for restricted stock units and other | ( | ) | ||||
Balance, December 31, 2019 | ||||||
94
COLGATE-PALMOLIVE COMPANY
Notes to Consolidated Financial Statements (continued)
(Dollars in Millions Except Share and Per Share Amounts)
Stock-Based Compensation
The Company recognizes the cost of employee services received in exchange for awards of equity instruments, such as stock options and restricted stock units, based on the fair value of those awards at the date of grant. The fair value of restricted stock units, generally based on market prices, is amortized on a straight-line basis over the requisite service period. The estimated fair value of stock options on the date of grant is amortized on a straight-line basis over the requisite service period for each separately vesting portion of the award. Awards to employees eligible for retirement prior to the award becoming fully vested are recognized as compensation cost from the grant date through the date that the employee first becomes eligible to retire and is no longer required to provide service to earn the award.
The Company has one incentive compensation plan pursuant to which it issues restricted stock units (both performance-based and time-vested) and stock options to employees and shares of common stock and stock options to non-employee directors. The Personnel and Organization Committee of the Board of Directors, which is comprised entirely of independent directors, administers the incentive compensation plan. The total stock-based compensation expense charged against pretax income for this plan was $100 , $109 and $127 for the years ended December 31, 2019, 2018 and 2017, respectively. The total income tax benefit recognized on stock-based compensation, excluding excess tax benefits discussed below, was approximately $20 , $25 and $42 for the years ended December 31, 2019, 2018 and 2017, respectively.
Stock-based compensation expense is recorded within Selling, general and administrative expenses in the Corporate segment as these amounts are not included in internal measures of segment operating performance.
The Company uses the Black-Scholes option pricing model to estimate the fair value of stock option awards. The weighted-average estimated fair value of stock options granted in the years ended December 31, 2019, 2018 and 2017 was $10.48 , $9.48 and $8.37 , respectively. Fair value is estimated using the Black-Scholes option pricing model with the assumptions summarized in the following table:
2019 | 2018 | 2017 | |||||||
Expected term of options | |||||||||
Expected volatility rate | % | % | % | ||||||
Risk-free interest rate | % | % | % | ||||||
Expected dividend yield | % | % | % | ||||||
The weighted-average expected term of options granted each year was determined with reference to historical exercise and post-vesting cancellation experience, the vesting period of the awards and the contractual term of the awards, among other factors. Expected volatility incorporates implied share-price volatility derived from exchange traded options on the Company’s common stock. The risk-free interest rate for the expected term of the option is based on the yield of a zero-coupon U.S. Treasury bond with a maturity period equal to the option’s expected term.
95
COLGATE-PALMOLIVE COMPANY
Notes to Consolidated Financial Statements (continued)
(Dollars in Millions Except Share and Per Share Amounts)
Performance-based Restricted Stock Units
In 2019, the Company evolved its approach to granting long-term incentive compensation, mainly from granting time-vested restricted stock units following the conclusion of a three-year performance cycle to granting officers and other key employees a target number of unearned performance-based restricted stock units at the beginning of each three-year performance cycle. Awards are earned and vest following the conclusion of the performance period on the basis of achievement of performance goals established at the commencement of each three-year performance period.
A summary of performance-based restricted stock unit activity during 2019 is presented below:
Shares (in thousands) | Grant Date Fair Value Per Award | ||||||
Performance-based restricted stock units as of January 1, 2019 | $ | ||||||
Activity: | |||||||
Granted | |||||||
Forfeited | ( | ) | |||||
Performance-based restricted stock units as of December 31, 2019 | $ | ||||||
As of December 31, 2019, there was $17 of total unrecognized compensation expense related to unvested performance-based restricted stock unit awards, which will be recognized rateably over the remaining performance period.
The Company uses a Monte-Carlo simulation model to estimate the fair value of performance-based restricted stock units at the date of grant.
Time-Vested Restricted Stock Units
The Company also grants time-vested restricted stock unit awards. As described above, under the Company’s previous long-term incentive program, time-vested restricted stock unit awards were also granted to officers and other key employees following a three-year performance period. Awards vest at the end of the restriction period, which is three years from the date of grant. The last award granted under the previous long-term incentive program was in 2018 for the 2015-2017 performance period. No awards were granted for the 2016-2018 or 2017-2019 performance periods. Awards for the 2018-2020 performance period, if earned, will be granted in 2021. As of December 31, 2019, approximately 13,200,000 shares of common stock were available for future restricted stock unit awards.
A summary of restricted stock unit activity during 2019 is presented below:
Shares (in thousands) | Weighted Average Grant Date Fair Value Per Award | ||||||
Restricted stock units as of January 1, 2019 | $ | ||||||
Activity: | |||||||
Granted | |||||||
Vested | ( | ) | |||||
Forfeited | ( | ) | |||||
Restricted stock units as of December 31, 2019 | $ | ||||||
As of December 31, 2019, there was $44 of total unrecognized compensation expense related to unvested restricted stock unit awards, which will be recognized over a weighted-average period of 2.2 years. The total fair value of restricted stock units vested during the years ended December 31, 2019, 2018 and 2017 was $53 , $55 and $66 , respectively.
96
COLGATE-PALMOLIVE COMPANY
Notes to Consolidated Financial Statements (continued)
(Dollars in Millions Except Share and Per Share Amounts)
Stock Options
The Company issues non-qualified stock options to non-employee directors, officers and other employees. Beginning in 2019, stock options generally have a contractual term of eight years . Prior to 2019, stock options generally had a contractual term of six years . Stock options vest ratably over three years . As of December 31, 2019, approximately 37,758,000 shares of common stock were available for future stock option grants.
A summary of stock option activity during 2019 is presented below:
Shares (in thousands) | Weighted Average Exercise Price | Weighted Average Remaining Contractual Life (in years) | Intrinsic Value of Unexercised In-the-Money Options | ||||||||||
Options outstanding, January 1, 2019 | $ | ||||||||||||
Granted | |||||||||||||
Exercised | ( | ) | |||||||||||
Forfeited or expired | ( | ) | |||||||||||
Options outstanding, December 31, 2019 | $ | ||||||||||||
Options exercisable, December 31, 2019 | $ | $ | |||||||||||
As of December 31, 2019, there was $32 of total unrecognized compensation expense related to unvested options, which will be recognized over a weighted-average period of 1.5 years. The total intrinsic value of options exercised during the years ended December 31, 2019, 2018 and 2017 was $84 , $92 and $201 , respectively.
The benefits of tax deductions in excess of grant date fair value resulting from the exercise of stock options and vesting of restricted stock unit awards for the years ended December 31, 2019, 2018 and 2017 were $6 , $12 and $47 , respectively, and are recognized in the provision for income taxes as a discrete item in the quarterly period in which they occur and classified as an operating cash flow. Cash proceeds received from options exercised for the years ended December 31, 2019, 2018 and 2017 were $498 , $329 and $507 , respectively.
9. Employee Stock Ownership Plan
In 1989, the Company expanded its Employee Stock Ownership Plan (“ESOP”) through the introduction of a leveraged ESOP that funds certain benefits for employees who have met eligibility requirements. As of December 31, 2019 and 2018, there were 13,359,448 and 15,806,529 shares of common stock, respectively, outstanding and issued to the Company’s ESOP.
During 2000, the ESOP entered into a loan agreement with the Company under which the benefits of the ESOP may be extended through 2035. As of December 31, 2019, the ESOP had outstanding borrowings from the Company of $2 , which represents unearned compensation shown as a reduction in Shareholders’ equity.
Dividends on stock held by the ESOP are paid to the ESOP trust and, together with cash contributions from the Company, are (a) used by the ESOP to repay principal and interest, (b) credited to participant accounts or (c) used for contributions to the Company’s defined contribution plans. Stock is allocated to participants based upon the ratio of the current year’s debt service to the sum of total outstanding principal and interest payments over the life of the debt. As of December 31, 2019, 11,651,749 shares of common stock had been released and allocated to participant accounts and 1,707,699 shares of common stock were available for future allocation to participant accounts.
97
COLGATE-PALMOLIVE COMPANY
Notes to Consolidated Financial Statements (continued)
(Dollars in Millions Except Share and Per Share Amounts)
Dividends on the stock used to repay principal and interest or credited to participant accounts are deductible for income tax purposes and, accordingly, are reflected net of their tax benefit in the Consolidated Statements of Changes in Shareholders’ Equity.
Annual expense related to the ESOP was $0 in 2019, 2018 and 2017.
The Company paid dividends on the shares held by the ESOP of $25 in 2019, $29 in 2018 and $32 in 2017. The Company did no t make any contributions to the ESOP in 2019, 2018 or 2017.
10. Retirement Plans and Other Retiree Benefits
Retirement Plans
The Company and certain of its U.S. and foreign subsidiaries maintain defined benefit retirement plans. Benefits under these plans are based primarily on years of service and employees’ earnings.
In the U.S., effective January 1, 2014, the Company provides virtually all future retirement benefits through the Company’s defined contribution plan. As a result, service after December 31, 2013 is not considered for participants in the Company’s principal U.S. defined benefit retirement plan. Participants in the Company’s principal U.S. defined benefit retirement plan whose retirement benefit was determined under the cash balance formula continue to earn interest credits on their vested balances as of December 31, 2013 but no longer receive pay credits. Participants whose retirement benefit was determined under the final average earnings formula or career average earnings formula continue to have their accrued benefit adjusted for pay increases until termination of employment.
98
COLGATE-PALMOLIVE COMPANY
Notes to Consolidated Financial Statements (continued)
(Dollars in Millions Except Share and Per Share Amounts)
In the Company’s principal U.S. plans and certain funded foreign plans, funds are contributed to trusts in accordance with regulatory limits to provide for current service and for any unfunded projected benefit obligation over a reasonable period. The target asset allocation for the Company’s defined benefit plans is as follows:
United States | International | |||||
Asset Category | ||||||
Equity securities | % | % | ||||
Fixed income securities | % | % | ||||
Real estate and other investments | % | % | ||||
Total | % | % | ||||
At December 31, 2019 the allocation of the Company’s plan assets and the level of valuation input, as applicable, for each major asset category were as follows:
Level of Valuation Input | Pension Plans | |||||||||||||
United States | International | Other Retiree Benefit Plans | ||||||||||||
Cash and cash equivalents | Level 1 | $ | $ | $ | ||||||||||
U.S. common stocks | Level 1 | |||||||||||||
International common stocks | Level 1 | |||||||||||||
Pooled funds(1) | Level 1 | |||||||||||||
Fixed income securities(2) | Level 2 | |||||||||||||
Guaranteed investment contracts(3) | Level 2 | |||||||||||||
Investments valued using NAV per share(4) | ||||||||||||||
Domestic, developed and emerging markets equity funds | ||||||||||||||
Fixed income funds(5) | ||||||||||||||
Hedge funds(6) | ||||||||||||||
Multi-Asset funds(7) | ||||||||||||||
Real estate funds(8) | ||||||||||||||
Other assets and liabilities, net(9) | ( | ) | ||||||||||||
Total Investments | $ | $ | $ | |||||||||||
99
COLGATE-PALMOLIVE COMPANY
Notes to Consolidated Financial Statements (continued)
(Dollars in Millions Except Share and Per Share Amounts)
At December 31, 2018 the allocation of the Company’s plan assets and the level of valuation input, as applicable, for each major asset category were as follows:
Level of Valuation Input | Pension Plans | |||||||||||||
United States | International | Other Retiree Benefit Plans | ||||||||||||
Cash and cash equivalents | Level 1 | $ | $ | $ | ||||||||||
U.S. common stocks | Level 1 | |||||||||||||
International common stocks | Level 1 | |||||||||||||
Pooled funds(1) | Level 1 | |||||||||||||
Fixed income securities(2) | Level 2 | |||||||||||||
Guaranteed investment contracts(3) | Level 2 | |||||||||||||
Investments valued using NAV per share(4) | ||||||||||||||
Domestic, developed and emerging markets equity funds | ||||||||||||||
Fixed income funds(5) | ||||||||||||||
Hedge funds(6) | ||||||||||||||
Multi-Asset funds(7) | ||||||||||||||
Real estate funds(8) | ||||||||||||||
Other assets and liabilities, net(9) | ( | ) | ||||||||||||
Total Investments | $ | $ | $ | |||||||||||
_______
(1) | Pooled funds primarily invest in U.S. and foreign equity securities, debt and money market securities. |
(2) | The fixed income securities are traded over the counter and certain of these securities lack daily pricing or liquidity and as such are classified as Level 2. As of both December 31, 2019 and 2018, approximately |
(3) | The guaranteed investment contracts (“GICs”) represent contracts with insurance companies measured at the cash surrender value of each contract. The Level 2 valuation reflects that the cash surrender value is based principally on a referenced pool of investment funds with active redemption. |
(4) | Investments that are measured at fair value using net asset value (“NAV”) per share as a practical expedient have not been classified in the fair value hierarchy. The NAV is based on the value of the underlying investments owned, minus its liabilities, divided by the number of shares outstanding. There are no unfunded commitments related to these investments. Redemption notice period primarily ranges from 0-3 months and redemption frequency windows range from daily to quarterly. |
(5) | Fixed income funds primarily invest in U.S. government and investment grade corporate bonds. |
(6) | Consists of investments in underlying hedge fund strategies that are primarily implemented through the use of long and short equity and fixed income securities and derivative instruments such as futures and options. |
(7) | Multi-Asset funds primarily invest across a variety of asset classes, including global stocks and bonds, as well as alternative strategies. |
(8) | Real estate is valued using the NAV per unit of funds that are invested in real estate property. The investment value of the real estate property is determined quarterly using independent market appraisals as determined by the investment manager. |
(9) | This category primarily includes unsettled trades for investments purchased and sold and dividend receivables. |
100
COLGATE-PALMOLIVE COMPANY
Notes to Consolidated Financial Statements (continued)
(Dollars in Millions Except Share and Per Share Amounts)
Equity securities in the U.S. plans include investments in the Company’s common stock representing 3 % and 5 % of U.S. plan assets at December 31, 2019 and December 31, 2018, respectively. In 2019 and 2018, the U.S. plans sold 588,334 and 384,004 shares, respectively, of the Company’s common stock to the Company. No shares of the Company’s stock were purchased by the U.S. plans in 2019 or 2018. The plans received dividends on the Company’s common stock of $2 in 2019 and $3 in 2018.
Other Retiree Benefits
The Company and certain of its subsidiaries provide health care and life insurance benefits for retired employees to the extent not provided by government-sponsored plans.
The Company uses a December 31 measurement date for its defined benefit and other retiree benefit plans. Summarized information for the Company’s defined benefit and other retiree benefit plans is as follows:
101
COLGATE-PALMOLIVE COMPANY
Notes to Consolidated Financial Statements (continued)
(Dollars in Millions Except Share and Per Share Amounts)
Pension Plans | Other Retiree Benefit Plans | |||||||||||||||||||||||
2019 | 2018 | 2019 | 2018 | 2019 | 2018 | |||||||||||||||||||
United States | International | |||||||||||||||||||||||
Change in Benefit Obligations | ||||||||||||||||||||||||
Benefit obligations at beginning of year | $ | $ | $ | $ | $ | $ | ||||||||||||||||||
Service cost | ||||||||||||||||||||||||
Interest cost | ||||||||||||||||||||||||
Participants’ contributions | ||||||||||||||||||||||||
Acquisitions/plan amendments | ||||||||||||||||||||||||
Actuarial loss (gain) | ( | ) | ( | ) | ( | ) | ||||||||||||||||||
Foreign exchange impact | ( | ) | ( | ) | ||||||||||||||||||||
Termination benefits (1) | ||||||||||||||||||||||||
Curtailments and settlements | ( | ) | ( | ) | ( | ) | ||||||||||||||||||
Benefit payments | ( | ) | ( | ) | ( | ) | ( | ) | ( | ) | ( | ) | ||||||||||||
Other | ( | ) | ||||||||||||||||||||||
Benefit obligations at end of year | $ | $ | $ | $ | $ | $ | ||||||||||||||||||
Change in Plan Assets | ||||||||||||||||||||||||
Fair value of plan assets at beginning of year | $ | $ | $ | $ | $ | $ | ||||||||||||||||||
Actual return on plan assets | ( | ) | ( | ) | ( | ) | ||||||||||||||||||
Company contributions | ||||||||||||||||||||||||
Participants’ contributions | ||||||||||||||||||||||||
Foreign exchange impact | ( | ) | ||||||||||||||||||||||
Settlements and acquisitions | ( | ) | ( | ) | ( | ) | ||||||||||||||||||
Benefit payments | ( | ) | ( | ) | ( | ) | ( | ) | ( | ) | ( | ) | ||||||||||||
Other | ( | ) | ||||||||||||||||||||||
Fair value of plan assets at end of year | $ | $ | $ | $ | $ | $ | ||||||||||||||||||
Funded Status | ||||||||||||||||||||||||
Benefit obligations at end of year | $ | $ | $ | $ | $ | $ | ||||||||||||||||||
Fair value of plan assets at end of year | ||||||||||||||||||||||||
Net amount recognized | $ | ( | ) | $ | ( | ) | $ | ( | ) | $ | ( | ) | $ | ( | ) | $ | ( | ) | ||||||
Amounts Recognized in Balance Sheet | ||||||||||||||||||||||||
Noncurrent assets | $ | $ | $ | $ | $ | $ | ||||||||||||||||||
Current liabilities | ( | ) | ( | ) | ( | ) | ( | ) | ( | ) | ( | ) | ||||||||||||
Noncurrent liabilities | ( | ) | ( | ) | ( | ) | ( | ) | ( | ) | ( | ) | ||||||||||||
Net amount recognized | $ | ( | ) | $ | ( | ) | $ | ( | ) | $ | ( | ) | $ | ( | ) | $ | ( | ) | ||||||
Amounts Recognized in Accumulated Other Comprehensive Income (Loss) | ||||||||||||||||||||||||
Actuarial loss | $ | $ | $ | $ | $ | $ | ||||||||||||||||||
Transition/prior service cost | ( | ) | ( | ) | ||||||||||||||||||||
$ | $ | $ | $ | $ | $ | |||||||||||||||||||
Accumulated benefit obligation | $ | $ | $ | $ | $ | — | $ | — | ||||||||||||||||
102
COLGATE-PALMOLIVE COMPANY
Notes to Consolidated Financial Statements (continued)
(Dollars in Millions Except Share and Per Share Amounts)
Pension Plans | Other Retiree Benefit Plans | |||||||||||||||||
2019 | 2018 | 2019 | 2018 | 2019 | 2018 | |||||||||||||
United States | International | |||||||||||||||||
Weighted-Average Assumptions Used to Determine Benefit Obligations | ||||||||||||||||||
Discount rate | % | % | % | % | % | % | ||||||||||||
Long-term rate of return on plan assets | % | % | % | % | % | % | ||||||||||||
Long-term rate of compensation increase | % | % | % | % | % | % | ||||||||||||
ESOP growth rate | % | % | % | % | % | % | ||||||||||||
Medical cost trend rate of increase | % | % | % | % | % | % | ||||||||||||
Interest Crediting Rate | % | % | % | % | % | % | ||||||||||||
_________
(1) | Represents pension and other retiree benefit enhancements incurred in 2019 and 2018 pursuant to the Global Growth and Efficiency Program. |
The actuarial losses incurred during 2019 were primarily driven from a decrease in discount rates applied against future expected benefit payments and resulted in an increase in the benefit obligation for both the U.S. pension and Other retiree benefit plans. The actuarial gains recorded during 2018 for both the U.S. pension and other retiree benefit plans were primarily a result of an increase in discount rates applied against future estimated benefit payments. Additionally, other retiree benefit plans were positively impacted as a result of lower medical cost increases.
The company adopted ASU No. 2018-14, “Compensation-Retirement Benefits-Defined Benefit Plans-
General (Topic 715): Disclosure Framework–Changes to the Disclosure Requirements for Defined Benefit Plans.” beginning on January 1, 2020. Refer to Note 3, Recent Accounting Pronouncements.
The overall investment objective of the plans is to balance risk and return so that obligations to employees are met. The Company evaluates its long-term rate of return on plan assets on an annual basis. In determining the long-term rate of return, the Company considers the nature of the plans’ investments and the historical rates of return. The assumed rate of return as of December 31, 2019 for the U.S. plans was 6.30 %. Average annual rates of return for the U.S. plans for the most recent 1-year, 5-year, 10-year, 15-year and 25-year periods were 17 %, 6 %, 8 %, 7 %, and 8 %, respectively. Similar assessments were performed in determining rates of return on international pension plan assets to arrive at the Company’s 2019 weighted-average rate of return of 3.38 %.
The medical cost trend rate of increase assumed in measuring the expected cost of benefits is projected to decrease from 6.00 % in 2020 to 4.75 % by 2025 , remaining at 4.75 % for the years thereafter.
103
COLGATE-PALMOLIVE COMPANY
Notes to Consolidated Financial Statements (continued)
(Dollars in Millions Except Share and Per Share Amounts)
Pension plans with projected benefit obligations in excess of plan assets and plans with accumulated benefit obligations in excess of plan assets as of December 31 consisted of the following:
Years Ended December 31, | ||||||||
2019 | 2018 | |||||||
Benefit Obligation Exceeds Fair Value of Plan Assets | ||||||||
Projected benefit obligation | $ | $ | ||||||
Fair value of plan assets | ||||||||
Accumulated benefit obligation | ||||||||
Fair value of plan assets | ||||||||
Other Retiree Benefit plans with accumulated postretirement benefit obligation in excess of plan assets as of December 31 consisted of the following:
Years Ended December 31, | ||||||||
2019 | 2018 | |||||||
Benefit Obligation Exceeds Fair Value of Plan Assets | ||||||||
Accumulated postretirement benefit obligation | $ | $ | ||||||
Fair value of plan assets | ||||||||
Summarized information regarding the net periodic benefit costs for the Company’s defined benefit and other retiree benefit plans is as follows:
104
COLGATE-PALMOLIVE COMPANY
Notes to Consolidated Financial Statements (continued)
(Dollars in Millions Except Share and Per Share Amounts)
Pension Plans | Other Retiree Benefit Plans | |||||||||||||||||||||||||||||||||||
2019 | 2018 | 2017 | 2019 | 2018 | 2017 | 2019 | 2018 | 2017 | ||||||||||||||||||||||||||||
United States | International | |||||||||||||||||||||||||||||||||||
Components of Net Periodic Benefit Cost | ||||||||||||||||||||||||||||||||||||
Service cost | $ | $ | $ | $ | $ | $ | $ | $ | $ | |||||||||||||||||||||||||||
Interest cost | ||||||||||||||||||||||||||||||||||||
Annual ESOP allocation | ||||||||||||||||||||||||||||||||||||
Expected return on plan assets | ( | ) | ( | ) | ( | ) | ( | ) | ( | ) | ( | ) | ( | ) | ( | ) | ||||||||||||||||||||
Amortization of transition and prior service costs (credits) | ||||||||||||||||||||||||||||||||||||
Amortization of actuarial loss | ||||||||||||||||||||||||||||||||||||
Net periodic benefit cost | $ | $ | $ | $ | $ | $ | $ | $ | $ | |||||||||||||||||||||||||||
Other postretirement charges | ( | ) | ||||||||||||||||||||||||||||||||||
Total pension cost | $ | $ | $ | $ | $ | $ | $ | $ | $ | |||||||||||||||||||||||||||
Weighted-Average Assumptions Used to Determine Net Periodic Benefit Cost | ||||||||||||||||||||||||||||||||||||
Discount rate | % | % | % | % | % | % | % | % | % | |||||||||||||||||||||||||||
Long-term rate of return on plan assets | % | % | % | % | % | % | % | % | % | |||||||||||||||||||||||||||
Long-term rate of compensation increase | % | % | % | % | % | % | % | % | % | |||||||||||||||||||||||||||
ESOP growth rate | % | % | % | % | % | % | % | % | % | |||||||||||||||||||||||||||
Medical cost trend rate of increase | % | % | % | % | % | % | % | % | % | |||||||||||||||||||||||||||
Interest Crediting Rate | % | % | % | % | % | % | % | % | % | |||||||||||||||||||||||||||
105
COLGATE-PALMOLIVE COMPANY
Notes to Consolidated Financial Statements (continued)
(Dollars in Millions Except Share and Per Share Amounts)
Effective January 1, 2018, as required, the Company adopted ASU No. 2017-07, “Compensation-Retirement Benefits (Topic 715): Improving the Presentation of Net Periodic Pension Cost and Net Periodic Postretirement Benefit Cost,” on a retrospective basis. As a result, for all periods presented, only the service related component of pension and other postretirement benefit costs is included in Operating profit. The non-service related components (interest cost, expected return on assets and amortization of actuarial gains and losses) are included in a new line item, “Non-service related postretirement costs,” which is below Operating profit. Adoption of this standard had no effect on Net income attributable to Colgate-Palmolive Company, Earnings per common share or Cash flow. See Note 2, Summary of Significant Accounting Policies to the Consolidated Financial Statements for additional information.
Other postretirement charges in 2019, 2018 and 2017 include pension and other benefit enhancements amounting to $7 , $9 and $21 respectively, incurred pursuant to the Global Growth and Efficiency Program. Other postretirement charges in 2019 and 2018 also include charges of $1 and $2 , respectively, in part due to retirements under the Global Growth and Efficiency Program.
The Company made voluntary contributions of $113 , $67 and $81 in 2019, 2018 and 2017, respectively, to its U.S. retirement plans.
Expected Contributions and Benefit Payments
The Company does not expect to make any voluntary contributions to its U.S. postretirement plans for the year ending December 31, 2020. Actual funding may differ from current estimates depending on the variability of the market value of the assets as compared to the obligation and other market or regulatory conditions.
Benefit payments expected to be paid from the Company's assets to participants in unfunded plans are estimated to be approximately $55 for the year ending December 31, 2020.
Total benefit payments expected to be paid to participants in both funded and unfunded plans are estimated as follows:
Pension Plans | ||||||||||||||||
Years Ended December 31, | United States | International | Other Retiree Benefit Plans | Total | ||||||||||||
2020 | $ | $ | $ | $ | ||||||||||||
2021 | ||||||||||||||||
2022 | ||||||||||||||||
2023 | ||||||||||||||||
2024 | ||||||||||||||||
2025-2029 | ||||||||||||||||
106
COLGATE-PALMOLIVE COMPANY
Notes to Consolidated Financial Statements (continued)
(Dollars in Millions Except Share and Per Share Amounts)
11. Income Taxes
The components of Income before income taxes are as follows for the years ended December 31:
2019 | 2018 | 2017 | ||||||||||
United States | $ | $ | $ | |||||||||
International | ||||||||||||
Total Income before income taxes | $ | $ | $ | |||||||||
The Provision for income taxes consists of the following for the years ended December 31:
2019 | 2018 | 2017 | ||||||||||
United States | $ | $ | $ | |||||||||
International | ||||||||||||
Total Provision for income taxes | $ | $ | $ | |||||||||
Temporary differences between accounting for financial statement purposes and accounting for tax purposes result in the current provision for taxes being higher (lower) than the total provision for income taxes as follows:
2019 | 2018 | 2017 | ||||||||||
Goodwill and intangible assets | $ | $ | $ | |||||||||
Property, plant and equipment | ( | ) | ||||||||||
Pension and other retiree benefits | ( | ) | ( | ) | ( | ) | ||||||
Stock-based compensation | ( | ) | ( | ) | ||||||||
Tax credits and tax loss carryforwards | ( | ) | ( | ) | ||||||||
Deferred withholding tax | ( | ) | ( | ) | ( | ) | ||||||
Other, net | ( | ) | ||||||||||
Total deferred tax benefit (provision) | $ | ( | ) | $ | ( | ) | $ | ( | ) | |||
107
COLGATE-PALMOLIVE COMPANY
Notes to Consolidated Financial Statements (continued)
(Dollars in Millions Except Share and Per Share Amounts)
The difference between the statutory U.S. federal income tax rate and the Company’s global effective tax rate as reflected in the Consolidated Statements of Income is as follows:
Percentage of Income before income taxes | 2019 | 2018 | 2017 | ||||||
Tax at United States statutory rate | % | % | % | ||||||
State income taxes, net of federal benefit | |||||||||
Earnings taxed at other than United States statutory rate | ( | ) | |||||||
Charge for U.S. tax reform(1) | |||||||||
Excess tax benefits from stock-based compensation | ( | ) | ( | ) | ( | ) | |||
Foreign Tax Credit Carryback(2) | ( | ) | |||||||
Benefit for foreign tax matters(3) | ( | ) | ( | ) | |||||
Foreign-derived intangible income benefit | ( | ) | ( | ) | |||||
Other, net | ( | ) | ( | ) | ( | ) | |||
Effective tax rate | % | % | % | ||||||
_________
(1) | On December 22, 2017, the TCJA was enacted, which, among other things, lowered the U.S. corporate income tax rate to 21% from 35% and established a modified territorial system requiring a mandatory deemed repatriation tax on undistributed earnings of foreign subsidiaries. Beginning in 2018, the TCJA also requires a minimum tax on certain earnings generated by foreign subsidiaries while providing for tax-free repatriation of such earnings through a |
(2) | In 2018, the Company generated excess foreign taxes associated with its foreign branch operations which are being carried back to 2017. This item is not expected to be recurring. |
(3) | In December 2019, the Swiss government enacted changes to its corporate tax regime, which included, among other items, the repeal of certain preferential tax regimes and an increase to the cantonal tax rate for future periods. Additionally, the government provided transition rules which allowed companies to record goodwill for tax purposes, partially offsetting the impact on cash taxes of the higher cantonal rate over the next ten years. As a result of these changes, the Company recorded an estimated net benefit of $ |
108
COLGATE-PALMOLIVE COMPANY
Notes to Consolidated Financial Statements (continued)
(Dollars in Millions Except Share and Per Share Amounts)
The components of deferred tax assets (liabilities) are as follows at December 31:
2019 | 2018 | |||||||
Deferred tax liabilities: | ||||||||
Goodwill and intangible assets | $ | ( | ) | $ | ( | ) | ||
Property, plant and equipment | ( | ) | ( | ) | ||||
Deferred withholding tax | ( | ) | ( | ) | ||||
Other | ( | ) | ( | ) | ||||
Total deferred tax liabilities | ( | ) | ( | ) | ||||
Deferred tax assets: | ||||||||
Pension and other retiree benefits | ||||||||
Tax credits and tax loss carryforwards | ||||||||
Accrued liabilities | ||||||||
Stock-based compensation | ||||||||
Other | ||||||||
Total deferred tax assets | ||||||||
Valuation Allowance | $ | ( | ) | $ | ( | ) | ||
Net deferred tax assets | $ | $ | ||||||
Net deferred income taxes | $ | ( | ) | $ | ( | ) | ||
2019 | 2018 | |||||||
Deferred taxes included within: | ||||||||
Assets: | ||||||||
Deferred income taxes | $ | $ | ||||||
Liabilities: | ||||||||
Deferred income taxes | ( | ) | ( | ) | ||||
Net deferred income taxes | $ | ( | ) | $ | ( | ) | ||
Applicable U.S. income and foreign withholding taxes have been provided on substantially all of the Company’s accumulated earnings of foreign subsidiaries.
Net tax benefit of $13 in 2019, net tax benefit of $2 in 2018, and net tax benefit of $37 in 2017 were recorded directly through equity. The net tax benefit in 2019 predominantly includes current and future tax impacts related to benefit plans. The amounts in 2018 and 2017 include current and future tax impacts related to employee equity compensation and benefit plans.
The Company uses a comprehensive model to recognize, measure, present and disclose in its financial statements uncertain tax positions that the Company has taken or expects to take on an income tax return.
109
COLGATE-PALMOLIVE COMPANY
Notes to Consolidated Financial Statements (continued)
(Dollars in Millions Except Share and Per Share Amounts)
Unrecognized tax benefits activity for the years ended December 31, 2019, 2018 and 2017 is summarized below:
2019 | 2018 | 2017 | ||||||||||
Unrecognized tax benefits: | ||||||||||||
Balance, January 1 | $ | $ | $ | |||||||||
Increases as a result of tax positions taken during the current year | ||||||||||||
Decreases of tax positions taken during prior years | ( | ) | ( | ) | ( | ) | ||||||
Increases of tax positions taken during prior years | ||||||||||||
Decreases as a result of settlements with taxing authorities and the expiration of statutes of limitations | ( | ) | ( | ) | ( | ) | ||||||
Effect of foreign currency rate movements | ( | ) | ||||||||||
Balance, December 31 | $ | $ | $ | |||||||||
If all of the unrecognized tax benefits for 2019 above were recognized, approximately $161 would impact the effective tax rate and would result in a cash outflow of approximately $170 . Although it is possible that the amount of unrecognized benefits with respect to our uncertain tax positions will increase or decrease in the next twelve months, the Company does not expect material changes.
The Company recognized approximately $0 , $1 and $11 of interest expense related to the above unrecognized tax benefits within income tax expense in 2019, 2018 and 2017, respectively. The Company had accrued interest of approximately $23 , $27 and $28 as of December 31, 2019, 2018 and 2017, respectively.
The Company and its subsidiaries file U.S. federal income tax returns as well as income tax returns in many state and foreign jurisdictions. All U.S. federal income tax returns through December 31, 2011 have been audited by the IRS and there are limited matters which the Company plans to appeal for years 2010 through 2011, the settlement of which is not expected to have a material adverse effect on the Company’s results of operations, cash flows or financial condition. With a few exceptions, the Company is no longer subject to U.S. state and local income tax examinations for income tax returns through December 31, 2013. In addition, the Company has subsidiaries in various foreign jurisdictions that have statutes of limitations for tax audits generally ranging from three to six years .
The Company has made an accounting policy election to treat Global Intangible Low-Taxed Income taxes as a current period expense rather than including these amounts in the measurement of deferred taxes.
110
COLGATE-PALMOLIVE COMPANY
Notes to Consolidated Financial Statements (continued)
(Dollars in Millions Except Share and Per Share Amounts)
12. Earnings Per Share
For the years ended December 31, 2019, 2018 and 2017, earnings per share were as follows:
2019 | 2018 | 2017 | ||||||||||||||||||||||||||||||
Net income attributable to Colgate-Palmolive Company | Shares (millions) | Per Share | Net income attributable to Colgate-Palmolive Company | Shares (millions) | Per Share | Net income attributable to Colgate-Palmolive Company | Shares (millions) | Per Share | ||||||||||||||||||||||||
Basic EPS | $ | $ | $ | $ | $ | $ | ||||||||||||||||||||||||||
Stock options and restricted stock units | ||||||||||||||||||||||||||||||||
Diluted EPS | $ | $ | $ | $ | $ | $ | ||||||||||||||||||||||||||
Basic earnings per common share is computed by dividing net income available for common stockholders by the weighted-average number of shares of common stock outstanding for the period.
Diluted earnings per common share is computed using the treasury stock method on the basis of the weighted-average number of shares of common stock plus the dilutive effect of potential common shares outstanding during the period. Dilutive potential common shares include outstanding stock options and restricted stock units.
As of December 31, 2019, 2018 and 2017, the average number of stock options that were anti-dilutive and not included in diluted earnings per share calculations were 19,901,202 , 18,039,961 and 11,056,725 , respectively. As of December 31, 2019, 2018 and 2017, the average number of restricted stock units that were anti-dilutive and not included in diluted earnings per share calculations were 4,516 , 9,529 and 91 , respectively.
111
COLGATE-PALMOLIVE COMPANY
Notes to Consolidated Financial Statements (continued)
(Dollars in Millions Except Share and Per Share Amounts)
13. Commitments and Contingencies
The Company has various contractual commitments to purchase raw, packaging and other materials totaling approximately $559 at December 31, 2019.
As a global company serving consumers in more than 200 countries and territories, the Company is routinely subject to a wide variety of legal proceedings. These include disputes relating to intellectual property, contracts, product liability, marketing, advertising, foreign exchange controls, antitrust and trade regulation, as well as labor and employment, pension, data privacy and security, environmental and tax matters and consumer class actions. Management proactively reviews and monitors the Company’s exposure to, and the impact of, environmental matters. The Company is party to various environmental matters and, as such, may be responsible for all or a portion of the cleanup, restoration and post-closure monitoring of several sites.
The Company establishes accruals for loss contingencies when it has determined that a loss is probable and that the amount of loss, or range of loss, can be reasonably estimated. Any such accruals are adjusted thereafter as appropriate to reflect changes in circumstances.
The Company also determines estimates of reasonably possible losses or ranges of reasonably possible losses in excess of related accrued liabilities, if any, when it has determined that a loss is reasonably possible and it is able to determine such estimates. For those matters disclosed below for which the amount of any potential losses can be reasonably estimated, the Company currently estimates that the aggregate range of reasonably possible losses in excess of any accrued liabilities is $0 to approximately $225 (based on current exchange rates). The estimates included in this amount are based on the Company’s analysis of currently available information and, as new information is obtained, these estimates may change. Due to the inherent subjectivity of the assessments and the unpredictability of outcomes of legal proceedings, any amounts accrued or included in this aggregate amount may not represent the ultimate loss to the Company. Thus, the Company’s exposure and ultimate losses may be higher or lower, and possibly significantly so, than the amounts accrued or the range disclosed above.
Based on current knowledge, management does not believe that the ultimate resolution of loss contingencies arising from the matters discussed herein will have a material effect on the Company’s consolidated financial position or its ongoing results of operations or cash flows. However, in light of the inherent uncertainties noted above, an adverse outcome in one or more matters could be material to the Company’s results of operations or cash flows for any particular quarter or year.
Brazilian Matters
There are certain tax and civil proceedings outstanding, as described below, related to the Company’s 1995 acquisition of the Kolynos oral care business from Wyeth (the “Seller”).
The Brazilian internal revenue authority has disallowed interest deductions and foreign exchange losses taken by the Company’s Brazilian subsidiary for certain years in connection with the financing of the Kolynos acquisition. The tax assessments with interest, penalties and any court-mandated fees, at the current exchange rate, are approximately $152 . This amount includes additional assessments received from the Brazilian internal revenue authority in April 2016 relating to net operating loss carryforwards used by the Company’s Brazilian subsidiary to offset taxable income that had also been deducted from the authority’s original assessments. The Company has been disputing the disallowances by appealing the assessments since October 2001. There is one case currently on appeal at the administrative level. In the event the Company is ultimately unsuccessful in this administrative appeal, further appeals are available within the Brazilian federal courts.
In September 2015, the Company lost one of its appeals at the administrative level and filed a lawsuit in Brazilian federal court. In February 2017, the Company lost an additional administrative appeal and filed a lawsuit in Brazilian federal court. In April 2019, the Company lost another administrative appeal and filed a lawsuit in Brazilian federal
112
COLGATE-PALMOLIVE COMPANY
Notes to Consolidated Financial Statements (continued)
(Dollars in Millions Except Share and Per Share Amounts)
court. Although there can be no assurances, management believes, based on the opinion of its Brazilian legal counsel, that the disallowances are without merit and that the Company should ultimately prevail. The Company is challenging these disallowances vigorously.
In July 2002, the Brazilian Federal Public Attorney filed a civil action against the federal government of Brazil, Laboratorios Wyeth-Whitehall Ltda. (the Brazilian subsidiary of the Seller) and the Company, as represented by its Brazilian subsidiary, in the 6th. Lower Federal Court in the City of São Paulo, seeking to annul an April 2000 decision by the Brazilian Board of Tax Appeals that found in favor of the Seller’s Brazilian subsidiary on the issue of whether it had incurred taxable capital gains as a result of the divestiture of Kolynos. The action seeks to make the Company’s Brazilian subsidiary jointly and severally liable for any tax due from the Seller’s Brazilian subsidiary. The case has been pending since 2002, and the Lower Federal Court has not issued a decision. Although there can be no assurances, management believes, based on the opinion of its Brazilian legal counsel, that the Company should ultimately prevail in this action. The Company is challenging this action vigorously.
In December 2005, the Brazilian internal revenue authority issued to the Company’s Brazilian subsidiary a tax assessment with interest, penalties and any court-mandated fees of approximately $63 , at the current exchange rate, based on a claim that certain purchases of U.S. Treasury bills by the subsidiary and their subsequent disposition during the period 2000 to 2001 were subject to a tax on foreign exchange transactions. The Company had been disputing the assessment within the internal revenue authority’s administrative appeals process. However, in November 2015, the Superior Chamber of Administrative Tax Appeals denied the Company’s final administrative appeal, and the Company has filed a lawsuit in the Brazilian federal court. In the event the Company is unsuccessful in this lawsuit, further appeals are available within the Brazilian federal courts. Although there can be no assurances, management believes, based on the opinion of its Brazilian legal counsel, that the tax assessment is without merit and that the Company should ultimately prevail. The Company is challenging this assessment vigorously.
Competition Matters
Certain of the Company’s subsidiaries have historically been subject to investigations, and, in some cases, fines, by governmental authorities in a number of countries related to alleged competition law violations. Substantially all of these matters also involved other consumer goods companies and/or retail customers. The Company’s policy is to comply with antitrust and competition laws and, if a violation of any such laws is found, to take appropriate remedial action and to cooperate fully with any related governmental inquiry. The status as of December 31, 2019 of competition law matters pending against the Company during the year ended December 31, 2019 is set forth below.
▪ | In December 2014, the French competition law authority found that |
▪ | In July 2014, the Greek competition law authority issued a statement of objections alleging a restriction of parallel imports into Greece. The Company responded to this statement of objections. In July 2017, the Company received the decision from the Greek competition law authority in which the Company was fined $ |
113
COLGATE-PALMOLIVE COMPANY
Notes to Consolidated Financial Statements (continued)
(Dollars in Millions Except Share and Per Share Amounts)
the decision to the Greek Supreme Court.
Talcum Powder Matters
The Company has been named as a defendant in civil actions alleging that certain talcum powder products that were sold prior to 1996 were contaminated with asbestos. Most of these actions involve a number of co-defendants from a variety of different industries, including suppliers of asbestos and manufacturers of products that, unlike the Company’s products, were designed to contain asbestos. As of December 31, 2019, there were 121 individual cases pending against the Company in state and federal courts throughout the United States, as compared to 239 cases as of December 31, 2018. During the year ended December 31, 2019, 110 new cases were filed and 228 cases were resolved by voluntary dismissal, dismissal by the court, judgment in the Company’s favor or settlement. During the year ended December 31, 2019, one case resulted in a jury verdict in favor of the Company after a trial, which is now pending appeal by the plaintiff, and one case resulted in an adverse jury verdict after a trial, which the Company is appealing. The value of the settlements and of the adverse jury verdict in the year presented was not material, either individually or in the aggregate, to such period’s results of operations.
The Company believes that a significant portion of its costs incurred in defending and resolving these claims will be covered by insurance policies issued by several primary, excess and umbrella insurance carriers, subject to deductibles, exclusions, retentions and policy limits.
While the Company and its legal counsel believe that these cases are without merit and intend to challenge them vigorously, there can be no assurances regarding the ultimate resolution of these matters. With the exception of the case where the Company received an adverse jury verdict, the range of reasonably possible losses in excess of accrued liabilities disclosed above does not include any amount relating to these cases because the amount of any possible losses from such cases currently cannot be reasonably estimated.
ERISA Matter
In June 2016, a putative class action claiming that residual annuity payments made to certain participants in the Colgate-Palmolive Company Employees’ Retirement Income Plan (the “Plan”) did not comply with the Employee Retirement Income Security Act was filed against the Plan, the Company and certain individuals in the United States District Court for the Southern District of New York. This action has been certified as a class action. The relief sought includes recalculation of benefits, pre- and post-judgment interest and attorneys’ fees. The Company is contesting this action vigorously. Since the amount of any potential loss from this case currently cannot be reasonably estimated, the range of reasonably possible losses in excess of accrued liabilities disclosed above does not include any amount relating to the case.
114
COLGATE-PALMOLIVE COMPANY
Notes to Consolidated Financial Statements (continued)
(Dollars in Millions Except Share and Per Share Amounts)
14. Segment Information
The Company operates in two product segments: Oral, Personal and Home Care; and Pet Nutrition.
The operations of the Oral, Personal and Home Care product segment are managed geographically in five reportable operating segments: North America, Latin America, Europe, Asia Pacific and Africa/Eurasia.
The Company evaluates segment performance based on several factors, including Operating profit. The Company uses Operating profit as a measure of operating segment performance because it excludes the impact of Corporate-driven decisions related to interest expense and income taxes.
The accounting policies of the operating segments are generally the same as those described in Note 2, Summary of Significant Accounting Policies. Intercompany sales have been eliminated. Corporate operations include costs related to stock options and restricted stock units, research and development costs, Corporate overhead costs, restructuring and related implementation charges and gains and losses on sales of non-core product lines and assets. The Company reports these items within Corporate operations as they relate to Corporate-based responsibilities and decisions and are not included in the internal measures of segment operating performance used by the Company to measure the underlying performance of the operating segments.
Approximately 70 % of the Company’s Net sales are generated from markets outside the U.S., with approximately 50 % of the Company’s Net sales coming from emerging markets (which consist of Latin America, Asia (excluding Japan), Africa/Eurasia and Central Europe). Oral, Personal and Home Care sales to Wal-Mart, Inc. and its affiliates represent approximately 11 % of the Company’s Net sales in 2019. No other customer represents more than 10% of Net sales.
In 2019, 2018 and 2017, Corporate Operating profit included charges of $125 , $152 and $313 , respectively, resulting from the Global Growth and Efficiency Program. Additionally, Corporate Operating profit for 2019 included a charge for acquisition-related costs of $24 and a benefit from a value-added tax matter in Brazil of $30 .
2019 | 2018 | 2017 | ||||||||||
Net sales | ||||||||||||
Oral, Personal and Home Care | ||||||||||||
North America(1) | $ | $ | $ | |||||||||
Latin America | ||||||||||||
Europe | ||||||||||||
Asia Pacific | ||||||||||||
Africa/Eurasia | ||||||||||||
Total Oral, Personal and Home Care | ||||||||||||
Pet Nutrition(2) | ||||||||||||
Total Net sales | $ | $ | $ | |||||||||
_________
(1) Net sales in the U.S. for Oral, Personal and Home Care were $3,166 , $3,091 and $2,865 in 2019, 2018 and 2017, respectively.
(2) Net sales in the U.S. for Pet Nutrition were $1,441 , $1,304 and $1,246 in 2019, 2018 and 2017, respectively.
115
COLGATE-PALMOLIVE COMPANY
Notes to Consolidated Financial Statements (continued)
(Dollars in Millions Except Share and Per Share Amounts)
2019 | 2018 | 2017 | ||||||||||
Operating profit | ||||||||||||
Oral, Personal and Home Care | ||||||||||||
North America | $ | $ | $ | |||||||||
Latin America | ||||||||||||
Europe | ||||||||||||
Asia Pacific | ||||||||||||
Africa/Eurasia | ||||||||||||
Total Oral, Personal and Home Care | ||||||||||||
Pet Nutrition | ||||||||||||
Corporate | ( | ) | ( | ) | ( | ) | ||||||
Total Operating profit | $ | $ | $ | |||||||||
2019 | 2018 | 2017 | ||||||||||
Capital expenditures | ||||||||||||
Oral, Personal and Home Care | ||||||||||||
North America | $ | $ | $ | |||||||||
Latin America | ||||||||||||
Europe | ||||||||||||
Asia Pacific | ||||||||||||
Africa/Eurasia | ||||||||||||
Total Oral, Personal and Home Care | ||||||||||||
Pet Nutrition | ||||||||||||
Corporate | ||||||||||||
Total Capital expenditures | $ | $ | $ | |||||||||
2019 | 2018 | 2017 | ||||||||||
Depreciation and amortization | ||||||||||||
Oral, Personal and Home Care | ||||||||||||
North America | $ | $ | $ | |||||||||
Latin America | ||||||||||||
Europe | ||||||||||||
Asia Pacific | ||||||||||||
Africa/Eurasia | ||||||||||||
Total Oral, Personal and Home Care | ||||||||||||
Pet Nutrition | ||||||||||||
Corporate | ||||||||||||
Total Depreciation and amortization | $ | $ | $ | |||||||||
116
COLGATE-PALMOLIVE COMPANY
Notes to Consolidated Financial Statements (continued)
(Dollars in Millions Except Share and Per Share Amounts)
2019 | 2018 | 2017 | ||||||||||
Identifiable assets | ||||||||||||
Oral, Personal and Home Care | ||||||||||||
North America | $ | $ | $ | |||||||||
Latin America | ||||||||||||
Europe | ||||||||||||
Asia Pacific | ||||||||||||
Africa/Eurasia | ||||||||||||
Total Oral, Personal and Home Care | ||||||||||||
Pet Nutrition | ||||||||||||
Corporate(1) | ||||||||||||
Total Identifiable assets(2) | $ | $ | $ | |||||||||
____________
(1) | In 2019, Corporate identifiable assets primarily consist of derivative instruments ( |
(2) | Long-lived assets in the U.S., primarily property, plant and equipment and goodwill and other intangibles represented approximately one-third of total long-lived assets of $ |
117
COLGATE-PALMOLIVE COMPANY
Notes to Consolidated Financial Statements (continued)
(Dollars in Millions Except Share and Per Share Amounts)
15. Leases
The Company adopted ASU No. 2016-02 “Leases (Topic 842)” on January 1, 2019, resulting in the recognition of right-of-use assets of $458 and liabilities of $574 . The Company enters into leases for land, office space, warehouses and equipment. A number of the leases include one or more options to renew the lease terms, purchase the leased property or terminate the lease. The exercise of these options is at the Company’s discretion and is therefore recognized on the balance sheet when it is reasonably certain the Company will exercise such options. As the Company’s leases typically do not contain a readily determinable implicit rate, the Company determines the present value of the lease liability using its incremental borrowing rate at the lease commencement date.
Substantially all of the Company’s leases are considered operating leases. Finance leases were not material as of December 31, 2019 or for the three and twelve months ended December 31, 2019.
As of December 31, 2019, the Company’s right-of use assets and liabilities for operating leases were as follows:
Other assets | $ | ||
Other accruals | $ | ||
Other liabilities | |||
Total operating lease liabilities | $ | ||
Lease commitments under noncancellable operating leases as of December 31, 2019 were as follows:
2020 | $ | ||
2021 | |||
2022 | |||
2023 | |||
2024 | |||
Thereafter | |||
Total lease commitments | $ | ||
Less: Interest | ( | ) | |
Present value of lease liabilities | $ | ||
The components of the Company’s operating lease cost for the twelve months ended December 31, 2019 were as follows:
Operating lease cost | $ | ||
Short-term lease cost | |||
Variable lease cost | |||
Sublease income | |||
Total lease cost | $ | ||
Short-term lease cost represents the Company’s cost with respect to leases with a duration of 12 months or less and is not reflected on the Company’s Consolidated Balance Sheets. Variable lease costs are comprised of costs, such as the Company’s proportionate share of actual costs for utilities, common area maintenance, property taxes and insurance, that are not included in the lease liability and are recognized in the period in which they are incurred.
Supplemental cash flow information related to operating leases for the twelve months ended December 31, 2019 was as follows:
▪Payments against amounts included in the measurement of lease liabilities: $202
▪Lease assets obtained in exchange for lease liabilities: $232
118
COLGATE-PALMOLIVE COMPANY
Notes to Consolidated Financial Statements (continued)
(Dollars in Millions Except Share and Per Share Amounts)
As of December 31, 2019, the weighted-average remaining lease term for operating leases was 8 years and the weighted-average discount rate for operating leases was 4.1 %
There were no material operating leases that the Company had entered into and that were yet to commence as of December 31, 2019.
Minimum rental commitments under noncancellable operating leases as of December 31, 2018, prior to adoption of ASU 2016-02, were as follows:
2019 | $ | ||
2020 | |||
2021 | |||
2022 | |||
2023 | |||
Thereafter | |||
Prior to adoption of ASU 2016-02, Company’s rental expense amounted to $213 in 2018 and $211 in 2017.
119
COLGATE-PALMOLIVE COMPANY
Notes to Consolidated Financial Statements (continued)
(Dollars in Millions Except Share and Per Share Amounts)
16. Supplemental Income Statement Information
Other (income) expense, net | 2019 | 2018 | 2017 | |||||||||
Global Growth and Efficiency Program | $ | $ | $ | |||||||||
Amortization of intangible assets | ||||||||||||
Equity income | ( | ) | ( | ) | ( | ) | ||||||
Value-added tax matter in Brazil | ( | ) | ||||||||||
Write-off of certain investments and fixed assets | ||||||||||||
Acquisition-related costs | ||||||||||||
Charges for a change in go-to-market strategy in certain countries | ||||||||||||
Other, net | ( | ) | ||||||||||
Total Other (income) expense, net | $ | $ | $ | |||||||||
Interest (income) expense, net | 2019 | 2018 | 2017 | |||||||||
Interest incurred | $ | $ | $ | |||||||||
Interest capitalized | ( | ) | ( | ) | ( | ) | ||||||
Interest income | ( | ) | ( | ) | ( | ) | ||||||
Total Interest (income) expense, net | $ | $ | $ | |||||||||
2019 | 2018 | 2017 | ||||||||||
Research and development | $ | $ | $ | |||||||||
Advertising | $ | $ | $ | |||||||||
120
COLGATE-PALMOLIVE COMPANY
Notes to Consolidated Financial Statements (continued)
(Dollars in Millions Except Share and Per Share Amounts)
17. Supplemental Balance Sheet Information
Inventories by major class are as follows at December 31:
Inventories | 2019 | 2018 | ||||||
Raw materials and supplies | $ | $ | ||||||
Work-in-process | ||||||||
Finished goods | ||||||||
Total Inventories, net | $ | $ | ||||||
Non-current inventory, net | ( | ) | ||||||
Current Inventories, net | $ | $ | ||||||
Inventories valued under LIFO amounted to $303 and $294 at December 31, 2019 and 2018, respectively. The excess of current cost over LIFO cost at the end of each year was $62 and $63 , respectively. The liquidations of LIFO inventory quantities had no material effect on income in 2019, 2018 and 2017. Inventory classified as non-current at December 31, 2019 was recorded on the Consolidated Balance Sheets as "Other assets".
Property, plant and equipment, net | 2019 | 2018 | ||||||
Land | $ | $ | ||||||
Buildings | ||||||||
Manufacturing machinery and equipment | ||||||||
Other equipment | ||||||||
Accumulated depreciation | ( | ) | ( | ) | ||||
Total Property, plant and equipment, net | $ | $ | ||||||
Other accruals | 2019 | 2018 | ||||||
Accrued advertising and coupon redemption | $ | $ | ||||||
Accrued payroll and employee benefits | ||||||||
Accrued taxes other than income taxes | ||||||||
Restructuring accrual | ||||||||
Pension and other retiree benefits | ||||||||
Lease Liabilities Due in One Year | — | |||||||
Accrued interest | ||||||||
Derivatives | ||||||||
Other | ||||||||
Total Other accruals | $ | $ | ||||||
Other liabilities | 2019 | 2018 | ||||||
Pension and other retiree benefits | $ | $ | ||||||
Restructuring accrual | ||||||||
Long-Term Lease Liabilities | — | |||||||
Other | ||||||||
Total Other liabilities | $ | $ | ||||||
121
COLGATE-PALMOLIVE COMPANY
Notes to Consolidated Financial Statements (continued)
(Dollars in Millions Except Share and Per Share Amounts)
18. Supplemental Other Comprehensive Income (Loss) Information
Other comprehensive income (loss) components attributable to Colgate-Palmolive Company before tax and net of tax during the years ended December 31 were as follows:
2019 | 2018 | 2017 | |||||||||||||||||||
Pre-tax | Net of Tax | Pre-tax | Net of Tax | Pre-tax | Net of Tax | ||||||||||||||||
Cumulative translation adjustments | $ | $ | $ | ( | ) | $ | ( | ) | $ | $ | |||||||||||
Pension and other benefits: | |||||||||||||||||||||
Net actuarial gain (loss), prior service costs and settlements during the period | ( | ) | ( | ) | ( | ) | ( | ) | |||||||||||||
Amortization of net actuarial loss, transition and prior service costs(1) | |||||||||||||||||||||
Retirement Plan and other retiree benefit adjustments | ( | ) | ( | ) | |||||||||||||||||
Cash flow hedges: | |||||||||||||||||||||
Unrealized gains (losses) on cash flow hedges | ( | ) | ( | ) | ( | ) | ( | ) | |||||||||||||
Reclassification of (gains) losses into net earnings on cash flow hedges(2) | ( | ) | ( | ) | |||||||||||||||||
Gains (losses) on cash flow hedges | ( | ) | ( | ) | ( | ) | ( | ) | |||||||||||||
Total Other comprehensive income (loss) | $ | ( | ) | $ | ( | ) | $ | ( | ) | $ | ( | ) | $ | $ | |||||||
_________
(1) | These components of Other comprehensive income (loss) are included in the computation of total pension cost. See Note 10, Retirement Plans and Other Retiree Benefits for additional details. |
(2) | These (gains) losses are reclassified into Cost of sales. See Note 7, Fair Value Measurements and Financial Instruments for additional details. |
There were no tax impacts on Other comprehensive income (loss) attributable to Noncontrolling interests.
Accumulated Other Comprehensive Income (Loss)
Accumulated other comprehensive income (loss) is comprised of cumulative foreign currency translation gains and losses, unrecognized pension and other retiree benefit costs and unrealized gains and losses from derivative instruments designated as cash flow hedges. At December 31, 2019 and 2018, Accumulated other comprehensive income (loss) consisted primarily of aftertax unrecognized pension and other retiree benefit costs of $1,138 and $1,038 , respectively, and cumulative foreign currency translation adjustments of $3,128 and $3,155 , respectively. Foreign currency translation adjustments in 2019 primarily reflect gains from Thai baht and the Mexican peso. Foreign currency translation adjustments in 2018 primarily reflect losses from the euro and the Argentine peso.
122
COLGATE-PALMOLIVE COMPANY
Notes to Consolidated Financial Statements (continued)
(Dollars in Millions Except Share and Per Share Amounts)
19. Quarterly Financial Data (Unaudited)
Total | First Quarter | Second Quarter | Third Quarter | Fourth Quarter | ||||||||||||||||
2019 | ||||||||||||||||||||
Net sales | $ | $ | $ | $ | $ | |||||||||||||||
Gross profit | (1) | (3) | (5) | (7) | (9) | |||||||||||||||
Net income including noncontrolling interests | (2) | (4) | (6) | (8) | (10) | |||||||||||||||
Net income attributable to Colgate-Palmolive Company | (2) | (4) | (6) | (8) | (10) | |||||||||||||||
Earnings per common share: | ||||||||||||||||||||
Basic | (2) | (4) | (6) | (8) | (10) | |||||||||||||||
Diluted | (2) | (4) | (6) | (8) | (10) | |||||||||||||||
2018 | ||||||||||||||||||||
Net sales | $ | $ | $ | $ | $ | |||||||||||||||
Gross profit | (11) | (13) | (15) | (17) | (19) | |||||||||||||||
Net income including noncontrolling interests | (12) | (14) | (16) | (18) | (20) | |||||||||||||||
Net income attributable to Colgate-Palmolive Company | (12) | (14) | (16) | (18) | (20) | |||||||||||||||
Earnings per common share: | ||||||||||||||||||||
Basic | (12) | (14) | (16) | (18) | (20) | |||||||||||||||
Diluted | (12) | (14) | (16) | (18) | (20) | |||||||||||||||
____________
Note: | Basic and diluted earnings per share are computed independently for each quarter and the year-to-date period presented. Accordingly, the sum of the quarterly earnings per common share may not necessarily equal the earnings per share for the year-to-date period. |
(1) | Gross profit for the full year of 2019 includes $ |
(2) | Net income including noncontrolling interests, Net income attributable to Colgate-Palmolive Company and Earnings per common share for the full year of 2019 includes $ |
(3) | Gross profit for the first quarter of 2019 includes $ |
(4) | Net income including noncontrolling interests, Net income attributable to Colgate-Palmolive Company and Earnings per common share for the first quarter of 2019 include $ |
(5) | Gross profit for the second quarter of 2019 includes $ |
(6) | Net income including noncontrolling interests, Net income attributable to Colgate-Palmolive Company and Earnings per common share for the second quarter of 2019 includes $ |
(7) | Gross profit for the third quarter of 2019 includes $ |
123
COLGATE-PALMOLIVE COMPANY
Notes to Consolidated Financial Statements (continued)
(Dollars in Millions Except Share and Per Share Amounts)
(8) | Net income including noncontrolling interests, Net income attributable to Colgate-Palmolive Company and Earnings per common share for the third quarter of 2019 include $ |
(9) | Gross profit for the fourth quarter of 2019 includes $ |
(10) | Net income including noncontrolling interests, Net income attributable to Colgate-Palmolive Company and Earnings per common share for the fourth quarter of 2019 include $ |
(11) | Gross profit for the full year of 2018 includes $ |
(12) | Net income including noncontrolling interests for the full year of 2018 includes $ |
(13) | Gross profit for the first quarter of 2018 includes $ |
(14) | Net income including noncontrolling interests, Net income attributable to Colgate-Palmolive Company and Earnings per common share for the first quarter of 2018 include $ |
(15) | Gross profit for the second quarter of 2018 includes $ |
(16) | Net income including noncontrolling interests for the second quarter of 2018 includes $ |
(17) | Gross profit for the third quarter of 2018 includes $ |
(18) | Net income including noncontrolling interests, Net income attributable to Colgate-Palmolive Company and Earnings per common share for the third quarter of 2018 include $ |
(19) | Gross profit for the fourth quarter of 2018 includes $ |
(20) | Net income including noncontrolling interests for the fourth quarter of 2018 include $ |
124
SCHEDULE II - VALUATION AND QUALIFYING ACCOUNTS
(Dollars in Millions)
Additions | ||||||||||||||||||||
Balance at Beginning of Period | Charged to Costs and Expenses | Other | Deductions | Balance at End of Period | ||||||||||||||||
Year Ended December 31, 2019 | ||||||||||||||||||||
Allowance for doubtful accounts and estimated returns | $ | $ | $ | $ | $ | |||||||||||||||
Valuation allowance for deferred tax assets | $ | $ | $ | $ | $ | |||||||||||||||
Year Ended December 31, 2018 | ||||||||||||||||||||
Allowance for doubtful accounts and estimated returns | $ | $ | $ | $ | $ | |||||||||||||||
Valuation allowance for deferred tax assets | $ | $ | $ | $ | $ | |||||||||||||||
Year Ended December 31, 2017 | ||||||||||||||||||||
Allowance for doubtful accounts and estimated returns | $ | $ | $ | $ | $ | |||||||||||||||
Valuation allowance for deferred tax assets | $ | $ | $ | $ | $ | |||||||||||||||
125
COLGATE-PALMOLIVE COMPANY
Market Information
The Company’s common stock is listed on the New York Stock Exchange and its trading symbol is CL.
Stock Price Performance Graphs
The following graphs compare cumulative total shareholder returns on Colgate-Palmolive Company common stock against the S&P Composite-500 Stock Index and a peer company index for the twenty-year, ten-year and five-year periods each ended December 31, 2019. The peer company index is comprised of consumer products companies that have both domestic and international businesses. For 2019, the peer company index consisted of Campbell Soup Company, The Clorox Company, The Coca-Cola Company, ConAgra Brands, Inc., The Estee Lauder Companies, Inc., General Mills, Inc., Johnson & Johnson, Kellogg Company, Kimberly-Clark Corporation, The Kraft Heinz Company, Mondelez International, Inc., PepsiCo, Inc., The Procter & Gamble Company, Reckitt Benckiser Group plc and Unilever N.V.
These performance graphs do not constitute soliciting material, are not deemed filed with the SEC and are not incorporated by reference in any of the Company’s filings under the Securities Act of 1933 or the Securities Exchange Act of 1934, as amended, whether made before or after the date of this Annual Report on Form 10-K and irrespective of any general incorporation language in any such filing, except to the extent the Company specifically incorporates these performance graphs by reference therein.
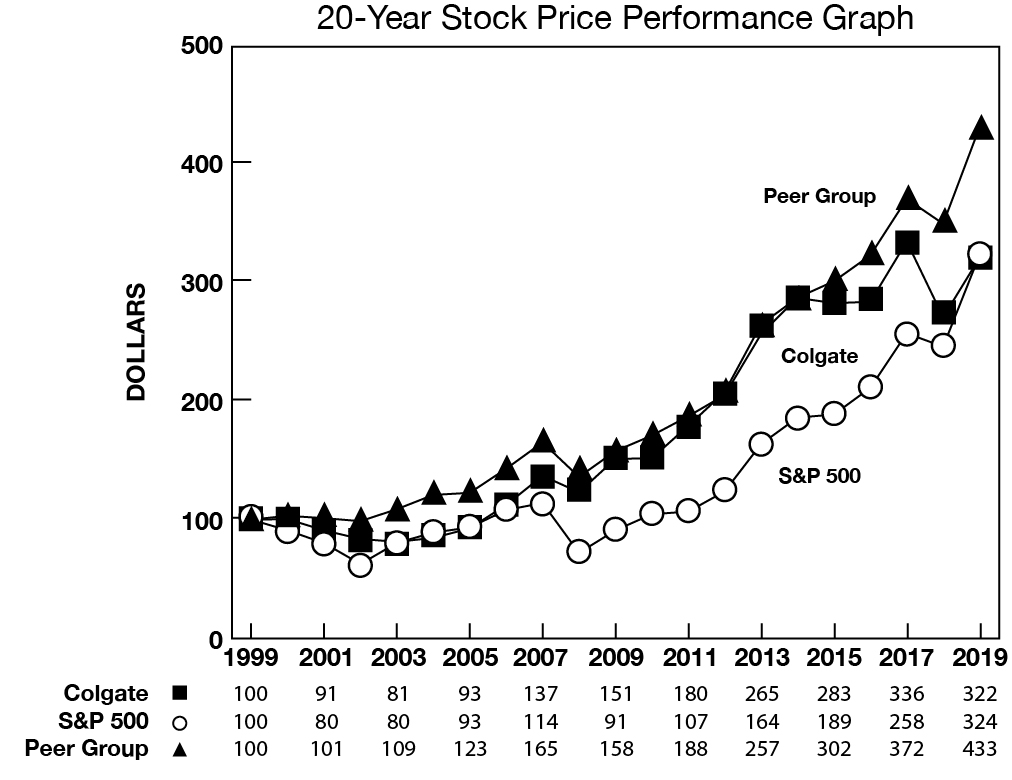
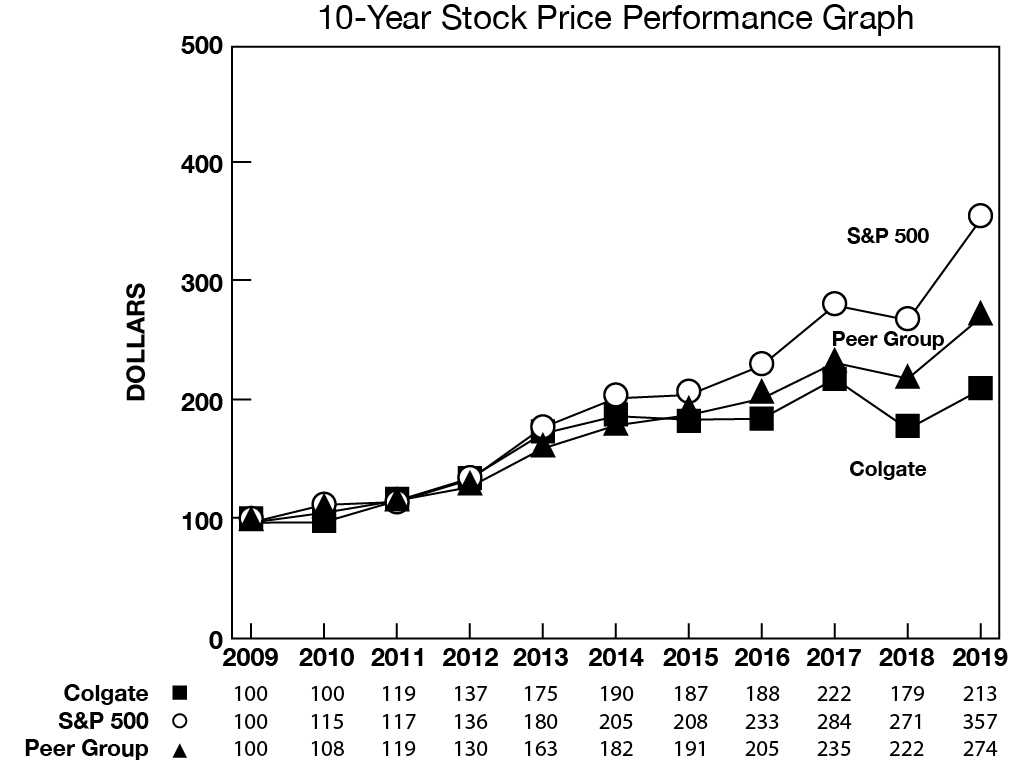
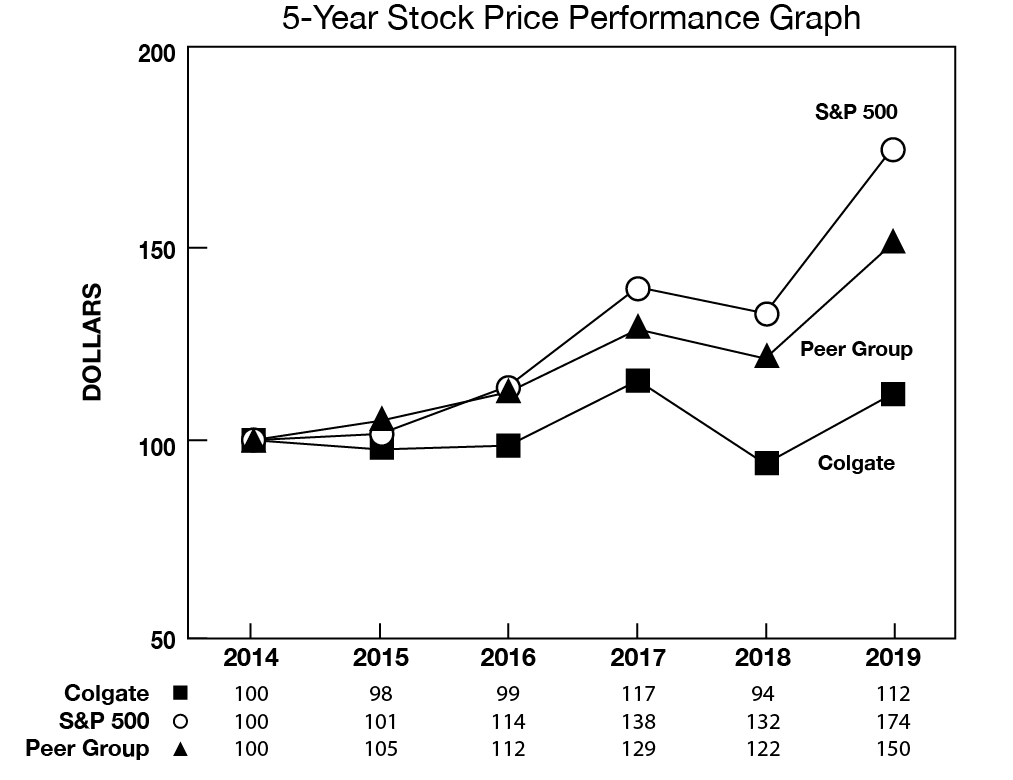
126
COLGATE-PALMOLIVE COMPANY
Historical Financial Summary
For the years ended December 31,
(Dollars in Millions Except Per Share Amounts)
(Unaudited)
2019 | 2018 | 2017 | 2016 | 2015 | 2014 | 2013 | 2012 | 2011 | 2010 | ||||||||||||||||||||||||||||||||
Continuing Operations | |||||||||||||||||||||||||||||||||||||||||
Net sales | $ | 15,693 | $ | 15,544 | $ | 15,454 | $ | 15,195 | $ | 16,034 | $ | 17,277 | $ | 17,420 | $ | 17,085 | $ | 16,734 | $ | 15,564 | |||||||||||||||||||||
Results of operations: | |||||||||||||||||||||||||||||||||||||||||
Net income attributable to Colgate-Palmolive Company | 2,367 | (1) | 2,400 | (2) | 2,024 | (3) | 2,441 | (4) | 1,384 | (5) | 2,180 | (6) | 2,241 | (7) | 2,472 | (8) | 2,431 | (9) | 2,203 | (10) | |||||||||||||||||||||
Earnings per common share, basic | 2.76 | (1) | 2.76 | (2) | 2.30 | (3) | 2.74 | (4) | 1.53 | (5) | 2.38 | (6) | 2.41 | (7) | 2.60 | (8) | 2.49 | (9) | 2.22 | (10) | |||||||||||||||||||||
Earnings per common share, diluted | 2.75 | (1) | 2.75 | (2) | 2.28 | (3) | 2.72 | (4) | 1.52 | (5) | 2.36 | (6) | 2.38 | (7) | 2.57 | (8) | 2.47 | (9) | 2.16 | (10) | |||||||||||||||||||||
Depreciation and amortization expense | 519 | 511 | 475 | 443 | 449 | 442 | 439 | 425 | 421 | 376 | |||||||||||||||||||||||||||||||
Financial Position | |||||||||||||||||||||||||||||||||||||||||
Current ratio | 1.0 | 1.1 | 1.4 | 1.3 | 1.2 | 1.2 | 1.1 | 1.2 | 1.2 | 1.0 | |||||||||||||||||||||||||||||||
Property, plant and equipment, net | 3,750 | 3,881 | 4,072 | 3,840 | 3,796 | 4,080 | 4,083 | 3,842 | 3,668 | 3,693 | |||||||||||||||||||||||||||||||
Capital expenditures | 335 | 436 | 553 | 593 | 691 | 757 | 670 | 565 | 537 | 550 | |||||||||||||||||||||||||||||||
Total assets | 15,034 | 12,161 | 12,676 | 12,123 | 11,935 | 13,440 | 13,968 | 13,379 | 12,711 | 11,163 | |||||||||||||||||||||||||||||||
Long-term debt | 7,333 | 6,354 | 6,566 | 6,520 | 6,246 | 5,625 | 4,732 | 4,911 | 4,417 | 2,806 | |||||||||||||||||||||||||||||||
Colgate-Palmolive Company shareholders’ equity | 117 | (102 | ) | (60 | ) | (243 | ) | (299 | ) | 1,145 | 2,305 | 2,189 | 2,375 | 2,675 | |||||||||||||||||||||||||||
Share and Other | |||||||||||||||||||||||||||||||||||||||||
Book value per common share | 0.66 | 0.23 | 0.28 | 0.03 | (0.04 | ) | 1.55 | 2.79 | 2.60 | 2.71 | 2.95 | ||||||||||||||||||||||||||||||
Cash dividends declared and paid per common share | 1.71 | 1.66 | 1.59 | 1.55 | 1.50 | 1.42 | 1.33 | 1.22 | 1.14 | 1.02 | |||||||||||||||||||||||||||||||
Closing price | 68.84 | 59.52 | 75.45 | 65.44 | 66.62 | 69.19 | 65.21 | 52.27 | 46.20 | 40.19 | |||||||||||||||||||||||||||||||
Number of common shares outstanding (in millions) | 854.7 | 862.9 | 874.7 | 883.1 | 892.7 | 906.7 | 919.9 | 935.8 | 960.0 | 989.8 | |||||||||||||||||||||||||||||||
Number of common shareholders of record | 20,556 | 21,900 | 22,700 | 23,600 | 24,400 | 25,400 | 26,900 | 27,600 | 28,900 | 29,900 | |||||||||||||||||||||||||||||||
Number of employees | 34,300 | 34,500 | 35,900 | 36,700 | 37,900 | 37,700 | 37,400 | 37,700 | 38,600 | 39,200 | |||||||||||||||||||||||||||||||
_________
Note: | All per share amounts and numbers of shares outstanding were adjusted for the two-for-one stock split of the Company’s common stock in 2013. |
(1) | Net income attributable to Colgate-Palmolive Company and Earnings per common share for the full year of 2019 includes $102 of aftertax charges related to the Global Growth and Efficiency Program, a $20 aftertax charge for acquisition-related costs, a $20 aftertax benefit related to a value-added tax matter in Brazil and a $29 tax benefit related to Swiss income tax reform. |
127
COLGATE-PALMOLIVE COMPANY
Historical Financial Summary
For the years ended December 31,
(Dollars in Millions Except Per Share Amounts)
(Unaudited)
(2) | Net income attributable to Colgate-Palmolive Company and earnings per common share for the full year of 2018 include $125 of aftertax charges related to the Global Growth and Efficiency Program, a $15 benefit from a foreign tax matter, and an $80 charge related to U.S. tax reform. |
(3) | Net income attributable to Colgate-Palmolive Company and earnings per common share for the full year of 2017 include $246 of aftertax charges related to the Global Growth and Efficiency Program and a $275 charge related to U.S. tax reform. |
(4) | Net income attributable to Colgate-Palmolive Company and earnings per common share for the full year of 2016 include $168 of aftertax charges related to the Global Growth and Efficiency Program, a $63 aftertax gain on the sale of land in Mexico, $11 of aftertax charges for a litigation matter and $35 of benefits from tax matters. |
(5) | Net income attributable to Colgate-Palmolive Company and earnings per common share for the full year of 2015 include a $1,058 aftertax charge related to the change in accounting for the Company’s Venezuelan operations, $183 of aftertax charges related to the Global Growth and Efficiency Program, $22 of aftertax charges related to the remeasurement of CP Venezuela’s local currency-denominated net monetary assets as a result of effective devaluations, $120 aftertax gain on the sale of the South Pacific laundry detergent business, a $14 aftertax charge for a litigation matter and a $15 charge for a tax matter. |
(6) | Net income attributable to Colgate-Palmolive Company and earnings per common share in 2014 include $208 of aftertax charges related to the Global Growth and Efficiency Program, $214 of aftertax charges related to the remeasurement of CP Venezuela’s local currency-denominated net monetary assets as a result of effective devaluations, $41 of charges for litigation matters, $3 of aftertax costs related to the sale of land in Mexico and a $66 charge for a tax matter. |
(7) | Net income attributable to Colgate-Palmolive Company and earnings per common share in 2013 include $278 of aftertax charges related to the Global Growth and Efficiency Program, a $111 aftertax charge related to the remeasurement of CP Venezuela’s local currency-denominated net monetary assets as a result of a devaluation, a $23 charge for a litigation matter and $12 of aftertax costs related to the sale of land in Mexico. |
(8) | Net income attributable to Colgate-Palmolive Company and earnings per common share in 2012 include $70 of aftertax charges related to the Global Growth and Efficiency Program, $18 of aftertax costs related to the sale of land in Mexico and $14 of aftertax costs associated with various business realignment and other cost-saving initiatives. |
(9) | Net income attributable to Colgate-Palmolive Company and earnings per common share in 2011 include an aftertax gain of $135 on the sale of the non-core laundry detergent business in Colombia, offset by $147 of aftertax costs associated with various business realignment and other cost-saving initiatives, $9 of aftertax costs related to the sale of land in Mexico and a $21 charge for a litigation matter. |
(10) | Net income attributable to Colgate-Palmolive Company and earnings per common share in 2010 include a $271 one-time charge related to the transition to hyperinflationary accounting in Venezuela, $61 of aftertax charges for termination benefits related to overhead reduction initiatives, a $30 aftertax gain on sales of non-core product lines and a $31 benefit related to the reorganization of an overseas subsidiary. |
128