Exhibit 99.1

Frontier Communications Reports First Quarter 2021 Financial Results
| • |
Net income of $60 million
|
| • |
Revenue of $1.68 billion, down 6.3% year-over-year, and Adjusted EBITDA of $670 million, down 2.3% year-over-year1, in line with expectations
|
| • |
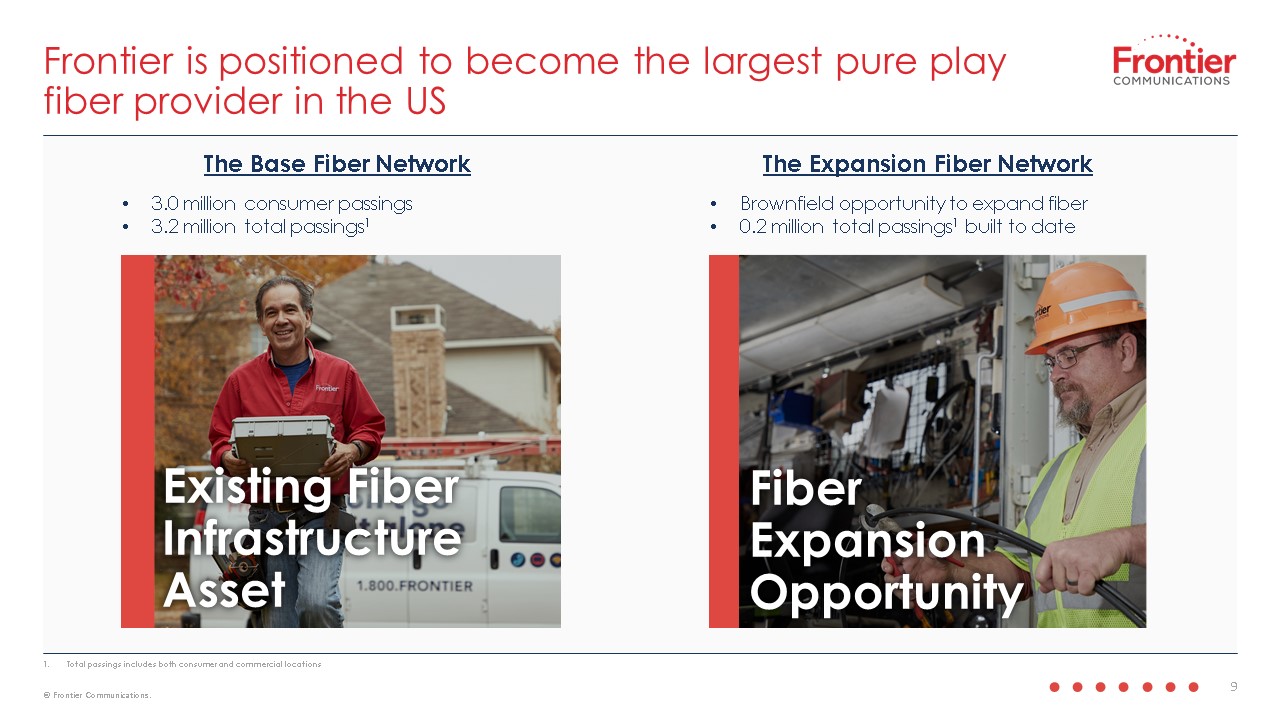
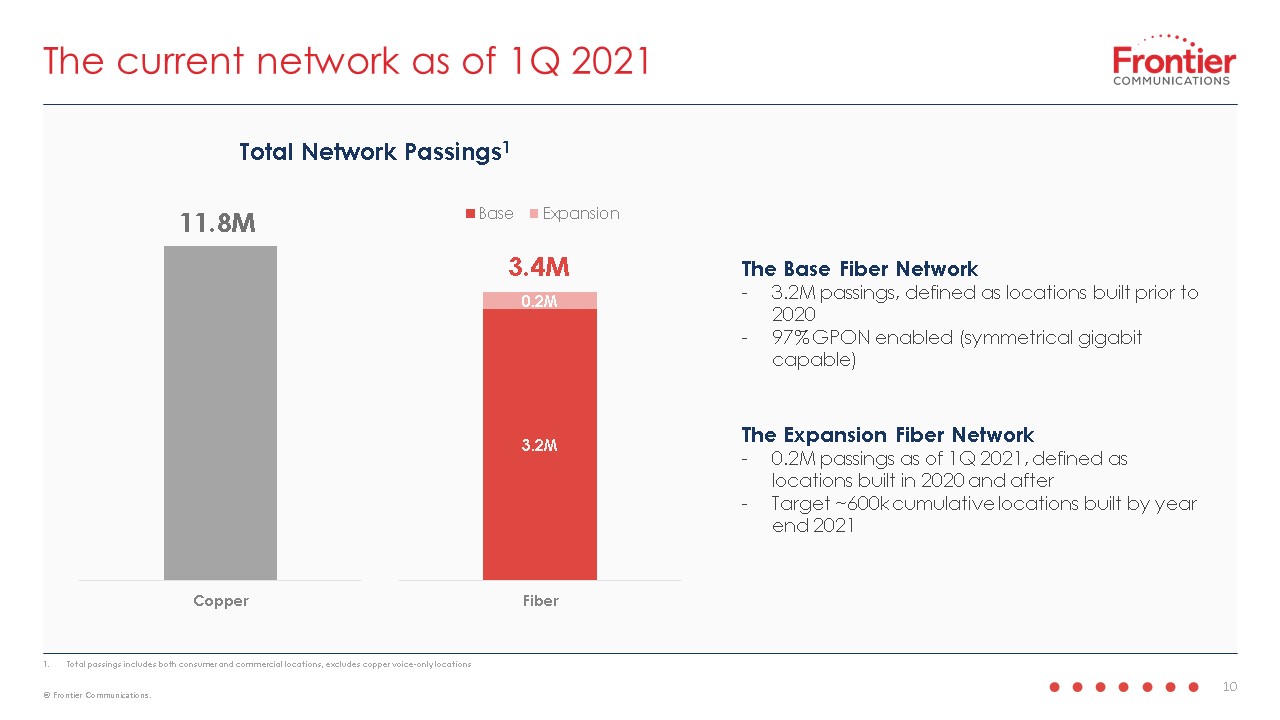
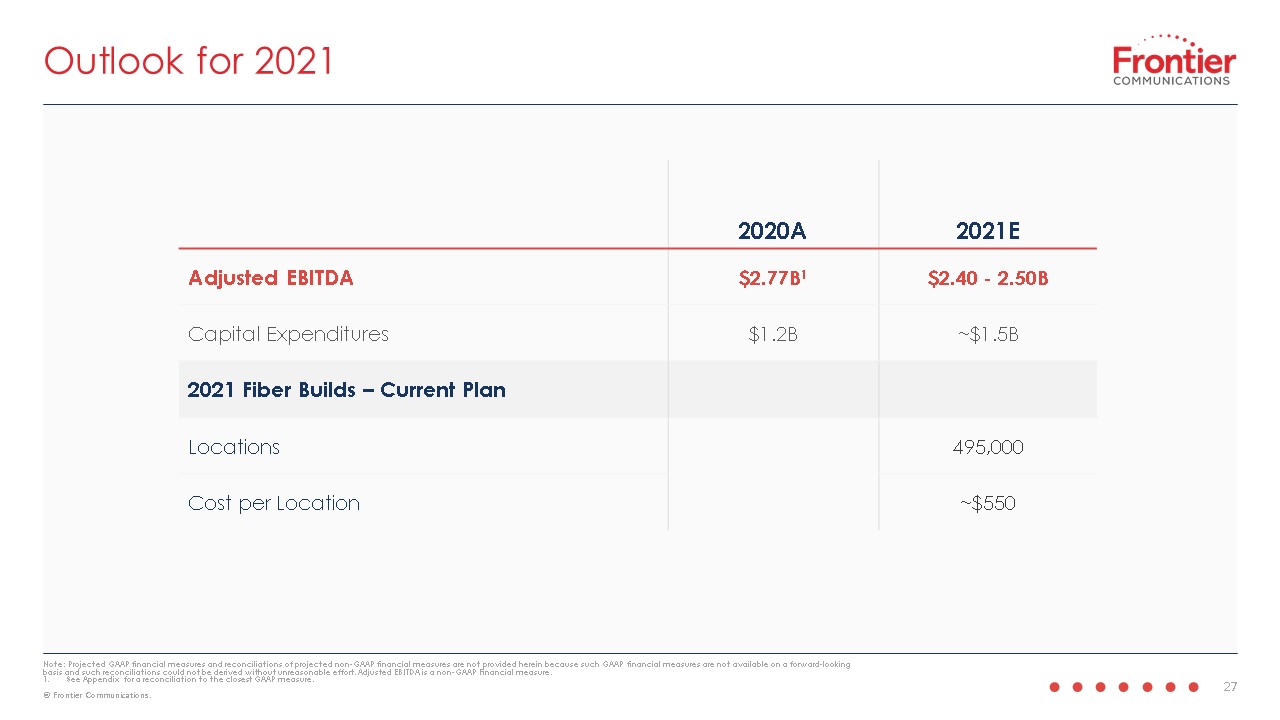
Expects to extend fiber network to 495,000 locations in 2021, with approximately 100,000 locations completed in the first quarter
|
| • |
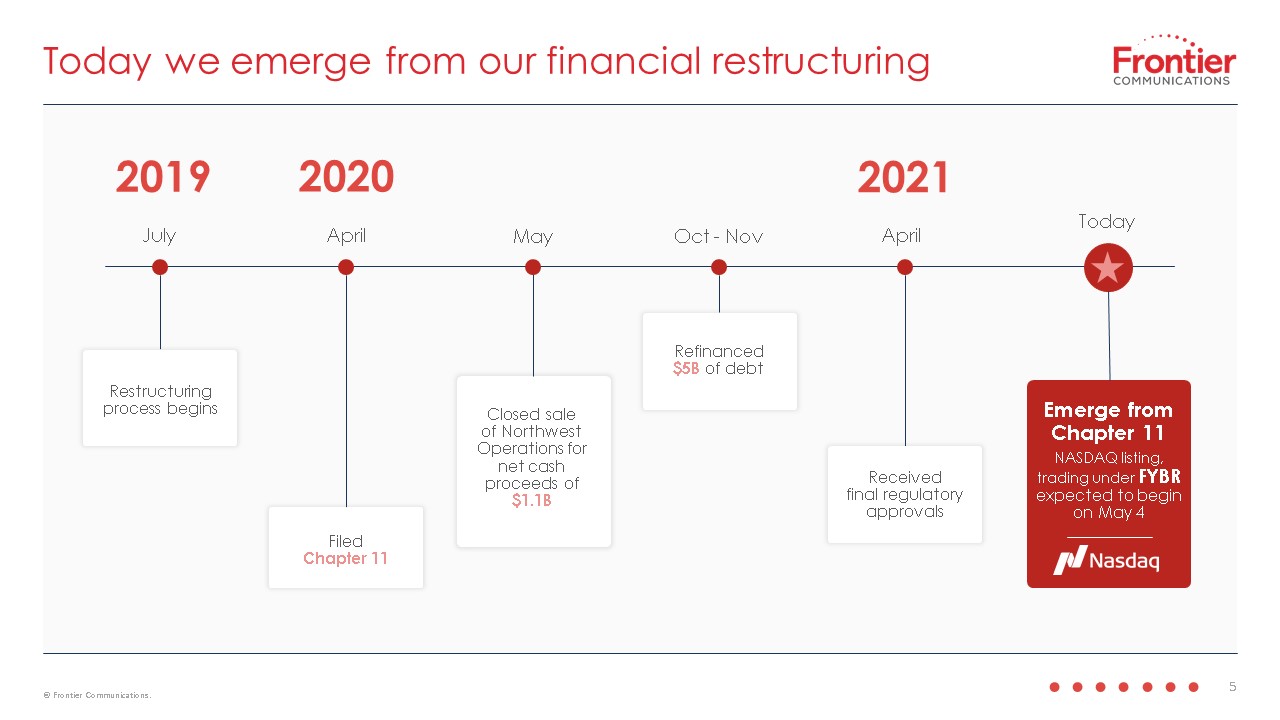
Expects to emerge today from Chapter 11 restructuring, reducing debt by approximately $11 billion and annual interest expense by approximately $1 billion
|
| • |
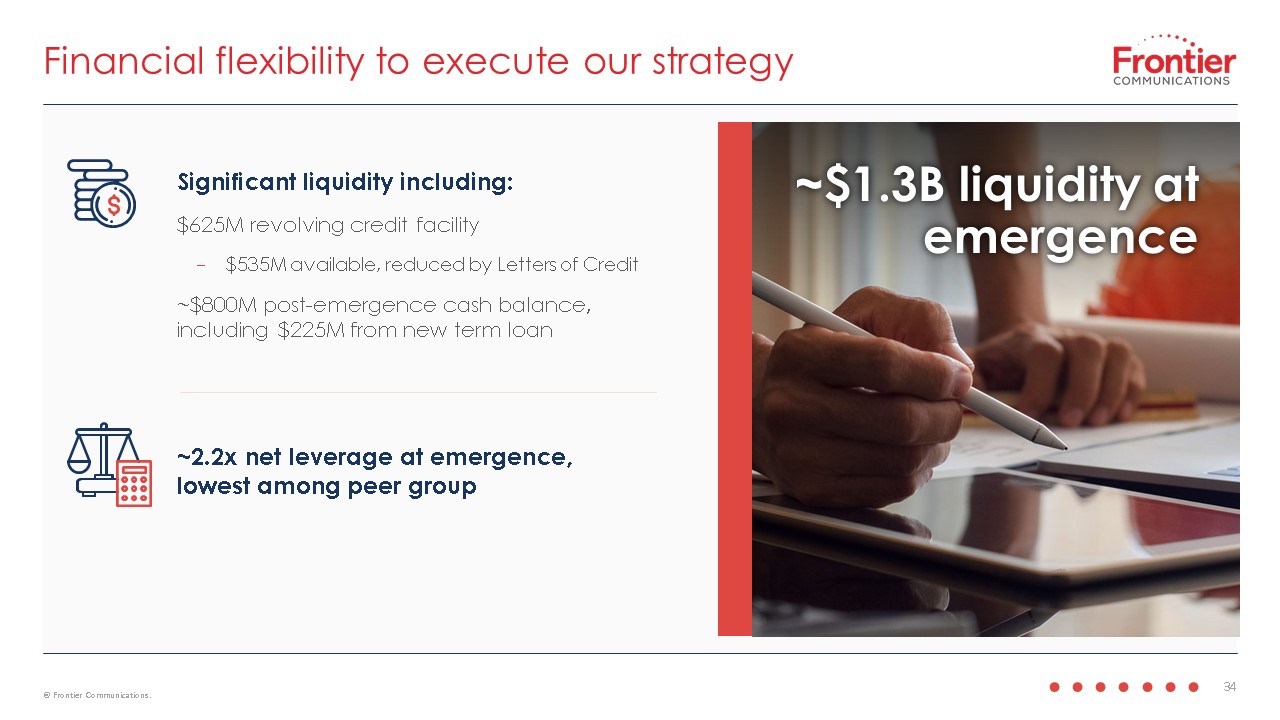
Liquidity of over $1.3 billion at emergence, creating flexibility to reinvest in fiber network expansion
|
| • |
Incoming Executive Chairman John Stratton, President and CEO Nick Jeffery, and CFO Sheldon Bruha to host presentation regarding first quarter results and path forward today at 10:00 AM ET
|
| • |
Investor Day announced for August 2021
|
NORWALK, Conn., Apr. 30, 2021 – Frontier Communications Corporation (“Frontier” or the “Company”) today reported financial results for the first quarter ended March 31, 2021.
Nick Jeffery, President and Chief Executive Officer of Frontier, said, “Frontier is now positioned with operational momentum and industry-leading leverage ratios to
capitalize on the major growth forecast in the US fiber market. At this pivotal moment in the company’s evolution, we look forward to rapidly expanding our fiber footprint, delivering enhanced customer service offerings and value, and accelerating
our efforts to build Gigabit America. Building on our first quarter performance, I am thrilled to announce our plan to expand our fiber footprint to 495,000 new locations in 2021.”
First Quarter 2021 Financial Results1
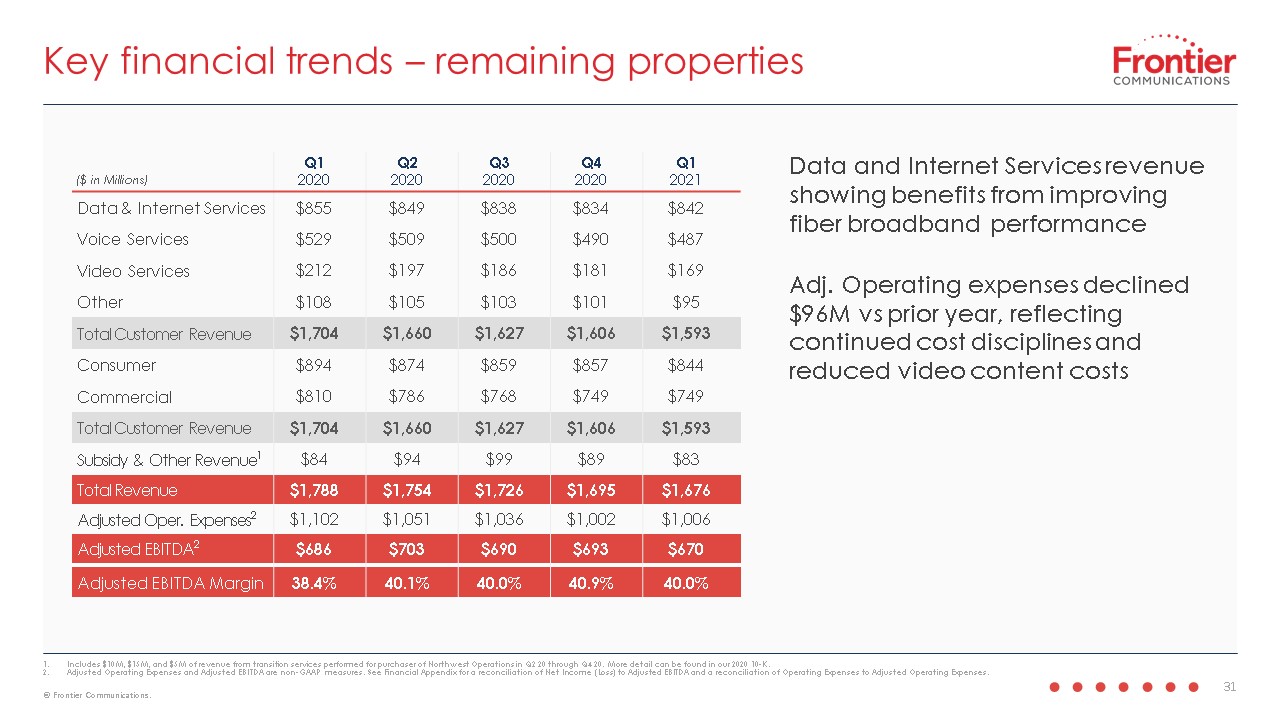
Frontier reported consolidated revenue for the first quarter of 2021 of $1.68 billion, a 6.3% decline from consolidated revenue reported in the first quarter of 2020.
While overall Data and Internet Services revenue decreased $13 million in the first quarter of 2021, or 1.5%, against the prior year, Frontier’s fiber broadband
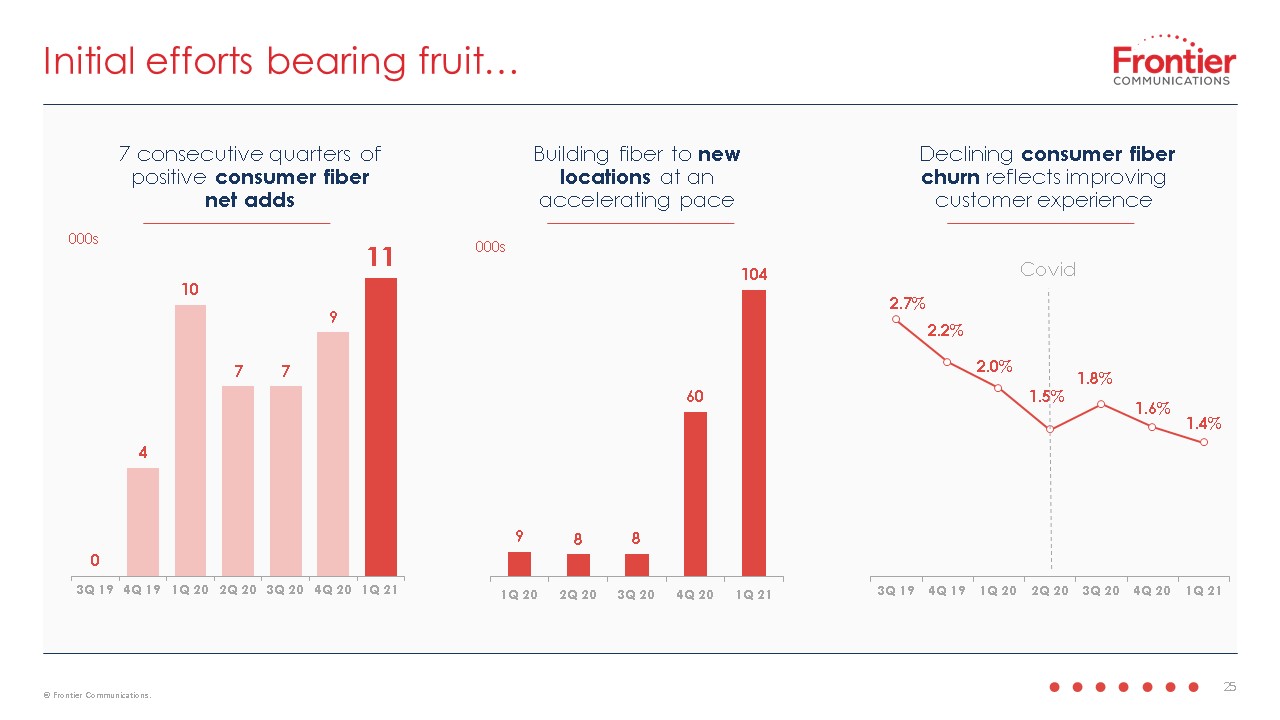
revenues grew by $19 million in the first quarter of 2021 compared to the prior year. Consumer fiber net adds were 11,000 in the quarter, the seventh consecutive quarter of positive consumer fiber net adds.
1 Prior Year Comparisons are Adjusted for Disposal of Northwest Operations. See Schedule D on page 14 and Schedule F on page 16 for reconciliation of
reported results to the results adjusted for the Disposal of Northwest Operations. Adjusted EBITDA is a non-GAAP measure of performance, See “Non-GAAP Measures” on page 4 for a description of this measure and its calculation. See Schedule A on
page 12 for a reconciliation of Adjusted EBITDA to net income/(loss).
- 1 of 18 -
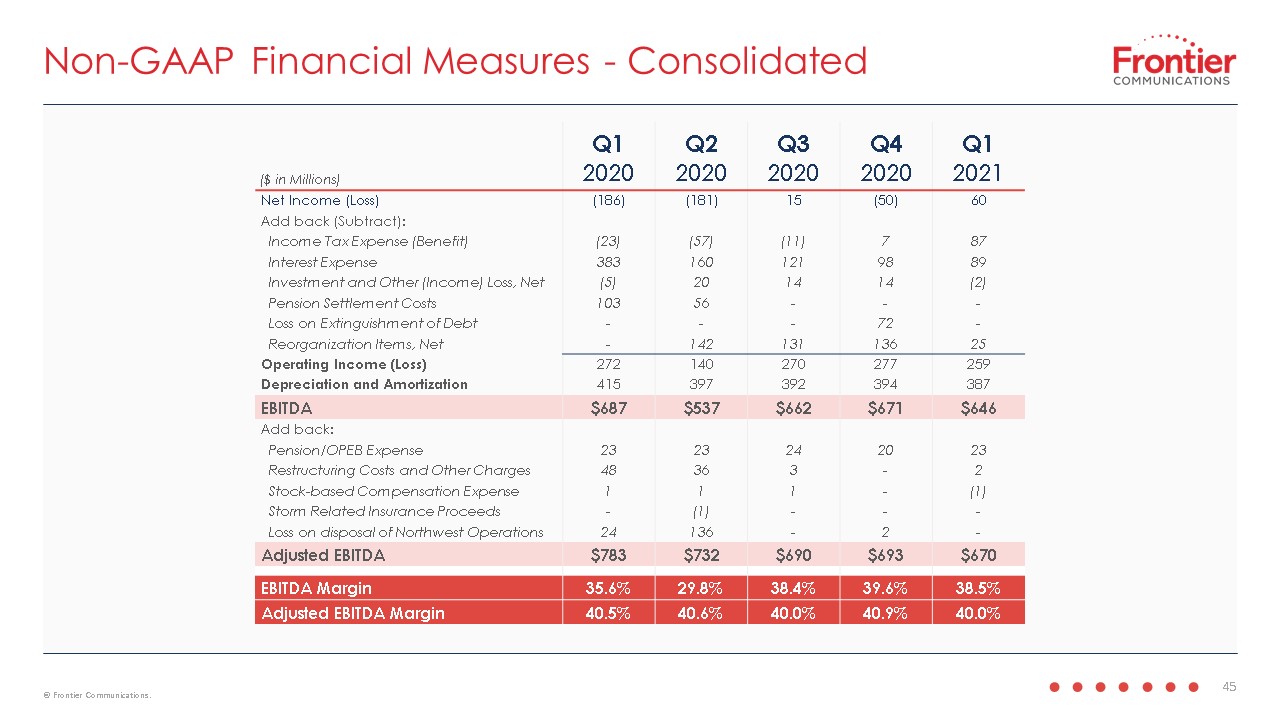
First quarter 2021 net income was $60 million. Adjusted EBITDA was $670 million and Adjusted EBITDA margin2 was 40.0%. This
compares with Adjusted EBITDA of $686 million and Adjusted EBITDA margin of 38.4% in the first quarter of 2020. The $16 million year-over-year decline in Adjusted EBITDA was driven by revenue declines, partially offset by cost savings initiatives
including the emphasis on reducing video content costs. Capital expenditures increased to $384 million in the quarter from $356 million in Q4 2020, as fiber expansion initiatives accelerate. During the quarter, Frontier built fiber to
approximately 100,000 new locations, more than the total number of locations it built in all of 2020.
Consumer Results
| • |
Consumer revenue was $844 million, down $50 million, or 5.6%, against prior year as fiber broadband growth was offset by video and voice subscriber losses.
|
| • |
Consumer customer churn was 1.45%, a strong improvement from 1.84% in the prior year.
|
| • |
Video revenue was impacted by subscriber losses, as video subscribers (excluding DISH) decreased by 141,000, or approximately 24% as the video bundle was deemphasized.
|
| • |
Fiber broadband ARPU increased $4 year-over-year from a higher speed mix, as well as price increases on new and existing accounts.
|
Commercial Results
| • |
Commercial revenue was $749 million, a $61 million decline, or approximately 7.5%, against prior year, driven by voice declines in our retail portion.
|
| • |
The wholesale portion of Commercial also declined reflecting proactive strategic repositioning with key business partners to reset pricing in exchange for higher win shares in the future and higher overall expected cash flow stability.
|
Sheldon Bruha, Chief Financial Officer, said, “Our early progress in implementing operational initiatives that enhance customer retention, simplify our internal
processes, and reduce costs reflect a solid start to the year. Looking ahead, our expected emergence later today provides the opportunity to aggressively reinvest in expanding our fiber business and strengthening the customer experience.”
John Stratton, incoming Executive Chairman of the Board, said, “As Frontier transitions from its financial restructuring to its new course
as a revitalized public company we are encouraged by what has been accomplished and enthusiastic about the future. Frontier is in a very strong position to accelerate the implementation of our fiber expansion plan and continually enhance the
customer experience. The incoming Board of Directors is excited to work with the team to capture the significant opportunities that lie ahead.”
2 Adjusted EBITDA margin is a non-GAAP measure of performance, calculated as Adjusted EBITDA, divided by total revenue. See “Non-GAAP Measures” on page 5
for a description of this measure and its calculation. See Schedule A on page 12 for a reconciliation of Adjusted EBITDA to net loss.
- 2 of 18 -
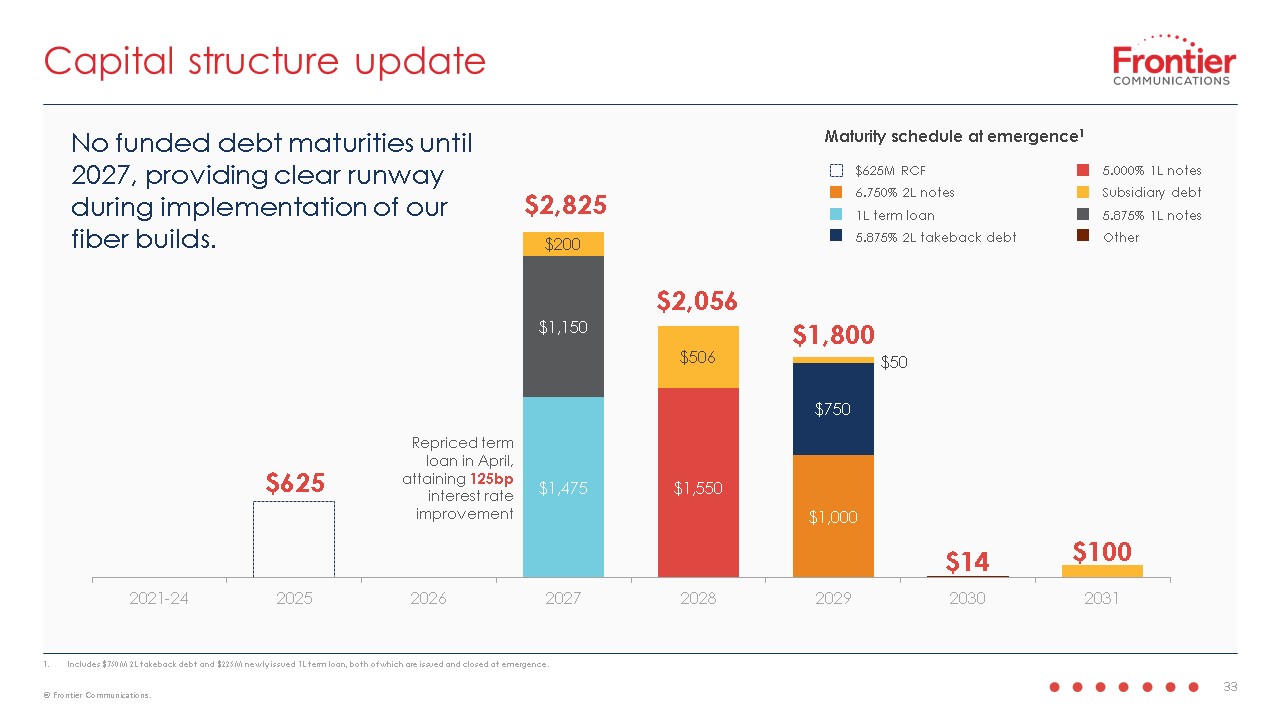
Capital Structure
In addition to the significant debt reduction accomplished in the Chapter 11 process, Frontier continues to take advantage of favorable market conditions to reduce
interest expense and enhance liquidity. Some capital structure changes year-to-date include:
| • |
Issuing $750 million of takeback second lien debt to existing noteholders concurrent with today’s expected emergence as contemplated by the Plan of Reorganization, with a coupon of 5.875%;
|
| • |
Repricing the $1.25 billion Term Loan facility and reducing the interest rate by 125bps, resulting in approximately $16 million in annual interest savings;
|
| • |
Raising an incremental $225 million of First Lien Term Loan expected to close concurrent with emergence; and
|
| • |
At emergence, the company is expected to have total liquidity3 of approximately $1.3B and an expected net debt to Adjusted EBITDA ratio of approximately of 2.2x.
|
Stock Trading Update
| • |
Concurrent with emergence, Frontier will issue approximately 244 million shares of new common stock to its senior unsecured noteholders. Together with the 6% of shares reserved under the Management
Incentive Plan (MIP), there will be approximately 260 million shares outstanding.
|
| • |
Frontier expects the new common stock to begin trading on the NASDAQ on May 4, 2021 under the ticker FYBR.
|
| • |
The pre-emergence common stock (trading under OTC: FTRCQ) will be extinguished and will not receive any new equity or other considerations, as provided in the Plan of Reorganization.
|
For more information on the new and previously issued common stock,
please visit www.frontier.com/ir.
2021 Outlook and Investor Day
Frontier has established operational and financial guidance expectations for 2021. Upon emergence from Chapter 11, Frontier expects to adopt fresh
start accounting in accordance with ASC 852. The impact of the application of fresh start accounting and any associated accounting policy changes will be determined by management upon and following emergence and, as such, the guidance below does
not reflect any such impact.
3 Total liquidity consists of cash and cash equivalents and available capacity under the Revolving Credit Facility.
- 3 of 18 -
Frontier’s guidance for the full year 2021 is as follows:
| • |
Adjusted EBITDA of $2.4-$2.5 billion4
|
| o |
Decrease from $2.8 billion in 2020 (adjusted for the sale of the Northwest operations), driven by strategic repositioning within Wholesale, secular declines of voice and copper broadband, and higher fiber
broadband customer acquisition costs, partially offset by growth in fiber broadband revenue
|
| • |
Cash taxes of approximately $50 million
|
| • |
Cash interest payments of approximately $365 million
|
| • |
Cash pension and OPEB of approximately $120 million (net of capitalization)
|
| • |
Cash capital expenditures of approximately $1.5 billion
|
| o |
Increase versus $1.2 billion in 2020 (not adjusted for Disposal of Northwest Operations) primarily driven by fiber expansion efforts accelerating during the year
|
| • |
Fiber build to 495,000 locations in 2021
|
| o |
Incremental cash cost to build estimated at approximately $550 per location
|
| o |
Level of the 2021 fiber build continues to be evaluated by new executive management
|
Frontier will hold an investor day in August 2021 following the completion of a strategic business review by the new Board of Directors and
management.
Conference Call and Webcast
Frontier will host a conference call today at 10 AM Eastern time,
followed by a question and answer session. In connection with the conference call, Frontier furnished today, under cover of a Current Report on Form 8-K, additional materials regarding its quarterly results. The conference call will be webcast
and may be accessed in the Webcasts & Presentations section of Frontier's Investor Relations website at www.frontier.com/ir.
A replay of the conference call will be available in the Webcasts
& Presentations section of Frontier's Investor Relations website at www.frontier.com/ir.
About Frontier Communications
Frontier Communications offers a variety of services to residential and business customers over its fiber-optic and copper networks in 25 states,
including video, high-speed Internet, advanced voice, and Frontier Secure® digital protection solutions. Frontier Business™ offers communications solutions to small, medium, and enterprise businesses. More information about Frontier is available
at www.frontier.com.
4 Projected GAAP financial measures and reconciliations of projected non-GAAP financial measures are not provided
herein because such GAAP financial measures are not available on a forward-looking basis and such reconciliations could
not be derived without unreasonable effort
- 4 of 18 -
Non-GAAP Financial Measures
Frontier uses certain non-GAAP financial measures in evaluating its performance, including EBITDA, EBITDA margin, Adjusted EBITDA, Adjusted EBITDA
margin, operating free cash flow, adjusted operating expenses, and leverage ratio, each of which is described below. Management uses these non-GAAP financial measures internally to (i) assist in analyzing Frontier's underlying financial
performance from period to period, (ii) analyze and evaluate strategic and operational decisions, (iii) establish criteria for compensation decisions, and (iv) assist in the understanding of Frontier's ability to generate cash flow and, as a
result, to plan for future capital and operational decisions. Management believes that the presentation of these non-GAAP financial measures provides useful information to investors regarding Frontier’s financial condition and results of
operations because these measures, when used in conjunction with related GAAP financial measures (i) provide a more comprehensive view of Frontier’s core operations and ability to generate cash flow, (ii) provide investors with the financial
analytical framework upon which management bases financial, operational, compensation, and planning decisions and (iii) present measurements that investors and rating agencies have indicated to management are useful to them in assessing Frontier
and its results of operations.
A reconciliation of these measures to the most comparable financial measures calculated and presented in accordance with GAAP is included in the
accompanying tables. These non-GAAP financial measures are not measures of financial performance or liquidity under GAAP, nor are they alternatives to GAAP measures and they may not be comparable to similarly titled measures of other companies.
EBITDA is defined as net income (loss) less income tax expense (benefit), interest expense, investment and other income (loss), pension settlement
costs, gains/losses on extinguishment of debt, reorganization items, and depreciation and amortization. EBITDA margin is calculated by dividing EBITDA by total revenue.
Adjusted EBITDA is defined as EBITDA, as described above, adjusted to
exclude, certain pension/OPEB expenses, restructuring costs and other charges, stock-based compensation, and certain other non-recurring items. Adjusted EBITDA margin is calculated by dividing Adjusted EBITDA by total revenue.
Management uses EBITDA, EBITDA margin, Adjusted EBITDA and Adjusted EBITDA margin to assist it in comparing performance from period to period and
as measures of operational performance. Management believes that these non-GAAP measures provide useful information for investors in evaluating Frontier’s operational performance from period to period because they exclude depreciation and
amortization expenses related to investments made in prior periods and are determined without regard to capital structure or investment activities. By excluding capital expenditures, debt repayments and dividends, among other factors, these
non-GAAP financial measures have certain shortcomings. Management compensates for these shortcomings by utilizing these non-GAAP financial measures in conjunction with the comparable GAAP financial measures.
Adjusted net income (loss) attributable to Frontier common
shareholders is defined as net income (loss) attributable to Frontier common shareholders and excludes restructuring costs and other charges, pension settlement costs, reorganization
items, certain income tax items and the income tax effect of these items, and certain other non-recurring items. Adjusting for these items allows investors to better understand and analyze Frontier’s
financial performance over the periods presented.
- 5 of 18 -
Management
defines operating free cash flow, a non-GAAP measure, as net cash provided from operating activities less capital expenditures. Management uses operating free cash flow to assist it in comparing liquidity from period to period and to obtain a more comprehensive view of Frontier’s core operations and ability to generate cash flow. Management believes that this non-GAAP measure is useful to investors in
evaluating cash available to service debt and pay dividends. This non-GAAP financial measure has certain shortcomings; it does not represent the residual cash flow available for discretionary
expenditures, as items such as debt repayments and preferred stock dividends are not deducted in determining such measure. Management compensates for these shortcomings by utilizing this non-GAAP financial measure in conjunction with the
comparable GAAP financial measure.
Adjusted operating expenses is defined as operating expenses adjusted to exclude depreciation and
amortization, restructuring and other charges, goodwill impairment charges, certain pension/OPEB expenses, stock-based compensation, and certain other non-recurring items. Investors have indicated that this non-GAAP measure is useful in
evaluating Frontier’s performance.
Leverage ratio is calculated as net debt (total debt less cash and cash equivalents) divided by Adjusted EBITDA for the most recent four quarters. Investors have
indicated that this non-GAAP measure is useful in evaluating Frontier’s debt levels.
The information in this press release should be read in conjunction with the financial statements and footnotes contained in Frontier’s documents
filed with the U.S. Securities and Exchange Commission.
- 6 of 18 -
Forward-Looking Statements
This press release contains "forward-looking statements," related to future events. Forward-looking statements address Frontier’s expected future business, financial
performance, and financial condition, and contain words such as "expect," "anticipate," "intend," "plan," "believe," "seek," "see," "may," "will," "would," or "target." Forward-looking statements by their nature address matters that are, to
different degrees, uncertain. Uncertainties that could cause our actual results to be materially different than those expressed in our forward-looking statements include, but are not limited to: our ability to realize the anticipated benefits of
the financial restructuring of our existing debt, existing equity interests and certain other obligations pursuant to the Fifth Amended Joint Plan of Reorganization of Frontier Communications Corporation and Its Debtor Affiliates Pursuant to
Chapter 11 of the Bankruptcy Code; our ability to comply with the restrictions imposed by covenants in our financing; declines in revenue from our voice services, switched and nonswitched access and video and data services that we cannot
stabilize or offset with increases in revenue from other products and services; our ability to successfully implement strategic initiatives, including opportunities to enhance revenue and realize productivity improvements; our ability to
effectively manage our operations, operating expenses, capital expenditures, debt service requirement and cash paid for income taxes and liquidity; competition from cable, wireless and wireline carriers, satellite, and over the top companies, and
the risk that we will not respond on a timely or profitable basis; our ability to successfully adjust to changes in the communications industry, including the effects of technological changes and competition on our capital expenditures, products
and service offerings; risks related to disruption in our networks, infrastructure and information technology that result in customer loss and/or incurrence of additional expenses; the impact of potential information technology or data security
breaches or other cyber-attacks or other disruptions; our ability to retain or attract new customers and to maintain relationships with customers, employees or suppliers; our ability to secure, continue to use or renew intellectual property and
other licenses used in our business; changes to our board of directors and management team upon emergence from bankruptcy or in anticipation of emergence, and our ability to hire or retain key personnel; our ability to dispose of certain assets
or asset groups on terms that are attractive to us, or at all; the effects of changes in the availability of federal and state universal service funding or other subsidies to us and our competitors and our ability to obtain future subsidies,
including participation in the proposed RDOF program; our ability to meet our CAF II obligations and the risk of penalties or obligations to return certain CAF II funds; our ability to defend against litigation and potentially unfavorable results
from current pending and future litigation; our ability to comply with applicable federal and state consumer protection requirements; the effects of state regulatory requirements that could limit our ability to transfer cash among our
subsidiaries or dividend funds up to the parent company; the effects of governmental legislation and regulation on our business, including costs, disruptions, possible limitations on operating flexibility and changes to the competitive landscape
resulting from such legislation or regulation; the impact of regulatory, investigative and legal proceedings and legal compliance risks; government infrastructure projects (such as highway construction) that impact our capital expenditures;
continued reductions in switched access revenues as a result of regulation, competition or technology substitutions; our ability to effectively manage service quality in the states in which we operate and meet mandated service quality metrics;
the effects of changes in income tax rates, tax laws, regulations or rulings, or federal or state tax assessments, including the risk that such changes may benefit our competitors more than us, as well as potential future decreases in the value
of our deferred tax assets; the effects of changes in accounting policies or practices, including potential future impairment charges with respect to our intangible assets or additional losses on assets held for sale; the effects of increased
medical expenses and pension and postemployment expenses; our ability to successfully renegotiate union contracts; changes in pension plan assumptions, interest rates, discount rates, regulatory rules and/or the value of our pension plan assets,
which could require us to make increased contributions to the pension plan in 2020 and beyond; adverse changes in economic, political and market conditions in the areas that we serve, the U.S. and globally, including but not limited to, changes
resulting from epidemics, pandemics and outbreaks of contagious diseases, including the COVID-19 pandemic, or other adverse public health developments; potential adverse impacts of the COVID-19 pandemic on our business and operations, including
potential disruptions to the work of our employees arising from health and safety measures such as social distancing and working remotely, our ability to effectively manage increased demand on our network, our ability to maintain relationships
with our current or prospective customers and vendors as well as their abilities to perform under current or proposed arrangements with us, and stress on our supply chain; the trading price and volatility of our common stock; and the risks and
other factors contained in Frontier’s filings with the U.S. Securities and Exchange Commission, including our most recent report on Form 10-K. These risks and uncertainties may cause actual future results to be materially different than those
expressed in such forward-looking statements. Frontier has no obligation to update or revise these forward-looking statements and does not undertake to do so.
|
INVESTOR CONTACT:
|
MEDIA CONTACT:
|
|
Jacob Noyes
|
Javier Mendoz
|
|
Manager,
|
Vice President,
|
|
Treasury & Investor Relations
|
Corporate Communications & External Affairs
|
|
(203) 614-5074
|
(562) 305-2345
|
|
ir@ftr.com
|
javier.mendoza@ftr.com
|
- 7 of 18 -
Frontier Communications Corporation
(Debtor-In-Possession)
Unaudited Consolidated Financial Data
(Unaudited)
|
For the quarter ended
|
||||||||||||
|
($ in millions and shares in thousands, except per share amounts)
|
March 31, 2021
|
December 31, 2020
|
March 31, 2020
|
|||||||||
|
Statement of Operations Data
|
||||||||||||
|
Revenue
|
$
|
1,676
|
$
|
1,695
|
$
|
1,933
|
||||||
|
Operating expenses:
|
||||||||||||
|
Network access expenses
|
198
|
208
|
286
|
|||||||||
|
Network related expenses
|
422
|
421
|
444
|
|||||||||
|
Selling, general and administrative expenses
|
408
|
393
|
444
|
|||||||||
|
Depreciation and amortization
|
387
|
394
|
415
|
|||||||||
|
Loss on disposal of Northwest Operations
|
-
|
2
|
24
|
|||||||||
|
Restructuring costs and other charges
|
2
|
-
|
48
|
|||||||||
|
Total operating expenses
|
1,417
|
1,418
|
1,661
|
|||||||||
|
Operating income
|
259
|
277
|
272
|
|||||||||
|
|
||||||||||||
|
Investment and other income (loss), net
|
2
|
(14
|
)
|
5
|
||||||||
|
Pension settlement costs
|
-
|
-
|
(103
|
)
|
||||||||
|
Loss on early extinguishment of debt
|
-
|
(72
|
)
|
-
|
||||||||
|
Reorganization items, net
|
(25
|
)
|
(136
|
)
|
-
|
|||||||
|
Interest expense (contractual interest for the three months ended was $338 million)
|
(89
|
)
|
(98
|
)
|
(383
|
)
|
||||||
|
Income (loss) before income taxes
|
147
|
(43
|
)
|
(209
|
)
|
|||||||
|
Income tax expense (benefit)
|
87
|
7
|
(23
|
)
|
||||||||
|
Net income (loss)
|
60
|
(50
|
)
|
(186
|
)
|
|||||||
|
Weighted average shares outstanding - basic
|
104,556
|
104,489
|
104,363
|
|||||||||
|
Weighted average shares outstanding - diluted
|
104,896
|
104,489
|
104,363
|
|||||||||
|
Basic and diluted net earnings (loss) per common share
|
$
|
0.57
|
$
|
(0.48
|
)
|
$
|
(1.78
|
)
|
||||
|
Other Financial Data:
|
||||||||||||
|
Capital expenditures
|
$
|
384
|
$
|
356
|
$
|
286
|
||||||
- 8 of 18 -
Frontier Communications Corporation
(Debtor-In-Possession)
Unaudited Financial Data for Remaining Properties (Excluding Northwest Operations)
Note: The following table presents disaggregation of
revenue for the operations located in the remaining 25 states (“Remaining Properties”) after excluding the Northwest Operations (“Northwest Ops”) through the date of sale from the Consolidated Company’s results. See Schedule D for a reconciliation to
the Total Company Results.
|
For the quarter ended
|
||||||||||||
|
($ in millions)
|
March 31, 2021
|
December 31, 2020
|
March 31, 2020
|
|||||||||
|
Selected Statement of Operations Data
|
||||||||||||
|
Revenue:
|
||||||||||||
|
Data and Internet services
|
$
|
842
|
$
|
834
|
$
|
855
|
||||||
|
Voice services
|
487
|
490
|
529
|
|||||||||
|
Video services
|
169
|
181
|
212
|
|||||||||
|
Other
|
95
|
101
|
108
|
|||||||||
|
Revenue from contracts with customers
|
1,593
|
1,606
|
1,704
|
|||||||||
|
Subsidy and other revenue
|
83
|
89
|
84
|
|||||||||
|
Total revenue
|
$
|
1,676
|
$
|
1,695
|
$
|
1,788
|
||||||
|
Other Financial Data
|
||||||||||||
|
Revenue:
|
||||||||||||
|
Consumer
|
$
|
844
|
$
|
857
|
$
|
894
|
||||||
|
Commercial
|
749
|
749
|
810
|
|||||||||
|
Revenue from contracts with customers
|
1,593
|
1,606
|
1,704
|
|||||||||
|
Subsidy and other revenue
|
83
|
89
|
84
|
|||||||||
|
Total revenue
|
$
|
1,676
|
$
|
1,695
|
$
|
1,788
|
||||||
- 9 of 18 -
Frontier Communications Corporation
(Debtor-In-Possession)
Unaudited Operating Data for Remaining Properties (Excluding Northwest Operations)
Note: The following table presents operating metrics
for the operations located in the remaining 25 states (“Remaining Properties”) after excluding the Northwest Operations (“Northwest Ops”) through the date of sale from the Consolidated Company’s results. See Schedule E for a reconciliation to the
Total Company Results.
|
For the quarter ended
|
||||||||||||
|
March 31, 2021
|
December 31, 2020
|
March 31, 2020
|
||||||||||
|
Consumer customer metrics
|
||||||||||||
|
Customers (in thousands)
|
3,234
|
3,264
|
3,373
|
|||||||||
|
Net customer additions (losses)
|
(30
|
)
|
(42
|
)
|
(39
|
)
|
||||||
|
Average monthly consumer revenue per customer
|
$
|
86.60
|
$
|
87.00
|
$
|
87.88
|
||||||
|
Customer monthly churn
|
1.45
|
%
|
1.67
|
%
|
1.84
|
%
|
||||||
|
Broadband subscriber metrics
|
||||||||||||
|
Broadband subscribers (in thousands)
|
3,052
|
3,069
|
3,183
|
|||||||||
|
Net subscriber additions (losses)
|
(17
|
)
|
(49
|
)
|
(28
|
)
|
||||||
|
Video (excl. DISH) subscriber metrics
|
||||||||||||
|
Video subscribers (in thousands)
|
453
|
485
|
594
|
|||||||||
|
Net subscriber additions (losses)
|
(32
|
)
|
(33
|
)
|
(37
|
)
|
||||||
|
DISH subscriber metrics
|
||||||||||||
|
DISH subscribers (in thousands)
|
129
|
134
|
149
|
|||||||||
|
Net subscriber additions (losses)
|
(5
|
)
|
(5
|
)
|
(7
|
)
|
||||||
|
Employees
|
16,201
|
16,200
|
16,487
|
|||||||||
Frontier Communications Corporation
(Debtor-In-Possession)
Condensed Consolidated Balance Sheet Data
|
(Unaudited)
|
||||||||
|
($ in millions)
|
March 31, 2021
|
December 31, 2020
|
||||||
|
ASSETS
|
||||||||
|
Current assets:
|
||||||||
|
Cash and cash equivalents (1)
|
$
|
2,107
|
$
|
1,829
|
||||
|
Accounts receivable, net
|
519
|
553
|
||||||
|
Other current assets
|
221
|
272
|
||||||
|
Total current assets
|
2,847
|
2,654
|
||||||
|
Property, plant and equipment, net
|
12,987
|
12,931
|
||||||
|
Other assets
|
1,126
|
1,210
|
||||||
|
Total assets
|
$
|
16,960
|
$
|
16,795
|
||||
|
LIABILITIES AND EQUITY (DEFICIT)
|
||||||||
|
Current liabilities:
|
||||||||
|
Long-term debt due within one year
|
$
|
5,782
|
$
|
5,781
|
||||
|
Accounts payable and other current liabilities
|
1,369
|
1,359
|
||||||
|
Total current liabilities
|
7,151
|
7,140
|
||||||
|
Deferred income taxes and other liabilities
|
3,069
|
2,990
|
||||||
|
Liabilities subject to compromise
|
11,570
|
11,565
|
||||||
|
Equity (deficit)
|
(4,830
|
)
|
(4,900
|
)
|
||||
|
Total liabilities and equity (deficit)
|
$
|
16,960
|
$
|
16,795
|
||||
(1) On the effective date of our emergence from bankruptcy, an estimated $1,313 million of cash will be distributed to creditors as set
forth in the Plan of Reorganization.
- 10 of 18 -
Frontier Communications Corporation
(Debtor-In-Possession)
Consolidated Cash Flow Data
(Unaudited)
|
For the three months ended
|
||||||||
|
($ in millions)
|
March 31, 2021
|
March 31, 2020
|
||||||
|
Cash flows provided from (used by) operating activities:
|
||||||||
|
Net income (loss)
|
$
|
60
|
$
|
(186
|
)
|
|||
|
Adjustments to reconcile net loss to net cash provided from (used by) operating activities:
|
||||||||
|
Depreciation and amortization
|
387
|
415
|
||||||
|
Pension settlement costs
|
-
|
103
|
||||||
|
Stock-based compensation
|
(1
|
)
|
1
|
|||||
|
Amortization of deferred financing costs
|
-
|
8
|
||||||
|
Other adjustments
|
1
|
1
|
||||||
|
Deferred income taxes
|
84
|
(30
|
)
|
|||||
|
Loss on disposal of Northwest Operations
|
-
|
24
|
||||||
|
Change in accounts receivable
|
34
|
29
|
||||||
|
Change in accounts payable and other liabilities
|
48
|
110
|
||||||
|
Change in prepaid expenses, income taxes, and other assets
|
52
|
2
|
||||||
|
Net cash provided from operating activities
|
665
|
477
|
||||||
|
Cash flows provided from (used by) investing activities:
|
||||||||
|
Capital expenditures
|
(384
|
)
|
(286
|
)
|
||||
|
Proceeds on sale of assets
|
2
|
2
|
||||||
|
Other
|
2
|
2
|
||||||
|
Net cash used by investing activities
|
(380
|
)
|
(282
|
)
|
||||
|
Cash flows used by financing activities:
|
||||||||
|
Long-term debt payments
|
-
|
(5
|
)
|
|||||
|
Finance lease obligation payments
|
(5
|
)
|
(8
|
)
|
||||
|
Other
|
(2
|
)
|
-
|
|||||
|
Net cash used by financing activities
|
(7
|
)
|
(13
|
)
|
||||
|
Increase in cash, cash equivalents, and restricted cash
|
278
|
182
|
||||||
|
Cash, cash equivalents, and restricted cash at January 1,
|
1,887
|
809
|
||||||
|
Cash, cash equivalents, and restricted cash at March 31,
|
$
|
2,165
|
$
|
991
|
||||
|
Supplemental cash flow information:
|
||||||||
|
Cash paid during the period for:
|
||||||||
|
Interest
|
$
|
40
|
$
|
163
|
||||
|
Income tax payments, net
|
$
|
-
|
$
|
1
|
||||
|
Reorganization items, net
|
$
|
56
|
$
|
-
|
||||
- 11 of 18 -
SCHEDULE A
Frontier Communications Corporation
(Debtor-In-Possession)
Unaudited Financial Data for Remaining Properties (Excluding Northwest Operations)
Reconciliation of Non-GAAP Financial Measures
Note: The following table presents Non-GAAP Measures
for the operations located in the remaining 25 states (“Remaining Properties”) after excluding the Northwest Operations (“Northwest Ops”) through the date of sale from the Consolidated Company’s results. See Schedule F for a reconciliation to the
Total Company Results.
|
For the quarter ended
|
||||||||||||
|
($ in millions)
|
March 31, 2021
|
December 31, 2020
|
March 31, 2020
|
|||||||||
|
Net income (loss)
|
$
|
60
|
$
|
(50
|
)
|
$
|
(283
|
)
|
||||
|
Add back (subtract):
|
||||||||||||
|
Income tax expense (benefit)
|
87
|
7
|
(23
|
)
|
||||||||
|
Interest expense
|
89
|
98
|
383
|
|||||||||
|
Investment and other (income) loss, net
|
(2
|
)
|
14
|
(5
|
)
|
|||||||
|
Pension settlement costs
|
-
|
-
|
103
|
|||||||||
|
Loss on extinguishment of debt
|
-
|
72
|
-
|
|||||||||
|
Reorganization items, net
|
25
|
136
|
-
|
|||||||||
|
Operating income
|
259
|
277
|
175
|
|||||||||
|
Depreciation and amortization
|
387
|
394
|
415
|
|||||||||
|
EBITDA
|
$
|
646
|
$
|
671
|
$
|
590
|
||||||
|
Add back:
|
||||||||||||
|
Pension/OPEB expense
|
23
|
20
|
23
|
|||||||||
|
Restructuring costs and other charges
|
2
|
-
|
48
|
|||||||||
|
Stock-based compensation
|
(1
|
)
|
-
|
1
|
||||||||
|
Loss on disposal of Northwest Operations
|
-
|
2
|
24
|
|||||||||
|
Adjusted EBITDA
|
$
|
670
|
$
|
693
|
$
|
686
|
||||||
|
EBITDA margin
|
38.5
|
%
|
39.6
|
%
|
33.0
|
%
|
||||||
|
Adjusted EBITDA margin
|
40.0
|
%
|
40.9
|
%
|
38.4
|
%
|
||||||
- 12 of 18 -
SCHEDULE B
Frontier Communications Corporation
(Debtor-In-Possession)
Reconciliation of Non-GAAP Financial Measures for Total Consolidated Operations
|
For the quarter ended
|
||||||||||||||||||||||||
|
March 31, 2021
|
December 31, 2020
|
March 31, 2020
|
||||||||||||||||||||||
|
($ in millions,
except per share amounts)
|
Net Income
(Loss)
|
Basic
Earnings
(Loss) Per
Share
|
Net Income
(Loss)
|
Basic
Earnings
(Loss) Per
Share
|
Net Income
(Loss)
|
Basic
Earnings
(Loss) Per
Share
|
||||||||||||||||||
|
Net income (loss) attributable to Frontier common shareholders
|
$
|
60
|
$
|
0.57
|
$
|
(50
|
)
|
$
|
(0.48
|
)
|
$
|
(186
|
)
|
$
|
(1.78
|
)
|
||||||||
|
Restructuring costs and other charges
|
2
|
-
|
48
|
|||||||||||||||||||||
|
Pension settlement costs
|
-
|
-
|
103
|
|||||||||||||||||||||
|
Reorganization items, net
|
25
|
136
|
-
|
|||||||||||||||||||||
|
Loss on extinguishment of debt
|
-
|
72
|
-
|
|||||||||||||||||||||
|
Loss on disposal of Northwest Operations
|
-
|
2
|
24
|
|||||||||||||||||||||
|
Certain other tax items (1)
|
41
|
51
|
13
|
|||||||||||||||||||||
|
Income tax effect on above items:
|
||||||||||||||||||||||||
|
Restructuring costs and other charges
|
(1
|
)
|
-
|
(10
|
)
|
|||||||||||||||||||
|
Pension settlement costs
|
-
|
-
|
(25
|
)
|
||||||||||||||||||||
|
Reorganization items, net
|
(7
|
)
|
(2
|
)
|
-
|
|||||||||||||||||||
|
Loss on extinguishment of debt
|
-
|
(31
|
)
|
-
|
||||||||||||||||||||
|
Loss on disposal of business
|
-
|
(8
|
)
|
-
|
||||||||||||||||||||
|
$
|
60
|
$
|
0.57
|
$
|
220
|
$
|
2.11
|
$
|
153
|
$
|
1.47
|
|||||||||||||
|
Adjusted net income (loss) attributable to
Frontier common shareholders(2)
|
$
|
120
|
$
|
1.15
|
$
|
170
|
$
|
1.63
|
$
|
(33
|
)
|
$
|
(0.32
|
)
|
||||||||||
(1) Includes impact arising from federal research and development credits, changes in certain deferred tax balances, interest expense deductions, state tax law
changes, state filing method change, and the net impact of uncertain tax positions.
(2) Adjusted net income (loss) attributable to Frontier common shareholders may not sum due to rounding.
SCHEDULE C
Frontier Communications Corporation
(Debtor-In-Possession)
Reconciliation of Non-GAAP Financial Measures for Remaining Properties (Excluding Northwest Operations)
Note: The following table presents Non-GAAP Measures
for the operations located in the remaining 25 states (“Remaining Properties”) after excluding the Northwest Operations (“Northwest Ops”) through the date of sale from the Consolidated Company’s results. See Schedule G for a reconciliation to the
Total Company Results.
|
For the quarter ended
|
||||||||||||
|
($ in millions)
|
March 31, 2021
|
December 31, 2020
|
March 31, 2020
|
|||||||||
|
Adjusted Operating Expenses
|
||||||||||||
|
Total operating expenses
|
$
|
1,417
|
$
|
1,418
|
$
|
1,613
|
||||||
|
Subtract:
|
||||||||||||
|
Depreciation and amortization
|
387
|
394
|
415
|
|||||||||
|
Loss on disposal of Northwest Operations
|
-
|
2
|
24
|
|||||||||
|
Pension/OPEB expense
|
23
|
20
|
23
|
|||||||||
|
Restructuring costs and other charges
|
2
|
-
|
48
|
|||||||||
|
Stock-based compensation
|
(1
|
)
|
-
|
1
|
||||||||
|
Adjusted operating expenses
|
$
|
1,006
|
$
|
1,002
|
$
|
1,102
|
||||||
- 13 of 18 -
SCHEDULE D
Frontier Communications Corporation
(Debtor-In-Possession)
Reconciliation of Non-GAAP Financial Measures for Remaining Properties to Consolidated Frontier
|
For the quarter ended
|
||||||||||||||||||||
|
March 31, 2021
|
December 31, 2020
|
March 31, 2020
|
||||||||||||||||||
|
Consolidated
|
Consolidated
|
Consolidated
|
Northwest
|
Remaining
|
||||||||||||||||
|
($ in millions)
|
Frontier
|
Frontier
|
Frontier
|
Ops (1)
|
Properties
|
|||||||||||||||
|
Data and Internet services
|
$
|
842
|
$
|
834
|
$
|
932
|
$
|
77
|
$
|
855
|
||||||||||
|
Voice services
|
487
|
490
|
572
|
43
|
529
|
|||||||||||||||
|
Video services
|
169
|
181
|
222
|
10
|
212
|
|||||||||||||||
|
Other
|
95
|
101
|
117
|
9
|
108
|
|||||||||||||||
|
Revenue from contracts with customers
|
1,593
|
1,606
|
1,843
|
139
|
1,704
|
|||||||||||||||
|
Subsidy revenue
|
83
|
89
|
90
|
6
|
84
|
|||||||||||||||
|
Revenue
|
1,676
|
1,695
|
1,933
|
145
|
1,788
|
|||||||||||||||
|
Operating expenses (2):
|
||||||||||||||||||||
|
Network access expenses
|
198
|
208
|
286
|
10
|
276
|
|||||||||||||||
|
Network related expenses
|
422
|
421
|
444
|
19
|
425
|
|||||||||||||||
|
Selling, general and administrative expenses
|
408
|
393
|
444
|
19
|
425
|
|||||||||||||||
|
Depreciation and amortization
|
387
|
394
|
415
|
-
|
415
|
|||||||||||||||
|
Loss on disposal of Northwest Operations
|
-
|
2
|
24
|
-
|
24
|
|||||||||||||||
|
Restructuring costs and other charges
|
2
|
-
|
48
|
-
|
48
|
|||||||||||||||
|
Total operating expenses
|
1,417
|
1,418
|
1,661
|
48
|
1,613
|
|||||||||||||||
|
Operating income
|
259
|
277
|
272
|
97
|
175
|
|||||||||||||||
|
Consumer
|
$
|
844
|
$
|
857
|
$
|
971
|
$
|
77
|
$
|
894
|
||||||||||
|
Commercial
|
749
|
749
|
872
|
62
|
810
|
|||||||||||||||
|
Revenue from contracts with customers
|
1,593
|
1,606
|
1,843
|
139
|
1,704
|
|||||||||||||||
|
Subsidy revenue
|
83
|
89
|
90
|
6
|
84
|
|||||||||||||||
|
Total revenue
|
$
|
1,676
|
$
|
1,695
|
$
|
1,933
|
$
|
145
|
$
|
1,788
|
||||||||||
(1) Amounts represent the financial results of our Northwest Operations for the three months ended March 31, 2020.
(2) Operating expenses for Northwest Ops do not include allocated expenses which are included in operating expenses for our Remaining Properties.
- 14 of 18 -
SCHEDULE E
Frontier Communications Corporation
(Debtor-In-Possession)
Unaudited Operating Data for Remaining Properties (Excluding Northwest Operations)
|
For the quarter ended
|
||||||||||||||||||||
|
March 31, 2021
|
December 31, 2020
|
March 31, 2020
|
||||||||||||||||||
|
Consolidated
|
Consolidated
|
Consolidated
|
Northwest
|
Remaining
|
||||||||||||||||
|
Frontier
|
Frontier
|
Frontier
|
Ops
|
Properties
|
||||||||||||||||
|
Customers (in thousands)
|
3,553
|
3,571
|
4,063
|
N/A
|
N/A
|
|||||||||||||||
|
Consumer customer metrics
|
||||||||||||||||||||
|
Customers (in thousands)
|
3,234
|
3,264
|
3,703
|
330
|
3,373
|
|||||||||||||||
|
Net customer additions (losses)
|
(30
|
)
|
(42
|
)
|
(44
|
)
|
(5
|
)
|
(39
|
)
|
||||||||||
|
Average monthly consumer revenue per customer
|
$
|
86.60
|
$
|
87.00
|
$
|
86.93
|
$
|
77.22
|
$
|
87.88
|
||||||||||
|
Customer monthly churn
|
1.45
|
%
|
1.67
|
%
|
1.81
|
%
|
1.52
|
%
|
1.84
|
%
|
||||||||||
|
Commercial customer metrics
|
||||||||||||||||||||
|
Customers (in thousands)
|
319
|
307
|
360
|
N/A
|
N/A
|
|||||||||||||||
|
Broadband subscriber metrics
|
||||||||||||||||||||
|
Broadband subscribers (in thousands)
|
3,052
|
3,069
|
3,480
|
297
|
3,183
|
|||||||||||||||
|
Net subscriber additions (losses)
|
(17
|
)
|
(49
|
)
|
(33
|
)
|
(5
|
)
|
(28
|
)
|
||||||||||
|
Video (excl. DISH) subscriber metrics
|
||||||||||||||||||||
|
Video subscribers (in thousands)
|
453
|
485
|
621
|
27
|
594
|
|||||||||||||||
|
Net subscriber additions (losses)
|
(32
|
)
|
(33
|
)
|
(39
|
)
|
(2
|
)
|
(37
|
)
|
||||||||||
|
DISH subscriber metrics
|
||||||||||||||||||||
|
DISH subscribers (in thousands)
|
129
|
134
|
165
|
16
|
149
|
|||||||||||||||
|
Net subscriber additions (losses)
|
(5
|
)
|
(5
|
)
|
(8
|
)
|
(1
|
)
|
(7
|
)
|
||||||||||
|
Employees
|
16,201
|
16,200
|
17,437
|
950
|
16,487
|
|||||||||||||||
- 15 of 18 -
Frontier Communications Corporation
(Debtor-In-Possession)
Reconciliation of Non-GAAP Financial Measures for Remaining Properties to Consolidated Frontier
|
For the quarter ended
|
||||||||||||||||||||
|
March 31, 2021
|
December 31, 2020
|
March 31, 2020
|
||||||||||||||||||
|
Consolidated
|
Consolidated
|
Consolidated
|
Northwest
|
Remaining
|
||||||||||||||||
|
($ in millions)
|
Frontier
|
Frontier
|
Frontier
|
Ops (1)
|
Properties
|
|||||||||||||||
|
Net income (loss)
|
$
|
60
|
$
|
(50
|
)
|
$
|
(186
|
)
|
$
|
97
|
$
|
(283
|
)
|
|||||||
|
Add back (subtract):
|
||||||||||||||||||||
|
Income tax benefit
|
87
|
7
|
(23
|
)
|
-
|
(23
|
)
|
|||||||||||||
|
Interest expense
|
89
|
98
|
383
|
-
|
383
|
|||||||||||||||
|
Investment and other loss (income), net
|
(2
|
)
|
14
|
(5
|
)
|
-
|
(5
|
)
|
||||||||||||
|
Pension settlement costs
|
-
|
-
|
103
|
-
|
103
|
|||||||||||||||
|
Loss on extinguishment of debt
|
-
|
72
|
-
|
-
|
-
|
|||||||||||||||
|
Reorganization items, net
|
25
|
136
|
-
|
-
|
-
|
|||||||||||||||
|
Operating income
|
259
|
277
|
272
|
97
|
175
|
|||||||||||||||
|
Depreciation and amortization
|
387
|
394
|
415
|
-
|
415
|
|||||||||||||||
|
EBITDA
|
646
|
671
|
687
|
97
|
590
|
|||||||||||||||
|
Add back:
|
||||||||||||||||||||
|
Pension/OPEB expense
|
23
|
20
|
23
|
-
|
23
|
|||||||||||||||
|
Restructuring costs and other charges
|
2
|
-
|
48
|
-
|
48
|
|||||||||||||||
|
Stock-based compensation
|
(1
|
)
|
-
|
1
|
-
|
1
|
||||||||||||||
|
Loss on disposal of Northwest Operations
|
-
|
2
|
24
|
-
|
24
|
|||||||||||||||
|
Adjusted EBITDA
|
$
|
670
|
$
|
693
|
$
|
783
|
$
|
97
|
$
|
686
|
||||||||||
|
EBITDA margin
|
38.5
|
%
|
39.6
|
%
|
35.6
|
%
|
66.9
|
%
|
33.0
|
%
|
||||||||||
|
Adjusted EBITDA margin
|
40.0
|
%
|
40.9
|
%
|
40.5
|
%
|
66.9
|
%
|
38.4
|
%
|
||||||||||
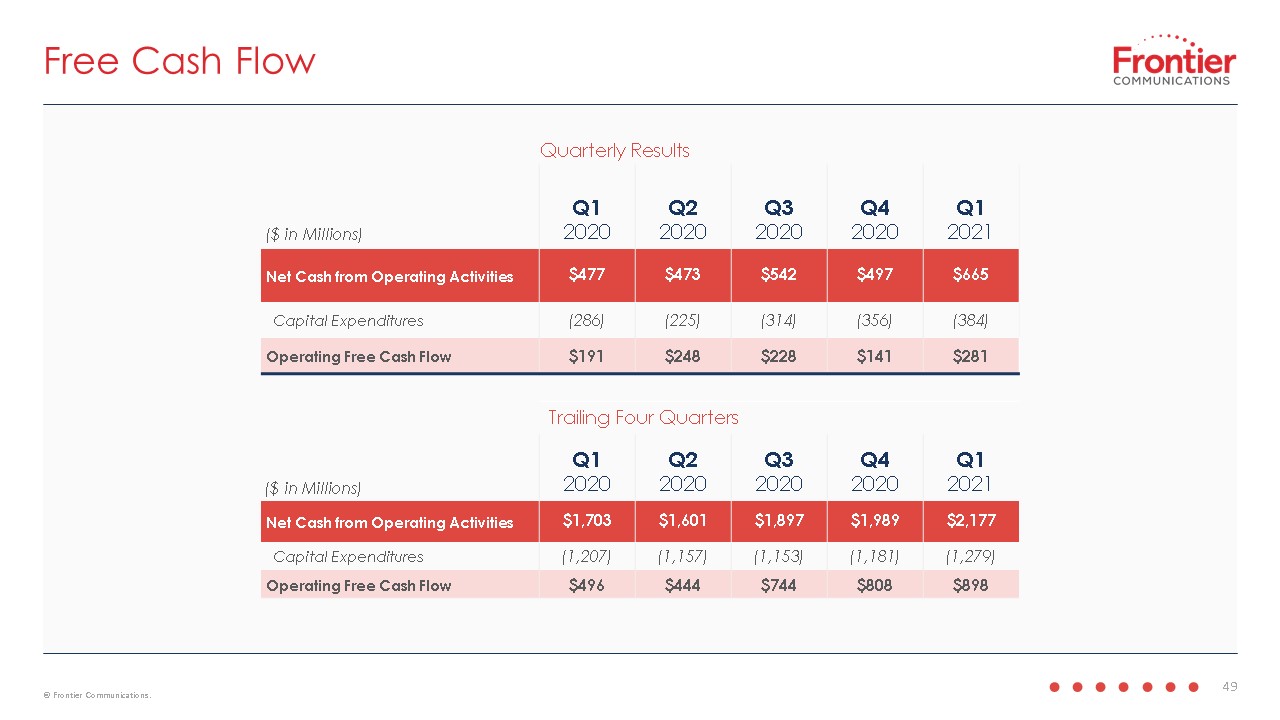
|
Free Cash Flow
|
||||||||||||||||||||
|
Net cash provided from operating activities
|
$
|
665
|
$
|
497
|
$
|
477
|
N/A
|
N/A
|
||||||||||||
|
Capital expenditures
|
(384
|
)
|
(356
|
)
|
(286
|
)
|
N/A
|
N/A
|
||||||||||||
|
Operating free cash flow
|
$
|
281
|
$
|
141
|
$
|
191
|
N/A
|
N/A
|
||||||||||||
(1) Amounts represent the financial results of our Northwest Operations for the three months ended March 31, 2020. Net loss does not include the impact
of income taxes and interest expense.
SCHEDULE G
Frontier Communications Corporation
(Debtor-In-Possession)
Reconciliation of Non-GAAP Financial Measures for Remaining Properties to Consolidated Frontier
|
For the quarter ended
|
||||||||||||||||||||
|
March 31, 2021
|
December 31, 2020
|
March 31, 2020
|
||||||||||||||||||
|
Consolidated
|
Consolidated
|
Consolidated
|
Northwest
|
Remaining
|
||||||||||||||||
|
($ in millions)
|
Frontier
|
Frontier
|
Frontier
|
Ops (1)
|
Properties
|
|||||||||||||||
|
Adjusted Operating Expenses
|
||||||||||||||||||||
|
Total operating expenses (2)
|
$
|
1,417
|
$
|
1,418
|
$
|
1,661
|
$
|
48
|
$
|
1,613
|
||||||||||
|
Subtract:
|
||||||||||||||||||||
|
Depreciation and amortization
|
387
|
394
|
415
|
-
|
415
|
|||||||||||||||
|
Loss on disposal of Northwest Operations
|
-
|
2
|
24
|
-
|
24
|
|||||||||||||||
|
Pension/OPEB expense
|
23
|
20
|
23
|
-
|
23
|
|||||||||||||||
|
Restructuring costs and other charges
|
2
|
-
|
48
|
-
|
48
|
|||||||||||||||
|
Stock-based compensation
|
(1
|
)
|
-
|
1
|
-
|
1
|
||||||||||||||
|
Adjusted operating expenses
|
$
|
1,006
|
$
|
1,002
|
$
|
1,150
|
$
|
48
|
$
|
1,102
|
||||||||||
(1) Amounts represent the financial results of our Northwest Operations for the three months ended March 31, 2020.
(2) Operating expenses for Northwest Ops do not include allocated expenses which are included in operating expenses for our Remaining Properties.
- 16 of 18 -
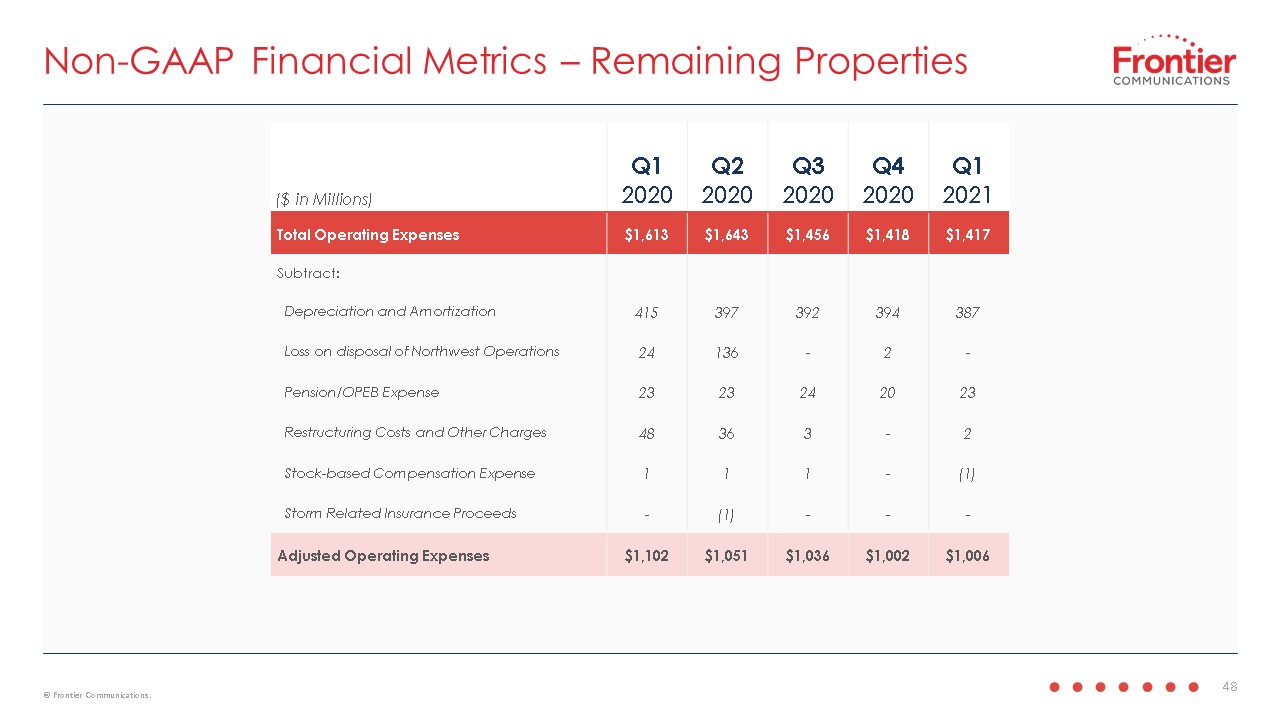
Frontier Communications Corporation
(Debtor-in-Possession)
Selected Financial and Operating Data for Remaining Properties, Excluding Northwest Operations
(Unaudited)
|
|
|
As of or for the Quarter Ended
|
|||||||||||||||||||||||||||||||||||
|
|
|
03/31/19
|
06/30/19
|
09/30/19
|
12/30/19
|
03/31/20
|
06/30/20
|
09/30/20
|
12/31/20
|
03/31/21
|
|||||||||||||||||||||||||||
|
Estimated Fiber Passings (in millions)
|
|||||||||||||||||||||||||||||||||||||
|
Base Fiber Passings
|
N/A
|
N/A
|
N/A
|
N/A
|
3.2
|
3.2
|
3.2
|
3.2
|
3.2
|
||||||||||||||||||||||||||||
|
Total Fiber Passings
|
N/A
|
N/A
|
N/A
|
N/A
|
3.2
|
3.2
|
3.2
|
3.3
|
3.4
|
||||||||||||||||||||||||||||
|
|
|
||||||||||||||||||||||||||||||||||||
|
Estimated Broadband Fiber % Penetration
|
|||||||||||||||||||||||||||||||||||||
|
Base Fiber Penetration
|
N/A
|
N/A
|
N/A
|
N/A
|
40.9
|
%
|
41.1
|
%
|
41.2
|
%
|
41.4
|
%
|
41.5
|
%
|
|||||||||||||||||||||||
|
Total Fiber Penetration
|
N/A
|
N/A
|
N/A
|
N/A
|
41.0
|
%
|
41.1
|
%
|
41.2
|
%
|
40.7
|
%
|
39.9
|
%
|
|||||||||||||||||||||||
|
|
|
||||||||||||||||||||||||||||||||||||
|
Broadband Customers, end of period (in thousands)
|
|||||||||||||||||||||||||||||||||||||
|
Consumer
|
Fiber
|
1,195
|
1,186
|
1,186
|
1,190
|
1,200
|
1,207
|
1,214
|
1,223
|
1,234
|
|||||||||||||||||||||||||||
|
Copper
|
1,565
|
1,523
|
1,474
|
1,441
|
1,418
|
1,401
|
1,380
|
1,348
|
1,326
|
||||||||||||||||||||||||||||
|
Total
|
2,760
|
2,709
|
2,660
|
2,631
|
2,618
|
2,608
|
2,594
|
2,571
|
2,560
|
||||||||||||||||||||||||||||
|
|
|
||||||||||||||||||||||||||||||||||||
|
Business (1)
|
Fiber
|
117
|
117
|
117
|
118
|
118
|
116
|
117
|
117
|
120
|
|||||||||||||||||||||||||||
|
Copper
|
198
|
192
|
185
|
179
|
171
|
166
|
160
|
154
|
149
|
||||||||||||||||||||||||||||
|
Total
|
315
|
309
|
302
|
297
|
289
|
282
|
277
|
271
|
269
|
||||||||||||||||||||||||||||
|
|
|
||||||||||||||||||||||||||||||||||||
|
Broadband Net Adds (in thousands)
|
|||||||||||||||||||||||||||||||||||||
|
Consumer
|
Fiber
|
(7
|
)
|
(9
|
)
|
-
|
4
|
10
|
7
|
7
|
9
|
11
|
|||||||||||||||||||||||||
|
Copper
|
(19
|
)
|
(42
|
)
|
(49
|
)
|
(33
|
)
|
(23
|
)
|
(17
|
)
|
(21
|
)
|
(31
|
)
|
(22
|
)
|
|||||||||||||||||||
|
Total
|
(26
|
)
|
(51
|
)
|
(49
|
)
|
(29
|
)
|
(13
|
)
|
(10
|
)
|
(14
|
)
|
(22
|
)
|
(11
|
)
|
|||||||||||||||||||
|
|
|
||||||||||||||||||||||||||||||||||||
|
Business (1)
|
Fiber
|
-
|
-
|
-
|
1
|
-
|
(2
|
)
|
1
|
-
|
3
|
||||||||||||||||||||||||||
|
Copper
|
(7
|
)
|
(6
|
)
|
(7
|
)
|
(6
|
)
|
(8
|
)
|
(5
|
)
|
(6
|
)
|
(6
|
)
|
(5
|
)
|
|||||||||||||||||||
|
Total
|
(7
|
)
|
(6
|
)
|
(7
|
)
|
(5
|
)
|
(8
|
)
|
(7
|
)
|
(5
|
)
|
(6
|
)
|
(2
|
)
|
|||||||||||||||||||
|
|
|
||||||||||||||||||||||||||||||||||||
|
Broadband Churn
|
|||||||||||||||||||||||||||||||||||||
|
Consumer
|
Fiber
|
2.75
|
%
|
2.81
|
%
|
2.69
|
%
|
2.24
|
%
|
1.97
|
%
|
1.54
|
%
|
1.81
|
%
|
1.56
|
%
|
1.40
|
%
|
||||||||||||||||||
|
Copper
|
2.38
|
%
|
2.64
|
%
|
2.91
|
%
|
2.53
|
%
|
2.36
|
%
|
2.03
|
%
|
2.11
|
%
|
1.96
|
%
|
1.63
|
%
|
|||||||||||||||||||
|
Total
|
2.54
|
%
|
2.71
|
%
|
2.81
|
%
|
2.40
|
%
|
2.18
|
%
|
1.81
|
%
|
1.97
|
%
|
1.77
|
%
|
1.52
|
%
|
|||||||||||||||||||
|
|
|
||||||||||||||||||||||||||||||||||||
|
Business (1)
|
Fiber
|
2.14
|
%
|
1.96
|
%
|
2.00
|
%
|
1.80
|
%
|
1.88
|
%
|
1.74
|
%
|
1.67
|
%
|
1.49
|
%
|
1.44
|
%
|
||||||||||||||||||
|
Copper
|
2.23
|
%
|
2.18
|
%
|
2.26
|
%
|
2.16
|
%
|
2.14
|
%
|
1.88
|
%
|
2.01
|
%
|
1.76
|
%
|
1.70
|
%
|
|||||||||||||||||||
|
Total
|
2.20
|
%
|
2.09
|
%
|
2.16
|
%
|
2.02
|
%
|
2.03
|
%
|
1.82
|
%
|
1.87
|
%
|
1.65
|
%
|
1.59
|
%
|
|||||||||||||||||||
|
|
|
||||||||||||||||||||||||||||||||||||
|
Broadband ARPU
|
|||||||||||||||||||||||||||||||||||||
|
Consumer
|
Fiber
|
$
|
55.1
|
$
|
53.5
|
$
|
52.9
|
$
|
52.7
|
$
|
52.5
|
$
|
52.4
|
$
|
52.8
|
$
|
54.5
|
$
|
56.0
|
||||||||||||||||||
|
Copper
|
38.1
|
38.5
|
38.9
|
38.8
|
38.7
|
39.1
|
39.1
|
39.3
|
40.1
|
||||||||||||||||||||||||||||
|
Total
|
$
|
45.4
|
$
|
45.0
|
$
|
45.1
|
$
|
45.0
|
$
|
44.9
|
$
|
45.2
|
$
|
45.5
|
$
|
46.5
|
$
|
47.7
|
|||||||||||||||||||
|
|
|
||||||||||||||||||||||||||||||||||||
|
Business (1)
|
Fiber
|
$
|
84.8
|
$
|
87.6
|
$
|
87.8
|
$
|
87.1
|
$
|
87.1
|
$
|
86.1
|
$
|
86.2 |
$
|
87.1 |
$
|
86.6
|
||||||||||||||||||
|
Copper
|
61.9
|
64.2
|
63.8
|
64.4
|
65.2
|
64.0
|
64.2 | 65.2 |
64.9
|
||||||||||||||||||||||||||||
|
Total
|
$
|
70.4
|
$
|
73.0
|
$
|
73.1
|
$
|
73.3
|
$
|
74.0
|
$
|
73.0
|
$
|
73.6 |
$
|
74.6
|
$
|
74.4
|
|||||||||||||||||||
(1) Business customers include our small, medium business and larger enterprise (SME) commerical customers. Wholesale customers are
excluded.
- 17 of 18 -
Frontier Communications Corporation
(Debtor-in-Possession)
Selected Financial and Operating Data for Remaining Properties, Excluding Northwest Operations
(Unaudited)
|
As of or for the Quarter Ended
|
||||||||||||||||||||||||||||||||||||
|
03/31/19
|
06/30/19
|
09/30/19
|
12/30/19
|
03/31/20
|
06/30/20
|
09/30/20
|
12/31/20
|
03/31/21
|
||||||||||||||||||||||||||||
|
($ in millions)
|
||||||||||||||||||||||||||||||||||||
|
Revenue by Product Type:
|
||||||||||||||||||||||||||||||||||||
|
Data
|
$
|
888
|
$
|
885
|
$
|
851
|
$
|
822
|
$
|
855
|
$
|
849
|
$
|
838
|
$
|
834
|
$
|
842
|
||||||||||||||||||
|
Voice
|
604
|
582
|
574
|
555
|
529
|
509
|
500
|
490
|
487
|
|||||||||||||||||||||||||||
|
Video
|
256
|
248
|
233
|
222
|
212
|
197
|
186
|
181
|
169
|
|||||||||||||||||||||||||||
|
Other
|
113
|
111
|
106
|
108
|
108
|
105
|
103
|
101
|
95
|
|||||||||||||||||||||||||||
|
Revenue from customers
|
$
|
1,861
|
$
|
1,826
|
$
|
1,764
|
$
|
1,707
|
$
|
1,704
|
$
|
1,660
|
$
|
1,627
|
$
|
1,606
|
$
|
1,593
|
||||||||||||||||||
|
Subsidy and other revenue
|
85
|
89
|
85
|
85
|
84
|
94
|
99
|
89
|
83
|
|||||||||||||||||||||||||||
|
Total revenue - Remaining Properties
|
$
|
1,946
|
$
|
1,915
|
$
|
1,849
|
$
|
1,792
|
$
|
1,788
|
$
|
1,754
|
$
|
1,726
|
$
|
1,695
|
$
|
1,676
|
||||||||||||||||||
|
Total revenue - Northwest Operations
|
155
|
152
|
148
|
150
|
145
|
47
|
-
|
-
|
-
|
|||||||||||||||||||||||||||
|
Total revenue - Consolidated Frontier
|
$
|
2,101
|
$
|
2,067
|
$
|
1,997
|
$
|
1,942
|
$
|
1,933
|
$
|
1,801
|
$
|
1,726
|
$
|
1,695
|
$
|
1,676
|
||||||||||||||||||
|
Revenue by Customer Type:
|
||||||||||||||||||||||||||||||||||||
|
Consumer
|
$
|
996
|
$
|
969
|
$
|
943
|
$
|
923
|
$
|
894
|
$
|
874
|
$
|
859
|
$
|
857
|
$
|
844
|
||||||||||||||||||
|
Commercial
|
865
|
857
|
821
|
784
|
810
|
786
|
768
|
749
|
749
|
|||||||||||||||||||||||||||
|
Revenue from customers
|
$
|
1,861
|
$
|
1,826
|
$
|
1,764
|
$
|
1,707
|
$
|
1,704
|
$
|
1,660
|
$
|
1,627
|
$
|
1,606
|
$
|
1,593
|
||||||||||||||||||
|
Subsidy and other revenue
|
85
|
89
|
85
|
85
|
84
|
94
|
99
|
89
|
83
|
|||||||||||||||||||||||||||
|
Total revenue - Remaining Properties
|
$
|
1,946
|
$
|
1,915
|
$
|
1,849
|
$
|
1,792
|
$
|
1,788
|
$
|
1,754
|
$
|
1,726
|
$
|
1,695
|
$
|
1,676
|
||||||||||||||||||
|
Total revenue - Northwest Operations
|
155
|
152
|
148
|
150
|
145
|
47
|
-
|
-
|
-
|
|||||||||||||||||||||||||||
|
Total revenue - Consolidated Frontier
|
$
|
2,101
|
$
|
2,067
|
$
|
1,997
|
$
|
1,942
|
$
|
1,933
|
$
|
1,801
|
$
|
1,726
|
$
|
1,695
|
$
|
1,676
|
||||||||||||||||||
|
Remaining Properties’ Financial Data
|
||||||||||||||||||||||||||||||||||||
|
Net income (loss)
|
$
|
(153
|
)
|
$
|
(5,392
|
)
|
$
|
(444
|
)
|
$
|
(263
|
)
|
$
|
(283
|
)
|
$
|
(210
|
)
|
$
|
15
|
$
|
(50
|
)
|
$
|
60
|
|||||||||||
|
Add back (subtract):
|
||||||||||||||||||||||||||||||||||||
|
Income tax expense (benefit)
|
18
|
(534
|
)
|
(21
|
)
|
(74
|
)
|
(23
|
)
|
(57
|
)
|
(11
|
)
|
7
|
87
|
|||||||||||||||||||||
|
Interest expense
|
379
|
383
|
382
|
391
|
383
|
160
|
121
|
98
|
89
|
|||||||||||||||||||||||||||
|
Investment and other (income) loss, net
|
9
|
9
|
10
|
9
|
(5
|
)
|
20
|
14
|
14
|
(2
|
)
|
|||||||||||||||||||||||||
|
Pension settlement costs
|
-
|
-
|
-
|
57
|
103
|
56
|
-
|
-
|
-
|
|||||||||||||||||||||||||||
|
Loss on extinguishment of debt
|
20
|
-
|
-
|
-
|
-
|
-
|
-
|
72
|
-
|
|||||||||||||||||||||||||||
|
Reorganization items, net
|
-
|
-
|
-
|
-
|
-
|
142
|
131
|
136
|
25
|
|||||||||||||||||||||||||||
|
Operating income (loss)
|
273
|
(5,534
|
)
|
(73
|
)
|
120
|
175
|
111
|
270
|
277
|
259
|
|||||||||||||||||||||||||
|
Depreciation and amortization
|
449
|
429
|
422
|
420
|
415
|
397
|
392
|
394
|
387
|
|||||||||||||||||||||||||||
|
EBITDA
|
$
|
722
|
$
|
(5,105
|
)
|
$
|
349
|
$
|
540
|
$
|
590
|
$
|
508
|
$
|
662
|
$
|
671
|
$
|
646
|
|||||||||||||||||
|
Add back:
|
||||||||||||||||||||||||||||||||||||
|
Pension/OPEB expense
|
20
|
19
|
20
|
19
|
23
|
23
|
24
|
20
|
23
|
|||||||||||||||||||||||||||
|
Restructuring costs and other charges
|
27
|
30
|
27
|
82
|
48
|
36
|
3
|
-
|
2
|
|||||||||||||||||||||||||||
|
Stock-based compensation
|
3
|
4
|
3
|
5
|
1
|
1
|
1
|
-
|
(1
|
)
|
||||||||||||||||||||||||||
|
Storm-related insurance proceeds
|
(1
|
)
|
-
|
-
|
(5
|
)
|
-
|
(1
|
)
|
-
|
-
|
-
|
||||||||||||||||||||||||
|
Goodwill impairment
|
-
|
5,449
|
276
|
-
|
-
|
-
|
-
|
-
|
-
|
|||||||||||||||||||||||||||
|
Loss on disposal of Northwest Operations
|
-
|
384
|
30
|
32
|
24
|
136
|
-
|
2
|
-
|
|||||||||||||||||||||||||||
|
Adjusted EBITDA
|
$
|
771
|
$
|
781
|
$
|
705
|
$
|
673
|
$
|
686
|
$
|
703
|
$
|
690
|
$
|
693
|
$
|
670
|
||||||||||||||||||
|
EBITDA margin
|
37.1
|
%
|
-266.6
|
%
|
18.9
|
%
|
30.1
|
%
|
33.0
|
%
|
29.0
|
%
|
38.4
|
%
|
39.6
|
%
|
38.5
|
%
|
||||||||||||||||||
|
Adjusted EBITDA margin
|
39.6
|
%
|
40.8
|
%
|
38.1
|
%
|
37.6
|
%
|
38.4
|
%
|
40.1
|
%
|
40.0
|
%
|
40.9
|
%
|
40.0
|
%
|
||||||||||||||||||
- 18 of 18 -