Exhibit 99.1

CMS
Energy Announces Strong First Quarter Results,
Reaffirms 2022 Adjusted EPS Guidance
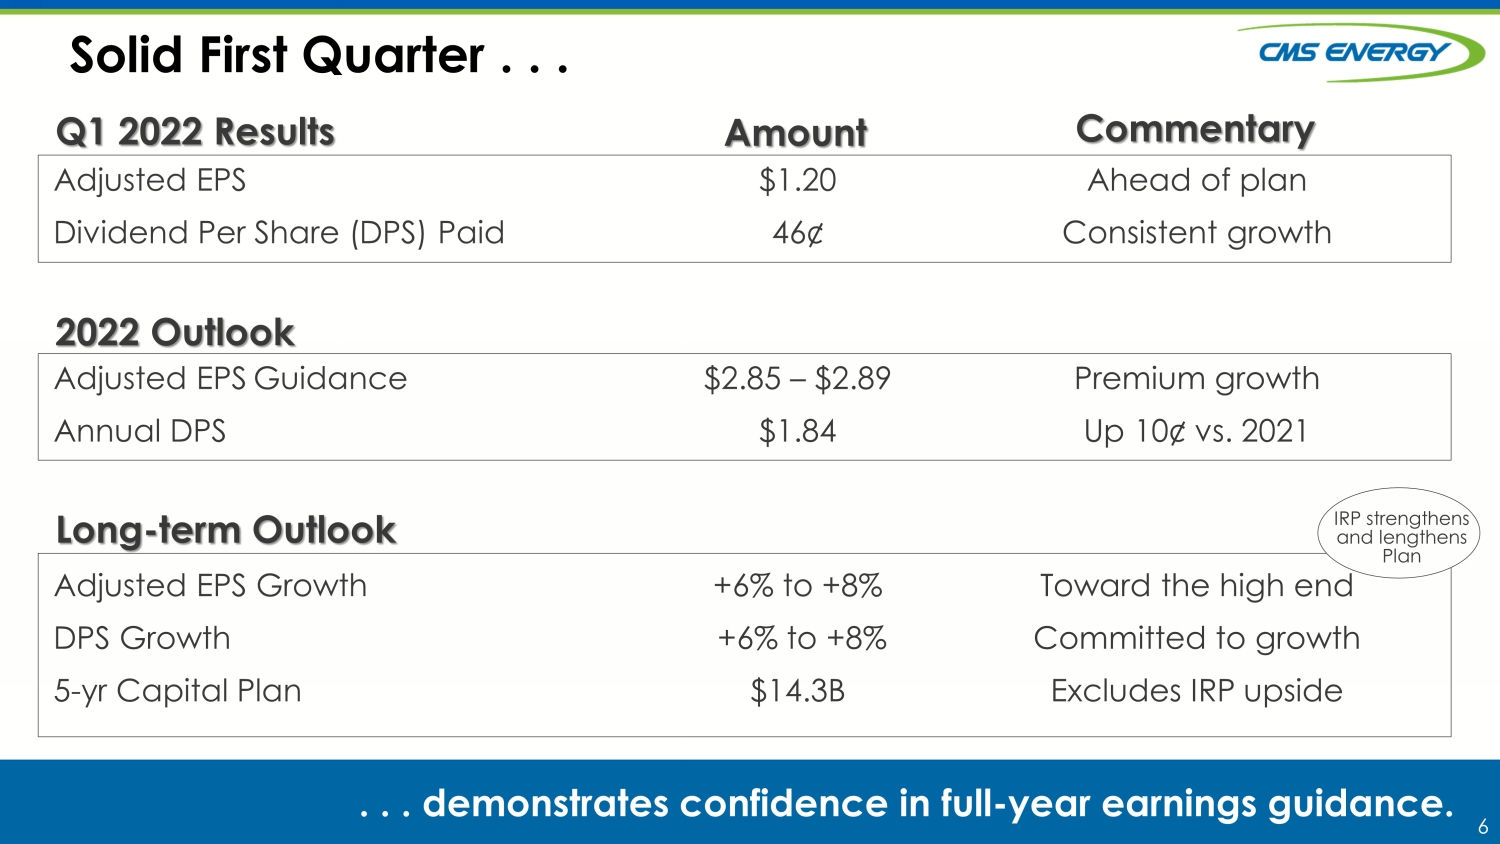
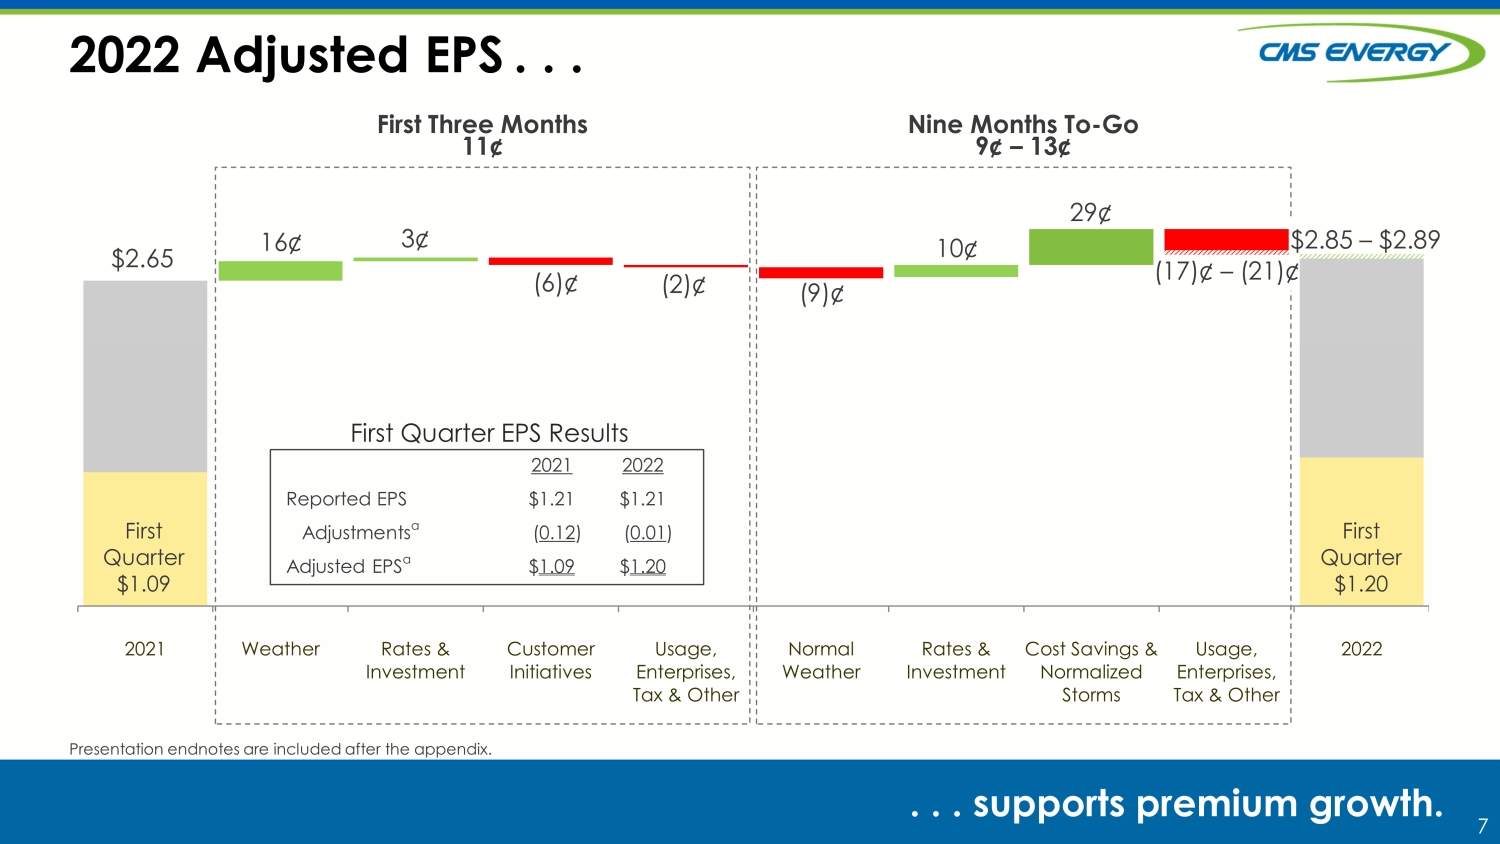
JACKSON, Mich., May 3, 2022 – CMS Energy announced today reported earnings per share of $1.21 for the first quarter of 2022, compared to $1.21 per share for the same quarter in 2021. The company’s adjusted earnings per share for the first quarter of 2022 were $1.20, compared to $1.09 per share for the same quarter in 2021.
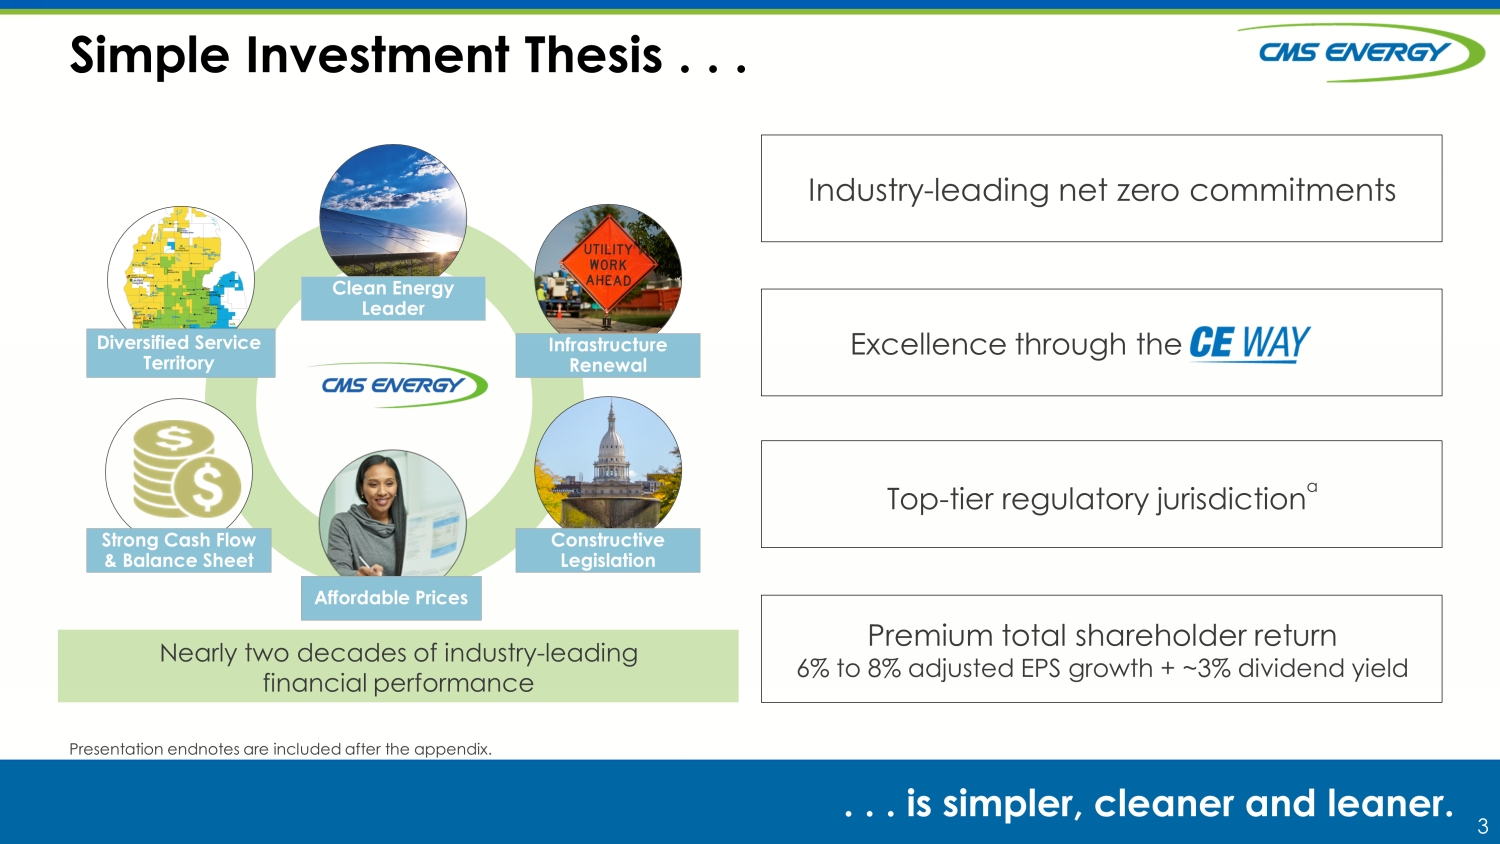
CMS Energy reaffirmed its 2022 adjusted earnings guidance of $2.85 to $2.89* per share (*See below for important information about non-GAAP measures) and reaffirmed long-term adjusted EPS growth of 6 to 8 percent, with continued confidence toward the high end of the adjusted EPS growth range.
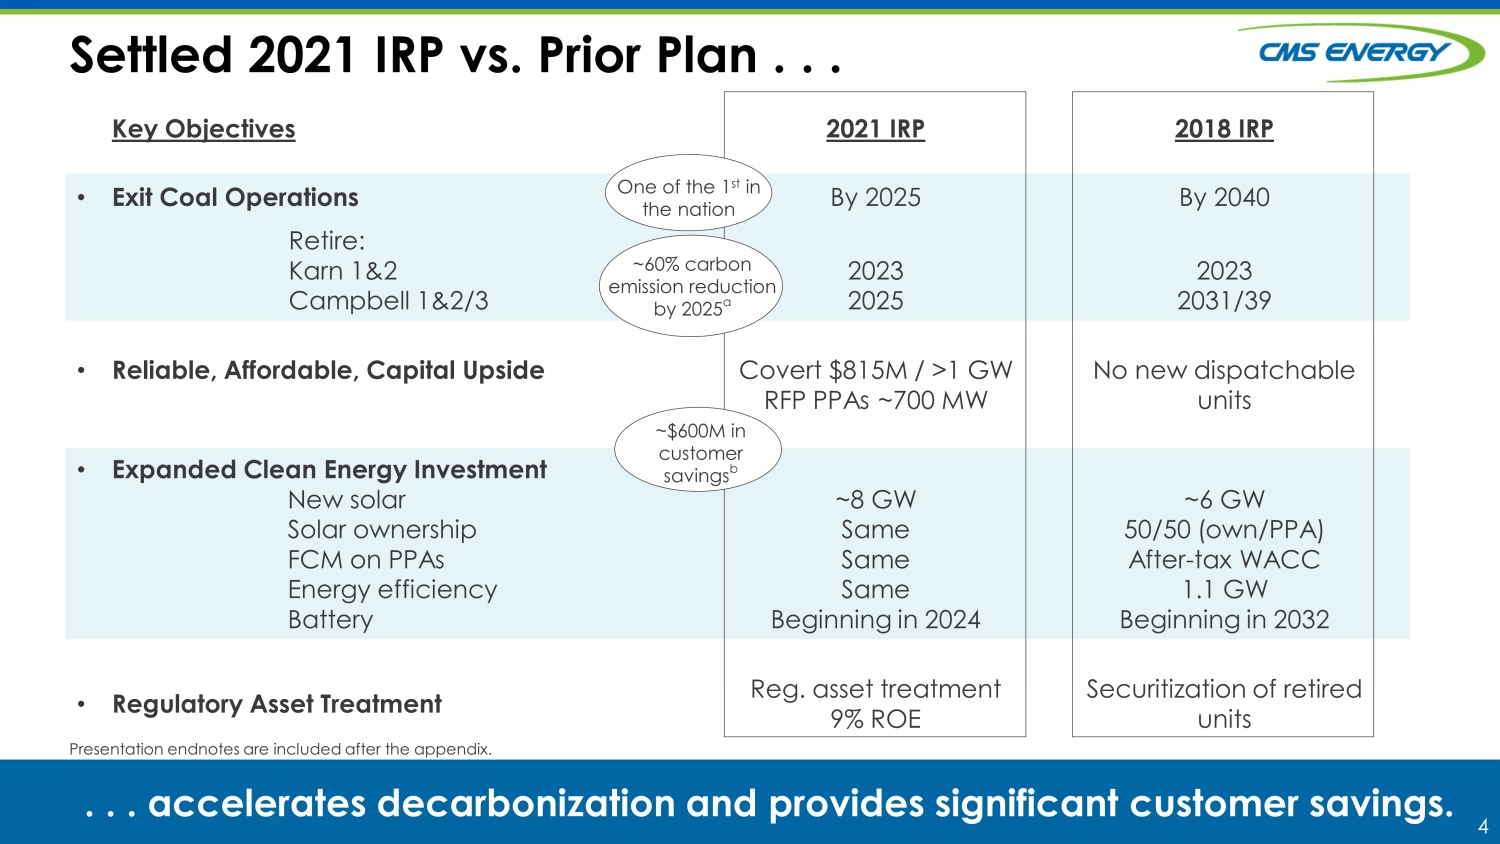
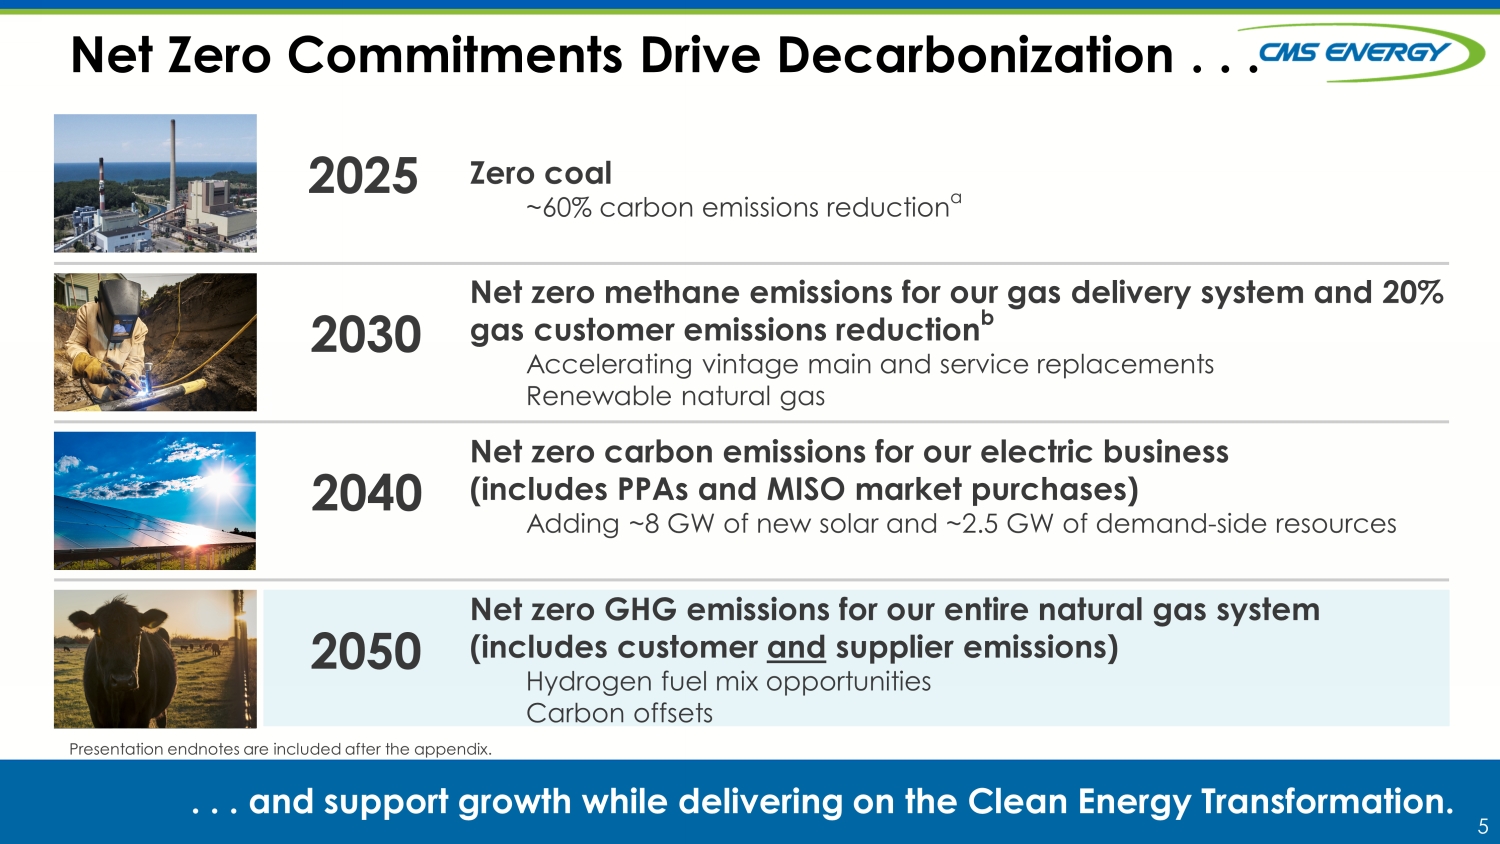
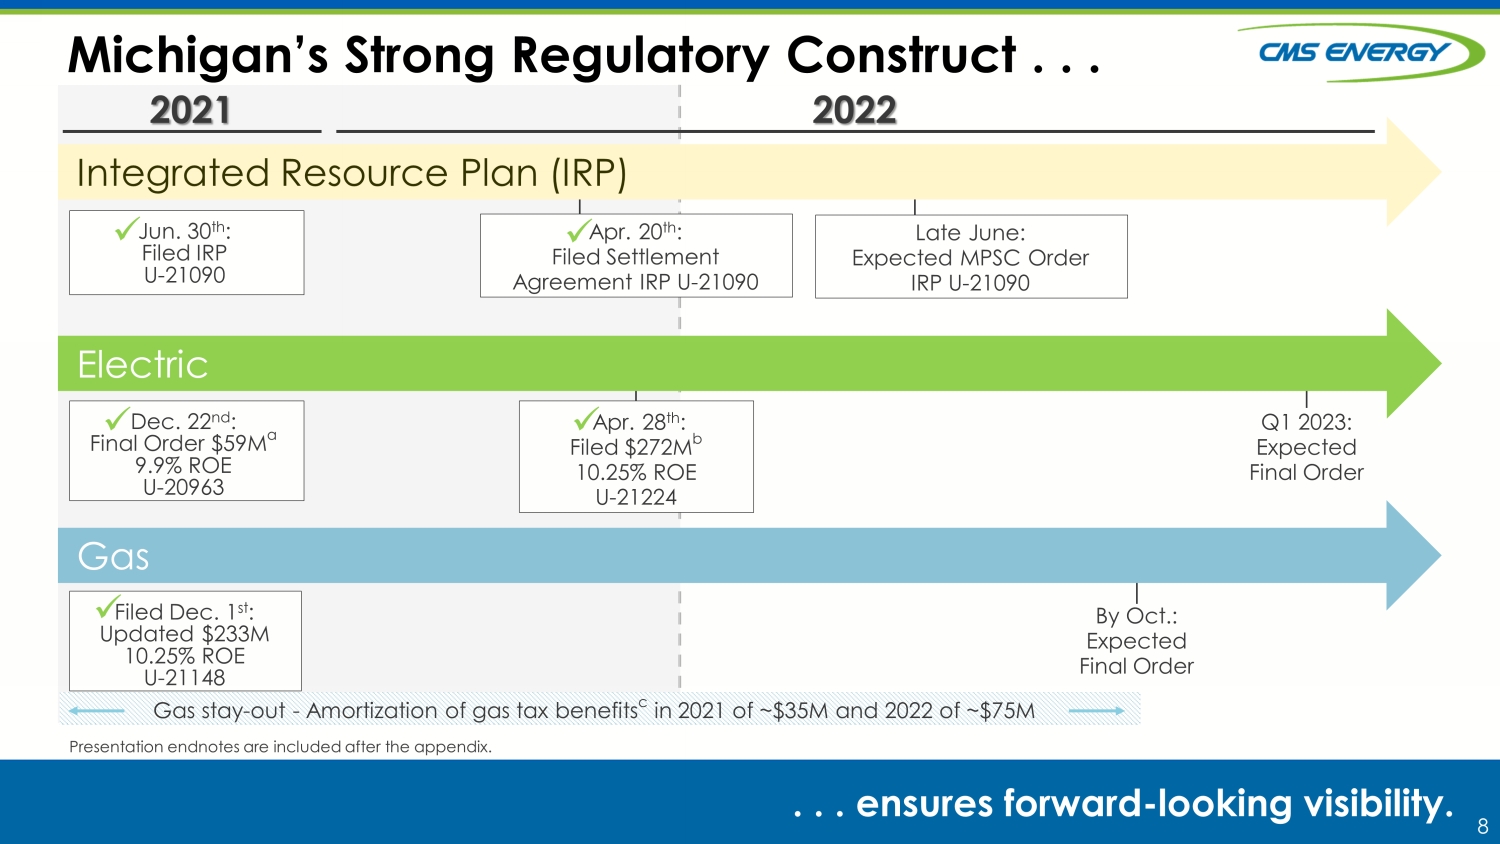
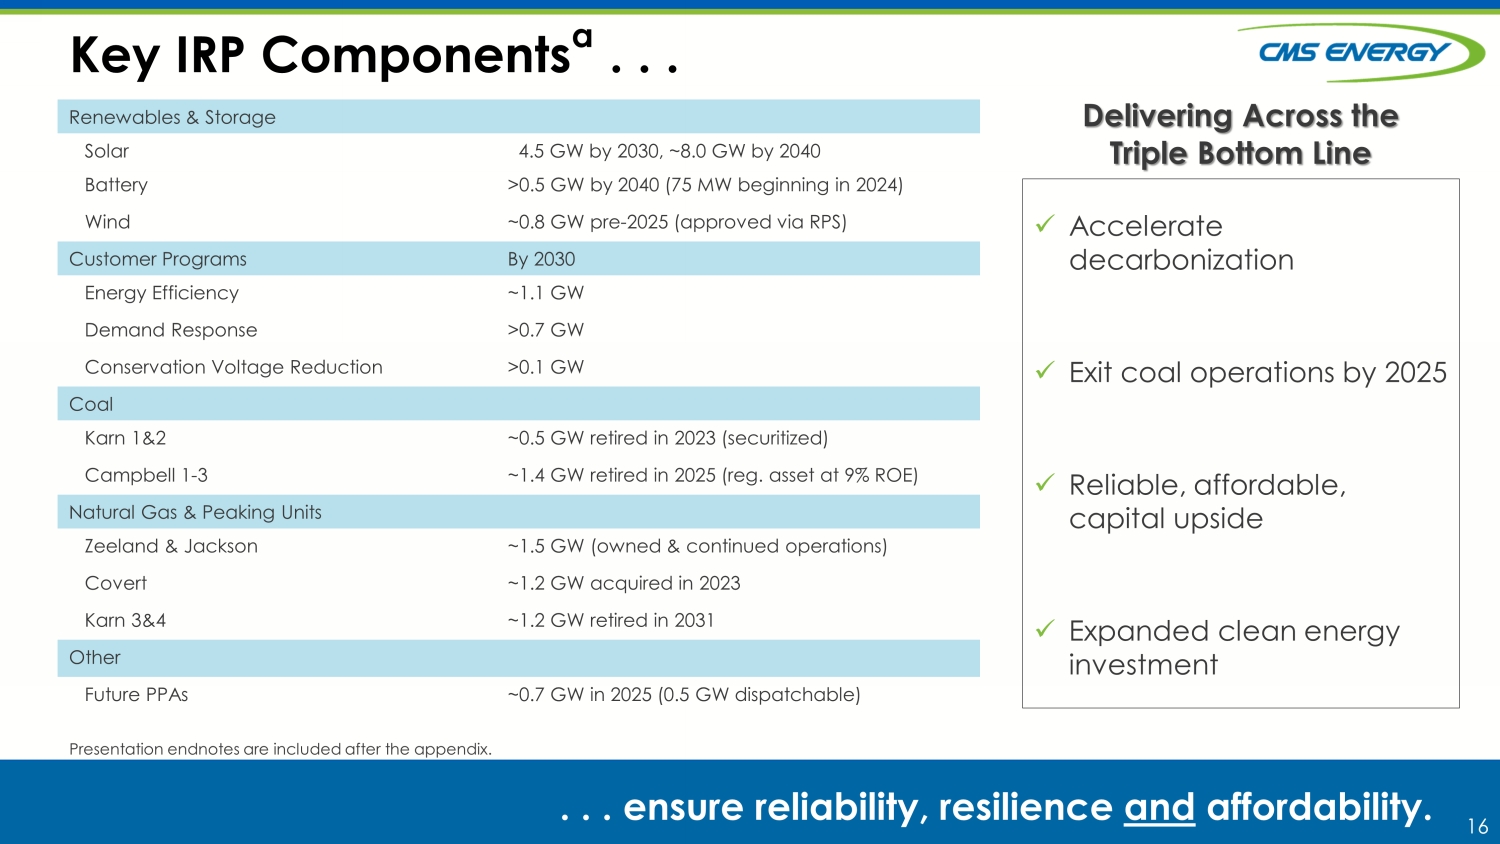
“The settlement agreement recently filed for our 2021 Integrated Resource Plan strengthens our financial outlook and serves as a proof point of our plan for net zero carbon emissions by 2040 in our electric business. As one of the first utilities in the country to eliminate coal generation by 2025, we are leading the clean energy transformation,” said Garrick Rochow, President and CEO of CMS Energy and Consumers Energy.
CMS Energy (NYSE: CMS) is a Michigan-based energy provider featuring Consumers Energy as its primary business. It also owns and operates independent power generation businesses.
# # #
CMS Energy will hold a webcast to discuss its 2022 first quarter results and provide a business and financial outlook on Tuesday, May 3 at 9:00 a.m. (EDT). To participate in the webcast, go to CMS Energy’s homepage (cmsenergy.com) and select “Events and Presentations.”
Important information for investors about non-GAAP measures and other disclosures.
This news release contains non-Generally Accepted Accounting Principles (non-GAAP) measures, such as adjusted earnings. All references to net income refer to net income available to common stockholders and references to earnings per share are on a diluted basis. Adjustments could include items such as discontinued operations, asset sales, impairments, restructuring costs, changes in accounting principles, changes in federal tax policy, regulatory items from prior years, unrealized gains or losses from mark-to-market adjustments recognized in net income related to CMS Enterprises’ interest expense, or other items. Management views adjusted earnings as a key measure of the company's present operating financial performance and uses adjusted earnings for external communications with analysts and investors. Internally, the company uses adjusted earnings to measure and assess performance. Because the company is not able to estimate the impact of specific line items, which have the potential to significantly impact, favorably or unfavorably, the company's reported earnings in future periods, the company is not providing reported earnings guidance nor is it providing a reconciliation for the comparable future period earnings. The company’s adjusted earnings should be considered supplemental information to assist in understanding our business results, rather than as a substitute for the reported earnings.
This news release contains "forward-looking statements." The forward-looking statements are subject to risks and uncertainties that could cause CMS Energy’s and Consumers Energy’s results to differ materially. All forward-looking statements should be considered in the context of the risk and other factors detailed from time to time in CMS Energy's and Consumers Energy's Securities and Exchange Commission filings.
Investors and others should note that CMS Energy routinely posts important information on its website and considers the Investor Relations section, www.cmsenergy.com/investor-relations, a channel of distribution.
For
more information on CMS Energy, please visit our website at cmsenergy.com.
To sign up for email alert notifications, please visit the Investor Relations section of our website.
Media Contacts: Katie Carey, 517/740-1739
Investment Analyst Contact: Travis Uphaus, 517/817-9241
2
Page 1 of 3
CMS ENERGY CORPORATION
Consolidated Statements of Income
(Unaudited)
| In Millions, Except Per Share Amounts | ||||||||
| Three Months Ended | ||||||||
| 3/31/22 | 3/31/21 | |||||||
| Operating revenue | $ | 2,374 | $ | 2,013 | ||||
| Operating expenses | 1,918 | 1,583 | ||||||
| Operating Income | 456 | 430 | ||||||
| Other income | 48 | 44 | ||||||
| Interest charges | 124 | 124 | ||||||
| Income Before Income Taxes | 380 | 350 | ||||||
| Income tax expense | 39 | 42 | ||||||
| Income From Continuing Operations | 341 | 308 | ||||||
| Income from discontinued operations, net of tax | 4 | 34 | ||||||
| Net Income | 345 | 342 | ||||||
| Loss attributable to noncontrolling interests | (8 | ) | (7 | ) | ||||
| Net Income Attributable to CMS Energy | 353 | 349 | ||||||
| Preferred stock dividends | 2 | - | ||||||
| Net Income Available to Common Stockholders | $ | 351 | $ | 349 | ||||
| Diluted Earnings Per Average Common Share | ||||||||
| Income from continuing operations per average common share available to common stockholders | $ | 1.20 | $ | 1.09 | ||||
| Income from discontinued operations per average common share available to common stockholders | 0.01 | 0.12 | ||||||
| Diluted earnings per average common share | $ | 1.21 | $ | 1.21 | ||||
Page 2 of 3
CMS ENERGY CORPORATION
Summarized Consolidated Balance Sheets
(Unaudited)
| In Millions | ||||||||
| As of | ||||||||
| 3/31/22 | 12/31/21 | |||||||
| Assets | ||||||||
| Current assets | ||||||||
| Cash and cash equivalents | $ | 446 | $ | 452 | ||||
| Restricted cash and cash equivalents | 28 | 24 | ||||||
| Other current assets | 1,985 | 2,151 | ||||||
| Total current assets | 2,459 | 2,627 | ||||||
| Non-current assets | ||||||||
| Plant, property, and equipment | 22,540 | 22,352 | ||||||
| Other non-current assets | 3,741 | 3,774 | ||||||
| Total Assets | $ | 28,740 | $ | 28,753 | ||||
| Liabilities and Equity | ||||||||
| Current liabilities (1) | $ | 1,432 | $ | 1,822 | ||||
| Non-current liabilities (1) | 7,430 | 7,269 | ||||||
| Capitalization | ||||||||
| Debt, finance leases, and other financing (excluding securitization debt) (2) | ||||||||
| Debt, finance leases, and other financing (excluding non-recourse and securitization debt) | 12,201 | 12,200 | ||||||
| Non-recourse debt | 74 | 76 | ||||||
| Total debt, finance leases, and other financing (excluding securitization debt) | 12,275 | 12,276 | ||||||
| Preferred stock and securities | 224 | 224 | ||||||
| Noncontrolling interests | 551 | 557 | ||||||
| Common stockholders' equity | 6,630 | 6,407 | ||||||
| Total capitalization (excluding securitization debt) | 19,680 | 19,464 | ||||||
| Securitization debt (2) | 198 | 198 | ||||||
| Total Liabilities and Equity | $ | 28,740 | $ | 28,753 | ||||
(1) Excludes debt, finance leases, and other financing.
(2) Includes current and non-current portions.
CMS ENERGY CORPORATION
Summarized Consolidated Statements of Cash Flows
(Unaudited)
| In Millions | ||||||||
| Three Months Ended | ||||||||
| 3/31/22 | 3/31/21 | |||||||
| Beginning of Period Cash and Cash Equivalents, Including Restricted Amounts | $ | 476 | $ | 185 | ||||
| Net cash provided by operating activities | 707 | 832 | ||||||
| Net cash used in investing activities | (539 | ) | (283 | ) | ||||
| Cash flows from operating and investing activities | 168 | 549 | ||||||
| Net cash used in financing activities | (170 | ) | (210 | ) | ||||
| Total Cash Flows | $ | (2 | ) | $ | 339 | |||
| End of Period Cash and Cash Equivalents, Including Restricted Amounts | $ | 474 | $ | 524 | ||||
Page 3 of 3
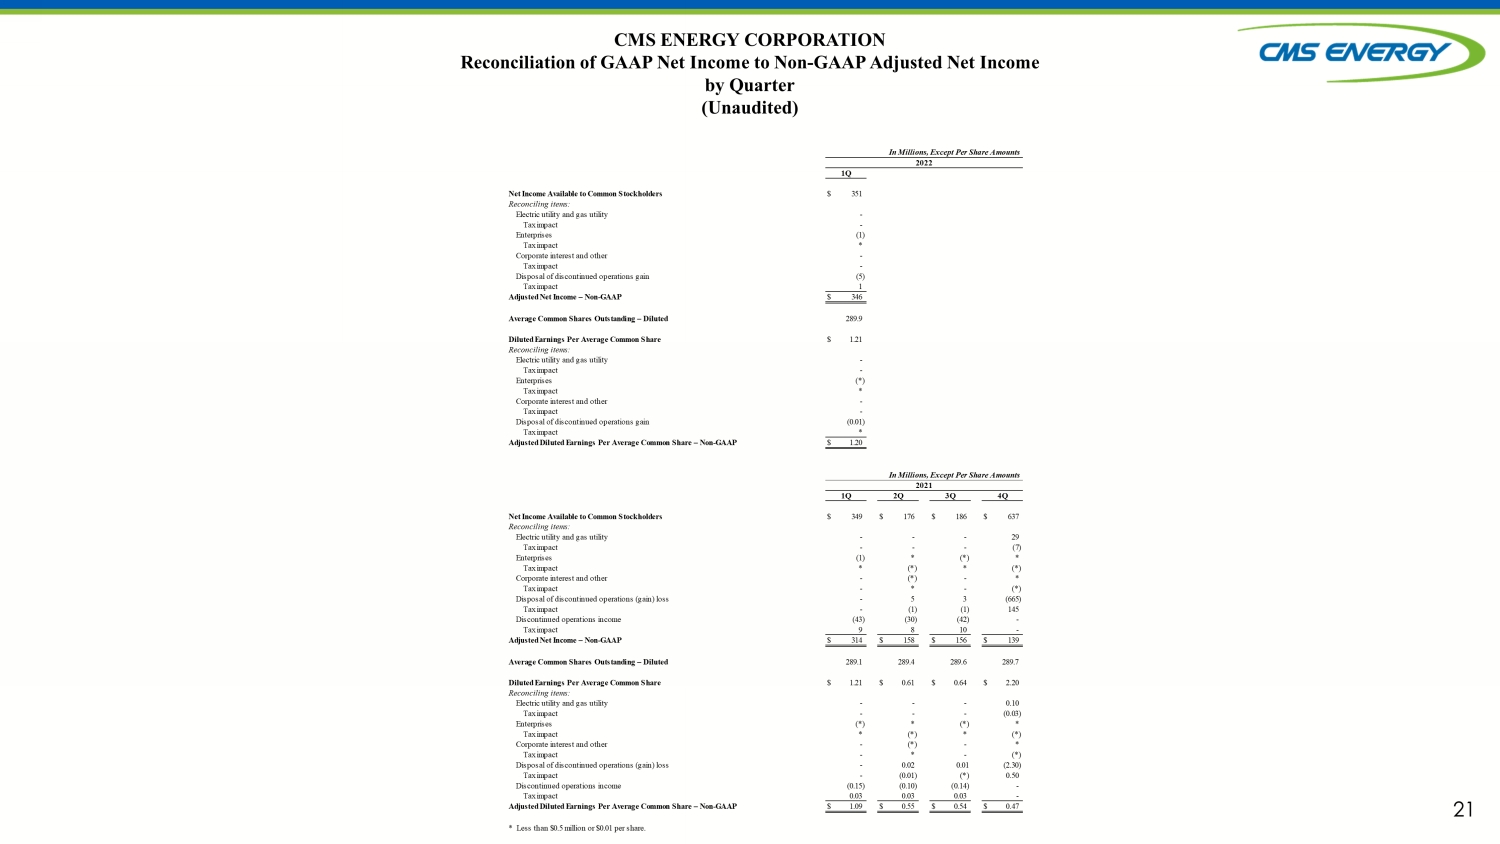
CMS ENERGY CORPORATION
Reconciliation of GAAP Net Income to Non-GAAP Adjusted Net Income
(Unaudited)
| In Millions, Except Per Share Amounts | ||||||||
| Three Months Ended | ||||||||
| 3/31/22 | 3/31/21 | |||||||
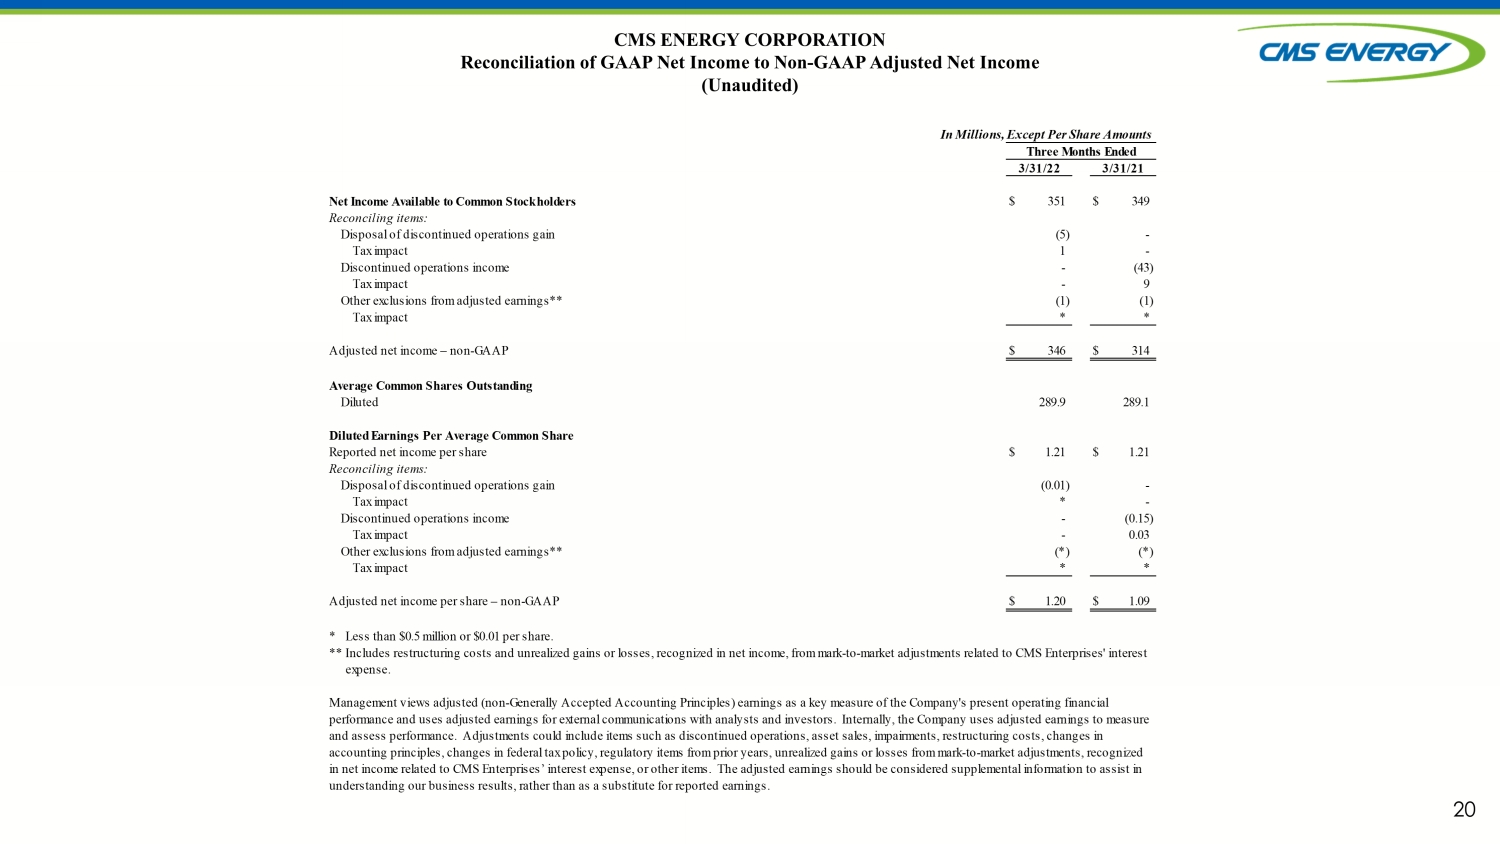
| Net Income Available to Common Stockholders | $ | 351 | $ | 349 | ||||
| Reconciling items: | ||||||||
| Disposal of discontinued operations gain | (5 | ) | - | |||||
| Tax impact | 1 | - | ||||||
| Discontinued operations income | - | (43 | ) | |||||
| Tax impact | - | 9 | ||||||
| Other exclusions from adjusted earnings** | (1 | ) | (1 | ) | ||||
| Tax impact | * | * | ||||||
| Adjusted net income – non-GAAP | $ | 346 | $ | 314 | ||||
| Average Common Shares Outstanding | ||||||||
| Diluted | 289.9 | 289.1 | ||||||
| Diluted Earnings Per Average Common Share | ||||||||
| Reported net income per share | $ | 1.21 | $ | 1.21 | ||||
| Reconciling items: | ||||||||
| Disposal of discontinued operations gain | (0.01 | ) | - | |||||
| Tax impact | * | - | ||||||
| Discontinued operations income | - | (0.15 | ) | |||||
| Tax impact | - | 0.03 | ||||||
| Other exclusions from adjusted earnings** | (* | ) | (* | ) | ||||
| Tax impact | * | * | ||||||
| Adjusted net income per share – non-GAAP | $ | 1.20 | $ | 1.09 | ||||
| * | Less than $0.5 million or $0.01 per share. |
| ** | Includes restructuring costs and unrealized gains or losses, recognized in net income, from mark-to-market adjustments related to CMS Enterprises' interest expense. |
Management views adjusted (non-Generally Accepted Accounting Principles) earnings as a key measure of the Company's present operating financial performance and uses adjusted earnings for external communications with analysts and investors. Internally, the Company uses adjusted earnings to measure and assess performance. Adjustments could include items such as discontinued operations, asset sales, impairments, restructuring costs, changes in accounting principles, changes in federal tax policy, regulatory items from prior years, unrealized gains or losses from mark-to-market adjustments, recognized in net income related to CMS Enterprises’ interest expense, or other items. The adjusted earnings should be considered supplemental information to assist in understanding our business results, rather than as a substitute for reported earnings.