Exhibit 99.1
Media contact: Tesia Williams media-relations@its.jnj.com | Investor contact: Jessica Moore investor-relations@its.jnj.com | |||||||
Johnson & Johnson Reports Q4 and Full-Year 2023 Results
•2023 Fourth-Quarter reported sales growth of 7.3% to $21.4 Billion with operational growth of 7.2%* and adjusted operational growth of 5.7%*. Operational growth excluding COVID-19 Vaccine of 10.9%*
•2023 Fourth-Quarter Earnings per share (EPS) of $1.70 increasing 39.3% and adjusted EPS of $2.29 increasing by 11.7%*
•2023 Full-Year reported sales growth of 6.5% to $85.2 Billion with operational growth of 7.4%* and adjusted operational growth of 5.9%*. Operational growth excluding COVID-19 Vaccine of 9.0%*
•2023 Full-Year EPS of $5.20 decreasing 15.3% due to a special one-time charge in the First-Quarter, and adjusted EPS of $9.92 increasing by 11.1%*
•Company re-confirms guidance for 2024 with operational sales5 growth of 5.0% - 6.0%* and adjusted operational EPS of $10.55 - $10.75, reflecting growth of 7.4%* at the mid-point
New Brunswick, N.J. (January 23, 2024) – Johnson & Johnson (NYSE: JNJ) today announced results for fourth-quarter and full year 2023. “Johnson & Johnson’s full year 2023 results reflect the breadth and competitiveness of our business and our relentless focus on delivering for patients,” said Joaquin Duato, Chairman and Chief Executive Officer. “We have entered 2024 from a position of strength, and I am confident in our ability to lead the next wave of health innovation.”
Unless otherwise noted, the financial results and earnings guidance included below reflect the continuing operations of Johnson & Johnson.
Overall Financial Results

1 Non-GAAP financial measure; refer to reconciliations of non-GAAP financial measures included in accompanying schedules
2 Excludes the impact of translational currency
3 Excludes the net impact of acquisitions and divestitures and translational currency
4 Excludes intangible amortization expense and special items
5 Excludes COVID-19 Vaccine
Note: values may have been rounded
Regional Sales Results
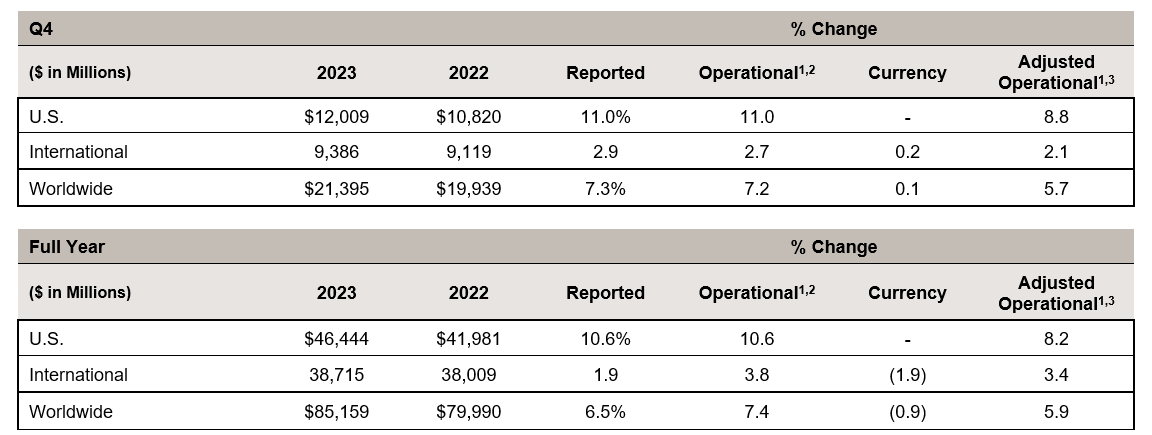
1 Non-GAAP financial measure; refer to reconciliations of non-GAAP financial measures included in accompanying schedules
2 Excludes the impact of translational currency
3 Excludes the net impact of acquisitions and divestitures and translational currency
Note: values may have been rounded
Segment Sales Results
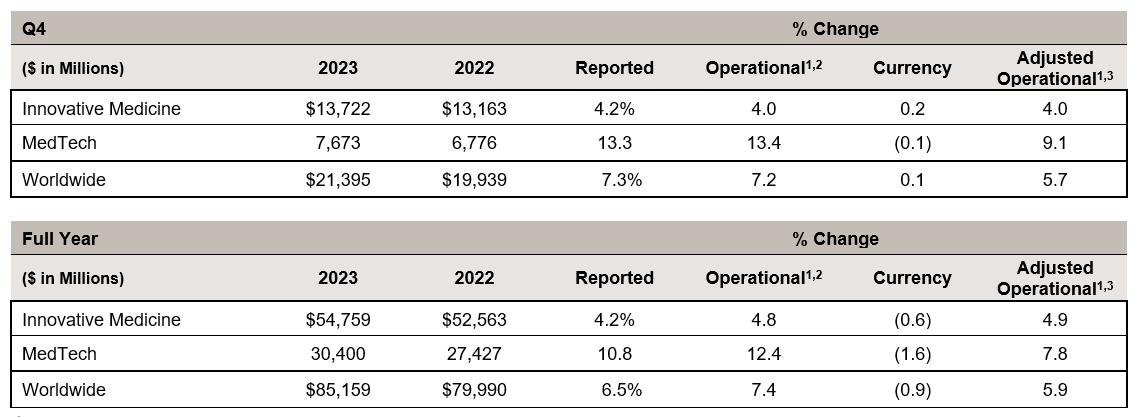
1 Non-GAAP financial measure; refer to reconciliations of non-GAAP financial measures included in accompanying schedules
2 Excludes the impact of translational currency
3 Excludes the net impact of acquisitions and divestitures and translational currency
Note: The Innovative Medicine segment was previously referred to as the Pharmaceutical segment
Values may have been rounded
Full Year 2023 Segment Commentary:
Operational sales* reflected below excludes the impact of translational currency. Adjusted operational sales* reflected below excludes the net impact of acquisitions and divestitures and translational currency.
Innovative Medicine
Innovative Medicine worldwide operational sales, excluding the COVID-19 Vaccine, grew 7.2%*. Growth was driven by DARZALEX (daratumumab), ERLEADA (apalutamide), TECVAYLI (teclistamab-cqyv) in Other Oncology, and CARVYKTI (ciltacabtagene autoleucel) in Oncology, STELARA (ustekinumab) and TREMFYA (guselkumab) in Immunology, and SPRAVATO (esketamine) in Neuroscience. Growth was partially offset by ZYTIGA (abiraterone acetate) and IMBRUVICA (ibrutinib) in Oncology, and REMICADE (infliximab) in Immunology. Including the COVID-19 Vaccine, Innovative Medicine worldwide operational sales grew 4.8%*.
MedTech
MedTech worldwide operational sales grew 12.4%*, with the acquisition of Abiomed contributing 4.7%. MedTech worldwide adjusted operational sales grew 7.8%*, driven primarily by electrophysiology products in Interventional Solutions, contact lenses in Vision, wound closure products in General Surgery, and biosurgery in Advanced Surgery.
Notable New Announcements in the Quarter:
The information contained in this section should be read together with Johnson & Johnson’s other disclosures filed with the Securities and Exchange Commission, including its Current Reports on Form 8-K, Quarterly Reports on Form 10-Q and Annual Reports on Form 10-K. Copies of these filings are available online at www.sec.gov, www.jnj.com or on request from Johnson & Johnson. The reader is also encouraged to review all other news releases and information available in the Investor Relations section of the company’s website at News Releases, as well as Innovative Medicine, MedTech, www.factsabouttalc.com, www.factsaboutourprescriptionopioids.com, and www.LLTManagementInformation.com.
| Regulatory | U.S. Food and Drug Administration Grants Full Approval for BALVERSA to Treat Locally Advanced or Metastatic Bladder Cancer with Select Genetic Alterations1 | Press Release | ||||||
Biosense Webster Announces Regulatory Approval of VARIPULSE Pulsed Field Ablation (PFA) Platform in Japan1 | Press Release | |||||||
| Janssen Submits Marketing Authorisation Application to the European Medicines Agency Seeking Approval of Lazertinib, in combination with RYBREVANT (amivantamab), for the First-Line Treatment of Patients with EGFR-Mutated Non-Small Cell Lung Cancer | Press Release | |||||||
| Johnson & Johnson Submits Supplemental Biologics License Application and New Drug Application to U.S. FDA Seeking Approval of RYBREVANT (amivantamab-vmjw) Plus Lazertinib for the Treatment of Patients with EGFR-Mutated Non-Small Cell Lung Cancer (NSCLC) | Press Release | |||||||
| Johnson & Johnson’s Investigational TAR-200 Granted U.S. FDA Breakthrough Therapy Designation for the Treatment of High-Risk Non-Muscle-Invasive Bladder Cancer | Press Release | |||||||
| Janssen Submits Application to the European Medicines Agency for RYBREVANT (amivantamab) in Combination with Chemotherapy for the Treatment of Adult Patients with Advanced EGFR-Mutated Non-Small Cell Lung Cancer After Failure of Prior Therapy | Press Release | |||||||
| Janssen Submits Supplemental Biologics License Application to U.S. FDA Seeking Approval of RYBREVANT (amivantamab-vmjw) Plus Chemotherapy for the Treatment of Patients with EGFR-Mutated Non-Small Cell Lung Cancer Who Progressed on or after Osimertinib | Press Release | |||||||
| MONARCH Platform for Bronchoscopy Receives Regulatory License for China | Press Release | |||||||
| Data Release | Johnson & Johnson highlights its preeminent leadership in hematology through differentiated blood cancer portfolio and pipeline with new clinical and real-world data at ASH | Press Release | ||||||
| New Real-World Data Show TREMFYA (guselkumab) Was Associated With Clinically Meaningful Improvements in Patient-Reported Outcomes for Adults Living With Active Psoriatic Arthritis | Press Release | |||||||
| Phase 2 Nipocalimab Data Establish Proof of Mechanism in Adults Living with Moderate to Severe Rheumatoid Arthritis, Supporting its Progression into a Combination Study | Press Release | |||||||
| New Biosense Webster QDOT MICRO Catheter Data Demonstrate Very High-Power, Short-Duration Ablations Improved Quality of Life and Reduced Healthcare Utilization for AFib Patients | Press Release | |||||||
| New Phase 3 TREMFYA (guselkumab) Results in Ulcerative Colitis Show a 77 Percent Overall Clinical Response Rate and Early Symptom Improvement | Press Release | |||||||
| Janssen Aims to Define New Standards of Care in the Treatment of Solid Tumor Cancers with Transformative Data Planned for Presentation at ESMO | Press Release | |||||||
| Product Launch | Ethicon Introduces ETHIZIA Hemostatic Sealing Patch, Clinically Proven to Stop Disruptive Bleeding | Press Release | ||||||
| Other | Johnson & Johnson to Acquire Ambrx, Advancing Next Generation Antibody Drug Conjugates to Transform the Treatment of Cancer1 | Press Release | ||||||
| Johnson & Johnson Announces Key Drivers for Long-Term Competitive Growth at Enterprise Business Review | Press Release | |||||||
| Johnson & Johnson Names Eugene A. Woods, Chief Executive Officer of Advocate Health, to its Board of Directors | Press Release | |||||||
| Johnson & Johnson MedTech Acquires Laminar, Inc. | Press Release | |||||||
| Johnson & Johnson MedTech Provides Details and Timeline for General Surgery Robot | Press Release | |||||||
| Johnson & Johnson Announces Departure of Ashley McEvoy, Tim Schmid Named Executive Vice President, Worldwide Chairman of MedTech | Press Release | |||||||
1 Subsequent to the quarter
Full-Year 2024 Guidance:
Johnson & Johnson does not provide GAAP financial measures on a forward-looking basis because the company is unable to predict with reasonable certainty the ultimate outcome of legal proceedings, unusual gains and losses, acquisition-related expenses, and purchase accounting fair value adjustments without unreasonable effort. These items are uncertain, depend on various factors, and could be material to Johnson & Johnson's results computed in accordance with GAAP.
($ in Billions, except EPS) | January 2024 | December 2023 | ||||||
Adjusted Operational Sales1,2,5 Change vs. Prior Year / Mid-point | 5.0% – 6.0% / 5.5% | |||||||
Operational Sales2,5/ Mid-point Change vs. Prior Year / Mid-point | $88.2B – $89.0B / $88.6B 5.0% – 6.0% / 5.5% | 5.0% – 6.0% / 5.5% | ||||||
Estimated Reported Sales3,5/ Mid-point Change vs. Prior Year / Mid-point | $87.8B – $88.6B / $88.2B 4.5% – 5.5% / 5.0% | |||||||
Adjusted Operational EPS (Diluted)2,4/ Mid-point Change vs. Prior Year / Mid-point | $10.55 – $10.75 / $10.65 6.4% – 8.4% / 7.4% | $10.55 – $10.75 / $10.65 7.3% Mid-point | ||||||
Adjusted EPS (Diluted)3,4 / Mid-point Change vs. Prior Year / Mid-point | $10.55 – $10.75 / $10.65 6.4% – 8.4% / 7.4% | |||||||
Average Shares Outstanding (Diluted)6 | ~2,435 million | |||||||
1 Non-GAAP financial measure; excludes the net impact of acquisitions and divestitures
2 Non-GAAP financial measure; excludes the impact of translational currency
3 Calculated using Euro Average Rate: January 2024 = $1.09 and December 2023 = $1.09 (Illustrative purposes only)
4 Non-GAAP financial measure; excludes intangible amortization expense and special items
5 Excludes COVID-19 Vaccine
6 Full Year 2024 Projected Average Shares Outstanding (Diluted) reflects impact from the Kenvue exchange offer
Note: percentages may have been rounded
Other modeling considerations will be provided on the webcast.
Webcast Information:
Johnson & Johnson will conduct a conference call with investors to discuss this earnings release today at 8:30 a.m., Eastern Time. A simultaneous webcast of the call for investors and other interested parties may be accessed by visiting the Johnson & Johnson website. A replay and podcast will be available approximately two hours after the live webcast in the Investor Relations section of the company's website at events-and-presentations.
About Johnson & Johnson:
At Johnson & Johnson, we believe health is everything. Our strength in healthcare innovation empowers us to build a world where complex diseases are prevented, treated, and cured, where treatments are smarter and less invasive, and solutions are personal. Through our expertise in Innovative Medicine and MedTech, we are uniquely positioned to innovate across the full spectrum of healthcare solutions today to deliver the breakthroughs of tomorrow, and profoundly impact health for humanity. Learn more at https://www.jnj.com/.
Non-GAAP Financial Measures:
* “Operational sales growth” excluding the impact of translational currency, “adjusted operational sales growth” excluding the net impact of acquisitions and divestitures and translational currency, as well as “adjusted net earnings”, “adjusted diluted earnings per share” and “adjusted operational diluted earnings per share” excluding after-tax intangible amortization expense and special items, are non-GAAP financial measures and should not be considered replacements for, and should be read together with, the most comparable GAAP financial measures. Except for guidance measures, reconciliations of these non-GAAP financial measures to the most directly comparable GAAP financial measures can be found in the accompanying financial schedules of the earnings release and the Investor Relations section of the company's website at quarterly results.
Copies of the financial schedules accompanying this earnings release are available on the company’s website at quarterly results. These schedules include supplementary sales data, a condensed consolidated statement of earnings, reconciliations of non-GAAP financial measures, and sales of key products/franchises. Additional information on Johnson & Johnson, including adjusted income before tax by segment, an Innovative Medicine pipeline of selected compounds in late stage development and a copy of today’s earnings call presentation can also be found in the Investor Relations section of the company's website at quarterly results.
Note to Investors Concerning Forward-Looking Statements:
This press release contains “forward-looking statements” as defined in the Private Securities Litigation Reform Act of 1995 regarding, among other things: future operating and financial performance, product development, and market position and business strategy. The reader is cautioned not to rely on these forward-looking statements. These statements are based on current expectations of future events. If underlying assumptions prove inaccurate or known or unknown risks or uncertainties materialize, actual results could vary materially from the expectations and projections of Johnson & Johnson. Risks and uncertainties include, but are not limited to: economic factors, such as interest rate and currency exchange rate fluctuations; competition, including technological advances, new products and patents attained by competitors; challenges inherent in new product research and development, including uncertainty of clinical success and obtaining regulatory approvals; uncertainty of commercial success for new and existing products; challenges to patents; the impact of patent expirations; the ability of the Company to successfully execute strategic plans, including restructuring plans; the impact of business combinations and divestitures; manufacturing difficulties or delays, internally or within the supply chain; product efficacy or safety concerns resulting in product recalls or regulatory action; significant adverse litigation or government action, including related to product liability claims; changes to applicable laws and regulations, including tax laws and global health care reforms; trends toward health care cost containment; changes in behavior and spending patterns of purchasers of health care products and services; financial instability of international economies and legal systems and sovereign risk; increased scrutiny of the health care industry by government agencies; the Company’s ability to realize the anticipated benefits from the separation of the Company’s Consumer Health business; and the New Consumer Health Company’s ability to succeed as a standalone publicly traded company. A further list and descriptions of these risks, uncertainties and other factors can be found in Johnson & Johnson’s Annual Report on Form 10-K for the fiscal year ended January 1, 2023, including in the sections captioned “Cautionary Note Regarding
Forward-Looking Statements” and “Item 1A. Risk Factors,” and in Johnson & Johnson’s subsequent Quarterly Reports on Form 10-Q and other filings with the Securities and Exchange Commission. Copies of these filings are available online at www.sec.gov, www.jnj.com or on request from Johnson & Johnson. Any forward-looking statement made in this release speaks only as of the date of this release. Johnson & Johnson does not undertake to update any forward-looking statement as a result of new information or future events or developments.