UNITED STATES
SECURITIES AND EXCHANGE COMMISSION
WASHINGTON, D.C. 20549
FORM 10-K
For the fiscal year ended December 31, 2019
or
For the transition period from to
Commission File No. 000-08185
(Exact name of registrant as specified in its charter)
(State or other jurisdiction of incorporation or organization) | (I.R.S. Employer Identification No.) |
(Address and Zip Code of principal executive offices)
(Registrant's telephone number, including area code)
Securities registered pursuant to Section 12(b) of the Act:
Title of each class | Trading Symbol(s) | Name of each exchange on which registered |
Indicate by check mark if the registrant is a well-known seasoned issuer, as defined in Rule 405 of the Securities Act. Yes ☑ No ☐
Indicate by check mark if the registrant is not required to file reports pursuant to Section 13 or Section 15(d) of the Act. Yes ☐ No ☑
Indicate by check mark whether the registrant (1) has filed all reports required to be filed by Section 13 or 15(d) of the Securities Exchange Act of 1934 during the preceding 12 months (or for such shorter period that the registrant was required to file such reports), and (2) has been subject to such filing requirements for the past 90 days. Yes ☑ No ☐
Indicate by check mark whether the registrant has submitted electronically every Interactive Data File required to be submitted pursuant to Rule 405 of Regulation S-T (§232.405 of this chapter) during the preceding 12 months (or for such shorter period that the registrant was required to submit such files). Yes ☑ No ☐
Indicate by check mark whether the registrant is a large accelerated filer, an accelerated filer, a non-accelerated filer, a smaller reporting company, or an emerging growth company. See the definitions of "large accelerated filer," "accelerated filer," "smaller reporting company," and "emerging growth company" in Rule 12b-2 of the Exchange Act.
☑ | Accelerated filer | ☐ | |||
Non-accelerated filer | ☐ | Smaller reporting company | Emerging growth company | ||
If an emerging growth company, indicate by check mark if the registrant has elected not to use the extended transition period for complying with any new or revised financial accounting standards provided pursuant to Section 13(a) of the Exchange Act. ☐
Indicate by check mark whether the registrant is a shell company (as defined in Rule 12b-2 of the Exchange Act). Yes ☐ No ☑
The aggregate market value of the voting and non-voting common equity held by non-affiliates computed by reference to the close price of such common equity, as of the last business day of the registrant's most recently completed second fiscal quarter as reported by The NASDAQ Stock Market, was $2,866,504,997 .
As of February 24, 2020, there were 152,776,438 shares outstanding of the registrant's common stock, par value $1 per share, its only outstanding class of common stock.
DOCUMENTS INCORPORATED BY REFERENCE
Specific portions of the Registrant's definitive Proxy Statement for the 2020 Annual Meeting of Shareholders to be held on May 6, 2020 are incorporated by reference into Part III hereof.
TABLE OF CONTENTS
Description | Page | |
Part I
Item 1. Business
General
TCF Financial Corporation ("TCF") is a financial holding company, a Michigan corporation incorporated in 1973 and headquartered in Detroit, Michigan. TCF completed a merger of equals with Chemical Financial Corporation ("Merger of Equals") on August 1, 2019. We had total assets of $46.7 billion at December 31, 2019 and were the 28th largest publicly traded bank holding company in the United States based on total assets at December 31, 2019.
Through our wholly-owned bank subsidiary, TCF National Bank, a national banking association ("TCF Bank") with its main office in Sioux Falls, South Dakota, we provide a full range of consumer-facing and commercial services, including consumer and commercial banking, trust and wealth management, and specialty leasing and lending products and services to consumers, small businesses and commercial customers. As of December 31, 2019, we had 520 branches primarily located in Michigan, Minnesota, Illinois, Ohio, Colorado and Wisconsin (our "primary banking markets"). We also conduct business across all 50 states and Canada through our specialty lending and leasing businesses.
References herein to "TCF Financial" refer to TCF Financial Corporation on an unconsolidated basis. TCF Financial Corporation (together with its direct and indirect subsidiaries, are referred to as "we," "us," "our," "TCF" or the "Corporation".
Merger of Equals
On August 1, 2019 (the "Merger Date"), TCF Financial Corporation, a Delaware corporation ("Legacy TCF"), merged with and into Chemical Financial Corporation ("Chemical"), with Chemical surviving the merger (the "Merger"). Immediately following the Merger, Chemical’s wholly owned bank subsidiary, Chemical Bank, a Michigan state-chartered bank, merged with and into TCF Bank, with TCF Bank surviving the merger. Upon completion of the Merger, Chemical was renamed TCF Financial Corporation.
The Merger was accounted for as a reverse merger using the acquisition method of accounting, therefore, Legacy TCF was deemed the acquirer for financial reporting purposes, even though Chemical was the legal acquirer. Accordingly, Legacy TCF's historical financial statements are the historical financial statements of the combined company for all periods before the Merger Date. Our results of operations for the year ended December 31, 2019 include the results of operations of Chemical on and after August 1, 2019. Results for periods before August 1, 2019 reflect only those of Legacy TCF and do not include the results of operations of Chemical. Accordingly, comparisons of our results for the year ended December 31, 2019 with those of prior periods may not be meaningful. The number of shares issued and outstanding, earnings per share, additional paid-in-capital, dividends paid and all references to share quantities of TCF have been retrospectively adjusted to reflect the equivalent number of shares issued in the Merger. See "Note 2. Merger" of the Notes to Consolidated Financial Statements for further information. In addition, the assets, including the intangible assets identified, and liabilities of Chemical as of the Merger Date have been recorded at their estimated fair value and added to those of Legacy TCF.
Reportable Segments
Our reportable segments are Consumer Banking, Commercial Banking and Enterprise Services. In connection with the Merger, we renamed the Wholesale Banking segment to Commercial Banking to align with the way it is now managed.
Consumer Banking Segment
Consumer Banking is comprised of all of our consumer and small business-facing businesses and includes Retail Banking, Wealth Management, Residential and Consumer Lending, and Business Banking. Our consumer banking strategy is primarily to generate deposits and originate high credit quality loans for investment and sale. Deposits are generated from consumers and small businesses to provide a source of low-cost funds, with a focus on building and maintaining quality customer relationships.
1
Retail Banking We offer an array of solutions for consumers and small businesses through its physical and digital distribution channels. We offer a broad selection of deposit and lending services including (i) checking and savings accounts, (ii) credit and debit cards, (iii) check cashing and remittance services and (iv) residential, consumer and small business lending.
Deposits are our primary source of funds for use in lending and for other general business purposes. Deposit inflows and outflows are significantly influenced by general interest rates, market and competitive conditions and other economic factors. We acquire deposits from within our primary banking markets through (i) checking, savings and money market accounts, (ii) certificates of deposit and (iii) individual retirement accounts. Such deposit accounts provide fee income, including fees and service charges.
At December 31, 2019, we had 520 branches, consisting of 396 traditional branches, 121 supermarket branches and three campus branches. We operate 236 branches in Michigan, 120 in Illinois, 85 in Minnesota, 32 in Colorado, 22 in Ohio, 17 in Wisconsin, seven in Arizona, and one in South Dakota. We also offer 1,099 ATMs across our primary banking markets.
Providing a wide range of retail banking services is an integral component of our business philosophy. Primary drivers of our fees and service charges include the number of customers we attract, our customers' level of engagement and the frequency with which our customer uses our solutions. Our business philosophy is to offer our customers an "easy-to-bank-with" experience, with multiple solutions that benefit the customer and are consistent with our business philosophy. Our customers have convenient access to their funds through their credit and debit cards, as well as by utilizing our enhanced digital channels. Our card programs are supported by interchange fees paid by retailers.
Wealth Management We offer services through the Wealth Management department of TCF Bank. These services include investment management and custodial services; trust services; financial and estate planning; and retirement planning and employee benefit programs. The Wealth Management department earns revenue largely from fees based on the market value of those assets under our management, which can fluctuate as the market fluctuates. Our Wealth Management department had assets under custodial and management arrangements of $5.0 billion at December 31, 2019. Through the Wealth Management department, we also sell investment products (largely annuity products and mutual funds) through the TCF Financial Advisors program. Customer assets within the TCF Financial Advisors program were $1.8 billion at December 31, 2019.
Residential and Consumer Lending We originate residential and other consumer loans for personal, family or household purposes, such as home purchases, debt consolidation and financing of home improvements. Our retail lending origination activity primarily consists of consumer real estate secured lending. It also includes originating loans secured by personal property and, to a limited extent, unsecured personal loans. Consumer loans are originated for investment and for sale, either on a fixed-term basis or as a revolving line of credit.
We also service loans for investors under contracts where we receive a fee for performing servicing activities on consumer loans that are not owned by us and are not included on our balance sheet. This process involves collecting monthly loan payments on behalf of investors, reporting information to those investors on a timely basis and maintaining custodial escrow accounts for remitting principal and interest payments to investors, and for paying property taxes and insurance premiums on behalf of borrowers.
On December 18, 2019, TCF Bank and its subsidiary Gateway One Lending & Finance, LLC completed the sale of the Legacy TCF auto finance portfolio, selling approximately $1.1 billion in motor vehicle consumer installment contracts to Santander Consumer USA Inc.
Business Banking We offer small businesses, corporations and governmental entities various products and services, including loans and lines of credit, deposits, cash management, capital market products, international trade finance, letters of credit, foreign exchange management services and loan syndication services.
2
Commercial Banking Segment
Commercial Banking, previously named Wholesale Banking, is comprised of commercial and industrial, commercial real estate banking and lease financing. Our commercial banking strategy focuses on building full commercial relationships including originating high credit quality loans and leases and providing deposit and treasury services.
Commercial and Industrial The commercial and industrial loans we originate are secured by various types of business assets including inventory, receivables, equipment or financial instruments, and may also be backed by personal guarantees of the owner or other sources of repayment. Commercial and industrial loans are used for a variety of purposes, including working capital and financing the purchase of equipment.
TCF Bank's wholly-owned subsidiary, TCF Inventory Finance, Inc. ("TCFIF") originates commercial, primarily variable-rate loans which are secured by the underlying floorplan equipment and supported by repurchase agreements from original equipment manufacturers. TCFIF focuses on establishing relationships with distributors, dealer buying groups and manufacturers, giving us access to thousands of independent retailers primarily in the areas of powersports equipment and lawn and garden equipment. TCFIF's portfolio balances are impacted by seasonal shipments and sales activities as dealers receive inventory shipments in anticipation of the upcoming selling season while carrying current season product. In 2009, TCFIF formed a joint venture with The Toro Company ("Toro") called Red Iron Acceptance, LLC ("Red Iron"). Red Iron provides U.S. distributors and dealers and select Canadian distributors of the Toro® and Exmark® brands with reliable, cost-effective sources of financing. We maintain a 55% ownership interest in Red Iron, with Toro owning the other 45%.
Commercial Real Estate The commercial real estate loans we originate are primarily secured by commercial real estate, including multi-family housing, office buildings, health care facilities, warehouse and industrial buildings, hotel and motel buildings, self-storage buildings and retail services buildings. The commercial real estate portfolio represented 39.3% and 24.3% of our total commercial portfolio at December 31, 2019 and 2018, respectively.
Lease Financing Our leasing business, TCF Capital Solutions, a division of TCF Bank, delivers comprehensive lease and equipment finance products addressing the diverse financing needs of small to large companies in a growing number of select market segments including specialty vehicles, construction equipment, golf cart and turf equipment, manufacturing equipment, medical equipment, trucks and trailers, furniture and fixtures, technology and data processing equipment, and agricultural equipment.
Enterprise Services
Enterprise Services is comprised of (i) corporate treasury, which includes our investment and borrowing portfolios and management of capital, debt and market risks, (ii) corporate functions, such as information technology, risk and credit management, bank operations, finance, investor relations, corporate development, internal audit, legal and human capital management that provide services to the operating segments, (iii) TCF Financial and (iv) eliminations. Our investment portfolio accounts for the earning assets within this segment. Borrowings may be used to offset reductions in deposits or to support lending activities. This segment also includes residual revenues and expenses representing the difference between actual amounts incurred by Enterprise Services and amounts allocated to the operating segments, including interest rate risk residuals such as funds transfer pricing mismatches.
Corporate Treasury Corporate treasury's primary responsibility is management of our liquidity, capital, interest rate risk, and investment and borrowing portfolios. Corporate treasury has authority to invest in various types of liquid assets including, but not limited to, U.S. Department of the Treasury obligations and debt securities of various federal agencies and U.S. Government sponsored enterprises, obligations of states and political subdivisions, deposits of insured banks, bankers' acceptances and federal funds. Corporate treasury also has the authority to enter into wholesale borrowing transactions which may be used to compensate for reductions in deposit inflows or net deposit outflows, or to support lending, leasing and other expansion activities. These borrowings may include Federal Home Loan Bank ("FHLB") advances, brokered deposits, repurchase agreements, federal funds and other permitted borrowings from counterparties.
See "Item 7. Management's Discussion and Analysis - Consolidated Income Statement Analysis - Reportable Segments" and "Note 27. Reportable Segments" of Notes to Consolidated Financial Statements for further information.
3
Other Information
Activities of Subsidiaries of TCF Our business operations include those conducted by direct and indirect subsidiaries of TCF Financial, all of which are consolidated for purposes of preparing our consolidated financial statements. TCF Bank's subsidiaries principally engage in inventory finance activities. See "Commercial Banking" above for further information.
Competition We compete with a number of depository institutions and financial service providers primarily based on price and service and we face significant competition in attracting and retaining deposits and in lending activities. Direct competition for deposits comes primarily from banks, savings institutions, credit unions and investment banks. Additional significant competition for deposits comes from institutions selling money market mutual funds and corporate and government securities. We compete for the origination of loans with banks, mortgage bankers, mortgage brokers, consumer and commercial finance companies, credit unions, insurance companies and savings institutions. We also compete nationwide with other companies and banks in the financing of equipment and inventory, leasing of equipment and origination of residential mortgage loans. The growth of financial technology companies, disintermediation and lowered barriers to entry through technology have increased competition for loan, lease and deposit products as non-banks now offer products and services traditionally provided by banks.
Employees As of December 31, 2019, we had 8,209 employees, including 955 part-time employees. We provide our employees with comprehensive benefits, some of which are provided on a contributory basis, including medical and dental plans, a 401(k) savings plan with a company matching contribution, life insurance and short- and long-term disability coverage.
Supervision and Regulation
As a financial institution, we operate in a highly regulated environment. The regulatory framework under which we operate is intended primarily for the protection of depositors and the Federal Deposit Insurance Corporation’s (the “FDIC’s”) Deposit Insurance Fund and not for the protection of our shareholders and creditors. The following is a general summary of the material aspects of certain statutes and regulations applicable to us. These summary descriptions are not complete, and you should refer to the full text of the statutes, regulations, and corresponding guidance for more information. These statutes and regulations are subject to change, and additional statutes, regulations, and corresponding guidance may be adopted. We are unable to predict these future changes or the effects, if any, that these changes could have on our business, revenues, and results of operations.
Examinations and Regulatory Sanctions TCF Financial is a financial holding company registered under the Bank Holding Company Act of 1956 (the “BHC Act”) and is subject to supervision and regulation by the Federal Reserve. Federal laws subject financial holding companies to particular restrictions on the types of activities in which they may engage and to a range of supervisory requirements and activities, including regulatory enforcement actions, for violation of laws and policies. TCF Financial is required to file annual and quarterly reports with the Federal Reserve and such additional information as the Federal Reserve may require pursuant to the BHC Act. The Federal Reserve may examine a bank holding company or any of its subsidiaries and charge the company for the cost of such an examination. TCF Bank is a national banking association, which is subject to regulation and supervision primarily by the Office of the Comptroller of the Currency ("OCC") and secondarily by the Federal Reserve and the FDIC. The OCC regularly examines TCF Bank. The FDIC may also periodically examine and evaluate insured banks. TCF Bank is subject to requirements and restrictions under federal law, including requirements to maintain reserves against deposits, restrictions on the types and amounts of loans that may be granted and the interest that may be charged thereon and limitations on the types of investments that may be made and the types of services that may be offered. Various consumer laws and regulations also affect the operations of TCF Bank.
Federal banking regulators may impose a number of restrictions or new requirements on institutions, including, but not limited to, growth limitations, dividend restrictions, increased regulatory capital requirements, increased loan and lease loss reserve requirements, increased supervisory assessments, activity limitations or other restrictions that could have an adverse effect on such institutions, their holding companies or holders of their debt and equity securities. Various enforcement remedies, including civil money penalties, may be assessed against an institution or an institution's directors, officers, employees, agents or independent contractors. Certain enforcement actions may not be publicly disclosed by us or our federal banking regulators. Subsidiaries of TCF Bank are also subject to state and/or self-regulatory organization licensing, regulation and examination requirements in connection with certain activities.
4
Regulatory Capital Requirements TCF Financial and TCF Bank are subject to various minimum regulatory capital requirements administered by the Federal Reserve and the OCC. These requirements include quantitative measures that assign risk weightings to assets and off-balance sheet items, as well as define and set minimum regulatory capital requirements. Failure to meet minimum capital requirements can initiate certain mandatory, and possible additional discretionary, actions by the federal banking regulators that, if undertaken, could have a material adverse effect on our financial condition and results of operations.
The Basel III capital standards impose minimum capital requirements for bank holding companies and banks. The rules apply to all national and state banks and savings associations regardless of size and bank holding companies and savings and loan holding companies with more than $3 billion in total consolidated assets. More stringent requirements are imposed on “advanced approaches” banking organizations which are organizations with $250 billion or more in total consolidated assets, $10 billion or more in total foreign exposures, or that have opted into the Basel III capital regime. In addition, in order to avoid restrictions on capital distributions or discretionary bonus payments to executives, under Basel III, a banking organization must maintain a “capital conservation buffer” on top of its minimum risk-based capital requirements. This buffer must consist solely of common equity Tier 1 capital, but the buffer applies to all three risk-based measurements (common equity Tier 1 capital, Tier 1 capital and total capital). The 2.5% capital conservation buffer was phased in incrementally over time, and became fully effective for us on January 1, 2019, resulting in the following effective minimum capital plus capital conservation buffer ratios: (i) a common equity Tier 1 capital ratio of 7.0%, (ii) a Tier 1 risk-based capital ratio of 8.5%, and (iii) a total risk-based capital ratio of 10.5%. TCF Financial and TCF Bank made the one-time permanent election permitted under the Basel III capital standards to not include accumulated other comprehensive income (loss) in regulatory capital. TCF Financial and TCF Bank exceeded the Basel III capital standard at December 31, 2019. See "Note 19. Regulatory Capital Requirements" of the Notes to Consolidated Financial Statements for further information.
On December 21, 2018, the federal banking agencies issued a joint final rule to revise their regulatory capital rules to (i) address the upcoming implementation of a new credit impairment model, the Current Expected Credit Loss, or CECL model, an accounting standard under GAAP; (ii) provide an optional three-year phase-in period for the day-one adverse regulatory capital effects that banking organizations are expected to experience upon adopting CECL; and (iii) require the use of CECL in stress tests beginning with the 2020 capital planning and stress testing cycle for certain banking organizations that are subject to stress testing. See "Note 3. Summary of Significant Accounting Policies" of the Notes to the Consolidated Financial Statements for further information.
In addition to the capital rules applicable to both banks and bank holding companies discussed above, under the prompt corrective action regulations, the federal bank regulators are required and authorized to take supervisory actions against undercapitalized banks. For this purpose, a bank is placed in one of five categories based on the bank’s capital: well-capitalized, adequately capitalized, undercapitalized, significantly undercapitalized and critically undercapitalized. Currently, the quantitative requirements for being well-capitalized are (at least 5% leverage capital, 6.5% common equity Tier 1 capital, 8% Tier 1 capital and 10% total capital). TCF Bank was considered well-capitalized at December 31, 2019.
Federal banking regulators are required to take various mandatory supervisory actions and are authorized to take other discretionary actions with respect to institutions in the three undercapitalized categories. The severity of the action depends upon the capital category in which the institution is placed. Generally, subject to a narrow exception, banking regulators must appoint a receiver or conservator for an institution that is “critically undercapitalized.” The federal banking agencies have specified by regulation the relevant capital level for each category. An institution that is categorized as “undercapitalized,” “significantly undercapitalized,” or “critically undercapitalized” is required to submit an acceptable capital restoration plan to its appropriate federal banking agency, which, for TCF Bank, is the OCC. Failure to meet capital guidelines could subject TCF Bank to a variety of enforcement remedies, including issuance of a capital directive, the termination of deposit insurance by the FDIC, a prohibition on accepting brokered deposits and other restrictions on our business.
Restrictions on Distributions TCF Financial's ability to pay dividends is subject to limitations imposed by the Federal Reserve. In general, Federal Reserve regulatory guidelines require the board of directors of a bank holding company to consider a number of factors in determining the payment of dividends, including the quality and level of current and future earnings. Restricted retained earnings represents earnings legally appropriated to thrift bad debt reserves and deducted for federal income tax purposes in prior years and is generally not available for payment of cash dividends or other distributions to shareholders. See "Note 18. Equity" of Notes to Consolidated Financial Statements for further information on restricted retained earnings.
5
Dividends or other capital distributions from TCF Bank to TCF Financial are the primary source of funds to enable TCF Financial to pay dividends on its preferred and common stock, to pay TCF Financial's obligations, to repurchase common stock or to meet other cash needs. The ability of TCF Financial and TCF Bank to pay dividends depends on regulatory policies and regulatory capital requirements and may be subject to regulatory approval. TCF Financial and TCF Bank must also obtain the common equity Tier 1 capital conservation buffer of 2.5% to avoid becoming subject to restrictions on capital distributions (as discussed above).
In general, TCF Bank may not declare or pay a dividend to TCF Financial in excess of 100% of its net retained earnings for the current year combined with its net retained earnings for the preceding two calendar years without prior approval of the OCC. The OCC also has the authority to prohibit the payment of dividends by a national bank when it determines such payments would constitute an unsafe and unsound banking practice. TCF Bank's ability to make capital distributions in the future may require regulatory approval and may be restricted by the OCC. TCF Bank's ability to make any such distributions will also depend on its earnings and ability to meet minimum regulatory capital requirements in effect during future periods. In the future, these capital adequacy standards may be higher than existing minimum regulatory capital requirements. See "Note 19. Regulatory Capital Requirements" of Notes to Consolidated Financial Statements for further information.
In addition, income tax considerations may limit the ability of TCF Bank to make dividend payments in excess of its current and accumulated tax earnings. Annual dividend distributions in excess of earnings could result in a tax liability based on the amount of excess earnings distributed and current tax rates.
Regulation of TCF and Affiliates and Insider Transactions TCF Financial is subject to Federal Reserve regulations, examinations and reporting requirements applicable to bank holding companies. Subsidiaries of bank holding companies, like TCF Bank, are subject to certain restrictions in their dealings with holding company affiliates.
Source of Strength A holding company must serve as a source of strength for its subsidiary banks and the Federal Reserve may require a holding company to contribute additional capital to an undercapitalized subsidiary bank. In addition, the OCC may assess TCF Financial if it believes the capital of TCF Bank has become impaired. If TCF Financial were to fail to pay such an assessment within three months, the Board of Directors would be required to cause the sale of TCF Bank's stock to cover a deficiency in the capital. In the event of a bank holding company's bankruptcy, any commitment by the bank holding company to a federal banking regulator to maintain the capital of a subsidiary bank would be assumed by the bankruptcy trustee and may be entitled to priority over other creditors.
Restrictions on Acquisitions and Changes in Control Under federal and state law, merger and branch acquisition transactions may be subject to certain restrictions, including certain nationwide and statewide insured deposit maximum concentration levels or other limitations. In addition, federal and state laws and regulations contain a number of provisions which impose restrictions on changes in control of financial institutions such as TCF Bank and which require regulatory approval prior to any such changes in control.
Under the BHA Act, Federal Reserve approval is required before acquiring more than 5% control, or substantially all of the assets, of another bank or bank holding company, or merging or consolidating with such a bank or bank holding company. The BHCA also generally prohibits a bank holding company, with certain exceptions, from acquiring direct or indirect ownership or control of more than 5% of the voting shares of any company which is not a bank or bank holding company, or from engaging directly or indirectly in activities other than those of banking, managing or controlling banks, providing services for its subsidiaries or conducting activities permitted by the Federal Reserve as being closely related to the business of banking. Further restrictions or limitations on acquisitions or establishing financial subsidiaries may also be imposed by our regulators or examiners.
Insurance of Accounts TCF Bank is a member of the FDIC, which maintains the Deposit Insurance Fund (the "DIF"). The FDIC insures deposits up to prescribed limits for each depositor through the DIF, which is funded through assessments on member institutions. To maintain the DIF, member institutions are assessed an insurance premium based on an assessment base and an assessment rate.
6
The Dodd-Frank Wall Street Reform and Consumer Protection Act of 2010 (the "Dodd-Frank Act") gave the FDIC much greater discretion to manage the DIF and also changed the assessment base from domestic deposits to average total assets less tangible equity. Additionally, the Dodd-Frank Act raised the minimum designated reserve ratio (the "DRR") to 1.35% of estimated insured deposits from 1.15% and required this new minimum be reached by September 30, 2020. From July 1, 2016 to October 1, 2018, an additional surcharge of 4.5 cents for each $100 of an institution's assessment base in excess of $10.0 billion was assessed to ensure the DRR reached this new minimum by the required date. The DIF ratio calculated by the FDIC using estimated insured deposits as of September 30, 2019 was 1.41%.
In 2019, insurance premiums on bank deposits insured by the FDIC for banks with at least $10.0 billion in total assets ranged from 1.5 cents to 40 cents per $100 of the institution's assessment base. Our FDIC insurance expense was $18.3 million, $15.1 million and $16.0 million in 2019, 2018 and 2017, respectively.
In addition to deposit insurance premium assessments from the FDIC, additional assessments may be imposed by the Financing Corporation, a separate U.S. government agency affiliated with the FDIC, to pay for the interest cost of Financing Corporation bonds. The final collection for this assessment was on March 29, 2019.
Community Reinvestment Act TCF Bank is subject to certain requirements and reporting obligations under the Community Reinvestment Act (“CRA”), which requires federal banking regulators to evaluate the record of each financial institution in meeting the credit needs of its local community, including low- and moderate- income neighborhoods. The CRA further requires these criteria to be considered in evaluating mergers, acquisitions and applications to open a branch or facility. Failure to adequately meet these criteria could result in the imposition of additional requirements and limitations on TCF Bank. Additionally, financial institutions must publicly disclose the terms of various CRA‑related agreements. In its most recent CRA examination, TCF Bank received an “outstanding” rating.
In December 2019, the FDIC and the OCC proposed changes to the regulations implementing the CRA, which, if adopted will result in changes to the current CRA framework. The Federal Reserve Board did not join the proposal.
CFPB Examination The Dodd-Frank Act created the CFPB, which is granted broad rulemaking, supervisory and enforcement powers under various federal consumer financial protection laws, including the Equal Credit Opportunity Act, Truth in Lending Act, Real Estate Settlement Procedures Act, Fair Credit Reporting Act, Fair Debt Collection Practices Act, the Consumer Financial Privacy provisions of the Gramm-Leach-Bliley Act and certain other statutes. The CFPB has examination and primary enforcement authority with respect to depository institutions with $10 billion or more in assets, such as TCF Bank. The CFPB has authority to prevent unfair, deceptive or abusive practices in connection with the offering of consumer financial products.
The CFPB has issued a number of regulations related to the origination of mortgages, foreclosures, and overdrafts as well as many other consumer issues. Additionally, the CFPB has proposed, or may propose, additional regulations or modifying existing regulations that directly relate to our business. Although it is difficult to predict at this time the extent to which the CFPB’s final rules impact the operations and financial condition of the TCF Bank, such rules may have a material impact on our compliance costs, compliance risk and fee income.
Anti-Money Laundering As a financial institution, TCF Bank must maintain anti‑money laundering programs that include established internal policies, procedures and controls; a designated compliance officer; an ongoing employee training program; and testing of the program by an independent audit function. Financial institutions are also prohibited from entering into specified financial transactions and account relationships and must meet enhanced standards for due diligence and “knowing your customer” in their dealings with foreign financial institutions, foreign customers and other high-risk customers. Financial institutions must take reasonable steps to conduct enhanced scrutiny of account relationships to guard against money laundering and to report any suspicious transactions, and recent laws provide law enforcement authorities with increased access to financial information maintained by banks. Anti‑money laundering obligations have been substantially strengthened as a result of the USA PATRIOT Act (the “Patriot Act”), as described below. Bank regulators routinely examine institutions for compliance with these obligations, and this area has become a particular focus of the regulators in recent years. In addition, the regulators are required to consider compliance in connection with the regulatory review of applications. The regulatory authorities have been active in imposing “cease and desist” orders and money penalty sanctions against institutions found to be violating these obligations.
7
USA Patriot Act The Patriot Act became effective on October 26, 2001 and amended the Bank Secrecy Act. The Patriot Act provides, in part, for the facilitation of information sharing among governmental entities and financial institutions for the purpose of combating terrorism and money laundering by enhancing anti‑money laundering and financial transparency laws, as well as enhanced information collection tools and enforcement mechanics for the U.S. government, including:
• | requiring standards for verifying customer identification at account opening; |
• | rules to promote cooperation among financial institutions, regulators and law enforcement entities in identifying parties that may be involved in terrorism or money laundering; |
• | reports by nonfinancial trades and businesses filed with the Treasury Department’s Financial Crimes Enforcement Network for transactions exceeding $10,000; and |
• | filing suspicious activities reports by brokers and dealers if they believe a customer may be violating U.S. laws and regulations. |
The Patriot Act requires financial institutions to undertake enhanced due diligence of private bank accounts or correspondent accounts for non‑U.S. persons that they administer, maintain, or manage. Bank regulators routinely examine institutions for compliance with these obligations and are required to consider compliance in connection with the regulatory review of applications.
Under the Patriot Act, the Financial Crimes Enforcement Network (“FinCEN”) can send TCF Bank a list of the names of persons suspected of involvement in terrorist activities or money laundering. TCF Bank may be requested to search its records for any relationships or transactions with persons on the list. If TCF Bank finds any relationships or transactions, it must report those relationships or transactions to FinCEN.
Consumer Protection Regulations Interest and other charges that TCF Bank collects or contracts for are subject to state usury laws and federal laws concerning interest rates. TCF Bank’s loan operations also are subject to federal laws applicable to credit transactions, such as:
• | the Truth in Lending Act, governing disclosures of credit terms to consumer borrowers; |
• | the Home Mortgage Disclosure Act, requiring financial institutions to provide information to enable the public and public officials to determine whether a financial institution is fulfilling its obligation to help meet the housing needs of the community it serves; |
• | the Equal Credit Opportunity Act, prohibiting discrimination on the basis of race, creed or other prohibited factors in extending credit; |
• | the Fair Credit Reporting Act, governing the use and provision of information to credit reporting agencies; |
• | the Fair Debt Collection Practices Act, governing the manner in which consumer debts may be collected by collection agencies; and |
• | the rules and regulations of the various governmental agencies charged with the responsibility of implementing these federal laws. |
In addition, TCF Bank’s deposit operations are subject to the Electronic Funds Transfer Act and Regulation E issued by the Federal Reserve to implement that act, which govern automatic deposits to and withdrawals from deposit accounts and customers’ rights and liabilities arising from the use of ATMs and other electronic banking services.
National Bank Investment Limitations Permissible investments by national banks are limited by the National Bank Act of 1864, as amended, and by rules of the OCC. Non-traditional bank activities permitted by the Gramm-Leach-Bliley Act of 1999 will subject a bank to additional regulatory limitations or requirements, including a required regulatory capital deduction and application of transactions with affiliates limitations in connection with such activities.
Taxation
Federal Taxation Our federal income tax returns are open and subject to examination for 2016 and later tax return years.
8
State Taxation TCF and/or its subsidiaries currently file tax returns in all state and local taxing jurisdictions which impose corporate income, franchise or other taxes. Our various state income tax returns are generally open for 2015 and later tax return years based on individual state statutes of limitation. The methods of filing and the methods for calculating taxable and apportionable income vary depending on the laws of each taxing jurisdiction.
Foreign Taxation TCF and/or its subsidiaries currently file tax returns in Canada and certain Canadian provinces which impose corporate income taxes. Our various foreign income tax returns are open and subject to examination for 2015 and later tax return years. The methods of filing and the methods for calculating taxable and apportionable income vary depending on the laws of each taxing jurisdiction.
See "Item 7. Management's Discussion and Analysis - Consolidated Income Statement Analysis - Income Taxes", "Note 3. Summary of Significant Accounting Policies" and "Note 16. Income Taxes" of Notes to Consolidated Financial Statements for further information regarding TCF's income taxes.
Available Information
Our website, www.tcfbank.com, includes free access to our news releases, investor presentations, conference calls to discuss published financial results, our Annual Report and periodic filings required by the U.S. Securities and Exchange Commission (the "SEC"), including annual reports on Form 10-K, quarterly reports on Form 10-Q, current reports on Form 8-K, proxy statements, and amendments to those reports, as soon as reasonably practicable after electronic filing of such material with, or furnishing it to, the SEC. Our periodic filings required by the SEC are also available on the SEC's website, www.sec.gov. Our Compensation and Pension Committee, Corporate Governance and Nominating Committee and Audit Committee charters, Corporate Governance and Director Standards, Codes of Ethics and information on all of our securities are also available on our website. Shareholders may request these documents in print free of charge by contacting the Corporate Secretary at TCF Financial Corporation, 333 West Fort Street, Suite 1800, Detroit, MI 48226.
Item 1A. Risk Factors.
There are risks, many beyond our control, which could cause our results to differ significantly from management’s expectations. Some of these significant risks and uncertainties are described below. Any factor described in this Annual Report on Form 10-K could, by itself or together with one or more other factors, adversely affect our business, results of operations and/or financial condition, and the market price of our common stock could decline significantly. Additional risks and uncertainties not currently known to us or that we currently consider to not be material also may materially and adversely affect us. In assessing these risks, you should also refer to other information disclosed in our SEC filings, including the financial statements and notes thereto. The risks discussed below also include forward-looking statements, and actual results may differ substantially from those discussed or implied in these forward-looking statements.
9
Risks Related to our Business
If we fail to effectively manage credit risk, our business and financial condition will suffer.
We must effectively manage credit risk. As a lender, we are exposed to the risk that our borrowers will be unable to repay their loans according to their terms, and that the collateral securing repayment of their loans, if any, may not be sufficient to ensure repayment. In addition, there are risks inherent in making any loan, including risks relating to proper loan underwriting, risks resulting from changes in economic and industry conditions and risks inherent in dealing with individual borrowers, including the risk that a borrower may not provide information to us about its business in a timely manner, and/or may present inaccurate or incomplete information to us, and risks relating to the value of collateral. Collateral values are adversely affected by changes in prevailing economic, environmental and other conditions, including declines in the value of real estate, changes in interest rates, changes in monetary and fiscal policies of the federal government, terrorist activity, environmental contamination and other external events. In order to manage credit risk successfully, we must, among other things, maintain disciplined and prudent underwriting standards and ensure that our lenders follow those standards. The weakening of these standards for any reason, such as an attempt to attract higher yielding loans, a lack of discipline or diligence by our employees in underwriting and monitoring loans, the inability of our employees to adequately adapt policies and procedures to changes in economic or any other conditions affecting borrowers and the quality of our loan portfolio, may result in loan defaults, foreclosures and additional charge-offs and may necessitate that we significantly increase our allowance for loan losses, each of which could adversely affect our net income. As a result, our inability to successfully manage credit risk could have a material adverse effect on our business, financial condition or results of operations.
Our financial results are significantly affected by general economic and political conditions.
Our operations and profitability are impacted by both business and economic conditions generally, as well as those in the primary banking markets in which we operate. Economic conditions have a significant impact on the demand for our products and services, as well as the ability of our customers to repay loans and leases, the value of the collateral securing loans and leases, our ability to sell loans and leases, the stability of our deposit funding sources and sales revenue at the end of contractual lease terms. A significant decline in general economic conditions caused by inflation, recession, unemployment, changes in debt securities markets, government shutdowns, defaults, anticipated defaults or rating agency downgrades of sovereign debt (including debt of the U.S.), changes in housing market prices, depressed oil prices, trade disputes and related tariffs or other factors could impact economic conditions or may have a destabilizing effect on the financial markets and, in turn, could have a material adverse effect on our financial condition and results of operations.
Additionally, adverse economic conditions may result in a decline in demand for equipment that we lease or finance, which could result in a decline in the amount of new equipment being placed in service, as well as declines in the values of collateral already in service. Adverse economic conditions may also hinder us from expanding the commercial and industrial loan portfolio by limiting our ability to attract and retain manufacturers and dealers as expected. Any such difficulties could have a material adverse effect on our financial condition and results of operations.
A failure in or breach of our operational or security systems or infrastructure, or those of third-parties, including as a result of cyberattacks, could disrupt our businesses, result in the disclosure or misuse of confidential or proprietary information, damage our reputation, increase our costs and cause losses.
Our operations rely on the secure processing, storage and transmission of confidential and other sensitive business and consumer information on our computer systems and networks and third-party providers. Under various federal and state laws, we are responsible for safeguarding such information, and ensuring that our collection, use, transfer and storage of personal information complies with all applicable laws and regulations can increase our costs.
10
Although we take protective measures to maintain the confidentiality, integrity and availability of information across all geographic and product lines, and endeavor to modify these protective measures as circumstances (including changes in our size and complexity) warrant, the nature of the threats continues to evolve. As a result, our computer systems, software and networks may be vulnerable to unauthorized access, loss or destruction of data (including confidential client information), account takeovers, unavailability of service, computer viruses or other malicious code, cyber-attacks and other adverse events. Despite the defensive measures we take to manage our internal technological and operational infrastructure, these threats may originate externally from third-parties such as foreign governments, organized crime and other hackers, including as a result of attacks on infrastructure-support providers and application developers, or may originate internally from within our organization. We may not be able to ensure that all of our clients, suppliers, counterparties and other third-parties have appropriate controls in place to protect the confidentiality of the information that they exchange with us. In addition, the increasing reliance on technology systems and networks and the occurrence and potential adverse impact of attacks on such systems and networks, both generally and in the financial services industry, have enhanced government and regulatory scrutiny of the measures taken by companies to protect against cyber-security threats. As these threats, and government and regulatory oversight of associated risks, continue to evolve, we may be required to expend additional resources to enhance or expand upon the security measures we currently maintain.
In particular, information pertaining to us and our customers is maintained, and transactions are executed, on the networks and systems of us, our customers and certain of our third-party partners, such as our online banking or reporting systems. The secure maintenance and transmission of confidential information, as well as execution of transactions over these systems, are essential to protect us and our customers against fraud and security breaches and to maintain our clients’ confidence. While to the best of our knowledge we have not experienced any material breaches of information security, such breaches may occur through intentional or unintentional acts by those having or gaining access to our systems or our customers’ or counterparties’ confidential information, including employees. Vulnerabilities in third-party technologies (and technology, including browsers and operating systems used by our customers) or other developments could result in a compromise or breach of the technology, processes and controls that we use to protect data. Furthermore, our customers' devices may become the target of cyber-attacks or information security breaches that could result in the unauthorized release, gathering, monitoring, misuse, loss or destruction of our or our customers' confidential, proprietary and other information, or otherwise disrupt our, our customers' or other third-parties' business operations. For example, various retailers have reported they were victims of cyber-attacks in which large amounts of their customers' data, including debit and credit card information, was obtained. In these situations, we may incur costs to address fraudulent transaction activity affecting our customers.
Although we have developed and continue to invest in systems and processes that are designed to detect and prevent security breaches and cyber-attacks and periodically test our security, a breach of our systems, or those of third-parties, could result in losses to us or our customers; loss of business and/or customers; damage to our reputation; expenses (including the cost of notification to consumers, credit monitoring and forensics, and fees and fines imposed by card networks); disruption to our business; our inability to grow our online services or other businesses; additional regulatory scrutiny or penalties; or our exposure to civil litigation and possible financial liability, any of which could have a material adverse effect on our business, financial condition and results of operations.
11
Our financial results are subject to interest rate risk.
Our earnings and cash flows largely depend on our net interest income. Interest rates are highly sensitive to many factors that are beyond our control, including general economic conditions and policies of various governmental and regulatory agencies, including the Federal Reserve. Changes in monetary policy, including changes in interest rates, could influence the amount of interest we receive on loans, leases and other investments and the amount of interest we pay on deposits and other borrowings, as well as: (i) our ability to originate loans and leases and attract or retain deposits; (ii) the fair value of our financial assets and liabilities and (iii) the average life of our interest-earning assets. A significant portion of our loans, including certain consumer, commercial real estate and commercial and industrial loans, bear interest at variable- and adjustable-rates. Increases in market interest rates can have a negative impact on our business, including reducing the amount of money our customers borrow or adversely impacting their ability to make increased payments caused by any increase in interest rates. In addition, as interest rates increase, in order to compete for deposits in our primary banking markets, we may have to offer more attractive interest rates to depositors, or pursue other sources of liquidity, such as wholesale funding. If the interest rates paid on deposits and other borrowings increase at a faster rate than the interest rates received on loans, leases and other investments, our net interest income and earnings could be adversely affected due to the increase in interest expense without a corresponding increase in interest income. Earnings could also be adversely affected if the interest rates received on loans, leases and other investments decrease more quickly than the interest rates paid on deposits and other borrowings. In addition, we have an investment security portfolio that could decline substantially in value if interest rates increase materially or if obligations of states and political subdivisions become subject to less favorable tax treatment. Although management believes it has implemented effective asset and liability management strategies, any substantial, unexpected or prolonged change in market interest rates could have a material adverse effect on our financial condition and results of operations.
We operate in a highly competitive industry and market areas.
We face substantial competition in all areas of our operations from a variety of different competitors, both within and beyond our primary banking markets, many of which are larger and may have more financial resources than us. We compete with commercial banks, credit unions, savings and loan associations, mortgage banking firms, other financial service businesses, including investment advisory and wealth management firms, mutual fund companies, and securities brokerage and investment banking firms, as well as super-regional, national and international financial institutions that operate offices in our primary market areas and elsewhere.
The financial services industry could become even more competitive as a result of legislative, regulatory and technological changes and continued consolidation. In addition, as customers' preferences and expectations continue to evolve, technology has lowered barriers to entry and made it possible for banks to expand their geographic reach by providing services over the Internet and for non-banks to offer products and services traditionally provided by banks, such as automatic transfer and automatic payment systems. For example, consumers can now pay bills and transfer funds directly without banks. The process of eliminating banks as intermediaries in financial transactions, known as disintermediation, could result in the loss of fee income, the loss of customer deposits and income generated from those deposits and lending opportunities.
We compete with these institutions both in attracting deposits and assets under management, and in making new loans. Many of our competitors have fewer regulatory constraints and may have lower cost structures. Additionally, due to their size, many competitors may be able to achieve economies of scale and, as a result, may offer a broader range of products and services as well as better pricing for those products and services than we can. To compete with these institutions, we may have to pay higher interest rates to attract deposits, accept lower yields on loans to attract loans and pay higher wages for new employees, resulting in lower net interest margin and reduced profitability. In addition, the loss of deposits to competitors may require us to address our liquidity needs in ways that increase our funding costs.
Our ability to compete successfully also depends on a number of other factors, including, among other things: our ability to develop, maintain and build long-term customer relationships based on quality service, high ethical standards and safe, sound assets; customer satisfaction with our service; and the ability to expand our market position. Failure to perform in any of these areas could significantly weaken our competitive position, which could adversely affect our growth and profitability and have a material adverse effect on our financial condition and results of operations.
12
Failure to keep pace with technological changes could adversely affect our business.
The financial services industry is continually undergoing rapid technological change with frequent introductions of new technology‑driven products and services. The effective use of technology increases efficiency and enables financial institutions to better serve customers and to reduce costs. Our future success depends, in part, upon our ability to address the needs of our customers by using technology to provide products and services that will satisfy customer demands, as well as to create additional efficiencies in our operations. Many of our competitors have substantially greater resources to invest in technological improvements. Although we are committed to keeping pace with technological advances and investing in new technology, our competitors may, through the use of new technologies that we have not implemented, whether due to cost or otherwise, be able to offer additional or superior products to those that we will be able to provide, which would put us at a competitive disadvantage. Failure to successfully keep pace with technological change affecting the financial services industry and avoid interruptions, errors and delays could result in a loss of customers seeking new technology-driven products and services and have a material adverse effect on our business, financial condition, results of operations and future prospects.
In addition, the conversion of Legacy TCF’s business to the selected core operating system and any future implementation of technological changes and upgrades to maintain current systems represent significant undertakings that may result in operational and customer challenges during and after implementation. Key challenges include service interruptions, transaction processing errors and system conversion delays, which may cause us to alienate customers or fail to comply with applicable laws, and may cause us to incur additional expenses, which may be substantial.
Our allowance for loan and lease losses, and fair value adjustments with respect to loans and leases acquired in our acquisitions, may prove to be insufficient to absorb actual losses in our loan and lease portfolio, which may adversely affect our business, financial condition and results of operations.
We maintain an allowance for loan and lease losses, which is a reserve established through a provision for loan and lease losses charged to net income that represents management's estimate of probable and estimable losses that have been incurred within our existing loan and lease portfolio. The level of the allowance for loan and lease losses reflects management's continuing evaluation of specific credit risks, loan and lease loss experience, current loan portfolio quality, the value of real estate, present economic, political and regulatory conditions and unidentified losses inherent in the current loan and lease portfolio. The determination of the appropriate level of the allowance for loan and lease losses inherently involves a high degree of subjectivity and requires us to make significant estimates of current credit risks and future trends, all of which may undergo material changes. Deterioration in economic conditions and declines in real estate values, new information regarding existing loans and leases, and identification of additional problem loans and other factors, all may require an increase in the allowance for loan and lease losses.
The application of the purchase method of accounting in our past (and future) acquisitions will impact our allowance for loan and lease losses. Under the purchase method of accounting, all acquired loans and leases are recorded in our Consolidated Financial Statements at their estimated fair value at the time of acquisition and any related allowance for loan and lease loss was eliminated because credit quality, among other factors, is considered in the determination of fair value. To the extent that our estimates of fair value of purchased loans and leases were too high, we will incur losses associated with the acquired loans and leases.
If our analysis or assumptions prove to be incorrect, our current allowance may not be sufficient, and adjustments may be necessary to allow for different economic conditions or adverse developments in our loan and lease portfolio. Material additions to the allowance for loan and lease losses would materially decrease our net income and adversely affect our general financial condition.
In addition, our regulators, as an integral part of their periodic examination, review our allowance for loan and lease losses and may require an increase in the allowance for loan and lease losses or the recognition of further loan charge-offs, based on judgments different than those of management.
13
New accounting standards will require us to increase our allowance for loan and lease losses and may have a material adverse effect on our financial condition and results of operation.
The Financial Accounting Standards Board ("FASB") issued a new credit impairment model, the Current Expected Credit Loss ("CECL") model, applicable to us in 2020. Initial measurement will take place at January 1, 2020, the date of adoption, and the measure of our allowance for loan and lease losses depends on the adoption and interpretation of accounting standards. The CECL model requires certain financial assets carried at amortized cost, such as loans and leases held for investment and held-to-maturity debt securities, to be valued at the net amount expected to be collected over the remaining estimated life of the asset, based on information about past events, including historical experience, current conditions, and reasonable and supportable forecasts that affect the collectability of the amount due. This measurement will take place at the time the financial asset is first added to the balance sheet and periodically thereafter. This differs significantly from the "incurred loss" model currently required under GAAP, which delays recognition until it is probable a loss has been incurred. Accordingly, we expect that the adoption of the CECL model will materially affect how we determine our allowance for loan and lease losses and could require us to significantly increase our allowance, increasing our capital needs. Moreover, the CECL model may create more volatility in the level of our provision for credit losses. If we are required to materially increase our level of allowance for loan and lease losses for any reason, such increase could adversely affect our business, financial condition and results of operations. We also expect to incur transition costs and ongoing costs in refining and implementing the CECL methodology.
See the sections captioned "Credit Quality" in Item 7. Management's Discussion and Analysis of Financial Condition and Results of Operations and "Note 3. Summary of Significant Accounting Policies" and "Note 8. Allowance for Loan and Lease Losses and Credit Quality" in the notes to our Consolidated Financial Statements in Item 8. Financial Statements and Supplementary Data, located elsewhere in this Annual Report for further discussion related to our process for determining the appropriate level of the allowance for loan and lease losses.
Changes in U.S. trade policies and other factors beyond our control, including the imposition of tariffs and retaliatory tariffs and the impacts of epidemics or pandemics, may adversely impact our business, financial condition and results of operations.
There have been changes and discussions with respect to U.S. trade policies, legislation, treaties and tariffs, including trade policies and tariffs affecting other countries, including China, the European Union, Canada and Mexico and retaliatory tariffs by such countries. Tariffs and retaliatory tariffs have been imposed, and additional tariffs and retaliation tariffs have been proposed. Such tariffs, retaliatory tariffs or other trade restrictions on products and materials that our customers import or export could cause the prices of our customers’ products to increase which could reduce demand for such products, or reduce our customer margins, and adversely impact their revenues, financial results and ability to service debt; which, in turn, could adversely affect our financial condition and results of operations. In addition, to the extent changes in the political environment have a negative impact on us or on the markets in which we operate our business, results of operations and financial condition could be materially and adversely impacted in the future. It remains unclear what the U.S. Administration or foreign governments will or will not do with respect to tariffs already imposed, additional tariffs that may be imposed, or international trade agreements and policies. On January 26, 2020, President Trump signed a new trade deal between the United States, Canada and Mexico to replace the North American Free Trade Agreement. The full impact of this agreement on us, our customers and on the economic conditions in our primary banking markets is currently unknown. In addition, coronavirus and concerns regarding the extent to which it may spread have affected, and may increasingly affect, international trade (including supply chains and export levels), travel, employee productivity and other economic activities. A trade war or other governmental action related to tariffs or international trade agreements or policies, as well as coronavirus or other potential epidemics or pandemics, have the potential to negatively impact ours and/or our customers’ costs, demand for our customers' products, and/or the U.S. economy or certain sectors thereof and, thus, adversely affect our business, financial condition, and results of operations.
14
Our supermarket branches are subject to a number of risks, including the long-term success and viability of our supermarket partners, our ability to maintain or terminate licenses or lease agreements for our supermarket locations, and customer preferences.
A significant financial decline or change in ownership involving one of our supermarket partners, including New Albertson's Inc. (our supermarket partner for our Jewel-Osco locations) and United Natural Foods, Inc. (“UNFI”, our supermarket partner for our Cub Foods locations), could result in the loss of supermarket branches or could increase costs to operate our supermarket branches, of which we had 121 at December 31, 2019. We are subject to the risk, among others, that our license or lease for a location or locations will terminate upon the sale or closure of that location or locations by the supermarket partner or that we may not be able to renew branch leases with our supermarket partners on favorable terms, or at all. UNFI stated in 2019 that it intends to divest of all company-owned Cub stores in 2020. Should UNFI choose to sell any Cub Foods store, the buyer may terminate the branch license or lease for that location after a specified notice period in certain circumstances at the buyer's election. Furthermore, UNFI or an independent franchisee could choose to close any Cub Foods store after a specified notice period at which point the branch license or lease as to that location would automatically terminate.
Difficult economic conditions, financial or labor difficulties in the supermarket industry, or a decrease in in-store customer traffic or utilization of traditional bank branches may reduce activity in our supermarket branches. Although utilization of these branches may decrease, the nature of these leases with our supermarket partners generally do not allow us to terminate significant numbers of individual branches. Because these leases are generally all renewed together, in the event of a decrease in customer utilization there may be limited opportunities to terminate unprofitable branch leases without incurring additional costs or penalties. Any of the above risks could have a material adverse effect on our financial condition and results of operations.
We may fail to realize all of the anticipated benefits, including estimated cost savings and revenue synergies, of our Merger with Legacy TCF.
The success of our Merger with Legacy TCF, which was consummated on August 1, 2019, will depend on, among other things, the ability to continue to successfully complete the integration of the merged companies in a manner that facilitates growth opportunities and realizes cost savings. In addition, we must achieve the anticipated growth and cost savings without adversely affecting current revenues and future growth. If we are not able to successfully achieve these objectives, the anticipated benefits of the Merger may not be realized fully, or at all, or may take longer to realize than expected. An inability to realize the full extent of the anticipated benefits of the Merger could have an adverse effect on our revenues, level of expenses and operating results, which may adversely affect the value of our common stock.
We may be adversely affected by risks associated with future mergers and acquisitions, including execution risk, which could disrupt our business and dilute shareholder value.
We plan to grow our business both organically and through mergers and acquisitions. We periodically evaluate merger and acquisition opportunities and conduct due diligence activities related to possible transactions with other financial institutions and financial services companies. As a result, we may engage in discussions or negotiations that, if they were to result in a transaction, could have a material effect on our operating results and financial condition, including short- and long-term liquidity. Our merger and acquisition activities could be material and could require us to use a substantial amount of common stock, preferred stock, cash, other liquid assets, and/or incur debt. For example, completion of the Merger required us to issue approximately 81.9 million common shares and a new series of preferred stock. Furthermore, failure to realize the expected revenue increases, cost savings, increases in geographic or product presence, and/or other projected benefits from our merger and acquisition activities could have a material adverse effect on our financial condition and results of operations, including net income per common share.
15
Our merger and acquisition activities could involve a number of additional risks, including the risks of:
• | delay in completing an acquisition or merger due to litigation; |
• | the recording of assets and liabilities of the acquired or merged company at fair value may materially dilute shareholder value at the transaction date and could have a material adverse effect on our financial condition and results of operations; |
• | incurring the time and costs associated with identifying and evaluating potential acquisition or merger targets; |
• | difficulty or unanticipated expense associated with converting the operating systems of the acquired or merged company into ours; |
• | the possibility of regulatory approval being delayed, impeded, conditioned or denied due to existing or new regulatory issues surrounding TCF, the target institution or the proposed combined entity as a result of, among other things, issues related to anti-money laundering/Bank Secrecy Act compliance, fair lending laws, fair housing laws, consumer protection laws, unfair, deceptive or abusive acts or practices regulations, or the Community Reinvestment Act; |
• | potential exposure to unknown or contingent liabilities of the acquired or merged company; |
• | our estimates and judgments used to evaluate credit, operations, management and market risks with respect to the acquired or merged company may not be accurate; |
• | our exposure to potential asset quality issues of the acquired or merged company; |
• | the time and costs of evaluating new markets, hiring experienced local management and opening new offices, and the time lags between these activities and the generation of sufficient assets and deposits to support the costs of the expansion; |
• | diversion of our management's attention to the negotiation of a transaction, and the integration of the operations and personnel of the combining businesses; |
• | the introduction of new products and services into our business; |
• | potential disruption to our business; |
• | incurring and possible impairment of goodwill and other intangible assets associated with an acquisition or merger and possible adverse short-term effects on our results of operations; |
• | the possible loss of key employees and customers of the acquired or merged company; |
• | difficulty in estimating the value of the acquired or merged company; and |
• | potential changes in banking or tax laws or regulations that may affect the acquired or merged company. |
Failure to successfully address these and other issues related to acquisitions and mergers could have a material adverse effect on our financial condition and results of operations, and could adversely affect our ability to successfully implement our business strategy.
We may be exposed to difficulties in combining the operations of acquired or merged businesses into our own operations, which may prevent us from achieving the expected benefits from our merger and acquisition activities.
We may not be able to fully achieve the strategic objectives and operating efficiencies that we anticipate in our merger and acquisition activities. In particular, the success of a merger or acquisition, including anticipated benefits and cost savings, will depend, in part, on our ability to continue to successfully combine and integrate our businesses in a manner that permits growth opportunities and does not materially disrupt the existing customer relationships or result in loss of customers. It is possible that the integration process could result in the loss of key employees, the disruption of businesses or inconsistencies in standards, controls, procedures and policies that adversely affect the combined company's ability to maintain relationships with customers, depositors, clients and employees or to achieve the anticipated benefits and cost savings of the merger. If we experience difficulties with the integration process, the anticipated benefits of the merger may not be realized fully or at all, or may take longer to realize than expected. If key employees depart, our business could be harmed. These and other difficulties associated with the integration of our businesses could have a material adverse effect on our business, and, in turn, our financial condition and results of operations.
16
We face risk of noncompliance with the Bank Secrecy Act and other anti-money laundering statutes and regulations and corresponding enforcement proceedings.
The federal Bank Secrecy Act, the Uniting and Strengthening America by Providing Appropriate Tools Required to Intercept and Obstruct Terrorism Act of 2001 (the "PATRIOT Act") and other laws and regulations require financial institutions, among other duties, to institute and maintain effective anti-money laundering programs and to file suspicious activity and currency transaction reports as appropriate. Financial Crimes Enforcement Network, established by the U.S. Treasury Department to administer the Bank Secrecy Act, is authorized to impose significant civil money penalties for violations of those requirements and has engaged in coordinated enforcement efforts with the individual federal banking regulators, as well as the U.S. Department of Justice, Drug Enforcement Administration and Internal Revenue Service. There is also increased scrutiny of compliance with the rules enforced by the Office of Foreign Assets Control. Regulators also have focused on compliance with Bank Secrecy Act and anti-money laundering regulations. If our policies, procedures and systems are deemed deficient or the policies, procedures and systems of the financial institutions that we have already acquired or may acquire in the future are deficient, we would be subject to liability, including fines and regulatory actions such as restrictions on our ability to pay dividends and the necessity to obtain regulatory approvals to proceed with certain aspects of our business plan, including our acquisition plans, which would negatively impact our business, financial condition, results of operations and prospects. Sanctions that the regulators have imposed on banks that have not complied with all requirements have been especially severe. Failure to maintain and implement adequate programs to combat money laundering and terrorist financing could also have serious reputational consequences for us. Any of these results could materially and adversely affect our business, financial condition and results of operations.
New lines of business or new products and services may subject us to additional risk.
From time to time, we may develop new lines of business, offer new products and services within existing lines of business, and expand into new markets or pursue new distribution channels. There are substantial risks and uncertainties associated with these efforts, particularly where the markets are new or not fully developed. In developing and marketing new lines of business and new products or services, we may invest significant time and resources. Initial timetables for the introduction and development of, or anticipated level of growth or profitability for new lines of business and new products or services, may not be achieved. External factors such as compliance with regulations, competitive alternatives and shifting market preferences may also impact the success of implementation of a new line of business or a new product or service. Any new line of business or new product or service could have a significant impact on the effectiveness of our system of internal controls. Failure to successfully manage these risks in the development and implementation of new lines of business and new products or services could have a material adverse effect on our financial condition and results of operations.
We are subject to certain risks related to originating and selling loans that could have a material adverse effect on our financial condition and results of operations.
We sell loans to generate earnings and manage our liquidity and capital levels, as well as to create geographical and product diversity in our loan portfolio. Disruptions in the financial markets, a decrease in demand for these loans, or changes to laws or regulations that reduce the attractiveness of such loans to purchasers of the loans could require us to decrease our lending activities or retain a greater portion of the loans we originate. Selling fewer loans would result in a decrease in the gains recognized on the sale of loans, could increase our capital needs as a result of the increase of risk weighted assets, result in decreased liquidity, and result in increased credit risk as our loan portfolio increased in size, any of which could have a material adverse effect on our financial condition and results of operations.
The structure of certain loan sales may result in the retention of credit or financial risks. We may receive interest-only strips or retain loan servicing rights in connection with certain of our loan sales. The interest-only strip is recorded at fair value, which represents the present value of future cash flows expected to be received by us. The value of these interest-only strips may be affected by factors such as changes in the behavior patterns of customers (including defaults and prepayments), changes in the strength of the economy and developments in the interest rate markets; therefore, actual performance may differ from our expectations. Loan servicing rights, the right to service a loan and receive servicing income over the life of the loan, are recognized as assets or liabilities at estimated fair value. The value of loan servicing rights are affected by prepayment speeds of mortgage loans and changes; therefore, actual performance may differ from our expectations. The impact of such factors could have a material adverse effect on the value of these interest-only strips and loan servicing rights and on our financial condition and results of operations.
17
When loans are sold or securitized, it is customary to make representations, warranties and covenants to the purchaser or investors about the loans, including the manner in which they were originated and will be serviced. These agreements generally require the repurchase of loans or indemnification in the event we breach these representations, warranties or covenants and such breaches are not cured. In addition, some agreements contain a requirement to repurchase loans as a result of early payoffs by the borrower, early payment default of the borrower or defects affecting the security interest in the collateral. We have not been obligated to make significant repurchases of sold loans in the past. A material increase in the amount of loans repurchased could have a material adverse effect on our financial condition and results of operations.
Some of our loan sales involve long-term residential mortgage loans. Purchasers of residential mortgage loans, such as government sponsored entities, require sellers of residential mortgage loans to either repurchase loans previously sold or reimburse purchasers for losses related to loans previously sold when losses are incurred on a loan due to actual or alleged failure to strictly conform to the purchaser's purchase criteria. As a result, we may face increased pressure from purchasers of our residential mortgage loans to repurchase those loans or reimburse purchasers for losses related to those loans and we may face increasing expenses to defend against such claims. If we are required in the future to repurchase loans, reimburse purchasers for losses related to loans previously sold, or if we incur increasing expenses to defend against such claims, our financial condition and results of operations could be adversely affected.
Our ability to maintain our reputation is critical to the success of our business, including our ability to attract and retain customer relationships, and failure to do so may materially adversely affect our performance.
The reputation of TCF Bank is one of the most valuable components of our business. As such, we strive to conduct our business in a manner that enhances our reputation. Damage to our reputation could undermine the confidence of our current and potential clients in our ability to provide financial services. Such damage could also impair the confidence of our investors, counterparties and business partners, and ultimately affect our ability to effect transactions or maintain or hire qualified management and personnel. Maintenance of our reputation depends not only on our success in controlling and mitigating the various risks described herein, but also on our success in identifying and appropriately addressing issues that may arise in areas such as potential conflicts of interest, anti-money laundering, client personal information and privacy issues, recordkeeping, regulatory investigations and any litigation that may arise from the failure or perceived failure of us to comply with legal and regulatory requirements. If our reputation is negatively affected, by the actions of our employees or otherwise, the resulting negative public opinion and potential regulatory action could adversely affect our business, financial condition and results of operations.
We are subject to liquidity risk in our operations, which could adversely affect our ability to fund our various obligations and jeopardize our business, financial condition and results of operations.
Liquidity risk is the possibility that we will not be able to meet our obligations as they come due or capitalize on growth opportunities as they arise because of an inability to liquidate assets or obtain adequate funding on a timely basis, at a reasonable cost and within acceptable risk tolerances. Liquidity is required to fund various obligations, including credit obligations to borrowers, loan originations, withdrawals by depositors, repayment of debt, dividends to shareholders, operating expenses and capital expenditures. Liquidity is derived primarily from retail deposit growth and earnings retention, principal and interest payments on loans and investment securities, net cash provided from operations and access to other funding. If we are unable to continue to attract and retain core deposits, to obtain third-party financing on favorable terms, or to have access to interbank or other liquidity sources, we may not be able to grow our assets as quickly as we have historically. If customers move money out of bank deposits into other investments, we would need to seek other funding alternatives, including wholesale funding, in order to continue to grow, thereby increasing our funding costs, if such funding was available at all, and reducing our net interest income and net income.
Our liquidity could also be limited by an inability to access the capital markets or by unforeseen outflows of cash, which could arise due to circumstances outside of our control, such as a general market disruption, a downturn in the markets in which we function, difficult credit markets, regulatory actions against us, or operational problems that affect us or third-parties. Our credit rating is important to our liquidity. A reduction or anticipated reduction in our credit ratings could adversely affect the ability of TCF Bank and its subsidiaries to lend by adversely affecting liquidity and our competitive position, increasing our borrowing costs, limiting our access to the capital markets or triggering unfavorable contractual obligations, such as termination of or the requirement that we provide additional collateral pursuant to our derivative contracts. If we are unable to maintain adequate liquidity, then our business, financial condition and results of operations would be negatively affected.
18
Our earnings are significantly affected by the fiscal and monetary policies of the federal government and its agencies, as well as other legal changes affecting businesses and consumers.
The policies of the Federal Reserve impact us significantly. The Federal Reserve regulates the supply of money and credit in the U.S. Its policies directly and indirectly influence the rate of interest earned on loans and leases and paid on borrowings and interest-bearing deposits, and also affect the value of financial instruments that we hold. Changes in those policies are difficult to predict. Federal Reserve policies can also affect our borrowers, potentially increasing the risk that they may fail to repay their loans or leases. For example, a tightening of the money supply by the Federal Reserve could increase unemployment or reduce the demand for a borrower's products and services. This could adversely affect the borrower's earnings and ability to repay its loan or lease. As a result, changes to the fiscal and monetary policies by the Federal Reserve could have a material adverse effect on our financial condition and results of operations.
In addition, legal changes affecting consumers and businesses, including the deductibility or other tax attributes associated with certain products, may significantly decrease the demand for certain products that we offer. For example, the Tax Cuts and Job Act ("Tax Reform") limits the tax deductibility of interest paid on home equity loans to those loans used to purchase or substantially improve qualified residences, which may decrease consumer demand for such loan products.
Our evaluation of investment securities for other-than-temporary impairment involves subjective determinations and could materially impact our financial condition and results of operations.
Our evaluation of impairment in our investment securities portfolio involves a quantitative and qualitative process, which is subject to risks and uncertainties and is intended to determine whether declines in the fair value of such investments should be recognized in current period earnings. The risks and uncertainties include changes in general economic conditions, the issuer's net income, projected net income and financial condition or future recovery prospects, the effects of changes in interest rates or credit spreads and the expected recovery period. Estimating future cash flows involves incorporating information received from third-party sources and making internal assumptions and judgments regarding the future performance of the underlying collateral and/or value of the underlying asset and assessing the probability that an adverse change in future cash flows has occurred. The determination of the amount of other-than-temporary impairments is based upon our periodic evaluation and assessment of known and inherent risks associated with the respective asset class. Such evaluations and assessments are revised as conditions change and new information becomes available.
Management considers a wide range of factors about the security issuer and uses judgment in evaluating the cause of the decline in the estimated fair value of the security and in assessing the prospects for recovery. Inherent in management's evaluation of the security are assumptions and estimates about the operations of the issuer and its future earnings potential. Considerations in the impairment evaluation process include, but are not limited to: (i) the length of time and the extent to which the market value has been less than cost or amortized cost; (ii) the potential for impairments of securities when the issuer is experiencing significant financial difficulties; (iii) the potential for impairments in an entire industry sector or sub-sector; (iv) the potential for impairments in certain economically depressed geographic locations; (v) the potential for impairments of securities where the issuer, series of issuers or industry has suffered a catastrophic type of loss or has exhausted natural resources; (vi) our intent and ability to retain the investment for a period of time sufficient to allow for the recovery of its value; (vii) unfavorable changes in forecasted cash flows on residential mortgage-backed and asset-backed securities; and (viii) other subjective factors, including concentrations and information obtained from regulators and rating agencies. Impairments to the carrying value of our investment securities may need to be taken in the future, which could have a material adverse effect on our financial condition and results of operations.
19
We may be required to recognize an impairment of our goodwill or core deposit intangible assets, or to establish a valuation allowance against our deferred income tax assets, which could have a material adverse effect on our financial condition and results of operations.
Goodwill represents the excess of the amounts paid to acquire assets over their fair value at the date of acquisition. We test goodwill at least annually for impairment. Substantially all of our goodwill at December 31, 2019 was recorded on the books of TCF Bank. The fair value of TCF Bank is impacted by the performance of its business and other factors. Core deposit intangible ("CDI") assets represent the estimated value of stable customer deposits, excluding time deposits, acquired in business combinations that provide a source of funds below market interest rates. We amortize our CDI assets over the estimated period the corresponding customer deposits are expected to exist. We test our CDI assets periodically for impairment. If we experience higher than expected deposit run-off, our CDI assets could be impaired. If we determine that our goodwill or CDI assets have been impaired, we must recognize a write-down by the amount of the impairment, with a corresponding charge to net income. Such write-downs could have a material adverse effect on our financial condition and results of operations. At December 31, 2019, we had $1.3 billion of goodwill, representing 22.7% of shareholders' equity and $130.2 million of CDI assets.
Deferred income tax represents the tax effect of the differences between the book and tax basis of assets and liabilities. Deferred tax assets are assessed periodically by management to determine if they are realizable. Factors in management's determination include our performance, including the ability to generate taxable net income. If, based on available information, it is more-likely-than-not that the deferred income tax asset will not be realized, then a valuation allowance must be established with a corresponding charge to net income. As of December 31, 2019, we carried a valuation allowance against our deferred tax assets of $12.8 million. Charges to establish a valuation allowance with respect to our deferred tax assets could have a material adverse effect on the financial condition and results of operations.
We are periodically named as a defendant in a variety of litigation and other actions, which may have a material adverse effect on our financial condition and results of operations.
We are periodically subject to claims and legal actions related to our operations. These claims and legal actions, could result in large, unpredictable monetary awards or penalties, as well as significant defense costs. While we maintain insurance coverage in amounts and with deductibles that we believe are appropriate for our operations, such insurance does not cover all types of liability, including regulatory fines or penalties and may not continue to be available to us at a reasonable cost, or at all. As a result, we may be exposed to substantial uninsured liabilities, which could have a material adverse effect on our financial condition and results of operations.
In addition, customers may make claims and take legal action pertaining to our deposit products and sale and servicing of our loan and lease products, account opening/origination practices, fees, employment practices, checking account overdraft program “opt in” requirements, or fiduciary responsibilities. Whether or not such claims and legal actions have merit, they may result in significant financial liability and could adversely affect the market perception of TCF Bank and our products and services, as well as impact customer demand for those products and services. Any financial liability or reputational damage could have a material adverse effect on our financial condition and results of operations.
In addition, the financial services industry has increasingly been targeted by lawsuits alleging infringement of patent rights, often from patent holding companies seeking to monetize patents they have purchased or otherwise obtained. Regardless of the scope or validity of such patents or other intellectual property rights, or the merits of any claims by potential or actual litigants, we may have to engage in protracted and costly litigation which may be time consuming and disruptive to our operations and management. If we are found to infringe on one or more patents or other intellectual property rights, we may be required to pay substantial damages or royalties to a third-party, or it may be subject to a temporary or permanent injunction prohibiting us from utilizing certain technologies.
From time to time we are, or may become, involved in suits, legal proceedings, investigations and proceedings by governmental and self-regulatory agencies that may lead to adverse consequences.
Many aspects of the banking business involve a substantial risk of legal liability. From time to time, we are, or may become, the subject of reviews, investigations and proceedings, and other forms of regulatory inquiry, including by bank regulatory agencies, self-regulatory agencies, the SEC and law enforcement authorities. The results of such proceedings could lead to significant civil or criminal penalties, including monetary penalties, damages, adverse judgements, settlements, fines, injunctions, restrictions on the way we conduct our business or reputational harm.
20
We are subject to extensive laws and government regulation and supervision and these laws or regulations, or changes to them or their enforcement could have a material adverse effect on our financial results.
We are subject to extensive federal and state laws, regulation and supervision. Banking regulations are primarily intended to protect bank customers, depositors' funds, federal deposit insurance funds and the banking system as a whole, not shareholders. These regulations affect our revenues, lending practices, capital structure, investment practices, dividend policy and growth, among other things. Congress and federal regulators continually review banking laws, regulations and policies for possible changes and the implementation of banking laws or regulations may change depending on leadership at federal banking agencies. Since many new banking rules are issued with limited interpretive guidance, we may not sufficiently comply with or anticipate the full impact of such new rules.
For example, the Community Reinvestment Act, the Equal Credit Opportunity Act and the Fair Housing Act impose nondiscriminatory lending requirements on financial institutions. The Federal Reserve, the CFPB, the Department of Justice, and other federal and state agencies are responsible for enforcing these laws and regulations. Private parties may also have the ability to challenge an institution’s performance under fair lending laws in private class action litigation. A successful challenge to our performance under the fair lending laws and regulations could adversely impact our rating under the Community Reinvestment Act and result in a wide variety of sanctions, including the required payment of damages and civil money penalties, injunctive relief, imposition of restrictions on merger and acquisition activity and restrictions on expansion activity, which could negatively impact our reputation, business, financial condition and results of operations.
Future changes in regulations, regulatory policies, interpretation and enforcement of statutes, regulations or policies could reduce revenues and increase compliance burdens and limit the types of financial services and products we may offer, or increase competition from non-banks offering competing financial services and products, among other things. Future legislative and regulatory initiatives cannot be fully or accurately predicted. Such proposals may impose more stringent standards than currently applicable or anticipated with respect to capital and liquidity requirements, leverage, deposit insurance and risk management requirements for depository institutions. For example, the CFPB has examination and enforcement authority over TCF Bank and its subsidiaries, and broad rulemaking authority to administer and carry out the purposes and objectives of the federal consumer financial laws with respect to all financial institutions that offer financial products and services to consumers. The CFPB is authorized to make rules identifying and prohibiting acts or practices that are unfair, deceptive or abusive in connection with any transaction with a consumer for a consumer financial product or service, or the offering of a consumer financial product or service. The term "abusive" may be interpreted in changing or inconsistent ways over time. Regulatory actions that adversely impact our deposit, lending, loan collection, campus banking programs or customer opt-in preferences with respect to overdrafts could have a material adverse effect on our financial condition and results of operations. In recent years there has been an increase in the frequency of enforcement actions brought by federal banking regulators, such as the CFPB, dealing with matters such as fair lending, account fees, loan servicing and other products and services provided to customers.
While we have policies and procedures designed to prevent violations of laws, regulations and regulatory policies, and to ensure compliance with new or changed laws, regulations and regulatory policies, there can be no assurance that violations will not occur, and failure to comply could result in reputational damage, remediation, disgorgement, penalties, increased capital requirements, higher deposit insurance assessments, other monetary relief, injunctive relief or changes to our business practices or operations, any of which could have a material adverse effect on our financial condition and results of operations.
We are exposed to risk of environmental liabilities with respect to real properties that we may acquire.
In the course of our business, we may acquire properties securing loans we have originated or purchased through the foreclosure of loans that are in default. Particularly in commercial real estate lending, there is a risk that hazardous substances could be discovered on these properties. In this event, we might be required to remove these substances from the affected properties at our sole cost and expense. The cost of this removal could substantially exceed the value of the affected properties. In addition, if we are the owner or former owner of a contaminated site, we may be subject to common law claims by third-parties seeking damages for environmental contamination emanating from the site. We may not have adequate remedies against the prior owner or other responsible parties and could find it difficult or impossible to sell the affected properties. If we were to become subject to significant environmental liabilities or costs, our business, results of operations and financial condition could be materially and adversely affected.
21
Our framework for managing risks may not be effective in mitigating risk and any resulting loss.
Our risk management framework seeks to mitigate risk and any resulting loss. We have established processes intended to identify, measure, monitor, report and analyze the types of risk to which we are subject, including legal and compliance, operational, reputational, strategic and market risk such as interest rate, credit, liquidity and foreign currency risk. However, as with any risk management framework, there are inherent limitations to our risk management strategies. There may exist, or develop in the future, risks that we have not appropriately anticipated or identified. Any future breakdowns in our risk management framework could have a material adverse effect on our financial condition and results of operations.
We depend on the accuracy and completeness of information about our customers and counterparties.
In deciding whether to extend credit or enter into other transactions, and in evaluating and monitoring our loan and lease portfolio on an ongoing basis, we rely on information provided to us by or on behalf of our customers and counterparties, including financial statements, credit reports and other financial information. We may also rely on representations of those customers and counterparties or of other third-parties, such as independent auditors, as to the accuracy and completeness of that information. Reliance on inaccurate, incomplete, fraudulent or misleading financial statements, credit reports or other financial or business information, or the failure to receive such information on a timely basis, could result in loan and lease losses, reputational damage or other effects that could have a material adverse effect on our business, financial condition or results of operations.
We depend on our executive officers and other key employees to continue the implementation of our long-term business strategy, and we could be harmed by the unexpected loss of their services.
We believe that our continued growth and future success will depend in large part on the skills of our executive officers and other key employees and our ability to motivate and retain these individuals, as well as our ability to attract, motivate and retain highly skilled employees. Competition for employees is intense, and the process of locating key personnel with the combination of skills and attributes required to execute our business strategy may be lengthy. If we are unable to retain personnel, including our key management, who are critical to the successful integration of Legacy TCF and our future operations, we could face disruptions in our operations, loss of existing customers, loss of key information, expertise or know-how, and unanticipated additional recruitment costs. If the services of any of our of key personnel should become unavailable for any reason, we may not be able to identify and hire qualified persons on terms acceptable to us, or at all, which could have a material adverse effect on our business, financial condition, results of operation and future prospects.
Our business needs and future growth may require us to raise additional capital, but that capital may not be available or may be dilutive.
We are required by federal and state regulatory authorities to maintain specified levels of capital to support our operations. We may need to raise additional capital, in the form of debt or equity, in the future to have sufficient capital resources to meet our commitments and to fund our business needs and future growth, particularly if the quality of our assets or earnings were to deteriorate significantly. In addition, we are required by federal regulatory authorities to maintain adequate levels of capital to support our operations. Our ability to raise additional capital will depend on conditions in the capital markets at that time, which are outside of our control, and on our financial performance. We cannot assure that we will be able to raise additional capital in the future on terms acceptable to us or at all. Any occurrence that limits our access to capital, may adversely affect our capital costs and our ability to raise capital and, in turn, our liquidity. Any inability to raise capital on acceptable terms when needed could have a material adverse effect on our business, financial condition and results of operations and could be dilutive to both tangible book value and our share price.
In addition, an inability to raise capital when needed may subject us to increased regulatory supervision and the imposition of restrictions on our growth and business. These restrictions could negatively affect our ability to operate or further expand our operations through loan growth, acquisitions or the establishment of additional branches and may result in increases in operating expenses and reductions in revenues that could have a material adverse effect on our financial condition, results of operations and our share price.
22
The soundness of other financial institutions could adversely affect us.
Our ability to engage in routine funding transactions could be adversely affected by the actions and commercial soundness of other financial institutions. Financial services institutions are interrelated as a result of trading, clearing, counterparty or other relationships. We have exposure to many different industries and counterparties, and we routinely execute transactions with counterparties in the financial services industry. As a result, defaults by, or even rumors or questions about, one or more financial services institutions, or the financial services industry generally, could lead to losses or defaults by us or by other institutions. Many of these transactions expose us to credit risk in the event of default of our counterparty or client. A diminished availability of counterparties who satisfy our credit quality requirements could negatively impact our business. In addition, our credit risk may be exacerbated when the collateral that we hold cannot be realized or is liquidated at prices insufficient to recover the full amount of the loan. We can give no assurance that any such losses would not materially and adversely affect our business, financial condition or results of operations.
Our controls and procedures may fail or be circumvented.
Management regularly reviews and updates our internal controls and corporate governance policies and procedures. Any system of controls, however well designed and operated, is based in part on certain assumptions and can provide only reasonable, not absolute, assurances that the objectives of the system are met. A significant failure or circumvention of our controls and procedures or failure to comply with regulations related to controls and procedures could have a material adverse effect on our business, results of operations and financial condition.
We depend on information technology, information and data, and telecommunications systems of third-parties, and systems failures, interruptions involving these systems could have an adverse effect on our operations, financial condition and results of operations.
Our business is highly dependent on the successful and uninterrupted functioning of our information technology and telecommunications systems, third-party servicers accounting systems and mobile and online banking platforms. We outsource some of our major systems, such as payment processing systems, and online banking platforms. While we select these third-party vendors carefully and attempt to monitor ongoing compliance with any arrangements with TCF, we do not control their actions. The failure of these systems, or the termination of a third-party software license or service agreement on which any of these systems is based, could interrupt our operations. Because our information technology and telecommunications systems interface with and depend on third-party systems, we could experience service denials if demand for such services exceeds capacity or such third-party systems fail or experience interruptions. If sustained or repeated, a system failure or service denial could result in a deterioration of our ability to process new and renewal loans, gather deposits and provide customer service, compromise our ability to operate effectively, damage our reputation, result in a loss of customer business and/or subject us to additional regulatory scrutiny and possible financial liability, any of which could have a material adverse effect on our financial condition and results of operations. In addition, failure of third-parties to comply with applicable laws and regulations, or fraud or misconduct on the part of employees of any of these third-parties could disrupt our operations or adversely affect our reputation. Furthermore, concentration among larger third-party providers servicing large segments of the banking industry can also potentially affect wide segments of the financial industry.
It may be difficult for us to replace some of our third-party vendors, particularly vendors providing our core banking, debit card services and information services in a timely manner if they are unwilling or unable to provide us with these services in the future for any reason, and even if we are able to replace them, it may be at higher cost or result in the loss of customers. Any such events could have a material adverse effect on our business, financial condition or results of operations. In addition, the conversion of Legacy TCF’s business to our core operating system and any future implementation of technological changes and upgrades to maintain current systems represent significant undertakings that may result in operational and customer challenges during and after implementation. Key challenges include service interruptions, transaction processing errors and system conversion delays, which may cause us to alienate customers or fail to comply with applicable laws, and may cause us to incur additional expenses, which may be substantial.
23
Uncertainty relating to the London Inter-bank Offered Rate, or LIBOR, calculation process and potential phasing out of LIBOR may adversely affect us.
On July 27, 2017, the Chief Executive of the United Kingdom Financial Conduct Authority, which regulates LIBOR, announced that it intends to stop persuading or compelling banks to submit rates for the calibration of LIBOR to the administrator of LIBOR after 2021. The announcement indicates that the continuation of LIBOR on the current basis cannot and will not be guaranteed after 2021. It is impossible to predict whether and to what extent banks will continue to provide LIBOR submissions to the administrator of LIBOR or whether any additional reforms to LIBOR may be enacted in the United Kingdom or elsewhere. At this time, no consensus exists as to what rate or rates may become acceptable alternatives to LIBOR and it is impossible to predict the effect of any such alternatives on the value of LIBOR-based securities and variable rate loans, or other securities or financial arrangements, given LIBOR’s role in determining market interest rates globally. If LIBOR rates are no longer available, and we are required to implement substitute indices for the calculation of interest rates under our loan agreements with our borrowers, we may experience significant expenses in effecting the transition, and may be subject to disputes or litigation with customers and creditors over the appropriateness or comparability to LIBOR of the substitute indices, which could have an adverse effect on our results of operations.
We rely on quantitative models to manage certain accounting, risk management and capital planning functions.
We use quantitative models to help manage certain aspects of our business and to assist with certain business decisions, including estimating probable loan losses, measuring the fair value of financial instruments when reliable market prices are unavailable, estimating the effects of changing interest rates and other market measures on our financial condition and results of operations, risk management and for capital planning purposes. Our modeling methodologies rely on many assumptions, historical analyses and correlations. These assumptions may be incorrect, particularly in times of market distress, and the historical correlations on which we rely may no longer be relevant. Additionally, as businesses and markets evolve, our measurements may not accurately reflect this evolution. Even if the underlying assumptions and historical correlations used in our models are adequate, our models may be deficient due to errors in computer code, bad data, misuse of data, or the use of a model for a purpose outside the scope of the model’s design.
All models have certain limitations. Reliance on models presents the risk that our business decisions based on information incorporated from models will be adversely affected due to incorrect, missing or misleading information. In addition, our models may not capture or fully express the risks we face, may suggest that we have sufficient capitalization when we do not, or may lead us to misjudge the business and economic environment in which we will operate. If our models fail to produce reliable results on an ongoing basis, we may not make appropriate risk management, capital planning, or other business or financial decisions. Strategies that we employ to manage and govern the risks associated with our use of models may not be effective or fully reliable, and as a result, we may realize losses or other lapses. Also, information that we provide to the public or regulators based on poorly designed models could be inaccurate or misleading.
Banking regulators continue to focus on the models used by banks and bank holding companies in their businesses. Some of our decisions that the regulators evaluate, including distributions to our shareholders, could be affected adversely due to their perception that the quality of the models used to generate the relevant information is insufficient. Accordingly, the failure or inadequacy of a model may result in increased regulatory scrutiny on us or may result in an enforcement action or proceeding against us by one of our regulators.
We are subject to examinations, challenges and rates set by tax authorities that could adversely affect our results of operations and financial condition.
We are subject to federal, state and foreign income tax regulations, which often require interpretation due to their complexity. Changes in income tax regulations or tax rates, including those resulting from the enactment of Tax Reform or in how the regulations are interpreted could have a material adverse effect on our results of operations. In the normal course of business, we are routinely subject to examinations and challenges from taxing authorities regarding our tax positions. Taxing authorities have been aggressive in challenging tax positions taken by financial institutions. These tax positions may relate to tax compliance, sales and use, franchise, gross receipts, payroll, property and income tax issues, including tax base, apportionment and tax credit planning. These challenges may result in adjustments to the timing or amount of taxable income or deductions, or the allocation of income among tax jurisdictions. If any such challenges are made and are not resolved in our favor, they could have a material adverse effect on our financial condition and results of operations.
24
Severe weather, natural disasters, acts of war or terrorism and other external events could significantly impact our business.
Severe weather, natural disasters, acts of war or terrorism and other adverse external events could have a significant impact on our ability to conduct business. Such events could affect the stability of our deposit base, impair the ability of borrowers to repay outstanding loans, impair the value of collateral securing loans, cause significant property damage, result in loss of revenue and/or cause us to incur additional expenses. Although management has established disaster recovery policies and procedures, the occurrence of any such event in the future could have a material adverse effect on our business, financial condition and results of operations.
Item 1B. Unresolved Staff Comments
None.
Item 2. Properties
Our headquarters is located in Detroit, Michigan, in an office building that is leased. We also operate regional offices located in the Minneapolis-St. Paul area of Minnesota and Midland, Michigan. At December 31, 2019, we leased or licensed 177 of our bank branch offices, owned the buildings and land for 313 of our bank branch offices and owned the buildings and leased the land for the remaining 30 of our bank branch offices, all of which are functional and appropriately maintained and are utilized by both our Consumer Banking and Commercial Banking reportable segments. These branch offices are located in Michigan, Illinois, Minnesota, Colorado, Ohio, Wisconsin, Arizona and South Dakota. For further information on premises and equipment, see "Note 9. Premises and Equipment, Net" of Notes to Consolidated Financial Statements.
25
Item 3. Legal Proceedings
From time to time we are a party to legal proceedings arising out of our lending, leasing and deposit operations, including foreclosure proceedings and other collection actions as part of our lending and leasing collections activities. We may also be subject to regulatory examinations and enforcement actions brought by federal regulators, including the SEC, the Federal Reserve, the OCC and the CFPB which may impose sanctions on us for failures related to regulatory compliance. From time to time borrowers and other customers, and employees and former employees have also brought actions against us, in some cases claiming substantial damages. We, like other financial services companies, are also subject to the risk of class action litigation. Litigation is often unpredictable and the actual results of litigation cannot be determined and therefore the ultimate resolution of a matter and the possible range of loss associated with certain potential outcomes cannot be established. Based on our current understanding of our pending legal proceedings, management does not believe that judgments or settlements arising from pending or threatened legal matters, individually or in the aggregate, would have a material adverse effect on our consolidated financial position, operating results or cash flows.
On February 22, 2016, two putative class action and derivative complaints were filed in the Circuit Court for Oakland County, Michigan by individuals purporting to be a shareholder of Talmer Bancorp, Inc. ("Talmer"), a company that merged with Chemical on August 31, 2016. The actions are styled Regina Gertel Lee v. Chemical Financial Corporation, et. al., Case No. 2016-151642-CB and City of Livonia Employees’ Retirement System v. Chemical Financial Corporation et. al., Case No. 2016-151641-CB. These complaints purport to be brought derivatively on behalf of Talmer against the individual defendants, and individually and on behalf of all others similarly situated against Talmer and the Corporation (collectively, the "Defendants"). The complaints allege, among other things, that the directors of Talmer breached their fiduciary duties to Talmer’s shareholders in connection with the merger by approving a transaction pursuant to an allegedly inadequate process that undervalues Talmer and includes preclusive deal protection provisions, and that we allegedly aided and abetted the Talmer directors in breaching their duties to Talmer’s shareholders. The complaints also allege that the individual defendants have been unjustly enriched. Both complaints seek various remedies on behalf of the putative class (consisting of all shareholders of Talmer who are not related to or affiliated with any defendant). They request, among other things, that the Court enjoin the merger from being consummated in accordance with its agreed-upon terms, direct the Talmer directors to exercise their fiduciary duties, rescind the merger agreement to the extent that it is already implemented, award the plaintiff all costs and disbursements in each respective action (including reasonable attorneys’ and experts’ fees), and grant such further relief as the court deems just and proper. The City of Livonia plaintiff amended its complaint on April 21, 2016 to add additional factual allegations, including but not limited to allegations that Keefe Bruyette & Woods, Inc. ("KBW") served as a financial advisor for the merger despite an alleged conflict of interest, that Talmer’s board acted under actual or potential conflicts of interest, and that the defendants omitted and/or misrepresented material information about the merger in the Form S-4 Registration Statement relating to the merger. These two cases were consolidated as In re Talmer Bancorp Shareholder Litigation, case number 2016-151641-CB, per an order entered on May 12, 2016. On October 31, 2016, the plaintiffs in this consolidated action again amended their complaint, adding additional factual allegations, adding KBW as a defendant, and asserting that KBW acted in concert with us to aid and abet breaches of fiduciary duty by Talmer's directors. The Defendants all filed motions for summary disposition seeking dismissal of all claims with prejudice. The Court issued an opinion and order on those motions on May 4, 2017 and granted dismissal to us, but denied the motions filed by KBW and the individual defendants. KBW and the individual defendants filed an application seeking leave to appeal the Court's ruling to the Michigan Court of Appeals. That application was denied by the Michigan Court of Appeals on August 16, 2017. On June 8, 2017, the Defendants filed a notice with the Court that the plaintiffs had failed to timely certify a class as required by the Michigan Court Rules. Upon the filing of that notice, the City of Livonia case became an individual action brought by the two named plaintiffs, and cannot proceed as a class action. On October 19, 2017, the Defendants filed motions for summary disposition under MCR 2.116(C) (10) in the City of Livonia case, again seeking the dismissal of the case. A hearing on those motions was held on April 11, 2018. On May 11, 2018, the Court issued its opinion and order granting the motion of the Defendants, and dismissing the case. On May 25, 2018, the plaintiffs filed a claim of appeal from the Court's decision with the Michigan Court of Appeals. By order dated August 7, 2018, the Michigan Court of Appeals consolidated the City of Livonia case with the Nicholl case discussed below.
26
On June 16, 2016, the same putative class plaintiff that filed the City of Livonia state court action discussed in the preceding paragraph filed a complaint in the United States District Court for the Eastern District of Michigan, styled City of Livonia Employees’ Retirement System v. Chemical Financial Corporation, et. al., Docket No. 1:16-cv-12229. The plaintiff purports to bring this action "individually and on behalf of all others similarly situated," and requests certification as a class action. The Complaint alleges violations of Section 14(a) and 20(a) of the Securities Exchange Act of 1934 and alleges, among other things, that the Defendants issued materially incomplete and misleading disclosures in the Form S-4 Registration Statement relating to the merger. The Complaint contains requests for relief that include, among other things, that the Court enjoin the transaction unless and until additional information is provided to Talmer’s shareholders, declare that the Defendants violated the securities laws in connection with the merger, award compensatory damages, interest, attorneys’ and experts’ fees, and that the Court grant such other relief as it deems just and proper. On October 18, 2016, the Federal Court entered a stipulated order staying this action until the Oakland County Circuit Court issues rulings on motions for summary disposition in In re Talmer Bancorp Shareholder Litigation, case number 2016-151641-CB. Following the Oakland County Circuit Court's denial of the Motions by KBW and the individual defendants and their ensuing application for leave to appeal that ruling, the Federal Court issued an order extending the stay of this action. On November 13, 2017, the Federal Court issued an Order Directing Plaintiff To Show Cause Why The Stay Should Not Be Lifted. On June 29, 2018, the Court issued an Order Lifting Stay. The plaintiff filed an amended complaint on July 27, 2018. In response to the amended complaint, the Defendants filed a Motion To Dismiss on August 24, 2018. On November 8, 2018, the Court entered an Order Staying Case Pending Appeal And Holding In Abeyance Motion To Dismiss. In the Order, the Court ruled that the case is stayed pending resolution of the appeals in the state court actions. The Order provides that if the Michigan Court of Appeals upholds the trial court decisions, and that ruling becomes final, the doctrine of collateral estoppel will preclude the plaintiffs in the City of Livonia and Nicholl cases from pursuing the federal case.
In response to the failure of the City of Livonia case to qualify as a class action, on July 31, 2017, the same attorneys who filed the City of Livonia action field a new lawsuit in the Oakland County, Michigan Circuit Court, based on the Talmer transaction. That case is styled Kevin Nicholl v Gary Torgow et al, Case No. 2017-160058-CB. The Nicholl case makes substantially the same claims as were brought in the City of Livonia case, and seeks certification of a shareholder class. The Nicholl case was assigned to Judge Wendy Potts, the same judge presiding over the City of Livonia case. On November 22, 2017, the plaintiff filed a First Amended Complaint purporting to add the City of Livonia Employees’ Retirement System and Regina Gertel Lee as additional named plaintiffs in the case. The Defendants moved to strike the class allegations in the Nicholl case based on the failure of the plaintiffs to timely file a motion to certify a class. On April 2, 2018, the Court entered an opinion and order confirming that the class allegations in the Nicholl case are stricken, and the Nicholl case will proceed as an individual action only. On April 23, 2018, the plaintiffs filed a claim of appeal with the Michigan Court of Appeals from the Court’s April 2, 2018 opinion and order.
As in the City of Livonia case, the Defendants filed motions for summary disposition in the Nicholl case, seeking dismissal of the Nicholl case. Argument on these motions was heard on April 11, 2018, together with arguments on the summary disposition motions of the Defendants in the City of Livonia case. On May 8, 2018 the Court issued its opinion and order granting the motion of the Defendants, and dismissing the Nicholl case. On May 25, 2018 the plaintiffs filed a claim of appeal from the Court’s decision with the Michigan Court of Appeals. The Court’s dismissal of the Nicholl case obviates the April 23, 2018 appeal filed by the Nicholl plaintiff with respect to the Court’s order of April 2, 2018 finding that the plaintiff failed to timely certify a class in the Nicholl litigation. By order dated August 7, 2018, the Michigan Court of Appeals consolidated the Nicholl case with the City of Livonia case.
On January 3, 2018, the plaintiffs in the City of Livonia case filed a Motion For Voluntary Dismissal Without Prejudice. Defendants filed an opposition to that motion. The Court did not rule on that motion, pending ruling on the Defendant’s summary disposition motions in the City of Livonia and Nicholl cases. The Court's dismissal of the City of Livonia case obviates the need for a ruling on this motion.
On October 17, 2019 the Michigan Court of Appeals ruled in favor of the Defendants in both the City of Livonia and Nicholl cases, affirming the decisions of the trial court. The plaintiffs did not appeal the Michigan Court of Appeals decision; the decision became final on December 2, 2019. The City of Livonia and Nicholl cases are closed. By stipulation of the parties, an order dated December 20, 2019 was issued in the federal case, closing that case with prejudice. All litigation concerning the Talmer merger transaction has now been finally resolved in favor of the Defendants.
Item 4. Mine Safety Disclosures
Not applicable.
27
Part II
Item 5. Market for Registrant's Common Equity, Related Shareholder Matters and Issuer Purchases of Equity Securities
Our common stock trades on the NASDAQ Stock Market® under the symbol "TCF." As of February 24, 2020, there were 8,617 holders of record of our common stock.
Dividends
The Board of Directors of TCF Financial and TCF Bank have each adopted a Capital Adequacy and Dividend Policy. The policies define how enterprise risk related to capital will be managed, how the adequacy of capital will be measured and the process by which capital strategy, capital management and preferred and common stock dividend recommendations will be presented to TCF's Board of Directors. Our management is charged with ensuring that capital strategy actions, including the declaration of preferred and common stock dividends, are prudent, efficient and provide value to our shareholders, while ensuring that past and prospective earnings retention is consistent with our capital needs, asset quality, risk profile and overall financial condition.
The Board of Directors currently intends to continue its practice of paying quarterly cash dividends on our common stock as justified by our financial condition. The declaration and amount of future dividends will depend on circumstances existing at the time, including our earnings, financial condition and capital requirements, the cash available to pay such dividends (derived mainly from dividends and distributions from TCF Bank which may be limited by its dividend paying capacity), alternative uses of capital, and regulatory and contractual limitations and such other factors as the Board of Directors may deem relevant. In addition, the ability of TCF Financial and TCF Bank to pay dividends depends on regulatory policies and capital requirements and may be subject to regulatory approval. See "Item 1. Business - Regulation - Regulatory Capital Requirements", "Item 1. Business - Regulation - Restrictions on Distributions", "Note 19. Regulatory Capital Requirements" and "Note 28. Parent Company Financial Information" of Notes to Consolidated Financial Statements. Dividends for the current dividend period on all outstanding shares of preferred stock must be declared and paid or declared and a sum sufficient for the payment thereof must be set aside before any dividend may be declared or paid on our common stock.
28
Total Return Performance
The following chart compares the cumulative total shareholder return on our common stock over the last five fiscal years with the cumulative total return of the KBW NASDAQ Regional Banking Index and the Standard and Poor's ("S&P") 500 Stock Index (assuming the investment of $100 in each index on December 31, 2014 and reinvestment of all dividends). As a result of the Merger in which Chemical Financial Corporation was the legal acquirer and subsequently changed its name to TCF Financial Corporation, the total shareholder return shown below for TCF Financial Corporation reflects Chemical Financial Corporation's stock price and dividends paid for the period of December 31, 2014 through the closing of the Merger on August 1, 2019, and the combined company's stock price and dividends paid for the period of August 1, 2019 through December 31, 2019.
TCF Total Stock Return Performance Chart(1)
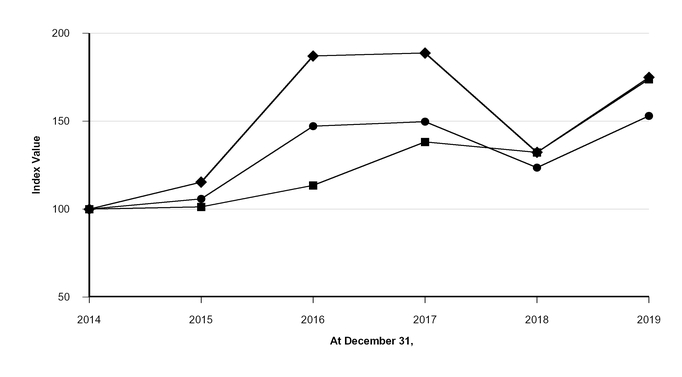
u TCF Financial Corporation(1) l KBW NASDAQ Regional Banking Index n S&P 500 Index
At December 31, | |||||||||||||||||||||||
Index | 2014 | 2015 | 2016 | 2017 | 2018 | 2019 | |||||||||||||||||
TCF Financial Corporation | $ | 100.00 | $ | 115.40 | $ | 187.09 | $ | 188.80 | $ | 132.36 | $ | 174.96 | |||||||||||
KBW NASDAQ Regional Banking Index | 100.00 | 105.91 | 147.24 | 149.82 | 123.60 | 153.03 | |||||||||||||||||
S&P 500 Index | 100.00 | 101.38 | 113.51 | 138.29 | 132.23 | 173.86 | |||||||||||||||||
Source: S&P Global Market Intelligence
(1) Prior to the Merger, the shares were traded under the symbol "CHFC".
29
Repurchases of TCF Common Stock
Share repurchase activity for the quarter ended December 31, 2019 was as follows:
(Dollars in thousands, except per share data) | Total Number of Shares Purchased | Average Price Paid Per Share | Total Number of Shares Purchased as Part of Publicly Announced Plan | Approximate Dollar Value of Shares that May Yet Be Purchased Under the Plan | |||||||||
October 1 to October 31, 2019 | |||||||||||||
Share repurchase program(1) | 37,000 | $ | 39.61 | 37,000 | $ | 148,534 | |||||||
Employee transactions(2) | 4,924 | 37.14 | N.A. | N.A. | |||||||||
November 1 to November 30, 2019 | |||||||||||||
Share repurchase program(1) | 620,817 | $ | 41.93 | 620,817 | $ | 122,505 | |||||||
Employee transactions(2) | 7,450 | 41.78 | N.A. | N.A. | |||||||||
December 1 to December 31, 2019 | |||||||||||||
Share repurchase program(1) | — | $ | — | — | $ | 122,505 | |||||||
Employee transactions(2) | 408 | 46.80 | N.A. | N.A. | |||||||||
Total | |||||||||||||
Share repurchase program(1) | 657,817 | $ | 41.80 | 657,817 | $ | 122,505 | |||||||
Employee transactions(2) | 12,782 | 40.15 | N.A. | N.A. | |||||||||
N.A. Not Applicable
(1) | On October 24, 2019, the Board of Directors approved an authorization to repurchase up to $150 million of our common stock. Repurchases will be based on market conditions, the trading price of our shares and other factors. The ability to repurchase shares in the future may be adversely affected by new legislation or regulations or by changes in regulatory policies. |
(2) | Represents restricted stock withheld pursuant to the terms of awards granted under the Legacy TCF Financial 2015 Omnibus Incentive Plan to offset tax withholding obligations that occur upon vesting and release of restricted stock. The plan provides that the value of shares withheld shall be the average of the high and low prices of common stock of TCF Financial Corporation on the date the relevant transaction occurs. |
30
Item 6. Selected Financial Data
The selected five-year financial summary presented below should be read in conjunction with the Consolidated Financial Statements and related notes. Financial results were significantly impacted by the Merger, and periods before the Merger reflect financial data of Legacy TCF, while periods after the Merger reflect financial data for the combined company. Certain reclassifications have been made to prior period financial statements to conform to the current period presentation. In addition, the number of shares issued and outstanding, earnings per share, additional paid-in-capital, dividends paid and all references to share quantities of TCF have been retrospectively restated to reflect the equivalent number of shares issued in the Merger as the Merger was treated as a reverse merger. Our Consolidated Financial Statements are prepared in accordance with United States generally accepted accounting principles ("GAAP"). As noted in the following table, certain non-GAAP financial measures are included, which should be read in conjunction with the section entitled, "Non-GAAP Financial Measures" and the accompanying table entitled "Reconciliation of Non-GAAP Operating Results," for reconciliation of non-GAAP measures to the most directly comparable GAAP financial measure. Historical data is not necessarily indicative of our future results of operations or financial condition. See "Item 1A. Risk Factors" for more discussion of factors that could cause our results to differ significantly from management's expectation.
Five-Year Financial Summary
For the Year Ended December 31, | ||||||||||||||||||||
(Dollars in thousands, except per share data) | 2019 | 2018 | 2017 | 2016 | 2015 | |||||||||||||||
Consolidated Income: | ||||||||||||||||||||
Interest income | $ | 1,587,261 | $ | 1,159,329 | $ | 1,031,745 | $ | 942,681 | $ | 903,473 | ||||||||||
Interest expense | 298,229 | 150,834 | 94,271 | 82,956 | 71,851 | |||||||||||||||
Net interest income | 1,289,032 | 1,008,495 | 937,474 | 859,725 | 831,622 | |||||||||||||||
Noninterest income | 465,532 | 454,397 | 436,063 | 454,281 | 430,764 | |||||||||||||||
Total revenue | 1,754,564 | 1,462,892 | 1,373,537 | 1,314,006 | 1,262,386 | |||||||||||||||
Provision for credit losses | 65,282 | 46,768 | 68,443 | 65,874 | 52,944 | |||||||||||||||
Noninterest expense | 1,332,115 | 1,014,400 | 1,059,934 | 909,887 | 894,747 | |||||||||||||||
Income before income tax expense | 357,167 | 401,724 | 245,160 | 338,245 | 314,695 | |||||||||||||||
Income tax expense (benefit) | 50,241 | 86,096 | (33,624 | ) | 116,528 | 108,872 | ||||||||||||||
Income attributable to non-controlling interest | 11,458 | 11,270 | 10,147 | 9,593 | 8,700 | |||||||||||||||
Net income attributable to TCF | 295,468 | 304,358 | 268,637 | 212,124 | 197,123 | |||||||||||||||
Preferred stock dividends | 9,975 | 11,588 | 19,904 | 19,388 | 19,388 | |||||||||||||||
Impact of preferred stock redemption | — | 3,481 | 5,779 | — | — | |||||||||||||||
Net income available to common shareholders | $ | 285,493 | $ | 289,289 | $ | 242,954 | $ | 192,736 | $ | 177,735 | ||||||||||
Earnings per common share: | ||||||||||||||||||||
Basic | $ | 2.56 | $ | 3.44 | $ | 2.83 | $ | 2.27 | $ | 2.11 | ||||||||||
Diluted | 2.55 | 3.43 | 2.83 | 2.27 | 2.11 | |||||||||||||||
Dividends declared | 1.29 | 1.18 | 0.59 | 0.59 | 0.44 | |||||||||||||||
Financial Ratios: | ||||||||||||||||||||
Return on average assets ("ROAA") | 0.92 | % | 1.37 | % | 1.26 | % | 1.05 | % | 1.03 | % | ||||||||||
Return on average common equity ("ROACE") | 7.67 | 12.42 | 10.80 | 9.13 | 9.19 | |||||||||||||||
Return on average tangible common equity ("ROATCE")(non-GAAP)(1) | 9.81 | 13.56 | 15.73 | 10.29 | 10.48 | |||||||||||||||
Net interest margin (GAAP) | 4.17 | 4.66 | 4.52 | 4.33 | 4.45 | |||||||||||||||
Net interest margin (FTE)(2)(3) | 4.20 | 4.69 | 4.59 | 4.34 | 4.42 | |||||||||||||||
Dividend payout ratio | 50.41 | 34.33 | 20.83 | 26.09 | 21.03 | |||||||||||||||
Efficiency ratio | 75.92 | 69.34 | 77.17 | 69.25 | 70.88 | |||||||||||||||
Net charge-offs as a percentage of average loans and leases | 0.27 | 0.29 | 0.24 | 0.26 | 0.30 | |||||||||||||||
Adjusted Financial Results (non-GAAP): | ||||||||||||||||||||
Adjusted net income attributable to TCF(1) | $ | 461,232 | $ | 329,867 | $ | 211,025 | $ | 212,124 | $ | 197,123 | ||||||||||
Adjusted diluted earnings per common share(1) | $ | 4.04 | $ | 3.73 | $ | 2.16 | $ | 2.27 | $ | 2.11 | ||||||||||
Adjusted ROAA(1) | 1.41 | % | 1.48 | % | 1.00 | % | 1.05 | % | 1.03 | % | ||||||||||
Adjusted ROACE(1) | 12.13 | 13.51 | 8.24 | 9.13 | 9.19 | |||||||||||||||
Adjusted ROATCE(1) | 15.34 | 14.74 | 9.25 | 10.29 | 10.48 | |||||||||||||||
Adjusted efficiency ratio (1) | 60.58 | 64.77 | 69.71 | 67.59 | 69.55 | |||||||||||||||
(1) | See "Item 7. Management's Discussion and Analysis - Consolidated Financial Condition Analysis - Non-GAAP Financial Measures" for further information. |
(2) | Net interest income on a fully tax-equivalent ("FTE") basis divided by average interest-earning assets. |
(3) | Presented on a tax-equivalent basis using the federal statutory tax rate in effect for each period presented. |
31
At December 31, | ||||||||||||||||||||
(Dollars in thousands) | 2019 | 2018 | 2017 | 2016 | 2015 | |||||||||||||||
Consolidated Financial Condition: | ||||||||||||||||||||
Loans and leases | $ | 34,497,464 | $ | 19,073,020 | $ | 19,105,284 | $ | 17,844,716 | $ | 17,436,744 | ||||||||||
Total assets | 46,651,553 | 23,699,612 | 23,002,159 | 21,441,326 | 20,689,609 | |||||||||||||||
Deposits | 34,468,463 | 18,903,686 | 18,335,002 | 17,242,522 | 16,719,989 | |||||||||||||||
Borrowings | 5,023,593 | 1,449,472 | 1,249,449 | 1,077,572 | 1,039,938 | |||||||||||||||
Total equity | 5,727,241 | 2,556,260 | 2,680,584 | 2,444,645 | 2,306,917 | |||||||||||||||
Financial Ratios: | ||||||||||||||||||||
Common equity to assets | 11.87 | % | 9.99 | % | 10.42 | % | 10.09 | % | 9.80 | % | ||||||||||
Tangible common equity as a percent of tangible assets (non-GAAP)(1) | 9.01 | 9.32 | 9.72 | 9.13 | 8.79 | |||||||||||||||
Total risk-based capital ratio | 12.70 | 13.38 | 13.90 | 13.69 | 13.71 | |||||||||||||||
Book value per common share | $ | 36.20 | $ | 28.44 | $ | 27.48 | $ | 24.91 | $ | 23.50 | ||||||||||
Tangible book value per common share (non-GAAP)(1) | 26.60 | 26.33 | 25.43 | 22.29 | 20.85 | |||||||||||||||
Credit Quality Ratios: | ||||||||||||||||||||
Nonaccrual loans and leases as a percentage of total loans and leases | 0.49 | % | 0.56 | % | 0.62 | % | 1.02 | % | 1.15 | % | ||||||||||
Nonperforming assets as a percentage of total loans and leases and other real estate owned | 0.59 | 0.65 | 0.72 | 1.28 | 1.43 | |||||||||||||||
Allowance for loan and lease losses as a percentage of total nonaccrual loans and leases | 66.64 | 148.65 | 144.24 | 88.33 | 77.85 | |||||||||||||||
(1) | See "Item 7. Management's Discussion and Analysis - Consolidated Financial Condition Analysis - Non-GAAP Financial Measures" for further information. |
32
Item 7. Management's Discussion and Analysis of Financial Condition and Results of Operations
Table of Contents
Description | Page |
33
Forward-looking Information
Any statements in this Annual Report on Form 10-K that are not historical in nature are forward-looking statements for purposes of the safe harbor provided in the Private Securities Litigation Reform Act of 1995. Forward-looking statements are based on, among other things, management’s beliefs, assumptions, current expectations, estimates and projections regarding the outlook for our businesses and primary banking markets and may include projections of future performance, targets, guidance, statements of our plans and objectives, forecasts of market trends and other matters. Such statements may be identified by such words or phrases as "will likely result," "are expected to," "will continue," "outlook," "will benefit," "is anticipated," "estimate," "project," "management believes" or similar expressions.
Management's determination of the provision and allowance for loan and lease losses; the carrying value of acquired loans and leases, goodwill and loan servicing rights; the fair value of investment securities (including whether any impairment on any investment security is temporary or other-than-temporary and the amount of any impairment); and management's assumptions concerning postretirement benefit plans involve judgments that are inherently forward-looking. There can be no assurance that future loan losses will be limited to the amounts estimated. All of the information concerning interest rate sensitivity is forward-looking. The future effect of changes in the financial and credit markets and the national and regional economies on the banking industry, generally, and on us, specifically, are also inherently uncertain.
These forward-looking statements are subject to certain risks, uncertainties and assumptions (“risk factors”) that could cause actual results to differ materially from those expressed or implied in such statements and no assurance can be given that the results in any forward-looking statement will be achieved. Any forward-looking statement speaks only as of the date on which it is made and we disclaim any obligation to subsequently revise any forward-looking statement to reflect events or circumstances after such date or to reflect the occurrence of anticipated or unanticipated events, except as required by law. These risk factors include the risks discussed in Part I, Item 1A. of this Annual Report on Form 10-K under the heading "Risk Factors" or otherwise disclosed in documents filed or furnished by us with or to the SEC after the filing of this Annual Report on Form 10-K, the factors discussed below and any other cautionary statements, written or oral, which may be made or referred to in connection with any such forward-looking statements. Since it is not possible to foresee all such risk factors, these risk factors should not be considered as complete or exhaustive: a failure to manage credit risk; cyber-security breaches involving us or third-parties, hacking, denial of service, loss or theft of information, or other cyber-attacks that disrupt our business operations or damage our reputation; adverse developments affecting our branches, including supermarket branches; our inability to successfully execute on our growth strategy through acquisitions or expanding existing business relationships; adverse effects related to competition from traditional competitors, non-bank providers of financial services and new technologies; failure to keep pace with technological change, including with respect to customer demands or system upgrades; risks related to developing new products, markets or lines of business; risks related to our loan origination and sales activity; lack of access to liquidity or raise capital that isn’t dilutive; adverse changes in monetary, fiscal or tax policies; risks associated with actual or potential investigations or legal proceedings by customers, regulatory agencies or others; heightened consumer protection, supervisory or regulatory practices or requirements; deficiencies in our compliance programs or risk mitigation frameworks; dependence on accurate and complete information from customers and counterparties; the failure to attract and retain key employees; ineffective internal controls; soundness of other financial institutions and other counterparty risk, including the risk of default, operational disruptions, or diminished availability of counterparties who satisfy our credit quality requirements; inability to grow deposits, increase earnings and revenue, manage operating expenses, or pay and receive dividends; interruptions, systems failures information technology and telecommunications systems failures of third-party services; deficiencies in our quantitative models; the effect of any negative publicity or reputational damage; technological or operational difficulties; changes in accounting standards or interpretations of existing standards, including changes in accounting principles relating to loan loss recognition (CECL); adverse federal, state or foreign tax assessments; and the effects of man-made and natural disasters, any of which may negatively affect our operations and/or our customers.
34
This Annual Report on Form 10-K also contains forward-looking statements regarding our outlook or expectations with respect to the Merger with Legacy TCF, which are subject to risks, uncertainties and assumptions, including, among others, the following:
• | the possibility that the anticipated benefits of the Merger, including anticipated cost savings and strategic gains, are not realized when expected or at all, including as a result of the impact of, or problems arising from, the integration of the two companies or as a result of the strength of the economy, competitive factors in the areas where we do business, or as a result of other unexpected factors or events; |
• | the impact of purchase accounting with respect to the Merger, or any change in the assumptions used regarding the assets purchased and liabilities assumed to determine their fair value; |
• | diversion of management's attention from ongoing business operations and opportunities; |
• | the operational integration of the merged businesses and operations, which may take longer than anticipated or be more costly than anticipated or have unanticipated adverse results; |
• | failure to attract new customers and retain existing customers in the manner anticipated; |
• | the challenges of integrating, retaining and hiring key personnel; and |
• | the potential impact of the Merger on relationships with third-parties, including customers, vendors, employees and competitors. |
Management's discussion and analysis of the consolidated financial condition and results of operations of TCF Financial Corporation should be read in conjunction with "Part I, Item 1A. Risk Factors," "Item 6. Selected Financial Data" and "Item 8. Consolidated Financial Statements."
35
Management's discussion and analysis of the consolidated financial condition and results of operations of TCF Financial Corporation should be read in conjunction with "Part I, Item 1A. Risk Factors," "Item 6. Selected Financial Data" and "Item 8. Consolidated Financial Statements."
Overview
TCF Financial Corporation ("TCF") is a financial holding company, headquartered in Detroit, Michigan. TCF completed a merger of equals with Chemical Financial Corporation ("Merger of Equals") on August 1, 2019. We had total assets of $46.7 billion at December 31, 2019 and were the 28th largest publicly traded bank holding company in the United States based on total assets at December 31, 2019.
Through our wholly-owned bank subsidiary, TCF National Bank, a national banking association ("TCF Bank") headquartered in Sioux Falls, South Dakota, we provide a full range of consumer-facing and commercial services, including consumer and commercial banking, trust and wealth management, and specialty leasing and lending products and services to consumers, small businesses and commercial customers. As of December 31, 2019, we had 520 branches primarily located in Michigan, Minnesota, Illinois, Ohio, Colorado and Wisconsin (our "primary banking markets"). We also conduct business across all 50 states and Canada through our specialty lending and leasing businesses.
References herein to "TCF Financial" refer to TCF Financial Corporation on an unconsolidated basis. TCF Financial Corporation (together with its direct and indirect subsidiaries, are referred to as "we," "us," "our," "TCF" or the "Corporation".
Merger of Equals
On August 1, 2019 (the "Merger Date"), TCF Financial Corporation, a Delaware corporation ("Legacy TCF"), merged with and into Chemical Financial Corporation, a Michigan corporation incorporated in August 1973 ("Chemical"), with Chemical surviving the merger (the "Merger"). Immediately following the Merger, Chemical’s wholly owned bank subsidiary, Chemical Bank, a Michigan state-chartered bank, merged with and into TCF Bank, with TCF Bank surviving the merger. Upon completion of the Merger, Chemical was renamed TCF Financial Corporation.
The Merger was accounted for as a reverse merger using the acquisition method of accounting, therefore, Legacy TCF was deemed the acquirer for financial reporting purposes, even though Chemical was the legal acquirer. Accordingly, Legacy TCF's historical financial statements are the historical financial statements of the combined company for all periods before the Merger Date. Our results of operations for the year ended December 31, 2019 include the results of operations of Chemical on and after August 1, 2019. Results for periods before August 1, 2019 reflect only those of Legacy TCF and do not include the results of operations of Chemical. Accordingly, comparisons of our results for the year ended December 31, 2019 with those of prior periods may not be meaningful. The number of shares issued and outstanding, earnings per share, additional paid-in-capital, dividends paid and all references to share quantities of TCF have been retrospectively adjusted to reflect the equivalent number of shares issued in the Merger. See "Note 2. Merger" of the Notes to Consolidated Financial Statements for further information. In addition, the assets, including the intangible assets identified, and liabilities of Chemical as of the Merger Date have been recorded at their estimated fair value and added to those of Legacy TCF.
Business Overview
Net interest income, the difference between interest income earned on loans and leases, investment securities and other earning assets (interest income) and interest paid on deposits and borrowings (interest expense), represented 73.5% of our total revenue for 2019, compared with 68.9% for 2018 and 68.3% for 2017. Net interest income can change significantly from period to period based on interest rates, customer prepayment patterns and the volume and mix of interest earning assets, noninterest-bearing deposits and interest-bearing liabilities. We manage the risk of changes in interest rates on our net interest income through a management Asset & Liability Committee ("ALCO") and through related interest rate risk monitoring and management policies. See "Part I, Item 1A. Risk Factors" and "Item 7A. Quantitative and Qualitative Disclosures about Market Risk" for further discussion.
36
Noninterest income is a significant source of our revenue and an important component of our results of operations. The significant components of noninterest income are from leasing revenue, fees and service charges on deposit accounts, card and ATM revenue, net gains on sales of loans and leases and servicing fee revenue. Leasing revenue generates noninterest income primarily from operating and sales-type leases. Providing a wide range of consumer banking services is an integral component of our business philosophy. Primary drivers of fees and service charges on deposit accounts include the number of customers we attract, the customers' level of engagement and the frequency with which the customer uses our solutions. We sell loans, primarily secured by consumer real estate, which results in gains on sales, as well as servicing fee income. Primary drivers of gains on sales include our ability to originate loans, identify loan buyers and execute loan sales.
The following portions of this Management's Discussion and Analysis of Financial Condition and Results of Operations ("Management's Discussion and Analysis") focus in more detail on the results of operations for 2019, 2018 and 2017 and on information about our financial condition, loan and lease portfolio, liquidity, funding resources, capital and other matters.
Critical Accounting Estimates
Our Consolidated Financial Statements are prepared in accordance with GAAP, Securities and Exchange Commission ("SEC") rules and interpretive releases and general practices within our industry. Application of these principles requires management to make estimates, assumptions and complex judgments that affect the amounts reported in our Consolidated Financial Statements and accompanying notes. These estimates, assumptions and judgments are based on historical experience and various assumption that we believe to be reasonable as of the date of the financial statements; accordingly, as this information changes, our Consolidated Financial Statements could reflect different estimates, assumptions and judgments. Actual results could differ significantly from those estimates.
Certain accounting measurements inherently have a greater reliance on the use of estimates, assumptions and judgments and, as such, have a greater possibility of producing results that could be materially different than originally reported. We use third-party sources to assist us with developing certain estimates, assumptions and judgments regarding certain amounts reported in our Consolidated Financial Statements and accompanying notes. When using third-party sources, management remains responsible for complying with GAAP. To execute management's responsibilities, we have processes in place to evaluate the third-party methodologies and to design and implement specific internal controls over valuation.
We have identified the determination of the allowance for loan and lease losses, accounting for business combinations (including fair value of purchased loans and leases and core deposit intangible), and the evaluation of goodwill impairment to be the accounting areas that require the most subjective or complex judgments and, as such, could be most subject to revision as new or additional information becomes available or circumstances change, including overall changes in the economic climate and/or market interest rates. Therefore, we consider these policies, discussed below, to be critical accounting estimates and discuss them directly with the Audit Committee of our board of directors.
See "Note 3. Summary of Significant Accounting Policies" of Notes to Consolidated Financial Statements for further discussion of our significant accounting policies.
Allowance for Loan and Lease Losses
The allowance for loan and lease losses represents management’s estimate of probable loan and lease losses inherent in our loan portfolio in addition to the difference between the recorded investment and the present values of our most recent estimates of expected cash flows for PCI loans where we have identified additional impairment subsequent to the date of acquisition. Determining the amount of the allowance for loan and lease losses is considered a critical accounting estimate because it requires significant judgment and the use of estimates related to the amount and timing of expected future cash flows on PCI loans, estimated losses based on risk characteristics of loans and consideration of other qualitative factors, all of which may be susceptible to significant change.
37
The allowance for loan and lease losses is maintained at a level that management believes is appropriate to provide for probable loan and lease losses incurred in the portfolio as of the balance sheet date, including known or anticipated problem loans and leases, as well as for loans and leases which are not currently known to require specific allowance. Events that are not within our control, such as changes in economic factors, could change subsequent to the balance sheet date and could cause the allowance for loan and lease losses to be overstated or understated. The amount of the allowance for loan and lease losses is affected by loan charge-offs, which decrease the allowance for loan and lease losses; recoveries on loans previously charged off, which increase the allowance for loan and lease losses; and the provision for credit losses charged to earnings, which increases the allowance for loan and lease losses.
The amount of the allowance for loan and lease losses significantly depends on management's estimates of variables affecting valuation, appraisals of collateral, evaluations of performance and status and the amounts and timing of future cash flows expected to be received. Such estimates, appraisals, evaluations and cash flows may be subject to frequent adjustments due to changing economic prospects of borrowers, lessees or properties. Management reviews these estimates quarterly and adjustments, if necessary, are recorded in the provision for credit losses in the periods in which they become known.
See "Note 3. Summary of Significant Accounting Policies" and "Note 8. Allowance for Loan and Lease Losses and Credit Quality" of the Consolidated Financial Statements for additional disclosure regarding our allowance for loan and lease losses.
Accounting for Business Combinations
In determining the estimated fair value of assets acquired as part of the Merger with Chemical, including the estimated fair value of acquired loans and leases and a core deposit intangible, management relied on a framework of internal controls in place to evaluate the relevance and reliability of key inputs and assumptions used in the fair value and to ensure the mathematical accuracy used to determine an appropriate fair value. Acquired loans and leases were valued using a discounted cash flow methodology with adjustments to contractual cash flows for probability of default, loss given default, market rates and prepayments speeds. Management based the assumptions used on historical data or available market information. The fair value of the core deposit intangible was estimated under the income approach based on discounted net cash flows. This estimate was determined by projecting net cash flow benefits derived from estimating costs to carry deposits compared to alternative funding costs, and includes key assumptions related to deposit interest rates, servicing costs, customer attrition rates, costs of alternative funding, discount rate, and net maintenance costs.
These assumptions were based on both internal data and available market information. Management reviewed the relevance and reliability of key valuation inputs used to support key assumptions. In cases where management utilized a third-party to assist with the valuation, management assessed the qualifications of the third-party and reviewed all outputs provided by the third-party for reasonableness. See "Note 2. Merger" and "Note 3. Summary of Significant Accounting Policies" for further information.
Goodwill
Goodwill represents the excess of the purchase price of our business acquisition and other purchases of bank branches and other businesses over the fair value of the net assets acquired. Goodwill is not amortized, but rather is tested by management annually for impairment, or more frequently if triggering events occur and indicate potential impairment, in accordance with ASC Topic 350-20, Goodwill (ASC 350-20). ASC 350-20 allows an entity to assess qualitative factors to determine whether it is more-likely-than-not that the fair value of a reporting unit is less than its carrying amount. ASC 350-20 also allows an entity to bypass the qualitative assessment approach and determine if goodwill is impaired utilizing a quantitative assessment approach.
In evaluating whether it is more-likely-than-not that the fair value of a reporting unit is less than its carrying amount, we assess relevant events and circumstances, including macroeconomic conditions, industry and market considerations, overall financial performance, changes in the composition or carrying amount of assets and liabilities, the market price of our common stock, and other relevant factors. We could incur impairment charges related to goodwill in the future due to changes in financial results or other matters that could affect the fair value of our reporting units.
38
Results of Operations
Performance Summary We reported net income of $295.5 million for 2019, compared with $304.4 million for 2018 and $268.6 million for 2017. For the year ended December 31, 2019, net income included merger-related expenses of $172.0 million and notable items of $63.2 million. Notable items, on a pre-tax basis, for the year ended December 31, 2019, included a $32.1 million loss on sale of the Legacy TCF auto finance portfolio, a $17.3 million loss on termination of interest rate swaps, $9.4 million of expense associated with the write-down of company-owned vacant land parcels due to an intent to sell and branch exit costs, $6.3 million of expense related to pension fair valuation adjustment on plans with previously announced terminations, and $3.9 million of loan servicing rights impairment, partially offset by $5.8 million of gain on sales of certain investment securities. The year ended December 31, 2019, also included $11.8 million of tax basis adjustment benefits considered a notable item. For the year ended December 31, 2018, net income included a $32.0 million pre-tax charge related to the settlement to resolve certain matters with the Consumer Financial Protection Bureau (the "CFPB") and Office of the Comptroller of the Currency (the "OCC") considered a notable item. For the year ended December 31, 2017, net income included a $73.0 million goodwill impairment related to the discontinued auto finance loan originations and a $130.7 million income tax benefit due to the impact of the re-measurement of our estimated net deferred tax liability as a result of the enactment of the Tax Cuts and Jobs Act ("Tax Reform") considered notable items. Adjusted net income, a non-GAAP financial measure that excludes merger-related expenses and the identified notable items, net of tax, was $461.2 million for the year ended December 31, 2019, compared to $329.9 million for 2018 and $211.0 million for 2017. See "Non-GAAP Financial Measures" in this Management's Discussion and Analysis for further information.
We reported diluted earnings per common share of $2.55 for 2019, compared with $3.43 for 2018 and $2.83 for 2017. Adjusted diluted earnings per common share, a non-GAAP financial measure that excludes merger-related expenses and the identified notable items, was $4.04 for the year ended December 31, 2019, compared to $3.73 for 2018 and $2.16 for 2017. See "Non-GAAP Financial Measures" in this Management's Discussion and Analysis for further information.
The following table provides our financial ratios and adjusted ratios (non-GAAP), which exclude merger-related expenses and the identified notable items.
Summary of Financial Ratios | ||||||||||||
Year Ended December 31, | Change From | |||||||||||
2019 | 2018 | 2017 | 2019/ | |||||||||
2018 | ||||||||||||
Return on average assets ("ROAA") | 0.92 | % | 1.37 | % | 1.26 | % | (45 | ) | bps | |||
ROACE | 7.67 | 12.42 | 10.80 | (475 | ) | |||||||
ROATCE (non-GAAP)(1) | 9.81 | 13.56 | 15.73 | (375 | ) | |||||||
Efficiency ratio | 75.92 | 69.34 | 77.17 | 658 | ||||||||
Adjusted Financial Results (non-GAAP) | ||||||||||||
Adjusted ROAA(1) | 1.41 | % | 1.48 | % | 1.00 | % | (7 | ) | bps | |||
Adjusted ROACE(1) | 12.13 | 13.51 | 8.24 | (138 | ) | |||||||
Adjusted ROATCE(1) | 15.34 | 14.74 | 9.25 | 60 | ||||||||
Adjusted efficiency ratio(1) | 60.58 | 64.77 | 69.71 | (419 | ) | |||||||
(1) | See section entitled "Non-GAAP Financial Measures" in this Management's Discussion and Analysis for further information. |
39
Consolidated Income Statement Analysis
Net Interest Income Net interest income was $1.3 billion for 2019, compared with $1.0 billion for 2018 and $937.5 million for 2017. Net interest income, our largest source of revenue (net interest income plus noninterest income), represented 73.5% of our total revenue for 2019, compared with 68.9% for 2018 and 68.3% for 2017. The increase in net interest income in 2019, compared to 2018, was primarily attributable to the increase in interest-earning assets acquired in the Merger, partially offset by the increase in interest-bearing liabilities acquired in the Merger. Net interest income included purchase accounting accretion and amortization of $58.9 million for 2019, substantially all as a result of the Merger. The increase in net interest income in 2018, compared to 2017, was primarily due to an increase in interest income on loans and leases as a result of interest rate increases on variable- and adjustable-rate loan portfolios and higher average balances, partially offset by an increase in cost of funds.
Net interest income, on a fully tax-equivalent ("FTE") basis, was $1.3 billion for 2019, compared with $1.0 billion for 2018 and $1.0 billion for 2017. Net interest income (FTE) is the difference between interest income and interest expense adjusted for the tax benefit received on tax-exempt loans, leases and investment securities. Net interest margin (FTE) is calculated by dividing net interest income (FTE) by average interest-earning assets, expressed as a percentage. Net interest income and net interest margin are affected by (i) changes in prevailing short- and long-term interest rates, (ii) loan, lease and deposit pricing strategies and competitive conditions, (iii) the volume and mix of interest-earning assets, noninterest-bearing deposits and interest-bearing liabilities, (iv) the level of nonaccrual loans and leases and other real estate owned and (v) the impact of modified loans and leases. Net interest margin was 4.17% for 2019, compared with 4.66% for 2018 and 4.52% for 2017. Net interest margin (FTE) was 4.20% for 2019, compared with 4.69% for 2018 and 4.59% for 2017. The decrease in both net interest margin and net interest margin (FTE) for the year ended December 31, 2019, compared to 2018, was primarily driven by a decrease in loan and lease yields due to the impact of the lower overall yield earned on loans and leases we acquired through the Merger, the impact of the Federal Reserve's interest rate cuts on our variable-rate loans and an increase in our cost of funds. The presentation of net interest income on a FTE basis and net interest margin (FTE) is not in accordance with GAAP but is customary in the banking industry, see the tables following for further information.
40
The following tables present the average balances of our major categories of assets and liabilities, interest income and expense on a FTE basis, average interest rates earned and paid on assets and liabilities, net interest income (FTE), net interest spread and net interest margin for the years ended December 31, 2019, 2018 and 2017. The presentation of net interest income on a FTE basis is not in accordance with GAAP but is customary in the banking industry. This non-GAAP measure ensures comparability of net interest income arising from both taxable and tax-exempt loans and investment securities.
Year Ended December 31, | ||||||||||||||||||||||||||||||||
2019 | 2018 | Change | ||||||||||||||||||||||||||||||
(Dollars in thousands) | Average Balance | Interest(1) | Yields and Rates(1) | Average Balance | Interest(1) | Yields and Rates(1) | Average Balance | Interest | Yields and Rates (bps) | |||||||||||||||||||||||
Assets: | ||||||||||||||||||||||||||||||||
Federal Home Loan Bank and Federal Reserve Bank stocks | $ | 210,001 | $ | 6,030 | 2.87 | % | $ | 89,774 | $ | 3,618 | 4.03 | % | $ | 120,227 | $ | 2,412 | (116 | ) | ||||||||||||||
Investment securities held-to-maturity | 144,318 | 2,950 | 2.04 | 154,619 | 3,970 | 2.57 | (10,301 | ) | (1,020 | ) | (53 | ) | ||||||||||||||||||||
Investment securities available-for-sale: | ||||||||||||||||||||||||||||||||
Taxable | 3,516,413 | 103,077 | 2.93 | 1,390,016 | 37,436 | 2.69 | 2,126,397 | 65,641 | 24 | |||||||||||||||||||||||
Tax-exempt(2) | 541,525 | 14,746 | 2.72 | 815,540 | 21,694 | 2.66 | (274,015 | ) | (6,948 | ) | 6 | |||||||||||||||||||||
Loans and leases held-for-sale | 336,292 | 18,599 | 5.53 | 103,240 | 6,686 | 6.48 | 233,052 | 11,913 | (95 | ) | ||||||||||||||||||||||
Loans and leases(2)(3) | 25,484,955 | 1,435,976 | 5.61 | 18,827,047 | 1,085,948 | 5.75 | 6,657,908 | 350,028 | (14 | ) | ||||||||||||||||||||||
Interest-bearing deposits with banks and other | 534,979 | 14,326 | 2.66 | 229,698 | 8,346 | 3.63 | 305,281 | 5,980 | (97 | ) | ||||||||||||||||||||||
Total interest-earning assets | 30,768,483 | 1,595,704 | 5.17 | 21,609,934 | 1,167,698 | 5.39 | 9,158,549 | 428,006 | (22 | ) | ||||||||||||||||||||||
Other assets | 2,758,447 | 1,452,214 | 1,306,233 | |||||||||||||||||||||||||||||
Total assets | $ | 33,526,930 | $ | 23,062,148 | $ | 10,464,782 | ||||||||||||||||||||||||||
Liabilities and Equity: | ||||||||||||||||||||||||||||||||
Noninterest-bearing deposits | $ | 5,622,092 | $ | 3,843,494 | $ | 1,778,598 | ||||||||||||||||||||||||||
Interest-bearing deposits: | ||||||||||||||||||||||||||||||||
Checking | 3,920,613 | 13,961 | 0.36 | 2,438,040 | 714 | 0.03 | 1,482,573 | 13,247 | 33 | |||||||||||||||||||||||
Savings | 7,203,987 | 52,087 | 0.72 | 5,621,723 | 20,009 | 0.36 | 1,582,264 | 32,078 | 36 | |||||||||||||||||||||||
Money market | 2,729,156 | 37,615 | 1.38 | 1,553,255 | 11,582 | 0.75 | 1,175,901 | 26,033 | 63 | |||||||||||||||||||||||
Certificates of deposit | 6,086,251 | 122,494 | 2.01 | 4,897,937 | 75,385 | 1.54 | 1,188,314 | 47,109 | 47 | |||||||||||||||||||||||
Total interest-bearing deposits | 19,940,007 | 226,157 | 1.13 | 14,510,955 | 107,690 | 0.74 | 5,429,052 | 118,467 | 39 | |||||||||||||||||||||||
Total deposits | 25,562,099 | 226,157 | 0.88 | 18,354,449 | 107,690 | 0.59 | 7,207,650 | 118,467 | 29 | |||||||||||||||||||||||
Borrowings: | ||||||||||||||||||||||||||||||||
Short-term borrowings | 1,279,073 | 20,836 | 1.61 | 3,288 | 77 | 2.33 | 1,275,785 | 20,759 | (72 | ) | ||||||||||||||||||||||
Long-term borrowings | 1,592,915 | 51,236 | 3.19 | 1,412,186 | 43,067 | 3.03 | 180,729 | 8,169 | 16 | |||||||||||||||||||||||
Total borrowings | 2,871,988 | 72,072 | 2.49 | 1,415,474 | 43,144 | 3.02 | 1,456,514 | 28,928 | (53 | ) | ||||||||||||||||||||||
Total interest-bearing liabilities | 22,811,995 | 298,229 | 1.30 | 15,926,429 | 150,834 | 0.94 | 6,885,566 | 147,395 | 36 | |||||||||||||||||||||||
Total deposits and borrowings | 28,434,087 | 298,229 | 1.05 | 19,769,923 | 150,834 | 0.76 | 8,664,164 | 147,395 | 29 | |||||||||||||||||||||||
Accrued expenses and other liabilities | 1,177,805 | 761,723 | 416,082 | |||||||||||||||||||||||||||||
Total liabilities | 29,611,892 | 20,531,646 | 9,080,246 | |||||||||||||||||||||||||||||
Total TCF Financial Corp. shareholders' equity | 3,889,204 | 2,506,179 | 1,383,025 | |||||||||||||||||||||||||||||
Non-controlling interest in subsidiaries | 25,834 | 24,323 | 1,511 | |||||||||||||||||||||||||||||
Total equity | 3,915,038 | 2,530,502 | 1,384,536 | |||||||||||||||||||||||||||||
Total liabilities and equity | $ | 33,526,930 | $ | 23,062,148 | $ | 10,464,782 | ||||||||||||||||||||||||||
Net interest spread (FTE) | 4.12 | 4.63 | (51 | ) | ||||||||||||||||||||||||||||
Net interest income (FTE) and net interest margin (FTE) | $ | 1,297,475 | 4.20 | $ | 1,016,864 | 4.69 | $ | 280,611 | (49 | ) | ||||||||||||||||||||||
Reconciliation to Reported Net Interest Income | ||||||||||||||||||||||||||||||||
Net interest income (FTE) | $ | 1,297,475 | $ | 1,016,864 | $ | 280,611 | ||||||||||||||||||||||||||
Adjustments for taxable equivalent interest(1)(3) | ||||||||||||||||||||||||||||||||
Loans | (5,348 | ) | (3,813 | ) | (1,535 | ) | ||||||||||||||||||||||||||
Tax-exempt investment securities | (3,095 | ) | (4,556 | ) | 1,461 | |||||||||||||||||||||||||||
Total FTE adjustments | (8,443 | ) | (8,369 | ) | (74 | ) | ||||||||||||||||||||||||||
Net interest income (GAAP) | $ | 1,289,032 | $ | 1,008,495 | $ | 280,537 | ||||||||||||||||||||||||||
Net interest margin (GAAP) | 4.17 | % | 4.66 | % | (49 | ) | ||||||||||||||||||||||||||
(1) | Interest and yields are presented on a FTE basis. |
(2) | The yield on tax-exempt loans, leases and available-for-sale investment securities is computed on a FTE basis using a statutory federal income tax rate of 21%. The presentation of net interest income on a FTE basis is not in accordance with GAAP, but is customary in the banking industry. |
(3) | Average balances of loans and leases include nonaccrual loans and leases and are presented net of unearned income |
41
Year Ended December 31, | ||||||||||||||||||||||||||||||||
2018 | 2017 | Change | ||||||||||||||||||||||||||||||
(Dollars in thousands) | Average Balance | Interest(1) | Yields and Rates(1) | Average Balance | Interest(1) | Yields and Rates(1) | Average Balance | Interest | Yields and Rates (bps) | |||||||||||||||||||||||
Assets: | ||||||||||||||||||||||||||||||||
Federal Home Loan Bank and Federal Reserve Bank stocks | $ | 89,774 | $ | 3,618 | 4.03 | % | $ | 81,928 | $ | 2,126 | 2.60 | % | $ | 7,846 | $ | 1,492 | 143 | |||||||||||||||
Investment securities held-to-maturity | 154,619 | 3,970 | 2.57 | 170,006 | 4,436 | 2.61 | (15,387 | ) | (466 | ) | (4 | ) | ||||||||||||||||||||
Investment securities available-for-sale: | ||||||||||||||||||||||||||||||||
Taxable | 1,390,016 | 37,436 | 2.69 | 823,526 | 18,382 | 2.23 | 566,490 | 19,054 | 46 | |||||||||||||||||||||||
Tax-exempt(2) | 815,540 | 21,694 | 2.66 | 712,530 | 22,916 | 3.22 | 103,010 | (1,222 | ) | (56 | ) | |||||||||||||||||||||
Loans and leases held-for-sale | 103,240 | 6,686 | 6.48 | 208,678 | 16,612 | 7.96 | (105,438 | ) | (9,926 | ) | (148 | ) | ||||||||||||||||||||
Loans and leases(2)(3) | 18,827,047 | 1,085,948 | 5.75 | 18,492,068 | 973,450 | 5.25 | 334,979 | 112,498 | 50 | |||||||||||||||||||||||
Interest-bearing deposits with banks and other | 229,698 | 8,346 | 3.63 | 200,579 | 8,365 | 4.17 | 29,119 | (19 | ) | (54 | ) | |||||||||||||||||||||
Total interest-earning assets | 21,609,934 | 1,167,698 | 5.39 | 20,689,315 | 1,046,287 | 5.05 | 920,619 | 121,411 | 34 | |||||||||||||||||||||||
Other assets | 1,452,214 | 1,362,652 | 89,562 | |||||||||||||||||||||||||||||
Total assets | $ | 23,062,148 | $ | 22,051,967 | $ | 1,010,181 | ||||||||||||||||||||||||||
Liabilities and Equity: | ||||||||||||||||||||||||||||||||
Noninterest-bearing deposits | $ | 3,843,494 | $ | 3,492,233 | $ | 351,261 | ||||||||||||||||||||||||||
Interest-bearing deposits: | ||||||||||||||||||||||||||||||||
Checking | 2,438,040 | 714 | 0.03 | 2,541,407 | 379 | 0.01 | (103,367 | ) | 335 | 2 | ||||||||||||||||||||||
Savings | 5,621,723 | 20,009 | 0.36 | 4,888,280 | 4,255 | 0.09 | 733,443 | 15,754 | 27 | |||||||||||||||||||||||
Money market | 1,553,255 | 11,582 | 0.75 | 2,140,553 | 10,139 | 0.47 | (587,298 | ) | 1,443 | 28 | ||||||||||||||||||||||
Certificates of deposit | 4,897,937 | 75,385 | 1.54 | 4,495,062 | 51,691 | 1.15 | 402,875 | 23,694 | 39 | |||||||||||||||||||||||
Total interest-bearing deposits | 14,510,955 | 107,690 | 0.74 | 14,065,302 | 66,464 | 0.47 | 445,653 | 41,226 | 27 | |||||||||||||||||||||||
Total deposits | 18,354,449 | 107,690 | 0.59 | 17,557,535 | 66,464 | 0.38 | 796,914 | 41,226 | 21 | |||||||||||||||||||||||
Borrowings: | ||||||||||||||||||||||||||||||||
Short-term borrowings | 3,288 | 77 | 2.33 | 5,267 | 58 | 1.09 | (1,979 | ) | 19 | 124 | ||||||||||||||||||||||
Long-term borrowings | 1,412,186 | 43,067 | 3.03 | 1,239,433 | 27,749 | 2.23 | 172,753 | 15,318 | 80 | |||||||||||||||||||||||
Total borrowings | 1,415,474 | 43,144 | 3.02 | 1,244,700 | 27,807 | 2.22 | 170,774 | 15,337 | 80 | |||||||||||||||||||||||
Total interest-bearing liabilities | 15,926,429 | 150,834 | 0.94 | 15,310,002 | 94,271 | 0.61 | 616,427 | 56,563 | 33 | |||||||||||||||||||||||
Total deposits and borrowings | 19,769,923 | 150,834 | 0.76 | 18,802,235 | 94,271 | 0.50 | 967,688 | 56,563 | 26 | |||||||||||||||||||||||
Accrued expenses and other liabilities | 761,723 | 713,794 | 47,929 | |||||||||||||||||||||||||||||
Total liabilities | 20,531,646 | 19,516,029 | 1,015,617 | |||||||||||||||||||||||||||||
Total TCF Financial Corp. shareholders' equity | 2,506,179 | 2,513,424 | (7,245 | ) | ||||||||||||||||||||||||||||
Non-controlling interest in subsidiaries | 24,323 | 22,514 | 1,809 | |||||||||||||||||||||||||||||
Total equity | 2,530,502 | 2,535,938 | (5,436 | ) | ||||||||||||||||||||||||||||
Total liabilities and equity | $ | 23,062,148 | $ | 22,051,967 | $ | 1,010,181 | ||||||||||||||||||||||||||
Net interest spread (FTE) | 4.63 | 4.55 | 8 | |||||||||||||||||||||||||||||
Net interest income (FTE) and net interest margin (FTE) | $ | 1,016,864 | 4.69 | $ | 952,016 | 4.59 | $ | 64,848 | 10 | |||||||||||||||||||||||
Reconciliation to Reported Net Interest Income | ||||||||||||||||||||||||||||||||
Net interest income (FTE) | $ | 1,016,864 | $ | 952,016 | $ | 64,848 | ||||||||||||||||||||||||||
Adjustments for taxable equivalent interest(1)(3) | ||||||||||||||||||||||||||||||||
Loans | (3,813 | ) | (6,522 | ) | 2,709 | |||||||||||||||||||||||||||
Tax-exempt investment securities | (4,556 | ) | (8,020 | ) | 3,464 | |||||||||||||||||||||||||||
Total FTE adjustments | (8,369 | ) | (14,542 | ) | 6,173 | |||||||||||||||||||||||||||
Net interest income (GAAP) | $ | 1,008,495 | $ | 937,474 | $ | 71,021 | ||||||||||||||||||||||||||
Net interest margin (GAAP) | 4.66 | % | 4.52 | % | 14 | |||||||||||||||||||||||||||
(1) | Interest and yields are presented on a FTE basis. |
(2) | The yield on tax-exempt loans, leases and available-for-sale investment securities is computed on a FTE basis using a statutory federal income tax rate of 21% in 2018 and 35% for 2017. The presentation of net interest income on a FTE basis is not in accordance with GAAP, but is customary in the banking industry. |
(3) | Average balances of loans and leases include nonaccrual loans and leases and are presented net of unearned income. |
42
Volume and Rate Variance Analysis
Year Ended December 31, 2019 vs. 2018 | Year Ended December 31, 2018 vs. 2017 | ||||||||||||||||||||||
Increase (Decrease) Due to Changes in | Increase (Decrease) Due to Changes in | ||||||||||||||||||||||
(Dollars in thousands) | Average Volume(1) | Average Yield/Rate(1) | Total Change | Average Volume(1) | Average Yield/Rate(1) | Total Change | |||||||||||||||||
Changes in Interest Income on Interest-Earning Assets: | |||||||||||||||||||||||
Federal Home Loan Bank and Federal Reserve Bank stocks | $ | 3,699 | $ | (1,287 | ) | $ | 2,412 | $ | 220 | $ | 1,272 | $ | 1,492 | ||||||||||
Investment securities held-to-maturity | (251 | ) | (769 | ) | (1,020 | ) | (396 | ) | (70 | ) | (466 | ) | |||||||||||
Investment securities available-for-sale: | |||||||||||||||||||||||
Taxable | 62,055 | 3,586 | 65,641 | 14,654 | 4,400 | 19,054 | |||||||||||||||||
Tax-exempt | (7,450 | ) | 502 | (6,948 | ) | 3,052 | (4,274 | ) | (1,222 | ) | |||||||||||||
Loans and leases held-for-sale | 13,023 | (1,110 | ) | 11,913 | (7,250 | ) | (2,676 | ) | (9,926 | ) | |||||||||||||
Loans and leases | 377,736 | (27,708 | ) | 350,028 | 17,936 | 94,562 | 112,498 | ||||||||||||||||
Interest-bearing deposits with banks and other | 8,746 | (2,766 | ) | 5,980 | 1,132 | (1,151 | ) | (19 | ) | ||||||||||||||
Total interest-earning assets | $ | 457,558 | $ | (29,552 | ) | $ | 428,006 | $ | 29,348 | $ | 92,063 | $ | 121,411 | ||||||||||
Changes in Interest Expense on Interest-Bearing Liabilities: | |||||||||||||||||||||||
Interest-bearing deposits: | |||||||||||||||||||||||
Checking | $ | 684 | $ | 12,563 | $ | 13,247 | $ | (16 | ) | $ | 351 | $ | 335 | ||||||||||
Savings | 6,877 | 25,201 | 32,078 | 730 | 15,024 | 15,754 | |||||||||||||||||
Money market | 12,275 | 13,758 | 26,033 | (3,298 | ) | 4,741 | 1,443 | ||||||||||||||||
Certificates of deposit | 20,769 | 26,340 | 47,109 | 4,967 | 18,727 | 23,694 | |||||||||||||||||
Interest-bearing deposits | 40,605 | 77,862 | 118,467 | 2,383 | 38,843 | 41,226 | |||||||||||||||||
Short-term borrowings | 20,791 | (32 | ) | 20,759 | (28 | ) | 47 | 19 | |||||||||||||||
Long-term borrowings | 5,721 | 2,448 | 8,169 | 4,286 | 11,032 | 15,318 | |||||||||||||||||
Total interest-bearing liabilities | $ | 67,117 | $ | 80,278 | $ | 147,395 | $ | 6,641 | $ | 49,922 | $ | 56,563 | |||||||||||
Total change in net interest income (FTE)(2) | $ | 390,441 | $ | (109,830 | ) | $ | 280,611 | $ | 22,707 | $ | 42,141 | $ | 64,848 | ||||||||||
(1) | Changes attributable to the combined impact of volume and rate have been allocated proportionately to the change due to volume and the change due to rate. |
(2) | Computed on a FTE basis using a federal income tax rate of 21% for both 2019 and 2018 and 35% in 2017. The presentation of net interest income on a FTE basis is not in accordance with GAAP, but is customary in the banking industry. |
Provision for Credit Losses The provision for credit losses was $65.3 million for 2019, compared with $46.8 million for 2018 and $68.4 million for 2017. The increase in 2019, compared to 2018, was primarily due to an increase in originated loan growth driven by increased activity in the loan and lease portfolio as a result of the Merger, and to a lesser extent, an increase in commercial and industrial net charge-offs, primarily due to one loan relationship, and a decrease in recoveries on previous charge-offs related to sales of consumer nonaccrual and TDR loans. The decrease in provision for credit losses in 2018, compared to 2017, was primarily due to run-off and maturation of the auto finance portfolio, partially offset by a decrease in recoveries on previous charge-offs related to consumer nonaccrual loan sales. The recoveries on previous charge-offs related to consumer nonaccrual and TDR loan sales were $4.7 million in 2019, compared to $6.6 million for 2018 and $13.3 million for 2017.
The provision for credit losses is predominantly a function of our reserving methodology used to determine the appropriate level of the allowance for loan and lease losses, which is a critical accounting estimate.
For further information, see "Consolidated Financial Condition Analysis — Credit Quality" in this Management's Discussion and Analysis and "Note 8. Allowance for Loan and Lease Losses and Credit Quality" of Notes to Consolidated Financial Statements.
43
Noninterest Income The components of noninterest income were as follows:
Year Ended December 31, | Change | ||||||||||||||||
(Dollars in thousands) | 2019 | 2018 | 2017 | 2019 / 2018 | 2018 / 2017 | ||||||||||||
Leasing revenue | $ | 163,718 | $ | 172,603 | $ | 134,460 | (5.1 | ) | 28.4 | ||||||||
Fees and service charges on deposit accounts | 127,860 | 113,242 | 115,567 | 12.9 | (2.0 | ) | |||||||||||
Card and ATM revenue | 87,221 | 78,406 | 75,165 | 11.2 | 4.3 | ||||||||||||
Net gains on sales of loans and leases | 26,308 | 33,695 | 45,318 | (21.9 | ) | (25.6 | ) | ||||||||||
Servicing fee revenue | 20,776 | 27,334 | 41,347 | (24.0 | ) | (33.9 | ) | ||||||||||
Wealth management revenue | 10,413 | — | — | N.M. | — | ||||||||||||
Net gains on investment securities | 7,425 | 348 | 237 | N.M. | 46.8 | ||||||||||||
Other | 21,811 | 28,769 | 23,969 | (24.2 | ) | 20.0 | |||||||||||
Total noninterest income | $ | 465,532 | $ | 454,397 | $ | 436,063 | 2.5 | 4.2 | |||||||||
Total noninterest income as a percentage of total revenue | 26.5 | % | 31.1 | % | 31.8 | % | |||||||||||
N.M. Not Meaningful
Noninterest income was $465.5 million for 2019, compared to $454.4 million for 2018 and $436.1 million for 2017. Following the Merger, we repositioned our balance sheet to lower our risk profile, reduce asset sensitivity and enhance capital and efficiency. As a result, noninterest income included the following balance sheet repositioning actions considered to be notable items in the year ended December 31, 2019: a $27.5 million loss related to the sale of the Legacy TCF auto finance portfolio (net gains on sales of loans and leases), a $17.3 million loss related to the termination of interest rate swaps (other noninterest income), and a gain of $5.8 million related to the sale of $1.6 billion of certain investment securities (net gains on investment securities). Noninterest income for the year ended December 31, 2019 also included $3.9 million of loan servicing rights impairment (other noninterest income), also considered a notable item. Adjusted noninterest income, a non-GAAP financial measure that excludes the identified notable items, was $508.3 million for 2019, compared to $454.4 million for 2018 and $436.1 million for 2017. See "Non-GAAP Financial Measures" in this Management's Discussion and Analysis for further information.
Leasing revenue Leasing revenue was $163.7 million for 2019, compared with $172.6 million for 2018 and $134.5 million for 2017. Leasing revenue is impacted by changes in our operating lease revenue and sales-type lease revenue through our equipment financing activity.
Fees and service charges on deposit accounts Fees and service charges on deposit accounts were $127.9 million for 2019, compared with $113.2 million for 2018 and $115.6 million for 2017. The increase in 2019, compared to 2018, was primarily attributable to incremental fees resulting from the Merger.
Card and ATM revenue Card and ATM revenue was $87.2 million for 2019, compared with $78.4 million for 2018 and $75.2 million for 2017. The increase in 2019, compared to 2018, was primarily due to incremental revenue resulting from the Merger.
Net gains on sales of loans and leases Net gains on sales of loans and leases were $26.3 million for 2019, compared with $33.7 million for 2018 and $45.3 million for 2017. The decrease in 2019, compared to 2018, was primarily due to the $27.5 million loss related to the sale of the Legacy TCF auto finance portfolio, partially offset by the higher volume of residential mortgage loans sold resulting from the Merger and the recognition of a $3.7 million gain on sale of loans and leases related to a nonaccrual and TDR loan sale. The decrease in 2018 from 2017 was primarily due to the strategic shift executed in 2017 to no longer sell auto finance loans and a decrease in volume of residential mortgage loans sold. We sold $2.9 billion of residential mortgage loans in 2019, compared with $1.2 billion in 2018 and $1.8 billion in 2017.
Servicing fee revenue Servicing fee revenue was $20.8 million for 2019, compared with $27.3 million for 2018 and $41.3 million for 2017. The decrease in 2019, compared to 2018, was primarily due to the continued run-off in the auto finance serviced for others portfolio, partially offset by revenue added as a result of the servicing portfolio acquired in the Merger. The decrease in 2018, compared to 2017, was primarily due to continued run-off in the auto finance serviced for others portfolio.
44
Wealth management Wealth management revenue is comprised of investment fees that are generally based on the market value of assets within a trust account, custodial fees and fees from the sale of investment products. Revenues from wealth management were $10.4 million for year ended December 31, 2019. Wealth management revenues are a new revenue stream as a result of the Merger.
Net gains on investment securities Net gains on investment securities were $7.4 million for 2019, compared to $348 thousand for 2018 and $237 thousand for 2017. The increase in 2019, compared to 2018, was primarily due to $5.8 million of net gains related to the sales of $1.6 billion of investment securities as a result of our balance sheet repositioning following the Merger.
Other Other noninterest income was $21.8 million for 2019, compared to $28.8 million for 2018 and $24.0 million for 2017. The decrease in 2019, compared to 2018, was primarily due to a $17.3 million loss related to the termination of interest rate swaps and the recognition of $3.9 million of loan servicing rights impairment, partially offset by an increase in incremental revenue resulting from the Merger. The increase in 2018, compared to 2017, was primarily due to an increase in interest rate swap income.
Noninterest Expense The components of noninterest expense were as follows:
Year Ended December 31, | Change | |||||||||||||||||
(Dollars in thousands) | 2019 | 2018 | 2017 | 2019 / 2018 | 2018 / 2017 | |||||||||||||
Compensation and employee benefits | $ | 576,922 | $ | 502,196 | $ | 503,618 | 14.9 | % | (0.3 | ) | % | |||||||
Occupancy and equipment | 189,560 | 165,839 | 156,913 | 14.3 | 5.7 | |||||||||||||
Lease financing equipment depreciation | 76,426 | 73,829 | 55,901 | 3.5 | 32.1 | |||||||||||||
Net foreclosed real estate and repossessed assets | 13,523 | 17,050 | 17,756 | (20.7 | ) | (4.0 | ) | |||||||||||
Merger-related expenses | 171,968 | — | — | N.M. | — | |||||||||||||
Other | 303,716 | 255,486 | 325,746 | 18.9 | (21.6 | ) | ||||||||||||
Total noninterest expense | $ | 1,332,115 | $ | 1,014,400 | $ | 1,059,934 | 31.3 | (4.3 | ) | |||||||||
Full-time equivalent staff (at period end) | 7,762 | 5,278 | 5,774 | 47.1 | (8.6 | ) | ||||||||||||
Efficiency ratio | 75.92 | % | 69.34 | % | 77.17 | % | 658 | bps | (783 | ) | bps | |||||||
Adjusted efficiency ratio (non-GAAP)(1) | 60.58 | 64.77 | 69.71 | (419 | ) | (494 | ) | |||||||||||
N.M. Not Meaningful
(1) | See "Consolidated Financial Condition Analysis - Non-GAAP Financial Measures" in this Management's Discussion and Analysis for further information. |
Noninterest expense was $1.3 billion for 2019, compared to $1.0 billion for 2018 and $1.1 billion for 2017. Noninterest expense in 2019 included $172.0 million of merger-related expenses and the following notable items creating fluctuations between periods: $9.4 million of expenses related to the write-down of company-owned vacant land parcels and branch exit costs as we focus on the opportunity in our core markets (other noninterest expense), $4.7 million of expenses related to the sale of the Legacy TCF auto finance portfolio (other noninterest expense $2.2 million, occupancy and equipment $1.5 million and compensation and employee benefits $930 thousand) and $6.3 million of expense related to a pension fair value adjustment on plans with previously announced terminations (other noninterest expense). Noninterest expense for 2018 included one notable item-a $32.0 million charge related to the settlement with the CFPB and the OCC (other noninterest expense), and noninterest expense for 2017 included one notable item-a $73.0 million goodwill impairment charge (other noninterest expense). Adjusted noninterest expense, a non-GAAP financial measure that excludes merger-related expenses and the identified notable items, was $1.1 billion for 2019, compared to $982.4 million for 2018 and $986.9 million for 2017. See "Non-GAAP Financial Measures" in this Management's Discussion and Analysis for further information.
Compensation and employee benefits Compensation and employee benefits expense was $576.9 million for 2019, compared with $502.2 million for 2018 and $503.6 million for 2017. The increase in 2019, compared to 2018, was primarily due to the staff additions resulting from the Merger. In 2019, compensation and employee benefits expense also included $930 thousand of expense related to the sale of the Legacy TCF auto finance portfolio. The decrease in 2018, compared to 2017, was primarily due to lower headcount in the auto finance business and severance expenses recognized during 2017, partially offset by a $7.4 million medical claim in 2018.
45
Occupancy and equipment Occupancy and equipment expense was $189.6 million for 2019, compared with $165.8 million for 2018 and $156.9 million for 2017. The increase in 2019, compared to 2018, was primarily due to the incremental operating costs associated with the Merger in addition to $1.5 million of expense related to the sale of the Legacy TCF auto finance portfolio and a $1.3 million impairment charge recognized on a branch we intend to sell in the future. The increase in 2018, compared to 2017, was primarily due to increased software maintenance expense and software depreciation expense. Depreciation and amortization expense related to premises and equipment was $75.3 million, $48.6 million and $45.9 million for 2019, 2018 and 2017, respectively.
Lease financing equipment depreciation Lease financing equipment depreciation was $76.4 million for 2019, compared with $73.8 million for 2018 and $55.9 million for 2017. The increase in both 2019, compared to 2018, and 2018, compared to 2017, was primarily due to an increase in balances of leased equipment.
Net foreclosed real estate and repossessed assets Net foreclosed real estate and repossessed assets expense was $13.5 million for 2019, compared with $17.1 million for 2018 and $17.8 million for 2017. The decrease in 2019, compared to 2018, was primarily due to a reduction in gains on sales of repossessed assets.
Merger-related expenses Merger-related expenses were $172.0 million for 2019 related to the Merger and consisted primarily of professional fees and employment related expenses. We had no merger-related expense in 2018 or 2017.
Other noninterest expense Other noninterest expense was $303.7 million for 2019, compared with $255.5 million for 2018 and $325.7 million for 2017. The increase in 2019, compared to 2018, was primarily due incremental costs associated with the Merger and notable items including: $9.4 million of expense related to write-downs of company-owned vacant land parcels and branch exit costs, $6.3 million of expense related to pension fair value adjustments on plans with previously announced terminations and $2.2 million of expense related to the sale of the Legacy TCF auto finance portfolio. Other noninterest expense for 2019 also included a $4.0 million impairment, or $3.2 million after tax, of historic tax credits placed into service, which was more than offset by $3.6 million of income tax benefit related to the same tax credit. The decrease in 2018, compared to 2017, was primarily due to charges related to the discontinuation of auto finance loan originations in 2017, including an impairment of goodwill, and loan and lease processing expense and charitable contributions, partially offset by the settlement with the CFPB and the OCC of $32.0 million, including related expenses. See "Note 26. Other Noninterest Expense" of Notes to Consolidated Financial Statements for further information.
Income Taxes Income tax expense was $50.2 million for 2019, compared with income tax expense of $86.1 million for 2018 and income tax benefit of $33.6 million for 2017. Income tax expense was 14.1% of income before income taxes for 2019, compared to 21.4% for 2018. The decrease in income tax expense in 2019, compared to 2018, was primarily due to the inclusion of $11.8 million of tax basis adjustment benefits, a $5.7 million benefit provided by the repricing of our net deferred tax position in connection with the completion of the Merger and a $3.6 million income tax benefit related to federal historic tax credits. The increase in income tax expense in 2018, compared to 2017, was primarily due to the estimated net tax benefit of $130.7 million in 2017 resulting from the re-measurement of our estimated net deferred tax liability as a result of the enactment of Tax Reform, partially offset by the change in the corporate statutory tax rate as a result of Tax Reform. The remaining fluctuations in our effective income tax rate reflect changes each period in the proportion of interest income exempt from federal taxation, nondeductible transaction costs and other nondeductible expenses relative to pretax income and tax credits. See "Note 3. Summary of Significant Accounting Policies" and "Note 16. Income Taxes" of Notes to Consolidated Financial Statements for further information.
Reportable Segment Results In connection with the Merger, effective August 1, 2019, we renamed our Wholesale Banking segment to Commercial Banking to align with the way we are now managed. In addition, activity that was related to small business banking and private banking were moved from the Commercial Banking segment to the Consumer Banking segment. The revised presentation of previously reported segment data has been applied retroactively to all periods presented in these financial statements. Our reportable segments are Consumer Banking, Commercial Banking and Enterprise Services. See "Note 27. Reportable Segments" of Notes to Consolidated Financial Statements for further information regarding net income (loss), revenues and assets for each of our reportable segments.
46
Consumer Banking
Consumer Banking generated net income available to common shareholders of $141.7 million for 2019, compared with $105.7 million for 2018 and $23.6 million for 2017. The increase in 2019, compared to 2018, was primarily due to the incremental income resulting from the Merger and the 2018 expense associated with the settlement with the CFPB and the OCC of $32.0 million. The increase in 2018, compared to 2017, was primarily due to a reduction in noninterest expense as the settlement with the CFPB and the OCC of $32.0 million in 2018 was more than offset by the $73.0 million goodwill impairment recognized in 2017 and a reduction in provision for credit losses.
Consumer Banking net interest income was $676.6 million for 2019, compared with $569.2 million for 2018 and $586.3 million for 2017. Consumer Banking net interest income was 52.5% of our total net interest income for 2019, compared with 56.4% for 2018 and 62.5% for 2017. The increase in net interest income in 2019, compared to 2018, was primarily attributable to the impact of the loans acquired in the Merger, partially offset by the deposits acquired in the Merger. The decrease in net interest income in 2018, compared to 2017, was primarily due to lower average balances of auto finance loans, increased interest expense on deposits and decreased interest income on the fixed-rate consumer loans, partially offset by increased interest income on the variable- and adjustable-rate consumer loans, higher net funds transfer pricing credits and lower interest expense on inter-company borrowings.
Consumer Banking provision for credit losses was $16.6 million for 2019, compared with $24.7 million for 2018 and $49.7 million for 2017. The decrease in 2019, compared to 2018, was primarily due to the sale of the Legacy TCF auto finance portfolio and a decrease in recoveries on previous charge-offs related to consumer nonaccrual and TDR loan sales, partially offset by an increase in loan originations as a result of the Merger. The decrease in 2018, compared to 2017, was primarily due to run-off in and maturation of the auto finance portfolio, partially offset by a decrease in recoveries on previous charge-offs related to the consumer nonaccrual loan sales. The recoveries on previous charge-offs related to the consumer real estate nonaccrual and TDR loan sales were $4.7 million in 2019, compared to $6.6 million for 2018 and $13.3 million for 2017. The provision for credit losses is predominantly a function of our reserving methodology used to determine the appropriate level of the allowance for loan and lease losses. For further information, see "Consolidated Income Statement Analysis — Provision for Credit Losses" and "Consolidated Financial Condition Analysis — Credit Quality" in this Management's Discussion and Analysis and "Note 8. Allowance for Loan and Lease Losses and Credit Quality" of Notes to Consolidated Financial Statements.
Consumer Banking noninterest income was $273.9 million for 2019, compared with $262.8 million for 2018 and $285.2 million for 2017. Consumer Banking noninterest income was 58.8% of our total noninterest income for 2019, compared with 57.8% for 2018 and 65.4% for 2017. The increase in noninterest income in 2019, compared to 2018, was primarily due to the addition of incremental revenue resulting from the Merger and a $3.7 million gain on sale of loans and leases related to a nonaccrual and TDR loan sale, partially offset by a $27.5 million loss related to the sale of the Legacy TCF auto finance portfolio and $3.9 million of impairment recognized on loan servicing rights. The decrease in 2018, compared to 2017, was primarily due to a decrease in servicing fee revenue due to continued run-off in the auto finance serviced for others portfolio and decreased gains on sales of loans primarily due to the strategic shift executed in 2017 to no longer sell auto finance loans and decreased volume of consumer loans sold. Servicing fee revenue attributable to the Consumer Banking segment was $19.7 million for 2019, compared with $26.0 million for 2018 and $40.0 million for 2017. Average Consumer Banking loans serviced for others were $4.2 billion for 2019, compared with $3.6 billion for 2018 and $4.8 billion for 2017.
Consumer Banking noninterest expense was $753.9 million for 2019, compared with $670.0 million for 2018 and $748.3 million for 2017. The increase in 2019, compared to 2018, was primarily due to the addition of incremental operating costs resulting from the Merger, $9.4 million of expense related to the write-down of company-owned vacant land parcels and branch exit costs, $4.7 million of expense related to the sale of the Legacy TCF auto finance portfolio and a $1.3 million impairment charge recognized on a branch we intend to sell in the future. The decrease in 2018, compared to 2017, was primarily due to the $73.0 million goodwill impairment recognized in 2017, a decrease in compensation and employee benefits expense as a result of lower headcount in the auto finance business and a decrease in loan processing expense, partially offset by the expense associated with the settlement with the CFPB and the OCC of $32.0 million.
47
Commercial Banking
Commercial Banking generated net income available to common shareholders of $240.9 million for 2019, compared with $178.7 million for 2018 and $277.9 million for 2017. The increase in 2019, compared to 2018, was primarily due to the incremental income resulting from the Merger. The decrease in 2018, compared to 2017, was primarily due to the income tax benefit in 2017 primarily resulting from the re-measurement of our estimated net deferred tax liability as a result of the enactment of Tax Reform.
Commercial Banking net interest income was $536.2 million for 2019, compared with $383.0 million for 2018 and $359.8 million for 2017. Commercial Banking net interest income was 41.6% of our total net interest income for 2019, compared with 38.0% for 2018 and 38.4% for 2017. The increase in net interest income in 2019, compared to 2018, was primarily due to the net impact of the loans and deposits acquired in the Merger. The increase in 2018, compared to 2017, was primarily due to increased interest income on the variable- and adjustable-rate commercial loan portfolios, partially offset by an increase in net funds transfer pricing charges and higher interest expense on inter-company borrowings driven by increases in interest rates and higher average balances of loans and leases.
Commercial Banking provision for credit losses was $48.7 million for 2019, compared with $22.1 million for 2018 and $18.8 million for 2017. The increase in 2019, compared to 2018, was primarily due to the increase in originated loan growth as a result of the Merger and an increase in commercial and industrial net charge-offs, primarily resulting from one loan relationship. The provision for credit losses is predominantly a function of our reserving methodology used to determine the appropriate level of the allowance for loan and lease losses. For further information, see "Consolidated Income Statement Analysis — Provision for Credit Losses" and "Consolidated Financial Condition Analysis — Credit Quality" in this Management's Discussion and Analysis and "Note 8. Allowance for Loan and Lease Losses and Credit Quality" of Notes to Consolidated Financial Statements.
Commercial Banking noninterest income was $198.9 million for 2019, compared with $190.4 million for 2018 and $150.5 million for 2017. Commercial Banking noninterest income was 42.7% of our total noninterest income for 2019, compared with 41.9% for 2018 and 34.5% for 2017. The increase in noninterest income for 2019, compared to 2018, was primarily due to incremental revenue resulting from the Merger, partially offset by a decrease in leasing revenue. The increase in 2018, compared to 2017, was primarily due to an increase in leasing revenue. Leasing revenue is impacted by changes in our operating lease revenue and sales-type lease revenue through our equipment financing activity.
Commercial Banking noninterest expense was $383.4 million for 2019, compared with $308.7 million for 2018 and $272.9 million for 2017. The increase in 2019, compared to 2018, was primarily due to an increase in merger-related expenses and other expenses related to the incremental costs added as a result of the Merger. The increase in 2018, compared to 2017, was primarily due to an increase in operating lease depreciation as a result of higher balances of leased equipment, higher allocations of other noninterest expense from the Enterprise Services segment and an increase in compensation and employee benefits expense.
Enterprise Services
Enterprise Services generated net loss available to common shareholders of $97.1 million for 2019, compared with net income available to common shareholders of $4.9 million for 2018 and net loss available to common shareholders of $58.5 million for 2017.
Enterprise Services net interest income was $76.3 million for 2019, compared to net interest income of $56.2 million for 2018 and net interest expense of $8.7 million for 2017. The increase in net interest income in 2019, compared to 2018, was primarily due to the investment securities acquired in the Merger. The increase in net interest income in 2018, compared to 2017, was primarily driven by asset sensitivity of the funds transfer pricing mismatches as a result of rising interest rates, an increase in interest income attributable to higher average balances of investment securities and an increase in interest income on inter-company borrowings, partially offset by an increase in interest expense on deposits.
48
Enterprise Services noninterest expense was $194.8 million for 2019, compared with $35.7 million for 2018 and $38.8 million for 2017. The increase in 2019, compared to 2018, was primarily due to an increase in merger-related expenses and other incremental expenses resulting from the Merger. The decrease in 2018, compared to 2017, was primarily due to higher allocations of other noninterest expense to the Consumer Banking and Commercial Banking segments and decreases in professional fees and charitable contributions, partially offset by an increase in compensation and employee benefits expense primarily driven by higher medical claims expense and an increase in occupancy and equipment expense.
Consolidated Financial Condition Analysis
Investment Securities Total investment securities available-for-sale, at fair value, were $6.7 billion at December 31, 2019, compared with $2.5 billion at December 31, 2018. Our investment securities available-for-sale are debt securities consisting primarily of fixed-rate mortgage-backed securities issued by the Federal National Mortgage Association ("FNMA") and the Federal Home Loan Mortgage Corporation ("FHLMC"), and obligations of states and political subdivisions. The increase in investment securities was primarily due to the addition of $3.8 billion of investment securities as a result of the Merger. As a component of our balance sheet repositioning following the close of the Merger, we sold $1.6 billion of investment securities and subsequently reinvested $1.4 billion of these funds in new securities. Our balance sheet repositioning efforts, shift in investment securities held, were targeted at reducing interest and credit risk as well as enhancing capital efficiency and liquidity. We may, from time to time, sell investment securities available-for-sale and utilize the proceeds to reduce borrowings, fund growth in loans and leases or for other corporate purposes. We sold $2.0 billion of investment securities during the year ended 2019 and $251.3 million during the year ended 2018. There were no sales of available-for-sale investment securities during the year ended 2017.
Total investment securities held-to-maturity were $139.4 million at December 31, 2019, compared with $148.9 million at December 31, 2018. Our investment securities held-to-maturity portfolio consists primarily of fixed-rate mortgage-backed securities issued by the FNMA. The decrease in debt securities held to maturity was primarily due to proceeds from maturities of and principal collected on fixed-rate mortgage-backed securities.
The amortized cost and fair value of investment securities available-for-sale and held-to-maturity were as follows:
At December 31, 2019 | At December 31, 2018 | At December 31, 2017 | |||||||||||||||||||||
(In thousands) | Amortized Cost | Fair value | Amortized Cost | Fair value | Amortized Cost | Fair value | |||||||||||||||||
Investment securities available-for-sale | |||||||||||||||||||||||
Debt securities: | |||||||||||||||||||||||
Government and government-sponsored enterprises | $ | 235,045 | $ | 234,385 | $ | — | $ | — | $ | — | $ | — | |||||||||||
Obligations of states and political subdivisions | 852,096 | 863,855 | 566,304 | 556,871 | 810,159 | 814,327 | |||||||||||||||||
Residential mortgage-backed securities | 4,866,473 | 4,929,718 | 1,930,700 | 1,913,194 | 908,195 | 894,691 | |||||||||||||||||
Commercial mortgage-backed securities | 685,212 | 691,613 | — | — | — | — | |||||||||||||||||
Corporate debt and trust preferred securities | 451 | 430 | — | — | — | — | |||||||||||||||||
Total investment securities available-for-sale | $ | 6,639,277 | $ | 6,720,001 | $ | 2,497,004 | $ | 2,470,065 | $ | 1,718,354 | $ | 1,709,018 | |||||||||||
Investment securities held-to-maturity | |||||||||||||||||||||||
Residential mortgage-backed securities | $ | 135,769 | $ | 141,168 | $ | 146,052 | $ | 146,467 | $ | 158,776 | $ | 162,826 | |||||||||||
Corporate debt and trust preferred securities | 3,676 | 3,676 | 2,800 | 2,800 | 2,800 | 2,800 | |||||||||||||||||
Total investment securities held-to-maturity | $ | 139,445 | $ | 144,844 | $ | 148,852 | $ | 149,267 | $ | 161,576 | $ | 165,626 | |||||||||||
Total investment securities | $ | 6,778,722 | $ | 6,864,845 | $ | 2,645,856 | $ | 2,619,332 | $ | 1,879,930 | $ | 1,874,644 | |||||||||||
The carrying value and FTE yield of investment securities available-for-sale and investment securities held-to-maturity by final contractual maturity were as follows. The final contractual maturities do not consider possible prepayments and therefore expected maturities may differ because borrowers may have the right to call or prepay obligations with or without call or prepayment penalties.
49
At December 31, 2019 | |||||||||||||||||||||||||||||||||||||||||
Government and Government-sponsored Enterprises | Obligations of States and Political Subdivisions | Residential mortgage-backed Securities | Commercial mortgage-backed Securities | Corporate Debt And Trust Preferred Securities | Total | ||||||||||||||||||||||||||||||||||||
(Dollars in thousands) | Amount | Yield (1) | Amount | Yield (1) | Amount | Yield (1) | Amount | Yield (1) | Amount | Yield (1) | Amount | Yield (1) | |||||||||||||||||||||||||||||
Investment securities available-for-sale | |||||||||||||||||||||||||||||||||||||||||
Due in one year or less | $ | — | — | % | $ | 66,112 | 2.16 | % | $ | — | — | % | $ | — | — | % | $ | — | — | % | $ | 66,112 | 2.16 | % | |||||||||||||||||
Due in 1-5 years | — | — | 166,252 | 2.64 | 22,762 | 1.89 | 3,051 | 1.77 | — | — | 192,065 | 2.51 | |||||||||||||||||||||||||||||
Due in 5-10 years | 24,666 | 3.11 | 182,658 | 2.79 | 116,199 | 2.02 | 232,000 | 2.69 | — | — | 555,523 | 1.48 | |||||||||||||||||||||||||||||
Due after 10 years | 209,719 | 2.99 | 448,833 | 2.87 | 4,790,757 | 2.93 | 456,562 | 2.69 | 430 | 6.6 | 5,906,301 | 2.70 | |||||||||||||||||||||||||||||
Total | $ | 234,385 | 3.00 | % | $ | 863,855 | 2.75 | % | $ | 4,929,718 | 2.90 | % | $ | 691,613 | 2.69 | % | $ | 430 | 6.60 | % | $ | 6,720,001 | 2.87 | % | |||||||||||||||||
Investment securities held-to-maturity | |||||||||||||||||||||||||||||||||||||||||
Due in 1-5 years | $ | — | — | % | $ | — | — | % | $ | — | — | % | $ | — | — | % | $ | 3,550 | 2.84 | % | $ | 3,550 | 2.84 | % | |||||||||||||||||
Due in 5-10 years | — | — | — | — | 58 | 6.50 | — | — | — | — | 58 | 6.50 | |||||||||||||||||||||||||||||
Due after 10 years | — | — | — | — | 135,711 | 2.47 | — | — | 126 | 6.00 | 135,837 | 2.47 | |||||||||||||||||||||||||||||
Total | $ | — | — | % | $ | — | — | % | $ | 135,769 | 2.47 | % | $ | — | — | % | $ | 3,676 | 2.95 | % | $ | 139,445 | 2.48 | % | |||||||||||||||||
(1) Interest and yields are presented on a FTE basis.
See "Note 6. Investment Securities" of Notes to Consolidated Financial Statements for further information regarding our investment securities available-for-sale and investment securities held-to-maturity.
Loans and Leases Held-for-Sale Our loans and leases held-for-sale were $199.8 million at December 31, 2019, an increase of $109.1 million, compared to $90.7 million at December 31, 2018. The increase was primarily due to the increased activity in the portfolio as a result of the Merger.
Loans and Leases Our commercial loan and lease portfolio is comprised of commercial and industrial loans, commercial real estate loans, and lease financing. Our consumer loan portfolio is comprised of residential mortgages, consumer installment loans and home equity loans and lines of credit. Our lending markets generally consist of communities throughout our primary banking markets including Michigan, Minnesota, Illinois, Ohio, Colorado and Wisconsin and additionally include Florida, Texas and California.
Total loans and leases were $34.5 billion at December 31, 2019, an increase of $15.4 billion, or 81%, compared to $19.1 billion at December 31, 2018. The increase was primarily due to $15.7 billion of loans and leases acquired in the Merger and originated growth in the commercial loan and lease portfolio, partially offset by the sale of the $1.1 billion Legacy TCF auto finance portfolio.
50
Information about our loans and leases was as follows:
Compound Annual | |||||||||||||||||||||||||
Growth Rate | |||||||||||||||||||||||||
At December 31, | 1-Year | 5-Year | |||||||||||||||||||||||
(Dollars in thousands) | 2019 | 2018 | 2017 | 2016 | 2015 | 2019 / 2018 | 2019 / 2015 | ||||||||||||||||||
Commercial loan and lease portfolio: | |||||||||||||||||||||||||
Commercial and industrial | $ | 11,439,602 | $ | 6,298,240 | $ | 5,920,423 | $ | 5,180,864 | $ | 4,647,038 | 81.6 | % | 19.7 | % | |||||||||||
Commercial real estate | 9,136,870 | 2,830,705 | 2,681,827 | 2,593,409 | 2,555,965 | 222.8 | 29.0 | ||||||||||||||||||
Lease financing | 2,699,869 | 2,530,163 | 2,461,182 | 2,319,579 | 2,102,576 | 6.7 | 5.1 | ||||||||||||||||||
Total commercial loan and lease portfolio | 23,276,341 | 11,659,108 | 11,063,432 | 10,093,852 | 9,305,579 | 99.6 | 20.1 | ||||||||||||||||||
Consumer loan portfolio: | |||||||||||||||||||||||||
Residential mortgage | 6,179,805 | 2,335,835 | 1,826,988 | 2,131,839 | 2,442,012 | 164.6 | 20.4 | ||||||||||||||||||
Consumer installment | 1,542,411 | 2,003,572 | 3,222,156 | 2,666,511 | 2,666,892 | (23.0 | ) | (10.4 | ) | ||||||||||||||||
Home equity | 3,498,907 | 3,074,505 | 2,992,708 | 2,952,514 | 3,022,261 | 13.8 | 3.0 | ||||||||||||||||||
Total consumer loan portfolio | 11,221,123 | 7,413,912 | 8,041,852 | 7,750,864 | 8,131,165 | 51.4 | 6.7 | ||||||||||||||||||
Total loans and leases | $ | 34,497,464 | $ | 19,073,020 | $ | 19,105,284 | $ | 17,844,716 | $ | 17,436,744 | 80.9 | 14.6 | |||||||||||||
The contractual maturities of loans and leases outstanding were as follows:
At December 31, 2019(1) | |||||||||||||||||||||||||||
(in thousands) | Commercial and industrial | Commercial real estate | Lease Financing | Residential mortgage | Consumer installment | Home equity | Total | ||||||||||||||||||||
Amounts due: | |||||||||||||||||||||||||||
Within 1 year | $ | 7,634,565 | 4,137,502 | $ | 922,997 | $ | 408,948 | $ | 84,900 | $ | 391,181 | $ | 13,580,093 | ||||||||||||||
1 to 5 years | 3,413,955 | 3,701,557 | 1,715,310 | 1,268,764 | 594,720 | 271,556 | 10,965,862 | ||||||||||||||||||||
Over 5 years | 391,082 | 1,297,811 | 61,562 | 4,502,093 | 862,791 | 2,836,170 | 9,951,509 | ||||||||||||||||||||
Total | 11,439,602 | 9,136,870 | 2,699,869 | 6,179,805 | 1,542,411 | 3,498,907 | 34,497,464 | ||||||||||||||||||||
Amounts due after 1 year: | |||||||||||||||||||||||||||
Fixed-rate loans and leases | 3,023,287 | 2,640,985 | 1,774,374 | 2,123,078 | 1,449,193 | 1,622,162 | 12,633,079 | ||||||||||||||||||||
Variable- and adjustable-rate loans and leases | 781,750 | 2,358,383 | 2,498 | 3,647,779 | 8,318 | 1,485,564 | 8,284,292 | ||||||||||||||||||||
Total after 1 year | $ | 3,805,037 | $ | 4,999,368 | $ | 1,776,872 | $ | 5,770,857 | $ | 1,457,511 | 3,107,726 | 20,917,371 | |||||||||||||||
(1) | This table does not include the effect of prepayments, which is an important consideration in management's interest-rate risk analysis. Our experience indicates that loans and leases remain outstanding for significantly shorter periods than their contractual terms. |
Commercial Loan and Lease Portfolio
Our commercial loan and lease portfolio was $23.3 billion at December 31, 2019, an increase of $11.6 billion, or 99.6%, compared to $11.7 billion at December 31, 2018, primarily due to originated growth and the $9.8 billion of commercial loans and leases acquired as a result of the Merger. Our commercial loan and lease portfolio is well diversified across business lines and has no concentration in any one industry.
Commercial and industrial Commercial and industrial loans and lines of credit include loans to varying types of businesses, municipalities, school districts and nonprofit organizations, for the purpose of supporting working capital and operational needs and term financing of equipment. Commercial and industrial loans are secured by various types of business assets including inventory, floorplan equipment, receivables, equipment or financial instruments. Origination levels related to equipment dealers are impacted by the velocity of fundings and repayments with dealers. Commercial and industrial loans were $11.4 billion at December 31, 2019, an increase of $5.1 billion, compared to $6.3 billion at December 31, 2018.
51
Commercial real estate Commercial real estate loans include loans that are secured by real estate occupied by the borrower for ongoing operations, non-owner occupied real estate leased to one or more tenants and construction and development loans primarily originated for construction of commercial properties. Construction and development loans often convert to a commercial real estate loan at the completion of the construction period. Commercial real estate loans are primarily secured by commercial real estate, including multi-family housing, office buildings, health care facilities, warehouse and industrial buildings, hotel and motel buildings, self-storage buildings and retail services buildings. Commercial real estate loans were $9.1 billion at December 31, 2019, an increase of $6.3 billion, compared to $2.8 billion at December 31, 2018.
Lease financing We provide a broad range of comprehensive lease products addressing the diverse financing needs of small to large companies in a growing number of select market segments including specialty vehicles, construction equipment, golf cart and turf equipment, manufacturing equipment, medical equipment, trucks and trailers, furniture and fixtures, technology and data processing equipment and agriculture equipment. Lease financing loans were $2.7 billion at December 31, 2019, an increase of $169.7 million, compared to $2.5 billion at December 31, 2018.
Our lease financing portfolio by equipment type was as follows:
At December 31, | |||||||||||||
2019 | 2018 | ||||||||||||
(Dollars in thousands) | Balance | Percent of Total | Balance | Percent of Total | |||||||||
Specialty vehicles | $ | 585,829 | 21.7 | % | $ | 522,384 | 20.6 | % | |||||
Golf cart and turf equipment | 473,476 | 17.5 | 426,389 | 16.9 | |||||||||
Medical equipment | 377,998 | 14.0 | 306,729 | 12.1 | |||||||||
Technology and data processing equipment | 248,187 | 9.2 | 245,837 | 9.7 | |||||||||
Manufacturing equipment | 226,833 | 8.4 | 278,952 | 11.0 | |||||||||
Construction equipment | 180,963 | 6.7 | 175,429 | 6.9 | |||||||||
Material handling | 138,182 | 5.1 | 79,043 | 3.1 | |||||||||
Agricultural equipment | 92,392 | 3.4 | 92,613 | 3.7 | |||||||||
Trucks and trailers | 91,711 | 3.4 | 85,645 | 3.4 | |||||||||
Other | 284,298 | 10.6 | 317,142 | 12.6 | |||||||||
Total | $ | 2,699,869 | 100.0 | % | $ | 2,530,163 | 100.0 | % | |||||
Consumer Loan Portfolio
Our consumer loan portfolio was $11.2 billion at December 31, 2019, an increase of $3.8 billion, or 51.4%, compared to $7.4 billion at December 31, 2018, primarily due to $5.9 billion of consumer loans acquired as a result of the Merger, partially offset by the sale of the $1.1 billion Legacy TCF auto finance portfolio and the sale of nonaccrual and TDR consumer real estate loans of $82.7 million.
Residential mortgage Residential mortgage loans consist primarily of one- to four-family residential loans with fixed and adjustable interest rates, with amortization periods generally from 15 to 30 years. The loan-to-value ratio at the time of origination is generally 90% or less. Loans with more than an 80% loan-to-value ratio generally require private mortgage insurance. Residential mortgage loans also include loans to consumers for the construction of single family residences that are secured by these properties. Residential mortgage loans were $6.2 billion at December 31, 2019, an increase of $3.8 billion, compared to $2.3 billion at December 31, 2018.
Consumer installment Consumer installment loans consist of relatively small loan amounts to consumers to finance personal items (primarily automobiles, recreational vehicles and marine vehicles) and are comprised primarily of indirect loans purchased from dealerships. Consumer rates are both fixed and variable, with negotiable terms. Our consumer installment loans typically amortize over periods up to 60 months. Consumer loans not secured by real estate are generally considered to have greater risk than first or second mortgages on real estate because they may be unsecured, or, if they are secured, the value of the collateral may be difficult to assess and more likely to decrease in value, and is more difficult to control, than real estate. Consumer installment loans were $1.5 billion at December 31, 2019, a decrease of $461.2 million, compared to $2.0 billion at December 31, 2018.
52
Home equity Home equity loans and lines of credit are comprised of loans to consumers who utilize equity in their personal residence, including junior lien mortgages, as collateral to secure the loan or line-of-credit. Our home equity portfolio totaled $3.5 billion at December 31, 2019 (consisting of $3.0 billion of home equity lines of credit and $474.7 million of amortizing home equity loans), an increase of $424.4 million, compared to $3.1 billion at December 31, 2018 (consisting of $2.9 billion of home equity lines of credit and $164.8 million of amortizing home equity loans). At December 31, 2019, $2.3 billion of our home equity lines of credit were comprised of loans with a 10-year interest-only draw period and a 20-year amortization repayment period. These home equity lines of credit include junior lien mortgages where the first lien mortgage is held by a nonaffiliated financial institution. At December 31, 2019, all were within the 10-year interest-only draw period and will not convert to amortizing loans until 2021 or later. At December 31, 2019, $677.7 million of the home equity line of credits were interest-only revolving draw loans with no defined amortization period and original draw periods of five to 40 years.
Credit Quality The following summarizes our loan and lease portfolio based on the credit quality factors that we believe are the most important and should be considered to understand the overall condition of the portfolio. The following items should be considered throughout this section:
• | Loans and leases that are over 90-days delinquent and accruing generally are a leading indicator for future charge-off trends. |
• | Nonaccrual loans and leases have been charged down to the estimated fair value of the collateral less estimated selling costs, or reserved for expected loss upon workout. |
• | Within the performing loans and leases, we classify customers within regulatory classification guidelines. Loans and leases that are "classified" are loans or leases that management has concerns regarding the ability of the borrowers to meet existing loan or lease terms and conditions, but may never become nonaccrual or result in a loss. |
Past due loans and leases Over 90-day delinquent loans and leases by type, excluding nonaccrual loans and leases, were as follows. Delinquent balances are determined based on the contractual terms of the loan or lease. See "Note 8. Allowance for Loan and Lease Losses and Credit Quality" of Notes to Consolidated Financial Statements for further information.
90 Days or More Delinquent and Accruing(1) | Percentage of Period-end Loans and Leases | |||||||||||||||||||||||||||||||||
At December 31, | ||||||||||||||||||||||||||||||||||
(Dollars in thousands) | 2019 | 2018 | 2017 | 2016 | 2015 | 2019 | 2018 | 2017 | 2016 | 2015 | ||||||||||||||||||||||||
Commercial loan and lease portfolio: | ||||||||||||||||||||||||||||||||||
Commercial and industrial | $ | 331 | $ | 760 | $ | 1,216 | $ | 75 | $ | 48 | — | % | 0.01 | % | 0.02 | % | — | % | — | % | ||||||||||||||
Commercial real estate | 1,440 | — | — | — | — | 0.02 | — | — | — | — | ||||||||||||||||||||||||
Lease financing | 1,901 | 1,882 | 918 | 1,009 | 547 | 0.07 | 0.07 | 0.04 | 0.04 | 0.03 | ||||||||||||||||||||||||
Total commercial loan and lease portfolio | 3,672 | 2,642 | 2,134 | 1,084 | 595 | 0.02 | 0.02 | 0.02 | 0.01 | 0.01 | ||||||||||||||||||||||||
Consumer loan portfolio: | ||||||||||||||||||||||||||||||||||
Residential mortgage | 559 | 1,275 | 593 | 2,144 | 2,917 | 0.01 | 0.06 | 0.03 | 0.11 | 0.13 | ||||||||||||||||||||||||
Consumer installment | 108 | 3,349 | 3,005 | 2,323 | 1,237 | 0.01 | 0.17 | 0.09 | 0.09 | 0.05 | ||||||||||||||||||||||||
Home equity | — | — | — | — | 37 | — | — | — | — | — | ||||||||||||||||||||||||
Total consumer loan portfolio | 667 | 4,624 | 3,598 | 4,467 | 4,191 | 0.01 | 0.06 | 0.05 | 0.06 | 0.05 | ||||||||||||||||||||||||
Portfolios acquired with deteriorated credit quality | 25,737 | 178 | 1,200 | — | — | 10.43 | 4.65 | 10.13 | — | — | ||||||||||||||||||||||||
Total | $ | 30,076 | $ | 7,444 | $ | 6,932 | $ | 5,551 | $ | 4,786 | 0.09 | % | 0.04 | % | 0.04 | % | 0.03 | % | 0.03 | % | ||||||||||||||
(1) | Excludes nonaccrual loans and leases |
53
Nonperforming assets Nonperforming assets, consisting of nonaccrual loans and leases and other real estate owned, were as follows:
At December 31, | |||||||||||||||||||
(Dollars in thousands) | 2019 | 2018 | 2017 | 2016 | 2015 | ||||||||||||||
Commercial loan and lease portfolio: | |||||||||||||||||||
Commercial and industrial | $ | 53,812 | $ | 26,061 | $ | 10,958 | $ | 10,587 | $ | 9,039 | |||||||||
Commercial real estate | 29,735 | 4,518 | 6,785 | 5,564 | 6,739 | ||||||||||||||
Lease financing | 10,957 | 7,993 | 10,247 | 5,782 | 6,907 | ||||||||||||||
Total commercial loan and lease portfolio | 94,504 | 38,572 | 27,990 | 21,933 | 22,685 | ||||||||||||||
Consumer loan portfolio: | |||||||||||||||||||
Residential mortgage | 38,577 | 33,111 | 61,951 | 106,124 | 124,156 | ||||||||||||||
Consumer installment | 714 | 8,581 | 7,367 | 7,042 | 9,511 | ||||||||||||||
Home equity | 35,863 | 25,654 | 21,274 | 46,346 | 44,114 | ||||||||||||||
Total consumer loan portfolio | 75,154 | 67,346 | 90,592 | 159,512 | 177,781 | ||||||||||||||
Total nonaccrual loans and leases | 169,658 | 105,918 | 118,582 | 181,445 | 200,466 | ||||||||||||||
Other real estate owned | 34,256 | 17,403 | 18,225 | 46,797 | 49,982 | ||||||||||||||
Total nonperforming assets | $ | 203,914 | $ | 123,321 | $ | 136,807 | $ | 228,242 | $ | 250,448 | |||||||||
Nonaccrual loans and leases as a percentage of total loans and leases | 0.49 | % | 0.56 | % | 0.62 | % | 1.02 | % | 1.15 | % | |||||||||
Nonperforming assets as a percentage of total loans and leases and other real estate owned | 0.59 | 0.65 | 0.72 | 1.28 | 1.43 | ||||||||||||||
Allowance for loan and lease losses as a percentage of nonaccrual loans and leases | 66.64 | 148.65 | 144.24 | 88.33 | 77.85 | ||||||||||||||
Nonperforming assets were $203.9 million at December 31, 2019, compared with $123.3 million at December 31, 2018. The increase was primarily due to loans acquired in the Merger, partially offset by the sale of $17.3 million of nonaccrual consumer loans. See "Note 3. Summary of Significant Accounting Policies" and "Note 8. Allowance for Loan and Lease Losses and Credit Quality" of Notes to Consolidated Financial Statements for further information.
Loans and leases are generally placed on nonaccrual status when the collection of interest or principal is 90 days or more past due unless, in the case of commercial loans, they are well secured and in process of collection. Delinquent consumer home equity loans with a junior lien are also placed on nonaccrual status when there is evidence that the related third-party first lien mortgage may be 90 days or more past due, or foreclosure, charge-off or collection action has been initiated. TDR loans are placed on nonaccrual status prior to the past due thresholds outlined above if repayment under the modified terms is not likely after performing a well-documented credit analysis. Loans on nonaccrual status are generally reported as nonaccrual loans until there is sustained repayment performance for six consecutive months, with the exception of loans not reaffirmed upon discharge in Chapter 7 bankruptcy, which remain on nonaccrual status until a well-documented credit analysis indicates full repayment of the remaining pre-discharged contractual principal and interest is likely. We do not classify purchase credit impaired ("PCI") loans as nonaccrual loans because these loans are recorded at their net realizable value based on the principal and interest expected to be collected on the loans.
The majority of our nonaccrual loans are secured by real estate. Given the nature of these assets and the related mortgage foreclosure, property sale and, if applicable, mortgage insurance claims processes, it can take 18 months or longer for a loan to migrate from initial delinquency to final disposition. This resolution process generally takes much longer for loans secured by real estate than for unsecured loans or loans secured by other property primarily due to state real estate foreclosure laws.
54
Changes in the amount of nonaccrual loans and leases were as follows:
At or For the Year Ended December 31, 2019 | |||||||||||
(in thousands) | Consumer Loan Portfolio | Commercial Loan and Lease Portfolio | Total | ||||||||
Balance, beginning of period | $ | 67,346 | $ | 38,572 | $ | 105,918 | |||||
Acquired in the Merger | 16,414 | 64,830 | 81,244 | ||||||||
Additions | 77,841 | 156,436 | 234,277 | ||||||||
Charge-offs | (9,580 | ) | (36,208 | ) | (45,788 | ) | |||||
Transfers to other assets | (17,126 | ) | (19,779 | ) | (36,905 | ) | |||||
Return to accrual status | (7,770 | ) | (39,356 | ) | (47,126 | ) | |||||
Payments received | (25,126 | ) | (72,979 | ) | (98,105 | ) | |||||
Sales | (26,722 | ) | — | (26,722 | ) | ||||||
Other, net | (123 | ) | 2,988 | 2,865 | |||||||
Balance, end of period | $ | 75,154 | $ | 94,504 | $ | 169,658 | |||||
At or For the Year Ended December 31, 2018 | |||||||||||
(in thousands) | Consumer Loan Portfolio | Commercial Loan and Lease Portfolio | Total | ||||||||
Balance, beginning of period | $ | 90,592 | $ | 27,990 | $ | 118,582 | |||||
Additions | 67,515 | 70,921 | 138,436 | ||||||||
Charge-offs | (9,804 | ) | (14,727 | ) | (24,531 | ) | |||||
Transfers to other assets | (19,578 | ) | (14,595 | ) | (34,173 | ) | |||||
Return to accrual status | (6,289 | ) | (4,690 | ) | (10,979 | ) | |||||
Payments received | (19,048 | ) | (28,412 | ) | (47,460 | ) | |||||
Sales | (35,786 | ) | — | (35,786 | ) | ||||||
Other, net | (256 | ) | 2,085 | 1,829 | |||||||
Balance, end of period | $ | 67,346 | $ | 38,572 | $ | 105,918 | |||||
Interest income recognized on loans and leases in nonaccrual status and contractual interest that would have been recorded had the loans and leases performed in accordance with their original contractual terms were as follows:
Year Ended December 31, | |||||||||||
(in thousands) | 2019 | 2018 | 2017 | ||||||||
Contractual interest due on nonaccrual loans and leases | $ | 17,310 | $ | 10,921 | $ | 15,009 | |||||
Interest income recognized on nonaccrual loans and leases | 5,514 | 1,351 | 2,982 | ||||||||
Unrecognized interest income | $ | 11,796 | $ | 9,570 | $ | 12,027 | |||||
Loan and lease credit classifications We assess the risk of our loan and lease portfolio utilizing numerous risk characteristics as outlined in the previous sections. Credit classifications are an additional characteristic monitored in the overall credit risk process. Loan and lease credit classifications are derived from standard regulatory rating definitions, which include: non-classified (pass and special mention) and classified (substandard and doubtful). Classified loans and leases have well-defined weaknesses, but may never result in a loss.
55
Loans and leases by portfolio and regulatory classification were as follows:
At December 31, 2019 | |||||||||||
Non-classified | Classified | Total | |||||||||
(In thousands) | |||||||||||
Commercial loan and lease portfolio: | |||||||||||
Commercial and industrial | $ | 11,246,036 | $ | 193,566 | $ | 11,439,602 | |||||
Commercial real estate | 9,061,475 | 75,395 | 9,136,870 | ||||||||
Lease financing | 2,674,965 | 24,904 | 2,699,869 | ||||||||
Total commercial loan and lease portfolio | 22,982,476 | 293,865 | 23,276,341 | ||||||||
Consumer loan portfolio: | |||||||||||
Residential mortgage | 6,135,661 | 44,144 | 6,179,805 | ||||||||
Consumer installment | 1,541,524 | 887 | 1,542,411 | ||||||||
Home equity | 3,457,748 | 41,159 | 3,498,907 | ||||||||
Total consumer loan portfolio | 11,134,933 | 86,190 | 11,221,123 | ||||||||
Total loans and leases | $ | 34,117,409 | $ | 380,055 | $ | 34,497,464 | |||||
At December 31, 2018 | |||||||||||
Non-classified | Classified | Total | |||||||||
(In thousands) | |||||||||||
Commercial loan and lease portfolio: | |||||||||||
Commercial and industrial | $ | 6,191,617 | $ | 106,623 | $ | 6,298,240 | |||||
Commercial real estate | 2,804,967 | 25,738 | 2,830,705 | ||||||||
Lease financing | 2,506,159 | 24,004 | 2,530,163 | ||||||||
Total commercial loan and lease portfolio | 11,502,743 | 156,365 | 11,659,108 | ||||||||
Consumer loan portfolio: | |||||||||||
Residential mortgage | 2,298,346 | 37,489 | 2,335,835 | ||||||||
Consumer installment | 1,983,146 | 20,426 | 2,003,572 | ||||||||
Home equity | 3,047,043 | 27,462 | 3,074,505 | ||||||||
Total consumer loan portfolio | 7,328,535 | 85,377 | 7,413,912 | ||||||||
Total loans and leases | $ | 18,831,278 | $ | 241,742 | $ | 19,073,020 | |||||
Total classified loans and leases were $380.1 million at December 31, 2019, compared with $241.7 million at December 31, 2018. The increase was primarily due to loans acquired in the Merger.
Loan modifications Troubled debt restructuring ("TDR") loans are loans to financially troubled borrowers that have been modified such that we have granted a concession in terms to improve the likelihood of collection of all principal and modified interest owed. TDR loans were as follows:
At December 31, | |||||||||||||||||||
(Dollars in thousands) | 2019 | 2018 | 2017 | 2016 | 2015 | ||||||||||||||
Accruing TDR Loans: | |||||||||||||||||||
Commercial loan and lease portfolio | $ | 12,986 | $ | 12,665 | $ | 22,512 | $ | 25,106 | $ | 27,686 | |||||||||
Consumer loan portfolio | 12,403 | 85,794 | 91,559 | 100,935 | 107,597 | ||||||||||||||
Total | 25,389 | 98,459 | 114,071 | 126,041 | 135,283 | ||||||||||||||
Nonaccrual TDR Loans: | |||||||||||||||||||
Commercial loan and lease portfolio | 5,356 | 6,153 | 1,972 | 3,877 | 7,829 | ||||||||||||||
Consumer loan portfolio | 14,875 | 22,554 | 39,634 | 77,465 | 87,495 | ||||||||||||||
Total | 20,231 | 28,707 | 41,606 | 81,342 | 95,324 | ||||||||||||||
Total TDR loans: | |||||||||||||||||||
Commercial loan and lease portfolio | 18,342 | 18,818 | 24,484 | 28,983 | 35,515 | ||||||||||||||
Consumer loan portfolio | 27,278 | 108,348 | 131,193 | 178,400 | 195,092 | ||||||||||||||
Total | $ | 45,620 | $ | 127,166 | $ | 155,677 | $ | 207,383 | $ | 230,607 | |||||||||
Over 90-day delinquency as a percentage of total accruing TDR loans | 0.52 | % | 0.14 | % | — | % | 0.30 | % | 0.71 | % | |||||||||
56
Total TDRs were $45.6 million at December 31, 2019, compared with $127.2 million at December 31, 2018. The decrease was primarily due to the sale of $63.8 million of TDR loans.
Loan modifications to borrowers who have not been granted concessions are not considered TDR loans and therefore are not included in the table above. TDR loans with an interest rate consistent with market rates on loans with comparable risk at the time of restructuring and performing based on the restructured terms are no longer disclosed as TDR loans in the calendar years after modification; however, these loans are still considered impaired and follow our impaired loan reserve policies.
TDRs typically involve a deferral of the principal balance of the loan, a reduction of the stated interest rate of the loan or, in certain limited circumstances, a reduction of the principal balance of the loan or the loan's accrued interest.
Interest income recognized on TDR loans and contractual interest that would have been recorded had the TDR loans performed in accordance with their original contractual terms were as follows:
Year Ended December 31, | |||||||||||
(in thousands) | 2019 | 2018 | 2017 | ||||||||
Contractual interest due on TDR loans | $ | 6,157 | $ | 6,842 | $ | 7,588 | |||||
Interest income recognized on TDR loans | 4,325 | 4,673 | 5,185 | ||||||||
Unrecognized interest income | $ | 1,832 | $ | 2,169 | $ | 2,403 | |||||
See "Note 8. Allowance for Loan and Lease Losses and Credit Quality" of Notes to Consolidated Financial Statements for further information regarding our loan modifications.
Allowance for loan and lease losses The determination of the allowance for loan and lease losses is a critical accounting estimate. Our evaluation of incurred losses is based on historical loss rates multiplied by the respective portfolio's loss emergence period. Factors utilized in the determination of the amount of the allowance include historical trends in loss rates, a portfolio's overall risk characteristics, changes in its character or size, risk rating migration, delinquencies, collateral values, economic outlook and prevailing economic conditions. We review the various factors used in the methodologies are reviewed on a periodic basis.
The allowance for loan and lease losses on loans and leases acquired in the Merger was not carried over on the Merger Date. Instead, the acquired loans and leases were recorded at their estimated fair value, which included a component for expected credit losses. The remaining credit mark as of December 31, 2019 was $142.5 million.
We consider our allowance for loan and lease losses of $113.1 million appropriate to cover losses incurred in the loan and lease portfolios at December 31, 2019. However, no assurance can be given that we will not, in any particular period, sustain loan and lease losses that are sizable in relation to the amount reserved or will not require significant changes in the balance of the allowance for loan and lease losses due to subsequent evaluations of the loan and lease portfolios.
The total allowance for loan and lease losses is expected to absorb losses from any segment of the portfolio. The allocation of our allowance for loan and lease losses disclosed in the following table is subject to change based on changes in the criteria used to evaluate the allowance and is not necessarily indicative of the trend of future losses in any particular portfolio.
57
In conjunction with "Note 8. Allowance for Loan and Lease Losses and Credit Quality" of Notes to Consolidated Financial Statements, detailed information regarding our allowance for loan and lease losses was as follows:
Credit Loss Reserves | Credit Loss Reserves as a Percentage of Portfolio | ||||||||||||||||||||||||||||
At December 31, | At December 31, | ||||||||||||||||||||||||||||
(Dollars in thousands) | 2019 | 2018 | 2017 | 2016 | 2015 | 2019 | 2018 | 2017 | 2016 | 2015 | |||||||||||||||||||
Commercial loan and lease portfolio: | |||||||||||||||||||||||||||||
Commercial and industrial | 42,430 | 41,103 | 35,451 | 33,193 | 28,165 | 0.38 | % | 0.66 | % | 0.61 | % | 0.65 | % | 0.61 | % | ||||||||||||||
Commercial real estate | 27,308 | 22,877 | 24,842 | 22,785 | 22,215 | 0.29 | 0.79 | 0.90 | 0.86 | 0.86 | |||||||||||||||||||
Lease financing | 14,742 | 13,449 | 12,663 | 11,999 | 9,951 | 0.55 | 0.53 | 0.51 | 0.52 | 0.47 | |||||||||||||||||||
Total commercial loan and lease portfolio | 84,480 | 77,429 | 72,956 | 67,977 | 60,331 | 0.36 | 0.66 | 0.66 | 0.67 | 0.65 | |||||||||||||||||||
Consumer loan portfolio: | |||||||||||||||||||||||||||||
Residential mortgage | 8,099 | 21,436 | 26,698 | 33,829 | 36,887 | 0.13 | 0.92 | 1.46 | 1.59 | 1.51 | |||||||||||||||||||
Consumer installment | 2,678 | 35,151 | 50,917 | 32,843 | 27,732 | 0.17 | 1.75 | 1.58 | 1.23 | 1.01 | |||||||||||||||||||
Home equity | 17,795 | 23,430 | 20,470 | 25,620 | 31,104 | 0.51 | 0.76 | 0.68 | 0.87 | 1.03 | |||||||||||||||||||
Total consumer loan portfolio | 28,572 | 80,017 | 98,085 | 92,292 | 95,723 | 0.25 | 1.08 | 1.22 | 1.19 | 1.17 | |||||||||||||||||||
Total allowance for loan and lease losses | 113,052 | 157,446 | 171,041 | 160,269 | 156,054 | 0.33 | 0.83 | 0.90 | 0.90 | 0.90 | |||||||||||||||||||
Other credit loss reserves: | |||||||||||||||||||||||||||||
Reserves for unfunded commitments | 3,528 | 1,429 | 1,479 | 1,115 | 1,044 | N.A. | N.A. | N.A. | N.A. | N.A. | |||||||||||||||||||
Total credit loss reserves | 116,580 | 158,875 | 172,520 | 161,384 | 157,098 | 0.34 | % | 0.83 | % | 0.90 | % | 0.90 | % | 0.90 | % | ||||||||||||||
N.A. Not Applicable
The total credit loss reserves were $116.6 million, or 0.34% as a percentage of the loan and lease portfolio, at December 31, 2019, compared with $158.9 million, or 0.83% as a percentage of the loan and lease portfolio, at December 31, 2018. The decrease in dollars in 2019, compared to 2018, was primarily due to the sale of $80.5 million of nonaccrual and accruing TDR loans while the decrease in percentage was also impacted by the loans acquired in the Merger that were recorded at their fair value as of the Merger Date without a carryover of the related allowance.
58
Reconciliations of changes in the allowance for loan and lease losses were as follows:
Year Ended December 31, | |||||||||||||||||||
(Dollars in thousands) | 2019 | 2018 | 2017 | 2016 | 2015 | ||||||||||||||
Balance, beginning of period | $ | 157,446 | $ | 171,041 | $ | 160,269 | $ | 156,054 | $ | 164,169 | |||||||||
Charge-offs: | |||||||||||||||||||
Commercial loan and lease portfolio: | |||||||||||||||||||
Commercial and industrial | (39,566 | ) | (16,005 | ) | (8,840 | ) | (7,450 | ) | (7,457 | ) | |||||||||
Commercial real estate | (302 | ) | — | (3,608 | ) | (752 | ) | (5,225 | ) | ||||||||||
Lease financing | (7,587 | ) | (4,203 | ) | (6,813 | ) | (2,912 | ) | (2,699 | ) | |||||||||
Total commercial loan and lease portfolio | (47,455 | ) | (20,208 | ) | (19,261 | ) | (11,114 | ) | (15,381 | ) | |||||||||
Consumer loan portfolio: | |||||||||||||||||||
Residential mortgage | (3,456 | ) | (3,417 | ) | (5,592 | ) | (9,710 | ) | (18,061 | ) | |||||||||
Consumer installment | (43,805 | ) | (57,393 | ) | (47,969 | ) | (34,346 | ) | (25,478 | ) | |||||||||
Home equity | (3,219 | ) | (3,710 | ) | (6,270 | ) | (8,915 | ) | (15,627 | ) | |||||||||
Total consumer loan portfolio | (50,480 | ) | (64,520 | ) | (59,831 | ) | (52,971 | ) | (59,166 | ) | |||||||||
Total charge-offs | (97,935 | ) | (84,728 | ) | (79,092 | ) | (64,085 | ) | (74,547 | ) | |||||||||
Recoveries: | |||||||||||||||||||
Commercial loan and lease portfolio: | |||||||||||||||||||
Commercial and industrial | 5,120 | 1,606 | 1,840 | 1,924 | 3,878 | ||||||||||||||
Commercial real estate | 322 | 183 | 777 | 308 | 2,032 | ||||||||||||||
Lease financing | 1,289 | 1,427 | 1,119 | 1,343 | 1,670 | ||||||||||||||
Total commercial loan and lease portfolio | 6,731 | 3,216 | 3,736 | 3,575 | 7,580 | ||||||||||||||
Consumer loan portfolio: | |||||||||||||||||||
Residential mortgage | 4,271 | 5,261 | 6,100 | 1,115 | 1,033 | ||||||||||||||
Consumer installment | 13,693 | 14,738 | 10,135 | 8,211 | 8,005 | ||||||||||||||
Home equity | 5,689 | 6,488 | 14,681 | 5,949 | 6,395 | ||||||||||||||
Total consumer loan portfolio | 23,653 | 26,487 | 30,916 | 15,275 | 15,433 | ||||||||||||||
Total recoveries | 30,384 | 29,703 | 34,652 | 18,850 | 23,013 | ||||||||||||||
Net charge-offs | (67,551 | ) | (55,025 | ) | (44,440 | ) | (45,235 | ) | (51,534 | ) | |||||||||
Provision for credit losses | 65,282 | 46,768 | 68,443 | 65,874 | 52,944 | ||||||||||||||
Other(1) | (42,125 | ) | (5,338 | ) | (13,231 | ) | (16,424 | ) | (9,525 | ) | |||||||||
Balance, end of period | $ | 113,052 | $ | 157,446 | $ | 171,041 | $ | 160,269 | $ | 156,054 | |||||||||
Net charge-offs as a percentage of average loans and leases | 0.27 | % | 0.29 | % | 0.24 | % | 0.26 | % | 0.30 | % | |||||||||
(1) | Primarily includes the transfer of the allowance for loan and lease losses to loans and leases held for sale. |
Net loan and lease charge-offs for 2019 were $67.6 million, or 0.27% of average loans and leases, compared with $55.0 million, or 0.29% of average loans and leases, for 2018 and $44.4 million, or 0.24% of average loans and leases, for 2017. The increase in net loan and lease charge-offs in 2019 was primarily due to an increase in commercial and industrial net charge-offs, partially offset by $4.7 million of recoveries of previous charge-offs related to the sale of consumer nonaccrual and TDR loans. The increase in net loan and lease charge-offs in 2018 was primarily due to an increase in charge-offs in the consumer installment portfolio, mostly due to auto finance.
Liquidity Management We manage our liquidity to ensure that our funding needs are met both promptly and in a cost-effective manner. Asset liquidity arises from liquid assets that can be sold or pledged as collateral, amortization, prepayment or maturity of assets and from our ability to sell loans. Liability liquidity results from our ability to maintain a diverse set of funding sources to promptly meet funding requirements.
The TCF Financial Board of Directors have adopted a Liquidity Management Policy for TCF Bank to direct management of the Corporation's liquidity risk and a Holding Company Investment and Liquidity Management Policy, which establishes a minimum target amount of cash or liquid investments TCF Financial will hold. See "Item 7A. Quantitative and Qualitative Disclosures about Market Risk" for further information.
59
TCF Bank had $489.7 million of net liquidity qualifying interest-bearing deposits at the Federal Reserve Bank at December 31, 2019, compared with $208.4 million at December 31, 2018. Certain investment securities held-to-maturity and investment securities available-for-sale provide the ability to liquidate or pledge unencumbered securities as needed. At December 31, 2019, $627.0 million of our securities were pledged as collateral to secure certain deposits and borrowings.
TCF Financial had net liquidity qualifying cash of $156.0 million at December 31, 2019, compared with $90.4 million at December 31, 2018.
Deposits are the primary source of our funds for use in lending and for other general business purposes. In addition to deposits, we receive funds from loan and lease repayments, loan sales and borrowings. Borrowings may be used to compensate for reductions in normal sources of funds, such as deposit inflows at less than projected levels, net deposit outflows or to fund balance sheet growth. We primarily borrow from the Federal Home Loan Bank (the "FHLB") of Des Moines. We had $2.4 billion of additional borrowing capacity at the FHLB of Des Moines at December 31, 2019, as well as access to the Federal Reserve Discount Window. In addition, we maintain a diversified set of unsecured and uncommitted funding sources, including access to overnight federal funds purchased lines, brokered deposits and capital markets. Lending activities, such as loan originations, loan purchases and equipment purchases for lease financing, are the primary uses of our funds.
On August 5, 2019, TCF Financial entered into a $50.0 million unsecured revolving credit facility with an unaffiliated bank. The revolving credit facility contains several restrictive covenants, including the maintenance of various capital adequacy levels, asset quality and profitability ratios, and certain restrictions on levels of indebtedness. At December 31, 2019, we had no outstanding balance under the revolving credit facility. The revolving credit facility is available to be used, as needed, to fund growth, common stock repurchases or other general corporate purposes. We were in compliance with all the covenants at December 31, 2019.
Our wholly-owned subsidiary TCF Commercial Finance Canada, Inc. ("TCFCFC") maintains a $20.0 million Canadian dollar-denominated line of credit facility with an unaffiliated bank, which is guaranteed by TCF Bank. TCFCFC had no outstanding borrowings under the line of credit with the counterparty at December 31, 2019 and 2018.
Deposits Deposits were $34.5 billion at December 31, 2019, compared with $18.9 billion at December 31, 2018. The increase in deposits was primarily due to the $16.4 billion deposits acquired in the Merger.
Noninterest-bearing checking accounts represented 23.1% of total deposits at December 31, 2019, compared with 20.7% of total deposits at December 31, 2018. Our weighted-average interest rate for deposits, including noninterest bearing deposits, was 0.88% for 2019 compared with 0.59% for 2018.
Certificates of deposit, including Certificate of Deposit Account Registry Service ("CDARS") deposits, IRA deposits and brokered deposits, were $7.5 billion at December 31, 2019, compared with $4.8 billion at December 31, 2018. The maturities of certificates of deposit with denominations equal to or greater than $100,000 at December 31, 2019 were as follows:
(n thousands) | |||
Three months or less | $ | 1,632,172 | |
Over three through six months | 1,069,425 | ||
Over six through 12 months | 848,901 | ||
Over 12 months | 607,203 | ||
Total | $ | 4,157,701 | |
Borrowings Borrowings were $5.0 billion at December 31, 2019, compared with $1.4 billion at December 31, 2018. The increase in borrowings was primarily due to $3.1 billion of borrowings assumed in the Merger. In addition, on July 2, 2019, TCF Bank issued $150.0 million of 4.125% fixed-to-floating rate subordinated notes. The subordinated notes qualify as Tier 2 capital of TCF Financial and TCF Bank under the capital adequacy rules established by the Federal Reserve Board and the OCC, respectively, subject to applicable limitations. The proceeds are to be used for general corporate purposes which may include capital to support asset growth and reduce other borrowings.
60
Information regarding short-term borrowings (borrowings with an original maturity of less than one year) was as follows:
At or For the Year Ended December 31, | ||||||||||||
(Dollars in thousands) | 2019 | 2018 | 2017 | |||||||||
FHLB advances | ||||||||||||
Maximum outstanding at any month-end | $ | 2,450,000 | $ | — | $ | — | ||||||
Balance outstanding at end of period | 2,450,000 | — | — | |||||||||
Weighted average interest rate at end of period | 1.85 | % | — | % | — | % | ||||||
Average balance outstanding | $ | 1,173,879 | $ | — | $ | — | ||||||
Weighted average interest rate | 1.69 | % | — | % | — | % | ||||||
Federal funds purchased | ||||||||||||
Maximum outstanding at any month-end | $ | — | $ | — | $ | — | ||||||
Balance outstanding at end of period | — | — | — | |||||||||
Weighted average interest rate at end of period | — | % | — | % | — | % | ||||||
Average balance outstanding | $ | 156 | $ | 156 | $ | 142 | ||||||
Weighted average interest rate | 2.51 | % | 1.91 | % | 1.30 | % | ||||||
Collateralized deposits | ||||||||||||
Maximum outstanding at any month-end | $ | 271,249 | $ | — | $ | 2,868 | ||||||
Balance outstanding at end of period | 219,145 | — | — | |||||||||
Weighted average interest rate at end of period | 0.64 | % | — | % | — | % | ||||||
Average balance outstanding | $ | 103,931 | $ | 1,977 | $ | 3,730 | ||||||
Weighted average interest rate | 0.67 | % | 2.19 | % | 0.78 | % | ||||||
Line-of-credit: TCF Commercial Finance Canada, Inc. | ||||||||||||
Maximum outstanding at any month-end | $ | 10,455 | $ | 8,565 | $ | 6,171 | ||||||
Balance outstanding at end of period | — | — | — | |||||||||
Weighted average interest rate at end of period | — | % | — | % | — | % | ||||||
Average balance outstanding | $ | 1,107 | $ | 1,155 | $ | 1,395 | ||||||
Weighted average interest rate | 3.00 | % | 2.63 | % | 1.91 | % | ||||||
Long-term borrowings were as follows:
(in thousands) | December 31, 2019 | December 31, 2018 | |||||
FHLB advances | $ | 1,822,058 | $ | 1,100,000 | |||
Subordinated debt obligations | 428,470 | 253,391 | |||||
Discounted lease rentals | 100,882 | 92,976 | |||||
Finance lease obligation | 3,038 | 3,105 | |||||
Total long-term borrowings | $ | 2,354,448 | $ | 1,449,472 | |||
See "Note 15. Borrowings" of Notes to Consolidated Financial Statements for further information regarding our long-term borrowings.
61
Contractual Obligations and Commitments As discussed in the Notes to Consolidated Financial Statements, we have certain obligations and commitments to make future payments under contracts.
At December 31, 2019, the aggregate contractual obligations and commitments were as follows:
Payments Due by Period | |||||||||||||||||||
(in thousands) | Total | Less than 1 year | 1-3 years | 3-5 years | More than 5 years | ||||||||||||||
Contractual Obligations: | |||||||||||||||||||
Certificates of deposit | $ | 7,455,556 | $ | 6,503,237 | $ | 831,120 | $ | 111,186 | $ | 10,013 | |||||||||
Long-term borrowings | 2,351,675 | 352,126 | 1,460,784 | 7,933 | 530,832 | ||||||||||||||
Lease obligations(1) | 387,469 | 33,164 | 53,139 | 49,861 | 251,305 | ||||||||||||||
Marketing related contracts | 191,383 | 48,128 | 69,430 | 36,978 | 36,847 | ||||||||||||||
Construction contracts and land purchase commitments for future branch sites | 3,377 | 3,377 | — | — | — | ||||||||||||||
Investments in affordable housing | 132,308 | 79,351 | 52,072 | 292 | 593 | ||||||||||||||
Liabilities related to acquisition and portfolio purchase (2) | 5,203 | 3,512 | 1,691 | — | — | ||||||||||||||
Other contractual obligations (3) | 4,738 | 1,563 | — | — | 3,175 | ||||||||||||||
Total | $ | 10,531,709 | $ | 7,024,458 | $ | 2,468,236 | $ | 206,250 | $ | 832,765 | |||||||||
(1) | Includes obligations for leases that have not yet commenced. |
(2) | Relates to acquisition of a leasing business in 2017. |
(3) | Includes certain tax investment projects, private equity capital investments and other similar types of investments. |
Amount of Commitment - Expiration by Period | |||||||||||||||||||
(in thousands) | Total | Less than 1 year | 1-3 years | 3-5 years | More than 5 years | ||||||||||||||
Commitments: | |||||||||||||||||||
Commitments to extend credit: | |||||||||||||||||||
Commercial | $ | 5,743,072 | $ | 2,834,385 | $ | 1,710,112 | $ | 920,789 | $ | 277,786 | |||||||||
Consumer | 2,305,096 | 114,988 | 128,543 | 177,078 | 1,884,487 | ||||||||||||||
Total commitments to extend credit | 8,048,168 | 2,949,373 | 1,838,655 | 1,097,867 | 2,162,273 | ||||||||||||||
Standby letters of credit and guarantees on industrial revenue bonds | 129,192 | 81,482 | 23,065 | 15,855 | 8,790 | ||||||||||||||
Total | $ | 8,177,360 | $ | 3,030,855 | $ | 1,861,720 | $ | 1,113,722 | $ | 2,171,063 | |||||||||
Unrecognized tax benefits, projected benefit obligations, demand deposits with indeterminate maturities and discretionary credit facilities that do not obligate us to lend have been excluded from the contractual obligations table above.
Capital Management We are committed to managing capital to maintain protection for shareholders, depositors and creditors. We employ a variety of capital management tools to achieve our capital goals, including, but not limited to, dividends, public offerings of preferred and common stock, common stock repurchases, redemption of preferred stock and the issuance or redemption of subordinated debt and other capital instruments. We maintain a Capital Planning and Dividend Policy which applies to TCF Financial and incorporates TCF Bank's Capital Planning and Dividend Policy. These policies are intended to ensure that capital strategy actions, including the addition of new capital, if needed, common stock repurchases, redemption of preferred stock or the declaration of preferred stock, common stock and bank dividends are prudent, efficient and provide value to our shareholders, while ensuring that past and prospective earnings retention is consistent with our capital needs for growth, as well as asset quality and overall financial condition. TCF Financial and TCF Bank manage capital levels to exceed all regulatory capital requirements.
On October 24, 2019, our board of directors approved an authorization to repurchase up to $150 million of our common stock. The repurchase program has no expiration, and permits shares to be repurchased in compliance with Rule 10b-18 of the Exchange Act, through one or more broker-dealers as part of “block purchases” made by TCF, and/or through privately negotiated purchases, accelerated stock repurchase agreements, or Rule 10b5-1 plans. Through December 31, 2019, we repurchased 657,817 shares of our common stock totaling $27.5 million.
62
At December 31, 2019 and 2018, TCF Bank's capital ratios exceeded the quantitative capital ratios required for an institution to be considered "well-capitalized." Significant factors that may affect capital adequacy include, but are not limited to, a disproportionate growth in assets versus capital and a change in mix or credit quality of assets. There are no conditions or events since December 31, 2019 that management believes have changed TCF Bank's status as well-capitalized. See "Note 19. Regulatory Capital Requirements" of Notes to Consolidated Financial Statement for further information.
Equity Total equity was $5.7 billion, or 12.3% of total assets, at December 31, 2019, compared with $2.6 billion, or 10.8% of total assets, at December 31, 2018. The increase in equity during the year ended December 31, 2019 was primarily attributable to the 81.9 million shares of common stock issued in the Merger. See "Note 2. Merger" of Notes to Consolidated Financial Statements for further information.
Preferred Stock Preferred stock was $169.3 million at both December 31, 2019 and December 31, 2018. See "Note 18. Equity" of Notes to Consolidated Financial Statements for further information regarding our preferred stock.
Treasury Stock and Other Treasury stock and other was $28.0 million at December 31, 2019, compared with $252.2 million at December 31, 2018. The $28.0 million at December 31, 2019 was comprised of shares held in trust for deferred compensation plans. The decrease was primarily due to the elimination of all previously outstanding Legacy TCF treasury stock in connection with the Merger. See "Note 18. Equity" of Notes to Consolidated Financial Statements for further information.
Common Stock Dividends Dividends to common shareholders on a per share basis were $1.29 for the year ended December 31, 2019, as adjusted to reflect the exchange ratio in the Merger Exchange for dividends paid prior to the completion of the Merger. Dividends to common shareholders on a per share basis, adjusted to reflect the exchange ratio in the Merger Exchange, were $1.18 for the year ended December 31, 2018. Our common stock dividend payout ratio was 50.4% for the year ended December 31, 2019, compared with 34.3% for the year ended December 31, 2018 and 20.8% for the year ended December 31, 2017. TCF Financial's primary funding sources for dividends are dividends received from TCF Bank.
On January 27, 2020, our board of directors declared a regular quarterly cash dividend of $0.35 per common share payable on March 2, 2020 to shareholders of record at the close of business on February 14, 2020, and declared a quarterly cash dividend of $0.35625 per depositary share representing a 1/1,000th interest in a share of the 5.70% Series C Non-Cumulative Perpetual Preferred Stock, payable on March 2, 2020 to shareholders of record at the close of business on February 14, 2020.
Common Shareholders' Equity Total common shareholders' equity was $5.5 billion, or 11.87% of total assets, at December 31, 2019, compared with $2.4 billion, or 9.99%, at December 31, 2018. Tangible common equity was $4.1 billion, or 9.01% of total tangible assets, at December 31, 2019, compared with $2.2 billion, or 9.32%, at December 31, 2018. Book value per common share was $36.20 at December 31, 2019, compared with $28.44 at December 31, 2018. Tangible book value per common share was $26.60 at December 31, 2019, compared with $26.33 at December 31, 2018. See "Consolidated Financial Condition Analysis — Non-GAAP Financial Measures" in this Management's Discussion and Analysis for further information.
63
Non-GAAP Financial Measures This Annual Report on Form 10-K contains references to financial measures that are not defined in GAAP. Such non-GAAP financial measures include our tangible book value per common share; tangible common shareholders' equity; presentation of net interest income and net interest margin on a fully tax-equivalent ("FTE") basis; our adjusted efficiency ratio (which excludes merger-related expenses, sale of legacy TCF auto finance portfolio, termination of interest rate swaps, write-down of company-owned vacant land parcels and branch exit costs, gain on sale of certain investment securities, pension fair valuation adjustment, loan servicing rights and goodwill impairment, the impact of Tax Reform, CFPB/OCC settlement adjustment, lease financing equipment depreciation, net interest income FTE adjustment, amortization of intangible assets and impairment of federal historic income tax credits); and other adjusted information presented excluding merger-related expenses and notable items (defined as sale of legacy TCF auto finance portfolio, termination of interest rate swaps, write-down of company-owned vacant land parcels and branch exit costs, gain on sale of certain investment securities, pension fair valuation adjustment, loan servicing rights and goodwill impairment and CFPB/OCC settlement adjustment) including net income, diluted earnings per share, return on average assets, return on average common shareholders' equity and return on average tangible common shareholders' equity. Management believes that the presentation of these non-GAAP financial measures (i) provides important supplemental information that contributes to a proper understanding of our operating performance, (ii) enables a more complete understanding of factors and trends affecting our business and (iii) allows investors to evaluate our performance in a manner similar to management, the financial services industry, bank stock analysts, and bank regulators. Management uses non-GAAP financial measures internally in the preparation of our operating budgets, monthly financial performance reporting, and in our presentation to investors of our performance. Non-GAAP financial measures are not defined by GAAP and other entities may calculate them differently than we do. Non-GAAP financial measures have inherent limitations and are not required to be uniformly applied. Although these non-GAAP financial measures are frequently used by stakeholders in the evaluation of a company, they have limitations as analytical tools and should not be considered in isolation or as a substitute for analyses of results as reported under GAAP.
64
The following tables provide a reconciliation of each non-GAAP financial measure to the most directly comparable GAAP financial measure. A reconciliation of net interest income and net interest margin (FTE) to the most directly comparable GAAP financial measure can be found within the Net Interest Income subheading of this Annual Report on Form 10-K.
The computation of the adjusted diluted earnings per common share was as follows:
Year Ended December 31, | ||||||||||||||||||||
(Dollars in thousands, except per share data) | 2019 | 2018 | 2017 | 2016 | 2015 | |||||||||||||||
Net income available to common shareholders | $ | 285,493 | $ | 289,289 | $ | 242,954 | $ | 192,736 | $ | 177,735 | ||||||||||
Earnings allocated to participating securities | (20 | ) | (42 | ) | (42 | ) | (49 | ) | (45 | ) | ||||||||||
Earnings allocated to common shareholders | (a) | 285,473 | 289,247 | 242,912 | 192,687 | 177,690 | ||||||||||||||
Merger-related expenses | 171,968 | — | — | — | — | |||||||||||||||
Notable items: | ||||||||||||||||||||
Sale of Legacy TCF auto finance portfolio(1) | 32,128 | — | — | — | — | |||||||||||||||
Termination of interest rate swaps(2) | 17,302 | — | — | — | — | |||||||||||||||
Gain on sale of certain investment securities(3) | (5,869 | ) | — | — | — | — | ||||||||||||||
Write-down of company-owned vacant land parcels and branch exit costs(4) | 9,384 | — | — | — | — | |||||||||||||||
Pension fair valuation adjustment(4) | 6,341 | — | — | — | — | |||||||||||||||
Loan servicing rights impairment(2) | 3,882 | — | — | — | — | |||||||||||||||
CFPB/OCC settlement adjustment(4) | — | 32,000 | — | — | — | |||||||||||||||
Re-measurement of net deferred tax liability(5) | — | — | (130,653 | ) | — | — | ||||||||||||||
Goodwill impairment(4) | — | — | 73,041 | — | ||||||||||||||||
Total notable items | 63,168 | 32,000 | (57,612 | ) | — | — | ||||||||||||||
Related income tax expense, net of benefits(6) | (69,372 | ) | (6,491 | ) | — | — | — | |||||||||||||
Total adjustments, net of tax | 165,764 | 25,509 | (57,612 | ) | — | — | ||||||||||||||
Adjusted earnings allocated to common stock | (b) | $ | 451,237 | $ | 314,756 | $ | 185,300 | $ | 192,687 | $ | 177,690 | |||||||||
Weighted-average common shares outstanding used in diluted earnings per common share calculation(7) | (c) | 111,818,365 | 84,324,686 | 85,734,575 | 85,006,293 | 84,297,208 | ||||||||||||||
Diluted earnings per common share | (a) / (c) | $ | 2.55 | $ | 3.43 | $ | 2.83 | $ | 2.27 | $ | 2.11 | |||||||||
Adjusted diluted earnings per common share | (b) / (c) | 4.04 | 3.73 | 2.16 | 2.27 | 2.11 | ||||||||||||||
Net income attributable to TCF | $ | 295,468 | $ | 304,358 | $ | 268,637 | $ | 212,124 | $ | 197,123 | ||||||||||
Total adjustments, net of tax | 165,764 | 25,509 | (57,612 | ) | — | — | ||||||||||||||
Adjusted net income attributable to TCF | $ | 461,232 | $ | 329,867 | $ | 211,025 | $ | 212,124 | $ | 197,123 | ||||||||||
(1) | Included within Net gains on sales of loans and leases ($27.5 million)(inclusive of the transfer of the Legacy TCF auto finance portfolio in the third quarter of 2019), other noninterest expense ($2.2 million), occupancy and equipment ($1.5 million) and compensation and employee benefits ($930 thousand). |
(2) | Included within Other noninterest income. |
(3) | Included within Net gains on investment securities. |
(4) | Included within Other noninterest expense. |
(5) | Includes the impact of the re-measurement of our estimated net deferred tax liability as a result of the enactment of Tax Reform. |
(6) | Included within Income tax expense. |
(7) | Assumes conversion of common shares, as applicable. |
65
The computation of the adjusted return on average assets, common equity and average tangible common equity was as follows:
Year Ended December 31, | ||||||||||||||||||||
(Dollars in thousands) | 2019 | 2018 | 2017 | 2016 | 2015 | |||||||||||||||
Adjusted net income after tax expense: | ||||||||||||||||||||
Income after tax expense | (a) | $ | 306,926 | $ | 315,628 | $ | 278,784 | $ | 221,717 | $ | 205,823 | |||||||||
Merger-related expenses | 171,968 | — | — | — | — | |||||||||||||||
Notable items | 63,168 | 32,000 | (57,612 | ) | — | — | ||||||||||||||
Related income tax expense, net of tax benefits | (69,372 | ) | (6,491 | ) | — | — | — | |||||||||||||
Adjusted net income after tax expense for ROAA calculation | (b) | $ | 472,690 | $ | 341,137 | $ | 221,172 | $ | 221,717 | $ | 205,823 | |||||||||
Net income available to common shareholders | (c) | $ | 285,493 | $ | 289,289 | $ | 242,954 | $ | 192,736 | $ | 177,735 | |||||||||
Other intangibles amortization and intangible impairment | 11,660 | 3,417 | 75,386 | 1,388 | 1,562 | |||||||||||||||
Related income tax expense | (2,752 | ) | (799 | ) | (1,046 | ) | (493 | ) | (562 | ) | ||||||||||
Net income available to common shareholders used in ROATCE calculation | (d) | $ | 294,401 | $ | 291,907 | $ | 317,294 | $ | 193,631 | $ | 178,735 | |||||||||
Adjusted net income available to common shareholders: | ||||||||||||||||||||
Net income available to common shareholders | $ | 285,493 | $ | 289,289 | $ | 242,954 | $ | 192,736 | $ | 177,735 | ||||||||||
Notable items | 63,168 | 32,000 | (57,612 | ) | — | — | ||||||||||||||
Merger-related expenses | 171,968 | — | — | — | — | |||||||||||||||
Related income tax expense, net of tax benefits | (69,372 | ) | (6,491 | ) | — | — | — | |||||||||||||
Net income available to common shareholders used in adjusted ROACE calculation | (e) | 451,257 | 314,798 | 185,342 | 192,736 | 177,735 | ||||||||||||||
Other intangibles amortization | 11,660 | 3,417 | 2,345 | 1,388 | 1,562 | |||||||||||||||
Related income tax expense | (2,752 | ) | (799 | ) | (1,046 | ) | (493 | ) | (562 | ) | ||||||||||
Net income available to common shareholders used in adjusted ROATCE calculation | (f) | $ | 460,165 | $ | 317,416 | $ | 186,641 | $ | 193,631 | $ | 178,735 | |||||||||
Average balances: | ||||||||||||||||||||
Average assets | (g) | $ | 33,526,930 | $ | 23,062,148 | $ | 22,051,967 | $ | 21,075,415 | $ | 19,889,677 | |||||||||
Total average equity | 3,915,038 | 2,530,502 | 2,535,938 | 2,394,701 | 2,217,204 | |||||||||||||||
Non-controlling interest in subsidiaries | (25,834 | ) | (24,323 | ) | (22,514 | ) | (21,525 | ) | (19,514 | ) | ||||||||||
Total TCF Financial Corporation shareholders' equity | 3,889,204 | 2,506,179 | 2,513,424 | 2,373,176 | 2,197,690 | |||||||||||||||
Preferred stock | (169,302 | ) | (176,971 | ) | (264,474 | ) | (263,240 | ) | (263,240 | ) | ||||||||||
Average total common shareholders' equity used in ROACE calculation | (h) | $ | 3,719,902 | $ | 2,329,208 | $ | 2,248,950 | $ | 2,109,936 | $ | 1,934,450 | |||||||||
Average goodwill, net | (620,253 | ) | (154,757 | ) | (219,144 | ) | (225,640 | ) | (225,640 | ) | ||||||||||
Average other intangibles, net | (99,038 | ) | (22,136 | ) | (12,779 | ) | (2,379 | ) | (3,883 | ) | ||||||||||
Average tangible common shareholders' equity used in ROATCE calculation | (i) | $ | 3,000,611 | $ | 2,152,315 | $ | 2,017,027 | $ | 1,881,917 | $ | 1,704,927 | |||||||||
ROAA | (a) / (g) | 0.92 | % | 1.37 | % | 1.26 | % | 1.05 | % | 1.03 | % | |||||||||
Adjusted ROAA | (b) / (g) | 1.41 | 1.48 | 1.00 | 1.05 | 1.03 | ||||||||||||||
ROACE | (c) / (h) | 7.67 | 12.42 | 10.80 | 9.13 | 9.19 | ||||||||||||||
Adjusted ROACE | (e) / (h) | 12.13 | 13.51 | 8.24 | 9.13 | 9.19 | ||||||||||||||
ROATCE | (d) / (i) | 9.81 | 13.56 | 15.73 | 10.29 | 10.48 | ||||||||||||||
Adjusted ROATCE | (f) / (i) | 15.34 | 14.74 | 9.25 | 10.29 | 10.48 | ||||||||||||||
66
The computation of the adjusted efficiency ratio was as follows:
Year Ended December 31, | ||||||||||||||||||||
(Dollars in thousands) | 2019 | 2018 | 2017 | 2016 | 2015 | |||||||||||||||
Noninterest expense | (a) | $ | 1,332,115 | $ | 1,014,400 | $ | 1,059,934 | $ | 909,887 | $ | 894,747 | |||||||||
Merger-related expenses | (171,968 | ) | — | — | — | — | ||||||||||||||
Sale of legacy TCF auto finance portfolio | (4,670 | ) | — | — | — | — | ||||||||||||||
CFPB/OCC settlement adjustment | — | (32,000 | ) | — | — | — | ||||||||||||||
Write-down of company-owned vacant land parcels and branch exit costs | (9,384 | ) | — | — | — | — | ||||||||||||||
Pension fair valuation adjustment | (6,341 | ) | — | — | — | — | ||||||||||||||
Goodwill impairment | — | — | (73,041 | ) | — | — | ||||||||||||||
Adjusted noninterest expense | $ | 1,139,752 | $ | 982,400 | $ | 986,893 | $ | 909,887 | $ | 894,747 | ||||||||||
Lease financing equipment depreciation | (76,426 | ) | (73,829 | ) | (55,901 | ) | (40,359 | ) | (39,409 | ) | ||||||||||
Other intangibles amortization | (11,660 | ) | (3,417 | ) | (2,345 | ) | (1,388 | ) | (1,562 | ) | ||||||||||
Impairment of historic income tax credit | (4,030 | ) | — | — | — | — | ||||||||||||||
Adjusted noninterest expense, efficiency ratio | (b) | $ | 1,047,636 | $ | 905,154 | $ | 928,647 | $ | 868,140 | $ | 853,776 | |||||||||
Net interest income | $ | 1,289,032 | $ | 1,008,495 | $ | 937,474 | $ | 859,725 | $ | 831,621 | ||||||||||
Noninterest income | 465,532 | 454,397 | 436,063 | 454,281 | 430,764 | |||||||||||||||
Total revenue | (c) | $ | 1,754,564 | $ | 1,462,892 | $ | 1,373,537 | $ | 1,314,006 | $ | 1,262,385 | |||||||||
Noninterest income | $ | 465,532 | $ | 454,397 | $ | 436,063 | $ | 454,281 | $ | 430,764 | ||||||||||
Sale of legacy TCF auto finance portfolio | 27,458 | — | — | — | — | |||||||||||||||
Termination of interest rate swaps | 17,302 | — | — | — | — | |||||||||||||||
Gain on sales of certain investment securities | (5,869 | ) | — | — | — | — | ||||||||||||||
Loan servicing rights impairment | 3,882 | — | — | — | — | |||||||||||||||
Adjusted noninterest income | 508,305 | 454,397 | 436,063 | 454,281 | 430,764 | |||||||||||||||
Net interest income | 1,289,032 | 1,008,495 | 937,474 | 859,725 | 831,621 | |||||||||||||||
Net interest income FTE adjustment | 8,443 | 8,369 | 14,542 | 10,813 | 4,640 | |||||||||||||||
Adjusted net interest income (FTE) | 1,297,475 | 1,016,864 | 952,016 | 870,538 | 836,261 | |||||||||||||||
Lease financing equipment depreciation | (76,426 | ) | (73,829 | ) | (55,901 | ) | (40,359 | ) | (39,409 | ) | ||||||||||
Adjusted total revenue, efficiency ratio | (d) | $ | 1,729,354 | $ | 1,397,432 | $ | 1,332,178 | $ | 1,284,460 | $ | 1,227,616 | |||||||||
Efficiency ratio | (a) / (c) | 75.92 | % | 69.34 | % | 77.17 | % | 69.25 | % | 70.88 | % | |||||||||
Adjusted efficiency ratio | (b) / (d) | 60.58 | 64.77 | 69.71 | 67.59 | 69.55 | ||||||||||||||
67
The computations of tangible common equity to tangible assets and tangible book value per common share were as follows:
At December 31, | ||||||||||||||||||||
(Dollars in thousands, except per share data) | 2019 | 2018 | 2017 | 2016 | 2015 | |||||||||||||||
Total equity | $ | 5,727,241 | $ | 2,556,260 | $ | 2,680,584 | $ | 2,444,645 | $ | 2,306,917 | ||||||||||
Non-controlling interest in subsidiaries | (20,226 | ) | (18,459 | ) | (17,827 | ) | (17,162 | ) | (16,001 | ) | ||||||||||
Total TCF Financial Corporation shareholders' equity | 5,707,015 | 2,537,801 | 2,662,757 | 2,427,483 | 2,290,916 | |||||||||||||||
Preferred stock | (169,302 | ) | (169,302 | ) | (265,821 | ) | (263,240 | ) | (263,240 | ) | ||||||||||
Total common shareholders' equity | (a) | 5,537,713 | 2,368,499 | 2,396,936 | 2,164,243 | 2,027,676 | ||||||||||||||
Goodwill, net | (1,299,878 | ) | (154,757 | ) | (154,757 | ) | (225,640 | ) | (225,640 | ) | ||||||||||
Other intangibles, net | (168,368 | ) | (20,496 | ) | (23,662 | ) | (1,708 | ) | (3,086 | ) | ||||||||||
Tangible common shareholders' equity | (b) | $ | 4,069,467 | $ | 2,193,246 | $ | 2,218,517 | $ | 1,936,895 | $ | 1,798,950 | |||||||||
Total assets | (c) | $ | 46,651,553 | $ | 23,699,612 | $ | 23,002,159 | $ | 21,441,326 | $ | 20,689,609 | |||||||||
Goodwill, net | (1,299,878 | ) | (154,757 | ) | (154,757 | ) | (225,640 | ) | (225,640 | ) | ||||||||||
Other intangibles, net | (168,368 | ) | (20,496 | ) | (23,662 | ) | (1,708 | ) | (3,086 | ) | ||||||||||
Tangible assets | (d) | $ | 45,183,307 | $ | 23,524,359 | $ | 22,823,740 | $ | 21,213,978 | $ | 20,460,883 | |||||||||
Common stock shares outstanding | (e) | 152,965,571 | 83,289,382 | 87,225,232 | 86,881,005 | 86,297,972 | ||||||||||||||
Common equity to assets | (a) / (c) | 11.87 | % | 9.99 | % | 10.42 | % | 10.09 | % | 9.80 | % | |||||||||
Tangible common equity to tangible assets | (b) / (d) | 9.01 | 9.32 | 9.72 | 9.13 | 8.79 | ||||||||||||||
Book value per common share | (a) / (e) | $ | 36.20 | $ | 28.44 | $ | 27.48 | $ | 24.91 | $ | 23.50 | |||||||||
Tangible book value per common share | (b) / (e) | 26.60 | 26.33 | 25.43 | 22.29 | 20.85 | ||||||||||||||
Recent Accounting Developments
For a description of new accounting standards issued, but not yet adopted, see "Note 3. Summary of Significant Accounting Policies" of Notes to Consolidated Financial Statements.
Item 7A. Quantitative and Qualitative Disclosures About Market Risk
Our results of operations depend, to a large degree, on our net interest income and our ability to manage interest rate risk. Although we manage other risks in the normal course of business, such as credit risk, liquidity risk and foreign currency risk, we consider interest rate risk to be one of our more significant market risks.
Interest Rate Risk
Our ALCO and the Finance Committee of our Board of Directors have established interest rate risk policy limits. Interest rate risk is defined as the exposure of net interest income and fair value of financial instruments (interest earning assets, deposits and borrowings) to movements in interest rates. The major sources of our interest rate risk are timing differences in the maturity and repricing characteristics of assets and liabilities, changes in the shape of the yield curve, changes in consumer behavior and changes in relationships between rate indices (basis risk). Management measures these risks and their impact in various ways, including through the use of simulation and valuation analyses. The interest rate scenarios may include gradual or rapid changes in interest rates, spread narrowing and widening, yield curve twists and changes in assumptions about consumer behavior in various interest rate scenarios. A mismatch between maturities, interest rate sensitivities and prepayment characteristics of assets and liabilities results in interest rate risk. We, like most financial institutions, have material interest rate risk exposure to changes in both short- and long-term interest rates, as well as variable interest rate indices (e.g., the prime rate or London Interbank Offered Rate).
68
Our ALCO is responsible for reviewing our interest rate sensitivity position and establishing policies to monitor and limit exposure to interest rate risk. ALCO manages our interest rate risk based on interest rate expectations and other factors. Our principal objective in managing our assets and liabilities is to provide maximum levels of net interest income and facilitate our funding needs, while maintaining acceptable levels of interest rate risk and liquidity risk.
ALCO primarily uses two interest rate risk tools with policy limits to evaluate our interest rate risk: net interest income simulation and economic value of equity ("EVE") analysis.
Management utilizes net interest income simulation models to estimate the near-term effects of changing interest rates on our net interest income. Net interest income simulation involves forecasting net interest income under a variety of scenarios, including the level of interest rates, the shape of the yield curve and the spreads between market interest rates. Management exercises its best judgment in making assumptions regarding events that management can influence, such as non-contractual deposit repricings and events outside management's control, including consumer behavior on loan and deposit activity and the effect that competition has on both loan and deposit pricing. These assumptions are subjective and, as a result, net interest income simulation results will differ from actual results due to the timing, magnitude and frequency of interest rate changes and changes in market conditions, consumer behavior and management strategies, among other factors. We perform various sensitivity analyses on new loan spreads, prepayment rates, basis risk and deposit assumptions.
The following table presents changes in our net interest income over a twelve month period if short- and long-term interest rates were to sustain an immediate change. These projections were based on our assets and liabilities remaining static over the next twelve months and factored into the simulation model.
Impact on Net Interest Income | |||||
(Dollars in millions) | December 31, 2019 | ||||
Immediate change in interest rates: | |||||
+200 basis points | $ | 32,200 | 2.1 | % | |
+100 basis points | 20,900 | 1.4 | |||
-100 basis points | (60,900 | ) | (4.0 | ) | |
Management also uses EVE to measure risk in the balance sheet that might not be taken into account in the net interest income simulation analysis. Net interest income simulation highlights exposure over a relatively short time period, while EVE analysis incorporates all cash flows over the estimated remaining life of all balance sheet positions. The valuation of the balance sheet, at a point in time, is defined as the discounted present value of asset cash flows minus the discounted present value of liability cash flows. EVE analysis addresses only the current balance sheet and does not incorporate the planned changes to interest-earning assets. As with the net interest income simulation model, EVE analysis is based on key assumptions about the timing and variability of balance sheet cash flows and does not take into account any potential responses by management to anticipated changes in interest rates.
Credit Risk
Credit risk is defined as the risk to our current or anticipated earnings or capital arising from an obligor's failures to meet the terms of any contract with us or otherwise failing to perform as agreed, such as the failure of customers and counterparties to meet their contractual obligations, as well as contingent exposures from unfunded loan commitments and letters of credit.
69
Our Enterprise Risk Management Committee meets at least quarterly and is responsible for monitoring the loan and lease portfolio composition and risk tolerance within the various segments of the portfolio. The Enterprise Risk Management Committee and TCF Financial's Board of Directors have adopted a Risk Appetite Statement to manage our credit risk by setting (i) a desired balance between asset classes, (ii) concentration limits based on loan type and business line and (iii) maximum tolerances for credit performance. To manage credit risk arising from lending and leasing activities, management has adopted and maintains underwriting policies and procedures and periodically reviews the appropriateness of these policies and procedures. Customers and guarantors or recourse providers are evaluated as part of initial underwriting processes and through periodic reviews. For consumer loans, credit scoring models are used to help determine eligibility for credit and terms of credit. These models are periodically reviewed to verify that they are predictive of borrower performance. Limits are established on the exposure to a single customer (including affiliates) and on concentrations for certain categories of customers. Loan and lease credit approval levels are established so that larger credit exposures receive managerial review at the appropriate level through the credit committees.
Management continuously monitors asset quality in order to manage our credit risk and to determine the appropriateness of valuation allowances, including, in the case of commercial loans, inventory finance loans and equipment finance loans and leases, a risk rating methodology under which a rating of one through nine is assigned to each loan or lease. The rating reflects management's assessment of the potential impact on repayment of the customer's financial and operational condition. Asset quality is monitored separately based on the type or category of loan or lease. The rating process allows management to better define our loan and lease portfolio risk profile. Management also uses various risk models to estimate probable impact on payment performance under various scenarios, both expected and unexpected.
We also have credit risk in our investment securities available-for-sale portfolio related to obligations of states and political subdivisions and non-agency collateralized mortgage obligations. We maintain a set of underwriting criteria and regularly monitor credit performance under the direction and supervision of the TCF Bank Credit Committee to manage this risk. The remainder of the investment securities available-for-sale portfolio and the investment securities held-to-maturity portfolio consist primarily of fixed-rate mortgage-backed securities issued and guaranteed by the FNMA and the FHLMC, and therefore credit risk is minimal. All investment related counterparties and transaction limits are reviewed and approved annually by both ALCO and the TCF Bank Credit Committee.
Liquidity Risk
Liquidity risk is defined as the risk to earnings or capital arising from our inability to meet our obligations when they come due without incurring unacceptable losses.
TCF Financial's primary source of cash flow is capital distributions from TCF Bank. TCF Bank may be required to receive regulatory approval prior to making any such distributions in the future and such distributions may be restricted by its federal banking regulators. TCF Bank's ability to make any such distributions will also depend on its earnings and ability to meet minimum regulatory capital requirements in effect during future periods. See "Item 1. Business - Regulation - Restrictions on Distributions", "Note 19. Regulatory Capital Requirements" and "Note 28. Parent Company Financial Information" of Notes to Consolidated Financial Statements for further information.
TCF Financial's Board of Directors have adopted a Liquidity Management Policy for TCF Bank to direct management of TCF Financial's liquidity risk. The objective of the Liquidity Management Policy is to ensure that TCF Bank meets its cash and collateral obligations promptly, in a cost-effective manner and with the highest degree of reliability. The maintenance of adequate levels of asset and liability liquidity will provide us with the ability to meet both expected and unexpected cash flows and collateral needs. Key liquidity ratios, asset liquidity levels and the amount available from funding sources are reported to ALCO on a monthly basis. TCF Bank's Liquidity Management Policy defines liquidity stress scenarios and establishes asset liquidity target ranges based on those stress scenarios that are deemed appropriate for its risk profile.
Our asset liquidity may be held in the form of on-balance sheet cash invested with the Federal Reserve Bank or other highly liquid marketable securities that are not pledged and can be sold or pledged to various counterparties under established agreements. Our liability liquidity is sourced primarily through deposits and other secured sources of funding. See "Item 7. Management's Discussion and Analysis - Consolidated Income Statement Analysis - Liquidity Management" for further information.
70
Foreign Currency Risk
We are also exposed to foreign currency risk as changes in the exchange rate of the Canadian dollar may impact our investment in TCFCFC. We enter into forward foreign exchange contracts in order to minimize the risk of changes in foreign exchange rates on its investment in and loans to TCFCFC. The values of forward foreign exchange contracts vary over their contractual lives as the related currency exchange rates fluctuate. We may also experience realized and unrealized gains or losses on forward foreign exchange contracts as a result of changes in foreign exchange rates. See "Note 3. Summary of Significant Accounting Policies" and "Note 23. Derivative Instruments" of Notes to Consolidated Financial Statements for further information.
LIBOR Transition
In 2017, the U.K. Financial Conduct Authority (the “FCA”) noted that market conditions raised serious questions about the future sustainability of LIBOR benchmarks. Many financial products, including mortgages and other consumer loans, commercial loans, corporate loans, various types of debt, derivatives and other securities, reference LIBOR to determine their applicable interest rate. The expected cessation of publication of LIBOR will impact the mechanics of floating rate financial instruments and contracts that reference LIBOR and mature after 2021. Certain of these financial products do not provide for alternative reference rates, and those that do may differ from the prior benchmark rates. The FCA subsequently announced that it had secured voluntary panel bank support of LIBOR through only 2021. As a result, central banks and regulators have convened working groups to find a suitable replacement index for LIBOR, and we are working to identify, assess and monitor risks associated with the expected discontinuation or unavailability of LIBOR, achieve operational readiness and engage impacted customers in connection with the transition.
71
Item 8. Financial Statements and Supplementary Data
Report of Independent Registered Public Accounting Firm
To the Shareholders and Board of Directors
TCF Financial Corporation:
Opinion on the Consolidated Financial Statements
We have audited the accompanying consolidated statements of financial condition of TCF Financial Corporation and subsidiaries (the Corporation) as of December 31, 2019 and 2018, the related consolidated statements of income, comprehensive income, equity, and cash flows for each of the years in the three‑year period ended December 31, 2019, and the related notes (collectively, the consolidated financial statements). In our opinion, the consolidated financial statements present fairly, in all material respects, the financial position of the Corporation as of December 31, 2019 and 2018, and the results of its operations and its cash flows for each of the years in the three‑year period ended December 31, 2019, in conformity with U.S. generally accepted accounting principles.
We also have audited, in accordance with the standards of the Public Company Accounting Oversight Board (United States) (PCAOB), the Corporation’s internal control over financial reporting as of December 31, 2019, based on criteria established in Internal Control - Integrated Framework (2013) issued by the Committee of Sponsoring Organizations of the Treadway Commission, and our report dated March 2, 2020 expressed an unqualified opinion on the effectiveness of the Corporation’s internal control over financial reporting.
Basis for Opinion
These consolidated financial statements are the responsibility of the Corporation’s management. Our responsibility is to express an opinion on these consolidated financial statements based on our audits. We are a public accounting firm registered with the PCAOB and are required to be independent with respect to the Corporation in accordance with the U.S. federal securities laws and the applicable rules and regulations of the Securities and Exchange Commission and the PCAOB.
We conducted our audits in accordance with the standards of the PCAOB. Those standards require that we plan and perform the audit to obtain reasonable assurance about whether the consolidated financial statements are free of material misstatement, whether due to error or fraud. Our audits included performing procedures to assess the risks of material misstatement of the consolidated financial statements, whether due to error or fraud, and performing procedures that respond to those risks. Such procedures included examining, on a test basis, evidence regarding the amounts and disclosures in the consolidated financial statements. Our audits also included evaluating the accounting principles used and significant estimates made by management, as well as evaluating the overall presentation of the consolidated financial statements. We believe that our audits provide a reasonable basis for our opinion.
Critical Audit Matters
The critical audit matters communicated below are matters arising from the current period audit of the consolidated financial statements that were communicated or required to be communicated to the audit committee and that: (1) relate to accounts or disclosures that are material to the consolidated financial statements and (2) involved our especially challenging, subjective, or complex judgments. The communication of critical audit matters does not alter in any way our opinion on the consolidated financial statements, taken as a whole, and we are not, by communicating the critical audit matters below, providing separate opinions on the critical audit matters or on the accounts or disclosures to which they relate.
72
Assessment of the fair value measurements of acquired loans and leases and the core deposit intangible in the Merger
As discussed in Note 3 to the consolidated financial statements, on August 1, 2019 (the Merger Date), legacy TCF Financial Corporation (Legacy TCF) merged into Chemical Financial Corporation (Chemical) as legal acquirer and surviving company (the Merger). The merger was accounted for as a business combination using the acquisition method of accounting with Legacy TCF as the accounting acquirer. Accordingly, Legacy TCF acquired loans and leases with a fair value of $15.7 billion and established a core deposit intangible (CDI) with a fair value of $138.2 million. The fair value of acquired loans and leases was based on a discounted cash flow methodology that projected principal and interest payments using key assumptions of probability of default (PD), loss given default (LGD), discount rate, and prepayment rate. The fair value of the CDI was based on an income approach methodology whereby projected net cash flow benefits were derived from estimating costs to carry deposits compared to alternative funding costs, and included key assumptions related to discount rate, deposit interest rates, customer attrition rates, costs of alternative funding, and net maintenance costs.
We identified the assessment of the fair value measurements of acquired loans and leases and the CDI in the Merger as a critical audit matter. These fair value measurements involved a high degree of measurement uncertainty and subjectivity, which required industry knowledge and experience to evaluate the measurements. Specifically, the assessment of these fair value measurements encompassed the evaluation of the methodologies of acquired loans and leases and the CDI, including the key assumptions and the inputs used to develop the key assumptions. The fair value measurements of the loans and leases and the CDI also included an evaluation of the mathematical accuracy of certain calculations.
The following are the primary procedures we performed to address the critical audit matter. Tested certain internal controls over the (1) development of the overall fair value methodologies, (2) determination of the key assumptions, as listed above, (3) evaluating the inputs used to develop key assumptions, (4) calculation of the fair value measurements, and (5) analysis of the fair value measurements results. We evaluated the Corporation’s process to develop the fair value measurements and key assumptions by testing certain inputs used to develop the assumptions and considered the relevance and reliability of such inputs and assumptions. We involved valuation professionals with industry knowledge and experience who assisted in the evaluation of the:
– | overall fair value measurement methodologies for compliance with U.S. generally accepted accounting principles, |
– | key assumptions, as listed above, and inputs used to develop those assumptions, that were used in the fair value measurements, |
– | development and application of the PD and LGD assumptions used in the loan and leases fair value measurement, |
– | individual risk ratings for acquired loans and leases, which are used in the selection of the PD assumption, for a selection of relationships within the commercial loan and leases portfolio, and |
– | mathematical accuracy of certain calculations within the fair value measurements. |
Assessment of the allowance for loan and lease losses related to loans and leases collectively evaluated for impairment
As discussed in Notes 3 and 8 to the consolidated financial statements, the Corporation’s allowance for loan and lease losses related to loans and leases collectively evaluated for impairment (the collective reserve) was $102.2 million of a total allowance of $113.1 million as of December 31, 2019. The Corporation estimated the collective reserve using methodologies that derive historical loss rates based on historical observation periods and loss emergence period assumptions. For the commercial loan and lease portfolio, such historical loss rates also incorporate risk ratings, and for certain commercial loans, the probability of default (PD) and loss given default (LGD). For the consumer loan portfolio, such historical loss rates also incorporate collateral fair values. The collective reserve includes adjustments for certain qualitative factors.
73
We identified the assessment of the collective reserve as a critical audit matter because it involved significant measurement uncertainty requiring subjective and complex auditor judgment, and knowledge and experience in the industry. Specifically, this assessment encompassed the evaluation of the collective reserve methodologies used to estimate the (1) historical loss rates, and their key inputs and assumptions, including the historical observation periods and loss emergence period assumptions for the commercial loan and lease portfolio and the consumer loan portfolio, risk ratings for the commercial loan and lease portfolio, PD and LGD for certain commercial loans, and collateral fair values for consumer loans; and (2) qualitative factors. The assessment included an evaluation of the mathematical accuracy of the collective reserve calculations. In addition, auditor judgment was required to evaluate the sufficiency of audit evidence obtained.
The following are the primary procedures we performed to address the critical audit matter. Tested certain internal controls over the (1) development of the methodologies over the collective reserve and qualitative factors, (2) determination of the key inputs and assumptions used to estimate the historical loss rates, (3) determination of the qualitative factors, (4) calculation of the collective reserve, and (5) analysis of the collective reserve results compared to relevant trends and ratios. We evaluated the relevance and reliability of data, inputs, and assumptions used in the collective reserve. We involved credit risk professionals with industry knowledge and experience who assisted in the evaluation of the:
– | collective reserve methodologies, including the key inputs and assumptions, for compliance with U.S. generally accepted accounting principles, |
– | length of the historical observation period assumptions used in (1) the historical loss rates for the commercial loan and lease portfolio, and the consumer loan portfolio, and (2) the PD and LGD for certain commercial loans, |
– | methodologies used to develop the loss emergence period assumptions for the commercial loan and lease portfolio and the consumer loan portfolio, |
– | individual risk ratings for a selection of relationships within the commercial loan and lease portfolio, |
– | fair value of collateral for consumer loans, |
– | qualitative factors and the effect of those factors on the collective reserve, and |
– | mathematical accuracy of the collective reserve calculations for the commercial loan and lease portfolio and the consumer loan portfolio. |
We evaluated the collective reserve by comparing current and historical reserve ratios and credit metrics. We also evaluated the results of the procedures performed to assess the sufficiency of the audit evidence obtained related to the collective reserve.
/s/ KPMG LLP
We have served as the Corporation's auditor since 1991.
Detroit, Michigan
March 2, 2020
74
TCF FINANCIAL CORPORATION AND SUBSIDIARIES
Consolidated Statements of Financial Condition
(Dollars in thousands, except per share data) | At December 31, 2019 | At December 31, 2018 | |||||
ASSETS | |||||||
Cash and cash equivalents: | |||||||
Cash and due from banks | $ | $ | |||||
Interest-bearing deposits with other banks | |||||||
Total cash and cash equivalents | |||||||
Federal Home Loan Bank and Federal Reserve Bank stocks, at cost | |||||||
Investment securities: | |||||||
Available-for-sale, at fair value | |||||||
Held-to-maturity, at amortized cost (fair value of $144,844 and $149,267) | |||||||
Total investment securities | |||||||
Loans and leases held-for-sale (includes $91,202 and $18,070 at fair value) | |||||||
Loans and leases | |||||||
Allowance for loan and lease losses | ( | ) | ( | ) | |||
Loans and leases, net | |||||||
Premises and equipment, net | |||||||
Goodwill | |||||||
Other intangible assets, net | |||||||
Loan servicing rights | |||||||
Other assets | |||||||
Total assets | $ | $ | |||||
LIABILITIES AND EQUITY | |||||||
Liabilities | |||||||
Deposits: | |||||||
Noninterest-bearing | $ | $ | |||||
Interest-bearing | |||||||
Total deposits | |||||||
Short-term borrowings | |||||||
Long-term borrowings | |||||||
Other liabilities | |||||||
Total liabilities | |||||||
Equity | |||||||
Preferred stock, $0.01 par value | |||||||
Authorized - 2,000,000 shares at December 31, 2019 and 30,000,000 shares at December 31, 2018 | |||||||
Issued and outstanding - 7,000 shares at both December 31, 2019 and December 31, 2018 | |||||||
Common stock, $1.00 par value at both December 31, 2019 and December 31, 2018 | |||||||
Authorized - 220,000,000 shares at December 31, 2019 and 142,268,000 shares at December 31, 2018 | |||||||
Issued - 152,965,571 shares at December 31, 2019 and 88,198,460 shares at December 31, 2018 | |||||||
Additional paid-in capital | |||||||
Retained earnings | |||||||
Accumulated other comprehensive income (loss) | ( | ) | |||||
Treasury stock at cost and other (4,909,069 Treasury shares at December 31, 2018) | ( | ) | ( | ) | |||
Total TCF Financial Corporation shareholders' equity | |||||||
Non-controlling interest | |||||||
Total equity | |||||||
Total liabilities and equity | $ | $ | |||||
See accompanying notes to consolidated financial statements.
75
TCF FINANCIAL CORPORATION AND SUBSIDIARIES
Consolidated Statements of Income
Year Ended December 31, | |||||||||||
(Dollars in thousands, except per share data) | 2019 | 2018 | 2017 | ||||||||
Interest income | |||||||||||
Interest and fees on loans and leases | $ | $ | $ | ||||||||
Interest on investment securities: | |||||||||||
Taxable | |||||||||||
Tax-exempt | |||||||||||
Interest on loans held-for-sale | |||||||||||
Interest on other earning assets | |||||||||||
Total interest income | |||||||||||
Interest expense | |||||||||||
Interest on deposits | |||||||||||
Interest on borrowings | |||||||||||
Total interest expense | |||||||||||
Net interest income | |||||||||||
Provision for credit losses | |||||||||||
Net interest income after provision for credit losses | |||||||||||
Noninterest income | |||||||||||
Leasing revenue | |||||||||||
Fees and service charges on deposit accounts | |||||||||||
Card and ATM revenue | |||||||||||
Net gains on sales of loans and leases | |||||||||||
Servicing fee revenue | |||||||||||
Wealth management revenue | |||||||||||
Net gains on investment securities | |||||||||||
Other | |||||||||||
Total noninterest income | |||||||||||
Noninterest expense | |||||||||||
Compensation and employee benefits | |||||||||||
Occupancy and equipment | |||||||||||
Lease financing equipment depreciation | |||||||||||
Net foreclosed real estate and repossessed assets | |||||||||||
Merger-related expenses | |||||||||||
Other | |||||||||||
Total noninterest expense | |||||||||||
Income before income tax expense | |||||||||||
Income tax expense (benefit) | ( | ) | |||||||||
Income after income tax expense (benefit) | |||||||||||
Income attributable to non-controlling interest | |||||||||||
Net income attributable to TCF Financial Corporation | |||||||||||
Preferred stock dividends | |||||||||||
Impact of preferred stock redemption | |||||||||||
Net income available to common shareholders | $ | $ | $ | ||||||||
Earnings per common share | |||||||||||
Basic | $ | $ | $ | ||||||||
Diluted | |||||||||||
Weighted-average common shares outstanding | |||||||||||
Basic | |||||||||||
Diluted | |||||||||||
See accompanying notes to consolidated financial statements.
76
TCF FINANCIAL CORPORATION AND SUBSIDIARIES
Consolidated Statements of Comprehensive Income
Year Ended December 31, | |||||||||||
(In thousands) | 2019 | 2018 | 2017 | ||||||||
Net income attributable to TCF Financial Corporation | $ | $ | $ | ||||||||
Other comprehensive income (loss), net of tax: | |||||||||||
Net unrealized gains (losses) on available-for-sale investment securities and interest-only strips | ( | ) | |||||||||
Net unrealized gains (losses) on net investment hedges | ( | ) | ( | ) | |||||||
Foreign currency translation adjustment | ( | ) | |||||||||
Recognized postretirement prior service cost | ( | ) | ( | ) | ( | ) | |||||
Total other comprehensive income (loss), net of tax | ( | ) | |||||||||
Comprehensive income | $ | $ | $ | ||||||||
See accompanying notes to consolidated financial statements.
77
TCF FINANCIAL CORPORATION AND SUBSIDIARIES
Consolidated Statements of Equity
TCF Financial Corporation | |||||||||||||||||||||||||||||||
Number of Shares Issued | Preferred Stock | Common Stock | Additional Paid-in Capital | Retained Earnings | Accumulated Other Comprehensive Income (Loss) | Treasury Stock and Other | Total | Non- controlling Interest | Total Equity | ||||||||||||||||||||||
(Dollars in thousands) | Preferred | Common | |||||||||||||||||||||||||||||
Balance, December 31, 2016 | $ | $ | $ | $ | $ | ( | ) | $ | ( | ) | $ | $ | $ | ||||||||||||||||||
Change in accounting principle | — | — | — | ( | ) | — | — | — | — | — | |||||||||||||||||||||
Balance, January 1, 2017 | ( | ) | ( | ) | |||||||||||||||||||||||||||
Reclassification of stranded tax effects from AOCI to retained earnings | — | — | — | — | — | ( | ) | — | — | — | — | ||||||||||||||||||||
Net income | — | — | — | — | — | — | — | ||||||||||||||||||||||||
Other comprehensive income (loss), net of tax | — | — | — | — | — | — | — | — | |||||||||||||||||||||||
Net investment by (distribution to) non-controlling interest | — | — | — | — | — | — | — | — | — | ( | ) | ( | ) | ||||||||||||||||||
Public offering of Series C Preferred Stock | — | — | — | — | — | — | — | ||||||||||||||||||||||||
Redemption of Series A Preferred Stock | ( | ) | — | ( | ) | — | — | ( | ) | — | — | ( | ) | — | ( | ) | |||||||||||||||
Repurchases of 226,848 shares of common stock | — | — | — | — | — | — | — | ( | ) | ( | ) | — | ( | ) | |||||||||||||||||
Dividends on 7.50% Series A Preferred Stock | — | — | — | — | — | ( | ) | — | — | ( | ) | — | ( | ) | |||||||||||||||||
Dividends on 6.45% Series B Preferred Stock | — | — | — | — | — | ( | ) | — | — | ( | ) | — | ( | ) | |||||||||||||||||
Dividends on 5.70% Series C Preferred Stock | — | — | — | — | — | ( | ) | — | — | ( | ) | — | ( | ) | |||||||||||||||||
Dividends on common stock of $0.59 per common share | — | — | — | — | — | ( | ) | — | — | ( | ) | — | ( | ) | |||||||||||||||||
Common shares purchased by TCF employee benefit plans | — | — | — | — | — | — | |||||||||||||||||||||||||
Stock compensation plans, net of tax | — | ( | ) | — | ( | ) | — | — | — | — | |||||||||||||||||||||
Change in shares held in trust for deferred compensation plans, at cost | — | — | — | — | ( | ) | — | — | — | — | — | ||||||||||||||||||||
Balance, December 31, 2017 | $ | $ | $ | $ | $ | ( | ) | $ | ( | ) | $ | $ | $ | ||||||||||||||||||
Change in accounting principle | — | — | — | — | — | ( | ) | — | — | ( | ) | — | ( | ) | |||||||||||||||||
Balance, January 1, 2018 | ( | ) | ( | ) | |||||||||||||||||||||||||||
Net income | — | — | — | — | — | — | — | ||||||||||||||||||||||||
Other comprehensive income (loss), net of tax | — | — | — | — | — | — | ( | ) | — | ( | ) | — | ( | ) | |||||||||||||||||
Net investment by (distribution to) non-controlling interest | — | — | — | — | — | — | — | — | — | ( | ) | ( | ) | ||||||||||||||||||
Redemption of Series B Preferred Stock | ( | ) | — | ( | ) | — | — | ( | ) | — | — | ( | ) | — | ( | ) | |||||||||||||||
Repurchases of 4,668,722 shares of common stock | — | — | — | — | — | — | — | ( | ) | ( | ) | — | ( | ) | |||||||||||||||||
Dividends on 6.45% Series B Preferred Stock | — | — | — | — | — | ( | ) | — | — | ( | ) | — | ( | ) | |||||||||||||||||
Dividends on 5.70% Series C Preferred Stock | — | — | — | — | — | ( | ) | — | — | ( | ) | — | ( | ) | |||||||||||||||||
Dividends on common stock of $1.18 per common share | — | — | — | — | — | ( | ) | — | — | ( | ) | — | ( | ) | |||||||||||||||||
Common stock warrants exercised | — | — | ( | ) | — | — | — | — | — | — | |||||||||||||||||||||
Common shares purchased by TCF employee benefit plans | — | — | — | — | — | — | |||||||||||||||||||||||||
Stock compensation plans, net of tax | — | — | — | — | — | ||||||||||||||||||||||||||
Change in shares held in trust for deferred compensation plans, at cost | — | — | — | — | ( | ) | — | — | — | — | — | ||||||||||||||||||||
Balance, December 31, 2018 | $ | $ | $ | $ | $ | ( | ) | $ | ( | ) | $ | $ | $ | ||||||||||||||||||
See accompanying notes to consolidated financial statements.
78
TCF FINANCIAL CORPORATION AND SUBSIDIARIES
Consolidated Statements of Equity, Continued
TCF Financial Corporation | |||||||||||||||||||||||||||||||
Number of Shares Issued | Preferred Stock | Common Stock | Additional Paid-in Capital | Retained Earnings | Accumulated Other Comprehensive Income (Loss) | Treasury Stock and Other | Total | Non- controlling Interest | Total Equity | ||||||||||||||||||||||
(Dollars in thousands) | Preferred | Common | |||||||||||||||||||||||||||||
Balance, December 31, 2018 | $ | $ | $ | $ | $ | ( | ) | $ | ( | ) | $ | $ | $ | ||||||||||||||||||
Net income | — | — | — | — | — | — | — | ||||||||||||||||||||||||
Other comprehensive income (loss), net of tax | — | — | — | — | — | — | — | — | |||||||||||||||||||||||
Reverse merger with Chemical Financial Corporation | — | — | — | — | — | ||||||||||||||||||||||||||
Net investment by (distribution to) non-controlling interest | — | — | — | — | — | — | — | — | — | ( | ) | ( | ) | ||||||||||||||||||
Repurchases of 2,111,725 shares of common stock | — | ( | ) | — | ( | ) | ( | ) | — | — | ( | ) | ( | ) | — | ( | ) | ||||||||||||||
Dividends on 5.70% Series C Preferred Stock | — | — | — | — | — | ( | ) | — | — | ( | ) | — | ( | ) | |||||||||||||||||
Dividends on common stock of $1.29 per common share | — | — | — | — | — | ( | ) | — | — | ( | ) | — | ( | ) | |||||||||||||||||
Stock compensation plans, net of tax | — | ( | ) | — | ( | ) | — | — | — | ||||||||||||||||||||||
Change in shares held in trust for deferred compensation plans, at cost | — | — | — | — | ( | ) | — | — | — | — | — | ||||||||||||||||||||
Balance, December 31, 2019 | $ | $ | $ | $ | $ | $ | ( | ) | $ | $ | $ | ||||||||||||||||||||
See accompanying notes to consolidated financial statements.
79
TCF FINANCIAL CORPORATION AND SUBSIDIARIES
Consolidated Statements of Cash Flows
Year Ended December 31, | |||||||||||
(In thousands) | 2019 | 2018 | 2017 | ||||||||
Cash flows from operating activities | |||||||||||
Net income | $ | $ | $ | ||||||||
Adjustments to reconcile net income to net cash provided by (used in) operating activities: | |||||||||||
Provision for credit losses | |||||||||||
Share-based compensation expense | |||||||||||
Depreciation and amortization | |||||||||||
Impairment of goodwill and other intangible assets | |||||||||||
Provision (benefit) for deferred income taxes | ( | ) | |||||||||
Net gains on sales of assets | ( | ) | ( | ) | ( | ) | |||||
Proceeds from sales of loans and leases held-for-sale | |||||||||||
Originations of loans and leases held-for-sale, net of repayments | ( | ) | ( | ) | ( | ) | |||||
Impairment of loan servicing rights | |||||||||||
Net change in other assets | ( | ) | ( | ) | ( | ) | |||||
Net change in other liabilities | |||||||||||
Other, net | ( | ) | ( | ) | ( | ) | |||||
Net cash provided by (used in) operating activities | |||||||||||
Cash flows from investing activities | |||||||||||
Proceeds from sales of investment securities available-for-sale | |||||||||||
Proceeds from maturities of and principal collected on investment securities available-for-sale | |||||||||||
Purchases of investment securities available-for-sale | ( | ) | ( | ) | ( | ) | |||||
Proceeds from maturities of and principal collected on investment securities held-to-maturity | |||||||||||
Purchases of investment securities held-to-maturity | ( | ) | ( | ) | ( | ) | |||||
Redemption of Federal Home Loan Bank stock | |||||||||||
Purchases of Federal Home Loan Bank stock | ( | ) | ( | ) | ( | ) | |||||
Proceeds from sales of loans and leases | |||||||||||
Loan and lease originations and purchases, net of principal collected | ( | ) | ( | ) | ( | ) | |||||
Proceeds from sales of other assets | |||||||||||
Purchases of premises and equipment and lease equipment | ( | ) | ( | ) | ( | ) | |||||
Net cash acquired (paid) in business combinations | ( | ) | |||||||||
Other, net | ( | ) | |||||||||
Net cash provided by (used in) investing activities | ( | ) | ( | ) | |||||||
Cash flows from financing activities | |||||||||||
Net change in deposits | ( | ) | |||||||||
Net change in short-term borrowings | ( | ) | |||||||||
Proceeds from long-term borrowings | |||||||||||
Payments on long-term borrowings | ( | ) | ( | ) | ( | ) | |||||
Payments on liabilities related to acquisition and portfolio purchase | ( | ) | ( | ) | ( | ) | |||||
Redemption of Series B preferred stock | ( | ) | |||||||||
Net proceeds from public offering of Series C preferred stock | |||||||||||
Redemption of Series A preferred stock | ( | ) | |||||||||
Repurchases of common stock | ( | ) | ( | ) | ( | ) | |||||
Common shares sold to TCF employee benefit plans | |||||||||||
Dividends paid on preferred stock | ( | ) | ( | ) | ( | ) | |||||
Dividends paid on common stock | ( | ) | ( | ) | ( | ) | |||||
Exercise of stock options | ( | ) | ( | ) | |||||||
Payments related to tax-withholding upon conversion of share-based awards | ( | ) | ( | ) | ( | ) | |||||
Net investment by (distribution to) non-controlling interest | ( | ) | ( | ) | ( | ) | |||||
Net cash provided by (used in) financing activities | ( | ) | |||||||||
Net change in cash and due from banks | ( | ) | |||||||||
Cash and cash equivalents at beginning of period | |||||||||||
Cash and cash equivalents at end of period | $ | $ | $ | ||||||||
Supplemental disclosures of cash flow information | |||||||||||
Cash paid (received) for: | |||||||||||
Interest on deposits and borrowings | $ | $ | $ | ||||||||
Income taxes, net | ( | ) | |||||||||
Noncash activities: | |||||||||||
Transfer of loans and leases to other assets | |||||||||||
Transfer of loans and leases from held for investment to held for sale, net | |||||||||||
See accompanying notes to consolidated financial statements.
80
TCF FINANCIAL CORPORATION AND SUBSIDIARIES
Notes to Consolidated Financial Statements
Note 1. Basis of Presentation
On August 1, 2019 (the "Merger Date"), TCF Financial Corporation, a Delaware corporation ("Legacy TCF"), merged with and into Chemical Financial Corporation, a Michigan corporation ("Chemical"), with Chemical continuing as the surviving legal corporation (the "Merger"). Immediately following the Merger, Chemical’s wholly owned bank subsidiary, Chemical Bank, a Michigan state-chartered bank, merged with and into Legacy TCF’s wholly owned bank subsidiary, TCF National Bank, a national banking association, with TCF National Bank surviving the merger (“TCF Bank”). Upon completion of the Merger, Chemical was renamed TCF Financial Corporation. TCF Financial Corporation (together with its direct and indirect subsidiaries, "we," "us," "our," "TCF" or the "Corporation"), is a financial holding company, headquartered in Detroit, Michigan. TCF Bank has its main office in Sioux Falls, South Dakota. References herein to "TCF Financial" refer to TCF Financial Corporation on an unconsolidated basis.
The Merger was accounted for as a reverse merger using the acquisition method of accounting, therefore, Legacy TCF was deemed the acquirer for financial reporting purposes, even though Chemical was the legal acquirer. Accordingly, Legacy TCF's historical financial statements are the historical financial statements of the combined company for all periods before the Merger Date. TCF's results of operations for 2019 include the results of operations of Chemical on and after August 1, 2019. Results for periods before August 1, 2019 reflect only those of Legacy TCF and do not include the results of operations of Chemical. The number of shares issued and outstanding, earnings per share, additional paid-in-capital, dividends paid and all references to share quantities of TCF have been retrospectively restated to reflect the equivalent number of shares issued in the Merger as the Merger was treated as a reverse merger. See "Note 2. Merger" for further information. In addition, the assets and liabilities of Chemical as of the Merger Date have been recorded at their estimated fair value and added to those of Legacy TCF.
TCF Bank operates bank branches primarily located in Michigan, Illinois and Minnesota with additional locations in Arizona, Colorado, Ohio, South Dakota and Wisconsin (TCF's "primary banking markets"). Through its direct subsidiaries, TCF Bank provides a full range of consumer-facing and commercial services, including consumer and commercial banking, trust and wealth management, and specialty leasing and lending products and services to consumers, small businesses and commercial customers.
The accompanying consolidated financial statements have been prepared in conformity with U.S. generally accepted accounting principles ("GAAP"). The preparation of financial statements in conformity with GAAP requires management to make estimates and assumptions that affect the reported amounts of assets and liabilities, disclosure of contingent assets and liabilities at the date of the financial statements and the reported amount of revenues and expenses during the reporting period. These estimates are based on information available to management at the time the estimates are made. Actual results could differ from those estimates. All significant intercompany accounts and transactions have been eliminated in consolidation. Certain reclassifications have been made to prior period financial statements to conform to the current period presentation.
In connection with the Merger, effective August 1, 2019, the Corporation renamed its Wholesale Banking segment to Commercial Banking to align with the way the Corporation is now managed. In addition, activity that was related to small business banking and private banking were moved from the Commercial Banking segment to the Consumer Banking segment. The Merger did not have any impact on Legacy TCF goodwill balances. The revised presentation of previously reported segment data has been applied retroactively for all periods presented in these financial statements. See "Note 25. Reportable Segments" for further information.
81
Note 2. Merger
As described in Note 1. Basis of Presentation, on August 1, 2019, the Corporation completed the Merger with Legacy TCF.
The Merger was an all-stock transaction. Pursuant to the merger agreement, on the Merger Date, each holder of Legacy TCF common stock received 0.5081 shares (the "Exchange Ratio") of TCF's common stock for each share of Legacy TCF common stock held. Each outstanding share of common stock of Chemical remained outstanding and was unaffected by the Merger other than by the change of the Corporation’s name from Chemical Financial Corporation to TCF Financial Corporation. As of the effective time of the Merger on August 1, 2019, TCF Financial had approximately 153.5 million shares of common stock outstanding. On the Merger Date, the shares of Legacy TCF common stock, which previously traded under the ticker symbol "TCF" on the New York Stock Exchange (the "NYSE"), ceased trading on, and were delisted from, the NYSE. Following the Merger, TCF Financial common stock continues to trade on the Nasdaq Stock Market (“NASDAQ”), but its ticker symbol changed from "CHFC" to "TCF" effective August 1, 2019.
Pursuant to the merger agreement, each outstanding share of Legacy TCF 5.70 % Series C Non-Cumulative Perpetual Preferred Stock, with a liquidation preference of $25,000 per share (the "Legacy TCF Preferred Stock") was converted into the right to receive one share of newly created 5.70 % Series C Non-Cumulative Perpetual Preferred Stock of TCF, with a liquidation preference of $25,000 per share (the "New TCF Preferred Stock"), and each depository share representing 1/1000th of a share of Legacy TCF Preferred Stock was converted into one depositary share representing 1/1000th of a share of New TCF Preferred Stock. Immediately following the effective time of the Merger, as of August 1, 2019, TCF Financial had 7,000 shares of New TCF Preferred Stock outstanding and 7.0 million related depositary shares outstanding.
The Merger constituted a business combination and was accounted for as a reverse merger using the acquisition method of accounting, therefore, Legacy TCF was deemed the acquirer for financial reporting purposes even though Chemical was the legal acquirer. As a result, the historical financial statements of Legacy TCF became the historical financial statements of the combined company. In addition, the assets acquired, including the intangible assets identified, and assumed liabilities of Chemical as of the Merger Date, have been recorded at their estimated fair value and added to those of Legacy TCF. In many cases, the determination of fair value required management to make estimates about discount rates, expected future cash flows, market conditions and other future events that are highly subjective in nature and subject to change.
As the legal acquirer, Chemical (now TCF Financial Corporation) issued approximately 81.9 million shares of TCF Financial common stock in connection with the Merger, which represented approximately 53 % of the voting interests in TCF Financial upon completion of the Merger. Guidance in Accounting Standards Codification ("ASC") 805-40-30-2 explains that the purchase price in a reverse acquisition is determined based on “the number of equity interests the legal acquiree would have had to issue to give the owners of the legal acquirer the same percentage equity interest in the combined entity that results from the reverse acquisition.” The first step in calculating the purchase price in the Merger is to determine the ownership of the combined company following the Merger. The table below summarizes the ownership of the combined company ("TCF Financial") following the Merger, as well as the market capitalization of the combined company using shares of Chemical and Legacy TCF common stock outstanding at July 31, 2019 and Chemical’s closing price on July 31, 2019.
(Dollars in thousands) | TCF Financial Ownership and Market Value | ||||||||
Number of Chemical Outstanding Shares | Percentage Ownership | Market Value at $42.04 Chemical Share Price | |||||||
Legacy TCF shareholders | % | $ | |||||||
Chemical shareholders | |||||||||
Total | $ | ||||||||
82
Next, the hypothetical number of shares Legacy TCF would have to issue to give Chemical owners the same percentage ownership in the combined company is calculated in the table below (based on shares of Legacy TCF common stock outstanding at July 31, 2019):
Hypothetical Legacy TCF Ownership | ||||||
Number of Legacy TCF Outstanding Shares | Percentage Ownership | |||||
Legacy TCF shareholders | % | |||||
Chemical shareholders | ||||||
Total | ||||||
Finally, the purchase price is calculated based on the number of hypothetical shares of Legacy TCF common stock issued to Chemical shareholders multiplied by the share price as demonstrated in the table below.
(Dollars in thousands, except per share data) | ||||
Number of hypothetical Legacy TCF shares issued to Chemical shareholders | ||||
Legacy TCF market price per share as of July 31, 2019 | $ | |||
Purchase price determination of hypothetical Legacy TCF shares issued to Chemical shareholders | ||||
Value of Chemical stock options hypothetically converted to options to acquire shares of Legacy TCF common stock | ||||
Cash in lieu of fractional shares | ||||
Purchase price consideration | $ | |||
83
The following table provides the purchase price allocation as of the Merger Date and the assets acquired and liabilities assumed at their estimated fair value as of the Merger Date as recorded by the Corporation. We recorded the estimate of fair value based on initial valuations available at the Merger Date and these estimates were considered preliminary as of September 30, 2019, and subject to adjustment for up to one year after the Merger Date. While we believe that the information available on the Merger Date provided a reasonable basis for estimating fair value, we expect that we may obtain additional information and evidence during the measurement period that would result in changes to the estimated fair value amounts. The measurement period ends on the earlier of one year after the Merger Date or the date we are able to determine that we have obtained all necessary information about the facts and circumstances that existed as of Merger Date. During the fourth quarter of 2019, we obtained additional information and evidence on certain acquired assets and assumed liabilities and adjusted the estimated fair value accordingly. We anticipate finalizing all valuations and recording final adjustments during the first quarter of 2020. These adjustments include: (i) changes in the estimated fair value of loans and leases acquired, (ii) changes in deferred tax assets related to fair value estimates and changes in the expected realization of items considered to be net operating loss carryforwards and (iii) changes in goodwill as a result of the net effect of any adjustments.
(In thousands) | |||
Purchase price consideration: | |||
Stock | $ | ||
Fair value of assets acquired(1): | |||
Cash and cash equivalents | |||
Federal Home Loan Bank and Federal Reserve Bank stocks | |||
Investment securities | |||
Loans held-for-sale | |||
Loans and leases | |||
Premises and equipment | |||
Loan servicing rights | |||
Other intangible assets | |||
Net deferred tax asset(2) | |||
Other assets | |||
Total assets acquired | |||
Fair value of liabilities assumed(1): | |||
Deposits | |||
Short-term borrowings | |||
Long-term borrowings | |||
Other liabilities | |||
Total liabilities assumed | |||
Fair value of net identifiable assets | |||
Goodwill resulting from Merger(1) | $ | ||
(1) | All amounts were previously reported in the Corporation's Quarterly Report on Form 10-Q for the three- and nine-month periods ended September 30, 2019, with the exception of the following adjustments to fair value based on additional information obtained in the the fourth quarter of 2019: (i) loans and leases ($ |
(2) | Net deferred tax asset includes acquisition-related fair value adjustments, loss and tax credit carry forwards, and deferred tax impacts of loan servicing rights and core deposit and customer intangibles. |
As described in more detail in Note 3. Summary of Significant Accounting Policies below, all Chemical loans and leases were recorded at their estimated fair value as of the Merger Date with no carryover of the related allowance for loan and lease losses. The acquired loans and leases were segregated into two classifications at acquisition, purchased credit impaired (“PCI”) loans accounted for under the provisions of Accounting Standards Codification ("ASC") Topic 310-30, and purchased nonimpaired loans and leases, also referred to as purchased loans and leases. The excess of cash flows expected to be collected over the estimated fair value of PCI loans is referred to as the accretable yield and is accreted into interest income over the estimated remaining life of the loan using the effective yield method. The difference between the contractually required payments and the cash flows expected to be collected at acquisition, considering the impact of prepayment and estimates of future credit losses expected to be incurred, is referred to the nonaccretable difference.
84
Information regarding acquired loans and leases included in loans and leases acquired at the Merger Date was as follows:
(In thousands) | |||
PCI loans: | |||
Contractually required payments receivable | $ | ||
Nonaccretable difference | ( | ) | |
Expected cash flows | |||
Accretable yield | |||
Fair value of PCI loans | $ | ||
Purchased nonimpaired loans and leases: | |||
Unpaid principal balance | $ | ||
Fair value discount | ( | ) | |
Fair value at acquisition | |||
Total fair value at acquisition | $ | ||
Supplemental disclosures of cash flow information related to investing and financing activities regarding the Merger are as follows for the year ended December 31, 2019:
(In thousands) | |||
Business combination | |||
Fair value of tangible assets acquired | $ | ||
Goodwill, loan servicing rights and other identifiable intangible assets acquired | |||
Liabilities assumed | |||
Common stock and stock options converted | |||
Other intangible assets consisted of core deposits and customer relationship intangibles with estimated fair values at the Merger Date of $138.2 million and $21.3 million, respectively. Core deposit intangibles are being amortized over a weighted-average life of ten years on an accelerated basis. Customer relationship intangibles are being amortized over a weighted-average life of 15.6 years based on expected economic benefits of the underlying intangible assets. The weighted-average life of amortizable intangibles acquired in the Merger was eleven years .
As a result of the Merger, we recorded $1.1 billion of goodwill. Of the $1.1 billion, $522.0 million was attributable to Consumer Banking and $623.1 million was attributable to Commercial Banking. The goodwill recorded is not deductible for income tax purposes.
85
Pro Forma Combined Results of Operations (Unaudited) The following pro forma financial information presents the consolidated results of operations of Legacy TCF and Chemical as if the Merger had occurred as of January 1, 2017 with pro forma adjustments. The pro forma adjustments give effect to any change in interest income due to the accretion of the discount (amortization of premium) associated with the fair value adjustments to acquired loans and leases, any change in interest expense due to estimated premium amortization/discount accretion associated with the fair value adjustments to acquired time deposits and borrowings and other debt and the amortization of the core deposit intangible that would have resulted had the deposits been acquired as of January 1, 2017. Merger-related expenses incurred by TCF during the year ended December 31, 2019 are not reflected in the pro forma amounts. The pro forma information does not necessarily reflect the results of operations that would have occurred had Legacy TCF merged with Chemical at the beginning of 2017. Anticipated cost savings that have not yet been realized are also not reflected in the pro forma amounts for the years ended December 31, 2019, 2018 and 2017.
Year Ended December 31, | |||||||||||
(In thousands, except per share data) | 2019 | 2018 | 2017 | ||||||||
Net interest income and other noninterest income | $ | $ | $ | ||||||||
Net income | |||||||||||
Net income available to common shareholders | |||||||||||
Earnings per share: | |||||||||||
Basic | $ | $ | $ | ||||||||
Diluted | |||||||||||
Note 3. Summary of Significant Accounting Policies
Business Combinations Pursuant to the guidance of ASC Topic 805 ("ASC 805"), the Corporation recognized assets acquired, including identified intangible assets, and the liabilities assumed in mergers and acquisitions at their fair values as of the acquisition date, with the acquisition and merger-related transaction and restructuring costs expensed in the period incurred.
ASC 805 affords a measurement period beyond the acquisition date that allows the opportunity to finalize the acquisition accounting in the event that new information is identified that existed as of the acquisition date but was not known or available at that time. This measurement period ends on the earlier of one year after the acquisition or the date information about the facts and circumstances that existed at the acquisition are available. TCF anticipates that measurement period adjustments may arise from adjustments to the fair values of Chemical's assets and liabilities recorded at the Merger Date, as additional information and evidence is obtained. In the event that a measurement period adjustment is identified, TCF will recognize the adjustment as part of its acquisition accounting, which may result in an adjustment to goodwill in the period the adjustment was identified.
In determining the estimated fair value of assets acquired as part of the Merger with Chemical, including the estimated fair value of acquired loans and leases and a core deposit intangible, management relied on a framework of internal controls in place to evaluate the relevance and reliability of key inputs and assumptions used in the fair value and to ensure the mathematical accuracy used to determine an appropriate fair value. Acquired loans and leases were valued using a discounted cash flow methodology with adjustments to contractual cash flows for probability of default, loss given default, discount rates and prepayments rates. Management based the assumptions used on historical data or available market information. The fair value of the core deposit intangible was estimated under the income approach based on discounted net cash flows. This estimate was determined by projecting net cash flow benefits derived from estimating costs to carry deposits compared to alternative funding costs, and includes key assumptions related to deposit interest rates, customer attrition rates, costs of alternative funding, discount rate, and net maintenance costs.
86
Fair Value Measurements Fair value for assets and liabilities measured at fair value on a recurring or nonrecurring basis refers to the price that would be received to sell an asset or paid to transfer a liability (an exit price) in an orderly transaction between market participants in the market in which the reporting entity transacts such sales or transfers based on the assumptions market participants would use when pricing an asset or liability. Assumptions are developed based on prioritizing information within a fair value hierarchy that gives the highest priority to quoted prices in active markets and the lowest priority to unobservable data, such as the reporting entity's own data.
The Corporation may choose to elect the fair value measurement option on eligible financial instruments. Unrealized gains and losses on items for which the fair value measurement option has been elected are reported in earnings at each subsequent reporting date. At December 31, 2019 and 2018, the Corporation had elected the fair value option on certain loans, primarily residential mortgage loans, it originates for the purpose of selling in secondary markets. The Corporation has not elected the fair value option for any other financial assets or liabilities as of December 31, 2019.
Allowance for Loan and Lease Losses The Corporation's reserving methodology used to determine the appropriate level of the allowance for loan and lease losses is a critical accounting estimate. The allowance for loan and lease losses is maintained at a level believed to be appropriate to provide for probable loan and lease losses incurred in the portfolio as of the balance sheet date, including known or anticipated problem loans and leases, as well as for loans and leases which are not currently known to require specific allowances. As discussed in the Loans and Leases Acquired in a Business Combination paragraph below, acquired loans and leases do not have an allowance for loan and lease losses recorded until there is a deterioration in credit subsequent to acquisition. Loans classified as troubled debt restructuring ("TDR") loans are considered impaired loans, along with nonaccrual commercial loans and leases and certain consumer loans. The Corporation individually evaluates impairment on all impaired loans and leases. All other loans and leases are evaluated collectively for impairment. A reserve for unfunded credit commitments such as letters of credit, financial guarantees and binding unfunded loan commitments is recorded in other liabilities on the Consolidated Statements of Financial Condition.
Loan impairment on consumer residential mortgage and home equity TDR loans is a key component of the allowance for loan and lease losses. Impairment is generally based on the present value of the expected future cash flows discounted at the loan's initial effective interest rate, unless the loans are collateral dependent, in which case loan impairment is based on the fair value of the collateral less estimated selling costs. Impairment on other consumer loans is generally based on the fair value of collateral less estimated selling costs.
Commercial TDR and impaired loans and leases are generally measured at the present value of the expected future cash flows discounted at the initial effective interest rate of the loan or lease, unless the loan or lease is collateral dependent, in which case impairment is based on the fair value of collateral less estimated selling costs; however, if payment or satisfaction of the loan or lease is dependent on the operation, rather than the sale of the collateral, the impairment does not include estimated selling costs.
The impairment for all other loans and leases is evaluated collectively by various characteristics. The collective evaluation of incurred losses in these portfolios is based on their historical loss rates multiplied by the respective loss emergence periods. Factors utilized in the determination of the amount of the allowance include historical trends in loss rates, a portfolio's overall risk characteristics, changes in its character or size, risk rating migration, delinquencies, collateral values, economic outlook and prevailing economic conditions. The various quantitative and qualitative factors used in the methodologies are reviewed on a periodic basis.
87
Loans and leases are charged off to the extent they are deemed to be uncollectible. Charge-offs are utilized in the historical data in calculating the allowance for loan and lease losses. Consumer residential mortgage and home equity loans are charged off to the estimated fair value of the underlying collateral, less estimated selling costs, no later than 150 days past due. Additional review of the fair value, less estimated costs to sell, compared with the recorded value occurs upon foreclosure and additional charge-offs are recorded if necessary. Commercial loans and leases that are considered collateral dependent are charged off to estimated fair value, less estimated selling costs when it becomes probable, based on current information and events, that all principal and interest amounts will not be collectible in accordance with their contractual terms. Consumer installment loans will generally be charged off in full no later than 120 days past due, unless repossession is reasonably assured and in process, in which case the loan would be charged off to the fair value of the collateral, less estimated selling costs. Consumer loans in bankruptcy status may be charged down to the fair value of the collateral, less estimated selling costs, within 60 days past due based on specific criteria. Deposit account overdrafts are reported in other loans. Net losses on uncollectible overdrafts are reported as net charge-offs in the allowance for loan and lease losses within 60 days from the date of overdraft. Loans that are not collateral dependent are charged off when deemed uncollectible based on specific facts and circumstances.
The amount of the allowance for loan and lease losses significantly depends on management's estimates of key factors and assumptions affecting valuation, appraisals of collateral, evaluations of performance and status and the amounts and timing of future cash flows expected to be received. Such estimates, appraisals, evaluations and cash flows may be subject to frequent adjustments due to changing economic prospects of borrowers, lessees or properties. These estimates are reviewed quarterly and adjustments, if necessary, are recorded in the provision for credit losses in the periods in which they become known.
Investment Securities Held-to-Maturity Investment securities held-to-maturity are carried at cost and adjusted for amortization of premiums or accretion of discounts using a level yield method; however, transfers of investment securities available-for-sale to investment securities held-to-maturity are made at fair value at the date of transfer. The unrealized holding gain or loss at the date of each transfer is retained in accumulated other comprehensive income (loss) and in the carrying value of the held-to-maturity investment security. Such amounts are then amortized over the remaining life of the transferred investment security as an adjustment of the yield on those securities. The Corporation evaluates investment securities held-to-maturity for other than temporary impairment on a quarterly basis. Declines in value considered other than temporary, if any, would be recorded in noninterest income within net gains on investment securities. See "Note 6. Investment Securities" for further information on investment securities held-to-maturity.
88
Loans and Leases Held-for-Sale Loans and leases designated as held-for-sale are generally carried at the lower of cost or fair value. Any amount by which cost exceeds fair value is initially recorded as a valuation allowance and subsequently recorded in net gains (losses) on sales of loans and leases when sold. Fair value calculations include the servicing value of loans as well as any accrued interest. From time to time, management identifies and designates, primarily consumer loans held in the loan portfolios, for sale. These loans are transferred to loans and leases held-for-sale at the lower of cost or fair value at the time of transfer net of any associated allowance for loan and lease losses.
Certain residential mortgage loans held-for-sale are recorded at fair value under the elected fair value option as prescribed by ASC Topic 820, Fair Value Measurements and Disclosures ("ASC 820"). The Corporation generally sells conforming long-term fixed interest rate mortgage loans it originates in the secondary market. Gains on the sales of these loans are determined using the specific identification method. The Corporation sells residential mortgage loans in the secondary market on servicing retained and servicing released bases. The fair value election allows for a more effective offset of the changes in fair value of residential mortgage loans held-for-sale and the derivative instruments used to economically hedge them without having to apply complex hedge accounting provisions. Residential mortgage loans held-for-sale are carried at fair value, with changes in fair value recorded through earnings.
Loans and Leases Held-for-Investment Loans and leases designated as held-for-investment are reported at historical cost including net direct fees and costs associated with originating and acquiring loans and leases. The net direct fees and costs for sales-type leases are offset against revenues recorded at the commencement of sales-type leases. Discounts and premiums on acquired loans, net direct fees and costs, unearned discounts and finance charges, and unearned lease income are amortized to interest income using methods that approximate a level yield over the estimated remaining lives of the loans and leases. Net direct fees and costs on all lines of credit are amortized on a straight line basis to fees and service charges over the contractual life of the line of credit and adjusted for payoffs. See "Note 7. Loans and Leases" for further information on loans and leases.
Loans and Leases Acquired in a Business Combination The Corporation record loans and leases acquired in a business combination at fair value at the acquisition date and the fair value discount or premium is recognized as an adjustment to yield over the remaining life of each loan or lease. Credit discounts are included in the determination of fair value; therefore, an allowance for loan and lease losses is not recorded at the acquisition date. Purchased and acquired loans and leases are evaluated at the acquisition date and classified as either (i) loans and leases purchased without evidence of deteriorated credit quality since origination, or (ii) loans purchased with evidence of deteriorated credit quality since origination for which it is probable that all contractually required payments will not be collected, referred to as purchase credit impaired (PCI) loans. PCI loans are considered to be impaired and are accounted for under ASC Topic 310-30, Loans and Debt Securities Acquired with Deteriorated Credit Quality ("ASC 310-30"). In determining whether an acquired loan should be classified as a PCI loan, the Corporation must make numerous assumptions, interpretations and judgments using internal and third-party credit quality information to determine whether or not it is probable that the Corporation will be able to collect all contractually required payments. This is a point in time assessment and is inherently subjective due to the nature of the available information and judgment involved. Evidence of credit quality deterioration as of the acquisition date may include statistics such as past due and nonaccrual status, recent borrower credit scores and loan-to-value percentages. The excess of cash flows expected to be collected over the estimated fair value of PCI loans is referred to as the accretable yield and is accreted into interest income over the estimated remaining life of the loan using the effective yield method. The Corporation estimates the expected cash flows based on the expected remaining life of the loans, which includes the effects of estimated prepayments and estimates of future credit losses. Cash flow evaluations are inherently subjective as they require material estimates, all of which may be susceptible to significant change. The difference between the contractually required payments and the cash flows expected to be collected at acquisition, is referred to as the nonaccretable difference.
89
The Corporation does not classify PCI loans as nonaccrual loans subsequent to acquisition because the loans are recorded at net realizable value based on the principal and interest expected to be collected on the loan. Judgment is required to estimate the timing and amount of cash flows expected to be collected when the loans are not performing in accordance with the original contractual terms.
The Corporation re-estimate the cash flows expected to be collected over the life of PCI loans quarterly. These evaluations require the Corporation to use key assumptions and estimates, similar to the initial estimate of fair value. A decrease in estimated cash flows due to deterioration in credit quality will result in additional reserves recognized in the allowance for loan and lease losses in addition to a transfer from accretable yield to nonaccretable difference.
Nonaccrual Loans and Leases Loans and leases are generally placed on nonaccrual status when the collection of interest or principal is 90 days or more past due, unless, in the case of commercial loans and leases, they are well secured and in the process of collection. Delinquent consumer home equity junior lien loans are placed on nonaccrual status when there is evidence that the related third-party first lien mortgage may be 90 days or more past due, or foreclosure, charge-off or collection action has been initiated. TDR loans are placed on nonaccrual status prior to the past due thresholds outlined above if repayment under the modified terms is not likely after performing a well-documented credit analysis.
Loans and leases on nonaccrual status are generally reported as nonaccrual loans until there is sustained repayment performance for six consecutive months, with the exception of loans not reaffirmed upon discharge under Chapter 7 bankruptcy, which remain on nonaccrual status until a well-documented credit analysis indicates full repayment of the remaining pre-discharged contractual principal and interest is likely. Income on these loans and leases is recognized on a cash basis when there is sustained repayment performance for nine or 12 consecutive months based on the credit evaluation and the loan is not more than 60 days delinquent.
Leases The Corporation enters into lease contracts as both a lessor and a lessee. A contract, or part of a contract, is considered a lease if it conveys the right to obtain substantially all of the economic benefits from, and the right to direct and use, an identified asset for a period of time in exchange for consideration. The determination of lease classification requires various judgments and estimates by management which may include the fair value of the equipment at lease inception, useful life of the equipment under lease, estimate of the lease residual value and collectability of minimum lease payments. Management has policies and procedures in place for the determination of lease classification and review of the related judgments and estimates for all leases.
As a lessor, the Corporation provides various types of lease financing that are classified for accounting purposes as direct financing, sales-type or operating leases. Leases that transfer substantially all of the benefits and risks of ownership to the lessee are classified as direct financing or sales-type leases and are recorded in loans and leases. Direct financing and sales-type leases are carried at the combined present value of future minimum lease payments and lease residual values.
90
Interest income on net investment in direct financing and sales-type leases is recognized using methods that approximate a level yield over the fixed, non-cancelable term of the lease, including pro rata rent payments received for the interim period until the lease contract commences and the fixed, non-cancelable lease term begins. Sales-type leases generate selling profit (loss), which is recognized on the commencement date by recording lease revenue net of lease cost. Lease revenue consists of the present value of the future minimum lease payments and lease cost consists of the leased equipment's net book value, less the present value of its residual.
Some lease financing contracts include a residual value component, which represents the estimated fair value of the leased equipment at the expiration of the initial term of the transaction. The estimation of residual values involves judgment regarding product and technology changes, customer behavior, shifts in supply and demand and other economic assumptions. The Corporation reviews residual assumptions when assessing potential impairment of the net investment in direct financing and sales-type leases each quarter. Decreases in the expected residual value are reflected through an increase in the provision for credit losses, which results in an increase to the allowance for loan and lease losses.
The Corporation may sell minimum lease payment receivables, primarily as a credit risk reduction tool, to third-party financial institutions at fixed rates, on a non-recourse basis, with its underlying equipment as collateral. For those transactions that qualify for sale accounting, the related lease cash flow stream and the non-recourse financing are derecognized. For those transactions that do not qualify for sale accounting, the underlying lease remains on the Consolidated Statements of Financial Condition and non-recourse debt is recorded in the amount of the proceeds received. The Corporation retains servicing of these leases and bills, collects and remits funds to the third-party financial institution. Upon default by the lessee, the third-party financial institutions may take control of the underlying collateral which the Corporation would otherwise retain as residual value.
Leases that do not transfer substantially all benefits and risks of ownership to the lessee are classified as operating leases. Such leased equipment and related initial direct costs are included in other assets and depreciated to their estimated salvage value on a straight-line basis over the term of the lease. Lease financing equipment depreciation is recorded in noninterest expense on the Consolidated Statements of Income. Operating lease payments received are recognized as lease income on the Consolidated Statements of Income when due and recorded as a component of leasing revenue in noninterest income. An allowance for lease losses is not provided on operating leases. See "Note 7. Loans and Leases" for further information on leases.
As a lessee, the Corporation enters into contracts to lease real estate, information technology equipment and various other types of equipment. Leases that transfer substantially all of the benefits and risks of ownership to the Corporation are classified as finance leases, while all others are classified as operating leases. At lease commencement, a lease liability and right-of-use asset are calculated and recognized for both types of leases. The lease liability is equal to the present value of future minimum lease payments. The right-of-use asset is equal to the lease liability, plus any initial direct costs and prepaid lease payments, less any lease incentives received. Operating lease right-of-use assets are recorded in other assets and finance lease right-of-use assets are recorded in premises and equipment, net. The Corporation uses the appropriate term FHLB rate to determine the discount rate for the present value calculation of future minimum payments when an implicit rate is not known for a given lease. The lease term used in the calculation includes any options to extend that the Corporation is reasonably certain to exercise.
91
Goodwill and Other Intangible Assets All assets and liabilities acquired in purchase acquisitions, including other intangibles, are initially recorded at fair value. Goodwill is recorded when the purchase price of an acquisition is greater than the fair value of net assets, including identifiable intangible assets. Goodwill is not amortized, but assessed for impairment annually at the reporting unit level. The Corporation has historically performed its annual assessment as of December 31st. As a result of its Merger, the Corporation has elected to perform its annual test in the fourth quarter utilizing September 30th financial data. The change in assessment date is not material to the financial statements and allows management more time to perform the analysis of the significant goodwill generated as a result of the Merger. Interim impairment analysis may be required if events occur or circumstances change that would more-likely-than-not reduce a reporting unit's fair value below its carrying amount. Other intangible assets are amortized on a straight-line basis or accelerated method over their estimated useful lives and are subject to impairment if events or circumstances indicate a possible inability to realize their carrying amounts.
When testing for goodwill impairment, the Corporation has the option to perform a qualitative assessment of goodwill. The Corporation may also elect to perform a quantitative test without first performing a qualitative analysis. If the qualitative assessment is performed and the Corporation concludes it is more-likely-than-not that a reporting unit's fair value is less than its carrying amount, a quantitative analysis is performed. Quantitative valuation methodologies primarily include a discounted cash flow analysis in determining the fair value of reporting units. If the fair value is less than the carrying amount, additional analysis is required to measure the amount of impairment. Impairment losses, if any, are recorded as a charge to other noninterest expense and an adjustment to the carrying value of goodwill.
92
Derivative Instruments All derivative instruments are recognized at fair value within other assets and other liabilities. The Corporation's derivative instruments may be subject to master netting arrangements and collateral arrangements and qualify for offset in the Consolidated Statements of Financial Condition. A master netting arrangement with a counterparty creates a right of offset for amounts due to and from that same counterparty that is enforceable in the event of a default or bankruptcy. The Corporation's policy is to recognize amounts subject to master netting arrangements and collateral arrangements on a net basis in the Consolidated Statements of Financial Condition. The value of derivative instruments will vary over their contractual terms as the related underlying rates fluctuate. The accounting for changes in the fair value of a derivative instrument depends on whether or not the contract has been designated and qualifies as a hedge. To qualify as a hedge, a contract must be highly effective at reducing the risk associated with the exposure being hedged. In addition, for a contract to be designated as a hedge, the risk management objective and strategy must be documented at inception. Hedge documentation must also identify the hedging instrument, the asset or liability and type of risk to be hedged and how the effectiveness of the contract is assessed prospectively and retrospectively. To assess effectiveness, the Corporation uses statistical methods such as regression analysis. A contract that has been, and is expected to continue to be effective at offsetting changes in fair values or the net investment, must be assessed and documented at least quarterly. If it is determined that a contract is not highly effective at hedging the designated exposure, hedge accounting is discontinued.
Upon origination of a derivative instrument, the contract is designated either as a hedge of the exposure to changes in the fair value of an asset or liability due to changes in market risk ("fair value hedge"), a hedge of the volatility of an investment in foreign operations driven by changes in foreign currency exchange rates ("net investment hedge") or is not designated as a hedge.
93
Fair Value Hedges TCF Bank entered into an interest rate swap agreement related to its contemporaneously issued subordinated debt, which settles through a central clearing house. The swap was designated as a fair value hedge and effectively converts the fixed interest rate to a floating rate based on the three-month London InterBank Offered Rate ("LIBOR") plus a fixed number of basis points on the $150.0 million notional amount through February 27, 2025, the maturity date of the subordinated debt.
The interest rate swap substantially offsets the change in fair value of the hedged underlying subordinated debt that is attributable to the changes in market risk. The gains and losses related to changes in the fair value of the interest rate swap, as well as the offsetting changes in fair value of the hedged debt, are recorded in interest on borrowings effective January 1, 2018 and were previously recorded in other noninterest income.
Net Investment Hedges Forward foreign exchange contracts, which generally settle within 34 days, are used to manage the foreign exchange risk associated with the Corporation's net investment in TCF Commercial Finance Canada, Inc. ("TCFCFC"), a wholly-owned indirect Canadian subsidiary of TCF Bank. Changes in net investment hedges recorded within other comprehensive income (loss) are subsequently reclassified to other noninterest expense during the period in which the foreign investment is substantially liquidated or when other elements of the currency translation adjustment are reclassified to income.
Derivatives Not Designated as Hedges The Corporation executes interest rate contracts with commercial banking customers to facilitate their respective risk management strategies. Those interest rate contracts are simultaneously hedged with offsetting interest rate contracts that the Corporation executes with a third party and generally settles through a central clearing house, minimizing the Corporation's net risk exposure. As the interest rate contracts do not meet hedge accounting requirements, changes in the fair value of both the customer contracts and the offsetting contracts are recorded in other noninterest income. These contracts have original fixed maturity dates ranging from 3 to 10 years.
Portions of loans to commercial banking customers with associated interest rate contracts may be sold or purchased by TCF Bank. In such circumstances, the Corporation often executes risk participation agreements ("RPAs") directly with the party that owns the remaining portion of the loan. These agreements require the party that has not originated the interest rate contract with the borrower to assume a portion of the risk that the borrower will default on the interest rate contract obligation. As the RPAs do not meet hedge accounting requirements, changes in the fair value of these contracts are recorded in other noninterest income. These contracts have original fixed maturity dates matching the associated interest rate contracts.
Certain of the Corporation's forward foreign exchange contracts are not designated as hedges and are generally settled within 34 days. Changes in the fair value of these forward foreign exchange contracts are recorded in other noninterest expense.
The Corporation enters into interest rate lock commitments in conjunction with the sale of certain consumer real estate loans. These interest rate lock commitments are agreements to extend credit under certain specified terms and conditions at fixed rates with original lock expirations generally within 10 months. They are not designated as hedges and accordingly, changes in the valuation of these commitments are recorded in net gains on sales of loans and leases.
Mandatory forward loan sale commitments are accounted for as derivatives and recorded at fair value, with changes in fair value recorded through earnings. The Corporation recognizes revenue associated with the expected future cash flows of servicing loans for loans held-for-sale at the time a forward loan sale commitment is made to originate a held-for-sale loan.
The Corporation has written and purchased option derivatives consisting of instruments to facilitate an equity-linked time deposit product (the "Power Equity CD"). The Power Equity CD is a time deposit that provides the purchaser a guaranteed return of principal at maturity plus a potential equity return (a written option), while the Corporation receives a known stream of funds based on the equity return (a purchased option). The written and purchased options are mirror derivative instruments which are carried at fair value on the Consolidated Statements of Financial Condition.
94
Short-term Borrowings Short-term borrowings are comprised of short-term FHLB advances with original scheduled maturities of one year or less, and collateralized customer deposits, which represent funds deposited by customers that are collateralized by investment securities owned by the Corporation, as these deposits are not covered by Federal Deposit Insurance Corporation ("FDIC") insurance and are reflected as a liability in the accompanying Consolidated Statements of Financial Condition. See "Note 15. Borrowings" for further information.
Advertising Costs Advertising costs are expensed as incurred. The Corporation has entered into long-term contracts for sponsorships or naming rights of certain events and buildings. Costs associated with these contracts are generally expensed ratable over the contract term.
Income Taxes The Corporation files consolidated and separate company U.S. federal income tax returns, combined and separate company state income tax returns and foreign income tax returns. Current and deferred tax assets and liabilities are measured based on the provisions of enacted tax law.
Income taxes are accounted for using the asset and liability method. Under this method, current income tax expense represents the estimated liability for the current period and includes income tax expense related to uncertain tax positions. When income and expenses are recognized in different periods for tax purposes than for book purposes, deferred tax assets and liabilities are recognized for the future tax consequences attributable to the temporary differences between the financial statement carrying amounts of existing assets and liabilities and their respective tax bases. Differences in the tax and book carrying amounts of assets and liabilities can also be generated when the Corporation acquires other businesses or bank branches. Deferred tax assets and liabilities are measured using enacted tax rates expected to apply to taxable income in the years in which those temporary differences are expected to be recovered or settled. The effect on deferred tax assets and liabilities of a change in tax rates is recorded in income tax expense (benefit) in the period in which the enactment date occurs. If current period income tax rates change, the impact on the annual effective income tax rate is applied year to date in the period of enactment.
The determination of current and deferred income taxes is based on analyses of many factors, including interpretation of income tax laws, the evaluation of uncertain tax positions, temporary differences between the tax and financial reporting bases of assets and liabilities, estimates of amounts due or owed, the timing of reversals of temporary differences and current financial accounting standards. Additionally, there can be no assurance that estimates and interpretations used in determining income tax assets or liabilities will not be challenged by taxing authorities. Actual results could differ significantly from the estimates and tax law interpretations used in determining the current and deferred income tax assets and liabilities.
95
Share-based Compensation The fair value of restricted stock awards, stock options and restricted stock units is determined on the date of grant and amortized to compensation and employee benefits expense, with a corresponding increase to additional paid-in capital, over the longer of the service period or performance period, but in no event beyond an employee's retirement date or date of employment termination. For performance-based restricted stock or stock units, the Corporation estimates the degree to which performance conditions will be met to determine the number of shares or units that will vest and the related expense. Compensation and employee benefits expense is adjusted in the period such estimates change. Non-forfeitable dividends, if any, paid on shares of restricted stock are recorded to retained earnings for shares that are expected to vest and to compensation and employee benefits expense for shares that are not expected to vest.
Earnings Per Common Share The Corporation's restricted stock awards that pay non-forfeitable common stock dividends meet the criteria of a participating security. Accordingly, earnings per share is calculated using the two-class method under which earnings are allocated to both common shares and participating securities.
Recently Adopted Accounting Pronouncements
Effective January 1, 2019, the Corporation adopted ASU No. 2018-16, Derivatives and Hedging (Topic 815): Inclusion of the Secured Overnight Financing Rate (SOFR) Overnight Index Swap (OIS) Rate as a Benchmark Interest Rate for Hedge Accounting Purposes, which permits the use of the OIS Rate based on the SOFR as a U.S. benchmark interest rate for hedge accounting purposes under Topic 815 in addition to the interest rates on direct Treasury obligations of the U.S. government, the London Interbank Offered Rate ("LIBOR") swap rate, the OIS Rate based on the Fed Funds Effective Rate and the Securities Industry and Financial Markets Association Municipal Swap Rate. The adoption of this ASU was on a prospective basis for qualifying new or redesignated hedging relationships entered into on or after January 1, 2019. The adoption of this guidance did not have a material impact on the consolidated financial statements.
96
Effective January 1, 2019, the Corporation adopted ASU No. 2018-15, Intangibles - Goodwill and Other - Internal-Use Software (Subtopic 350-40): Customer's Accounting for Implementation Costs Incurred in a Cloud Computing Arrangement That Is a Service Contract (a consensus of the FASB Emerging Issues Task Force), which requires the decision to capitalize or expense implementation costs incurred in a cloud computing arrangement (i.e. a hosting arrangement) that is a service contract to follow the internal-use software guidance in ASC 350-40. The Corporation's policy had been to expense these costs as incurred. The adoption of this ASU was on a prospective basis. The adoption of this guidance did not have a material impact on the consolidated financial statements.
Effective January 1, 2019, the Corporation adopted ASU No. 2018-07, Compensation - Stock Compensation (Topic 718): Improvements to Nonemployee Share-Based Payment Accounting, which simplifies the accounting for share-based payments to nonemployees by aligning it more consistently with the accounting for share-based payments to employees. The new guidance in ASC 718 supersedes the guidance in ASC 505-50. The adoption of this ASU was on a modified retrospective basis with no cumulative effect adjustment recorded. The adoption of this guidance did not have a material impact on the consolidated financial statements.
Effective January 1, 2019, the Corporation adopted ASU No. 2017-11, Earnings Per Share (Topic 260): Distinguishing Liabilities from Equity (Topic 480); Derivatives and Hedging (Topic 815): (Part I) Accounting for Certain Financial Instruments with Down Round Features, which simplifies the accounting for certain equity-linked financial instruments and embedded features with the down round features that reduce the exercise price when the pricing of a future round of financing is lower. The adoption of this ASU was on a modified retrospective basis. The adoption of this guidance did not have a material impact on the consolidated financial statements.
Effective January 1, 2019, the Corporation adopted ASU No. 2016-02, Leases (Topic 842), which, along with other amendments, requires lessees to recognize most leases on their balance sheet. Lessor accounting is largely unchanged. The ASU requires both quantitative and qualitative disclosure regarding key information about leasing arrangements from both lessees and lessors. Effective January 1, 2019, the Corporation also adopted the following ASUs, which further amend the original lease guidance in Topic 842: (i) ASU No. 2017-13, Revenue Recognition (Topic 605), Revenue from Contracts with Customers (Topic 606), Leases (Topic 840) and Leases (Topic 842): Amendments to SEC Paragraphs, which rescinds certain SEC Observer comments and staff announcements from the lease guidance and incorporates SEC staff announcements on the effect of a change in tax law on leveraged leases from ASC 840 into ASC 842; (ii) ASU No. 2018-01, Leases (Topic 842): Land Easement Practical Expedient for Transition to Topic 842, which amends the new lease guidance to add an optional transition practical expedient that permits an entity to continue applying its current accounting policy for land easements that existed or expired before January 1, 2019; (iii) ASU No. 2018-10, Codification Improvements to Topic 842, Leases, which makes narrow scope improvements to the standard for specific issues; (iv) ASU No. 2018-11, Leases (Topic 842): Targeted Improvements, which provides an optional transition method allowing the standard to be applied at the adoption date and provides a practical expedient related to separating components of a contract for lessors; (v) ASU No. 2018-20, Leases (Topic 842): Narrow-Scope Improvements for Lessors, which allows lessors to elect to account for all sales taxes as lessee costs, instead of determining whether they are lessee or lessor costs in each individual jurisdiction. It requires lessor costs paid by lessees directly to third parties to be excluded from revenue, requires lessors to account for costs excluded from the consideration of a contract that are paid by the lessor as revenue and requires certain variable payments to be allocated (rather than recognized) to lease and nonlease components when changes occur in the facts and circumstances on which the variable payments are based; and (vi) ASU No. 2019-01, Leases (Topic 842): Codification Improvements, which allows lessors that are not manufacturers or dealers to calculate the fair value of an underlying asset as its cost less any volume or trade discount, requires lessors to classify principal payments received from direct financing and sales-type leases as investing activities in the statement of cash flows and clarifies that certain disclosure requirements that were explicitly excluded from annual reporting during the year of adoption are also excluded from interim reporting during the same year. These ASUs were adopted on a modified retrospective basis. Management elected the practical expedients and optional transition method, which allow for leases entered into prior to January 1, 2019 to be accounted for consistent with prior guidance. Management evaluated the Corporation's leasing contracts and activities, and developed methodologies and processes to estimate and account for the right-of-use assets and lease liabilities based on the present value of future lease payments. On January 1, 2019, the Corporation recorded right-of-use assets and lease liabilities totaling $91.9 million and $112.8 million, respectively. The Corporation also recorded additional right-of-use assets and lease liabilities totaling $39.8 million and $41.6 million on August 1, 2019 as a result of the Merger. The impact to capital ratios as a result of increased risk-weighted assets is immaterial. The adoption of this guidance did not result in a material change to lessee expense recognition. The changes to lessor accounting, as well as changes in customer behavior driven by the adoption of these ASUs, impacts the results of the leasing and equipment financing businesses, including earlier recognition of expense due to a narrower definition of initial direct costs and the timing of revenue recognition for certain leases, resulting in more revenue being deferred over the lease term.
97
Recently Issued Accounting Pronouncements
In January 2020, the Financial Accounting Standards Board (the "FASB") issued ASU No. 2020-01, Investments-Equity Securities (Topic 321), Investments-Equity Method and Joint Ventures (Topic 323), and Derivatives and Hedging (Topic 815)-Clarifying the Interactions between Topic 321, Topic 323, and Topic 815 (a consensus of the Emerging Issues Task Force), which clarifies the interactions between Topic 321, Topic 323 and Topic 815, including accounting for the transition into and out of the equity method and measuring certain purchased options and forward contracts to acquire investments. The adoption of this ASU will be required beginning with the Corporation's Quarterly Report on Form 10-Q for the quarter ending March 31, 2021. Early adoption is allowed. Management is currently evaluating the impact of this guidance on the consolidated financial statements.
In December 2019, the FASB issued ASU No. 2019-12, Income Taxes (Topic 740): Simplifying the Accounting for Income Taxes, which is intended to simplify the accounting for income taxes by removing certain exceptions to the general rules found in Topic 740 - Income Taxes. The adoption of this ASU will be required beginning with the Corporation's Quarterly Report on Form 10-Q for the quarter ending March 31, 2021. Early adoption is allowed. Management is currently evaluating the impact of this guidance on the consolidated financial statements.
In November 2019, the FASB issued ASU No. 2019-08, Compensation-Stock Compensation (Topic 718) and Revenue from Contracts with Customers (Topic 606): Codification Improvements-Share-Based Consideration Payable to a Customer, which requires entities to measure and classify share based payment awards granted to a customer by applying the guidance in Topic 718. The adoption of this ASU will be required beginning with the Corporation's Quarterly Report on Form 10-Q for the quarter ending March 31, 2020. Early adoption is allowed. The adoption of this guidance will not have a material impact on the consolidated financial statements.
In November 2018, the FASB issued ASU No. 2018-18, Collaborative Arrangements (Topic 808): Clarifying the Interaction between Topic 808 and Topic 606, which makes targeted improvements to the accounting for collaborative arrangements in response to questions raised as a result of the issuance of ASU 2014-09, Revenue from Contracts with Customers (Topic 606). The adoption of this ASU will be required beginning with the Corporation's Quarterly Report on Form 10-Q for the quarter ending March 31, 2020. Early adoption is allowed. The adoption of this guidance will not have a material impact on the consolidated financial statements.
In October 2018, the FASB issued ASU No. 2018-17, Consolidation (Topic 810): Targeted Improvements to Related Party Guidance for Variable Interest Entities, which provides an elective exemption to private companies from applying variable interest entities ("VIE") guidance to all entities under common control if certain criteria are met. In addition, this ASU contains an amendment applicable to all entities which amends how a decision maker or service provider determines whether its fee is a variable interest in a VIE when a related party under common control also has an interest in the VIE. The adoption of this ASU will be required beginning with the Corporation's Quarterly Report on Form 10-Q for the quarter ending March 31, 2020. Early adoption is allowed. The adoption of this guidance will not have a material impact on the consolidated financial statements.
In August 2018, the FASB issued ASU No. 2018-13, Fair Value Measurement (Topic 820): Disclosure Framework Changes to the Disclosure Requirements for Fair Value Measurement, which eliminates, adds and modifies certain disclosure requirements for fair value measurements. The adoption of this ASU will be required beginning with the Corporation's Quarterly Report on Form 10-Q for the quarter ending March 31, 2020. Certain of the amendments require prospective application, while the remainder require retrospective application. Early adoption is allowed either for the entire standard or only the provisions that eliminate or modify the requirements. Management is currently evaluating which adoption method will be selected as well as the related potential impact of this guidance on the consolidated financial statements.
In January 2017, the FASB issued ASU No. 2017-04, Intangibles - Goodwill and Other (Topic 350): Simplifying the Test for Goodwill Impairment. This ASU simplifies the accounting for goodwill impairment by removing Step 2 of the goodwill impairment test, which requires a hypothetical purchase price allocation. Subsequent to adoption, goodwill impairment will be the amount by which a reporting unit’s carrying value exceeds its fair value, not to exceed the carrying amount of goodwill. All other goodwill impairment guidance largely remains unchanged. The adoption of this ASU will be required beginning with the Corporation's Quarterly Report on Form 10-Q for the quarter ending March 31, 2020 on a prospective basis. Early adoption is allowed. The adoption of this guidance will not have a material impact on the consolidated financial statements.
98
In June 2016, the FASB issued ASU No. 2016-13, Financial Instruments - Credit Losses (Topic 326): Measurement of Credit Losses on Financial Instruments, which changes the impairment model for most financial assets (including off-balance sheet exposures), including trade and other receivables, debt securities held-to-maturity, loans, net investments in leases and purchased financial assets with credit deterioration. The ASU requires the use of a current expected credit loss ("CECL") methodology to determine the allowance for credit losses for loans and debt securities held to maturity. CECL requires loss estimates for the remaining estimated life of the asset to be measured using historical loss data as well as adjustments for current conditions and reasonable and supportable forecasts of future economic conditions. In November 2018, the FASB issued ASU No. 2018-19, Codification Improvements to Topic 326, Financial Instruments - Credit Losses, which clarifies that receivables arising from operating leases are not within the scope of Subtopic 326-20 and should be accounted for in accordance with Topic 842. In April 2019, the FASB issued ASU No. 2019-04, Codification Improvements to Topic 326, Financial Instruments - Credit Losses, Topic 815, Derivatives and Hedging, and Topic 825, Financial Instruments, which clarifies and corrects certain unintended applications of the guidance contained in each of the amended Topics. In May 2019, the FASB issued ASU No. 2019-05, Financial Instruments - Credit Losses (Topic 326): Targeted Transition Relief, which provides an option to irrevocably elect the fair value option in Subtopic 825-10 to certain instruments within the scope of Subtopic 326-20 upon adoption of Topic 326. In November 2019, the FASB issued ASU No. 2019-11, Codification Improvements to Topic 326, Financial Instruments-Credit Losses, which clarifies that expected recoveries of amounts previously written off or expected to be written off should be included in the estimate of allowance for credit losses for purchased financial assets with credit deterioration, provides certain transition relief for TDR accounting when the discounted cash flow method is used to estimate credit losses, allows entities to elect to disclose separately the total amount of accrued interest included in the amortized cost basis as a single balance to meet certain disclosure requirements, and clarifies that an entity should assess whether it reasonably expects the borrower will be able to continually replenish collateral securing financial assets when electing a practical expedient to measure the estimate of expected credit losses by comparing the amortized cost basis of the financial asset and the fair value of collateral securing the financial asset as of the reporting date. The adoption of these ASUs will be reflected using a modified retrospective approach with a cumulative effect adjustment recorded as of January 1, 2020 in the Corporation's Quarterly Report on Form 10-Q for the quarter ending March 31, 2020. CECL represents a significant change in GAAP and is expected to result in a significant change to industry practice, which the Corporation expects will continue to evolve over time.
The Corporation has established a governance structure to implement these ASUs and has developed a methodology and set of models to be used upon adoption. At December 31, 2019, loan and lease portfolios totaled $34.5 billion with a corresponding allowance for loan and lease losses ("ALLL") of $113.1 million under current GAAP. Based on parallel runs of the CECL process that the Corporation has performed alongside the current ALLL process, the Corporation estimates that the adoption of the standard will result in an allowance for credit losses ("ACL") that is larger than the current ALLL levels by $200.0 million to $225.0 million in total for all portfolios. Approximately 20 % of the anticipated increase from ALLL to ACL relates to originated loans and leases, with the largest impact on the consumer segment given the longer duration of the portfolios. A significant portion of the anticipated increase from ALLL to ACL is a result of new requirements to record ACL related to acquired loans and leases, regardless of any credit mark recorded. Approximately 80 % of the anticipated increase from ALLL to ACL relates to acquired loans and leases, which were recorded at estimated fair value at their respective acquisition dates, the majority of which relate to loans and leases acquired in the Merger. Under current GAAP, credit marks are included in the determination of the fair value adjustments reflected as a discount to the carrying value of the loans, and an ALLL is not recorded on acquired loans and leases until there is evidence of credit deterioration post acquisition. However, upon adoption of CECL an ACL is recorded for all acquired loans and leases based on the lifetime loss concept. Further, for acquired loans and leases that do not meet the definition of purchase credit deteriorated ("PCD"), the credit and interest marks which remain from acquisition accounting as of December 31, 2019 will continue to accrete over the life of loan. For acquired loans that meet the definition of PCI and convert to PCD at adoption, the ACL recorded is recognized through a gross-up that increases the amortized cost basis of loans with a corresponding ACL, and therefore results in little to no impact to the cumulative effect adjustment to retained earnings. The adoption of CECL will also result in an increase in the liability for unfunded commitments of between $10.0 million and $15.0 million. For other assets within the scope of the standard such as debt securities held-to-maturity, trade and other receivables, management expects the impact from the standard to be inconsequential. The Corporation estimates a cumulative tax effected adjustment to record ACL and to increase the unfunded commitment liability results in a reduction to retained earnings of $160.0 million to $175.0 million. Management is finalizing its review of certain asset-specific risk characteristics and of the most recent model run related to acquired loans. Management is also evaluating financial statement and disclosure impacts, as well as determining whether to elect to utilize the three-year phase-in period for regulatory impact of CECL. As the Corporation finalizes the implementation of the standard in the first quarter of 2020, final decisions by management will result in the specific January 1, 2020 ACL impact being established.
99
Note 4. Cash and Cash Equivalents
Cash and cash equivalents include cash and due from banks and interest-bearing deposits in other banks.
At December 31, 2019 and 2018, TCF Bank was required by Federal Reserve regulations to maintain reserves of $177.0 million and $106.2 million, respectively, in cash on hand or at the Federal Reserve Bank.
We maintain cash balances that are restricted as to their use in accordance with certain obligations. Cash payments received on loans serviced for third parties are generally held in separate accounts until remitted. We may also retain cash balances for collateral on certain borrowings and derivative contracts. We maintained restricted cash totaling $68.6 million and $38.3 million at December 31, 2019 and 2018, respectively.
Note 5. Federal Home Loan Bank and Federal Reserve Bank Stocks
Investments were as follows:
At December 31, | |||||||
(In thousands) | 2019 | 2018 | |||||
Federal Home Loan Bank stock, at cost | $ | $ | |||||
Federal Reserve Bank stock, at cost | |||||||
Total investments | $ | $ | |||||
100
Note 6. Investment Securities
The amortized cost and fair value of investment securities were as follows:
Investment Securities Available-for-sale, At Fair Value | |||||||||||||||
(In thousands) | Amortized Cost | Gross Unrealized Gains | Gross Unrealized Losses | Fair Value | |||||||||||
At December 31, 2019 | |||||||||||||||
Debt securities: | |||||||||||||||
Government and government-sponsored enterprises | $ | $ | $ | $ | |||||||||||
Obligations of states and political subdivisions | |||||||||||||||
Mortgage-backed securities: | |||||||||||||||
Residential agency | |||||||||||||||
Residential non-agency | |||||||||||||||
Commercial agency | |||||||||||||||
Commercial non-agency | |||||||||||||||
Total mortgage-backed debt securities | |||||||||||||||
Corporate debt and trust preferred securities | |||||||||||||||
Total investment securities available-for-sale | $ | $ | $ | $ | |||||||||||
At December 31, 2018 | |||||||||||||||
Debt securities: | |||||||||||||||
Obligations of states and political subdivisions | $ | $ | $ | $ | |||||||||||
Mortgage-backed securities: | |||||||||||||||
Residential agency | |||||||||||||||
Residential non-agency | |||||||||||||||
Commercial agency | |||||||||||||||
Total mortgage-backed debt securities | |||||||||||||||
Total investment securities available-for-sale | $ | $ | $ | $ | |||||||||||
Investment Securities Held-to-Maturity | |||||||||||||||
(In thousands) | Amortized Cost | Gross Unrealized Gains | Gross Unrealized Losses | Fair Value | |||||||||||
At December 31, 2019 | |||||||||||||||
Residential agency mortgage-backed securities | $ | $ | $ | $ | |||||||||||
Corporate debt and trust preferred securities | |||||||||||||||
Total investment securities held-to-maturity | $ | $ | $ | $ | |||||||||||
At December 31, 2018 | |||||||||||||||
Residential agency mortgage-backed securities | $ | $ | $ | $ | |||||||||||
Corporate debt and trust preferred securities | |||||||||||||||
Total investment securities held-to-maturity | $ | $ | $ | $ | |||||||||||
101
Gross unrealized losses and fair value of investment securities aggregated by investment category and the length of time the securities were in a continuous loss position were as follows:
At December 31, 2019 | |||||||||||||||||||||||
Less than 12 months | 12 months or more | Total | |||||||||||||||||||||
(In thousands) | Fair Value | Unrealized Losses | Fair Value | Unrealized Losses | Fair Value | Unrealized Losses | |||||||||||||||||
Investment securities available-for-sale | |||||||||||||||||||||||
Debt securities: | |||||||||||||||||||||||
Government and government sponsored enterprises | $ | $ | $ | $ | $ | $ | |||||||||||||||||
Obligations of states and political subdivisions | |||||||||||||||||||||||
Mortgage-backed securities: | |||||||||||||||||||||||
Residential agency | |||||||||||||||||||||||
Residential non-agency | |||||||||||||||||||||||
Commercial agency | |||||||||||||||||||||||
Commercial non-agency | |||||||||||||||||||||||
Total mortgage-backed debt securities | |||||||||||||||||||||||
Corporate debt and trust preferred securities | |||||||||||||||||||||||
Total investment securities available-for-sale | $ | $ | $ | $ | $ | $ | |||||||||||||||||
Investment securities held-to-maturity | |||||||||||||||||||||||
Residential agency mortgage-backed securities | $ | $ | $ | $ | $ | $ | |||||||||||||||||
Total investment securities held-to-maturity | $ | $ | $ | $ | $ | $ | |||||||||||||||||
At December 31, 2018 | |||||||||||||||||||||||
Less than 12 months | 12 months or more | Total | |||||||||||||||||||||
(In thousands) | Fair Value | Unrealized Losses | Fair Value | Unrealized Losses | Fair Value | Unrealized Losses | |||||||||||||||||
Investment securities available-for-sale | |||||||||||||||||||||||
Debt securities: | |||||||||||||||||||||||
Obligations of states and political subdivisions | $ | $ | $ | $ | $ | $ | |||||||||||||||||
Residential agency mortgage-backed securities | |||||||||||||||||||||||
Total investment securities available-for-sale | $ | $ | $ | $ | $ | $ | |||||||||||||||||
Investment securities held-to-maturity | |||||||||||||||||||||||
Residential agency mortgage-backed securities | $ | $ | $ | $ | $ | $ | |||||||||||||||||
Total investment securities held-to-maturity | $ | $ | $ | $ | $ | $ | |||||||||||||||||
At December 31, 2019 there were 517 investment securities in an unrealized loss position. We have assessed each investment security with unrealized losses for credit impairment. As part of that assessment we evaluated and concluded that it is more-likely-than-not that we will not be required and do not intend to sell any of the investment securities prior to recovery of the amortized cost. Unrealized losses on investment securities were primarily due to changes in interest rates.
The gross gains and losses on sales of investment securities were as follows:
Year Ended December 31, | |||||||||||
(In thousands) | 2019 | 2018 | 2017 | ||||||||
Gross realized gains | $ | $ | $ | ||||||||
Gross realized losses | |||||||||||
Recoveries on previously impaired investment securities held-to-maturity | |||||||||||
Net gains on investment securities | $ | $ | $ | ||||||||
102
The amortized cost and fair value of investment securities by final contractual maturity were as follows. Securities with multiple maturity dates are classified in the period of final maturity. The final contractual maturities do not consider possible prepayments and therefore expected maturities may differ because borrowers may have the right to call or prepay obligations with or without call or prepayment penalties.
At December 31, 2019 | At December 31, 2018 | ||||||||||||||
(In thousands) | Amortized Cost | Fair Value | Amortized Cost | Fair Value | |||||||||||
Investment Securities Available-for-Sale | |||||||||||||||
Due in one year or less | $ | $ | $ | $ | |||||||||||
Due in 1-5 years | |||||||||||||||
Due in 5-10 years | |||||||||||||||
Due after 10 years | |||||||||||||||
Total investment securities available-for-sale | $ | $ | $ | $ | |||||||||||
Investment Securities Held-to-Maturity | |||||||||||||||
Due in 1-5 years | $ | $ | $ | $ | |||||||||||
Due in 5-10 years | |||||||||||||||
Due after 10 years | |||||||||||||||
Total investment securities held-to-maturity | $ | $ | $ | $ | |||||||||||
Note 7. Loans and Leases
Loans and leases were as follows:
At December 31, | |||||||
(In thousands) | 2019 | 2018 | |||||
Commercial loan and lease portfolio: | |||||||
Commercial and industrial | $ | $ | |||||
Commercial real estate | |||||||
Lease financing | |||||||
Total commercial loan and lease portfolio | |||||||
Consumer loan portfolio: | |||||||
Residential mortgage | |||||||
Consumer installment | |||||||
Home equity | |||||||
Total consumer loan portfolio | |||||||
Total loans and leases(1) | $ | $ | |||||
(1) | Loans and leases are reported at historical cost including net direct fees and costs associated with originating and acquiring loans and leases, lease residuals, unearned income and unamortized purchase premiums and discounts. The aggregate amount of these loan and lease adjustments was a net deferred cost of $ |
Acquired Loans and Leases The Corporation acquired loans and leases at fair value in the Merger and in previous acquisitions completed by Legacy TCF. Certain loans acquired were classified as PCI and are accounted for under ASC 310-30, which recognizes the expected shortfall of expected future cash flows, as compared to the contractual amount due, as nonaccretable difference. Any excess of the net present value of expected future cash flows over the acquisition date fair value is recognized as the accretable yield. The accretable yield is recognized over the expected remaining life of the acquired loan. In the event an acquired loan is renewed or extended, the loan continues to be accounted for as an acquired loan in accordance with ASC 310-30.
103
The carrying value and changes in accretable yield of all PCI loans were as follows:
At or For Year Ended December 31, | |||||||
(In thousands) | 2019 | 2018 | |||||
Balance of PCI loans, beginning of period | $ | $ | |||||
Accretable Yield | |||||||
Balance, beginning of period | $ | $ | |||||
Addition attributable to the Merger | |||||||
Accretion recognized in interest income | ( | ) | ( | ) | |||
Net reclassification (to) from nonaccretable difference | |||||||
Payments received | ( | ) | ( | ) | |||
Balance, end of period | $ | $ | |||||
Balance of PCI loans, end of period | $ | $ | |||||
Leases Effective January 1, 2019, we adopted ASU No. 2016-02, Leases (Topic 842), and related ASUs on a modified retrospective basis, electing the practical expedients and optional transition method. As such, the following leasing disclosures include information at or for the year ended December 31, 2019.
The components of the net investment in direct financing and sales-type leases were as follows:
(In thousands) | At December 31, 2019 | ||
Carrying amount | $ | ||
Unguaranteed residual assets | |||
Net direct fees and costs and unearned income | ( | ) | |
Total net investment in direct financing and sales-type leases | $ | ||
The carrying amount of the sales-type and direct financing leases subject to residual value guarantees was $277.1 million at December 31, 2019.
The components of total lease income were as follows:
(In thousands) | Year Ended December 31, 2019 | ||
Interest income - loans and leases: | |||
Interest income on net investment in direct financing and sales-type leases | $ | ||
Leasing revenue (noninterest income): | |||
Lease income from operating lease payments | |||
Profit (loss) recorded on commencement date on sales-type | |||
Gain (losses) on sales of leased equipment | |||
Leasing Revenue | |||
Total lease income | $ | ||
Lease financing equipment depreciation on equipment leased to others was $76.4 million and the net book value of equipment leased to others and related initial direct costs under operating leases was $289.7 million at December 31, 2019.
104
Undiscounted future minimum lease payments receivable for direct financing and sales-type leases, and a reconciliation to the carrying amount recorded at December 31, 2019 were as follows:
(In thousands) | |||
2020 | $ | ||
2021 | |||
2022 | |||
2023 | |||
2024 | |||
Thereafter | |||
Equipment under leases not yet commenced | |||
Total undiscounted future minimum lease payments receivable for direct financing and sales-type leases | |||
Third-party residual value guarantees | |||
Total carrying amount of direct financing and sales-type leases | $ | ||
Undiscounted future minimum lease payments expected to be received for operating leases at December 31, 2019 were as follows:
(In thousands) | |||
2020 | $ | ||
2021 | |||
2022 | |||
2023 | |||
2024 | |||
Thereafter | |||
Total undiscounted future minimum lease payments | $ | ||
Loan Sales The following table summarizes the net gains on sales of loans and leases. We retain servicing on a majority of loans sold. See " Note 11. Loan Servicing Rights" for further information.
Year Ended December 31, | |||||||||||
(In millions) | 2019 | 2018 | 2017 | ||||||||
Sale proceeds, net | $ | $ | $ | ||||||||
Recorded investment in loans and leases sold, including accrued interest | |||||||||||
Loss on transfer of loans to held-for-sale, interest-only strips at initial value and other | ( | ) | ( | ) | ( | ) | |||||
Net gains on sales of loans and leases | $ | $ | $ | ||||||||
During the fourth quarter of 2019, we completed the sale of the Legacy TCF auto finance portfolio of $1.1 billion, which had been included within loans held-for-sale at September 30, 2019, resulting in a $27.5 million loss for the year, included in net gains on sales of loans and leases.
The remaining interest-only strips on the balance sheet related to loan sales were as follows:
At December 31, | |||||||
(In thousands) | 2019 | 2018 | |||||
Interest-only strips | $ | $ | |||||
We recorded $62 thousand, $661 thousand and $1.6 million of impairment charges on interest-only strips in 2019, 2018 and 2017, respectively.
105
The Corporation's agreements to sell consumer loans typically contain certain representations, warranties and covenants regarding the loans sold or securitized. These representations, warranties and covenants generally relate to, among other things, the ownership of the loan, the validity, priority and perfection of the lien securing the loan, accuracy of information supplied to the buyer or investor, the loan's compliance with the criteria set forth in the agreement, the manner in which the loans will be serviced, payment delinquency and compliance with applicable laws and regulations. These agreements generally require the repurchase of loans or indemnification in the event we breach these representations, warranties or covenants and such breaches are not cured. In addition, some agreements contain a requirement to repurchase loans as a result of early payoffs by the borrower, early payment default of the borrower or the failure to obtain valid title. Losses related to repurchases pursuant to such representations, warranties and covenants were immaterial for 2019, 2018 and 2017.
Note 8. Allowance for Loan and Lease Losses and Credit Quality
The rollforwards of the allowance for loan and lease losses were as follows:
At or For the Year Ended December 31, 2019 | |||||||||||
(In thousands) | Consumer Loan Portfolio | Commercial Loan and Lease Portfolio | Total Loans and Leases | ||||||||
Balance, beginning of period | $ | $ | $ | ||||||||
Charge-offs | ( | ) | ( | ) | ( | ) | |||||
Recoveries | |||||||||||
Net (charge-offs) recoveries | ( | ) | ( | ) | ( | ) | |||||
Provision for credit losses | |||||||||||
Other(1) | ( | ) | ( | ) | ( | ) | |||||
Balance, end of period | $ | $ | $ | ||||||||
At or For the Year Ended December 31, 2018 | |||||||||||
(In thousands) | Consumer Loan Portfolio | Commercial Loan and Lease Portfolio | Total Loans and Leases | ||||||||
Balance, beginning of period | $ | $ | $ | ||||||||
Charge-offs | ( | ) | ( | ) | ( | ) | |||||
Recoveries | |||||||||||
Net (charge-offs) recoveries | ( | ) | ( | ) | ( | ) | |||||
Provision for credit losses | |||||||||||
Other(1) | ( | ) | ( | ) | ( | ) | |||||
Balance, end of period | $ | $ | $ | ||||||||
At or For the Year Ended December 31, 2017 | |||||||||||
(In thousands) | Consumer Loan Portfolio | Commercial Loan and Lease Portfolio | Total Loans and Leases | ||||||||
Balance, beginning of period | $ | $ | $ | ||||||||
Charge-offs | ( | ) | ( | ) | ( | ) | |||||
Recoveries | |||||||||||
Net (charge-offs) recoveries | ( | ) | ( | ) | ( | ) | |||||
Provision for credit losses | |||||||||||
Other(1) | ( | ) | ( | ) | ( | ) | |||||
Balance, end of period | $ | $ | $ | ||||||||
(1) | Primarily includes the transfer of the allowance for loan and lease losses to loans and leases held-for-sale. |
106
The allowance for loan and lease losses and loans and leases outstanding by type of allowance methodology were as follows:
At December 31, 2019 | |||||||||||
(In thousands) | Consumer Loan Portfolio | Commercial Loan and Lease Portfolio | Total Loans and Leases | ||||||||
Allowance for loan and lease losses: | |||||||||||
Collectively evaluated for impairment | $ | $ | $ | ||||||||
Individually evaluated for impairment | |||||||||||
Loans acquired with deteriorated credit quality | |||||||||||
Total | $ | $ | $ | ||||||||
Loans and leases outstanding: | |||||||||||
Collectively evaluated for impairment | $ | $ | $ | ||||||||
Individually evaluated for impairment | |||||||||||
Loans acquired with deteriorated credit quality | |||||||||||
Total | $ | $ | $ | ||||||||
At December 31, 2018 | |||||||||||
(In thousands) | Consumer Loan Portfolio | Commercial Loan and Lease Portfolio | Total Loans and Leases | ||||||||
Allowance for loan and lease losses: | |||||||||||
Collectively evaluated for impairment | $ | $ | $ | ||||||||
Individually evaluated for impairment | |||||||||||
Total | $ | $ | $ | ||||||||
Loans and leases outstanding: | |||||||||||
Collectively evaluated for impairment | $ | $ | $ | ||||||||
Individually evaluated for impairment | |||||||||||
Loans acquired with deteriorated credit quality | |||||||||||
Total | $ | $ | $ | ||||||||
Accruing and Nonaccrual Loans and Leases The Corporation's key credit quality indicator is the receivable's payment performance status, defined as accruing or nonaccruing. Nonaccrual loans and leases are those which management believes have a higher risk of loss. Delinquent balances are determined based on the contractual terms of the loan or lease. Loans and leases that are over 60 days delinquent have a higher potential to become nonaccrual and generally are a leading indicator for future charge-off trends. The Corporation's accruing and nonaccrual loans and leases were as follows:
At December 31, 2019 | |||||||||||||||||||||||
(In thousands) | Current | 30-89 Days Delinquent and Accruing | 90 Days or More Delinquent and Accruing | Total Accruing | Nonaccrual | Total | |||||||||||||||||
Commercial loan and lease portfolio: | |||||||||||||||||||||||
Commercial and industrial | $ | $ | $ | $ | $ | $ | |||||||||||||||||
Commercial real estate | |||||||||||||||||||||||
Lease financing | |||||||||||||||||||||||
Total commercial loan and lease portfolio | |||||||||||||||||||||||
Consumer loan portfolio: | |||||||||||||||||||||||
Residential mortgage | |||||||||||||||||||||||
Consumer installment | |||||||||||||||||||||||
Home equity | |||||||||||||||||||||||
Total consumer loan portfolio | |||||||||||||||||||||||
PCI loans(1) | $ | ||||||||||||||||||||||
Total | $ | $ | $ | $ | $ | $ | |||||||||||||||||
(1) | PCI loans that are not performing in accordance with contractual terms are not reported as nonaccrual because these loans were recorded at their net realizable value based on the principal and interest TCF expects to collect on these loans. |
107
At December 31, 2018 | |||||||||||||||||||||||
(In thousands) | Current | 30-89 Days Delinquent and Accruing | 90 Days or More Delinquent and Accruing | Total Accruing | Nonaccrual | Total | |||||||||||||||||
Commercial loan and lease portfolio: | |||||||||||||||||||||||
Commercial and industrial | $ | $ | $ | $ | $ | $ | |||||||||||||||||
Commercial real estate | |||||||||||||||||||||||
Lease financing | |||||||||||||||||||||||
Total commercial loan and lease portfolio | |||||||||||||||||||||||
Consumer loan portfolio: | |||||||||||||||||||||||
Residential mortgage | |||||||||||||||||||||||
Consumer installment | |||||||||||||||||||||||
Home equity | |||||||||||||||||||||||
Total consumer loan portfolio | |||||||||||||||||||||||
PCI loans(1) | $ | ||||||||||||||||||||||
Total | $ | $ | $ | $ | $ | $ | |||||||||||||||||
(1) | PCI loans that are not performing in accordance with contractual terms are not reported as nonaccrual because these loans were recorded at their net realizable value based on the principal and interest TCF expects to collect on these loans. |
In addition to the receivables payment performance status, credit quality is also analyzed using risk categories, which vary based on the size and type of credit risk exposure and additionally measure liquidity, debt capacity, coverage and payment behavior as shown in the borrower's financial statements. The risk categories also measure the quality of the borrower's management and the repayment support offered by any guarantors. Loan and lease credit classifications are derived from standard regulatory rating definitions, which include: pass, special mention, substandard, doubtful and loss. Substandard and doubtful loans and leases have well-defined weaknesses, but may never result in a loss.
The following schedule presents the recorded investment of loans and leases by credit risk categories.
(In thousands) | Pass | Special Mention | Substandard | Total | |||||||||||
At December 31, 2019 | |||||||||||||||
Commercial loan and lease portfolio: | |||||||||||||||
Commercial and industrial | $ | $ | $ | $ | |||||||||||
Commercial real estate | |||||||||||||||
Lease financing | |||||||||||||||
Total commercial loan and lease portfolio | |||||||||||||||
Consumer loan portfolio: | |||||||||||||||
Residential mortgage | |||||||||||||||
Consumer installment | |||||||||||||||
Home equity | |||||||||||||||
Total consumer loan portfolio | |||||||||||||||
Total loans and leases | $ | $ | $ | $ | |||||||||||
At December 31, 2018 | |||||||||||||||
Commercial loan and lease portfolio: | |||||||||||||||
Commercial and industrial | $ | $ | $ | $ | |||||||||||
Commercial real estate | |||||||||||||||
Lease financing | |||||||||||||||
Total commercial loan and lease portfolio | |||||||||||||||
Consumer loan portfolio: | |||||||||||||||
Residential mortgage | |||||||||||||||
Consumer installment | |||||||||||||||
Home equity | |||||||||||||||
Total consumer loan portfolio | |||||||||||||||
Total loans and leases | $ | $ | $ | $ | |||||||||||
108
Troubled Debt Restructurings In certain circumstances, the Corporation may consider modifying the terms of a loan for economic or legal reasons related to the customer's financial difficulties. If the Corporation grants a concession, the modified loan is classified as a troubled debt restructuring ("TDR"). TDRs typically involve a deferral of the principal balance of the loan, a reduction of the stated interest rate of the loan or, in certain limited circumstances, a reduction of the principal balance of the loan or the loan's accrued interest. All loans classified as TDR loans are considered to be impaired.
The following table presents the recorded investment of loan modifications first classified as TDRs during the periods presented:
Year Ended December 31, | |||||||||||||||||||||||
2019 | 2018 | 2017 | |||||||||||||||||||||
(In thousands) | Pre-modification Investment | Post-modification Investment | Pre-modification Investment | Post-modification Investment | Pre-modification Investment | Post-modification Investment | |||||||||||||||||
Commercial loan and lease portfolio: | |||||||||||||||||||||||
Commercial and industrial | $ | $ | $ | $ | $ | $ | |||||||||||||||||
Commercial real estate | |||||||||||||||||||||||
Total commercial loan and lease portfolio | |||||||||||||||||||||||
Consumer loan portfolio: | |||||||||||||||||||||||
Residential mortgage | |||||||||||||||||||||||
Consumer installment | |||||||||||||||||||||||
Home equity | |||||||||||||||||||||||
Total consumer loan portfolio | |||||||||||||||||||||||
Total | $ | $ | $ | $ | $ | $ | |||||||||||||||||
The following table presents TDR loans:
At December 31, 2019 | At December 31, 2018 | ||||||||||||||||||||||
(In thousands) | Accruing TDR Loans | Nonaccrual TDR Loans | Total TDR Loans | Accruing TDR Loans | Nonaccrual TDR Loans | Total TDR Loans | |||||||||||||||||
Commercial loan and lease portfolio | $ | $ | $ | $ | $ | $ | |||||||||||||||||
Consumer loan portfolio | |||||||||||||||||||||||
Total | $ | $ | $ | $ | $ | $ | |||||||||||||||||
Commitments to lend additional funds to borrowers whose terms have been modified in TDRs were $638 thousand at both December 31, 2019 and December 31, 2018.
Loan modifications to troubled borrowers are no longer disclosed as TDR loans in the calendar years after modification if the loans were modified to an interest rate equal to or greater than the yields of new loan originations with comparable risk at the time of restructuring and if the loan is performing based on the restructured terms; however, these loans are still considered impaired and follow the Corporation's impaired loan reserve policies.
109
The following table summarizes the TDR loans that defaulted during the periods presented that were modified during the respective reporting period or within one year of the beginning of the respective reporting period. The Corporation considers a loan to have defaulted when under the modified terms it becomes 90 or more days delinquent, has been transferred to nonaccrual status, has been charged down or has been transferred to other real estate owned or repossessed and returned assets.
Year Ended December 31, | |||||||||||
(In thousands) | 2019 | 2018 | 2017 | ||||||||
Defaulted TDR loan balances modified during the applicable period | |||||||||||
Commercial loan and lease portfolio: | |||||||||||
Commercial and industrial | $ | $ | $ | ||||||||
Total commercial loan and lease portfolio | |||||||||||
Consumer loan portfolio: | |||||||||||
Residential mortgage | |||||||||||
Consumer installment | |||||||||||
Home equity | |||||||||||
Total consumer loan portfolio | |||||||||||
Defaulted TDR loan balances | $ | $ | $ | ||||||||
Impaired Loans and Leases Effective January 1, 2019, in conjunction with the adoption of ASU No. 2016-02, Leases (Topic 842) and related ASUs, the Corporation considers impaired loans and leases to include nonaccrual commercial loans and leases, as well as all commercial and consumer TDR loans. Previously, the Corporation did not include impaired leases within the following tables. For purposes of this disclosure, PCI loans have been excluded. In the following table, the balance of impaired loans and leases represents the amount recorded within loans and leases on the Consolidated Statements of Financial Condition, whereas the unpaid contractual balance represents the balances legally owed by the borrowers.
110
Information on impaired loans and leases at December 31, 2019 and information on impaired loans at December 31, 2018 was as follows:
At December 31, 2019 | At December 31, 2018 | ||||||||||||||||||||||
(In thousands) | Unpaid Contractual Balance | Loan and Lease Balance | Related Allowance Recorded | Unpaid Contractual Balance | Loan Balance | Related Allowance Recorded | |||||||||||||||||
Impaired loans and leases with an allowance recorded: | |||||||||||||||||||||||
Commercial loan and lease portfolio: | |||||||||||||||||||||||
Commercial and industrial | $ | $ | $ | $ | $ | $ | |||||||||||||||||
Commercial real estate | |||||||||||||||||||||||
Lease financing | |||||||||||||||||||||||
Total commercial loan and lease portfolio | |||||||||||||||||||||||
Consumer loan portfolio: | |||||||||||||||||||||||
Residential mortgage | |||||||||||||||||||||||
Consumer installment | |||||||||||||||||||||||
Home equity | |||||||||||||||||||||||
Total consumer loan portfolio | |||||||||||||||||||||||
Total impaired loans and leases with an allowance recorded | |||||||||||||||||||||||
Impaired loans and leases without an allowance recorded: | |||||||||||||||||||||||
Commercial loan and lease portfolio: | |||||||||||||||||||||||
Commercial and industrial | |||||||||||||||||||||||
Commercial real estate | |||||||||||||||||||||||
Total commercial loan and lease portfolio | |||||||||||||||||||||||
Consumer loan portfolio: | |||||||||||||||||||||||
Residential mortgage | |||||||||||||||||||||||
Consumer installment | |||||||||||||||||||||||
Home equity | |||||||||||||||||||||||
Total consumer loan portfolio | |||||||||||||||||||||||
Total impaired loans and leases without an allowance recorded | |||||||||||||||||||||||
Total impaired loans and leases | $ | $ | $ | $ | $ | $ | |||||||||||||||||
111
The average balances of impaired loans and leases and interest income recognized on impaired loans and leases for the year ended December 31, 2019 and the average loan balance of impaired loans and interest income recognized on impaired loans for the years ended December 31, 2018 and December 31, 2017 were as follows:
Year Ended December 31, | |||||||||||||||||||||||
2019 | 2018 | 2017 | |||||||||||||||||||||
(In thousands) | Average Loan and Lease Balance | Interest Income Recognized | Average Loan Balance | Interest Income Recognized | Average Loan Balance | Interest Income Recognized | |||||||||||||||||
Impaired loans and leases with an allowance recorded | |||||||||||||||||||||||
Commercial loan and lease portfolio: | |||||||||||||||||||||||
Commercial and industrial | $ | $ | $ | $ | $ | $ | |||||||||||||||||
Commercial real estate | |||||||||||||||||||||||
Lease financing | |||||||||||||||||||||||
Total commercial loan and lease portfolio | |||||||||||||||||||||||
Consumer loan portfolio: | |||||||||||||||||||||||
Residential mortgage | |||||||||||||||||||||||
Consumer installment | |||||||||||||||||||||||
Home equity | |||||||||||||||||||||||
Total consumer loan portfolio | |||||||||||||||||||||||
Total impaired loans and leases with an allowance recorded | |||||||||||||||||||||||
Impaired loans and leases without an allowance recorded | |||||||||||||||||||||||
Commercial loan and lease portfolio: | |||||||||||||||||||||||
Commercial and industrial | |||||||||||||||||||||||
Commercial real estate | |||||||||||||||||||||||
Total commercial loan and lease portfolio | |||||||||||||||||||||||
Consumer loan portfolio: | |||||||||||||||||||||||
Residential mortgage | |||||||||||||||||||||||
Consumer installment | |||||||||||||||||||||||
Home equity | |||||||||||||||||||||||
Total consumer loan portfolio | |||||||||||||||||||||||
Total impaired loans and leases without an allowance recorded | |||||||||||||||||||||||
Total impaired loans and leases | $ | $ | $ | $ | $ | $ | |||||||||||||||||
Other Real Estate Owned and Repossessed and Returned Assets Other real estate owned, repossessed and returned assets and consumer real estate loans in process of foreclosure were as follows:
At December 31, | |||||||
(In thousands) | 2019 | 2018 | |||||
Other real estate owned | $ | $ | |||||
Repossessed and returned assets | |||||||
Consumer real estate loans in process of foreclosure | |||||||
On August 1, 2019, the Corporation acquired $14.6 million of other real estate owned and $338 thousand of repossessed and returned assets in connection with the Merger. Other real estate owned and repossessed and returned assets were written down $7.7 million, $3.4 million and $6.2 million in 2019, 2018 and 2017, respectively.
112
Note 9. Premises and Equipment, Net
Premises and equipment, net were as follows:
At December 31, | |||||||
(In thousands) | 2019 | 2018 | |||||
Land | $ | $ | |||||
Office buildings | |||||||
Leasehold improvements | |||||||
Furniture, equipment and computer software | |||||||
Premises and equipment leased under finance leases | |||||||
Subtotal | |||||||
Accumulated depreciation and amortization | ( | ) | ( | ) | |||
Premises and equipment, net | $ | $ | |||||
Depreciation and amortization expense related to premises and equipment was $75.3 million, $48.6 million and $45.9 million for 2019, 2018 and 2017, respectively.
Note 10. Goodwill and Other Intangible Assets
Goodwill was as follows:
At December 31, | |||||||
(In thousands) | 2019 | 2018 | |||||
Goodwill related to consumer banking segment | $ | $ | |||||
Goodwill related to commercial banking segment | |||||||
Goodwill, net | $ | $ | |||||
The Corporation recorded goodwill in the amount of $1.1 billion related to the merger with Legacy TCF and Chemical completed on August 1, 2019. Goodwill was allocated to the appropriate reporting unit based on the relative fair value of assets acquired and deposits held by the reporting unit. This methodology allocates goodwill in proportion to the assets held by each reporting unit as well as incorporating the value of the funding source provided by the in place deposits. The reporting units aggregate between the Consumer Banking and Commercial Banking segments. See "Note 2. Merger" for further information. There was an impairment charge to goodwill of $73.0 million in 2017 related to the acquisition of Gateway One as a result of the Corporation's decision to discontinue auto finance loan originations effective December 31, 2017. Goodwill related to Gateway One was fully impaired at December 31, 2017. There was no impairment of goodwill in 2019 and 2018.
The following table sets forth the carrying amount and accumulated amortization of intangible assets that are amortizable and arose from business combinations or other acquisitions.
(In thousands) | Core deposit intangibles | Program agreements | Non-compete agreements | Customer relationships | Total | |||||||||||||||
At December 31, 2019 | ||||||||||||||||||||
Gross carrying value | $ | $ | $ | $ | $ | |||||||||||||||
Accumulated amortization | ( | ) | ( | ) | ( | ) | ( | ) | ( | ) | ||||||||||
Net carrying amount | $ | $ | $ | $ | $ | |||||||||||||||
At December 31, 2018 | ||||||||||||||||||||
Gross carrying value | $ | $ | $ | $ | $ | |||||||||||||||
Accumulated amortization | ( | ) | ( | ) | ( | ) | ( | ) | ( | ) | ||||||||||
Net carrying amount | $ | $ | $ | $ | $ | |||||||||||||||
There was no impairment of other intangible assets in 2019 and 2018. There was an impairment charge of $368 thousand in 2017 related to the customer relationships intangible asset attributable to Gateway One as a result of the Corporation's decision to discontinue auto finance loan originations effective December 31, 2017. The Gateway One customer relationships intangible asset was fully impaired at December 31, 2017 and written off in 2018.
113
Amortization expense for intangible assets was $11.7 million, $3.4 million and $2.0 million for 2019, 2018 and 2017, respectively.
The estimated future amortization expense on intangible assets for the next five years is as follows:
(In thousands) | Total | |||
2020 | $ | |||
2021 | ||||
2022 | ||||
2023 | ||||
2024 | ||||
Note 11. Loan Servicing Rights
Information regarding LSRs was as follows:
At December 31, | |||||||||||
(in thousands) | 2019 | 2018 | 2017 | ||||||||
Balance, beginning of period | $ | $ | $ | ||||||||
Acquired in the Merger | |||||||||||
New servicing assets created | |||||||||||
Impairment (charge) recovery | ( | ) | |||||||||
Amortization | ( | ) | ( | ) | ( | ) | |||||
Balance, end of period | $ | $ | $ | ||||||||
Valuation allowance, end of period | $ | ( | ) | ||||||||
Loans serviced for others that have servicing rights capitalized, end of period | $ | ||||||||||
Total loan servicing, late fee and other ancillary fee income, included in servicing fee income, related to loans serviced for others that have servicing rights capitalized was $7.0 million for December 31, 2019.
Note 12. Operating Lease Right-of-Use Assets and Liabilities
Operating lease right-of-use assets, included in other assets, were $118.7 million at December 31, 2019. Operating lease liabilities, included in other liabilities, were $138.4 million at December 31, 2019. In connection with the Merger, the Corporation recorded $39.8 million and $41.6 million of operating lease right-of-use assets and operating lease liabilities, respectively. Undiscounted future minimum operating lease payments and a reconciliation to the amount recorded as operating lease liabilities at December 31, 2019 were as follows:
(In thousands) | |||
2020 | $ | ||
2021 | |||
2022 | |||
2023 | |||
2024 | |||
Thereafter | |||
Total undiscounted future minimum operating lease payments | |||
Discount | ( | ) | |
Total operating lease liabilities | $ | ||
114
As of December 31, 2019, the Corporation had approximately $233.6 million in additional leases for real property that have not yet commenced and are excluded from the operating lease liability table above. Of this amount, $231.6 million was related to a lease agreement for the Corporation's new headquarters building in Detroit, Michigan signed on May 31, 2019 by Legacy Chemical, with an organization 50 % owned by indirect related parties. The new headquarter lease has a term of 22.5 years commencing January 1, 2022 with renewal options.
The weighted-average discount rate and remaining lease term for operating leases was as follows:
At December 31, 2019 | ||
Weighted-average discount rate | % | |
Weighted-average remaining lease term (years) | ||
The components of total lease cost for operating leases, included in occupancy and equipment noninterest expense, were as follows:
(In thousands) | Year Ended December 31, 2019 | ||
Lease expense | $ | ||
Short-term and variable lease cost | |||
Sublease income | ( | ) | |
Total lease cost for operating leases | $ | ||
Supplemental cash flow information related to operating leases was as follows:
(In thousands) | Year Ended December 31, 2019 | ||
Operating lease right-of-use assets obtained in exchange for operating lease liabilities | $ | ||
Cash paid for amounts included in the measurement of lease liabilities - operating | |||
Note 13. Investments in Qualified Affordable Housing Projects, Federal Historic Projects and New Market Tax Credits
The Corporation invests in qualified affordable housing projects, federal historic projects, and new market tax credits for the purposes of community reinvestment and to obtain tax credits. Return on the Corporation's investment in these projects comes in the form of pass-through tax credits and tax losses. The carrying value of the investments is included in other assets. The Corporation primarily utilizes the proportional amortization method to account for investments in qualified affordable housing projects and the equity method to account for investments in other tax credit projects.
Under the proportional amortization method, the Corporation amortizes the initial cost of the investment in proportion to the tax credits and other tax benefits. The Corporation recognized amortization expense of investments in qualified affordable housing projects of $13.3 million, $9.9 million and $9.6 million for the years ended December 31, 2019, 2018 and 2017, respectively. Amortization expense was offset by tax credits and other tax benefits of $16.6 million, $11.6 million and $12.5 million for the years ended December 31, 2019, 2018 and 2017, respectively. The Corporation's remaining investment in qualified affordable housing projects accounted for under the proportional amortization method totaled $195.8 million at December 31, 2019 and $90.9 million at December 31, 2018.
Under the equity method, the Corporation's share of the earnings or losses is included in other noninterest expense. The Corporation's remaining investment in federal historic projects, all of which were acquired in the Merger, totaled $43.6 million at December 31, 2019. During the year ended December 31, 2019, $4.6 million of income tax benefit was recognized due to the federal historic tax credits, which was partially offset by amortization expense, inclusive of impairment, of $4.0 million.
The Corporation's unfunded equity contributions relating to investments in qualified affordable housing projects, federal historic projects and new market tax credits are included in other liabilities. The Corporation's remaining unfunded equity contributions totaled $131.3 million at December 31, 2019 and $56.2 million at December 31, 2018.
Management analyzes these investments for potential impairment when events or changes in circumstances indicate that it is more-likely-than-not that the carrying amount of the investment will not be realized. An impairment loss is measured as the amount by which the carrying amount of an investment exceeds its fair value.
115
Note 14. Deposits
Deposits were as follows:
At December 31, | |||||||||||||
2019 | 2018 | ||||||||||||
(Dollars in thousands) | Amount | Year-to-Date Weighted-average Rate | Amount | Year-to-Date Weighted-average Rate | |||||||||
Checking: | |||||||||||||
Noninterest bearing | $ | — | % | $ | — | % | |||||||
Interest bearing | |||||||||||||
Total checking | |||||||||||||
Savings | |||||||||||||
Money market | |||||||||||||
Certificates of deposit | |||||||||||||
Total deposits | $ | % | $ | % | |||||||||
Excluded from total deposits are account overdrafts which have been classified as loans. At December 31, 2019 and 2018, overdrafts totaled $19.0 million and $9.6 million, respectively.
Scheduled maturities for certificates of deposits, including Certificate of Deposit Account Registry Service ("CDARS") deposits, IRA deposits and brokered deposits at December 31, 2019 were as follows:
(In thousands) | |||
2020 | $ | ||
2021 | |||
2022 | |||
2023 | |||
2024 | |||
Thereafter | |||
Total | $ | ||
The aggregate amount of certificates of deposit with balances equal to or greater than the Federal Deposit Insurance Corporation insurance limit of $250,000 was $2.2 billion and $782.4 million at December 31, 2019 and 2018, respectively.
Note 15. Borrowings
TCF Bank is a member of the FHLB, which provides short- and long-term funding collateralized by mortgage related assets to its members.
Collateralized deposits include TCF Bank's Repurchase Investment Sweep Agreement product collateralized by mortgage-backed securities, and funds deposited by customers that are collateralized by investment securities owned by TCF Bank, as these deposits are not covered by FDIC insurance.
116
Short-term borrowings (borrowings with an original maturity of less than one year) were as follows:
At December 31, 2019 | At December 31, 2018 | ||||||||||||
(Dollars in thousands) | Amount | Weighted-average Rate | Amount | Weighted-average Rate | |||||||||
FHLB advances | $ | % | $ | % | |||||||||
Collateralized deposits | |||||||||||||
Total short-term borrowings | $ | % | $ | % | |||||||||
On August 5, 2019, TCF Financial entered into a $50.0 million unsecured 364 -day revolving credit facility bearing interest at the then applicable Eurocurrency Rate plus 150 basis points, available to be used, as needed, to fund growth, common stock repurchases or other general corporate purposes. The revolving credit facility contains covenants related to certain thresholds that must be maintained related to various capital adequacy levels, asset quality and profitability ratios, and certain restrictions on levels of indebtedness. TCF Financial had no outstanding balance under the revolving credit facility and was in compliance with all covenants at December 31, 2019.
Long-term borrowings were as follows:
At December 31, 2019 | At December 31, 2018 | |||||||||
(Dollars in thousands) | Stated Rate | Amount | At Amount | |||||||
FHLB advances due 2020 to 2025 (1)(2) | 1.30% - 2.72% | $ | $ | |||||||
Subordinated debt: | ||||||||||
Subordinated debt obligation due 2022 | ||||||||||
Subordinated debt obligation due 2025 | ||||||||||
Subordinated debt obligation due 2029 | ||||||||||
Subordinated debt securities due 2032-2035 (3)(4) | 3.54% - 5.34% | |||||||||
Hedge related adjustment | ( | ) | ||||||||
Total subordinated debt obligations | ||||||||||
Discounted lease rentals due 2020 to 2024 | 2.64% - 6.50% | |||||||||
Finance lease obligation due 2038 | ||||||||||
Total long-term borrowings | $ | $ | ||||||||
(1)Includes the current portion of FHLB advances of $110.0 million at December 31, 2019.
(2)The December 31, 2019 balance includes advances payable of $1.81 billion and purchase accounting premiums of $12.1 million.
(3)The December 31, 2019 balance includes advances payable of $20.6 million and purchase accounting discounts of $1.6 million.
(4)Floating-rate based on three-month LIBOR plus 1.45 % - 3.25 %.
FHLB Advances As a result of the Merger, the Corporation assumed long-term FHLB advances. These long-term FHLB advances have maturity dates ranging from 2020 to 2025 and carried interest rates ranging from 1.30 % to 2.72 % at December 31, 2019. FHLB advances are collateralized by residential mortgage and commercial real estate loans.
Subordinated Debt Obligations As a result of the Merger, the Corporation assumed subordinated debt securities totaling $19.0 million. Included in the obligations assumed in the Merger were $5.6 million of obligations due in 2032 with a carrying interest rate based on the three-month LIBOR plus 3.25 % and $13.4 million of obligations due in 2034 and 2035 with carrying interest rates based on the three-month LIBOR plus 1.45 % to 2.85 %.
On July 2, 2019, TCF Bank issued $150.0 million of fixed-to-floating rate subordinated notes (the "2029 Notes") at par. The fixed-to-floating rate subordinated notes, due July 2, 2029, bear an initial interest rate of 4.125 % per annum, payable semi-annually in arrears on January 2 and July 2, commencing on January 2, 2020. The 2029 Notes are redeemable at TCF Bank's option beginning on July 2, 2024. Effective July 2, 2024, the interest rate will reset quarterly to an annual interest rate equal to the then-current three-month LIBOR rate plus 237.5 basis points, payable quarterly in arrears on January 2, April 2, July 2 and October 2, commencing on October 2, 2024. TCF Bank incurred issuance costs of $1.5 million that are amortized as interest expense to the call date in 2024 using the effective interest method.
At December 31, 2019, TCF Bank had pledged loans secured by consumer and commercial real estate and FHLB stock with an aggregate carrying value of $10.5 billion. At December 31, 2019, $1.5 billion of the FHLB advances outstanding were prepayable at the Corporation's option.
117
The contractual maturities of long-term borrowings at December 31, 2019 were as follows:
(In thousands) | |||
2020 | $ | ||
2021 | |||
2022 | |||
2023 | |||
2024 | |||
Thereafter | |||
Total long-term borrowings | $ | ||
Note 16. Income Taxes
Applicable income taxes in the Consolidated Statements of Income were as follows:
(In thousands) | Current | Deferred | Total | ||||||||
Year Ended December 31, 2019: | |||||||||||
Federal | $ | ( | ) | $ | $ | ||||||
State | ( | ) | |||||||||
Foreign | ( | ) | |||||||||
Total | $ | $ | $ | ||||||||
Year Ended December 31, 2018: | |||||||||||
Federal | $ | $ | $ | ||||||||
State | |||||||||||
Foreign | |||||||||||
Total | $ | $ | $ | ||||||||
Year Ended December 31, 2017: | |||||||||||
Federal | $ | $ | ( | ) | $ | ( | ) | ||||
State | |||||||||||
Foreign | ( | ) | |||||||||
Total | $ | $ | ( | ) | $ | ( | ) | ||||
Reconciliations to the Corporation's effective income tax rates from the statutory federal income tax rates were as follows:
Year Ended December 31, | ||||||||
2019 | 2018 | 2017 | ||||||
Federal income tax rate | % | % | % | |||||
Increase (decrease) resulting from: | ||||||||
Tax basis adjustment | ( | ) | ||||||
State income tax, net of federal tax | ||||||||
Tax credit investments | ( | ) | ( | ) | ( | ) | ||
Tax-exempt income | ( | ) | ( | ) | ( | ) | ||
Merger deferred tax reprice | ( | ) | ||||||
State tax settlements, net of federal tax | ( | ) | ( | ) | ||||
Non-controlling interest tax effect | ( | ) | ( | ) | ( | ) | ||
Stock compensation | ( | ) | ( | ) | ( | ) | ||
Tax reform effects, net | ( | ) | ( | ) | ||||
Nondeductible goodwill impairment effect | ||||||||
Other, net | ( | ) | ||||||
Effective income tax rate | % | % | ( | )% | ||||
118
As a result of the Tax Cuts and Jobs Act, enacted on December 22, 2017 ("Tax Reform"), the Corporation recorded a reasonable estimate of a net tax benefit of $130.7 million in its consolidated financial statements for 2017, primarily resulting from the re-measurement of the Corporation's estimated net deferred tax liability. Certain of these amounts were provisional in nature, as all the information necessary to record more precise amounts was not available, prepared or analyzed for 2017. The Corporation recorded an additional net tax benefit of $1.1 million in the second quarter of 2018 for the finalization of the provisional amounts recorded in 2017.
The Corporation considers its undistributed foreign earnings to be reinvested indefinitely. This position is based on management's determination that cash held in the Corporation's foreign jurisdictions is not needed to fund its U.S. operations and that it either has reinvested or has intentions to reinvest these earnings. While management currently intends to indefinitely reinvest all of the Corporation's foreign earnings, should circumstances or tax laws change, the Corporation may need to record additional income tax expense in the period in which such determination or tax law change occurs.
Due to the shift to a worldwide territorial tax regime as part of Tax Reform, future repatriations of foreign earnings are no longer subject to U.S. federal income tax. However, these foreign earnings may be subject to foreign withholding taxes should they be distributed in the form of dividends. As of December 31, 2019, the estimated withholding taxes that could be due on these earnings was $4.7 million.
Reconciliations of the changes in unrecognized tax benefits were as follows:
At or For the Year Ended December 31, | |||||||||||
(In thousands) | 2019 | 2018 | 2017 | ||||||||
Balance, beginning of period | $ | $ | $ | ||||||||
Increases for tax positions related to the current year | |||||||||||
Increases for tax positions related to prior years | |||||||||||
Decreases for tax positions related to prior years | ( | ) | ( | ) | ( | ) | |||||
Settlements with taxing authorities | ( | ) | |||||||||
Decreases related to lapses of applicable statutes of limitation | ( | ) | ( | ) | |||||||
Balance, end of period | $ | $ | $ | ||||||||
The total amount of unrecognized tax benefits that, if recognized, would affect the effective tax rate was $2.1 million and $3.7 million at December 31, 2019 and 2018, respectively. The Corporation recognizes increases and decreases for interest and penalties related to unrecognized tax benefits, where applicable, in income tax expense (benefit). The Corporation recognized approximately $400 thousand of tax benefit, $100 thousand of tax expense and $600 thousand of tax benefit for 2019, 2018 and 2017, respectively, related to interest and penalties. Interest and penalties of approximately $300 thousand and $700 thousand were accrued at December 31, 2019 and 2018, respectively.
The Corporation's federal income tax returns are open and subject to examination for 2016 and later tax return years. The Corporation's various state income tax returns are generally open for 2015 and later tax return years based on individual state statutes of limitation. The Corporation's various foreign income tax returns are open and subject to examination for 2015 and later tax return years. Changes in the amount of unrecognized tax benefits within the next 12 months from normal expirations of statutes of limitation are not expected to be material.
119
The Corporation's deferred tax assets and deferred tax liabilities were as follows:
At December 31, | |||||||
(In thousands) | 2019 | 2018 | |||||
Deferred tax assets: | |||||||
Net operating losses and other carryforwards | $ | $ | |||||
Acquisition-related fair value adjustments | |||||||
Stock compensation and deferred compensation plans | |||||||
Allowance for loan and lease losses | |||||||
Nonaccrual interest | |||||||
Investment securities available-for-sale | |||||||
Other | |||||||
Deferred tax assets | |||||||
Valuation allowance | ( | ) | ( | ) | |||
Total deferred tax assets, net of valuation allowance | |||||||
Deferred tax liabilities: | |||||||
Lease financing | |||||||
Goodwill and other intangibles | |||||||
Premises and equipment | |||||||
Investment securities available-for-sale | |||||||
Loan servicing rights | |||||||
Loan fees and discounts | |||||||
Prepaid expenses | |||||||
Other | |||||||
Total deferred tax liabilities | |||||||
Net deferred tax liabilities | $ | $ | |||||
The net operating losses and other carryforwards at December 31, 2019 consisted of federal net operating losses of $23.0 million that expire in 2026 through 2034, state net operating losses of $7.4 million that expire in 2020 through 2039, charitable contribution carryforwards of $3.4 million that expire in 2024, capital loss carryforwards of $200 thousand that expire in 2022, federal credit carryforwards of $19.5 million that expire in 2028 through 2039 and federal credit carryforwards of $5.0 million that do not expire. The valuation allowance against the Corporation’s deferred tax asset at December 31, 2019 consisted of state net operating losses of $12.3 million and capital loss carryforwards of $600 thousand. The valuation allowance at December 31, 2019 and 2018 principally applies to net operating losses and capital loss carryforwards that, in the opinion of management, are more-likely-than-not to expire unutilized. However, to the extent that tax benefits related to these carryforwards are realized in the future, the reduction in the valuation allowance will reduce income tax expense.
Note 17. Revenue from Contracts with Customers
The Corporation earns a variety of revenue, including interest and fees, from customers, as well as revenues from noncustomers. The majority of the Corporation's sources of revenue are included in interest income and noninterest income and are outside of the scope of ASC Topic 606, Revenue from Contracts with Customers ("ASC 606"). Other sources of revenue fall within the scope of ASC 606 and are mostly included in noninterest income.
120
The Corporation recognizes revenue when the performance obligations related to the transfer of goods or services under the terms of a contract are satisfied. Some obligations are satisfied at a point in time, while others are satisfied over a period of time. Revenue is recognized as the amount of consideration expected to be received in exchange for transferring goods or services to a customer and is segregated based on the nature of product and services offered as part of contractual arrangements. Revenue streams within the scope of ASC 606 are discussed below.
• | Fees and Service Charges on Deposit Accounts Fees and service charges on deposit accounts includes fees and other charges the Corporation receives to provide various services, including but not limited to, service charges on deposit accounts and other fees including account analysis fees, monthly service fees, overdraft services, transferring funds, and accepting and executing stop-payment orders. The Corporation's performance obligation for account analysis fees and monthly service fees are generally satisfied and, therefore, revenue is recognized over the period in which the service is provided. Deposit account related fees are largely transactional based, and therefore, the performance obligation is satisfied and the related revenue is recognized at the point in time when the transaction occurs. |
• | Wealth Management Revenue Wealth management revenue includes fee income generated from personal and institutional customers. The Corporation also provides investment management services. Revenue is recognized over the period of time the services are rendered. Wealth management revenue also includes commissions that are earned for placing a brokerage transaction for execution. Revenue is recognized once the transaction is completed and the Corporation is entitled to receive consideration. |
• | Card and ATM Revenue Card and ATM revenue includes ATM surcharges and debit card related revenue. ATM surcharges and certain debit card fees are transactional based and, therefore, the performance obligation is satisfied and the related revenue is recognized at the point in time when the transaction occurs. Other debit card fees satisfied over a period of time are recognized over the period in which the service is provided. |
• | Other Noninterest Income Other noninterest income includes wire transfer fees, safe deposit box income and check orders. The consideration includes both fixed (e.g., safe deposit box fees) and transaction (i.e., wire-transfer fee and check orders) fees. Fixed fees are recognized over the period of time the service is provided, while transaction fees are recognized when a specific service is rendered to the customer. |
• | Net Foreclosed Real Estate and Repossessed Assets Expense Net foreclosed real estate and repossessed assets expense includes net gain or loss on sales of other real estate owned and repossessed assets. Revenue is recognized at the time the sale is complete and the Corporation is entitled to receive consideration, including sales that are seller financed as receipt of all payment is expected. |
121
The following tables present total noninterest income segregated between contracts with customers within the scope of ASC 606 and those within the scope of other GAAP topics.
Year Ended December 31, 2019 | |||||||||||||||||||
Within the scope of ASC 606 | Out of scope of ASC 606 | Total | |||||||||||||||||
(In thousands) | Consumer Banking | Commercial Banking | Enterprise Services | ||||||||||||||||
Noninterest income | |||||||||||||||||||
Fees and service charges on deposit accounts | $ | $ | $ | $ | $ | ||||||||||||||
Wealth management revenue | |||||||||||||||||||
Card and ATM revenue | |||||||||||||||||||
Other noninterest income | |||||||||||||||||||
Total | $ | $ | $ | $ | $ | ||||||||||||||
Noninterest expense | |||||||||||||||||||
Net foreclosed real estate and repossessed assets | $ | ( | ) | $ | $ | ( | ) | $ | $ | ||||||||||
Year Ended December 31, 2018 | |||||||||||||||||||
Within the scope of ASC 606 | Out of scope of ASC 606 | Total | |||||||||||||||||
(In thousands) | Consumer Banking | Commercial Banking | Enterprise Services | ||||||||||||||||
Noninterest income | |||||||||||||||||||
Fees and service charges on deposit accounts | $ | $ | $ | $ | $ | ||||||||||||||
Card and ATM revenue | |||||||||||||||||||
Other noninterest income | |||||||||||||||||||
Total | $ | $ | $ | $ | $ | ||||||||||||||
Noninterest expense | |||||||||||||||||||
Net foreclosed real estate and repossessed assets | $ | $ | ( | ) | $ | $ | $ | ||||||||||||
December 31, 2017 | |||||||||||||||||||
Within the scope of ASC 606 | Out of scope of ASC 606 | Total | |||||||||||||||||
(In thousands) | Consumer Banking | Commercial Banking | Enterprise Services | ||||||||||||||||
Noninterest income | |||||||||||||||||||
Fees and service charges on deposit accounts | $ | $ | $ | $ | $ | ||||||||||||||
Card and ATM revenue | |||||||||||||||||||
Other noninterest income | ( | ) | |||||||||||||||||
Total | $ | $ | $ | $ | $ | ||||||||||||||
Noninterest expense | |||||||||||||||||||
Net foreclosed real estate and repossessed assets | $ | $ | $ | $ | $ | ||||||||||||||
Contract Balances A contract asset balance occurs when an entity performs a service for a customer before the customer pays consideration (resulting in a contract receivable) or before payment is due (resulting in a contract asset). A contract liability balance is an entity's obligation to transfer a service to a customer for which the entity has already received payment (or payment is due) from the customer. The Corporation's noninterest income streams are largely based on transactional activity, or standard month-end revenue accruals such as asset management fees based on month-end market values. Consideration is most often received immediately or shortly after the Corporation satisfies its performance obligation and revenue is recognized. The Corporation does not typically enter into long-term revenue contracts with customers, and therefore, does not experience significant contract balances.
122
Note 18. Equity
Preferred Stock Preferred stock was as follows:
At December 31, | |||||||
(In thousands) | 2019 | 2018 | |||||
Series C non-cumulative perpetual preferred stock | $ | $ | |||||
Pursuant to the merger agreement, each outstanding share of Legacy TCF 5.70 % Series C Non-Cumulative Perpetual Preferred Stock, with a liquidation preference of $25,000 per share (the "Legacy TCF Preferred Stock") was converted into the right to receive one share of newly created 5.70 % Series C Non-Cumulative Perpetual Preferred Stock of TCF, par value $0.01 per share, with a liquidation preference of $25,000 per share (equivalent to $25 per depositary share) (the "New TCF Preferred Stock"), and each depository share representing 1/1000th of a share of Legacy TCF Preferred Stock was converted into one depositary share representing 1/1000th of a share of New TCF Preferred Stock. Immediately following the Merger Date, the Corporation had 7,000 shares of New TCF Preferred Stock outstanding and 7,000,000 related depositary shares outstanding. Dividends are payable on the Series C Preferred Stock if, as and when declared by TCF's Board of Directors on a non-cumulative basis on March 1, June 1, September 1 and December 1 of each year. The Series C Preferred Stock may be redeemed at the Corporation's option in whole or in part on December 1, 2022 or on any dividend payment date thereafter.
On March 1, 2018, the Corporation redeemed all 4,000,000 of the outstanding shares of the 6.45 % Series B non-cumulative perpetual preferred stock of TCF Financial Corporation, par value $0.01 per share, with a liquidation preference of per share (the "Series B Preferred Stock") for $100.0 million. Deferred stock issuance costs of $3.5 million originally recorded as a reduction to preferred stock upon the issuance of the Series B Preferred Stock were reclassified to retained earnings and resulted in a one-time, non-cash reduction to net income available to common shareholders utilized in the computation of earnings per common share and diluted earnings per common share for 2018. Dividends were payable on the Series B Preferred Stock if, as and when declared by the Corporation's Board of Directors on a non-cumulative basis on March 1, June 1, September 1 and December 1 of each year.
Restricted Retained Earnings Retained earnings at TCF Bank at December 31, 2019 included approximately $170.2 million for which no provision for federal income taxes has been made. This amount represents earnings legally appropriated to thrift bad debt reserves and deducted for federal income tax purposes in prior years and is generally not available for payment of cash dividends or other distributions to shareholders. Future payments or distributions of these appropriated earnings could create a tax liability for the Corporation based on the amount of the distributions and the tax rates in effect at that time.
Treasury Stock and Other Treasury stock and other were as follows:
At December 31, | |||||||
(In thousands) | 2019 | 2018 | |||||
Treasury stock, at cost | $ | $ | |||||
Shares held in trust for deferred compensation plans, at cost | |||||||
Total | $ | $ | |||||
The Corporation repurchased $86.3 million of its common stock in the year ended December 31, 2019 pursuant to its share repurchase program. Repurchases of common stock prior to the Merger date were recorded as treasury stock. In connection with the merger, all previously outstanding Legacy TCF treasury stock was eliminated. Subsequent to the merger, repurchases of common stock were retired. The Corporation repurchased $212.9 million and $9.2 million of its common stock for 2018 and 2017, respectively, pursuant to its share repurchase program. These shares were recorded as treasury stock. At December 31, 2019, the Corporation had the authority to repurchase an additional $122.5 million in aggregate value of shares pursuant to its share repurchase program.
The Corporation reissued 347,329 shares of treasury stock at a cost of $12.9 million in 2019 related to grants of restricted stock awards compared to 8,130 shares of treasury stock at a cost of $378 thousand in 2018. There were no reissuances of treasury stock in 2017.
123
The cost of TCF common stock held in trust for the deferred compensation plans, including the Directors Deferred Compensation Plans, TCF Financial 2015 Omnibus Incentive Plan and the TCF 401K Supplemental Plan, is reported in a manner similar to treasury stock (that is, changes in fair value are not recognized) with a corresponding deferred compensation obligation reflected in additional paid-in capital. Upon resignation, death, disability or termination of a deferred compensation plan participant or based on other contractual requirements, the shares held in trust are distributed to the respective plan's participant or beneficiary, as applicable. See "Note 20. Share-based Compensation" and "Note 21. Retirement Plans" for further information on deferred compensation plans.
Note 19. Regulatory Capital Requirements
TCF and TCF Bank are subject to minimum capital requirements administered by the federal banking regulators. Failure to meet minimum capital requirements can initiate certain mandatory, and possible additional discretionary, actions by the federal banking regulators that could have a material adverse effect on TCF. In general, TCF Bank may not declare or pay a dividend to TCF Financial in excess of 100 % of its net retained earnings for the current year combined with its net retained earnings for the preceding two calendar years, which was $340.8 million at December 31, 2019, without prior approval of the Office of the Comptroller of the Currency (the "OCC"). The OCC also has the authority to prohibit the payment of dividends by a national bank when it determines such payments would constitute an unsafe and unsound banking practice. TCF Bank's ability to make capital distributions in the future may require regulatory approval and may be restricted by its federal banking regulators. TCF Bank's ability to make any such distributions will also depend on its earnings and ability to meet minimum regulatory capital requirements in effect during future periods. In the future, these capital adequacy standards may be higher than existing minimum regulatory capital requirements.
The Basel III capital standards allowed institutions not subject to the advanced approaches requirements to opt out of including components of accumulated other comprehensive income (loss) in common equity Tier 1 capital. TCF and TCF Bank made the one-time permanent election to not include accumulated other comprehensive income (loss) in regulatory capital.
Regulatory capital information for TCF and TCF Bank was as follows:
TCF | TCF Bank | ||||||||||||||||||||
At December 31, | At December 31, | ||||||||||||||||||||
(Dollars in thousands) | 2019 | 2018 | 2019 | 2018 | Well-capitalized Standard | Minimum Capital Requirement(1) | |||||||||||||||
Regulatory Capital: | |||||||||||||||||||||
Common equity Tier 1 capital | $ | $ | $ | $ | |||||||||||||||||
Tier 1 capital | |||||||||||||||||||||
Total capital | |||||||||||||||||||||
Regulatory Capital Ratios: | |||||||||||||||||||||
Common equity Tier 1 capital ratio | % | % | % | % | % | % | |||||||||||||||
Tier 1 risk-based capital ratio | |||||||||||||||||||||
Total risk-based capital ratio | |||||||||||||||||||||
Tier 1 leverage ratio | |||||||||||||||||||||
(1) | Excludes capital conservation buffer of |
124
Note 20. Share-based Compensation
Before the Merger, Chemical and Legacy TCF granted share-based awards under their respective share-based compensation plans, including the Chemical Stock Incentive Plan of 2019 (the "Stock Incentive Plan of 2019”") and the TCF Financial 2015 Omnibus Incentive Plan (the "Legacy TCF Omnibus Incentive Plan"). At December 31, 2019, there were 1,808,804 shares reserved for issuance under the Stock Incentive Plan of 2019 and there were 2,271,524 shares reserved for issuance under the Legacy TCF Omnibus Incentive Plan.
In connection with the Merger, each equity award granted under Legacy TCF’s equity plans, including the Legacy TCF Omnibus Incentive Plan, was legally assumed by the combined company and adjusted so that its holder is entitled to receive a number of shares of TCF Financial's common stock equal to the product of (a) the number of shares of Legacy TCF common stock subject to such award multiplied by (b) the Exchange Ratio and (c) rounded, as applicable, to the nearest whole share, and otherwise subject to the same terms and conditions (including, without limitation, with respect to vesting conditions (taking into account any vesting that occurred at the Merger Date) and cash dividend equivalent rights). For any Legacy TCF equity awards that were subject to performance-based vesting at multiple achievement levels, the number of shares of Legacy TCF common stock underlying such award was calculated and fixed as of the Merger Date assuming achievement of the applicable performance conditions at the greater of target level performance or the actual level of achievement of Legacy TCF’s performance results through the latest practicable date before the Merger Date. Such awards converted into service-based vesting awards with the applicable vesting date to be the last day of the original performance period. For purposes of Legacy TCF equity awards for which performance was achievable at a single level, the performance condition was deemed satisfied as of the Merger Date.
In connection with the Merger, all outstanding stock options, performance-based restricted stock units and time-vesting restricted stock units of Chemical (collectively, the "Chemical equity awards") which were outstanding immediately before the Merger Date continue to be awards in respect of TCF Financial common stock following the Merger, subject to the same terms and conditions that were applicable to such awards before the Merger Date, except with respect to performance-based restricted stock units. The performance-based restricted stock units for which performance results had not been measured were measured as of the latest practicable date before the Merger Date and the number of performance-based restricted stock units was fixed at the greater of the target (100%) performance level or actual performance (the “Chemical earned awards”) and such Chemical earned awards will continue to vest based on the executive’s continued service through the end of the applicable performance period.
The fair value of share-based awards is recognized as compensation expense over the requisite service or performance period. Compensation expense for share-based awards was $15.2 million, $16.5 million and $12.7 million for the years ended December 31, 2019, 2018 and 2017, respectively. The excess tax benefit realized from share-based compensation transactions during the years ended December 31, 2019, 2018 and 2017 was a benefit of $2.3 million, $2.6 million and $2.8 million, respectively.
Restricted Stock Units
The Corporation can grant performance-based restricted stock units ("PRSUs") and time-based restricted stock units ("TRSUs") (collectively referred to as "RSUs") under the Stock Incentive Plan of 2019 and the Legacy TCF Omnibus Incentive Plan; provided that, RSUs granted under the Legacy TCF Omnibus Incentive Plan may only be granted to former employees of Legacy TCF. At December 31, 2019, there were no PRSUs outstanding dependent on achieving certain performance target levels and the grantee completing the requisite service period. The TRSUs vest upon satisfaction of a service condition. Upon achievement of the performance target level and/or satisfaction of a service condition, as applicable, the RSUs are converted into shares of TCF Financial's common stock on a one-to-one basis.
125
A summary of the activity for RSUs for the years ended December 31, 2019, 2018 and 2017 is presented below:
Number of Units | Weighted-average Grant Date Fair Value Per Unit | |||||
Outstanding at December 31, 2016 | $ | |||||
Outstanding at December 31, 2016 as adjusted for conversion | ||||||
Granted | ||||||
Outstanding at December 31, 2017 | ||||||
Outstanding at December 31, 2017 as adjusted for conversion | ||||||
Granted | ||||||
Forfeited/canceled | ( | ) | ||||
Vested | ( | ) | ||||
Outstanding at December 31, 2018 | ||||||
Outstanding at December 31, 2018 as adjusted for conversion | ||||||
Granted | ||||||
Acquired in the Merger(1) | ||||||
Forfeited/canceled | ( | ) | ||||
Vested | ( | ) | ||||
Outstanding at December 31, 2019 | ||||||
(1) | Inclusive of certain Legacy TCF PRSUs which were converted at their maximum payout into |
Unrecognized compensation expense related to RSUs totaled $42.6 million at December 31, 2019 and is expected to be recognized over the remaining weighted-average period of 2.2 years.
Restricted Stock Awards
The Corporation's restricted stock award transactions were as follows:
Number of Awards | Weighted-Average Grant Date Fair Value Per Award | |||||
Outstanding at December 31, 2016 | $ | |||||
Outstanding at December 31, 2016 as adjusted for conversion | ||||||
Granted | ||||||
Forfeited/canceled | ( | ) | ||||
Vested | ( | ) | ||||
Outstanding at December 31, 2017 | $ | |||||
Outstanding at December 31, 2017 as adjusted for conversion | ||||||
Granted | ||||||
Forfeited/canceled | ( | ) | ||||
Vested | ( | ) | ||||
Outstanding at December 31, 2018 | ||||||
Outstanding at December 31, 2018 as adjusted for conversion | ||||||
Granted | ||||||
Forfeited/canceled | ( | ) | ||||
Vested | ( | ) | ||||
Outstanding at December 31, 2019 | $ | |||||
At December 31, 2019, there were no shares of performance-based restricted stock awards outstanding. Unrecognized stock compensation expense for restricted stock awards was $18.5 million at December 31, 2019 with a weighted-average remaining amortization period of 2.4 years.
126
Stock Options
A summary of activity for the Corporation's stock options is presented below:
Non-Vested Stock Options Outstanding | Stock Options Outstanding | ||||||||||||
Number of Options | Weighted-average Exercise Price | Number of Options | Weighted-average Exercise Price | ||||||||||
Outstanding at December 31, 2016 | $ | $ | |||||||||||
Outstanding at December 31, 2016 as adjusted for conversion | |||||||||||||
Exercised | ( | ) | |||||||||||
Outstanding at December 31, 2017 | |||||||||||||
Outstanding at December 31, 2017 as adjusted for conversion | |||||||||||||
Exercised | ( | ) | |||||||||||
Outstanding at December 31, 2018 | |||||||||||||
Acquired in the Merger(1) | |||||||||||||
Exercised | ( | ) | |||||||||||
Forfeited/canceled | ( | ) | |||||||||||
Expired | ( | ) | |||||||||||
Vested | ( | ) | |||||||||||
Outstanding at December 31, 2019 | $ | $ | |||||||||||
Exercisable/vested at December 31, 2019 | $ | ||||||||||||
(1) Options acquired in the Merger expire ten years from the date of grant and vest ratably over a five-year period.
The weighted-average remaining contractual term was 3.87 years for all stock options outstanding and 3.25 years for all exercisable stock options at December 31, 2019. The intrinsic value of all outstanding in-the-money stock options and exercisable in-the-money stock options was $10.1 million and $9.0 million, respectively, at December 31, 2019. The aggregate intrinsic values of outstanding and exercisable options at December 31, 2019 were calculated based on the closing market price of TCF Financial's common stock on December 31, 2019 of $46.80 per share less the exercise price. Options with intrinsic values less than zero, or "out-of-the-money" options, are not included in the aggregate intrinsic value reported.
During the year ended December 31, 2019, $771 thousand cash was received from option exercises.
Note 21. Retirement Plans
The Corporation maintains four Legacy TCF employee benefit plans: (i) the TCF 401K Plan (the "TCF 401K"), (ii) the TCF 401K Supplemental Plan (the "Legacy TCF Supplemental Plan"), (iii) the TCF Cash Balance Pension Plan (the "Legacy TCF Pension Plan"), a defined benefit pension plan, and (iv) the TCF Postretirement Plan (the "Legacy TCF Postretirement Plan"). Effective November 1, 2019, the Legacy TCF Pension Plan has been terminated.
The Corporation also maintains the Chemical employee benefit plans that existed before the Merger: (i) the Chemical Financial Corporation Nonqualified Postretirement Benefit Plan (the "Chemical Postretirement Benefit Plan"), and (ii) the Chemical Financial Corporation 401k Savings Plan (the "Chemical 401k"). In addition, Chemical has a pension plan, the Chemical Pension Plan (together with TCF Pension Plan, defined as the "Pension Plans"), which is a defined benefit pension plan, that was terminated effective August 31, 2019.
127
Qualified Defined Benefit Pension Plans
The Board of Directors of Legacy TCF approved the termination of the Legacy TCF Pension Plan, a qualified defined benefit plan, effective November 1, 2019. The Legacy TCF Pension Plan covered employees who were hired prior to June 30, 2004, were at least 21 years old and had worked 1,000 hours. Effective March 31, 2006, Legacy TCF amended the Legacy TCF Pension Plan to discontinue compensation credits for all participants. Interest credits will continue to be paid until participants' accounts are distributed from the Legacy TCF Pension Plan. The Corporation makes a monthly interest credit to each participant's account. The interest rate used to determine the monthly interest credit is based on the one-year average of the 5 -year Treasury Constant Maturity Rate plus 25 basis points, rounded to the nearest quarter point, capped at 12 % and determined at the beginning of each year. The weighted-average interest crediting rate was 3.00 % and 2.25 % for 2019 and 2018, respectively. All participant accounts are 100 % vested. At December 31, 2019 the Legacy TCF Pension Plan was remeasured and resulted in the Corporation recording an expense of $2.3 million related to the fair value adjustment. The Legacy TCF Pension Plan was fully funded as of December 31, 2019. The Corporation does not consolidate the assets and liabilities associated with the Legacy TCF Pension Plan.
The termination of the Chemical Pension Plan was approved effective August 31, 2019. The discount rate was adjusted to 3.48 % based on the remeasurement of the Chemical Pension Plan required due to the Merger and the termination. At the time of the Merger, as a result of the termination, the Corporation recognized a prepaid asset representing the funded status of the Chemical Pension Plan, net of estimated settlement costs, and the balance previously recorded in accumulated other comprehensive income was eliminated. The purchase accounting adjustment, as a result of the Merger, was reported in goodwill. At December 31, 2019, the Chemical Pension Plan's annual remeasurement resulted in the Corporation recording an expense of $4.0 million related to the fair value adjustment. The Chemical Pension Plan was fully funded as of December 31, 2019.
Nonqualified Postretirement Benefit Plans
The Legacy TCF Postretirement Plan provides health care benefits to eligible retired employees who retired prior to December 31, 2009. Effective January 1, 2000, the Corporation modified the Postretirement Plan for employees not yet eligible for benefits under the Postretirement Plan by eliminating the Corporation subsidy. The provisions for full-time and retired employees then eligible for these benefits were not changed. The Postretirement Plan is not funded.
The Chemical Postretirement Benefit Plan provides medical and dental benefits, upon retirement, to a limited number of active and retired employees. The majority of the retirees are required to make contributions toward the cost of their benefits based on their years of credited service and age at retirement. Covered employees include those who were at least age 50 as of January 1, 2012, that retire at age 60 or older, have at least 25 years of service with Chemical and are participants in the active employee group health insurance plan. Eligible employees may also cover their spouse until age 65 as long as the spouse is not offered health insurance coverage through his or her employer. Employees and their spouses eligible to participate in the Chemical Postretirement Benefit Plan are required to make contributions toward the cost of their benefits upon retirement, with the contribution levels designed to cover the projected overall cost of these benefits over the long-term. Retiree contributions are generally adjusted annually. The accounting for these postretirement benefits anticipates changes in future cost-sharing features such as retiree contributions, deductibles, copayments and coinsurance. The benefits can be amended, modified or terminated by the Corporation at any time.
401(k) Savings Plans
The TCF 401K, a qualified postretirement benefit and employee stock ownership plan, allows participants to make contributions of up to 50 % of their covered compensation on a tax-deferred and/or after-tax basis, subject to the annual covered compensation limitation imposed by the Internal Revenue Service ("IRS"). TCF matches the contributions of all participants with TCF common stock at the rate of $1 per dollar for employees with one or more years of service up to a maximum company contribution of 5.0 % of the employee's covered compensation per pay period subject to the annual covered compensation limitation imposed by the IRS. Employee contributions vest immediately and matching contributions made subsequent to January 1, 2016 vest immediately. The corporation matching contributions made prior to January 1, 2016 are subject to a graduated vesting schedule based on an employee's years of service with full vesting after five years . Dividends on TCF's common shares held in the 401K reduce retained earnings and the shares are considered outstanding for computing earnings per share.
128
Employees have the opportunity to diversify and invest their account balance, including matching contributions, in various mutual funds or TCF common stock. At December 31, 2019, the fair value of the assets in the TCF 401K totaled $583.0 million and included $194.0 million invested in TCF common stock. Dividends on TCF common shares held in the 401K reduce retained earnings and the shares are considered outstanding for computing earnings per share. The Corporation's matching contributions are expensed when earned. The Corporation's contributions to the TCF 401K were $12.3 million for each of 2019, 2018 and 2017.
The Legacy TCF Supplemental Plan, a nonqualified plan, allows certain employees to contribute up to 50 % of their salary and bonus. The Corporation's matching contributions to this plan totaled $1.2 million, $1.3 million and $1.2 million for 2019, 2018 and 2017, respectively. The Corporation made no other contributions to this plan, other than payment of administrative expenses. The amounts deferred under this plan are invested in TCF common stock or mutual funds. At December 31, 2019 and 2018, the fair value of the assets in the plan totaled $69.7 million and $51.7 million, respectively, and included $27.6 million and $23.0 million, respectively, invested in TCF common stock. The plan's assets invested in TCF common stock are held in trust and included in treasury stock and other. See "Note 18. Equity" for further information on treasury stock and other.
The Chemical 401K, a qualified postretirement benefit plan, is available to all former Chemical employees that continue to be employed following the Merger Date, and provides tax-deferred salary deductions and alternative investment options. The Corporation provides a safe harbor matching contribution of the participant's elective deferrals up to a maximum of 6.0 % of eligible compensation up to the maximum amount imposed by the IRS. The Chemical 401K provides the option to invest in TCF common stock. The Corporation's matching contributions are expensed when earned. The Corporation's contributions to the Chemical 401K were $4.1 million for 2019.
As of December 31, 2019, the Chemical 401K is merged with and into the TCF 401K.
Benefit Obligations and Plan Expenses
The measurement of the benefit obligation, prepaid pension asset, pension liability and annual pension expense involves actuarial valuation methods and the use of actuarial and economic assumptions. Due to the long-term nature of the Pension Plans' obligation, actual results may differ significantly from the actuarial-based estimates. Differences between estimates and actual experience are recorded in the year they arise. The Corporation closely monitors all assumptions and updates them annually. The Corporation does not consolidate the assets and liabilities associated with the Pension Plans. The information set forth in the following tables is based on current actuarial reports.
129
The following schedule sets forth the changes in the benefit obligation and plan assets of the Corporation's Plans:
Pension Plans | Postretirement Benefit Plans | ||||||||||||||
At or For the Year Ended December 31, | |||||||||||||||
(In thousands) | 2019 | 2018 | 2019 | 2018 | |||||||||||
Benefit obligation: | |||||||||||||||
Benefit obligation, beginning of year | $ | $ | $ | $ | |||||||||||
Benefit obligation acquired in Merger | |||||||||||||||
Service cost | |||||||||||||||
Interest cost | |||||||||||||||
Net actuarial loss (gain) | ( | ) | ( | ) | ( | ) | |||||||||
Benefits paid | ( | ) | ( | ) | ( | ) | ( | ) | |||||||
Benefit obligations, end of year | |||||||||||||||
Fair value of plan assets: | |||||||||||||||
Fair value of plan assets, beginning of year | |||||||||||||||
Fair value of plan assets acquired in Merger | |||||||||||||||
Actual gain (loss) on plan assets | ( | ) | |||||||||||||
Benefits paid | ( | ) | ( | ) | ( | ) | ( | ) | |||||||
Employer contributions | |||||||||||||||
Fair value of plan assets, end of year | |||||||||||||||
Funded status of plan, end of period | $ | $ | $ | ( | ) | $ | ( | ) | |||||||
Accumulated benefit obligation | $ | $ | |||||||||||||
Amounts recognized in the Consolidated Statements of Financial Condition: | |||||||||||||||
Prepaid (accrued) benefit cost, end of period | $ | $ | $ | ( | ) | $ | ( | ) | |||||||
Prior service cost included in accumulated other comprehensive income (loss) | $ | $ | $ | ( | ) | $ | ( | ) | |||||||
Weighted-average rate assumptions of the Corporation's Plans follow:
Legacy TCF Pension Plan | Chemical Pension Plan | Legacy TCF Postretirement Plan | Chemical Postretirement Plan | ||||||||||||||||||||||||||||||||
(In thousands) | 2019 | 2018 | 2017 | 2019 | 2018 | 2017 | 2019 | 2018 | 2017 | 2019 | 2018 | 2017 | |||||||||||||||||||||||
Discount rate used in determining benefit obligation -December 31 | % | % | % | % | % | % | % | % | % | % | % | % | |||||||||||||||||||||||
Discount rate used in determining expense | |||||||||||||||||||||||||||||||||||
Expected long-term return on Pension Plan Assets | |||||||||||||||||||||||||||||||||||
Health care cost trend rate assumed for next year | |||||||||||||||||||||||||||||||||||
Final health care cost trend rate | |||||||||||||||||||||||||||||||||||
Year that final health care trend rate is reached | — | — | — | — | — | — | 2038 | 2038 | 2038 | — | — | — | |||||||||||||||||||||||
130
The net periodic benefit plan (income) cost included in other noninterest expense for the Corporation's Plans was as follows for the years ended December 31:
Pension Plans | Postretirement Plans | ||||||||||||||||||||||
(In thousands) | 2019 | 2018 | 2017 | 2019 | 2018 | 2017 | |||||||||||||||||
Interest cost | $ | $ | $ | $ | $ | $ | |||||||||||||||||
Service cost | |||||||||||||||||||||||
Return on plan assets | ( | ) | ( | ) | |||||||||||||||||||
Recognized actuarial (gain) loss | ( | ) | ( | ) | ( | ) | ( | ) | |||||||||||||||
Amortization of prior service cost | ( | ) | ( | ) | ( | ) | |||||||||||||||||
Net periodic benefit plan (income) cost | $ | $ | $ | $ | $ | ( | ) | $ | ( | ) | |||||||||||||
The Corporation is eligible to contribute up to $10.0 million to the Pension Plans until the 2019 federal income tax return extended due date under various IRS funding methods. The Corporation made no cash contributions to the Legacy TCF Pension Plan or Chemical Pension Plan in 2019, 2018 and 2017, respectively. The Corporation does not expect to be required to contribute to the Pension Plans in 2020.
The Corporation contributed $377 thousand, $392 thousand and $332 thousand to the TCF Postretirement Plan in 2019, 2018 and 2017, respectively and no contributions were made to the Chemical Postretirement Plan in 2019. The Corporation expects to contribute $384 thousand to the Postretirement Plans in 2020. The Corporation currently has no plans to pre-fund the Postretirement Plans in 2020.
The following schedule presents estimated future benefit payments for the next 10 years under the Corporation's Plans for retirees already receiving benefits and future retirees, assuming they retire and begin receiving unreduced benefits as soon as they are eligible:
(In thousands) | Pension Plans | Postretirement Plans | ||||
2020 | $ | $ | ||||
2021 | ||||||
2022 | ||||||
2023 | ||||||
2024 | ||||||
2025 - 2029 | ||||||
Total | $ | $ | ||||
Pension Plan Assets
TCF's Pension Plan investment policy permits investments in cash, money market mutual funds, direct fixed income securities to include U.S. Treasury securities and U.S. Government-sponsored enterprises, and indirect fixed income investment securities made in fund form (mutual fund or institutional fund) where the fund invests in fixed income securities in investment grade corporate credits, non-investment grade floating-rate bank loans and non-investment grade bonds.
The assets of the Chemical Pension Plan were historically invested by the Wealth Management department of Chemical Bank. The Chemical Pension Plan's primary investment objective is long-term growth coupled with income. In consideration of the Pension Plan's fiduciary responsibilities, emphasis is placed on quality investments with sufficient liquidity to meet benefit payments and plan expenses, as well as providing the flexibility to manage the investments to accommodate current economic and financial market conditions. To meet the Chemical Pension Plan's long-term objective within the constraints of prudent management, target ranges have been set for the three primary asset classes: an equity securities range from 40.0 % to 70.0 %, a debt securities range from 20.0 % to 60.0 %, and a cash and cash equivalents and other range from 0.0 % to 10.0 %. Modest asset positions outside of these targeted ranges may occur due to the repositioning of assets within industries or other activity in the financial markets. Equity securities are primarily comprised of both individual securities and equity-based mutual funds, invested in either domestic or international markets. The stocks are diversified among the major economic sectors of the market and are selected based on balance sheet strength, expected earnings growth, the management team and position within their industries, among other characteristics. Debt securities are comprised of U.S. dollar denominated bonds issued by the U.S. Treasury, U.S. government agencies and investment grade bonds issued by corporations. The notes and bonds purchased are primarily rated "A" or better by the major bond rating companies from diverse industries.
131
The Pension Plans' assets are measured at fair value on a recurring basis and grouped in three levels, based on the markets in which the assets are traded and the degree and reliability of estimates and assumptions used to determine fair value. Mutual funds, U.S. Treasury Bills, equity securities and interest-bearing cash are categorized as Level 1. The fair value of Level 1 assets is based on quotes from independent asset pricing services based on active markets. Mortgage-backed securities and U.S. Treasury and government sponsored agency bonds and notes are categorized as Level 2. The fair value of level 2 assets is based on prices obtained from independent pricing sources that are based on observable transactions of similar instruments, but not quoted markets. At December 31, 2019 and 2018, there were no assets categorized as Level 3. The fair value of the collective investment fund is based on the net asset value ("NAV") of units as a practical expedient, and therefore the asset is not classified in the fair value hierarchy.
The following schedule sets forth the fair value of the Pension Plans' assets and the level of valuation inputs used to value those assets at December 31, 2019 and 2018.
At December 31, 2019 | |||||||||||||||
(In thousands) | Level 1 | Level 2 | Level 3 | Total | |||||||||||
Cash | $ | $ | $ | $ | |||||||||||
Debt Securities: | |||||||||||||||
U.S. Treasury and government sponsored agency bonds and notes | |||||||||||||||
Mutual funds(1) | |||||||||||||||
Corporate bonds | |||||||||||||||
Mortgage-backed securities | |||||||||||||||
Other | |||||||||||||||
Total investments at fair value | $ | $ | $ | $ | |||||||||||
At December 31, 2018 | |||||||||||||||
(In thousands) | Level 1 | Level 2 | Level 3 | Total | |||||||||||
Cash | $ | $ | $ | $ | |||||||||||
Debt Securities: | |||||||||||||||
Mutual funds(1) | |||||||||||||||
U.S. Treasury Bills | |||||||||||||||
Mortgage-backed securities | |||||||||||||||
Collective investment fund (measured at NAV of units as a practical expedient) | — | — | — | ||||||||||||
Total investments at fair value | $ | $ | $ | $ | |||||||||||
(1) Comprised primarily of money market mutual funds, fixed-income bonds issued by the U.S. Treasury and government sponsored agencies and
bonds of U.S. and foreign issuers from diverse industries.
At December 31, 2019 and 2018, the Pension Plans did not hold any shares of the Corporation's common stock.
Accumulated Other Comprehensive Loss
The following sets forth the changes in accumulated other comprehensive income (loss), before tax, related to the Corporation's Pension Plans and Postretirement Plans during 2019:
At or For the Year Ended December 31, | |||||||||||
Postretirement Plans | |||||||||||
(In thousands) | 2019 | 2018 | 2017 | ||||||||
Accumulated other comprehensive income (loss) before tax, beginning of period | $ | ( | ) | $ | ( | ) | $ | ( | ) | ||
Net actuarial income (loss) | |||||||||||
Amortization of prior service credit (recognized in net periodic benefit cost) | |||||||||||
Accumulated other comprehensive income (loss) before tax, end of period | $ | ( | ) | $ | ( | ) | $ | ( | ) | ||
132
Note 22. Commitments, Contingent Liabilities and Guarantees
Financial Instruments with Off-Balance Sheet Risk In the normal course of business, the Corporation enters into financial instruments with off-balance sheet risk, primarily to meet the financing needs of its customers. These financial instruments, which are issued or held for purposes other than trading, involve elements of credit and interest-rate risk in excess of the amounts recognized in the Consolidated Statements of Financial Condition.
The Corporation's exposure to credit loss, in the event of nonperformance by the counterparty to the financial instrument is represented by the contractual amount of the commitments. The Corporation uses the same credit policies in making these commitments as it does for making direct loans. The Corporation evaluates each customer's creditworthiness on a case-by-case basis. The amount of collateral obtained is based on a credit evaluation of the customer.
Financial instruments with off-balance sheet risk were as follows:
(In thousands) | At December 31, 2019 | At December 31, 2018 | |||||
Commitments to extend credit: | |||||||
Commercial | $ | $ | |||||
Consumer | |||||||
Total commitments to extend credit | |||||||
Standby letters of credit and guarantees on industrial revenue bonds | |||||||
Total | $ | $ | |||||
Commitments to Extend Credit Commitments to extend credit are agreements to lend provided there is no violation of any condition in the contract. These commitments generally have fixed expiration dates or other termination clauses and may require payment of a fee. Since a certain amount of the commitments are expected to expire without being drawn upon, the total commitment amounts do not necessarily represent future cash requirements. Collateral to secure any funding of these commitments predominantly consists of residential and commercial real estate mortgages.
Standby Letters of Credit and Guarantees on Industrial Revenue Bonds Standby letters of credit and guarantees on industrial revenue bonds are conditional commitments issued by the Corporation guaranteeing the performance of a customer to a third-party. These conditional commitments expire in various years through 2039. The majority of these standby letters of credit are collateralized. Collateral held consists primarily of commercial real estate mortgages. Since the conditions under which the Corporation is required to fund these commitments may not materialize, the cash requirements are expected to be less than the total outstanding commitments.
Contingencies and Guarantees The Corporation has originated and sold certain loans, and additionally acquired the potential liability for those historical originated and sold loans by merged or acquired entities, for which the buyer has limited recourse to the Corporation in the event the loans do not perform as specified in the agreements. The outstanding balance and the maximum potential amount of undiscounted future payments that the Corporation could be required to make in the event of nonperformance by the borrower totaled $6.0 million at December 31, 2019. In the event of nonperformance, the Corporation has rights to the underlying collateral securing the loans. At December 31, 2019, the Corporation had recorded a liability of $100 thousand, in connection with the recourse agreements, in other liabilities.
In addition, the Corporation acquired certain Small Business Administration ("SBA") guaranteed loans in which the guaranteed portion had been sold to a third party investor. In the event these loans default and the SBA guaranty is no longer intact (i.e. an issue found to have occurred during the origination or the liquidation of the loans) the Corporation would be liable to make the loan whole to the third-party investor. The maximum potential amount of undiscounted future payments that the Corporation could be required to make in the event of default by the borrower was $16.7 million at December 31, 2019. In the event of default, the Corporation has rights to the underlying collateral securing the loans. At December 31, 2019, the Corporation had recorded a liability of $891 thousand, in other liabilities.
133
Representations, Warranties and Contractual Liabilities In connection with the Corporation's residential mortgage loan sales, and the historical sales of merged or acquired entities, the Corporation makes certain representations and warranties that the loans meet certain criteria, such as collateral type, underwriting standards and the manner in which the loans will be serviced. The Corporation may be required to repurchase individual loans and/or indemnify the purchaser against losses if the loan fails to meet established criteria. In addition, some agreements contain a requirement to repurchase loans as a result of early payoffs by the borrower, early payment default of the borrower or the failure to obtain valid title. At December 31, 2019 and December 31, 2018 the liability recorded in connection with these representations and warranties was $5.7 million and $1.3 million, respectively, included in other liabilities.
Litigation Contingencies From time to time, the Corporation is a party to legal proceedings arising out of its lending, leasing and deposit operations, including foreclosure proceedings and other collection actions as part of its lending and leasing collections activities. The Corporation may also be subject to regulatory examinations and enforcement actions brought by federal regulators, including the Securities and Exchange Commission, the Federal Reserve, the OCC and the Consumer Financial Protection Bureau ("CFPB") which may impose sanctions on the Corporation for failures related to regulatory compliance. From time to time borrowers and other customers, and employees and former employees have also brought actions against the Corporation, in some cases claiming substantial damages. The Corporation and other financial services companies are subject to the risk of class action litigation. Litigation is often unpredictable and the actual results of litigation cannot be determined and therefore the ultimate resolution of a matter and the possible range of loss associated with certain potential outcomes cannot be established. Based on the current understanding of the Corporation's pending legal proceedings, management does not believe that judgments or settlements arising from pending or threatened legal matters, individually or in the aggregate, would have a material adverse effect on the consolidated financial position, operating results or cash flows of the Corporation.
Note 23. Derivative Instruments
Derivative instruments, recognized at fair value within other assets or accrued expenses and other liabilities on the Consolidated Statements of Financial Condition, were as follows:
At December 31, 2019 | |||||||||||
Fair Value | |||||||||||
(In thousands) | Notional Amount(1) | Derivative Assets | Derivative Liabilities | ||||||||
Derivatives designated as hedging instruments: | |||||||||||
Interest rate contract | $ | $ | $ | ||||||||
Forward foreign exchange contracts | |||||||||||
Total derivatives designated as hedging instruments | |||||||||||
Derivatives not designated as hedging instruments: | |||||||||||
Interest rate contracts | |||||||||||
Risk participation agreements | |||||||||||
Forward foreign exchange contracts | |||||||||||
Interest rate lock commitments | |||||||||||
Forward loan sales commitments | |||||||||||
Power Equity CDs | |||||||||||
Swap agreement | |||||||||||
Total derivatives not designated as hedging instruments | |||||||||||
Total derivatives before netting | |||||||||||
Netting(2) | ( | ) | ( | ) | |||||||
Total derivatives, net | $ | $ | |||||||||
(1) | Notional or contract amounts, which represent the extent of involvement in the derivatives market, are used to determine the contractual cash flows required in accordance with the terms of the agreement. These amounts are typically not exchanged, significantly exceed amounts subject to credit or market risk and are not reflected in the Consolidated Statements of Financial Condition. |
(2) | Includes netting of derivative asset and liability balances and related cash collateral, where counterparty netting agreements are in place. |
134
At December 31, 2018 | |||||||||||
Fair Value | |||||||||||
(In thousands) | Notional Amount(1) | Derivative Assets | Derivative Liabilities | ||||||||
Derivatives designated as hedging instruments: | |||||||||||
Interest rate contract | $ | $ | $ | ||||||||
Forward foreign exchange contracts | |||||||||||
Total derivatives designated as hedging instruments | |||||||||||
Derivatives not designated as hedging instruments: | |||||||||||
Interest rate contracts | |||||||||||
Risk participation agreements | |||||||||||
Forward foreign exchange contracts | |||||||||||
Interest rate lock commitments | |||||||||||
Swap agreement | |||||||||||
Total derivatives not designated as hedging instruments | |||||||||||
Total derivatives before netting | |||||||||||
Netting(2) | ( | ) | ( | ) | |||||||
Total derivatives, net | $ | $ | |||||||||
(1) | Notional or contract amounts, which represent the extent of involvement in the derivatives market, are used to determine the contractual cash flows required in accordance with the terms of the agreement. These amounts are typically not exchanged, significantly exceed amounts subject to credit or market risk and are not reflected in the Consolidated Statements of Financial Condition. |
(2) | Includes netting of derivative asset and liability balances and related cash collateral, where counterparty netting agreements are in place. |
135
Derivative instruments may be subject to master netting arrangements and collateral arrangements and qualify for offset in the Consolidated Statements of Financial Condition. A master netting arrangement with a counterparty creates a right of offset for amounts due to and from that same counterparty that is enforceable in the event of a default or bankruptcy. Derivative instruments subject to master netting arrangements and collateral arrangements are recognized on a net basis in the Consolidated Statements of Financial Condition. The gross amounts recognized, gross amounts offset and net amount presented of derivative instruments were as follows:
At December 31, 2019 | |||||||||||
(In thousands) | Gross Amounts Recognized | Gross Amounts Offset(1) | Net Amount Presented | ||||||||
Derivative assets | |||||||||||
Interest rate contracts | $ | $ | ( | ) | $ | ||||||
Risk participation agreements | |||||||||||
Forward foreign exchange contracts | |||||||||||
Interest rate lock commitments | ( | ) | |||||||||
Forward loan sales commitments | ( | ) | |||||||||
Power Equity CDs | |||||||||||
Total derivative assets | $ | $ | ( | ) | $ | ||||||
Derivative liabilities | |||||||||||
Interest rate contracts | $ | $ | ( | ) | $ | ||||||
Risk participation agreements | |||||||||||
Forward foreign exchange contracts | ( | ) | |||||||||
Interest rate lock commitments | ( | ) | |||||||||
Forward loan sales commitments | ( | ) | |||||||||
Power Equity CDs | |||||||||||
Swap agreement | ( | ) | |||||||||
Total derivative liabilities | $ | $ | ( | ) | $ | ||||||
At December 31, 2018 | |||||||||||
(In thousands) | Gross Amounts Recognized | Gross Amounts Offset(1) | Net Amount Presented | ||||||||
Derivative assets | |||||||||||
Interest rate contracts | $ | $ | ( | ) | $ | ||||||
Risk participation agreements | |||||||||||
Forward foreign exchange contracts | ( | ) | |||||||||
Interest rate lock commitments | |||||||||||
Total derivative assets | $ | $ | ( | ) | $ | ||||||
Derivative liabilities | |||||||||||
Interest rate contracts | $ | $ | ( | ) | $ | ||||||
Risk participation agreements | |||||||||||
Forward foreign exchange contracts | ( | ) | |||||||||
Interest rate lock commitments | |||||||||||
Swap agreement | ( | ) | |||||||||
Total derivative liabilities | $ | $ | ( | ) | $ | ||||||
(1) | Includes the amounts with counterparties subject to enforceable master netting arrangements that have been offset in the Consolidated Statements of Financial Condition. |
136
Derivatives Designated as Hedging Instruments
Interest rate contract The carrying amount of the hedged subordinated debt, including the cumulative basis adjustment related to the application of fair value hedge accounting, is recorded in long-term borrowings on the Consolidated Statements of Financial Condition and was as follows:
Carrying Amount of the Hedged Liability | Cumulative Amount of Fair Value Hedging Adjustments Included in the Carrying Amount of the Hedged Liability | ||||||||||||||
At December 31, | At December 31, | ||||||||||||||
(In thousands) | 2019 | 2018 | 2019 | 2018 | |||||||||||
Subordinated bank note - 2025 | $ | $ | $ | $ | ( | ) | |||||||||
The following table summarizes the effect of fair value hedge accounting on the Consolidated Statements of Income for the years ended December 31, 2019 and 2018.
Year Ended December 31, | |||||||||||
(In thousands) | 2019 | 2018 | 2017 | ||||||||
Statement of income line where the gain (loss) on the fair value hedge was recorded: | |||||||||||
Interest expense on borrowings | $ | $ | $ | ||||||||
Other noninterest income | |||||||||||
Gain (loss) on interest rate contract (fair value hedge) | |||||||||||
Hedged item | $ | ( | ) | $ | $ | ||||||
Derivative designated as a hedging instrument | ( | ) | ( | ) | |||||||
Net income (expense) recognized on fair value hedge in interest expense on borrowings | ( | ) | |||||||||
Forward Foreign Exchange Contracts The effect of net investment hedges on accumulated other comprehensive income was as follows:
Year Ended December 31, | |||||||||||
(In thousands) | 2019 | 2018 | 2017 | ||||||||
Forward foreign exchange contracts | $ | ( | ) | $ | $ | ( | ) | ||||
Derivatives Not Designated as Hedging Instruments Certain other interest rate contracts, forward foreign exchange contracts, interest rate lock commitments and other contracts have not been designated as hedging instruments. The effect of these derivatives on the Consolidated Statements of Income was as follows:
Year Ended December 31, | ||||||||||||
(In thousands) | Location of Gain (Loss) | 2019 | 2018 | 2017 | ||||||||
Interest rate contracts(1) | Other noninterest income | $ | ( | ) | $ | ( | ) | $ | ( | ) | ||
Risk participation agreements | Other noninterest income | ( | ) | |||||||||
Forward foreign exchange contracts | Other noninterest expense | ( | ) | ( | ) | |||||||
Interest rate lock commitments | Net gains on sales of loans | ( | ) | ( | ) | |||||||
Forward loan sales commitments | Net gains on sales of loans | ( | ) | |||||||||
Swap agreement | Other noninterest expense | ( | ) | ( | ) | ( | ) | |||||
Net gain (loss) recognized | $ | ( | ) | $ | $ | ( | ) | |||||
(1) | Included in the year ended December 31, 2019 is a loss of $ |
The Corporation executes all of its forward foreign exchange contracts in the over-the-counter market with large financial institutions pursuant to International Swaps and Derivatives Association, Inc. agreements. These agreements include credit risk-related features that enhance the creditworthiness of these instruments, as compared with other obligations of the respective counterparty with whom the Corporation has transacted, by requiring that additional collateral be posted under certain circumstances. The amount of collateral required depends on the contract and is determined daily based on market and currency exchange rate conditions.
137
At December 31, 2019 and 2018, credit risk-related contingent features existed on forward foreign exchange contracts with a notional value of $23.1 million and $25.7 million, respectively. In the event the Corporation is rated less than BB- by Standard and Poor's, the contracts could be terminated or the Corporation may be required to provide approximately $462 thousand in additional collateral at both December 31, 2019 and 2018. There were no forward foreign exchange contracts containing credit risk-related features in a liability position at both December 31, 2019 and December 31, 2018.
At December 31, 2019, the Corporation had posted $54.6 million, $4.8 million and $1.3 million of cash collateral related to its interest rate contracts, forward foreign exchange contracts and swap agreement, respectively.
Note 24. Fair Value Measurements
The Corporation uses fair value measurements to record fair value adjustments to certain assets and liabilities and to determine fair value disclosures. Fair values are based on the price that would be received upon the sale of an asset or paid to transfer a liability in an orderly transaction between market participants at the measurement date. Investment securities available-for-sale, certain loans held-for-sale, interest-only strips, derivative instruments, forward loan sales commitments and assets and liabilities held in trust for deferred compensation plans are recorded at fair value on a recurring basis. From time to time we may be required to record at fair value other assets on a non-recurring basis, such as certain investment securities held-to-maturity, loans and leases, goodwill, loan servicing rights, other intangible assets, other real estate owned, repossessed and returned assets or the securitization receivable. These non-recurring fair value adjustments typically involve application of lower of cost or fair value accounting or write-downs of individual assets.
The Corporation groups its assets and liabilities measured at fair value in three levels, based on the markets in which the assets and liabilities are traded and the degree and reliability of estimates and assumptions used to determine fair value. The levels are as follows:
Level 1 | Valuations that are based on prices obtained from independent pricing sources for the same instruments traded in active markets. |
Level 2 | Valuations that are based on prices obtained from independent pricing sources that are based on observable transactions of similar instruments, but not quoted markets. |
Level 3 | Valuations generated from Corporation model-based techniques that use at least one significant unobservable input. Such unobservable inputs reflect estimates of assumptions that market participants would use in pricing the asset or liability. |
Assets and Liabilities Recorded at Fair Value on a Recurring Basis
Investment Securities Available-for-Sale: The fair value of investment securities available-for-sale, categorized as Level 2, is recorded using prices obtained from independent asset pricing services that are based on observable transactions, but not quoted markets. Management reviews the prices obtained from independent asset pricing services for unusual fluctuations and comparisons to current market trading activity.
Loans Held-for-Sale: The Corporation has elected the fair value option for certain residential mortgage loans held-for-sale. Accordingly, the fair values of these loans held-for-sale are based on valuation models that use the market price for similar loans sold in the secondary market. As these prices are derived from market observable inputs, the Corporation categorized as Level 2.
Interest-only Strips: The fair value of interest-only strips, categorized as Level 3, represents the present value of future cash flows expected to be received by the Corporation on certain assets. The Corporation uses available market data, along with its own empirical data and discounted cash flow models, to arrive at the fair value of its interest-only strips. The present value of the estimated expected future cash flows to be received is determined by using discount, loss and prepayment rates that the Corporation believes are commensurate with the risks associated with the cash flows and what a market participant would use. These assumptions are inherently subject to volatility and uncertainty and, as a result, the fair value of the interest-only strips may fluctuate significantly from period to period.
138
Derivative Instruments:
Interest Rate Contracts: The Corporation executes interest rate contracts as described in Note 3. Summary of Significant Accounting Policies. The fair value of these interest rate contracts, categorized as Level 2, is determined using a cash flow model which may consider the forward curve, the discount curve, option volatilities and credit valuation adjustments related to counterparty and/or borrower nonperformance risk.
Risk Participation Agreements: The fair value of risk participation agreements, categorized as Level 2, is determined using a cash flow model which may consider the forward curve, the discount curve, option volatilities and credit valuation adjustments related to counterparty and/or borrower nonperformance risk.
Forward Foreign Exchange Contracts: The Corporation's forward foreign exchange contracts are recorded at fair value using a cash flow model that includes key inputs such as foreign exchange rates and an assessment of the risk of counterparty nonperformance. The risk of counterparty nonperformance is based on external assessments of credit risk. The fair value of these contracts, categorized as Level 2, is based on observable transactions, but not quoted markets.
Interest Rate Lock Commitments: The Corporation's interest rate lock commitments are derivative instruments that are recorded at fair value based on valuation models that use the market price for similar loans sold in the secondary market. The interest rate lock commitments are adjusted for expectations of exercise and funding. As the prices are derived from market observable inputs, the Corporation categorized as Level 2.
Power Equity CDs: Power Equity CDs are categorized as Level 2, and determined using quoted prices of underlying stocks, along with other terms and features of the derivate instruments.
Swap Agreement: The Corporation's swap agreement, categorized as Level 3, is related to the sale of the Corporation's Visa Class B stock. The fair value of the swap agreement is based on the estimated exposure related to the Visa covered litigation through a probability analysis of the funding and estimated settlement amounts.
Forward Loan Sales Commitments: The Corporation enters into forward loan sales commitments to sell certain mortgage loans which are recorded at fair value based on valuation models. The Corporation’s expectation of the amount of its interest rate lock commitments that will ultimately close is a factor in determining the position. The valuation models utilize the fair value of related mortgage loans determined using observable market data and therefore categorized as Level 2.
Assets and Liabilities Held in Trust for Deferred Compensation Plans: Assets held in trust for deferred compensation plans include investments in publicly traded securities, excluding TCF Financial common stock reported in treasury stock and other equity, and U.S. Treasury notes. The fair value of these assets, categorized as Level 1, is based on prices obtained from independent asset pricing services based on active markets. The fair value of the liabilities equals the fair value of the assets.
139
The balances of assets and liabilities measured at fair value on a recurring basis were as follows:
December 31, 2019 | ||||||||||||
(In thousands) | Level 1 | Level 2 | Level 3 | Total | ||||||||
Assets | ||||||||||||
Investment securities available-for-sale | $ | $ | $ | $ | ||||||||
Loans held-for-sale | ||||||||||||
Interest-only strips | ||||||||||||
Derivative assets:(1) | ||||||||||||
Interest rate contracts | ||||||||||||
Risk participation agreements | ||||||||||||
Interest rate lock commitments | ||||||||||||
Forward loan sales commitments | ||||||||||||
Power Equity CDs | ||||||||||||
Total derivative assets | ||||||||||||
Forward loan sales commitments | ||||||||||||
Assets held in trust for deferred compensation plans | ||||||||||||
Total assets at fair value | $ | $ | $ | $ | ||||||||
Liabilities | ||||||||||||
Derivative liabilities:(1) | ||||||||||||
Interest rate contracts | $ | $ | $ | $ | ||||||||
Risk participation agreements | ||||||||||||
Forward foreign exchange contracts | ||||||||||||
Interest rate lock commitments | ||||||||||||
Forward loan sales commitments | ||||||||||||
Power Equity CDs | ||||||||||||
Swap agreement | ||||||||||||
Total derivative liabilities | ||||||||||||
Liabilities held in trust for deferred compensation plans | ||||||||||||
Total liabilities at fair value | $ | $ | $ | $ | ||||||||
(1) | As permitted under GAAP, the Corporation has elected to net derivative assets and derivative liabilities when a legally enforceable master netting agreement exists as well as the related cash collateral received and paid. For purposes of this table, the derivative assets and derivative liabilities are presented gross of this netting adjustment. |
140
December 31, 2018 | |||||||||||||||
(In thousands) | Level 1 | Level 2 | Level 3 | Total | |||||||||||
Assets | |||||||||||||||
Investment securities available-for-sale | $ | $ | $ | $ | |||||||||||
Loans held-for-sale | |||||||||||||||
Interest-only strips | |||||||||||||||
Derivative assets:(1) | |||||||||||||||
Interest rate contracts | |||||||||||||||
Risk participation agreements | |||||||||||||||
Forward foreign exchange contracts | |||||||||||||||
Interest rate lock commitments | |||||||||||||||
Total derivative assets | |||||||||||||||
Forward loan sales commitments | |||||||||||||||
Assets held in trust for deferred compensation plans | |||||||||||||||
Total assets at fair value | $ | $ | $ | $ | |||||||||||
Liabilities | |||||||||||||||
Derivative liabilities:(1) | |||||||||||||||
Interest rate contracts | $ | $ | $ | $ | |||||||||||
Risk participation agreements | |||||||||||||||
Forward foreign exchange contracts | |||||||||||||||
Interest rate lock commitments | |||||||||||||||
Swap agreement | |||||||||||||||
Total derivative liabilities | |||||||||||||||
Forward loan sales commitments | |||||||||||||||
Liabilities held in trust for deferred compensation plans | |||||||||||||||
Total liabilities at fair value | $ | $ | $ | $ | |||||||||||
(1) | As permitted under GAAP, the Corporation has elected to net derivative assets and derivative liabilities when a legally enforceable master netting agreement exists as well as the related cash collateral received and paid. For purposes of this table, the derivative assets and derivative liabilities are presented gross of this netting adjustment. |
Management assesses the appropriate classification of financial assets and liabilities within the fair value hierarchy by monitoring the level of available observable market information. Changes in markets or economic conditions, as well as changes to the valuation models, may require the transfer of financial instruments from one fair value level to another. Such transfers, if any, are recorded at the fair values as of the beginning of the quarter in which the transfers occurred.
141
The changes in Level 3 assets and liabilities measured at fair value on a recurring basis were as follows:
(In thousands) | Investment securities available-for-sale | Loans held-for-sale | Interest-only strips | Interest rate lock commitments | Swap agreement | Forward loan sales commitments | |||||||||||||||||
Asset (liability) balance, December 31, 2016 | $ | $ | $ | $ | $ | ( | ) | $ | |||||||||||||||
Total net gains (losses) included in: | |||||||||||||||||||||||
Net income | ( | ) | ( | ) | ( | ) | |||||||||||||||||
Other comprehensive income (loss) | ( | ) | |||||||||||||||||||||
Sales | ( | ) | |||||||||||||||||||||
Originations | |||||||||||||||||||||||
Principal paydowns / settlements | ( | ) | ( | ) | ( | ) | |||||||||||||||||
Asset (liability) balance, December 31, 2017 | $ | $ | $ | $ | $ | ( | ) | $ | |||||||||||||||
Total net gains (losses) included in: | |||||||||||||||||||||||
Net income | ( | ) | ( | ) | |||||||||||||||||||
Other comprehensive income (loss) | |||||||||||||||||||||||
Sales | ( | ) | |||||||||||||||||||||
Originations | |||||||||||||||||||||||
Principal paydowns / settlements | ( | ) | ( | ) | ( | ) | |||||||||||||||||
Asset (liability) balance, December 31, 2018 | $ | $ | $ | $ | $ | ( | ) | $ | ( | ) | |||||||||||||
Total net gains (losses) included in: | |||||||||||||||||||||||
Net income | ( | ) | ( | ) | |||||||||||||||||||
Other comprehensive income (loss) | ( | ) | ( | ) | |||||||||||||||||||
Acquired | |||||||||||||||||||||||
Sales | ( | ) | |||||||||||||||||||||
Originations | |||||||||||||||||||||||
Principal paydowns / settlements | ( | ) | ( | ) | ( | ) | |||||||||||||||||
Transfers out of Level 3 (1) | ( | ) | ( | ) | |||||||||||||||||||
Asset (liability) balance, December 31, 2019 | $ | $ | $ | $ | $ | ( | ) | $ | |||||||||||||||
(1) | Certain assets (liabilities) previously classified as Level 3 were transferred to Level 2 because current period prices are derived from Level 2 observable market data. |
Assets and Liabilities Recorded at Fair Value on a Non-recurring Basis
The following is a discussion of the valuation methodologies used to record assets and liabilities at fair value on a non-recurring basis.
Loans and Leases: Loans and leases for which repayment is expected to be provided solely by the value of the underlying collateral, categorized as Level 3 and recorded at fair value on a non-recurring basis, are valued based on the fair value of that collateral less estimated selling costs. The fair value of the collateral is determined based on internal estimates and/or assessments provided by third-party appraisers and the valuation relies on discount rates ranging from 10.0 % to 30.0 %. Effective January 1, 2019, in conjunction with the adoption of ASU No. 2016-02, Leases (Topic 842) and the related ASUs, such loans and leases include impaired loans and leases as well as certain delinquent nonaccrual consumer loans. Previously, the Corporation did not include impaired leases.
Loan servicing rights: The fair value of loan servicing rights, categorized as Level 3, is based on a third party valuation model utilizing a discounted cash flow analysis using interest rates and prepayment speed assumptions currently quoted for comparable instruments and a discount rate determined by management. The valuation relies on discount rates ranging from 2.0 % to 30.0 %. Loan servicing rights are recorded at the lower of cost or fair value.
Other Real Estate Owned: The fair value of other real estate owned, categorized as Level 3, is based on independent appraisals, real estate brokers' price opinions or automated valuation methods, less estimated selling costs. Certain properties require assumptions that are not observable in an active market in the determination of fair value and include discount rates ranging from 8.0 % to 30.0 %. Assets acquired through foreclosure are initially recorded at the lower of the loan or lease carrying amount or fair value less estimated selling costs at the time of transfer to other real estate owned.
142
Repossessed and Returned Assets: The fair value of repossessed and returned assets, categorized as Level 2 or Level 3 depending on the underlying asset type, is based on available pricing guides, auction results or price opinions, less estimated selling costs. Unobservable inputs used to value repossessed and returned assets categorized as Level 3 include discount rates ranging from 20.0 % to 30.0 %. Assets acquired through repossession or returned to the Corporation are initially recorded at the lower of carrying amount or fair value less estimated selling costs at the time of transfer to repossessed and returned assets.
The balances of assets measured at fair value on a non-recurring basis were as follows. There were no liabilities measured at fair value on a non-recurring basis at December 31, 2019 and December 31, 2018.
(In thousands) | Level 1 | Level 2 | Level 3 | Total | |||||||||||
At December 31, 2019 | |||||||||||||||
Loans and leases | $ | $ | $ | $ | |||||||||||
Loan servicing rights | |||||||||||||||
Other real estate owned | |||||||||||||||
Repossessed and returned assets | |||||||||||||||
Total non-recurring fair value measurements | $ | $ | $ | $ | |||||||||||
At December 31, 2018 | |||||||||||||||
Loans | $ | $ | $ | $ | |||||||||||
Other real estate owned | |||||||||||||||
Repossessed and returned assets | |||||||||||||||
Total non-recurring fair value measurements | $ | $ | $ | $ | |||||||||||
Fair Value Option
The Corporation has elected the fair value option for certain residential mortgage loans held-for-sale. This election facilitates the offsetting of changes in fair value of the loans held-for-sale and the derivative financial instruments used to economically hedge them. The difference between the aggregate fair value and aggregate unpaid principal balance of these loans held-for-sale was as follows:
(In thousands) | December 31, 2019 | December 31, 2018 | |||||
Fair value carrying amount | $ | $ | |||||
Aggregate unpaid principal amount | |||||||
Fair value carrying amount less aggregate unpaid principal | $ | $ | |||||
Differences between the fair value carrying amount and the aggregate unpaid principal balance include changes in fair value recorded at and subsequent to funding and gains and losses on the related loan commitment prior to funding. No loans recorded under the fair value option were delinquent or on nonaccrual status at December 31, 2019 and December 31, 2018. The net gain from initial measurement of the loans held-for-sale, any subsequent changes in fair value while the loans are outstanding and any actual adjustment to the gains realized upon sales of the loans totaled $27.9 million, $10.0 million and $4.9 million for the years ended December 31, 2019, 2018 and 2017, respectively, and are included in net gains on sales of loans and leases. These amounts exclude the impacts from the interest rate lock commitments and forward loan sales commitments which are also included in net gains on sales of loans and leases.
Disclosures about Fair Value of Financial Instruments
Management discloses the estimated fair value of financial instruments, including assets and liabilities on and off the Consolidated Statements of Financial Condition, for which it is practicable to estimate fair value. These fair value estimates were made at December 31, 2019 and December 31, 2018 based on relevant market information and information about the financial instruments. Fair value estimates are intended to represent the price at which an asset could be sold or a liability could be settled. However, given there is no active market or observable market transactions for many of the financial instruments, the estimates of fair value are subjective in nature, involve uncertainties and include matters of significant judgment. Changes in assumptions could significantly affect the estimated values.
143
The carrying amounts and estimated fair values of the financial instruments, excluding short-term financial assets and liabilities as their carrying amounts approximate fair value and excluding financial instruments recorded at fair value on a recurring basis, were as follows. This information represents only a portion of the Consolidated Statements of Financial Condition and not the estimated value of the Corporation as a whole. Nonfinancial instruments such as the intangible value of the Corporation's branches and core deposits, leasing operations, goodwill, premises and equipment and the future revenues from the Corporation's customers are not reflected in this disclosure. Therefore, this information is of limited use in assessing the value of the Corporation.
At December 31, 2019 | |||||||||||||||||||
Carrying | Estimated Fair Value | ||||||||||||||||||
(In thousands) | Amount | Level 1 | Level 2 | Level 3 | Total | ||||||||||||||
Financial instrument assets | |||||||||||||||||||
FHLB and FRB stocks | $ | $ | $ | $ | $ | ||||||||||||||
Investment securities held-to-maturity | |||||||||||||||||||
Loans and leases held-for-sale | |||||||||||||||||||
Net loans(1) | |||||||||||||||||||
Securitization receivable(2) | |||||||||||||||||||
Deferred fees on commitments to extend credit | |||||||||||||||||||
Total financial instrument assets | $ | $ | $ | $ | $ | ||||||||||||||
Financial instrument liabilities | |||||||||||||||||||
Certificates of deposits | $ | $ | $ | $ | $ | ||||||||||||||
Long-term borrowings | |||||||||||||||||||
Deferred fees on standby letters of credit | |||||||||||||||||||
Total financial instrument liabilities | $ | $ | $ | $ | $ | ||||||||||||||
At December 31, 2018 | |||||||||||||||||||
Carrying | Estimated Fair Value | ||||||||||||||||||
(In thousands) | Amount | Level 1 | Level 2 | Level 3 | Total | ||||||||||||||
Financial instrument assets | |||||||||||||||||||
FHLB and FRB stocks | $ | $ | $ | $ | $ | ||||||||||||||
Investment securities held-to-maturity | |||||||||||||||||||
Loans held-for-sale | |||||||||||||||||||
Net loans(1) | |||||||||||||||||||
Securitization receivable(2) | |||||||||||||||||||
Deferred fees on commitments to extend credit | |||||||||||||||||||
Total financial instrument assets | $ | $ | $ | $ | $ | ||||||||||||||
Financial instrument liabilities | |||||||||||||||||||
Certificates of deposits | $ | $ | $ | $ | $ | ||||||||||||||
Long-term borrowings | |||||||||||||||||||
Deferred fees on standby letters of credit | |||||||||||||||||||
Total financial instrument liabilities | $ | $ | $ | $ | $ | ||||||||||||||
(1) | Expected credit losses are included in the estimated fair values. |
(2) | The Corporation executed an auto finance loan securitization during 2016 with a related receivable representing a cash reserve account posted at the inception of the securitization. The carrying amount is included in other assets. |
144
Note 25. Earnings Per Common Share
The computations of basic and diluted earnings per common share were as follows:
Year Ended December 31, | |||||||||||
(Dollars in thousands, except per share data) | 2019 | 2018 | 2017 | ||||||||
Basic Earnings Per Common Share: | |||||||||||
Net income attributable to TCF Financial Corporation | $ | $ | $ | ||||||||
Preferred stock dividends | |||||||||||
Impact of preferred stock redemption(1) | |||||||||||
Net income available to common shareholders | |||||||||||
Less: Earnings allocated to participating securities | |||||||||||
Earnings allocated to common stock | $ | $ | $ | ||||||||
Weighted-average common shares outstanding used in basic earnings per common share calculation | |||||||||||
Basic earnings per common share | $ | $ | $ | ||||||||
Diluted Earnings Per Common Share: | |||||||||||
Earnings allocated to common stock | $ | $ | $ | ||||||||
Weighted-average common shares outstanding used in basic earnings per common share calculation | |||||||||||
Net dilutive effect of: | |||||||||||
Non-participating restricted stock | |||||||||||
Stock options | |||||||||||
Warrants | |||||||||||
Weighted-average common shares outstanding used in diluted earnings per common share calculation | |||||||||||
Diluted earnings per common share | $ | $ | $ | ||||||||
Anti-dilutive shares outstanding not included in the computation of diluted earnings per common share | |||||||||||
Non-participating restricted stock | |||||||||||
Stock options | |||||||||||
(1) |
Note 26. Other Noninterest Expense
Other noninterest expense was as follows:
Year Ended December 31, | |||||||||||
(In thousands) | 2019 | 2018 | 2017 | ||||||||
Outside processing | $ | $ | $ | ||||||||
Loan and lease expense | |||||||||||
Advertising and marketing | |||||||||||
Professional fees | |||||||||||
Card processing and issuance costs | |||||||||||
FDIC insurance | |||||||||||
CFPB and OCC settlement charge | |||||||||||
Goodwill impairment | |||||||||||
Other | |||||||||||
Total other noninterest expense | $ | $ | $ | ||||||||
145
Note 27. Reportable Segments
The Corporation's reportable segments are Consumer Banking, Commercial Banking and Enterprise Services. Consumer Banking is comprised of all of the Corporation's consumer-facing businesses and includes retail banking, consumer lending, wealth management and small business banking. Commercial Banking, previously named Wholesale Banking, is comprised of commercial and industrial and commercial real estate banking and lease financing. Enterprise Services is comprised of (i) corporate treasury, which includes the Corporation's investment and borrowing portfolios and management of capital, debt and market risks, (ii) corporate functions, such as information technology, risk and credit management, bank operations, finance, investor relations, corporate development, internal audit, legal and human capital management that provide services to the operating segments, (iii) TCF Financial and (iv) eliminations.
In connection with the Merger, effective August 1, 2019, the Corporation renamed its Wholesale Banking segment to Commercial Banking to align with the way the Corporation is now managed. In addition, activity that was related to small business banking and private banking were moved from the Commercial Banking segment to the Consumer Banking segment. The revised presentation of previously reported segment data has been applied retroactively to all periods presented in these financial statements.
The Corporation evaluates performance and allocates resources based on each reportable segment's net income or loss. The reportable segments follow GAAP as described in Note 1. Basis of Presentation, except for the accounting for intercompany interest income and interest expense, which are eliminated in consolidation and presenting net interest income on a fully tax-equivalent basis. The Corporation generally accounts for inter-segment sales and transfers at cost.
Certain information for each of the reportable segments, including reconciliations of the Corporation's consolidated totals, was as follows:
(In thousands) | Consumer Banking | Commercial Banking | Enterprise Services | Consolidated | |||||||||||
At or For the Year Ended December 31, 2019: | |||||||||||||||
Net interest income | $ | $ | $ | $ | |||||||||||
Provision for credit losses | |||||||||||||||
Noninterest income | ( | ) | |||||||||||||
Noninterest expense | |||||||||||||||
Income tax expense (benefit) | ( | ) | |||||||||||||
Income (loss) after income tax expense (benefit) | ( | ) | |||||||||||||
Income attributable to non-controlling interest | |||||||||||||||
Preferred stock dividends | |||||||||||||||
Net income (loss) available to common shareholders | $ | $ | $ | ( | ) | $ | |||||||||
Total assets | $ | $ | $ | $ | |||||||||||
(In thousands) | Consumer Banking | Commercial Banking | Enterprise Services | Consolidated | |||||||||||
At or For the Year Ended December 31, 2018: | |||||||||||||||
Net interest income | $ | $ | $ | $ | |||||||||||
Provision for credit losses | |||||||||||||||
Noninterest income | |||||||||||||||
Noninterest expense | |||||||||||||||
Income tax expense (benefit) | |||||||||||||||
Income (loss) after income tax expense (benefit) | |||||||||||||||
Income attributable to non-controlling interest | |||||||||||||||
Preferred stock dividends | |||||||||||||||
Impact of preferred stock call | |||||||||||||||
Net income (loss) available to common shareholders | $ | $ | $ | $ | |||||||||||
Total assets | $ | $ | $ | $ | |||||||||||
146
(In thousands) | Consumer Banking | Commercial Banking | Enterprise Services | Consolidated | |||||||||||
At or For the Year Ended December 31, 2017: | |||||||||||||||
Net interest income (expense) | $ | $ | $ | ( | ) | $ | |||||||||
Provision for credit losses | |||||||||||||||
Noninterest income | |||||||||||||||
Noninterest expense | |||||||||||||||
Income tax expense (benefit) | ( | ) | ( | ) | ( | ) | |||||||||
Income (loss) after income tax expense (benefit) | ( | ) | |||||||||||||
Income attributable to non-controlling interest | |||||||||||||||
Preferred stock dividends | |||||||||||||||
Impact of preferred stock call | |||||||||||||||
Net income (loss) available to common shareholders | $ | $ | $ | ( | ) | $ | |||||||||
Total assets | $ | $ | $ | $ | |||||||||||
Note 28. Parent Company Financial Information
TCF Financial's condensed statements of financial condition, income and cash flows were as follows:
Condensed Statements of Financial Condition
At December 31, | |||||||
(In thousands) | 2019 | 2018 | |||||
Assets: | |||||||
Cash and due from banks | $ | $ | |||||
Premises and equipment, net | |||||||
Deferred tax asset | |||||||
Investment in TCF Bank | |||||||
Accounts receivable from TCF Bank | |||||||
Other assets | |||||||
Total assets | $ | $ | |||||
Liabilities and Equity: | |||||||
Long term borrowings | $ | $ | |||||
Accrued expenses and other liabilities | |||||||
Total liabilities | |||||||
Equity | |||||||
Total liabilities and equity | $ | $ | |||||
147
Condensed Statements of Income
Year Ended December 31, | |||||||||||
(In thousands) | 2019 | 2018 | 2017 | ||||||||
Interest income | $ | $ | $ | ||||||||
Interest expense | |||||||||||
Net interest income | ( | ) | |||||||||
Noninterest income: | |||||||||||
Dividends from TCF Bank | |||||||||||
Management fees | |||||||||||
Other | |||||||||||
Total noninterest income | |||||||||||
Noninterest expense: | |||||||||||
Compensation and employee benefits | |||||||||||
Occupancy and equipment | |||||||||||
Merger-Related expenses | |||||||||||
Other | |||||||||||
Total noninterest expense | |||||||||||
Income before income tax benefit and equity in undistributed earnings (loss) of TCF Bank | |||||||||||
Income tax benefit | |||||||||||
Income before equity in undistributed earnings (loss) of TCF Bank | |||||||||||
Equity in undistributed earnings (loss) of TCF Bank | ( | ) | |||||||||
Net income | |||||||||||
Preferred stock dividends | |||||||||||
Impact of preferred stock redemption | |||||||||||
Net income available to common shareholders | $ | $ | $ | ||||||||
148
Condensed Statements of Cash Flows
Year Ended December 31, | |||||||||||
(In thousands) | 2019 | 2018 | 2017 | ||||||||
Cash flows from operating activities: | |||||||||||
Net income | $ | $ | $ | ||||||||
Adjustments to reconcile net income to net cash provided by (used in) operating activities: | |||||||||||
Equity in undistributed (earnings) loss of TCF Bank | ( | ) | ( | ) | |||||||
Share-based compensation expense | |||||||||||
Depreciation and amortization | ( | ) | |||||||||
Provision (benefit) for deferred income taxes | ( | ) | |||||||||
Net gains (losses) on sales of assets | ( | ) | |||||||||
Net change in other assets | ( | ) | |||||||||
Net change in other liabilities | ( | ) | ( | ) | ( | ) | |||||
Other, net | ( | ) | ( | ) | ( | ) | |||||
Net cash provided by operating activities | |||||||||||
Cash flows from investing activities: | |||||||||||
Purchases of premises and equipment and lease equipment | ( | ) | ( | ) | ( | ) | |||||
Proceeds from sales of premises and equipment | |||||||||||
Net cash acquired in business combination | |||||||||||
Net cash provided by (used in) investing activities | ( | ) | |||||||||
Cash flows from financing activities: | |||||||||||
Redemption of Series B preferred stock | ( | ) | |||||||||
Net proceeds from public offering of Series C preferred stock | |||||||||||
Redemption of Series A preferred stock | ( | ) | |||||||||
Repurchases of common stock | ( | ) | ( | ) | ( | ) | |||||
Common shares sold to TCF employee benefit plans | |||||||||||
Dividends paid on preferred stock | ( | ) | ( | ) | ( | ) | |||||
Dividends paid on common stock | ( | ) | ( | ) | ( | ) | |||||
Payments related to tax-withholding upon conversion of share-based awards | ( | ) | ( | ) | ( | ) | |||||
Exercise of stock options | ( | ) | ( | ) | |||||||
Net cash used in financing activities | ( | ) | ( | ) | ( | ) | |||||
Net change in cash and due from banks | |||||||||||
Cash and due from banks at beginning of period | |||||||||||
Cash and due from banks at end of period | $ | $ | $ | ||||||||
TCF Financial's operations are conducted through its banking subsidiary, TCF Bank. As a result, TCF Financial's cash flows and ability to make dividend payments to its preferred and common shareholders depend on the earnings of TCF Bank. The ability of TCF Bank to pay dividends or make other payments to TCF Financial is limited by its obligation to maintain sufficient capital and by other regulatory restrictions on dividends. See "Note 19. Regulatory Capital Requirements" of Notes to Consolidated Financial Statements for further information.
149
Note 29. Accumulated Other Comprehensive Income (Loss)
The components of other comprehensive income (loss), reclassifications from accumulated other comprehensive income (loss) to various financial statement line items and the related tax effects were as follows:
(In thousands) | Before Tax | Tax Effect | Net of Tax | ||||||||
Year Ended December 31, 2019: | |||||||||||
Net unrealized gains (losses) on available-for-sale investment securities and interest-only strips: | |||||||||||
Net unrealized gains (losses) arising during the period | $ | $ | ( | ) | $ | ||||||
Reclassification of net (gains) losses from accumulated other comprehensive income (loss) to: | |||||||||||
Total interest income | ( | ) | |||||||||
Net gains (losses) on investment securities | ( | ) | ( | ) | |||||||
Other noninterest expense | ( | ) | ( | ) | |||||||
Amounts reclassified from accumulated other comprehensive income (loss) | ( | ) | |||||||||
Net unrealized gains (losses) on available-for-sale investment securities and interest-only strips | ( | ) | |||||||||
Recognized postretirement prior service cost: | |||||||||||
Reclassification of amortization of prior service cost to other noninterest expense | ( | ) | ( | ) | |||||||
Net unrealized gains (losses) on net investment hedges | ( | ) | ( | ) | |||||||
Foreign currency translation adjustment(1) | |||||||||||
Total other comprehensive income (loss) | $ | $ | ( | ) | $ | ||||||
Year Ended December 31, 2018: | |||||||||||
Net unrealized gains (losses) on available-for-sale investment securities and interest-only strips: | |||||||||||
Net unrealized gains (losses) arising during the period | $ | ( | ) | $ | $ | ( | ) | ||||
Reclassification of net (gains) losses from accumulated other comprehensive income (loss) to: | |||||||||||
Total interest income | ( | ) | |||||||||
Net gains (losses) on investment securities | ( | ) | ( | ) | |||||||
Other noninterest expense | ( | ) | |||||||||
Amounts reclassified from accumulated other comprehensive income (loss) | ( | ) | |||||||||
Net unrealized gains (losses) on available-for-sale investment securities and interest-only strips | ( | ) | ( | ) | |||||||
Recognized postretirement prior service cost: | |||||||||||
Reclassification of amortization of prior service cost to other noninterest expense | ( | ) | ( | ) | |||||||
Net unrealized gains (losses) on net investment hedges | ( | ) | |||||||||
Foreign currency translation adjustment(1) | ( | ) | ( | ) | |||||||
Total other comprehensive income (loss) | $ | ( | ) | $ | $ | ( | ) | ||||
Year Ended December 31, 2017: | |||||||||||
Net unrealized gains (losses) on available-for-sale investment securities and interest-only strips: | |||||||||||
Net unrealized gains (losses) arising during the period | $ | $ | ( | ) | $ | ||||||
Reclassification of net (gains) losses from accumulated other comprehensive income (loss) to: | |||||||||||
Total interest income | |||||||||||
Other noninterest expense | ( | ) | ( | ) | |||||||
Amounts reclassified from accumulated other comprehensive income (loss) | |||||||||||
Net unrealized gains (losses) on available-for-sale investment securities and interest-only strips | ( | ) | |||||||||
Recognized postretirement prior service cost: | |||||||||||
Reclassification of amortization of prior service cost to other noninterest expense | ( | ) | ( | ) | |||||||
Net unrealized gains (losses) on net investment hedges | ( | ) | ( | ) | |||||||
Foreign currency translation adjustment(1) | |||||||||||
Total other comprehensive income (loss) | $ | $ | ( | ) | $ | ||||||
(1) | Foreign investments are deemed to be permanent in nature and, therefore, TCF does not provide for taxes on foreign currency translation adjustments. |
150
The components of accumulated other comprehensive income (loss) were as follows:
(In thousands) | Net Unrealized Gains (Losses) on Available-for-Sale Investment Securities and Interest-only Strips | Net Unrealized Gains (Losses) on Net Investment Hedges | Foreign Currency Translation Adjustment | Recognized Postretirement Prior Service Cost | Total | ||||||||||||||
At or For the Year Ended December 31, 2019: | |||||||||||||||||||
Balance, beginning of period | $ | ( | ) | $ | $ | ( | ) | $ | $ | ( | ) | ||||||||
Other comprehensive income (loss) | ( | ) | |||||||||||||||||
Amounts reclassified from accumulated other comprehensive income (loss) | ( | ) | |||||||||||||||||
Net other comprehensive income (loss) | ( | ) | ( | ) | |||||||||||||||
Balance, end of period | $ | $ | $ | ( | ) | $ | $ | ||||||||||||
At or For the Year Ended December 31, 2018: | |||||||||||||||||||
Balance, beginning of period | $ | ( | ) | $ | $ | ( | ) | $ | $ | ( | ) | ||||||||
Other comprehensive income (loss) | ( | ) | ( | ) | ( | ) | |||||||||||||
Amounts reclassified from accumulated other comprehensive income (loss) | ( | ) | |||||||||||||||||
Net other comprehensive income (loss) | ( | ) | ( | ) | ( | ) | ( | ) | |||||||||||
Balance, end of period | $ | ( | ) | $ | $ | ( | ) | $ | $ | ( | ) | ||||||||
At or For the Year Ended December 31, 2017: | |||||||||||||||||||
Balance, beginning of period | $ | ( | ) | $ | $ | ( | ) | $ | $ | ( | ) | ||||||||
Other comprehensive income (loss) | ( | ) | |||||||||||||||||
Amounts reclassified from accumulated other comprehensive income (loss) | ( | ) | |||||||||||||||||
Net other comprehensive income (loss) | ( | ) | ( | ) | |||||||||||||||
Adoption impact of ASU 2018-02 | ( | ) | ( | ) | |||||||||||||||
Balance, end of period | $ | ( | ) | $ | $ | ( | ) | $ | $ | ( | ) | ||||||||
151
Note 30. Selected Quarterly Financial Data (Unaudited)
Quarter Ended | ||||||||||||||||||||||||
(In thousands, except per share data) | Dec. 31, 2019 | Sep. 30, 2019 | Jun. 30, 2019 | Mar. 31, 2019 | Dec. 31, 2018 | Sep. 30, 2018 | Jun. 30, 2018 | Mar. 31, 2018 | ||||||||||||||||
Net interest income | $ | $ | $ | $ | $ | $ | $ | $ | ||||||||||||||||
Provision for credit losses | ||||||||||||||||||||||||
Net interest income after provision for credit losses | ||||||||||||||||||||||||
Noninterest income | ||||||||||||||||||||||||
Noninterest expense | ||||||||||||||||||||||||
Income before income tax expense (benefit) | ||||||||||||||||||||||||
Income tax expense (benefit) | ( | ) | ||||||||||||||||||||||
Income after income tax expense (benefit) | ||||||||||||||||||||||||
Income attributable to non-controlling interest | ||||||||||||||||||||||||
Net income attributable to TCF Financial Corporation | ||||||||||||||||||||||||
Preferred stock dividends | ||||||||||||||||||||||||
Impact of preferred stock redemption | ||||||||||||||||||||||||
Net income available to common shareholders | $ | $ | $ | $ | $ | $ | $ | $ | ||||||||||||||||
Earnings per common share: | ||||||||||||||||||||||||
Basic | $ | $ | $ | $ | $ | $ | $ | $ | ||||||||||||||||
Diluted | ||||||||||||||||||||||||
152
Item 9. Changes in and Disagreements With Accountants on Accounting and Financial Disclosure
None.
Item 9A. Controls and Procedures
Disclosure Controls and Procedures TCF Financial carried out an evaluation, under the supervision and with the participation of TCF Financial's management, including its Chief Executive Officer (Principal Executive Officer), Chief Financial Officer (Principal Financial Officer) and Chief Accounting Officer (Principal Accounting Officer), of the effectiveness of the design and operation of TCF Financial’s disclosure controls and procedures pursuant to Rules 13a-15 and 15d-15 of the Securities Exchange Act of 1934, as amended (the "Exchange Act"). Based on that evaluation, management concluded that TCF Financial’s disclosure controls and procedures were effective as of December 31, 2019.
Any system of disclosure controls and procedures, no matter how well conceived and operated, can provide only reasonable, not absolute, assurance that the objectives of the control system are met. The design of a control system inherently has limitations and the benefits of controls must be weighed against their costs. Additionally, controls can be circumvented by the individual acts of some persons, by collusion of two or more people or by management override of the controls. Therefore, no assessment of a cost-effective system of internal controls can provide absolute assurance that all control issues and instances of fraud, if any, will be detected.
Disclosure controls and procedures are designed to ensure that information required to be disclosed by TCF Financial in reports filed or submitted under the Exchange Act is recorded, processed, summarized and reported within the time periods specified in the Securities and Exchange Commission's rules and forms. Disclosure controls are also designed with the objective of ensuring that such information is accumulated and communicated to TCF Financial's management, including the Chief Executive Officer (Principal Executive Officer), Chief Financial Officer (Principal Financial Officer) and Chief Accounting Officer (Principal Accounting Officer), as appropriate, to allow for timely decisions regarding required disclosure. TCF Financial's disclosure controls also include internal controls that are designed to provide reasonable assurance that transactions are properly authorized, assets are safeguarded against unauthorized or improper use and that transactions are properly recorded and reported.
Changes in Internal Control Over Financial Reporting Management is responsible for establishing and maintaining
adequate internal control over financial reporting for TCF. Internal control over financial reporting is a process designed
to provide reasonable assurance regarding the reliability of financial reporting and the preparation of financial statements for external purposes in accordance with generally accepted accounting principles.
Internal control over financial reporting includes those policies and procedures that pertain to the maintenance of records that in reasonable detail accurately and fairly reflect the transactions and dispositions of the assets of TCF; provide reasonable assurance that transactions are recorded as necessary to permit preparation of financial statements
in accordance with generally accepted accounting principles and that receipts and expenditures of TCF are only being made in accordance with authorizations of management and directors of TCF; and provide reasonable assurance regarding prevention or timely detection of unauthorized acquisition, use, or disposition of TCF’s assets that could have a material effect on the financial statements.
The Merger, which was completed on August 1, 2019, had a material impact on the financial position, results of operations and cash flows of the combined company from the date of acquisition through December 31, 2019. We continue to progress in our process of planning for the future integration of our financial systems and assessing the anticipated changes in the internal controls over financial reporting for the combined company. We expect that the integration will be completed in the second half of 2020 and we will disclose material changes in internal control over financial reporting on an on-going basis as they occur.
153
Management's Report on Internal Control Over Financial Reporting
Management is responsible for establishing and maintaining adequate internal control over financial reporting for TCF Financial Corporation (the "Corporation"). Internal control over financial reporting is a process designed to provide reasonable assurance regarding the reliability of financial reporting and the preparation of financial statements for external purposes in accordance with generally accepted accounting principles.
Internal control over financial reporting includes those policies and procedures that pertain to the maintenance of records that in reasonable detail accurately and fairly reflect the transactions and dispositions of the assets of the Corporation; provide reasonable assurance that transactions are recorded as necessary to permit preparation of financial statements in accordance with generally accepted accounting principles and that receipts and expenditures of the Corporation are only being made in accordance with authorizations of management and directors of the Corporation; and provide reasonable assurance regarding prevention or timely detection of unauthorized acquisition, use, or disposition of the Corporation's assets that could have a material effect on the financial statements.
Management, with the participation of the Chief Executive Officer (Principal Executive Officer) and Chief Financial Officer (Principal Financial Officer), completed an assessment of TCF's internal control over financial reporting as of December 31, 2019. This assessment was based on criteria for evaluating internal control over financial reporting established in Internal Control - Integrated Framework issued by the Committee of Sponsoring Organizations of the Treadway Commission in May 2013. Based on this assessment, management concluded that TCF's internal control over financial reporting was effective as of December 31, 2019.
KPMG LLP, the Corporation's independent registered public accounting firm that audited the consolidated financial statements included in this annual report, has issued an unqualified attestation report on the effectiveness of the Corporation's internal control over financial reporting as of December 31, 2019.
Any control system, no matter how well conceived and operated, can provide only reasonable, not absolute, assurance that the objectives of the control system are met. The design of a control system inherently has limitations and the benefits of controls must be weighed against their costs. Additionally, controls can be circumvented by the individual acts of some persons, by collusion of two or more people or by management override of the controls. Therefore, no assessment of a cost-effective system of internal controls can provide absolute assurance that all control issues and instances of fraud, if any, will be detected.
154
Report of Independent Registered Public Accounting Firm
To the Shareholders and Board of Directors
TCF Financial Corporation:
Opinion on Internal Control Over Financial Reporting
We have audited TCF Financial Corporation and subsidiaries’ (the Corporation) internal control over financial reporting as of December 31, 2019, based on criteria established in Internal Control - Integrated Framework (2013) issued by the Committee of Sponsoring Organizations of the Treadway Commission. In our opinion, the Corporation maintained, in all material respects, effective internal control over financial reporting as of December 31, 2019, based on criteria established in Internal Control - Integrated Framework (2013) issued by the Committee of Sponsoring Organizations of the Treadway Commission.
We also have audited, in accordance with the standards of the Public Company Accounting Oversight Board (United States) (PCAOB), the consolidated statements of financial condition of the Corporation as of December 31, 2019 and 2018, the related consolidated statements of income, comprehensive income, equity, and cash flows for each of the years in the three-year period ended December 31, 2019, and the related notes (collectively, the consolidated financial statements), and our report dated March 2, 2020 expressed an unqualified opinion on those consolidated financial statements.
Basis for Opinion
The Corporation’s management is responsible for maintaining effective internal control over financial reporting and for its assessment of the effectiveness of internal control over financial reporting, included in the accompanying Management’s Report on Internal Control Over Financial Reporting. Our responsibility is to express an opinion on the Corporation’s internal control over financial reporting based on our audit. We are a public accounting firm registered with the PCAOB and are required to be independent with respect to the Corporation in accordance with the U.S. federal securities laws and the applicable rules and regulations of the Securities and Exchange Commission and the PCAOB.
We conducted our audit in accordance with the standards of the PCAOB. Those standards require that we plan and perform the audit to obtain reasonable assurance about whether effective internal control over financial reporting was maintained in all material respects. Our audit of internal control over financial reporting included obtaining an understanding of internal control over financial reporting, assessing the risk that a material weakness exists, and testing and evaluating the design and operating effectiveness of internal control based on the assessed risk. Our audit also included performing such other procedures as we considered necessary in the circumstances. We believe that our audit provides a reasonable basis for our opinion.
Definition and Limitations of Internal Control Over Financial Reporting
A company’s internal control over financial reporting is a process designed to provide reasonable assurance regarding the reliability of financial reporting and the preparation of financial statements for external purposes in accordance with generally accepted accounting principles. A company’s internal control over financial reporting includes those policies and procedures that (1) pertain to the maintenance of records that, in reasonable detail, accurately and fairly reflect the transactions and dispositions of the assets of the company; (2) provide reasonable assurance that transactions are recorded as necessary to permit preparation of financial statements in accordance with generally accepted accounting principles, and that receipts and expenditures of the company are being made only in accordance with authorizations of management and directors of the company; and (3) provide reasonable assurance regarding prevention or timely detection of unauthorized acquisition, use, or disposition of the company’s assets that could have a material effect on the financial statements.
Because of its inherent limitations, internal control over financial reporting may not prevent or detect misstatements. Also, projections of any evaluation of effectiveness to future periods are subject to the risk that controls may become inadequate because of changes in conditions, or that the degree of compliance with the policies or procedures may deteriorate.
/s/ KPMG LLP
Detroit, Michigan
March 2, 2020
155
Item 9B. Other Information
None.
Part III
Item 10. Directors, Executive Officers and Corporate Governance
Information regarding our directors and executive officers is set forth in the following sections of our definitive Proxy Statement for the 2020 Annual Meeting of Shareholders ("2020 Proxy") to be held on May 6, 2020 and is incorporated herein by reference: Election of Directors; Background of Executive Officers Who Are Not Directors; and Delinquent Section 16(a) Reports.
Information regarding procedures for nominations of directors is set forth in the following sections of our 2020 Proxy and is incorporated herein by reference: Corporate Governance - Director Nominations; and Additional Information.
Audit Committee and Financial Expert
Information regarding our Audit Committee, its members and financial experts is set forth in the following sections of our 2020 Proxy and is incorporated herein by reference: Election of Directors - Background of the Nominees; Corporate Governance - Board Committees, Committee Memberships, and Meetings in 2019; and Corporate Governance - Audit Committee.
Our Board of Directors is required to determine whether it has at least one Audit Committee Financial Expert and that the expert is independent. An Audit Committee Financial Expert is a committee member who has an understanding of generally accepted accounting principles and financial statements and has the ability to assess the general application of these principles in connection with the accounting for estimates, accruals and reserves. Additionally, this individual should have experience preparing, auditing, analyzing or evaluating financial statements that present the breadth and level of complexity of accounting issues that are generally comparable to the breadth and complexity of issues that can reasonably be expected to be raised by our financial statements or experience actively supervising one or more persons engaged in such activities. The member should also have an understanding of internal control over financial reporting as well as an understanding of audit committee functions.
The Board has determined that all members of the Audit Committee, including Karen L. Grandstrand, Barbara J. Mahone, Roger J. Sit, Julie H. Sullivan, Jeffery L. Tate, and Franklin C. Wheatlake, are independent and that Directors Sullivan and Tate each meet the requirements of audit committee financial experts. Additional information regarding Ms. Grandstrand, Ms. Mahone, Mr. Sit, Dr. Sullivan, Mr. Tate and Mr. Wheatlake and the other directors is set forth in the section Election of Directors - Background of the Nominees in our 2020 Proxy and is incorporated herein by reference.
Code of Ethics for Senior Financial Management
We have adopted a code of ethics applicable to the Principal Executive Officer ("PEO"), Principal Financial Officer ("PFO") and Principal Accounting Officer ("PAO") (the "Senior Financial Management Code of Ethics") as well as a code of ethics generally applicable to all of our employees (including the PEO, PFO and PAO) and directors (the "Code of Ethics"). The Code of Ethics and the Senior Financial Management Code of Ethics are both available for review on our website at www.tcfbank.com by clicking on "About TCF" and then "Learn More" under the heading "Corporate Governance" and then either "Code of Ethics Policy" or "Code of Ethics for Senior Financial Management". Any changes to either code will be posted on the website and any waivers granted to or violations by the PEO, PFO, PAO or any director of TCF Financial will also be posted on our website. To date, there have been no waivers granted to or violations by the PEO, PFO, PAO or any director of our directors.
Item 11. Executive Compensation
Information regarding compensation of our directors and executive officers is set forth in the following sections of our 2020 Proxy and is incorporated herein by reference: Corporate Governance - Compensation and Pension Committee; Director Compensation; Compensation Discussion and Analysis; Compensation Committee Report; and Executive Compensation.
156
Item 12. Security Ownership of Certain Beneficial Owners and Management and Related Stockholder Matters
Information regarding ownership of our common stock by our directors, executive officers and certain other shareholders and shares authorized under equity compensation plans is set forth in the following sections of TCF's 2020 Proxy and is incorporated herein by reference: Equity Compensation Plans Approved by Shareholders; and Ownership of TCF Stock.
Item 13. Certain Relationships and Related Transactions, and Director Independence
Information regarding director independence and certain relationships and transactions between TCF and certain related persons is set forth in the section entitled Corporate Governance - Director Independence and Related Person Transactions of our 2020 Proxy and is incorporated herein by reference.
Item 14. Principal Accounting Fees and Services
Information regarding principal accounting fees and services and the Audit Committee's pre-approval policies and procedures relating to audit and non-audit services provided by our independent registered public accounting firm is set forth in the section entitled Independent Registered Public Accountants in our 2020 Proxy and is incorporated herein by reference.
Part IV
Item 15. Exhibits, Financial Statement Schedules
1. Financial Statements | |
The following consolidated financial statements of TCF Financial Corporation are filed as part of this report: | |
Description | Page |
2. Financial Statement Schedules | |
All financial statement schedules have been included in the Consolidated Financial Statements or the Notes thereto, or are either inapplicable or not required. | |
157
3. Exhibits
Exhibit Number | Description | |
2(a) | Agreement and Plan of Merger by and between Chemical Financial Corporation and TCF Financial Corporation dated as of January 27, 2019 Previously filed as Exhibit 2.1 to the registrant’s Current Report on Form 8-K filed with the SEC on January 28, 2019. Here incorporated by reference. | |
3(a) | Restated Articles of Incorporation of the Corporation Previously filed as Exhibit 3.1 to the registrant’s Quarterly Report on Form 10-Q for the quarter ended March 31, 2017, filed with the SEC on May 10, 2017. Here incorporated by reference. | |
3(b) | Amendment to the Restated Articles of Incorporation of TCF Financial Corporation, including the Certificate of Designations of 5.70% Series C Non-Cumulative Perpetual Preferred Stock. Previously filed as Exhibit 3.2 to the registrant’s Current Report on Form 8-K filed with the SEC on August 1, 2019. Here incorporated by reference. | |
3(c) | Bylaws of TCF Financial Corporation, as of August 1, 2019. Previously filed as Exhibit 3.3 to the registrant’s Current Report on Form 8-K filed with the SEC on August 1, 2019. Here incorporated by reference. | |
4(a) | Description of Common Stock. Previously filed as Exhibit 4.1 to the registrant’s Current Report on Form 8-K filed with the SEC on August 1, 2019. Here incorporated by reference. | |
4(b) | Long-Term Debt. The registrant has outstanding long-term debt which at the time of this Annual Report does not exceed 10% of the registrant's total consolidated assets. The registrant agrees to furnish copies of the agreements defining the rights of holders of such long-term debt to the SEC upon request. | |
10(a)* | Amending and Restated Chemical Financial Corporation Stock Incentive Plan of 2006. Previously filed as Exhibit 10.1 to the registrant's Quarterly Report on Form 10-Q for the quarter ended June 30, 2011, filed with the SEC on August 3, 2011. Here incorporated by reference. | |
10(b)* | Chemical Financial Corporation Stock Incentive Plan of 2012. Previously filed as Appendix A to the registrant's definitive proxy statement for the registrant's 2012 Annual Meeting of Shareholders, filed with the SEC on March 1, 2012. Here incorporated by reference. | |
10(c)* | Chemical Financial Corporation Stock Incentive Plan of 2015. Previously filed as Appendix C to the registrant's definitive proxy statement for the registrant's 2015 Annual Meeting of Shareholders, filed with the SEC on March 6, 2015. Here incorporated by reference. | |
10(d)* | Chemical Financial Corporation Stock Incentive Plan of 2017. Previously filed as Exhibit 10.1 to the registrant's Quarterly Report on Form 10-Q for the quarter ended March 31, 2017, filed with the SEC on May 10, 2017. Here incorporated by reference. | |
10(e)* | Chemical Financial Corporation Supplemental Retirement Income Plan. Previously filed as Exhibit 10.5 to the registrant's Registration Statement on Form S-4, filed with the SEC on February 19, 2010. Here incorporated by reference. | |
10(f)* | Chemical Financial Corporation Deferred Compensation Plan for Directors. Previously filed as Exhibit 10.2 to the registrant's Annual Report on Form 10-K for the year ended December 31, 2011, filed with the SEC on February 24, 2012. Here incorporated by reference. | |
10(g)*# | ||
10(h)* | Chemical Financial Corporation Directors' Deferred Stock Plan. Previously filed as Exhibit 10.8 to the registrant's Annual Report on Form 10-K for the year ended December 31, 2013, filed with the SEC on February 26, 2014. Here incorporated by reference. | |
10(i)* | Chemical Financial Corporation Executive Annual Incentive Plan. Previously filed as Exhibit 10.9 of the registrant's Annual Report on Form 10-K filed with the SEC on February 28, 2018. Here incorporated by reference. | |
10(j)* | Form of Restricted Stock Unit Agreement pursuant to the Stock Incentive Plan of 2017 for Performance-Based Restricted Stock. Previously filed as Exhibit 10.29 of the registrant’s Annual Report on Form 10-K filed with the SEC on February 28, 2018. Here incorporated by reference. | |
10(k)* | Form of Restricted Stock Unit Agreement pursuant to the Stock Incentive Plan of 2017 for Time-Vested Restricted Stock. Previously filed as Exhibit 10.30 of the registrant’s Annual Report on Form 10-K filed with the SEC on February 28, 2018. Here incorporated by reference | |
10(l)* | Form of Restricted Stock Unit Agreement pursuant to the Stock Incentive Plan of 2017 for Performance-Based Restricted Stock awarded to Executive Leadership. Previously filed as Exhibit 10.29 of the registrant’s Annual Report on Form 10-K filed with the SEC on February 28, 2019. Here incorporated by reference. | |
10(m)* | Form of Restricted Stock Unit Agreement pursuant to the Stock Incentive Plan of 2017 for Performance-Based Restricted Stock awarded to the Chairman and Chief Executive Officer. Previously filed as Exhibit 10.30 of the registrant’s Annual Report on Form 10-K filed with the SEC on February 28, 2019. Here incorporated by reference. | |
10(n)* | Form of Restricted Stock Unit Agreement pursuant to the Stock Incentive Plan of 2017 for Time-Based Restricted Stock awarded to Executive Leadership. Previously filed as Exhibit 10.31 of the registrant’s Annual Report on Form 10-K filed with the SEC on February 28, 2019. Here incorporated by reference. | |
10(o)* | Form of Restricted Stock Unit Agreement pursuant to the Stock Incentive Plan of 2017 for Time-Based Restricted Stock awarded to the Chairman and Chief Executive Officer. Previously filed as Exhibit 10.32 of the registrant’s Annual Report on Form 10-K filed with the SEC on February 28, 2019. Here incorporated by reference. | |
10(p)* | Amended and Restated Employment Agreement dated November 6, 2019, between TCF Financial Corporation and Craig R. Dahl. Previously filed as Exhibit 10(a) of the registrant’s Quarterly Report on Form 10-Q for the quarter ended September 30, 2019, with the SEC on November 12, 2019. Here incorporated by reference. | |
10(q)* | Retention Agreement between David T. Provost and Chemical Financial Corporation, dated January 27, 2019. Previously filed as Exhibit 10.1 of the registrant’s Current Report on Form 8-K filed with the SEC on January 28, 2019. Here incorporated by reference. | |
10(r)* | Retention Agreement between Gary Torgow and Chemical Financial Corporation, dated January 27, 2019. Previously filed as Exhibit 10.2 of the registrant’s Current Report on Form 8-K filed with the SEC on January 28, 2019. Here incorporated by reference. | |
10(s)* | Employment Agreement between J. Brennan Ryan, Chemical Financial Corporation and Chemical Bank, dated July 9, 2018. Previously filed as Exhibit 10.28 to the registrant’s Annual Report on Form 10-K for the year ended December 31, 2018, filed with the SEC on February 28, 2019. Here incorporated by reference. | |
10(t)* | Letter Agreement dated July 31, 2019 between Chemical Financial Corporation and Brennan Ryan. Previously filed as Exhibit 10.2 to the registrant’s Current Report on Form 8-K filed with the SEC on August 1, 2019. Here incorporated by reference. | |
158
10(u)* | Amended and Restated Employment Agreement dated July 31, 2019 between Chemical Financial Corporation and Thomas C. Shafer. Previously filed as Exhibit 10.3 to the registrant’s Current Report on Form 8-K filed with the SEC on August 1, 2019. Here incorporated by reference. | |
10(v)* | Employment Agreement between Dennis L. Klaeser, Chemical Financial Corporation and Chemical Bank, dated July 1, 2018. Previously filed as Exhibit 10.2 to the registrant's Current Report on Form 8-K filed with the SEC on July 3, 2018. Here incorporated by reference. | |
10(w)* | Letter Agreement dated December 13, 2019 between Dennis L. Klaeser and TCF Financial Corporation. Previously filed as Exhibit 10.1 to the registrant’s Current Report on Form 8-K filed with the SEC on December 16, 2019. Here incorporated by reference. | |
10(x)* | Executive Employment Agreement dated December 13, 2019 by and between TCF Financial Corporation and Brian Maass. Previously filed as Exhibit 10.2 to the registrant’s Current Report on Form 8-K filed with the SEC on December 16, 2019. Here incorporated by reference. | |
10(y)* | Form of Retention Time-Vesting Restricted Stock Unit Agreement. Previously filed as Exhibit 10.4 of the registrant’s Current Report on Form 8-K filed with the SEC on August 1, 2019. Here incorporated by reference. | |
10(z)* | Amended and Restated TCF Financial 2015 Omnibus Incentive Plan. Previously filed as Exhibit 10(a) to Legacy TCF’s Annual Report on Form 10-K filed with the SEC on February 26, 2019. Here incorporated by reference. | |
10(aa)* | Form of Restricted Stock Award Agreement under the TCF Financial 2015 Omnibus Incentive Plan. Previously filed as Exhibit 10(a)-1 to Legacy TCF’s Annual Report on Form 10-K filed with the SEC on February 26, 2019. Here incorporated by reference. | |
10(bb)* | Form of Performance-Based Restricted Stock Award Agreement under the TCF Financial 2015 Omnibus Incentive Plan. Previously filed as Exhibit 10(a)-2 to Legacy TCF’s Annual Report on Form 10-K filed with the SEC on February 26, 2019. Here incorporated by reference. | |
10(cc)* | Form of Restricted Stock Unit Agreement under the TCF Financial 2015 Omnibus Incentive Plan. Previously filed as Exhibit 10(a)-3 to Legacy TCF’s Annual Report on Form 10-K filed with the SEC on February 26, 2019. Here incorporated by reference. | |
10(dd)* | Form of Performance-Based Restricted Stock Unit Agreement under the TCF Financial 2015 Omnibus Incentive Plan. Previously filed as Exhibit 10(a)-4 to Legacy TCF’s Annual Report on Form 10-K filed with the SEC on February 26, 2019. Here incorporated by reference. | |
10(ee)* | Form of TCF Financial Corporation Management Incentive Plan - Executive Award. Previously filed as Exhibit 10(a)-6 to Legacy TCF’s Annual Report on Form 10-K filed with the SEC on February 26, 2019. Here incorporated by reference. | |
10(ff)* | Form of Performance-Based Restricted Stock Unit Agreement under the TCF Financial 2015 Omnibus Incentive Plan. Previously filed as Exhibit 10(a)-7 to Legacy TCF’s Annual Report on Form 10-K filed with the SEC on February 26, 2019. Here incorporated by reference. | |
10(gg)* | TCF Financial Incentive Stock Program, as amended and restated April 24, 2013. Previously filed as Exhibit 10(b) to Legacy TCF’s Annual Report on Form 10-K filed with the SEC on February 26, 2019. Here incorporated by reference. | |
10(hh)* | Form of Deferred Restricted Stock Award Agreement as executed by certain executives. Previously filed as Exhibit 10(b)-2 to Legacy TCF’s Annual Report on Form 10-K filed with the SEC on February 26, 2019. Here incorporated by reference. | |
10(ii)* | Form of Performance-Based Restricted Stock Award Agreement as executed by certain executives. Previously filed as Exhibit 10(b)-3 to Legacy TCF’s Annual Report on Form 10-K filed with the SEC on February 26, 2019. Here incorporated by reference. | |
10(jj)* | TCF Financial Corporation Supplemental Employee Retirement Plan - ESPP Plan as amended and restated through January 24, 2005. Previously filed as Exhibit 10(e) to Legacy TCF’s Annual Report on Form 10-K filed with the SEC on February 26, 2019. Here incorporated by reference. | |
10(kk)*# | ||
10(ll)* | Trust Agreement for TCF 401K Plan Supplemental Plan effective November 1, 2017, by and between TCF Financial Corporation and Reliance Trust Company. Previously filed as Exhibit 10(f) to Legacy TCF’s Annual Report on Form 10-K filed with the SEC on February 26, 2019. Here incorporated by reference. | |
10(mm)*# | ||
10(nn)* | TCF Financial Corporation TCF Directors Deferred Compensation Plan as amended and restated through January 24, 2005. Previously filed as Exhibit 10(l) to Legacy TCF’s Annual Report on Form 10-K filed with the SEC on February 26, 2019. Here incorporated by reference. | |
10(oo)*# | TCF Financial Corporation Directors Deferred Compensation Plan, adopted effective as of January 6, 2005, as amended and restated October 23, 2019. | |
10(pp)* | Trust Agreement for TCF Directors Deferred Compensation Plan as amended by amendment adopted April 30, 2001 as amended by amendment adopted October 10, 2001 and as amended by amendments adopted May 3, 2002 and as amended by Third Amendment of TCF Directors Deferred Compensation Trust effective as of June 30, 2003 Previously filed as Exhibit 10(m) to Legacy TCF’s Annual Report on Form 10-K filed with the SEC on February 26, 2019. Here incorporated by reference. | |
10(qq)*# | TCF 401K Plan, as amended and restated effective January 1, 2020. | |
10(rr)*# | ||
10(ss)*# | ||
10(tt)*# | ||
10(uu)* | Lease, dated May 31, 2019, by and between GPC Adams LLC and Chemical Bank. Previously filed as Exhibit 10.1 to the registrant’s Current Report on Form 8-K filed with the SEC on June 6, 2019. Here incorporated by reference. | |
21# | ||
23.1# | ||
23.2# | ||
31.1# | ||
31.2# | ||
32.1# | ||
32.2# | ||
159
99.1# | ||
101.INS | XBRL Instance Document - the instance document does not appear in the Interactive Data File because its XBRL tags are embedded within the Inline XBRL document. | |
101.SCH# | XBRL Taxonomy Extension Schema Document | |
101.CAL# | XBRL Taxonomy Extension Calculation Linkbase Document | |
101.DEF# | XBRL Taxonomy Extension Definitions Linkbase Document | |
101.LAB# | XBRL Taxonomy Extension Label Linkbase Document | |
101.PRE# | XBRL Taxonomy Extension Presentation Linkbase Document | |
*These agreements are management contracts or compensation plans or arrangements required to be filed as Exhibits to this Form 10-K.
# Filed herein
160
SIGNATURES
Pursuant to the requirements of Section 13 or Section 15(d) of the Securities Exchange Act of 1934, the registrant has duly caused this report to be signed on its behalf by the undersigned, thereunto duly authorized.
TCF FINANCIAL CORPORATION | ||
/s/ Craig R. Dahl | ||
Craig R. Dahl, | ||
Chief Executive Officer and President | ||
(Principal Executive Officer) | ||
Dated: March 2, 2020
161
Pursuant to the requirements of the Securities Exchange Act of 1934, this report has been signed below by the following persons on behalf of the registrant and in the capacities and on the dates indicated.
Name | Title | Date |
/s/ Craig R. Dahl | March 2, 2020 | |
Craig R. Dahl | Chief Executive Officer and President (Principal Executive Officer) | |
/s/ Dennis L. Klaeser | March 2, 2020 | |
Dennis L. Klaeser | Executive Vice President and Chief Financial Officer (Principal Financial Officer) | |
/s/ Kathleen S. Wendt | March 2, 2020 | |
Kathleen S. Wendt | Executive Vice President and Chief Accounting Officer (Principal Accounting Officer) | |
/s/ Gary Torgow | March 2, 2020 | |
Gary Torgow | Executive Chairman | |
/s/ David T. Provost | March 2, 2020 | |
David T. Provost | Executive Vice Chairman | |
/s/ Peter Bell | March 2, 2020 | |
Peter Bell | Director | |
/s/ Karen L. Grandstrand | March 2, 2020 | |
Karen L. Grandstrand | Director | |
/s/ Richard H. King | March 2, 2020 | |
Richard H. King | Director | |
/s/ Ronald A. Klein | March 2, 2020 | |
Ronald A. Klein | Director | |
/s/ Barbara J. Mahone | March 2, 2020 | |
Barbara J. Mahone | Director | |
/s/ Barbara L. McQuade | March 2, 2020 | |
Barbara L. McQuade | Director | |
/s/ Vance K. Opperman | March 2, 2020 | |
Vance K. Opperman | Lead Director | |
/s/ Roger J. Sit | March 2, 2020 | |
Roger J. Sit | Director | |
/s/ Julie H. Sullivan | March 2, 2020 | |
Julie H. Sullivan | Director | |
/s/ Jeffrey L. Tate | March 2, 2020 | |
Jeffrey L. Tate | Director | |
/s/ Arthur A. Weiss | March 2, 2020 | |
Arthur A. Weiss | Director | |
/s/ Franklin C. Wheatlake | March 2, 2020 | |
Franklin C. Wheatlake | Director | |
/s/ Theresa M. H. Wise | March 2, 2020 | |
Theresa M. H. Wise | Director | |
162