UNITED STATES
SECURITIES AND EXCHANGE COMMISSION
WASHINGTON, D.C. 20549
FORM 10-K
☑ ANNUAL REPORT
PURSUANT TO SECTION 13 OR 15(d) OF
THE SECURITIES EXCHANGE ACT OF 1934
For the fiscal year ended December 31, 2018
☐
Transition Report Pursuant to Section 13 or 15(d) of the Securities Exchange Act of 1934
For the Transition Period from
________ to
___________
Commission File Number: 1-8351
CHEMED CORPORATION
(Exact name of registrant as specified in its charter)
| Delaware | 31-0791746 |
|
(State or other jurisdiction of
incorporation or organization)
|
(I.R.S. Employer
Identification Number)
|
| Suite 2600, 255 East Fifth Street, Cincinnati, Ohio | 45202-4726 |
| (Address of principal executive offices) | (Zip Code) |
(513) 762-6690
(Registrant’s Telephone number, including area code)
Securities registered pursuant to Section 12(b) of the Act:
| Title of Each Class | Name of each exchange on which registered |
|
Capital Stock – Par Value $1 Per Share
|
New York Stock Exchange
|
Securities registered pursuant to Section 12(b) of the Act: None
Securities registered pursuant to Section 12(g) of the Act: None
Indicate by check mark if the registrant is a well-known seasoned issuer, as defined in Rule 405 of the Securities Act. Yes ☑ No ☐
Indicate by check mark if the registrant is not required to file reports pursuant to Section 13 or Section 15(d) of the Act. Yes ☐ No ☑
Indicate by check mark whether the registrant (1) has filed all reports required to be filed by Section 13 or 15(d) of the Securities
Exchange Act of 1934 during the preceding 12 months (or for such shorter period that the registrant was required to file such reports), and (2) has been subject to such filing requirements for the past 90 days. Yes ☑ No ☐
Indicate by check mark whether the registrant has submitted electronically and posted on its corporate Web site, if any, every Interactive
Data File required to be submitted and posted pursuant to Rule 405 of Regulation S-T (§232.405 of this chapter) during the preceding 12 months (or for such shorter period that the registrant was required to submit and post such files). Yes ☑ No ☐
Indicate by check mark if disclosure of delinquent filers pursuant to Item 405 of Regulation S-K is not contained herein, and will not be
contained, to the best of registrant’s knowledge, if definitive proxy or information statements incorporated by reference in Part III of this Form 10-K or any amendment to this Form 10-K. Yes ☐ No ☑
Indicate by check mark whether the registrant is a large accelerated filer, an accelerated filer, a non-accelerated filer, a smaller
reporting company or emerging growth company. See definition of “accelerated filer, large accelerated filer, smaller reporting company and emerging growth company” in Rule 12b-2 of the Exchange Act.
(Check One): Large accelerated filer ☑ Accelerated
filer ☐ Non-accelerated filer ☐ Smaller reporting company ☐
Emerging growth company ☐
If an emerging growth company, indicate by check mark if the registrant has elected not to use the extended transition period for complying
with any new or revised financial accounting standards provided pursuant to Section 13(a) of the Exchange Act. ☐
Indicate by check mark whether the registrant is a shell company (as defined in Rule 12b-2 of the Act). Yes ☐ No ☑
The aggregate market value of the voting stock held by non-affiliates of the registrant, based upon the closing price of said stock on the
New York Stock Exchange – Composite Transaction Listing on June 29, 2018 ($320.64 per share), was $5,077,902,421.
At February 15, 2019, 15,967,469 shares of Chemed Capital Stock (par value $1 per share) were outstanding.
DOCUMENTS INCORPORATED BY REFERENCE
|
Document
|
Where Incorporated
|
| 2018 Annual Report to Stockholders (specified portions) |
Parts I, II, and IV |
|
Proxy Statement for Annual Meeting to be held May 20, 2019
|
Part III
|
CHEMED CORPORATION
2018 FORM 10-K ANNUAL REPORT
Table of Contents
|
PART I
|
|
|
PART II
|
|
|
PART III
|
|
|
PART IV
|
|
| Form 10-K Summary |
General
Chemed Corporation (the Company or Chemed) was incorporated in Delaware in 1970 as a subsidiary of W.R. Grace
& Co. and succeeded to the business of W.R. Grace & Co.’s Special Products Group as of April 30, 1971 and remained a subsidiary of W.R. Grace & Co. until March 10, 1982.
Chemed purchases, operates and divests subsidiaries engaged in diverse business activities for the purposes of
maximizing shareholder value. The Company’s day to day operating businesses are managed on a decentralized basis. There are few integrated business functions between the operating units and Chemed (such as sales, marketing or purchasing).
Chemed’s corporate office management participates in and is ultimately responsible for long term strategic planning, significant capital allocation decisions, investment activities, financial reporting, tax, legal and the selection of the key
executives of each of the operating businesses. Since its inception, the Company has engaged in twelve significant acquisitions or divestitures of diverse business units.
During 2018, Chemed conducted its business operations in two segments: the VITAS segment (VITAS) and the
Roto-Rooter segment (Roto-Rooter). VITAS provides hospice and palliative care services to its patients through a network of physicians, registered nurses, home health aides, social workers, clergy and volunteers. Roto-Rooter provides plumbing,
drain cleaning, water restoration and other related services to residential and commercial customers.
Forward Looking Statements
This Annual Report contains or incorporates by reference certain forward-looking statements within the meaning of
the Private Securities Litigation Reform Act of 1995. The Company intends such statements to be subject to the safe harbors created by that legislation. Such statements involve risks and uncertainties that could cause actual results of operations
to differ materially from these forward-looking statements.
Financial Information about Industry Segments
The required segment and geographic data for the Company’s continuing operations (as described below) for three
years ended December 31, 2016, 2017 and 2018 are shown in Note 5 of the Notes to Consolidated Financial Statements on pages 80-82 of the 2018 Annual Report to Stockholders and are incorporated herein by reference.
Description of Business by Segment
The information called for by this item is included within Note 5 of the Notes to Consolidated Financial
Statements appearing on pages 80-82 of the 2018 Annual Report to Stockholders is incorporated herein by reference.
Product and Market Development
Each segment of the Company’s business analyzes opportunities for the development and marketing of new services
and products. While new products and services and new market development are important factors for the long term growth of each active segment of the Company’s business, the Company does not expect that any new products and services or marketing
effort, including those in the development stage, will require the investment of a material amount of the Company’s assets.
Patents, Service Marks and Licenses
The Roto-Rooterâ trademarks and service marks
have been used and advertised since 1935 by Roto-Rooter Corporation, a wholly owned indirect subsidiary of the Company. The Roto-Rooterâ marks are among the most highly recognized
trademarks and service marks in the United States. The Company considers the Roto-Rooterâ marks to be a valuable asset and a significant factor in the marketing of Roto-Rooter’s
franchises, products and services and the products and services provided by its franchises.
“VITAS” and “Innovative Hospice Care” are trademarks and servicemarks of VITAS Healthcare Corporation. The
Company and its subsidiaries also own certain trade secrets including training manuals, cost information, patient information and software source code. Certain states require certificates of need to conduct hospice operations. In those states, we
consider certificates of need valuable assets.
1
Seasonality
Roto-Rooter’s revenue and operating results are impacted by significant weather patterns across the United
States. Significant changes in precipitation or temperatures in areas we have company-owned and independent contractor operations will generally affect the revenue and operating results at Roto-Rooter.
A significant portion of our VITAS business is operated in the state of Florida. The vast majority of our
patients are Medicare recipients. Medicare patients relocating to Florida during the winter months generally result in higher admissions and revenue for our Florida programs during that period.
Customer Concentration
Roto-Rooter’s business has a large and diverse customer base. Approximately 93% of VITAS’ revenue is from the
United States government through the Medicare program. The loss of a portion or all of our Medicare revenue would have a material adverse effect on the Company.
Competition
Roto-Rooter
All aspects of the sewer, drain and pipe cleaning, plumbing repair and water restoration businesses are highly
competitive. Competition is fragmented in most markets with local and regional firms providing the primary competition. The principal methods of competition are advertising, range of services provided, name recognition, emergency-service
availability, speed and quality of customer service, service guarantees, and pricing.
VITAS
Hospice care in the United States is competitive. Plans of care for hospice services are not proprietary. As a
result, VITAS competes and differentiates itself primarily on the basis of its ability to deliver quality, responsive services within the requirements of Medicare’s hospice conditions of participation. VITAS is one of the nation’s largest
providers of hospice services in an industry dominated primarily by small, non-profit, community-based hospices. Approximately 30% of all hospice providers are not-for-profit. Because the hospice care industry is highly fragmented, VITAS competes
with a large number of organizations.
VITAS also competes with a number of national and regional hospice providers, hospitals, nursing homes, home
health agencies and other health care providers. Many providers offer home care to patients who are terminally ill, and some actively market palliative care and hospice-like programs. In addition, various health care companies have diversified
into the hospice market. Some of these health care companies have greater financial resources than VITAS. Relatively few barriers to entry exist in the majority of markets served by VITAS. Accordingly, other companies that are not currently
providing hospice care may enter these markets and expand the variety of services they offer to include hospice.
Research and Development
The Company engages in a continuous program directed toward the development of new services, products and
processes, the improvement of existing services, products and processes, and the development of new and different uses of existing products. The research and development expenditures from continuing operations have not been nor are they expected
to be material.
Government Regulations
Roto-Rooter
Roto-Rooter’s franchising activities are subject to various federal and state franchising laws and regulations,
including the rules and regulations of the Federal Trade Commission (the “FTC”) regarding the offering or sale of franchises. The rules and regulations of the FTC require that Roto-Rooter provide all the prospective franchises with specific
information regarding the franchise program and Roto-Rooter in the form of a detailed franchise offering circular. In addition, a number of states require Roto-Rooter to register its franchise offering prior to offering or selling franchises in
the state. Various state laws also provide for certain rights in favor of franchisees, including (i) limitations on the franchisor’s ability to terminate a franchise except for good cause, (ii) restrictions on the franchisor’s ability to deny
renewal of a franchise, (iii) circumstances under which the franchisor may be required to purchase certain inventory of franchisees when a franchise is terminated or not renewed in violation of such laws, and (iv) provisions relating to
arbitration. Roto-Rooter’s ability to engage in the plumbing repair business is also subject to certain limitations and restrictions imposed by state and local licensing laws and regulations.
2
VITAS
General.
The health care industry and VITAS’ hospice programs are subject to extensive federal and state regulation. VITAS’ hospices are licensed as required under state law as either hospices or home health agencies, or both, depending on the regulatory
requirements of each particular state. In addition, VITAS’ hospices are required to meet certain conditions of participation to be eligible to receive payments as hospices under Medicare and Medicaid programs. All of VITAS’ hospices, other than
those currently in development, are certified for participation as hospices in the Medicare program, and are also eligible to receive payments as hospices from the Medicaid program in each of the states in which VITAS operates. VITAS’ hospices are
subject to periodic survey by governmental authorities or private accrediting entities to assure compliance with state licensing, certification and accreditation requirements.
Medicare
Conditions of Participation. Federal regulations require that a hospice program satisfy certain Conditions of Participation (“COP”) to be certified and receive Medicare payment for the services it provides. Failure to comply with the
conditions of participation may result in sanctions, up to and including decertification from the Medicare program. See “Surveys and Audits”
below.
The Medicare COP for hospice programs include the following:
Governing
Body. Each hospice must have a governing body that assumes full responsibility for the policies and the overall operation of the hospice and for ensuring that all services are provided in a manner consistent with accepted standards of
practice. The governing body must designate one individual who is responsible for the day-to-day management of the hospice.
Medical
Director. Each hospice must have a medical director who is a physician and who assumes responsibility for overseeing the medical component of the hospice’s patient care program.
Direct
Provision of Core Services. Medicare limits those services for which the hospice may use individual independent contractors or contract agencies to provide care to patients. Specifically, substantially all nursing, social work, and
counseling services must be provided directly by hospice employees meeting specific educational and professional standards. During periods of peak patient loads or under extraordinary circumstances, the hospice may be permitted to use contract
workers, but the hospice must agree in writing to maintain professional, financial and administrative responsibility for the services provided by those individuals or entities.
Professional
Management of Non-Core Services. A hospice may arrange to have non-core services such as therapy services, home health aide services, medical supplies or drugs provided by a non-employee or outside entity. If the hospice elects to use an
independent contractor to provide non-core services, however, the hospice must retain professional management responsibility for the arranged services and ensure that the services are furnished in a safe and effective manner by qualified personnel,
and in accordance with the patient’s plan of care.
Plan of
Care. The patient’s attending physician, the medical director or the designated hospice physician, and interdisciplinary team must establish an individualized written plan of care prior to providing care to any hospice patient. The plan
must assess the patient’s needs and identify services to be provided to meet those needs and must be reviewed and updated at specified intervals.
Continuation
of Care. A hospice may not discontinue or reduce care provided to a Medicare beneficiary if the individual becomes unable to pay for that care.
Informed
Consent. The hospice must obtain the informed consent of the hospice patient, or the patient’s legal representative, that specifies the type of care services that may be provided as hospice care, which is palliative and not curative
care. The patient or the patient’s legal representative must also acknowledge that by choosing hospice care, certain other Medicare benefits are waived.
Training.
A hospice must provide ongoing training for its employees.
Quality
Assurance. A hospice must conduct ongoing and comprehensive self-assessments of the quality and appropriateness of care it provides and that its contractors provide under arrangements to hospice patients.
3
Interdisciplinary
Team. A hospice must designate an interdisciplinary team to provide or supervise hospice care services. The interdisciplinary team develops and updates plans of care, and establishes policies governing the day-to-day provision of hospice
services. The team must include at least a physician, registered nurse, social worker and spiritual or other counselor. A registered nurse must be designated to coordinate the plan of care.
Volunteers.
Hospice programs are required to recruit and train volunteers to provide patient care services or administrative services. Volunteer services must be provided in an amount equal to at least five percent of the total patient care hours provided by
all paid hospice employees and contract staff.
Licensure.
Each hospice and all hospice personnel must be licensed, certified or registered in accordance with applicable federal, state and local laws and regulations.
Central
Clinical Records. Hospice programs must maintain clinical records for each hospice patient that are organized in such a way that they may be easily retrieved. The clinical records must be complete and accurate and protected against loss,
destruction and unauthorized use.
Surveys
and Audits. Hospice programs are subject to periodic survey by federal and state regulatory authorities and private accrediting entities to ensure compliance with applicable licensing and certification requirements and accreditation
standards. Regulators conduct periodic surveys of hospice programs and provide reports containing statements of deficiencies for alleged failure to comply with various regulatory requirements. Survey reports and statements of deficiencies are
common in the healthcare industry. In most cases, the hospice program and regulatory authorities will agree upon any steps to be taken to bring the hospice into compliance with applicable regulatory requirements. In some cases, however, a state
or federal regulatory authority may take a number of adverse actions against a hospice program, including the imposition of fines, temporary suspension of admission of new patients to the hospice’s service or, in extreme circumstances,
decertification from participation in the Medicare or Medicaid programs or revocation of the hospice’s license.
From time to time VITAS receives survey reports containing statements of deficiencies. VITAS reviews such reports
and takes appropriate corrective action. VITAS believes that its hospices are in material compliance with applicable licensure and certification requirements. If a VITAS hospice were found to be out of compliance and actions were taken against a
VITAS hospice, they could materially adversely affect the hospice’s ability to continue to operate, to provide certain services and to participate in the Medicare and Medicaid programs, which could materially adversely affect VITAS.
Billing
Audits/ Claims Reviews. The Medicare program and its Medicare Administrative Contractors and other payors periodically conduct pre-payment or post-payment reviews and other reviews and audits of health care claims, including hospice
claims. There is pressure from state and federal governments and other payors to scrutinize health care claims to determine their validity and appropriateness. In order to conduct these reviews, the payor requests documentation from VITAS and
then reviews that documentation to determine compliance with applicable rules and regulations, including the eligibility of patients to receive hospice benefits, the appropriateness of the care provided to those patients and the documentation of
that care. VITAS’ claims have been subject to review and audit. We make appropriate provisions in our accounting records to reduce our revenue for anticipated denial of payment related to these audits and reviews. We believe our hospice programs
comply with all payor requirements at the time of billing. However, we cannot predict whether future billing reviews or similar audits by payors will result in material denials or reductions in revenue.
Corporate
Integrity Agreement. VITAS and certain of its subsidiaries entered into a Corporate Integrity Agreement (“CIA”) with the Office of the Inspector General (“OIG”) on October 30, 2017 in connection with the settlement of a False Claims Act
Case. The CIA formalizes various aspects of VITAS’ already existing Compliance Program and contains requirements designed to document ongoing compliance with federal healthcare program requirements. It has a term of five years during which it
imposes monitoring, reporting, certification, oversight, screening and training obligations, certain of which have previously been implemented by VITAS. It also requires VITAS to engage an Independent Review Organization to perform auditing and
review functions and to prepare reports regarding compliance with federal healthcare programs. In the event of breach of the CIA, VITAS could become liable for payment of stipulated penalties or could be excluded from participation in federal
healthcare programs.
Certificate
of Need Laws and Other Restrictions. Some states, including Florida, have certificate of need or similar health planning laws that apply to hospice care providers. These states may require some form of state agency review or approval
prior to opening a new hospice program, to adding or expanding hospice services, to undertaking significant capital expenditures or under other specified circumstances. Approval under these certificate of need laws is generally conditioned on the
showing of a demonstrable need for services in the community. VITAS may seek to develop, acquire or expand hospice programs in states having certificate of need laws. To the extent that state agencies require VITAS to obtain a certificate of need
or other similar approvals to expand services at existing hospice programs or to make acquisitions or develop hospice programs in new or existing geographic markets, VITAS’ plans could be adversely affected by a failure to obtain such certificate
or approval. In addition, competitors may seek administratively or judicially to challenge such an approval or proposed approval by the state agency. Such a challenge, whether or not ultimately successful, could adversely affect VITAS.
4
Limitations
on For-Profit Ownership. A few states have laws that restrict the development and expansion of for-profit hospice programs. For example, in New York, a hospice generally cannot be owned by a corporation that has another corporation as a
stockholder. These types of restrictions could affect VITAS’ ability to expand into New York, or in other jurisdictions with similar restrictions.
Limits on
the Acquisition or Conversion of Non-Profit Health Care Organizations. A number of states have enacted laws that restrict the ability of for-profit entities to acquire or otherwise assume the operations of a non-profit health care
provider. Some states may require government review, public hearings, and/or government approval of transactions in which a for-profit entity proposes to purchase certain non-profit healthcare organizations. Heightened scrutiny of these
transactions may significantly increase the costs associated with future acquisitions of non-profit hospice programs in some states, otherwise increase the difficulty in completing those acquisitions or prevent them entirely. VITAS cannot assure
that it will not encounter regulatory or governmental obstacles in connection with any proposed acquisition of non-profit hospice programs in the future.
Professional
Licensure and Participation Agreements. Many hospice employees are subject to federal and state laws and regulations governing the ethics and practice of their profession, including physicians, physical, speech and occupational
therapists, social workers, home health aides, pharmacists and nurses. In addition, those professionals who are eligible to participate in the Medicare, Medicaid or other federal health care programs as individuals must not have been excluded from
participation in those programs at any time.
State
Licensure of Hospice. Each of VITAS’ hospices must be licensed in the state in which it operates. State licensure rules and regulations require that VITAS’ hospices maintain certain standards and meet certain requirements, which may vary
from state to state. VITAS believes that its hospices are in material compliance with applicable licensure requirements. If a VITAS hospice were found to be out of compliance and actions were taken against a VITAS hospice, they could materially
adversely affect the hospice’s ability to continue to operate, to provide certain services and to participate in the Medicare and Medicaid programs, which could materially adversely affect VITAS.
Overview
of Government Payments—General. Over 95% of VITAS’ revenue consisted of payments from the Medicare and Medicaid programs. Such payments are made primarily on a “per diem” basis. Under the per diem reimbursement methodology, VITAS is
essentially at risk for the cost of eligible services provided to hospice patients. Profitability is therefore largely dependent upon VITAS’ ability to manage the costs of providing hospice services to patients. Increases in operating costs, such
as labor and supply costs that are subject to inflation and other increases, without a compensating increase in Medicare and Medicaid rates, could have a material adverse effect on VITAS’ business in the future. The Medicare and Medicaid programs
are increasing pressure to control health care costs and to decrease or limit increases in reimbursement rates for health care services. As with most government programs, the Medicare and Medicaid programs are subject to statutory and regulatory
changes, possible retroactive and prospective rate and payment adjustments, administrative rulings, freezes and funding reductions, all of which may adversely affect the level of program payments and could have a material adverse effect on VITAS’
business. VITAS’ levels of revenues and profitability are subject to the effect of legislative and regulatory changes, including possible reductions in coverage or payment rates, or changes in methods of payment, by the Medicare and Medicaid
programs.
Overview of Government Payments – Medicare
Medicare
Eligibility Criteria. To receive Medicare payment for hospice services, the hospice medical director and, if the patient has one, the patient’s attending physician, must certify and describe in a brief narrative that the patient has a
life expectancy of six months or less if the illness runs its normal course. This determination is made based on the physician’s clinical judgment. Due to the uncertainty of such prognoses, however, it is likely and expected that some percentage
of hospice patients will not die within six months of entering a hospice program. The Medicare program (among other third-party payers) recognizes that terminal illnesses often do not follow an entirely predictable course, and therefore the
hospice benefit remains available to beneficiaries so long as the hospice physician or the patient’s attending physician continues to certify that the patient’s life expectancy remains six months or less and the patient or patient’s legal guardian,
continues to maintain the hospice election. Specifically, the Medicare hospice benefit provides for two initial 90-day benefit periods followed by an unlimited number of 60-day periods. In order to qualify for hospice care, a Medicare beneficiary
must elect hospice care and waive any right to other Medicare benefits related to his or her terminal illness. A Medicare beneficiary may revoke his or her election of the Medicare hospice benefit at any time and resume receiving regular Medicare
benefits. The patient may elect the hospice benefit again at a later date so long as he or she remains eligible. The Medicare program, however, has reaffirmed that Medicare hospice beneficiaries are not limited to six months of coverage and
that there is no limit on how long a Medicare beneficiary can continue to receive hospice benefits and services, provided that the beneficiary continues to meet the eligibility criteria under the Medicare hospice program.
5
Levels of
Care. Medicare pays for hospice services on a prospective payment system basis under which VITAS receives an established payment rate for each day that it provides hospice services to a Medicare beneficiary. These rates are subject to
annual adjustments for inflation and vary based upon the geographic location where the services are provided. The rate VITAS receives depends on which level of care is being provided to the beneficiary.
There are four levels of care and related reimbursement within the Medicare Hospice Benefit. These levels of care are Routine Home
Care, Continuous Care, Inpatient Care and Respite Care. Medicare hospice providers are required under Medicare’s Conditions of Participation and their regulations to provide all four levels of care, available on a 24/7 basis, when appropriate.
Vitas, as required under Medicare’s Conditions of Participation and their regulations, has the ability to provide all levels of care
to its patients. The actual level of care a patient receives on any given day is based upon the clinical needs of the patient.
Routine Home Care. The routine home care rate is paid for each day that a patient is in a hospice program and is not receiving one of the other categories of hospice care. The routine home care rate is a two-tiered rate, with a
higher rate for the first 60 days of a hospice patient’s care and a lower rate for days 61 and after. In addition there is a Service Intensity Add-on payment which covers direct home care visits conducted by a registered nurse or social worker in
the last seven days of a hospice patient’s life, reimbursed up to four hours per day in fifteen minute increments at the continuous care rate.
General Inpatient Care. The general inpatient care rate is paid when a patient requires inpatient services for a short period for pain control or symptom management which cannot be managed in other settings. General inpatient
care services must be provided in a Medicare or Medicaid certified hospital or long-term care facility or at a freestanding inpatient hospice facility with the required registered nurse staffing.
Continuous Home Care. Continuous home care, which VITAS refers to as “Intensive Comfort Care,” is provided to patients while at home, during periods of crisis when intensive monitoring and care, primarily nursing care, is
required in order to achieve palliation or management of acute medical symptoms. Continuous home care requires a minimum of 8 hours of care within a 24-hour day, which begins and ends at midnight. The care must be predominantly nursing care
provided by either a registered nurse or licensed practical nurse. While the published Medicare continuous home care rates are daily rates, Medicare actually pays for continuous home care in fifteen minute increments. This fifteen minute rate is
calculated by dividing the daily rate by 96.
Respite Care. Respite care permits a hospice patient to receive services on an inpatient basis for a short period of time in order to provide relief for the patient’s family or other caregivers from the demands of caring for the
patient. A hospice can receive payment for respite care for a given patient for up to five consecutive days at a time, after which respite care is reimbursed at the routine home care rate.
Medicare
Payment for Physician Services. Payment for direct patient care physician services delivered by hospice physicians is billed separately by the hospice to the Medicare Administrative Contractors and paid at the lesser of the actual charge
or the Medicare allowable charge for these services. This payment is in addition to the per diem rates VITAS receives for hospice care. Payment for hospice physicians’ administrative and general supervisory activities is included in the daily
rates discussed above. Payments for attending physician professional services (other than services furnished by hospice physicians) are not paid to the hospice, but rather are paid directly to the attending physician by the Medicare Administrative
Contractors. For fiscal 2018, less than 2% of VITAS’ net revenue was attributable to physician services.
Medicare
Limits on Hospice Care Payments. Medicare payments for hospice services are subject to two additional limits or “caps”. Each of VITAS’ hospice programs is separately subject to both of these “caps”. Both of these “caps” are determined
on an annual basis for the period running from November 1 through October 31 of each year.
First, under a Medicare rule known as the “80-20” rule applicable to the Medicare inpatient services, if the
number of inpatient care days furnished by a hospice to Medicare beneficiaries exceeds 20% of the total days of hospice care furnished by such hospice to Medicare beneficiaries, Medicare payments to the hospice for inpatient care days exceeding the
cap are reduced to the routine home care rate.
Second, Medicare payments to a hospice are also subject to a separate cap based on overall average payments per
admission. Any payments exceeding this overall hospice cap must be refunded by the hospice. This cap was set at $28,689.04 per admission for the twelve-month period ended on October 31, 2018, and is adjusted annually to account for inflation.
VITAS’ hospices may be subject to future payment reductions or recoupments as the result of this cap.
6
Medicare
Managed Care Programs. The Medicare program has entered into contracts with managed care companies to provide managed care benefits to Medicare beneficiaries who elect to participate in managed care programs. These managed care programs
are commonly referred to as Medicare HMOs, Medicare Advantage or Medicare risk products. VITAS provides hospice care to Medicare beneficiaries who participate in these managed care programs, and VITAS is paid for services provided to these
beneficiaries in the same way and at the same rates as those of other Medicare beneficiaries who are not in a Medicare managed care program. Under current Medicare policy, Medicare pays the hospice directly for services provided to these managed
care program participants.
Overview of Government Payments – Medicaid
Medicaid
Coverage and Reimbursements. State Medicaid programs are another source of VITAS’ net patient revenue. Medicaid is a state-administered program financed by state funds and federal funds to provide medical assistance to the indigent and
certain other eligible persons. For those states that elect to provide a hospice benefit, the Medicaid program is required to pay the hospice at rates at least equal to the rates provided under Medicare and calculated using the same methodology.
States maintain flexibility to establish their own hospice election procedures and to limit the number and duration of benefit periods for which they will pay for hospice services. Reimbursement from state Medicaid programs in 2018 accounted for
4% of VITAS’ revenues.
Nursing
Home Residents. For VITAS’ patients who receive nursing home care under a state Medicaid program and who elect hospice care under Medicare or Medicaid, VITAS contracts with nursing homes for the nursing homes’ provision of room and board
services. In addition to the applicable Medicare or Medicaid hospice daily or hourly rate, the state generally must pay VITAS an amount equal to at least 95% of the Medicaid daily nursing home rate for room and board services furnished to the
patient by the nursing home. Under VITAS’ standard nursing home contracts, VITAS pays the nursing home for these room and board services at the Medicaid daily nursing home rate.
Adjustments
to Medicare and Medicaid Payment Rates. Payment rates under the Medicare and Medicaid programs are adjusted annually for inflation based upon the Hospital Market Basket Index and the Consumer Price Index; however, the adjustments have
historically been less than actual inflation. These base rates are further modified by the Hospice Wage Index to reflect local differences in wages according to the revised wage index. Effective April 1, 2013, the Federal government implemented a
2% reimbursement cut for all Medicare programs, including hospice. It is possible that there will be further modifications to the rate structure under which the Medicare or Medicaid programs pay for hospice care services; the current cut is
scheduled to last through the Federal Government’s fiscal year 2027. Any future reductions in the rate of increase or an actual decrease in Medicare and Medicaid payments may have an adverse impact on VITAS’ net patient service revenue and
profitability. On July 31, 2015, CMS published the final full year 2016 hospice wage index providing guidance to hospice providers regarding changes to hospice reimbursement for full year 2016. Effective January 1, 2016 the routine home care rate
changed to reflect a two-tiered rate, with a higher rate for the first 60 days of a hospice patient’s care, and a lower rate for days 61 and after. In addition, the full year 2016 wage rule provides reimbursement of a Service Intensity Add-on
payment. This Service Intensity Add-on payment also went into effect on January 1, 2016, and applies to direct home care visits conducted by a registered nurse or social worker in the last seven days of a hospice patient’s life while on the
routine home care level of care.
Managed
Medicaid. In some states in which VITAS operates, the state legislatures have established managed Medicaid programs. Managed Medicaid programs outsource the process of eligibility determination and payment by Medicaid to private insurance
companies. In some states, participants are required to choose a managed Medicaid provider. VITAS negotiates participant eligibility and documentation requirements, as well as hospice pay rates with each managed Medicaid provider. These
requirements and pay rates may or may not align with the applicable Medicare hospice regulations and pay rates.
Other
Healthcare Regulations
Federal
and State Anti-Kickback Laws and Safe Harbor Provisions. The federal Anti-Kickback Law makes it a felony to knowingly and willingly offer, pay, solicit or receive any form of remuneration in exchange for referring, recommending,
arranging, purchasing, leasing or ordering items or services covered by a federal health care program including Medicare or Medicaid. The Anti-Kickback Law applies regardless of whether the remuneration is provided directly or indirectly, in cash
or in kind. Although the Anti-Kickback statute does not prohibit all financial transactions or relationships that providers of healthcare items or services may have with each other, interpretations of the law have been very broad. Under current
law, courts and federal regulatory authorities have stated that this law is violated if even one purpose (as opposed to the sole or primary purpose) of the arrangement is to induce referrals.
7
Violations of the Anti-Kickback Law carry potentially severe penalties including imprisonment of up to ten years,
criminal fines of up to $100,000 per act, civil money penalties of up to $100,000 per act, and additional damages of up to three times the amounts claimed or remuneration offered or paid. Federal law also authorizes exclusion from the Medicare and
Medicaid programs for violations of the Anti-Kickback Law.
The Anti-Kickback Law contains several statutory exceptions to the broad prohibition. In addition, Congress
authorized the OIG to publish numerous “safe harbors” that exempt some practices from enforcement action under the Anti-Kickback Law and related laws. These statutory exceptions and regulatory safe harbors protect various bona fide employment
relationships, contracts for the rental of space or equipment, personal service arrangements, and management contracts, among other things, provided that certain conditions set forth in the statute or regulations are satisfied. The safe harbor
regulations, however, do not comprehensively describe all lawful relationships between healthcare providers and referral sources, and the failure of an arrangement to satisfy all of the requirements of a particular safe harbor does not mean that
the arrangement is unlawful. Failure to comply with the safe harbor provisions, however, may mean that the arrangement will be subject to scrutiny.
Many states, including states where VITAS does business, have adopted similar prohibitions against payments that
are intended to induce referrals of patients, regardless of the source of payment. Some of these state laws lack explicit “safe harbors” that may be available under federal law. Sanctions under these state anti-kickback laws may include civil
money penalties, license suspension or revocation, exclusion from the Medicare or Medicaid programs, and criminal fines or imprisonment. Little precedent exists regarding the interpretation or enforcement of these statutes.
VITAS is required under the Medicare conditions of participation and some state licensing laws to contract with
numerous healthcare providers and practitioners, including physicians, hospitals and nursing homes, and to arrange for these individuals or entities to provide services to VITAS’ patients. In addition, VITAS has contracts with other suppliers,
including pharmacies, ambulance services and medical equipment companies. Some of these individuals or entities may refer, or be in a position to refer, patients to VITAS, and VITAS may refer, or be in a position to refer, patients to these
individuals or entities. These arrangements may not qualify for a safe harbor. VITAS from time to time seeks guidance from regulatory counsel as to the changing and evolving interpretations and the potential applicability of these anti-kickback
laws to its programs, and in response thereto, takes such actions as it deems appropriate. The Company generally believes that VITAS’ contracts and arrangements with providers, practitioners and suppliers do not violate applicable anti-kickback
laws. However, the Company cannot assure that such laws will ultimately be interpreted in a manner consistent with VITAS’ practices.
HIPAA
Anti-Fraud Provisions. HIPAA includes several revisions to existing health care fraud laws by permitting the imposition of civil monetary penalties in cases involving violations of the anti-kickback statute or contracting with excluded
providers. In addition, HIPAA created statutes making it a federal felony to engage in fraud, theft, embezzlement, or the making of false statements with respect to healthcare benefit programs, which include private, as well as government
programs. In addition, federal enforcement officials have the ability to exclude from the Medicare and Medicaid programs any investors, officers and managing employees associated with business entities that have committed healthcare fraud, even if
the investor, officer or employee had no actual knowledge of the fraud.
OIG Fraud
Alerts, Advisory Opinions and Other Program Guidance. The OIG identifies and seeks to eliminate fraud, abuse and waste in HHS programs. The OIG conducts audits, investigations and inspections and issues public pronouncements identifying
practices that may be subject to heightened scrutiny. There have been a number of hospice related audits and reviews conducted. These reviews and recommendations have included:
|
•
|
Ensuring that Medicare hospice eligibility determinations are made in accordance with the Medicare regulations; and
|
|
•
|
Revising the annual cap on hospice benefits to better reflect the cost of care provided.
|
From time to time, various federal and state agencies, such as HHS and the OIG, issue a variety of pronouncements,
including fraud alerts, the OIG’s Annual Work Plan and other reports, identifying practices that may be subject to heightened governmental scrutiny. The Company cannot predict what, if any, changes may be implemented in coverage, reimbursement, or
enforcement policies as a result of these OIG reviews and recommendations.
On October 30, 2017, the Company entered into a settlement agreement (the “Settlement Agreement”) to resolve civil
litigation under the False Claims Act brought by the United States Department of Justice (“DOJ”) on behalf of the OIG and various relators concerning VITAS, filed in the U.S. District Court of the Western District of Missouri (the “2013 Action”).
The Company denied any violation of law and agreed to settlement without admission of wrongdoing.
8
In connection with the settlement VITAS and certain of its subsidiaries entered into a corporate integrity
agreement (“CIA”) on October 30, 2017. The CIA formalizes various aspects of VITAS’ already existing Compliance Program and contains requirements designed to document compliance with federal healthcare program requirements. It has a term of five
years during which it imposes monitoring, reporting, certification, oversight, screening and training obligations, certain of which had previously been implemented by VITAS. It also requires VITAS to engage an Independent Review Organization to
perform audit and review functions and to prepare reports regarding compliance with federal healthcare programs. In the event of breach of the CIA, VITAS could become liable for payment of stipulated penalties or could be excluded from
participation in federal healthcare programs.
Under the Settlement Agreement, the United States agreed to release the Company, VITAS, and its hospice operation
subsidiaries from any civil or administrative monetary liability relating to any patients’ disputed terminal medical prognosis of six months or less; a lack of medical necessity for billed Continuous Home Care, General Inpatient Care, or Respite
Care levels of hospice care; or that the claims for those levels of hospice care were not eligible for payment for any other reason. The OIG agreed, conditioned on the Company’s full payment and in consideration of VITAS’ obligations under the
CIA, to release its permissive exclusion rights and refrain from instituting any administrative action seeking to exclude the Company, VITAS, and its affiliates from participating in Medicare, Medicaid, or other federal healthcare programs in this
regard.
Under the Settlement Agreement, the Company paid $75 million plus interest, plus certain attorney fees and
expenses of qui tam relators. The Company made these payments during the fourth quarter of 2017. The Company previously recorded a $90 million loss reserve ($55.8 million after-tax) related to the Settlement Agreement, and associated costs in the
second quarter of 2017. During the fourth quarter of 2017, approximately $5.5 million ($3.4 million after-tax) recorded as part of the $90 million was reversed as relator attorney' fees were less than originally estimated
The costs incurred related to U.S. v. VITAS and related regulatory matters, exclusive of the settlement were, $5.2 million and
$5.3 million for 2017, and 2016 respectively.
Federal
False Claims Acts. The federal law includes several criminal and civil false claims provisions, which provide that knowingly submitting claims for items or services that were not provided as represented may result in the imposition of
multiple damages, administrative civil money penalties, criminal fines, imprisonment, and/or exclusion from participation in federally funded healthcare programs, including Medicare and Medicaid. In addition, the OIG may impose extensive and
costly corporate integrity requirements upon a healthcare provider that is the subject of a false claims judgment or settlement. These requirements may include the creation of a formal compliance program, the appointment of a government monitor,
and the imposition of annual reporting requirements and audits conducted by an independent review organization to monitor compliance with the terms of the agreement and relevant laws and regulations. The Affordable Care Act also contains
provisions aimed at strengthening fraud and abuse enforcement.
As described above, VITAS and certain of its subsidiaries entered into a CIA with the OIG on October 30, 2017 in
connection with the settlement of a False Claims Act Case In the event of breach of the CIA, VITAS could become liable for payment of stipulated penalties or could be excluded from participation in federal healthcare programs.
The Civil False Claims Act prohibits the known filing of a false claim or the known use of false statements to
obtain payments. Penalties for violations include fines ranging from $5,500 to $11,000 (as adjusted for inflation), plus treble damages, for each claim filed. Provisions in the Civil False Claims Act also permit individuals to bring actions
against individuals or businesses in the name of the government as “qui tam” relators. If a qui tam relator’s claim is successful, he
or she is entitled to share the government’s recovery.
Both direct enforcement activity by the government and qui tam actions have increased significantly and have increased the risk that a healthcare company may have to defend a false claims action, pay fines or be excluded from the Medicare and/or
Medicaid programs as a result of an investigation arising out of this type of an action. Because of the complexity of the government regulations applicable to the healthcare industry, the Company cannot assure that VITAS will not be the subject of
other actions under the False Claims Act.
State
False Claims Laws. Several states in which VITAS currently operates have adopted state false claims laws that mirror to some degree the federal false claims laws. While these statutes vary in scope and effect, the penalties for violating
these false claims laws include administrative, civil and/or criminal fines and penalties, imprisonment, and the imposition of multiple damages.
9
The Stark
Law and State Physician Self-Referral Laws. Section 1877 of the Social Security Act, commonly known as the “Stark Law”, prohibits physicians from referring Medicare or Medicaid patients for “designated health services” to entities in
which they hold an ownership or investment interest or with whom they have a compensation arrangement, subject to a number of statutory and regulatory exceptions. Penalties for violating the Stark Law are severe and include:
|
•
|
Denial of payment;
|
|
•
|
Civil monetary penalties of $15,000 per referral or $100,000 for “circumvention schemes;”
|
|
•
|
Assessments equal to 200% of the dollar value of each such service provided; and
|
|
•
|
Exclusion from the Medicare and Medicaid programs.
|
Hospice care itself is not specifically listed as a designated health service; however, certain services that
VITAS provides, or in the future may provide, are among the services identified as designated health services for purposes of the self-referral laws. The Company cannot assure that future regulatory changes will not result in hospice services
becoming subject to the Stark Law’s ownership, investment or compensation prohibitions in the future.
Many states where VITAS operates have laws similar to the Stark Law, but with broader effect because they apply
regardless of the source of payment for care. Penalties similar to those listed above as well as the loss of state licensure may be imposed in the event of a violation of these state self-referral laws. Little precedent exists regarding the
interpretation or enforcement of these statutes.
Civil
Monetary Penalties. The Civil Monetary Penalties Statute provides that civil penalties ranging between $10,000 and $50,000 per claim or act may be imposed on any person or entity that knowingly submits improperly filed claims for federal
health benefits or that offers or makes payment to induce a beneficiary or provider to reduce or limit the use of health care services or to use a particular provider or supplier. Civil monetary penalties may be imposed for violations of the
anti-kickback statute and for the failure to return known overpayments, among other things.
Prohibition
on Employing or Contracting with Excluded Providers. The Social Security Act and federal regulations state that individuals or entities that have been convicted of a criminal offense related to the delivery of an item or service under
Medicare or Medicaid programs or that have been convicted, under state and federal law, of a criminal offense relating to neglect or abuse of residents in connection with the delivery of a healthcare item or service cannot participate in any
federal health care programs, including Medicare and Medicaid. Additionally, individuals and entities convicted of fraud, that have had their licenses revoked or suspended, or that have failed to provide services of adequate quality also may be
excluded from the Medicare and Medicaid programs. Federal regulations prohibit Medicare providers, including hospice programs, from submitting claims for items or services or their related costs if an excluded provider furnished those items or
services. The OIG maintains a list of excluded persons and entities. Nonetheless, it is possible that VITAS might unknowingly bill for services provided by an excluded person or entity with whom it contracts. The penalty for contracting with an
excluded provider may range from civil monetary penalties of $100,000 and damages of up to three times the amount of payment that was inappropriately received.
Corporate
Practice of Medicine and Fee Splitting. Most states have laws that restrict or prohibit anyone other than a licensed physician, including business entities such as corporations, from employing physicians and/or prohibit payments or
fee-splitting arrangements between physicians and corporations or unlicensed individuals. Penalties for violations of corporate practice of medicine and fee-splitting laws vary from state to state, but may include civil or criminal penalties, the
restructuring or termination of the business arrangements between the physician and unlicensed individual or business entity, or even the loss of the physician’s license to practice medicine. These laws vary widely from state to state both in
scope and origin (e.g. statute, regulation, Attorney General opinion, court ruling, agency policy) and in most instances have been subject to only limited interpretation by the courts or regulatory bodies.
VITAS employs or contracts with physicians to provide medical direction and patient care services to its
patients. VITAS has made efforts in those states where certain contracting or fee arrangements are restricted or prohibited to structure those arrangements, including its palliative care offerings, in compliance with the applicable laws and
regulations. Despite these efforts, however, the Company cannot assure that agency officials charged with enforcing these laws will not interpret VITAS’ contracts with employed or independent contractor physicians as violating the relevant laws or
regulations. Future determinations or interpretations by individual states with corporate practice of medicine or fee splitting restrictions may force VITAS to restructure its arrangements with physicians in those locations.
10
Health
Information Practices. There currently are numerous legislative and regulatory initiatives at both the state and federal levels that address patient privacy concerns. In particular, federal regulations issued under the Health Insurance
Portability and Accountability Act of 1996 (“HIPAA”) and the Health Information Technology for Electronic and Clinical Health Act (“HITECH”) require VITAS to protect the privacy and security of patients’ individual health information. HIPAA and
HITECH do not automatically preempt applicable state laws and regulations concerning VITAS’ use, disclosure and maintenance of patient health information, which means that VITAS is subject to a complex regulatory scheme that, in many instances,
requires VITAS to comply with both federal and state laws and regulations. If we are found to have violated these laws, we could be subject to sanctions, fines, damages, and other civil and criminal penalties.
Additional
Federal and State Regulation. Federal and state governments also regulate various aspects of the hospice industry. In particular, VITAS’ operations are subject to federal and state health regulatory laws covering professional services,
the dispensing of drugs and certain types of hospice activities. Some of VITAS’ employees are subject to state laws and regulations governing the ethics and professional practice of medicine, respiratory therapy, pharmacy and nursing.
Compliance
with Health Regulatory Laws. VITAS maintains an internal regulatory compliance review program and from time to time retains regulatory counsel for guidance on compliance matters. The Company cannot assure, however, that VITAS’ practices,
if reviewed, would be found to be in compliance with applicable health regulatory laws, as such laws ultimately may be interpreted, or that any non-compliance with such laws would not have a material adverse effect, including an effect on its brand
reputation, on VITAS.
Environmental Matters
Roto-Rooter’s operations are subject to various federal, state, and local laws and regulations regarding
environmental matters and other aspects of the operation of a sewer and drain cleaning, plumbing, and water restoration services business. For certain other activities, such as septic tank and grease trap pumping, Roto-Rooter is subject to state
and local environmental health and sanitation regulations.
At December 31, 2018, the Company’s accrual for its estimated liability for potential environmental cleanup and
related costs arising from the 1991 sale of DuBois Chemicals Inc. (“DuBois”) amounted to $1.7 million. Of this balance, $901,000 is included in other liabilities and $826,000 is included in other current liabilities. The Company is contingently
liable for additional DuBois-related environmental cleanup and related costs up to a maximum of $14.9 million. On the basis of a continuing evaluation of the Company’s potential liability, and in consultation with the Company’s environmental
attorney, management believes that it is not probable this additional liability will be paid. Accordingly, no provision for this contingent liability has been recorded. Although it is not presently possible to reliably project the timing of
payments related to the Company’s potential liability for environmental costs, management believes that any adjustments to its recorded liability will not materially adversely affect its financial position or results of operations.
The Company, to the best of its knowledge, is currently in compliance in all material respects with the
environmental laws and regulations affecting its operations. Such environmental laws, regulations and enforcement proceedings have not required the Company to make material increases in or modifications to its capital expenditures and they have
not had a material adverse effect on sales or net income. Capital expenditures for the purpose of complying with environmental laws and regulations during 2018 and 2019 with respect to continuing operations are not expected to be material in
amount; there can be no assurance, however, that presently unforeseen legislative enforcement actions will not require additional expenditures.
Employees
On December 31, 2018, the Company had a total of 15,707 employees.
Available Information
The Company’s Internet address is www.chemed.com. The Company’s Annual Report on Form 10-K, quarterly reports on
Form 10-Q, and current reports on Form 8-K, and amendments to those reports filed or furnished pursuant to Section 13(a) or 15(d) of the Exchange Act are electronically available through the SEC (http://www.sec.gov) or the Company’s website as soon
as reasonably practicable after such reports are filed with, or furnished to, the SEC.
Annual reports, press releases, Board Committee charters, Code of Ethics, Corporate governance guidelines and
other printed materials may be obtained from the website or from Chemed Investor Relations without charge by writing to, 255 East Fifth Street, Suite 2600, Cincinnati, Ohio 45202 or by calling 800-2CHEMED or 800-224-3633. The Company intends to
satisfy the disclosure requirement under Item 5.05 of Form 8-K by posting such information on its website.
11
You should carefully consider the risks described below, together with all of the information included in this
Annual Report on Form 10-K, in evaluating us and our Capital Stock. They are not the only ones facing the Company. Other risks and uncertainties not currently known to us or that we deem to be immaterial may also materially and adversely affect
our business, financial condition, or results of operations.
GENERAL
We have incurred debt to finance the operations of the Company.
The Company has debt service obligations that may restrict our operating flexibility. We cannot assure you that
our cash flow from operations will be sufficient to service our debt, which may require us to borrow additional funds, or restructure or otherwise refinance our debt. In addition, the Company has the ability to expand its debt and borrowing
capacity subject to various restrictions and covenants defined by its creditors. The interest rate the Company pays will fluctuate from time to time based upon a number of factors including current LIBOR rates and Company operating performance.
Significant changes in these factors could result in a material change in the Company’s interest expense.
Our ability to repay or to refinance our indebtedness and to pay interest on our indebtedness will depend on our
operating performance, which may be affected by factors beyond our control. These factors could include operating difficulties, increased operating costs, our competitors’ actions and regulatory developments. Our ability to meet our debt service
and other obligations may depend in significant part on the extent to which we successfully implement our business strategy. We cannot assure you that we will be able to implement our strategy fully or that the anticipated results of our strategy
will be realized. Credit market conditions may make it difficult for us to obtain new financing or refinance our current debt on terms and conditions acceptable to us.
If our cash flows and capital resources are insufficient to fund our debt service obligations, we may be forced to
reduce or delay capital expenditures, sell assets, seek additional equity capital or restructure our debt. We cannot assure you that our cash flows and capital resources will be sufficient to make scheduled payments of principal and interest on
our indebtedness in the future or that alternative measures would successfully meet our debt service obligations.
The agreements and instruments governing our outstanding debt contain restrictions and limitations that could
significantly impact our ability to operate our business and adversely affect the price of our Capital Stock.
The operating and financial restrictions and covenants in our instruments of indebtedness restrict our ability to
incur additional debt; issue and sell capital stock of subsidiaries; sell assets; engage in transactions with affiliates; restrict distributions from subsidiaries; incur liens; engage in business other than permitted businesses; engage in
sale/leaseback transactions; engage in mergers or consolidations; make capital expenditures; make guarantees; make investments and acquisitions; enter into operating leases; hedge interest rates; and prepay other debt.
Moreover, if we are unable to meet the terms of the financial covenants or if we breach any of these covenants, a
default could result under one or more of these agreements. A default, if not waived by our lenders, could accelerate repayment of our outstanding indebtedness. If acceleration occurs, we may not be able to repay our debt and it is unlikely that
we would be able to borrow sufficient additional funds to refinance such debt on acceptable terms. In the event of any default under our credit facilities, the lenders thereunder could elect to declare all outstanding borrowings, together with
accrued and unpaid interest and other fees, to be due and payable, and to require us to apply all of our available cash to repay these borrowings, any of which would be an event of default.
We depend on our management team and the loss of their service could have a material adverse effect on our
business, financial condition and results of operations.
Our success depends to a large extent upon the continued services of our executive management team. The loss of
key personnel could have a material adverse effect on our business, financial condition, results of operations and cash flows. Additionally, we cannot assure you that we will be able to attract or retain other skilled personnel in the future.
12
Environmental and safety compliance costs and liabilities could increase our expenses and adversely affect our
financial condition.
Our operations are subject to numerous environmental, health and safety laws and regulations that prohibit or
restrict the discharge of pollutants into the environment and regulate employee exposure to hazardous substance in the workplace. Failure to comply with these laws could subject us to material costs and liabilities, including civil and criminal
fines, costs to cleanup contamination we cause and, in some circumstances, costs to cleanup contamination we discover on our own property but did not cause.
Because we use and generate hazardous materials in some of our operations, we are potentially subject to material
liabilities relating to the cleanup of contamination and personal injury claims. In addition, we have retained certain environmental liabilities in connection with the sale of former businesses. We are currently funding the cleanup of historical
contamination at one of our former properties and contributing to the cleanup of third-party sites as a result of our sale of our former subsidiary DuBois Chemicals Inc. Although we have established a reserve for these liabilities, actual cleanup
costs may exceed our current estimates due to factors beyond our control, such as the discovery of additional contamination or the enforcement of more stringent cleanup requirements. New laws and regulations or their stricter enforcement, the
discovery of presently unknown conditions or the receipt of additional claims for indemnification could require us to incur costs or become the basis for new or increased liabilities including impairment of our brand that could have a material
adverse effect on our business, financial condition and results of operations.
We are subject to certain anti-takeover statutes that might make it more difficult to effect a change in control
of the Company.
We are subject to the anti-takeover provisions of Section 203 of the Delaware General Corporation Law, which
prohibits us from engaging in a “business combination” with an “interested stockholder” for a period of three years after the date of the transaction in which the person became an interested stockholder, unless the business combination is approved
in a prescribed manner. The application of Section 203 could have the effect of delaying or preventing a change of control that could be advantageous to stockholders.
An adverse ruling against us in certain litigation could have an adverse effect on our financial condition and
results of operations.
We are involved in litigation incidental to the conduct of our business currently and from time to time. The
damages claimed against us in some of these cases can be substantial. See the “Legal Proceedings” sections of this 10-K for discussion of particular matters. We cannot assure you that we will prevail in pending cases. Regardless of the outcome,
such litigation is costly to manage, investigate and defend, and the related defense costs, diversion of management’s time and related publicity may adversely affect the conduct of our business and the results of our operations.
ROTO-ROOTER
We face intense competition from numerous, fragmented competitors. If we do not compete effectively, our business
may suffer.
We face intense competition from numerous competitors. The sewer, drain and pipe cleaning, excavation, plumbing
repair and water restoration businesses are highly fragmented, with the bulk of the industries consisting of local and regional competitors. We compete primarily on the basis of advertising, range of services provided, name recognition,
availability of emergency service, speed and quality of customer service, service guarantees and pricing. Our competitors may succeed in developing new or enhanced products and services more successful than ours and in marketing and selling
existing and new products and services better than we do. In addition, new competitors may emerge. We cannot make any assurances that we will continue to be able to compete successfully with any of these companies.
Our operations are subject to numerous laws and regulations, exposing us to potential claims and compliance costs
that could adversely affect our business.
We are subject to federal, state and local laws and regulations relating to franchising, insurance and other
aspects of our business. These are discussed in greater detail under “Government Regulations” in the Description of Business section hereof. If we fail to comply with existing or future laws and regulations, we may be subject to governmental or
judicial fines and sanctions. Our franchising activities are subject to various federal and state franchising laws and regulations, including the rules and regulations of the FTC regarding the offering or sale of franchises. These rules and
regulations require us to provide all of our prospective franchisees with specific information regarding us and our franchise program in the form of a detailed franchise offering circular. In addition, a number of states require us to register our
franchise offering prior to offering or selling franchises in such states. Various state laws also provide for certain rights in favor of franchisees, including (i) limitations on the franchisor’s ability to terminate a franchise except for good
cause, (ii) restrictions on the franchisor’s ability to deny renewal of a franchise, (iii) circumstances under which the franchisor may be required to purchase certain inventory of franchisees when a franchise is terminated or not renewed in
violation of such laws and (iv) provisions relating to arbitration. The ability to engage in the plumbing repair business is also subject to certain limitations and restrictions imposed by the state and local licensing laws and regulations. We
cannot predict what legislation or regulations affecting our business will be enacted in the future, how existing or future laws or regulations will be enforced, administered and interpreted, or the amount of future expenditures that may be
required to comply with these laws or regulations. Compliance costs associated with governmental regulations could have a material adverse effect on our business, financial condition and results of operations.
13
Roto-Rooter’s loss of key management personnel or its inability to hire and retain skilled employees could
adversely affect its business, financial condition and results of operations.
Roto-Rooter’s future success significantly depends upon the continued service of its senior management personnel.
The loss of one or more of Roto-Rooter’s key senior management personnel or its inability to hire and retain new skilled employees could negatively impact its ability to maintain or increase customer calls and jobs, a key aspect of its growth
strategy, and could adversely affect its future operating results.
Competition for skilled employees, particularly licensed plumbers, is intense, and the process of locating and
recruiting skilled employees with the combination of qualifications and attributes required to adequately perform plumbing duties can be difficult and lengthy. We cannot assure you that Roto-Rooter will be successful in attracting, retaining or
training highly skilled personnel. Roto-Rooter’s business could be disrupted and its growth and profitability negatively impacted if it is unable to attract and retain skilled employees.
Cybersecurity
In the normal course of business, our information technology systems hold sensitive customer information including
names, addresses and partial credit card information. Additionally, we utilize those same systems to perform our day-to-day activities, such as receiving customer calls, dispatching technicians to jobs and maintaining an accurate record of all
transactions. We have not experienced any known attacks on our information technology systems that compromised customer data or the Company’s proprietary data. We maintain our information technology systems with safeguard protection against
cyber-attacks including intrusion detection and protection services, firewalls and virus detection software. Additionally, on a quarterly basis, we test our information technology systems by using cyber-scanning software and other methods to learn
how a successful attack may be made. We remedy any issues encountered during these tests. We have developed and tested a response plan in the event of a successful attack and we maintain commercial insurance related to a cyber-attack. However,
these safeguards do not ensure that a significant cyber-attack could not occur. A successful attack on our information technology systems could have significant consequences to the business including liability for compromised customer information
and business interruption.
We are regularly the target of attempted cyber and other security threats and must continuously monitor and
develop our information technology networks and infrastructure to prevent, detect, address and mitigate the risk of unauthorized access, misuse, computer viruses and other events that could have a security impact. Insider or employee cyber and
security threats are increasingly a concern for all large companies, including ours.
Roto-Rooter’s success is highly dependent on its brand reputation
Roto-Rooter’s national reputation and brand image for performing necessary, high quality services in a timely
manner is critical to Roto-Rooter’s continued success. Adverse publicity, litigation or on-line negative reviews focused on the Roto-Rooter brand could negatively impact Roto-Rooter’s national reputation resulting in decreased future demand for
Roto-Rooter branded services. Roto-Rooter maintains a reputation management risk program, however, a loss of brand reputation at Roto-Rooter could adversely affect consumer willingness to use our service and thus, adversely affect our future
operating performance.
14
VITAS
VITAS is highly dependent on payments from Medicare and Medicaid. If there are changes in the rate or methods
governing these payments, VITAS’ net patient service revenue and profits could materially decline.
In excess of 95% of VITAS’ net patient service revenue consists of payments from the Medicare and Medicaid
programs. Such payments are made primarily on a “per diem” basis, subject to annual reimbursement caps. Because VITAS receives a per diem fee to provide eligible services to all patients, VITAS’ profitability is largely dependent upon its ability
to manage the costs of providing hospice services to patients. Increases in operating costs, such as labor and supply costs that are subject to inflation, without a compensating increase in Medicare and Medicaid rates, could have a material
adverse effect on VITAS’ business in the future. Medicare and Medicaid currently adjust the various hospice payment rates annually based primarily on the increase or decrease of the hospital wage index basket, regionally adjusted. However, the
increases may be less than actual inflation. VITAS’ profitability could be negatively impacted if this adjustment were eliminated or reduced, or if VITAS’ costs of providing hospice services increased more than the annual adjustment. In addition,
cost pressures resulting from shorter patient lengths of stay and the use of more expensive forms of palliative care, including drugs and drug delivery systems, could negatively impact VITAS’ profitability. Many payors are increasing pressure to
control health care costs. The U.S. federal budget remains in flux, which could, among other things, cut Medicare payments to providers. The Medicare program is frequently mentioned as a target for spending cuts. The full impact on our business
of any future cuts in Medicare or other programs is uncertain. In addition, both public and private payors are increasing pressure to decrease, or limit increases in, reimbursement rates for health care services. VITAS’ levels of revenue and
profitability will be subject to the effect of possible reductions in coverage or payment rates by third-party payors, including payment rates from Medicare and Medicaid.
Each state that maintains a Medicaid program has the option to provide reimbursement for hospice services at
reimbursement rates generally required to be at least as much as Medicare rates. All states in which VITAS operates cover Medicaid hospice services; however, we cannot assure you that the states in which VITAS is presently operating or states into
which VITAS could expand operations will continue to cover Medicaid hospice services. In addition, the Medicare and Medicaid programs are subject to statutory and regulatory changes, retroactive and prospective rate and payment adjustments,
administrative rulings, freezes and funding reductions, all of which may adversely affect the level of program payments and could have a material adverse effect on VITAS’ business. We cannot assure that Medicare and/or Medicaid payments to
hospices will not decrease. Reductions in amounts paid by government programs for services or changes in methods or regulations governing payments could cause VITAS’ net patient service revenue and profits to materially decline.
Approximately 20% of VITAS’ days of care are provided to patients who reside in nursing homes. Changes in the laws
and regulations regarding payments for hospice services and “room and board” provided to VITAS’ hospice patients residing in nursing homes could reduce its net patient service revenue and profitability.
For VITAS’ hospice patients receiving nursing home care under certain state Medicaid programs who elect hospice
care under Medicare and Medicaid, the state generally must pay VITAS, in addition to the applicable Medicare or Medicaid hospice per diem rate, an amount equal to at least 95% of the Medicaid per diem nursing home rate for “room and board”
furnished to the patient by the nursing home. VITAS contracts with various nursing homes for the nursing homes’ provision of certain “room and board” services that the nursing homes would otherwise provide Medicaid nursing home patients. VITAS
bills and collects from the applicable state Medicaid program an amount equal to approximately 95% of the amount that would otherwise have been paid directly to the nursing home under the state’s Medicaid plan. Under VITAS’ standard nursing home
contracts, it pays the nursing home for these “room and board” services at approximately 100% of the Medicaid per diem nursing home rate.
The reduction or elimination of Medicare and Medicaid payments for hospice patients residing in nursing homes
would reduce VITAS’ net patient service revenue and profitability. In addition, changes in the way nursing homes are reimbursed for “room and board” services provided to hospice patients residing in nursing homes could affect VITAS’ ability to
serve patients in nursing homes.
If VITAS is unable to maintain relationships with existing patient referral sources or to establish new referral
sources, VITAS’ growth and profitability could be adversely affected.
VITAS’ success is heavily dependent on referrals from physicians, long-term care facilities, hospitals and other
institutional health care providers, managed care companies, insurance companies and other patient referral sources in the communities that its hospice locations serve, as well as on its ability to maintain good relations with these referral
sources. VITAS’ referral sources may refer their patients to other hospice care providers or not to a hospice provider at all. VITAS’ growth and profitability depend significantly on its ability to establish and maintain close working
relationships with these patient referral sources and to increase awareness and acceptance of hospice care by its referral sources and their patients. We cannot assure that VITAS will be able to maintain its existing relationships or that it will
be able to develop and maintain new relationships in existing or new markets. VITAS’ loss of existing relationships or its failure to develop new relationships could adversely affect its ability to expand or maintain its operations and operate
profitably. Moreover, we cannot assure you that awareness or acceptance of hospice care will increase or remain at current levels.
15
VITAS operates in an industry that is subject to extensive government regulation and claims reviews, and changes
in law and regulatory interpretations could reduce its net patient service revenue and profitability and adversely affect its financial condition and results of operations.
The healthcare industry is subject to extensive federal, state and local laws, rules and regulations relating to,
among others:
|
•
|
Payment for services;
|
|
•
|
Conduct of
operations, including fraud and abuse, anti-kickback prohibitions, self-referral prohibitions and false claims;
|
|
•
|
Privacy and security of medical records;
|
|
•
|
Employment practices; and
|
|
•
|
Various state approval requirements, such as facility and professional licensure, certificate
of need, compliance surveys and other certification or recertification requirements.
|
Changes in these laws, rules and regulations or their interpretations could reduce VITAS’ net patient service
revenue and profitability. VITAS’ ability to comply with such regulations is a key factor in determining the success of its business. See the “Government Regulations” section of this 10-K for a greater description of these matters.
Fraud and
Abuse Laws. VITAS contracts with a significant number of health care providers and practitioners, including physicians, hospitals and nursing homes and arranges for these entities to provide services to VITAS’ patients. Some of these
health care providers and practitioners may refer, or be in a position to refer, patients to VITAS (or VITAS may refer patients to them). These arrangements may not qualify for a safe harbor. VITAS from time to time seeks guidance from regulatory
counsel as to the changing and evolving interpretations and the potential applicability of the Anti-Kickback Law to its programs, and in response thereto, takes such actions as it deems appropriate. VITAS generally believes that its contracts and
arrangements with providers, practitioners and suppliers should not be found to violate the Anti-Kickback Law. However, we cannot assure you that such laws will ultimately be interpreted in a manner consistent with VITAS’ practices.
Several health care reform proposals have included an expansion of the Anti-Kickback Law to include referrals of
any patients regardless of payor source, which is similar to the scope of certain laws that have been enacted at the state level. In addition, a number of states in which VITAS operates have laws, which vary from state to state, prohibiting
certain direct or indirect remuneration or fee-splitting arrangements between health care providers, regardless of payor source, for the referral of patients to a particular provider.
The federal Ethics in Patient Referral Act, Section 1877 of the Social Security Act (commonly known as the “Stark
Law”) prohibits physicians from referring Medicare or Medicaid patients for “designated health services” to entities in which they hold an ownership or investment interest or with whom they have a compensation arrangement, subject to certain
statutory or regulatory exceptions. We cannot assure you that future statutory or regulatory changes will not result in hospice services being subject to the Stark Law’s ownership, investment, compensation or referral prohibitions. Several states
in which VITAS operates have similar laws which likewise are subject to change. Any such changes could adversely affect the business, financial condition and operating results of VITAS.
Further, under separate statutes, submission of claims for items or services that are “not provided as claimed”
may lead to civil money penalties, criminal fines and imprisonment and/or exclusion from participation in Medicare, Medicaid and other federally funded state health care programs. These false claims statutes include the federal False Claims Act,
which allows any person to bring suit on behalf of the federal government, known as a qui tam action, alleging false or fraudulent
Medicare or Medicaid claims or other violations of the statute and to share in any amounts paid by the entity to the government in fines or settlement.
Certificate
of Need Laws. Many states, including Florida, have certificate of need laws or other similar health planning laws that apply to hospice care providers. These states may require some form of state agency review or approval prior to
opening a new hospice program, to adding or expanding hospice services, to undertaking significant capital expenditures or under other specified circumstances. Approval under these certificate of need laws is generally conditioned on the showing
of a demonstrable need for services in the community. VITAS may seek to develop, acquire or expand hospice programs in states having certificate of need laws. To the extent that state agencies require VITAS to obtain a certificate of need or
other similar approvals to expand services at existing hospice programs or to make acquisitions or develop hospice programs in new or existing geographical markets, VITAS’ plans could be adversely affected by a failure to obtain a certificate or
approval. In addition, competitors may seek administratively or judicially to challenge such an approval or proposed approval by the state agency. Such a challenge, whether or not ultimately successful, as well as a state significantly changing
its existing certificate of need rules and regulations, could adversely affect VITAS.
16
Other
Federal and State Regulations. The federal government and all states regulate various aspects of the hospice industry and VITAS’ business. In particular, VITAS’ operations are subject to federal and state health regulatory laws,
including those covering professional services, the dispensing of drugs and certain types of hospice activities. Certain of VITAS’ employees are subject to state laws and regulations governing professional practice. VITAS’ operations are subject
to periodic survey by governmental authorities and private accrediting entities to assure compliance with applicable state licensing, and Medicare and Medicaid certification and accreditation standards, as the case may be. From time to time in the
ordinary course of business, VITAS receives survey reports noting deficiencies for alleged failure to comply with applicable requirements. VITAS reviews such reports and takes appropriate corrective action. The failure to effect such action could
result in one of VITAS’ hospice programs being terminated from the Medicare hospice program. Any termination of one or more of VITAS’ hospice locations from the Medicare hospice program could adversely affect VITAS’ net patient service revenue and
profitability and adversely affect its financial condition and results of operations. The failure to obtain, renew or maintain any of the required regulatory approvals, certifications or licenses could materially adversely affect VITAS’ business
and could prevent the programs involved from offering products and services to patients. In addition, laws and regulations often are adopted to regulate new products, services and industries. We cannot assure you that either the states or the
federal government will not impose additional regulations on VITAS’ activities, which might materially adversely affect VITAS, including impairing the value of its brand.
Claims
Review. The Medicare and Medicaid programs and their Medicare Administrative Contractors and other payors periodically conduct pre-payment or post-payment reviews and other reviews and audits of health care claims, including hospice
claims. As a result of such reviews or audits, VITAS could be required to return any amounts found to be overpaid, or amounts found to be overpaid could be recouped through reductions in future payments. There is pressure from state and federal
governments and other payors to scrutinize health care claims to determine their validity and appropriateness. VITAS’ claims have been subject to review and audit. We cannot assure you that reviews and/or similar audits of VITAS’ claims will not
result in material recoupments, denials or other actions that could have a material adverse effect on VITAS’ business, financial condition and results of operations.
Regulation
and Provision of Continuous Home Care. VITAS provides continuous home care to patients requiring such care. Continuous home care is provided to allow the patient to remain in their home, during periods of crisis when intensive monitoring
and care, primarily nursing care, is required in order to achieve palliation or management of acute medical symptoms. Continuous home care requires a minimum of 8 hours of care within a 24-hour day, which begins and ends at midnight. The care
must be predominantly nursing care provided by either a registered nurse or licensed practical nurse.
Continuous home care can be challenging for a hospice to provide for a number of reasons, including the need to
have available sufficient skilled and trained staff to furnish such care, the need to manage the staffing and provision of such care, and a shortage of nurses that can make it particularly difficult to attract and retain nurses that are required to
furnish a majority of such care. Medicare reimbursement for continuous home care has been calculated by multiplying the applicable continuous home care hourly rate by the number of hours of care provided. If the care was provided for less than
one hour, Medicare requires reporting in 15-minute increments of care provided, with no rounding.
Medicare reimbursement for continuous home care is subject to a number of requirements posing further challenges
for a hospice providing such care. For example, if a patient requires skilled interventions for palliation or symptom management that can be accomplished in less than 8 aggregate hours within the 24-hour period, if the majority of care can be
accomplished by someone other than a registered nurse or a licensed practical nurse (e.g., if a majority of care is furnished by a home health aide or homemaker), or if for any reason less than 8 hours of direct care are provided (such as when a
patient dies before 8 AM even if 7 or more hours of care has been provided), the care rendered cannot be reimbursed by Medicare at the continuous home care rate (although the care instead may be eligible for Medicare reimbursement at the reduced
routine home care day rate). As a result of such requirements, VITAS may incur the costs of providing services intended to be continuous home care services yet be unable to bill or be reimbursed for such services at the continuous home care rate.
We cannot assure you that challenges in providing continuous home care will not cause VITAS’ net patient service revenue and profits to materially decline or that reviews and/or similar audits of VITAS’ claims will not result in material
recoupments, denials or other actions that could have a material adverse effect on VITAS’ business, financial condition and results of operations.
17
Compliance.
VITAS maintains an internal regulatory compliance review program and from time to time retains regulatory counsel for guidance on compliance matters. We cannot assure you, however, that VITAS’ practices, if reviewed, would be found to be in
compliance with applicable health regulatory laws, as such laws ultimately may be interpreted, or that any non-compliance with such laws would not have a material adverse effect on VITAS.
Federal and state legislative and regulatory initiatives could require VITAS to expend substantial sums on
acquiring, implementing and supporting new information systems, which could negatively impact its profitability.
There are currently numerous legislative and regulatory initiatives at both the state and federal levels that
address patient privacy concerns. We cannot predict the total financial or other impact of the regulations on VITAS’ operations. In addition, although VITAS’ management believes it is in compliance with the requirement of patient privacy
regulations, we cannot assure you that VITAS will not be found to have violated state and federal laws, rules or guidelines surrounding patient privacy. Compliance with current and future HIPAA and HITECH requirements or any other federal or state
privacy initiatives could require VITAS to make substantial investments, which could negatively impact its profitability and cash flows.
VITAS’ growth strategies may not be successful, which could adversely affect its business.
A significant element of VITAS’ growth strategy is expected to include expansion of its business in new and
existing markets. This aspect of VITAS’ growth strategy may not be successful, which could adversely impact its growth and profitability. We cannot assure you that VITAS will be able to:
|
•
|
Identify markets that meet its selection criteria for new hospice locations;
|
|
•
|
Hire and retain qualified management teams to operate each of its new hospice locations;
|
|
•
|
Manage a large and geographically diverse group of hospice locations;
|
|
•
|
Become Medicare and Medicaid certified in new markets;
|
|
•
|
Generate sufficient hospice admissions to operate profitably in these new markets;
|
|
•
|
Compete effectively with existing hospices in new markets; or
|
|
•
|
Obtain state licensure and/or a certificate of need from appropriate state agencies in new markets.
|
VITAS’ loss of key management personnel or its inability to hire and retain skilled employees could adversely
affect its business, financial condition and results of operations.
VITAS’ future success significantly depends upon the continued service of its senior management personnel. The
loss of one or more of VITAS’ key senior management personnel or its inability to hire and retain new skilled employees could negatively impact VITAS’ ability to maintain or increase patient referrals, a key aspect of its growth strategy, and could
adversely affect its future operating results.
Competition for skilled employees is intense, and the process of locating and recruiting skilled employees with
the combination of qualifications and attributes required to care effectively for terminally ill patients and their families can be difficult and lengthy. We cannot assure you that VITAS will be successful in attracting, retaining or training
highly skilled nursing, management, community education, operations, admissions and other personnel. VITAS’ business could be disrupted and its growth and profitability negatively impacted if it is unable to attract and retain skilled employees.
A nationwide shortage of qualified nurses could adversely affect VITAS’
profitability, growth and ability to continue to provide quality, responsive hospice services to its patients as nursing wages and benefits increase.
A significant portion of VITAS’ workforce is licensed nurses. VITAS depends on qualified nurses to provide
quality, responsive hospice services to its patients. The current nationwide shortage of qualified nurses impacts some of the markets in which VITAS provides hospice services. In response to this shortage, VITAS has adjusted its wages and
benefits to recruit and retain nurses and to engage contract nurses. VITAS’ inability to attract and retain qualified nurses could adversely affect its ability to provide quality, responsive hospice services to its patients and its ability to
increase or maintain patient census in those markets. Increases in the wages and benefits required to attract and retain qualified nurses or an increase in reliance on contract nurses could negatively impact profitability.
18
VITAS may not be able to compete successfully against other hospice providers, and competitive pressures may limit
its ability to maintain or increase its market position and adversely affect its profitability, financial condition and results of operations.
Hospice care in the United States is highly competitive. In many areas in which VITAS’ hospices are located, they
compete with a large number of organizations, including:
|
•
|
Community-based hospice providers;
|
|
•
|
National and regional companies;
|
|
•
|
Hospital-based hospice and palliative care programs;
|
|
•
|
Physician groups;
|
|
•
|
Nursing homes;
|
|
•
|
Home health agencies;
|
|
•
|
Infusion therapy companies; and
|
|
•
|
Nursing agencies.
|
Various health care companies have diversified into the hospice industry. Other companies, including hospitals
and health care organizations that are not currently providing hospice care, may enter the markets VITAS serves and expand the variety of services offered to include hospice care. We cannot assure you that VITAS will not encounter increased
competition in the future that could limit its ability to maintain or increase its market position, including competition from parties in a position to impact referrals to VITAS. Such increased competition could have a material adverse effect on
VITAS’ business, financial condition and results of operations.
If VITAS fails to comply with
the terms of the CIA, it could be subject to substantial monetary penalties or suspension or exclusion from participation in the Medicare and Medicaid programs.
VITAS and certain of its subsidiaries entered into a CIA with the Office of the OIG on October 30, 2017 in
connection with the settlement of a False Claims Act Case. The CIA formalizes various aspects of VITAS’ already existing Compliance Program and contains requirements designed to document compliance with federal healthcare program requirements. It
has a term of five years during which it imposes monitoring, reporting, certification, oversight, screening and training obligations, certain of which have previously been implemented by VITAS. It also requires VITAS to engage an Independent
Review Organization to perform auditing and review functions and to prepare reports regarding compliance with federal healthcare programs. In the event of breach of the CIA, VITAS could become liable for payment of stipulated penalties or could be
excluded from participation in federal healthcare programs.
Changes in rates or methods of payment for VITAS’ services could adversely affect its revenues and profits.
Managed care organizations have grown substantially in terms of the percentage of the population they cover and
their control over an increasing portion of the health care economy. Managed care organizations have continued to consolidate to enhance their ability to influence the delivery of health care services and to exert pressure to control health care
costs. VITAS has a number of contractual arrangements with managed care organizations and other similar parties.
VITAS provides hospice care to many Medicare beneficiaries who have elected Medicare managed care. Under such
contracts between HMOs and the federal Department of Health and Human Services, the Medicare payments for hospice services are excluded from the per-member, per-month payment from Medicare to HMOs and instead are paid directly by Medicare to the
hospices. As a result, VITAS’ payments for Medicare beneficiaries enrolled in Medicare risk HMOs are processed in the same way with the same rates as other Medicare beneficiaries. We cannot assure, however, that payment for hospice services will
continue to be excluded from HMO payment under Medicare risk contracts and similar Medicare managed care plans or that if not excluded, managed care organizations or other large third-party payors would not use their power to influence and exert
pressure on health care providers to reduce costs in a manner that could have a material adverse effect on VITAS’ business, financial condition and results of operations.
19
Liability claims may have an adverse effect on VITAS, and its insurance coverage may be inadequate.
Participants in the hospice industry are subject to lawsuits alleging negligence, product liability, wage and hour
or other similar legal theories, many of which involve large claims and significant defense costs. We are also subject to the risk of lawsuits under the False Claims Act and comparable state laws for allegedly submitting fraudulent bills for
services to the Medicare and Medicaid programs and other federal and state healthcare programs. These lawsuits, which may be initiated by “whistleblowers” can involve significant monetary damages, fines, attorneys’ fees and the award of bounties
to private qui tam plaintiffs. From time to time, VITAS is subject to such and other types of lawsuits. See the description below under Legal
Proceedings. The ultimate liability for claims, if any, could have a material adverse effect on its financial condition or operating results. Although VITAS currently maintains liability insurance intended to cover the claims, we cannot assure
you that the coverage limits of such insurance policies will be adequate or that all such claims will be covered by the insurance. In addition, VITAS’ insurance policies must be renewed annually and may be subject to cancellation during the policy
period. While VITAS has been able to obtain liability insurance in the past, such insurance varies in cost, and may not be available in the future on terms acceptable to VITAS, if at all.
A successful claim in excess of the insurance coverage could have a material adverse effect on VITAS. Claims,
regardless of their merit or eventual outcome, also may have a material adverse effect on VITAS’ business and reputation due to the costs of litigation, diversion of management’s time and related publicity.
VITAS procures professional liability coverage on a claims-made basis. The insurance contracts specify that
coverage is available only during the term of each insurance contract. VITAS’ management intends to renew or replace the existing claims-made policy annually but such coverage is difficult to obtain, may be subject to cancellation and may be
written by carriers that are unable, or unwilling to pay claims. Additionally, some risks and liabilities, including claims for punitive damages, are not covered by insurance.
Cybersecurity
In the normal course of business, our information technology systems hold sensitive patient information including
patient demographic data, eligibility for various medical plans including Medicare and Medicaid and protected health information. Additionally, we utilize those same systems to perform our day-to-day activities, such as receiving referrals,
assigning medical teams to patients, documenting medical information and maintaining an accurate record of all transactions. We have not experienced any known attacks on our information technology systems that have compromised patient data or the
Company’s proprietary data. We maintain our information technology systems with safeguard protection against cyber-attacks including active intrusion protection, firewalls and virus detection software. As discussed previously, we are subject to
and comply with HIPAA and HITECH regulations. We have developed and tested a response plan in the event of a successful attack and we maintain commercial insurance related to a cyber-attack. However, these safeguards do not ensure that a
significant cyber-attack could not occur. A successful attack on our information technology systems could have significant consequences to the business including liability for compromised patient information and business interruption.
We are regularly the target of attempted cyber and other security threats and must continuously monitor and
develop our information technology networks and infrastructure to prevent, detect, address and mitigate the risk of unauthorized access, misuse, computer viruses and other events that could have a security impact. Insider or employee cyber and
security threats are increasingly a concern for all large companies, including ours.
VITAS’ success is highly dependent on its brand reputation
VITAS’ reputation for performing quality routine and high acuity patient hospice care within the regulations
mandated by Medicare, Medicaid and commercial payors is critical to our success. Failure to provide quality patient care within the regulations mandated by our third-party payors, or the perception of inappropriate care resulting in adverse
publicity, litigation or a campaign of negative on-line reviews are some of the factors that could negatively impact VITAS’ national reputation. VITAS maintains a reputation management risk program however, a loss of brand reputation at VITAS
could adversely affect referral sources’ willingness to refer our service and thus, adversely affect our future operating performance.
VITAS’ headquarters and a significant portion of its operations are in south Florida
The occurrence of a natural disaster in any region that VITAS has significant operations could have a negative
impact on the business. VITAS’ headquarters are located in Miami, Florida. In addition, two of our largest programs are in south Florida. The location of our headquarters and these large programs increases our exposure to hurricanes. A major
hurricane in south Florida could impede our ability to bill for our services, operate our businesses and serve our patients in the affected area. VITAS maintains a disaster recovery program to mitigate this risk however, natural disasters could
have an adverse effect on our future operating performance.
20
None.
The Company’s corporate offices and the headquarters for Roto-Rooter are located in Cincinnati, Ohio. Roto-Rooter
has manufacturing and distribution center facilities in West Des Moines, Iowa and has 129 leased and owned office and service facilities in 27 states. VITAS, headquartered in Miami, operates 47 programs from 169 leased and owned facilities and 27
inpatient units in 19 states and the District of Columbia.
All “owned” property is held in fee and is subject to the security interests of the holders of our debt
instruments. The leased properties have lease terms ranging from monthly to eleven years. Management does not foresee any difficulty in renewing or replacing the remainder of its current leases. The Company considers all of its major operating
properties to be maintained in good operating condition and to be generally adequate for present and anticipated needs.
The Company and certain current and former directors and officers are defendants in a case captioned In re Chemed Corp. Shareholder Derivative Litigation, No. 13 Civ. 1854 (LPS) (CJB) (D. Del.), which was consolidated on February 2, 2015.
On February 2, 2015, the Court appointed KBC Asset Management NV the sole lead plaintiff and its counsel, the sole
lead and liaison counsel. On March 3, 2015, Lead Plaintiff KBC designated its Complaint as the operative complaint in the consolidated proceedings and defendants renewed a previously filed motion to dismiss those claims and allegations. The
consolidated Complaint named fourteen individual defendants, together with the Company as nominal defendant. The Complaint alleges a claim for breach of fiduciary duty against the individual defendants for allegedly permitting the Company to
submit false claims to the U.S. government. The Complaint seeks (a) a declaration that the individual defendants breached their fiduciary duties to the Company; (b) an order requiring those defendants to pay compensatory damages, restitution and
exemplary damages, in unspecified amounts, to the Company; (c) an order directing the Company to implement new policies and procedures; and (d) costs and disbursements incurred in bringing the action, including attorneys’ fees. On May 12, 2016,
the Court issued a Memorandum Order granting Chemed’s motion to dismiss, and dismissing Lead Plaintiff KBC’s Complaint without prejudice to KBC’s opportunity to file within 30 days of the date of the Court’s Order (i.e., by June 13, 2016) an
amended Complaint addressing the deficiencies in its duty of loyalty claim. Lead Plaintiff KBC did not file an amended Complaint within the time specified by the Court.
However, on June 13, 2016, counsel for Chemed shareholder Michael Kvint filed a letter with the Court requesting a
two-week extension to file a motion to substitute Mr. Kvint as lead plaintiff, in place of Lead Plaintiff KBC and to file an amended Complaint. Alternatively, counsel for Mr. Kvint requested that any dismissal of the action be with prejudice to
KBC only. On June 14, 2016, Chemed filed a reply letter with the Court, reserving its rights to oppose any motion filed by Mr. Kvint and, if warranted, to oppose any other actions taken by Mr. Kvint to proceed with the action (including by filing
an untimely amended Complaint). On June 21, 2016, the Court entered an Oral Order providing Mr. Kvint until June 30, 2016 to file a Motion to Substitute and Motion for Leave to File an Amended Complaint. On that date, Mr. Kvint filed, under seal,
a Motion to Substitute Plaintiff and File Amended Complaint, and attached a Proposed Amended Complaint. Mr. Kvint’s motion was fully briefed by the parties. On April 25, 2017, Magistrate Judge Burke issued a Report and Recommendation recommending
that the Court permit Mr. Kvint to intervene as Lead Plaintiff and grant leave to amend the complaint to replead the duty of loyalty claim only. On May 16, 2017, Chief Judge Stark signed an Order adopting that Report and Recommendation. Plaintiff
Kvint filed a Corrected Amended Complaint on May 30, 2017. On September 13, 2017, the Court entered an order dismissing with prejudice the claims against defendants Timothy S. O’Toole and Joel F. Gemunder and permitting Defendants to file a Motion
to Dismiss the Corrected Amended Complaint. The matter has been fully briefed and argued. On February 26, 2019, Magistrate Judge Burke issued a Report and Recommendations recommending that Defendants' motion to dismiss the amended complaint be granted. Any objections to that Report are due March 12, 2019, and any responses
thereto are due March 26, 2019. The Court will then decide whether to accept the Report and Recommendations. As the Company has previously disclosed, the
legal fees and costs associated with defending against this lawsuit are presently being paid by insurance. For additional procedural history of this litigation, please refer to our prior quarterly and annual filings.
21
On October 30, 2017, the Company entered into a settlement agreement (the “Settlement Agreement”) to resolve civil
litigation under the False Claims Act brought by the United States Department of Justice (“DOJ”) on behalf of the OIG and various relators concerning VITAS, filed in the U.S. District Court of the Western District of Missouri (the “2013 Action”).
The Company denied any violation of law and agreed to settlement without admission of wrongdoing.
In connection with the settlement VITAS and certain of its subsidiaries entered into a corporate integrity
agreement (“CIA”) on October 30, 2017. The CIA formalizes various aspects of VITAS’ already existing Compliance Program and contains requirements designed to document compliance with federal healthcare program requirements. It has a term of five
years during which it imposes monitoring, reporting, certification, oversight, screening and training obligations, certain of which had previously been implemented by VITAS. It also requires VITAS to engage an Independent Review Organization to
perform audit and review functions and to prepare reports regarding compliance with federal healthcare programs. In the event of breach of the CIA, VITAS could become liable for payment of stipulated penalties or could be excluded from
participation in federal healthcare programs.
Under the Settlement Agreement, the United States agreed to release the Company, VITAS, and its hospice operation
subsidiaries from any civil or administrative monetary liability relating to any patients’ disputed terminal medical prognosis of six months or less; a lack of medical necessity for billed Continuous Home Care, General Inpatient Care, or Respite
Care levels of hospice care; or that the claims for those levels of hospice care were not eligible for payment for any other reason. The OIG agreed, conditioned on the Company’s full payment and in consideration of VITAS’ obligations under the
CIA, to release its permissive exclusion rights and refrain from instituting any administrative action seeking to exclude the Company, VITAS, and its affiliates from participating in Medicare, Medicaid, or other federal healthcare programs in this
regard.
Under the Settlement Agreement, the Company paid $75 million plus interest, plus certain attorney fees and
expenses of qui tam relators. The Company made these payments during the fourth quarter of 2017. The Company previously recorded a $90 million loss reserve ($55.8 million after-tax) related to the Settlement Agreement, and associated costs in the
second quarter of 2017. During the fourth quarter of 2017, approximately $5.5 million ($3.4 million after-tax) recorded as part of the $90 million was reversed as relator attorney' fees were less than originally estimated
The costs incurred related to U.S. v. VITAS and related regulatory matters, exclusive of the settlement were $5.2
million and $5.3 million for 2017, and 2016 respectively.
Jordan Seper (“Seper”), a Registered Nurse at VITAS’ Inland Empire program from May 12, 2014 to March 21, 2015,
filed a lawsuit in San Francisco Superior Court on September 26, 2016. She alleged VITAS Healthcare Corp of CA (“VITAS CA”) (1) failed to provide minimum wage for all hours worked; (2) failed to provide overtime for all hours worked; (3) failed to
provide a second meal period; (4) failed to provide rest breaks; (5) failed to indemnify for necessary expenditures; (6) failed to timely pay wages due at time of separation; and (7) engaged in unfair business practices. Seper seeks a state-wide
class action of current and former non-exempt employees employed with VITAS in California within the four years preceding the filing of the lawsuit. She seeks court determination that this action may be maintained as a class action for the entire
California class and subclasses, designation as class representative, declaratory relief, injunctive relief, damages (including wages for regular or overtime hours allegedly worked but not paid, premium payments for missed meal or rest periods, and
unreimbursed expenses), all applicable penalties associated with each claim, pre and post-judgment interest, and attorneys’ fees and costs. Seper served VITAS CA with the lawsuit, Jordan A. Seper on behalf of herself and others similarly situated v. VITAS Healthcare Corporation of California, a Delaware corporation; VITAS Healthcare Corp of CA, a business entity unknown; and
DOES 1 to 100, inclusive; Los Angeles Superior Court Case Number BC 642857 on October 13, 2016 (“Jordan Seper case”).
On November 14, 2016, the Parties filed a Stipulation to transfer the venue of the lawsuit from San Francisco to
Los Angeles. The Los Angeles Superior Court Complex Division accepted transfer of the case on December 6, 2016 and stayed the case. On December 16, 2016, VITAS CA filed its Answer and served written discovery on Seper.
Jiwann Chhina (“Chhina”), hired by VITAS as a Home Health Aide on February 5, 2002, is currently a Licensed
Vocational Nurse for VITAS’ San Diego program. On September 27, 2016, Chhina filed a lawsuit in San Diego Superior Court, alleging (1) failure to pay minimum wage for all hours worked; (2) failure to provide overtime for all hours worked; (3)
failure to pay wages for all hours at the regular rate; (4) failure to provide meal periods; (5) failure to provide rest breaks; (6) failure to provide complete and accurate wage statements; (7) failure to pay for all reimbursement expenses; (8)
unfair business practices; and (9) violation of the California Private Attorneys General Act. Chhina seeks to pursue these claims in the form of a state-wide class action of current and former non-exempt employees employed with VITAS in California
within the four years preceding the filing of the lawsuit. He seeks court determination that this action may be maintained as a class action for the entire California class and subclasses, designation as class representative, declaratory relief,
injunctive relief, damages (including wages for regular or overtime hours allegedly worked but not paid, premium payments for missed meal or rest period, and unreimbursed expenses), all applicable penalties associated with each claim, pre-judgment
interest, and attorneys’ fees and costs. Chhina served VITAS CA with the lawsuit, Jiwan Chhina v. VITAS Health Services of California, Inc.,
a California corporation; VITAS Healthcare Corporation of California, a Delaware corporation; VITAS Healthcare Corporation of California, a Delaware corporation dba VITAS Healthcare Inc.; and DOES 1 to 100, inclusive; San Diego Superior
Court Case Number 37-2015-00033978-CU-OE-CTL on November 3, 2016 (“Jiwann Chhina case”). On December 1, 2016, VITAS CA filed its Answer and served written discovery on Chhina.
22
On May 19, 2017, Chere Phillips (a Home Health Aide in Sacramento) and Lady Moore (a former Social Worker in
Sacramento) filed a lawsuit against VITAS CA in Sacramento County Superior Court, alleging claims for (1) failure to pay all wages due; (2) failure to authorize and permit rest periods; (3) failure to provide off-duty meal periods; (4) failure to
furnish accurate wage statements; (5) unreimbursed business expenses; (6) waiting time penalties; (7) violations of unfair competition law; and (8) violation of the Private Attorneys General Act. The case is captioned: Chere Phillips and Lady Moore v. VITAS Healthcare Corporation of California, Sacramento County Superior Court, Case No. 34-2017-0021-2755. Plaintiffs sought
to pursue these claims in the form of a state-wide class action of current and former non-exempt employees employed with VITAS CA in California within the four years preceding the filing of the lawsuit. Plaintiffs served VITAS with the lawsuit on
June 5, 2017. VITAS CA timely answered the Complaint generally denying the Plaintiffs’ allegations. The Court has stayed all class discovery in this case pending resolution of mediation in the Jordan Seper and Jiwann Chhina cases.
There are currently three other lawsuits against VITAS pending in the superior courts of other California counties
that contain claims and class periods that substantially overlap with Phillips’ and Moore’s claims: the Jordan Seper and Jiwann Chhina cases, and Williams v. VITAS Healthcare Corporation of California, filed on May 22, 2017 in Alameda County Superior Court, RG 17853886.
Jazzina Williams’ (a Home Health Aide in Sacramento) lawsuit alleges claims for (1) failure to pay all wages due;
(2) failure to authorize and permit rest periods; (3) failure to provide off-duty meal periods; (4) failure to furnish accurate wage statements; (5) unreimbursed business expenses; (6) waiting time penalties; and (7) violations of the Private
Attorneys General Act (“PAGA”). Williams seeks to pursue these claims both individually and as a representative action under the PAGA on behalf of current and former California non-exempt employees. Plaintiff served VITAS with the lawsuit on May
31, 2017. VITAS CA timely answered the Complaint generally denying Plaintiff’s allegations. Williams is pursing discovery of her individual claim and has agreed to a stay of class discovery pending possible resolution through ongoing mediation in
the Jordan Seper and Jiwann Chhina cases. Defendant filed and served each of Plaintiffs Williams, Phillips, and Moore with a Notice of Related Cases on July 19, 2017.
The Jordan
Seper and Jiwann Chhina cases have been consolidated in Los Angeles County Superior court; Chhina
was dismissed as a separate action and joined with Seper through the filing of an amended complaint in Seper in which Chhina is also identified as a
named plaintiff, on August 28, 2018.
Alfred Lax (“Lax”), a current employee of Roto-Rooter Services Company (“RRSC”), was hired
in the RRSC’s Menlo Park branch in 2007. On November 30, 2018, Lax filed a class action lawsuit in Santa Clara County Superior Court alleging (1) failure to provide or compensate for required rest breaks; (2) failure to properly pay for all hours
worked; (3) failure to provide accurate wage statements; (4) failure to reimburse for work-related expenses; and (5) unfair business practices. Lax has stated these claims as a representative of a class defined as all service technicians employed
by RRSC in California during the four years preceding the filing of the complaint. He seeks a determination that the action may proceed and be maintained as a class action and for compensatory and statutory damages (premium payments for missed
rest periods, uncompensated rest periods, wages for time allegedly not paid such as travel time, repair time, and vehicle maintenance time, and unreimbursed expenses), penalties and restitutions, pre- and post-judgement interest and attorneys’ fees
and costs. The lawsuit, Alfred Lax, on behalf of himself and all others similarly situated v. Roto-Rooter Services Company, and Does 1
through 50 inclusive; Santa Clara County Superior Court Case Number 18CV338652, was received by RRSC on December 11, 2018 and RRSC timely filed its answer denying the claims.
The Company is not able to reasonably estimate the probability of loss or range of loss for any of these lawsuits
at this time.
The Company intends to defend vigorously against the allegations in each of the above lawsuits. Regardless of the
outcome of any of the preceding matters, dealing with the various regulatory agencies and opposing parties can adversely affect us through defense costs, potential payments, diversion of management time, and related publicity. Although the Company
intends to defend them vigorously, there can be no assurance that those suits will not have a material adverse effect on the Company.
23
None
Executive Officers of the Company
|
Name
|
Age
|
Office
|
First Elected
|
|||
|
Kevin J. McNamara
|
65
|
President and Chief Executive Officer
|
August 2, 1994 (1)
|
|||
|
David P. Williams
|
58
|
Executive Vice President and Chief Financial Officer
|
March 5, 2004 (4)
|
|||
|
Spencer S. Lee
|
63
|
Executive Vice President
|
May 15, 2000 (3)
|
|||
|
Nicholas M. Westfall
|
40
|
Executive Vice President
|
June 16, 2016 (2)
|
|||
|
Naomi C. Dallob
|
65
|
Vice President and Chief Legal Officer
|
May 4, 1987 (5)
|
|
(1)
|
Mr. K.J. McNamara is President and Chief Executive Officer of the Company and has held these positions since August 1994
and May 2001, respectively. Previously, he served as an Executive Vice President, Secretary and General Counsel of the Company, since November 1993, August 1986 and August 1986, respectively. He previously held the position of Vice
President of the Company, from August 1986 to May 1992.
|
|
(2)
|
Mr. D.P. Williams is an Executive Vice President and the Chief Financial Officer of the company and has held these
positions since August 2007 and March 2004, respectively. Mr. Williams is also Senior Vice President and Chief Financial Officer of Roto-Rooter Group, Inc., and has held these positions since January 1999.
|
|
(3)
|
Mr. S.S. Lee is an Executive Vice President of the Company and has held this position since May 2000. Mr. Lee is also
Chairman and Chief Executive Officer of Roto-Rooter Services Company, a wholly owned subsidiary of the Company, and has held this position since January 1999. Previously, he served as a Senior Vice President of Roto-Rooter Services
Company from May 1997 to January 1999.
|
|
(4)
|
Mr. N.M. Westfall is an Executive Vice President of the Company and has held this position since June 2016. He is also
Chief Executive Officer of VITAS, a wholly owned subsidiary of the Company, and has held this position since June 2016. Previously, from May 2015 to June 2016, he also served as Chief Operating Officer of VITAS. Previously, he served as
Senior Vice President of VITAS from April 2012 to April of 2015. Prior to that he served as Director of Information Technology and Operations for Chemed from May 2009 to April 2012.
|
|
(5)
|
Ms. N.C. Dallob is a Vice President and the Secretary and Chief Legal Officer of the Company. She has held these positions
since May 1987, May 1995, and May 2009, respectively. From May 1986 to May 1995 she held the position of Assistant Secretary of the Company.
|
Each executive officer holds office until the annual election at the next annual organizational meeting of the
Board of Directors of the Company which is scheduled to be held on May 20, 2019.
PART II
Item 5. Market for the Registrant’s Common Equity, Related Stockholder Matters and Issuer Purchases of Equity
Securities
The Company has historically paid cash dividends quarterly. However, future dividends are dependent upon the
Company’s earnings and financial condition, compliance with certain debt covenants and other factors not presently determinable.
As of February 15, 2019, there were approximately 1,607 stockholders of record of the Company’s Capital Stock.
This number only includes stockholders of record and does not include stockholders with shares beneficially held in nominee name or within clearinghouse positions of brokers, banks or other institutions.
24
During 2018, the number of shares of Capital Stock repurchased by the Company, the weighted average price paid for each share, the
cumulative shares repurchased under each program and the dollar amounts remaining under each program were as follows:
Company Purchase of Shares of Capital Stock
|
Total Number
|
Weighted Average
|
Cumulative Shares
|
Dollar Amount
|
|||||||||||||
|
of Shares
|
Price Paid Per
|
Repurchased Under
|
Remaining Under
|
|||||||||||||
|
Repurchased
|
Share
|
the Program
|
The Program
|
|||||||||||||
|
February
2011 Program
|
||||||||||||||||
|
January 1 through January 31, 2018
|
-
|
$
|
-
|
7,815,718
|
$
|
55,533,344
|
||||||||||
|
February 1 through February 28, 2018
|
96,890
|
258.26
|
7,912,608
|
30,510,279
|
||||||||||||
|
March 1 through March 31, 2018
|
203,110
|
276.22
|
8,115,718
|
$
|
124,407,848
|
|||||||||||
|
First Quarter Total
|
300,000
|
$
|
270.42
|
|||||||||||||
|
April 1 through April 30, 2018
|
-
|
$
|
-
|
8,115,718
|
$
|
124,407,878
|
||||||||||
|
May 1 through May 31, 2018
|
-
|
-
|
8,115,718
|
124,407,878
|
||||||||||||
|
June 1 through June 30, 2018
|
10,000
|
317.86
|
8,125,718
|
$
|
121,229,007
|
|||||||||||
|
Second Quarter Total
|
10,000
|
$
|
317.86
|
|||||||||||||
|
July 1 through July 31, 2018
|
10,249
|
$
|
314.49
|
8,135,967
|
$
|
118,005,847
|
||||||||||
|
August 1 through August 31, 2018
|
39,751
|
315.87
|
8,175,718
|
105,449,705
|
||||||||||||
|
September 1 through September 30, 2018
|
70,622
|
309.99
|
8,246,340
|
$
|
83,557,343
|
|||||||||||
|
Third Quarter Total
|
120,622
|
$
|
312.31
|
|||||||||||||
|
October 1 through October 31, 2018
|
2,586
|
$
|
313.03
|
8,248,926
|
$
|
82,747,856
|
||||||||||
|
November 1 through November 30, 2018
|
-
|
-
|
8,248,926
|
82,747,856
|
||||||||||||
|
December 1 through December 31, 2018
|
127,938
|
282.16
|
8,376,864
|
$
|
46,649,495
|
|||||||||||
|
Fourth Quarter Total
|
130,524
|
$
|
282.77
|
|||||||||||||
On March 6, 2018, our Board of Directors authorized an additional $150 million under February 2011 Repurchase Program.
25
As of December 31, 2018, the number of stock options and performance share units outstanding under the Company’s
equity compensation plans, the weighted average exercise price of outstanding options, and the number of securities remaining available for issuance were as follows:
EQUITY COMPENSATION PLAN INFORMATION
|
Number of securities to be issued upon exercise of outstanding warrants and rights
|
Weighted-average exercise price of outstanding options, warrants and rights
|
Number of securities remaining available for future issuance under equity compensation plans (excluding securities reflected
in column)
|
||||||||||
|
Plan Category
|
||||||||||||
|
Equity compensation plans approved by stockholders (1)
|
1,443,770
|
$
|
175.68
|
1,607,637
|
||||||||
|
(1)
|
Amount includes 48,736 shares allocated to certain employees which vest upon attainment of specified earnings per share
targets and specified total shareholder return targets.
|
26
Comparative Stock Performance
The graph below compares the yearly percentage change in the Company’s cumulative total stockholder return on
Capital Stock (as measured by dividing (i) the sum of (A) the cumulative amount of dividends for the period December 31, 2013, to December 31, 2018, assuming dividend reinvestment, and (B) the difference between the Company’s share price at
December 31, 2013 and December 31, 2018; by (ii) the share price at December 31, 2013) with the cumulative total return, assuming reinvestment of dividends, of the (1) S&P 500 Stock Index and (2) Dow Jones Industrial Diversified Index.
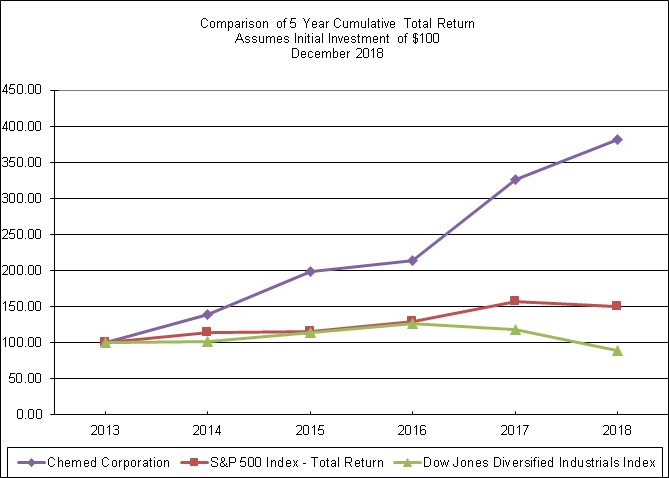
|
December 31
|
2013
|
2014
|
2015
|
2016
|
2017
|
2018
|
|
Chemed Corporation
|
100.00
|
139.13
|
198.60
|
214.24
|
326.34
|
381.85
|
|
S&P 500
|
100.00
|
113.69
|
115.26
|
129.05
|
157.22
|
150.33
|
|
Dow Jones Diversified Industrials
|
100.00
|
101.05
|
114.02
|
126.52
|
118.18
|
88.53
|
27
The information called for by this Item for the five years ended December 31, 2018 is set forth on page 95 of the 2018
Annual Report to Stockholders and is incorporated herein by reference.
The information called for by this Item is set forth on pages 99 through 119 of the 2018 Annual Report to Stockholders and
is incorporated herein by reference.
The Company’s primary market risk exposure relates to interest rate risk exposure through its variable interest line of
credit. For each $10 million dollars borrowed under the credit facility, an increase or decrease of 100 basis points (1% point), increases or decreases the Company’s annual interest expense by $100,000.
The Company continually evaluates this interest rate exposure and periodically weighs the cost versus the benefit of
fixing the variable interest rates through a variety of hedging techniques.
The market value of the Company’s long-term debt at December 31, 2018 is approximately $89.2 million which equals the
carrying value as all outstanding debt is at a variable interest rate.
The consolidated financial statements, together with the report thereon of PricewaterhouseCoopers LLP dated February 27,
2019, appearing on pages 60 through 92 of the 2018 Annual Report to Stockholders, along with the Supplementary Data (Unaudited Summary of Quarterly Results) appearing on pages 93-94, are incorporated herein by reference.
None.
Evaluation of Disclosure Controls and Procedures
The Company’s management, under the supervision of and with the participation of the Company’s President and Chief
Executive Officer, Executive Vice President and Chief Financial Officer and Vice President and Controller, has evaluated the effectiveness of the Company’s disclosure controls and procedures, as such term is defined in Rules 13a-15(e) and 15d-15(e)
under the Securities Exchange Act of 1934, as amended (the “Exchange Act”), as of the end of the period covered by this report. Based on such evaluation, the Company’s President and Chief Executive Officer, Executive Vice President and Chief
Financial Officer and Vice President and Controller have concluded that, as of the end of such period, the Company’s disclosure controls and procedures are effective and are reasonably designed to ensure that all material information relating to
the Company required to be included in the Company’s reports filed or submitted under the Exchange Act is recorded, processed, summarized and reported within the time periods specified in the rules and forms of the Securities and Exchange
Commission and that such information is accumulated and communicated to management, including the President and Chief Executive Officer, Executive Vice President and Chief Financial Officer and Vice President and Controller, as appropriate, to
allow timely decisions regarding required disclosure.
Management’s Report on Internal Control Over Financial Reporting
Refer to Management’s Report on Internal Control over Financial Reporting and Report of Independent Registered Public
Accounting Firm on pages 60 through 62 of the Company’s 2018 Annual Report to Stockholders, which are incorporated herein by reference.
28
Changes in Internal Control Over Financial Reporting
There have not been any changes in the Company’s internal control over financial reporting, as such term is defined in
Rules 13a-15(f) and 15d-15(f) under the Exchange Act during the Company’s fiscal quarter ended December 31, 2018 that have materially affected, or are reasonably likely to materially affect, the Company’s internal control over financial reporting.
Not applicable.
PART III
The directors of the Company are:
Kevin J. McNamara
Joel F. Gemunder
Patrick P. Grace
Thomas C. Hutton
Walter L. Krebs
Andrea R. Lindell
Thomas P. Rice
Donald E. Saunders
George J. Walsh III
Frank E. Wood
The additional information required under this Item is set forth in the Company’s 2019 Proxy Statement and in Part I hereof under the caption
“Executive Officers of the Registrant” and is incorporated herein by reference.
The Company has adopted a Code of Ethics that applies to the Company’s principal executive officer, principal financial
officer, principal accounting officer, directors and employees. A copy of this Code of Ethics is incorporated with this report as Exhibit 14 and it is also posted on the Company’s Web site, www.chemed.com.
Information required under this Item is set forth in the Company’s 2019 Proxy Statement, which is incorporated herein by
reference.
Item 12. Security Ownership of Certain Beneficial Owners and Management and Related Stockholder Matters
Information required under this Item is set forth in the Company’s 2019 Proxy Statement, which is incorporated herein by
reference.
Information required under this Item is set forth in the Company’s 2019 Proxy Statement, which is incorporated herein by
reference.
Audit Fees
PricewaterhouseCoopers LLP charged the Company $2,091,000 for 2017 and $2,205,000 for 2018. These fees were for
professional services rendered for the integrated audit of the Company’s annual financial statements and of its internal control over financial reporting, review of the financial statements included in the Company’s Forms 10-Q and review of
documents filed with the SEC.
29
Audit-Related Fees
PricewaterhouseCoopers LLP charged the Company $137,000 and $141,000 for 2017 and 2018, respectively, for audit-related
services. These services were related primarily to the audit of one of VITAS’ Florida subsidiaries.
Tax Fees
No such services were rendered in 2017 or 2018.
All Other Fees
No such other services were rendered in 2017 or 2018.
The Audit Committee has adopted a policy which requires the Committee’s pre-approval of audit and non-audit services
performed by the independent auditor to assure that the provision of such services does not impair the auditor’s independence. The Audit Committee pre-approved all of the audit and non-audit services rendered by PricewaterhouseCoopers LLP as
listed above.
30
PART IV
|
Exhibits and Financial Statement Schedule
|
||
|
Exhibits
|
||
|
3.1
|
Certificate of Incorporation of Chemed Corporation.*
|
|
|
3.2
|
Certificate of Amendment to Certificate of Incorporation, dated May 15, 2006.*
|
|
|
3.3
|
By-Laws of Chemed Corporation, as amended February 17, 2017
|
|
|
10.1
|
2006 Stock Incentive Plan, as amended August 11, 2006.*,**
|
|
|
10.2
|
2010 Stock Incentive Plan.*,**
|
|
|
10.3
|
2015 Stock Incentive Plan*,**
|
|
|
10.4
|
2018 Stock Incentive Plan**
|
|
|
10.5
|
Employment Agreement with David P. Williams dated December 1, 2006.*,**
|
|
|
10.6
|
First Amendment to Employment Agreement with David P. Williams dated July 9, 2009.*,**
|
|
|
10.7
|
Consulting Agreement with Timothy S. O'Toole dated June 16, 2016.
|
|
|
10.8
|
Employment Agreement with Kevin J. McNamara dated May 3, 2008.*,**
|
|
|
10.9
|
First Amendment to Employment Agreement with Kevin J. McNamara dated July 9, 2009.*,**
|
|
|
10.10
|
Excess Benefits Plan, as restated and amended, effective June 1, 2001.*,**
|
|
|
10.11
|
Amendment No. 1 to Excess Benefits Plan, effective July 1, 2001.*,**
|
|
|
10.12
|
Amendment No. 2 to Excess Benefits Plan, effective November 7, 2003.*,**
|
|
|
10.13
|
Non-Employee Directors’ Deferred Compensation Plan.*,**
|
|
|
10.14
|
Chemed/Roto-Rooter Savings & Retirement Plan, effective January 1, 1999.*,**
|
|
|
10.15
|
First Amendment to Chemed/Roto-Rooter Savings & Retirement Plan, effective September 6, 2000.*,**
|
|
|
10.16
|
Second Amendment to Chemed/Roto-Rooter Savings & Retirement Plan, effective January 1, 2001.*,**
|
|
|
10.17
|
Third Amendment to Chemed/Roto-Rooter Savings & Retirement Plan, effective December 12, 2001.*,**
|
|
|
10.18
|
Directors Emeriti Plan.*,**
|
|
|
10.19
|
Chemed Corporation Change in Control Severance Plan, as amended August 3, 2018.**
|
|
|
10.20
|
Chemed Corporation Senior Executive Severance Policy, as amended August 3, 2018**
|
|
|
10.21
|
Roto-Rooter Deferred Compensation Plan No. 1, as amended January 1, 1998.*,**
|
|
|
10.22
|
Roto-Rooter Deferred Compensation Plan No. 2.*,**
|
|
|
10.23
|
Form of Performance-Based Restricted Stock Units Award*,**
|
|
|
10.24
|
Form of Restricted Stock Award.*,**
|
|
|
10.25
|
Form of Stock Option Grant, pre-2013.*,**
|
|
|
10.26
|
Form of Stock Option Grant, 2013.*,**
|
|
|
10.27
|
Form of Stock Option Grant, 2015. *,**
|
31
|
10.28
|
Settlement Agreement, effective October 30, 2017 by and among the United States of America, acting through the United States Department
of Justice and on behalf of the Office of the Inspector General of the Department of Health and Human Services, VITAS Hospice Services, L.L.C., VITAS Healthcare Corporation, VITAS Healthcare Corporation of California, VITAS Healthcare
Corporation of Illinois, VITAS Healthcare Corporation of Florida, Vitas Healthcare Corporation of Ohio, VITAS Healthcare Corporation of Atlantic, VITAS Healthcare of Texas, L.P., VITAS Healthcare Corporation Midwest, VITAS Healthcare
Corporation of Georgia, Chemed Corporation, and the various Relators named therein.
|
|
|
10.29
|
Corporate Integrity Agreement, effective October 30, 2017 between the Office of Inspector General of the Department of Health and Human
Services and VITAS Hospice Services, L.L.C., VITAS Healthcare Corporation, VITAS Healthcare Corporation of California, VITAS Healthcare Corporation of Illinois, VITAS Healthcare Corporation of Florida, VITAS Healthcare Corporation of Ohio,
VITAS Healthcare Corporation of Atlantic, VITAS Healthcare of Texas, L.P., VITAS Healthcare Corporation Midwest and VITAS Healthcare Corporation of Georgia.
|
|
|
10.30
|
Fourth Amended and Restated Credit Agreement by and among Chemed Corporation, JP Morgan Chase Bank NA, and other lenders as of June 30,
2018, exhibits and schedules thereto.*
|
|
|
13
|
2018 Annual Report to Stockholders.
|
|
|
14
|
Policies on Business Ethics of Chemed Corporation
|
|
|
21
|
Subsidiaries of Chemed Corporation.
|
|
|
23
|
Consent of Independent Registered Public Accounting Firm.
|
|
|
24
|
Powers of Attorney.
|
|
|
31.1
|
Certification by Kevin J. McNamara pursuant to Rule 13a-14(a)/15d-14(a) of the Exchange Act of 1934.
|
|
|
31.2
|
Certification by David P. Williams pursuant to Rule 13a-14(a)/15d-14(a) of the Exchange Act of 1934.
|
|
|
31.3
|
Certification by Michael D. Witzeman pursuant to Rule 13a-14(a)/15d-14(a) of the Exchange Act of 1934.
|
|
|
32.1
|
Certification by Kevin J. McNamara pursuant to Section 906 of the Sarbanes-Oxley Act of 2002.
|
|
|
32.2
|
Certification by David P. Williams pursuant to Section 906 of the Sarbanes-Oxley Act of 2002.
|
|
|
32.3
|
Certification by Michael D. Witzeman pursuant to Section 906 of the Sarbanes-Oxley Act of 2002.
|
|
|
101.INS
|
XBRL Instance Document*
|
|
|
101.SCH
|
XBRL Extension Schema*
|
|
|
101.CAL
|
XBRL Taxonomy Extension Calculation Linkbase*
|
|
|
101.DEF
|
XBRL Taxonomy Extension Definition Linkbase*
|
|
|
101.LAB
|
XBRL Taxonomy Extension Label Linkbase*
|
|
|
101.PRE
|
XBRL Taxonomy Extension Presentation Linkbase*
|
|
|
*
|
This exhibit is being filed by means of incorporation by reference (see Index to Exhibits on page E-1). Each other exhibit is being
filed with this Annual Report on Form 10-K.
|
|
|
**
|
Management contract or compensatory plan or arrangement.
|
|
|
Financial Statement Schedule
|
||
|
See Index to Financial Statements and Financial Statement Schedule on page S-1.
|
||
32
Not applicable.
33
SIGNATURES
Pursuant to the requirements of Section 13 or 15(d) of the Securities Exchange Act of 1934, the registrant has
duly caused this report to be signed on its behalf by the undersigned, thereunto duly authorized.
| February 27, 2019 |
CHEMED CORPORATION | |
|
|
|
By /s/ Kevin J. McNamara |
|
|
|
Kevin J. McNamara |
|
|
|
President and Chief Executive Officer |
Pursuant to the requirements of the Securities Exchange Act of 1934, this report has been signed below
by the following persons on behalf of the registrant and in the capacities and on the dates indicated.
|
Signature
|
Title
|
Date
|
|||
|
/s/ Kevin J. McNamara
Kevin J. McNamara
|
President and Chief
Executive Officer and
a Director (Principal
Executive Officer)
|
||||
|
/s/ David P. Williams
David P. Williams
|
Executive Vice President and Chief
Financial Officer
(Principal Financial Officer)
|
||||
|
/s/ Michael D. Witzeman
Michael D. Witzeman
|
Vice President and
Controller
(Principal Accounting
Officer)
|
February 27, 2019
|
|||
|
Joel F. Gemunder*
Patrick P. Grace*
Thomas C. Hutton*
Walter L. Krebs*
Andrea R. Lindell*
|
Thomas P. Rice*
Donald E. Saunders*
George J Walsh III*
Frank E. Wood*
|
--Directors |
* Naomi C. Dallob by signing her name hereto signs this document on behalf of each of the persons indicated above pursuant to powers of attorney duly executed
by such persons and filed with the Securities and Exchange Commission.
|
February 27, 2019
|
/s/ Naomi C. Dallob
|
|
|
Date
|
Naomi C. Dallob
(Attorney-in-Fact)
|
34
CHEMED CORPORATION AND SUBSIDIARY COMPANIES
INDEX TO FINANCIAL STATEMENTS AND FINANCIAL STATEMENT SCHEDULE
2016, 2017 AND 2018
|
Page
(s)
|
|
|
Chemed Corporation Consolidated Financial
Statements and Financial Statement Schedule
|
|
| Report of Independent Registered Public Accounting Firm | 60* |
| Consolidated Statements of Income | 63* |
| Consolidated Balance Sheets | 64* |
| Consolidated Statements of Cash Flows | 65* |
| Consolidated Statements of Changes in Stockholders’ Equity | 66* |
| Notes to Consolidated Financial Statements | 67-92* |
|
Report of Independent Registered Public Accounting Firm on
Financial Statement Schedule
|
S-2 |
| Schedule II |
S-3 |
* Indicates page numbers in Chemed Corporation 2018 Annual Report to Stockholders
The consolidated financial statements of Chemed Corporation listed above, appearing in the 2018 Annual Report to
Stockholders, are incorporated herein by reference. The Financial Statement Schedule should be read in conjunction with the consolidated financial statements listed above. Schedules not included have been omitted because they are not applicable
or the required information is shown in the financial statements or notes thereto as listed above.
S-1
35
Report of Independent Registered Public Accounting Firm on
Financial Statement Schedule
To the Board of Directors and Stockholders of Chemed Corporation
Our audits of the consolidated financial statements referred to in our report dated February 27, 2019 appearing in the 2018
Annual Report to Stockholders of Chemed Corporation (which report and consolidated financial statements are incorporated by reference in this Annual Report on Form 10-K) also
included an audit of the schedule of valuation and qualifying accounts for each of the three years in the period ended December 31, 2018 appearing under Schedule II of this Form 10-K. In our opinion, this financial statement schedule
presents fairly, in all material respects, the information set forth therein when read in conjunction with the related consolidated financial statements.
/s/ PricewaterhouseCoopers LLP
Cincinnati, Ohio
February 27, 2019
S-2
36
|
SCHEDULE II
|
||||||||||||||||||||
|
CHEMED CORPORATION AND SUBSIDIARY COMPANIES
|
||||||||||||||||||||
|
VALUATION AND QUALIFYING ACCOUNTS
|
||||||||||||||||||||
|
(IN THOUSANDS)
|
||||||||||||||||||||
|
DR/(CR)
|
||||||||||||||||||||
|
ADDITIONS
|
||||||||||||||||||||
|
(CHARGED)
|
||||||||||||||||||||
|
CREDITED
|
(CHARGED)
|
|||||||||||||||||||
|
BALANCE AT
|
TO COSTS
|
CREDITED
|
BALANCE
|
|||||||||||||||||
|
BEGINNING
|
AND
|
TO OTHER
|
DEDUCTIONS
|
AT END
|
||||||||||||||||
|
DESCRIPTION
|
OF PERIOD
|
EXPENSES
|
ACCOUNTS
|
(a)
|
OF PERIOD
|
|||||||||||||||
|
Allowances for doubtful
|
||||||||||||||||||||
|
accounts (b)
|
||||||||||||||||||||
|
For the year 2018
|
$
|
(15,175
|
)
|
$
|
(247
|
)
|
$
|
(1,436
|
)
|
$
|
16,605
|
$
|
(253
|
)
|
||||||
|
For the year 2017
|
$
|
(14,236
|
)
|
$
|
(17,376
|
)
|
$
|
(1,360
|
)
|
$
|
17,797
|
$
|
(15,175
|
)
|
||||||
|
For the year 2016
|
$
|
(13,244
|
)
|
$
|
(16,420
|
)
|
$
|
(1,518
|
)
|
$
|
16,946
|
$
|
(14,236
|
)
|
||||||
|
|
||||||||||||||||||||
|
(a)
|
With respect to allowances for doubtful accounts, deductions include accounts considered uncollectible or written off, payments, companies divested, etc. |
| (b) |
Classified in consolidated balance sheets as a reduction of accounts receivable. |
37
INDEX TO EXHIBITS
|
Page Number
|
|||
|
or
|
|||
| Incorporation by Reference | |||
|
Exhibit
|
File No. and | Previous | |
|
Number
|
Filing Date |
Exhibit No.
|
|
|
3.1
|
Certificate of Incorporation of
|
Form S-3
|
4.1
|
| Chemed Corporation | Reg. No. 33-44177 | |
|
| |
11/26/91 | ||
|
3.2
|
Form 8-K
|
3.1
|
|
| Incorporation, dated May 15, 2006 | 5/16/06 | |
|
|
3.3
|
Form 8-K
|
||
| as amended February 17, 2017 | 2/17/17 | |
|
|
10.1
|
Form 10-Q
|
10.1
|
|
| as amended August 11, 2006 | 8/14/06, ** | |
|
|
10.2
|
Form 8-K |
99.1 |
|
|
5/18/10, **
|
|||
|
10.3
|
2015 Stock Incentive Plan | Form S-8 | 4.5 |
|
7/15/15, **
|
|||
|
10.4
|
2018 Stock Incentive Plan | Form S-8 | 4.5 |
|
5/23/18, **
|
|||
|
10.5
|
Form 8-K
|
10.01
|
|
| |
P. Williams dated December 1, 2006 | 12/1/06, ** | |
|
10.6
|
Form 10-Q
|
10.2
|
|
| Agreement with David P.
Williams |
10/30/09, ** | |
|
| |
dated July 9, 2009. | ||
|
10.7
|
Form 8-K
|
10.02
|
|
| |
Timothy S. O’Toole dated | 5/7/07, ** | |
| |
May 6, 2007. |
||
|
10.8
|
Form 10-Q
|
10.3
|
|
| Agreement with Timothy S.
|
10/30/09, ** | |
|
| O’Toole dated July 9, 2009. | |
||
|
10.9
|
Form 8-K
|
10.1
|
|
| Timothy S. O’Toole dated
|
6/8/16, ** | |
|
| June 16, 2016.
|
|
||
|
10.10
|
Form 8-K
|
10.01
|
|
| Kevin J. McNamara dated
|
5/6/08,** | |
|
| May 3, 2008. |
|
||
|
10.11
|
Form 10-Q
|
10.1
|
|
| Agreement with Kevin J.
|
10/30/09, ** | |
|
| McNamara dated July 9,
2009. |
|
38
|
10.12
|
Form 10-K
|
10.24
|
|
| |
and amended, effective June 1, 2001 | 3/12/04, ** | |
|
10.13
|
Form 10-K
|
10.25
|
|
| |
Plan, effective July 1, 2002 | 3/12/04, ** |
|
|
10.14
|
Form 10-K
|
10.26
|
|
| |
Plan, effective November 7, 2003 | 3/12/04, ** |
|
|
10.15
|
Non-Employee Directors' Deferred
|
Form 10-K
|
10.10
|
| |
Compensation Plan | 3/24/88, ** |
|
|
10.16
|
Form 10-K
|
10.25
|
|
| |
Retirement Plan, effective | 3/25/99, ** |
|
| |
January 1, 1999 |
||
|
10.17
|
Form 10-K
|
10.22
|
|
| |
Roto-Rooter Savings & Retirement | 3/28/02, ** |
|
| |
Plan effective September 6, 2000
|
||
|
10.18
|
Form 10-K
|
10.23
|
|
| |
Roto-Rooter Savings & Retirement | 3/28/02, ** |
|
| |
Plan effective January 1, 2001
|
||
|
10.19
|
Form 10-K
|
10.24
|
|
| |
Roto-Rooter Savings & Retirement | 3/28/02, ** |
|
| |
Plan effective December 12, 2001
|
||
|
10.20
|
Directors Emeriti Plan
|
Form 10-Q
|
10.11
|
| |
5/12/88, ** |
||
|
10.21
|
Change in Control Severance | ||
| |
Plan as amended August 3, 2018. | ** | |
|
10.22
|
Senior Executive Severance | ** |
|
| |
Policy as amended August 3, 2018. | ||
|
10.23
|
Form 10-K
|
10.37
|
|
| |
Plan No. 1, as amended January 1, 1998 | 3/28/01, ** |
|
|
10.24
|
Form 10-K
|
10.38
|
|
| Plan No. 2 |
3/28/01, ** | |
|
|
10.25
|
Form 10-K
|
10.32
|
|
| Stock Unit Award
|
2/27/14, ** | |
|
|
10.26
|
Form of Restricted Stock Award | Form 10-K | 10.50 |
| 3/28/05, ** | |
||
|
10.27
|
Form 10-K
|
10.51
|
|
| 3/28/05, ** |
|
||
|
10.28
|
Form 10-K
|
10.35
|
|
| 2/27/14, ** |
|
||
|
10.29
|
Form 10-K
|
10.30
|
|
| 2/26/16,** |
|
39
40
|
101.INS
|
XBRL Instance Document
|
* |
|
|
101.SCH
|
XBRL Extension Schema
|
* |
|
|
101.CAL
|
XBRL Taxonomy Extension Calculation
|
* | |
| Linkbase |
|
||
|
101.DEF
|
XBRL Taxonomy Extension Definition
|
* |
|
| Linkbase |
|
||
|
101.LAB
|
XBRL Taxonomy Extension Label
|
* |
|
| Linkbase |
|
||
|
101.PRE
|
XBRL Taxonomy Extension Presentation
|
* |
|
| Linkbase |
|
* Filed herewith.
** Management contract or compensatory plan or arrangement.
41