00018984962023FYfalse339338343218337332315http://fasb.org/us-gaap/2023#FairValueAdjustmentOfWarrantshttp://fasb.org/us-gaap/2023#AccruedLiabilitiesCurrenthttp://fasb.org/us-gaap/2023#AccruedLiabilitiesCurrentP3Y0M0D000018984962023-01-012023-12-3100018984962023-06-30iso4217:USD00018984962024-03-11xbrli:shares00018984962023-10-012023-12-310001898496gety:ChinhChuMember2023-10-012023-12-310001898496gety:ChinhChuMember2023-12-310001898496gety:MikaelChoMember2023-10-012023-12-310001898496gety:MikaelChoMember2023-12-310001898496gety:KjeltiKelloughMember2023-10-012023-12-310001898496gety:KjeltiKelloughMember2023-12-310001898496gety:JenniferLeydenMember2023-10-012023-12-310001898496gety:JenniferLeydenMember2023-12-310001898496gety:KennethMainardisMember2023-10-012023-12-310001898496gety:KennethMainardisMember2023-12-310001898496gety:PeterOrlowskyMember2023-10-012023-12-310001898496gety:PeterOrlowskyMember2023-12-310001898496gety:MichaelTeasterMember2023-10-012023-12-310001898496gety:MichaelTeasterMember2023-12-3100018984962023-12-3100018984962022-12-31iso4217:USDxbrli:shares0001898496us-gaap:CommonClassAMember2023-12-310001898496us-gaap:CommonClassAMember2022-12-310001898496us-gaap:CommonClassBMember2023-12-310001898496us-gaap:CommonClassBMember2022-12-3100018984962022-01-012022-12-3100018984962021-01-012021-12-310001898496us-gaap:CommonClassAMember2023-01-012023-12-310001898496us-gaap:CommonClassAMember2022-01-012022-12-310001898496us-gaap:CommonClassAMember2021-01-012021-12-310001898496us-gaap:RedeemablePreferredStockMembersrt:ScenarioPreviouslyReportedMember2020-12-310001898496us-gaap:CommonClassAMembersrt:ScenarioPreviouslyReportedMemberus-gaap:CommonStockMember2020-12-310001898496srt:ScenarioPreviouslyReportedMemberus-gaap:CommonStockMemberus-gaap:CommonClassBMember2020-12-310001898496us-gaap:AdditionalPaidInCapitalMembersrt:ScenarioPreviouslyReportedMember2020-12-310001898496srt:ScenarioPreviouslyReportedMemberus-gaap:RetainedEarningsMember2020-12-310001898496us-gaap:AccumulatedOtherComprehensiveIncomeMembersrt:ScenarioPreviouslyReportedMember2020-12-310001898496us-gaap:ParentMembersrt:ScenarioPreviouslyReportedMember2020-12-310001898496srt:ScenarioPreviouslyReportedMemberus-gaap:NoncontrollingInterestMember2020-12-310001898496srt:ScenarioPreviouslyReportedMember2020-12-310001898496us-gaap:CommonClassAMembersrt:RevisionOfPriorPeriodReclassificationAdjustmentMemberus-gaap:CommonStockMember2020-12-310001898496srt:RevisionOfPriorPeriodReclassificationAdjustmentMemberus-gaap:AdditionalPaidInCapitalMember2020-12-310001898496us-gaap:RedeemablePreferredStockMember2020-12-310001898496us-gaap:CommonClassAMemberus-gaap:CommonStockMember2020-12-310001898496us-gaap:CommonStockMemberus-gaap:CommonClassBMember2020-12-310001898496us-gaap:AdditionalPaidInCapitalMember2020-12-310001898496us-gaap:RetainedEarningsMember2020-12-310001898496us-gaap:AccumulatedOtherComprehensiveIncomeMember2020-12-310001898496us-gaap:ParentMember2020-12-310001898496us-gaap:NoncontrollingInterestMember2020-12-3100018984962020-12-310001898496us-gaap:RetainedEarningsMember2021-01-012021-12-310001898496us-gaap:ParentMember2021-01-012021-12-310001898496us-gaap:NoncontrollingInterestMember2021-01-012021-12-310001898496us-gaap:AccumulatedOtherComprehensiveIncomeMember2021-01-012021-12-310001898496us-gaap:CommonClassAMemberus-gaap:CommonStockMember2021-01-012021-12-310001898496us-gaap:AdditionalPaidInCapitalMember2021-01-012021-12-310001898496us-gaap:RedeemablePreferredStockMember2021-01-012021-12-310001898496us-gaap:RedeemablePreferredStockMember2021-12-310001898496us-gaap:CommonClassAMemberus-gaap:CommonStockMember2021-12-310001898496us-gaap:CommonStockMemberus-gaap:CommonClassBMember2021-12-310001898496us-gaap:AdditionalPaidInCapitalMember2021-12-310001898496us-gaap:RetainedEarningsMember2021-12-310001898496us-gaap:AccumulatedOtherComprehensiveIncomeMember2021-12-310001898496us-gaap:ParentMember2021-12-310001898496us-gaap:NoncontrollingInterestMember2021-12-3100018984962021-12-310001898496us-gaap:RetainedEarningsMember2022-01-012022-12-310001898496us-gaap:ParentMember2022-01-012022-12-310001898496us-gaap:NoncontrollingInterestMember2022-01-012022-12-310001898496us-gaap:AccumulatedOtherComprehensiveIncomeMember2022-01-012022-12-310001898496us-gaap:CommonClassAMemberus-gaap:CommonStockMember2022-01-012022-12-310001898496us-gaap:AdditionalPaidInCapitalMember2022-01-012022-12-310001898496us-gaap:RedeemablePreferredStockMember2022-01-012022-12-310001898496us-gaap:CommonStockMemberus-gaap:CommonClassBMember2022-01-012022-12-310001898496us-gaap:CommonClassAMembergety:PrivatePlacementWarrantsMemberus-gaap:CommonStockMember2022-01-012022-12-310001898496gety:PrivatePlacementWarrantsMemberus-gaap:AdditionalPaidInCapitalMember2022-01-012022-12-310001898496gety:PrivatePlacementWarrantsMemberus-gaap:ParentMember2022-01-012022-12-310001898496gety:PrivatePlacementWarrantsMember2022-01-012022-12-310001898496us-gaap:CommonClassAMembergety:PublicWarrantsMemberus-gaap:CommonStockMember2022-01-012022-12-310001898496gety:PublicWarrantsMemberus-gaap:AdditionalPaidInCapitalMember2022-01-012022-12-310001898496us-gaap:ParentMembergety:PublicWarrantsMember2022-01-012022-12-310001898496gety:PublicWarrantsMember2022-01-012022-12-310001898496us-gaap:RedeemablePreferredStockMember2022-12-310001898496us-gaap:CommonClassAMemberus-gaap:CommonStockMember2022-12-310001898496us-gaap:CommonStockMemberus-gaap:CommonClassBMember2022-12-310001898496us-gaap:AdditionalPaidInCapitalMember2022-12-310001898496us-gaap:RetainedEarningsMember2022-12-310001898496us-gaap:AccumulatedOtherComprehensiveIncomeMember2022-12-310001898496us-gaap:ParentMember2022-12-310001898496us-gaap:NoncontrollingInterestMember2022-12-310001898496us-gaap:RetainedEarningsMember2023-01-012023-12-310001898496us-gaap:ParentMember2023-01-012023-12-310001898496us-gaap:NoncontrollingInterestMember2023-01-012023-12-310001898496us-gaap:AccumulatedOtherComprehensiveIncomeMember2023-01-012023-12-310001898496us-gaap:CommonClassAMemberus-gaap:CommonStockMember2023-01-012023-12-310001898496us-gaap:AdditionalPaidInCapitalMember2023-01-012023-12-310001898496us-gaap:RedeemablePreferredStockMember2023-12-310001898496us-gaap:CommonClassAMemberus-gaap:CommonStockMember2023-12-310001898496us-gaap:CommonStockMemberus-gaap:CommonClassBMember2023-12-310001898496us-gaap:AdditionalPaidInCapitalMember2023-12-310001898496us-gaap:RetainedEarningsMember2023-12-310001898496us-gaap:AccumulatedOtherComprehensiveIncomeMember2023-12-310001898496us-gaap:ParentMember2023-12-310001898496us-gaap:NoncontrollingInterestMember2023-12-31gety:language0001898496gety:GettyImagesHoldingsIncMember2023-12-31xbrli:pure0001898496srt:RestatementAdjustmentMember2022-01-012022-12-310001898496gety:GettyImagesSeaHoldingsCo.LimitedMember2023-12-3100018984962022-01-010001898496us-gaap:RelatedPartyMember2016-06-150001898496gety:ThirdPartyDelegatesMemberus-gaap:RevenueFromContractWithCustomerMembergety:DelegatesConcentrationRiskMember2022-01-012022-12-310001898496gety:ThirdPartyDelegatesMemberus-gaap:RevenueFromContractWithCustomerMembergety:DelegatesConcentrationRiskMember2023-01-012023-12-310001898496gety:ThirdPartyDelegatesMemberus-gaap:RevenueFromContractWithCustomerMembergety:DelegatesConcentrationRiskMember2021-01-012021-12-310001898496srt:MinimumMemberus-gaap:LicenseMemberus-gaap:RevenueFromRightsConcentrationRiskMember2023-01-012023-12-310001898496us-gaap:LicenseMembersrt:MaximumMemberus-gaap:RevenueFromRightsConcentrationRiskMember2023-01-012023-12-310001898496srt:MaximumMember2023-01-012023-12-310001898496srt:MinimumMember2023-01-012023-12-310001898496gety:UncappedDigitalContentSubscriptionsMember2023-12-31gety:performanceObligation0001898496srt:MinimumMemberus-gaap:CostOfGoodsProductLineMemberus-gaap:SupplierConcentrationRiskMember2023-01-012023-12-310001898496us-gaap:CostOfGoodsProductLineMembersrt:MaximumMemberus-gaap:SupplierConcentrationRiskMember2023-01-012023-12-310001898496gety:PublicWarrantsMember2022-07-222022-07-220001898496gety:PrivatePlacementWarrantsMember2022-07-222022-07-220001898496gety:ForwardPurchaseWarrantsMember2022-07-222022-07-220001898496gety:ForwardPurchaseWarrantsMember2022-07-22gety:segment0001898496gety:CommonStockHoldersMembergety:LegacyGettyImagesMember2022-07-220001898496us-gaap:CommonClassAMembergety:CommonStockHoldersMembergety:LegacyGettyImagesMember2022-07-222022-07-220001898496gety:RedeemablePreferredStockHoldersMembergety:LegacyGettyImagesMember2022-07-222022-07-220001898496us-gaap:CommonClassAMembergety:RedeemablePreferredStockHoldersMembergety:LegacyGettyImagesMember2022-07-222022-07-220001898496gety:BusinessCombinationAgreementMembergety:LegacyGettyImagesMember2022-07-222022-07-220001898496gety:BusinessCombinationAgreementMembergety:LegacyGettyImagesMember2022-07-22gety:tranche0001898496gety:LegacyGettyImagesMember2022-07-222022-07-220001898496gety:EarnOutTrancheIMembergety:BusinessCombinationAgreementMembergety:LegacyGettyImagesMember2022-07-222022-07-220001898496gety:EarnOutTrancheIiMembergety:BusinessCombinationAgreementMembergety:LegacyGettyImagesMember2022-07-222022-07-220001898496gety:EarnOutTrancheIiiMembergety:BusinessCombinationAgreementMembergety:LegacyGettyImagesMember2022-07-222022-07-220001898496us-gaap:CommonClassAMembergety:EarnOutTrancheIMembergety:CommonStockHoldersMembergety:BusinessCombinationAgreementMembergety:LegacyGettyImagesMember2022-07-222022-07-220001898496us-gaap:CommonClassAMembergety:EarnOutTrancheIiMembergety:CommonStockHoldersMembergety:BusinessCombinationAgreementMembergety:LegacyGettyImagesMember2022-07-222022-07-220001898496us-gaap:CommonClassAMembergety:CommonStockHoldersMembergety:EarnOutTrancheIiiMembergety:BusinessCombinationAgreementMembergety:LegacyGettyImagesMember2022-07-222022-07-220001898496gety:SponsorSideLetterMember2022-07-220001898496gety:SeriesB1CommonStockMembergety:SponsorSideLetterMember2022-07-220001898496gety:SeriesB2CommonStockMembergety:SponsorSideLetterMember2022-07-220001898496gety:SponsorSideLetterMember2022-07-222022-07-220001898496gety:SeriesB1CommonStockMembergety:SponsorSideLetterMember2022-07-222022-07-220001898496gety:SeriesB2CommonStockMembergety:SponsorSideLetterMember2022-07-222022-07-220001898496gety:SeriesB1CommonStockMembergety:CommonStockHoldersMembergety:SponsorSideLetterMember2022-07-222022-07-220001898496gety:CommonStockHoldersMembergety:SeriesB2CommonStockMembergety:SponsorSideLetterMember2022-07-222022-07-220001898496us-gaap:CommonClassAMembergety:PipeSubscriptionAgreementsMember2022-07-222022-07-220001898496us-gaap:CommonClassAMembergety:PipeSubscriptionAgreementsMember2022-07-220001898496gety:ForwardPurchaseAgreementMemberus-gaap:CommonClassAMember2022-07-222022-07-220001898496gety:ForwardPurchaseAgreementMember2022-07-222022-07-220001898496us-gaap:CommonClassAMembergety:BackstopFacilityAgreementMember2022-07-222022-07-220001898496us-gaap:CommonClassAMembergety:BackstopFacilityAgreementMember2022-07-2200018984962022-07-2200018984962022-07-222022-07-220001898496us-gaap:CommonClassAMember2022-07-220001898496us-gaap:CommonClassBMember2022-07-220001898496gety:CcNeubergerPrincipalHoldingsIiMember2022-07-220001898496gety:CcNeubergerPrincipalHoldingsIiMember2022-01-012022-12-310001898496gety:CcNeubergerPrincipalHoldingsIiMembergety:PipeSubscriptionAgreementsMember2022-01-012022-12-310001898496gety:ForwardPurchaseAgreementMembergety:CcNeubergerPrincipalHoldingsIiMember2022-01-012022-12-310001898496gety:CcNeubergerPrincipalHoldingsIiMembergety:BackstopFacilityAgreementMember2022-01-012022-12-3100018984962022-07-210001898496gety:PipeSubscriptionAgreementsMember2022-07-222022-07-220001898496gety:BackstopFacilityAgreementMember2022-07-222022-07-220001898496gety:CommonStockHoldersMembergety:LegacyGettyImagesMember2022-07-222022-07-220001898496gety:CcNeubergerPrincipalHoldingsIiMember2023-12-310001898496gety:UnsplashIncMember2021-04-012021-04-010001898496gety:UnsplashIncMembergety:ScenarioOneTwoYearEarnoutMember2021-04-012021-04-010001898496gety:UnsplashIncMembergety:ScenarioTwoThreeYearEarnoutMember2021-04-012021-04-010001898496gety:UnsplashIncMembergety:ScenarioOneTwoYearEarnoutMember2022-01-012022-12-310001898496gety:UnsplashIncMembergety:ScenarioFiveRevenuesThatExceed30.0MillionMember2021-04-012021-04-010001898496gety:ScenarioSixRevenuesThatExceeds60.0MillionInTrailing12MonthPeriodMembergety:UnsplashIncMember2021-04-012021-04-010001898496gety:UnsplashIncMember2021-04-01gety:imageDownloadgety:imageView00018984962021-04-012021-04-010001898496us-gaap:CommonClassAMembergety:PublicWarrantsMember2022-07-220001898496gety:PublicWarrantsMember2022-07-220001898496us-gaap:CommonClassAMembergety:PrivatePlacementWarrantsMember2022-07-220001898496us-gaap:CommonClassAMembergety:PrivatePlacementWarrantsMember2022-08-012022-08-310001898496gety:PrivatePlacementWarrantsMember2022-08-012022-08-310001898496gety:PublicWarrantsAndForwardPurchaseWarrantsMember2022-07-222022-07-220001898496gety:PublicWarrantsAndForwardPurchaseWarrantsMember2022-10-192022-10-190001898496gety:PublicWarrantsMember2022-10-192022-10-190001898496gety:PublicWarrantsMember2022-12-310001898496gety:PublicWarrantsMember2023-12-310001898496us-gaap:NondesignatedMemberus-gaap:ForeignExchangeOptionMember2021-12-310001898496us-gaap:NondesignatedMemberus-gaap:ForeignExchangeOptionMember2023-12-310001898496us-gaap:NondesignatedMemberus-gaap:ForeignExchangeOptionMember2022-12-310001898496us-gaap:NondesignatedMemberus-gaap:ForeignExchangeOptionMember2022-01-012022-12-310001898496us-gaap:NondesignatedMemberus-gaap:ForeignExchangeOptionMember2021-01-012021-12-310001898496us-gaap:NondesignatedMemberus-gaap:InterestRateSwapMember2019-02-012019-02-28gety:derivativeInstrument0001898496us-gaap:NondesignatedMembergety:InterestRateSwapOneMember2019-02-280001898496us-gaap:NondesignatedMembergety:InterestRateSwapTwoMember2019-02-280001898496us-gaap:NondesignatedMembergety:InterestRateSwapTwoMember2023-12-310001898496us-gaap:NondesignatedMemberus-gaap:InterestRateSwapMember2023-12-310001898496us-gaap:NondesignatedMemberus-gaap:InterestRateSwapMember2023-06-300001898496us-gaap:NondesignatedMemberus-gaap:InterestRateSwapMember2023-01-012023-12-310001898496us-gaap:NondesignatedMemberus-gaap:InterestRateSwapMember2022-01-012022-12-310001898496us-gaap:NondesignatedMemberus-gaap:InterestRateSwapMember2021-01-012021-12-310001898496us-gaap:NondesignatedMemberus-gaap:InterestRateSwapMember2022-12-310001898496us-gaap:NondesignatedMember2023-12-310001898496us-gaap:NondesignatedMember2022-12-310001898496us-gaap:FairValueMeasurementsRecurringMemberus-gaap:FairValueInputsLevel1Member2023-12-310001898496us-gaap:FairValueMeasurementsRecurringMemberus-gaap:FairValueInputsLevel2Member2023-12-310001898496us-gaap:FairValueMeasurementsRecurringMemberus-gaap:FairValueInputsLevel3Member2023-12-310001898496us-gaap:FairValueMeasurementsRecurringMember2023-12-310001898496us-gaap:FairValueMeasurementsRecurringMemberus-gaap:FairValueInputsLevel1Memberus-gaap:InterestRateSwapMember2023-12-310001898496us-gaap:FairValueMeasurementsRecurringMemberus-gaap:FairValueInputsLevel2Memberus-gaap:InterestRateSwapMember2023-12-310001898496us-gaap:FairValueMeasurementsRecurringMemberus-gaap:FairValueInputsLevel3Memberus-gaap:InterestRateSwapMember2023-12-310001898496us-gaap:FairValueMeasurementsRecurringMemberus-gaap:InterestRateSwapMember2023-12-310001898496us-gaap:FairValueMeasurementsRecurringMemberus-gaap:FairValueInputsLevel1Member2022-12-310001898496us-gaap:FairValueMeasurementsRecurringMemberus-gaap:FairValueInputsLevel2Member2022-12-310001898496us-gaap:FairValueMeasurementsRecurringMemberus-gaap:FairValueInputsLevel3Member2022-12-310001898496us-gaap:FairValueMeasurementsRecurringMember2022-12-310001898496us-gaap:FairValueMeasurementsRecurringMemberus-gaap:FairValueInputsLevel1Memberus-gaap:InterestRateSwapMember2022-12-310001898496us-gaap:FairValueMeasurementsRecurringMemberus-gaap:FairValueInputsLevel2Memberus-gaap:InterestRateSwapMember2022-12-310001898496us-gaap:FairValueMeasurementsRecurringMemberus-gaap:FairValueInputsLevel3Memberus-gaap:InterestRateSwapMember2022-12-310001898496us-gaap:FairValueMeasurementsRecurringMemberus-gaap:InterestRateSwapMember2022-12-310001898496us-gaap:FairValueMeasurementsNonrecurringMemberus-gaap:FairValueInputsLevel1Member2023-12-310001898496us-gaap:FairValueMeasurementsNonrecurringMemberus-gaap:FairValueInputsLevel2Member2023-12-310001898496us-gaap:FairValueMeasurementsNonrecurringMemberus-gaap:FairValueInputsLevel3Member2023-12-310001898496us-gaap:FairValueMeasurementsNonrecurringMember2023-12-310001898496us-gaap:FairValueMeasurementsNonrecurringMemberus-gaap:FairValueInputsLevel1Member2022-12-310001898496us-gaap:FairValueMeasurementsNonrecurringMemberus-gaap:FairValueInputsLevel2Member2022-12-310001898496us-gaap:FairValueMeasurementsNonrecurringMemberus-gaap:FairValueInputsLevel3Member2022-12-310001898496us-gaap:FairValueMeasurementsNonrecurringMember2022-12-310001898496gety:UnsplashIncMember2023-12-310001898496gety:UnsplashIncMember2022-12-310001898496gety:UnsplashIncMember2022-01-012022-12-310001898496us-gaap:FairValueInputsLevel3Member2022-12-310001898496us-gaap:FairValueInputsLevel3Membergety:MeasurementInputProbabilitiesOfSuccessMember2022-12-310001898496us-gaap:FairValueInputsLevel3Memberus-gaap:MeasurementInputExpectedTermMember2022-12-310001898496us-gaap:MeasurementInputDiscountRateMemberus-gaap:FairValueInputsLevel3Member2022-12-310001898496gety:PrivatePlacementWarrantsMember2021-12-310001898496gety:PrivatePlacementWarrantsMember2022-12-310001898496gety:ContemporaryImageryMember2023-12-310001898496gety:ContemporaryImageryMember2022-12-310001898496us-gaap:ComputerEquipmentMember2023-12-310001898496us-gaap:ComputerEquipmentMember2022-12-310001898496us-gaap:SoftwareDevelopmentMember2023-12-310001898496us-gaap:SoftwareDevelopmentMember2022-12-310001898496srt:MinimumMemberus-gaap:LeaseholdImprovementsMember2023-12-310001898496us-gaap:LeaseholdImprovementsMembersrt:MaximumMember2023-12-310001898496us-gaap:LeaseholdImprovementsMember2023-12-310001898496us-gaap:LeaseholdImprovementsMember2022-12-310001898496us-gaap:FurnitureAndFixturesMember2023-12-310001898496us-gaap:FurnitureAndFixturesMember2022-12-310001898496us-gaap:CollectionsIncludingWorkOfArtAndHistoricalTreasureMember2023-12-310001898496us-gaap:CollectionsIncludingWorkOfArtAndHistoricalTreasureMember2022-12-310001898496srt:MinimumMemberus-gaap:OtherCapitalizedPropertyPlantAndEquipmentMember2023-12-310001898496us-gaap:OtherCapitalizedPropertyPlantAndEquipmentMembersrt:MaximumMember2023-12-310001898496us-gaap:OtherCapitalizedPropertyPlantAndEquipmentMember2023-12-310001898496us-gaap:OtherCapitalizedPropertyPlantAndEquipmentMember2022-12-310001898496us-gaap:CollectionsIncludingWorkOfArtAndHistoricalTreasureMember2023-01-012023-12-310001898496us-gaap:CollectionsIncludingWorkOfArtAndHistoricalTreasureMember2022-01-012022-12-310001898496us-gaap:TradeNamesMember2023-12-310001898496us-gaap:TradeNamesMember2022-12-310001898496srt:MinimumMemberus-gaap:TrademarksAndTradeNamesMember2023-12-310001898496srt:MaximumMemberus-gaap:TrademarksAndTradeNamesMember2023-12-310001898496us-gaap:TrademarksAndTradeNamesMember2023-12-310001898496us-gaap:TrademarksAndTradeNamesMember2022-12-310001898496srt:MinimumMemberus-gaap:IntellectualPropertyMember2023-12-310001898496us-gaap:IntellectualPropertyMembersrt:MaximumMember2023-12-310001898496us-gaap:IntellectualPropertyMember2023-12-310001898496us-gaap:IntellectualPropertyMember2022-12-310001898496srt:MinimumMemberus-gaap:CustomerRelatedIntangibleAssetsMember2023-12-310001898496srt:MaximumMemberus-gaap:CustomerRelatedIntangibleAssetsMember2023-12-310001898496us-gaap:CustomerRelatedIntangibleAssetsMember2023-12-310001898496us-gaap:CustomerRelatedIntangibleAssetsMember2022-12-310001898496us-gaap:NoncompeteAgreementsMember2023-12-310001898496us-gaap:NoncompeteAgreementsMember2022-12-310001898496srt:MinimumMemberus-gaap:OtherIntangibleAssetsMember2023-12-310001898496srt:MaximumMemberus-gaap:OtherIntangibleAssetsMember2023-12-310001898496us-gaap:OtherIntangibleAssetsMember2023-12-310001898496us-gaap:OtherIntangibleAssetsMember2022-12-310001898496us-gaap:SeniorNotesMember2023-12-310001898496us-gaap:SeniorNotesMember2022-12-310001898496gety:UsdTermLoansMember2023-12-310001898496gety:UsdTermLoansMember2022-12-310001898496gety:EurTermLoansMember2023-12-310001898496gety:EurTermLoansMember2022-12-310001898496us-gaap:SeniorNotesMember2019-02-280001898496gety:UsdTermLoansMember2019-02-280001898496gety:EurTermLoansMember2019-02-28iso4217:EUR0001898496us-gaap:RevolvingCreditFacilityMember2019-02-280001898496us-gaap:LineOfCreditMemberus-gaap:RevolvingCreditFacilityMember2023-05-030001898496us-gaap:LineOfCreditMemberus-gaap:RevolvingCreditFacilityMember2023-05-040001898496us-gaap:LineOfCreditMemberus-gaap:RevolvingCreditFacilityMember2023-05-042023-05-040001898496gety:UsdTermLoansMember2022-08-012022-08-310001898496gety:UsdTermLoansMember2022-01-012022-12-310001898496gety:EurTermLoansMember2023-01-012023-12-310001898496gety:UsdTermLoansMember2023-01-012023-12-310001898496gety:BaseRateLoansUsdTermLoansMember2023-12-310001898496gety:NyfrbRateMembergety:BaseRateLoansUsdTermLoansMember2023-01-012023-12-310001898496gety:AdjustedTermSecuredOvernightFinancingRateSOFRMembergety:BaseRateLoansUsdTermLoansMember2023-01-012023-12-310001898496gety:EurodollarLoansUsdTermLoansMembergety:AdjustedTermSecuredOvernightFinancingRateSOFRMember2023-12-310001898496gety:SecuredOvernightFinancingRateSOFRMembergety:TermLoansMemberus-gaap:SecuredDebtMember2023-01-012023-12-310001898496gety:AdjustedTermSecuredOvernightFinancingRateSOFRMembergety:TermLoansMemberus-gaap:SecuredDebtMember2023-12-310001898496gety:EurTermLoansMembergety:AdjustedEurodollarRateMember2023-12-310001898496gety:UsdTermLoansMember2021-12-310001898496gety:EurTermLoansMember2021-12-310001898496gety:UsdTermLoansAndEurTermLoansMember2023-12-310001898496gety:EurTermLoans2024Member2023-12-310001898496gety:EurTermLoans2025Member2023-12-310001898496gety:EurTermLoans2026Member2023-12-310001898496gety:UsdTermLoans2024Member2023-12-310001898496gety:UsdTermLoans2025Member2023-12-310001898496gety:UsdTermLoans2026Member2023-12-3100018984962023-02-17gety:lawsuit0001898496gety:UnitedStatesDistrictCourtForTheSouthernDistrictOfNewYorkAltaPartnersLLCVGettyImagesHoldingsIncCaseMember2023-10-272023-10-270001898496gety:CRCMInstitutionalMasterFundBVILTDEtAlVGettyImagesHoldingsIncCaseMember2023-10-272023-10-270001898496gety:UnitedStatesDistrictCourtForTheSouthernDistrictOfNewYorkAltaPartnersLLCVGettyImagesHoldingsIncCaseMember2023-10-270001898496gety:CRCMInstitutionalMasterFundBVILTDEtAlVGettyImagesHoldingsIncCaseMember2023-10-270001898496gety:TaxAssessmentCanadaRevenueAgencyMember2023-01-012023-12-310001898496gety:TaxAssessmentCanadaRevenueAgencyMembersrt:MaximumMember2023-01-012023-12-31gety:productgety:staffMember0001898496gety:CreativeMember2023-01-012023-12-310001898496gety:CreativeMember2022-01-012022-12-310001898496gety:CreativeMember2021-01-012021-12-310001898496gety:EditorialMember2023-01-012023-12-310001898496gety:EditorialMember2022-01-012022-12-310001898496gety:EditorialMember2021-01-012021-12-310001898496gety:OtherMember2023-01-012023-12-310001898496gety:OtherMember2022-01-012022-12-310001898496gety:OtherMember2021-01-012021-12-310001898496us-gaap:CommonClassAMembergety:GettyImagesHoldingsIncMember2022-07-222022-07-220001898496us-gaap:CommonClassAMember2022-07-222022-07-22gety:vote0001898496us-gaap:CommonClassBMember2022-07-222022-07-220001898496us-gaap:CommonClassAMember2022-08-310001898496us-gaap:CommonClassAMember2022-08-012022-08-310001898496us-gaap:SellingGeneralAndAdministrativeExpensesMember2023-01-012023-12-310001898496us-gaap:SellingGeneralAndAdministrativeExpensesMember2022-01-012022-12-310001898496us-gaap:SellingGeneralAndAdministrativeExpensesMember2021-01-012021-12-310001898496srt:MinimumMembergety:EquityIncentivePlan2022Member2023-01-012023-12-310001898496srt:MaximumMembergety:EquityIncentivePlan2022Member2023-01-012023-12-310001898496gety:EquityIncentivePlan2022Member2023-12-310001898496srt:ScenarioPreviouslyReportedMember2021-12-310001898496srt:ScenarioPreviouslyReportedMember2021-01-012021-12-310001898496srt:RevisionOfPriorPeriodReclassificationAdjustmentMember2021-12-310001898496gety:LegacyGetty2012PlanMember2021-12-310001898496us-gaap:RestrictedStockUnitsRSUMember2022-12-310001898496us-gaap:RestrictedStockUnitsRSUMember2023-01-012023-12-310001898496us-gaap:RestrictedStockUnitsRSUMember2023-12-310001898496us-gaap:PerformanceSharesMember2022-12-310001898496us-gaap:PerformanceSharesMember2023-01-012023-12-310001898496us-gaap:PerformanceSharesMember2023-12-310001898496gety:EarnOutPlanMember2023-12-310001898496gety:EarnOutPlanMemberus-gaap:RestrictedStockUnitsRSUMember2022-12-310001898496gety:EarnOutPlanMemberus-gaap:RestrictedStockUnitsRSUMember2023-01-012023-12-310001898496gety:EarnOutPlanMemberus-gaap:RestrictedStockUnitsRSUMember2023-12-310001898496us-gaap:EmployeeStockMembergety:A2022EmployeeStockPurchasePlanMember2023-01-012023-12-310001898496us-gaap:EmployeeStockMembergety:A2022EmployeeStockPurchasePlanMember2023-12-310001898496country:US2023-12-31gety:plan0001898496country:US2023-01-012023-12-310001898496country:GB2023-12-310001898496country:GB2023-01-012023-12-310001898496srt:MaximumMembercountry:CA2023-01-012023-12-310001898496country:IE2023-01-012023-12-310001898496country:US2023-12-310001898496country:US2022-12-310001898496us-gaap:DomesticCountryMember2023-12-310001898496us-gaap:ForeignCountryMember2023-12-310001898496srt:AmericasMember2023-01-012023-12-310001898496srt:AmericasMember2022-01-012022-12-310001898496srt:AmericasMember2021-01-012021-12-310001898496us-gaap:EMEAMember2023-01-012023-12-310001898496us-gaap:EMEAMember2022-01-012022-12-310001898496us-gaap:EMEAMember2021-01-012021-12-310001898496srt:AsiaPacificMember2023-01-012023-12-310001898496srt:AsiaPacificMember2022-01-012022-12-310001898496srt:AsiaPacificMember2021-01-012021-12-310001898496us-gaap:RevenueFromContractWithCustomerMemberus-gaap:GeographicConcentrationRiskMembercountry:US2023-01-012023-12-310001898496us-gaap:RevenueFromContractWithCustomerMemberus-gaap:GeographicConcentrationRiskMembercountry:US2022-01-012022-12-310001898496us-gaap:RevenueFromContractWithCustomerMemberus-gaap:GeographicConcentrationRiskMembercountry:US2021-01-012021-12-310001898496us-gaap:RevenueFromContractWithCustomerMemberus-gaap:GeographicConcentrationRiskMembercountry:GB2023-01-012023-12-310001898496us-gaap:RevenueFromContractWithCustomerMemberus-gaap:GeographicConcentrationRiskMembercountry:GB2022-01-012022-12-310001898496us-gaap:RevenueFromContractWithCustomerMemberus-gaap:GeographicConcentrationRiskMembercountry:GB2021-01-012021-12-310001898496srt:AmericasMember2023-12-310001898496srt:AmericasMember2022-12-310001898496us-gaap:EMEAMember2023-12-310001898496us-gaap:EMEAMember2022-12-310001898496srt:AsiaPacificMember2023-12-310001898496srt:AsiaPacificMember2022-12-310001898496us-gaap:AssetsTotalMemberus-gaap:GeographicConcentrationRiskMembercountry:US2023-01-012023-12-310001898496us-gaap:AssetsTotalMemberus-gaap:GeographicConcentrationRiskMembercountry:US2022-01-012022-12-310001898496us-gaap:AssetsTotalMemberus-gaap:GeographicConcentrationRiskMembercountry:IE2023-01-012023-12-310001898496us-gaap:AssetsTotalMemberus-gaap:GeographicConcentrationRiskMembercountry:IE2022-01-012022-12-310001898496us-gaap:EmployeeStockOptionMember2023-01-012023-12-310001898496us-gaap:EmployeeStockOptionMember2022-01-012022-12-310001898496us-gaap:EmployeeStockOptionMember2021-01-012021-12-310001898496us-gaap:RestrictedStockUnitsRSUMember2023-01-012023-12-310001898496us-gaap:RestrictedStockUnitsRSUMember2022-01-012022-12-310001898496us-gaap:RestrictedStockUnitsRSUMember2021-01-012021-12-31
UNITED STATES
SECURITIES AND EXCHANGE COMMISSION
Washington, D.C. 20549
FORM 10-K
(Mark One)
x ANNUAL REPORT PURSUANT TO SECTION 13 OR 15(d) OF THE SECURITIES EXCHANGE ACT OF 1934
For the fiscal year ended December 31, 2023
Or
o TRANSITION REPORT PURSUANT TO SECTION 13 OR 15(d) OF THE SECURITIES EXCHANGE ACT OF 1934
For the transition period from to .
Commission file number: 001-41453
GETTY IMAGES HOLDINGS, INC.
(Exact name of registrant as specified in its charter)
| | | | | | | | |
| Delaware | | 87-3764229 |
| State or other jurisdiction of incorporation or organization | | (I.R.S. Employer Identification No.) |
| | |
605 5th Ave. S. Suite 400 Seattle, WA 98104 _________________________________________________ (Address of principal executive offices) (zip code) (206) 925-5000 _________________________________________________ Registrant’s telephone number, including area code |
Securities registered pursuant to Section 12(b) of the Act:
| | | | | | | | | | | | | | |
| Title of each class | | Trading Symbol(s) | | Name of each exchange on which registered |
| Class A Common Stock | | GETY | | New York Stock Exchange |
Securities registered pursuant to section 12(g) of the Act: None
Indicate by check mark if the registrant is a well-known seasoned issuer, as defined in Rule 405 of the Securities Act. Yes o No þ
Indicate by check mark if the registrant is not required to file reports pursuant to Section 13 or Section 15(d) of the Act. Yes o No þ
Indicate by check mark whether the registrant (1) has filed all reports required to be filed by Section 13 or 15(d) of the Securities Exchange Act of 1934 during the preceding 12 months (or for such shorter period that the registrant was required to file such reports), and (2) has been subject to such filing requirements for the past 90 days. Yes þ No o
Indicate by check mark whether the registrant has submitted electronically every Interactive Data File required to be submitted pursuant to Rule 405 of Regulation S-T (§232.405 of this chapter) during the preceding 12 months (or for such shorter period that the registrant was required to submit such files). Yes þ No o
Indicate by check mark whether the registrant is a large accelerated filer, an accelerated filer, a non-accelerated filer, a smaller reporting company, or an emerging growth company. See the definitions of “large accelerated filer,” “accelerated filer,” “smaller reporting company,” and “emerging growth company” in Rule 12b-2 of the Exchange Act.
| | | | | | | | | | | |
| Large accelerated filer | o | Accelerated filer | þ |
| Non-accelerated filer | o | Smaller reporting company | þ |
| | Emerging growth company | þ |
If an emerging growth company, indicate by check mark if the registrant has elected not to use the extended transition period for complying with any new or revised financial accounting standards provided pursuant to Section 13(a) of the Exchange Act. o
Indicate by check mark whether the registrant has filed a report on and attestation to its management’s assessment of the effectiveness of its internal control over financial reporting under Section 404(b) of the Sarbanes-Oxley Act (15 U.S.C. 7262(b)) by the registered public accounting firm that prepared or issued its audit report. o
If securities are registered pursuant to Section 12(b) of the Act, indicate by check mark whether the financial statements of the registrant included in the filing reflect the correction of an error to previously issued financial statements. o
Indicate by check mark whether any of those error corrections are restatements that required a recovery analysis of incentive-based compensation received by any of the registrant’s executive officers during the relevant recovery period pursuant to §240.10D-1(b). o
Indicate by check mark whether the registrant is a shell company (as defined in Rule 12b-2 of the Act). Yes o No þ
The aggregate market value of voting stock held by non-affiliates of Getty Images Holdings, Inc. on June 30, 2023, based on the closing price of $4.88 for shares of Class A common stock of Getty Images Holdings, Inc. as reported by the New York Stock Exchange on June 30, 2023, was approximately $133,323,781.36. For purposes of this calculation, shares of Class A common stock beneficially owned by each executive officer, director, and holders of 5% or more of our Class A common stock have been excluded since those persons may under certain circumstances be deemed to be affiliates. This determination of affiliate status is not necessarily a conclusive determination for other purposes.
As of March 11, 2024, 405,870,456 shares of Class A common stock, par value $0.0001 per share of Getty Images Holdings, Inc. were issued and outstanding.
DOCUMENTS INCORPORATED BY REFERENCE
Portions of the proxy statement for the 2024 Annual Meeting of Stockholders of Getty Images Holdings, Inc. are incorporated herein by reference in Part III of this Annual Report on Form 10-K to the extent stated herein. Such proxy statement will be filed with the Securities and Exchange Commission within 120 days of Getty Images Holdings, Inc.’s fiscal year ended December 31, 2023.
GETTY IMAGES HOLDINGS, INC.
Form 10-K
Table of Contents
Cautionary Note Regarding Forward-Looking Statements
Certain statements included in this Annual Report on Form 10-K (the “Annual Report”) that are not historical facts are forward-looking statements for purposes of the safe harbor provisions under the United States Private Securities Litigation Reform Act of 1995. Forward-looking statements may be identified by the use of the words such as “believe,” “may,” “will,” “estimate,” “continue,” “anticipate,” “intend,” “expect,” “should,” “would,” “plan,” “project,” “forecast,” “predict,” “potential,” “seem,” “seek,” “future,” “outlook,” “target” or similar expressions that predict or indicate future events or trends or that are not statements of historical matters. These forward-looking statements include, but are not limited to, statements regarding estimates and forecasts of other financial and performance metrics and projections of market opportunity. These statements are based on various assumptions, whether or not identified in this report, and on the current expectations of our management and are not predictions of actual performance. These forward-looking statements are provided for illustrative purposes only and are not intended to serve as, and must not be relied on by any investor as, a guarantee, an assurance, a prediction or a definitive statement of fact or probability. Actual events and circumstances are difficult or impossible to predict and will differ from assumptions. Many actual events and circumstances are beyond our control.
These forward-looking statements are subject to a number of risks and uncertainties, including:
•our inability to continue to license third-party content and offer relevant quality and diversity of content to satisfy customer needs;
•our ability to attract new customers and retain and motivate an increase in spending by its existing customers;
•the user experience of our customers on its websites;
•the extent to which we are able to maintain and expand the breadth and quality of our content library through content licensed from third-party suppliers, content acquisitions and imagery captured by our staff of in-house photographers;
•the mix of and basis upon which we license our content, including the price-points at, and the license models and purchase options through, which we license our content;
•the risk that we operate in a highly competitive market;
•the risk that we are unable to successfully execute our business strategy or effectively manage costs;
•our inability to effectively manage our growth;
•our inability to maintain an effective system of internal controls and financial reporting;
•the risk that we may lose the right to use “Getty Images” trademarks;
•our inability to evaluate our future prospects and challenges due to evolving markets and customers’ industries;
•The increase use of AI applications such as generative AI technologies that may result in harm to our brand, reputation, business, or intellectual property;
•the legal, social and ethical issues relating to the use of new and evolving technologies, such as Artificial Intelligence (“AI”), including statements regarding AI and innovation momentum;
•the risk that our operations in and continued expansion into international markets bring additional business, political, regulatory, operational, financial and economic risks;
•our inability to adequately adapt our technology systems to ingest and deliver sufficient new content;
•the risk of technological interruptions or cybersecurity breaches, incidents, and vulnerabilities;
•the risk that any prolonged strike by, or lockout of, one or more of the unions that provide personnel essential to the production of films or television programs, such as the 2023 strike by the writers’ union and the actors' unions, could further impact our entertainment business;
•the inability to expand our operations into new products, services and technologies and to increase customer and supplier awareness of new and emerging products and services, including with respect to our AI initiatives;
•the loss of and inability to attract and retain key personnel that could negatively impact our business growth;
•the inability to protect the proprietary information of customers and networks against security breaches and protect and enforce intellectual property rights;
•our reliance on third parties;
•the risks related to our use of independent contractors;
•the risk that an increase in government regulation of the industries and markets in which we operate could negatively impact our business;
•the impact of worldwide and regional political, military or economic conditions, including declines in foreign currencies in relation to the value of the U.S. dollar, hyperinflation, higher interest rates, devaluation, the impact of recent bank failures on the marketplace and the ability to access credit and significant political or civil disturbances in international markets where we conduct business;
•the risk that claims, judgements, lawsuits and other proceedings that have been, or may be, instituted against us or our predecessors could adversely affect our business;
•the inability to maintain the listing of our Class A common stock on the New York Stock Exchange;
•volatility in our stock price and in the liquidity of the trading market for our Class A common stock;
•the lingering effect of the COVID-19 pandemic;
•changes in applicable laws or regulations;
•the risks associated with evolving corporate governance and public disclosure requirements;
•the risk of greater than anticipated tax liabilities;
•the risks associated with the storage and use of personally identifiable information;
•earnings-related risks such as those associated with late payments, goodwill or other intangible assets;
•our ability to obtain additional capital on commercially reasonable terms;
•the risks associated with being an “emerging growth company” and “smaller reporting company” within the meaning of the U. S. securities laws;
•risks associated with our reliance on information technology in critical areas of our operations;
•our inability to pay dividends for the foreseeable future;
•the risks associated with additional issuances of Class A common stock without stockholder approval;
•costs related to operating as a public company; and
•other risks and uncertainties identified in “Item 1A. Risk Factors” of this Annual Report.
If any of these risks materialize or our assumptions prove incorrect, actual results could differ materially from the results implied by these forward-looking statements.
These and other factors that could cause actual results to differ from those implied by the forward-looking statements in this Annual Report are more fully described under the heading “Item 1A. Risk Factors”. The risks described under the heading “Item 1A. Risk Factors” in this Annual Report are not exhaustive. New risk factors emerge from time to time and it is not possible to predict all such risk factors, nor can we assess the impact of all such risk factors on our business or the extent to which any factor or combination of factors may cause actual results to differ materially from those contained in any forward-looking statements. All forward-looking statements attributable to us or persons acting on our behalf are expressly qualified in their entirety by the foregoing cautionary statements. We undertake no obligations to update or revise publicly any forward-looking statements, whether as a result of new information, future events or otherwise, except as required by law.
In addition, the statements of belief and similar statements reflect our beliefs and opinions on the relevant subject. These statements are based upon information available to us, as applicable, as of the date of this report, and while we believe such information forms a reasonable basis for such statements, such information may be limited or incomplete, and statements should not be read to indicate that we have conducted an exhaustive inquiry into, or review of, all potentially available relevant information. These statements are inherently uncertain and you are cautioned not to unduly rely upon these statements.
PART I
Item 1. Business.
The Company
Getty Images Holdings, Inc. is a Delaware corporation with its corporate headquarters located at 605 5th Ave S., Suite 400, Seattle, Washington 98104, telephone number (206) 925-5000, Internet website address www.gettyimages.com. Our Internet website and content contained therein or connected thereto are not intended to incorporate into this Annual Report. References to “Getty Images,” the “Company,” “we,” “our” and “us” and similar terms mean Getty Images Holdings, Inc. and its subsidiaries following the completion of the Business Combination (as defined below), unless the context otherwise requires.
The Business Combination
On July 22, 2022 (the “Closing Date”), the Company consummated the transactions in the Business Combination Agreement, dated December 9, 2021 (the “Business Combination Agreement” and the consummation of such transactions, the “Closing”), by and among CC Neuberger Principal Holdings II, a Cayman Islands exempted company (“CCNB”), the Company (at such time, named Vector Holding, LLC, a Delaware limited liability company and wholly-owned subsidiary of CCNB), Vector Domestication Merger Sub, LLC, a Delaware limited liability company and wholly-owned subsidiary of the Company (“Domestication Merger Sub”), Vector Merger Sub 1, LLC, a Delaware limited liability company and a wholly-owned subsidiary of CCNB (“G Merger Sub 1”), Vector Merger Sub 2, LLC, a Delaware limited liability company and a wholly-owned subsidiary of CCNB (“G Merger Sub 2”), Griffey Global Holdings, Inc., a Delaware corporation (“Legacy Getty”), and Griffey Investors, L.P., a Delaware limited partnership (the “Partnership”). On the day prior to the Closing Date, the Company statutorily converted from a Delaware limited liability company to a Delaware corporation (the “Statutory Conversion”). On the Closing Date, CCNB merged with and into Domestication Merger Sub, with Domestication Merger Sub surviving the merger as a wholly-owned direct subsidiary of the Company (the “Domestication Merger”). Following the Domestication Merger on the Closing Date, G Merger Sub 1 merged with and into Legacy Getty, with Legacy Getty surviving the merger as an indirect wholly-owned subsidiary of the Company (the “First Getty Merger”). Immediately after the First Getty Merger, Legacy Getty merged with and into G Merger Sub 2 with G Merger Sub 2 surviving the merger as an indirect wholly-owned subsidiary of the Company (the “Second Getty Merger” and together with the First Getty Merger, the “Getty Mergers” and, together with the Statutory Conversion and the Domestication Merger, the “Business Combination”). See “Note 3 — Business Combination” for further details.
Legacy Getty was incorporated in Delaware on September 25, 2012, and in October of the same year, indirectly acquired Getty Images, Inc.
Business Overview
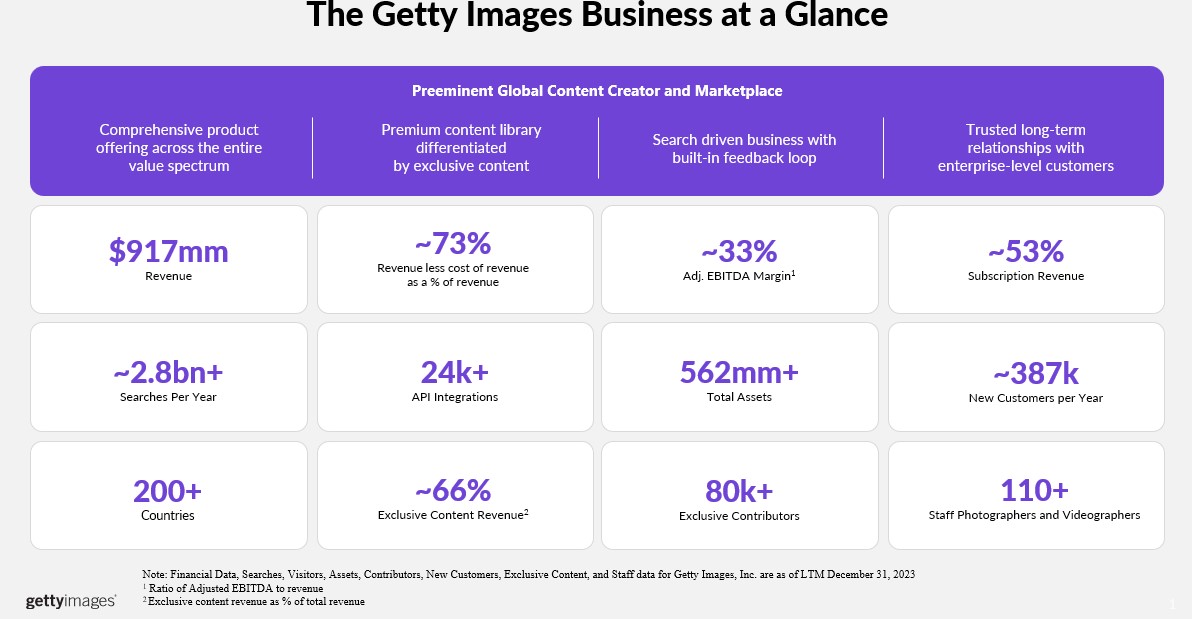
Getty Images was founded in 1995, with the core mission of bringing the world’s best creative and editorial visual content solutions to our customers to engage their audiences. We have developed market enhancements across e-commerce, content subscriptions, user-generated content, diverse and inclusive content, and proprietary research alongside investment in our technology platform, which includes generative AI-services designed to be commercially safe, natural language processing, AI based integrated APIs, to become a global, trusted industry leader in the visual content space.
Product Offerings
Our comprehensive product offering is designed to address the full spectrum of customers’ visual content needs.
| | | | | | | | | | | |
| | | |
| Content | Premium creative and editorial content including stills, music and video. | Budget-conscious creative stills and video | Free and very low cost creative stills |
| Key Customer | Enterprise customers | SMBs | SMBs, prosumers and professional/semiprofessional content creators |
| Go-to-Market Approach | Premium account management with supporting services (e.g., research, rights and clearance, digital asset management) | Primarily e-commerce and online service | Self-service |
| Rights | Extensive protections and rights customized to customer needs | Industry standard | Limited/no indemnification |
| Business Models | A la carte, subscription and custom assignments | A la carte and subscription | Subscription, Ad-supported and API monetization |
•Getty Images is our premium offering focused on corporate, agency, and media customers, serving the full breadth of our customers’ content needs by combining the highest quality content with premium support and customized rights and protections. Customers can purchase on an a la carte basis and through subscriptions, including our “Premium Access” product, where we enable customers to access our complete library of creative and editorial images and video and music, via one website and one set of terms. Our assignment capabilities along with our Custom Content offering, a subscription product that leverages Getty Images’ global network of photographers and videographers to create customized and exclusive project-specific content, enables Getty Images to produce cost-effective content to meet the specific needs of customers. In the fall of 2023, we launched Generative AI by Getty Images in partnership with NVIDIA Corporation (“NVIDIA”), which is designed to be a commercially safe AI image generation service that is trained exclusively with Getty Images creative content.
•iStock is our value offering of creative stills and videos, which provides a significant volume of exclusive image and video content to small to medium sized businesses, furnishing them with a powerful and cost-efficient means to produce and maintain their visual narrative. Customers can purchase on an a la carte basis and through a range of monthly and annual subscription options. Customers can also use Generative AI by iStock to create, ready to use AI generated content that is designed to be commercially safe and is trained exclusively with Getty Images creative content.
•Unsplash is a widely accessed, creative stills offering serving the fast-growing and broad-based creator economy ranging from prosumers and semi-professional creators to full time creative professionals working at corporates and agencies. Customers can purchase an unlimited subscription, which includes premium content that has specific legal protections, or download from the millions of free images.
•In addition to our websites, customers and partners can access and integrate our content, metadata, and search capabilities into their workflows via our APIs, such as through Canva, and through a range of mobile apps and plugins, including Adobe Creative Cloud, WordPress, and other publishing and workflow platforms.
•In recent years, we have shifted revenues toward subscription products including annual subscription products to drive revenue growth and durability. As of December 31, 2023, annual subscriptions represented more than half of total revenue. We offer a complete range of subscription products on our Getty Images, iStock and Unsplash websites. Our Premium Access subscription offers all of Getty Images’ Creative and Editorial image and video content and music in one subscription. We similarly continue to see more subscription adoption in e-commerce through our iStock subscription, which includes images video and music, and Unsplash+, which is an unlimited image-only subscription. In all cases, our annual subscriptions provide greater customer and revenue visibility and upside through expanded consumption and ongoing cross-sell and upsell opportunities via our dedicated Customer Success team.
Content & Services
While we go to market through our Getty Images, iStock, and Unsplash brands, we categorize our content and services into three categories — Creative, Editorial and Other.
•Creative: Creative is comprised of royalty free (“RF”) photos, illustrations, vectors, videos, and generative AI-services, that are released for commercial use and cover a wide variety of commercial, conceptual and contemporary subjects, including lifestyle, business, science, health, wellness, beauty, sports, transportation and travel. This content is available for immediate use by a wide range of customers with a depth, breadth and quality allowing our customers to produce impactful websites, digital media, social media, marketing campaigns, corporate collateral, textbooks, movies, television and online video content relevant to their target geographies and audiences. We primarily source Creative content from a broad network of professional, semi-professional and amateur creators, many of whom are exclusive to Getty Images. We have a global creative insights team dedicated to providing briefing and art direction to our exclusive contributor community. Creative represents 63.1%, 63.2% and 65.0% of our revenue of which 53.3%, 47.4% and 41.8% is generated through our annual subscription products, for the years ended December 31, 2023, 2022 and 2021, respectively. Annual Subscription products include products and subscriptions with a duration of 12 months or longer, Unsplash API and Custom Content.
•Editorial: Editorial is comprised of photos and videos covering the world of entertainment, sports and news. We combine contemporary coverage of events around the globe with one of the largest privately held archives globally with access to images spanning all the way back to the beginning of photography. We invest in a dedicated editorial team which includes over 110 staff photographers and videographers to generate our own coverage in addition to coverage from our network of content partners. Editorial represents 35.0%, 35.2% and 33.4% of our revenue, of which 53.3%, 52.1% and 53.5% is generated through our annual subscription products, for the years ended December 31, 2023, 2022 and 2021, respectively. Annual Subscription products include subscriptions with a duration of 12 months or longer.
•Other: Other represents 1.9%, 1.6%, and 1.6% of our revenue for the years ended December 31, 2023, 2022, and 2021, respectively. This includes music licensing, digital asset management and distribution services, print sales and data licensing.
With a consistently differentiated, authentic and high-quality content offering at our core, we have a rich history of embracing disruption and innovation with regard to how that content is packaged, accessed, licensed, created and distributed to an evolving universe of customers.
Comprehensive Premium Product Offering
Our differentiated, authentic and high-quality content offering is generated through:
•A growing base of more than 557,000 contributors, of which over 80,000 are exclusive to Getty Images.
•Over 70 exclusive editorial content partners, such as AFP, Disney, Globo, ITN, Bloomberg, BBC Studios, CBS, The Boston Globe, Fairfax Media, NBC News Archives and Sky News, who rely upon Getty Images to manage and license their content and Formula One, NBA, NHL, MLB, NASCAR, FIFA and International Olympic Committee, who, in addition to distributing content from their events through Getty Images, grant us unique commercial rights with event and content access.
•Nearly 400 dedicated staff content experts across creative and editorial who guide and contribute to the creation of over 10 million new visual assets per quarter and have been recognized with more than 1,400 major industry awards including the 2022 Pulitzer Prize for Breaking News Photography, World Press Photo, Picture of the Year International, Sony World Photography Awards, White House Photographer of the Year, The Lucie Awards, Visa d’Or, Ville de Perpignan Remi Ochlik, UK Picture Guild Awards, Press Photographer of the Year, Sports Photographer of the Year and Creative Review Photography Annual.
•A unique comprehensive visual archival collection covering a broad range of geographies, time periods and content categories such as news, sport, celebrity, music and fashion.
Collectively, these represent a growing library of over 562 million total assets that delivers unmatched depth, breadth, and quality to meet the expanding needs of our growing customer base. For more information, see “—Our Content Contributors” below.
Customers
Our customers are in the categories of corporate, agency and media. As of December 31, 2023, corporations, media, and agency customers contributed approximately 56%, 28%, and 16%, of revenue, respectively. Through our brands Getty Images, iStock and Unsplash, we reach customers from the largest enterprises to the smallest businesses and individual creators. In addition, we maintain deep integrations with internet platforms, ensuring broad access to our content across the creative economy.
Getty Images is privileged to work with the world’s leading companies every day. In 2023 and 2022, over 75% of our booked revenues were from customers that have a tenure of 10 years or more. In addition to maintaining strong revenue from highly tenured customers, we added more than 387,000 new customers during the year ended December 31, 2023.
We also have strong revenue diversification. For the year ended December 31, 2023, our top ten customers contributed less than 6% of our booked revenue.
Proprietary Platform & Infrastructure
The Getty Images and iStock websites and related systems are on a unified, global, cloud-based platform. We source and store our content on a common, scalable, and proprietary rights and content management system that supports all content types and categories. This platform enables customers to search, select, license, and download content from our websites and supports our centralized sales order processing, customer database management, finance, and accounting. We believe that our unified platform allows for resource efficiency and its scalability, reliability and flexibility allow us to service customers in any geography, handle a variety of visual content and address changing customer demands. From this unified platform, we benefit from a comprehensive view into customer behavior and needs, which allows us to effectively evolve our content offering, services and proprietary search algorithms to deliver the unique insights to our customers. We operate multiple websites which are available on a global basis, maintained in 23 different languages, localized for their respective markets, and which provide for e-commerce transactions in 24 local currencies.
Back-end integration across the Getty Images and iStock websites and brands allows for efficiency of use by customers, enabled by natural language processing and machine learning to understand the context and meaning behind a user’s search query, along with additional search capabilities that are enabled by patented search technology that attaches metadata such as captions, keywords, and tags to our content. Our metadata is translated by proprietary and patented controlled vocabularies into multiple languages. Dynamic image placement algorithms present the most relevant content to customers based on features such as customer location, search and license history, and the businesses type. We continuously invest in our digital platform to improve our customer experience and functionality through improvements in search engine optimization and marketing analytics, dynamic image placement algorithms, customer support and partner/API access, use of image recognition technologies, and development license models that adapt to customer needs and behaviors.
In 2023, we partnered with NVIDIA to train and deliver a monetizable, generative AI image tool, enhancing our offerings to our customers. It is trained exclusively on Getty Images creative content and data and provides customers with images designed to be commercially safe, while compensating contributors for the use of their copyrighted works as training data.
Marketing
Since 2019, we have improved our marketing efficiency, which has driven acceleration in our new customer growth, with new customers per million dollars of digital marketing spend increasing by more than 50% in 2023 when compared to 2019. We shifted our marketing mix to take advantage of free website traffic through affiliate partnerships, expanded our geographic investment, invested in search engine optimization, and implemented a rigorous data-driven e-commerce business. These steps have improved our marketing returns, resulting in decreased customer acquisition cost (since 2019 down by over 30% to $109 in 2023) and improved revenue opportunity and customer lifetime value.
Our Business Transformation
Over the past several years, we have reoriented our strategy and made significant business investments. Key initiatives implemented include:
•Unification and migration of our end-to-end platform to the cloud.
•Investment in best-in-class customer relationship management tools and technologies such as Salesforce.com.
•Transition of a significant share of our business to a differentiated subscription offering with strong retention characteristics.
•Successfully exited legacy declining products (Creative Rights Managed, Unauthorized Use and Thinkstock) to simplify our offering, reduce customer friction, and to better focus our resources.
•Invested in search engine optimization and altered our digital marketing deployment to accelerate new customer growth through our iStock brand.
•Launched our Custom Content offering to allow customers to efficiently secure brand and product- specific imagery through our global contributor network.
•Restructured our Sales, Customer Success Management, and Customer Service functions to take advantage of our global scale to reduce costs and improve service levels.
•Acquired Unsplash, monetized API offerings on Unsplash and launched Unsplash+, the unlimited subscription model, all of which allows us to tap into the growth of the creator economy long tail.
•Partnership with leading technology companies, including NVIDIA, Bria AI and Runway, to develop image and video generative AI models and services designed to be commercially safe that compensate creators on a recurring basis for the use of their content as training data.
•Extended search experience to accept natural language queries, allowing customers to be more expressive in their searches and, in turn, we better understand their intent and serve content that meets their needs.
•Continued to deleverage our balance sheet, including the principal payment in August 2022 of $300 million and further voluntary payments totaling $50.4 million in 2023 under our Credit Facility.
We believe that our transformation and investments, together with the changes driving industry growth, set the stage for our next phase of growth.
Growth Strategies
We believe we are well-positioned to continue generating revenue and strong cash flow by capitalizing on the increasing demand for visual content driven by long-term trends through our differentiated end-to-end content offering, our established brands and corresponding market coverage, and our strong value proposition to customers and content providers. We anticipate our future growth to be driven by the following strategies:
Capturing growth within the Corporate Market: The corporate market has been a clear and steady source of growth over the last several years and we believe a large corporate market opportunity still exists. To capture this opportunity, we realigned our sales force and their incentives to target further penetration and upsell of the corporate market. Furthermore, we increased our customer service capabilities and resources against the segment and launched new and upgraded products to better meet corporate needs. Through our Custom Content product, we are able to leverage our contributor network to deliver budget-friendly custom photos, illustrations and videos to customers. Through continued investment and focus, our management believes that it can further accelerate growth across the corporate segment.
Accelerate our penetration across high-growth geographies: We are focused on deepening our international reach by investing in digital marketing, search engine optimization and further localization of our services, offerings and content in geographies where we are underpenetrated. We believe we are well-positioned from a brand, content, and product perspective across 23 languages and 24 currencies to capture an increased share of these attractive, underpenetrated market opportunities.
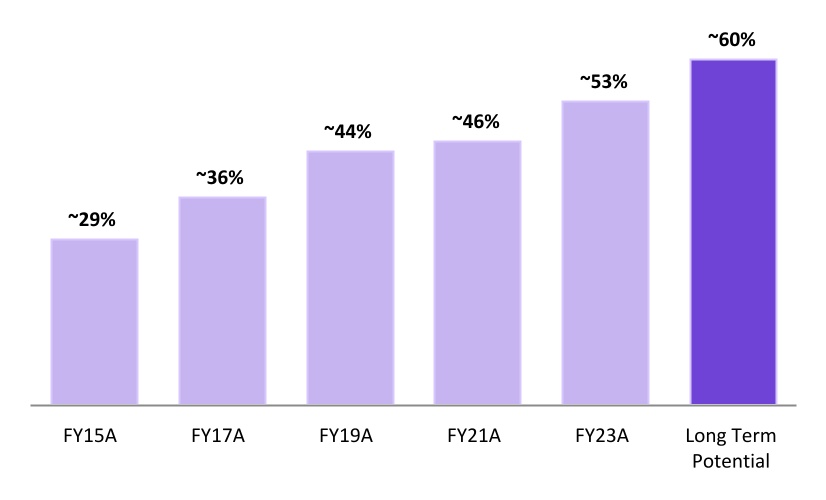
Continued emphasis on subscription offerings: Annual subscription revenues now comprise roughly half our total revenue, and we expect to further increase penetration over time through an emphasis on our e-commerce offerings and continued growth of our larger subscription offerings.
Annual Subscription Revenue 1
1Represents annual subscription product revenue as a percentage of total revenue (excluding certain retired products )
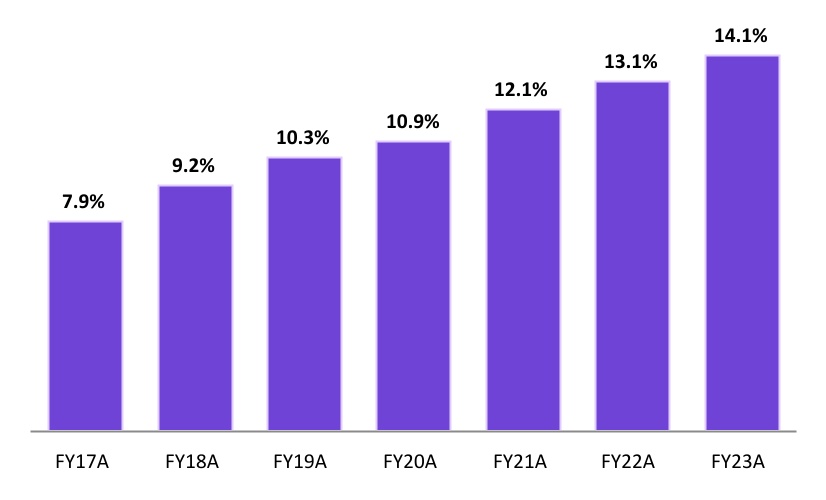
Continue to grow video consumption: The video attachment rate, a measure of the percentage of total paid customer downloaders who are video downloaders, increased to 14.1% for the year ended December 31, 2023 from 13.1% for the year ended December 31, 2022. However, approximately 27% of Getty Images and 11% of iStock customers purchase
video. We expect more customers to use video in the future, which we believe creates a stickier customer that potentially consumes and spends more on our platform.
Video Attachment Rate 1
1Attachment is calculated as % of downloaders who downloaded video from all offerings (inclusive of subscription and non-subscription products).
Increase wallet share within existing customer base: We expect to increase wallet share with existing customers by upselling into larger subscription products with increased download caps and including video. Additionally, we can cross sell into products such as Generative AI, Custom Content, music, and Media Manager, our digital asset management product. These offerings drive significant increases in Average Annual Revenue per User (“ARPU”) from our corporate customers and drive high customer retention.
Monetize reach into evolving creator economy: We believe our acquisition of Unsplash has strengthened our position in the rapidly growing “creative long-tail” economy. Unsplash attracts more than 22 million visitors per month and has over 24,000 API integrations. Traffic has grown significantly in the last three years, with monthly image downloads averaging more than 106 million, which we believe reflects the significant opportunity across the “long tail” creator economy. In addition to growing the existing advertising revenue streams, we are monetizing existing API integrations through licensing fees and Unsplash+, an unlimited subscription that launched October 2022, that includes premium content (with corresponding license protections) to Unsplash users.
Opportunities for AI, data and insights: We have partnered with leading AI innovators such as NVIDIA, Bria AI and Runway, to develop generative AI models that are designed to deliver commercially safe image generation services. As part of these efforts, in 2023 we launched Generative AI by Getty Images and in early 2024 Generative AI by iStock, which are designed to be commercially-safe AI text to image generation services, available on gettyimages.com and istock.com. We have and will continue to leverage Artificial Intelligence and Machine Learning capabilities to improve the relevance and effectiveness of our imagery, our search efficiency and enable image editing. We are continuously investing to bring unique capabilities and insights to increase customer stickiness and to drive new revenue streams. Getty Images also licenses the use of its visual assets and associated metadata to customers in connection with the development of artificial intelligence and machine learning tools.
Pursue accretive and strategic acquisitions: We have a successful track record of executing and integrating acquisitions. We have been able to leverage our content, brands, and large customer base to enter related, but adjacent markets to achieve efficiencies and accelerate growth.
Our Content Contributors
The content we license to our customers is sourced from more than 557,000 photographers, videographers, illustrators, and image partners from almost every country in the world. We do not rely on any single individual or group of suppliers to meet our content supply needs. Content sourced from any single content supplier accounted for no more than 3% of revenue in the year ended December 31, 2023. As of December 31, 2023, we owned or licensed more than 562 million images and videos.
More than 110 staff photographers and videographers and over 80,000 contributors, which includes premium content partners, provide content to Getty Images on an exclusive basis. These exclusive relationships allow for transparent information and the sharing of research and insights with contributors. Nearly 66% of our revenue was generated from exclusive content during 2023 highlighting customer demand for high quality, differentiated content in a world with nearly infinite visual content. For the year ended December 31, 2023, we paid nearly $220 million in royalties to our content contributors, which includes content partners.
Independent contributors
Independent contributors typically fund their own production costs and retain copyright ownership of their content but enter contracts with Getty Images granting global distribution and pricing rights, often on an exclusive basis. These content sourcing agreements also provide representations and warranties by content suppliers as to the copyrights and other intellectual property rights in the content, including representations as to the released nature of the content, if relevant.
Image Partners
Image partners are third-party companies that license their collection of content through us. We generally act as our image partners’ primary or exclusive distribution channel, enabling us to commercialize their editorial coverage of news, entertainment and sporting events and their fully released creative content. Image Partners provide both their wholly-owned and third-party contributor content to us for license through our extensive global network.
Staff and Freelance photographers/videographers
We have more than 110 full-time staff photographers and videographers, who supply Editorial photos and video content across news, sports, and entertainment. These staff professionals are award-winning experts in their fields and are employed by Getty Images. For most staff-produced content, we pay very limited, if any, royalties. We also utilize our global network of freelance photographers to cover events. In many cases, we own the resulting copyright and pay no royalties as these photographers are paid a set rate to shoot the event.
Archive
Getty Images maintains one of the largest and best privately-owned photographic archives in the world with over 135 million images cross geographies, time periods and verticals. Additionally, we exclusively represent and maintain unique archives such as Hulton, Bettman, Sygma and Gamma. These key collections often hold historical significance and are irreplaceable. We believe they are a key differentiator versus competitors.
Competition
The market for digital content and related services is highly competitive and rapidly evolving. Our current and potential domestic and international competitors range from large established companies to emerging start-ups across different industries. Our competitors include: online marketplaces and traditional stock content suppliers of current and archival creative and editorial imagery and stock video; specialized visual content companies in specific geographic regions; providers of free images, music and video and related tools; websites specializing in image search, recognition, discovery and consumption; websites that host and store images, art and other related products; those providers of visual content creation and editing tools that include integrated stock content in their product offering; providers of cloud-based digital asset management tools; social networking and social media services; generative AI-services; and commissioned photographers and photography agencies. There are also a very large number of small stock photography and video agencies, image content aggregators and individual photographers throughout the world with whom we compete. We also compete for content contributors on the basis of several similar factors including ease and speed of the upload and content review process; the volume of customers who license their submitted content; contributor commission models and practices; the degree to which contributors are protected from legal risk; brand recognition and reputation; the effective use of technology; the global nature of our interfaces; and customer service. Additionally, we compete with in-house or self-created content. We believe our principal competitors for creative content are Shutterstock and AdobeStock and our principal competitors for editorial content include the Associated Press and Reuters.
Intellectual Property
A significant portion of the content that we distribute is licensed to us from individual photographers and videographers and image partners. Content suppliers typically prefer to retain copyright ownership of their work and, as a result, copyright to content remains with the artists in most cases, even while we maintain the right to market, display, distribute and license the imagery, illustration or video on their behalf, globally. We own the copyrights to imagery and video produced by staff photographers as well as any created on a work-for-hire basis, and to imagery and video acquired from third parties. We also own numerous trademarks and have the rights to corresponding internet domain names such as Getty Images (www.gettyimages.com), iStock (www.istock.com) and Unsplash (www.unsplash.com), which are important to the business and have significant value. Depending on the jurisdiction, trademarks are valid as long as they are in use and/or their registrations are properly maintained, and they have not been found to have become generic. We have successfully recovered domain names that include infringing trademarks in the past and intend to continue to enforce our rights in the future. Although we own the Getty Trademarks, in certain specified scenarios, Getty Investments LLC (“Getty Investments”) has the option to acquire, for a nominal sum, all rights to the Getty Trademarks. See “Item 1A. Risk factors—Operational risks relating to our business—We may lose the right to use “Getty Images” trademarks in the event we experience a change of control.” We also own copyrights, including certain content on our web properties, publications and designs, as well as patents, including with respect to our display systems and search capabilities. These intellectual property rights are important to our business and marketing efforts. The duration of the protection afforded to our intellectual property depends on the type of property in question, the laws and regulations of the relevant jurisdiction and the terms of our license agreements with others. We protect our intellectual property rights by relying on federal, state, and common law rights, including registration, in the United States and applicable foreign jurisdictions, as well as contractual restrictions. We enforce and protect our intellectual property rights through litigation from time to time, and by controlling access to our intellectual property and proprietary technology, in part, by entering into confidentiality and proprietary rights agreements with our employees, consultants, contractors, and vendors. In this way, we have historically chosen to protect our software and other technological intellectual property as trade secrets. We further control the use of our proprietary technology and intellectual property through provisions in our websites’ terms of use and license agreements.
Human Capital
Our Culture and Values
At the core of our business is a mission to move the world. We pursue our mission through our images, videos, and illustrations, which seek to inform, drive debate, entertain, inspire, and challenge historical biases.
By capturing powerful imagery, we strive to make an impact for today and for posterity. Our imagery moves hearts and minds across the globe, shifting perceptions and powering commerce and ideas at the same time.
Beyond our mission, we also hold ourselves accountable to a shared culture which is customer-focused, results-driven, team-oriented and which maximizes the contribution of our employees toward our shared goals (our “Leadership Principles”):
•We are trustworthy, transparent and honest.
•We always raise the bar.
•We collectively bring solutions.
•We care, are kind, courteous and respectful.
•We are inclusive of different voices, perspectives and experiences.
•We are one Getty Images with no silos.
•We deliver on our commitments and commercial goals.
•We put the customer at the heart of everything we do.
•We reject biased behavior and discrimination.
Employees
As of December 31, 2023, we had more than 1,700 employees, of which approximately 63% were located in the Americas region, approximately 30% in the EMEA region, and the remainder in the APAC region. Some of our employees in Brazil, Germany, France and Spain are subject to collective bargaining agreements that set minimum salaries, benefits, working conditions and/or termination requirements. We consider our employee relations to be satisfactory. See “Item 1A. Risk
Factors—The loss of key personnel, an inability to attract and retain additional personnel or difficulties in the integration of new members of our management team into our Company could affect our ability to successfully grow our business.”
Diversity and Inclusion
Our vision for diversity and inclusion is a Getty Images whose employees, contributors, and imagery reflects the diversity of our customers and markets around the globe and our culture enables individuals to come to work as themselves, be treated with respect and be given equal opportunities, and will ensure their perspectives and experiences are included in our decision making.
We are committed to building a diverse community and creating an environment in which all can thrive. How we hire, develop, and compensate at all levels and in all departments, including our global network of content creators, must address systemic bias.
We are committed to supporting our employees, where all experiences and backgrounds are respected and where everyone comes together to produce amazing imagery, support our customers and impact the world. We are committed to eradicating and dismantling inequities and barriers that prevent individuals from being seen, heard, valued and respected for their full authentic selves.
We are committed to a work environment that is a safe and inclusive space for all individuals. We are committed to increasing the diversity of our staff, our leadership, and our content creators. We are committed to open dialogue and provide resources and training in support of our collective learning journey. We are committed to providing authentic and positive depiction across all marginalized communities.
We maintain a Global Advisory Committee on Diversity and Inclusion comprised of 21 employees from our global employee base. The committee’s responsibilities encompass auditing and advising the business’ diversity and inclusion efforts and progress while supporting and engaging local offices, Employee Resource Groups and employees.
Employee Opportunity
Our more than 1,700 employees represent the diverse communities they live and work in around the world. They come from more than 33 countries, and include working parents, military spouses and veterans. They bring a wide berth of perspectives and experiences to drive our mission.
We seek to ensure our employees are recognized and rewarded, feel empowered and inspired as they live out our Leadership Principles every day. We foster an environment of transparency, always seeking to learn and improve our employee experience. We do this by engaging with employees in regular feedback loops, including live discussions and a bi-annual engagement survey, and that feedback then provides insights that fuel our employee programming from learning and development to our total rewards approaches and everything in between. Internationally, we customize our compensation and benefits to remain competitive and responsive to our employees’ needs, including global mental health and well-being programs.
We provide many opportunities for learning and growth, cultivating a culture of curiosity. These include formal and informal mentoring opportunities, high potential programming, leadership learning, content development hours to inform on our product offerings, and tailored learning across all functions. We believe in providing learning across various platforms and media as well, recognizing the learning differences of our employees.
We are defining a future of work that is more flexible, digital, and purposeful. Our approach aims to empower employees to do their best work in the setting that works for them, supporting employee flexibility while balancing business needs.
Government Regulation
The legal environment of the internet is evolving rapidly throughout the world. Numerous laws and regulations have been adopted at the national and state level in the United States and across the globe that could have an impact on our business. These laws and regulations include, but are not limited to, the following:
•The Digital Millennium Copyright Act, which regulates digital material and created updated copyright laws to address the unique challenges of regulating the use of digital content.
•The Directive on Copyright in the Digital Single Market, which regulates a marketplace for copyright in the European Union.
•The Controlling the Assault of Non-Solicited Pornography and Marketing Act of 2003 and similar laws adopted by a number of states, which regulate the format, functionality and distribution of commercial solicitation e-mails, create criminal penalties for unmarked sexually-oriented material, and control other online marketing practices.
•The Children’s Online Privacy Protection Act and the Prosecutorial Remedies and Other Tools to End Exploitation of Children Today Act of 2003, which regulate the collection or use of information, and restrict the distribution of certain materials, as related to certain protected age groups. In addition, the Protection of Children from Sexual Predators Act of 1998 provides for reporting and other obligations by online service providers in the area of child pornography.
•The Federal Trade Commission Act and numerous state “mini-FTC” acts, which bar “deceptive” and “unfair” trade practices, including in the contexts of online advertising and representations made in privacy policies and other online representations.
•The European Union General Data Protection Regulation and UK Data Protection Act, which regulate how we can collect and process the personal data of, primarily, European Union and UK residents.
•The California Consumer Privacy Act (as amended by the California Privacy Rights Act, together the “CCPA”) which regulates how we can collect and process the personal data of California residents.
•The Colorado Privacy Act (“CPA”), which regulates how we can collect and process the personal data of Colorado residents.
•The Connecticut Data Privacy Act (“CTDPA”), which regulates how we can collect and process the personal data of Connecticut residents.
•The Utah Consumer Privacy Act (“UCPA”), which regulates how we can collect and process the personal data of Utah residents.
•The Virginia Consumer Data Protection Act (“VACDPA”), which regulates how we can collect and process the personal data of Virginia residents.
•The Illinois Biometric Information Privacy Act (“BIPA”), which regulates how we can collect and process biometric identifiers of Illinois residents.
•The Texas Capture or Use of Biometric Identifier Act (“CUBI”), which regulates how we can collect and process biometric identifiers of Texas residents.
•The Washington Biometric Privacy Law (“H.B. 1493”), which regulates how we can collect and process biometric identifiers of Washington residents.
In particular, we are subject to U.S. federal and state, and foreign laws and regulations regarding privacy and data protection as well as foreign, federal and state regulation. In certain instances, we may also have obligations under several U.S. state data breach or breach notification laws. Foreign data protection, privacy, content regulation, consumer protection, and other laws and regulations can be more restrictive than those in the United States and often have extraterritorial application, and the interpretation and application of these laws are continuously evolving and remain in flux. See “Item 1A. Risk Factors—We collect, store, process, transmit and use personal information, which subjects us to governmental regulation and other legal obligations related to privacy, information security and data protection in many jurisdictions. Any cybersecurity breaches or our actual or perceived failure to comply with such legal obligations by us, or by our third-party service providers or partners, could harm our business.”
In addition, from a taxation perspective, there are applicable and potential government regulatory matters that may impact us. In particular, certain provisions of the Tax Cuts and Jobs Act of 2017 (the “TCJA”) have had and will continue to have a significant impact on our financial position and results of operations. The TCJA continues to be subject to further regulatory interpretation and technical corrections by the U.S. Treasury Department and the I.R.S. and therefore, the full impact of the TCJA on our tax provision may continue to evolve. Further, we continue to remain subject to uncertainty related to foreign jurisdictions’ potential reactions to the TCJA, as well as evolving regulatory views and legislation regarding taxation of e-commerce businesses such as the Organization for Economic Cooperation and Development’s Base
Erosion and Profit Shifting proposals and other country specific digital tax initiatives. As these and other tax laws and related regulations continue to evolve, our financial results could prospectively be materially impacted. See “Item 1A. Risk Factors—Our operations may expose us to greater than anticipated income and transaction tax liabilities that could harm our financial condition and results of operations.”
Seasonality
Our operating results may fluctuate from quarter to quarter and year to year as a result of a variety of factors, including as a result of major sporting events, world events or otherwise. Our quarterly and annual results may also reflect the effects of intra-period trends in customer behavior. Because a significant portion of our revenue is derived from repeat customers who have purchased subscription plans, our revenues have historically been less susceptible to quarterly seasonality.
In addition, expenditures on content by customers tend to be discretionary in nature, reflecting overall economic conditions, the economic prospects of specific industries, budgeting constraints, buying patterns and a variety of other factors, many of which are outside our control. As a result of these and other factors, the results of any prior quarterly or annual periods should not be relied upon as indicators of our future operating performance.
Available Information
Our annual reports on Form 10-K, quarterly reports on Form 10-Q, current reports on Form 8-K and amendments to those reports filed or furnished pursuant to Section 13(a) or 15(d) of the Securities Exchange Act of 1934, as amended (the “Exchange Act”) as well as proxy and information statements and other information that we file, are available free of charge through our Internet website as soon as reasonably practicable after we electronically file such material with, or furnish such material to, the United States Securities and Exchange Commission (“SEC”). Our Internet website and the content contained therein or connected thereto are not intended to be incorporated into this Annual Report on Form 10-K. The SEC maintains an Internet website at www.sec.gov, which also contains reports, proxy and information statements and other information that we file electronically with the SEC. We routinely post important information on our website, www.gettyimages.com. We also may use our website as a means of disclosing material, non-public information and for complying with our disclosure obligations under Regulation FD. Accordingly, investors should monitor our website, in addition to following our press releases, SEC filings, public conference calls, presentations and webcasts. The information contained on, or that may be accessed through, our website is not incorporated by reference into, and is not a part of, this document.
Copies of the Company’s Annual Report on Form 10-K for the year ended December 31, 2023 may also be obtained by stockholders without charge upon written request to: Getty Images Holdings, Inc., 605 5th Ave S., Suite 400, Seattle, Washington 98104, ATTN: Investor Relations.
Item 1A. Risk Factors.
In addition to the other information contained in this Annual Report, including the matters addressed under the heading “Cautionary Note Regarding Forward-Looking Statements,” you should carefully consider the following risk factors in this Form 10-K before investing in our securities. The risk factors described below disclose both material and other risks, and are not intended to be exhaustive and are not the only risks facing us. Additional risks not currently known to us or that we currently deem to be immaterial also may materially adversely affect our business, financial condition, results of operations and cash flows in future periods or are not identified because they are generally common to businesses.
Summary Risk Factors
•Operational Risks Related to Our Business
◦Our inability to attract new and retain existing and repeat customers;
◦Our inability to offer relevant, quality and diversity of content to satisfy customer needs;
◦The intense competition we face could reduce our revenues, margins and operating results;
◦Our inability to successfully execute our business strategy;
◦Risks resulting from increased costs incurred in implementing our business strategy;
◦Our inability to maintain an effective system of internal control over financial reporting;
◦Losing the right to use the “Getty Images” trademark;
◦Our inability to adapt to industry change;
◦The increasing use of AI applications such as generative AI technologies that may result in harm to our brand, reputation, business, or intellectual property;
◦Failure to develop, market, sell or enhance new or existing products and services;
◦Our failure to successfully expand into new international markets;
◦Risks resulting from actions by governments to restrict access to our services;
◦Negative impacts of currency fluctuations;
◦Our inability to adequately maintain, adapt and upgrade our websites and technology systems to ingest and deliver higher quantities of new content;
◦Technological interruptions that impair access to our websites or the efficiency of our websites and technology systems damaging our reputation and brand;
◦Our failure to protect the proprietary information of our customers and our networks against cybersecurity breaches;
◦Our inability to acquire or integrate new content and product lines;
◦Potential for goodwill or other intangible asset impairment charges
◦Our inability to obtain additional capital on commercially reasonable terms; and
◦Our incurrence of debt, which could have a negative impact on our financing options and liquidity position.
•Risks Related to Personnel
◦The impact of worldwide economic, political and social conditions on our business;
◦The loss of key personnel, an inability to attract and retain additional personnel or difficulties in the integration of new members of our management team into our business;
◦Risks related to our use of independent contractors;
◦Our inability to protect and enforce our intellectual property rights;
•Risks Related to Our Intellectual Property and Confidential Information
◦Infringement on intellectual property rights of third parties;
◦Risks associated with the use of “open source” software;
◦Risks associated with scraping our content for use in training AI models and services;
•Risks Related to Legal and Regulatory Matters
◦An increase in government regulation of the industries and markets in which we operate, including with respect to the internet, e-commerce and AI;
◦Risks associated with public disclosure regulations and expectations, including with respect to environmental, social and governance matters;
◦Exposure to greater than anticipated income and transaction tax liabilities;
◦Our inability to comply with privacy, information security and data protection regulations and legal obligations;
◦Payment-related risks that may result in higher operating costs or the inability to process payments;
◦Complaints or litigation that may adversely affect our business and reputation;
•Risks Related to Our Class A Common Stock
◦Risks related to our status as an “emerging growth company” and “smaller reporting company”;
◦Class A common stock price volatility;
◦Lack of an active trading market for our Class A common stock;
◦Future sales of shares by existing stockholders could cause our stock price to decline;
◦Delaware law and provisions of our organizational documents that make a merger, tender offer, or proxy contest difficult, thereby depressing the trading price of our Class A common stock;
◦Forum selection provisions in our Amended and Restated Certificate of Incorporation;
◦Our inability to pay dividends for the foreseeable future; and
◦Additional issuances of shares of Class A common stock or other equity securities without shareholder approval.
Operational Risks Related to Our Business
Our business depends in large part on our ability to attract new and retain existing and repeat customers.
More than a majority of our revenue is derived from customers who have licensed content from us in the past. We are also increasingly seeing the mix of revenue shift to committed revenues from annual subscription products. We must ensure that existing customers remain active customers and that we are successful in renewing our committed content agreements, including Premium Access agreements and iStock annual subscriptions. Our future performance largely depends on our ability to attract new and retain existing customers. We employ various customer experience, content, marketing and pricing strategies to incentivize customers to seek and use our content. Our customer experience strategies may be unsuccessful, due to lack of available and desirable content, the depth and breadth of our current and future product offerings, lack of differentiated content, a decline or failure in the quality and accuracy of our search algorithms, the features and functionality of our websites, payment systems and effectiveness of our sales support. As new and emerging platforms and content distribution systems emerge, including but not limited to generative AI generated content and services powered by generative AI, our customers may no longer want to source content from distributors such as us. In addition, our marketing strategies may not attract new customers, our content strategies may not attract relevant content from a suitably diverse network of suppliers and our pricing strategies may discourage purchases. To the extent that we are unable to attract new customers, our costs to acquire and retain customers increase, or our existing customers do not continue to license content from us for these or any other reasons, our results of operations and financial condition could be materially and adversely affected.
We may be unable to offer relevant quality and diversity of content to satisfy customer needs, including due to an inability to license content owned by third parties, which may become unavailable to us on commercially reasonable terms or may not be available at all.
We generate a significant majority of our revenue from content that we source from third parties. We typically acquire rights in such content from suppliers through licenses, either on an exclusive or non-exclusive basis, with the ability to grant sublicenses. If we are unable to renew our supply agreements with third-party suppliers or if such suppliers otherwise fail to continue to provide us with relevant content or cease providing content that we currently or may in the future license, we may be unable to offer our customers the depth and breadth of content they may demand. In addition, other digital content distributors who currently or in the future may offer competing content and services may offer content suppliers higher royalties, easier submission workflows and platforms, less rigorous ingestion practices, and/or exclusivity incentives, and/or take other actions that could make it more difficult or impossible for us to license existing or new content from third party suppliers. Such third party suppliers may choose to stop distributing new content with us or remove their existing content from our collection. If we are unable to continue to offer a wide variety of content at reasonable prices with acceptable license rights, our financial condition and results of operations could be materially and adversely affected and future growth prospects limited.
Our business is highly competitive, and we face intense competition from a number of companies and technologies, which could reduce our revenues, margins and results of operations.
The digital media content industry is fragmented and intensely competitive, and competition may intensify in the future. Increased competition may result in our loss of market share, pricing pressure and reduced profit margins, any of which could materially and adversely affect our business and results of operations.
We compete with a wide array of entities, including large media companies, individual content creators and newly emerging generative AI technologies. These competitors include:
•traditional stock content providers;
•other online platforms from which imagery may be sourced that provide both paid and no-cost licenses, including content created on demand or through generative AI models;
•other specialized editorial and video content providers that are established in local, content or product-specific market segments;
•independent photographers, filmmakers, musicians and related agencies;
•crowd-sourced distribution platforms, social networking and image hosting services; and
•emerging products and services powered by generative AI.
Many of our competitors have or may obtain significantly greater financial, marketing or other resources or greater brand awareness than we have. Some of these competitors may be able to respond more quickly to new or expanding technology, such as newly emerging generative AI technologies, and devote more resources to product development, marketing or content acquisition than we can. Industry consolidation could result in stronger competitors that are better able to compete for customers. This could lead to more variability in results of operations as we compete with larger competitors and could have a material adverse effect on our business, results of operations, and financial condition.
In addition, new competitors may enter our market, including those that rely on generative AI technologies. They and existing competitors could focus investment in creating, sourcing, archiving, indexing, reviewing, searching, purchasing or delivering content more easily or more affordably. The barriers to creating a website platform that allows for the license of digital content are low, which could result in greater competition. New entrants, as well as existing competitors, may raise significant amounts of capital (or leverage relationships with other competitors or investors) and they may choose to prioritize increasing their market share and brand awareness over profitability, including, for example, by investing more in content offerings, marketing or pricing strategies such as delivering AI generated content, offering higher royalties for exclusivity or lowering content prices. Some of these new competitors may also invest in other existing competitors, increasing market pressure on our offerings.
Competitors could develop products or services that render ours less desirable or obsolete. External factors such as our competitors’ pricing and marketing strategies could impede our ability to meet customer expectations. Our competitors may be able to attract talented staff from us and others to devote greater resources to research and development of products and technologies. Increased competition and pricing pressures may result in reduced sales, lower margins, losses or the failure of our product and services to maintain and grow their current market share, any of which could harm our business. If we are unable to compete successfully against competitors and adapt to emerging technologies, our financial condition, growth prospects and results of operations could be materially and adversely affected.
We may be unsuccessful in executing our business strategy.
The success of our business and our future growth prospects relies on our ability to execute our business strategies in making available desired content and expanding our global customer base. There can be no assurance that we will be able to continue to execute any or all of our strategies, including our ability to provide a proprietary platform and infrastructure as well as our acquisition strategy. Failure to execute these strategies on a timely and cost-effective basis could have a material and adverse effect on our financial condition and results of operations and could limit our growth prospects.
We have incurred and expect to continue to incur increased costs and our management will continue to face increased demands as a result of continuously improving our operations as a public company.
We have incurred and expect to continue to incur significant legal, tax, insurance, accounting and other expenses as a result of conducting our operations as a public company. Changing laws, regulations and standards relating to corporate governance and public disclosure, including the Sarbanes-Oxley Act of 2002, the Dodd-Frank Wall Street Reform and Consumer Protection Act of 2010 and related regulations implemented by the SEC and the stock exchanges increase legal and financial compliance costs and making some activities more time-consuming. We are currently evaluating and monitoring developments with respect to new and proposed rules and cannot predict or estimate the amount of additional costs we may incur or the timing of such costs. These laws, regulations and standards are subject to varying interpretations, in many cases due to their lack of specificity, and, as a result, their application in practice may evolve over time as new guidance is provided by regulatory and governing bodies. Further, there may be uncertainty regarding the implementation of these laws due to changes in the political climate and other factors. Our compliance with Section 404 of the Sarbanes-Oxley Act requires that we incur substantial accounting expense and expend significant management efforts. We have incurred and expect to continue to incur costs to obtain directors’ and officers’ insurance as a result of operating as a public company, as well as additional costs necessitated by compliance matters and ongoing revisions to disclosure and governance standards.
These and other increased costs associated with operating as a public company may decrease our net income or increase our net loss and may cause us to reduce costs in other areas of our business or increase the prices of our products or services to offset the effect of such increased costs. Although we continue to evaluate and manage our costs, the ability to effectively manage such costs is subject to risks and uncertainties, and we cannot be sure that these activities, or any other activities that we may undertake in the future, will achieve the desired cost management or efficiencies. Failure to effectively manage our costs, whether as a result of being a public company or otherwise, could adversely affect our results of operations and financial condition and curtail investment in growth opportunities
If we fail to maintain an effective system of internal control over financial reporting, we may not be able to report our financial results accurately or in a timely fashion, and we may not be able to prevent fraud; in such case, our stockholders could lose confidence in our financial reporting, which would harm our business and could negatively impact the price of our stock.
As a public company, we required by the Sarbanes-Oxley Act to establish and maintain corporate oversight and adequate internal control over financial reporting and disclosure controls and procedures. Effective internal control is necessary for us to provide reliable, timely financial reports and prevent fraud.
Our testing of our internal controls, or the testing by our independent registered public accounting firm, may reveal deficiencies in our internal control over financial reporting that we would be required to remediate in a timely manner to be able to comply with the requirements of Section 404 of the Sarbanes-Oxley Act each year. If we are not able to comply with the requirements of Section 404 of the Sarbanes-Oxley Act in a timely manner each year, we could be subject to sanctions or investigations by the SEC or other regulatory authorities, which would require additional financial and management resources and could adversely affect the market price of our shares of Class A common stock. Furthermore, if we cannot provide reliable financial reports or prevent fraud, our business and results of operations could be harmed and investors could lose confidence in our reported financial information.
We may lose the right to use “Getty Images” trademarks in the event we experience a change of control or otherwise exceed the permitted usage of this trademark.
We own trademark registrations and applications for the name “Getty Images.” We use “Getty Images” as a corporate identity, as do certain of our subsidiaries. We refer to these trademark registrations and trademark applications as the “Getty Images Trademarks.” Pursuant to the Restated Option Agreement (as defined below) and the Fourth Amendment to the Restated Option Agreement, in the event that one or more third parties not affiliated with Getty Investments acquire a controlling interest in us, for so long as Getty Investments, Mark Getty, The October 1993 Trust and The Options Settlement (collectively, the “Getty Family Stockholders”) (together with their respective successors and any permitted transferees) beneficially own more than 27,500,000 shares of Class A common stock (the “Ownership Threshold”), Getty Investments has the option to acquire, for a nominal sum, all rights to the Getty Images Trademarks.
If the Getty Family Stockholders (together with their respective successors and any permitted transferees) fall below the Ownership Threshold, their option referred to herein will terminate. After an exercise of the option, we would be permitted to continue to use the Getty Images Trademarks for 24 months, and thereafter we would have to cease such use. Getty Investments may also exercise the option if we cease all use of the Getty Images Trademarks. We may not sell, transfer or encumber the Getty Images Trademarks, or any interest therein, without the prior written consent of Getty Investments. In addition, we may not use the Getty Images Trademarks for any direct-to-consumer sales beyond an incidental and limited level. The loss of rights to the Getty Images Trademarks could have a material adverse effect on our business, results of operations and financial condition.
We operate in new and rapidly changing markets, which makes it difficult to evaluate our future prospects and may increase the risk that we will not be successful.
The market for commercial digital imagery and other content is a rapidly changing market, characterized by changing technologies, intense price competition, the introduction of new competitors, evolving industry standards, changing and diverse regulatory environments, frequent new service announcements and changing consumer demands and behaviors. Our inability to anticipate these changes and adapt our business, platform, and offerings could undermine our business strategy. Our business strategy and projections, including those related to our revenue growth and profitability, rely on a number of assumptions about the market for commercial digital content, including the size and projected growth of the imagery and video markets over the next several years. Some or all of these assumptions may be incorrect. In particular, our growth is highly dependent upon the continued demand for commercial digital content. To the extent that demand for commercial digital content does not continue to grow as expected or decreases, our revenue growth and profitability may be materially and adversely affected. Our growth strategy is dependent, in part, on our ability to timely and effectively launch new products and services, the development of which are uncertain, complex and costly. In addition, we may be unable successfully and efficiently to address advancements in distribution technology, marketing and pricing strategies and content breadth and availability in certain or all of these markets, which could materially and adversely affect our growth prospects and results of operations.
The limited history of some of the markets in which we operate makes it difficult to effectively assess our future prospects, and our business and prospects should be considered in light of the risks and difficulties we may encounter in these evolving markets. We cannot accurately predict whether our products and services will achieve significant acceptance by potential customers in significantly larger numbers or at the same or higher price points than at present. Our historic growth rates should therefore not be relied upon as an indication of future growth, financial condition or results of operations.
The increasing use of AI applications such as generative AI technologies may result in harm to our brand, reputation, business, or intellectual property, and could otherwise adversely affect our results of operations.
Uncertainty around new and emerging AI applications such as generative AI content creation may require additional investment in the development of proprietary datasets and machine learning models, development of new approaches and processes to provide attribution or remuneration to content creators and building systems that enable creatives to have greater control over the use of their work in the development of AI, which may be costly and could impact our profit margin. Developing, testing, and deploying AI systems may also increase the cost profile of our offerings due to the nature of the computing costs involved in such systems.
Further, Generative AI technology may negatively impact our ability to attract, engage, and retain customers; protect and monetize our intellectual property; maintain and grow other revenue streams; and retain customers and grow trust in our brand. The rapid advancement and adoption of generative AI technologies poses risks to our business operations, particularly in the licensing of creative images and videos. Generative AI presents a dual-threat scenario: the unauthorized use of our intellectual property to train AI models and the potential for these models to create competitive or substitutive content. Recent advances and continued rapid development in generative AI technology may alter the market for our products and services.
Generative AI tools powered by models that have been trained on our content, or that are able to display and produce output that contains, is similar to, or is based on, our content, without permission, fair compensation, or proper attribution, may reduce our online traffic, decrease customer demand, infringe our intellectual property rights, impair our ability to attract new customers, harm existing and potential revenue streams, and adversely affect our business, revenues and results of operations. Generative AI technologies also have the potential to create images and videos that directly compete with or substitute for our licensed content. As these technologies become more accessible and capable, customers may opt for AI generated content that bypasses traditional licensing models, impacting our revenue and market position. The evolving nature of AI generated content also raises questions about copyright and originality, potentially disrupting the legal frameworks that protect our assets.
There is a growing concern that third parties may engage in the scraping of our intellectual property without consent, utilizing this content to train their generative AI models. Such unauthorized use infringes on our intellectual property rights and undermines the value proposition of our licensing business. Despite our efforts to monitor and enforce these rights, the volume of digital content and the sophistication of scraping technologies may limit our ability to fully prevent unauthorized use. We are actively monitoring these developments and exploring strategies to mitigate their impact, including technological solutions to prevent unauthorized scraping and participating in industry and legislative efforts to address the challenges posed by generative AI. However, there is no guarantee that these measures will be fully effective in protecting our interests, and our failure to adapt to these changes could adversely affect our business, financial condition, and operational results.
The legal landscape for generative AI remains uncertain, including with respect to intellectual property rights, and the development of the law in this area could impact our ability to protect our intellectual property from infringing and competitive uses. See “Item 3—Legal Proceedings” for background on our suit against Stability AI, Inc. et al. There can be no assurance that we will be successful in these cases, or in preventing other generative AI developers or technologies from using our content without authorization or fair compensation. Our business, brand, financial condition and results of operations may suffer as a result.
We are also using and may continue to use certain generative AI tools in our business. If the recommendations that these tools assist in producing are or are alleged to be deficient, inaccurate, biased or otherwise problematic, our reputation may be adversely affected. In addition, the introduction of generative AI tools into our business may negatively impact our workplace culture and ability to attract and retain employees if generative AI tools are viewed as displacing workers. Accordingly, our use of, or perceptions of the way that we use, generative AI could adversely affect our business, brand, financial condition or results of operations.
If we cannot continue to innovate technologically or develop, market and sell new products and services, or enhance existing technology and products and services to meet customer requirements, our ability to grow our revenue could be impaired.
Our growth largely depends on our ability to innovate and add value to our existing creative platform and to provide our customers and contributors with a scalable, high-performing technology infrastructure that can efficiently and reliably handle increased customer and contributor usage globally, as well as the deployment of new features. For example, AI and products, including but not limited to generative AI, require additional capital and resources. Without improvements to our technology and infrastructure, our operations might suffer from unanticipated system disruptions, slow performance or unreliable service levels, any of which could negatively affect our reputation and ability to attract and retain customers and contributors. We are currently making, and plan to continue making, significant investments to maintain and enhance the technology and infrastructure and to evolve our information processes and computer systems in order to run our business more efficiently and remain competitive. We may not achieve the anticipated benefits, significant growth or increased market share from these investments for several years, if at all. If we are unable to manage our investments successfully or in a cost-efficient manner, our business and results of operations may be adversely affected.
Our growth also depends, in part, on our ability to identify and develop new products and services and enhance existing products and services. The process of developing new products and services and enhancing existing products and services and bringing products or enhancements to market in a timely manner is complex, costly and uncertain and we may not execute successfully on our vision or strategy because of challenges such as product planning and timing, technical hurdles, or a lack of resources. The success of our products depends on several factors, including our ability to:
•anticipate customers’ and contributors’ changing needs or emerging technological trends;
•timely develop, complete and introduce innovative new products and enhancements;
•differentiate our products from those of our competitors;
•effectively market our products and gain market acceptance;
•adopt new technologies without alienating our current contributors;
•price our products competitively; and
•provide timely, effective and accurate support to our customers and contributors.
We may be unable to successfully identify new product opportunities or enhancements, develop and bring new products to market in a timely manner, or achieve market acceptance of our products. There can be no assurance that products and technologies developed by others will not render our products or technologies obsolete or less competitive. If we are unsuccessful in innovating our technology or in identifying new or enhancing our existing product offerings, our ability to compete in the marketplace, to attract and retain customers and contributors and to grow our revenue could be impaired.
Further, our customer base is diverse, but trends in their industries present risks to our business. In recent years, traditional outlets for media and advertising, such as newspapers, magazines, book publishing and television, have experienced consolidation and undergone other significant changes, and, in many cases, also experienced diminishing readership and viewership, as applicable, and ultimately periodic declines in revenues and profitability. Corporate in-house content users have experienced reduced budgets and shifts in use patterns that have changed the way they acquire and use our content, including an increase in reliance on in-house creative and marketing capabilities instead of outsourcing this work to agencies. We have also seen an increasing shift away from print media to digital and online media use. Content used online has historically been characterized by lower resolutions and lower price points but potentially significantly higher volumes than print-based applications. If we are unable to adapt our content offerings and distribution technology to address any current or future changes to customer industries, our future growth prospects and results of operation could be materially and adversely affected.
We rely on third parties to drive traffic to our website, and these providers may change their search engine algorithms or pricing in ways that could negatively affect our business, results of operations, financial condition and prospects.
Our success depends on our ability to attract customers in a cost-effective manner. With respect to our marketing channels, we rely heavily on relationships with providers of online services, search engines, social media, and affiliate websites and e-commerce businesses to provide content, advertising banners and other links that direct customers to our websites. We rely on these relationships to provide significant sources of traffic to our website. In particular, we rely on search engines as important marketing channels. Search engine companies change their natural search engine algorithms periodically, and our ranking in natural searches have been in the past, and may be in the future, adversely affected by such changes. Search engine companies may also determine that we are not in compliance with their guidelines and consequently penalize us in
their algorithms as a result. If search engines change or penalize us with their algorithms, terms of service, display and featuring of search results, or if competition increases for advertisements, we may be unable to cost-effectively drive consumers to our websites.
Our relationships with our affiliate websites are not long term in nature and often do not require any specific performance commitments. As competition for online advertising has increased, the cost for some of these services has also increased. A significant increase in the cost of the affiliate websites could adversely impact our ability to attract customers cost effectively and harm our business, results of operations, financial condition and prospects.
Our operation in and continued expansion into international markets is important for our business. As we continue to expand internationally, we face additional business, political, regulatory, operational, financial and economic risks, any of which could increase our costs or otherwise limit our growth.
Operating internationally and continuing to expand our business to attract new customers and content suppliers in geographies other than North America and Western Europe is important to our continued success and growth. For each of the years ended December 31, 2023, 2022 and 2021, approximately 50% of our revenue was derived from customers located outside of the United States. We expect to continue to devote resources to international expansion through exploring acquisition and foreign distributor partnership opportunities, as well as through expanding our foreign language marketing of offerings and further localizing our content library and user experience for foreign markets. Our ability to expand our business and to attract talented employees, customers and content suppliers in an increasing number of international markets requires considerable management attention and resources and is subject to the particular challenges of supporting a growing business in an environment of multiple languages, cultures, customs, political regimes, legal systems, alternative dispute systems, regulatory systems and commercial infrastructures. Moreover, as the wars in the Ukraine and the Middle East continue, there can be no certainty regarding whether such governments or other governments will impose additional sanctions or other economic or military measures against Russia, Hamas or others. We cannot provide assurance that current sanctions or potential future changes in sanctions will not have an adverse impact on our operations. Expanding our international focus may subject us to risks that we have not faced before or increase risks that we currently face, certain of which are described elsewhere in these “Item 1A. Risk factors,” including risks associated with:
•modifying and customizing our content, technology, pricing and marketing efforts to appeal to foreign customers and attract foreign content suppliers;
•changes to domestic and international intellectual property, privacy and rights of publicity laws;
•higher costs associated with doing business internationally, including increased taxes and foreign currency fluctuations;
•legal, political or systemic restrictions on the ability of U.S. companies to do business in foreign countries, including, among others, restrictions imposed by the U.S. Office of Foreign Assets Control (“OFAC”) on the ability of U.S. companies to do business in certain specified foreign countries or with certain specified organizations and individuals;
•difficulty in staffing and strains on our systems and staff in managing widespread operations and ensuring compliance with foreign laws and regulations, including local laws, the U.S. Foreign Corrupt Practices Act, the U.K. Anti-Bribery Act, the U.K. Modern Slavery Act, or other anti-corruption or anti-money laundering laws, tax regulations, disclosure requirements, privacy laws, biometric, data protection, rights of publicity, human rights, employment, technology laws and laws relating to content;
•government regulation of e-commerce and restrictions on communications, distribution of content and media, including censorship;
•disruption in the political, economic or military stability of markets in which we operate;
•providing for the health and safety of our photographers and other employees around the world;
•potential legal, political or social uncertainty and volatility or catastrophic events, including wars and terrorist events, that could restrict our photographers’ travel or otherwise adversely impact our operations and business and/or those of the companies with which we do business;
•currency restrictions that may limit our ability to repatriate profits;
•differences in payment cycles, increased credit risks and increased payment fraud levels;
•lack of adoption by certain jurisdictions of e-commerce and internet payment platforms and adoption of different platforms by different jurisdictions;
•reduced and more costly protection of our intellectual property;
•currency exchange fluctuations, hyperinflation and deflation fluctuations;
•potential adverse tax consequences of doing business in certain jurisdictions;
•recruiting and retaining talented and capable management and employees in foreign countries; and
•difficulties of establishing, adapting and maintaining the systems and operations for compliance with and management of these risks.
These risks may make it impossible or prohibitively expensive to effectively maintain operations in or expand to new international markets, or delay entry into such markets, which could materially and adversely affect our ability to grow our business. Additionally, the entry of local competitors in certain markets may impede our ability to grow our business in those markets.
Actions by governments to restrict access to, or operation of, our services or the content we distribute in their countries could substantially harm our reputation, business and financial results.
Foreign governments, or internet service providers acting pursuant to foreign government policies or orders, of one or more countries may seek to limit content available through our e-commerce platform in their country, restrict access to our products and services from their country entirely, or impose other restrictions that may affect the accessibility of our services in their country for an extended period of time or indefinitely if our services, or the content we distribute, are deemed to be in violation of their local laws and regulations. For example, domestic internet service providers have previously blocked access to certain content in China and other countries, such as Russia, have previously restricted access to specific content. If access to our services is restricted, in whole or in part, in one or more countries or our competitors can successfully penetrate geographic markets that we cannot access, our reputation among our customers, contributors and employees may be negatively impacted, our ability to retain or increase our contributor and customer base may be adversely affected, we may not be able to maintain or grow our revenue as anticipated, and our financial results could be adversely affected.
The impact of currency fluctuations could adversely and materially affect our business and results of operations.
Our foreign operations are exposed to foreign exchange rate fluctuations as our financial results are translated from the local currency into U.S. dollars upon consolidation. If the U.S. dollar weakens against foreign currencies, the translation of these foreign currency denominated transactions will result in increased revenue, operating expenses and net income. Similarly, if the U.S. dollar strengthens against foreign currencies (which occurred in 2022), the translation of these foreign currency denominated transactions will result in decreased revenue, operating expenses and net income. As exchange rates vary, sales and other results of operations, when translated, may differ materially from expectations. For the years ended December 31, 2023, 2022 and 2021, 49%, 44% and 47% of our revenue was denominated in foreign currencies, respectively. In addition, approximately 34%, 35% and 34% of our SG&A (as defined below) and capital expenditures for the years ended December 31, 2023, 2022 and 2021 were denominated in foreign currencies, respectively.
Because we report our financial results in U.S. dollars, fluctuations in foreign currencies (including the British Pound, Australian and Canadian dollars, Japanese Yen and Euro) have had and will continue to have a material effect on our financial performance. Volatility in foreign currency fluctuations may continue as a result of economic and political circumstances beyond our control.
A decline in value of any foreign currency against the U.S. dollar will tend to have a negative effect on our financial performance, while an increase in value of these currencies against the U.S. dollar will tend to have a positive impact on reported financial performance. This fluctuation risk increases as we expand into foreign markets.
We currently, and may in the future, enter into certain derivatives or other financial instruments to hedge against this foreign exchange risk. It is difficult to predict the impact hedging activities have on our results of operations and any actions we have and will take with respect to hedging our foreign currency exchange risk may be unsuccessful.
We may be unable to adequately maintain, adapt and upgrade our websites and technology systems to ingest and deliver higher quantities of new content and allow existing and new customers to successfully search for our content.
To remain competitive, we must continue to add substantial quantities of the most relevant content desired by our customers. Our ability to ingest such content is directly related to the ease of access, sophistication, protections and reliability of the technology relating to our ingestion tools. Our failure to address deficiencies could result in a decrease or inability to ingest enough new content, thereby causing customers to seek other sources, which could materially and adversely affect our results of operations and financial condition.
Even if we can ingest sufficient new content, we must also add new functionality and features to our websites to allow customers to search for the relevant content we offer. A significant component of our technology strategy is the improvement of the compatibility of our websites with third-party search engines that direct traffic to our site and, specifically, to content that reflects searched key words. The search algorithms developed by third-party search engines are typically not publicly known and are subject to unanticipated changes, which could significantly affect the number of new customers we attract to our sites. In addition, we continually seek to improve search functions within our site to enable customers to locate the most relevant and appropriate content for their particular use. If we do not address any current or future deficiencies with respect to potential or existing customers’ ability to search for content on the internet or on our websites, we may be unsuccessful in acquiring and retaining customers and ultimately licensing the most relevant content, which could materially and adversely affect our results of operations and financial condition. In addition, the expansion and improvement of our systems and websites may require us to commit substantial financial, operational and technical resources, with no assurance that our business will improve.
We may not be able to continue the growth of our business at rates reflective of our historical growth rates or at all.
We have experienced growth in terms of revenues, customers and content offerings, and we may not be able to maintain our historical rate of growth in certain product lines or replicate this growth with other product lines or across geographies. Our growth strategy may require us to commit substantial financial, operational and technical resources to current operations, which may divert such resources away from other potentially profitable ventures, without any guarantee of a similar return on any such investments. Further, even if we do achieve the desired growth, such growth could also strain our ability to maintain reliable operation of our websites or our relationships with customers and content suppliers and acquire relevant content. This in turn could negatively impact our ability to develop and improve our operational, financial and management controls and systems. If we fail to effectively manage or support future growth, or if we are otherwise negatively impacted by our efforts to grow our product lines, our business, results of operations and financial condition may be materially and adversely affected.
Technological interruptions that impair access to our websites or the efficiency of our websites and technology systems could damage our reputation and brand and adversely affect our results of operations.
The digitization and satisfactory internet distribution of our content is a key component of the efficient functioning of our websites and our business. We will need to continue to invest in and improve our websites and systems, network infrastructure, content ingestion, and customer experience in order to ensure consistent performance, reliability, and accessibility, and to accommodate our expanding product offerings, anticipated increased site traffic, sales volume, and processing of the resulting information and transactions. If we experience significant disruptions or difficulties as a result of or during any such technology updates or upgrades, we may face system interruptions, poor website response times, inability to refresh or add content, diminished customer services, impaired quality and speed of order processing, and potential problems with our internal control over financial reporting. Substantial or repeated system disruptions or failures would reduce the attractiveness of our websites significantly and negatively impact our brand and reputation for both customers and content providers. Even a disruption as brief as a few minutes could have a negative impact on activities on our websites or systems and could therefore result in a loss of customers, revenue, partners, content providers or data. Because some of the causes of system interruptions may be outside of our control, we may not be able to remedy such interruptions in a timely manner, or at all.
Our ability to license content and offer other related services also depends on the maintenance of a reliable network backbone with the necessary speed, data capacity and security, as well as the timely development of complementary capabilities, to provide reliable website internet access and services. The internet has experienced, and is likely to continue to experience, significant growth in the number of users and bandwidth requirements. As a result, problems caused by viruses, worms, malware and similar programs could negatively impact internet infrastructure and cause it to be unable to support the user demand associated with such users and bandwidth requirements. The internet has experienced a variety of outages and other delays as a result of damage to portions of its infrastructure, and it could face outages and delays in the future, which could reduce the level of internet usage generally as well as the level of usage of our services. In addition, if telecommunications providers lose service to their customers, our customers will not be able to access our websites. Our websites and systems have in the past experienced, and may in the future experience, temporary system interruptions for a variety of reasons, including cybersecurity breaches and other security incidents, viruses, telecommunication and other network failures, power failures, programming errors, data corruption, denial-of-service attacks or an overwhelming number of visitors trying to reach our websites during periods of strong demand. Even a brief disruption in service that causes portions of our websites to be unavailable to customers or prevents us from efficiently uploading content to our websites, or taking, processing or fulfilling orders could have a significant impact on our financial performance. System
disruptions and difficulties, whether as a result of our internally developed systems or those of third-party providers, may inconvenience our customers and content providers and/or result in negative publicity, and may negatively affect our ability to provide services and the volume of content we license and deliver over the internet, thereby causing users to perceive our sites as not functioning properly and causing them to use another website or other methods to obtain the products or services we offer.
We rely upon third-party service providers, such as co-location and cloud service providers, for certain of our data centers and application hosting, and we are dependent on these third parties to provide continuous power, cooling, internet connectivity and technical, administrative and physical security for our servers. Occasionally, we migrate data among data centers and to third-party hosted environments. Certain of these third-party providers have in the past experienced, and may in the future experience, interruptions in operations that could harm our business. In such events, or in the event that we are unable to agree upon satisfactory terms for continued relationships, we could be forced to enter into relationships with other service providers or assume hosting responsibilities ourselves, potentially at a greater cost or on less favorable terms to us. Although our use of cloud services and multiple production data centers enables us to provide rapid content delivery to our customers and to support business continuity in the event of an emergency, a system disruption at an active data center or third-party hosting service provider could result in a noticeable disruption and/or performance degradation on our websites.
Additionally, some of the computer and communications hardware necessary to operate our corporate functions are located in metropolitan areas worldwide, which systems and operations could be damaged or interrupted by fire, flood, power loss, telecommunications failure, earthquake and similar events. We do not have redundancy for all of our systems, many of our critical applications reside in only one of our data centers or in the cloud, and our disaster recovery planning may not account for all eventualities. In addition, we may have inadequate insurance coverage to compensate for any related loss.
Disruptions to our websites or internal communications and operating systems for any of the foregoing reasons could negatively impact our reputation and the perceived or actual functionality of our operations, which could harm our business and reputation, and cause a material and adverse effect on our financial condition.
Our failure to protect the proprietary information of our customers and our networks against cyberattacks, security breaches or unauthorized access could adversely affect our business and results of operations, damage our reputation and expose us to liability.
An important component of our global business is the secure transmission of proprietary information and the transaction of commerce over the internet. We and our third-party service providers collect and maintain proprietary information and personal information in connection with servicing our customers and content suppliers and other related processes on our websites and systems, and, in particular, in connection with processing and remitting payments to and from our customers and content suppliers, and are therefore exposed to security and fraud-related risks, which are likely to become more challenging as we expand our operations and as technology evolves. In addition, we collect proprietary information and personal information of third-party vendors and distributors, as well as our employees. Although we maintain security features on our websites and systems, designed to detect, prevent and provide protections against compromises of our systems or data, and utilize security measures such as encryption and authentication technology, we are subject to cyberattacks and are the target of computer viruses, hackers, distributed denial of service attacks, malware infections, ransomware attacks, phishing and spear-phishing campaigns, and/or other external hazards, as well as improper or inadvertent workforce behavior which, could expose confidential company and personal data systems and information to security breaches. Our security measures may not detect or prevent all attempts to hack our systems, denial-of-service attacks, viruses, malicious software, break-ins, phishing attacks, social engineering, security breaches or other attacks and similar disruptions that may jeopardize the security of information stored in and transmitted by our websites and system. We rely on encryption and authentication technology licensed from third parties to provide the security and authentication to effectively secure transmission of the proprietary information that we process for our customers, employees, vendors, distributors and content suppliers, and such technology may fail to function properly or may be compromised or breached. Additionally, we use third-party co-location and cloud service vendors for our data centers and application hosting, and other third-party vendors for some of the software and services that we use to operate the business, and their security measures may not prevent security breaches and other disruptions that may jeopardize the security of information stored in and transmitted through their systems. Further, some of the software and services that we use to operate our business, including our internal e-mail and customer relationship management software, are hosted by third parties. It is possible that a breach of any of these systems could go undetected for an extended period of time.
We have experienced successful attacks, by various types of hacking groups, in which personal and commercially sensitive information, belonging to the Company or its clients, has been compromised. However, none of these cybersecurity incidents or attacks to our knowledge have been material to our business or financial results.
In the event of a security breach, our business operations could be disrupted, and could result in loss of revenues or market share, liability to customers or others including an obligation to notify individuals or regulatory authorities, the diversion of corporate resources, injury to our reputation or increased service and maintenance cost. An unauthorized party could misappropriate proprietary information and/or personal information, cause interruption in our operations, damage or misuse our websites or systems, distribute or delete content owned by our content suppliers, customers, vendors or employees, and misuse the information that they misappropriate. We may be required to expend significant capital and other resources to protect against such security breaches or to alleviate problems caused by such breaches. In addition, a significant cyber-security breach could result in major credit card associations’ payment networks and companies offering other payment methods prohibiting us from processing future transactions on their networks and systems. Security and fraud-related issues are likely to become more challenging as we expand our operations and the related prevention, maintenance and risks associated with them could have a material and adverse effect on our financial condition.
Although cybersecurity and the continued development and enhancement of the processes, practices and controls that are designed to protect our systems, computers, software, data and networks from attack, damage or unauthorized access are a high priority for us, our efforts may not be enough to prevent a party from circumventing our security measures, or the security measures of our third-party service providers, and accessing and misusing the proprietary information of our employees, customers and contributors. Accounts created with weak or recycled passwords could allow cyber-attackers to gain access to confidential data.
Security researchers, criminal hackers and other third parties regularly develop new techniques to penetrate computer and network security measures and, certain parties have in the past managed to obtain limited unauthorized access to certain of our systems and misused some of our systems and software. Outside parties have in the past attempted and may in the future attempt to fraudulently induce our employees or users of our products or services to disclose proprietary information or sensitive, personal, or confidential information via illegal electronic spamming, phishing or other tactics. Unauthorized parties may also attempt to gain physical access to our facilities in order to infiltrate our information systems or attempt to gain logical access to our products, services, or information systems for the purpose of exfiltrating content and data. These actual and potential breaches of our security measures and the accidental loss, inadvertent disclosure or unauthorized dissemination of proprietary information or sensitive, personal or confidential data about us, our employees, our customers or their end users, including the potential loss or disclosure of such information or data as a result of hacking, fraud, trickery or other forms of deception, could expose us, our employees, our customers or the individuals affected to a risk of loss or misuse of this information. This may result in liability, compliance costs, governmental inquiry or a loss of customer confidence, any of which could harm our business or damage our brand and reputation. In addition, our failure to adequately control fraudulent credit card transactions could damage our reputation and brand. Any one of the foregoing occurrences could result in a material and adverse effect on our business and results of operations.
As the techniques used to obtain unauthorized access, attack, disable or degrade services, or sabotage systems, are constantly evolving in sophisticated ways, we may be unable to anticipate these techniques or implement adequate preventative measures. We may also be required to expend significant capital and other resources to protect against security breaches or to alleviate problems caused by such breaches. Any actual breach, the perceived threat of a breach or a perceived breach could cause our customers, contributors and other third parties to cease doing business with us, or subject us to lawsuits, regulatory fines and other action or liability, any of which could harm our reputation, business, financial condition and results of operations.
Any compromise of security may result in our being out of compliance with U.S. federal and state laws, and international laws and contractual commitments, and we may be subject to lawsuits, fines, criminal penalties, statutory damages, and other costs, including for provision of breach notices and credit monitoring to our customers. Any failure, or perceived failure, by us to comply with our posted or internal privacy and data protection policies or with any regulatory requirements or orders or other federal, state, or international privacy, security or consumer protection-related laws and regulations, could result in proceedings or actions against us by governmental entities or others, subject us to significant penalties and negative publicity, and adversely affect our results of operations.
We may not be successful in acquiring or integrating new content and product lines.
Our strategy to increase market share and enhance profitability is to leverage our existing expertise into what we believe are underserved product and geographic markets. As part of this strategy, we have in the past acquired and invested in, and may in the future seek to acquire or invest in new businesses, products, collections and product offerings, or technologies that could complement or expand our business. Acquisitions or new partnerships may require significant capital infusions or investments and may negatively impact our results of operations. Further, the evaluation and negotiation of potential
acquisitions and partnerships, as well as the integration of acquired businesses or onboarding of new partners, may divert management time and other resources. Certain other risks related to such acquisitions and investments that may have a material effect on our business or prevent us from benefiting from such investments include:
•disruption of our ongoing business, including diverting management’s attention from existing businesses and operations;
•costs incurred in performing due diligence and professional fees relating to potential acquisitions and partnerships;
•use of cash resources or incurrence of debt to fund acquisitions and investments;
•assumption of actual or contingent liabilities, known and unknown;
•amortization expense related to acquired intangible assets, impairment of any goodwill acquired and other adverse accounting consequences;
•difficulties and expenses in integrating the sales, marketing, operations, products, services, technology and financial and information systems of an acquired company, particularly in emerging geographic markets;
•information security vulnerabilities;
•retention of key employees, customers, and suppliers of an acquired business; and
•an adverse review of an acquisition or potential acquisition, or limitations put on such acquisitions, by a regulatory body.
These risks may make it impossible or prohibitively expensive to execute our business and investment strategies or delay execution of such strategies, which would materially and adversely affect our growth prospects and financial condition.
If our goodwill or other intangible assets become impaired, we may be required to record a significant charge to earnings.
Under generally accepted accounting principles, we review our intangible assets for impairment when events or changes in circumstances indicate that the carrying value may not be recoverable. We are required to test goodwill and any other intangible asset with an indefinite life for possible impairment on the same date each year and on an interim basis if there are indicators of a possible impairment. We are also required to evaluate amortizable intangible assets and fixed assets for impairment if there are indicators of a possible impairment. There is significant judgment required in the analysis of a potential impairment of goodwill, identified intangible assets and fixed assets. If, as a result of a general economic slowdown, deterioration in one or more of the markets in which we operate or in our financial performance and/or future outlook, the estimated fair value of our long-lived assets decreases, we may determine that one or more of our long-lived assets is impaired. An impairment charge could have a material adverse effect on our results of operations and financial position. We may be required to record a significant charge to earnings in our financial statements during the period in which any impairment of our goodwill or other intangible assets is determined, thereby materially and adversely affecting our results of operations.
Our ability to obtain additional capital on commercially reasonable terms may be limited.
Although we believe our cash, cash equivalents and short-term investments, as well as future cash from operations and cash available, provide adequate resources to fund ongoing operating requirements for the foreseeable future, we may need to seek additional financing to compete effectively.
If we are unable to obtain capital on commercially reasonable terms, it could:
•reduce funds available to us for purposes such as working capital, capital expenditures, strategic acquisitions and investments and other general corporate purposes;
•restrict our ability to introduce new products or exploit business opportunities;
•increase our vulnerability to economic downturns and competitive pressures in the markets in which we operate; and
•place us at a competitive disadvantage.
We have incurred debt, which could have a negative impact on our financing options and liquidity position, which could in turn adversely affect our business.
As of December 31, 2023, we had $1.401 billion in aggregate principal amount of total debt. Additionally, our Credit Facility has remaining borrowing capacity of $150.0 million as of December 31, 2023. Our overall leverage and the terms of our financing arrangements could:
•limit our ability to obtain additional financing in the future for working capital, capital expenditures or acquisitions, to fund growth or for general corporate purposes, even when necessary to maintain adequate liquidity;
•make it more difficult for us to satisfy the terms of our debt obligations;
•limit our ability to refinance our indebtedness on terms acceptable to us, or at all;
•limit our flexibility to plan for and to adjust to changing business and market conditions and increase our vulnerability to general adverse economic and industry conditions;
•require us to dedicate a substantial portion of our cash flow from operations to make interest and principal payments on our debt, thereby limiting the availability of our cash flow to fund future investments, capital expenditures, working capital, business activities and other general corporate requirements; and
•increase our vulnerability to adverse economic or industry conditions.
Our ability to meet expenses and debt service obligations will depend on our future performance, which could be affected by financial, business, economic and other factors. In addition, a breach of any of the covenants in our outstanding debt agreements or our inability to comply with the required financial ratios could result in a default under our debt instruments, including the Credit Facility. If an event of default occurs, our creditors could elect to declare all borrowings outstanding, together with accrued and unpaid interest, to be immediately due and payable and/or require us to apply all of our available cash to repay borrowings. If we are not able to pay our debt service obligations we may be required to refinance all or part of our debt, sell assets, borrow more money or raise additional equity capital.
Risks Related to Global Economic Conditions
The impact of worldwide economic, political and social conditions may adversely affect our business and results of operations.
Global economic, political and social conditions can affect the business of our customers and the markets they serve, as well as disrupt the business of our vendors, third-party resellers and strategic partners. Numerous external forces beyond our control, including generally weak or uncertain economic conditions, supply chain disruptions, rising interest rates, inflation, negative or uncertain political climates, changes in government, global health epidemics (such as COVID-19), geopolitical conflicts and wars such as the Russia-Ukraine and Israel-Hamas wars, government shutdowns and/or the financial stability of the banking industry could adversely affect our financial condition. Particularly, our financial condition is affected by worldwide economic conditions and their impact on content generation and marketing and advertising spending. Expenditures by our customers generally tend to reflect overall economic conditions, and to the extent that the economy stagnates as a result of macroeconomic conditions, companies may reduce their spending with us. To the extent that overall economic conditions reduce spending on digital content, our ability to retain current and obtain new customers could be hindered, which could reduce our revenue and negatively impact our business.
Further, economic, political and social macro developments in the United States, Europe, and Asia could negatively affect our ability to conduct business in those territories. Financial difficulties experienced by our customers, third-party resellers, vendors and strategic partners due to economic volatility, rising interest rates, supply chain disruptions, inflation or other unfavorable changes could result in these companies scaling back operations, exiting businesses, merging with other businesses or filing for bankruptcy protection and potentially ceasing operations, all of which could adversely affect our business, financial condition and results of operations.
Risks Related to Personnel
The loss of key personnel, an inability to attract and retain additional personnel or difficulties in the integration of new members of our management team into our Company could affect our ability to successfully grow our business.
Our future success depends in large part upon the continued service of the members of our executive management team and key employees. All members of our executive management team are subject to employment agreements. In addition, our
success also depends on our ability to attract and retain qualified technical, sales and marketing, customer support, financial and accounting, legal and other managerial personnel, as well as high quality photographers for our product line covering entertainment, sports and news (“Editorial”). The competition for skilled personnel in the industries in which we operate is intense. Our personnel generally may terminate their employment at any time for any reason. We may incur significant costs to attract and retain highly skilled personnel, and we may lose new employees to our competitors before we realize the benefit of our investment in recruiting them. As we move into new geographies, we will need to attract and recruit skilled personnel across functional areas. Some of our employees in Brazil, Germany, France and Spain are subject to collective bargaining agreements and employees in other jurisdictions may unionize. If we fail to attract new personnel or if we suffer increases in costs or business operations interruptions as a result of a labor dispute, or fail to retain and motivate our current personnel, we might not be able to operate our businesses effectively or efficiently, serve our customers properly or maintain the quality of our content and services.
We may be exposed to risks related to our use of independent contractors.
We rely on independent third parties to provide certain services for our Company. The state of the law regarding independent contractor status varies from jurisdiction to jurisdiction and is subject to change based on court decisions and regulation. For example, on April 30, 2018, the California Supreme Court adopted a new standard for determining whether a company “employs” or is the “employer” for purposes of the California Wage Orders in its decision in the Dynamex Operations West, Inc. v. Superior Court case. This standard was expanded and codified in California via Assembly Bill 5, which was signed into law in September 2019 and became effective as of January 1, 2020. The Dynamex decision and Assembly Bill 5 altered the analysis of whether an individual, who is classified by a hiring entity as an independent contractor in California, has been properly classified as an independent contractor. Assembly Bill 5 was amended to include exclusions for photographers, videographers and editors where specific requirements are met. In addition, independent workers have been the subject of widespread national discussion and it is possible that other jurisdictions may enact laws similar to Assembly Bill 5 or that otherwise impact our business and our relationships with independent third parties. As a result, there is significant uncertainty regarding the future of the worker classification regulatory landscape.
From time to time, we may be involved in lawsuits and claims that assert that certain independent contractors should be classified as our employees. Adverse determinations regarding the status of any of our independent contractors could, among other things, entitle such individuals to the reimbursement of certain expenses and to the benefit of wage-and-hour laws, and could result in the Company being liable for income taxes, employment, social security, and withholding taxes and benefits for such individuals. Any such adverse determination could result in a material reduction of the number of subcontractors we can use for our business or significantly increase our costs to serve our customers, which could adversely affect our business, financial condition and results of operations.
Risks Related to Our Intellectual Property and Confidential Information
Our business and prospects would suffer if we are unable to protect and enforce our intellectual property rights and confidential information.
The success of our business depends on our ability to protect and enforce our patents, trade secrets, trademarks, copyrights and all of our other intellectual property rights and other confidential information, including our intellectual property rights underlying our owned content library, websites and search algorithms. Despite our efforts to protect our intellectual property rights, which may afford only limited legal protections, unauthorized parties have attempted, and may continue to, attempt to copy and use aspects of our intellectual property and other confidential information. Effective legal protection for our patents, trade secrets, trademarks, copyrights and other intellectual property assets may not be available or practical in every country in which we operate or intend to operate. Moreover, policing our intellectual property rights is difficult, costly and may not always be effective. We may commence legal proceedings to protect our IP rights, which may increase our operating expenses. We could be subject to countersuits as a result. To the extent any unauthorized parties, which may include our competitors, are successful in copying and using aspects of our intellectual property or confidential information, including our search algorithms and our trade secrets, our business could be harmed.
We or one of our affiliates have registered “Getty Images,” “iStock,” “Unsplash” and other marks and logos as trademarks in the United States and other jurisdictions. Nevertheless, competitors may adopt trademarks similar to ours, or purchase keywords in internet search engine marketing programs that are confusingly similar to our trademarks, thereby impeding our ability to build brand identity and possibly leading to confusion among existing and potential new customers. In addition, there could be infringement claims by third parties regarding any of our trademarks or our use of other intellectual
property that could damage our reputation and brand, prove costly to defend irrespective of their validity, and, if such claims are ultimately validated, materially and adversely affect our financial condition and results of operations.
We currently own the www.gettyimages.com, www.istock.com and www.unsplash.com internet domain names in addition to various other domain names. Domain names are generally regulated by internet regulatory bodies. If we lose the ability to use a domain name in a particular country, we would be forced either to incur significant additional expenses to market our products within that country or to elect not to sell products in that country. Either result could harm our business and results of operations. The regulation of domain names in the United States and in foreign countries is subject to change, including the establishment of additional top-level domains and domain name registrars or the modification of the requirements for holding domain names. As a result, we may not be able to acquire or maintain the domain names that utilize our brand names in the United States or other countries in which we conduct business or in which we may conduct business in the future.
In order to protect our trade secrets and other confidential information, we rely in part on confidentiality agreements with our employees, consultants and third parties with whom we have relationships. These agreements may not prevent disclosure of trade secrets and other confidential information and may not provide an adequate remedy in the event of misappropriation or any unauthorized disclosure or independent discovery of our trade secrets and confidential information. Costly and time-consuming litigation could be necessary to enforce or determine the scope of our trade secret rights and related confidentiality and nondisclosure provisions. Failure to adequately protect our trade secrets and other confidential information could adversely affect our competitive business position.
Litigation or proceedings before the U.S. Patent and Trademark Office, U.S. Copyright Office or other governmental authorities and administrative bodies in the United States and foreign countries may be necessary in the future to enforce and protect our patent rights, copyrights, trademarks, trade secrets, domain names and other intellectual property rights and to determine the validity, enforcement and scope of the intellectual property rights of others. Furthermore, the monitoring and protection of our intellectual property rights may become more difficult, costly and time consuming as we continue to expand internationally, particularly in those markets, such as China and certain other developing countries in Asia, in which legal protection of intellectual property rights is less robust than in the United States and in Europe. Our efforts to enforce or protect our intellectual property rights may be ineffective and could result in substantial costs and diversion of resources and management time, each of which could materially and adversely affect our results of operations.
We rely on intellectual property laws and contractual restrictions to protect the content in our library. Intellectual property laws and protections may change and such changes may impact our protections, adversely impacting our business and financial position. Certain countries do not prioritize the enforcement of intellectual property laws, and litigation in those countries may be costly and ineffective. Consequently, these intellectual property laws afford us only limited protection. Unauthorized parties have attempted, and may continue to attempt, to improperly use our content. We cannot guarantee that we will be able to prevent the unauthorized use of our content or that we will be successful in stopping such use once it is detected.
Advancements in technology, including advancements in generative AI technology, have made unauthorized copying and wide dissemination of unlicensed content easier. At the same time, detection of unauthorized use of our intellectual property and enforcement of our intellectual property rights have become more challenging, in part due to the increasing volume and sophistication of attempts at unauthorized use of our intellectual property, including from generative AI developers or technologies. As our business and the presence and impact of bad actors become more global in scope, we may not be able to protect our proprietary rights in a cost-effective manner in other jurisdictions. In addition, intellectual property protection may not be available in every country in which our products and services are distributed or made available through the internet.
If we are unable to protect and enforce our intellectual property rights, we may not succeed in realizing the full value of our assets, our business and profitability may suffer as a result of misuse of our intellectual property. In addition, we are currently engaged in litigation in the United States and England to enforce our intellectual property rights, and we may in the future be required to do so in the United States or elsewhere, and such litigation may be costly and time consuming. See “Item 3—Legal Proceedings” for additional information.
Our products and services may infringe on intellectual property rights of third parties, which could require us to incur substantial costs and distract our management.
Media, internet and technology companies are frequently the target of litigation based on allegations of infringement, misappropriation or other violations of intellectual property rights or rights related to their use of technology. Some internet, technology and media companies, including some of our competitors, own large numbers of patents, copyrights, trademarks, trade secrets and other intellectual property rights, which they may use as a basis to assert claims against us. We have developed proprietary technology and a robust infrastructure to power our products and services, and this technology is critical to our business. Third parties may in the future assert that the technology we have developed or the content that we display and distribute infringes, misappropriates or otherwise violates their intellectual property rights, and as we face increasing competition, the possibility of intellectual property rights claims against us grows. Such litigation may involve patent holding companies or other adverse patent owners who have no relevant product revenue, and therefore our own issued and pending patents may provide little or no deterrence to these patent owners in bringing intellectual property rights claims against us. Existing laws and regulations are evolving and subject to different interpretations, and various federal and state legislative or regulatory bodies may change current laws or regulations or enact new ones. We cannot guarantee that our technology is not infringing or violating any third-party intellectual property rights or rights related to the use of technology, or that it will not infringe or violate such rights in the future.
We license a significant majority of the content in our library from third parties, and we cannot guarantee that each supplier holds the rights or releases he or she claims or that such rights and releases are adequate. From time to time we receive notices from third parties claiming that certain content that we license infringes their intellectual property rights. In such circumstances, we may not be able to obtain licenses to use those rights on commercially reasonable terms or at all, we may have to stop selling such content, and we may have to pay damages or satisfy indemnification commitments to our customers, or we may incur significant expense to defend against claims of infringement. While we offer our customers indemnification for only certain specified amounts of legal costs and direct damages arising from the use of images, video or music licensed through us, our contractual liability limitations with respect to such indemnification obligations may not be enforceable in all jurisdictions. We maintain insurance policies to cover potential intellectual property disputes; however, such insurance does not cover all exposures, including the potential damages associated with any willful infringements.
We cannot predict whether assertions of third-party intellectual property rights or any infringement or misappropriation or other claims arising from such assertions will substantially harm our business or results of operations. If we are forced to defend against any infringement or misappropriation or other claims, whether they are with or without merit, are settled out of court, or are determined in our favor, we may be required to expend significant time and financial resources on the defense of such claims.
Furthermore, an adverse outcome of a dispute may require us to: pay damages, potentially including statutory damages and attorneys’ fees if we are found to have willfully infringed a party’s intellectual property rights; expend additional development resources to redesign our technology; enter into potentially unfavorable royalty or license agreements in order to obtain the right to use necessary technologies, content, or materials; and/or indemnify our partners and/or other third parties. Royalty or licensing agreements, if required or desirable, may be unavailable on terms acceptable to us, or at all, and may require significant royalty payments and other expenditures. In addition, any lawsuits regarding intellectual property rights, regardless of their success or merit, could be expensive to resolve, cause harm to our reputation, and would divert the time and attention of our management and technical personnel.
Although we have insurance to cover indemnification claims, we have incurred, and will continue to incur, legal fees and other expenses, as well as a diversion of management time and resources related to such claims and related settlements, which may increase over time, and adversely affect our financial condition and results of operations.
Much of the software and technologies used to provide our services incorporate, or have been developed with, “open source” software, which may restrict how we use or distribute our services or require that we publicly release certain portions of our source code.
Much of the software and technologies used to provide our services incorporate, or have been developed with, “open source” software. Such “open source” software may be subject to third-party licenses that impose restrictions on our software and services depending on how such software is used, including whether it is modified, distributed or made available. Under certain open source licenses, if certain conditions were met, we could be required to publicly release or license aspects of the source code of our software or to make our software available under open source licenses free of
charge. Few courts have interpreted open source licenses, and the way these licenses may be interpreted and enforced is therefore subject to some uncertainty. To avoid the public release of the affected portions of our source code, we could be required to expend substantial time and resources to re-engineer some or all of our software, which could reduce or eliminate the value of our services and technologies and materially and adversely affect our ability to sustain and grow our business.
If an author or other third-party that distributes open source software were to allege that we had not complied with the conditions of one or more of these licenses, we could be required to incur significant legal expenses defending against such allegations and could be subject to significant damages, enjoined from the sale of our services that contained the open source software and required to comply with the foregoing conditions, which could disrupt the distribution and sale of some of our services. In addition, use of open source software can lead to greater risks than use of third-party commercial software because open source licensors generally do not provide warranties or controls on the origin of the software. The use of open source software can also carry security risks arising from unknown vulnerabilities that can be exploited by malware in unanticipated ways, which can lead to disruption and/or harm to operations and protected data. Additionally, because any software source code we contribute to open source projects is publicly available, while we may benefit from the contributions of others, our ability to protect our intellectual property rights in such software source code may be limited or lost entirely, and we will be unable to prevent our competitors or others from using such contributed software source code. Similarly, we may be subject to third-party intellectual property claims as a user of or contributor to such open source software. Any of these risks could be difficult to eliminate or manage and, if not addressed, could adversely affect our business, financial performance, and growth.
Risks Related to Legal and Regulatory Matters
An increase in federal, state and foreign government regulation of the industries and markets in which we operate, including with respect to the internet and e-commerce, could have a negative impact on our business.
Existing or future laws and other regulations that may materially affect our business include, but are not limited to, those that govern or restrict:
•privacy and biometric issues and data collection, processing, retention and transmission;
•data and cybersecurity;
•subscriptions practices, including automatic contract or subscription renewal, billing and cancellation;
•credit card fraud and processing;
•consumer protection;
•advertising, marketing and sales of our content and services;
•pricing and taxation of goods and services offered over the internet;
•website content, or the manner in which products and services may be offered, paid for and/or marketed over the internet;
•sources of liability for companies involved in internet services or e-commerce;
•piracy and intellectual property rights;
•the development and use of AI generated content;
•internet neutrality and internet access;
•controls on overseas suppliers and other similar anti-terrorism controls, anti-bribery and anti-corruption conduct and policies; and
•outsourcing, contracting and employment.
For example, we are subject to numerous laws and regulations at the international and United States national and state level, including the following:
•The United States Foreign Corrupt Practices Act and the U.K. Anti-Bribery Act (and similar global legislation), which prohibits corporations and individuals from engaging in specified activities to obtain or retain business or to influence a person working in an official capacity. Under these acts, it is generally illegal to pay, offer to pay, or authorize the payment of anything of value to any foreign government official, government staff member, political party, or political candidate in an attempt to obtain or retain business, or to otherwise influence a person working in an official capacity.
•The U.K. Modern Slavery Act, which prohibits corporations and individuals from engaging in the trafficking of or facilitation of trafficking of humans. Under this Act, it is illegal to engage in or do business with any
individual or entity that engages in such trafficking and obligates companies and individuals to put in place appropriate controls to mitigate against such risks.
•OFAC regulations, under which all U.S. individuals and businesses are prohibited from engaging in transactions with countries subject to comprehensive trade embargoes (such as Cuba and Iran) unless a specific exemption from the regulations exists (such as those for information, all materials and people-to-people exchanges) or a license is obtained from OFAC. Transactions with persons, groups or entities designated as terrorists or as their supporters or associates are also prohibited. A list of Specially Designated Nationals consisting of “drug kingpins,” terrorists and others considered a danger to the United States, is maintained by the Treasury Department’s Office of Foreign Assets Control. Known as the “OFAC List,” it contains over 5,000 names and is updated often. No U.S. person, individual or business in the United States, or, in some instances, the foreign subsidiaries of U.S. companies, may conduct any kind of business with anyone on the OFAC List, and companies are expected to keep track of all changes to this list. Penalties for violations of these rules can be severe, including having the violator’s assets frozen or forfeited and up to $250,000 or twice the transaction value per violation in fines.
•The CCPA regulates the collection and processing of personal data of California residents, and grants residents certain rights in connection with such collection and processing.
•The CPA regulates the collection and processing of the personal data of Colorado residents, and grants residents certain rights in connection with such collection and processing.
•The CTDPA regulates the collection and processing of personal data of Connecticut residents, and grants residents certain rights in connection with such collection and processing.
•The UCPA regulates the collection and processing of personal data of Utah residents, and grants residents certain rights in connection with such collection and processing.
•The VACDPA regulates the collection and processing of personal data of Virginia residents, and grants residents certain rights in connection with such collection and processing.
•The BIPA regulates the collection, use, safeguarding, and storage of “biometric identifiers” by private entities. While the statute specifically excludes photographs from its scope to date there has been no dispositive judicial interpretations of that language.
•The H.B. 1493, which oversees the collection, use and storage of “biometric identifiers,” which include fingerprints, voiceprints, eye retinas, irises and other unique biological identifiers or characteristics used to identify a specific individual, while specifically excluding photographs from its scope.
•The CUBI regulates the capture, receipt, possession, sharing and retention of “biometric identifiers,” which include retina or iris scans, fingerprints, voiceprints, or records of hand or face geometry.
•Several foreign jurisdictions and U.S. states have adopted, and other jurisdictions are expected to enact, statutes that regulate the collection, use, transmission and storage of personal information and require reporting certain breaches of the security of personal information.
•Several jurisdictions, including the United Kingdom and the United States, are in the process of adopting or reforming or expected to adopt or reform legislation that impacts the content we distribute, including the E.U. Copyright Directive, the Copyright Act, the Digital Millennium Copyright Act, and various statutes and regulations impacting rights of publicity for those depicted in imagery.
•Several foreign jurisdictions and U.S. states have adopted, and other jurisdictions are expected to enact, statutes that purport to void or substantially limit automatic renewal provisions of certain free or discounted trial incentives.
•President Biden issued an Executive Order on the Safe, Secure, and Trustworthy Development and Use of Artificial Intelligence, and several U.S. states have adopted or proposed regulations governing the use of AI.
•Several foreign jurisdictions have adopted, and other jurisdictions are expected to enact legislation or regulation, that governs AI and the development and use of AI, including the E.U. AI Act.
We currently license content to customers in virtually every country in the world, excluding Sanctioned Countries, and the different laws that apply in each of those foreign countries may be more or less restrictive than those that apply to companies operating solely within the United States, creating tension in compliance obligations across borders. The adoption, modification or interpretation of laws or regulations in any of these countries relating to our business could adversely affect the manner in which we conduct our business or the overall popularity or growth in use of the internet.
Further, the current legislative and regulatory landscape regarding the regulation of the internet is subject to uncertainty. For example, in January 2018, the Federal Communications Commission (“FCC”) released an order that repealed the “open Internet rules,” often known as “net neutrality,” which could affect the services used by us and our customers. In response to this decision California and a number of states implemented their own net neutrality rules which mirrored parts of the repealed federal regulations. In October 2023, the FCC voted to begin the process of reinstating substantially all of the net
neutrality rules that had been in place prior to the 2018 repeal. We cannot predict the actions the FCC may take, whether any new FCC order or state initiatives regulating providers will be modified, overturned, or vacated by legal action, federal legislation, or the FCC itself, or the degree to which further regulatory action - or inaction - may adversely affect our business. Users who access our marketplace through devices such as smart phones, laptops, and tablet computers must have a high-speed internet connection, such as Wi-Fi, 3G, 4G, or 5G to use our services. Currently, this access is provided by telecommunications companies and internet access service providers that have significant and increasing market power in the broadband and internet access marketplace. If the repeal of net neutrality remains in effect, these providers could take measures that affect their customers’ ability to use our products and services, such as degrading the quality of the data packets we transmit over their lines, giving our packets low priority, giving other packets higher priority than ours, blocking our packets entirely, or attempting to charge their customers more for using our products and services. To the extent that internet service providers implement usage-based pricing, including meaningful bandwidth caps, or otherwise try to monetize access to their networks, we could incur greater operating expenses and customer acquisition and retention could be negatively impacted. Furthermore, to the extent network operators were to create tiers of internet access service and either charge us or their customers for availability of our services through these tiers, our business could be negatively impacted.
In addition, the rapid growth of the internet and the proliferation in the use of content therein has created tensions and instability in the application of traditional intellectual property law concepts to such uses.
Compliance with new regulations or legislation or new interpretations of existing regulations or legislation could cause us to incur additional expenses, lose the ability to transact business in the way we have historically done or, make it more difficult to renew subscriptions automatically, make it more difficult to attract new customers or otherwise require us to alter our business model, or cause us to divert resources and funds to address government or private investigatory or adversarial proceedings. Any of these outcomes could have a material adverse effect on our business, financial condition or results of operations.
Our business is subject to evolving corporate governance and public disclosure regulations and expectations, including with respect to environmental, social and governance matters, which could expose us to numerous risks.
We are subject to changing rules and regulations promulgated by a number of governmental and self-regulatory organizations, including the SEC, NYSE and the Financial Accounting Standards Board. These rules and regulations continue to evolve in scope and complexity and many new requirements have been created in response to laws enacted by Congress, making compliance more difficult and uncertain. In addition, increasingly regulators, customers, investors, employees and other stakeholders are focusing on environmental, social and governance (“ESG”) matters and related disclosures. These changing rules, regulations and stakeholder expectations have resulted in, and are likely to continue to result in, increased general and administrative expenses and increased management time and attention spent complying with or meeting such regulations and expectations. For example, the collection, measurement and reporting of ESG-related information and metrics can be costly, difficult and time consuming and is subject to evolving reporting standards, including the SEC’s recently proposed climate-related reporting requirements, and similar proposals by other international regulatory bodies. We may also communicate certain initiatives and goals, regarding environmental matters, diversity, responsible sourcing and social investments and other ESG related matters, in our SEC filings or in other public disclosures. These ESG-related initiatives and goals could be difficult and expensive to implement, the technologies needed to implement them may not be cost effective and may not advance at a sufficient pace, and we could be criticized for the accuracy, adequacy or completeness of the disclosure. Further, statements about our ESG-related initiatives and goals, and progress against those goals, may be based on standards for measuring progress that are still developing, internal controls and processes that continue to evolve, and assumptions that are subject to change in the future. In addition, we could be criticized for the scope or nature of such initiatives or goals, or for any revisions to these goals. If our ESG-related data, processes and reporting are incomplete or inaccurate, or if we fail to achieve progress with respect to our goals within the scope of ESG on a timely basis, or at all, our reputation, business, financial performance and growth could be adversely affected.
Our operations may expose us to greater than anticipated income and transaction tax liabilities that could harm our financial condition and results of operations.
We are subject to income and other taxes in the United States and numerous other jurisdictions. Significant judgment is required in determining our worldwide provision for taxes. For example, see a discussion of the tax assessments from the Canadian Revenue Agency (“CRA”) relating to a subsidiary of the Company asserting additional tax is due under the heading “Item 7. Management’s Discussion and Analysis of Financial and Results of Operations—Liquidity and Capital Resources”. In the ordinary course of our business, we are involved in many transactions where the ultimate tax determination may be uncertain. Although we believe our tax provisions are reasonable, the final determination of tax
audits and any related litigation could be materially different from our historical income tax provisions and reserves for uncertain tax positions. We have created reserves with respect to such tax liabilities where we believe it to be appropriate. The final determination of such tax liabilities could have a material effect on our tax provision, net income, earnings per share, or cash flows in the period or periods for which that determination is made as well as subsequent periods. Furthermore, we have operations in various taxing jurisdictions in the United States and in other countries, and there is a risk that our tax liabilities in future taxable periods in one or more jurisdictions could exceed our estimated tax liabilities or our tax liabilities in prior taxable periods despite our plan to structure our activities in a manner so as to minimize our tax liabilities.
In addition, there are a number of applicable and potential government regulations that may impact the Company.
For example, the U.S. federal tax legislation commonly referred to as the Tax Cuts and Jobs Act (the “TCJA”), enacted in December 2017, resulted in fundamental changes to the Code, including, among many other things, a reduction to the federal corporate income tax rate, a partial limitation on the deductibility of business interest expense, a limitation on the deductibility of certain director and officer compensation expense, limitations on net operating loss carrybacks and carryovers and changes relating to the scope and timing of U.S. taxation on earnings from international business operations. Subsequent legislation, the Coronavirus Aid, Relief, and Economic Security Act (the “CARES Act”) enacted on March 27, 2020, relaxed certain of the limitations imposed by the TCJA for certain taxable years, including the limitation on the use and carryback of net operating losses and the limitation on the deductibility of business interest expense. The exact impact of the TCJA and the CARES Act for future years is difficult to quantify, but these changes could materially affect our effective tax rate in future periods. In addition, we are subject to the Inflation Reduction Act, which imposes a 1% excise tax on certain stock repurchases and a 15% alternative minimum tax on certain adjusted financial statement income. Several other legislative proposals have been set forth that would, if enacted, make significant changes to U.S. tax laws. Congress may consider, and could include, some or all of these proposals in connection with tax reform that may be undertaken. It is unclear whether these or similar changes will be enacted and, if enacted, how soon any such changes could take effect. The passage of any legislation as a result of these proposals and other similar changes in U.S. federal income tax laws could have an adverse impact on our effective rate of tax in future periods.
We may have exposure to sales or other transaction taxes (including VAT) on our past and future transactions. A successful assertion by any jurisdiction that we failed to pay such sales or other transaction taxes, or the imposition of new laws requiring the payment of such taxes, could result in substantial tax liabilities related to past sales, create increased administrative burdens or costs, discourage customers from purchasing images from us, or otherwise materially and adversely affect our financial condition and results of operations. Further, we are currently subject to and in the future may become subject to additional compliance requirements for certain of these taxes. Where appropriate, we have made accruals for these taxes, which are reflected in our consolidated financial statements.
Due to the large and expanding scale of our international business activities, any changes in the U.S. taxation of such activities may increase our worldwide effective tax rate and harm our financial condition and results of operations. In addition, tax authorities in a number of U.S. states, as well as the U.S. Congress, are currently reviewing the appropriate tax treatment of companies engaged in online commerce, and new state tax regulations might subject us to additional state sales and other taxes. If one or more U.S. local, state or non-U.S. jurisdictions impose sales tax collection obligations on us, our sales into such state or jurisdiction might decrease because the effective cost of purchasing goods from us increases for those residing in these states or jurisdictions. We might also incur significant financial and organizational burdens in order to set up the infrastructure required to comply with these applicable new tax regulations.
We collect, store, process, transmit and use personal information, which subjects us to governmental regulation and other legal obligations in many jurisdictions related to privacy, information security and data protection. Our actual or perceived failure to comply with such legal obligations by us, or by our third-party service providers or partners, could harm our business.
It is not always clear how existing laws governing issues such as property ownership, sales and other taxes, and personal privacy apply to the internet and e-commerce, as the vast majority of these laws were adopted prior to the advent of the internet and do not contemplate or address the unique issues raised by the internet or e-commerce. Regulatory scrutiny of privacy, data collection, use of data and data protection continues to intensify both within the United States and globally. The personal information and other data we collect, store, process and use are increasingly subject to legislation and regulations in numerous jurisdictions around the world, especially in the U.K. and Europe. These laws often develop in ways we cannot predict and some laws may be in conflict with one another. This may significantly increase our cost of doing business, particularly as we expand our localization efforts. In addition, we may not be readily able to achieve
compliance with the requirements of certain privacy and data security laws and regulations within the required periods for compliance.
For example, we are subject to the General Data Protection Regulation (the “GDPR”), which imposes stringent operational requirements for controllers and processors of personal information of individuals in the U.K. and European Economic Area (the “EEA”), and noncompliance can trigger fines of up to the greater of €20 million or 4% of global annual revenues. Further, following the U.K.’s formal exit from the E.U. in January 2020, we became subject to the GDPR as incorporated into U.K. law. In June 2021, the European Commission formally approved an adequacy decision for the U.K. on data protection in which they deemed the U.K.’s data protection regime sufficient to protect E.U. personal data, but the U.K. is considering changes to the Data Protection Act and there is no guarantee that the European Commission will continue to retain its adequacy decision with respect to U.K. data protection law in the future. Additionally, although we are making use of the E.U. Standard Contractual Clauses with regard to the transfer of certain personal data to countries outside the EEA, recent legal developments in Europe have created complexity and regulatory compliance uncertainty regarding certain transfers of personal information from the EEA to the United States. For example, on July 10, 2023, the European Commission adopted a new adequacy decision on the E.U.-U.S. Data Privacy Framework (“Data Privacy Framework”), following the invalidation of the E.U.-U.S. Data Privacy Shield by the Court of Justice of the European Union in July 2020. The Data Privacy Framework create new privacy obligations allowing personal information to be transferred from the E.U. to U.S. entities who have self-certified under the framework. We currently rely on a mixture of mechanisms to transfer personal data from our U.K. and E.U. businesses to the U.S. and we are an active participant in we are an active participant in the Data Privacy Framework (list available at https://www.dataprivacyframework.gov/). As supervisory authorities issue further guidance on personal information export mechanisms, including circumstances where the standard contractual clauses cannot be used and/or start taking enforcement action, we could suffer additional costs, complaints, and/or regulatory investigations or fines. Moreover, if we are otherwise unable to transfer personal information between and among countries and regions in which we operate, it could affect the manner in which we provide our services and could adversely affect our financial results.
Several other foreign jurisdictions have adopted or are considering adopting new or updated comprehensive privacy legislation to offer additional data privacy for individuals, such as: Brazil, where its General Data Protection Law that imposes detailed rules for the collection, use, processing and storage of personal data in Brazil took effect on September 18, 2020, and became enforceable on August 1, 2021; and India, where on August 9, 2023 the Digital Personal Data Protection Act was passed and comes into effect in June 2024, which imposes rules regarding the collection, use, processing and storage of personal data in India. Additionally, data privacy laws have been enacted in a number of jurisdictions, including, but not limited to, the European Union and certain U.S. states such as Illinois, Texas and Washington (in addition to U.S. cities, such as New York City), which regulate the collection and use of certain biometric data regarding individuals, including their facial images, and the use of such data, including in facial recognition systems. Similar laws have also been introduced in several additional states, but have not yet been enacted. We have entered into certain contractual agreements that may implicate or make use of such technology. Such laws may have the effect of adversely impacting our ability to grow our business in that area. Although we are closely monitoring regulatory developments in this area, any actual or perceived failure by us to comply with any regulatory requirements or orders or other domestic or international privacy or consumer protection-related laws and regulations could result in proceedings or actions against us by governmental entities or others (e.g., class action litigation), subject us to significant penalties and negative publicity, require us to change our business practices, increase our costs and/or adversely affect our business.
Data protection legislation is also becoming increasingly common in the United States at both the federal and state level. For example, in June 2018, the State of California enacted the California Consumer Privacy Act (“CCPA”), which came into effect on January 1, 2020. The CCPA requires, among other things, companies that collect personal information about California residents to make new disclosures to those residents about their data collection, use and sharing practices, allows residents to opt out of certain data sharing with third parties, and provides a new cause of action for data breaches. The California Privacy Rights Act (“CPRA”) came into effect on January 1, 2023 (with a look back to January 2022). It amends and expands the CCPA to add additional disclosure obligations (including an obligation to disclose retention periods or criteria for categories of personal information), grant consumers additional rights (including rights to correct their data, limit the use and disclosure of sensitive personal information, and opt out of the sharing of personal information for certain targeted behavioral advertising purposes), and establishes a privacy enforcement agency known as the California Privacy Protection Agency (“CPPA”). The CPPA will serve as California’s chief privacy regulator, which will likely result in greater regulatory activity and enforcement in the privacy area.
Further, the New York SHIELD Act became effective on March 21, 2020, the VACDPA became effective on January 1, 2023; the CPA and CTDPA both became effective on July 1, 2023; the UCPA became effective on December 31, 2023 (UCPA, together with the CCPA, CPRA, VACDPA, and CTDPA, the “U.S. State Privacy Laws”). The Florida Digital Bill of Rights, Montana Consumer Data Privacy Act, Oregon Consumer Data Privacy Act, and the Texas Data Privacy and
Security Act are expected to become effective by the end of 2024. Each of these laws carry similar consumer rights to those provided under the GDPR and California’s privacy laws, and require companies to make detailed disclosures to residents of those states about their data collection, use and sharing practices. Other states have also considered or are considering similar privacy laws. Additionally, the Federal Trade Commission and many state attorneys general are interpreting federal and state consumer protection laws to impose standards for the online collection, use, dissemination and security of data. The scope and interpretation of data privacy and cybersecurity regulations continues to evolve, and we believe that the adoption of increasingly restrictive regulations in this area is likely in the near future within the U.S. at both state and federal levels. The burdens imposed by the U.S. State Privacy Laws and other similar laws that may be enacted at the federal and state level may require us to modify our data processing practices and policies and to incur substantial costs in order to comply with these laws and to investigate, and defend against potential private class-action litigation or litigation brought by regulatory authorities.
In the event of a security incident, we may also have obligations under foreign and U.S. breach notification laws, such as the New York SHIELD Act, which became effective on March 21, 2020. Our marketing and promotional activities may be subject to laws such as the Controlling the Assault of Non-Solicited Pornography And Marketing Act, the Telephone Consumer Protection Act and the Telemarketing Sales Rule.
Further, we may be or become subject to data localization laws mandating that data collected from a foreign country be processed and stored only within that country. For example, the Indian Parliament passed the Digital Personal Data Protection Act in 2023, which limits storage of certain personal data outside of India. Such data localization requirements may have cost implications for us, impact our ability to utilize the efficiencies and value of our global network, and affect our strategy. Further, if other countries in which we have customers were to adopt data localization laws, we could be required to expand our data storage facilities there or build new ones in order to comply with these laws. The expenditure this would require, as well as costs of ongoing compliance, could harm our financial condition.
We are subject to payments-related risks that may result in higher operating costs or the inability to process payments, either of which could harm our financial condition and results of operations.
Non-payment or late payments of amounts due to us by customers could significantly and negatively affect our business and financial performance. A portion of our customers typically purchase our products on payment terms, and therefore we assume a credit risk for non-payment in the ordinary course of business. We evaluate the credit-worthiness of new customers and perform ongoing financial condition evaluations of our existing customers; however, there can be no assurance that our allowances for uncollected accounts receivable balances will be sufficient. As of December 31, 2023, our allowance for doubtful accounts was $6.5 million. If the volume of sales to enterprise customers continues to grow, we expect to increase our allowance for doubtful accounts primarily as the result of changes in the volume of sales to customers who pay on payment terms.
We accept payments using a variety of methods, including credit cards and debit cards, which are subject to additional regulations and compliance requirements and are susceptible to incidences of fraud. For certain payment methods, including credit and debit cards, we pay interchange and other fees, which may increase over time and raise our operating costs and lower profitability, and rely on third parties to provide processing services, who may be unwilling or unable to provide these services to us. We are also subject to payment card association operating rules, certification requirements and rules governing electronic funds transfers, which could change or be reinterpreted to make it difficult or impossible for us to comply. We may be required to provide cash deposits to our credit card processors. If we fail to comply with these rules or requirements, we could be subject to civil and criminal penalties or forced to cease our operations, fines and higher transaction fees or we could lose our ability to accept credit and debit card payments from consumers or facilitate other types of online payments. To date, we have experienced minimal losses from credit card fraud, but we continue to face the risk of significant losses from this type of fraud, which could adversely affect our financial condition and results of operations.
We are also subject to, or voluntarily comply with, several other laws and regulations relating to money laundering, international money transfers, privacy and information security and electronic fund transfers. If we were found to be in violation of applicable laws or regulations, we could be subject to civil and criminal penalties or forced to cease our operations.
We are, from time to time, subject to various litigation, the unfavorable outcomes of which might have a material adverse effect on our financial condition, results of operations and cash flow.
From time to time, we may become subject to various legal and regulatory proceedings relating to our business or otherwise. For example, see “Item 3. Legal Proceedings”. Due to the inherent uncertainties of litigation and regulatory proceedings, we cannot determine with certainty the ultimate outcome of any such litigation or proceedings. If the final resolution of any such litigation or proceedings is unfavorable, our financial condition, results of operations and cash flows could be materially affected.
Risks Related to Our Class A Common Stock
We qualify as an “emerging growth company” and “smaller reporting company” within the meaning of the Securities Act and Exchange Act, and we take advantage of certain exemptions from disclosure requirements available to emerging growth companies and smaller reporting companies, which could make our securities less attractive to investors and may make it more difficult to compare our performance to the performance of other public companies.
We qualify as an “emerging growth company” and “smaller reporting company” under the Securities Act and Exchange Act. As such, we are eligible for and take advantage of certain exemptions from various reporting requirements applicable to other public companies that are not emerging growth companies and/or smaller reporting companies for as long as we continue to be an emerging growth company and/or smaller reporting company, including, but not limited to, (a) not being required to comply with the auditor attestation requirements of Section 404 of the Sarbanes-Oxley Act, (b) reduced disclosure obligations regarding executive compensation in our periodic reports and proxy statements and (c) exemptions from the requirements of holding a nonbinding advisory vote on executive compensation and stockholder approval of any golden parachute payments not previously approved. As a result, our stockholders may not have access to certain information they may deem important. We will remain an emerging growth company until the earliest of (i) the last day of the fiscal year in which the market value of our Common Stock that is held by non-affiliates exceeds $700 million as of June 30 of that fiscal year, (ii) the last day of the fiscal year in which we have total annual gross revenue of $1.235 billion or more during such fiscal year (as indexed for inflation), (iii) the date on which we have issued more than $1 billion in non-convertible debt in the prior three-year period or (iv) December 31, 2027, which is the last day of the fiscal year following the fifth anniversary of the date of the first sale of Class A common stock in connection with the Business Combination. We would cease to be a smaller reporting company if (i) the market value of our voting and non-voting common stock held by non-affiliates is more than $250 million measured on the last business day of our second fiscal quarter or (ii) our annual revenue is more than $100 million during the most recently completed fiscal year and the market value of our voting and non-voting common stock held by non-affiliates is more than $700 million measured on the last business day of our second fiscal quarter. We cannot predict whether investors will find our securities less attractive because we rely on these exemptions. If some investors find our securities less attractive as a result of our reliance on these exemptions, the trading prices of our securities may be lower than they otherwise would be, there may be a less active trading market for our securities and the trading prices of our securities may be more volatile.
Our stock price has been and will likely continue to be volatile and may decline regardless of our operating performance.
The market price of our Class A common stock has fluctuated significantly in response to numerous factors and may continue to fluctuate, causing our stockholders to lose all or part of their investment in our Class A common stock since they may sell their shares at or below the price for which they purchased such shares. The trading price of our Class A common stock depends on a number of factors, including those described in this “Item 1A. Risk Factors” section, many of which are beyond our control.
The market prices of securities of companies have experienced fluctuations that often have been unrelated or disproportionate to their operating results. In the past, stockholders have sometimes instituted securities class action litigation against companies following periods of volatility in the market price of their securities. Any similar litigation against us could result in substantial costs, divert management’s attention and resources, and harm our business, financial condition, and results of operations.
Our stock price may be exposed to additional risks because our business became a public company through a “de-SPAC” transaction. There has been increased focus by government agencies on de-SPAC transactions in the last year, and we expect that increased focus to continue, and we may be subject to increased scrutiny by the SEC and other government agencies and holders of our securities as a result, which could adversely affect the price of our Class A Common Stock.
An active trading market for our Class A common stock may not be sustained.
Our Class A common stock is listed on the NYSE under the symbol “GETY” and trades on that market. We cannot assure you that an active trading market for our Class A common stock will be sustained. Accordingly, we cannot assure you of the liquidity of any trading market, your ability to sell your shares of our Class A common stock when desired or the prices that you may obtain for your shares.
Future sales of shares by existing stockholders could cause our stock price to decline.
The sale of substantial amounts of shares of our Class A common stock in the public market, or the perception that such sales could occur, could harm the prevailing market price of shares of our Class A Common Stock. These sales, or the possibility that these sales may occur, also might make it more difficult for us to sell equity securities in the future at a time and at a price that we deem appropriate.
If our existing stockholders sell or indicate an intention to sell substantial amounts of our Class A common stock in the public market, the trading price of our Class A common stock could decline. For example, as of March 1, 2024, the Getty Family Stockholders and Koch Icon Investments, LLC (“Koch Icon”) hold 47.2% and 19.9% of our Class A common stock, respectively. In addition, shares underlying any outstanding options and Restricted Stock Units will become eligible for sale if exercised or settled, as applicable, and to the extent permitted by the provisions of various vesting agreements and Rule 144 of the Securities Act (“Rule 144”). All the shares of Class A common stock subject to stock options outstanding and reserved for issuance under its equity incentive plans were registered under the Securities Act and such shares are eligible for sale in the public markets, subject to Rule 144 limitations applicable to affiliates. If these additional shares are sold, or if it is perceived that they will be sold in the public market, the trading price of our Class A common stock could decline.
As restrictions on resale have end and the registration statements are available for use, the market price of our Class A common stock could decline if the holders of currently restricted shares sell them or are perceived by the market as intending to sell them. These factors could also make it more difficult for us to raise additional funds through future offerings of our Class A common stock or other securities.
If securities or industry analysts either do not publish research about us or publish inaccurate or unfavorable research about us, our business, or its market, or if they change their recommendations regarding our Class A common stock adversely, the trading price or trading volume of our Class A common stock could decline.
The trading market for our Class A common stock is influenced in part by the research and reports that securities or industry analysts may publish about us, its business, our market, or our competitors. If one or more of the analysts initiate research with an unfavorable rating or downgrade our Class A Common Stock, provide a more favorable recommendation about our competitors, or publish inaccurate or unfavorable research about our business, the trading price of our Class A common stock would likely decline. In addition, we currently expect that securities research analysts will establish and publish their own periodic projections for our business. These projections may vary widely and may not accurately predict the results we actually achieve. Our stock price may decline if our actual results do not match the projections of these securities research analysts. While we expect research analyst coverage, if no analysts commence or maintain coverage of us, the trading price and volume for our Class A common stock could be adversely affected. If any analyst who may cover us were to cease coverage of us or fail to regularly publish reports on us, we could lose visibility in the financial markets, which in turn could cause the trading price or trading volume of our Class A common stock to decline.
Delaware law and anti-takeover provisions in our Amended and Restated Certificate of Incorporation and Amended and Restated Bylaws could make a merger, tender offer, or proxy contest difficult, thereby depressing the trading price of our Class A Common Stock.
Our Amended and Restated Certificate of Incorporation and Amended and Restated Bylaws contain provisions that could depress the trading price of our Class A common stock by acting to discourage, delay, or prevent a change of control of us or changes in our management that our stockholders may deem advantageous. These provisions include the following:
•a classified board of directors so that not all members of our board of directors are elected at one time;
•the right of the board of directors to establish the number of directors and fill any vacancies and newly created directorships;
•director removal solely for cause;
•“blank check” preferred stock that our board of directors could use to implement a stockholder rights plan;
•the right of our board of directors to issue our authorized but unissued Class A common stock and preferred stock without stockholder approval;
•no ability of our stockholders to call special meetings of stockholders;
•no right of our stockholders to act by written consent, which requires all stockholder actions to be taken at a meeting of our stockholders;
•limitations on the liability of, and the provision of indemnification to, our director and officers;
•the right of the board of directors to make, alter, or repeal our Amended and Restated Bylaws; and
•advance notice requirements for nominations for election to our board of directors or for proposing matters that can be acted upon by stockholders at annual stockholder meetings.
In addition, we will continue to be subject to Section 203 of the Delaware General Corporate Law. Section 203 prohibits a publicly held Delaware corporation from engaging in a business combination with an interested stockholder for a period of three years following the date such person becomes an interested stockholder, unless the business combination or the transaction in which such person becomes an interested stockholder is approved in a prescribed manner. Generally, a “business combination” includes a merger, asset or stock sale, or other transaction resulting in a financial benefit to the interested stockholder. Generally, an “interested stockholder” is a person that, together with affiliates and associates, owns, or within three years prior to the determination of interested stockholder status did own, 15% or more of a corporation’s voting stock. The existence of this provision may have an anti-takeover effect with respect to transactions not approved in advance by our board of directors and the anti-takeover effect includes discouraging attempts that might result in a premium over the market price for the shares of our Class A common stock.
Any provision of our Amended and Restated Certificate of Incorporation or Amended and Restated Bylaws that has the effect of delaying or deterring a change in control could limit the opportunity for our stockholders to receive a premium for their shares of our Class A common stock, and could also affect the price that some investors are willing to pay for our Class A common stock.
Our Amended and Restated Certificate of Incorporation provides that the Court of Chancery of the State of Delaware will be the exclusive forum for substantially all disputes between us and our stockholders, which could limit our stockholders’ ability to obtain a favorable judicial forum for disputes with us or our directors, officers or employees.
Our Amended and Restated Certificate of Incorporation provides that the Court of Chancery of the State of Delaware is the exclusive forum for any derivative action or proceeding brought on our behalf, any action asserting a breach of fiduciary duty, any action asserting a claim against us arising pursuant to the Delaware General Corporation Law, our Amended and Restated Certificate of Incorporation or Amended and Restated Bylaws or any action asserting a claim against us that is governed by the internal affairs doctrine. These choice of forum provisions may limit a stockholder’s ability to bring a claim in a judicial forum that it finds favorable for disputes with us or our directors, officers or other employees and may discourage these types of lawsuits. This provision would not apply to claims brought to enforce a duty or liability created by the Exchange Act or any other claim for which the federal courts have exclusive jurisdiction. Our Amended and Restated Certificate of Incorporation provides further that, to the fullest extent permitted by law, the federal district courts of the United States will be the exclusive forum for resolving any complaint asserting a cause of action arising under the Securities Act. However, Section 22 of the Securities Act provides that federal and state courts have concurrent jurisdiction over lawsuits brought under the Securities Act or the rules and regulations thereunder. To the extent the exclusive forum provision restricts the courts in which claims arising under the Securities Act may be brought, there is uncertainty as to whether a court would enforce such a provision. We note that investors cannot waive compliance with the federal securities laws and the rules and regulations thereunder. Furthermore, the enforceability of similar choice of forum provisions in other companies’ certificates of incorporation has been challenged in legal proceedings, and it is possible that a court could find these types of provisions to be inapplicable or unenforceable. While the Delaware courts have determined that such choice of forum provisions are facially valid, a stockholder may nevertheless seek to bring a claim in a venue other than those designated in the exclusive forum provisions, and there can be no assurance that such provisions will be enforced by a court in those other jurisdictions. If a court were to find the exclusive-forum provision contained in our Amended and Restated Certificate of Incorporation to be inapplicable or unenforceable in an action, we may incur additional costs associated with resolving such action in other jurisdictions, which could harm our business.
We do not intend to pay dividends for the foreseeable future.
We currently intend to retain any future earnings to finance the operation and expansion of our business and we do not expect to declare or pay any dividends in the foreseeable future. As a result, stockholders must rely on sales of their Class A common stock after price appreciation as the only way to realize any future gains on their investment.
We may issue additional shares of Class A common stock or other equity securities without your approval, which would dilute shareholder ownership interests and may depress the market price of our Class A common stock.
As of December 31, 2023, we had outstanding options to purchase up to an aggregate of 27,790,625 shares of our Class A common stock, 8,735,236 outstanding Restricted Stock Units (“RSUs”) and 963,000 outstanding Performance Stock Units (“PSUs”) outstanding. We also have the ability to initially issue up to 51,104,577 shares of Class A common stock under the 2022 Equity Incentive Plan, 5,000,000 shares of Class A common stock under the ESPP, 6,000,000 shares of Class A common stock under the Earn Out Plan (as defined below).
We may issue additional shares of Class A common stock or other equity securities of equal or senior rank in the future in connection with, among other things, future acquisitions or repayment of outstanding indebtedness, without stockholder approval, in a number of circumstances.
Our issuance of additional shares of Class A common stock or other equity securities of equal or senior rank would have the following effects:
•Our existing stockholders’ proportionate ownership interest in us will decrease;
•the amount of cash available per share, including for payment of dividends (if any) in the future, may decrease;
•the relative voting strength of each previously outstanding share of Class A common stock may be diminished; and the market price of our shares of Class A common stock may decline.
Item 1B. Unresolved Staff Comments.
None.
Item 1C. Cybersecurity
The Company’s management is responsible for the day-to-day management of risk, and our board of directors, including through its committees, is responsible for understanding and overseeing the various risks facing the Company.
Cybersecurity Risk Management and Strategy
Increased global cybersecurity vulnerabilities, threats and more sophisticated and targeted cyber-related attacks pose an ongoing risk to the security of our information systems and networks. Getty Images seeks to manage cybersecurity risks consistent with its general approach to enterprise risk management.
Getty Images engages third parties to conduct assessments to help it identify, categorize and manage cyber risks and to confirm compliance with applicable legal and regulatory requirements. Additionally, management and third parties conduct ongoing vulnerability scanning and performs penetration testing from time to time to help Getty Images identify and reduce the threat of known and emerging cybersecurity risks.
Board Oversight and Governance
Getty Images’ board of directors has delegated the oversight of cybersecurity risks to the Audit Committee. The Audit Committee assists Getty Images’ board of directors in its oversight of the policies and practices used by Getty Images to identify, assess and manage key risks facing Getty Images, including cybersecurity risks. Members of management, including the Company’s Chief Technology Officer (“CTO”), provide the Audit Committee with updates on cybersecurity and information technology matters. In turn, the Audit Committee and management also provide updates to Getty Images’ board of directors. In addition to reporting to the Audit Committee and Getty Images’ board of directors, the CTO provides periodic reports to our Chief Executive Officer and other members of our senior management as appropriate. The Audit Committee, or Getty Images’ board of directors, is notified of cybersecurity incidents, as appropriate, in accordance with the Company’s incident response processes.
Cybersecurity Oversight
Management plays an important role in assessing and managing Getty Images’ material risks from cybersecurity threats. The CTO is responsible for oversight of the design and implementation of the security program and strategy. Getty Images’ current CTO has served in various roles in technology for over 25 years, and has had had oversight of information technology and information security for both Getty Images (6+ years) and other organizations.
At the employee level, we maintain an experienced information technology team who is tasked with implementing our privacy and cybersecurity program and support the CTO in carrying out reporting, security, and mitigation functions.
As part of the Getty Images cybersecurity program, cross-functional teams throughout the Company address cybersecurity threats and respond to cybersecurity incidents. Through ongoing communications with these teams, the CTO and senior management are informed about and monitor the prevention, detection, mitigation and remediation of cybersecurity threats and incidents and escalate such threats and incidents as appropriate through the processes described in more detail below.
Management’s cybersecurity risk management strategy and processes focus on several key areas, including:
•Incident Response Planning: Getty Images has a global Information Security Incident Response Plan (the “Plan”) for identifying and managing cyber and data security threats. The Plan defines the roles and responsibilities of Company stakeholders involved in responding to cyber and data security events, severity levels and incident categories, and it outlines a process for incident management, including escalation and communication procedures. A cross-functional working group of security, privacy, and legal personnel review significant incidents to determine if further escalation is appropriate. If an incident could be deemed material, it is escalated to the CTO and other members of the executive team, and we consult with outside counsel during this assessment as appropriate.
•Technical Safeguards: Getty Images seeks to continuously improve technical safeguards that are designed to protect its information systems. Standards include controls for identity and access management, cyber threat and incident management, data security, encryption, human resource security, network and device security, secure asset management, secure system development, security operations and third-party security. While Getty Images seeks to maintain adequate cybersecurity controls, it may not always be effective. See “Item 1A. Risk Factors—Our failure to protect the proprietary information of our customers and our networks against cyberattacks, security breaches or unauthorized access could adversely affect our business and results of operations, damage our reputation and expose us to liability” and “We collect, store, process, transmit and use personal information, which subjects us to governmental regulation and other legal obligations in many jurisdictions related to privacy, information security and data protection” for more information as well as related risks.
•Education and Awareness: We require annual employee trainings on privacy and cybersecurity, records and information management, and generally seek to promote awareness of cybersecurity risk through communication and education of our employee population.
•Third-Party Risk Management: We rely on certain third-party computer systems and third-party service providers in connection with providing some of our services. We also depend upon various third parties to process payments for our transactions around the world. These third-party business partners, service providers, and consultants need to access our customer and other data and in some cases connect to our computer networks. We define expected security and privacy requirements through our contracting processes with third parties and we perform third-party cyber risk assessments to monitor the cyber risk management efforts of third parties as needed.
•Threat Intelligence: Our security teams engage in threat intelligence, predictive modeling, and penetration testing to understand the Company's threat landscape and reduce the risk and impact of cybersecurity incidents.
Material Effects of Cybersecurity Incidents
As of the date of this Annual Report, we have experienced cybersecurity incidents and threats, including malware, phishing, partner and customer account takeover attacks, and denial-of-service attacks on our systems. We do not believe these cybersecurity incidents have materially affected our business strategy, results of operations, or financial condition. However, there is no guarantee that a future cyber incident would not materially affect our business strategy, results of operations or financial condition. To learn more about risks from cybersecurity threats, review the risk factors included in “Item 1A. Risk Factors” in this Annual Report, as updated by Getty Images’ subsequent SEC filings. The risks described in such filings are not the only risks facing Getty Images. Additional risks and uncertainties not currently known or that may currently be deemed to be immaterial may materially adversely affect Getty Images’ business, financial condition, or results of operations.
Item 2. Properties.
Our major U.S. offices are located in New York and Seattle, and our major offices in the rest of the world are located in London, Dublin, and Calgary. In all, as of December 31, 2023, we have staff in 33 countries across the globe. We lease these offices and all of our other office spaces around the world.
For additional information regarding obligations under operating leases, see “Note 19 – Leases” of the Notes to the Consolidated Financial Statements included in this Annual Report.
We believe that our facilities are adequate for our current needs.
Item 3. Legal Proceedings.
The Company was named as a defendant in two lawsuits filed by former warrant holders in the United States District Court for the Southern District of New York, Alta Partners, LLC v. Getty Images Holdings, Inc., Case No. 1:22-cv-08916 (filed October 19, 2022) and CRCM Institutional Master Fund (BVI) LTD et al. v. Getty Images Holdings, Inc., Case No. 1:23-cv-01074 (filed February 8, 2023). The plaintiffs generally allege breaches of the Warrant Agreement dated August 4, 2020 and alternative claims for violations of federal securities laws, including claims under the Securities Act of 1933 and/or the Securities Exchange Act of 1934. The complainants seek, among other things, an award of money damages. On October 27, 2023, the Court issued its decision on cross-motions for summary judgment filed by all parties and entered judgment in favor of the Plaintiffs on their breach of contract claims in the amount of $36.9 million for Alta Partners, LLC and $51.0 million for the CRCM plaintiffs, plus, in each case, pre-judgment interest of 9% per annum. The Court entered judgments in favor of the Company on all other claims asserted by the Plaintiffs. The Company has appealed that portion of the Court’s judgment in favor of the Plaintiffs. Alta has cross appealed that portion of the Court’s judgment in favor of the Company.
Getty Images (US), Inc. is a plaintiff in a lawsuit filed in the United States District Court for the District of Delaware against Stability AI, Inc. The case, Getty Images (US), Inc. v. Stability AI, Inc., Case No. 1:23-cv-00135-GBW (filed February 3, 2023), arises out of the defendant’s alleged unauthorized reproduction of approximately 12 million images from Getty Images’ websites, along with the accompanying captions and associated metadata, and use of the copied content in connection with Stability AI’s generative artificial intelligence model known as Stable Diffusion. Getty Images (US), Inc. has asserted claims for copyright infringement; removal, alteration and/or falsification of copyright management information; trademark infringement; unfair competition; trademark dilution; and deceptive trade practices. The Complaint seeks, among other things, monetary damages and injunctive relief. The defendant has not yet responded to the Complaint. On May 2, 2023, the defendants moved to dismiss or, in the alternative, to transfer the case to the Northern District of California. The defendants’ motion is premised on their contention that Stability AI, Ltd. is not subject to personal jurisdiction in Delaware. Getty Images served jurisdictional discovery requests on Defendants on May 12, 2023, and the parties agreed to extend Getty Images (US), Inc.’s time to respond to the motion to dismiss while the parties engage in discovery relating to the defendants’ activities within Delaware and other states in the U.S. On January 26, 2024, the court dismissed the defendants’ motion to dismiss without prejudice with leave to re-file upon the completion of jurisdictional discovery.
Arising out of similar alleged facts, Getty Images (US), Inc., Getty Images International U.C., Getty Images (UK) Limited, Getty Images Devco UK Limited and iStockphoto LP are Claimants in proceedings issued in the High Court of England & Wales against Stability AI Limited on January 16, 2023, claim number IL2023-000007, which, together with the Particulars of Claim (the Claimants’ statement of case) were served on the defendant on May 12, 2023. The Claimants assert claims for copyright infringement, infringement of database rights, trademark infringement, passing off and breach of the terms and conditions of the Claimants’ websites and seeks, amongst other things, monetary damages, injunctive relief and legal costs. In June 2023, Stability filed a motion to strike certain portions of the claim and grant summary judgment on Getty Images’ secondary infringement claim. The court conducted a hearing on the issues in October 2023. Following the hearing, the Judge issued an order denying Stability’s motion in its entirety and granted costs to Getty Images. The order became final and public in late January 2024. Stability has requested an appeal against that decision. The case schedule has been set for the next stages of the litigation, including disclosures and any additional changes to the parties' claims or defense. A trial date has not yet been set.
Although we cannot be certain of the outcome of any litigation or the disposition of any claims, nor the amount of damages and exposure, if any, that we could incur, we currently believe that the final disposition of all existing matters will not have a material adverse effect on our business, results of operations, financial condition or cash flows. Further, in the ordinary course of our business, we are also subject to periodic threats of lawsuits, investigations and claims. Regardless of the
outcome, litigation can have an adverse impact on us because of defense and settlement costs, diversion of management resources and other factors.
Item 4. Mine Safety Disclosures
Not applicable.
PART II
Item 5. Market for Registrant’s Common Equity, Related Stockholder Matters and Issuer Purchases of Equity Securities.
Market Information
Our Class A common stock is currently listed on the NYSE under the symbol “GETY”. As of March 11, 2024, there were 405,870,456 shares of Class A common stock issued and outstanding held of record by 40 holders. Because many of our shares of Class A common stock are held by brokers and other institutions on behalf of stockholders, this number is not indicative of the total number of stockholders represented by these stockholders of record.
Dividends
We have not paid any cash dividends on our Class A common stock to date. The payment of cash dividends in the future will be dependent upon our revenues and earnings, if any, capital requirements and general financial condition. The payment of any cash dividends will be within the discretion of our Board at such time. In addition, we are not currently contemplating and do not anticipate declaring any cash dividends in the foreseeable future as it is currently expected that available cash resources will be utilized in connection with our ongoing operations.
Recent Sales of Unregistered Securities
All sales of unregistered securities during the fiscal year ended December 31, 2023 have been previously reported in our filings with the SEC.
Issuer Purchases of Equity Securities
We did not acquire any shares of Class A common stock during the three months ended December 31, 2023.
Stock Performance Graph
The following graph compares the cumulative total return to stockholders from the closing price on July 25, 2022 (the date our Class A common stock began trading on the NYSE following the Business Combination) through December 31, 2023, relative to the performance of the Russell 2000 Index and the S&P Composite 1500 Interactive Media & Services Index. The stock performance graph assumes $100 was invested in our Class A common stock and the common stock of each of
the companies listed on the Russell 2000 Index and the S&P Composite 1500 Interactive Media & Services Index on July 25, 2022.
| | | | | | | | | | | | | | | | | | | | |
| 7/25/2022 | 12/31/2022 | | 6/30/2023 | | 12/31/2023 |
| Getty Images Holdings, Inc. | $ | 100.00 | | $ | 60.56 | | | $ | 53.33 | | | $ | 57.38 | |
| Russell 2000 Index | $ | 100.00 | | $ | 97.57 | | | $ | 105.44 | | | $ | 114.04 | |
| S&P Composite 1500 Interactive Media & Services Index | $ | 100.00 | | $ | 80.49 | | | $ | 126.27 | | | $ | 149.55 | |
Item 6.
[Reserved]
Item 7. Management’s Discussion and Analysis of Financial and Results of Operations
Condition and Results of Operations
The following discussion and analysis of the financial condition and results of operations of Getty Images should be read together with our consolidated financial statements and related notes included elsewhere in this Annual Report. The discussion should also be read together with the “Cautionary Note Regarding Forward-Looking Statements” above and the “Item 1A Risk Factors” disclosure above for additional discussion of the risks and uncertainties that could cause our actual results to differ materially from those expressed or implied in our forward-looking statements.
Business Overview and Recent Developments
In 1995, Mark Getty and Jonathan Klein co-founded the predecessor to Getty Images, Inc. in London. In September 1997, Getty Communications, as it was called at the time, merged with PhotoDisc, Inc. to form Getty Images, Inc. Legacy Getty was incorporated in Delaware on September 25, 2012, and in October of the same year, indirectly acquired Getty Images, Inc.
On July 22, 2022 (the “Closing Date”), the Company consummated the transactions in the Business Combination Agreement, dated December 9, 2021 (the “Business Combination Agreement” and the consummation of such transactions, the “Closing”), by and among CC Neuberger Principal Holdings II, a Cayman Islands exempted company (“CCNB”), the Company (at such time, named Vector Holding, LLC, a Delaware limited liability company and wholly-owned subsidiary of CCNB), Vector Domestication Merger Sub, LLC, a Delaware limited liability company and wholly-owned subsidiary of the Company (“Domestication Merger Sub”), Vector Merger Sub 1, LLC, a Delaware limited liability company and a wholly-owned subsidiary of CCNB (“G Merger Sub 1”), Vector Merger Sub 2, LLC, a Delaware limited liability company and a wholly-owned subsidiary of CCNB (“G Merger Sub 2”), Griffey Global Holdings, Inc., a Delaware corporation (“Legacy Getty”), and Griffey Investors, L.P., a Delaware limited partnership (the “Partnership”). On the day prior to the Closing Date, the Company statutorily converted from a Delaware limited liability company to a Delaware corporation (the “Statutory Conversion”). On the Closing Date, CCNB merged with and into Domestication Merger Sub, with Domestication Merger Sub surviving the merger as a wholly-owned direct subsidiary of the Company (the “Domestication Merger”). Following the Domestication Merger on the Closing Date, G Merger Sub 1 merged with and into Legacy Getty, with Legacy Getty surviving the merger as an indirect wholly-owned subsidiary of the Company (the “First Getty Merger”). Immediately after the First Getty Merger, Legacy Getty merged with and into G Merger Sub 2 with G Merger Sub 2 surviving the merger as an indirect wholly-owned subsidiary of the Company (the “Second Getty Merger” and together with the First Getty Merger, the “Getty Mergers” and, together with the Statutory Conversion and the Domestication Merger, the “Business Combination”).
Getty Images is a preeminent global visual content creator and marketplace. Through Getty Images, iStock, and Unsplash, we offer a full range of content solutions to meet the needs of any customer—no matter their size—around the globe, with over 562 million visual assets available through its industry-leading sites. New content and coverage is added daily, with over 10 million new assets added each quarter and over 2.8 billion searches annually. The Company has almost 800,000 purchasing customers, with customers from almost every country in the world and websites in 23 languages bringing the world’s best content to media outlets, advertising agencies and corporations of all sizes and, increasingly, to individual creators and prosumers.
In support of its content, Getty Images employs over 110 staff photographers and videographers, distributes the content of over 557,000 contributors and more than 320 premium content partners. Over 80,000 of our contributors are exclusive to the Company, creating content that cannot be found anywhere else. Each year, we cover more than 160,000 global events across news, sport and entertainment, providing a depth and breadth of coverage that is unmatched. Getty Images also maintains one of the largest and best privately-owned photographic archives in the world with over 135 million images across geographies, time periods and verticals.
Through our content and coverage, Getty Images moves the world — whether the goal is commercial or philanthropic, revenue-generating or society-changing, market-disrupting or headline-driving. Through our staff, our exclusive contributors and partners, and our expertise, data and research, Getty Images’ content grabs attention, sheds light, represents communities and reminds us of our history.
We offer comprehensive content solutions including a la carte (“ALC”) and subscription access to our pre- shot content and coverage, custom content and coverage solutions, generative AI-services, digital asset management tools, data insights, research, and print offerings.
For 29 years, Getty Images has embraced innovation; from analogue to digital, from offline to e-commerce, from stills to video, from single image purchasing to subscriptions, from websites to application programming interfaces (“APIs”), from pre-shot content to AI generated content designed to be commercially safe. With quality content at the core of our offerings, we embrace innovation as a means to better service our existing customers and to reach new ones.
Creative
Creative is comprised of royalty free (“RF”) photos, illustrations, vectors, videos, and generative AI-services, that are released for commercial use and cover a wide variety of commercial, conceptual and contemporary subjects, including lifestyle, business, science, health, wellness, beauty, sports, transportation and travel. This content is available for immediate use by a wide range of customers with a depth, breadth and quality allowing our customers to produce impactful websites, digital media, social media, marketing campaigns, corporate collateral, textbooks, movies, television and online video content relevant to their target geographies and audiences. We primarily source Creative content from a broad network of professional, semi-professional and amateur creators, many of whom are exclusive to Getty Images. We have a global creative insights team dedicated to providing briefing and art direction to our exclusive contributor community. Creative represents 63.1%, 63.2% and 65.0% of our revenue of which 53.3%, 47.4% and 41.8% is generated through our annual subscription products, for the years ended December 31, 2023, 2022 and 2021, respectively. Annual Subscription products include products and subscriptions with a duration of 12 months or longer, Unsplash API and Custom Content.
Editorial
Editorial is comprised of photos and videos covering the world of entertainment, sports and news. We combine contemporary coverage of events around the globe with one of the largest privately held archives globally with access to images to the beginning of photography. We invest in a dedicated editorial team which includes over 110 staff photographers and videographers to generate our own coverage in addition to coverage from our network of content partners. Editorial represents 35.0%, 35.2% and 33.4% of our revenue, of which 53.3%, 52.1% and 53.5% is generated through our annual subscription products, for the years ended December 31, 2023, 2022 and 2021, respectively. Annual Subscription products include subscriptions with a duration of 12 months or longer.
Other
Other represents 1.9%, 1.6%, and 1.6% of our revenue for the years ended December 31, 2023, 2022, and 2021, respectively. This includes music licensing, digital asset management and distribution services, print sales and data licensing.
We service a full range of customers through our industry-leading brands and websites:
Getty Images
Gettyimages.com offers premium creative content and editorial coverage, including video, with exclusive content, and customizable rights and protections. This site primarily serves larger enterprise agency, media and corporate customers with global customer support from our sales and service teams. Customers can purchase on an ALC basis or through our content subscriptions, including our “Premium Access” subscription, where we uniquely offer frictionless access across all of our content in one solution.
iStock
iStock.com is our budget-conscious e-commerce offering our customers access to creative stills and video, which includes exclusive content. This site primarily serves SMBs, including the growing freelance market. Customers can purchase on an ALC basis or through a range of monthly and annual subscription options with access to an extensive amount of unique and exclusive content.
Unsplash
Unsplash.com is a platform offering free stock photo downloads and paid subscriptions targeted to the high-growth prosumer and semi-professional creator segments. The Unsplash website reaches a significant and geographically diverse audience with more than 103 million image downloads every month. On October 4, 2022, Unsplash launched Unsplash+, an unlimited paid subscription providing access to unique model released content with expanded legal protections.
***
In addition to our websites, customers and partners can access and integrate our content, metadata and search capabilities via our APIs and through a range of mobile apps and plugins.
We are a critical intermediary between content suppliers and a broad set of customers. We compete against a broad range of stock licensing marketplaces, editorial news agencies, creative agencies, production companies, staff and freelance photographers and videographers, photo and video archives, freelance marketplaces and amateur content creators, creative tools and services and free sources. Getty Images’ unique offering and approach offers a strong value proposition to our customers and content contributors.
For customers:
•We offer a comprehensive suite of high quality, authentic content, purchase and licensing options and services to meet the needs of our customers, regardless of project requirements, needs or budgets.
•Our content sourcing and production, rights oversight, websites and content distribution are all supported by a unique, scalable cloud-based unified platform with powerful artificial intelligence/machine learning and data addressing all customers at scale.
•Customers have access to Generative AI by Getty Images and iStock which is designed to be a commercially-safe and responsible solution designed to help embrace AI, elevate creativity, and ideate or iterate on concepts and compositions.
•Customers can avoid the costly investment and environmental impact of producing content on their own. This can include costs incurred from staffing, travel and access, model and location, hardware and production, and editing.
•Customers do not have to wait for content to be produced and distributed and can avoid the difficulties and pitfalls of searching across the internet to locate and negotiate for rights to license or use specific content. Our best-in-class, scaled infrastructure offers customers a one-stop shop for instant content access and maneuverability.
•Customers licensing from Getty Images and iStock receive trusted copyright claim protections, model and property releases and the ability to secure the necessary clearances for their intended use of the content.
For content contributors:
•Access to a marketplace that reaches almost every country in the world, across all customer categories and sizes and generated annual royalties of nearly $220 million for the year ended December 31, 2023.
•We maintain a dedicated and experienced creative insights team focused on understanding changes in customer demand, the visual landscape, the authentic portrayal of communities and cultures, and the evolution of core creative concepts. We work closely with leading organizations to augment our proprietary research and understanding of communities and cultures to provide content with authentic depiction. We convey this research to our exclusive contributors via actionable insights allowing them to invest in and create content that accurately caters to changing consumer demand and up to date market trends.
•Not only do we provide exclusive contributors with scaled access to end markets and proprietary information, but we also provide premium royalty rates. This allows our exclusive contributors and partners to confidently invest more into their productions with the potential to generate higher returns.
•Partnering with Getty Images allows contributors to focus on content creation and avoid time and financial investment in the marketing, sales, distribution and management of their content.
•Our Generative AI by Getty Images and iStock products compensates our world-class content creators for the use of their work in our AI models, allowing them to continue to create more high-quality pre-shot imagery.
Russia and Ukraine Conflict
Getty Images does not maintain a direct business or employee presence within Russia or Ukraine. Our in-country presence is limited to our editorial staff covering the conflict and broader consequences. Revenues generated through e-commerce
and third-party licensing of our content within Russia and Ukraine represent less than 1% of our business. We do work with creative contributors within Ukraine and Russia, of which, the majority are non-exclusive to Getty Images. We continue to license their content and are complying with all sanctions and trade rules.
Closing of the Business Combination
In connection with the Business Combination, on the Closing Date, Getty Images issued, (a) an aggregate of 66,000,000 shares of Class A common stock for aggregate gross proceeds of $660.0 million and (b) 20,000,000 shares of Class A common stock and 3,750,000 Forward Purchase Warrants (as defined in the notes to the consolidated financial statements included elsewhere in this Annual Report) for an aggregate purchase price of $200 million. The foregoing transactions resulted in aggregate gross proceeds to the Company of approximately $864.2 million, which included approximately $4.2 million remaining in the trust account. The Company used the proceeds, in addition to cash on hand, to repay a portion of its outstanding indebtedness and retire the Redeemable Preferred Stock of Legacy Getty. Each option to purchase shares of common stock of Legacy Getty (whether vested or unvested) was converted into a comparable option to purchase shares of Class A common stock of Getty Images.
See also “Note 5 — Common Stock Warrants” and “Note 16 — Stockholders’ Equity (Deficit)” in our consolidated financial statements included elsewhere in this Annual Report for information on additional transactions related to the Business Combination.
Key Performance Indicators (KPI)
The Key Performance Indicators outlined below are the metrics that provide management with the most immediate understanding of the drivers of business performance and our ability to deliver shareholder return, track to financial targets and prioritize customer satisfaction. Note, KPI comparisons to periods prior to the year ended December 31, 2022 reflect some COVID-19 impact.
Beginning with the three months ended September 30, 2022, the Company made two changes to its reporting that has some impact on reported KPI’s. First, activity for LATAM, Turkey and Israel, which was previously excluded from these metrics, is now included due to completion of a system migration. Additionally, the method by which we aggregate our customer accounts was updated to better align with our internal sales CRM system. We have not restated historical periods given the immaterial impact to the KPI’s, except for LTM total active annual subscribers and LTM annual subscriber revenue retention rate for which the legacy reporting format is detailed below.
| | | | | | | | | | | | | | | | | |
| Years Ended December 31, |
| 2023 | | 2022 | | 2021 |
LTM total purchasing customers (thousands)1 | 799 | | 835 | | 794 |
LTM total active annual subscribers (thousands)1 | 236 | | 129 | | 75 |
LTM paid download volume (millions)1,2 | 95 | | 95 | | 89 |
| LTM annual subscriber revenue retention rate | 92.4 | % | | 100.1 | % | | 104.5 | % |
Image collection (millions)1 | 535 | | 497 | | 458 |
| Video collection (millions) | 28 | | 24 | | 20 |
LTM video attachment rate1 | 14.1 | % | | 13.1 | % | | 12.1 | % |
____________________
1The Company launched Unsplash+ during the three months ended December 31, 2022. This new Unsplash subscription is included within these KPIs from the launch date forward.
2Excludes downloads from Editorial Subscriptions, Editorial feeds and certain API structured deals, including bulk unlimited deals. Excludes downloads starting in Q3’22 tied to a two-year deal signed with Amazon in July 2022, as the magnitude of the potential download volume over the deal term could result in significant fluctuations in this metric without corresponding impact to revenue in the same period.
Total purchasing customers is the count of total customers who made a purchase within the reporting period based on billed revenue. This metric provides management and investors with an understanding of both how we are growing our purchasing customer base and combined with revenue, an understanding of our average revenue per purchasing customer. This metric differs from total customers, which is a count of all downloading customers, irrespective of whether they made a purchase in the period. This decrease is tied to both our continued shift into subscription products and continued contraction in our agency customers who consume nearly entirely on an a la carte or transactional basis.
Total active annual subscribers is the count of customers who were on an annual subscription product during the LTM reporting period. This metric provides management and investors with visibility into the rate at which we are growing our annual subscriber base and is highly correlated to the percentage of our revenue that comes from annual subscription products. Growth in annual subscribers reflects the Company’s deliberate focus on expanding its subscription offerings for customers to provide comprehensive content solutions across all price points. The increase of approximately 83% over the corresponding period in 2022 was driven primarily by our e-commerce subscriptions, including our iStock and Unsplash+ subscriptions. Absent the reporting changes noted above, LTM total active annual subscribers under legacy reporting would have been 212 thousand and 116 thousand for December 31, 2023 and December 31, 2022, respectively.
Paid download volume is a count of the number of paid downloads by our customers in the reported period. This metric informs both management and investors about the volumes at which customers are engaging with our content over time. Paid download volume was flat in the LTM ended December 31, 2023, as compared to the LTM ended December 31, 2022, but up compared to the LTM ended December 31, 2021. The steady demand in paid download volumes during a year with a myriad of macro-economic challenges, is a strong outcome and signals that our content continues to meet our customers evolving needs.
Annual subscriber revenue retention rate calculates retention of total revenue for customers on annual subscription products, comparing the customer’s total booked revenue (inclusive of spend for both annual subscription and non-annual subscription products) in the LTM period to the prior twelve month period. For example, LTM annual subscriber booked revenue (the amount of revenue invoiced to customers) for the period ended December 31, 2023 was 92.4% of revenue from these customers in the period ended December 31, 2022. Revenue retention rate informs management and investors on the degree to which we are maintaining or growing revenue from our annual subscriber base. As we continue to focus on growing subscriptions as percentage of total revenue, revenue retention for these customers is a key driver of the predictability of our financial model with respect to revenue. LTM annual subscriber revenue retention rate decreased for the period ended December 31, 2023, as compared to the period ended December 31, 2022. The decline was primarily driven by lower revenue retention rates on some of our smaller e-commerce subscription customers. Absent the reporting changes noted above, LTM annual subscriber retention rate under legacy reporting would have been 90.7% and 99.2% for December 31, 2023 and December 31, 2022, respectively.
Image and Video collection is a count of the total images and videos in our content library as of the reporting date. Management and investors can view growth in the size, both depth and breadth, of the content library as an indication of our ability to continue to expand our content offering with premium, high quality, contemporary content to meet the evolving needs of our customers. Image and video collections increased during the period ending December 31, 2023 as compared to the periods ending December 31, 2022 and 2021.
Video attachment rate is a measure of the percentage of total paid customer downloaders who are video downloaders. Customer demand for video content continues to grow and represents a significant opportunity for revenue growth for Getty Images. The video attachment rate provides management and investors with an indication of our customers’ level of engagement with our video content offering. Our expansion of video across our subscription products is focused on further increasing the attachment rate over time. The increase in video attachment rates from the LTM periods ending December 31, 2022 and 2021 to the period ending December 31, 2023 reflects increased customer awareness of our video offering, improved search and site prominence for video content, and upselling of video into subscriptions.
Executive summary
Revenue
We generate revenue by licensing content to customers through multiple license models and purchase options, as well as by providing related services to our customers. The key image licensing model in the pre-shot market is RF. Content licensed on a RF basis is subject to a standard set of terms, allowing the customer to use the image for an unlimited duration and without limitation on the use or application. Within our video offering, we also offer a licensing model known as Rights-Ready. The Rights-Ready model offers a limited selection of broader usage categories, thus simplifying the purchase process. In September 2023 and January 2024, we launched Generative AI by Getty Images and Generative AI by iStock, respectively. They are generative AI text to image tools that were trained exclusively on Getty Images’ world‑class creative content and designed for commercial use. Customers that download visuals through the tool will receive the standard royalty‑free license.
In addition to licensing imagery and video, we also generate revenue from custom content solutions, photo and video assignments, music content in some of our subscriptions, print sales, data licensing and licensing our digital asset management systems to help customers manage their owned and licensed digital content.
References to “reported revenue” in this discussion and analysis are to our revenue as reported in our historical audited consolidated financial statements for the relevant periods and reflect the effect of changes in foreign currency exchange rates. References to “currency neutral” (“Currency Neutral” or “CN”) revenue growth (expressed as a percentage) in this section refer to our revenue growth (expressed as a percentage), excluding the effect of changes in foreign currency exchange rates. See “— Non-GAAP Financial Measures” for additional information regarding Currency Neutral revenue growth (expressed as a percentage).
Cost of revenue (exclusive of depreciation and amortization)
The ownership rights to the majority of the content we license are retained by the owners, and licensing rights are provided to us by a large network of content contributors and content partners. When we license content entrusted to us by content suppliers, we pay royalties to them at varying rates depending on the license model and the use of that content that our customers select. Suppliers who choose to work with us under contract typically receive royalties of 20% to 50% of the total license fee we charge customers, depending on the basis on which their content is licensed by our customers. Contributors will be compensated on an annual recurring basis for any inclusion of their content in AI data training sets and, in certain cases, share in the revenue generated by AI tools and services trained with their content. We also own the copyright to certain content in our collections (wholly-owned content), including content produced by our staff photographers for our editorial product, for which we do not pay any third-party royalties. Cost of revenue includes certain costs of our assignment photo shoots, but excludes amortization associated with creating or buying content. Cost of revenue consists primarily of royalties owed to content contributors, comprised of photographers, filmmakers, third-party companies that license their collection of content through us (“Content Partners”) and third party music content providers. We expect our cost of revenue as a percentage of revenue to vary modestly based on changes in revenue mix by product, as royalty rates vary depending on license model and use of content.
Selling, general and administrative expenses
Selling, general and administrative expenses (“SG&A”) primarily consists of staff costs, marketing expense, occupancy costs, professional fees and other general operating charges. We expect our selling, general and administrative expenses to increase in absolute dollars but remain relatively constant as a percentage of revenue in the near term. Absolute dollar spending will increase as we continue to expand our operations and invest in our growth. Lastly, we expect our marketing to stay relatively constant as a percentage of revenue. However, the Company will continue to evaluate opportunities to incrementally invest in marketing as may be appropriate.
Depreciation
Depreciation expense consists of internally developed software, content and equipment depreciation. We record property and equipment at cost and reflect Balance Sheet balances net of accumulated depreciation. We record depreciation expense on a straight-line basis. We depreciate leasehold improvements over the shorter of the respective lives of the leases or the useful lives of the improvements.
We expect depreciation expense to remain stable as we continue to innovate and invest in the design, user experience and performance of our websites.
Amortization
Amortization expense consists of the amortization of intangible assets related to acquired customer relationships, trademarks and other intangible assets. The majority of our intangible assets have been fully amortized as of December 31, 2023. We expect amortization expense to be insignificant in the coming years.
Factors affecting results of operations
A shift in the product mix of our revenue may affect our overall cost of revenue as a percentage of revenue. Our revenues and profitability are also subject to fluctuations in foreign exchange rates. The weakening or strengthening of our reporting
currency, the U.S. dollar, during any given period as compared to currencies that we collect revenues in, most notably, the Euro and British pound, impacts our reported revenues.
Our future financial condition and results of operation will also be dependent upon various factors that generally affect the digital content industry, including the general trends affecting the media, marketing and advertising customer bases that we target, protection of intellectual property, and new and expanding technology such as generative artificial intelligence technologies. In addition, our financial condition and results of operation will continue to be affected by factors that affect internet commerce companies and by general macroeconomic factors such as the global uncertainty caused by, among other things, any lingering effects of the Hollywood actors and writers strike and COVID-19 pandemic, the military conflicts between Russia and Ukraine and in the Middle East, high interest rates, currency fluctuations, high inflation and labor shortages.
Results of Operations
Comparison of the Years Ended December 31, 2023 and 2022
| | | | | | | | | | | | | | | | | | | | | | | | | | |
| Consolidated statements of operations | | | | | | | | |
| (In thousands) | | Years Ended
December 31, | | increase (decrease) |
| | 2023 | | 2022 | | $ change | | % change |
| REVENUE | | $ | 916,555 | | | $ | 926,244 | | | $ | (9,689) | | | (1.0) | % |
| | | | | | | | |
| OPERATING EXPENSE: | | | | | | | | |
| Cost of revenue (exclusive of depreciation and amortization shown separately below) | | 250,249 | | | 254,990 | | | (4,741) | | | (1.9) | % |
| Selling, general and administrative expenses | | 402,516 | | | 375,582 | | | 26,934 | | | 7.2 | % |
| Depreciation | | 54,374 | | | 49,574 | | | 4,800 | | | 9.7 | % |
| Amortization | | 24,069 | | | 43,645 | | | (19,576) | | | (44.9) | % |
| | | | | | | | |
| Loss on litigation | | 116,051 | | | 1,101 | | | 114,950 | | | NM |
| Recovery of loss on litigation | | (60,000) | | | — | | | (60,000) | | | NM |
| Other operating expense (income) – net | | 1,624 | | | (681) | | | 2,305 | | | NM |
| Operating expense | | 788,883 | | | 724,211 | | | 64,672 | | | 8.9 | % |
| INCOME FROM OPERATIONS | | 127,672 | | | 202,033 | | | (74,361) | | | (36.8) | % |
| | | | | | | | |
| OTHER EXPENSE, NET: | | | | | | | | |
| Interest expense | | (126,884) | | | (117,229) | | | (9,655) | | | 8.2 | % |
| (Loss) gain on fair value adjustment for swaps and foreign currency exchange contract – net | | (7,573) | | | 23,508 | | | (31,081) | | | NM |
| Unrealized foreign exchange (losses) gain – net | | (23,772) | | | 24,643 | | | (48,415) | | | NM |
| Loss on extinguishment of debt | | — | | | (2,693) | | | 2,693 | | | NM |
| Net loss on fair value adjustment for warrant liabilities | | — | | | (160,728) | | | 160,728 | | | NM |
| Other non-operating income (expense) – net | | 3,652 | | | (3,051) | | | 6,703 | | | NM |
| | | | | | | | |
| Total other expense – net | | (154,577) | | | (235,550) | | | 80,973 | | | (34.4) | % |
| LOSS BEFORE INCOME TAXES | | (26,905) | | | (33,517) | | | 6,612 | | | (19.7) | % |
| INCOME TAX BENEFIT (EXPENSE) | | 46,482 | | | (44,126) | | | 90,608 | | | NM |
| | | | | | | | |
| NET INCOME (LOSS) | | $ | 19,577 | | | $ | (77,643) | | | $ | 97,220 | | | NM |
____________________
NM - Not meaningful
| | | | | | | | | | | | | | | | | | | | | | | | | | | | | | | | | | | | | | | | | | | | |
| Revenue by product | | | | | | | | | | | | | | |
| (In thousands) | | Years Ended
December 31, | | increase / (decrease) |
| | 2023 | | % of revenue | | 2022 | | % of revenue | | $ change | | % change | | CN % change |
| Creative | | 578,727 | | | 63.1 | % | | 585,398 | | | 63.2 | % | | (6,671) | | | (1.1) | % | | (0.6) | % |
| Editorial | | 320,643 | | | 35.0 | % | | 325,779 | | | 35.2 | % | | (5,136) | | | (1.6) | % | | (1.2) | % |
| Other | | 17,185 | | | 1.9 | % | | 15,067 | | | 1.6 | % | | 2,118 | | | 14.1 | % | | 14.9 | % |
| Total revenue | | $ | 916,555 | | | 100.0 | % | | $ | 926,244 | | | 100.0 | % | | $ | (9,689) | | | (1.0) | % | | (0.5) | % |
| Certain prior year amounts have been reclassified to conform to the current year presentation. |
Consolidated Revenue. For the year ended December 31, 2023, reported revenue was $916.6 million as compared to reported revenue of $926.2 million for the year ended December 31, 2022. On a reported basis for the year ended December 31, 2023, revenue decreased by 1.0% (0.5% CN) year over year. Foreign exchange movements negatively impacted reported revenue growth for the year ended December 31, 2023 by 50 basis points, largely driven by the strengthening dollar relative to the EUR and GBP. Additionally, starting in Q2 2023, the Hollywood actors and writers strikes negatively impacted both our Creative and Editorial product lines.
Creative. In Creative, revenue decreased on a reported basis 1.1% (0.6% CN) for the year ended December 31, 2023. At the product level, decreases for the year included Getty Images Stills and Video (decreased $23.8 million) and iStock monthly subscriptions and ALC credit sales (decreased $11.3 million), which was in part due to our continued focus on driving customers to our committed solutions. Offsetting increases were led by our iStock annual subscriptions (increased $12.1 million) and Getty Images annual subscriptions (increased $17.2 million). Without the declines of our agency business, which sits entirely in Creative, the Creative business is growing.
Editorial. In Editorial, revenue decreased on a reported basis 1.6% (1.2% CN) for the year ended December 31, 2023. The decrease was driven by editorial ALC (decreased $9.8 million), which is partially due to our continued focus on driving customers to our committed solutions. Also, comparative results were impacted by the US political midterm elections, Men’s World Cup and Winter Olympics all occurring in the prior year. Offsetting increases were seen across both assignments (increased by $3.4 million) and editorial subscriptions (increased $1.3 million).
Other. This category includes music licensing, digital asset management and distribution services, print sales, and data licensing revenues. Revenue for the year ended December 31, 2023 from our Other products increased on a reported basis by 14.1% (14.9% CN). The increase was driven by music licensing (increase of $1.2 million), digital asset management and distribution services (increase of $0.9 million) and data licensing (increase of $0.7 million), partially offset by print sales (decreased by $0.8 million).
Cost of revenue (exclusive of depreciation and amortization). Cost of revenue for the year ended December 31, 2023 was $250.2 million (27.3% of revenue) compared to $255.0 million (27.5% of revenue) in the prior year. The decrease in cost of revenue as a percentage of revenue compared to the prior year was due primarily to revenue mix by product. Generally, cost of revenue rates vary modestly period over period based on changes in revenue mix by product, as royalty rates vary depending on the license model and use of content.
Selling, general and administrative expense. Reported SG&A expense increased by $26.9 million or 7.2% (7.5% CN) for the year ended December 31, 2023 as compared to the year ended December 31, 2022. SG&A fluctuations from the prior period include the following:
•increase of $31.2 million related to staff costs for the year ended December 31, 2023. The increase was largely driven by equity-based compensation (increased $28.4 million), resulting primarily from grants of restricted stock units.
•increase in professional fees of $5.7 million for the year ended December 31, 2023. The increase was primarily related to legal fees associated with ongoing litigation related to our intellectual property rights. Beginning in the third quarter of 2023, the Company reclassified historical legal fees associated with our warrant litigation from “Selling, general and administrative expenses” to “Loss on litigation” within the Condensed Consolidated Statements of Operations. As a result, for the six months ended June 30, 2023, $6.4 million has been reclassified to Loss on litigation and for the year ended December 31, 2022, $1.1 million has been reclassified to Loss on litigation.
•decrease in marketing spend of 13.1% ($7.3 million) for the year ended December 31, 2023. For the year ended December 31, 2023, marketing spend as a percentage of sales decreased to 5.3% from the year ended December 31, 2022 ratio of 6.0%. The decrease was due primarily to decreased investment in digital marketing.
•decrease of $2.0 million related to occupancy costs (primarily rent expense), as we continue to evaluate our office space needs now and into the future.
Depreciation expense. For the year ended December 31, 2023, depreciation expense was $54.4 million which was in line with the prior year.
Amortization expense. For the year ended December 31, 2023, amortization expense was $24.1 million which was a decrease of $19.6 million compared to the prior year. The decrease was due to several of our intangible assets becoming fully amortized in the fourth quarter of 2022.
Loss on litigation. For the year ended December 31, 2023, the Company’s loss on litigation of $116.1 million was comprised of the summary judgment amounts related to two lawsuits filed by former public warrant holders, in addition to pre and post judgment interest and associated legal fees and other direct costs through December 31, 2023. Loss on Litigation will increase in the future to the extent we continue to incur costs associated with this litigation.
Recovery of loss on litigation. The Company has recognized recovery of loss on litigation of $60.0 million, which represents the limit of the Company’s third-party insurance coverage related to the lawsuits filed by former public warrant holders.
Other operating (income) expense - net. For the year ended December 31, 2023, the increase in other operating expense, net from the prior year was $2.3 million. This increase in net expense was due to the prior year change in fair value of the Contingent Consideration related to our Unsplash acquisition. For further details, see “Note 7 — Fair Value of Financial Instruments” in our consolidated financial statements included elsewhere in this Annual Report. Additionally, the prior year income from the change in fair value of Contingent Consideration was partially offset by expenses associated with the abandonment of some of our office space in North America as we continue to evaluate our global office space needs. We recognized insignificant amounts of other operating expense, net for the year ended December 31, 2023.
Interest expense. We recognized interest expense of $126.9 million and $117.2 million for the year ended December 31, 2023 and December 31, 2022, respectively. Our interest expense primarily consists of interest charges on our outstanding U.S. dollar and Euro term loans (the “Term Loans”), $300.0 million of Senior Unsecured Notes (the “Senior Notes”), and our revolving credit facility as well as the amortization of original issue discount on our Term Loans and amortization of deferred debt financing fees. The increase in interest expense was due to the rise in interest rates in 2023 as compared to 2022. The increase was partially offset by the Company voluntarily prepaying a total of $50.4 million of outstanding indebtedness in 2023.
Fair value adjustment for swaps and foreign currency exchange contract - net. We recognized fair value adjustment loss for our swaps and foreign currency exchange contracts, net of $7.6 million for the year ended December 31, 2023, compared with net gains of $23.5 million for the year ended December 31, 2022. Gains and losses are driven by changes in interest and foreign exchange rates, relative to the rates in our derivatives.
Unrealized foreign exchange gains - net. We recognized foreign exchange losses, net of $23.8 million for the year ended December 31, 2023, compared with gains of $24.6 million for the year ended December 31, 2022. These changes are primarily driven by fluctuations in the EUR related to our EUR Term Loans.
Loss on extinguishment of debt. For the year ended December 31, 2022, the Company utilized proceeds from the Business Combination along with cash on hand to repay $300.0 million of outstanding indebtedness on its USD Term Loans. The loss on debt extinguishment represents the acceleration of the issuance costs and debt discount. There were no such costs in the current year.
Net loss on fair value adjustment of warrant liabilities. For the year ended December 31, 2022, there was a loss on fair value of our warrant liability of $160.7 million. There was no such warrant liability in the current year.
Other non-operating income (expense) - net. We recognized other non-operating income, net of $3.7 million and expense of $3.1 million for the year ended December 31, 2023 and December 31, 2022, respectively. For the year ended December 31, 2023, the income primarily related to interest income from our cash and cash equivalents. For the year ended
December 31, 2022, the expense relates to the transaction costs that were allocated to the fair value of the warrant liability, which were expensed upon the Closing of the Business Combination.
Income tax expense. The Company’s income tax expense decreased by $90.6 million to a benefit of ($46.5) million for the year ended December 31, 2023, as compared to an expense of $44.1 million for the year ended December 31, 2022. The Company’s effective income tax rate for the year ended December 31, 2023 is 172.8%, compared to (131.7%) for the year ended December 31, 2022. The decrease in tax expense compared to the prior year is primarily due to the release of the Ireland valuation allowance and a release of uncertain tax position reserves in current year.
Comparison of the Year Ended December 31, 2022 and December 31, 2021
| | | | | | | | | | | | | | | | | | | | | | | | | | |
| Consolidated statements of operations | | | | | | | | |
| (In thousands) | | Years Ended
December 31, | | increase (decrease) |
| | 2022 | | 2021 | | $ change | | % change |
| REVENUE | | $ | 926,244 | | | $ | 918,688 | | | $ | 7,556 | | | 0.8 | % |
| | | | | | | | |
| OPERATING EXPENSE: | | | | | | | | |
| Cost of revenue (exclusive of depreciation and amortization shown separately below) | | 254,990 | | | 248,152 | | | 6,838 | | | 2.8 | % |
| Selling, general and administrative expenses | | 375,582 | | | 367,704 | | | 7,878 | | | 2.1 | % |
| Depreciation | | 49,574 | | | 51,099 | | | (1,525) | | | (3.0) | % |
| Amortization | | 43,645 | | | 49,361 | | | (5,716) | | | (11.6) | % |
| | | | | | | | |
| Loss on litigation | | 1,101 | | | — | | | 1,101 | | | NM |
| Other operating expense (income) – net | | (681) | | | 386 | | | (1,067) | | | NM |
| Operating expense | | 724,211 | | | 716,702 | | | 7,509 | | | 1.0 | % |
| INCOME FROM OPERATIONS | | 202,033 | | | 201,986 | | | 47 | | | — | |
| | | | | | | | |
| OTHER EXPENSE, NET: | | | | | | | | |
| Interest expense | | (117,229) | | | (122,160) | | | 4,931 | | | (4.0) | % |
| (Loss) gain on fair value adjustment for swaps and foreign currency exchange contract – net | | 23,508 | | | 19,282 | | | 4,226 | | | 21.9 | % |
| Unrealized foreign exchange (losses) gain – net | | 24,643 | | | 36,406 | | | (11,763) | | | (32.3) | % |
| Loss on extinguishment of debt | | (2,693) | | | — | | | (2,693) | | | NM |
| Net loss on fair value adjustment for warrant liabilities | | (160,728) | | | — | | | (160,728) | | | NM |
| Other non-operating income (expense) – net | | (3,051) | | | 612 | | | (3,663) | | | NM |
| | | | | | | | |
| Total other expense – net | | (235,550) | | | (65,860) | | | (169,690) | | | 257.7 | % |
| (LOSS) INCOME BEFORE INCOME TAXES | | (33,517) | | | 136,126 | | | (169,643) | | | NM |
| INCOME TAX BENEFIT (EXPENSE) | | (44,126) | | | (18,729) | | | (25,397) | | | 135.6 | % |
| | | | | | | | |
| NET INCOME (LOSS) | | $ | (77,643) | | | $ | 117,397 | | | $ | (195,040) | | | NM |
____________________
NM - Not meaningful
| | | | | | | | | | | | | | | | | | | | | | | | | | | | | | | | | | | | | | | | | | | | |
| Revenue by product | | | | | | | | | | | | | | |
| (In thousands) | | Year ended
December 31, | | increase / (decrease) |
| | 2022 | | % of revenue | | 2021 | | % of revenue | | $ change | | % change | | CN % change |
| Creative | | 585,398 | | | 63.2 | % | | 596,913 | | | 65.0 | % | | (11,515) | | | (1.9) | % | | 2.7 | % |
| Editorial | | 325,779 | | | 35.2 | % | | 306,635 | | | 33.4 | % | | 19,144 | | | 6.2 | % | | 11.5 | % |
| Other | | 15,067 | | | 1.6 | % | | 15,140 | | | 1.6 | % | | (73) | | | (0.5) | % | | 4.1 | % |
| Total revenue | | $ | 926,244 | | | 100.0 | % | | $ | 918,688 | | | 100.0 | % | | $ | 7,556 | | | 0.8 | % | | 5.7 | % |
| Certain prior year amounts have been reclassified to conform to the current year presentation. |
Consolidated Revenue. For the year ended December 31, 2022, reported revenue was $926.2 million as compared to reported revenue of $918.7 million for the year December 31, 2021. On a reported basis for the year ended December 31, 2022 revenue increased by 0.8% (5.7% CN) year over year. Foreign exchange movements negatively impacted reported revenue growth for the year ended December 31, 2022 by 490 basis points, largely driven by the strengthening dollar relative to the EUR and GBP.
Creative. In Creative, revenue decreased on a reported basis 1.9% (increased 2.7% CN) for the year ended December 31, 2022. At the product level, decreases for the year ended December 31, 2022 was driven largely by our Premium Royalty Free ALC product (decreased $21.8 million), which was largely due to our continued focus on driving customers to our committed solutions. This decrease was partially offset by our Premium Access subscription product, which showed growth compared to the prior year (increased $9.0 million). Absent the currency impact, the annual subscriptions grew across all product offerings with additional growth from Unsplash, more than offsetting the declines within our ALC products.
Editorial. In Editorial, revenue increased on a reported basis 6.2% (11.5% CN) for the year ended December 31, 2022. The increase was seen across assignments (increased $11.2 million), our editorial subscription and Premium Access offerings (increased $5.7 million) and ALC (increased $2.2 million). These increases were primarily driven by Entertainment (from the COVID-19 recovery we have seen since 2021) and Sport (which has grown beyond the pre-COVID periods and has performed at historically high levels during the period).
Other. This category includes music licensing, digital asset management and distribution services, print sales, and data licensing revenues. Revenue for the year ended December 31, 2022 from our Other products decreased on a reported basis by 0.5% (increased 4.1% CN). The decrease was driven by print sales (decreased $1.2 million); which was partially offset by music licensing (increased $0.8 million) and digital asset management and distribution services (increased $0.4 million).
Cost of revenue (exclusive of depreciation and amortization). Cost of revenue for the year ended December 31, 2022 was $255.0 million (27.5% of revenue) compared to $248.2 million (27.0% of revenue) in the prior year. The increase in cost of revenue as a percentage of revenue compared to the prior year was due primarily to revenue mix by product. Generally, cost of revenue rates vary modestly period over period based on changes in revenue mix by product, as royalty rates vary depending on the license model and use of content.
Selling, general and administrative expense. Reported SG&A expense increased by $7.9 million or 2.1% (5.4% CN) for the year ended December 31, 2022 as compared to the year ended December 31, 2021. SG&A fluctuations from the prior period include the following:
•increase in computer related expenses of $3.2 million for the year ended December 31, 2022. The increase was due primarily to our continued growth and related cloud storage needs.
•increase in professional fees of $2.0 million for the year ended December 31, 2022. The increase was largely due to fees associated with our public company readiness efforts. Beginning in the third quarter of 2023, the Company reclassified historical legal fees associated with our warrant litigation from “Selling, general and administrative expenses” to “Loss on litigation” within the Condensed Consolidated Statements of Operations. As a result, for the three months ended December 31, 2022, $1.1 million has been reclassified to Loss on litigation.
•increase in marketing spend of 3.9% ($2.1 million) for the year ended December 31, 2022. For the year ended December 31, 2022, marketing spend as a percentage of sales increased to 6.0% from the year ended December 31, 2021 ratio of 5.8%. These increases were due primarily to increased investment in affiliate and digital marketing.
•increases were also seen in insurance expense ($1.7 million), other taxes ($0.7 million) and travel and entertainment ($1.5 million).
•decrease of $2.2 million related to staff costs for the year ended December 31, 2022 The decrease was largely due to a reduction in bonus expense tied to company performance, which was partially offset by an increase in salaries and wages, driven by our annual raise cycle and increased headcount.
•decrease of $1.8 million related to occupancy costs (primarily rent expense), as we continue to evaluate our office space needs now and into the future.
Depreciation expense. For the year ended December 31, 2022, depreciation expense was $49.6 million which was in line with the prior year.
Amortization expense. For the year ended December 31, 2022, amortization expense was $43.6 million which was a decrease of $5.7 million compared to the prior year. The decrease was due to several of our intangible assets becoming fully amortized in the fourth quarter of 2022.
Loss on litigation. For the year ended December 31, 2022, the Company’s loss on litigation of $1.1 million was comprised of legal fees related to two lawsuits by former public warrant holders.
Other operating (income) expense - net. For the year ended December 31, 2022, the decrease in other operating expense, net from the prior period was $1.1 million. This decrease in expense was driven by the change in fair value of the Contingent Consideration related to our Unsplash acquisition. For further details, see “Note 7 — Fair Value of Financial Instruments” in our consolidated financial statements included elsewhere in this Annual Report. Additionally, this change was partially offset by expenses associated with the abandonment of some of our office space in North America as we continue to evaluate our global office space needs.
Interest expense. We recognized interest expense of $117.2 million and $122.2 million for the year ended December 31, 2022 and December 31, 2021, respectively. Our interest expense primarily consists of interest charges on our outstanding Term Loans, Senior Notes, and our revolving credit facility as well as the amortization of original issue discount on our term loans and amortization of deferred debt financing fees. The Company repaid $300.0 million of outstanding indebtedness in Q3 2022, which decreased our interest expense for the remainder of 2022 as compared to 2021. This decrease was partially offset by the rise in interest rates during 2022.
Fair value adjustment for swaps and foreign currency exchange contract - net. We recognized fair value adjustment gains for our swaps and foreign currency exchange contracts, net of $23.5 million for the year ended December 31, 2022, compared with net gains of $19.3 million for the year ended December 31, 2021. Gains and losses are driven by changes in interest and foreign exchange rates, relative to the rates in our derivatives.
Unrealized Foreign exchange gains - net. We recognized foreign exchange gains, net of $24.6 million for the year ended December 31, 2022, compared with gains of $36.4 million for the year ended December 31, 2021. These changes are primarily driven by fluctuations in the EUR related to our EUR Term Loans.
Loss on extinguishment of debt. The Company utilized proceeds from the Business Combination along with cash on hand to repay $300.0 million of outstanding indebtedness on its USD Term Loans. The loss on debt extinguishment represents the acceleration of the issuance costs and debt discount.
Net loss on fair value adjustment for warrant liabilities. For the year ended December 31, 2022, there was a loss on fair value of our warrant liability of $160.7 million. There was no such warrant liability in the prior year.
Other non-operating (expense) income - net. We recognized other non-operating expense, net of $3.1 million and other non-operating income, net of $0.6 million for the year ended December 31, 2022 and December 31, 2021, respectively. The increase in expense from the prior year period relates to the transaction costs that were allocated to the fair value of the warrant liability, which were expensed upon the Closing of the Business Combination.
Income tax expense. The Company’s income tax expense increased by $25.4 million to an expense of $44.1 million for the year ended December 31, 2022, as compared to an expense of $18.7 million for the year ended December 31, 2021. The Company’s effective income tax rate for the year ended December 31, 2022 is (131.7%), compared to 13.8% for the year ended December 31, 2021. The increase in tax expense compared to the prior year is primarily due to changes in
nondeductible net loss on fair value adjustment for warrant liabilities in the current year, nondeductible officer compensation, and a release of uncertain tax position reserves in 2021.
Non-GAAP Financial Measures
In addition to our results determined in accordance with generally accepted accounting principles in the United States (“GAAP”), we believe the non-GAAP measures of Currency Neutral (“CN”) revenue growth (expressed as a percentage) and Adjusted Earnings Before Interest, Taxes, Depreciation, and Amortization (“EBITDA”) are useful in evaluating our operating performance. We believe that non-GAAP financial information, when taken collectively, may be helpful to investors because it provides consistency and comparability with past financial performance and assists in comparisons with other companies, some of which use similar non-GAAP information to supplement their GAAP results. The non-GAAP financial information is presented for supplemental informational purposes only, and should not be considered a substitute for financial information presented. Investors are encouraged to review the related GAAP financial measures and the reconciliation of these non-GAAP financial measures to their most comparable GAAP financial measures.
Currency Neutral Revenue
Currency Neutral revenue changes (expressed as a percentage) excludes the impact of fluctuating foreign currency values pegged to the U.S. dollar between comparative periods by translating all local currencies using the current period exchange rates. We consistently apply this approach to revenue for all countries where the functional currency is not the U.S. dollar. We believe that this presentation provides useful supplemental information regarding changes in our revenue not driven by fluctuations in the value of foreign currencies.
Adjusted EBITDA
A reconciliation is provided below to the most comparable financial measure stated in accordance with GAAP. We define Adjusted EBITDA Margin as the ratio of Adjusted EBITDA to revenue.
| | | | | | | | | | | | | | | | | | | | |
| (in thousands) | | Year Ended December 31, |
| | 2023 | | 2022 | | 2021 |
| Net income (loss) | | $ | 19,577 | | | $ | (77,643) | | | $ | 117,397 | |
| Add/(less) non-GAAP adjustments: | | | | | | |
| Depreciation and amortization | | 78,443 | | | 93,219 | | | 100,460 | |
Loss on litigation, net of recovery 1 | | 56,051 | | | 1,101 | | | — | |
| Other operating expense (income) – net | | 1,624 | | | (681) | | | 386 | |
| Interest expense | | 126,884 | | | 117,229 | | | 122,160 | |
Fair value adjustments, foreign exchange and other non operating (expense) income — net2 | | 27,693 | | | (45,100) | | | (56,300) | |
| Loss on extinguishment of debt | | — | | | 2,693 | | | — | |
| Loss on fair value adjustment for warrant liabilities — net | | — | | | 160,728 | | | — | |
| Income tax expense | | (46,482) | | | 44,126 | | | 18,729 | |
| Equity-based compensation expense | | 37,652 | | | 9,292 | | | 6,441 | |
| Adjusted EBITDA | | $ | 301,442 | | | $ | 304,964 | | | $ | 309,273 | |
| Net income (loss) margin | | 2.1 | % | | (8.4) | % | | 12.8 | % |
| Adjusted EBITDA Margin | | 32.9 | % | | 32.9 | % | | 33.7 | % |
____________________
1 Beginning with the third quarter of 2023 reporting period, the Company reclassified historical legal fees associated with our warrant litigation from “Selling, general and administrative expenses” to “Loss on litigation” within the Condensed Consolidated Statements of Operations. The aggregate amount of these fees reported through June 30, 2023, totaled $7.5 million, with $1.1 million recognized for the three months ended December 31, 2022 and $6.4 million recognized for the six months ended June 30, 2023. This change in classification serves to increase our Adjusted EBITDA by $6.4 million for the year ended December 31, 2023 and $1.1 million for the year ended December 31, 2022, when compared to classification in prior periods.
2 Fair value adjustments for our swaps and foreign currency exchange contracts, foreign exchange gains (losses) and other insignificant non-operating related (expenses) income.
Liquidity and Capital Resources
Our sources of liquidity are our existing cash and cash equivalents, cash provided by operations and amounts available under our revolving credit facility. As of December 31, 2023, 2022 and 2021, we had cash and cash equivalents of $136.6 million, $97.9 million and $186.3 million, respectively, and availability under our revolving credit facility. On May 4, 2023, we increased and extended our revolving credit facility to $150.0 million, which expires May 4, 2028. Additionally, we voluntarily prepaid a total of $50.4 million of outstanding indebtedness in 2023. Our principal liquidity needs include debt service and capital expenditures, as well as those required to support working capital, internal growth, and strategic acquisitions and investments. Deferred revenue represents the majority of our current liabilities, which given its nature is not expected to require cash settlement.
As we have previously disclosed, the Company has been named as a defendant in two lawsuits filed by former public warrant holders. The plaintiffs generally alleged breaches of the Warrant Agreement, dated August 4, 2020, and alternative claims for violations of the federal securities laws, including claims under the Securities Act of 1933 and/or the Securities Exchange Act of 1934. On October 27, 2023, the Court issued its decision on the cross-motions for summary judgment and entered judgment in favor of Plaintiffs on their breach of contract claims in the amount of $36.9 million for Alta Partners, LLC and $51.0 million for the CRCM plaintiffs, plus, in each case, pre-judgment interest of 9.0% per annum. The Company’s Loss on Litigation is comprised of these summary judgment amounts, in addition to pre and post-judgment interest and associated legal fees and other direct costs through December 31, 2023. The Company has recognized Recovery of Loss on Litigation of $60.0 million, which represents the limit of the Company’s insurance coverage for this matter. As of December 31, 2023, the Company had a remaining insurance recovery receivable of $48.6 million. The Company has appealed the part of the Court’s decision that ruled in favor of the plaintiffs.
We have previously disclosed that we have open tax audits in various jurisdictions and some of these jurisdictions require taxpayers to pay assessed taxes in advance or at the time of appealing such assessments. The Company has open tax audits in various jurisdictions and some of these jurisdictions require taxpayers to pay assessed taxes in advance or at the time of appealing such assessments. One such jurisdiction is Canada, where one of the Company’s subsidiaries, iStockphoto ULC, recently received tax assessments from the CRA asserting additional tax is due. The position taken by the CRA is related to the transactions between iStockphoto ULC and other affiliates within the Getty Images group for the 2015 Canadian income tax return filed. The Company believes the CRA position lacks merit and intends to appeal and vigorously contest these assessments.
As part of the appeal process in Canada, the Company may be required to pay a portion of the assessed amounts, which we estimate could be up to $19.3 million. Such required payment is not an admission that the Company believes it is subject to such taxes. The Company believes it is more likely than not it will prevail on appeal, however, if the CRA were to be successful in the appeal process, we estimate the maximum potential outcome could be up to $29.2 million.
Future cash needs
We expect to fund our ordinary course operating activities from existing cash and cash flows from operations and believe that these sources of liquidity will be sufficient to fund our ordinary course operations and other planned investing activities for at least the next 12 months and thereafter for the foreseeable future. From time to time, we may evaluate potential acquisitions, investments and other growth and strategic opportunities. While we believe we have sufficient liquidity to fund our ordinary course operations for the foreseeable future, our sources of liquidity could be affected by current and future difficult economic conditions, payment of certain restructuring costs, reliance on key personnel, international risks, intellectual property claims, the resolution of pending or future tax audits or other factors described herein under “Potential Liability and Insurance” below and “Item 7A. Quantitative and Qualitative Disclosures About Market Risk.”
We may, from time to time, incur or increase borrowings under the revolving credit facility or issue new debt securities, if market conditions are favorable, to meet our future cash needs or to reduce our borrowing costs. We or our affiliates from time to time consider potential transactions intended to rationalize our consolidated balance sheet. In connection with any such transactions, we may, among other things, seek to retire our outstanding notes or loans through cash purchases and/or exchanges for equity or other securities, in open market purchases, privately negotiated transactions, tenders or otherwise. Such repurchases, exchanges, or other transactions, if any, will depend on prevailing market conditions, our liquidity requirements, contractual restrictions and other factors. The Company became a public reporting company as a result of the closing of the Business Combination on July 22, 2022. The net proceeds from the Business Combination were primarily used to reduce debt of the Company and therefore reduce our borrowing costs starting in the second half of 2022.
The Business Combination resulted in aggregate gross proceeds to the Company of approximately $864.0 million. As a result of the Business Combination, the previously outstanding Redeemable Preferred Stock of Legacy Getty was redeemed in full through a combination of a cash payment of approximately $615.0 million and 15,000,000 shares of the Company’s Class A common stock with a fair value at issuance of $140.2 million. Additionally, the Company used $300.0 million of cash to repay a portion of its outstanding indebtedness related to the USD Term Loans, which when combined with the retirement of the preferred shares, resulted in a reduction of approximately $1.1 billion of balance sheet obligations.
Our liquidity may also be adversely affected by the resolution of pending or future tax audits and legal proceedings. See discussion above. We may be subject to tax liabilities in excess of amounts reserved for liabilities for uncertain tax positions on our consolidated balance sheets. In addition, certain jurisdictions in which we have current open tax audits require taxpayers to pay assessed taxes in advance of contesting, whether by way of litigation or appeal, an adverse determination or assessment by the relevant taxing authority. The amount of any such advance payment depends upon the amount in controversy and may be material, and payment of any such amount could adversely affect our liquidity. A jurisdiction that collects any such advance payment generally will repay such amounts if we ultimately prevail in the related litigation or appeal. See “Note 13 — Commitments and Contingencies” and “Note 20 — Income Taxes” in our consolidated financial statements included elsewhere in this report, for additional discussions of our pending tax audits and our uncertain tax positions and risks related thereto.
Cash Flows
| | | | | | | | | | | | | | | | | | | | | | | | | | |
| | Year Ended
December 31, | | increase (decrease) |
| (Dollars in thousands) | | 2023 | | 2022 | | $ change | | % change |
| Net cash provided by operating activities | | $ | 132,716 | | | $ | 163,117 | | | $ | (30,401) | | | (18.6) | % |
| Net cash used in investing activities | | $ | (56,999) | | | $ | (61,291) | | | $ | 4,292 | | | 7.0 | % |
| Net cash used in financing activities | | $ | (45,350) | | | $ | (184,347) | | | $ | 138,997 | | | 75.4 | % |
| Effects of exchange rate fluctuations | | $ | 8,089 | | | $ | (6,614) | | | $ | 14,703 | | | NM |
____________________
NM - Not meaningful
Cash provided by operating activities was $132.7 million for the year December 31, 2023 as compared to cash provided by operating activities of $163.1 million for the year ended December 31, 2022. The primary driver of our decrease in cash provided by operating activities of $30.4 million was an increase in our interest expense driven by the rise in interest rates from 2022 to 2023. We also saw an increase in the use of cash related to our ongoing intellectual property rights and warrant litigation.
Our investing activities used $57.0 million and $61.3 million in cash during the year ended December 31, 2023 and 2022, respectively, which was used to acquire property and equipment. The property and equipment was mainly related to internal software development as we continued to innovate and invest in the design, user experience and performance of our websites.
For the year ended December 31, 2023 and 2022, our financing activities used $45.4 million and $184.3 million of cash, respectively. Financing activities for the year ended December 31, 2023 primarily includes voluntary principal payments on our Term Loans and cash paid for settlement of employee taxes related to exercise of equity-based awards, partially offset by proceeds from common stock issuance related to employee options exercised. Financing activities for the year ended December 31, 2022 primarily related to the Business Combination, including cash contributions ($864.2 million) which were used to pay equity issuance costs ($106.9 million), retire our Redeemable Preferred Stock ($615.0 million) and prepay a portion of our USD Term Loans ($310.4 million). Additionally, during the six months ended June 30, 2022, the
Unsplash Inc. Two-Year Earnout was achieved and was paid during the three months ended September 30, 2022 ($10.0 million).
| | | | | | | | | | | | | | | | | | | | | | | | | | |
| | Year Ended
December 31, | | increase (decrease) |
| (Dollars in thousands) | | 2022 | | 2021 | | $ change | | % change |
| Net cash provided by operating activities | | $ | 163,117 | | | $ | 188,890 | | | $ | (25,773) | | | (13.6) | % |
| Net cash used in investing activities | | $ | (61,291) | | | $ | (136,926) | | | $ | 75,635 | | | 55.2 | % |
| Net cash used in financing activities | | $ | (184,347) | | | $ | (19,265) | | | $ | (165,082) | | | (856.9) | % |
| Effects of exchange rate fluctuations | | $ | (6,614) | | | $ | (2,479) | | | $ | (4,135) | | | (166.8) | % |
Cash provided by operating activities was $163.1 million for the year ended December 31, 2022, as compared to cash provided by operating activities of $188.9 million for the year ended December 31, 2021. The primary driver of our decrease in cash provided by operating activities of $25.8 million was changes in working capital, which increased cash flows from operating activities by $2.4 million in 2022 as compared to increased cash flows from operating activities of $31.3 million in 2021. Within working capital, the primary components of the difference between periods are reduced cash flows from changes in the timing of payments of accrued expenses and changes in deferred revenue, partially offset by increased cash flows from the change in timing of collections related to accounts receivable and timing of the payments for accounts payable. The largest of these categories is accrued expenses, with the primary driver of the change between periods being accrued bonus. The Company’s annual bonus for 2021 (paid in 2022) was significantly larger than the 2020 bonus (paid in 2021).
Our investing activities used $61.3 million and $136.9 million in cash during the year ended December 31, 2022 and 2021, respectively, which was used in part to acquire property and equipment. The property and equipment was mainly related to internal software development as we continued to innovate and invest in the design, user experience and performance of our websites. In addition, on April 1, 2021, we acquired Unsplash Inc. in exchange for $89.2 million in net cash plus an additional earnout potential of approximately $20.0 million based on revenue targets over two and three years, funded through existing cash on hand.
For the year ended December 31, 2022 and 2021, our financing activities used $184.3 million and $19.3 million of cash, respectively. Financing activities for the year ended December 31, 2022 primarily related to the Business Combination, including cash contributions ($864.2 million) which were used to pay equity issuance costs ($106.9 million), retire our Redeemable Preferred Stock ($615.0 million) and prepay a portion of our USD Term Loans ($310.4 million). Additionally, during the six months ended June 30, 2022, the Unsplash Two-Year Earnout was achieved and was paid during the three months ended September 30, 2022 ($10.0 million).
Contractual obligations, guarantees and other potentially significant uses of cash
A summary of contractual cash obligations as of December 31, 2023 were as follows:
| | | | | | | | | | | | | | | | | | | | | | | | | | |
| (Dollars in thousands) | | 2024-2025 | | 2026-2027 | | 2028 and
thereafter | | Total |
Long-term indebtedness, including current portion and interest1 | | $ | 243,175 | | | $ | 1,455,584 | | | $ | — | | | $ | 1,698,759 | |
Operating lease obligations2 | | 26,439 | | | 14,956 | | | 22,571 | | | 63,966 | |
Minimum royalty guarantee payments to suppliers of content3 | | 82,108 | | | 34,529 | | | 19,942 | | | 136,579 | |
| IT Commitments | | 14,564 | | | 1,063 | | | — | | | 15,627 | |
| Other commitments | | 3,280 | | | 222 | | | — | | | 3,502 | |
| Total | | $ | 369,566 | | | $ | 1,506,354 | | | $ | 42,513 | | | $ | 1,918,433 | |
____________________
1Interest payments are estimated based on interest rate curves valued as of December 31, 2023.
2Offsetting operating lease payments will be immaterial receipts for subleased facilities.
3Offsetting the minimum royalty guarantee payments to content suppliers will be minimum guaranteed receipts from content suppliers.
Capital expenditures
We have historically had a predictable level of capital expenditures, a significant portion of which has been discretionary and growth-related. Our capital expenditures have generally consisted of costs related to imagery and other content creation, capitalized labor for development of software, purchased computer hardware, and leasehold improvements. Content creation capital expenditures include capitalized internal and external labor for ingesting and editing creative content, content acquisition, buying content collections from photographers or Content Partners, and cameras, lenses and miscellaneous imaging equipment primarily for our editorial operations. Software includes computer software developed for internal use and consists of internal and external costs incurred during the application development stage of software development and costs of upgrades or enhancements that result in additional software functionality.
Off-balance sheet arrangements
From time to time, we may issue small amounts of letters of credit to provide credit support for leases, guarantees, and contractual commitments. The fair values of the letters of credit reflect the amount of the underlying obligation and are subject to fees competitively determined in the marketplace. As of December 31, 2023, 2022 and 2021, we had no material letters of credit outstanding or other off-balance sheet arrangements except for operating leases entered into in the normal course of business.
Effects of inflation and changing prices
We do not believe that inflation has had a material effect on our business, financial condition or results of operations. If our costs were to become subject to significant inflationary pressures, we may not be able to fully offset such higher costs through price increases. Our inability or failure to do so could harm our business and adversely affect our financial condition and results of operations.
Potential Liability and Insurance
We indemnify certain customers from claims related to alleged infringements of the intellectual property rights of third parties or misappropriation of publicity or personality rights of third parties, such as claims arising from copyright infringement or failure to secure model and property releases for images we license if such a release is required. The standard terms of these indemnifications require us to defend those claims upon notice and pay related damages, if any. We typically mitigate this risk by requiring all uses of licenses to be within the scope of our licenses, and by securing necessary model and property releases for Creative Stills content and by contractually requiring contributing photographers and other content partners to do the same prior to submitting any content to us, and by limiting damages/liability in certain circumstances. Additionally, we require all contributors and Content Partners, as well as companies that are potential acquisition targets to warrant that the content licensed to or purchased by us does not and will not infringe upon or misappropriate the rights of third parties. We also require content providers, including contributing photographers, Content Partners and sellers of businesses or image collections that we have purchased to indemnify us in certain circumstances where a claim arises in relation to an image they have provided or sold to us. Content Partners are also typically required to carry insurance policies for losses related to such claims and individual contributors are encouraged to carry such policies and we have insurance policies to cover litigation costs for such claims. We will record liabilities for these indemnifications if and when such claims are probable and the range of possible payments and available recourse from content partners can be estimated, as applicable. Historically, the exposure to such claims has been immaterial, as were the recorded liabilities for intellectual property infringement at December 31, 2023, 2022 and 2021. As such, management believes the estimated fair value of these liabilities is minimal.
In the ordinary course of business, we also enter into certain types of agreements that contingently require us to indemnify counterparties against third-party claims. These may include:
•agreements with vendors and suppliers, under which we may indemnify them against claims arising from our use of their products or services;
•agreements with customers other than those licensing images, under which we may indemnify them against claims and uncollectible trade accounts receivable arising from their use of our products or services in their markets;
•agreements with agents, delegates and distributors, under which we may indemnify them against claims arising from their distribution of our products or services;
•real estate and equipment leases, under which we may indemnify lessors against third-party claims relating to use of their property;
•agreements with directors and officers, under which we indemnify them to the full extent allowed by Delaware law against claims relating to their service to us; and
•agreements with purchasers of businesses we have sold, under which we may indemnify the purchasers against claims arising from our operation of the businesses prior to sale.
The nature and terms of these indemnifications vary from contract to contract, and generally a maximum obligation is not stated. Because management does not believe a material liability is probable, no related liabilities were recorded at December 31, 2023, 2022 and 2021. We are subject to a variety of claims and suits that arise from time to time in the ordinary course of our business. Although management currently believes that resolving claims against us, individually or in aggregate, will not have a material adverse impact on our financial statements, these matters are subject to inherent uncertainties and management’s judgment about these matters may change in the future. Additionally, we hold insurance policies that mitigate potential losses arising from certain indemnifications, and historically, significant costs related to performance under these obligations have not been incurred.
Income taxes
We account for income taxes and accruals for uncertain tax positions using the asset and liability approach. Our income tax expense, deferred tax assets and liabilities, and reserves for unrecognized tax benefits reflect management’s best assessment of current and future taxes to be paid. Our judgments, assumptions, and estimates relative to the current provision for income taxes take into account current tax laws, our interpretation of current tax laws and possible outcomes of future audits conducted by foreign and domestic tax authorities. Changes in tax law or our interpretation of tax laws and future tax audits could significantly impact the amounts provided for income taxes in our consolidated financial statements.
We conduct operations on a global basis and are subject to income taxes in the United States and numerous foreign jurisdictions. Significant judgment is required in evaluating and estimating our provision and accruals for these taxes. Our effective tax rate is subject to significant variation due to several factors, including variability in accurately predicting our taxable income and the geographical mix of our pre-tax earnings. In addition, we are subject to audit in various jurisdictions, and such jurisdictions may assess additional income tax liabilities. We record unrecognized tax benefits as liabilities in accordance with ASC 740, “Income Taxes” (“ASC 740”) and adjust these liabilities when our judgment changes as result of the evaluation of new information not previously available. Such amounts are based on management’s judgment and best estimate as to the ultimate outcome of tax audits.
Critical accounting policies and estimates
The preparation of consolidated financial statements in conformity with GAAP requires us to make estimates and assumptions that affect the reported amounts of assets and liabilities and disclosure of contingent assets and liabilities at the date of the consolidated financial statements and revenues and expenses reported during the period. Some of the estimates and assumptions that require the most difficult judgments are:
•the assumptions used to estimate unused capped subscription-based and credit-based products;
•the assumptions used to allocate transaction price to multiple performance obligations for uncapped subscription arrangements;
•the assumptions used to estimate accrued litigation reserves and insurance recoveries; and
•the appropriateness of the amount of accrued income taxes, including the potential outcome of future tax consequences of events that have been recognized in the consolidated financial statements as well as the deferred tax asset valuation allowances.
These judgments are inherently uncertain which directly impacts their valuation and accounting. Actual results and outcomes may differ from our estimates and assumptions.
Revenue recognition
Revenue is derived principally from licensing rights to use images, video footage and music that are delivered digitally. Digital content licenses are generally purchased on a monthly or annual subscription basis, whereby a customer either pays for a predetermined quantity of content or for access to our content library that may be downloaded over a specific period of time, or, on a transactional basis, whereby a customer pays for individual content licenses at the time of download. Also, a significant portion of revenue is generated through the sale and subsequent use of credits. Various amounts of credits are required to license digital content.
The Company recognizes revenue under the core principle to depict the transfer of control to our customers in an amount reflecting the consideration to which we expect to be entitled. In order to achieve that core principle, we apply the following five-step approach: (i) identify the contract with a customer, (ii) identify the performance obligations in the contract, (iii) determine the transaction price, (iv) allocate the transaction price to the performance obligations in the contract and (v) recognize revenue when a performance obligation is satisfied.
The recognition and measurement of revenue requires the use of judgments and estimates. Specifically, judgment is used in identifying the performance obligations and the standalone selling price of the performance obligations. At contract inception, we assess the product offerings in our contracts to identify performance obligations that are distinct. A performance obligation is distinct when it is separately identifiable from other items and if a customer can benefit from it on its own or with other resources that are readily available to the customer.
For digital content licenses, we recognize revenue on capped subscription-based, credit-based sales and single image licenses when content is downloaded, at which time the license is provided. In addition, we estimate expected unused licenses for capped subscription-based and credit-based products and recognize the revenue associated with the unused licenses throughout the subscription or credit period. The estimate of unused licenses is based on historical download activity and future changes in the estimate could impact the timing of revenue recognition of our subscription products.
For uncapped digital content subscriptions, we have determined that access to the existing content library and future digital content updates represent two separate performance obligations. As such, a portion of the total contract consideration related to access to the existing content library is recognized as revenue at the commencement of the contract when control of the content library is transferred. The remaining contractual consideration is recognized as revenue ratably over the term of the contract when updated digital content is transferred to the licensee, in line with when the control of the new content is transferred. Management allocates the total contract consideration to each performance obligation based on a relative standalone selling price basis. We do not sell “existing content” and “future content” separately to the customer. We believe that the best estimate for value provided to the customer for each performance obligation is based on our customers’ historical content download and usage patterns. We determine the standalone selling price for each based on these observable patterns.
Litigation reserves and insurance recoveries
The Company recognizes a charge for litigation reserves when a loss is probable, and the amount is material and reasonably determinable. The amount accrued represents the Company’s best estimate of the loss, including related interest if applicable or, if no best estimate within a range of outcomes exists, the minimum amount in the range is reserved and high end of the range is disclosed. If it is determined that a loss is only reasonably possible or that a loss is probable but the amount is not reasonably estimable, the Company discloses the nature of the possible loss and gives an estimate of the possible range of loss. Our estimates and judgments could change based on new information, changes in laws or regulations, or the outcome of legal proceedings, settlements, or other factors. If different estimates and judgments were applied with respect to these matters, it is likely that reserves would be recorded for different amounts. The reserve for litigation is accrued in “Litigation Reserves” on the Condensed Consolidated Balance Sheets and related legal and professional fees associated with the litigation are included in “Accounts Payable” or “Accrued Liabilities” on the Condensed Consolidated Balance Sheets.
The Company also recognizes the benefit of recoveries of losses on litigation when it is probable that such recoveries will be received. These recoveries are typically receivable from our third-party insurance carriers for legal claims and related costs that are included in “Loss on Litigation” on the Condensed Consolidated Statement of Operations.
Income taxes
The Company computes income taxes and accruals for uncertain tax positions under the asset and liability method in accordance with ASC 740 for accounting for income taxes and uncertain tax positions. Deferred income taxes are provided for the temporary differences between the consolidated financial statement carrying amounts and the tax basis of the Company’s assets and liabilities and operating loss and tax credit carryforwards. The Company establishes a valuation allowance for deferred tax assets if it is more likely than not that these items will either expire before the Company is able to realize their benefits or future deductibility is uncertain. Periodically, the valuation allowance is reviewed and adjusted based on management’s assessments of realizable deferred tax assets. The Company accounts for the global intangible low-tax income (“GILTI”) earned by foreign subsidiaries included in gross U.S. taxable income in the period incurred.
Recent Accounting Pronouncements
Please refer to “Note 2 — Summary of Significant Accounting Policies” in our consolidated financial statements included elsewhere in this Annual Report.
Item 7A. Quantitative and Qualitative Disclosures About Market Risk.
Interest rate market risk
For the year ended December 31, 2023, we were exposed to changes in LIBOR and Adjusted Term SOFR interest rates on the USD Term Loans of the senior secured credit facilities, subject to a minimum floor of 0.00%. On February 3, 2023, we amended our Credit Agreement to replace LIBOR with Adjusted Term SOFR on the USD Term Loans effective from the start of the next interest period and thereafter were exposed to changes in Term SOFR interest rates on the USD Term Loans of the senior secured credit facilities. The Adjusted Term SOFR rate is subject to a minimum floor of 0.00%. As of December 31, 2023, the principal outstanding of our USD Term Loans of the senior secured credit facility was $637.0 million. As of December 31, 2023, the applicable Adjusted Term SOFR is above said floor. To offset our exposure to interest rate changes, Getty Images has entered into interest rate swap agreements with notionals of $355.0 million. These swap arrangements also had an embedded floor of 0.00%. Based on the principal outstanding, incorporating the effect of the swap agreements, as of December 31, 2023 each one eighth percentage point increase in the Term SOFR rate thereafter would have correspondingly increased our interest expense on the senior secured credit facilities by approximately $0.4 million per annum.. We are also exposed to changes in EURIBOR interest rates on the senior secured term loan, subject to a minimum floor of 0.00%. As of December 31, 2023, the principal outstanding of our EUR Term Loans of the senior secured term was €419.0 million. Based on the principal outstanding as of December 31, 2023, each one eighth percentage point increase in the EURIBOR rate would correspondingly increase our interest expense on the senior secured credit facilities by approximately $0.6 million per annum.
Foreign currency market risk
We are exposed to foreign currency risk by virtue of our international operations. For each of the twelve months ended December 31, 2023 and 2022, we derived approximately 50% of our revenue from operations outside the United States. Getty Images and its subsidiaries enter into transactions that are denominated in currencies other than Getty Images’ functional currency, including Euro and British pounds. Some of these transactions result in foreign currency denominated assets and liabilities that are revalued each month. Upon revaluation, transaction gains and losses are generated, which, with the exception of those related to long-term intercompany balances, are reported as exchange gains and losses in our consolidated statements of income in the periods in which the exchange rates fluctuate. Transaction gains and losses on foreign currency denominated long-term intercompany balances for which settlement is not planned or anticipated in the foreseeable future, are reported in “Accumulated other comprehensive” income in our consolidated balance sheets.
Transaction gains and losses arising from revaluation of assets and liabilities denominated in the same foreign currencies may offset each other, in part, acting as a natural hedge. Where our assets and liabilities are not naturally hedged, we may enter into non-exotic foreign currency exchange contracts to reduce our exposure to transaction gains and losses. These foreign exchange contracts are generally up to eighteen months in original maturity and primarily require the sale of either Euro or British Pounds and the purchase of U.S. dollars. The contracts during the current period have not been designated as hedges as defined by ASC 815, “Derivatives and Hedging,” and therefore gains and losses arising from revaluation of these forward contracts are recorded as exchange gains and losses in our consolidated statements of income in the periods in which the exchange rates fluctuate. These gains and losses generally offset, at least in part, the gains and losses of the underlying exposures that are being hedged.
The statements of operations of foreign subsidiaries are translated into U.S. dollars, our reporting currency, at the prior month’s average daily exchange rate. When these exchange rates change from period to period, they cause fluctuations in reported results of operations that are not necessarily indicative of fundamental company operating performance but instead may reflect the performance of foreign currencies.
Item 8. Financial Statements and Supplementary Data.
The information required by this item is incorporated by reference to the consolidated financial statements and accompanying notes set forth on pages F-2 through F-40 of this Annual Report on Form 10-K.
Item 9. Changes in and Disagreements With Accountants on Accounting and Financial Disclosure.
None.
Item 9A. Controls and Procedures.
Evaluation of Disclosure Controls and Procedures
We maintain disclosure controls and procedures (as that term is defined in Rules 13a-15(e) and 15d-15(e) under the Exchange Act) that are designed to ensure that information required to be disclosed in the Company’s reports under the Exchange Act is recorded, processed, summarized and reported within the time periods specified in the SEC’s rules and forms and that such information is accumulated and communicated to our management, including our Chief Executive Officer and Chief Financial Officer, as appropriate, to allow timely decisions regarding required disclosures. Any controls and procedures, no matter how well-designed and operated, can provide only reasonable assurance of achieving the desired control objectives. Based upon our evaluation management concluded that, as of December 31, 2023, our disclosure controls and procedures were effective to accomplish their objectives at a reasonable assurance level.
Management’s Report on Internal Control over Financial Reporting
Our management is responsible for establishing and maintaining adequate internal control over financial reporting. Internal controls over financial reporting is a process designed to provide reasonable assurance regarding the reliability of financial reporting and the preparation of our financial statements for external reporting purposes in accordance with generally accepted accounting principles. Because of its inherent limitations, internal controls over financial reporting may not prevent or detect all misstatements. No evaluation of controls can provide absolute assurance that misstatement due to error or fraud will not occur or that all control issues or instances of fraud have been detected.
Our management conducted an evaluation of the effectiveness of our internal controls over financial reporting based on the framework and criteria established in Internal Control – Integrated Framework (2013), issued by the Committee of Sponsoring Organizations of the Treadway Commission. Based on this evaluation, management concluded that, as of December 31, 2023, our internal controls over financial reporting were effective.
As we are an emerging growth company and smaller reporting company, we are exempt from the requirement to obtain an attestation report from our independent registered public accounting firm on the assessment of our internal controls pursuant to Sarbanes-Oxley Act of 2002, and this Annual Report does not include such attestation report.
Changes in Internal Control over Financial Reporting
There were no changes in our internal controls over financial reporting, as defined in Rules 13a-15(f) and 15d-15(f) of the Exchange Act, that occurred during the period covered by this Annual Report that have materially affected, or are reasonably likely to materially affect, our internal control over financial reporting.
Item 9B. Other Information.
Insider Trading Arrangements and Policies
During the fiscal quarter ended December 31, 2023, certain of our directors and officers (as defined in Section 16a-1(f) of the Securities Exchange Act of 1934, as amended) adopted or terminated trading arrangements intended to satisfy the affirmative defense conditions of Rule 10b5-1(c). Information regarding these Rule 10b5-1 trading arrangements is presented in the table below. There were no “non-Rule 10b5-1 trading arrangements” (as defined in Item 408(a) of Regulation S-K) adopted or terminated by any director or officer during the fiscal quarter ended December 31, 2023. The trading arrangements described below were entered into during an open insider trading window and were in compliance with our insider trading policies and procedures. Actual sale transactions will be disclosed publicly in filings with the SEC in accordance with applicable securities laws, rules, and regulations.
| | | | | | | | | | | | | | | | | | | | | | | | | | | | | | | | |
| | | | | | Trading Arrangement | | | | |
| Name and Title | | Action | | Date Adopted/ Terminated | | Rule 10b5-1 | | Total Shares to be Sold | | Expiration Date2 |
Chinh Chu1, Director | | Terminate | | 11/28/2023 | | X | | 16,333,198 | | 08/01/2024 |
Chinh Chu1, Director | | Adopt | | 11/28/2023 | | X | | 16,333,198 | | 11/01/2024 |
Mikael Cho, Senior Vice President, CEO - Unsplash | | Adopt | | 11/21/2023 | | X | | 108,987 | | 10/24/2024 |
Kjelti Kellough, Senior Vice President, Secretary and General Counsel | | Adopt | | 11/16/2023 | | X | | 300,000 | | 10/24/2024 |
Jennifer Leyden, Senior Vice President, Chief Financial Officer | | Adopt | | 11/16/2023 | | X | | 35,493 | | 6/21/2024 |
Kenneth Mainardis, Senior Vice President, Global Content | | Adopt | | 11/22/2023 | | X | | 1,095,845 | | 10/24/2024 |
Peter Orlowsky, Senior Vice President, Strategic Development | | Adopt | | 11/27/2023 | | X | | 158,061 | | 10/24/2024 |
Michael Teaster, Senior Vice President, Chief of Staff | | Adopt | | 12/14/2023 | | X | | 185,000 | | 10/24/2024 |
1 Chinh Chu is a current member of the Company’s Board. Mr. Chu currently holds his Getty Images’ securities through CC Capital SP, LP (“CC Capital”). Mr. Chu controls the investment decisions and voting powers of CC Capital. The 10b5-1 plan was entered into by CC Capital.
2 Each plan terminates on the earlier of: (i) the expiration date listed in the table above, (ii) the first date on which all trades set forth in the plan have been executed, or (iii) such date the plan is otherwise terminated according to its terms.
Item 9C. Disclosure Regarding Foreign Jurisdictions that Prevent Inspections
Not Applicable.
PART III
Item 10. Directors, Executive Officers and Corporate Governance
The information required by this item will be included under the caption “Proposal 1: Election of Directors,” “Continuing Directors,” “Executive Officers,” “Corporate Governance,” “Committees of the Board” and “Delinquent Section 16(a) Reports” of our Proxy Statement for the 2024 Annual Meeting of Stockholders to be filed with the SEC within 120 days of the fiscal year ended December 31, 2023 (the “Proxy Statement”) and is incorporated herein by reference. Additionally, a list of our executive officers and directors appears below.
Further, the Company has adopted a Code of Conduct and Business Ethics applicable to its directors, executive officers and employees, including its principal executive officer, principal financial officer, principal accounting officer or controller, or persons performing similar functions that complies with the rules and regulations of the NYSE. The Code of Conduct and Business Ethics codifies the business and ethical principles that govern all aspects of the Company’s business. A copy of the Code of Conduct and Business Ethics has been filed with the SEC and is provided on our website, gettyimages.com. The Company will disclose on its website all disclosures that are required by law or the NYSE listing standards concerning any amendments to or waivers of certain provisions of its Code of Conduct and Business Ethics. The information on any of our websites is deemed not to be incorporated in this Annual Report.
Executive Officers and Board of Directors
The following persons are the members of our board of directors and our executive officers as of the date of this Annual Report:
| | | | | | | | | | | |
| Name | | | Position |
| Executive Officers | | | |
| Craig Peters | | | Chief Executive Officer, Director (Class III) |
| Mikael Cho | | | Senior Vice President, CEO, Unsplash |
| Grant Farhall | | | Senior Vice President, Chief Product Officer |
| Gene Foca | | | Senior Vice President, Chief Marketing Officer |
| Nate Gandert | | | Senior Vice President, Chief Technology Officer |
| Chris Hoel | | | Vice President, Chief Accounting Officer |
| Kjelti Kellough | | | Senior Vice President, General Counsel |
| Jennifer Leyden | | | Senior Vice President, Chief Financial Officer |
| Ken Mainardis | | | Senior Vice President, Global Content |
| Peter Orlowsky | | | Senior Vice President, Strategic Development |
| Michael Teaster | | | Senior Vice President, Chief of Staff |
| Lizanne Vaughan | | | Senior Vice President, Chief People Officer |
| Daine March Weston | | | Senior Vice President, Ecommerce |
| Non-Employee Directors | | | |
| Mark Getty, self-employed, serving in various capacities including Trustee and director of various Getty family entities | | | Chair (Class II) |
| Patrick Maxwell, Private Equity Management | | | Director (Class I) |
| James Quella, self-employed | | | Director (Class I) |
| Jeffrey Titterton, Chief Marketing Officer, Stripe, Inc. | | | Director (Class I) |
| Chinh Chu, Senior Managing Director and Founder, CC Capital Partners, LLC | | | Director (Class II) |
| Brett Watson, President, Koch Equity Development LLC | | | Director (Class II) |
| Michael Harris, Managing Director of Koch Equity Development LLC | | | Director (Class III) |
| Jonathan Klein, Executive in Residence at General Catalyst | | | Director (Class III) |
| Hilary Schneider, Strategic Advisor to the board of directors of Shutterfly | | | Director (Class III) |
Item 11. Executive Compensation
The information required by this item will be included under the caption “Executive Compensation” and “Compensation Committee Interlocks and Insider Participation” of the Proxy Statement and is incorporated herein by reference.
Item 12. Security Ownership of Certain Beneficial Owners and Management and Related Stockholder Matters
The information required by this item will be included under the caption “Security Ownership of Certain Beneficial Owners and Management” and “Executive Compensation—Securities Authorized for Issuance Under Equity Compensation Plans” of the Proxy Statement and is incorporated herein by reference.
Item 13. Certain Relationships and Related Transactions, and Director Independence
The information required by this item will be included under the caption “Certain Relationships and Related Person Transactions” and “Corporate Governance—Director Independence” of the Proxy Statement and is incorporated herein by reference.Additional information regarding certain related party balances and transactions is included in “Note 2 — Summary of Significant Accounting Policies” to the consolidated financial statements included in this Annual Report.
Item 14. Principal Accountant Fees and Services
The information required by this item will be included under the caption “Independent Registered Pubic Accounting Firm Fees and Other Matters” of the Proxy Statement and is incorporated herein by reference.
PART IV
Item 15. EXHIBIT AND FINANCIAL STATEMENT SCHEDULES
(a)The following documents are filed as part of this annual report.
1Financial Statements
2Financial Statement Schedules
All schedules are omitted because they are not applicable or the required information is shown in the consolidated financial statements or notes thereto.
3Exhibits
| | | | | | | | |
| Exhibit Number | | Description |
| 2.1† | | |
| 3.1 | | |
| 3.2 | | |
| 4.1 | | |
| 4.2* | | |
| 4.3* | | |
| 4.4* | | |
| 4.5* | | |
| 10.1 | | Registration Rights Agreement, by and among Getty Images Holdings, Inc., CC Neuberger Principal Holdings II, the Independent Directors (as defined therein), Getty Investments L.L.C., Koch Icon Investments, LLC and certain equity holders of Getty Images, dated July 22, 2022 (incorporated by reference to Exhibit 108 of the Company’s Current Report on Form 8-K, filed with the SEC on July 28, 2022) |
| 10.2^ | | |
| | | | | | | | |
| 10.3 | | |
| 10.4* | | Incremental Commitment Amendment and Second Amendment to Credit Agreement, dated as of May 4, 2023, by and among Abe Investment Holdings, Inc., Getty Images, Inc., J.P. Morgan Chase Bank N.A., as administrative agent, as an L/C Issuer (as defined therein) and as Swing Line Lender (as defined therein), the lenders party thereto and the other loan parties party thereto (incorporated by reference to Exhibit 10.1 of the Company’s Form 8-K, filed with the SEC on May 10, 2023) |
| 10.5^ | | |
| 10.6^ | | |
| 10.7^ | | |
| 10.8*^ | | |
| 10.9*^ | | |
| 10.10*^ | | |
| 10.11^ | | |
| | |
| 10.12^ | | Employment Agreement with Craig Peters dated July 1, 2015, as amended on January 27, 2017, November 3, 2017, January 1, 2019, April 1, 2020, October 1, 2020, and January 1, 2024. |
| 10.13^ | | |
| 10.14*^ | | |
| 10.15 | | Restated Option Agreement, by and among Griffey Investors, L.P., Getty Images, Inc., Getty Investments, L.L.C. and certain other parties, dated February 9, 1998, as amended on February 9, 1998, February 24, 2008, August 14, 2012, and December 9, 2021 (incorporated by reference to Exhibit 10.15 of Vector Holding, LLC’s Registration Statement on Form S-4, filed with the SEC on June 29, 2022) |
| 10.16 | | |
| 10.17 | | Sponsor Side Letter by and among CC Neuberger Principal Holdings II Sponsor, LLC, Joel Alsfine, James Quella, Jonathan Gear, CC NB Sponsor 2 Holdings LLC, Neuberger Berman Opportunistic Capital Solutions Master Fund LP, CC Neuberger Principal Holdings II, Vector Holding, LLC and Griffey Global Holdings, Inc., dated as of December 9, 2021 (incorporated by reference to Exhibit 10.3 of Vector Holding, LLC’s Registration Statement on Form S-4, filed with the SEC on June 29, 2022) |
| 21.1* | | |
| 23.1* | | |
| 31.1* | | |
| 31.2* | | |
| | | | | | | | |
| 32.1** | | |
| 32.2** | | |
| 97* | | |
| 101 | | Interactive Data Files Pursuant to Rule 405 of Regulation S-T: (i) Consolidated Balance Sheets, (ii) Consolidated Statements of Operations, (iii) Consolidated Statements of Comprehensive (Loss) Income, (iv) Consolidated Statement of Redeemable Preferred Stock and Stockholders’ Equity (Deficit), (v) Consolidated Statements of Cash Flows, and (vi) Notes to Consolidated Financial Statements. The instance document does not appear in the Interactive Data File because its XBRL tags are embedded within the Inline XBRL document |
| 104 | | Cover Page Interactive Data File. Formatted in Inline XBRL and contained in exhibit 101. |
| † | | Certain of the exhibits and schedules to this exhibit have been omitted in accordance with Regulation S-K Item 601(b)(2). The Company agrees to furnish supplementally a copy of all omitted exhibits and schedules to the SEC upon its request. |
| * | | Filed Herewith |
| ** | | Furnished Herewith |
| ^ | | Indicates management contract or compensatory plan or arrangement |
ITEM 16. FORM 10-K SUMMARY
Not applicable.
SIGNATURES
Pursuant to the requirements of Section 13 or 15(d) of the Securities Exchange Act of 1934, the registrant has duly caused this report to be signed on its behalf by the undersigned, thereunto duly authorized.
| | | | | | | | |
Date: March 15, 2024 | GETTY IMAGES HOLDINGS, INC. (REGISTRANT) |
| | |
| By: | /s/ Craig Peters |
| Name: | Craig Peters |
| Title: | Chief Executive Officer and Director |
Pursuant to the requirements of the Securities Exchange Act of 1934, this report has been signed below by the following persons on behalf of the registrant and in the capacities and on the dates indicated.
| | | | | | | | | | | | | | |
| /s/ Craig Peters | | /s/ Jennifer Leyden |
| Name: | Craig Peters | | Name: | Jennifer Leyden |
| Title: | Chief Executive Officer and Director | | Title: | Chief Financial Officer |
| (Principal Executive Officer) | | | (Principal Financial Officer) |
| Date: | March 15, 2024 | | Date: | March 15, 2024 |
| | | | |
| /s/ Chris Hoel | | | |
| Name: | Chris Hoel | | | |
| Title: | Chief Accounting Officer | | | |
| (Principal Accounting Officer) | | | |
| Date: | March 15, 2024 | | | |
| | | | |
| /s/ Mark Getty | | /s/ Chin Chu |
| Name: | Mark Getty | | Name: | Chin Chu |
| Title: | Director | | Title: | Director |
| Date: | March 15, 2024 | | Date: | March 15, 2024 |
| | | | |
| /s/ Michael Harris | | /s/ Jonathan Klein |
| Name: | Michael Harris | | Name: | Jonathan Klein |
| Title: | Director | | Title: | Director |
| Date: | March 15, 2024 | | Date: | March 15, 2024 |
| | | | |
| /s/ Patrick Maxwell | | /s/ James Quella |
| Name: | Patrick Maxwell | | Name: | James Quella |
| Title: | Director | | Title: | Director |
| Date: | March 15, 2024 | | Date: | March 15, 2024 |
| | | | |
| /s/ Hilary Schneider | | /s/ Jeffrey Titterton |
| Name: | Hilary Schneider | | Name: | Jeffrey Titterton |
| Title: | Director | | Title: | Director |
| Date: | March 15, 2024 | | Date: | March 15, 2024 |
| | | | |
| /s/ Brett Watson | | | |
| Name: | Brett Watson | | | |
| Title: | Director | | | |
| Date: | March 15, 2024 | | | |
Report of Independent Registered Public Accounting Firm
To the Stockholders and the Board of Directors
Getty Images Holdings, Inc.
Opinion on the Financial Statements
We have audited the accompanying consolidated balance sheets of Getty Images Holdings, Inc. (the “Company”) as of December 31, 2023 and 2022, the related consolidated statements of operations, comprehensive income (loss), redeemable preferred stock and stockholders’ equity (deficit) and cash flows for each of the three years in the period ended December 31, 2023, and the related notes (collectively referred to as the “consolidated financial statements”). In our opinion, the consolidated financial statements present fairly, in all material respects, the financial position of the Company at December 31, 2023 and 2022, and the results of its operations and its cash flows for each of the three years in the period ended December 31, 2023 in conformity with U.S. generally accepted accounting principles.
Basis for Opinion
These financial statements are the responsibility of the Company’s management. Our responsibility is to express an opinion on the Company’s financial statements based on our audits. We are a public accounting firm registered with the Public Company Accounting Oversight Board (United States) (PCAOB) and are required to be independent with respect to the Company in accordance with the U.S. federal securities laws and the applicable rules and regulations of the Securities and Exchange Commission and the PCAOB.
We conducted our audits in accordance with the standards of the PCAOB. Those standards require that we plan and perform the audit to obtain reasonable assurance about whether the financial statements are free of material misstatement, whether due to error or fraud. The Company is not required to have, nor were we engaged to perform, an audit of its internal control over financial reporting. As part of our audits we are required to obtain an understanding of internal control over financial reporting but not for the purpose of expressing an opinion on the effectiveness of the Company’s internal control over financial reporting. Accordingly, we express no such opinion.
Our audits included performing procedures to assess the risks of material misstatement of the financial statements, whether due to error or fraud, and performing procedures that respond to those risks. Such procedures included examining, on a test basis, evidence regarding the amounts and disclosures in the financial statements. Our audits also included evaluating the accounting principles used and significant estimates made by management, as well as evaluating the overall presentation of the financial statements. We believe that our audits provide a reasonable basis for our opinion.
/s/Ernst & Young LLP
We have served as the Company’s auditor since 2013.
Seattle, Washington
March 15, 2024
GETTY IMAGES HOLDINGS, INC.
CONSOLIDATED BALANCE SHEETS
(In thousands, except share and par value data)
| | | | | | | | | | | |
| December 31, |
| 2023 | | 2022 |
| ASSETS | | | |
| CURRENT ASSETS: | | | |
| Cash and cash equivalents | $ | 136,623 | | | $ | 97,912 | |
| Restricted cash | 4,227 | | | 4,482 | |
Accounts receivable – net of allowance of $6,526 and $6,460, respectively | 138,730 | | | 129,603 | |
| Prepaid expenses | 15,798 | | | 15,728 | |
| Insurance recovery receivable | 48,615 | | | — | |
| Taxes receivable | 9,758 | | | 11,297 | |
| Other current assets | 11,253 | | | 10,497 | |
| Total current assets | 365,004 | | | 269,519 | |
| PROPERTY AND EQUIPMENT – NET | 179,378 | | | 172,083 | |
| RIGHT OF USE ASSETS | 41,098 | | | 47,231 | |
| GOODWILL | 1,501,814 | | | 1,499,578 | |
| IDENTIFIABLE INTANGIBLE ASSETS – NET | 403,805 | | | 419,548 | |
| DEFERRED INCOME TAXES – NET | 69,400 | | | 8,272 | |
| OTHER LONG-TERM ASSETS | 41,262 | | | 51,952 | |
| TOTAL | $ | 2,601,761 | | | $ | 2,468,183 | |
| LIABILITIES AND STOCKHOLDERS’ EQUITY | | | |
| CURRENT LIABILITIES: | | | |
| Accounts payable | $ | 102,525 | | | $ | 93,766 | |
| Accrued expenses | 43,653 | | | 49,327 | |
| Income taxes payable | 11,325 | | | 8,031 | |
| Litigation reserves | 98,149 | | | — | |
| Deferred revenue | 176,349 | | | 171,371 | |
| Total current liabilities | 432,001 | | | 322,495 | |
| LONG-TERM DEBT – NET | 1,398,658 | | | 1,428,847 | |
| LEASE LIABILITIES | 39,858 | | | 46,218 | |
| DEFERRED INCOME TAXES – NET | 21,580 | | | 37,075 | |
| UNCERTAIN TAX POSITIONS | 24,772 | | | 37,333 | |
| OTHER LONG-TERM LIABILITIES | 3,462 | | | 3,167 | |
| Total liabilities | 1,920,331 | | | 1,875,135 | |
| Commitments and contingencies (Note 13) | | | |
| | | |
| | | |
| STOCKHOLDERS’ EQUITY: | | | |
Preferred Stock, $0.0001 par value; 1.0 million shares authorized; no shares issued and outstanding as of December 31, 2023 and December 31, 2022. | — | | | — | |
Class A common stock, $0.0001 par value: 2.0 billion shares authorized; 405.0 million shares issued and outstanding as of December 31, 2023 and 394.8 million shares issued and outstanding as of December 31, 2022 | 40 | | | 39 | |
Class B common stock, $0.0001 par value: 5.1 million shares authorized; no shares issued and no shares outstanding as of December 31, 2023 and December 31, 2022. | — | | | — | |
| Additional paid-in capital | 1,983,276 | | | 1,936,324 | |
| Accumulated deficit | (1,263,015) | | | (1,282,354) | |
| Accumulated other comprehensive loss | (87,076) | | | (108,928) | |
| Total Getty Images Holdings, Inc. stockholders’ equity | 633,225 | | | 545,081 | |
| Noncontrolling interest | 48,205 | | | 47,967 | |
| Total stockholders’ equity | 681,430 | | | 593,048 | |
| TOTAL | $ | 2,601,761 | | | $ | 2,468,183 | |
See notes to consolidated financial statements.
GETTY IMAGES HOLDINGS, INC.
CONSOLIDATED STATEMENTS OF OPERATIONS
(In thousands, except share and per share amounts)
| | | | | | | | | | | | | | | | | |
| Year Ended
December 31, |
| 2023 | | 2022 | | 2021 |
| REVENUE | $ | 916,555 | | | $ | 926,244 | | | $ | 918,688 | |
| | | | | |
| OPERATING EXPENSE: | | | | | |
| Cost of revenue (exclusive of depreciation and amortization shown separately below) | 250,249 | | | 254,990 | | | 248,152 | |
| Selling, general and administrative expenses | 402,516 | | | 375,582 | | | 367,704 | |
| Depreciation | 54,374 | | | 49,574 | | | 51,099 | |
| Amortization | 24,069 | | | 43,645 | | | 49,361 | |
| | | | | |
| Loss on litigation | 116,051 | | | 1,101 | | | — | |
| Recovery of loss on litigation | (60,000) | | | — | | | — | |
| Other operating expense (income) – net | 1,624 | | | (681) | | | 386 | |
| Operating expense | 788,883 | | | 724,211 | | | 716,702 | |
| INCOME FROM OPERATIONS | 127,672 | | | 202,033 | | | 201,986 | |
| | | | | |
| OTHER EXPENSE, NET: | | | | | |
| Interest expense | (126,884) | | | (117,229) | | | (122,160) | |
| (Loss) gain on fair value adjustment for swaps and foreign currency exchange contract – net | (7,573) | | | 23,508 | | | 19,282 | |
| Unrealized foreign exchange (losses) gain – net | (23,772) | | | 24,643 | | | 36,406 | |
| Loss on extinguishment of debt | — | | | (2,693) | | | — | |
| Net loss on fair value adjustment for warrant liabilities | — | | | (160,728) | | | — | |
| Other non-operating income (expense) – net | 3,652 | | | (3,051) | | | 612 | |
| | | | | |
| Total other expense – net | (154,577) | | | (235,550) | | | (65,860) | |
| (LOSS) INCOME BEFORE INCOME TAXES | (26,905) | | | (33,517) | | | 136,126 | |
| INCOME TAX BENEFIT (EXPENSE) | 46,482 | | | (44,126) | | | (18,729) | |
| | | | | |
| NET INCOME (LOSS) | 19,577 | | | (77,643) | | | 117,397 | |
| Less: | | | | | |
| Net income (loss) attributable to noncontrolling interest | 238 | | | (89) | | | 329 | |
| Premium on early redemption of Redeemable Preferred Stock | — | | | 26,678 | | | — | |
| Redeemable Preferred Stock dividend | — | | | 43,218 | | | 71,393 | |
| NET INCOME (LOSS) ATTRIBUTABLE TO GETTY IMAGES HOLDINGS, INC. | $ | 19,339 | | | $ | (147,450) | | | $ | 45,675 | |
| | | | | |
| Net income (loss) per share attributable to Class A Getty Images Holdings, Inc. common stockholders: | | | | | |
| Basic | $ | 0.05 | | | $ | (0.53) | | | 0.23 | |
| Diluted | $ | 0.05 | | | $ | (0.53) | | | 0.23 | |
| | | | | |
| Weighted-average Class A common shares outstanding: | | | | | |
| Basic | 399,037,805 | | 276,942,660 | | 196,084,650 |
| Diluted | 411,495,025 | | 276,942,660 | | 201,507,355 |
See notes to consolidated financial statements.
GETTY IMAGES HOLDINGS, INC.
CONSOLIDATED STATEMENTS OF COMPREHENSIVE INCOME (LOSS)
(In thousands)
| | | | | | | | | | | | | | | | | |
| Year Ended
December 31, |
| 2023 | | 2022 | | 2021 |
| NET INCOME (LOSS) | $ | 19,577 | | | $ | (77,643) | | | 117,397 | |
| OTHER COMPREHENSIVE INCOME (LOSS): | | | | | |
| Net foreign currency translation adjustment gain (losses) | 21,852 | | | (30,525) | | | (31,603) | |
| COMPREHENSIVE INCOME (LOSS) | 41,429 | | | (108,168) | | | 85,794 | |
| Less: Comprehensive gain (loss) attributable to noncontrolling interest | 238 | | | (89) | | | 328 | |
| COMPREHENSIVE INCOME (LOSS) ATTRIBUTABLE TO GETTY IMAGES HOLDINGS, INC. | $ | 41,191 | | | $ | (108,079) | | | $ | 85,466 | |
See notes to consolidated financial statements.
GETTY IMAGES HOLDINGS, INC.
CONSOLIDATED STATEMENTS OF REDEEMABLE PREFERRED STOCK AND STOCKHOLDERS’ EQUITY (DEFICIT)
(In thousands, except share amounts)
| | | | | | | | | | | | | | | | | | | | | | | | | | | | | | | | | | | | | | | | | | | | | | | | | | | | | | | | | | | | | | | | | | | | | | | | | | |
| Redeemable
Preferred Stock | | | Class A
Common Stock | | Class B
Common Stock | | Additional
Paid-In
Capital | | Accumulated
Deficit | | Accumulated
Other
Comprehensive
Loss | | Total
Getty Images
Holdings, Inc.
Stockholders’
Equity (Deficit) | | Noncontrolling
Interest | | Total
Stockholders’
Equity (Deficit) |
| Shares | | Amount | | | Shares | | Amount | | Shares | | Amount | | | | | | |
| BALANCE — December 31, 2020 | 606,910 | | $ | 613,957 | | | | 153,303,505 | | $ | 1,533 | | | — | | $ | — | | | $ | 998,487 | | | $ | (1,320,508) | | | $ | (46,800) | | | $ | (367,288) | | | $ | 47,728 | | | $ | (319,560) | |
| Retroactive application of recapitalization | — | | $ | — | | | | 42,779,007 | | $ | (1,513) | | | — | | $ | — | | | $ | 1,513 | | | $ | — | | | $ | — | | | $ | — | | | $ | — | | | $ | — | |
| BALANCE — December 31, 2020, after effect of recapitalization | 606,910 | | $ | 613,957 | | | | 196,082,512 | | $ | 20 | | | — | | $ | — | | | $ | 1,000,000 | | | $ | (1,320,508) | | | $ | (46,800) | | | $ | (367,288) | | | $ | 47,728 | | | $ | (319,560) | |
| Net loss | — | | — | | | | — | | — | | | — | | — | | | — | | | 117,068 | | | — | | | 117,068 | | | 329 | | | 117,397 | |
| Other comprehensive (loss) | — | | — | | | | — | | — | | | — | | — | | | — | | | — | | | (31,603) | | | (31,603) | | | (1) | | | (31,604) | |
| Issuance of common stock in connection with equity-based compensation arrangements | — | | — | | | | 12,790 | | — | | | — | | — | | | 35 | | | — | | | — | | | 35 | | | — | | | 35 | |
| Redeemable Preferred Stock dividend | 70,574 | | 71,393 | | | | — | | — | | | — | | — | | | (71,393) | | | — | | | — | | | (71,393) | | | — | | | (71,393) | |
| Equity-based compensation activity | — | | — | | | | — | | — | | | — | | — | | | 6,440 | | | — | | | — | | | 6,440 | | | — | | | 6,440 | |
| BALANCE — December 31, 2021 | 677,484 | | $ | 685,350 | | | | 196,095,302 | | $ | 20 | | | — | | $ | — | | | $ | 935,082 | | | $ | (1,203,440) | | | $ | (78,403) | | | $ | (346,741) | | | $ | 48,056 | | | $ | (298,685) | |
| Net loss | — | | — | | | | — | | — | | | — | | — | | | — | | | (77,554) | | | — | | | (77,554) | | | (89) | | | (77,643) | |
| Other comprehensive (loss) | — | | — | | | | — | | — | | | — | | — | | | — | | | — | | | (30,525) | | | (30,525) | | | | | (30,525) | |
| Cumulative effect of accounting change- adoption of ASU 2019-12 (Note 2) | — | | — | | | | — | | — | | | — | | — | | | — | | | (1,360) | | | — | | | (1,360) | | | — | | | (1,360) | |
| Issuance of common stock in connection with equity-based compensation arrangements | — | | — | | | | 1,581,275 | | — | | | — | | — | | | 194 | | | — | | | — | | | 194 | | | — | | | 194 | |
| Common shares withheld for settlement of taxes in connection with equity-based compensation | — | | — | | | | (679,914) | | — | | | — | | — | | | (6,267) | | | — | | | — | | | (6,267) | | | — | | | (6,267) | |
| Equity-based compensation activity | — | | — | | | | — | | — | | | — | | — | | | 9,547 | | | — | | | — | | | 9,547 | | | — | | | 9,547 | |
| Redeemable Preferred Stock dividend | 38,109 | | 43,218 | | | | — | | — | | | — | | — | | | (43,218) | | | — | | | — | | | (43,218) | | | — | | | (43,218) | |
| Premium on early redemption of Redeemable Preferred Stock | — | | 26,678 | | | | — | | — | | | — | | — | | | (26,678) | | | — | | | — | | | (26,678) | | | — | | | (26,678) | |
| Redemption of Redeemable Preferred Stock for cash and share consideration | (715,593) | | (755,246) | | | | 15,000,000 | | 2 | | | — | | — | | | 140,248 | | | — | | | — | | | 140,250 | | | — | | | 140,250 | |
| Issuance of Class A and Class B common stock upon Business Combination and PIPE Investment, net of tax impact and issuance costs | — | | — | | | | 107,068,311 | | 10 | | | 5,140,000 | | 1 | | | 694,449 | | | — | | | — | | | 694,460 | | | — | | | 694,460 | |
| Issuance of Class A common stock upon exercise of Private Placement Warrants | — | | — | | | | 11,555,996 | | 1 | | | — | | — | | | 232,852 | | | — | | | — | | | 232,853 | | | — | | | 232,853 | |
| Issuance of Class A common stock upon exercise of Public Warrants | — | | — | | | | 10,328 | | — | | | — | | — | | | 121 | | | — | | | — | | | 121 | | | — | | | 121 | |
| Issuance of Class A common stock upon vesting of Earn-out shares | — | | — | | | | 58,999,956 | | 6 | | | — | | — | | | (6) | | | — | | | — | | | — | | | — | | | — | |
| Conversion of Class B common stock to Class A common Stock | — | | — | | | | 5,140,000 | | — | | | (5,140,000) | | (1) | | | — | | | — | | | — | | | (1) | | | — | | | (1) | |
| BALANCE — December 31, 2022 | — | | — | | | | 394,771,254 | | 39 | | | — | | — | | | 1,936,324 | | | (1,282,354) | | | (108,928) | | | 545,081 | | | 47,967 | | | 593,048 | |
| Net income | — | | — | | | | — | | — | | | — | | — | | | — | | | 19,339 | | | — | | | 19,339 | | | 238 | | | 19,577 | |
| Other comprehensive income | — | | — | | | | — | | — | | | — | | — | | | — | | | — | | | 21,852 | | | 21,852 | | | — | | | 21,852 | |
| Issuance of common stock in connection with equity-based compensation arrangements | — | | — | | | | 12,035,420 | | 1 | | | — | | — | | | 15,049 | | | — | | | — | | | 15,050 | | | — | | | 15,050 | |
| Common shares withheld for settlement of taxes in connection with equity-based compensation | — | | — | | | | (1,835,887) | | — | | | — | | — | | | (8,713) | | | — | | | — | | | (8,713) | | | — | | | (8,713) | |
| Equity-based compensation activity | — | | — | | | | — | | — | | | — | | — | | | 40,616 | | | | | — | | | 40,616 | | | — | | | 40,616 | |
| BALANCE — December 31, 2023 | — | | $ | — | | | | 404,970,787 | | $ | 40 | | | — | | $ | — | | | $ | 1,983,276 | | | $ | (1,263,015) | | | $ | (87,076) | | | $ | 633,225 | | | $ | 48,205 | | | $ | 681,430 | |
See notes to consolidated financial statements.
GETTY IMAGES HOLDINGS, INC.
CONSOLIDATED STATEMENTS OF CASH FLOWS
(In thousands)
| | | | | | | | | | | | | | | | | |
| Year Ended
December 31, |
| 2023 | | 2022 | | 2021 |
| CASH FLOWS FROM OPERATING ACTIVITIES: | | | | | |
| Net income (loss) | $ | 19,577 | | | $ | (77,643) | | | $ | 117,397 | |
| Adjustments to reconcile net income (loss) to net cash provided by operating activities: | | | | | |
| Depreciation | 54,374 | | | 49,574 | | | 51,099 | |
| Amortization | 24,069 | | | 43,645 | | | 49,361 | |
| Unrealized exchange gains on foreign denominated debt | 16,579 | | | (26,636) | | | (39,173) | |
| Equity-based compensation | 37,652 | | | 9,292 | | | 6,440 | |
| Non-cash fair value adjustment for common stock warrants | — | | | 160,728 | | | — | |
| Deferred income taxes – net | (76,624) | | | 15,801 | | | 5,793 | |
| Uncertain tax positions | (12,561) | | | (5,368) | | | (20,507) | |
| Non-cash fair value adjustment for swaps and foreign currency exchange contracts | 7,573 | | | (22,005) | | | (20,196) | |
| Amortization of debt issuance costs | 3,965 | | | 6,096 | | | 6,741 | |
| Non cash operating lease costs | 12,173 | | | 9,760 | | | — | |
| Impairment of right of use assets | — | | | 2,563 | | | — | |
| Loss on extinguishment of debt | — | | | 2,693 | | | — | |
| Transaction costs allocated to common stock warrants | — | | | 4,262 | | | — | |
| Non-cash fair value adjustment of contingent consideration | — | | | (4,039) | | | 1,373 | |
| Other | 4,458 | | | 3,428 | | | (725) | |
| Changes in assets and liabilities: | | | | | |
| Accounts receivable | (11,704) | | | 6,016 | | | (16,075) | |
| Accounts payable | 9,799 | | | 6,001 | | | (555) | |
| Accrued expenses | (6,808) | | | (14,231) | | | 18,712 | |
| Insurance recovery receivable | (48,615) | | | — | | | — | |
| Litigation reserves | 98,149 | | | — | | | — | |
| Lease liabilities, non-current | (13,187) | | | (11,408) | | | — | |
| Income taxes receivable/payable | 8,027 | | | (188) | | | 320 | |
| | | | | |
| Deferred revenue | 4,532 | | | 9,140 | | | 24,783 | |
| Other | 1,288 | | | (4,364) | | | 4,102 | |
| Net cash provided by operating activities | 132,716 | | | 163,117 | | | 188,890 | |
| | | | | |
| CASH FLOWS FROM INVESTING ACTIVITIES: | | | | | |
| Acquisition of property and equipment | (56,999) | | | (59,291) | | | (49,317) | |
| Purchase of a minority investment | — | | | (2,000) | | | — | |
| Acquisition of a business, net of cash acquired | — | | | — | | | (89,206) | |
| Other investing activities | — | | | — | | | 1,597 | |
| Net cash used in investing activities | (56,999) | | | (61,291) | | | (136,926) | |
| | | | | |
| CASH FLOWS FROM FINANCING ACTIVITIES: | | | | | |
| Repayment of debt | (50,400) | | | (310,400) | | | (17,449) | |
| Payment of contingent consideration | — | | | (10,000) | | | — | |
| Payment of Redeemable Preferred Stock | — | | | (614,996) | | | — | |
| Cash contributions from business combination | — | | | 864,164 | | | — | |
| Cash paid for debt issuance costs | (1,137) | | | — | | | — | |
| Proceeds from common stock issuance | 15,050 | | | — | | | — | |
| Cash paid for settlement of employee taxes related to exercise of equity-based awards | (8,713) | | | (6,267) | | | — | |
| Cash paid for equity issuance costs | (150) | | | (106,917) | | | (1,851) | |
| Proceeds from option and warrant exercises | — | | | 313 | | | 35 | |
| Redemption of warrants for cash | — | | | (244) | | | — | |
| Net cash used in financing activities | (45,350) | | | (184,347) | | | (19,265) | |
| | | | | |
| EFFECTS OF EXCHANGE RATE FLUCTUATIONS | 8,089 | | | (6,614) | | | (2,479) | |
| NET INCREASE (DECREASE) IN CASH, CASH EQUIVALENTS AND RESTRICTED CASH | 38,456 | | | (89,135) | | | 30,220 | |
| CASH, CASH EQUIVALENTS AND RESTRICTED CASH - Beginning of period | 102,394 | | | 191,529 | | | 161,309 | |
| CASH, CASH EQUIVALENTS AND RESTRICTED CASH - End of period | $ | 140,850 | | | $ | 102,394 | | | $ | 191,529 | |
| | | | | |
| | | | | |
| SUPPLEMENTAL DISCLOSURES: | | | | | |
| Interest paid | $ | 122,826 | | | $ | 110,909 | | | $ | 115,258 | |
| Income taxes paid, including foreign taxes withheld | $ | 31,700 | | | $ | 30,800 | | | $ | 32,300 | |
See notes to consolidated financial statements.
GETTY IMAGES HOLDINGS, INC.
NOTES TO CONSOLIDATED FINANCIAL STATEMENTS
1. DESCRIPTION OF THE BUSINESS
Getty Images Holdings, Inc. (the “Company” or “Getty Images”) is a preeminent global visual content creator and marketplace that offers a full range of content solutions to meet the needs of customers around the globe, no matter their size. Through Getty Images, iStock, and Unsplash brands, websites and APIs, the Company serves customers in almost every country in the world and is one of the first places people turn to discover, purchase and share powerful visual content from the world’s best photographers and videographers. The Company offers a full range of content, with over 562 million assets available through its industry-leading sites. The Company serves businesses in almost every country in the world with websites in 23 languages bringing content to media outlets, advertising agencies and corporations and, increasingly, serving individual creators and prosumers.
On July 22, 2022 (the “Closing Date”), the Company consummated the transactions in the Business Combination Agreement, dated December 9, 2021 (the “Business Combination Agreement” and the consummation of such transactions, the “Closing”), by and among CC Neuberger Principal Holdings II, a Cayman Islands exempted company (“CCNB”), the Company (at such time, named Vector Holding, LLC, a Delaware limited liability company and wholly-owned subsidiary of CCNB), Vector Domestication Merger Sub, LLC, a Delaware limited liability company and wholly-owned subsidiary of the Company (“Domestication Merger Sub”), Vector Merger Sub 1, LLC, a Delaware limited liability company and a wholly-owned subsidiary of CCNB (“G Merger Sub 1”), Vector Merger Sub 2, LLC, a Delaware limited liability company and a wholly-owned subsidiary of CCNB (“G Merger Sub 2”), Griffey Global Holdings, Inc., a Delaware corporation (“Legacy Getty”), and Griffey Investors, L.P., a Delaware limited partnership (the “Partnership”). On the day prior to the Closing Date, the Company statutorily converted from a Delaware limited liability company to a Delaware corporation (the “Statutory Conversion”). On the Closing Date, CCNB merged with and into Domestication Merger Sub, with Domestication Merger Sub surviving the merger as a wholly-owned direct subsidiary of the Company (the “Domestication Merger”). Following the Domestication Merger on the Closing Date, G Merger Sub 1 merged with and into Legacy Getty, with Legacy Getty surviving the merger as an indirect wholly-owned subsidiary of the Company (the “First Getty Merger”). Immediately after the First Getty Merger, Legacy Getty merged with and into G Merger Sub 2 with G Merger Sub 2 surviving the merger as an indirect wholly-owned subsidiary of the Company (the “Second Getty Merger” and together with the First Getty Merger, the “Getty Mergers” and, together with the Statutory Conversion and the Domestication Merger, the “Business Combination”). See “Note 3 — Business Combination” for further details.
Legacy Getty was incorporated in Delaware on September 25, 2012, and in October of the same year, indirectly acquired Getty Images, Inc.
2. SUMMARY OF SIGNIFICANT ACCOUNTING POLICIES
Accounting Principles — The Company’s accompanying consolidated financial statements have been prepared in conformity with accounting principles generally accepted in the United States of America (“U.S. GAAP”).
Basis of Presentation — The Business Combination in July of 2022 was accounted for as a reverse recapitalization in accordance with U.S. GAAP. Under this method of accounting, CCNB was treated as the “acquired” company and Legacy Getty is treated as the acquirer for financial reporting purposes. For accounting purposes, the Business Combination was treated as the equivalent of Legacy Getty issuing stock for the net assets of CCNB, accompanied by a recapitalization. The net assets of CCNB are stated at historical cost, with no goodwill or other intangible assets recorded.
Legacy Getty was determined to be the accounting acquirer based on the following predominant factors:
•Legacy Getty stockholders have the greatest voting interest in the Company with approximately 72% of the voting interest;
•Legacy Getty stockholders have the ability to nominate a majority of the initial members of the Company’s Board of Directors;
•Legacy Getty senior management is the senior management of the Company; and
•Legacy Getty was the larger entity based on historical operating activity and had the larger employee base.
The consolidated assets, liabilities and results of operations prior to the Business Combination are those of Legacy Getty. The shares and corresponding capital amounts and earnings per share, prior to the Business Combination, have been retroactively restated based on shares reflecting the exchange ratio of 1.27905 (the “Exchange Ratio”) established in the Business Combination.
The accompanying consolidated financial statements include the accounts and operations of the Company and its wholly owned subsidiaries. All intercompany balances and transactions have been eliminated in consolidation.
Estimates and Assumptions — The preparation of the consolidated financial statements in conformity with U.S. GAAP requires management to make estimates and assumptions that affect the reported amounts of assets and liabilities and disclosure of contingent assets and liabilities at the date of the consolidated financial statements and revenues and expenses reported during the period. Some of the estimates and assumptions that require the most difficult judgments are: a) the assumptions used to estimate unused capped subscription-based and credit-based products; b) the assumptions used to allocate transaction price to multiple performance obligations for uncapped subscription arrangements; c) the appropriateness of the amount of accrued income taxes, including the potential outcome of future tax consequences of events that have been recognized in the consolidated financial statements as well as the deferred tax asset valuation allowances and; d) the assumptions used to estimate accrued litigation reserves and insurance recoveries. These judgments are inherently uncertain which directly impacts their valuation and accounting. Actual results and outcomes may differ from management’s estimates and assumptions.
Reclassifications — Certain prior year amounts have been reclassified to conform to the current year presentation. For the year ending December 31, 2022, $1.1 million in legal fees associated with the warrant litigation was reclassified from “Selling, general and administrative expenses” to “Loss on litigation” within the Condensed Consolidated Statements of Operations.
Principles of Consolidation — The consolidated financial statements and notes thereto include the accounts of Getty Images Holdings, Inc and its subsidiaries. Equity investments in which the Company exercises significant influence, but does not control and is not the primary beneficiary of, are accounted for using the equity method. Significant accounts and transactions between consolidated entities have been eliminated. Intercompany transactions and balances have been eliminated in consolidation.
Noncontrolling Interest — The Company’s noncontrolling interest represents the minority stockholder’s ownership interest related to the Company’s subsidiary, Getty Images SEA Holdings Co., Limited (“Getty SEA”). The Company reports its non-controlling interest in subsidiary as a separate component of stockholders’ equity (deficit) in the Consolidated Balance Sheets and reports both net income (loss) attributable to the non-controlling interest and net income (loss) attributable to the Company’s common stockholders on the Consolidated Statements of Operations. The Company’s equity interest in Getty SEA is 50% and the non-controlling stockholder’s interest is 50%. Net Income or Loss from this subsidiary is allocated based upon these ownership interests. This is reflected in the Consolidated Statements of Redeemable Preferred Stock and Stockholders’ Equity (Deficit) as “Noncontrolling interest”.
Net Income (Loss) Per Share Attributable to Common Stockholders — Basic net income (loss) per share attributable to common stockholders is calculated by dividing the net income (loss) attributable to common stockholders by the weighted-average number of shares of common stock outstanding for the period, without consideration of potentially dilutive securities. Net income (loss) available to common stockholders represents net income (loss) attributable to common stockholders adjusted by (i) the Redeemable Preferred Stock dividend (ii) premium on early redemption of the Redeemable Preferred Stock and (iii) the allocation of income or losses to the noncontrolling interest.
In periods where the Company recognizes a net loss, such as the year ended December 31, 2022, diluted net loss per share attributable to common stockholders is the same as basic net loss per share attributable to common stockholders since the effect of potentially dilutive securities is anti-dilutive.
Diluted net income per share is computed by dividing the net income attributable to common stockholders by the weighted average common shares outstanding and all potential common shares, if they are dilutive. The potentially dilutive effect of options or warrants are computed using the treasury stock method. Securities that potentially have an anti-dilutive effect are excluded from the diluted earnings per share calculation.
Foreign Currencies — Assets and liabilities for subsidiaries with functional currencies other than the U.S. dollar are recorded in foreign currencies and translated at the exchange rate on the balance sheet date. Revenue and expenses are
translated at average rates of exchange prevailing during the year. Translation adjustments resulting from this process are charged or credited to “Other comprehensive income (loss)” (“OCI”), as a separate component of stockholders’ equity (deficit). Transaction gains and losses arising from transactions denominated in a currency other than the functional currency of the entity involved are included in “Unrealized Foreign exchange gains (losses) — net” in the Consolidated Statements of Operations. For the years ended December 31, 2023, 2022, and 2021 the Company recognized net foreign currency transaction loss of $23.8 million, net gain of $24.6 million and net gain of $36.4 million, respectively.
Derivative Instruments — The Company uses derivative instruments to manage exposures to foreign currency and interest rate risks. The objectives for holding derivatives include reducing or eliminating the economic impact of these exposures. Derivative instruments are recorded as either assets or liabilities and are measured at fair value. The accounting for changes in the fair value of a derivative depends on the intended use of the derivative and whether the instrument is designated as a hedge for accounting purposes. For a derivative instrument designated as a cash flow hedge, the effective portion of the derivative’s gain or loss is initially reported as a component of OCI and is subsequently recognized in earnings when the hedged exposure affects earnings. The ineffective portion of the gain or loss is recognized in earnings. For derivative instruments designated as either fair value or cash flow hedges, changes in the time value are excluded from the assessment of hedge effectiveness and are recognized in earnings. Gains and losses from changes in fair values of derivatives that are not designated as hedges for accounting purposes are recognized in “(Loss) gain on fair value adjustment for swaps and foreign currency exchange contract – net” in the Consolidated Statements of Operations. As of December 31, 2023, 2022, and 2021 the Company did not have any derivatives designated as hedging instruments as defined by the derivative instruments and hedging activities accounting guidance. See “Note 6 — Derivative Instruments” for further information.
Litigation Reserves— The Company recognizes a charge for litigation reserves when a loss is probable, and the amount is material and reasonably determinable. The amount accrued represents the Company’s best estimate of the loss, including related interest if applicable or, if no best estimate within a range of outcomes exists, the minimum amount in the range is reserved and the high end of the range is disclosed. If it is determined that a loss is only reasonably possible or that a loss is probable but the amount is not reasonably estimable, the Company discloses the nature of the possible loss and gives an estimate of the possible range of loss. The estimates and judgments could change based on new information, changes in laws or regulations, or the outcome of legal proceedings, settlements, or other factors. If different estimates and judgments were applied with respect to these matters, it is likely that reserves would be recorded for different amounts. The reserve for litigation is accrued in “Litigation Reserves” on the Condensed Consolidated Balance Sheets and related legal and professional fees associated with the litigation are included in “Accounts Payable” or “Accrued Expenses” on the Condensed Consolidated Balance Sheets. See Note 13 — Commitments and Contingencies” for further discussion.
Recoveries of Losses on Litigation— The Company recognizes the benefit of recoveries of losses on litigation when it is probable that such recoveries will be received. These recoveries are typically receivable from our third-party insurance carriers for legal claims and related costs that are included in “Loss on Litigation” on the Condensed Consolidated Statement of Operations, see “Note 13 — Commitments and Contingencies”.
Cash, Cash Equivalents and Restricted Cash — The following represents the Company’s cash, cash equivalents and restricted cash as of December 31, 2023 and 2022 (in thousands):
| | | | | | | | | | | |
| As of December 31, |
| 2023 | | 2022 |
| Cash and cash equivalents | $ | 136,623 | | | $ | 97,912 | |
| Restricted cash | 4,227 | | | 4,482 | |
| Total cash, cash equivalents and restricted cash | $ | 140,850 | | | $ | 102,394 | |
Cash equivalents are short-term, highly liquid investments that are both readily convertible to cash and have maturities at the date of acquisition of three months or less. Cash equivalents are generally composed of investment-grade debt instruments subject to lower levels of credit risk, including certificates of deposit and money market funds. The Company’s current cash and cash equivalents consist primarily of cash on hand, bank deposits, and money market accounts.
Restricted cash consists primarily of cash held as collateral related to corporate credit cards and real estate lease obligations.
Fair Value Measurements — The Company records its financial assets and liabilities at fair value. Fair value is defined as the price that would be received upon sale of an asset or paid upon transfer of a liability in an orderly transaction between market participants at the measurement date and in the principal or most advantageous market for that asset or liability. The fair value should be calculated based on assumptions that market participants would use in pricing the asset or liability, not on assumptions specific to the entity. In addition, the fair value of liabilities should include consideration of nonperformance risk including the Company’s own credit risk.
The three-tier fair value hierarchy prioritizes the inputs used in the valuation methodologies. Each fair value measurement is reported in one of the three levels, which is determined by the lowest level input that is significant to the fair value measurement in its entirety. These levels are:
Level 1 — Valuations based on quoted prices for identical assets and liabilities in active markets.
Level 2 — Valuations based on observable inputs other than quoted prices included in Level 1, such as quoted prices for similar assets and liabilities in active markets, quoted prices for identical or similar assets and liabilities in markets that are not active, or other inputs that are observable or can be corroborated by observable market data.
Level 3 — Valuations based on unobservable inputs reflecting management’s own assumptions, consistent with reasonably available assumptions made by other market participants. These valuations require significant judgment.
Contingent Consideration — The Company records a liability for contingent consideration at the date of a business combination and reassesses the fair value of the liability each period until it is settled. Upon settlement of these liabilities, the portion of the contingent consideration payment that is attributable to the initial amount recorded as part of the business combination will be classified as a cash flow from financing activities and the portion of the settlement that is attributable to subsequent changes in the fair value of the contingent consideration will be classified as a cash flow from operating activities in the Consolidated Statement of Cash Flows.
Accounts Receivable — Net — Accounts receivable are trade receivables, net of reserves for allowances for doubtful accounts totaling $6.5 million and $6.5 million as of December 31, 2023 and 2022, respectively.
Allowance for doubtful accounts is calculated based on historical losses, existing economic conditions, and analysis of specific older account balances of customer and delegate accounts. Trade receivables are written off when collection efforts have been exhausted.
Allowance for doubtful accounts changed as follows during the years presented (in thousands):
| | | | | | | | | | | | | | | | | |
| Year Ended December 31, |
| 2023 | | 2022 | | 2021 |
| Beginning of year | $ | 6,460 | | | $ | 5,946 | | | $ | 7,773 | |
| Provision | 2,228 | | | 1,465 | | | 750 | |
| Deductions | (2,161) | | | (951) | | | (2,577) | |
| End of year | $ | 6,527 | | | $ | 6,460 | | | $ | 5,946 | |
Deductions represent balances written off, net of amounts recovered that had previously been written off, and the effect of exchange rate fluctuations.
Property and Equipment — Net — Property and equipment are stated at cost, net of accumulated depreciation. Contemporary and archival imagery consists of costs to acquire imagery from third parties and internal and external costs incurred in creating imagery, including identification of marketable subject matter, art direction, digitization, mastering and the assignment of search terms, and other pertinent information to each image. Computer software developed for internal use consists of internal and external costs incurred during the application development stage of software development (except for training costs) and costs of upgrades or enhancements that result in additional software functionality. Costs incurred during the web application, infrastructure, graphics and content development stages of website development are also capitalized and included within computer software developed for internal use.
Expenditures that extend the life, increase the capacity or improve the efficiency of property and equipment are capitalized, while expenditures for repairs and maintenance are expensed as incurred.
Depreciation is recognized on a straight-line basis over the estimated useful lives of the assets or, for leasehold improvements, over the shorter of the remaining original term of the lease or the estimated life of the related asset.
Minority Investment without Readily Determinable Fair Value — The carrying amount of the minority investments, which is included within “Other long-term assets” on the Consolidated Balance Sheets, was $10.0 million and $9.6 million as December 31, 2023 and 2022, respectively. The Company uses the measurement alternative for these equity investments and their carrying value is reported at cost, adjusted for impairments or any observable price changes in ordinary transactions with identical or similar investments. Revenue related to content consumed by the minority investees was not material during any of the years end December 31, 2023, 2022 and 2021. The Company purchased a minority investment in another company during the year ended December 31, 2022. The cost of that investment was $2.0 million.
The investments are holdings in a privately held companies that are not exchange traded and therefore not supported with observable market prices. The Company periodically evaluates the carrying value of the minority investment, or when events and circumstances indicate that the carrying amount of an asset may not be recovered. As of December 31, 2023, 2022 and 2021, no adjustments to the carrying values of the Company’s long-term investments were identified as a result of this assessment. Changes in performance negatively impacting operating results and cash flows of these investments could result in the Company recording an impairment charge in future periods.
Goodwill — The Company evaluates goodwill for impairment annually or more frequently when an event occurs, or circumstances indicate it is more likely than not that the fair value of the reporting unit is below its carrying value. Circumstances that could indicate impairment and require impairment tests more frequently than annually include; significant adverse changes in legal factors or market and economic conditions, a significant decline in the financial results of the Company’s operations, significant changes in strategic plans, adverse actions by regulators, unanticipated changes in competition and market share, or a planned disposition of a significant portion of the business. Management performs the annual goodwill impairment analysis as of October 1 each year. The Company’s 2023, 2022 and 2021 goodwill impairment analyses did not result in an impairment charge. As circumstances change, it is possible that future goodwill impairment analysis could result in goodwill impairments, which would be included in the calculation of income or loss from operations.
Identifiable Intangible Assets — Identifiable intangible assets are assets that do not have physical representation but that arise from contractual or other legal rights or are capable of being separated or divided from the Company and sold, transferred, licensed, rented or exchanged. Identifiable intangible assets are amortized on a straight-line basis over their estimated useful lives, unless such life is determined to be indefinite. The remaining useful lives of identifiable intangible assets are reassessed each reporting period to determine whether events and circumstances warrant revisions to the remaining periods of amortization. Potential impairment of identifiable intangible assets with an indefinite useful life are evaluated annually or whenever circumstances indicate that it is more likely than not that the indefinite-lived asset is impaired. Intangible assets with a finite life and long-lived assets are reviewed for impairment whenever an event occurs, or circumstances change that indicate their carrying value may not be recoverable through projected undiscounted cash flows expected to be generated by the asset. If the evaluation of the projected cash flows indicates that the carrying value of the asset is not recoverable, the asset is written down to its fair value.
Loans Receivable — Loans are stated at unpaid principal balances less any allowance for loan losses. Interest is recognized over the term of the loan and is calculated using the compound interest method. Management considers a loan impaired when, based on current information or factors, it is probable that the principal and interest payment will not be collected according to the loan agreement. The Company did not recognize any loan impairment charges during the years ended December 31, 2023, 2022 or 2021.
Leases —The Company recorded rent expense for the year end December 31, 2021 on a straight-line basis over the term of the related lease. Prior to the adoption of ASU 2016-02, “Leases (Topic 842)”, as amended (“ASC 842”), the difference between the rent expense recognized and the actual payments made in accordance with the operating lease agreement was recognized as a deferred rent liability on the Company’s Consolidated Balance Sheet.
Effective January 1, 2022, the Company adopted ASC 842 using the modified retrospective transition method and elected the package of practical expedients permitted under the transition guidance, which allows a carryforward of the historical lease classification. The Company also elected the hindsight practical expedient to determine the reasonably certain lease term for existing leases. The election of the hindsight practical expedient did not alter the lease terms for any of the existing leases. Upon adoption of this standard on January 1, 2022, the Company recognized a total lease liability in the amount of $61.3 million, representing the present value of the minimum rental payments remaining as of the adoption date, a right-of-use asset in the amount of $53.1 million with offsets to deferred rent of $8.3 million.
In accordance with ASC 842, the Company first determines if an arrangement contains a lease and the classification of that lease, if applicable, at inception. This standard requires the recognition of right-of-use (“ROU”) assets and lease liabilities for the Company’s operating leases. For contracts with lease and non-lease components, the Company has elected not to allocate the contract consideration, and to account for the lease and non-lease components as a single lease component. The Company has also elected not to recognize a lease liability or ROU asset for leases with a term of 12 months or less, and recognize lease payments for those short-term leases on a straight-line basis over the lease term in the Consolidated Statements of Operations. Operating leases are included in “Right of use assets”, “Accrued expenses” and “Lease liabilities” (net of current portion) in the Consolidated Balance Sheets.
ROU assets represent the Company’s right to use an underlying asset for the lease term and lease liabilities represent the Company’s obligation to make lease payments under the lease. ROU assets and lease liabilities are recognized at the lease commencement date based on the present value of lease payments over the lease term. The implicit rate within the Company’s leases is generally not determinable and therefore the incremental borrowing rate at the lease commencement date is utilized to determine the present value of lease payments. The determination of the incremental borrowing rate requires judgment. Management determines the incremental borrowing rate for each lease using the Company’s estimated borrowing rate, adjusted for various factors including level of collateralization, term and currency to align with the terms of the lease. The ROU asset also includes any lease prepayments, offset by lease incentives. Certain of the Company’s leases include options to extend or terminate the lease. An option to extend the lease is considered in connection with determining the ROU asset and lease liability when the Company is reasonably certain that the option will be exercised. An option to terminate is considered unless the Company is reasonably certain the option will not be exercised. The ROU assets are reviewed for impairment with the Company’s long-lived assets.
Related-Party Transactions — The Company paid annual management fees to Getty Investments, LLC (“Getty Investments”) in the amount of $0.9 million and $1.5 million for the years ended December 31, 2022 and 2021, respectively. These costs are included in “Selling, general and administrative expenses” in the Consolidated Statements of Operations. Getty Investments was the majority partner in Partnership. With the closing of the Business Combination, the management fee contract was terminated.
On June 15, 2016, Getty SEA, a subsidiary of the Company, entered into various agreements with Visual China Group Holding Limited (“VCG”). As part of those agreements, Getty SEA issued $24.0 million in an unsecured note receivable to VCG. This note receivable bears interest at 2.5% per annum with an August 18, 2036 due date. VCG is also a noncontrolling interest stockholder of Getty SEA. As of December 31, 2023, 2022 and 2021 this unsecured note receivable is included in “Other long-term assets” in the Consolidated Balance Sheets.
Revenue Recognition — Revenue is derived principally from licensing rights to use images, video footage and music that are delivered digitally over the internet. Digital content licenses are generally purchased on a monthly or annual subscription basis, whereby a customer either pays for a predetermined quantity of content or for access to the Company’s content library that may be downloaded over a specific period of time, or, on a transactional basis, whereby a customer pays for individual content licenses at the time of download. Also, a significant portion of revenue is generated through the sale and subsequent use of credits. Various amounts of credits are required to license digital content.
The Company recognizes revenue gross of contributor royalties because the Company is the principal in the transaction as it is the party responsible for the performance obligation and it controls the product or service before transferring it to the customer. The Company also licenses content to customers through third-party delegates worldwide (approximately 3% of total revenues for the years ended December 31, 2023, 2022 and 2021). Delegates sell the Company’s products directly to customers as the principal in those transactions. Accordingly, the Company recognizes revenue net of costs paid to delegates. Delegates typically earn and retain 35% to 50% of the license fee, and the Company recognizes the remaining 65% to 50% as revenue.
The Company maintains a credit department that sets and monitors credit policies that establish credit limits and ascertains customer creditworthiness, thus reducing the risk of potential credit loss. Revenue is not recognized unless it is determined that collectability is reasonably assured. Revenue is recorded at invoiced amounts (including discounts and applicable sales taxes) less an allowance for sales returns, which is based on historical information. Customer payments received in advance of revenue recognition are contract liabilities and are recorded as deferred revenue. Customers that do not pay in advance are invoiced and are required to make payments under standard credit terms.
The Company recognizes revenue under the core principle to depict the transfer of control to the Company’s customers in an amount reflecting the consideration to which the Company expects to be entitled. In order to achieve that core principle, the Company applies the following five-step approach: (i) identify the contract with a customer, (ii) identify the performance obligations in the contract, (iii) determine the transaction price, (iv) allocate the transaction price to the performance obligations in the contract and (v) recognize revenue when a performance obligation is satisfied.
For digital content licenses, the Company recognizes revenue on both its capped subscription-based, credit-based sales and single image licenses when content is downloaded, at which time the license is provided. In addition, management estimates expected unused licenses for capped subscription-based and credit-based products and recognizes the revenue associated with the unused licenses throughout the subscription or credit period. The estimate of unused licenses is based on historical download activity and future changes in the estimate could impact the timing of revenue recognition of the Company’s subscription products.
For uncapped digital content subscriptions, the Company has determined that access to the existing content library and future digital content updates represent two separate performance obligations. As such, a portion of the total contract consideration related to access to the existing content library is recognized as revenue at the commencement of the contract when control of the content library is transferred. The remaining contractual consideration is recognized as revenue ratably over the term of the contract when updated digital content is transferred to the licensee, in line with when the control of the new content is transferred.
See “Note 14 — Revenue” and “Note 21 — Segment and Geographic Information” for additional revenue disclosures.
Cost of Revenue — The ownership rights to the majority of the content licensed is retained by the owners, and licensing rights are provided to the Company by a large network of content suppliers. When the Company licenses content entrusted by content suppliers, royalties are paid to them at varying rates depending on the license model and the customers use of that content. Suppliers who choose to work with the Company under contract typically receive royalties between 20% to 50% of the total license fee charged customers. The Company also owns the copyright to certain content in its collections (wholly owned content), including content produced by staff photographers for the Editorial Stills product, for which the Company does not pay any third-party royalties. Cost of revenue also includes costs of assignment photo shoots but excludes depreciation and amortization associated with creating or buying content.
Sales Commissions — Internal sales commissions are generally paid in the quarter following invoicing of the commissioned receivable and is reported in “Selling, general and administrative expenses” on the Consolidated Statements of Operations. The Company expenses contract acquisition costs, including internal sales commissions, as incurred, to the extent that the amortization period would otherwise be one year or less.
Equity-Based Compensation — Equity-based compensation is accounted for in accordance with authoritative guidance for equity-based payments. This guidance requires equity-based compensation cost to be measured at the grant date based on the fair value of the award and recognized as an expense over the applicable service period, which is the vesting period, net of estimated forfeitures. Compensation expense for equity-based payments that contain service conditions is recorded on a straight-line basis, over the service period of generally four years. Compensation expense for equity-based payments that contain performance conditions is not recorded until it is probable that the performance condition will be achieved. The estimation of stock awards that will ultimately vest requires judgment, and to the extent actual results or updated estimates differ from the Company’s current estimates, such amounts will be recorded as a cumulative adjustment in the period estimates are revised. The Company considers many factors when estimating expected forfeitures, including types of awards, employee class, and historical experience. Actual results and future estimates may differ substantially from current estimates.
Common Stock Warrants — The Company assumed 20,700,000 warrants originally issued in CCNB’s initial public offering (the “Public Warrants”) and 18,560,000 warrants issued in a private placement that closed concurrently with
CCNB’s initial public offering, (the “Private Placement Warrants”) in the Business Combination. In addition, on the Closing Date, the Company issued 3,750,000 warrants in connection with a Forward Purchase Agreement dated August 4, 2020 (the “Forward Purchase Agreement” and the “Forward Purchase Warrants”). The Public, Private Placement and Forward Purchase Warrants entitled the holder to purchase one share of Class A common stock at an exercise price of $11.50 per share.
The Company evaluated the Public, Private Placement and Forward Purchase Warrants (together “the Warrants”) under ASC 815-40, Derivatives and Hedging-Contracts in Entity’s Own Equity (“ASC 815-40”), and concluded they did not meet the criteria to be indexed to the Company’s own stock as certain provisions of the warrant agreement could change the settlement amount of these warrants based on variables that would not be considered inputs to the valuation model for a fixed-for-fixed equity instrument. Since the Warrants met the definition of a derivative under ASC 815-40, the Company recorded these Warrants as liabilities in the Consolidated Balance Sheets at fair value, with subsequent changes in their respective fair values recognized in the “Loss on fair value adjustment for warrant liabilities — net” within the Consolidated Statements of Operations at each reporting date.
The Public Warrants were publicly traded and thus had an observable market price to estimate fair value. The Forward Purchase Warrants, which had identical terms as the Public Warrants, were valued similar to the Public Warrants. The Private Placement Warrants were valued using a Black-Scholes option-pricing model as described in “Note 7 — Fair Value of Financial Instruments”.
As described in “Note 5 — Common Stock Warrants”, during the year ended December 31, 2022, all Warrants were exercised or redeemed.
Advertising and Marketing — The Company markets its products and services mainly through paid search, natural or organic search optimization, affiliate marketing channels, email and website marketing, customer events and public relations initiatives. Costs associated with marketing efforts are recorded in “Selling, general and administrative expenses” when related liabilities are incurred. For paid search and affiliate marketing, liabilities are incurred when potential new customers click through the links in the ad, generating an obligation to the internet search provider or affiliate marketing partner. Advertising and marketing costs expensed for the years ended December 31, 2023, 2022 and 2021 were $48.5 million, $55.8 million and $53.7 million, respectively.
Income Taxes — The Company computes income taxes and accruals for uncertain tax positions under the asset and liability method as set forth in the authoritative guidance for accounting for income taxes and uncertain tax positions. Deferred income taxes are provided for the temporary differences between the consolidated financial statement carrying amounts and the tax basis of the Company’s assets and liabilities and operating loss and tax credit carryforwards. The Company establishes a valuation allowance for deferred tax assets if it is not more likely than not that the tax benefits will be realized. Periodically, the valuation allowance is reviewed and adjusted based on management’s assessments of realizable deferred tax assets. The Company accounts for the global intangible low-tax income (“GILTI”) earned by foreign subsidiaries included in gross U.S. taxable income in the period incurred. See “Note 20 — Income Taxes” for further information.
Segments — The Company has determined that it operates and manages one operating segment, which is the business of developing and commercializing visual content. The Company’s chief operating decision maker (the “CODM”), its chief executive officer, reviews financial information on an aggregate basis for the purpose of allocating resources and making operating decisions.
Concentration of Credit Risk — Financial instruments that are exposed to concentration of credit risk consist primarily of cash and cash equivalents and accounts receivable balances. Cash and cash equivalents are held with financial institutions of high quality. Balances may exceed the amount of insurance provided on such deposits.
Concentration of credit risk with respect to trade receivables is limited due to the large number of customers and their dispersion across many geographic areas. No single customer represented 10% or more of the Company’s total revenue or accounts receivable in any of the years presented.
Recently Adopted Accounting Standard Updates — In December 2019, the FASB issued ASU 2019-12, “Simplifying the Accounting for Income Taxes (Topic 740)” (“ASU 2019-12”), which removes certain exceptions to the general principles in Topic 740 and improves consistent application of and simplifies U.S. GAAP for other areas of
Topic 740 by clarifying and amending existing guidance. The Company adopted ASU 2019-12, effective January 1, 2022. The adoption of this standard did not have a material impact on the consolidated financial statements.
In June 2016, the FASB issued ASU 2016-13 (Topic 326), “Financial Instruments — Credit Losses” (“ASU 2016-13”). ASU 2016-13 changes how to recognize expected credit losses on financial assets. The standard requires an entity to replace the incurred loss impairment methodology in current U.S. GAAP with a methodology that reflects current expected credit losses, requires consideration of a broader range of reasonable and supportable information to inform credit loss estimates and provides additional transparency about credit risk. The effective date of ASU 2016-13 for the Company is beginning with fiscal years after December 15, 2022, including interim periods within those fiscal years. The Company adopted ASU 2016-13 on January 1, 2023. The adoption of this standard did not have a material impact on the consolidated financial statements.
Recently Issued Accounting Standard Updates — In November 2023, the Financial Accounting Standards Board ("FASB") issued new guidance that modifies the disclosure and presentation requirements of reportable segments. The new guidance requires the disclosure of significant segment expenses that are regularly provided to the chief operating decision maker ("CODM") and included within each reported measure of segment profit and loss. In addition, the new guidance enhances interim disclosure requirements, clarifies circumstances in which an entity can disclose multiple segment measures of profit or loss, provides new segment disclosure requirements for entities with a single reportable segment, and contains other disclosure requirements. The update is effective for annual periods beginning after December 15, 2023, and interim periods within fiscal years beginning after December 15, 2024, with early adoption permitted. The Company is in the process of evaluating the impact of adopting this new guidance on the consolidated financial statement disclosures.
In December 2023, the FASB issued new guidance to amend and improve the existing income tax disclosure requirements. Under the new guidance, public business entities are required to disclose more details to the effective tax rate reconciliation and income taxes paid. The new guidance is effective for public business entities for annual periods beginning after December 15, 2024. The Company is in the process of evaluating the impact of adopting this new guidance on the consolidated financial statement disclosures.
Subsequent Events — The Company evaluated subsequent events and transactions for potential recognition or disclosure in the consolidated financial statements through March 15, 2024.
3. BUSINESS COMBINATION
As discussed in “Note 1 – Description of the Business”, on July 22, 2022, the Company consummated the transactions contemplated by the Business Combination Agreement. At the Closing, and subject to the terms and conditions of the Business Combination Agreement, holders of 153,322,880 shares of Legacy Getty common stock received 196,938,915 shares of the Company’s Class A common stock as consideration in the Business Combination, and the previously outstanding Legacy Getty Redeemable Preferred Stock was retired in full through a combination of a cash payment of approximately $615.0 million and 15,000,000 shares of the Company’s Class A common stock with a fair value at issuance of $140.2 million. Each Legacy Getty Option (whether vested or unvested) to purchase Legacy Getty Common Shares was converted into an option to purchase a number of shares of the Company’s Class A common stock and at an exercise price converted based on the Exchange Ratio, calculated in accordance with the terms of the Business Combination Agreement.
In addition to the consideration paid at Closing, during a period to expire 10 years from the Closing Date (the “Earn-Out Period”), within 10 business days after the occurrence of an applicable triggering event, as described below, the Company was required to issue to former equity holders of Legacy Getty an aggregate of up to 59,000,000 shares of the Company’s Class A common stock (the “Earn-Out Shares”), upon the terms and subject to the conditions set forth in the Business Combination Agreement and the other agreements contemplated thereby. The Earn-Out Shares were issuable in three equal tranches if (i) the volume weighted average price of the shares of the Company’s Class A common stock over any 20 trading days within any 30 consecutive trading day period was greater than or equal to $12.50, $15.00 and $17.50, respectively, or (ii) if there was a change of control of the Company prior to the expiration of the Earn-Out Period that would result in the holders of shares of the Company’s Class A common stock receiving a price per share equal to or in excess of $12.50, $15.00 and $17.50, respectively. The Earn-Out Shares were accounted for as equity-classified equity instruments and recorded in additional paid-in capital as part of the Business Combination.
Pursuant to a certain letter agreement executed concurrently with the Business Combination Agreement (the “Sponsor Side Letter”), CC Neuberger Principal Holdings II Sponsor, LLC (the “Sponsor”), its independent directors and certain affiliates, agreed to convert, through a series of transactions, 5,140,000 of its CCNB Class B common stock into 2,570,000 Series B-1common stock and 2,570,000 Series B-2 common stock of the Company (the shares of Series B-2 common stock together with the shares of Series B-1 common stock, the “Restricted Sponsor Shares”), which were subject to forfeiture if certain vesting events are not satisfied. The Series B-1 common stock and Series B-2 common stock would vest and convert into shares of Class A common stock if (i) the volume weighted average price of the shares of the Company’s Class A common stock over any 20 trading days within any 30 consecutive trading day period was greater than or equal to $12.50 and $15.00, respectively, or (ii) if there was a change of control of the Company that would result in the holders of shares of the Company’s Class A common stock receiving a price per share equal to or in excess of $12.50 and $15.00, respectively. The Restricted Sponsor Shares are accounted for as equity-classified equity instruments and recorded in additional paid-in capital as part of the Business Combination.
Concurrent with the execution of the Business Combination Agreement, CCNB and the Company entered into Subscription Agreements (the “PIPE Subscription Agreements”) with the Sponsor and Getty Investments. Additionally, on December 28, 2021, CCNB and the Company entered into the Permitted Equity Subscription Agreement with Multiply Group (the “Permitted Equity Subscription Agreement”). On July 22, 2022, Getty Investments entered into an additional subscription agreement with the Company (the “Additional Getty Subscription Agreement”). Pursuant to the PIPE Subscription Agreements, the Permitted Equity Subscription Agreement and the Additional Getty Subscription Agreement, on the Closing Date, the Sponsor, Getty Investments and Multiply Group subscribed for and purchased, and CCNB and the Company issued and sold to such investors, an aggregate of 36,000,000 shares of the Company’s Class A common stock for a purchase price of $10.00 per share, for aggregate gross proceeds of $360.0 million (the “PIPE Financing”).
On the Closing Date, the Company completed the issuance and sale of 20,000,000 shares of the Company’s Class A common stock and 3,750,000 Forward Purchase Warrants to Neuberger Berman Opportunistic Capital Solutions Master Fund LP (“NBOKS”) for an aggregate purchase price of $200.0 million, in connection with the Forward Purchase Agreement. Refer to “Note 5 – Common Stock Warrants” for additional information on the accounting for the Forward Purchase Warrants.
Additionally, on the Closing Date, the Company completed the sale of 30,000,000 shares of the Company’s Class A common stock to NBOKS, for a purchase price of $10.00 per share and aggregate purchase price of $300.0 million, pursuant to that certain Backstop Facility Agreement dated November 16, 2020, as amended.
Upon the closing of the Business Combination, the Company’s certificate of incorporation was amended and restated to, among other things, increase the total number of authorized shares of all classes of capital stock to 2,006,140,000 shares, $0.0001 par value per share, of which, 2,000,000,000 shares are designated as Class A common stock, 5,140,000 shares are designated as Class B common stock, and 1,000,000 shares are designated as preferred stock.
The Business Combination was accounted for as a reverse recapitalization in accordance with U.S. GAAP. Under this method of accounting, CCNB was treated as the “acquired” company and Getty Images is treated as the acquirer for financial reporting purposes. Accordingly, for accounting purposes, the Business Combination was treated as the equivalent of Getty Images issuing stock for the net assets of CCNB, accompanied by a recapitalization. The net assets of CCNB are stated at historical cost, with no goodwill or other intangible assets recorded.
The following table reconciles the elements of the Business Combination to the Consolidated Statement of Cash Flows and the Consolidated Statements of Redeemable Preferred Stock and Stockholders’ Equity (Deficit) for the year ended December 31, 2022 (in thousands):
| | | | | |
| Cash – CCNB trust and cash, net of redemptions | $ | 4,164 | |
| Cash – PIPE Financing | 360,000 | |
| Cash – Forward Purchase Agreement | 200,000 | |
| Cash – Backstop Agreement | 300,000 | |
| Less: Cash paid to redeem Redeemable Preferred Stock | (614,996) | |
| Less: Transaction costs paid during the year ended December 31, 2022 | (106,917) | |
| Net cash contributions from the Business Combination and related transactions | $ | 142,251 | |
| Add: Non-cash assets received from CCNB | 806 | |
| Add: Transaction costs allocated to warrants | 4,262 | |
| Add: Cash paid to redeem Redeemable Preferred Stock | 614,996 | |
| Add: Tax effect of change in tax basis due to business combination | 6,508 | |
| Less: Fair value of Public, Private Placement and Forward Purchase Warrants | (72,374) | |
| Less: Transaction costs previously paid by Legacy Getty during 2021 or accrued at December 31, 2022 | (1,989) | |
| Net Business Combination and related transactions, excluding Redeemable Preferred Stock redemption | $ | 694,460 | |
| Add: Fair value of Class A common stock issued to redeem Redeemable Preferred Stock | 140,250 | |
| Net Business Combination and related transactions, including Redeemable Preferred Stock redemption | $ | 834,710 | |
The number of shares of common stock issued immediately following the consummation of the Business Combination:
| | | | | |
| Common stock of CCNB, net of redemptions | 508,311 |
| CCNB shares held by the Sponsor | 25,700,000 |
| Shares issued in the PIPE Financing | 36,000,000 |
| Shares issued in the Forward Purchase Agreement | 20,000,000 |
| Shares issued in the Backstop Agreement | 30,000,000 |
| Total shares issued in Business Combination and related transactions | 112,208,311 |
| Shares issued for Getty Images common stock | 196,938,915 |
| Shares issued upon redemption of Getty Images Redeemable Preferred Stock | 15,000,000 |
| Total shares of common stock immediately following the Business Combination | 324,147,226 |
___________________________________
CCNB shares held by the Sponsor in the table above include 5,140,000 Restricted Sponsor Shares.
4. ACQUISITION
On April 1, 2021, the Company acquired Unsplash Inc. (“Unsplash”) in exchange for $95.4 million in cash plus additional conditional payments (“Contingent Consideration”).
The Contingent Consideration payments are based on revenue of Unsplash for (i) the period commencing May 1, 2021 and ending on the earlier of when the trailing 12 month revenues of Unsplash reaches $10.0 million or two years (the “Two-Year Earnout”), and (ii) the period commencing May 1, 2021 and ending on the earlier of when the trailing 12 month revenues of the Unsplash reaches $30.0 million or three years (the “Three-Year Earnout”).
The Two-Year Earnout was met and payment of $10.0 million was made during the year ended December 31, 2022.
If the Three-Year Earnout is met, the payment will be $10.0 million, plus $1.0 thousand for every $1.0 million in revenues that exceed $30.0 million and $2.5 thousand for every $1.0 million in revenues that exceeds $60.0 million in that trailing 12 month period.
To estimate the fair value of the Contingent Consideration, the Company used a variation of an income approach where revenue was simulated in a risk-neutral framework using Geometric Brownian Motion, which is a model of stock price behavior that is used in option pricing models such as the Black-Scholes option pricing model. The real options method extends this model to situations where the asset of interest (revenue in this case) is not priced in the market. The Company determined the acquisition-date fair value of the Contingent Consideration to be $13.2 million, based on the likelihood of paying cash related to the contingent earn-out clauses, as part of the consideration transferred. See “Note 7 — Fair Value of Financial Instruments” for subsequent measurements of these contingent liabilities.
The components of the fair value of consideration transferred are as follows (in thousands):
| | | | | |
| Cash | $ | 95,418 | |
| Contingent Consideration | 13,200 | |
| Total fair value of consideration transferred | $ | 108,618 | |
The transaction was accounted for using the acquisition method and, accordingly, the results of the acquired business have been included in the Company’s results of operations from the acquisition date. In connection with the acquisition, the Company incurred approximately $0.4 million of transaction costs.
Unsplash provides a platform for sharing exclusively curated, world-class images, free for use. With more than 102 million image downloads and 20 billion image views per month, Unsplash has become a leading source for visuals on the internet. This acquisition will allow the Company to increase its presence across the full spectrum of the world’s growing creative community.
The fair value of consideration transferred in this business combination was allocated to the intangible and tangible assets acquired and liabilities assumed at the acquisition date, with the remaining unallocated amount recorded as goodwill. Goodwill is primarily attributed to assembled workforce of Unsplash and expected synergies from combining operations. Goodwill recognized for this acquisition was allocated to the Company’s one operating segment and is generally not tax deductible.
The aggregate purchase price was allocated to the assets acquired and liabilities assumed as follows (in thousands):
| | | | | |
| Assets acquired and liabilities assumed: | Fair Value at
Acquisition Date |
| Cash and cash equivalents | $ | 6,213 | |
| Accounts receivable | 1,061 | |
| Other current assets | 736 | |
| Prepaid expenses | 118 | |
| Property and equipment | 1,729 | |
| Other long term assets | 306 | |
| Identifiable intangible assets | 23,900 | |
| Goodwill | 75,782 | |
| Total assets acquired | $ | 109,845 | |
| Accounts payable and accrued expenses | (128) | |
| Deferred income tax liability | (1,099) | |
| Total liabilities assumed | (1,227) | |
| Net assets acquired | $ | 108,618 | |
The identifiable intangible assets, which include contributor content, customer relationships, developed technology, and trade names, have a weighted average life of approximately 6.0 years and are being amortized on a straight-line basis. The fair value of the customer relationships was determined using a variation of the income approach known as the multiple-period excess earnings method. The fair value of the trade names and developed technology were determined using the relief-from-royalty method and the fair value of the contributor content was determined using the cost-to-recreate method.
The revenue and operating loss from Unsplash included in the Company’s consolidated statements of operations for the year ended December 31, 2021 was $5.8 million and $1.2 million, respectively.
5. COMMON STOCK WARRANTS
Public Warrants — As part of CCNB’s initial public offering, 20,700,000 Public Warrants were sold. The Public Warrants entitled the holder thereof to purchase one share of Class A common stock at a price of $11.50 per share, subject to adjustments. The Public Warrants were only exercisable for a whole number of shares of Class A common stock. No fractional shares were to be issued upon exercise of the warrants. The Public Warrants were set to expire at 5:00 p.m. New York City time on July 22, 2027, or earlier upon redemption or liquidation. The Public Warrants were listed on the NYSE under the symbol “GETY.WS.”
The Company redeemed the Public Warrants at a price of $0.01 per warrant after the sale price of Class A common stock equaled or exceeded $18.00 per share for 20 trading days within a 30-trading day period. The Company had the option to require all holders that wish to exercise the Public Warrants to do so on a cashless basis.
Private Placement Warrants — Simultaneously with CCNB’s initial public offering, CCNB consummated a private placement of 18,560,000 Private Placement Warrants with CCNB’s sponsor. Each Private Placement Warrant was exercisable for one share of Class A common stock at a price of $11.50 per share, subject to adjustment. The Private Placement Warrants were identical to the Public Warrants, except that the Private Placement Warrants were non-redeemable so long as they were held by the initial purchasers or such purchasers’ permitted transferees, and the initial purchasers or such purchasers’ permitted transferees had the option to exercise the Private Placement Warrants on a cashless basis. If the Private Placement Warrants were held by someone other than the initial purchasers or their permitted transferees, the Private Placement Warrants would be redeemable by the Company and exercisable by such holders on the same basis as the Public Warrants.
In August 2022, all of the Private Placement Warrants were exercised on a cashless basis for 11,555,996 shares of Class A common stock. The fair value of the Private Placement Warrants was remeasured upon the exercise of the warrants, resulting in an non-cash loss of $176.6 million recorded in “Loss on fair value adjustment for warrant liabilities” Consolidated Statements of Operations.
Forward Purchase Warrants — Additionally, on the Closing Date, the Company issued 3,750,000 Forward Purchase Warrants in connection with the Forward Purchase Agreement. The Forward Purchase Warrants had the same terms as the Public Warrants.
The Company concluded the Public, Private Placement and Forward Purchase Warrants meet the definition of a derivative under ASC 815-40 (as described in “Note 2 — Summary of Significant Accounting Policies”) and were recorded as liabilities. Upon consummation of the Business Combination, the fair value of the Public, Private Placement and Forward Purchase Warrants were recorded in the Consolidated Balance Sheet. Transaction costs allocated to the issuance of the Public, Private Placement and Forward Purchase Warrants of $4.3 million were recorded as “Other non-operating (expense) income — net” in the Consolidated Statements of Operations.
On September 19, 2022, the Company announced that it had elected to redeem all of the outstanding Public Warrants and Forward Purchase Warrants that remain outstanding at 5:00 p.m. New York City time on October 19, 2022 for $0.01 per warrant. 10,328 Public Warrants were exercised for an aggregate cash payment of $0.1 million. Effective October 19, 2022, the remaining Public Warrants and Forward Purchase Warrants were redeemed for $0.2 million. The fair value of the Public and Forward Purchase Warrants was remeasured upon the exercise and redemption of the warrants, resulting in a non-cash gain of $15.9 million recorded in “Loss on fair value adjustment for warrant liabilities — net” Consolidated Statements of Operations.
As of December 31, 2022 and December 31, 2023, there were no outstanding Public, Private Placement or Forward Purchase Warrants.
6. DERIVATIVE INSTRUMENTS
Foreign Currency Risk — Certain assets, liabilities and future operating transactions are exposed to foreign currency exchange rate risk. The Company has utilized derivative financial instruments, namely foreign currency forwards and option contracts, to reduce the impact of foreign currency exchange rate risks where natural hedges do not exist. The Company is exposed to market risk from foreign currency exchange rate fluctuations as a result of foreign currency-denominated revenues and expenses. The Company has entered into certain foreign currency derivative contracts, including foreign currency forward options to manage these risks. These contracts were economic hedges of the Company’s exposures but were not designated as hedges, as defined in the applicable accounting guidance, for financial reporting purposes. The notional amounts outstanding under these contracts as of December 31, 2021 was $15.2 million. These contracts were carried at fair value, as determined by quoted market exchange rates. At December 31, 2023 and 2022 the Company held no foreign currency contracts. The Company recognized gain of $0.7 million and $1.7 million for the years ended December 31, 2022 and 2021, respectively. These gains and are recognized in “(Loss) gain on fair value adjustment for swaps and foreign currency exchange contract – net” in the accompanying Consolidated Statements of Operations.
Interest Rate Risk — In February 2019, the Company entered into two interest rate swaps to hedge interest rate risk associated with the Company’s debt. One of the swaps had a notional amounts of $175.0 million and the Company paid a fixed rate of 2.5010%. This swap matured during the year ended December 31, 2022. The other swap has a notional amount of $355.0 million and the Company pays a fixed rate of 2.5380%. This swap was still outstanding as of December 31, 2023, and matured in February 2024. Each swap contains an embedded floor option under which the Company receives a rate of 0.0% or one-month LIBOR, whichever is greater, to match the terms of the Company’s debt. In June 2023 the rate transitioned to the greater of one-month CME Term SOFR or negative 0.1%. Both swaps are considered economic hedges and have not been designated as hedges, as defined in the applicable accounting guidance, for financial reporting purposes. The changes in fair value are recognized in “(Loss) gain on fair value adjustment for swaps and foreign currency exchange contract – net” in the accompanying Consolidated Statements of Operations.
For the interest rate swaps, the Company recognized loss of $7.6 million, gain of $22.8 million and gain of $17.6 million on these derivative instruments for the years ended December 31, 2023, 2022 and 2021, respectively.
The Company does not hold or issue derivative financial instruments for trading purposes. In general, the Company’s derivative activities do not create foreign currency exchange rate risk because fluctuations in the value of the instruments used for economic hedging purposes are offset by fluctuations in the value of the underlying exposures being hedged. Counterparties to derivative financial instruments expose the Company to credit related losses in the event of nonperformance; however, the Company has entered into these instruments with creditworthy financial institutions and considers the risk of nonperformance to be minimal.
The following table summarizes the location and fair value amounts of derivative instruments reported in the Consolidated Balance Sheets (in thousands):
| | | | | | | | | | | | | | | | | | | | | | | |
| As of December 31, |
| 2023 | | 2022 |
| Asset | | Liability | | Asset | | Liability |
| Derivatives not designated as hedging instruments: | | | | | | | |
| Interest rate swaps | $ | 1,459 | | | $ | — | | | $ | 9,032 | | | $ | — | |
| | | | | | | |
| Total derivatives | $ | 1,459 | | | $ | — | | | $ | 9,032 | | | $ | — | |
Short-term derivative assets are included in “Other current assets” and long-term derivative assets are included in “Other long-term assets” on the Consolidated Balance Sheet.
7. FAIR VALUE OF FINANCIAL INSTRUMENTS
The Company’s disclosable financial instruments as of December 31, 2023 and 2022 consist of cash equivalents, interest rate swaps, debt, and contingent consideration. Assets and liabilities measured at fair value on a recurring basis (cash equivalents, interest rates swaps and common stock warrants) and a nonrecurring basis (debt) are categorized in the tables below based on the levels discussed in “Note 2 — Summary of Significant Accounting Policies”.
Financial instrument assets recorded at fair value as of December 31 are as follows (in thousands):
| | | | | | | | | | | | | | | | | | | | | | | |
| As of December 31, 2023 |
| Level 1 | | Level 2 | | Level 3 | | Total |
| Money market funds (cash equivalents) | $ | 57,062 | | | $ | — | | | $ | — | | | $ | 57,062 | |
| Derivative assets: | | | | | | | |
| Interest rate swaps | — | | | 1,459 | | | — | | | 1,459 | |
| $ | 57,062 | | | $ | 1,459 | | | $ | — | | | $ | 58,521 | |
| | | | | | | | | | | | | | | | | | | | | | | |
| As of December 31, 2022 |
| Level 1 | | Level 2 | | Level 3 | | Total |
| Money market funds (cash equivalents) | $ | 20,462 | | | $ | — | | | $ | — | | | $ | 20,462 | |
| Derivative assets: | | | | | | | |
| Interest rate swaps | — | | | 9,032 | | | — | | | 9,032 | |
| $ | 20,462 | | | $ | 9,032 | | | $ | — | | | $ | 29,494 | |
The fair value of the Company’s money market funds is based on quoted active market prices for the funds and is determined using the market approach.
Financial instrument liabilities recorded or disclosed at fair value as of December 31 are as follows (in thousands):
| | | | | | | | | | | | | | | | | | | | | | | |
| As of December 31, 2023 |
| Level 1 | | Level 2 | | Level 3 | | Total |
| Term Loans | $ | — | | | $ | 1,104,237 | | | $ | — | | | $ | 1,104,237 | |
| Senior Notes | — | | | 302,250 | | | — | | | 302,250 | |
| $ | — | | | $ | 1,406,487 | | | $ | — | | | $ | 1,406,487 | |
| | | | | | | | | | | | | | | | | | | | | | | |
| As of December 31, 2022 |
| Level 1 | | Level 2 | | Level 3 | | Total |
| Term Loans | $ | — | | | $ | 1,112,990 | | | $ | — | | | $ | 1,112,990 | |
| Senior Notes | — | | | 297,354 | | | — | | | 297,354 | |
| $ | — | | | $ | 1,410,344 | | | $ | — | | | $ | 1,410,344 | |
The fair value of the Company’s Term Loans and Senior Notes are based on market quotes provided by a third-party pricing source. See “Note 12 — Debt” for additional disclosures on the Term Loans and Senior Notes.
The fair value of the Company’s interest rate swap contracts are based on market quotes provided by the counterparty. Quotes by the counterparty are calculated based on observable current rates and forward interest rate curves and exchange rates. The Company recalculates and validates this fair value using publicly available market inputs using the market approach.
Contingent Consideration — As of December 31, 2023 and 2022, the Company had estimated its obligations to transfer Contingent Consideration relating to the acquisition of Unsplash to be zero. The Company recorded acquisition-date fair value of the Contingent Consideration, based on the likelihood of contingent earn-out payments, as part of the consideration transferred. The earn-out payments are remeasured to fair value each reporting date. Changes in the fair value of the Contingent Consideration are recognized within “Other operating expense (income) –
net” on the Consolidated Statement of Operations. The fair value of the Contingent Consideration is based on significant inputs not observable in the market, and as such the Company classified the financial liability as Level 3. The fair value of the Contingent Consideration may change significantly as additional data is obtained, impacting the Company’s assumptions regarding probabilities of outcomes used to estimate the fair value of the liabilities. In evaluating this information, considerable judgment is required to interpret the data used to develop the assumptions and estimates. The estimates of fair value may not be indicative of the amounts that could be realized in a current market exchange. Accordingly, the use of different market assumptions and/or different valuation techniques may have a material effect on the estimated fair value amounts, and such changes could materially impact the Company’s results of operations in future periods.
The Contingent Consideration payments are based on revenue of Unsplash as outlined in “Note 4 — Acquisition.” The Two-Year Earnout was met and a payment of $10.0 million was made during the year ended December 31, 2022.
The following table provides quantitative information associated with the fair value measurements of the Company’s Level 3 inputs:
| | | | | | | | | | | | | | | | | | | | | | | |
| Fair Value as of
December 31, 2023
(in thousands) | | Valuation
Technique | | Unobservable Input | | Range |
| Contingent Consideration | — | | | Probability-adjusted discounted cash flow | | Probabilities of success | | —% |
| | | | | Years until milestone is expected to be achieved | | 0.33 years |
| | | | | Discount rate | | 9.94% |
This Contingent Consideration was valued using an income approach where revenue was simulated in a risk-neutral framework using Geometric Brownian Motion, a model of stock price behavior that is used in option pricing models such as the Black-Scholes option pricing model. The real options method extends this model to situations where the asset of interest (revenue in this case) is not priced in the market. The significant unobservable inputs used in the fair value measurement of the Contingent Consideration forecasts of expected future revenues and the probability of achievement of those forecasts. Increases in the assessed likelihood of a higher payout under a Contingent Consideration arrangement contribute to increases in the fair value of the related liability. Conversely, decreases in the assessed likelihood of a higher payout under a Contingent Consideration arrangement contribute to decreases in the fair value of the related liability.
The following table presents changes in the fair value of the Contingent Consideration for the years ended December 31 (in thousands):
| | | | | | | | | | | |
| Year end December 31, |
| 2023 | | 2022 |
| Balance, beginning of period | $ | — | | | $ | 14,039 | |
| | | |
| Payment | — | | | (10,000) | |
| Change in fair value of Contingent Consideration | — | | | (4,039) | |
| Balance, end of period | $ | — | | | $ | — | |
Public, Private Placement and Forward Purchase Warrants — When outstanding, the Public Warrants were classified within Level 1 as they were publicly traded and had an observable market price in an active market. The Forward Purchase Warrants, which had identical terms as the Public Warrants, were valued similar to the Public Warrants and were classified within Level 2.
The Private Placement Warrants, all of which were exercised on a cashless basis in August 2022, were valued based on a Black-Scholes option pricing model, using assumptions and estimates the Company believes would be made by a market participant in making the same valuation. The Private Placement Warrants were collectively classified as a Level 3 measurement within the fair value hierarchy because the valuation model involves the use of unobservable inputs relating to the Company’s estimate of its expected stock volatility, which was developed based on the historical volatility of a publicly traded set of peer companies.
Changes in the fair value of the Private Placement Warrant liability related to updated assumptions and estimates are recognized within the Consolidated Statements of Operations as a non-operating expense. The changes in the fair value of the Private Placement Warrant liability resulted from changes in the fair values of the underlying Class A common shares and its associated volatilities.
The following table presents the change in the fair value of the Private Placement Warrants for the year ended December 31, 2022 (in thousands):
| | | | | |
| Year end December 31, 2022 |
| Balance, beginning of period | $ | — | |
| Assumed in Business Combination (Note 3) | 56,237 | |
| Change in fair value | 176,616 | |
| Exercise | (232,853) | |
| Balance, end of period | $ | — | |
8. PROPERTY AND EQUIPMENT – NET
Property and equipment consisted of the following at the reported Balance Sheet dates (in thousands, except years):
| | | | | | | | | | | | | | | | | |
| Estimated
Useful
Lives
(in Years) | | December 31, |
| | 2023 | | 2022 |
| Contemporary imagery | 5 | | $ | 395,063 | | | $ | 377,858 | |
| Computer hardware purchased | 3 | | 2,809 | | | 6,783 | |
| Computer software developed for internal use | 3 | | 161,317 | | | 119,516 | |
| Leasehold improvements | 2–20 | | 8,295 | | | 8,361 | |
| Furniture, fixtures and studio equipment | 5 | | 11,341 | | | 10,856 | |
| Archival imagery | 40 | | 96,090 | | | 94,043 | |
| Other | 3–4 | | 2,406 | | | 2,352 | |
| Property and equipment | | | 677,321 | | | 619,769 | |
| Less: accumulated depreciation | | | (497,943) | | | (447,686) | |
| Property and equipment, net | | | $ | 179,378 | | | $ | 172,083 | |
Included in archival imagery as of December 31, 2023 and 2022 was $10.2 million and $10.0 million respectively, of imagery that has an indefinite life and therefore is not amortized.
9. GOODWILL
Goodwill was tested for impairment as of October 1, 2023 and 2022. The Company did not recognize a goodwill impairment charge during the year ended December 31, 2023 and 2022. The fair value of the Goodwill was estimated using both market indicators of fair value and the expected present value of future cash flows. As of December 31, 2023 and 2022, the accumulated impairment loss on Goodwill was $525.0 million for both years.
Goodwill changed during the years presented as follows (in thousands):
| | | | | | | | | | | | | | | | | |
| Goodwill
before
impairment | | Accumulated
impairment
charge | | Goodwill – net |
| December 31, 2021 | $ | 2,028,245 | | | $ | (525,000) | | | $ | 1,503,245 | |
| Effects of fluctuations in foreign currency exchange rates | (3,667) | | | — | | | (3,667) | |
| December 31, 2022 | $ | 2,024,578 | | | $ | (525,000) | | | $ | 1,499,578 | |
| Effects of fluctuations in foreign currency exchange rates | 2,236 | | | — | | | 2,236 | |
| December 31, 2023 | $ | 2,026,814 | | | $ | (525,000) | | | $ | 1,501,814 | |
10. IDENTIFIABLE INTANGIBLE ASSETS — NET
Identifiable intangible assets consisted of the following at December 31 (in thousands, except years):
| | | | | | | | | | | | | | | | | | | | | | | | | | | | | | | | | | | | | | | | | |
| | | As of December 31, |
| | | 2023 | | 2022 |
| Range of
Estimated
Useful Lives
(Years) | | Gross
Amount | | Accumulated
Amortization | | Net
Amount | | Gross
Amount | | Accumulated
Amortization | | Net
Amount |
| Trade name | Indefinite | | $ | 397,495 | | | $ | — | | | $ | 397,495 | | | $ | 389,484 | | | $ | — | | | $ | 389,484 | |
| Trademarks and trade names | 5–10 | | 104,109 | | | (104,109) | | | — | | | 104,053 | | | (104,026) | | | 27 | |
| Patented and unpatented technology | 3–10 | | 111,045 | | | (106,869) | | | 4,176 | | | 109,275 | | | (103,419) | | | 5,856 | |
| Customer lists, contracts, and relationships | 5–11 | | 399,378 | | | (397,244) | | | 2,134 | | | 391,454 | | | (367,273) | | | 24,181 | |
| Non-compete Covenant | 3 | | 900 | | | (900) | | | — | | | 900 | | | (900) | | | — | |
| Other identifiable intangible assets | 3–13 | | 5,089 | | | (5,089) | | | — | | | 5,059 | | | (5,059) | | | — | |
| | | $ | 1,018,016 | | | $ | (614,211) | | | $ | 403,805 | | | $ | 1,000,225 | | | $ | (580,677) | | | $ | 419,548 | |
The Getty Images and Unsplash trade names were valued using an estimated royalty rate which considered name recognition, licensing practices of the Company and its competitors for similar services, and other relevant qualitative factors.
Based on balances at December 31, 2023, the estimated aggregate amortization expense for identifiable intangible assets for the next five years is as follows (in thousands):
| | | | | |
Fiscal Years Ended
December 31, | |
| 2024 | $ | 2,106 | |
| 2025 | $ | 2,106 | |
| 2026 | $ | 818 | |
| 2027 | $ | 284 | |
| 2028 | $ | 284 | |
11. OTHER ASSETS AND LIABILITIES
Other Long-Term Assets — Other long-term assets consisted of the following at the reported Balance Sheet dates (in thousands):
| | | | | | | | | | | |
| Year end December 31, |
| 2023 | | 2022 |
| Long term note receivable from a related party | $ | 24,000 | | | $ | 24,000 | |
| Minority and other investments | 12,454 | | | 12,097 | |
| Derivative asset | — | | | 9,032 | |
| Tax receivable | — | | | 2,700 | |
| Equity method investment | 2,852 | | | 2,064 | |
| Long term deposits | 1,526 | | | 1,609 | |
| Other | 430 | | | 450 | |
| Total other long-term assets | $ | 41,262 | | | $ | 51,952 | |
Accrued Expenses — Accrued expenses at the reported Balance Sheet dates are summarized below (in thousands):
| | | | | | | | | | | |
| Year end December 31, |
| 2023 | | 2022 |
| Accrued compensation and related costs | $ | 16,933 | | | $ | 23,851 | |
| Lease liabilities | 9,780 | | | 10,094 | |
| Interest payable | 9,942 | | | 9,993 | |
| Accrued professional fees | 6,045 | | | 4,334 | |
| Other | 953 | | | 1,055 | |
| Total accrued expenses | $ | 43,653 | | | $ | 49,327 | |
12. DEBT
Debt included the following (in thousands):
| | | | | | | | | | | |
| Year end December 31, |
| 2023 | | 2022 |
| Senior Notes | $ | 300,000 | | | $ | 300,000 | |
| USD Term Loans | 637,000 | | | 687,400 | |
| EUR Term Loans | 463,588 | | | 446,996 | |
| Less: issuance costs and discounts amortized to interest expense | (1,930) | | | (5,549) | |
| Long-term debt – net | $ | 1,398,658 | | | $ | 1,428,847 | |
In February of 2019, the Company issued $300.0 million of Senior Unsecured Notes (“Senior Notes”) and entered into a senior secured credit facility (“Credit Facility”) consisting of (i) a $1,040.0 million term loan facility (“USD Term Loans”), (ii) a €450.0 million term loan facility (“EUR Term Loans”) (together with the USD Term Loans the “Term Loans”) and (iii) an $80.0 million revolving credit facility that could be upsized to $110.0 million (“Revolver”).
On May 4, 2023, the Company amended the existing Credit Facility to among other things, (i) upsize the total amount of commitments under the revolving credit facility capacity from $80.0 million to $150.0 million and (ii) extend the maturity of the revolving credit facility until May 4, 2028. The revolving facility is also subject to a springing maturity of 180 days inside any earlier maturity of Senior Notes or Term Loans with an aggregate principal amount exceeding $100.0 million. The revolving credit facility remains undrawn. The Company accounted for this amendment as a modification of the existing revolving credit facility. The unamortized debt issuance costs and the fees incurred to amend the revolving credit facility will be amortized over the term of the new revolving credit facility. The Company incurred unused commitment fees of $0.4 million during each of the years ended December 31, 2023, 2022 and 2021.
The Senior Notes are due March 1, 2027, and bear interest at a rate of 9.750% per annum. Interest on the notes is payable semi-annually on March 1 and September 1 of each year. The Company may redeem the Senior Notes earlier than March 1, 2027, subject to prepayment premiums.
The Term Loans mature in 2026. The Company may voluntarily prepay loans or reduce commitments under the Credit Facility without premium or penalty.
In August of 2022, the Company utilized proceeds from its Business Combination along with cash on hand to repay $300.0 million of outstanding indebtedness on its USD Term Loans. In accordance with ASC 470-50-40-2 - Debt - Modifications and Extinguishments, the Company recorded a loss on extinguishment of debt of $2.7 million for the year ended December 31, 2022, in the Consolidated Statements of Operations related to this payment. The loss on extinguishment of debt represents the acceleration of amortization of issuance costs and debt discount related to the $300.0 million payment. Under the terms of the Credit Facility, the prepayment of $300.0 million was applied against the quarterly installments of $2.6 million. Accordingly, the remaining balance on the USD Term Loans is due at maturity.
The face value of the EUR Term Loans was €419.0 million and €419.0 million as of December 31, 2023 and 2022, respectively, converted using currency exchange rates as of those dates. There is no amortization on the EUR Term Loans.
The Credit Facility requires a principal payment with the net cash proceeds of certain events and up to 50% of excess cash flow (subject to reduction based on the achievement of specified net first lien leverage ratios). No excess cash flow principal payment was required for the years ended December 31, 2023 and 2022 based on the net first lien leverage ratio.
The obligations under the Credit Facility are secured by a first priority lien on substantially all of the Company’s assets.
On 2nd February 2023, we amended our Credit Agreement to replace LIBOR with Adjusted Term SOFR on the USD Term Loans effective from the start of the next interest period thereafter. For the USD Term Loans, the interest rate for base rate loans is 3.50% plus the greater of the prime rate in effect, the NYFRB Rate plus 0.5% or the Adjusted Term SOFR rate for a one-month interest period plus 1%. The interest rate for Term Benchmark loans with respect to the USD Term Loans is the sum of the applicable rate of 4.50%, plus the Adjusted Term SOFR rate. The Adjusted Term SOFR rate is the greater of the Term SOFR rate for the applicable interest period plus 0.10% or 0.00%. The Term SOFR Rate for the applicable interest period, is the is the rate per annum published by the CME Term SOFR Administrator and identified by Administrative Agent as the forward-looking term rate based on SOFR at approximately 5:00 a.m. Chicago time, two U.S. Government Securities Business Days prior to the first day in such interest period. For the EUR Term Loans, the interest rate for loans is the sum of the applicable rate of 5.0%, plus the Adjusted Eurodollar rate. The Eurodollar rate is defined as the greater of the EURIBOR Screen rate per annum for deposits of Euro for the applicable interest period as of approximately 11:00 a.m. Brussels time two business days prior to the first day in such interest period, or 0.0%. The Adjusted Eurodollar rate is defined as the interest rate per annum (rounded upward, if necessary, to the next 1/16 of 1%), equal to the Eurodollar Rate for the interest period multiplied by the Statutory Reserve Rate. The USD Term loans had an average interest rate of 9.55%, 6.00% and 4.63% for the years ended December 31, 2023, 2022 and 2021, respectively. The EUR Term loans had an average interest rate of 8.21%, 5.27% and 5.00% for the years ended December 31, 2023, 2022 and 2021, respectively.
Debt issuance costs and discounts related to the Senior Notes and Term Loans are reported in the Consolidated Balance Sheet as a direct deduction from the face amount of the debt. These costs are amortized as a component of “Interest expense” in the Consolidated Statements of Operations utilizing the effective interest method. As of December 31, 2023, the Company was compliant with all debt covenants and obligations.
13. COMMITMENTS AND CONTINGENCIES
Commitments — The Company has entered into agreements that represent significant, enforceable and legally binding contractual obligations that are noncancelable without incurring a significant penalty. If a contract is cancelable with a penalty, the amount shown in the table below is the full contractual obligation, not the penalty, as the Company currently intends to fulfill each of these obligations.
Liabilities for uncertain tax positions are excluded from this table due to the uncertainty of the timing of the resolution of the underlying tax positions. At December 31, 2023, net uncertain tax positions were $24.8 million. The entire balance as of December 31, 2023 is non-current as the timing of resolution is uncertain and no portion of these liabilities is expected to be cash settled within the next 12 months.
Payments under purchase orders, certain sponsorships, donations and other commitments that are not enforceable and legally binding contractual obligations are also excluded from this table, as are payments, guaranteed and contingent, under employment contracts because they do not constitute purchase commitments.
The Company leases real estate under operating lease agreements that expire on various dates and does not anticipate any difficulties in renewing those leases that expire within the next several years or in leasing other space or hosting facilities, if required. The Company enters into unconditional purchase obligations related to contracts for cloud-based services, infrastructure and other business services as well as minimum royalty guarantees in connection with certain content licenses. The future minimum payments under debt obligations, non-cancelable operating leases and other purchase obligations are as follows as of December 31, 2023 (in thousands):
| | | | | | | | | | | | | | | | | | | | | | | | | | | | | | | | | | | | | | | | | |
| Years ended December 31, |
| 2024 | | 2025 | | 2026 | | 2027 | | 2028 | | Thereafter | | Total |
| USD Term Loans and EUR Term loans: | | | | | | | | | | | | | |
| Principal payments | $ | — | | | $ | — | | | $ | 1,100,588 | | | $ | — | | | $ | — | | | $ | — | | | $ | 1,100,588 | |
Interest payments1 | 99,400 | | | 83,831 | | | 11,121 | | | — | | | — | | | — | | | 194,352 | |
| Senior Notes: | | | | | | | | | | | | | |
| Principal payments | — | | | — | | | — | | | 300,000 | | | — | | | — | | | 300,000 | |
| Interest payments | 29,250 | | | 29,250 | | | 29,250 | | | 14,625 | | | — | | | — | | | 102,375 | |
| Revolver commitment fee | 763 | | | 681 | | | — | | | — | | | — | | | — | | | 1,444 | |
| Operating lease payments on facilities leases | 13,486 | | | 12,953 | | | 7,946 | | | 7,010 | | | 6,074 | | | 16,497 | | | 63,966 | |
| Minimum royalty guarantee payments to content suppliers | 41,577 | | | 40,531 | | | 23,331 | | | 11,198 | | | 11,067 | | | 8,875 | | | 136,579 | |
| Technology purchase commitments | 8,399 | | | 6,165 | | | 1,063 | | | — | | | — | | | — | | | 15,627 | |
| Other commitments | 2,766 | | | 514 | | | 222 | | | — | | | — | | | — | | | 3,502 | |
| Total commitments | $ | 195,641 | | | $ | 173,925 | | | $ | 1,173,521 | | | $ | 332,833 | | | $ | 17,141 | | | $ | 25,372 | | | $ | 1,918,433 | |
1 These are estimated payments based on interest rate curves valued as of December 31, 2023. Rates used for the EUR Term Loans are 8.3% for 2024, 6.9% for 2025 and 6.8% for 2026. Rates used for the USD Term Loans are 9.3% for 2024, 7.9% for 2025 and 7.6% for 2026.
Offsetting operating lease payments will be approximately $5.0 million in receipts for subleased facilities each year through 2025, and $1.2 million in 2026. Offsetting the minimum royalty guarantee payments to content suppliers will be approximately $2.0 million in minimum guaranteed receipts from content suppliers for each of the years through 2025.
Contingencies — The Company indemnifies certain customers from claims related to alleged infringements of the intellectual property rights of third parties or misappropriation of publicity or personality rights of third parties, such as claims arising from copyright infringement or failure to secure model and property releases for images the Company licenses if such a release is required. The standard terms of these indemnifications require the Company to defend those claims upon notice and pay related damages, if any. The Company typically mitigates this risk by requiring all uses of licenses to be within the scope of the license, securing all necessary model and property releases for imagery for which the Company holds the copyright, and by contractually requiring contributing photographers and other imagery partners to do the same prior to submitting any imagery to the Company and by limiting damages/liability in certain circumstances. Additionally, the Company requires all contributors and image partners, as well as potential
acquisition targets to warrant that the content licensed to or purchased by the Company does not and shall not infringe upon or misappropriate the rights of third parties. The Company requires contributing photographers, other imagery partners and sellers of businesses or image collections that Getty Images has purchased to indemnify the Company in certain circumstances where a claim arises in relation to an image they have provided or sold to the Company. Imagery Partners are typically required to carry insurance policies for losses related to such claims and individual contributors are encouraged to carry such policies and the Company itself has insurance policies to cover litigation costs for such claims. The Company will record liabilities for these indemnifications if and when such claims are probable and the range of possible payments and available recourse from imagery partners can be assessed, as applicable. Historically, the exposure to such claims has been immaterial, as were the recorded liabilities for intellectual property infringement at December 31, 2023 or 2022.
In the ordinary course of business, the Company enters into certain types of agreements that contingently require the Company to indemnify counterparties against third-party claims. These may include:
•agreements with vendors and suppliers, under which the Company may indemnify them against claims arising from Getty Images’ use of their products or services;
•agreements with customers other than those licensing images, under which the Company may indemnify them against claims arising from their use of Getty Images’ products or services;
•agreements with agents, delegates and distributors, under which the Company may indemnify them against claims arising from their distribution of Getty Images’ products or services;
•real estate and equipment leases, under which the Company may indemnify lessors against third-party claims relating to use of their property;
•agreements with directors and officers, under which the Company indemnifies them to the full extent allowed by Delaware law against claims relating to their service to Getty Images;
•agreements with purchasers of businesses Getty Images has sold, under which Getty Images may indemnify the purchasers against claims arising from the Company’s operation of the businesses prior to sale; and
•agreements with initial purchasers and underwriters of the Company’s debt securities, under which Getty Images indemnifies them against claims relating to their participation in the Transactions.
The nature and terms of these indemnifications vary from contract to contract, and generally a maximum obligation is not stated. Because management does not believe a material liability is probable, no related liabilities were recorded at December 31, 2023 or 2022.
The Company has been named as a defendant in two lawsuits filed by former public warrant holders in the United States District Court for the Southern District of New York, Alta Partners, LLC v. Getty Images Holdings, Inc., Case No. 1:22-cv-08916 (filed October 19, 2022), and CRCM Institutional Master Fund (BVI) LTD, et al. (together the “Plaintiffs”) v. Getty Images Holdings, Inc., Case No. 1:23-cv-01074 (filed February 8, 2023). The Plaintiffs generally allege breaches of the Warrant Agreement, dated August 4, 2020, and alternative claims for violations of the federal securities laws, including claims under the Securities Act of 1933 and/or the Securities Exchange Act of 1934. The complaints seek, among other things, an award of money damages. On February 17, 2023, the Court consolidated the actions for purposes of discovery. The Company filed answers to the complaints, and discovery closed on August 28, 2023. On September 11, 2023, all parties filed cross-motions for summary judgment, which were fully briefed on October 2, 2023. On October 27, 2023, the Court issued its decision on the cross-motions for summary judgment and entered judgment in favor of Plaintiffs on their breach of contract claims in the amount of $36.9 million for Alta Partners, LLC and $51.0 million for the CRCM plaintiffs, plus, in each case, pre-judgment interest of 9.0% per annum. The Court entered judgment in favor of the Company on all other claims asserted by Plaintiffs. The Company intends to appeal that portion of the Court’s judgment in favor of plaintiffs.
The Company’s Loss on Litigation is comprised of these summary judgment amounts, in addition to interest pre-judgment through December 31, 2023 and associated legal fees through December 31, 2023. The Company has recognized Recovery of Loss on Litigation of $60.0 million, which represents the limit of the Company’s insurance coverage for this matter. As of December 31, 2023, the Company had a remaining insurance recovery receivable of $48.6 million.
The Company is subject to a variety of other legal claims and suits that arise from time to time in the ordinary course of business. Other than the matter described above, management currently believes that resolving such claims, individually or in aggregate, will not have a material adverse impact on the consolidated financial statements. However, these matters are subject to inherent uncertainties and management’s view of these matters may change in
the future. The Company holds insurance policies that mitigate potential losses arising from certain indemnifications, and historically, significant costs related to performance under these obligations have not been incurred.
The Company has open tax audits in various jurisdictions and some of these jurisdictions require taxpayers to pay assessed taxes in advance or at the time of appealing such assessments. One such jurisdiction is Canada, where one of the Company’s subsidiaries, iStockphoto ULC, recently received tax assessments from the Canada Revenue Agency (“CRA”) asserting additional tax is due. The position taken by the CRA is related to the transactions between iStockphoto ULC and other affiliates within the Getty Images group for the 2015 Canadian income tax return filed. The Company believes the CRA position lacks merit and intends to appeal and vigorously contest these assessments.
As part of the appeal process in Canada, the Company may be required to pay a portion of the assessment amount, which the Company estimates could be up to $19.3 million. Such required payment is not an admission that the Company believes it is subject to such taxes. The Company believes it is more likely than not it will prevail on appeal, however, if the CRA were to be successful in the appeal process, the Company estimates the maximum potential outcome could be up to $29.2 million.
14. REVENUE
The Company distributes its content and services offerings through three primary products:
Creative —Creative is comprised of royalty free (“RF”) photos, illustrations, vectors, videos, and generative AI-services, that are released for commercial use and cover a wide variety of commercial, conceptual and contemporary subjects, including lifestyle, business, science, health, wellness, beauty, sports, transportation and travel. This content is available for immediate use by a wide range of customers with a depth, breadth and quality allowing our customers to produce impactful websites, digital media, social media, marketing campaigns, corporate collateral, textbooks, movies, television and online video content relevant to their target geographies and audiences. We primarily source Creative content from a broad network of professional, semi-professional and amateur creators, many of whom are exclusive to Getty Images. We have a global creative insights team dedicated to providing briefing and art direction to our exclusive contributor community.
Editorial — Editorial is comprised of photos and videos covering the world of entertainment, sports and news. We combine contemporary coverage of events around the globe with one of the largest privately held archives globally with access to images to the beginning of photography. We invest in a dedicated editorial team which includes over 110 staff photographers and videographers to generate our own coverage in addition to coverage from our network of content partners
Other — The Company offers a range of additional products and services to deepen the customer relationships, enhance customer loyalty and create additional differentiation in the market. These additional products and services currently include music licensing, digital asset management and distribution services, print sales and data licensing.
The following table summarizes the Company’s revenue by product (in thousands):
| | | | | | | | | | | | | | | | | |
| Year Ended December 31, |
| 2023 | | 2022 | | 2021 |
| Creative | $ | 578,727 | | | $ | 585,398 | | | $ | 596,917 | |
| Editorial | 320,643 | | | 325,779 | | | 306,631 | |
| Other | 17,185 | | | 15,067 | | | 15,140 | |
| Total Revenue | $ | 916,555 | | | $ | 926,244 | | | $ | 918,688 | |
The December 31, 2023 deferred revenue balance will be earned as content is downloaded, services are provided or upon the expiration of subscription-based products, and nearly all is expected to be earned within the next twelve months. During the year ended December 31, 2023, the Company recognized revenue of $139.3 million that had been included in deferred revenue as of January 1, 2023.
15. REDEEMABLE PREFERRED STOCK
Under its second amended and restated certificate of incorporation, Legacy Getty was authorized to issue up to 900,000 shares of series A preferred stock (the “Redeemable Preferred Stock”) with a par value of $0.01 per share. In conjunction with the Business Combination discussed in “Note 3 — Business Combination”, the previously outstanding Legacy Getty Redeemable Preferred Stock was redeemed in full during the year ended December 31, 2022 through a combination of a cash payment of approximately $615.0 million and 15,000,000 shares of the Company’s Class A common stock with a fair value at issuance of $140.2 million.
Dividends declared and issued totaled $43.2 million (38,109 shares) and $71.4 million (70,574 shares) for the years ended December 31, 2022 and 2021, respectively. Redeemable Preferred Stock dividends were included in the Statements of Redeemable Preferred Stock and Stockholders’ Equity (Deficit) as a detriment to common stockholders and a benefit to Redeemable Preferred stockholders. Such dividends are also included as an adjustment to net income (loss) attributable to Getty Images Holdings, Inc. See “Note 22 — Net Income (Loss) Attributable to Common Stockholders”.
Per the terms of the Redeemable Preferred Stock, the Company elected to early redeem outstanding shares of Redeemable Preferred Stock at a premium. The redemption amount upon the Closing date was equal to (i) the liquidation value multiplied by (ii) the redemption percentage, which was 105%. The Company recognized a $26.7 million increase in the redemption value immediately prior to the Closing. These changes were affected by charges against paid-in capital as the Company was in a retained deficit prior to the Business Combination.
16. STOCKHOLDERS’ EQUITY (DEFICIT)
Common Stock — Upon the closing of the Business Combination, the Company’s certificate of incorporation was amended and restated to, among other things, increase the total number of authorized shares of all classes of capital stock to 2,006,140,000 shares, $0.0001 par value per share, of which, 2,000,000,000 shares are designated as Class A common stock, 5,140,000 shares are designated as Class B common stock, and 1,000,000 shares are designated as preferred stock.
Each holder of Class A common stock is entitled to one vote for each share on all matters properly submitted to a vote, including the election of directors. Class A Stockholders do not have cumulative voting rights in the election of directors. Accordingly, holders of a majority of the voting shares are able to elect all of the directors. Holders of shares of Class A common stock are entitled to dividends, if any, as may be declared from time-to-time by the Board out of legally available funds. Holders of Class A common stock have no preemptive, conversion, subscription or other rights, and there are no redemption or sinking fund provisions applicable to Class A common stock.
Except as otherwise required by law, no holder of Class B common stock is entitled to any voting rights with respect to Class B common stock. If entitled to vote by law, each holder of Class B common stock is entitled to one vote per share. Holders of shares of Class B common stock are entitled to receive dividends, if any, as may be declared from time-to-time by the Board out of legally available funds, contingent upon the occurrence of a conversion into Class A common stock, as discussed below. The holders of shares of Class B common stock shall not be entitled to receive any assets of the Company in the event of any voluntary or involuntary liquidation, dissolution or winding up of the affairs of the Company. Holders of Class B common stock have no preemptive, conversion, subscription or other rights, and there are no redemption or sinking fund provisions applicable to Class B common stock.
In connection with the Business Combination, 2,570,000 shares of Class B common stock were designated as Series B-1 common stock and 2,570,000 shares of Class B common stock were designated Series B-2 common stock. The Series B-1 common stock and Series B-2 common stock would automatically vest and convert into shares of Class A common stock if (i) the volume weighted average price of the shares of the Company’s Class A common stock over any 20 trading days within any 30 consecutive trading day period was greater than or equal to $12.50 and $15.00, respectively, or (ii) if there was a change of control of the Company that would result in the holders of shares of the Company’s Class A common stock receiving a price per share equal to or in excess of $12.50 and $15.00, respectively.
In August 2022, the Series B-1 common stock and Series B-2 common stock automatically converted into 5,140,000 shares of Class A common stock. See “Note 5 — Common Stock Warrants” for further details.
In August 2022, the Earn-Out Shares issued in connection with the Business Combination vested and 58,999,956 shares of Class A common stock were issued.
17. EQUITY-BASED COMPENSATION
Equity-based compensation expense is recorded in “Selling, general and administrative expenses” in the Consolidated Statements of Operations, net of estimated forfeitures. The Company recognized equity-based compensation - net of estimated forfeitures of $40.6 million, $9.5 million, and $6.4 million for the years ended December 31, 2023, 2022 and 2021, respectively. The Company capitalized $3.0 million and $0.3 million of stock-based compensation expense associated with the cost of developing internal-use software during the year ended December 31, 2023 and 2022, respectively.
Prior to the Business Combination, certain employees of the Company were granted equity awards under Legacy Getty’s Amended and Restated 2012 Equity Incentive Plan of the Parent (“Legacy Getty 2012 Plan”). Upon closing of the Business Combination, awards under the Legacy Getty 2012 Plan were converted at the Exchange Ratio, and the Company’s board of directors approved the Getty Images Holdings, Inc. 2022 Equity Incentive Plan (“2022 Plan”). The 2022 Plan provides for the grant of stock options, including incentive stock options and nonqualified stock options, stock appreciation rights, restricted stock, dividend equivalents, restricted stock units (“RSU”), performance stock units (“PSU”), and other stock or cash-based awards. Equity-based awards generally vest over three or four years. Under the 2022 Plan, up to 51,104,577 shares of Class A common stock are reserved for issuance, of which 7,750,436 are available to be issued as of December 31, 2023.
Stock Options — The following tables presents a summary of the Company’s stock option activity for the year ended December 31, 2023 (in thousands except weighted average data and years):
| | | | | | | | | | | | | | | | | |
| Number
of
awards | | Weighted
Average
Exercise
Price | | Remaining
Average
Contractual
Life (in Years) |
Outstanding — December 31, 20211 | 26,271 | | $ | 3.98 | | | 5.87 |
| Retroactive application of recapitalization | 7,331 | | $ | (0.87) | | | 0 |
| Outstanding — December 31, 2021, after effect of recapitalization | 33,602 | | $ | 3.11 | | | 5.87 |
| Granted | 978 | | 6.18 | | | |
| Exercised | (2,959) | | 4.36 | | | |
| Pre-vesting forfeitures | (1,659) | | 3.32 | | | |
| Post-vesting cancellations | (27) | | 2.77 | | | |
| Outstanding - December 31, 2022 | 29,935 | | 3.08 | | | 5.85 |
| Granted | 2,936 | | $ | 6.49 | | | |
| Exercised | (5,017) | | 3.00 | | | |
| Pre-vesting forfeitures | (32) | | 4.94 | | | |
| Post-vesting cancellations | (31) | | 6.00 | | | |
| Outstanding - December 31, 2023 | 27,791 | | 3.45 | | | 5.12 |
| | | | | |
| Exercisable - December 31, 2023 | 23,845 | | $ | 3.02 | | | 4.50 |
| Vested and expected to vest after December 31, 2023 | 27,775 | | $ | 3.45 | | | 5.12 |
1 Excludes 3,635 non-stock option equity awards that were outstanding under the Legacy Getty 2012 Plan, which were converted to Class A common stock upon closing of the Business Combination.
Intrinsic value of stock options is calculated as the excess of market price of the Company’s common stock over the strike price of the stock options, multiplied by the number of stock options. The intrinsic value of the Company’s stock options is as follows (in thousands):
| | | | | | | | | | | |
| December 31, |
| 2023 | | 2022 |
| Stock options outstanding | $ | 56,534 | | | $ | 75,888 | |
| Stock options exercisable | $ | 54,944 | | | $ | 68,431 | |
| Stock options vested and expected to vest | $ | 56,502 | | | $ | 75,704 | |
The intrinsic value of stock options exercised for the years ended December 31, 2023 and December 31, 2022 was approximately $14.9 million and $14.8 million, respectively. The intrinsic value of stock options exercised in the year ended December 31, 2021 was insignificant.
The weighted-average grant-date fair value of stock options, the valuation model used to estimate the fair value, and the assumptions input into that model, for awards granted were as follows:
| | | | | | | | | | | | | | | | | |
| Year Ended December 31, |
| 2023 | | 2022 | | 2021 |
| Weighted average grant date fair value per award | $ | 2.20 | | | $ | 3.17 | | | $ | 1.19 | |
| Valuation model used | Black-Scholes | | Black-Scholes | | Black-Scholes |
| Expected award price volatility | 50 | % | | 50 | % | | 35 | % |
| Risk-free rate of return | 3.70 | % | | 4.15 | % | | 1.15 | % |
| Expected life of awards | 5.89 years | | 5.7 years | | 6.1 years |
| Expected rate of dividends | None | | None | | None |
The stock volatility assumption for award-based compensation is based on historical volatilities of the common stock of several public companies with characteristics similar to those of the Company since the Company’s common stock has only been trading in the public market for a short period of time.
The risk-free rate of return represents the implied yield available during the month the award was granted for a U.S. Treasury zero-coupon security issued with a term equal to the expected life of the awards.
The expected life is measured from the grant date and is based on the simplified method calculation.
As of December 31, 2023 there was $6.6 million of total unrecognized compensation expense related to outstanding stock options, which the Company expects to recognize over a weighted average period of approximately 2.1 years. During the years ended December 31, 2023, 2022 and 2021, the fair value of stock options that vested was $3.8 million, $7.9 million, and $6.7 million, respectively.
Restricted Stock Units — The following table presents a summary of RSU activity (in thousands except weighted average data):
| | | | | | | | | | | |
| Number
of
awards | | Weighted Average
Grant-Date Fair Value |
| Outstanding — December 31, 2022 | 4,367 | | 5.58 |
| Granted | 3,567 | | $ | 4.80 | |
| Vested | (2,048) | | $ | 5.55 | |
| Cancelled | (242) | | $ | 5.08 | |
| Outstanding - December 31, 2023 | 5,644 | | $ | 5.12 | |
As of December 31, 2023, the total unrecognized compensation expense related to RSUs is approximately $24.6 million, which is expected to be recognized over a weighted average period of approximately 2.19 years.
Performance Stock Units — The following table presents a summary of PSU activity (in thousands except weighted average data):
| | | | | | | | | | | |
| Number
of
awards | | Weighted Average
Grant-Date Fair Value |
| Outstanding — December 31, 2022 | — | | | $ | — | |
| Granted | 963 | | | $ | 4.76 | |
| Vested | — | | | $ | — | |
| Cancelled | — | | | $ | — | |
| Outstanding - December 31, 2023 | 963 | | | $ | 4.76 | |
The number of units subject to future vesting is based on annual Company achieved factors, such as Revenue growth and Adjusted EBITDA less Capital Expenditures growth. Unvested units are expected to vest at the determination date of March 20, 2024, and expense recognized is adjusted quarterly for expected achievement. In addition to the granted shares in the table above, the Company issued an incremental 1.90 million PSUs that will have an accounting grant date in future periods upon achieved factors being set. PSU achievement is at the discretion of the Compensation Committee of the Board of Directors.
Earn Out Plan — The Getty Images Holdings, Inc. Earn Out Plan (“Earn Out Plan”) provides for the grant of RSUs, which generally vest upon grant. Under the Earn Out Plan, up to 6.0 million shares of Class A common stock are reserved for issuance, of which 1,431,582 shares are available to be issued as of December 31, 2023.
| | | | | | | | | | | | |
| Number | | | |
| of | | Weighted Average | |
| awards | | Grant-Date Fair Value | |
| Outstanding — December 31, 2022 | — | | | $ | — | | |
| Granted | 4,568 | | | $ | 4.72 | | |
| Vested | (4,568) | | | $ | 4.72 | | |
| Cancelled | — | | | $ | — | | |
| Outstanding — December 31, 2023 | — | | | $ | — | | |
| | | | |
As of December 31, 2023, there is no unrecognized compensation expense related to RSUs granted from the Earn Out Plan, as all RSUs were fully vested upon grant.
Employee Stock Purchase Plan —The Getty Images Holdings, Inc. 2022 Employee Stock Purchase Plan (“ESPP”) provides for shares of Class A common stock to be purchased by eligible employees at six months intervals at 85% of the fair market value of the stock on either the first or last trading day of each six months period, whichever is lower. Eligible employees are allowed to contribute up to 10% of their compensation. The Company’s first six months period under the ESPP began on June 01, 2023. Under the ESPP, up to 5.0 million shares of Class A common stock are reserved for issuance, of which all 4.6 million are available to be issued as of December 31, 2023.
18. DEFINED CONTRIBUTION EMPLOYEE BENEFIT PLANS
The Company sponsors defined contribution retirement plans in which the majority of employees are able to participate.
The Company sponsors one defined contribution plan in the U.S., a 401(k) plan, in which all U.S. employees over 18 years of age are auto-enrolled unless they opt-out. The Company matches 100% of participant contributions, up to the first 4% of each participant’s eligible compensation (generally including salary, bonuses and commissions), not to exceed the Internal Revenue Service per person annual limitations. Additionally, the Company sponsors one defined contribution pension plan in the U.K. Employees who contribute a minimum of 3% of their eligible compensation
(generally including salary, bonuses, and commissions), generally receive a Company contribution of 5% of eligible compensation. Lastly, the Company also has a group registered retirement savings plan (RRSP) for employees in Canada. The Company matches dollar-for-dollar up to 3% of base salary. Employee contributions are deducted on a pre- tax basis and they may begin participating after 3 months of service.
The Company’s contributions to these plans and other defined contribution plans worldwide totaled $7.8 million, $7.4 million and $8.3 million for the years ended December 31, 2023, 2022 and 2021, respectively. These contributions were recorded as “Selling, general and administrative expenses” in the Consolidated Statements of Operations.
19. LEASES
The Company’s leases relate primarily to office facilities that expire on various dates from 2023 through 2033, some of which include one or more options to renew. All of the Company’s leases are classified as operating leases. Operating leases are included in “Right of use assets” in the Consolidated Balance Sheets. Current portion of the lease liabilities are included in “Accrued expenses” and non-current portion of lease liabilities are included in “Lease liabilities” in the Consolidated Balance Sheets. Operating lease costs, including insignificant costs related to short-term leases, were $8.9 million, $10.0 million and $11.8 million for the years ended December 31, 2023, 2022 and 2021, respectively.
Additional information related to the Company’s leases as of and for the years ended December 31, 2023 and 2022, are as follows (in thousands, except for the lease term and discount rate):
| | | | | | | | |
| As of December 31, 2023 | As of December 31, 2022 |
| Right of use asset | $ | 41,098 | | $ | 47,231 | |
| | |
| Lease liabilities, current | 9,780 | | 10,094 | |
| Lease liabilities, non-current | 39,858 | | 46,218 | |
| Total lease liabilities | $ | 49,638 | | $ | 56,312 | |
| | |
| Weighted average remaining lease term | 5.9 years | 6.3 years |
| Weighted average discount rate | 5.7 | % | 5.6 | % |
| | |
| Cash paid for amounts included in lease liabilities | $ | 13,391 | | $ | 14,150 | |
| Right of use asset obtained in exchange for lease obligation upon adoption | $ | — | | $ | 53,076 | |
| Right of use asset obtained in exchange for lease obligations | $ | 2,591 | | $ | 6,050 | |
Maturities of lease liabilities as of December 31, 2023 were as follows (in thousands):
| | | | | | | | |
| Year ended December 31, | | |
| 2024 | | $ | 12,377 | |
| 2025 | | 12,941 | |
| 2026 | | 7,416 | |
| 2027 | | 6,289 | |
| 2028 | | 5,382 | |
| Thereafter | | 14,644 | |
| Total undiscounted lease payments | | 59,049 | |
| Less: imputed interest | | (9,411) | |
| Total lease liabilities | | $ | 49,638 | |
Due to hybrid working arrangements, the Company has continued to assess its office needs and subleased several office locations during the year ended December 31, 2023 and 2022. These agreements were considered to be
operating leases. The Company has not been legally released from the primary obligations under the original leases and therefore the Company continues to account for the original lease separately. The Company recorded an ROU asset impairment charge of $314 thousand and $2.6 million for the years ended December 31, 2023 and 2022, respectively, which was the amount by which the carrying value of the lease ROU assets exceeded the fair values. Estimates of the fair values are based on the discounted cash flows of estimated net rental income for the office spaces subleased. The ROU asset impairment charge is included in “Other operating (income) expense - net” on the Consolidated Statement of Operations. Rent income from the sublessees is included in the Consolidated Statement of Operations on a straight-line basis as an offset to rent expense associated with the original operating lease included in “Selling, general and administrative expenses” on the Consolidated Statement of Operations.
20. INCOME TAXES
The components of (loss) income before income taxes are as follows (in thousands):
| | | | | | | | | | | | | | | | | |
| Year Ended December 31, |
| 2023 | | 2022 | | 2021 |
| United States | $ | (67,496) | | | $ | (95,489) | | | $ | 104,984 | |
| Foreign | 40,591 | | | 61,972 | | | 31,142 | |
| (Loss) income before income taxes | $ | (26,905) | | | $ | (33,517) | | | $ | 136,126 | |
The components of income tax expense (benefit) are as follows (in thousands):
| | | | | | | | | | | | | | | | | |
| Year Ended December 31, |
| 2023 | | 2022 | | 2021 |
| Current: | | | | | |
| United States | $ | 26,720 | | | $ | 20,652 | | | $ | 22,321 | |
| Foreign | 1,823 | | | 9,487 | | | (7,756) | |
| Total current income tax expense (benefit) | 28,543 | | | 30,139 | | | 14,565 | |
| Deferred: | | | | | |
| United States | (15,169) | | | 13,356 | | | 4,698 | |
| Foreign | (59,856) | | | 631 | | | (534) | |
| Total deferred income tax expense (benefit) | (75,025) | | | 13,987 | | | 4,164 | |
| Total provision for income tax expense | $ | (46,482) | | | $ | 44,126 | | | $ | 18,729 | |
The items accounting for the difference between income taxes computed at the U.S. federal statutory rate and the effective income tax rate are as follows (in thousands):
| | | | | | | | | | | | | | | | | |
| Year Ended December 31, |
| 2023 | | 2022 | | 2021 |
| Federal income tax expense (benefit) at the statutory rate | $ | (5,651) | | | $ | (7,039) | | | $ | 28,586 | |
| Effect of: | | | | | |
| State taxes, net of federal benefit | (1,736) | | | (3,092) | | | 3,632 | |
| Tax impact of foreign earnings and losses | 11,524 | | | 11,453 | | | (10,171) | |
| Stock-based compensation | 3,633 | | | 2,230 | | | 236 | |
| Nondeductible net loss on fair value adjustment for warrant liabilities | — | | | 34,659 | | | — | |
| Valuation allowance | (49,425) | | | 12,223 | | | 1,532 | |
| Tax credits | (5,284) | | | (6,852) | | | (5,030) | |
| Other, net | 457 | | | 544 | | | (56) | |
| Income tax expense (benefit) | $ | (46,482) | | | $ | 44,126 | | | $ | 18,729 | |
Uncertain Tax Positions —The Company follows the provisions of accounting for uncertainty in income taxes. This guidance clarifies the accounting for uncertainty in income taxes recognized in the consolidated financial statements and prescribes a recognition threshold of more likely than not and a measurement attribute on all tax positions taken or expected to be taken in a tax return for their recognition in the financial statements.
A reconciliation of the beginning and ending amounts of unrecognized tax benefits is as follows (in thousands):
| | | | | | | | | | | | | | | | | |
| Year Ended December 31, |
| 2023 | | 2022 | | 2021 |
| Uncertain tax benefits, beginning of year | $ | 28,967 | | | $ | 33,425 | | | $ | 47,637 | |
| Gross increase to tax positions related to prior years | 338 | | | 31 | | | 121 | |
| Gross decrease to tax positions related to prior years | (36) | | | (1,109) | | | (413) | |
| Gross increase to tax positions related to the current year | 2,036 | | | 675 | | | 2,204 | |
| Gross decrease to tax positions related to the current year | — | | | — | | | — | |
| Settlements | (4,636) | | | — | | | — | |
| Lapse of statute of limitations | (6,514) | | | (4,055) | | | (16,124) | |
| Uncertain tax benefits, end of year | $ | 20,155 | | | $ | 28,967 | | | $ | 33,425 | |
As of December 31, 2023, the Company had $20.2 million of gross unrecognized tax benefits, of which $19.3 million, if fully recognized, would affect our effective tax rate. The timing of resolution for these liabilities is uncertain. The resolution of these items may result in additional or reduced income tax expense. Possible releases of liabilities due to expirations of statutes of limitations will have the effect of decreasing our income tax expense and the effective tax rate, if and when they occur. Although the timing of resolution and/or closure of tax audits cannot be predicted with certainty, the Company believes it is reasonably possible that approximately $6.9 million of its reserves for uncertain tax positions may be released in the next 12 months.
The Company recognizes interest and penalties related to liabilities for uncertain tax positions in income tax expense in the consolidated statements of operations. Interest and penalties were ($3.5) million, ($0.9) million, and ($5.3) million for the years ended December 31, 2023, 2022, and 2021, respectively. The Company has recognized total accrued interest and penalties of approximately $8.9 million, $12.4 million, and $13.3 million as of December 31, 2023, 2022, and 2021, respectively, relating to uncertain tax positions.
The Company conducts business globally and, as a result, the Company and its subsidiaries file income tax returns in the U.S., including various states, and foreign jurisdictions. In the normal course of business, the Company is subject to examination by taxing authorities throughout the world. The tax years 2017 and forward are open for U.S. federal income tax matters. The tax years 2015 and forward are open for U.S. state income tax matters. With few exceptions, foreign tax filings are open for years 2012 and subsequent years. As of December 31, 2023, the Company is currently undergoing audit examinations for tax years 2015 through 2017 by the New York State Department of Taxation, for tax years 2012 through 2016 by the Canada Revenue Agency, for tax years 2015 through 2021 by the Ireland Tax Appeals Commission, and for tax years 2020 and 2021 by the UK HM Revenue and Customs.
Deferred Taxes and Valuation Allowances — The Company follows authoritative guidance for accounting for income taxes, which requires the Company to reduce deferred tax by a valuation allowance if, based on the weight of all available positive and negative evidence, it is more likely than not that some portion or all of the deferred tax assets will not be realized. Based on all available evidence, the Company released a valuation allowance of $65.5 million in Ireland for the year ended December 31, 2023. After consideration of all available evidence for the realizability of U.S. deferred tax assets, the Company provided a valuation allowance of $148.9 million and $126.7 million for the years ended December 31, 2023 and December 31, 2022, respectively. In future periods, the Company will evaluate the positive and negative evidence available at the time in order to support its analysis for a valuation allowance, and as a result the Company may release its valuation allowance in part, or in total, when it becomes more likely than not that the deferred tax assets will be realized.
Deferred tax assets, liabilities and valuation allowance are as follows (in thousands):
| | | | | | | | | | | |
| December 31, |
| 2023 | | 2022 |
| Deferred tax assets | | | |
| Income tax attributes | $ | 242,234 | | | $ | 225,831 | |
| Accrued liabilities and reserves | 18,874 | | | 7,109 | |
| Operating lease liabilities | 9,077 | | | 10,969 | |
| Prepaid expenses | — | | | — | |
| Stock-based compensation expense | 5,893 | | | 6,736 | |
| Other | 855 | | | 1,656 | |
| Gross deferred tax assets | 276,933 | | | 252,301 | |
| Less valuation allowance | (168,185) | | | (216,745) | |
| Total deferred tax assets | 108,748 | | | 35,556 | |
| Deferred tax liabilities | | | |
| Amortization and depreciation | (44,932) | | | (43,556) | |
| Operating lease assets | (7,598) | | | (9,139) | |
| Prepaid expenses | (3,667) | | | (1,569) | |
| Other | (4,731) | | | (10,095) | |
| Net deferred tax liabilities, net of valuation allowance | $ | 47,820 | | | $ | (28,803) | |
The deferred tax assets at December 31, 2023, with respect to net operating loss carryforwards and expiration periods are as follows (in thousands):
| | | | | | | | | | | |
| Deferred
Tax
Assets | | Net Operating
Loss
Carryforwards |
| United States, expiring between 2024 and 2042 | $ | 9,421 | | | $ | 134,888 | |
| Foreign, expiring between 2025 and 2042 | 21,345 | | | 87,079 | |
| Foreign, indefinite | 54,386 | | | 421,200 | |
| Total | $ | 85,152 | | | $ | 643,167 | |
The following is information pertaining to U.S. federal tax credits at December 31, 2023, as well as the expiration periods (in thousands):
| | | | | |
| Tax
Credits |
| United States, federal tax credit carryforwards: | |
| Foreign tax credits, expiring between 2023 and 2033 | $ | 44,307 | |
| Total | $ | 44,307 | |
The components of our net deferred taxes at the reported balance sheet dates are primarily comprised of amounts relating to net operating loss carryforwards, accrued assets and liabilities, and depreciable and amortizable assets.
21. SEGMENT AND GEOGRAPHIC INFORMATION
As of December 31, 2023, 2022 and 2021, the Company identified one operating and reportable segment for purposes of allocating resources and evaluating financial performance. Asset information on a segment basis is not disclosed as this information is not separately identified or internally reported to the Company’s CODM.
Geographic Financial Information
The following represents the Company’s geographic revenue based on customer location (in thousands):
| | | | | | | | | | | | | | | | | |
| December 31, |
| 2023 | | 2022 | | 2021 |
| Americas | $ | 515,374 | | | $ | 525,775 | | | $ | 496,607 | |
| Europe, the Middle East, and Africa | 298,589 | | | 293,673 | | | 317,435 | |
| Asia-Pacific | 102,592 | | | 106,796 | | | 104,646 | |
| Total Revenues | $ | 916,555 | | | $ | 926,244 | | | $ | 918,688 | |
Included in Americas is the United States, which comprises approximately 51.2%, 51.7% and 48.9% of total revenue for the years ended December 31, 2023, 2022 and 2021, respectively. Included in Europe, the Middle East, and Africa is the United Kingdom, which accounts for approximately 11.1%, 10.4% and 11.5% of total revenue for the years ended December 31, 2023, 2022 and 2021, respectively. No other country accounts for more than 10% of the Company’s revenue in any period presented.
The Company’s long-lived tangible assets were located as follows (in thousands):
| | | | | | | | | | | |
| December 31, |
| 2023 | | 2022 |
| Americas | $ | 89,728 | | | $ | 87,819 | |
| Europe, the Middle East, and Africa | 89,164 | | | 83,928 | |
| Asia-Pacific | 487 | | | 336 | |
| Total long-lived tangible assets | $ | 179,379 | | | $ | 172,083 | |
Included in Americas is the United States, which comprises 45.2% and 47.0% of total long-lived tangible assets as of December 31, 2023 and 2022, respectively. Included in Europe, the Middle East, and Africa is Ireland, which comprises 42.8% and 41.7% of total long-lived tangible assets as of December 31, 2023 and 2022, respectively.
22. NET INCOME (LOSS) PER SHARE ATTRIBUTABLE TO COMMON STOCKHOLDERS
The following table sets forth the computation of basic and diluted (loss) income per share of Class A common stock (amounts in thousands, except share and per share amounts):
| | | | | | | | | | | | | | | | | |
| Year end December 31, |
| 2023 | | 2022 | | 2021 |
| NET INCOME (LOSS) | $ | 19,577 | | | $ | (77,643) | | | $ | 117,397 | |
| Less: | | | | | |
| Net income (loss) attributable to noncontrolling interest | 238 | | | (89) | | | 329 | |
| Premium on early redemption of Redeemable Preferred Stock | — | | | 26,678 | | | — | |
| Redeemable Preferred Stock dividend | — | | | 43,218 | | | 71,393 | |
| NET INCOME (LOSS) ATTRIBUTABLE TO GETTY IMAGES HOLDINGS, INC. - Basic | $ | 19,339 | | | $ | (147,450) | | | $ | 45,675 | |
| | | | | |
| Weighted-average Class A common stock outstanding: | | | | | |
| Basic | 399,037,805 | | 276,942,660 | | 196,084,650 |
| Effect of dilutive securities | 12,457,220 | | — | | 5,422,705 |
| Diluted | 411,495,025 | | 276,942,660 | | 201,507,355 |
| Net income (loss) per share of Class A common stock attributable to Getty Images Holdings, Inc. common stockholders: | | | | | |
| Basic | $ | 0.05 | | | $ | (0.53) | | | $ | 0.23 | |
| Diluted | $ | 0.05 | | | $ | (0.53) | | | $ | 0.23 | |
The following are excluded from the computation of diluted net income per share of Class A common stock as their effect would have been anti-dilutive:
| | | | | | | | | | | | | | | | | |
| December 31, |
| 2023 | | 2022 | | 2021 |
| Common stock options | 4,424,674 | | 29,934,987 | | 13,826,565 |
| Restricted stock units | 2,335,684 | | 4,367,413 | | — |
| 6,760,358 | | 34,302,400 | | 13,826,565 |