00018806612023FYFalsehttp://fasb.org/us-gaap/2023#RelatedPartyMemberhttp://fasb.org/us-gaap/2023#RelatedPartyMemberhttp://fasb.org/us-gaap/2023#RelatedPartyMemberhttp://fasb.org/us-gaap/2023#RelatedPartyMemberP2YP1YP1YP3Yhttp://fasb.org/us-gaap/2023#OtherAssetshttp://fasb.org/us-gaap/2023#OtherAssets.3333.2http://fasb.org/us-gaap/2023#OtherLiabilitiesP3Y15400018806612023-01-012023-12-3100018806612023-06-30iso4217:USD0001880661us-gaap:CommonClassAMember2024-02-20xbrli:shares0001880661us-gaap:NonvotingCommonStockMember2024-02-200001880661us-gaap:CommonClassBMember2024-02-200001880661us-gaap:ConsolidatedEntityExcludingVieMember2023-12-310001880661us-gaap:ConsolidatedEntityExcludingVieMember2022-12-3100018806612023-12-3100018806612022-12-310001880661us-gaap:AssetPledgedAsCollateralMember2023-12-310001880661us-gaap:AssetPledgedAsCollateralMember2022-12-310001880661us-gaap:VariableInterestEntityNotPrimaryBeneficiaryMember2023-12-310001880661us-gaap:VariableInterestEntityNotPrimaryBeneficiaryMember2022-12-310001880661us-gaap:CommonClassAMember2022-12-31iso4217:USDxbrli:shares0001880661us-gaap:CommonClassAMember2023-12-310001880661us-gaap:CommonClassBMember2022-12-310001880661us-gaap:CommonClassBMember2023-12-3100018806612022-01-012022-12-3100018806612021-01-012021-12-310001880661us-gaap:ConsolidatedEntityExcludingVieMember2023-01-012023-12-310001880661us-gaap:ConsolidatedEntityExcludingVieMember2022-01-012022-12-310001880661us-gaap:ConsolidatedEntityExcludingVieMember2021-01-012021-12-310001880661us-gaap:VariableInterestEntityPrimaryBeneficiaryMember2023-01-012023-12-310001880661us-gaap:VariableInterestEntityPrimaryBeneficiaryMember2022-01-012022-12-310001880661us-gaap:VariableInterestEntityPrimaryBeneficiaryMember2021-01-012021-12-3100018806612022-01-012022-01-1800018806612022-01-192022-12-310001880661tpg:PartnerCapitalMember2020-12-310001880661us-gaap:CommonStockMemberus-gaap:CommonClassAMember2020-12-310001880661us-gaap:CommonStockMemberus-gaap:CommonClassBMember2020-12-310001880661us-gaap:AdditionalPaidInCapitalMember2020-12-310001880661us-gaap:RetainedEarningsMember2020-12-310001880661us-gaap:AccumulatedOtherComprehensiveIncomeMember2020-12-310001880661us-gaap:ParentMember2020-12-310001880661us-gaap:NoncontrollingInterestMember2020-12-3100018806612020-12-310001880661tpg:PartnerCapitalMember2021-01-012021-12-310001880661us-gaap:NoncontrollingInterestMember2021-01-012021-12-310001880661tpg:PartnerCapitalMember2021-12-310001880661us-gaap:CommonStockMemberus-gaap:CommonClassAMember2021-12-310001880661us-gaap:CommonStockMemberus-gaap:CommonClassBMember2021-12-310001880661us-gaap:AdditionalPaidInCapitalMember2021-12-310001880661us-gaap:RetainedEarningsMember2021-12-310001880661us-gaap:AccumulatedOtherComprehensiveIncomeMember2021-12-310001880661us-gaap:ParentMember2021-12-310001880661us-gaap:NoncontrollingInterestMember2021-12-3100018806612021-12-310001880661tpg:PartnerCapitalMember2022-01-012022-01-180001880661us-gaap:NoncontrollingInterestMember2022-01-012022-01-180001880661tpg:PartnerCapitalMember2022-01-012022-12-310001880661us-gaap:CommonStockMemberus-gaap:CommonClassAMember2022-01-012022-12-310001880661us-gaap:CommonStockMemberus-gaap:CommonClassBMember2022-01-012022-12-310001880661us-gaap:AdditionalPaidInCapitalMember2022-01-012022-12-310001880661us-gaap:RetainedEarningsMember2022-01-012022-12-310001880661us-gaap:ParentMember2022-01-012022-12-310001880661us-gaap:NoncontrollingInterestMember2022-01-012022-12-310001880661us-gaap:CommonStockMemberus-gaap:CommonClassAMemberus-gaap:IPOMember2022-01-012022-12-310001880661us-gaap:IPOMemberus-gaap:AdditionalPaidInCapitalMember2022-01-012022-12-310001880661us-gaap:IPOMemberus-gaap:ParentMember2022-01-012022-12-310001880661us-gaap:IPOMemberus-gaap:NoncontrollingInterestMember2022-01-012022-12-310001880661us-gaap:IPOMember2022-01-012022-12-310001880661us-gaap:NoncontrollingInterestMember2022-01-192022-12-310001880661us-gaap:CommonStockMemberus-gaap:CommonClassAMemberus-gaap:OverAllotmentOptionMember2022-01-012022-12-310001880661us-gaap:AdditionalPaidInCapitalMemberus-gaap:OverAllotmentOptionMember2022-01-012022-12-310001880661us-gaap:ParentMemberus-gaap:OverAllotmentOptionMember2022-01-012022-12-310001880661us-gaap:OverAllotmentOptionMember2022-01-012022-12-310001880661us-gaap:AdditionalPaidInCapitalMember2022-01-012022-01-180001880661us-gaap:ParentMember2022-01-012022-01-180001880661us-gaap:RetainedEarningsMember2022-01-192022-12-310001880661us-gaap:ParentMember2022-01-192022-12-310001880661us-gaap:AdditionalPaidInCapitalMember2022-01-192022-12-310001880661us-gaap:CommonStockMemberus-gaap:CommonClassAMember2022-12-310001880661us-gaap:CommonStockMemberus-gaap:CommonClassBMember2022-12-310001880661us-gaap:AdditionalPaidInCapitalMember2022-12-310001880661us-gaap:RetainedEarningsMember2022-12-310001880661us-gaap:AccumulatedOtherComprehensiveIncomeMember2022-12-310001880661us-gaap:ParentMember2022-12-310001880661us-gaap:NoncontrollingInterestMember2022-12-310001880661us-gaap:RetainedEarningsMember2023-01-012023-12-310001880661us-gaap:ParentMember2023-01-012023-12-310001880661us-gaap:NoncontrollingInterestMember2023-01-012023-12-310001880661us-gaap:AdditionalPaidInCapitalMember2023-01-012023-12-310001880661us-gaap:CommonStockMemberus-gaap:CommonClassAMember2023-01-012023-12-310001880661us-gaap:CommonStockMemberus-gaap:CommonClassBMember2023-01-012023-12-310001880661us-gaap:CommonStockMemberus-gaap:CommonClassAMember2023-12-310001880661us-gaap:CommonStockMemberus-gaap:CommonClassBMember2023-12-310001880661us-gaap:AdditionalPaidInCapitalMember2023-12-310001880661us-gaap:RetainedEarningsMember2023-12-310001880661us-gaap:ParentMember2023-12-310001880661us-gaap:NoncontrollingInterestMember2023-12-310001880661us-gaap:VariableInterestEntityNotPrimaryBeneficiaryMember2023-01-012023-12-310001880661us-gaap:VariableInterestEntityNotPrimaryBeneficiaryMember2022-01-012022-12-310001880661us-gaap:VariableInterestEntityNotPrimaryBeneficiaryMember2021-01-012021-12-310001880661us-gaap:IPOMember2022-01-122022-01-120001880661us-gaap:IPOMember2022-01-120001880661tpg:NonControllingInterestHolderOfTPGOperatingGroupMemberus-gaap:IPOMember2022-01-122022-01-120001880661us-gaap:CommonClassAMemberus-gaap:IPOMember2022-01-122022-01-120001880661us-gaap:NonvotingCommonStockMemberus-gaap:IPOMember2022-01-122022-01-120001880661us-gaap:CommonClassAMemberus-gaap:OverAllotmentOptionMember2022-02-092022-02-090001880661us-gaap:CommonClassAMembertpg:NonControllingInterestHolderOfTPGOperatingGroupMemberus-gaap:OverAllotmentOptionMember2022-02-092022-02-090001880661us-gaap:OverAllotmentOptionMember2022-02-092022-02-090001880661us-gaap:CommonClassAMemberus-gaap:OverAllotmentOptionMember2022-02-090001880661us-gaap:NonvotingCommonStockMemberus-gaap:OverAllotmentOptionMember2022-02-090001880661tpg:TPGOperatingGroupMember2023-12-31xbrli:pure0001880661tpg:ManagementFeesMember2023-01-012023-12-310001880661tpg:ManagementFeesMember2022-01-012022-12-310001880661tpg:ManagementFeesMember2021-01-012021-12-310001880661tpg:MonitoringFeesMember2023-01-012023-12-310001880661tpg:MonitoringFeesMember2022-01-012022-12-310001880661tpg:MonitoringFeesMember2021-01-012021-12-310001880661tpg:TransactionFeesMember2023-01-012023-12-310001880661tpg:TransactionFeesMember2022-01-012022-12-310001880661tpg:TransactionFeesMember2021-01-012021-12-310001880661tpg:IncentiveFeesMember2023-01-012023-12-310001880661tpg:IncentiveFeesMember2022-01-012022-12-310001880661tpg:IncentiveFeesMember2021-01-012021-12-310001880661tpg:ExpenseReimbursementsAndOtherMember2023-01-012023-12-310001880661tpg:ExpenseReimbursementsAndOtherMember2022-01-012022-12-310001880661tpg:ExpenseReimbursementsAndOtherMember2021-01-012021-12-310001880661tpg:CommittedCapitalMembersrt:MinimumMember2023-12-310001880661tpg:CommittedCapitalMembersrt:MaximumMember2023-12-310001880661srt:MinimumMembertpg:ActivelyInvestedCapitalMember2023-12-310001880661srt:MaximumMembertpg:ActivelyInvestedCapitalMember2023-12-310001880661tpg:NetFundedCapitalCommitmentsMembersrt:MinimumMember2023-12-310001880661tpg:NetFundedCapitalCommitmentsMembersrt:MaximumMember2023-12-310001880661tpg:CostOfInvestmentsMembersrt:MinimumMember2023-12-310001880661tpg:CostOfInvestmentsMembersrt:MaximumMember2023-12-310001880661srt:MinimumMembertpg:NetAssetValueMember2023-12-310001880661srt:MaximumMembertpg:NetAssetValueMember2023-12-310001880661tpg:YTPGMember2023-12-310001880661us-gaap:CommonClassAMembertpg:YTPGMember2023-04-170001880661tpg:AFTRMember2023-12-310001880661tpg:AFTRMemberus-gaap:CommonClassAMember2023-08-160001880661srt:MinimumMember2023-12-310001880661srt:MaximumMember2023-12-310001880661tpg:FurnitureFixturesEquipmentAndComputerEquipmentMembersrt:MinimumMember2023-12-310001880661srt:MaximumMembertpg:FurnitureFixturesEquipmentAndComputerEquipmentMember2023-12-310001880661tpg:AngeloGordonCoLPAgFundsLPAndAGPartnersLPMember2023-11-012023-11-010001880661tpg:VestedCommonUnitMembertpg:AngeloGordonCoLPAgFundsLPAndAGPartnersLPMembertpg:CommonUnitsMember2023-11-012023-11-010001880661tpg:UnvestedCommonUnitMembertpg:AngeloGordonCoLPAgFundsLPAndAGPartnersLPMembertpg:CommonUnitsMember2023-11-012023-11-01tpg:installment0001880661tpg:AngeloGordonCoLPAgFundsLPAndAGPartnersLPMembertpg:AggregateAnnualCashHoldbackAmountMember2023-11-010001880661tpg:AngeloGordonCoLPAgFundsLPAndAGPartnersLPMembertpg:EarnoutPaymentMember2023-11-010001880661tpg:AngeloGordonCoLPAgFundsLPAndAGPartnersLPMember2023-11-010001880661tpg:AngeloGordonCoLPAgFundsLPAndAGPartnersLPMembersrt:AffiliatedEntityMember2023-11-010001880661tpg:VestedCommonUnitMembertpg:AngeloGordonCoLPAgFundsLPAndAGPartnersLPMember2023-11-012023-11-010001880661tpg:AngeloGordonCoLPAgFundsLPAndAGPartnersLPMembertpg:AcquisitionCommonUnitsMember2023-11-012023-11-010001880661tpg:AngeloGordonCoLPAgFundsLPAndAGPartnersLPMemberus-gaap:RestrictedStockUnitsRSUMember2023-11-012023-11-010001880661tpg:InvestmentManagementAgreementsMembertpg:ValuationTechniqueMultiPeriodExcessEarningsMethodMembertpg:AngeloGordonCoLPAgFundsLPAndAGPartnersLPMember2023-11-012023-11-010001880661tpg:InvestmentManagementAgreementsMembertpg:ValuationTechniqueMultiPeriodExcessEarningsMethodMembertpg:AngeloGordonCoLPAgFundsLPAndAGPartnersLPMembersrt:MinimumMember2023-11-012023-11-010001880661tpg:InvestmentManagementAgreementsMembertpg:ValuationTechniqueMultiPeriodExcessEarningsMethodMembersrt:MaximumMembertpg:AngeloGordonCoLPAgFundsLPAndAGPartnersLPMember2023-11-012023-11-010001880661tpg:AngeloGordonCoLPAgFundsLPAndAGPartnersLPMemberus-gaap:ValuationTechniqueDiscountedCashFlowMembertpg:AcquiredCarriedInterestMember2023-11-012023-11-010001880661tpg:ValuationTechniqueReplacementCostAnalysisAndReliefFromRoyaltyAnalysisMembertpg:AngeloGordonCoLPAgFundsLPAndAGPartnersLPMemberus-gaap:TechnologyBasedIntangibleAssetsMember2023-11-012023-11-010001880661us-gaap:TradeNamesMembertpg:AngeloGordonCoLPAgFundsLPAndAGPartnersLPMembertpg:ValuationTechniqueReliefFromRoyaltyMethodMember2023-11-012023-11-010001880661tpg:AngeloGordonCoLPAgFundsLPAndAGPartnersLPMember2023-01-012023-12-310001880661tpg:AngeloGordonCoLPAgFundsLPAndAGPartnersLPMember2022-01-012022-12-310001880661tpg:NewQuestHoldingsCaymanLimitedMember2022-01-310001880661tpg:NewQuestHoldingsCaymanLimitedMemberus-gaap:CommonClassAMember2022-01-012022-01-310001880661tpg:NewQuestHoldingsCaymanLimitedMembertpg:CommonUnitsMember2022-01-012022-01-310001880661tpg:NewQuestHoldingsCaymanLimitedMember2022-01-012022-01-310001880661tpg:PerformanceAllocationsMember2023-12-310001880661tpg:PerformanceAllocationsMember2022-12-310001880661us-gaap:VariableInterestEntityPrimaryBeneficiaryMember2023-12-310001880661us-gaap:VariableInterestEntityPrimaryBeneficiaryMember2022-12-310001880661tpg:CapitalInterestsMember2023-12-310001880661tpg:CapitalInterestsMember2022-12-310001880661tpg:OtherEquityMethodInvestmentsMember2023-12-310001880661tpg:OtherEquityMethodInvestmentsMember2022-12-3100018806612021-09-012021-09-300001880661tpg:NewQuestHoldingsCaymanLimitedMember2021-01-012021-12-310001880661tpg:TPGSMember2021-12-012021-12-310001880661tpg:NerdyIncMember2023-12-310001880661us-gaap:CommonClassAMembertpg:NerdyIncMember2023-12-310001880661us-gaap:FairValueMeasurementsRecurringMember2023-12-310001880661tpg:NerdyIncMemberus-gaap:WarrantMember2023-09-012023-09-300001880661us-gaap:CommonClassAMembertpg:NerdyIncMember2023-09-012023-09-300001880661tpg:ClassAEarnoutSharesMembertpg:NerdyIncMember2023-12-310001880661tpg:NerdyIncMember2022-12-310001880661us-gaap:CommonClassAMembertpg:NerdyIncMember2022-12-310001880661tpg:ClassAEarnoutSharesMembertpg:NerdyIncMember2022-12-310001880661tpg:NerdyIncMemberus-gaap:WarrantMember2022-12-310001880661us-gaap:FairValueMeasurementsRecurringMember2022-12-310001880661tpg:TPGSMember2021-12-012021-12-310001880661tpg:TPGFundsAndPublicSPACsMember2022-12-310001880661tpg:TPGFundsAndPublicSPACsMember2023-12-310001880661tpg:TPGFundsAndPublicSPACsMember2023-12-310001880661tpg:TPGFundsAndPublicSPACsMember2022-12-310001880661tpg:TPGFundsAndPublicSPACsMember2021-12-310001880661tpg:TPGFundsAndPublicSPACsMember2023-01-012023-12-310001880661tpg:TPGFundsAndPublicSPACsMember2022-01-012022-12-310001880661tpg:TPGFundsAndPublicSPACsMember2021-01-012021-12-310001880661tpg:TPGFundsAndPublicSPACsMember2021-01-012021-12-310001880661tpg:ForeignPrivateAgreementsMember2023-12-310001880661tpg:ForeignPrivateAgreementsMember2022-12-310001880661us-gaap:WarrantMember2023-12-310001880661us-gaap:WarrantMember2022-12-310001880661us-gaap:SwapMemberus-gaap:VariableInterestEntityPrimaryBeneficiaryMember2023-01-012023-12-310001880661us-gaap:SwapMemberus-gaap:VariableInterestEntityPrimaryBeneficiaryMember2022-01-012022-12-310001880661us-gaap:SwapMemberus-gaap:VariableInterestEntityPrimaryBeneficiaryMember2021-01-012021-12-310001880661us-gaap:ForeignExchangeContractMemberus-gaap:VariableInterestEntityPrimaryBeneficiaryMember2023-01-012023-12-310001880661us-gaap:ForeignExchangeContractMemberus-gaap:VariableInterestEntityPrimaryBeneficiaryMember2022-01-012022-12-310001880661us-gaap:ForeignExchangeContractMemberus-gaap:VariableInterestEntityPrimaryBeneficiaryMember2021-01-012021-12-310001880661tpg:PublicWarrantsMemberus-gaap:VariableInterestEntityNotPrimaryBeneficiaryMember2023-01-012023-12-310001880661tpg:PublicWarrantsMemberus-gaap:VariableInterestEntityNotPrimaryBeneficiaryMember2022-01-012022-12-310001880661tpg:PublicWarrantsMemberus-gaap:VariableInterestEntityNotPrimaryBeneficiaryMember2021-01-012021-12-310001880661us-gaap:VariableInterestEntityNotPrimaryBeneficiaryMemberus-gaap:ForwardContractsMember2023-01-012023-12-310001880661us-gaap:VariableInterestEntityNotPrimaryBeneficiaryMemberus-gaap:ForwardContractsMember2022-01-012022-12-310001880661us-gaap:VariableInterestEntityNotPrimaryBeneficiaryMemberus-gaap:ForwardContractsMember2021-01-012021-12-310001880661us-gaap:FairValueInputsLevel1Memberus-gaap:FairValueMeasurementsRecurringMember2023-12-310001880661us-gaap:FairValueInputsLevel2Memberus-gaap:FairValueMeasurementsRecurringMember2023-12-310001880661us-gaap:FairValueInputsLevel3Memberus-gaap:FairValueMeasurementsRecurringMember2023-12-310001880661tpg:AggregateAnnualCashHoldbackAmountMemberus-gaap:FairValueInputsLevel1Memberus-gaap:FairValueMeasurementsRecurringMember2023-12-310001880661tpg:AggregateAnnualCashHoldbackAmountMemberus-gaap:FairValueInputsLevel2Memberus-gaap:FairValueMeasurementsRecurringMember2023-12-310001880661tpg:AggregateAnnualCashHoldbackAmountMemberus-gaap:FairValueInputsLevel3Memberus-gaap:FairValueMeasurementsRecurringMember2023-12-310001880661tpg:AggregateAnnualCashHoldbackAmountMemberus-gaap:FairValueMeasurementsRecurringMember2023-12-310001880661tpg:EarnoutPaymentMemberus-gaap:FairValueInputsLevel1Memberus-gaap:FairValueMeasurementsRecurringMember2023-12-310001880661tpg:EarnoutPaymentMemberus-gaap:FairValueInputsLevel2Memberus-gaap:FairValueMeasurementsRecurringMember2023-12-310001880661tpg:EarnoutPaymentMemberus-gaap:FairValueInputsLevel3Memberus-gaap:FairValueMeasurementsRecurringMember2023-12-310001880661tpg:EarnoutPaymentMemberus-gaap:FairValueMeasurementsRecurringMember2023-12-310001880661us-gaap:FairValueInputsLevel1Memberus-gaap:FairValueMeasurementsRecurringMember2022-12-310001880661us-gaap:FairValueInputsLevel2Memberus-gaap:FairValueMeasurementsRecurringMember2022-12-310001880661us-gaap:FairValueInputsLevel3Memberus-gaap:FairValueMeasurementsRecurringMember2022-12-310001880661us-gaap:FairValueInputsLevel1Memberus-gaap:WarrantMemberus-gaap:FairValueMeasurementsRecurringMember2022-12-310001880661us-gaap:FairValueInputsLevel2Memberus-gaap:WarrantMemberus-gaap:FairValueMeasurementsRecurringMember2022-12-310001880661us-gaap:FairValueInputsLevel3Memberus-gaap:WarrantMemberus-gaap:FairValueMeasurementsRecurringMember2022-12-310001880661us-gaap:WarrantMemberus-gaap:FairValueMeasurementsRecurringMember2022-12-310001880661tpg:FinancialLiabilityMember2022-12-310001880661tpg:FinancialLiabilityMember2021-12-310001880661tpg:FinancialLiabilityMember2023-01-012023-12-310001880661tpg:FinancialLiabilityMember2022-01-012022-12-310001880661tpg:FinancialLiabilityMember2023-12-310001880661us-gaap:DerivativeFinancialInstrumentsLiabilitiesMember2022-12-310001880661us-gaap:DerivativeFinancialInstrumentsLiabilitiesMember2021-12-310001880661us-gaap:DerivativeFinancialInstrumentsLiabilitiesMember2023-01-012023-12-310001880661us-gaap:DerivativeFinancialInstrumentsLiabilitiesMember2022-01-012022-12-310001880661us-gaap:DerivativeFinancialInstrumentsLiabilitiesMember2023-12-310001880661us-gaap:MarketApproachValuationTechniqueMembertpg:AggregateAnnualCashHoldbackAmountMemberus-gaap:FairValueInputsLevel3Member2023-12-310001880661us-gaap:MarketApproachValuationTechniqueMembertpg:AggregateAnnualCashHoldbackAmountMembersrt:WeightedAverageMemberus-gaap:FairValueInputsLevel3Memberus-gaap:MeasurementInputDiscountRateMember2023-12-310001880661us-gaap:MarketApproachValuationTechniqueMembertpg:EarnoutPaymentMemberus-gaap:FairValueInputsLevel3Member2023-12-310001880661us-gaap:MeasurementInputPriceVolatilityMemberus-gaap:MarketApproachValuationTechniqueMembertpg:EarnoutPaymentMembersrt:WeightedAverageMemberus-gaap:FairValueInputsLevel3Member2023-12-310001880661us-gaap:FairValueInputsLevel3Member2023-12-310001880661tpg:ContractualPerformanceFeeAllocationsMember2023-12-310001880661tpg:ContractualPerformanceFeeAllocationsMember2022-12-310001880661tpg:ManagementContractsMember2023-12-310001880661tpg:ManagementContractsMember2022-12-310001880661us-gaap:TechnologyBasedIntangibleAssetsMember2023-12-310001880661us-gaap:TechnologyBasedIntangibleAssetsMember2022-12-310001880661tpg:InvestorRelationshipsMember2023-12-310001880661tpg:InvestorRelationshipsMember2022-12-310001880661us-gaap:TradeNamesMember2023-12-310001880661us-gaap:TradeNamesMember2022-12-310001880661us-gaap:OtherIntangibleAssetsMember2023-12-310001880661us-gaap:OtherIntangibleAssetsMember2023-12-310001880661us-gaap:OtherIntangibleAssetsMember2022-12-310001880661us-gaap:OtherIntangibleAssetsMember2022-12-310001880661tpg:AngeloGordonCoLPAgFundsLPAndAGPartnersLPMember2023-12-310001880661us-gaap:OtherIntangibleAssetsMember2022-12-310001880661us-gaap:OtherIntangibleAssetsMember2023-12-310001880661us-gaap:LeaseholdImprovementsMember2023-12-310001880661us-gaap:LeaseholdImprovementsMember2022-12-310001880661us-gaap:ComputerEquipmentMember2023-12-310001880661us-gaap:ComputerEquipmentMember2022-12-310001880661us-gaap:FurnitureAndFixturesMember2023-12-310001880661us-gaap:FurnitureAndFixturesMember2022-12-310001880661us-gaap:PropertyPlantAndEquipmentOtherTypesMember2023-12-310001880661us-gaap:PropertyPlantAndEquipmentOtherTypesMember2022-12-310001880661tpg:NorthwoodsEuropeanManagementLLCMembertpg:NearwaterMemberus-gaap:RepurchaseAgreementsMember2023-12-31iso4217:EUR0001880661tpg:CitibankNAMembertpg:NorthwoodsEuropeanManagementLLCMemberus-gaap:RepurchaseAgreementsMember2023-12-310001880661us-gaap:VariableInterestEntityNotPrimaryBeneficiaryMemberus-gaap:NonrelatedPartyMember2023-12-310001880661us-gaap:VariableInterestEntityNotPrimaryBeneficiaryMemberus-gaap:NonrelatedPartyMember2022-12-310001880661us-gaap:RelatedPartyMemberus-gaap:VariableInterestEntityNotPrimaryBeneficiaryMember2023-12-310001880661us-gaap:RelatedPartyMemberus-gaap:VariableInterestEntityNotPrimaryBeneficiaryMember2022-12-310001880661us-gaap:VariableInterestEntityNotPrimaryBeneficiaryMembersrt:MinimumMembertpg:RemainCoMember2023-01-012023-12-310001880661srt:MaximumMemberus-gaap:VariableInterestEntityNotPrimaryBeneficiaryMembertpg:RemainCoMember2023-01-012023-12-310001880661us-gaap:VariableInterestEntityNotPrimaryBeneficiaryMembertpg:RemainCoMember2022-01-012022-12-310001880661us-gaap:VariableInterestEntityNotPrimaryBeneficiaryMembertpg:RemainCoMember2023-01-012023-12-310001880661us-gaap:VariableInterestEntityNotPrimaryBeneficiaryMembersrt:ScenarioForecastMembertpg:RemainCoMember2024-01-012024-12-310001880661srt:AffiliatedEntityMembertpg:AnnualAdministrationMember2023-01-012023-12-310001880661us-gaap:SecuredDebtMembertpg:TrancheAMember2018-12-310001880661us-gaap:SecuredDebtMembertpg:TrancheBMember2019-12-310001880661us-gaap:SecuredDebtMembertpg:SecuredNotesMember2023-12-310001880661us-gaap:SecuredDebtMembertpg:SecuredNotesMember2022-12-310001880661us-gaap:VariableInterestEntityNotPrimaryBeneficiaryMemberus-gaap:SecuredDebtMember2023-12-310001880661us-gaap:VariableInterestEntityNotPrimaryBeneficiaryMemberus-gaap:SecuredDebtMember2022-12-310001880661us-gaap:LineOfCreditMembertpg:SeniorUnsecuredRevolvingCreditFacilityMember2023-12-310001880661us-gaap:LineOfCreditMembertpg:SeniorUnsecuredRevolvingCreditFacilityMember2022-12-310001880661tpg:SeniorUnsecuredTermLoanAgreementMemberus-gaap:LineOfCreditMember2023-12-310001880661tpg:SeniorUnsecuredTermLoanAgreementMemberus-gaap:LineOfCreditMember2022-12-310001880661us-gaap:SecuredDebtMembertpg:SecuredBorrowingsTrancheAMember2023-12-310001880661us-gaap:SecuredDebtMembertpg:SecuredBorrowingsTrancheAMember2022-12-310001880661tpg:SecuredBorrowingsTrancheBMemberus-gaap:SecuredDebtMember2023-12-310001880661tpg:SecuredBorrowingsTrancheBMemberus-gaap:SecuredDebtMember2022-12-310001880661us-gaap:LineOfCreditMembertpg:A364DayRevolvingCreditFacilityMember2023-12-310001880661us-gaap:LineOfCreditMembertpg:A364DayRevolvingCreditFacilityMember2022-12-310001880661us-gaap:LineOfCreditMembertpg:SubordinatedCreditFacilityMember2023-12-310001880661us-gaap:LineOfCreditMembertpg:SubordinatedCreditFacilityMember2022-12-310001880661us-gaap:LineOfCreditMember2023-12-310001880661us-gaap:SecuredDebtMember2023-12-310001880661us-gaap:SecuredDebtMember2022-12-310001880661us-gaap:RevolvingCreditFacilityMemberus-gaap:LineOfCreditMembertpg:SeniorUnsecuredRevolvingCreditFacilityMember2023-12-310001880661srt:MaximumMemberus-gaap:RevolvingCreditFacilityMemberus-gaap:LineOfCreditMembertpg:SeniorUnsecuredRevolvingCreditFacilityMemberus-gaap:BaseRateMember2023-09-012023-09-300001880661srt:MaximumMemberus-gaap:RevolvingCreditFacilityMemberus-gaap:LineOfCreditMembertpg:SeniorUnsecuredRevolvingCreditFacilityMembertpg:SecuredOvernightFinancingRateSOFRMember2023-09-012023-09-300001880661us-gaap:LineOfCreditMembertpg:SeniorUnsecuredRevolvingCreditFacilityMembertpg:FundCashConsiderationOfAcquisitionMember2023-01-012023-12-310001880661tpg:WorkingCapitalPurposesMemberus-gaap:LineOfCreditMembertpg:SeniorUnsecuredRevolvingCreditFacilityMember2023-01-012023-12-310001880661tpg:SeniorUnsecuredTermLoanAgreementMemberus-gaap:LineOfCreditMembertpg:SecuredOvernightFinancingRateSOFRMembertpg:TermLoansMember2023-01-012023-12-310001880661tpg:SeniorUnsecuredTermLoanAgreementMembertpg:SecuredOvernightFinancingRateSOFRMembertpg:TermLoansMember2023-01-012023-12-31tpg:tranche0001880661us-gaap:LineOfCreditMembertpg:A364DayRevolvingCreditFacilityMember2023-04-142023-04-140001880661us-gaap:LineOfCreditMembertpg:A364DayRevolvingCreditFacilityMember2023-04-140001880661us-gaap:LineOfCreditMembertpg:FederalFundsRateMember2023-01-012023-12-310001880661us-gaap:LineOfCreditMembertpg:SecuredOvernightFinancingRateSOFRMember2023-01-012023-12-310001880661us-gaap:LineOfCreditMemberus-gaap:BaseRateMembersrt:MinimumMember2023-01-012023-12-310001880661srt:MaximumMemberus-gaap:LineOfCreditMemberus-gaap:BaseRateMember2023-01-012023-12-310001880661us-gaap:LineOfCreditMembertpg:RiskFreeRateMembersrt:MinimumMember2023-01-012023-12-310001880661srt:MaximumMemberus-gaap:LineOfCreditMembertpg:RiskFreeRateMember2023-01-012023-12-310001880661us-gaap:LineOfCreditMembersrt:MinimumMembertpg:SterlingOvernightIndexAverageMember2023-01-012023-12-310001880661srt:MaximumMemberus-gaap:LineOfCreditMembertpg:SterlingOvernightIndexAverageMember2023-01-012023-12-310001880661us-gaap:LineOfCreditMember2023-01-012023-12-310001880661us-gaap:RevolvingCreditFacilityMembertpg:SubordinatedCreditFacilityMemberus-gaap:SubordinatedDebtMember2014-08-012014-08-31tpg:creditFacility0001880661us-gaap:RevolvingCreditFacilityMembertpg:SubordinatedCreditFacilityOneMemberus-gaap:SubordinatedDebtMember2014-08-310001880661us-gaap:RevolvingCreditFacilityMembertpg:SubordinatedCreditFacilityTwoMemberus-gaap:SubordinatedDebtMember2014-08-310001880661us-gaap:RevolvingCreditFacilityMembertpg:SubordinatedCreditFacilityMemberus-gaap:SubordinatedDebtMember2014-08-310001880661us-gaap:RevolvingCreditFacilityMembertpg:SecuredOvernightFinancingRateSOFRMembertpg:SubordinatedCreditFacilityMemberus-gaap:SubordinatedDebtMember2023-01-012023-12-310001880661us-gaap:RevolvingCreditFacilityMembertpg:SubordinatedCreditFacilityMemberus-gaap:SubordinatedDebtMember2023-01-012023-12-310001880661us-gaap:EstimateOfFairValueFairValueDisclosureMemberus-gaap:UnsecuredDebtMember2023-12-310001880661us-gaap:EstimateOfFairValueFairValueDisclosureMemberus-gaap:UnsecuredDebtMember2022-12-310001880661us-gaap:SecuredDebtMemberus-gaap:EstimateOfFairValueFairValueDisclosureMember2023-12-310001880661us-gaap:SecuredDebtMemberus-gaap:EstimateOfFairValueFairValueDisclosureMember2022-12-310001880661us-gaap:SecuredDebtMemberus-gaap:CarryingReportedAmountFairValueDisclosureMember2023-12-310001880661us-gaap:SecuredDebtMemberus-gaap:CarryingReportedAmountFairValueDisclosureMember2022-12-310001880661us-gaap:LineOfCreditMembertpg:SeniorUnsecuredRevolvingCreditFacilityMemberus-gaap:SubsequentEventMember2024-01-012024-01-310001880661us-gaap:DomesticCountryMember2023-01-012023-12-310001880661us-gaap:DomesticCountryMember2022-01-012022-12-310001880661us-gaap:DomesticCountryMember2021-01-012021-12-310001880661us-gaap:ForeignCountryMember2023-01-012023-12-310001880661us-gaap:ForeignCountryMember2022-01-012022-12-310001880661us-gaap:ForeignCountryMember2021-01-012021-12-310001880661us-gaap:ForeignCountryMember2023-12-310001880661tpg:PortfolioCompaniesMembersrt:AffiliatedEntityMember2023-12-310001880661tpg:PortfolioCompaniesMembersrt:AffiliatedEntityMember2022-12-310001880661tpg:PartnersAndEmployeesMembersrt:AffiliatedEntityMember2023-12-310001880661tpg:PartnersAndEmployeesMembersrt:AffiliatedEntityMember2022-12-310001880661tpg:OtherRelatedEntitiesMembersrt:AffiliatedEntityMember2023-12-310001880661tpg:OtherRelatedEntitiesMembersrt:AffiliatedEntityMember2022-12-310001880661tpg:UnconsolidatedVIEsMembersrt:AffiliatedEntityMember2023-12-310001880661tpg:UnconsolidatedVIEsMembersrt:AffiliatedEntityMember2022-12-310001880661srt:AffiliatedEntityMember2023-12-310001880661srt:AffiliatedEntityMember2022-12-310001880661us-gaap:RelatedPartyMembertpg:RelatedPartyInvestmentsMember2023-01-012023-12-310001880661us-gaap:RelatedPartyMembertpg:RelatedPartyInvestmentsMember2022-01-012022-12-310001880661us-gaap:RelatedPartyMemberus-gaap:NotesReceivableMember2023-12-310001880661us-gaap:RelatedPartyMemberus-gaap:NotesReceivableMember2022-12-3100018806612022-01-012022-01-310001880661us-gaap:RelatedPartyMembertpg:AnnualAdministrationMember2023-01-012023-12-310001880661us-gaap:RelatedPartyMembertpg:AnnualAdministrationMember2022-01-012022-12-310001880661us-gaap:RelatedPartyMembertpg:OtherRelatedPartyTransactionsMember2023-01-012023-12-310001880661us-gaap:RelatedPartyMembertpg:OtherRelatedPartyTransactionsMember2022-01-012022-12-310001880661us-gaap:RelatedPartyMembertpg:OtherRelatedPartyTransactionsMember2021-01-012021-12-310001880661tpg:UnitsMembertpg:AFTRMemberus-gaap:IPOMember2021-08-012021-08-310001880661tpg:UnitsMembertpg:AFTRMemberus-gaap:IPOMember2021-08-310001880661tpg:AFTRMemberus-gaap:CommonClassAMember2021-08-310001880661tpg:AFTRMemberus-gaap:IPOMember2021-08-310001880661tpg:AFTRMemberus-gaap:SeriesAPreferredStockMember2023-08-160001880661tpg:UnitsMemberus-gaap:IPOMembertpg:YTPGMember2021-04-012021-04-300001880661tpg:UnitsMemberus-gaap:IPOMembertpg:YTPGMember2021-04-300001880661us-gaap:CommonClassAMembertpg:YTPGMember2021-04-300001880661us-gaap:IPOMembertpg:YTPGMember2021-04-300001880661us-gaap:SeriesAPreferredStockMembertpg:YTPGMember2023-04-170001880661tpg:UnitsMemberus-gaap:IPOMembertpg:TPGYMember2020-10-012020-10-310001880661tpg:UnitsMemberus-gaap:IPOMembertpg:TPGYMember2020-10-310001880661us-gaap:CommonClassAMembertpg:TPGYMember2020-10-310001880661us-gaap:IPOMembertpg:TPGYMember2020-10-310001880661tpg:TPGYMemberus-gaap:SeriesAPreferredStockMember2022-10-110001880661us-gaap:IPOMembertpg:PublicSPACsMember2021-01-012021-12-310001880661us-gaap:IPOMembertpg:PublicSPACsMember2023-01-012023-12-310001880661us-gaap:IPOMembertpg:PublicSPACsMember2022-01-012022-12-310001880661tpg:AFTRMemberus-gaap:WarrantMember2021-08-310001880661tpg:TPGYMemberus-gaap:WarrantMember2020-10-310001880661tpg:April2024Member2023-12-310001880661tpg:August2025Member2023-12-310001880661tpg:March2026Member2023-12-310001880661tpg:June2026Member2023-12-310001880661tpg:December2026Member2023-12-310001880661tpg:September2028Member2023-12-310001880661tpg:June2030Member2023-12-310001880661tpg:HellasInvestmentMember2023-01-012023-12-31tpg:partnertpg:individual0001880661tpg:HellasInvestmentMembertpg:TPGAndApaxRelatedPartiesMember2018-02-012018-02-280001880661tpg:TPGMembertpg:HellasInvestmentMember2018-02-012018-02-280001880661tpg:HellasInvestmentMemberstpr:NY2023-12-31tpg:cases00018806612022-01-1300018806612023-01-062023-01-0600018806612023-01-060001880661us-gaap:RestrictedStockUnitsRSUMember2022-02-092022-02-090001880661tpg:AngeloGordonCoLPAgFundsLPAndAGPartnersLPMembertpg:RestrictedStockUnitsAcquisitionServiceAwardsMember2023-11-012023-11-010001880661tpg:AngeloGordonCoLPAgFundsLPAndAGPartnersLPMembertpg:RestrictedStockUnitsAcquisitionServiceAwardsMember2023-12-310001880661tpg:RestrictedStockUnitsIPOServiceAwardsMember2023-12-310001880661tpg:RestrictedStockUnitsIPOServiceAwardsMember2023-01-012023-12-310001880661tpg:RestrictedStockUnitsIPOServiceAwardsMember2022-01-012022-12-310001880661tpg:RestrictedStockUnitsIPOMarketConditionAwardsMember2023-12-310001880661tpg:RestrictedStockUnitsIPOMarketConditionAwardsMember2023-01-012023-12-310001880661tpg:RestrictedStockUnitsIPOMarketConditionAwardsMember2022-01-012022-12-310001880661tpg:RestrictedStockUnitsAcquisitionServiceAwardsMember2023-12-310001880661tpg:RestrictedStockUnitsAcquisitionServiceAwardsMember2023-01-012023-12-310001880661tpg:RestrictedStockUnitsAcquisitionServiceAwardsMember2022-01-012022-12-310001880661tpg:RestrictedStockUnitsExecutiveServiceAwardsMember2023-12-310001880661tpg:RestrictedStockUnitsExecutiveServiceAwardsMember2023-01-012023-12-310001880661tpg:RestrictedStockUnitsExecutiveServiceAwardsMember2022-01-012022-12-310001880661tpg:RestrictedStockUnitsExecutiveMarketConditionAwardsMember2023-12-310001880661tpg:RestrictedStockUnitsExecutiveMarketConditionAwardsMember2023-01-012023-12-310001880661tpg:RestrictedStockUnitsExecutiveMarketConditionAwardsMember2022-01-012022-12-310001880661tpg:RestrictedStockUnitsOrdinaryServiceAwardsMember2023-12-310001880661tpg:RestrictedStockUnitsOrdinaryServiceAwardsMember2023-01-012023-12-310001880661tpg:RestrictedStockUnitsOrdinaryServiceAwardsMember2022-01-012022-12-310001880661tpg:RestrictedStockUnitsOrdinaryPerformanceConditionAwardsMember2023-12-310001880661tpg:RestrictedStockUnitsOrdinaryPerformanceConditionAwardsMember2023-01-012023-12-310001880661tpg:RestrictedStockUnitsOrdinaryPerformanceConditionAwardsMember2022-01-012022-12-310001880661us-gaap:RestrictedStockUnitsRSUMember2023-12-310001880661us-gaap:RestrictedStockUnitsRSUMember2023-01-012023-12-310001880661us-gaap:RestrictedStockUnitsRSUMember2022-01-012022-12-310001880661us-gaap:GeneralAndAdministrativeExpenseMemberus-gaap:RestrictedStockUnitsRSUMember2023-01-012023-12-310001880661us-gaap:GeneralAndAdministrativeExpenseMemberus-gaap:RestrictedStockUnitsRSUMember2022-01-012022-12-310001880661tpg:ServiceAwardsMember2023-01-012023-12-310001880661tpg:RestrictedStockUnitsAcquisitionServiceAwardsMember2023-11-012023-11-010001880661tpg:ServiceAwardsMember2022-12-310001880661tpg:ServiceAwardsMember2023-12-310001880661us-gaap:CommonClassAMemberus-gaap:SubsequentEventMembertpg:ServiceAwardsMember2024-01-012024-01-310001880661us-gaap:SubsequentEventMembertpg:RestrictedStockUnitsOrdinaryServiceAwardsMember2024-01-012024-01-310001880661tpg:RestrictedStockUnitsAcquisitionServiceAwardsMemberus-gaap:SubsequentEventMember2024-01-012024-01-310001880661srt:MinimumMemberus-gaap:SubsequentEventMembertpg:ServiceAwardsMember2024-01-012024-01-310001880661srt:MaximumMemberus-gaap:SubsequentEventMembertpg:ServiceAwardsMember2024-01-012024-01-310001880661tpg:RestrictedStockUnitsOrdinaryPerformanceConditionAwardsMember2022-12-310001880661tpg:RestrictedStockUnitsIPOServiceVestingAndMarketConditionIPOAwardsMember2022-01-182022-01-180001880661tpg:RestrictedStockUnitsIPOServiceAwardsMember2022-01-182022-01-180001880661tpg:RestrictedStockUnitsIPOMarketConditionAwardsMember2022-01-182022-01-180001880661us-gaap:ShareBasedCompensationAwardTrancheOneMembertpg:RestrictedStockUnitsIPOMarketConditionAwardsMember2022-01-182022-01-180001880661us-gaap:ShareBasedCompensationAwardTrancheTwoMembertpg:RestrictedStockUnitsIPOMarketConditionAwardsMember2022-01-182022-01-180001880661tpg:RestrictedStockUnitsExecutiveServiceAwardsMembersrt:ChiefExecutiveOfficerMember2023-11-302023-11-300001880661srt:ChiefExecutiveOfficerMembertpg:RestrictedStockUnitsExecutiveMarketConditionAwardsMember2023-11-302023-11-300001880661us-gaap:ShareBasedCompensationAwardTrancheThreeMembersrt:ChiefExecutiveOfficerMembertpg:RestrictedStockUnitsExecutiveMarketConditionAwardsMember2023-11-302023-11-300001880661us-gaap:ShareBasedCompensationAwardTrancheTwoMembersrt:ChiefExecutiveOfficerMembertpg:RestrictedStockUnitsExecutiveMarketConditionAwardsMember2023-11-302023-11-300001880661srt:ChiefExecutiveOfficerMembertpg:RestrictedStockUnitsExecutiveMarketConditionAwardsMemberus-gaap:ShareBasedCompensationAwardTrancheOneMember2023-11-302023-11-300001880661srt:ChiefExecutiveOfficerMembertpg:RestrictedStockUnitsExecutiveMarketConditionAwardsMembertpg:ShareBasedPaymentArrangementTrancheFourMember2023-11-302023-11-300001880661us-gaap:CommonClassAMembersrt:ChiefExecutiveOfficerMembertpg:RestrictedStockUnitsExecutiveMarketConditionAwardsMemberus-gaap:ShareBasedCompensationAwardTrancheOneMember2023-11-302023-11-300001880661us-gaap:CommonClassAMemberus-gaap:ShareBasedCompensationAwardTrancheTwoMembersrt:ChiefExecutiveOfficerMembertpg:RestrictedStockUnitsExecutiveMarketConditionAwardsMember2023-11-302023-11-300001880661us-gaap:CommonClassAMemberus-gaap:ShareBasedCompensationAwardTrancheThreeMembersrt:ChiefExecutiveOfficerMembertpg:RestrictedStockUnitsExecutiveMarketConditionAwardsMember2023-11-302023-11-300001880661us-gaap:CommonClassAMembersrt:ChiefExecutiveOfficerMembertpg:RestrictedStockUnitsExecutiveMarketConditionAwardsMembertpg:ShareBasedPaymentArrangementTrancheFourMember2023-11-302023-11-300001880661srt:ChiefExecutiveOfficerMembertpg:RestrictedStockUnitsExecutiveMarketConditionAwardsMemberus-gaap:ShareBasedCompensationAwardTrancheOneMember2023-01-012023-12-310001880661us-gaap:ShareBasedCompensationAwardTrancheTwoMembersrt:ChiefExecutiveOfficerMembertpg:RestrictedStockUnitsExecutiveMarketConditionAwardsMember2023-01-012023-12-310001880661us-gaap:ShareBasedCompensationAwardTrancheThreeMembersrt:ChiefExecutiveOfficerMembertpg:RestrictedStockUnitsExecutiveMarketConditionAwardsMember2023-01-012023-12-310001880661srt:ChiefExecutiveOfficerMembertpg:RestrictedStockUnitsExecutiveMarketConditionAwardsMembertpg:ShareBasedPaymentArrangementTrancheFourMember2023-01-012023-12-310001880661srt:ChiefExecutiveOfficerMembertpg:RestrictedStockUnitsExecutiveMarketConditionAwardsMemberus-gaap:ShareBasedCompensationAwardTrancheOneMember2023-12-310001880661us-gaap:ShareBasedCompensationAwardTrancheTwoMembersrt:ChiefExecutiveOfficerMembertpg:RestrictedStockUnitsExecutiveMarketConditionAwardsMember2023-12-310001880661us-gaap:ShareBasedCompensationAwardTrancheThreeMembersrt:ChiefExecutiveOfficerMembertpg:RestrictedStockUnitsExecutiveMarketConditionAwardsMember2023-12-310001880661srt:ChiefExecutiveOfficerMembertpg:RestrictedStockUnitsExecutiveMarketConditionAwardsMembertpg:ShareBasedPaymentArrangementTrancheFourMember2023-12-310001880661tpg:MarketConditionAwardsMember2022-12-310001880661tpg:MarketConditionAwardsMember2023-01-012023-12-310001880661tpg:MarketConditionAwardsMember2023-12-310001880661tpg:NewQuestHoldingsCaymanLimitedMember2022-12-310001880661tpg:TPHUnitsMember2023-12-310001880661tpg:TPHUnitsMember2023-01-012023-12-310001880661tpg:TPHUnitsMember2022-01-012022-12-310001880661tpg:RPHUnitsMember2023-12-310001880661tpg:RPHUnitsMember2023-01-012023-12-310001880661tpg:RPHUnitsMember2022-01-012022-12-310001880661tpg:TPHUnitsAndRPHUnitsMember2023-12-310001880661tpg:TPHUnitsAndRPHUnitsMember2023-01-012023-12-310001880661tpg:TPHUnitsAndRPHUnitsMember2022-01-012022-12-310001880661tpg:TOGCommonUnitsMember2023-12-310001880661tpg:TOGCommonUnitsMember2023-01-012023-12-310001880661tpg:TOGCommonUnitsMember2022-01-012022-12-310001880661us-gaap:CommonClassAMember2023-01-012023-12-310001880661us-gaap:CommonClassAMember2022-01-012022-12-310001880661tpg:AcquisitionCommonUnitsMember2023-12-310001880661tpg:AcquisitionCommonUnitsMember2023-01-012023-12-310001880661tpg:AcquisitionCommonUnitsMember2022-01-012022-12-310001880661tpg:OtherAwardsMember2023-12-310001880661tpg:OtherAwardsMember2023-01-012023-12-310001880661tpg:OtherAwardsMember2022-01-012022-12-310001880661tpg:TPHUnitsMember2022-12-310001880661tpg:RPHUnitsMember2022-12-310001880661tpg:TOGUnitsMember2022-12-310001880661us-gaap:CommonClassAMember2022-12-310001880661tpg:TOGUnitsMember2023-01-012023-12-310001880661us-gaap:CommonClassAMember2023-01-012023-12-310001880661tpg:TOGUnitsMember2023-12-310001880661us-gaap:CommonClassAMember2023-12-310001880661tpg:AcquisitionCommonUnitsAndTOGCommonUnitsMember2023-12-310001880661tpg:AngeloGordonCoLPAgFundsLPAndAGPartnersLPMembertpg:OtherLiabilityClassifiedAwardsMember2023-01-012023-12-310001880661tpg:AngeloGordonCoLPAgFundsLPAndAGPartnersLPMembertpg:OtherLiabilityClassifiedAwardsMember2023-12-310001880661tpg:TRTXAwardMember2023-01-012023-12-310001880661tpg:TRTXAwardMember2022-01-012022-12-31tpg:classOfStock0001880661tpg:CommonClassAVotingMember2023-12-310001880661us-gaap:NonvotingCommonStockMember2023-12-310001880661us-gaap:CommonClassBMember2023-01-012023-12-310001880661us-gaap:CommonClassAMember2022-05-102022-05-100001880661us-gaap:CommonClassAMember2022-08-092022-08-090001880661us-gaap:CommonClassAMember2022-11-092022-11-090001880661us-gaap:CommonClassAMember2023-02-152023-02-150001880661us-gaap:CommonClassAMember2023-05-152023-05-150001880661us-gaap:CommonClassAMember2023-08-082023-08-080001880661us-gaap:CommonClassAMember2023-11-072023-11-070001880661us-gaap:CommonClassAMemberus-gaap:SubsequentEventMember2024-02-132024-02-1300018806612023-03-300001880661us-gaap:CommonClassAMember2023-03-300001880661us-gaap:CommonClassBMember2023-03-300001880661tpg:DeborahMessemerMember2023-01-012023-12-3100018806612023-10-012023-12-310001880661tpg:DeborahMessemerMember2023-10-012023-12-310001880661tpg:DeborahMessemerMember2023-12-31
UNITED STATES
SECURITIES AND EXCHANGE COMMISSION
Washington, D.C. 20549
FORM 10-K
(Mark One)
| | | | | |
| x | ANNUAL REPORT PURSUANT TO SECTION 13 OR 15(d) OF THE SECURITIES EXCHANGE ACT OF 1934 |
| For the fiscal year ended December 31, 2023 |
OR
| | | | | |
| ¨ | TRANSITION REPORT PURSUANT TO SECTION 13 OR 15(d) OF THE SECURITIES EXCHANGE ACT OF 1934 |
| For the transition period from to |
Commission file number 001-41222
TPG Inc.
(Exact name of registrant as specified in its charter)
| | | | | |
| Delaware | 87-2063362 |
| (State or other jurisdiction of incorporation or organization) | (I.R.S. Employer Identification No.) |
301 Commerce Street, Suite 3300 | 76102 |
Fort Worth, TX | (Zip Code) |
(817) 871-4000
Registrant's telephone number, including area code
Securities registered pursuant to Section 12(b) of the Act:
| | | | | | | | |
| Title of each class | Trading Symbol(s) | Name of each exchange on which registered |
| Class A common stock | TPG | The Nasdaq Stock Market LLC |
Securities registered pursuant to section 12(g) of the Act: None
Indicate by check mark if the registrant is a well-known seasoned issuer, as defined in Rule 405 of the Securities Act. Yes x No o
Indicate by check mark if the registrant is not required to file reports pursuant to Section 13 or Section 15(d) of the Act. Yes o No x
Indicate by check mark whether the registrant: (1) has filed all reports required to be filed by Section 13 or 15(d) of the Securities Exchange Act of 1934 during the preceding 12 months (or for such shorter period that the registrant was required to file such reports); and (2) has been subject to such filing requirements for the past 90 days. Yes x No o
Indicate by check mark whether the registrant has submitted electronically and posted on its corporate web site, if any, every Interactive Data File required to be submitted and posted pursuant to Rule 405 of Regulation S-T (§232.405 of this chapter) during the preceding 12 months (or for such shorter period that the registrant was required to submit and post such files). Yes x No ¨
Indicate by check mark whether the registrant is a large accelerated filer, an accelerated filer, a non-accelerated filer, or a smaller reporting company. See the definitions of “large accelerated filer,” “accelerated filer” and “smaller reporting company” in Rule 12b-2 of the Exchange Act. (Check one):
| | | | | | | | | | | | | | |
| Large accelerated filer | x | | Accelerated filer | ¨ |
| Non-accelerated filer | ¨ | | Smaller reporting company | ¨ |
| | | Emerging growth company | ¨ |
If an emerging growth company, indicate by check mark if the registrant has elected not to use the extended transition period for complying with any new or revised financial accounting standards provided pursuant to Section 13(a) of the Exchange Act. ¨
Indicate by check mark whether the registrant has filed a report on and attestation to its management's assessment of the effectiveness of its internal control over financial reporting under Section 404(b) of the Sarbanes-Oxley Act (15 U.S.C. 7262(b)) by the registered public accounting firm that prepared or issued its audit report. x
If securities are registered pursuant to Section 12(b) of the Act, indicate by check mark whether the financial statements of the registrant included in the filing reflect the correction of an error to previously issued financial statements. o
Indicate by check mark whether any of those error corrections are restatements that required a recovery analysis of incentive-based compensation received by any of the registrant’s executive officers during the relevant recovery period pursuant to §240.10D-1(b).o
Indicate by check mark whether the registrant is a shell company (as defined in Rule 12b-2 of the Act). Yes ¨ No x
The aggregate market value of the common stock of the Registrant held by non-affiliates as of June 30, 2023 was $1,928.6 million.
As of February 20, 2024, there were 74,762,397 shares of the registrant’s Class A common stock, 8,258,901 shares of the registrant’s nonvoting Class A common stock and 281,657,626 shares of the registrant’s Class B common stock outstanding.
DOCUMENTS INCORPORATED BY REFERENCE
Portions of the Registrant’s definitive proxy statement relating to its 2024 annual meeting of the shareholders (the “2024 Proxy Statement”) are incorporated by reference into Part III of this Annual Report on Form 10-K where indicated. The 2024 Proxy Statement will be filed with the U.S. Securities and Exchange Commission within 120 days after the end of the fiscal year to which this report relates.
TABLE OF CONTENTS
CAUTIONARY NOTE REGARDING FORWARD-LOOKING STATEMENTS
This report may contain forward-looking statements. Forward-looking statements can be identified by words such as “anticipates,” “intends,” “plans,” “seeks,” “believes,” “estimates,” “expects” and similar references to future periods, or by the inclusion of forecasts or projections. Examples of forward-looking statements include, but are not limited to, statements we make regarding the outlook for our future business and financial performance, estimated operational metrics, business strategy and plans and objectives of management for future operations, including, among other things, statements regarding expected growth, future capital expenditures, fund performance, dividends and dividend policy and debt service obligations, such as those contained in “Item 7.—Management’s Discussion and Analysis of Financial Condition and Results of Operations.”
Forward-looking statements are based on our current expectations and assumptions regarding our business, the economy and other future conditions. Because forward-looking statements relate to the future, by their nature, they are subject to inherent uncertainties, risks and changes in circumstances that are difficult to predict. As a result, our actual results may differ materially from those contemplated by any forward-looking statements. Important factors that could cause actual results to differ materially from those in the forward-looking statements include the inability to recognize the anticipated benefits of the acquisition of Angelo Gordon (as defined herein); purchase price adjustments; unexpected costs related to the integration of the Angelo Gordon business and operations; our ability to manage growth and execute our business plan; and regional, national or global political, economic, business, competitive, market and regulatory conditions, including, but not limited to, those described in “Item 1A.—Risk Factors” and “Item 7.—Management’s Discussion and Analysis of Financial Condition and Results of Operations.”
For the reasons described above, we caution you against relying on any forward-looking statements, which should also be read in conjunction with the other cautionary statements that are included elsewhere in this report. Any forward-looking statement made by us in this speaks only as of the date on which we make it. Factors or events that could cause our actual results to differ may emerge from time to time, and it is not possible for us to predict all of them. We undertake no obligation to publicly update or revise any forward-looking statement, whether as a result of new information, future developments or otherwise, except as may be required by law.
On November 1, 2023, TPG Inc., TPG Operating Group II, L.P., an indirect subsidiary of TPG Inc., and certain of their affiliated entities (collectively, the “TPG Parties”) completed the acquisition (the “Acquisition”) of Angelo, Gordon & Co., L.P., AG Funds L.P. and AG Partners, L.P. (collectively, the “Angelo Gordon Parties”) pursuant to the terms and subject to the conditions set forth in the Transaction Agreement, dated as of May 14, 2023, by and among the TPG Parties and the Angelo Gordon Parties. Accordingly, the results of TPG Angelo Gordon included in our consolidated results of operations are from November 1, 2023 through December 31, 2023.
Risk Factor Summary
The following is only a summary of the principal risks that may materially adversely affect our business, financial condition, results of operations and cash flows. The following should be read in conjunction with the more complete discussion of the risk factors we face, which are set forth more fully in “Part I. Item 1A. Risk Factors.”
•our dependence on our senior leadership and key investment and other professionals;
•our ability to attract, retain and motivate investment and other key professionals;
•the performance of our funds;
•our ability to raise new funds or capital for our funds and obtain favorable economic terms;
•our ability to incorporate TPG Angelo Gordon into the Company and achieve the intended benefits of the Acquisition;
•our execution of new investment strategies or expansion into new markets and businesses;
•increasing scrutiny from fund investors and regulators on ESG (as defined herein) matters;
•the variability of part of our revenue, earnings and cash flow;
•our funds’ historical returns not being indicative of returns on investing in our Class A common stock;
•the performance of our funds’ portfolio companies;
•our investment in companies based outside of the United States;
•changes in China’s governmental policies and interventions by China’s government in industries in which we are invested;
•our ability to maintain the security of our information and technology networks;
•our ability to manage conflicts of interest, including conflicts of interests relating to our funds’ investment activities, conflicts of interest with our partners, directors and senior advisors, and conflicts of interest that may arise between our public stockholders and our management and certain other affiliates;
•the potential misconduct, fraud or other deceptive practices of our employees, advisors or third-party service providers or our funds’ portfolio companies;
•pending and future litigation and related liabilities and reputational harm;
•clawback or contingent repayment obligations if and when triggered under our funds’ governing agreements;
•the historical pro forma financial information in this report not being predictive of future performance;
•our reliance on exemptions from certain governance requirements as a “controlled company” within the meaning of Nasdaq listing standards;
•our status as a holding company, with our only material asset being our interest in the TPG Operating Group (as defined herein);
•us potentially being deemed an “investment company” under the Investment Company Act (as defined herein);
•the disparity in the voting rights among the classes of our common stock;
•our ability to pay dividends;
•the effect on our share price of the large number of shares eligible for future sale and exchange;
•the acceleration of payments under the Tax Receivable Agreement (as defined herein);
•changes in the debt financing markets or higher interest rates;
•the intense competition in the investment management business;
•climate change and related regulations;
•difficult economic and market conditions;
•the extensive regulation of our businesses and increased regulatory focus on our industry, including proposed legislative changes that would modify the tax treatment of performance allocations or otherwise adversely impact our business model;
•changes in the U.S. political and financial regulatory environment; and
•our structure, which involves complex provisions of U.S. federal tax law.
TERMS USED IN THIS REPORT
As used in this Annual Report on Form 10-K, unless the context otherwise requires, references to:
•“TPG,” “the Company,” “we,” “our,” and “us,” or like terms, refer to TPG Inc. and its consolidated subsidiaries taken as a whole.
•“Acquired Interests” refers to all of the outstanding limited partnership interests in AG OpCo and AG CarryCo (each as defined herein), as well as all the outstanding limited liability company interests in AG GP, LLC and limited partnership interests in AG Partner Investments, L.P. acquired in connection with the Acquisition.
•“Angelo Gordon” refers, collectively, to Angelo, Gordon & Co., L.P. (“AG OpCo”) and AG Funds L.P. (“AG CarryCo”), each a Delaware limited partnership. Following the closing of the Acquisition, we refer to Angelo Gordon as “TPG Angelo Gordon.”
•“Class A common stock” refers to Class A common stock of TPG Inc., which entitles the holder to one vote per share. When we use the term “Class A common stock” in this Annual Report on Form 10-K, we are referring exclusively to such voting Class A common stock and not to “nonvoting Class A common stock.”
•“Class B common stock” refers to Class B common stock of TPG Inc., which entitles the holder to ten votes per share until the Sunset but carries no economic rights.
•“Co-Invest Leverage Facility” refers to the agreement whereby TPG Holdings II Sub, L.P., TPG Holdings I, L.P., TPG Holdings II, L.P., TPG Holdings III, L.P. and certain of our other subsidiaries agreed to guarantee then existing and future secured recourse loans made to eligible employees and certain other participants.
•“Common Unit” refers to a common unit in the TPG Operating Group.
•“Exchange Act” refers to the Securities Exchange Act of 1934, as amended.
•“Excluded Assets” refers to the assets and economic entitlements transferred to RemainCo listed in Schedule A to the master contribution agreement entered into in connection with the Reorganization (as defined herein), which primarily include (i) minority interests in certain sponsors unaffiliated with TPG, (ii) the right to certain performance allocations in TPG funds, (iii) certain co-invest interests and (iv) cash.
•“Founders” refers to David Bonderman and James G. (“Jim”) Coulter.
•“GP LLC” refers to TPG GP A, LLC, the owner of the general partner of TPG Group Holdings.
•“GP Services Credit Facility” refers to the agreement whereby TPG Holdings I, L.P., TPG Holdings II Sub, L.P., TPG Holdings II, L.P., TPG Holdings III, L.P. and certain of our other wholly-owned subsidiaries agreed to guarantee the revolving credit facility entered into between GP Services (as defined herein) and a financial institution.
•“IPO” refers to our initial public offering of Class A common stock of TPG Inc. that was completed on January 18, 2022.
•“nonvoting Class A common stock” refers to the nonvoting Class A common stock of TPG Inc., which has no voting rights and is convertible into shares of Class A common stock upon transfer to a third party as and when permitted by the Investor Rights Agreement.
•“Pre-IPO Investors” refers to certain sovereign wealth funds, other institutional investors and certain other parties that entered into a strategic relationship with us prior to the Reorganization.
•“Promote Unit” refers to a promote unit in TPG Operating Group, which entitles the holder to certain distributions of performance allocations received by TPG Operating Group.
•“Public SPACs” refers to Pace Holdings Corp., TPG Pace Holdings Corp., TPG Pace Tech Opportunities Corp., TPG Pace Beneficial Finance Corp., TPG Pace Energy Holdings Corp., TPG Pace Solutions Corp., TPG Pace Beneficial II Corp. and AfterNext HealthTech Acquisition Corp.
•“RemainCo” refers to, collectively, Tarrant Remain Co I, L.P., a Delaware limited partnership, Tarrant Remain Co II, L.P., a Delaware limited partnership, and Tarrant Remain Co III, L.P., a Delaware limited partnership, which owns the Excluded Assets, and Tarrant Remain Co GP, LLC, a Delaware limited liability company serving as their general partner.
•“Securities Act” refers to the Securities Act of 1933, as amended.
•“Specified Company Assets” refers to TPG general partner entities from which holders of Common Units (including us) received an estimated 20% performance allocation after giving effect to the Reorganization.
•“Sunset” refers to the event that will occur on the date that a majority of the independent directors are elected at the first annual meeting of stockholders (or pursuant to a consent of stockholders in lieu thereof) after the earlier of (i) the earliest date specified in a notice delivered to the Company by GP LLC and its members pursuant to that certain GP LLC limited liability company agreement promptly following the earliest of: (a) the date that is three months after the date that neither Founder continues to be a member of GP LLC, (b) a vote of GP LLC to trigger the Sunset and (c) upon 60-days advance notice, the date determined by either Founder who is then a member of the Control Group to trigger the Sunset, if, following a period of at least 60 days, the requisite parties are unable to agree on the renewal of Mr. Winkelried’s employment agreement or the selection of a new CEO in the event that Mr. Winkelried ceases to serve as our CEO, and (ii) the first day of the quarter immediately following the fifth anniversary of the IPO.
•“Tax Receivable Agreement" refers to the Amended and Restated Tax Receivable Agreement entered into by TPG Inc. and the other parties thereto on November 1, 2023.
•“TPG general partner entities” refers to certain entities that (i) serve as the general partner of certain TPG funds and (ii) are, or historically were, consolidated by TPG Group Holdings.
•“TPG Group Holdings” refers to TPG Group Holdings (SBS), L.P., a Delaware limited partnership that is considered our predecessor for accounting purposes and is a TPG Partner Vehicle and direct owner of certain Common Units and Class B common stock.
•“TPG Operating Group” refers (i) for periods prior to giving effect to the Reorganization (as defined herein), to the TPG Operating Group partnerships and their respective consolidated subsidiaries; (ii) for periods beginning after giving effect to the Reorganization through November 1, 2023, (A) to the TPG Operating Group partnerships and their respective consolidated subsidiaries and (B) not to RemainCo and (iii) for periods after November 1, 2023, to TPG Operating Group II, L.P., a Delaware limited partnership, and its respective consolidated subsidiaries, including TPG Operating Group I, L.P. and TPG Operating Group III, L.P.
•“TPG Operating Group partnerships” refers to TPG Operating Group I, L.P., a Delaware limited partnership formerly named TPG Holdings I, L.P., TPG Operating Group II, L.P., a Delaware limited partnership formerly named TPG Holdings II, L.P., and TPG Operating Group III, L.P., a Delaware limited partnership formerly named TPG Holdings III, L.P.
•“TPG Partner Holdings” refers to TPG Partner Holdings, L.P., a Delaware limited partnership, which is a TPG Partner Vehicle that indirectly owns substantially all of the economic interests of TPG Group Holdings, a TPG Partner Vehicle.
•“TPG Partner Vehicles” refers to, collectively, the vehicles through which the Founders and current and former TPG partners (including such persons’ related entities and estate planning vehicles) hold their equity in the TPG Operating Group, including TPG Group Holdings and TPG Partner Holdings.
•“Transaction Agreement” refers to that certain transaction agreement dated as of May 14, 2023, by and among TPG, the TPG Operating Group, GP LLC, Angelo Gordon and certain of its affiliated entities, as amended on October 3, 2023 and October 31, 2023.
In addition, for definitions of “Gross IRR,” “Net IRR,” “Gross MoM,” “Net IRR,” “Investor Net MoM,” and related terms, see “Item 7.—Management’s Discussion and Analysis of Financial Condition and Results of Operations—Net Accrued Performance Allocations—Fund Performance Metrics.”
PART I
Item 1. Business
Overview
TPG is a leading global alternative asset manager with $221.6 billion in assets under management (“AUM”) as of December 31, 2023. We have built our firm through more than 30 years of successful innovation and growth, and believe that we have delivered attractive risk-adjusted returns to our clients and established a premier investment business focused on the fastest-growing segments of both the alternative asset management industry and the global economy. We believe that we have a distinctive business approach as compared to other alternative asset managers and a diversified, innovative array of investment platforms that position us well to continue generating sustainable growth across our business.
We primarily invest in complex asset classes such as private equity, credit, real estate and public market strategies, which is distinct from most other asset managers that invest only in traditional asset classes such as stocks, bonds or commodities. We have constructed a high-quality base of assets under management within highly attractive sub-segments of the alternative asset management industry. The strength of our investment performance, our ability to innovate within our business and our focus on strategic, inorganic growth has led to consistent historical growth in our assets under management, all on a scaled infrastructure that gives our business a high degree of operating leverage. From 2019 to December 31, 2023, our assets under management have grown 160.7% from $85.0 billion to $221.6 billion. The following table presents AUM over the last five years:
| | | | | | | | |
| | Assets Under Management |
| | ($ in Billions) |
| 2019 | | $ | 85 | |
| 2020 | | 90 | |
| 2021 | | 114 | |
| 2022 | | 135 | |
| 2023 | | 222 | |
As of December 31, 2023, we employed approximately 1,850 people, including over 650 investment and operations professionals, in offices across 16 countries, providing us with a substantial global footprint and network. Our investment and operations professionals are organized into industry sector teams, which share investment themes across platforms to drive firmwide pattern recognition. Through multiple decades of experience, we have developed an ecosystem of insight, engagement and collaboration across our platforms and products, which currently include over 300 active portfolio companies, over 300 real estate properties and over 5,000 credit positions across more than 30 countries.
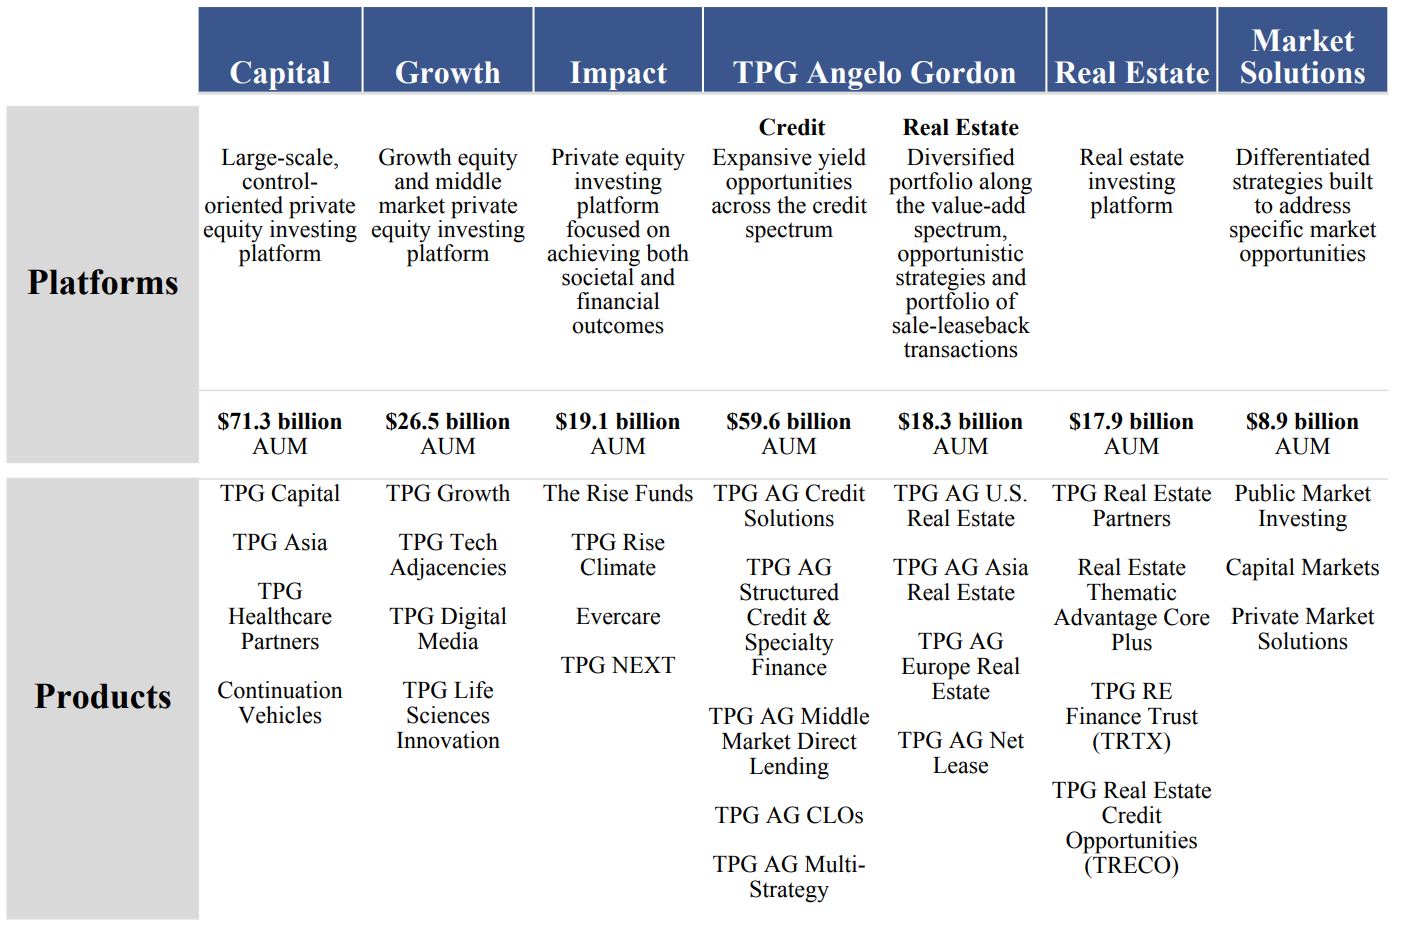
Our firm consists of six multi-strategy investment platforms: (1) Capital, (2) Growth, (3) Impact, (4) TPG Angelo Gordon, (5) Real Estate and (6) Market Solutions. We have developed our investment platforms organically over time by identifying areas where our track record and thematic depth provide opportunities to create differentiated solutions to address market needs. We have also grown inorganically, including through our acquisition on November 1, 2023 of Angelo Gordon, an alternative investment firm focused on credit and real estate investing.
_________________
Note: AUM as of December 31, 2023.
Platforms
Platform: Capital
Our Capital platform is focused on large-scale, control-oriented private equity investments. Our Capital platform funds are organized in four primary products: (1) TPG Capital, (2) TPG Asia, (3) TPG Healthcare Partners and (4) Continuation Vehicles.
The following table presents certain data about our Capital platform as of December 31, 2023 (dollars in billions):
| | | | | | | | | | | | | | | | | | | | | | | | | | |
| AUM | | Fee-earning AUM | | Active Funds | | Available Capital | | Investment Professionals |
| $ | 71 | | | $ | 39 | | | 10 | | $ | 17 | | | 130 |
Product: TPG Capital
TPG Capital is our North America and Europe-focused private equity investing business, with $41.8 billion in assets under management and 83 investment professionals around the world as of December 31, 2023. TPG Capital seeks to invest through leveraged buyouts and large-scale growth equity investments in market leaders with fundamentally strong business models which are expected to benefit from long-term secular growth trends. We also seek to help our portfolio companies accelerate their growth under our ownership through operational improvements, by investing in organic and inorganic growth, and by leveraging our human capital team to upgrade or enhance our management teams and boards.
Product: TPG Asia
TPG Asia consists of 47 investment professionals focused on pursuing investments in the Asia-Pacific region, including Australia, India, Korea and Southeast Asia, with $21.8 billion in assets under management as of December 31, 2023. Our distributed regional footprint has provided a foundation to pursue the region’s highly attractive investing opportunities with both new and existing products and strategies. We invest through a variety of transaction structures, including through partnerships with large corporations and families.
Product: TPG Healthcare Partners
We established TPG Healthcare Partners, or “THP”, in 2019 to pursue healthcare-related investments, primarily in partnership with other TPG funds. THP provides our limited partners with a dedicated healthcare investment platform that touches all areas of healthcare, including providers, payors, pharmaceuticals, medical devices and healthcare technology.
Product: Continuation Vehicles
Periodically, across our platforms, we identify portfolio companies in which certain of our limited partners would like to remain invested but which we own in a fund nearing the end of its life. In these situations, we have utilized single-asset continuation vehicles (“CVs”) managed by TPG that allow the limited partners who choose to do so to remain invested in a portfolio company beyond the life of the TPG fund that initially invested in the company. CVs are attractive for both our limited partners, who retain ongoing exposure to strong assets, and for TPG, as these vehicles extend the duration of our capital. CVs provide opportunities for TPG to continue creating value for our investors and earning management and performance fees.
Platform: Growth
TPG Growth is our dedicated growth equity and middle market investing vehicle. Our Growth platform provides us with a flexible mandate to capitalize on investment opportunities that are earlier in their life cycle, are smaller in size and/or have different profiles than would be considered for our Capital platform. Our Growth funds are organized in four primary products: (1) TPG Growth, (2) TPG Tech Adjacencies, (3) TPG Digital Media and (4) TPG Life Sciences Innovation.
The following table presents certain data about our Growth platform as of December 31, 2023 (dollars in billions):
| | | | | | | | | | | | | | | | | | | | | | | | | | |
| AUM | | Fee-earning AUM | | Active Funds | | Available Capital | | Investment Professionals |
| $ | 27 | | | $ | 12 | | | 10 | | $ | 5 | | | 47 |
Product: TPG Growth
TPG Growth is our dedicated growth equity and middle market investing product, with $17.0 billion in assets under management and 47 dedicated investment professionals as of December 31, 2023. TPG Growth seeks to make growth buyout and growth equity investments, primarily in North America and India.
Product: TPG Tech Adjacencies
TPG Tech Adjacencies, or “TTAD”, with $6.7 billion in assets under management as of December 31, 2023, is a product we developed organically to pursue minority and/or structured investments in internet, software, digital media and other technology sectors. Specifically, TTAD aims to provide flexible capital for founders, employees and early investors looking for liquidity, as well as primary structured equity solutions for companies looking for additional, creative capital for growth.
Product: TPG Digital Media
TPG Digital Media, or “TDM”, is a flexible source of capital to pursue opportunities to invest in digital media. TDM seeks to pursue investments in businesses in which we have the opportunity to capitalize on our long history of studying and pursuing content-centric themes.
Product: TPG Life Sciences Innovation
TPG Life Sciences Innovation, or “LSI”, is a new product which will invest in the life sciences sector in novel therapeutics as well as digital health, medical devices, diagnostics, and tech-enabled services. LSI will invest across different therapeutic areas and stages from company creation to IPO, and will leverage TPG’s broad experience in the healthcare sector.
Platform: Impact
Our multi-fund Impact platform pursues both competitive financial returns and measurable societal benefits at scale, harnessing the diverse skills of a differentiated group of stakeholders:
• Y Analytics: A public benefit organization that is wholly owned by TPG and which we founded to provide impact research and rigorous assessment measures for impact investments, and today functions as TPG’s firm-wide ESG and impact performance arm.
• The TPG Rise Global Advisory Board: A group of experienced investors and global thought leaders with a deep personal and professional commitment to driving social and environmental change.
• The TPG Rise Climate Coalition: A partnership between TPG and 28 leading global corporations to identify and share best practices for considering climate solutions investment opportunities through TPG Rise Climate.
Based on our investment strategy, we believe our impact investments can deliver profit and positive impact in tandem. Our Impact funds are organized in four primary products: (1) The Rise Funds, (2) TPG Rise Climate, (3) Evercare and (4) TPG NEXT.
The following table presents certain data about our Impact platform as of December 31, 2023 (dollars in billions):
| | | | | | | | | | | | | | | | | | | | | | | | | | |
| AUM | | Fee-earning AUM | | Active Funds | | Available Capital | | Investment Professionals |
| $ | 19 | | | $ | 14 | | | 6 | | $ | 5 | | | 60 |
Product: The Rise Funds
The Rise Funds are our dedicated vehicles for investing in companies that generate a demonstrable and significant positive societal impact alongside business performance and strong returns, with $8.7 billion in assets under management and 27 dedicated investment professionals as of December 31, 2023. The Rise Fund’s core areas of focus include climate and conservation, education, financial inclusion, food and agriculture, healthcare and impact services, and invest globally.
Product: TPG Rise Climate
TPG Rise Climate is our dedicated climate impact investing product. TPG Rise Climate has raised $7.3 billion in total commitments, and is innovative in matching significant capital from traditional limited partners with over $2.6 billion in commitments from 28 leading global corporations. In addition to committing capital to the fund, the companies joined TPG in forming the TPG Rise Climate Coalition, an effort focused on identifying and sharing best practices for considering investment opportunities, among the corporate group and more broadly across the TPG Impact platform. TPG Rise Climate’s core areas of focus include energy transition, green mobility, sustainable fuels, sustainable materials and products and carbon solutions.
Product: Evercare
The Evercare Health Fund (“Evercare”) is an emerging markets healthcare fund that is striving to provide affordable, high-quality healthcare in emerging markets. Evercare’s investments are integrated under a common operating platform, The Evercare Group, an integrated healthcare delivery platform in emerging markets across Africa and South Asia, including India, Pakistan, Bangladesh, Kenya and Nigeria.
Product: TPG NEXT
TPG NEXT is designed to support the next generation of diverse alternative asset managers. TPG announced the launch of the TPG NEXT fund in 2022 to seed new managers, strengthen their access to capital, offer business building expertise and provide strategic advisory support to talent that is chronically underrepresented in alternative asset management. TPG NEXT began investing in 2023 and aims to increase the number of diverse-led firms in alternative assets, furthering an effort we began in 2019 with our investments in Harlem Capital and VamosVentures.
Platform: TPG Angelo Gordon
TPG AG Credit
TPG Angelo Gordon’s alternative credit products (collectively referred to as “TPG AG Credit”) are: (1) TPG AG Credit Solutions, (2) TPG AG Structured Credit & Specialty Finance, (3) TPG AG Middle Market Direct Lending, (4) TPG AG Collateralized Loan Obligations (“CLOs”), and (5) TPG AG Multi-Strategy. TPG AG Credit’s capabilities span private and tradeable credit across corporate and asset-backed markets.
The following table presents certain data about our TPG AG Credit platform as of December 31, 2023 (dollars in billions):
| | | | | | | | | | | | | | | | | | | | | | | | | | |
| AUM | | Fee-earning AUM | | Active Funds | | Available Capital | | Investment Professionals |
| $ | 60 | | | $ | 40 | | | 73 | | $ | 7 | | | 141 |
Product: TPG AG Credit Solutions
TPG AG Credit Solutions, with $12.9 billion in assets under management and 21 investment professionals as of December 31, 2023, invests in stressed, distressed and special situation corporate credit opportunities, primarily in North America and Europe, and can dynamically pivot between the public and private markets. We employ what we believe to be a differentiated, solutions-based approach that is capable of being executed in any market environment. TPG AG Credit Solutions seeks to align with companies, financial sponsors and business owners and to use its structuring skill and capital base to create bespoke, bilaterally-negotiated financing transactions that help resolve complex and idiosyncratic financial challenges. TPG AG Credit Solutions funds may also opportunistically invest in securities acquired at what the investment team believes are discounted prices relative to their intrinsic value and offer the potential for contractual income and/or price appreciation. TPG AG Credit Solutions invests through its Credit Solutions and Essential Housing closed-ended funds, as well as its Corporate Credit Opportunities open-ended fund.
Product: TPG AG Structured Credit & Specialty Finance
TPG AG Structured Credit & Specialty Finance focuses on major non-corporate credit sectors, including consumer, residential and commercial real estate, and specialty lending markets, and also has substantial CLO debt and equity investing capabilities. TPG AG Structured Credit & Specialty Finance invests through Mortgage Value Partners Fund, an open-ended hedge fund, the Asset Based Credit Fund, a closed-ended fund, separately managed accounts (“SMAs”) and AG Mortgage Investment Trust, Inc. (NYSE: MITT) (“MITT”), an externally-managed, publicly traded residential mortgage real estate investment trust focused on investing in a diversified risk-adjusted portfolio of residential mortgage-related assets in the U.S. mortgage market. As of December 31, 2023, TPG AG Structured Credit & Specialty Finance had $15.8 billion in assets under management and 30 investment professionals.
Product: TPG AG Middle Market Direct Lending
TPG AG Middle Market Direct Lending, Twin Brook Capital Partners, focuses on sourcing, underwriting and actively managing a diversified portfolio of middle market, floating rate, senior secured loans, including revolvers, first lien debt and, opportunistically, second lien debt. As a direct lender to private equity sponsored middle market companies, the product focuses on opportunities where we can receive a pricing premium relative to broadly syndicated loans and relies on ongoing borrower support from sponsors. TPG AG Middle Market Direct Lending includes the MMDL closed-ended fund series, as well as a public, non-traded business development company (“BDC”), AG Twin Brook Capital Income Fund
(“TCAP”). As of December 31, 2023, TPG AG Middle Market Direct Lending had $20.6 billion in assets under management and 70 investment professionals.
Product: TPG AG CLOs
TPG AG CLOs, with $8.4 billion in assets under management and 14 investment professionals as of December 31, 2023, invests predominantly in non-investment grade senior secured bank loans. TPG AG issues U.S. CLOs investing predominantly in U.S. dollar-denominated loans, and Euro CLOs investing predominantly in Euro-denominated loans and secured bonds. TPG AG CLOs include performing credit bespoke vehicles, collateralized loan obligation (“CLO”) funds and direct investment in the tranches of Northwoods CLOs.
Product: TPG AG Multi-Strategy
TPG AG Multi-Strategy, with $2.0 billion in assets under management and 6 investment professionals as of December 31, 2023, invests across the breadth of TPG AG Credit, with a geographic focus in the United States and Western Europe. TPG AG Multi-Strategy offers actively managed co-mingled funds, including its Super Fund (“Super Fund”), in addition to bespoke vehicles and various multi-strategy credit funds of one. These funds invest in public and private investment opportunities sourced from across TPG AG Credit, as well as arbitrage strategies, including convertible arbitrage and merger arbitrage. TPG AG Multi-Strategy funds invest in, among other products, corporate loans and bonds; residential, consumer and asset-based loans and securities; hybrid instruments; and derivative securities, including currency and interest rate hedges.
TPG AG Real Estate
TPG Angelo Gordon’s real estate products (collectively referred to as “TPG AG Real Estate”) are (1) TPG AG U.S. Real Estate, (2) TPG AG Asia Real Estate, (3) TPG AG Europe Real Estate, and (4) TPG AG Net Lease. TPG AG Real Estate products in the United States, Asia and Europe primarily focus on the acquisition of equity interests of underperforming and undervalued assets in the United States, Asia and Europe, where we employ our opportunistic and value-add strategies to improve performance. TPG AG Net Lease primarily invests in single tenant commercial real estate acquired in simultaneous sale-leaseback transactions.
The following table presents certain data about our TPG AG Real Estate platform as of December 31, 2023 (dollars in billions):
| | | | | | | | | | | | | | | | | | | | | | | | | | |
| AUM | | Fee-earning AUM | | Active Funds | | Available Capital | | Investment Professionals |
| $ | 18 | | | $ | 14 | | | 26 | | $ | 7 | | | 85 |
Product: TPG AG U.S. Real Estate
TPG AG U.S. Real Estate, with $6.8 billion in assets under management, manages assets across various product sectors and has been active in many of the major U.S. real estate markets. TPG AG U.S. Real Estate focuses on purchasing what we believe to be underperforming and undervalued real estate assets, where we then execute an active asset management strategy to reposition and stabilize the properties. TPG AG U.S. Real Estate is diversified across property sectors, with a thematic portfolio construction focused on rental residential, industrial, self-storage, life science, student housing and medical office, among other sectors. As of December 31, 2023, TPG AG U.S. Real Estate had 28 real estate investment professionals in New York, Los Angeles and Bethesda focused by region and working with a network of over 90 local operating partners.
Product: TPG AG Asia Real Estate
TPG AG Asia Real Estate, with $5.3 billion in assets under management, manages assets across Asia, with investments primarily in Japan, South Korea, Hong Kong, China and Singapore. TPG AG Asia Real Estate focuses on capitalizing on opportunistic investments, primarily created through lack of real estate expertise, illiquidity or distress in many Asian markets. The TPG AG Asia Real Estate portfolio includes office, industrial, residential, hotel, retail, life science and other asset types. As of December 31, 2023, TPG AG Asia Real Estate had 20 real estate investment professionals in Hong Kong, Seoul and Tokyo working with a network of over 55 local operating partners.
Product: TPG AG Europe Real Estate
TPG AG Europe Real Estate, with $4.1 billion in assets under management, manages assets across Europe, with investments primarily located in major cities in Western Europe and the United Kingdom. TPG AG Europe Real Estate focuses on sub-performing and distressed real estate assets. Business plans may range from modest lease-up and operational improvement to more significant value-add strategies, which may require complete capital restructuring or asset repositioning to stabilize. The TPG AG Europe Real Estate portfolio includes industrial, residential, office, hotel, retail, student housing, self-storage and other asset types. As of December 31, 2023, TPG AG Europe Real Estate had 20 real estate investment professionals in London, Milan, Amsterdam and Frankfurt working with a network of 50 local operating partners.
Product: TPG AG Net Lease
TPG AG Net Lease, with $2.0 billion in assets under management, focuses on single tenant commercial real estate, generally leased to non-investment grade tenants, largely acquired in simultaneous sale-leaseback transactions. TPG AG Net Lease primarily purchases existing facilities that are integral to the ongoing operations of the tenants, such as a company’s manufacturing plant or distribution centers. TPG AG Net Lease manages assets primarily located within the United States, with certain assets in the United Kingdom, Western Europe, Canada and Mexico. As of December 31, 2023, TPG AG Net Lease had 17 investment professionals across New York and London.
Platform: Real Estate
We established our TPG real estate investing practice in 2009 to pursue real estate investments systematically and build the capabilities to do so at significant scale. We invest in real estate through four primary products: (1) TPG Real Estate Partners, (2) TPG Real Estate Thematic Advantage Core-Plus, (3) TPG RE Finance Trust, Inc. and (4) TPG Real Estate Credit Opportunities.
The following table presents certain data about our Real Estate platform as of December 31, 2023 (dollars in billions):
| | | | | | | | | | | | | | | | | | | | | | | | | | |
| AUM | | Fee-earning AUM | | Active Funds | | Available Capital | | Investment Professionals |
| $ | 18 | | | $ | 11 | | | 4 | | $ | 8 | | | 53 |
Product: TPG Real Estate Partners
TPG Real Estate Partners (“TREP”), with $11.3 billion in assets under management, focuses on acquiring and building platforms rather than investing on a property-by-property basis, which we believe creates more efficient operating structures and ultimately results in scaled investments that may trade at premium entity-level pricing in excess of the net asset value of individual properties. TREP utilizes a distinct theme-based strategy for sourcing and executing proprietary investments and, over time, many of these themes have aligned with TPG’s broader thematic sector expertise, particularly those pertaining to the healthcare and technology sectors.
Product: TPG Real Estate Thematic Advantage Core-Plus
TPG Real Estate Thematic Advantage Core-Plus (“TAC+”), with $1.7 billion in assets under management, is an extension of our opportunistic real estate investment program. TAC+ targets investments in stabilized (or near stabilized) high-quality real estate, particularly in thematic sectors where we have gained significant experience and conviction. The investment strategy is designed to enhance traditional core-plus objectives of capital preservation and reliable current income generation by applying our differentiated thematic approach, strategy and skillset.
Product: TPG RE Finance Trust, Inc.
TPG RE Finance Trust, Inc. (NYSE: TRTX) (“TRTX”) is externally-managed by an affiliate of TPG and directly originates, acquires and manages commercial mortgage loans and other commercial real estate-related debt instruments in North America for its balance sheet. The platform’s objective is to provide attractive risk-adjusted returns to its stockholders over time through cash distributions. As of December 31, 2023, the TRTX loan investment portfolio consisted of 53 first mortgage loans (or interests therein) and total loan commitments of $3.7 billion.
Product: TPG Real Estate Credit Opportunities
TPG Real Estate Credit Opportunities (TRECO) is our opportunistic, real estate credit strategy targeting risk-adjusted returns through investments primarily in real estate-related high-yield senior and subordinate loans and securities. TRECO focuses on select sectors and geographies where we have distinct expertise informed by our longstanding practice around theme development. The fund has a flexible mandate and will aim to invest opportunistically across the credit spectrum.
Platform: Market Solutions
Our Market Solutions platform leverages the broader TPG ecosystem to create differentiated products in order to address specific market opportunities.
The following table presents certain data about our Market Solutions platform as of December 31, 2023 (dollars in billions):
| | | | | | | | | | | | | | | | | | | | | | | | | | |
| AUM | | Fee-earning AUM | | Active Funds | | Available Capital | | Investment Professionals |
| $ | 9 | | | $ | 6 | | | 10 | | $ | 2 | | | 46 |
Product: TPG Public Equities
TPEP seeks to generate superior risk-adjusted returns through deep, fundamental private equity-style research in the public markets. TPEP is not siloed from our private investment businesses from an information perspective, which allows TPEP to collaborate with sector-focused teams across the rest of our firm and leverage TPG’s full intellectual capital and resources. TPEP currently manages a $2.1 billion long / short fund and a $1.9 billion long-only fund, both of which are managed with broad, opportunistic mandates.
Product: Capital Markets
Our dedicated capital markets group centralizes our in-house debt and equity advisory expertise and optimizes capital solutions for our investment professionals and portfolio companies. Primary activities include:
• Debt Capital Markets: (i) Structure and execute new deal and acquisition financings across leveraged loans, high yield bonds and mezzanine debt (privately placed and syndicated) and (ii) manage capital structures on an ongoing basis, including re-financings, re-pricings, hedging, amendments and extensions and other services.
• Equity Capital Markets: (i) Act as lead advisor and underwriter on capital raises and the monetization of our ownership stakes in the public equity markets, including initial public offerings, follow-on offerings, equity-linked products and subsequent realizations and (ii) provide dual-track and structured equity solutions advisory, among other services.
Through our capital markets activities, we generate underwriting, placement, arrangement, structuring and advisory fee revenue. In 2023, 2022 and 2021, our capital markets business drove $113.1 million, $117.4 million and $104.9 million in transaction revenue, respectively. We believe that the high margin profile of our business coupled with our consistent ability to deliver superior financing outcomes drives significant value to our portfolio companies and our stockholders.
Product: Private Markets Solutions
Our private markets solutions business is focused on pursuing investments in high-quality, stable private equity assets, alongside third-party sponsors, typically through continuation vehicles, funds or underlying third-party investment managers who will continue to control such assets in which the funds invest. Our private markets solutions business is organized into two businesses: (1) NewQuest and (2) TPG GP Solutions (“TGS”).
NewQuest Capital Partners
NewQuest seeks to acquire private equity positions on a secondary basis in underlying portfolio companies whose businesses are substantially based in the Asia Pacific region. With an investment team of approximately 30 professionals and $3.0 billion in assets under management as of December 31, 2023, NewQuest is principally focused on complex secondary transactions.
TPG GP Solutions
Established in 2021, TGS was created to invest in high-quality private equity assets, which are principally based in North America and Europe, in partnership with third-party general partners. TGS brings a primary private equity approach to the general partner-led secondaries market that leverages the TGS team’s deep investing experience and the insights and expertise of the broader TPG ecosystem.
Organizational Structure
The following diagram provides a simplified illustration of our organizational structure as of December 31, 2023. Certain entities depicted below may be held through intervening entities not shown in the diagram.
___________
(1)GP LLC (as defined herein) is owned by entities owned by Messrs. Bonderman, Coulter and Winkelried. GP LLC owns the entity that serves as the general partner of the entity that holds 100% of the shares of Class B common stock outstanding.
(2)Includes pre-IPO investors and Angelo Gordon founder partners.
Environmental, Social and Governance (“ESG”)
We have a longstanding practice of integrating material ESG factors into our investment process. Reflecting an enduring commitment to build strong, sustainable companies, we adopted our first ESG policy in 2012, became a signatory to the UN Principles for Responsible Investment in 2013, became a supporter of the Taskforce on Climate-Related Financial Disclosures in 2019, and are a supporter of the Sustainability Accounting Standards Board (SASB, now part of IFRS Foundation). Each year, we seek to continue to deepen the analysis-driven insights from the integration of ESG factors into our investment processes and operating philosophy where we believe these efforts can contribute to value creation and risk mitigation.
Y Analytics is our purpose-built capability to understand and inform decision making about the environmental and social impacts of deployed capital. The Y Analytics team supports TPG, our funds and our portfolio companies by assessing and advising on risk management and value creation through ESG performance. It was created in 2018 to conduct impact assessments and measure ESG performance for the Rise Fund, but it has expanded to also provide leadership and support to our investment professionals on ESG topics throughout the lifecycle of investments. ESG considerations are reflected in a variety of components of our investment due diligence processes. Our goal in conducting ESG assessments is to use financially material, investment-specific sustainability risk and performance factors and indicators to determine the potential for ESG-related risk and value creation, and to support a holistic understanding and appropriate discussion of these findings during investment decision-making and post-closing.
In addition to investment-specific support, Y Analytics leads our ESG Strategy Council, which is comprised of members of our investment teams as well as representatives from Y Analytics and multiple other functions, including Legal and Compliance, Human Capital and Operations. Our commitment to ESG is also supported by our cross-functional Diversity, Equity and Inclusion Council and Cybersecurity Steering Committee. ESG matters are brought before our board of directors on a periodic basis. We also seek to advance ESG and impact-related priorities through firm initiatives and investment-related actions, including:
Portfolio Board Diversity: Consistent with our core value of promoting diversity, equity and inclusion, we support the diversity of our portfolio company boards.
Employee Ownership: Across our investing platforms, a range of our portfolio companies have established incentive profit-sharing programs to create economic opportunity for employees and deliver recruiting, retention and productivity benefits to companies. In 2022, we became a founding member of Ownership Works, a non-profit advancing shared ownership programs, and continue to implement Ownership Works programs in our portfolio where appropriate.
Climate Change Action: We have long recognized the importance of considering the opportunities and financially material risks posed by climate change. Our climate strategy includes understanding our firm-wide operational and financed emissions and physical and transition-related risks in our portfolio.
We have analyzed, verified and publicly reported our firm-wide operational emissions for each year since 2019. Our operational emissions footprint includes the emissions associated with our firm’s offices and our employees’ activities (Scope 1, Scope 2 and certain categories of Scope 3 emissions). In addition to evaluating operational emissions reduction opportunities on an ongoing basis, we have purchased carbon credits we believe to be high-quality to address our measured and verified emissions in each verified year. We intend to continue this process for 2023, for which emission measurement is subject to ongoing verification, as a complementary component of our broader climate strategy. We do not deduct these purchased credits from our reported emissions.
We also provide support to investment professionals and certain portfolio companies regarding climate resilience and decarbonization aligned with their business strategies – either through direct advisory support or through reference to our external network of advisors and consultants.
Creating Innovative Platforms: A key reflection of our commitment to environmental and social impact has been our creation of leading platforms for pursuing investments in companies that deliver a positive impact in addition to financial returns. These have included: The Rise Fund, which launched in 2016 and raised its successor funds in 2020 and 2023; TPG Rise Climate, which launched in 2021; Evercare, which has been part of TPG since 2019; and TPG NEXT, which made its first balance sheet investments in 2019 and launched in 2023. This work plays an important role in seeking to bring scaling capital to environmentally and socially beneficial solutions beyond the venture stage.
See “—Platforms—Platform: Impact” for further discussion of these platforms.
Human Capital Resources
The quality of our investments and our ability to build great companies depends on the caliber of our people. Our people are one of our core strengths and principal reasons for our success. They are the key to our culture of integrity, innovation and collaboration. We aim to foster a welcoming and inclusive work environment with opportunities for growth and development to attract and retain a high-performing team. As of December 31, 2023, we have approximately 1,850 full-time employees, including over 650 investment and operations professionals, over 970 non-investment and fundraising professionals, and more than 200 support staff, located in offices across Asia-Pacific, Europe, the Middle East, and North America.
Talent Development and Retention
We believe our culture, the breadth of our platforms and our track record for strong investment performance help us attract, develop and retain the best talent in our industry. We regularly review and evaluate our internal processes for ways to improve employee engagement, productivity and efficiency.
Recognizing that feedback is critical to driving career development and growth, as well as overall employee engagement, we have developed a robust feedback framework, which includes opportunities for all employees to both provide and receive feedback through our annual 360 degree review process. In addition, our employees set goals at the beginning of the year in partnership with their managers and receive feedback throughout the year. Our annual review process is a competency-based assessment, including “core” competencies that are consistent across the firm regardless of function or title. These competencies are aligned with the firm’s values and are attributes that we believe are important to the success of all employees.
Our year end 360 degree review process is designed to encourage feedback from employees of all levels and includes a self-assessment, which summarizes key accomplishments, development areas and status of the goals set earlier in the year. All employees measure themselves and their colleagues based on firmwide and business-unit specific competencies, which are customized by function and level. In addition, select employees receive a Manager Effectiveness evaluation, which measures managers on key attributes of effective management and leadership skills. We offer training and resources at each stage of the process to help ensure that employees have productive, thoughtful and candid performance conversations.
Employees who joined the firm as part of the acquisition of Angelo Gordon participated in a separate annual performance review process for 2023 and will begin to transition to our 360 review process in 2024.
In order to invest in our people and to foster community, we continue to expand our employee and manager training programs, as described in detail under “—Learning and Engagement Initiatives” below.
Learning and Engagement Initiatives
Employee Training and Mentorship: We have instituted various “learning initiatives” as a part of our commitment to invest in the development of our employees. These learning initiatives focus on a variety of areas, including culture, diversity, equity and inclusion (“DEI”), functional and technical knowledge, leadership and management and professional growth. We have tailored learning initiatives for our new employees to facilitate their integration into the firm.
In addition to our learning initiatives, we provide our employees access to e-learning resources that have been curated based on our analysis of performance review data. These curated learning paths align with our internal performance management competencies, including risk management, DEI and specific functional knowledge. In furtherance of our goal of developing an inclusive workforce, over the past few years we have held firmwide training on unconscious bias, allyship, harassment awareness and prevention. Our harassment awareness and prevention training also covers protocols for bystander intervention. Employees who joined the firm as part of the acquisition of Angelo Gordon participated in harassment awareness and prevention training in 2023 in jurisdictions where it is required, and all employees have access to the online training throughout the year.
We believe that external learning opportunities also benefit our employees and foster our culture of continuous learning. We offer our employees a learning reimbursement stipend to encourage them to apply for certifications and attend classes or conferences related to their role to further their professional growth.
We believe our culture of apprenticeship also helps to ensure our employees feel connected to the greater firm as they learn, grow and develop by partnering with their colleagues. For example, through Jump Start, one of our formal mentoring programs, our junior employees are matched with a mentor and senior sponsor to create opportunities for connectivity and personal development.
Manager Training: We also believe it is important to invest in our managers to strengthen the firm and provide a positive experience for our employees. In order to develop strong managers, we have equipped them with new resources, virtual and classroom trainings and communication mechanisms to help guide feedback and professional growth conversations.
Advancing Diversity, Equity and Inclusion
We believe that the quality of our investments and our ability to build great companies depend on the originality of our insights. Promoting diversity, equity and inclusion is one of our core values, which is embedded into the highest levels of our firm and by our DEI Council. The DEI Council is a 15-member partner steering committee led by our President and the Co-Managing Partner of Capital and our Head of Y Analytics. Our actions include investing in diverse-led investment managers and investing in our people:
Investing in Diverse-led Investment Managers: We launched TPG NEXT to seed new managers, strengthen their access to capital, offer business building expertise and provide strategic advisory support to talent that is chronically underrepresented in alternative asset management. The strategy aims to increase the number of diverse-led firms in alternative assets, aligning the industry more closely with broader demographic trends. TPG NEXT leverages the full TPG ecosystem by combining capital, operating expertise and the broad reach of its network to help underrepresented founders and teams build businesses for the future. The firm began investing in diverse managers in 2019 and in 2023, we announced the launch of the inaugural TPG NEXT fund, which is designed to back the next generation of underrepresented alternative asset managers. TPG Next continues to raise third-party capital to invest in what we believe are compelling opportunities set across the diverse manager landscape.
Investing in Our People: In addition to the work of our DEI Council, we strive to ensure that our DEI strategy is embedded in the key pillars of our firm’s talent strategy, including recruiting, employee retention and employee development. From a diversity recruiting perspective, we have enhanced our collaborations with key external organizations to diversify our sourcing and networks. As a result, 71% and 69% of global new hires that we recruited during each of the years ended December 31, 2023 and 2022, respectively, are racially or ethnically diverse, gender diverse or identify as LGBTQ+.
Employee retention also is a key part of our DEI strategy and efforts. Our people are encouraged to engage with and support one another through our six affinity groups, which include Asian, Black, Hispanic/Latino, LGBTQ+, Veterans and Women groups, that were formed to cultivate and retain a diverse, equitable and inclusive workforce. Partner-sponsored initiatives, such as our Associate Mentoring Program, Women’s Mentoring Program and Diversity Roundtable discussions, are critical ways for us to ensure an inclusive employee experience. With respect to employee development, we proactively build a diverse pipeline at all levels of the firm and actively identify talented diverse employees early in their careers. We seek to ensure that their careers are proactively managed and that they are developed for future opportunities. For our annual performance processes over the last four years, 53% of our promotes below partner level, in addition to 33% of our partner promotes, have been racially or ethnically diverse, gender diverse or identify as LGBTQ+.
TPG supports the importance of racial and social equality. We have released public statements regarding racial and social equality and women’s and LGBTQ+ rights, and have made financial contributions to and partnered with various non-profits focused on diversity, equity and inclusion. We also joined organizations that support women and racial diversity, including those that support board and executive leadership diversity.
For more information on our portfolio board diversity initiative, see “—Environmental, Social and Governance Action” above.
Health and Wellness
We are committed to the health, safety and wellness of our people and offer comprehensive health and welfare benefit plans and retirement offerings as well as a variety of wellness benefits. These include healthcare and insurance benefits, paid time-off, family leave and family planning resources.
We care deeply about the overall emotional well-being of our employees. We offer employee well-being programs designed to meet the needs of our diverse employee population, including access to mental health support through our medical plan, access to online meditation platforms and learning resources that teach methods to mitigate burn out, focus on self-care and increase productivity.
Compensation and Benefits
We believe that we provide a competitive compensation, benefits and total rewards framework to support the performance of the firm as a whole and each individual’s contributions to the firm. We believe that our compensation and incentive programs support our culture and long-term strategic business objectives while mitigating excessive risk-taking. Our programs are designed to recruit, incentivize and retain top talent and to promote a culture of performance and meritocracy. We believe that our performance-based incentive compensation structure helps to ensure that our people’s interests align with the interests of our shareholders and other stakeholders, which include alignment with the firm’s financial performance and goals.
Compensation generally is comprised of a base salary (or hourly rate) and a discretionary annual incentive that is determined based on a number of performance considerations, including firm, platform, product, department and individual performance.
To further align the interests of our people with stakeholders and to cultivate a strong sense of ownership and commitment to our firm, certain employees also are eligible to receive equity awards and/or participate in other long-term incentive programs. Additionally, certain of our people are eligible to make co-investments in or alongside our funds and other vehicles we manage.
Senior Advisors and Other Advisors and Consultants
To complement the expertise of our people, we also engage senior advisors and other advisors and consultants. While these individuals are not employed by us, they provide us with additional operational and strategic insight. The responsibilities of senior advisors and other advisors and consultants include serving on the boards of our portfolio companies, assisting us in sourcing and evaluating individual investment opportunities and assisting portfolio companies with operational matters. These individuals include current and former chief executive officers, chief financial officers and chairpersons of major corporations, and others holding leading positions of corporations and agencies worldwide.
Corporate Social Responsibility
We strive to invest in our local communities and engaging our people and other stakeholders in making a meaningful impact, whether through charitable donations or volunteer time. The firm hosts a wide range of volunteering opportunities, including serving meals at local shelters, mentoring local students, and building and coordinating delivery of care packages to U.S. troops. Additionally, we participate in corporate sponsorships and partnerships and offer a donation matching program. At a firm level, we have focused much of our civic engagement on our commitment to equality. We engage on public issues to advance equality, such as immigration, gender and racial discrimination, women’s issues and access to education. For example, in 2017, we authored guidance for our portfolio companies encouraging preservation of Deferred Action for Childhood Arrivals (DACA) and providing support and financial resources to those impacted. In 2018, we joined the Business Coalition for the Equality Act. In 2019, we were the only private equity firm to sign an amicus brief to the U.S. Supreme Court in support of non-discrimination protections for LGBTQ+ people in federal civil rights law.
Investment Process
We maintain a rigorous investment process and a comprehensive due diligence approach across all of our platforms. We have developed policies and procedures that govern the investment practices of our funds. Moreover, individual funds can be subject to certain investment requirements and limitations, including the types of assets in which the fund can invest, the amount that can be invested in any one company, the geographic regions in which the fund will invest and potential conflicts of interest that may arise from investing activities. Our investment professionals are familiar with our investment policies and procedures and the investment criteria applicable to the funds they manage, and these limitations have generally not negatively impacted our ability to invest our funds. Additionally, our investment professionals frequently interact across our platforms on a formal and informal basis. We have in place certain procedures to allocate investment opportunities among our funds in a way that complies with our duties as managers of the applicable funds and that we believe is equitable, fair and in the best interests of the applicable funds.
Our investment professionals are actively involved in the investment process. Generally, they directly or indirectly lead with identifying, evaluating, structuring, performing diligence, conveying terms, executing, monitoring and exiting investments. We strive to be creative and look for deals in which we can leverage our competitive advantages and sector and geographical experience. Our investment professionals perform significant research into each prospective investment, including, based on the type of investment a review of the prospective investment’s performance, projection, market position, capital structure, financial statements, comparisons of other public and private companies and comparative transactions and relevant industry and market data. For our private equity investments, the due diligence effort also typically includes on-site visits, interviews and meetings with management, research, evaluation and analyses related to the potential investment’s industry, markets, products and services, and competitive positioning, and background checks of the management team.
For our businesses with an investment review committee, our investment professionals submit investment opportunities and analysis for review and consideration. The investment review committees are generally comprised of senior leaders and investment professionals of the applicable platform, and in many cases, senior leaders of the firm. The process involves detailed review of the transaction and investment thesis, business, risk factors and diligence issues, as well as financial models. Considerations involved when evaluating an investment may include, depending on the nature of the investing business and its strategy, the quality, market position and growth potential of the target company or asset in which the fund proposes to invest, the quality and reputation of the target company’s management team, the sale process for such target company or asset, likely exit strategies and factors that could reduce the value of the target company or asset at exit, the target company or asset’s size and sensitivity to cash flow generation, the portfolio fit and macroeconomic trends in the relevant geographic region or industry.
After discussing the proposed deal with the deal team, the applicable investment review committee will decide whether to give its preliminary approval to the deal team to continue evaluating and performing diligence on such potential investments and will direct the team on conveying necessary terms. The applicable investment review committee may conduct several meetings to consider a particular deal. Both at such meetings and in other discussions with the deal team, the applicable investment review committee will direct our investment professionals on terms, strategy, process and other important considerations.
Existing investments are reviewed and monitored on a regular basis by investment professionals and with routine investment performance reporting to senior leaders of the applicable platforms. In addition, where applicable, our investment professionals and portfolio operations teams work directly with our portfolio company senior executives to identify opportunities to drive operational efficiencies and growth. Our investment professionals are also responsible for making recommendations with respect to when and how to exit an investment to maximize value for our investors.
Structure and Operation of Our Funds
Structure and Management of Investment Vehicles
We manage most of our funds and other similar private vehicles primarily by organizing a limited partnership or other limited liability entity to serve as the general partner of a limited partnership (a fund) organized by us to accept investors’ commitments. Investors in our funds generally make commitments to provide capital at the outset of a fund and deliver capital when called by us as investment opportunities become available. We determine the amount of initial capital commitments for such funds by taking into account current market opportunities and conditions, as well as investor expectations. We and our affiliates generally also make a commitment to our funds, which can be as much as 5% of the fund’s total limited partner capital commitments. Fund commitments are generally available for investment and other fund purposes during what we call the investment period or commitment period, which typically runs six or fewer years for each fund. After that time, commitments may be used for follow-on investments and other fund purposes. In the case of our separately managed accounts, primarily related to TPG Angelo Gordon, the investor, rather than we, generally controls the investment vehicle that holds or has custody of the investments we advise the vehicle to make. For most of our historic TPG funds, as each investment is realized, these funds first return the capital related to that investment, any previously realized or written down investments and certain fund expenses to fund investors and the general partner. The general partners of our historic TPG funds are then generally entitled to a performance allocation of 20% of the remaining profits, subject to preferred returns or high watermarks, where applicable. The general partners of the TPG Angelo Gordon funds are generally entitled to a performance allocation of up to 20% after a catch-up allocation, subject to preferred returns or high watermarks, where applicable. Certain funds may make distributions to the general partner to provide the general partner with cash sufficient to pay applicable federal, state and local tax liabilities to the extent distributions from such funds for the relevant year were otherwise insufficient to cover such tax liabilities.
Our private investment funds typically have a term of six to ten years or more, subject to the potential for extensions with investor consent. Dissolution of certain of those funds may be accelerated upon a vote of investors (often 75% in interest, with a simple majority sufficing for some funds) not affiliated with us and terminated upon the occurrence of certain other specified events. Ownership interests in most of our private funds are not, however, subject to redemption prior to termination of the funds. Our TPEP funds are structured as funds where the investor’s capital is fully funded on the subscription date.
In general, each fund that is a limited partnership has a general partner that is responsible for the management and operation of the fund’s affairs and makes all policy and investment decisions relating to the fund’s activities. The general partner is responsible for all decisions concerning the day-to-day management and operations of the fund and relies upon the fund’s investment manager to implement such decisions pursuant to a management (or similar) agreement. Generally, the limited partners of our funds take no part in the conduct or control of such funds, have no right or authority to act for or bind such funds, and have no influence over the voting or disposition of the securities or other assets held by such funds, although such limited partners may vote on certain partnership matters, including certain amendments to the partnership agreement or early liquidation of the partnership. In addition, the governing agreements of many of our funds provide that in the event certain “key persons” do not devote the requisite time and attention, then the fund’s commitment period will generally be automatically suspended for a period of time, typically 60 or 90 days, and, depending on the fund’s governing documents, may be terminated unless a majority in interest of the fund’s investors elect to continue the commitment period or an appropriate successor is approved by the fund’s advisory committee. Further, investors in such funds may have the right to vote to terminate the commitment period by a specified percentage in interest (including, in certain cases, a simple majority) vote in accordance with specified procedures. The governing agreements of certain funds also provide that investors have the right to terminate the investment period for any reason by a vote of 75% of the interests in such fund (with some funds only requiring a simple majority). Most of our funds also have an advisory committee, comprising representatives of certain limited partners, which may consider or waive conflicts of interest or other restrictions in the partnership agreement or otherwise consult with the general partner on certain partnership matters.
There are non-U.S. funds that are structured as corporate or non-partnership entities under applicable law. Two of the vehicles that we manage, TRTX and MITT, are publicly traded corporations. We also manage TCAP, a business development company. None of TRTX, MITT or TCAP have redemption provisions or a requirement to return capital to investors upon exiting the investments made with such capital, except as required by applicable law (including distribution requirements that must be met to maintain real estate investment trust (“REIT”) or regulated investment company (“RIC”) status, as applicable).
Our funds are each generally advised by a TPG entity serving as investment adviser that is registered under the Investment Advisers Act of 1940, as amended (the “Advisers Act”). Our investment advisers are generally entitled to a management fee from each investment fund for which they serve as investment advisers. For a discussion of the management fee to which our investment advisers are entitled, see “—Incentive Arrangements and Fee Structure” below. Investment funds themselves typically do not register as investment companies under the Investment Company Act of 1940, as amended (the “Investment Company Act”), in reliance on Section 3(c) or Section 7(d) thereof. Section 3(c)(7) of the Investment Company Act exempts from the Investment Company Act’s registration requirements investment funds whose securities are owned exclusively by persons that, at the time of acquisition of such securities, are “qualified purchasers” as defined under the Investment Company Act and purchase their interests in a private placement. Section 3(c)(1) of the Investment Company Act exempts from the Investment Company Act’s registration requirements investment funds whose securities are beneficially owned by not more than 100 persons that purchase their interests in a private placement. In addition, under certain current SEC interpretations, Section 7(d) of the Investment Company Act exempts from registration any non-U.S. investment fund all of whose outstanding securities are beneficially owned either by non-U.S. residents or by U.S. residents that are qualified purchasers and purchase their interests in a private placement. Certain of our investment funds, however, rely on other exemptions from the Investment Company Act or register as investment companies or business development companies under the Investment Company Act.
Incentive Arrangements and Fee Structure
Management Fees
A fund’s investment adviser generally receives a management fee based on a percentage of the fund’s capital commitments, or the fund’s invested capital, funded commitments, cost of investments or Net Asset Value (“NAV”), depending on the fund’s terms and stage in its lifecycle. Management fees are payable on a regular basis, typically quarterly or semi-annually, in the contractually prescribed amounts over the life of the fund. Depending on the base on which management fees are calculated, negative performance of one or more investments in a fund may reduce the total management fee paid for the relevant period, but not the fee rate. Management fees may also be offset by the investment advisers’ receipt of transaction, monitoring or other fees, as described in more detail under “Transaction, Monitoring and Other Fees” below. Management fees received are generally not subject to clawback.
The investment adviser of our funds generally receives a management fee based on a percentage of the fund’s net asset value. These management fees are payable on a regular basis, typically quarterly. These funds generally permit investors to withdraw or redeem their interests periodically, in some cases following the expiration of a specified period of time when capital may not be withdrawn. Decreases in the net asset value of investor’s capital accounts may reduce the total management fee paid for the relevant period, but generally not the fee rate. We also provide investment management services to certain funds in which we earn management fees and incentive fees based on their equity value and core earnings, subject to preferred returns or high watermarks, where applicable. The associated management fees and incentive fees are payable quarterly in arrears. The management fees received by our investment advisers that earn fees based on equity value are also not subject to clawback.
Transaction, Monitoring and Other Fees
The investment advisers to certain of our funds, or other affiliated entities, may receive special fees, including transaction, monitoring and other fees, when, for example, they provide capital structuring or other advice to our portfolio companies, generally in connection with debt and equity arrangements and underwriting and placement services. Monitoring fees are paid when the investment adviser provides a portfolio company monitoring services. In some cases, transaction, monitoring or other similar fees will offset the management fee received by the applicable fund.
Performance Allocations
As part of its partnership interest in a fund and, in addition to a return on its capital interest in a fund, the general partner or an affiliate is typically entitled to receive performance allocations from a fund. Generally, this means that the general partner’s partnership interest in the fund will entitle it to a share of the fund’s net profits. Performance allocations have historically accounted for a significant portion of the income we realize from our fund general partnership interests.
Performance allocations are generally calculated on a realized basis, and each general partner (or affiliate) is typically entitled to an allocation of 20% of the net realized profits (also taking into account, among other things, unrealized losses) generated by such fund. Net realized income or loss is not netted between or among funds.
Performance allocations are subject to limited partner preferred returns or high watermarks, where applicable, and subject to a catch-up allocation to the general partner. Generally, if at the termination of a fund (and in some cases at interim points in the life of a fund), the general partner received distributions of performance allocations over the life of the fund in excess of its allocable share under the applicable partnership agreement, the general partner will be obligated to repay an amount equal to the extent the previously distributed performance allocations exceeded its allocable share. This is known as a “clawback” obligation. To the extent we are required to fulfill a clawback obligation, we may decrease the amount of our dividends to our stockholders. The clawback obligation operates with respect to a given fund’s own net investment performance only, and performance allocations of other funds are not netted for determining this contingent obligation. Moreover, the governing agreements of most of our funds generally provide a guarantee of clawback obligations to fund investors from the TPG Operating Group (directly or indirectly) although we retain the right to pursue any remedies that we have against performance allocation distributees who do not return to us such distributions. We have recorded a contingent repayment obligation of $58.3 million as of December 31, 2023, equal to the amount that would be due if the various funds were liquidated at their current carrying value.
Certain funds may make distributions to their partners, including the general partner, to provide them with cash sufficient to pay applicable federal, state and local tax liabilities attributable to the fund’s income that is allocable to them. These distributions are referred to as tax distributions and to the extent received by a fund’s general partner are not subject to clawback.
For additional information concerning the clawback obligations we could face, see “Item 1A. Risk Factors—Risks Related to Our Business—The clawback provisions in our governing agreements may give rise to contingent obligations that may require us to return amounts to our funds and fund investors.”
Capital Invested in and Alongside Our Funds
To further align our interests with those of our funds’ investors, we and our professionals have invested our own capital in and alongside the funds we sponsor and manage. Minimum general partner capital commitments to our funds are determined separately with respect to each fund. We may, from time to time, invest in excess of contractually required minimums and/or exercise our right to purchase additional interests in our funds that become available in the ordinary course of their operations. Our general partner capital commitments are funded with cash and not with performance allocations or deferral of management fees. In addition, certain qualified professionals are required and/or permitted, subject to certain restrictions, to invest in or alongside the funds we sponsor and manage. Fees assessed on such investments by our professionals may be eliminated or substantially reduced.
Investors in many of our funds, as well as certain other investors, may have the opportunity to co-invest alongside our funds. Co-investments are investments in portfolio companies or other fund assets generally on the same terms and conditions as those to which the applicable fund is subject.
Competition
We compete with other alternative asset management firms, as well as global banking institutions and other types of financial institutions, for people, investors and investment opportunities. Generally, our competition varies across platforms, geographies and financial markets. We compete for outside investors based on a variety of factors, including investment performance, transaction execution skills, the quality of services provided to investors, access to and retention of qualified professionals, reputation and brand recognition, business relationships, depth of our product offering and the level of fees and expenses charged for services. We believe that competition for investment opportunities varies across platforms but is generally based on industry expertise and potential for value-add pricing, terms, the structure of a proposed investment and certainty of execution.
In addition to these traditional competitors within the global alternative asset management industry, we also face competition from local and regional firms, financial institutions and sovereign wealth funds in the various countries in which we invest. In certain emerging markets, local firms may have more established relationship with the companies in which we are attempting to invest. In addition, large institutional investors and sovereign wealth funds have begun to develop their own in-house investment capabilities and may compete against us for investment opportunities.
Legal and Compliance
Our legal and compliance team includes over 80 attorneys, compliance professionals and paralegals. In addition to supporting our corporate functions, the legal team supports our investment team across all investments made by us on behalf of our clients and investors. The compliance team is responsible for overseeing and enforcing our policies and procedures relating to compliance with securities laws and related rules and regulations and our code of ethics, as well as the compliance policies and procedures and laws and regulations that apply to our non-U.S. subsidiaries and operations.
Regulation and Compliance
Our businesses, as well as the financial services industry generally, are subject to extensive regulation in the United States and elsewhere. The level of regulation and supervision to which we are subject varies from jurisdiction to jurisdiction and is based on the type of business activity involved. We, in conjunction with our outside advisors and counsel, seek to manage our business and operations in compliance with such regulation and supervision. The regulatory and legal requirements that apply to our activities are subject to change from time to time and may become more restrictive, which may make compliance with applicable requirements more difficult or expensive or otherwise restrict our ability to conduct our business activities in the manner in which they are now conducted. Our businesses have operated for many years within a legal framework that requires us to monitor and comply with a broad range of legal and regulatory developments that affect our activities. However, additional legislation, changes in rules promulgated by self-regulatory organizations or changes in the interpretation or enforcement of existing laws and rules, either in the United States or elsewhere, may directly or indirectly affect our mode of operation and profitability. Each of the regulatory bodies with jurisdiction over us, and our portfolio companies and investments, has regulatory powers dealing with many aspects of financial services, including the authority to grant, and in specific circumstances to cancel, permissions to carry on particular activities. Any failure to comply with these rules and regulations could expose us to liability or reputational damage.
Rigorous legal and compliance analysis of our businesses and investments is important to our culture. We strive to maintain a culture of compliance through the use of policies and procedures, such as our code of ethics, compliance systems, and education and training for our people. Our compliance policies and procedures address a variety of regulatory and compliance risks such as the handling of material non-public information, personal securities trading, anti-bribery, valuation of investments, document retention, potential conflicts of interest and the allocation of investment opportunities.
Although we have placed certain businesses behind permanent information barriers, we generally allow for information to flow freely among many of our other investment platforms. In an effort to manage possible risks relating to the receipt of material, non-public information and our decision not to implement information barriers among many investment platforms, we maintain a list of issuers applicable to each side of an information barrier for which we have access to material, non-public information and in whose securities the funds, accounts and investment professionals on that side of the information barrier are not permitted to trade. We could in the future decide that it is advisable to establish additional permanent or temporary information barriers, particularly as our business expands and diversifies. In the event we establish additional information barriers, synergies across our businesses will be further reduced.
United States
Regulation as an Investment Adviser
Certain of our subsidiaries are registered with the SEC as investment advisers under the Advisers Act, including TPG Global Advisors, LLC, TPG Capital Advisors, LLC, TPG PEP Advisors, LLC, TPG Real Estate Advisors, LLC, TPG RE Finance Trust Management, L.P., TPG Solutions Advisors, LLC, Angelo Gordon & Co., L.P., AGTB Fund Manager, LLC, and the subsidiaries that are relying advisers and rely on umbrella registration to be registered as investment advisers with the SEC. All of our SEC-registered investment advisers are subject to the requirements and regulations of the Advisers Act that include anti-fraud provisions, upholding fiduciary duties to advisory clients, maintaining an effective compliance program, managing conflicts of interest, record-keeping and reporting requirements, and disclosure requirements. In addition, our registered investment advisers are subject to routine periodic and other examinations by the staff of the SEC. The Advisers Act generally grants the SEC broad administrative powers, including the power to limit or restrict an investment adviser from conducting advisory activities if it fails to comply with federal securities laws. Additional sanctions that may be imposed for failure to comply with applicable requirements include the prohibition of individuals from associating with an investment adviser, the revocation of registrations and other censures and fines.
Regulation Under the Investment Company Act
We regard ourselves as an alternative asset management firm. We believe that we are engaged primarily in the business of providing asset management services and not in the business of investing, reinvesting or trading in securities. We also believe that the primary source of income from each of our businesses is properly characterized as income earned in exchange for the provision of services. We hold ourselves out as an alternative asset management firm and do not propose to engage primarily in the business of investing, reinvesting or trading in securities. Accordingly, we do not believe that either TPG Inc. or the TPG Operating Group is an “orthodox” investment company as defined in section 3(a)(1)(A) of the Investment Company Act. Further, a majority of the TPG Operating Group’s assets consist of indirect ownership interests in the general partners or managing members of the funds we sponsor. We believe these interests in the general partners or managing members are not investment securities. The TPG Operating Group also holds minority interests in certain operating subsidiaries that are consolidated on the TPG Operating Group’s financial statements as “variable interest entities.” See Note 11, “Variable Interest Entities,” to the Consolidated Financial Statements for additional information regarding our variable interest entities. The TPG Operating Group’s interests in these subsidiaries may be considered investment securities under section 3(a)(1)(C) of the Investment Company Act (“section 3(a)(1)(C)”). However, the value of these subsidiaries is not large enough to cause the TPG Operating Group’s holdings in investment securities to exceed the 40% threshold under section 3(a)(1)(C). TPG Inc.’s assets consist primarily of units representing approximately 22% of the TPG Operating Group held through its 100% interest in certain holding companies. TPG Inc. is also the owner of the entities serving as the general partner of the TPG Operating Group partnerships and, in such capacity, indirectly controls all of the TPG Operating Group’s business and affairs. We do not believe TPG Inc.’s interests in these units or the general partners are investment securities. Therefore, we believe that less than 40% of TPG Inc.’s total assets (exclusive of U.S. government securities and cash items) on an unconsolidated basis comprise assets that could be considered investment securities. Accordingly, we do not believe TPG Inc. is an inadvertent investment company by virtue of the 40% test in section 3(a)(1)(C). In addition, we believe TPG Inc. is not an investment company under section 3(b)(1) of the Investment Company Act because it is primarily engaged in a non-investment company business. Regulation as a Broker-Dealer
TPG Capital BD, LLC (“TPG Capital BD”), one of our subsidiaries, is registered as a broker-dealer with the SEC under the Securities Exchange Act of 1934, as amended (the “Exchange Act”) and is subject to regulation and oversight by the SEC and is a member of the Financial Industry Regulatory Authority (“FINRA”) and is registered as a broker-dealer in all 50 states and the District of Columbia. FINRA, a self-regulatory organization subject to oversight by the SEC, adopts and enforces rules governing the conduct, and examines the activities, of its member firms, including TPG Capital BD. State securities regulators also have regulatory oversight over TPG Capital BD. TPG Capital BD is an affiliated entity through which we conduct U.S.-based fundraising and capital markets activities, and administer a compliance program designed to comply with applicable anti-money laundering requirements. Broker-dealers are subject to regulations that cover all aspect of the securities business, including, among others, the implementation of a supervisory control system over the securities business, advertising and sales practices, conduct of public and private securities offerings, maintenance of adequate net capital, record-keeping, and the conduct and qualifications of persons associated with the broker-dealer. In particular, as a registered broker-dealer and member of FINRA, TPG Capital BD is subject to the SEC’s “net capital rule,” Rule 15c3-1. Rule 15c3-1 specifies the minimum level of net capital a broker-dealer must maintain, requires that a significant part of a broker-dealer’s assets be kept in relatively liquid form and imposes certain requirements that may have the effect of prohibiting a broker-dealer from distributing or withdrawing capital and requiring prior notice to the SEC for certain withdrawals of capital. The SEC and various self-regulatory organizations impose rules that require notification when net capital of a broker-dealer falls below certain predefined criteria, limit the ratio of subordinated debt to equity in the capital structure of a broker-dealer and constrain the ability of a broker-dealer to expand its business under certain circumstances. Violation of the net capital rule may result in censures, fines, the issuance of cease-and-desist orders, revocation of licenses or registrations, the suspension or expulsion from the securities industry of the broker-dealer or its associated persons or other similar consequences by regulatory bodies.
Regulation as a Real Estate Investment Trust
TRTX and MITT have elected and qualified to be taxed as a REIT under the U.S. Internal Revenue Code of 1986, as amended (the “Code”). To maintain its qualifications as a REIT, TRTX and MITT generally must distribute at least 90% of their respective net taxable income to its stockholders and meet, on a continuing basis, certain other complex requirements under the Code.
Regulation as a BDC
TCAP has elected to be regulated as a business development company under the Investment Company Act. Many of the regulations governing TCAP restrict, among other things, the amount of leverage it can incur and co-investments and other transactions with other entities within our corporate structure. Certain of our products may be restricted from engaging in transactions with TCAP. AGTB Fund Manager, LLC, our subsidiary and affiliate, serves as the investment adviser to the BDC.
United Kingdom
TPG Europe LLP (“TPG Europe”) and Angelo, Gordon Europe LLP (“AG Europe”) are our London-based affiliates that are authorized and regulated by the U.K. Financial Conduct Authority (“FCA”) under the Financial Services and Markets Act 2000 (the “FSMA”). The FSMA and related rules, including the FCA’s rules and guidance, govern most aspects of investment business, including provision of investment advice, use and safekeeping of client funds and securities, regulatory capital, record-keeping, approval standards for individuals, anti-money laundering and periodic reporting. The FCA is responsible for administering these requirements and our compliance with the FSMA and related rules. Violations of these requirements may result in public or private censures, fines, imposition of additional requirements, injunctions, restitution orders, revocation or modification of permissions or registrations, the suspension or expulsion of officers or employees from performing certain functions within the financial services industry, or other similar consequences. TPG Europe and AG Europe have permission to engage in a number of activities regulated under the FSMA, including advising on and arranging deals.
Other Jurisdictions
Certain other subsidiaries or funds that we advise are registered with, have been licensed by or have obtained authorizations to operate in their respective jurisdictions outside of the United States. These registrations, licenses or authorizations relate to providing investment advice, marketing of securities and other regulated activities. Failure to comply with the laws and regulations governing these subsidiaries and funds that have been registered, licensed or authorized could expose us to liability and/or damage our reputation.
In Singapore, TPG Capital (S) Pte. Ltd. holds a capital market services license and is authorized by the Monetary Authority of Singapore to conduct fund management activities. In Hong Kong, TPG Capital, Limited is licensed and authorized by the Hong Kong Securities and Futures Commission to engage in the business of dealing in securities and advising on securities, and Angelo, Gordon Hong Kong Limited is licensed and authorized by the Hong Kong Securities and Futures Commission to engage in the business of dealing in securities. In the Cayman Islands, NewQuest Holdings (Cayman) Limited is registered with the Cayman Islands Monetary Authority as a registered person under the Securities Investment Business Act (As Revised) of the Cayman Islands and is authorized to conduct certain securities investment business activities, and each of the TPEP “master funds,” as well as each of the TPEP “offshore feeders,” is registered with the Cayman Islands Monetary Authority under the Mutual Funds Law. In South Korea, Angelo, Gordon Asia Co. Ltd. holds an investment advisory license with the Financial Services Commission of South Korea. In Japan, Angelo, Gordon International LLC is registered with the Japanese Financial Services Agency and the Kanto Local Finance Bureau.
Website and Availability of SEC Filings
We use our website (https://www.tpg.com), Rise website (https://therisefund.com), Microsites (https://software.tpg.com, https://healthcare.tpg.com), LinkedIn (https://www.linkedin.com/company/tpg-capital), Twitter (https://twitter.com/tpg), Vimeo (https://vimeo.com/user52190696), Rise YouTube (https://www.youtube.com/channel/UCo8p2iF_I5p-Wr2_MQlzedw/featured) and Rise Instagram (https://www.instagram.com/therisefund/?hl=en) accounts as channels of distribution of company information. The information we post through these channels may be deemed material. Accordingly, investors should monitor these channels, in addition to following our press releases, SEC filings and public conference calls and webcasts. In addition, you may automatically receive email alerts and other information about TPG when you enroll your email address by visiting the “Email Alerts” section of our website at https://shareholders.tpg.com. The contents of our website, any alerts and social media channels are not, however, a part of this report.
We also make available free of charge on our website or provide a link on our website to our Annual Report on Form 10-K, Quarterly Reports on Form 10-Q and Current Reports on Form 8-K, and any amendments to those reports filed or furnished pursuant to Section 13(a) or 15(d) of the Exchange Act, as soon as reasonably practicable after those reports are electronically filed with, or furnished to, the SEC. To access these filings, go to the “SEC Filings” portion of our
“Shareholders” page on our website. You may also access the reports and other documents we file with the SEC at a website maintained by the SEC at www.sec.gov.
Item 1A. Risk Factors
Risks Related to Our Business
We depend on our senior leadership and key investment and other professionals, and the loss of their services or investor confidence in such professionals could have a material adverse effect on our results of operations, financial condition and cash flow.
We depend on the experience, expertise, efforts, skills and reputations of our investment and other professionals, including our senior leadership, senior advisors and other key personnel, none of whom are obligated to remain employed or otherwise engaged with us. For example, our ability to continue delivering strong fund returns depends on the investments that our investment professionals and other key personnel identify and the synergies among their diverse fields of expertise. Senior leadership, investment professionals and other key personnel also have strong business relationships with our fund investors and other members of the business community. The loss of any of their services, including if any were to join or form a competing firm, could have a material adverse effect on our results of operations, financial condition and cash flow and could harm our ability to maintain or grow AUM in existing funds or raise additional funds in the future. Further, there can be no assurance that our founder succession process or plans to transition to long-term corporate governance by an independent board of directors will facilitate an orderly transition.
In addition, the failure of certain “key persons” (i.e., professionals who are named as “key persons” for certain of our funds) to devote the requisite time and attention required under a fund’s governing documents could cause the automatic suspension or termination of the fund’s commitment period, and in certain cases the general partner’s replacement and/or the fund’s dissolution. If “key persons” engage in certain forms of misconduct, fund investors could have the right to, among other things, remove the general partner, terminate the commitment period and/or dissolve the fund. See “—Third-party investors in our funds have the right under certain circumstances to remove the general partner of the fund, terminate commitment periods or dissolve the funds, each of which could lead to a substantial decrease in our revenues.” Moreover, many of our senior professionals’ equity interests in us are already substantially vested, thereby limiting their incentive to remain with us. Any of the foregoing could lead to a substantial decrease in our revenues or materially and adversely affect our reputation.
Our ability to attract, retain and motivate investment and other key professionals is critical to our success. Our failure to do so could have a material adverse effect on our results of operations, financial condition and cash flow.
Our success depends on our ability to retain and recruit investment and other professionals. The market for investment and other professionals is extremely competitive, and we may not succeed in retaining or recruiting qualified investment or other professionals to sustain our current performance or pursue our growth strategy. Our senior leadership, investment professionals and other key personnel possess substantial experience and expertise in investing, assist with locating and executing our funds’ investments, have significant relationships with the institutions that are the source of many of our funds’ investment opportunities and have strong business relationships with our fund investors. Therefore, the departure of members of our senior leadership, our investment professionals or other key personnel, particularly if they join competitors or form competing firms, could result in the loss of significant investment opportunities and certain fund investors and could impair our funds’ performance.
Our ability to recruit, retain and motivate qualified investment and other professionals depends primarily on our ability to offer attractive compensation packages. Efforts to retain or attract investment professionals and other professionals could therefore result in significant additional expenses, which would negatively affect our profitability.
Amounts earned by our investment and other professionals who participate in partnership equity programs will vary from year to year depending on our overall realized performance. As a result, there may be periods when we determine that realized performance allocations (together with other then-existent partnership return elements) are not sufficient to incentivize individuals, which could result in our having to increase salaries, cash bonuses, other equity awards and other benefits, modify existing programs or use new incentive programs, which could increase our compensation costs. Reductions in partnership equity programs could also make it harder to retain investment professionals and other key personnel and cause these individuals to seek other employment opportunities. We may also not be able to provide our senior professionals with equity interests in our business to the same extent or with the same economic and tax
consequences as those from which our existing senior professionals benefited prior to the IPO, and in years of poor realization such new equity interests may be inadequate to incentivize and retain our key personnel. Furthermore, changes in tax laws in the United States and the United Kingdom (the “U.K.”) have increased tax rates on various items of income and gain realized by our investment professionals, which in turn could impact our ability to recruit, retain and motivate our current and future investment professionals. Additionally, legislative changes have been proposed that, if enacted, could further increase applicable tax rates. See “—Risks Related to Taxation—Legislative changes have been proposed that would, if enacted, modify the tax treatment of partnership interests. If this or any similar legislation or regulation were to be enacted and apply to us, we could incur a substantial increase in our compensation costs and it could result in a reduction in the value of our Class A common stock.”
In addition, the confidentiality agreements, restrictive covenants and other arrangements with some of our senior leadership, investment professionals and other key personnel may not prevent them from leaving us, joining our competitors or otherwise competing with us. Depending on which entity is a party to these agreements and the laws applicable to these agreements, we may be unable to, or may find it impracticable to, enforce them, and certain of these agreements may be waived, modified or amended at any time without our consent. Even when enforceable, these agreements expire after certain periods of time, at which point investment professionals and other key personnel are free to compete with us and solicit our fund investors and employees.
Poor performance of our funds would cause a decline in our revenue, may obligate us to repay performance allocations previously paid to us and could negatively impact our ability to raise capital for future funds.
We primarily derive revenues from:
• management fees, which are generally based on the amount of capital committed or invested in our funds;
• performance allocations, which are based on the performance of our funds;
• investment income from our investments as general partner;
• compensation our broker-dealer or related entities receive for various capital markets services; and
• expense reimbursements.
Poor performance of our funds could make it more difficult for us to raise new capital. Existing and potential investors continually assess our funds’ performance, and our ability to raise capital for existing funds and future funds, as well as avoiding excessive redemptions from our open-ended funds, including certain of our credit funds and our public equity funds, depends on our funds’ continued satisfactory performance. Accordingly, poor fund performance may deter future investment in our funds and thereby decrease our AUM and revenue. In addition, capital markets fees are typically dependent on transaction frequency and volume, and a slowdown in the pace or size of investments by our funds could adversely affect the amount of fees generated by our broker-dealer. Any of the foregoing could have a material adverse effect on our results of operations, financial condition and cash flow.
If a fund performs poorly, we will receive little or no performance allocations relating to our interest in the fund and little income, or possibly losses, from any principal investment in the fund, which could decrease our revenue. Investors could also demand lower fees or fee concessions for existing or future funds, which would likewise decrease our revenue. Further, if a fund does not achieve total investment returns that exceed a specified investment return threshold for the life of the fund as a result of poor performance of later investments in a fund’s life, we may be obligated to return the amount by which performance allocations previously distributed to us exceed amounts to which we are ultimately entitled. See “—The clawback provisions in our governing agreements may give rise to contingent obligations that may require us to return amounts to our funds and fund investors.”
Our inability to raise new funds or capital for our funds could result in lower management fees and less capital to invest and place pressure on fees and fee arrangements of future funds, which could have a material adverse effect on our results of operations, financial condition and cash flow.
Our current private equity, real estate and certain of our credit and other funds and investment vehicles have a finite life and a finite amount of commitments from fund investors. Once a fund nears the end of its investment period, our success depends on our ability to raise additional or successor funds in order to keep making investments and, over the long term, keep earning steady management fees. If we are unable to raise successor funds of a comparable size without delay, our revenues may decrease as the investment periods of our predecessor funds expire and associated fees decrease. In addition, investors in our open-ended funds, including certain of our credit funds and our public equity funds, and our BDC, have the ability to redeem their fund interests and move their capital to other investments; these funds’ management fees and performance allocations would decline if we are unable to raise capital to replace that of redeeming fund investors. We may seek to raise significant capital for successor funds at a time when our competitors, some of whom have substantially larger capital formation teams, are likewise engaged in significant fundraising campaigns, or at a time when investors, as a result of general economic downturn or otherwise, are limiting or reducing their total investments. By the time we seek to raise new funds, investors who might otherwise have participated may have already allocated all of their available capital to other funds and therefore be unable to commit to ours. We could struggle to raise successor funds or fresh capital for other reasons beyond our control, including as a result of general economic or market conditions or regulatory changes, which could have a material adverse effect on our results of operations, financial condition and cash flow.
In addition, certain institutional investors, including sovereign wealth funds and public pension funds, continue to demonstrate an increased preference for alternatives to traditional fund structures, such as managed accounts, specialized funds and co-investment vehicles. There can be no assurance that historical or current levels of commitments to our funds from these investors will continue. Investors in our funds may decide to move their capital away to other investments for any number of reasons, such as changes in interest rates that make other investments more attractive; poor investment performance; changes in investor perception regarding our focus or alignment of interest, including if we change or broaden a fund’s investment strategy; reputational concerns; legislation reducing or minimizing the ability to invest in alternative assets; or departures or changes in responsibilities of key investment professionals. In the U.K. and Europe, there has been a shift from defined benefit pension plans to defined contribution plans, and many public pension funds, including in the United States, the U.K. and Europe, are and may continue to be significantly underfunded, all of which could reduce the amount of assets available for us to manage on behalf of certain of our clients. Moreover, certain institutional investors prefer to in-source their own investment professionals and make direct investments in alternative assets without the assistance of investment advisers like us. Such institutional investors may become our competitors and could cease to be our clients.
We have also entered into, and expect to continue to enter into, customized investment programs with select investors, which can take the form of contractual arrangements pursuant to broader strategic relationships, separately managed accounts (“SMAs”) and other bespoke investment structures. In exchange for significant historical and/or future commitments, these arrangements can include the establishment of dedicated vehicles, discounted management fees, reduced performance allocations, the right to participate in co-investment opportunities and knowledge sharing, training and secondment programs. These arrangements could increase the cost of raising capital at the scale and level of profitability we have historically achieved.
Further, certain investors have implemented, or may implement, restrictions against investing in certain types of asset classes, which would affect our ability to raise new funds focused on those asset classes. Countries’ implementation of certain tax measures may also adversely impact our funds’ ability to raise capital from certain investors if these investors decide that it is more tax efficient for them to invest on their own or only in funds with similarly situated investors. See “—Our funds invest in companies that are based outside of the United States, which may expose us to additional risks not typically associated with investing in companies that are based in the United States” and “—Risks Related to Taxation—Changes in relevant tax laws, regulations or treaties or an adverse interpretation of these items by tax authorities could negatively impact our effective tax rate and tax liability.”
The failure of our funds to raise capital in sufficient amounts and on satisfactory terms could decrease our AUM and revenue and have a material adverse effect on our results of operations, financial condition and cash flow.
A decline in the pace or size of investments by our funds could result in our receiving less revenue from fees.
Management fee revenue constitutes the largest portion of income from our business and depends on the pace of investment activity in our funds. For almost all of our funds, we charge management fees based on the amount of capital invested during a portion, and sometimes all, of a fund’s fee-paying life. As a result, the pace at which we make investments, the length of time we hold these investments and the timing of dispositions directly impact our revenues. Many factors could cause a decline in the pace of investment, including the inability of our investment professionals to identify attractive investment opportunities, competition for such opportunities, decreased availability of capital on attractive terms and our failure to consummate identified investment opportunities because of business, regulatory or legal complexities and adverse developments in the U.S. or global economy or financial markets. In addition, in certain cases a decline in investment value can reduce the invested capital fee base. As a result, the variable pace at which many of our funds invest capital and dispose of investments, and variations in underlying asset value, may cause our management fee revenue to vary from one quarter to the next. We would generally expect a slowdown in investment pace to cause an eventual decline in other sources of revenue such as transaction fees and fees earned by our broker-dealer. Likewise, during attractive selling environments, our funds may capitalize on increased opportunities to exit investments, and an increase in the pace at which our funds exit investments, if not offset by new commitments and investments, would reduce management fees. Additionally, higher fundraising activity also generates incremental expenses and, as new capital commitments may not immediately generate fees, we could incur fundraising related costs ahead of generating revenues.
We may reduce our AUM, limit its growth, reduce our fees or otherwise alter the terms under which we do business when we deem it to be in the best interest of our fund investors, even when such actions may be contrary to the near-term interests of stockholders.
From time to time we may decide it is in our best interest to take actions that could reduce the profits we could otherwise realize in the short term. While we believe that our commitment to treating our fund investors fairly is in the long-term interest of us and our stockholders, we may take actions that could adversely impact our short-term profitability, and there is no guarantee that such actions will benefit us in the long term. For example, we may seek to benefit fund investors by limiting AUM to an amount we believe can be invested appropriately in accordance with our investment mandate and current or anticipated economic and market conditions or by voluntarily reducing management fee rates and terms for certain of our investors, funds or strategies, even when doing so may reduce our short-term revenue. See “—Our inability to raise new funds or capital for our funds could result in lower management fees and less capital to invest and place pressure on fees and fee arrangements of future funds, which could have a material adverse effect on our results of operations, financial condition and cash flow.”
Many of our funds utilize subscription line facilities to fund investments prior to the receipt of capital contributions from the fund’s investors. As using a subscription line facility delays fund capital calls, the investment period of such capital is shortened, which may increase a fund’s reported Gross and Net IRR (each as defined herein). However, since interest expense and other costs of borrowings under subscription line facilities are a fund expense, borrowing will reduce the fund’s net multiple of invested capital and may reduce the amount of performance allocations the fund generates. Any reduction in performance allocations will negatively impact our revenues.
We may also take other actions that could adversely impact our short-term results of operations when we deem such action appropriate. For example, we may waive management fees on certain vehicles at various times. We may delay the realization of performance allocations to which we are otherwise entitled if we determine (based on a variety of factors, including the stage of the fund’s life cycle and the extent of fund profits accrued to date) that there would be an unacceptably high risk of future clawback obligations, or for other reasons. Any of the foregoing delays could result in a deferral of realized performance allocations to a subsequent period, if they are earned at all. See “—Parts of our revenue, earnings and cash flow are highly variable, which could cause volatility in the price of our Class A common stock.”
Our investors in future funds may negotiate to pay us lower management fees, reimburse us for fewer expenses or change the economic terms to be less favorable to us than those of our existing funds, which could have a material adverse effect on our results of operations, financial condition and cash flow.
We negotiate terms with existing and potential investors when raising capital for new or existing funds. These negotiations could result in terms that are materially less favorable to us than the terms of our prior funds. For example, such terms could restrict our ability to raise funds with investment objectives or strategies that compete with existing funds, increase the hurdle required to be generated on investment prior to our right to receive management fees and performance allocations, add expenses and obligations for us in managing funds or increase our potential liabilities. Further, as
institutional investors increasingly consolidate their relationships with investment firms and competition becomes more acute, we may receive more requests to modify the terms of our new funds, including reductions in management fees. For example, certain of our newer funds include more favorable terms for fund investors that commit to early closes. Any agreement to or changes in terms less favorable to us could result in a material decrease in our profitability and have a material adverse effect on our results of operations, financial condition and cash flow.
Further, investors increasingly expect to make investments in our funds on customized terms. We may enter into separate agreements and/or create separate vehicles with certain individual investors, which may include, among other things, provisions permitting an investor to opt out of particular investments, discounting an investor’s management fee, reducing our share of performance allocations or granting an investor preferential rights with respect to co-investment opportunities. Any agreement to terms that are more favorable than those set forth in a fund’s governing documents could result in a material decrease in our profitability and have a material adverse effect on our results of operations, financial condition and cash flow.
Certain institutional investors have also publicly criticized specific fund fee and expense structures. We have received, and expect to continue to receive, requests from a variety of fund investors and groups representing such investors to decrease fees, modify our performance allocations and change incentive fee structures, which could result in a reduction or delay our receipt of performance allocations and incentive fees. The Institutional Limited Partners Association (“ILPA”) maintains and revises from time to time a set of Private Equity Principles (the “Principles”), which continue to call for enhanced “alignment of interests” between general partners and limited partners through modifications of some of the terms of fund arrangements, including guidelines for performance allocations, fees and fee structures. We endorsed the Principles as an indication of our general support for ILPA’s efforts. Further, the SEC’s focus on certain fund fees and expenses, including whether such fees and expenses were appropriately disclosed to fund limited partners, may lead to increased publicity that could cause fund investors to further resist certain fees and expense reimbursements. Significant changes to our fund fee and expense structures in response to requirements of institutional investors, ILPA or the SEC could have a material adverse effect on our results of operations, financial condition and cash flow.
The Acquisition may not achieve its intended benefits, and certain difficulties, costs or expenses may outweigh such intended benefits.
While we expect the Acquisition to benefit the Company and our stockholders, the completion of the Acquisition also exposes our business to new and varying risks. We also cannot assure you that we will be able to successfully integrate TPG Angelo Gordon or otherwise realize the expected benefits of the Acquisition. The success of the Acquisition depends on, among other things, our ability to:
•mitigate risks that arise from the diversion of management’s time and attention from our existing business and to otherwise minimize any disruption to our ongoing businesses;
•properly manage potential conflicts of interest with our existing businesses;
•integrate TPG Angelo Gordon’s business model and people into our businesses, including realizing the benefits of expected synergies;
•implement adequate investment processes, controls and procedures that are appropriate for the combined company, including TPG Angelo Gordon’s obligations to provide financial reporting as part of a public company, and to manage any associated incremental operating costs;
•retain TPG Angelo Gordon’s current clients and/or employees and expand product offerings to potential new investors; and
•manage the increased demands on our information systems, operational systems and technology, including related security systems and infrastructure.
Many of these factors will be outside of our control and any one of them could result in increased costs, decreases in the amount of expected revenues and diversion of management’s time and focus, which could have a material and adverse effect on our results of operations, financial condition and cash flow.
In addition, other events outside of our control, including, but not limited to, political climate, macroeconomic events and regulatory or legislative changes, including in jurisdictions in which we have not historically operated, could limit our ability to realize the anticipated benefits from the Acquisition.
Incorporation of TPG Angelo Gordon into the Company results in certain incremental risks and exacerbates existing risks of our business.
TPG Angelo Gordon operates its business as a new platform of TPG focused on credit and real estate investments. These investments are new to the Company and, especially in the case of credit funds, pose incremental risks, many of which may be material. These risks include, but are not limited to:
•financial, regulatory and other risks related to investment in real estate assets in new geographies, including increased exposure to real estate assets in Europe and Asia;
•risks related to investments made pursuant to special situation and distressed debt investment strategies;
•litigation and regulatory risks relating to credit products, including risks arising in jurisdictions in which we have not previously operated;
•risks related to investments in, regulation of, and reserve requirements related to CLOs; and
•risks related to TCAP, TPG Angelo Gordon’s BDC.
In addition, the acquisition of TPG Angelo Gordon may heighten the potential adverse effects on our business, operating results, cash flows or financial condition described in other risk factors in this report, including, but not limited to:
•risks related to changes in general, economic, market and political conditions, and interest rates;
•risks related to adverse capital and credit market conditions;
•risks related to the management of potential conflicts of interest;
•risks related to our Earnout Payment (as defined herein)
•risks related to retention of key professionals;
•risks related to fundraising and fund performance;
•risks related to demands on our information systems, operational systems and technology, including related security systems and infrastructure; and
•regulatory risks across numerous jurisdictions.
We may not be successful in executing or managing the complexities of new investment strategies or expanding into new markets and businesses, which could have a material adverse effect on our results of operations, financial condition and cash flow.
We continuously look to expand our platform through investments in, and development or acquisition of, businesses, products and investment strategies complementary to our existing business. The success of our growth strategy depends on, among other things:
•our ability to correctly identify and create products that appeal to investors;
•how our existing fund investors view any new initiatives;
•mitigating risks that arise from the diversion of management’s time and attention from our existing businesses;
•our ability to properly manage conflicts of interests with our existing businesses;
•minimizing any disruption to our ongoing businesses;
•management’s ability to develop and integrate new businesses and the success of integration efforts;
•our ability to identify and manage risks in new lines of businesses;
•our ability to successfully negotiate and enter into beneficial arrangements with new counterparties;
•our ability to implement adequate investment processes, controls and procedures that we have already developed around our existing platforms and/or identify and develop new policies, controls and procedures appropriate in light of a new business, product or investment strategy;
•our ability to successfully enter into markets or businesses in which we may have limited or no experience;
•managing the increased demands on our information systems, operational systems and technology, including related security systems, and infrastructure;
•our ability to achieve expected results or realize expected synergies from newly developed products or strategic alliances;
•our ability to obtain requisite approvals and licenses from relevant governmental authorities and to comply with applicable laws and regulations without incurring undue costs or delays; and
•the broadening of our geographic footprint and successfully managing the risks associated with conducting operations in foreign jurisdictions (including regulatory, tax, legal and reputational consequences).
In some instances, we may determine that growth in a specific area is best achieved through the acquisition of an existing business, as with our recent acquisition of TPG Angelo Gordon. Our ability to consummate an acquisition will depend on our ability to identify and accurately value potential acquisition opportunities and successfully compete for these businesses against companies that may have greater financial resources. Even if we are able to identify and successfully negotiate and complete an acquisition, these transactions can be complex, and we may encounter unexpected difficulties or incur unexpected costs. The following factors, among others, could also limit the success of a firm acquisition:
•difficulties and costs associated with the integration of operations and systems;
•required investment of capital and other resources, including costs associated with additional regulatory compliance;
•difficulties integrating the acquired business’s internal controls and procedures into our existing control structure and resolving potential conflicts that arise in light of the acquired business;
•difficulties and costs associated with the assimilation of employees; and
•the risk that a change in ownership will negatively impact the relationship between an acquiree and the investors in its investment vehicles.
Historically, we have had, and in the future may have, a new product, business or venture developed internally or by acquisition that proves to be unsuccessful. In those instances, we may decide to wind down, liquidate and/or discontinue those products, businesses or ventures, and we have done so in the past. Such actions could negatively impact our relationships with investors in those businesses, subject us to litigation or regulatory inquiries and expose us to additional expenses, including impairment charges and potential liability from investor or other complaints.
Entry into certain lines of business may subject us to new laws and regulations with which we are not familiar, or from which we are currently exempt, and may lead to increased litigation and regulatory risk and expense. New products or strategies could have different economic structures than our traditional funds and may require a different marketing approach. Our strategic initiatives may include joint ventures, in which case we will be subject to additional risks and
uncertainties in that we may be dependent upon, and subject to liability, losses or reputational damage relating to, systems, controls and personnel that are not under our control. There can be no assurance that any joint venture opportunities will be successful. In addition, to the extent that we distribute products through new channels, including through unaffiliated firms and/or those providing access to retail investors, we may be unable to effectively monitor or control the manner of their distribution. These activities also will impose additional compliance burdens on us, subject us to enhanced regulatory scrutiny and expose us to greater reputation and litigation risk. Further, these activities may give rise to conflicts of interest and related party transaction risks and may lead to litigation or regulatory scrutiny. There can be no assurance that any new product, business or venture we develop internally or by acquisition will succeed.
We are subject to increasing scrutiny from fund investors and regulators on ESG matters, which may constrain investment opportunities for our funds and negatively impact our ability to raise capital from such investors.
Our fund investors, stockholders, regulators and other stakeholders are increasingly focused on ESG matters. Certain fund investors consider our record of socially responsible investing and other ESG factors, including by relying on third-party benchmarks or scores, in determining whether to invest in our funds. At times, certain fund investors have conditioned future capital commitments on the taking of or refraining from taking certain ESG-related actions. Although several of our funds are focused on socially responsible and climate-focused investing, other funds may make investments that fund investors or stockholders view as inconsistent with their ESG standards. If our ESG practices or third-party ratings do not meet the standards set by these fund investors or stockholders, or if we fail, or are perceived to fail, to demonstrate progress toward our ESG goals and initiatives, they may choose not to invest in our funds or exclude our Class A common stock from their investments, and we may face reputational damage. To the extent our access to capital from fund investors focused on ESG ratings or matters is impaired, we may not be able to maintain or increase the size of our funds or raise sufficient capital for new funds, which may adversely affect our revenues. Further, there can be no assurance that fund investors and other stakeholders will determine that our ESG initiatives, goals and commitments are sufficiently robust. There can be no assurance that we will be able to accomplish any announced goals related to our ESG program, as statements regarding our ESG goals reflect our current plans and aspirations and are not guarantees that we will be able to achieve them within the timelines we announce or at all. Further, as part of our ESG practices, we rely on the services and methodologies of Y Analytics, an affiliated public benefit organization. Such services and methodologies by Y Analytics could prove to be inaccurate and there can be no assurance that they will be successful. The occurrence of any of the foregoing could negatively impact our relationships with fund investors, our ability to raise funds and capital and the price of our Class A common stock, all of which could adversely affect our business and results of operations.
Anti-ESG sentiment has gained momentum across the United States, with a growing number of states having enacted or proposed “anti-ESG” policies, legislation or issued related legal opinions. For example, (i) boycott bills target financial institutions that “boycott” or “discriminate against” companies in certain industries and prohibit state entities from doing business with such institutions and/or investing the state’s assets (including pension plan assets) through such institutions; and (ii) ESG investment prohibitions require that state entities or managers/administrators of state investments make investments based solely on pecuniary factors without consideration of ESG factors. If fund investors subject to such legislation viewed our funds or ESG practices, including our climate-related impact strategies, as being in contradiction of such “anti-ESG” policies, legislation or legal opinions, such fund investors may not invest in our funds, our ability to maintain the size of our funds could be impaired, and it could negatively affect our results of operations, financial condition and cash flow. Additionally, asset managers have been subject to recent scrutiny related to ESG-focused industry working groups, initiatives, and associations, including organizations advancing action to address climate change or climate-related risk. Further, the Supreme Court’s recent ruling striking down race-based affirmative action in higher education has increased scrutiny of corporate diversity, equity and inclusion (“DEI”) practices. Some groups and state attorneys general have begun to analogize the outcome of that case to private employment matters, asserting that certain corporate DEI practices are racially discriminatory and unlawful. Such anti-ESG and anti-DEI related policies, legislation, initiatives and scrutiny could expose us to the risk of litigation, antitrust investigations or challenges by federal or state authorities, result in injunctions, penalties and reputational harm and require certain investors to divest or discourage certain fund investors from investing in our funds.
There is a growing interest on the part of fund investors and regulators in ESG factors and increased demand for, and scrutiny of, ESG-related disclosures by asset managers, which exposes us to additional risks. For example, this additional scrutiny has increased the risk that asset managers could be perceived as, or accused of, making inaccurate or misleading statements regarding the investment strategies of their funds or their and their funds’ ESG efforts or initiatives, often referred to as “greenwashing.” Any such perception or accusation could damage our reputation, result in litigation or regulatory actions, and adversely impact our ability to raise capital and attract new fund investors. In addition, there has been increased regulatory focus on ESG-related practices by investment managers and regulators, and new regulatory
initiatives related to ESG that are applicable to us, our funds and their portfolio companies could adversely affect our business. There is a growing regulatory interest across jurisdictions in improving transparency regarding the definition, measurement and disclosure of ESG factors to allow investors to validate and better understand sustainability claims. For example, in May 2022, the SEC proposed amendments to rules and reporting forms concerning ESG factors. In August 2023, the SEC adopted its final rule enhancing the regulation of private fund advisers, which includes requirements with respect to the disclosure of certain information to investors that could affect the way certain ESG-related information is shared. In addition, in 2021 the SEC established an enforcement task force to examine ESG practices and disclosures by public companies and investment managers and has begun to bring enforcement actions based on ESG disclosures not matching actual investment processes.
In March 2022, the SEC issued a proposed rule regarding the enhancement and standardization of mandatory climate-related disclosures for investors. The proposed rule would mandate extensive disclosure of climate-related data, risks, and opportunities, including financial impacts, physical and transition risks, related governance and strategy, and greenhouse gas emissions, for certain public companies. Although the ultimate date of effectiveness and the final form and substance of the requirements for this proposed rule is not yet known and the ultimate scope and impact on our business is uncertain, compliance with this proposed rule, if finalized, will likely result in increased legal, accounting and financial compliance costs, make some activities more difficult, time-consuming and costly, and place strain on our personnel, systems and resources. At the state level, in October 2023, California enacted legislation that will ultimately require certain companies that do business in California to publicly disclose their Scopes 1, 2 and 3 greenhouse gas emissions, with third party assurance of such data, and issue public reports on their climate-related financial risk and related mitigation measures.
We, our funds and their portfolio companies could become subject to additional regulations, penalties and/or risks of regulatory scrutiny and enforcement in the future. We cannot guarantee that our current ESG program and practices will meet future regulatory requirements, reporting frameworks or best practices, increasing the risk of related enforcement. Compliance with new requirements may lead to increased management burdens and costs. If the SEC or any other governmental authority, regulatory agency or similar body were to take issue with our past or future practices, then we, our funds and/or their portfolio companies may be at risk for regulatory sanction, and any such investigations could be costly, distracting and/or time consuming. There is also a risk of mismatch between U.S., EU and U.K. regulatory initiatives.
Further, with respect to both voluntary and mandated ESG disclosures, we and our portfolio companies may not successfully implement measurement processes and disclosure controls and procedures that meet evolving investor, activist, or regulatory expectations. Any enhancements to such processes and controls may be costly and give rise to significant administrative burdens. For example, collecting, measuring, and reporting ESG information and metrics can be costly, difficult and time consuming, is subject to evolving reporting standards, and can present numerous operational, reputational, financial, legal and other risks. If we or our portfolio companies do not successfully implement controls related to reporting ESG information, this could result in legal liability and reputational damage, which could impact our ability to attract and retain fund investors and employees.
We and many of our portfolio companies may undertake extensive voluntary reporting on various ESG matters, including greenhouse gas emissions, diversity and human capital management. The standards for tracking and reporting on ESG matters are relatively new, have not been harmonized, and continue to evolve and we may fail to successfully implement or comply with, these rapidly developing ESG standards and requirements. In addition, we and our portfolio companies’ selection of reporting frameworks or standards, and other methodological choices, such as the use of certain performance metrics, levels of quantification, value chain reporting, or materiality standards, may vary over time and may not always align with evolving investor and activist expectations or market practices.
Outside of the United States, the European Commission adopted an action plan on financing sustainable growth, as well as initiatives at the European Union (“EU”) level, such as the SFDR (as defined herein). See “—Risks Related to Our Industry—Regulatory initiatives in jurisdictions outside the United States could negatively impact our business—Sustainable Finance.” Compliance with the SFDR and other ESG-related rules and frameworks has and is expected to result in increased legal, compliance, restrictions, reporting and other associated costs and expenses which would be borne by us and our funds because of the need to collect certain information to meet the disclosure requirements, which are highly dynamic and subject to change. Under these requirements, we are required to classify certain of our funds and their portfolio companies against certain criteria, some of which can be open to subjective interpretation. Our view on the appropriate classification may develop over time, including in response to statutory or regulatory guidance or changes in industry approach to classification. If regulators disagree with the procedures or standards we use for ESG investing, or new regulations or legislation require a methodology of measuring or disclosing ESG or impact that is different from our
current practice, it could have a material adverse effect on our reputation, results of operations, financial condition and cash flow. While in force, each of the Taxonomy Regulation, the SFDR and the associated regulatory technical standards remain subject to change, as a series of initiatives are ongoing for review and potential revision of each. If the relevant proposals are adopted, the relevant TPG funds may be obliged to update existing disclosures provided to investors, or changes to the investment portfolio of particular funds or name changes to particular funds may be necessary.
In addition, where there are uncertainties regarding the operation of a framework, a lack of official, conflicting or inconsistent regulatory guidance, a lack of established market practice and/or data gaps or methodological challenges affecting the ability to collect relevant data, funds and/or fund managers may be required to engage third party advisors and/or service providers to fulfil the requirements, thereby exacerbating any increase in compliance burden and costs.
Third-party investors in our funds have the right under certain circumstances to remove the general partner of the fund, terminate commitment periods or dissolve the funds, each of which could lead to a substantial decrease in our revenues.
If we, as the general partner, managing member or management company, or certain “key persons” engage in certain forms of misconduct, the governing agreements of our funds generally allow the investors of those funds to, among other things, remove the general partner, terminate the commitment period and/or dissolve the fund. Certain of those events may happen upon the affirmative vote of a specified percentage of limited partner interests entitled to vote, whereas others may happen automatically absent a limited partner vote to waive the event. In addition, our funds generally have the ability to terminate their agreements with the relevant management companies for any reason. Our investment vehicles that are structured as “funds of one,” or SMAs, have a single investor or a few affiliated investors that typically have the right to terminate the investment period or cause a dissolution of the vehicle under certain circumstances. Moreover, if certain “key persons” fail to devote the requisite time and attention to managing the fund, the fund’s commitment period will generally be automatically suspended for a period of time, typically 60 or 90 days, and, depending on the fund’s governing documents, may be terminated unless a majority in interest of the fund’s investors elect to continue the commitment period or an appropriate successor is approved by the fund’s advisory committee. While we believe that our investment professionals have appropriate incentives to remain in their respective positions based on equity ownership, profit participation and other contractual provisions, there can be no guarantee of the ongoing participation of our investment professionals in respect of our funds. If a general partner is removed, we would no longer be involved in the management or control of the fund, and there could be no assurance regarding the fund’s ability to consummate investment opportunities and manage portfolio companies. In addition, if a general partner is removed for certain bad acts, the amount of accrued performance allocations we would otherwise receive may significantly decrease. In the event that a fund is dissolved prematurely, it may be required to dispose of its investments at a disadvantageous time or make in-kind distributions. Although we periodically engage in discussions with fund investors and/or advisory committees of our funds regarding a waiver of such provisions or replacement of relevant key persons with respect to executives whose departures have occurred or are anticipated, such waiver or replacement is not guaranteed. Such an event with respect to any of our funds would likely result in significant reputational damage to us and could negatively impact our future fundraising efforts, cause us to agree to less favorable terms with respect to the affected fund or have a material adverse effect on our results of operations, financial condition and cash flow.
If we are required to liquidate fund investments at a disadvantageous time as a result of dissolution, management fees and performance allocations would terminate, and we could ultimately realize lower-than-expected return on the investments and, perhaps, on the fund itself. We do not know whether, or under what circumstances, our funds’ investors are likely to exercise such right.
In addition, because our funds generally have an adviser registered under the Advisers Act, each fund’s management agreement must require the fund’s consent for any “assignment” of the agreement, which may be deemed to occur in the event the investment advisers of our funds were to experience a change of control. Failure to obtain consent may constitute a violation of the management agreement. A change of control typically occurs if there is a transfer of more than 25% of the voting securities of an investment adviser or its parent. There can be no assurance that a change of control will not occur and that we will obtain the consents required to assign our investment management agreements. See “—Risks Related to Our Organization Structure—A change of control of our company could result in an assignment of our investment advisory agreements.”
Parts of our revenue, earnings and cash flow are highly variable, which could cause volatility in the price of our Class A common stock.
The portion of our revenues, earnings and cash flow we derive from performance allocations is highly variable and can vary significantly from quarter to quarter and year to year. The timing of performance allocations generated by our funds is uncertain and will contribute to the volatility of our results. It takes a substantial period of time to identify attractive investment opportunities, to raise the necessary funds and then to realize the investment through a sale, public offering, recapitalization or other exit. Even if an investment proves to be profitable, it may be several years before we realize any profits in cash or other proceeds. We cannot predict when, or if, any realization of an investment will occur. Generally, with respect to our private equity and credit distributions, although we recognize performance allocations on an accrual basis, we receive performance allocation payments (i) from our historical TPG funds, only upon disposition of an investment by the relevant fund and (ii) from our TPG Angelo Gordon funds, only after the respective fund’s investors have received their capital contributions in the fund and certain preferred returns, in each case contributing to the volatility of our cash flow. If our funds were to have a realization event in a particular quarter or year, it may have a significant impact on our results for that particular quarter or year that may not be replicated in subsequent periods. We recognize revenue on investments in our funds based on our allocable share of realized and unrealized gains (or losses) reported by such funds, and a decline in realized or unrealized gains, or an increase in realized or unrealized losses, would adversely affect our revenue, which could further increase the volatility of our results.
The timing and receipt of performance allocations also vary with the life cycle of certain of our funds. Our funds that have completed their investment periods and are able to realize mature investments are more likely to make larger distributions than our funds that are in their fundraising or earlier parts of their investment periods. During times when a significant portion of our AUM is attributable to funds that are not in the stage when they would realize investments, we may receive substantially lower distributions of performance allocations. Our TPG Angelo Gordon funds employ a European waterfall, and as a result, the general partners of these funds do not receive performance allocations for an extended period of time, even if multiple realizations have occurred within the fund. Relative to our historical TPG funds that generally receive performance allocations following each realization, performance allocations from our TPG Angelo Gordon funds are expected to come later in their life cycle and to consist of larger relative amounts, increasing the volatility of our cash flow.
Our funds’ historical returns should not be considered as indicative of our or our funds’ future results or of any returns expected on an investment in our Class A common stock.
We have presented in this report information relating to the historical performance of our funds. The historical returns of our funds are not an indication of future fund performance or potential returns on our Class A common stock. In addition, any continued positive performance of our funds will not necessarily result in positive returns on an investment in our Class A common stock, though we would expect poor fund performance to cause a decline in our revenue from such funds that could, consequently, negatively impact our ability to raise funds and capital and the value of our Class A common stock.
Moreover, with respect to the historical returns of our funds:
•we may create new funds in the future that reflect a different asset mix, different investment strategies and varied geographic and industry exposure compared to our current funds, and any such new funds could have different returns than our existing or previous funds;
•the historical returns presented in this report derive largely from the performance of our existing funds, whereas future fund returns will depend increasingly on the performance of our newer funds or funds not yet formed, which may have little or no realized investment track record, may be invested by different investment professionals, and may have lower target returns than our existing funds;
•the performance of our funds reflects our valuation of the unrealized investments held in those funds using assumptions that we believe are reasonable under the circumstances, but the actual realized return on these investments will depend on a variety of factors including future operating results and the value of assets and market conditions at the time of disposition, each of which may differ from the assumptions on which the valuations are based, which could negatively impact the ultimate value we realize from those investments;
•in recent years, there has been increased competition for investment opportunities resulting from, among other things, the increased amount of capital invested in alternative funds, high liquidity in debt markets and strong equity markets, and increased competition for investments could reduce our returns in the future;
•the rates of returns of some of our funds in certain years have been positively influenced by a number of investments that experienced rapid and substantial increases in value following the dates on which those investments were made, which may not occur with respect to future investments;
•our funds’ returns in some years have benefited from investment opportunities and general market conditions, including a low interest rate environment, that may not repeat themselves, and our current or future funds may be unable to avail themselves of comparable investment opportunities or market conditions;
•market conditions during previous periods may have been significantly more favorable for generating positive performance, particularly in our private equity business, than current market conditions or the market conditions that we may experience in the future; and
•newly established funds may generate lower returns during the period that they take to deploy their capital.
Our financial performance depends in part on the investment performance of our funds, which in turn is influenced by general market conditions. Increased market volatility, including broad declines in equity valuations and changes in interest rates, would impact our investments and the performance of our funds. We believe that future volatility in general market conditions would affect both of our funds’ performance and our financial performance.
Our performance in prior years benefited from high multiples and asset prices. A decline in multiples or asset prices, or an overall deterioration in market conditions, could make it more difficult to earn such returns on new investments. The future returns of any current or future fund may therefore vary considerably from the historical returns generated by any particular fund or our funds as a whole. Future returns will also be affected by the risks described elsewhere in this report, including risks of the industries and businesses in which a particular fund invests.
Our investments in portfolio companies and the financial performance of our funds and their portfolio companies could negatively impact our results of operations, financial condition and cash flow.
Our funds’ performance, and thus our performance, depends on the value of our funds’ portfolio companies and other investments. Our funds invest in companies in many different industries, each of which is subject to volatility based on a variety of economic, market and other factors. Typically, our funds’ performance will not be meaningfully impaired by the poor performance of a limited number of portfolio companies. However, a fund’s performance could be negatively impacted if several of its portfolio companies perform poorly, and we have limited resources to assist portfolio companies experiencing financial difficulties, such as unsustainable levels of indebtedness, contractual or legal constraints and industry headwinds. Risks that could negatively impact the financial performance of our funds and their portfolio companies and otherwise impact our results of operations, financial condition and cash flow include:
•Business, Regulatory or Legal Complexity: We often pursue investment opportunities with substantial business, regulatory or legal complexity that we believe may deter other investment managers. Portfolio companies acquired in such transactions can be more challenging to manage and sometimes entail a greater risk of contingent liabilities.
•Control: Our funds often invest in equity securities and other financial instruments of companies we do not control. In the future, our funds may acquire minority equity interests more frequently or dispose of a portion of majority equity investments in portfolio companies over time in a manner that results in the funds retaining a minority stake. Minority investments are subject to the risk that the company in which our funds invest may make business, financial or management decisions with which we do not agree or that the company’s majority stockholders or the management may take risks or otherwise act in a manner that does not serve our funds’ interests, each of which could decrease the value of our funds’ investments and have a material adverse effect on our results of operations, financial condition and cash flow. In addition, our funds’ portfolio companies make decisions regarding tax positions, which we may not control, that could result in additional tax costs to us.
•Junior Ranked Investments: In most cases, the portfolio companies in which our funds invest have, or are permitted to have, outstanding indebtedness or equity securities that rank senior to our funds’ investments. By their terms, those investments may provide that the holders are entitled to receive payment of dividends, interest or principal on or before the dates on which we are entitled to receive payments in respect of our investments. In the event of insolvency of a portfolio company, holders of securities ranking senior to our investment would typically be entitled to receive payment in full (and, in some cases, plus interest) before distributions could be made in respect of our investment. Furthermore, during periods of financial distress or following an insolvency, the ability of our funds to influence a portfolio company’s affairs and to take actions to protect their investments may be substantially less than that of the senior creditors. After repaying holders of securities ranking senior to our investment, the portfolio company may not have any remaining assets to repay its obligation to us. In the case of securities ranking equally with our investments, we would have to share on an equal basis any distributions with other security holders in the event of an insolvency of the relevant portfolio company.
The rights we may have with respect to the collateral securing certain loans made by our credit funds to our portfolio companies may also be limited pursuant to the terms of one or more intercreditor agreements or agreements among lenders. Under these agreements, we may forfeit certain rights with respect to the collateral to holders with prior claims, including the right to commence enforcement proceedings against the collateral, the right to control the conduct of enforcement proceedings, the right to approve amendments to collateral documents, the right to release liens on collateral and the right to waive past defaults under collateral documents. We may not have the ability to control or direct such actions, even if as a result our rights as lenders are adversely affected.
•Concentration of Fund Investments: The governing agreements of our funds generally contain only limited investment restrictions and limited requirements as to diversification of fund investments, either by geographic region or asset type. For example, we manage funds that invest predominantly in North America and Asia. During periods of difficult market conditions or slowdowns in these sectors or geographic regions, decreased revenue, difficulty in obtaining access to financing and increased funding costs experienced by our funds may be exacerbated by this concentration of investments, which would result in lower investment returns for our funds. Such concentration may increase the risk that events affecting a specific geographic region or asset type will have a negative or disparate impact on such funds compared to funds that invest more broadly.
Valuation methodologies for certain fund assets may involve subjective judgments, and our valuation of an investment could differ significantly from the value that is obtained upon the investment’s exit, which could result in significant losses for us and our funds.
There are no readily ascertainable market prices for a substantial majority of our funds’ illiquid investments. We generally determine the fair value of the investments of our funds in accordance with accounting principles generally accepted in the United States of America (“U.S. GAAP”).
Our valuations of illiquid assets in accordance with U.S. GAAP are based to a large extent on our estimates, comparisons and qualitative evaluations of private information, which can be incomplete or inaccurate. The amount of judgment and discretion inherent in valuing assets renders valuations uncertain and susceptible to material fluctuations over possibly short periods of time; substantial write-downs and earnings volatility are possible. Our determination of an investment’s fair value may differ materially from the value that would have been determined if a ready market for the securities had existed and the valuations the general partners of other funds or other third parties ascribe to the same investment. Our valuation of an investment at a measurement date may also differ materially from the value that is obtained upon the investment’s exit. The valuations of and realization opportunities for investments made by our funds could also be subject to high volatility as a result of uncertainty regarding governmental policy with respect to, among other things, tax, financial services regulation, international trade, immigration, healthcare, labor, infrastructure and energy.
Further, although we follow valuation methodologies and procedures designed to ensure that our fair value determinations are the product of the application of U.S. GAAP and to minimize potential bias, we may have incentives to arrive at higher valuations. Our stockholders’ equity could be negatively impacted if the values of investments that we record are materially higher than the values that are ultimately realized upon the disposal of the investments. Realizations at values significantly lower than the values at which investments have been reflected in prior fund reporting could result in losses for the applicable fund and the loss of potential performance and other fees. Additionally, if realizations of our investments produce values materially different than the carrying values reflected in prior fund reporting, fund investors may lose confidence in us, which could in turn result in difficulty in raising capital for future funds or redemptions from
our funds that permit redemptions. If the investment values that we record from time to time are not ultimately realized, it could have a material adverse effect on our results of operations, financial condition and cash flow.
In addition, because we typically value our entire portfolio on a quarterly basis, subsequent events that may have a significant impact on those valuations may not be reflected until the next quarterly valuation date. Changes in values attributed to investments from quarter to quarter may result in volatility in our AUM and could materially affect the results of operations that we report from period to period.
The due diligence process that we undertake in connection with our investments may not reveal all facts that may be relevant in connection with an investment.
Before making our investments, we conduct due diligence that we deem reasonable and appropriate based on the facts and circumstances applicable to each investment opportunity. The objective of the due diligence process is to identify both the attractive attributes of and risks associated with an investment as well as prepare a framework that may be used from the date of acquisition to drive operational improvement and value creation. When conducting due diligence, we may need to evaluate important and complex business, financial, regulatory, tax, accounting, environmental and legal issues. Outside consultants, legal advisors, accountants and investment banks, as well as Y Analytics, may be involved in the due diligence process in varying degrees depending on the type of investment.
When conducting due diligence and assessing an investment, we rely on the resources available to us, including information from the target and, in some circumstances, third-party investigations and analysis. The information available to us in conducting due diligence of newly-organized or growth stage companies is limited, may be difficult to obtain for companies experiencing distress, and we limit the due diligence we conduct for certain of our strategies to publicly available information. Accordingly, the due diligence investigation that we carry out with respect to an investment opportunity may not reveal or highlight all relevant facts that may be necessary or helpful in evaluating it. For example, the due diligence process in connection with carve-out transactions may underestimate the complexity and/or level of dependence a business has on its parent company and affiliated entities. In addition, because a carve-out business often does not have financial statements that accurately reflect its true financial performance as a stand-alone business, due diligence assessments of such investments can be particularly difficult. Instances of fraud, accounting irregularities and other improper, illegal or deceptive practices can be difficult to detect, and fraud and other deceptive practices can be widespread in certain jurisdictions. Several of our funds invest in emerging market countries that may not have laws and regulations that are as stringent or consistently enforced as in more developed nations. For example, our funds invest throughout jurisdictions that are perceived to present an elevated risk of corruption according to international rating standards (such as Transparency International’s Corruption Perceptions Index), and in companies in the United States and other jurisdictions and regions with low perceived risk of corruption but whose business may be conducted in other high-risk jurisdictions, including, for example, Bangladesh, Brazil, China, India, Indonesia, Kenya, Myanmar, Nigeria, the Philippines, Thailand and Vietnam. Due diligence on investment opportunities in these jurisdictions is frequently more complicated due to lack of consistent and uniform commercial practices and/or very limited access to information. Bribery, fraud, accounting irregularities and deceptive or corrupt practices can be especially difficult to detect in such locations.
In addition, investment opportunities may involve companies that have historic and/or unresolved regulatory-, tax-, fraud- or accounting-related investigations, audits or inquiries and/or have been subject to public accusations of improper behavior (including bribery and corruption). Even specific, enhanced due diligence investigations with respect to such matters may not reveal or highlight all facts and circumstances that may be relevant to evaluating the investment opportunity and/or accurately identifying and assessing settlements, enforcement actions and judgments that could arise and have a material adverse effect on the portfolio company’s operations, financial condition, cash flow, reputation and prospects. Our due diligence investigations may not result in us making successful investments. Although our funds typically obtain representations and warranties insurance, such insurance may not be available on desired terms. Failure to identify risks associated with our investments could have a material adverse effect on our results of operations, financial condition and cash flow.
Many of our funds invest in relatively high-risk, illiquid assets, and we may fail to realize any profits from these activities for a considerable period of time or lose some or all of the principal amount we invest.
Many of our funds invest in securities, including equity securities, that are not publicly traded. In many cases, contracts we enter into or applicable securities laws prohibit our funds from selling such securities for a period of time. Our funds will generally be unable to sell these securities publicly unless we register their sale under applicable securities laws or we can rely on an available exemption, and in either case only at such times when we do not possess material non-public
information. Our funds’ ability to dispose of investments is heavily dependent on the capital markets, particularly, the public equity markets. For example, our ability to realize any value from an investment may depend upon our ability to complete an initial public offering. However, even with publicly traded securities, we may only dispose of large holdings over a substantial length of time, exposing our investment returns to market risk during the intended disposition period. Moreover, because the investment strategy of many of our funds often entails us serving on our funds’ public portfolio company boards, our funds may be restricted from selling during certain time periods. Accordingly, our funds may be forced, under certain conditions, to either sell securities at a loss or defer, potentially for a considerable period of time, sales that they had planned to make.
In addition, market conditions and regulatory environment can also delay our funds’ exit and realization of investments. For example, rising interest rates and challenging credit markets may make it difficult for potential buyers to raise sufficient capital to purchase our funds’ investments. Government policies, or restrictions on foreign investment in certain of our funds’ portfolio companies or assets can also limit our funds’ exit opportunities.
Our funds invest in companies that are based outside of the United States, which may expose us to additional risks not typically associated with investing in companies that are based in the United States.
Many of our funds invest a significant portion of their assets in the equity or other securities of issuers located outside the United States, including (in order of concentration as of December 31, 2023) Europe, India, China, Australia, Singapore, Korea, and Malaysia. Investments in non-U.S. securities or companies that are based or have operations in countries outside of the United States, or otherwise generate revenue or have other touchpoints outside of the United States, involve certain factors not typically associated with investing in U.S. companies, including risks relating to:
•currency exchange matters, including fluctuations in currency exchange rates and costs associated with conversion of investment principal and income from one currency into another;
•less developed or efficient financial markets, which could lead to price volatility and relative illiquidity;
•the absence of uniform accounting, auditing and financial reporting standards, practices and disclosure requirements and less government supervision and regulation;
•changes in laws or clarifications to existing laws that could create tax uncertainty;
•a less developed legal or regulatory environment, differences in the legal and regulatory environment or enhanced legal and regulatory compliance;
•greater levels of bribery, corruption and politically exposed persons;
•potential exposure to the U.S. Foreign Corrupt Practices Act (“FCPA”) and other laws that prohibit improper payments or offers of payments for commercial bribery purposes or to foreign governments, their officials and other third parties;
•violations of trade sanctions or trade control regimes (including those that are maintained and enforced by U.S. Treasury Department’s Office of Foreign Assets Control (“OFAC”)) and the potential for the imposition of new or additional tariffs;
•political hostility to investments by foreign or private equity investors, including increased risk of government expropriation;
•reliance on a more limited number of commodity inputs, service providers and distribution mechanisms;
•higher rates of inflation;
•higher transaction costs;
•less government supervision of exchanges, brokers and issuers;
•less developed or non-uniform bankruptcy, limited liability company, corporate, partnership and other laws (which may have the effect of disregarding or otherwise circumventing limited liability structures, potentially causing the actions or liabilities of one fund or portfolio company to adversely impact us or an unrelated fund or portfolio company);
•difficulty in enforcing contractual obligations;
•less stringent requirements relating to fiduciary duties;
•fewer investor protections and less publicly available information about a company;
•limitations on borrowings to be used to fund acquisitions or dividends;
•potential limitations on the deductibility of interest for income tax purposes;
•limitations on permissible transaction counterparties or consolidation rules that effectively restrict the types of businesses in which we may invest;
•economic and political risks, including potential exchange control regulations, restrictions on repatriation of profits on investments or of capital invested, nationalization, expropriation of assets, confiscatory taxation and political, economic or social instability; and
•the imposition of non-U.S. taxes or withholding on income and gains recognized with respect to such securities and potential non-U.S. tax filing requirements.
For a more detailed discussion of risks specific to China, see “—Changes in China’s governmental policies could have an adverse effect on our business and operations.”
In addition, restrictions on international trade or the recent or potential further imposition of tariffs may negatively impact investments in non-U.S. companies. See “—Ongoing trade negotiations and the potential for further regulatory reform in the U.S. and abroad may create regulatory uncertainty for us, our funds and our funds’ portfolio companies and our investment strategies and negatively impact the profitability of our funds and our funds’ portfolio companies.” For example, the tax authorities in certain countries, including certain EU member states, have sought to deny the benefits of income tax treaties or EU directives with respect to withholding taxes on interest and dividends and capital gains of non-resident entities. These various proposals and initiatives could result in an increase in taxes and/or increased tax withholding with respect to our fund investors. Adverse developments along these lines could negatively impact the assets we hold in certain countries or the returns from these assets.
Ongoing trade negotiations and the potential for further regulatory reform in the U.S. and abroad may create regulatory uncertainty for us, our funds and our funds’ portfolio companies and our investment strategies and negatively impact the profitability of our funds and our funds’ portfolio companies.
Since March 2018, the United States has imposed, or threatened to impose, a series of various tariffs and restrictions on a variety of goods imported into the United States, with an emphasis on those imported from China, the EU, Russia and Belarus. For example, the United States denied the “most-favored nation” tariff treatment on products from Russia and Belarus and prohibited the importation of oil, gas and coal from Russia. These new tariffs, or other changes in U.S. trade policy, have resulted in, and may continue to trigger, retaliatory actions by affected countries, particularly China. While the United States and China signed a preliminary trade deal in January 2020 halting further tariffs and increasing sales of U.S. goods to China, the agreement leaves in place most tariffs on Chinese goods.
The United States has imposed economic sanction programs and export controls targeting Russia and Belarus. The U.S. government has also implemented and expanded a number of economic sanctions programs and export controls that target Chinese entities and nationals on national security grounds and has imposed restrictions on the acquisition of interests in the securities of certain Chinese entities. These initiatives target, for example, China’s response to political demonstrations in Hong Kong, China’s conduct concerning the treatment of Uighurs and other ethnic minorities in its Xinjiang province and certain Chinese entities designated by the U.S. government as Communist Chinese military companies, among other things.
Tensions globally remain elevated and the path of future trade policy and further permanent trade agreements with China are still unclear. A “trade war” or other governmental action related to tariffs or international trade agreements or policies has the potential to increase costs, decrease margins, reduce the competitiveness of products and services offered by current and future portfolio companies and negatively impact the revenues and profitability of companies whose businesses rely on goods imported from or exported to any country impacted by such policies. In addition, tariff increases may negatively impact our suppliers and certain other customers of our funds’ portfolio companies, which could amplify the negative impact on our operating results or future cash flows.
Changes in China’s governmental policies could have an adverse effect on our business and operations.
Investments in companies with significant Chinese operations can involve a high degree of risk and special considerations that are not always associated with investing in other markets. For example, investing in China may involve a risk of loss due to the imposition of restrictions on foreign investments or repatriation of capital. The Chinese government maintains a major role in setting economic policy, often making sudden changes to laws and regulations, including through the issuance of guidance or enforcement, possibly with retroactive effect. For example, in 2021, the Chinese government has changed policies regulating certain industries, including the education and technology sectors. While our funds have limited exposure to companies in those industries, the Chinese government could at any time adopt similar measures with respect to any of the multiple sectors across which we invest. Any changes in laws and regulations governing those sectors may reduce opportunities for our funds to make, exit and realize value from, and realize expected returns on, our investments in China. The industries in which our funds invest, and the material risks associated with these respective industries, include:
•Software: The Chinese government has enacted cybersecurity laws (including the Cyber Security Law, Data Security Law and Individual Information Protection Law, as well as relevant regulations implementing such laws), and the Chinese government may promulgate more detailed guidelines on data localization and data security compliance for firms that are currently, or plan to be, listed in foreign jurisdictions. Such laws and guidelines may limit options for our funds’ exit from such firms.
•Media and Financial Technology: The Chinese government has increased scrutiny of, and restrictions on, the media and financial technology industries, including by promulgating rules barring private investments from news gathering and distribution operations or live streaming events that may sway political and public opinion. These restrictions could constrain the operation and profitability of firms in those industries, and therefore, negatively impact our funds’ investments in those sectors.
•Consumer Goods: China has recently enforced stringent regulations (including but not limited to the latest amendment to the Juvenile Protection Law, which came into effect on June 1, 2021) “to protect the physical and mental health of minors,” including significant limitations on the use of online gaming and private tutoring services for young adults and teenagers in China. These regulations could constrain the operation and profitability of firms in those industries, and therefore, negatively impact our funds’ investments in those sectors.
•Healthcare: The Chinese government has been promoting volume-based purchasing of medicine and medical devices as a way to reduce medical costs for the public. Any such reforms may adversely affect our funds’ investments in the Chinese healthcare sector.
In addition, certain of our portfolio companies in China implement variable interest entity (“VIE”) structures. Instead of directly owning the equity securities of a Chinese company, a VIE enters into service and other contracts with the Chinese company that provide the VIE with economic exposure to it. Although the VIE does not own any of the Chinese company’s equity, the contractual arrangements permit the VIE to consolidate it in its financial statements. We invest in VIE structures constructed by our funds’ portfolio companies to access foreign capital, which structures replicate foreign investment in Chinese-based companies where, for example, Chinese law prohibits direct foreign investments in the operating companies. Our funds therefore do not directly hold equity interests in the Chinese operating company when a VIE structure is used. Intervention by the Chinese government with respect to VIEs, including disallowing the structure altogether (as the media has reported, with the China Securities Regulatory Commission issuing a contradicting statement), could significantly affect the Chinese operating company’s performance and the enforceability of the VIE’s contractual arrangements with the Chinese company and result in a decline in the value of our funds’ investment.
Further, unlike in many other jurisdictions, the Chinese judiciary is not independent and may not be able to provide effective legal redress challenging Chinese authorities’ policy changes. Legal disputes over such policy changes may be subject to the exercise of considerable discretion or influence by Chinese governmental agencies or the governing political party, and factors unrelated to the legal merits of a particular matter may influence their determination. Continued uncertainty relating to the laws in China and the application of the laws could have a material adverse effect upon our funds’ and their portfolio companies’ operation in China. While none of our funds invests exclusively in China and our current investments in companies headquartered, listed or expected to be listed in Mainland China and Hong Kong represent approximately 2% of our AUM, our funds invest in various companies that operate globally, including in China, and thus could be subject to Chinese authorities’ policy changes. We also maintain and intend to continue to maintain multiple offices, personnel and investments in various sectors in China. Therefore, the materialization of any of the foregoing risks could have an adverse effect on the financial performance of our portfolio companies that operate in China and thus negatively affect our results of operations, financial condition and cash flow.
Risk management activities may not be successful and, in some cases, may negatively impact the return on our and our funds’ investments.
When managing our exposure to market risks, we may (on our own behalf or on behalf of our funds) from time to time use forward contracts, options, swaps, caps, collars and floors or pursue other strategies or use other forms of derivative instruments (over the counter, or “OTC,” and otherwise) to limit our exposure to changes in the relative values of investments that may result from market developments, including changes in prevailing interest rates, currency exchange rates and commodity prices. The scope of risk management activities undertaken by us varies based on the level and volatility of interest rates, the prevailing foreign currency exchange rates, the types of investments that are made and other changing market conditions. We do not seek to hedge our exposure in all currencies or all investments, which means that our exposure to certain market risks are not limited. The use of hedging transactions and other derivative instruments to reduce the effects of a decline in the value of a position does not eliminate the possibility of fluctuations in the value of the position or prevent losses if the value of the position declines. Moreover, it may not be possible to limit the exposure to a market development that is so generally anticipated that a hedging or other derivative transaction cannot be entered into at an acceptable price. The success of any hedging or other derivative transaction generally will depend on our ability to correctly predict market changes, the degree of correlation between price movements of a derivative instrument and the position being hedged, the creditworthiness of the counterparty and other factors. As a result, while we may enter into such a transaction in order to reduce our exposure to market risks, the transaction may result in poorer overall investment performance than if it had not been executed. Such transactions may also limit the opportunity for gain if the value of a hedged position increases. In addition, the degree of correlation between price movements of the instruments used in connection with hedging activities and price movements in a position being hedged may vary. For various reasons, we may not seek to establish, or be successful in establishing, a perfect correlation between the instruments used in hedging or other derivative transactions and the positions being hedged. An imperfect correlation could prevent us from achieving the intended result and give rise to a loss. Further, it may not be possible to fully or perfectly limit our exposure against all changes in the value of our and our funds’ investments because the value of investments is likely to fluctuate as a result of a number of factors, some of which will be beyond our control or ability to hedge. If our risk management activities are not successful, resulting losses could have a material adverse effect on our results of operations, financial condition and cash flow.
Operational risks, including those associated with our business model, could disrupt our businesses, result in losses or limit our growth.
We operate businesses that are highly dependent on information systems and technology. We rely heavily on a host of computer software and hardware systems, including our financial, accounting and other data processing systems, and on the systems of third party service providers. In addition to the systems required to monitor most of our funds, certain of our credit funds, for example, are highly dependent on our ability to process and evaluate, on a daily basis, transactions across markets and geographies in a time-sensitive, efficient and accurate manner. As a result, we rely heavily on our financial, accounting and other data processing systems. If any of these systems do not operate properly or experience a security breach, we could suffer financial loss, theft of intellectual property or personally identifiable information, a disruption of our businesses, liability to our funds, regulatory intervention and fines and reputational damage. For example, we face operational risk from errors made in the execution, confirmation or settlement of transactions, as well as errors in recording, evaluating and accounting for them. Our and our third-party service providers’ information systems and technology may be unable to accommodate our growth, adequately protect the information of our individual fund investors or address security risks, and the cost of maintaining such systems and technology may increase from our current level.
Such a failure to accommodate growth, or an increase in costs related to such information systems and technology, could have a material adverse effect on our results of operations, financial condition and cash flow.
Our acquisition of Angelo Gordon, which was completed on November 1, 2023, creates risks involving the integration of its information technology environment and cybersecurity controls. These risks may arise from any defects or vulnerabilities that may be present in their systems or difficulties or other breakdowns or disruptions in connection with the integration of the network environment and security controls into our information technology systems. In addition, firms undergoing mergers and acquisitions are often targeted more frequently by cyber criminals due to this period of increased risk.
We are also dependent on an increasingly concentrated group of third-party software vendors that we do not control for hosting solutions and technologies. A disaster or a disruption in technology or infrastructure that supports our businesses, including a disruption involving electronic communications or other parts or services used by us, our vendors or third parties with whom we conduct business, including custodians, paying agents and escrow agents, or directly affecting our principal offices, could negatively impact our ability to continue to operate our business without interruption. Our business continuation or disaster recovery programs may not be sufficient to mitigate the harm that could result from such a disaster or disruption, and insurance and other safeguards may only partially reimburse us for our losses, if at all. Furthermore, we utilize cloud applications and services for the asset management business, and such applications and systems are vulnerable to damage or interruption from computer viruses, data corruption, cyber-based attacks, unauthorized access, natural disasters, pandemics, terrorism, war and telecommunication and electrical failures. Any disruption in the operation of the information systems and technology or cloud applications and services on which we rely could negatively impact our business.
Failure to maintain the security of our information and technology networks or data security breaches could harm our reputation and have a material adverse effect on our results of operations, financial condition and cash flow.
We rely on the reasonably secure processing, storage and transmission of confidential and other sensitive information in our computer systems and networks, and those of our service providers and their vendors. We are subject to various risks and costs associated with the collection, handling, storage and transmission of personally identifiable information and other sensitive information, including those related to compliance with U.S. and foreign data collection and privacy laws and other contractual obligations, as well as those associated with the compromise of our systems processing such information. In the ordinary course of our business, we collect and store a range of data, including our proprietary business information and intellectual property, and personally identifiable information of our employees, our fund investors and other third parties, in our cloud applications and on our networks, as well as our service providers’ systems. The secure processing, maintenance and transmission of this information are critical to our operations. We, our service providers and their vendors face various security threats on a regular basis, including ongoing cybersecurity threats to and attacks on our and their information technology infrastructure that are intended to gain access to our proprietary information, destroy or modify data or disable, degrade or sabotage our systems. Cyber-incident techniques change frequently, may not immediately be recognized and can originate from a wide variety of sources. There has been an increase in the frequency, sophistication and ingenuity of the data security threats we and our service providers face, with attacks ranging from those common to businesses generally to those that are more advanced and persistent. Although we and our services providers take protective measures and endeavor to modify them as circumstances warrant, our computer systems, software and networks may be vulnerable to unauthorized access, theft, misuse, computer viruses or other malicious code, including malware, and other events that could have a security impact. Modifying or adjusting such protective measures may require increased allocation of Company resources. We may be the target of more advanced and persistent attacks because, as an alternative asset manager, we hold a significant amount of confidential and sensitive information about, among other things, our fund investors, portfolio companies and potential investments. We may also be exposed to a more significant risk if these acts are taken by state actors. Any of the above cybersecurity threats, fraudulent activities or security breaches suffered by our service providers and their vendors could also put our confidential and sensitive information at risk or cause the shutdown of a service provider on which we rely. We and our employees have been and expect to continue to be the target of fraudulent calls and emails, the subject of impersonations and fraudulent requests for money, including attempts to redirect material payment amounts in a transaction to a fraudulent bank account, and other forms of spam attacks, phishing or other social engineering, ransomware or other events. Cyber-criminals may attempt to redirect payments made at the closings of our investments to unauthorized accounts, which we or our services providers we retain, such as paying agents and escrow agents, may be unable to detect or protect against. The COVID-19 pandemic exacerbated these risks due to heavier reliance on online communication and the remote working environment, which may be less secure, and there has been a significant increase in hacking attempts by cyber-criminals. Ongoing global conflicts have likewise exacerbated these risks due to the scale of related offensive cyber-attacks that could directly,
indirectly or inadvertently impact business far removed from the battlefield. For example, U.S. companies were harmed by NotPetya attacks in 2017, which were attributed to the Russian military in connection with Russia’s annexation of Crimea. The costs related to cyber or other security threats or disruptions may not be fully insured or indemnified by others, including by our service providers. If successful, such attacks and criminal activity could harm our reputation, disrupt our business, cause liability for stolen assets or information and have a material adverse effect on our results of operations, financial condition and cash flow.
We rely heavily on our back office informational technology infrastructure, including our data processing systems, communication lines and networks. Although we have back-up systems and business-continuity plans in place, our back-up procedures and capabilities in the event of a failure or interruption may not be adequate. Any interruption or failure of our informational technology infrastructure could result in our inability to provide services to our clients, other disruptions of our business, corruption or modifications to our data and fraudulent transfers or requests for transfers of money or the inability to demonstrate compliance with legal requirements. Further consequences could include liability for stolen assets or information, increased cybersecurity protection, computer forensics expenses, insurance costs and litigation. We expect that we will need to continue to upgrade and expand our back-up and procedures and capabilities in the future to avoid disruption of, or constraints on, our operations. We may incur significant costs to further upgrade our data processing systems and other operating technology in the future.
Further, we provide certain back office services, such as information and technology and accounting services, to Sixth Street Partners, our former affiliate (the “former affiliate”), which could pose additional risks. We manage back office services for our former affiliate using the same processes and procedures as our internal services, which may result in increased risk of inadvertent data sharing between us and our former affiliate due to human error. In addition, as we do not provide such services to other third parties, these risks may be heightened if we fail to effectively carry out our obligations or implement and maintain appropriate compliance procedures. For example, we could face liability under a transition services agreement with our former affiliate in connection with our failure to maintain appropriate back office services and support, and we may be exposed to material non-public information that may restrict our ability to make investments and execute our business strategy. See “—Our activities and the business activities of certain of our personnel may give rise to conflicts of interest with our funds, and our failure to deal appropriately with conflicts of interest could damage our reputation and negatively impact our business—Information barriers.”
Our technology, data and intellectual property and the technology, data and intellectual property of our funds’ portfolio companies are also subject to a heightened risk of theft or compromise to the extent that we and our funds’ portfolio companies engage in operations outside the United States, particularly in those jurisdictions that do not have comparable levels of protection of proprietary information and assets, such as intellectual property, trademarks, trade secrets, know-how and customer information and records. In addition, we and our funds’ portfolio companies may be required to forgo protections or rights to technology, data and intellectual property in order to operate in or access markets in a foreign jurisdiction. Any such direct or indirect loss of rights in these assets could negatively impact us, our funds and their investments.
A significant actual or potential theft, loss, corruption, exposure or fraudulent, unauthorized or accidental use or misuse of investor, employee or other personally identifiable or proprietary business data could occur, as a result of third-party actions, employee malfeasance or otherwise, non-compliance with our contractual or other legal obligations regarding such data or intellectual property or a violation of our privacy and security policies with respect to such data. If such a theft, loss, corruption, use or misuse of data were to occur, it could result in significant remediation and other costs, fines, litigation and regulatory actions against us by (i) the U.S. federal and state governments, (ii) the EU or other jurisdictions, (iii) various regulatory organizations or exchanges and (iv) affected individuals, as well as significant reputational harm.
Cybersecurity has become a top priority for regulators around the world. Many jurisdictions in which we operate have laws and regulations relating to data privacy, cybersecurity and protection of personal information and other sensitive information, including, without limitation the General Data Protection Regulation (Regulation (EU) 2016/679) (the “GDPR”) in the EU and the Data Protection Act 2018 in the U.K. (the “U.K. Data Protection Act”), comprehensive U.S. state privacy laws enacted in California, Texas and other states as well as laws in Australia, Cayman Islands, Hong Kong, India, Korea, Japan, Dubai and Singapore. China and other countries have also passed cybersecurity laws that may impose data sovereignty restrictions and require the localization of certain information. We believe that additional similar laws will be adopted in these and other jurisdictions in the future, further expanding the regulation of data privacy and cybersecurity. Such laws and regulations strengthen the rights of individuals (data subjects), mandate stricter controls over the processing of personal data by both controllers and processors of personal data and impose stricter sanctions with substantial administrative fines and potential claims for damages from data subjects for breach of their rights, among other
requirements. Some jurisdictions, including each of the U.S. states, U.S. federal laws, as well as the EU through the GDPR and the U.K. through the U.K. Data Protection Act, have also enacted laws requiring companies to notify individuals of data security breaches involving certain types of personal data, which would require heightened escalation and notification processes with associated response plans. We devote resources to and monitor and enhance our information security and data privacy procedures and controls in an effort to comply with evolving cybersecurity and data privacy regulation. We or our fund’s portfolio companies may incur substantial costs to comply with changes in such laws and regulations and may be unable to adapt to such changes in the necessary timeframe and/or at reasonable cost. Furthermore, if we fail to comply with the applicable laws and regulations, it could result in regulatory investigations and penalties, which could lead to negative publicity and may cause our fund investors and clients to lose confidence in the effectiveness of our security and privacy measures.
Our funds’ portfolio companies also rely on data processing systems and the secure processing, storage and transmission of information, including payment and health information. A disruption or compromise of these systems could negatively impact the value of these businesses. Our funds may invest in strategic assets having a national or regional profile or in infrastructure, the nature of which could expose them to a greater risk of being subject to a nation-state or terrorist attack or security breach than other assets or businesses. Such an event could negatively impact our investment or assets of the same type or require portfolio companies to increase preventative security measures or expand insurance coverage.
The materialization of one or more of these risks could impair the quality of our and our funds’ operations, harm our reputation, materially and adversely impact our businesses and limit our ability to grow.
We and our funds are subject to risks in using third-party service providers, including custodians, administrators, executing brokers, prime brokers and other agents.
We and many of our funds depend on the services of custodians, administrators, prime brokers and other agents and third-party service providers to carry out certain securities transactions and other business functions. Errors and mistakes made by these third parties may be attributed to us and subject us or our fund investors to reputational damage, penalties or losses. We may be unsuccessful in seeking reimbursement or indemnification from these third-party service providers.
Furthermore, in the event of the insolvency of a custodian and/or prime broker, our funds may be unable to recover equivalent assets in full as they will rank among the custodian’s and prime broker’s unsecured creditors in relation to assets it borrows, lends or otherwise uses. In addition, a custodian or prime broker may not segregate our funds’ cash from its own cash, and our funds therefore may rank as unsecured creditors in relation to that cash. The inability to recover assets from the custodian or prime broker could have a material adverse effect on our and our funds’ results of operations, financial condition and cash flow. Counterparties have generally reacted to recent market volatility by tightening their underwriting standards and increasing their margin requirements for all categories of financing, which has the result of decreasing the overall amount of leverage available and increasing the costs of borrowing. Many of our funds have credit facilities, and if a lender under one or more of these credit facilities were to become insolvent, we could have difficulty replacing the credit facility and one or more of our funds may face liquidity problems.
The counterparty to one or more of our or our funds’ contractual arrangements could default on its obligations under the contract. Default risk may arise from events or circumstances that are difficult to detect, foresee or evaluate. In addition, concerns about, or a default by, one large market participant could lead to significant liquidity problems for other market participants, which could in turn expose us to significant losses. If a counterparty defaults, we and our funds may be unable to take action to cover the exposure and could incur material losses and legal and reputational damages. We may not accurately anticipate the impact of market stress or counterparty financial condition and, as a result, we could take insufficient action to reduce these risks effectively, which, if left unmitigated, could have a material adverse effect on our results of operations, financial condition and cash flow.
The consolidation and elimination of counterparties may increase our concentration of counterparty risk. Our funds generally are not restricted from dealing with any particular counterparty or from concentrating any or all of their transactions with one counterparty. In particular, our public equity funds utilize prime brokerage arrangements with a relatively limited number of counterparties, which has the effect of concentrating the transaction volume (and related counterparty default risk) of these funds with these counterparties.
Our activities and the business activities of certain of our personnel may give rise to conflicts of interest with our funds, and our failure to deal appropriately with conflicts of interest could damage our reputation and negatively impact our business.
As we have expanded and continue to expand the number and scope of our activities, we increasingly confront actual, potential or apparent conflicts of interest relating to our funds’ investment activities. The following discussion describes certain of these actual, potential or apparent conflicts of interest and how we intend to manage them. If we are unable to successfully manage conflicts of interest relating to our funds’ investment activities, fund investors may decrease their commitments to future funds, we could be subject to lawsuits or regulatory enforcement actions or we could face other adverse consequences and reputational harm, all of which could cause our and our funds’ performance to suffer and thus adversely affect our results of operations, financial condition and cash flow. The following summary is not intended to be an exhaustive list of all conflicts or their potential consequences. Identifying potential conflicts of interest is complex and fact-intensive, and it is not possible to foresee every conflict of interest that will arise.
Allocation Procedures and Principles. Conflicts of interest exist regarding decisions about the allocation of specific investment opportunities among us and our funds and the allocation of fees and costs among us, our funds and our funds’ portfolio companies. Certain inherent conflicts of interest arise from the fact that:
•we provide investment management services to more than one fund;
•our funds often have overlapping investment strategies and objectives, including co-investing funds and funds that invest alongside other funds; and
•we could choose to allocate an investment to more than one fund or to allocate an entire investment opportunity to a single fund when the “duty to offer” provisions in our fund documents are not determinative of allocation.
An allocation decision may result in a single fund being allocated an entire investment opportunity, or in multiple funds sharing an investment opportunity on a basis approved by an allocation committee. Our allocation committee employs principles that we determine in good faith to be fair and reasonable. In addition, as described below under “—Information Barriers,” certain funds are behind an information barrier and would generally not be allocated an opportunity sourced by an investment platform on the other side of the information barrier.
We expect our allocation principles, and procedures more generally, to change over time, including during the commitment periods of our funds. The application of our allocation principles is a fact-intensive exercise. While we base our allocation decisions on the information available to us at the time, this information may prove, in retrospect, to be incomplete or otherwise flawed.
In making an allocation decision, additional conflicts of interest will arise. Specifically, because our funds have different fee, expense and profit-sharing structures, we have an incentive to allocate an investment opportunity to the fund that would generate higher management fees or performance allocations. In addition, our professionals will generally participate indirectly in investments made by the funds in which they invest. We do not explicitly take such considerations into account in making allocation decisions and expect that our procedures and principles will help mitigate the risk that these incentives implicitly influence our allocation decisions.
Conflicts of interest may also arise in the determination of what constitutes fund-related expenses and the allocation of such expenses between the funds we manage and us. We employ the same procedures and principles described above when allocating fees and expenses incurred in connection with “broken deals,” or potential investments that we actively consider but do not consummate. That is, we generally make fee and expense allocation decisions while a transaction is pending based on our best judgment of the fund or funds to which we will ultimately allocate the transaction. This judgment is necessarily subjective, especially when a transaction is terminated at an early stage. When we abandon an opportunity, absent a factual development to the contrary, we will allocate the fees and expenses for such transaction to such fund or funds. As with our other allocation decisions, our allocation procedures and principles are designed to help mitigate the risk that financial incentives implicitly influence the allocation of broken deal fees and expenses.
From time to time, we will have the option to offer fund investors, senior advisors or other third parties (including investors in other funds) the opportunity to invest alongside our funds, or “co-invest,” in an investment a fund is making either directly or through a TPG-controlled vehicle established to invest in one or more co-investment opportunities. Our
fund documents typically do not mandate specific allocations with respect to co-investments. Our funds’ investment advisers may have an incentive to provide potential co-investment opportunities to certain investors in lieu of others and/or in lieu of an allocation to our funds (including, for example, as part of an investor’s overall strategic relationship with us) if such allocations are expected to generate relatively greater fees or performance allocations than would arise if such co-investment opportunities were allocated otherwise.
Shared investments. We expect more than one of our funds to make investments in the same portfolio company from time to time. In many such cases, the funds will co-invest in lockstep, with both funds making and exiting the shared investment at the same time and on substantially the same terms. In some situations, however, the funds will have different entry timing in the same portfolio company, acquire the same security on different terms and/or invest in different parts of the portfolio company’s capital structure. In these cases, each fund’s views of the investment and its interests may diverge. This could cause one fund to dispose of, increase its exposure to or continue to hold the investment at a time when the other fund has taken a different approach. As a result, the actions of one fund could affect the value of the other fund’s investment. For instance, a sale by a fund of its investment could put downward pressure on the value of the remaining fund’s interest. Additionally, in certain circumstances, our investment professionals overseeing an investment for one fund may be unaware, as a result of information barriers, of another’s fund investment in the same portfolio company. See “—Information Barriers” below.
Investing throughout the corporate capital structure. Our funds invest in a broad range of asset classes throughout the corporate capital structure, including preferred equity securities, common equity securities, loans and debt securities; and certain of our funds also engage in short selling. In certain cases, we may manage separate funds that invest in different parts of the same company’s capital structure or one fund may lend to a company in which another fund holds an equity stake. Similarly, one fund may be “long” a company that another fund is “short.” As our number and range of products grows, the frequency of such conflicts may increase. Decisions taken by one fund in these circumstances to further its interests may be adverse to the interests of another fund. In those cases, the interests of our funds may not be aligned, which could create actual or potential conflicts of interest or the appearance of such conflicts. We will at times take steps to reduce potential conflicts of interest, including by causing a fund to take certain actions that, in the absence of such conflict, it would not take (or abstain from taking certain actions it would otherwise take). Any such steps could have the effect of benefiting one fund, or the Company, at the expense of another fund.
Competition and conflicts among TPG businesses. Given the breadth of our portfolio across platforms, our funds may invest in a competitor or customer of, or service provider or supplier to, a portfolio company of another fund, which could give rise to a variety of conflicts of interest. For example, a fund or its portfolio company may take actions for commercial reasons that have adverse consequences for another fund or its portfolio company, such as seeking to increase its market share at the portfolio company’s expense (as a competitor), withdrawing business from the portfolio company in favor of a competitor that offers the same product or service at a more competitive price (as a customer), increasing prices in lockstep with other enterprises in the industry (as a supplier) or commencing litigation against the fund portfolio company (in any capacity). Our funds are under no obligation to take into account another fund’s interests in advising their portfolio companies or otherwise managing their assets.
Possession of material non-public information. Our funds, investment platforms and people regularly obtain non-public information regarding target companies and other investment opportunities. Prior to our acquisition of TPG Angelo Gordon, we did not maintain permanent information barriers among our businesses. Following the acquisition, we have created an information barrier between our historical TPG business and TPG Angelo Gordon. For more information, see “—Information Barriers” below. We generally impute non-public information received by one investment team to all other investment professionals on the same side of an information barrier, including all of the personnel who make investments for our funds. In the event that any of our funds or people obtain confidential or material non-public information, we and our funds may be restricted in acquiring or disposing of investments. Notwithstanding the maintenance of restricted securities lists and other internal controls, the internal controls relating to the management of material non-public information could fail and result in us, or one of our people, buying or selling a security while, at least constructively, in possession of material non-public information. Inadvertent trading on material non-public information could negatively impact our reputation, result in the imposition of regulatory or financial sanctions and, consequently, negatively impact our ability to provide investment management services to our funds and clients. These risks are heightened by the existence of our “inside-the-wall” public equity funds, and the public equity funds are subject to a broad restricted securities list, which may limit its investment opportunities. In limited circumstances, we erect temporary information barriers to restrict the transfer of non-public information, which limit our funds’ abilities to benefit from TPG expertise and could be breached, resulting in the same restrictions on their investment activities. Additionally, in connection with providing services under a transition services agreement to our former affiliate, we and/or the former affiliate could be exposed to material non-public
information held by the former affiliate or us, as applicable, which could further restrict our ability to acquire or dispose of investments.
Information barriers. While we generally allow for information to flow freely among many of our investment platforms, we place certain businesses behind information barriers. Currently, for example, TPG Angelo Gordon and its affiliated entities are on the other side of an information barrier from the rest of our investment platforms. While information barriers are designed to restrict the flow of information between certain businesses, such barriers may be breached, inadvertently or otherwise, including with respect to information regarding certain investment opportunities, deal pipelines and strategy, which could result in greater restrictions to our funds’ investment activities. In addition, our information barriers may not be effective in accomplishing their stated purpose and/or they may otherwise adversely affect the ability of our funds to effectively achieve their investment objectives by unduly limiting the investment flexibility of the funds and/or the flow of otherwise appropriate information between businesses. For example, in some instances, certain of our personnel may be unable to assist with the activities of a fund as a result of these information barriers. As a result of having an information barrier, information that could benefit a fund might become restricted to those other respective businesses and otherwise be unavailable to such fund. Further, we could be required by certain regulations, or decide that it is advisable, to establish additional permanent information barriers, which would further reduce our ability to share information internally, limit management’s ability to manage our investments and reduce potential synergies across our businesses. The establishment of information barriers may also lead to operational disruptions and result in restructuring costs, including costs related to hiring additional personnel as existing investment professionals are allocated to either side of a barrier.
Broker-dealer and other affiliated service providers. TPG Capital BD, is an affiliate of ours that is a broker-dealer registered with the SEC and a member of FINRA. TPG Capital BD performs services that include those described below. See “—Our broker-dealer’s capital markets activities expose us to risks that, if they materialize, could have a material adverse effect on our results of operations, financial condition and cash flow.” We expect the types of capital markets services we provide to evolve in light of market developments and industry trends.
TPG Capital BD and related entities typically receive compensation for the services we provide in connection with these capital markets activities. Depending on the nature of the transaction, the fund, the portfolio company or other parties to the transaction will pay the fee to TPG Capital BD or a related entity. In many cases, subject to a fund’s governing documents, compensation we receive for providing capital markets services will not offset the management fee or require the consent of investors or any advisory committee.
While we believe that our internal capital markets capabilities help maximize value for our funds, our ability to utilize TPG Capital BD or a related entity in connection with the foregoing transactions gives rise to conflicts of interest. In general, we have an incentive to retain, or to exercise our control or influence over a portfolio company’s management team so that it retains, TPG Capital BD (or a related entity) or otherwise transacts with TPG Capital BD instead of other unaffiliated broker-dealers or counterparties. For instance, TPG Capital BD (or a related entity) could take the place of another investment bank in the syndicate underwriting a securities offering or act as the sole or lead financial institution on a transaction instead of a third-party bank. When involved in a particular transaction, TPG Capital BD (or a related entity) has the incentive to seek higher fees or other favorable terms from a fund, the portfolio company or other counterparties, as well as to structure a transaction so that it benefits certain fund investors or other third parties that are of strategic importance. For example, TPG Capital BD could influence the placement of portfolio company securities or debt instruments so that investors who are sizeable investors in multiple of our funds or who pay TPG Capital BD a placement fee receive an allocation ahead of others. To the extent that our capital markets personnel face competing demands for their time and attention, we have an incentive to devote our limited capital markets resources to portfolio companies and transactions that would generate the highest fee for TPG Capital BD (or related entities). Our employees who provide capital markets services are under no obligation to prioritize the interests of a fund or its investors in determining how to allocate their time across various projects within our firm.
Potential conflicts of interest in connection with co-investments between our private funds and our Registered Closed-End Management Investment Companies. The registered closed-ended management investment companies we manage are permitted to co-invest in portfolio companies with each other and with affiliated investment funds pursuant to an SEC Order (the “Co-Investment Exemptive Order”). The different investment objectives or terms of such funds may result in a potential conflict of interest, including in connection with the allocation of investments between the funds made pursuant to the Co-Investment Exemptive Order. In addition, conflicts of interest may exist in the valuation of our investments and regarding decisions about the allocation of specific investment opportunities among us and our funds and the allocation of fees and costs among us, our funds and their portfolio companies.
Potential performance allocation-related conflicts. Since the amount of performance allocations allocable to the general partners of our funds depends on the funds’ performance, we have an incentive to recommend and, as the general partner, cause our funds to make more speculative investments than they would otherwise make in the absence of such performance-based allocation. We may also have an incentive to cause a fund, as its general partner, to dispose of investments at a time and in a sequence that would generate the most performance allocations, even if it would not be in the fund’s interest to dispose of the investments in that manner. Further, under amendments to U.S. tax law pursuant to Public Law Number 115-97, formerly known as the Tax Cuts and Jobs Act (the “TCJA”), capital gain in respect of a general partner’s distributions of performance allocations from certain of our funds will be treated as short-term capital gain unless the fund holds the relevant investment for more than three years, as opposed to the general rule that capital gain from the disposition of investments held for more than one year is treated as long-term capital gain. This may create an incentive to cause the fund to hold a fund’s investments for longer periods in order for the gain from their dispositions to qualify for capital gain treatment under the new performance allocation rules, even if it would be in the fund’s interest to hold the investments for shorter periods. Consequently, conflicts of interest may arise in connection with investment decisions, including regarding the identification, making, management, disposition and, in each case, timing of a fund’s investments, and we may not realize the most tax efficient treatment of our performance allocations generated by all of our funds going forward.
In addition, since our investment professionals have an interest in the performance allocations made by our funds, our investment professionals may have an incentive to recommend investments and realizations that maximize the amount of performance allocations rather than management fees. Further, because Tarrant Remain Co I, L.P., Tarrant Remain Co II, L.P., and Tarrant Remain Co III, L.P. (collectively with Tarrant Remain Co GP, LLC, “RemainCo”) are entitled to a portion of our funds’ performance allocations, we, in certain circumstances, will have less of an interest in such performance allocations than our investment professionals who also hold equity interests in RemainCo. Similarly, because our senior leadership team holds equity interests in RemainCo, they may have an incentive to recommend that we allocate investments to certain funds or create new funds in which RemainCo holds a higher share percentage of performance allocations, which may be contrary to our interests. See also “—Risks Related to Our Organizational Structure—The historical and pro forma financial information and related notes in this report may not permit you to assess our future performance”.
Use of subscription line facilities by our funds. Most of our funds obtain subscription line facilities to, among other things, facilitate investments. Our funds’ subscription line facilities generally allow revolving borrowings up to a specified principal amount that is determined based in part on the relevant fund’s capital commitments and the lenders’ assessment of the creditworthiness of its investors, and subscription line facilities are typically secured by pledges of the general partner’s right to call capital from, and receive amounts funded by, the funds’ investors. Subscription line facilities may be entered into on a cross-collateralized basis with the assets of the funds’ parallel funds, certain other funds and their respective alternative investment vehicles and allow borrowings by portfolio companies or other investment entities. The applicable entities party to the subscription line facility may be held jointly and severally liable for the full amount of the obligations arising out of such facility. If a fund obtains a subscription line facility, the fund’s working capital needs will, in most instances, be satisfied through borrowings under the subscription line facility. As a result, capital calls are expected to be conducted in larger amounts on a less frequent basis in order to, among other things, repay borrowings and related interest expenses due under such subscription line facilities.
We have incentives to engage in fund-level borrowing notwithstanding the expense and risks that accompany it. For example, we may present certain performance metrics in a fund’s periodic reports and marketing materials. These performance metrics measure investors’ actual cash outlays to, and returns from, our funds and thus depend on the amount and timing of investor capital contributions to the fund and fund distributions to its investors. To the extent that a fund uses borrowed funds in advance or in lieu of calling capital, investors make correspondingly later or smaller capital contributions. Also, borrowing to make distributions of proceeds from an investment enables fund investors to receive distributions earlier. As a result, the use of borrowed funds generally results in the presentation of higher performance metrics than simply calling capital, even after accounting for the attendant interest expense.
Fund-level borrowing can also affect the preferred return fund investors receive and the performance allocations the general partner receives, as preferred return and performance allocations generally depend on the amount and timing of capital contributions and distributions of proceeds. In particular, the preferred return generally begins to accrue after capital contributions are due (regardless of when the fund borrows, makes the relevant investment or pays expenses) and ceases to accrue upon return of these capital contributions. Borrowing funds to shorten the period between calling and returning capital limits the amount of time the preferred return will accrue. Since we do not pay preferred returns on funds borrowed
in advance or in lieu of calling capital, fund level borrowing will therefore reduce the amount of preferred return to which the fund investors would otherwise be entitled had we called capital.
Conflicts of interest with our partners, directors, senior advisors, professionals or business partners could damage our reputation and negatively impact our business.
Our arrangements with our partners, directors, senior advisors, professionals and business partners could give rise to additional conflicts of interest. The following discussion describes certain of these actual, potential or apparent conflicts of interest and how we intend to manage them. If we are unable to successfully manage conflicts of interest relating to arrangements with our partners, directors, senior advisors, professionals or business partners, fund investors may decrease their commitments to future funds, we could be subject to lawsuits or regulatory enforcement actions or we could face other adverse consequences and reputational harm, all of which could cause our and our funds’ performance to suffer and thus adversely affect our results of operations, financial condition and cash flow. The following summary is not intended to be an exhaustive list of all conflicts or their potential consequences. Identifying potential conflicts of interest is complex and fact-intensive, and it is not possible to foresee every conflict of interest that will arise.
Potential conflicts of interest with our personnel, partners, directors or senior advisors. One or more committees of our board of directors, excluding any directors who may have an interest or involvement, will review and address, as appropriate, certain actual or perceived conflicts of interest involving, among others, our executive officers or directors. Other than as may be provided in the non-competition, non-solicitation and confidentiality obligations contained in employment or other agreements with our personnel, which may not be enforceable or may involve costly litigation, our partners, directors and senior advisors are not prohibited from engaging in other businesses or activities, including those that might be in direct competition with us or our funds’ portfolio companies. However, our code of conduct and ethics contains a conflicts of interest policy that provides that directors and officers must strive to identify and avoid conflicts of interest with the Company. Additionally, our related person transactions policy requires the review and approval by one or more committees of our board of directors, excluding any directors who may have an interest or involvement, of certain transactions involving us and our directors, executive officers, 5% or greater stockholders and other related persons as defined under the policy. Nevertheless, potential or perceived conflicts could lead to investor dissatisfaction, harm our reputation or result in litigation or regulatory enforcement actions.
In addition, senior advisors are not employees and thus are generally not subject to restrictions and conditions that relate specifically to our employees and affiliates. Senior advisors often make personal investments in portfolio companies alongside our funds, and our funds are not prohibited from investing in portfolio companies in which senior advisors hold existing material investments. Similarly, our funds may co-invest in portfolio companies alongside funds that senior advisors manage or invest in portfolio companies in which such funds have an existing material investment. One of our senior advisors serves as co-managing partner of one of our funds and chief investment officer of another fund, and we believe that the expertise of all of our senior advisors benefits our funds. However, conflicts of interest or the appearance of such conflicts may arise in connection with investment decisions for funds in which our partners and senior advisors, are personally invested. For example, we typically determine a senior advisor’s compensation even when our funds or their portfolio companies ultimately pay or reimburse us for such compensation. Our close business or personal relationships with certain senior advisors decreases our incentive to negotiate for lower compensation. Moreover, the appropriate level of compensation for a senior advisor can be difficult to determine, especially if the expertise and services he or she provides are unique and/or tailored to the specific engagement. Similarly, these unique and/or tailored specific engagements with our senior advisors can be difficult to manage. See “—Risks Related to Our Industry—Extensive regulation of our businesses affects our activities and creates the potential for significant liabilities and penalties. Increased regulatory focus on the alternative asset industry or legislative or regulatory changes could result in additional burdens and expenses on our business.”
Activities and compensation of our operation and business building professionals. We engage operations and business building professionals to assist our investment team in creating value in our portfolio. We determine in our discretion and subject to applicable law whether to engage a professional as an employee or as a consultant. Professionals engaged as consultants may become employees, and likewise employees may become consultants. Our determination of whether to engage a professional as an employee or a consultant can give rise to conflicts of interest because, in general, except with respect to certain in-house, foreign office and specialized operational services provided to certain funds, we bear the compensation costs for our employees whereas compensation costs for consultants could be paid by us, a fund or a portfolio company, as described above. Where an operations professional performs specialized operational services for a fund or portfolio companies, we are often reimbursed for the costs of those services, regardless of whether the professional providing the service is our employee or a consultant.
Strategic business partners and operators. We have also formed and expect to continue to form relationships with third-party strategic partners and operators so that our funds can take advantage of their expertise, often in particular industries, sectors and/or geographies. These strategic partners and operators often have close business relationships with us and provide services that are similar to, and that may overlap with, services we provide to our funds, including sourcing, conducting due diligence on or developing potential investments, as well as structuring, managing, monitoring and disposing of investments. We determine the compensation of our strategic partners and certain of our operators on a case-by-case basis, which creates a conflict of interest in that we have an incentive to structure compensation under strategic business partnerships so that the fund (and hence its investors) bears the costs (directly or indirectly) instead of us. In addition, as with senior advisors, our close business relationship with a strategic partner decreases our incentive to negotiate for their lower compensation.
Interest of our professionals in our funds. Our professionals generally participate indirectly in investments made by our funds. While we believe this helps align the interests of our professionals with those of the funds’ other investors and provides a strong incentive to enhance fund performance, these arrangements could also give rise to conflicts of interest. For example, our professionals have an incentive to influence the allocation of an attractive investment opportunity to the fund in which they stand to personally earn the greatest return, although the involvement of a substantial number of professionals in our investment review process mitigates this. Some of our professionals also have personal investments in entities that are not affiliated with us, such as funds managed by other sponsors that may be competing for the same investment opportunities or acquire an investment from, or dispose of an investment to, one of our funds, which likewise gives rise to conflicts of interest.
Certain of our senior advisors and directors have family offices in addition to providing services to TPG. If we fail to maintain appropriate compliance procedures or deal appropriately with potential conflicts between the personal financial interests of such senior advisors and directors and our interests, it could subject us to regulatory and investor scrutiny or have a material adverse effect on our results of operations, financial condition and cash flow.
Certain of our senior advisors and directors have separate family offices. The investment activities of such family offices, and the involvement of our senior advisors and directors in these activities, may give rise to potential conflicts of interest between the personal financial interests of such senior advisors and directors and the interests of us or any stockholder. For example, our senior advisors and directors may face competing demands for their time and attention and may have an incentive to devote their resources to the investments of their family offices. Family offices may also compete with us for investment opportunities. Further, one of our senior advisors serves as Co-Managing Partner of one of our funds and Chief Investment Officer of another fund and has a limited ability to selectively co-invest alongside certain of our funds, including in some cases, by investing amounts otherwise allocable to TPG. In certain instances, he may invest in different parts of a portfolio company’s capital structure, and decide when to exit such investments, which may be at a different time than when we or our funds exit. These co-investments, while currently limited to a maximum of 0.2% to 3% of the amount of the TPG fund’s investment, depending on the fund, may reduce or slow the deployment of a fund’s capital, as well as reduce the amount of capital we may co-invest alongside our funds. In addition, we reimburse our senior advisors for certain expenses incurred by them (and, in the case of one of our senior advisors, his office) in connection with their service to TPG, and the determination of what constitutes fund-related expenses and the allocation of such expenses between the funds we manage and us involves judgment. While members of our board of directors and certain of our senior advisors are subject to our policies and procedures, including with respect to sharing confidential information, independent family offices and independent wealth managers are not. Our failure to adequately mitigate these conflicts and risks and make proper judgments could give rise to regulatory and investor scrutiny.
Because members of our senior leadership team own a significant indirect economic interest in us, and hold their economic interest through other entities, conflicts of interest may arise between them and holders of shares of our Class A common stock or us.
As of February 22, 2024, members of our senior leadership team indirectly own approximately 47% of the outstanding Common Units and, together with our other partners and professionals, the Promote Units. They hold substantially all of their economic interest in the TPG Operating Group primarily through TPG Partner Vehicles (rather than through ownership of shares of our Class A common stock), and for each Common Unit owned, they own one share of our Class B common stock. Further, GP LLC has, prior to the Sunset (as defined herein), the right to vote our Class B common stock held by TPG Group Holdings. Therefore, GP LLC, which is owned by entities owned by Messrs. Bonderman, Coulter and Winkelried, holds the significant majority of the combined voting power of our common stock. As a result of their indirect economic interest in us, the members of our senior leadership team may have interests that do not align with, or that conflict with, those of the holders of Class A common stock or with us, and conflicts of interest may
arise among such members of our senior leadership team, on the one hand, and us and/or the holders of our Class A common stock, on the other hand. For example, members of our senior leadership team have different tax positions from Class A common stockholders, which could influence their decisions regarding whether and when to dispose of assets, whether and when to incur new or refinance existing indebtedness, and whether and when we should terminate the Tax Receivable Agreement and accelerate the obligations thereunder. In addition, the structuring of future transactions and investments may take into consideration the members’ tax considerations even where no similar benefit would accrue to us. Pursuant to the Bipartisan Budget Act of 2015, for tax years beginning after December 31, 2017, if the Internal Revenue Service (“IRS”) makes audit adjustments to the TPG Operating Group’s federal income tax returns, it may assess and collect any taxes (including any applicable penalties and interest) resulting from such audit adjustment directly from the TPG Operating Group partnership. If, as a result of any such audit adjustment, the TPG Operating Group partnership is required to make payments of taxes, penalties and interest, the partnership’s cash available for distributions to us may be substantially reduced. These rules are not applicable to the TPG Operating Group partnership for tax years beginning on or prior to December 31, 2017. We have agreed with GP LLC that the TPG Operating Group partnership will not make any elections that would result in the IRS pursuing the partners of such partnerships for such taxes owed for periods ending on or prior to December 31, 2021 without consent of (i) a majority of the holders of Common Units and (ii) TPG Group Holdings.
Our compensation and incentive model may give rise to conflicts of interest between holders of our Class A common stock and our management and certain other affiliates.
In connection with the implementation of our compensation and incentive model following our IPO, and to further align partner interests with the investment performance of our funds, we increased the share of performance allocations available to our partners and professionals. If in 2024 the amount otherwise available under the new discretionary performance allocation program is less than $130 million, our Chief Executive Officer (“CEO”) can determine to increase the performance allocations available under our performance allocation program by an amount equal to the shortfall plus $10 million (which we refer to as a “Performance Allocation Increase”), but by no more than $40 million, by allocating amounts that would have otherwise been distributable to RemainCo. To the extent the foregoing amount is insufficient to satisfy the Performance Allocation Increase, RemainCo will loan the shortfall to one or more TPG Partner Vehicles (with an obligation by such entities to repay the loan out of future performance allocations). Because our CEO, senior leadership team and Pre-IPO Investors hold certain economic interests in RemainCo, our CEO’s decision regarding a Performance Allocation Increase could be influenced by interests that do not align with, or that conflict with, those of our public stockholders. To the extent the Performance Allocation Increases are not made and other performance allocations are insufficient to ensure an adequate amount of cash is received by our partners and professionals, we may not be able to adequately retain or motivate our investment professionals.
Certain of our funds employ special situation and distressed debt investment strategies that involve significant risks.
Certain of our investment funds, in particular certain of our credit funds, invest in companies with weak financial conditions, poor operating results, substantial financial needs, negative net worth, special competitive problems or securities that are illiquid, distressed or have other high-risk features, including business entities involved in bankruptcy or other reorganization and liquidation proceedings. In such situations, it may be difficult to obtain full information as to the exact financial and operating conditions of these companies. Additionally, the fair values of such investments are subject to abrupt and erratic market movements and significant price volatility if they are publicly-traded securities, and are subject to significant uncertainty in general if they are not publicly-traded securities. Furthermore, some of our funds’ distressed investments may not be widely traded or may have no recognized market. A fund’s exposure to such investments may be substantial in relation to the market for those investments, and the assets are likely to be illiquid and difficult to sell or transfer. As a result, it may take a number of years for the market value of such investments to ultimately reflect their intrinsic value as perceived by us.
A central feature of our distressed investment strategy is our ability to effectively anticipate the occurrence of certain corporate events, such as debt and/or equity offerings, restructurings, reorganizations, mergers, takeover offers and other transactions, that we believe will improve the condition of the business. Similarly, we perform significant analysis of the company’s capital structure, operations, industry and ability to generate income, as well as market valuation of the company and its debt, and develop a strategy with respect to a particular distressed investment based on such analysis. In furtherance of that strategy our funds seek to identify the best position in the capital structure in which to invest. If the relevant corporate event that we anticipate is delayed, changed or never completed, or if our analysis or investment strategy is inaccurate, the market price and value of the applicable fund’s investment could decline sharply.
In addition, these investments could subject a fund to certain potential additional liabilities that may exceed the value of its original investment. Under certain circumstances, payments or distributions on certain investments may be reclaimed if any such payment or distribution is later determined to have been a fraudulent conveyance, a preferential payment or similar transaction under applicable bankruptcy and insolvency laws. In addition, under certain circumstances, a lender that has inappropriately exercised control of the management and policies of a debtor may have its claims subordinated or disallowed, or may be found liable for damages suffered by parties as a result of such actions. In the case where the investment in securities of troubled companies is made in connection with an attempt to influence restructuring proposal or plan of reorganization in bankruptcy, our funds may become involved in substantial litigation.
Our real estate funds’ portfolio investments are subject to the risks inherent in the ownership and operation of real estate and real estate-related businesses and assets.
Our real estate funds’ portfolio investments are subject to the risks inherent in the ownership and operation of real estate and real estate-related businesses and assets, including the deterioration of real estate fundamentals. These risks include those highlighted elsewhere as well as:
•those associated with the burdens of ownership of real property;
•changes in supply of and demand for competing properties in an area (e.g., as a result of overbuilding);
•the financial resources of tenants;
•changes in building, environmental, zoning and other laws;
•changes in demand for commercial office properties;
•changes in geographic markets, macroeconomic conditions and evolving political and legislative oversight of real estate markets;
•casualty or condemnation losses;
•various uninsured or uninsurable risks;
•changes in the way real estate is occupied as a result of pandemics or other unforeseen events;
•the reduced availability of mortgage funds, or other forms of financing, including construction financing which may render the sale or refinancing of properties difficult or impracticable;
•increase in insurance premiums and changes to the insurance market;
•environmental liabilities;
•acts of god, natural disasters, pandemics, terrorist attacks, war and other factors that are beyond our control; and
•dependence on local operating partners and/or management teams that manage our real estate investments.
Our real estate funds’ portfolio investments will be subject to various risks that cause fluctuations in occupancy, rental rates, operating income and expenses or that render the sale or financing of the funds’ portfolio investment properties difficult or unattractive. For example, following the termination or expiration of a tenant’s lease, there could be a period of time before a funds’ portfolio investment will begin receiving rental payments under a replacement lease. During that period, the portfolio investments (and indirectly, the funds) will continue to bear fixed expenses such as interest, real estate taxes, maintenance and other operating expenses. In addition, declining economic conditions could impair the portfolio investments’ ability to attract replacement tenants and achieve rental rates equal to or greater than the rents paid under previous leases. Increased competition for tenants would require the portfolio investments to make capital improvements to properties that we would not otherwise have planned. Any unbudgeted capital improvements that a fund undertakes may divert cash that would otherwise be available for distribution to investors. To the extent that the portfolio investments are
unable to renew leases or re-let spaces as leases expire, decreased cash flow from tenants will result, which would adversely impact the relevant fund’s returns.
In addition, if our real estate funds’ portfolio investments acquire direct or indirect interests in undeveloped land or underdeveloped real property, which may often be non-income producing, they will be subject to the risks normally associated with such assets and development activities, including risks relating to the availability and timely receipt of zoning and other regulatory or environmental approvals, the cost and timely completion of construction (including risks beyond our or our funds’ control, such as weather or labor conditions or material shortages) and the availability of both construction and permanent financing on favorable terms. Our real estate funds may also make investments in residential real estate projects and/or otherwise participate in financing opportunities relating to residential real estate assets or portfolios thereof from time to time, which may be more highly susceptible to adverse changes in prevailing economic and/or market conditions and present additional risks relative to the ownership and operation of commercial real estate assets. The strategy of our real estate funds may be based, in part, on the availability for purchase of assets at favorable prices followed by the continuation or improvement of market conditions or on the availability of refinancing, and there can be no assurance that the real estate businesses or assets can be acquired or disposed of at favorable prices or that refinancing will be available. Further, the success of certain investments will depend on the ability to modify and effect improvements in the operations of the applicable properties, and there can be no assurance that we or our funds will be successful in identifying or implementing such modifications and improvements.
Additionally, lenders in commercial real estate financing customarily require a “bad boy” guarantee, which typically provides that the lender can recover losses from the guarantors for certain bad acts, such as fraud or intentional misrepresentation, intentional waste, willful misconduct, criminal acts, misappropriation of funds, voluntary incurrence of prohibited debt and environmental losses sustained by lender. For our acquisitions, “bad boy” guarantees would generally be extended by our funds. “Bad boy” guarantees also typically provide that the loan will be a full personal recourse obligation of the guarantor for certain actions, such as prohibited transfers of the collateral or changes of control and voluntary bankruptcy of the borrower. We expect that commercial real estate financing arrangements generally will require “bad boy” guarantees and, in the event that such a guarantee is called, a fund’s or our assets could be negatively impacted. Moreover, “bad boy” guarantees could apply to actions of the joint venture partners associated with the investments, and, in certain cases, the acts of such joint venture partner could result in liability to our funds or us under such guarantees.
The acquisition, ownership and disposition of real properties carry certain specific litigation risks. Litigation may be commenced with respect to a property acquired in relation to activities that took place prior to the acquisition of such property. In addition, at the time of disposition, other potential buyers may bring claims related to the asset or for due diligence expenses or other damages. After the sale of a real estate asset, buyers may later sue our funds or us for losses associated with latent defects or other problems not uncovered in due diligence.
We or our funds may also be subject to certain risks associated with investments in particular real estate-related assets. REITs may be affected by changes in the value of their underlying properties and defaults by borrowers or tenants, and changes in tax laws or by a failure to qualify for tax-free pass through income could impair a REIT’s ability to generate cash flows to make distributions. Qualification as a REIT also depends on a REITs ability to meet various requirements imposed by the Code, which relate to organizational structure, diversity of stock ownership, and certain restrictions with regard to the nature of their assets and the sources of their income. If a REIT fails to qualify as a REIT in any taxable year, it will be subject to U.S. federal income tax at regular corporate rates, and applicable state and local taxes, which would reduce the amount of cash available for distribution to its stockholders.
Investments in real estate debt investments may be unsecured and/or subordinated to a substantial amount of indebtedness and may not be protected by financial covenants. Non-performing real estate loans may require a substantial amount of workout negotiations and/or modification, which may entail, among other things, a substantial reduction in the interest rate and a substantial write-down of the principal of such loan. Investments in commercial mortgage loans are subject to risks of delinquency, foreclosure and loss of principal. In the event of any default under a mortgage loan held directly by us or one of our funds, we or our fund will bear a risk of loss of principal to the extent of any deficiency between the value of the collateral and the principal and accrued interest of the loan. Investments in distressed assets or businesses may have little or no near-term cash flow, involve a high degree of risk and, if subject to bankruptcy or insolvency, could be subordinated or disallowed.
Our public equity platforms subject us to numerous additional risks.
Our public equity platform, TPEP, invests in the public equity markets and is subject to numerous additional risks, including the following:
•Certain public equity funds may engage in short selling, which is subject to theoretically unlimited loss, in that the price of the underlying security could theoretically increase without limit, thus increasing the cost of buying those securities to cover the short position. There can be no assurance that the security necessary to cover a short position will be available for purchase. Purchasing securities to close out the short position can itself cause the prices of the securities to rise further, thereby exacerbating the loss. Furthermore, if a request for return of borrowed securities occurs at a time when other short sellers of the security are receiving similar requests, a “short squeeze” can occur, in which case the public equity fund would be compelled to replace borrowed securities previously sold short with purchases on the open market at the most disadvantageous time, possibly at prices significantly in excess of the proceeds received in originally selling the securities short.
•The efficacy of investment and trading strategies depends largely on the ability to establish and maintain an overall market position in a combination of financial instruments. A public equity fund’s trading orders may not be executed in a timely and efficient manner due to various circumstances, including market illiquidity, systems failures or human error. In such event, the funds might only be able to build some but not all of the position, or if the overall position were to need adjustment, the funds might not be able to make such adjustment. As a result, the funds would not be able to achieve the desired market position and might incur a loss in liquidating their position.
•As “inside-the-wall” funds, our public equity funds are subject to a broad restricted securities list, which may limit their investment opportunities as well as their ability to exit an investment, including covering a short position. An inability to cover a short position theoretically subjects a fund to unlimited loss.
To the extent the financial condition of TPEP is adversely affected by these risks, our revenues and AUM may also decline.
Our broker-dealer’s capital markets activities expose us to risks that, if they materialize, could have a material adverse effect on our results of operations, financial condition and cash flow.
TPG Capital BD (and related entities) provides various capital markets services, including:
•structuring, executing and at times underwriting initial public offerings, follow-on primary offerings and secondary offerings (including “block trades”) and private placements of equity securities;
•structuring, executing and at times underwriting high yield and other bond offerings;
•structuring, arranging and placing interests in loans, credit facilities, asset-based facilities, securitizations and similar debt instruments;
•structuring and arranging amendments to existing securities, credit facilities and other instruments;
•structuring and implementing interest rate, foreign exchange and other hedging or derivative strategies;
•structuring and executing other similar transactions to finance fund acquisitions of a portfolio company or to enable a fund to monetize its interest in a portfolio company;
•providing capital markets advice with respect to any of the foregoing transactions; and
•providing any other capital markets services that a third party may render to or with respect to an existing, prospective or former portfolio company.
As a result of these capital markets services, we could incur losses that could have a material adverse effect on our results of operations, financial condition and cash flow, as well as our reputation. TPG Capital BD’s capital market activities subject us to potential liability for, among other things, material misstatements or omissions in prospectuses and other offering documents in the United States and elsewhere, and for failure to provide certain disclosure documents or marketing securities to certain types of investors in the EU and the U.K. Further, the relationship between us, TPG Capital BD (or a related entity providing capital markets services), on the one hand, and our funds and/or our funds’ portfolio companies, on the other hand, gives rise to conflicts of interest which could negatively impact our business. See “—Our activities and the business activities of certain of our personnel may give rise to conflicts of interest with our funds, and our failure to deal appropriately with conflicts of interest could damage our reputation and negatively impact our business.”
Certain of our management agreements with investment vehicles that are publicly-registered companies with the SEC are subject to limitation or termination, and any such termination could have a material adverse effect on our business, results of operations and financial condition.
The agreements under which we provide management and other services to companies that raise capital through the public markets are renewable upon mutual consent of the parties for an unlimited number of successive one-year periods. In certain instances, these agreements may generally be terminated by such managed public company upon 60 days’ written notice for any reason, and expire on an annual basis, unless otherwise renewed. With respect to our management agreements with publicly traded vehicles, following an initial term, such agreements will automatically be renewed for successive one-year periods unless we or, in certain limited circumstances, the publicly traded vehicle, elect not to renew by providing 180 days prior written notice. There can be no assurance that these agreements will not expire or be terminated or not be renewed. Any such termination, expiration or non-renewal could have a material adverse effect on our business, results of operations, financial condition and prospects.
Funds associated with our secondaries investment products are subject to additional risks.
Funds associated with our secondaries investment products, NewQuest and TPG GP Solutions, are subject to additional risks. Such funds have limited control of the day-to-day operation of the funds in which they invest, including investment and disposition decisions, or to protect their indirect position in portfolio investments, nor do they generally have the right to remove the managers thereof. The success of these funds is substantially dependent upon the capabilities and performance of the general partners who control those portfolio investments and the company management of the underlying portfolio companies, which will include representatives of other financial investors with whom such funds are not affiliated and whose interests may conflict with the interests of the funds. Although investors (such as our funds) in general partner-led and other structured secondary transactions typically retain enhanced governance and other rights (and may participate in the initial structuring and customizing of portfolios of a portfolio investment), once such a transaction is complete, the general partners will generally have broad discretion in structuring, negotiating, purchasing, financing, monitoring and eventually divesting the underlying assets and portfolio companies. Further, should a general partner for any reason cease to participate in the management of the underlying assets and/or portfolio companies, the performance of the relevant portfolio investment (and, consequently, our funds) could be adversely affected.
Our secondaries funds are also authorized to invest in preferred, synthetic and/or other investments in management companies, general partners and similar entities that manage or advise other investment funds (such entities, “Managing Entities”). Among the factors that we will typically consider in selecting such Managing Entities for investment is a record of strong financial performance. However, the past performance of any such Managing Entity is not necessarily indicative of its future performance. There can be no assurance that such Managing Entity will achieve similar revenues or profits in the future. While we periodically meet with the management of Managing Entities in which our funds invest, and our funds may negotiate contractual terms requiring such Managing Entities to periodically provide the funds with certain information, our funds generally do not have the opportunity to evaluate the specific strategies employed by the Managing Entities and their funds, and our funds do not have an active role in the day-to-day management of the Managing Entities.
A downturn in the global credit markets could adversely affect our CLO investments.
Our CLO funds are subject to credit, liquidity, interest rate and other risks. From time to time, liquidity in the credit markets contracts, sometimes significantly, resulting in an increase in credit spreads and a decline in ratings, performance and market values for leveraged loans. CLOs invest on a leveraged basis in loans or securities that are themselves highly leveraged investments in the underlying collateral, which increases both the opportunity for higher returns as well as the magnitude of losses compared to unlevered investments. As a result of such funds’ leveraged position, our CLO funds are at greater risk of suffering losses. CLOs have also failed in the past and may in the future fail one or more of their “over-
collateralization” tests. Market or other conditions that cause our CLOs to fail “over-collateralization” tests would decrease our cash flows and reduce the value of our investments.
Misconduct, fraud or other deceptive practices of our employees, advisors or third-party service providers or our funds’ portfolio companies could subject us to significant legal liability, regulatory scrutiny and reputational harm and have a material adverse effect on our results of operations, financial condition and cash flow.
Our reputation is critical to maintaining and developing relationships with existing and prospective investors, potential purchasers or sellers of fund investments, potential fund investors and other third parties with whom we do business, and there is a risk that our employees, advisers or third-party service providers could engage in misconduct or fraud that creates legal exposure for us or reputational harm and thus negatively impacts our business. Employee misconduct or fraud could include, among other things, binding our funds to transactions that exceed authorized limits or present unacceptable risks, concealing unsuccessful investments (which could result in unknown and unmanaged risks or losses) or otherwise charging, or seeking to charge, inappropriate expenses or misappropriating or misdirecting funds belonging to the Company or our funds. If an employee were to engage in illegal or suspicious activities, we could be subject to penalties or sanctions and suffer serious harm to our reputation, financial position, investor relationships and ability to attract future investors. For example, we could lose our ability to raise new funds if any of our “covered persons” is the subject of a criminal, regulatory or court order or other “disqualifying event.” In addition, if any of our employees, consultants or service providers, or those of our funds’ portfolio companies, become subject to allegations of sexual harassment, racial or gender discrimination or other similar misconduct, such allegations could, regardless of the ultimate outcome, result in negative publicity that could significantly harm our, and such portfolio company’s, brand and reputation. Similarly, allegations of employee misconduct could affect our reputation and ability to raise funds even if the allegations pertain to activities not related to our business and/or are ultimately unsubstantiated.
Further, our business often requires that we deal with confidential matters of great significance to us, our funds and companies in which our funds may invest, as well as trade secrets. If any of our employees, consultants or service providers were to improperly use or disclose confidential information, we could suffer serious harm to our reputation, financial position and current and future business relationships as well as face potentially significant litigation or investigation.
It is not always possible to deter misconduct or fraud by employees, consultants or service providers, and the precautions we take to detect and prevent this activity may not be effective in all cases. Misconduct or fraud by any of our employees, consultants or service providers, or even unsubstantiated allegations of misconduct or fraud, could have a material adverse effect on our results of operations, financial condition and cash flow, as well as our reputation.
Fraud, payment or solicitation of bribes and other deceptive practices or other misconduct at our funds’ portfolio companies could similarly have a material adverse effect on our results of operations, financial condition and cash flow, as well as our reputation. For example, failures by personnel of our funds’ portfolio companies, or individuals acting on behalf of such portfolio companies, to comply with anti-bribery, sanctions or other legal and regulatory requirements could negatively impact the valuation of a fund’s investments or harm our reputation. In addition, there are a number of grounds upon which such misconduct at a portfolio company could subject us to criminal and/or civil liability, including on the basis of actual knowledge, willful blindness or control person liability.
Pending and future litigation could result in significant liabilities and reputational harm, which could have a material adverse effect on our results of operations, financial condition and cash flow.
From time to time, we are involved in litigation and claims incidental to the conduct of our business. Our business is also subject to extensive regulation, which may result in regulatory proceedings against us. In recent years, the volume of claims and the amount of potential damages claimed in such proceedings against the financial services industry have generally been increasing. The activities of our business, including the investment decisions we make and the activities of our employees in connection with our funds, portfolio companies or other investment vehicles may subject us and them to the risk of litigation by third parties, including fund investors dissatisfied with the performance or management of our funds, holders of our or our funds’ portfolio companies’ debt or equity and a variety of other potential litigants. For example, we, our funds and certain of our employees are each exposed to the risks of litigation relating to investment activities of our funds and actions taken by the officers and directors (some of whom may be TPG employees) of portfolio companies, such as lawsuits by other stockholders of our public portfolio companies or holders of debt instruments of companies in which we or our funds have significant investments, including securities class action lawsuits by stockholders, as well as class action lawsuits that challenge our acquisition transactions and/or attempt to enjoin them. As an additional example, we are sometimes listed as a co-defendant in actions against portfolio companies on the theory that
we control such portfolio companies or based upon allegations that we improperly exercised control or influence over portfolio investments. We may suffer losses as a result of a variety of claims, including related to securities, antitrust, contracts, environmental, pension, fraud and various other potential claims, whether or not such claims are valid. We are also exposed to risks of litigation, investigation or negative publicity in the event of any transactions that are alleged not to have been properly considered and approved under applicable law or where transactions presented conflicts of interest that are alleged not to have been properly addressed. See “—Our activities and the business activities of certain of our personnel may give rise to conflicts of interest with our funds, and our failure to deal appropriately with conflicts of interest could damage our reputation and negatively impact our business.” The activities of our broker-dealer may also subject us to the risk of liabilities to our clients and third parties, under securities or other laws in connection with transactions in which we participate. See Note 17, “Commitments and Contingencies,” to the Consolidated Financial Statements for a discussion of a particular matter which we believe to be without merit but in which large nominal damages have been claimed against us as a party. Further, the laws and regulations governing the limited liability of issuers and portfolio companies vary from jurisdiction to jurisdiction, and in certain contexts the laws of certain jurisdictions may provide not only for carve-outs from limited liability protection for the issuer or portfolio company that has incurred the liabilities, but also for recourse to assets of other entities under common control with, or that are part of the same economic group as, such issuer. For example, if one of our funds’ portfolio companies is subject to bankruptcy or insolvency proceedings in certain jurisdictions and is found to have liabilities under the local consumer protection, labor, environmental, tax or bankruptcy laws, the laws of that jurisdiction may permit authorities or creditors to file a lien on, or to otherwise have recourse to, assets held by other portfolio companies or the sponsor itself in that jurisdiction. The foregoing risks could have a material adverse effect on our results of operations, financial condition and liquidity.
In addition, with a workforce composed of many highly paid professionals, we also face the risk of litigation relating to claims for compensation or other damages, which may be significant in amount. Such claims are more likely to occur in situations where individual employees may experience significant volatility in their year-to-year compensation due to fund performance or other issues and in situations where previously highly compensated employees were terminated for performance or efficiency reasons. The cost of settling such claims could negatively impact our results of operations, financial condition and liquidity.
Investors in our funds do not have legal remedies against us solely based on their dissatisfaction with the investment performance of such funds. However, investors may have remedies against us, the general partners of our funds, our funds, our employees, or our affiliates to the extent any losses result from fraud, negligence, willful misconduct or other similar malfeasance. While the general partners of our funds, our funds, our employees and our affiliates are typically insured and are generally indemnified to the fullest extent permitted by law with respect to their conduct in connection with the management of the business and affairs of our funds, such indemnity does not extend to actions determined to have involved fraud, gross negligence, willful misconduct, or other similar misconduct.
Defending against litigation could be costly. Such litigation costs may not be recoverable from insurance or other indemnification. Additionally, we may not be able to obtain or maintain sufficient insurance on commercially reasonable terms or with adequate coverage levels against potential liabilities we may face in connection with potential claims. Insurance and other safeguards might only partially reimburse us for our losses, if at all, and if a claim is successful and exceeds or is not covered by our insurance policies, we may be required to pay a substantial amount in respect of such claim. If we are required to incur all or a portion of the costs arising out of litigation or regulatory inquiry or action as a result of inadequate insurance proceeds or failure to obtain indemnification from our funds, our results of operations, financial condition and liquidity could be materially adversely affected. Certain losses of a catastrophic nature, such as wars, earthquakes, typhoons, terrorist attacks, pandemics, health crises or other similar events, may be uninsurable or may only be insurable at rates that are so high that maintaining coverage would cause an adverse impact on our business, our funds and their portfolio companies. In general, losses related to terrorism are becoming harder and more expensive to insure against. Some insurers are excluding terrorism coverage from their all-risk policies or offering significantly limited coverage against terrorist acts for additional premiums, which can greatly increase the total cost of casualty insurance for a property. Further, because of limited precedent for claims being made related to pandemics, it is not yet possible to determine if pandemic-related losses and expenses will be covered by our insurance policies. As a result, we, our funds and their portfolio companies may not be insured against terrorism, pandemics or certain other catastrophic losses.
If any litigation or regulatory actions were brought against us and resulted in a finding of substantial legal liability, that result could materially adversely affect our business, results of operations or financial condition or cause significant reputational harm to us, which could materially impact our business. Furthermore, the current rise of populist political
movements has generated and may continue to generate a growing negative public sentiment toward globalization, free trade, capitalism and financial institutions, which could lead to heightened scrutiny and criticisms of our business and our investments. In addition, recent public discourse ahead of the U.S. presidential election and social inequality issues raised and debated during those campaigns have demonstrated the elevated level of focus put on us, our industry and companies in which our funds are invested. See “—Risks Related to Our Industry—Extensive regulation of our businesses affects our activities and creates the potential for significant liabilities and penalties. Increased regulatory focus on the alternative asset industry or legislative or regulatory changes could result in additional burdens and expenses on our business.” The risk of reputational harm is elevated by the prevalence of internet and social media usage and the increased public focus on behaviors and externalities of business activities, including those affecting stakeholder interests and ESG considerations. We depend to a large extent on our business relationships and our reputation. As a result, allegations of improper conduct by private litigants (including investors in or alongside our funds), regulators or employees, whether the ultimate outcome is favorable or unfavorable to us, as well as negative publicity and press speculation about us, our investment activities, our lines of business, our workplace environment or the private equity industry in general, whether or not valid, may harm our reputation, which may be more damaging to our business than to other types of businesses.
Contingent liabilities could harm the performance of our funds.
Our funds may acquire an investment that is subject to contingent liabilities. Such contingent liabilities could be unknown to us at the time of acquisition or, if they are known to us, we may not accurately assess or protect against the risks that they present. Acquired contingent liabilities could thus result in unforeseen losses for our funds. Additionally, in connection with the disposition of an investment in a portfolio company, a fund may be required to make representations about the business and financial affairs of such portfolio company typical of those made in connection with the sale of a business. A fund may also be required to indemnify the purchasers of such investment to the extent that any such representations are inaccurate. These arrangements may result in the incurrence of contingent liabilities by a fund, even after the disposition of an investment. Although our funds typically obtain representations and warranties insurance, the inaccuracy of representations and warranties made by a fund could harm such fund’s performance.
The clawback provisions in our governing agreements may give rise to contingent obligations that may require us to return amounts to our funds and fund investors.
In certain circumstances, we are required to return previously distributed performance allocations. The partnership documents governing our funds generally include a clawback provision that, if triggered, requires us to return distributions of performance allocations to the fund for distribution to fund investors.
Pursuant to a clawback provision, upon the liquidation of a fund, the general partner must return previously distributed performance allocations to the extent that the aggregate lifetime performance of the fund resulted in these previous distributions having exceeded the amount that the general partner was ultimately entitled to under the terms of the fund’s partnership documents.
Historically, we distribute performance allocations received by us to their ultimate recipients (our professionals and investors) within the year that we receive them. Therefore, if a subsequent clawback occurs, we will no longer be holding the performance allocations initially paid to us. In addition, in certain of our more recent funds and we expect in future funds, we or one of our subsidiaries have and will guarantee 100% of any clawback obligations.
Many of our funds include a segregated reserve account funded by a percentage of performance allocations otherwise distributable to us (typically 10% or less). Although certain performance allocations are subject to return to us by their ultimate recipients upon the occurrence of a clawback event, others are not and we may be unable to obtain return of others. For example, we do not anticipate being entitled to recover performance allocations distributed through our performance allocation pool program from their ultimate recipients.
There can be no assurances that the amounts in related segregated reserve accounts will be sufficient to satisfy our clawback obligations, or that we will be willing, able or entitled to recover amounts sufficient from the ultimate recipients of the performance allocations to satisfy our clawback obligations in full. We will bear the loss from our clawback obligations (reduced only by the amounts in the relevant segregated reserve account and amounts recovered from the ultimate recipients of the relevant performance allocations, if any).
In addition, certain of our funds include interim clawback provisions that may give rise to clawback payment obligations prior to the liquidation of the fund. An interim clawback provision typically requires the general partner of a
fund to determine, as of a particular date, such as the end of the sixth full fiscal year following the fund’s closing date, the amount, if any, of its interim clawback obligations with respect to each limited partner. To the extent an interim clawback obligation exists with respect to any limited partner, the general partner would have a period of time to return previously distributed performance allocation. During this period, amounts that would otherwise be distributed as performance allocations to the general partner in respect of such limited partner will instead be distributed to such limited partner to the extent necessary to satisfy such interim clawback obligation, and any increases in the value of the fund’s portfolio will reduce the amount of such interim clawback obligation. To the extent we do not timely satisfy an interim clawback obligation, management fees paid to the fund manager will typically be suspended.
As of December 31, 2023, $58.3 million of performance allocations were subject to this clawback obligation, assuming that all applicable funds and investments were liquidated at their current unrealized fair values as of December 31, 2023. Had the investments in these funds been liquidated at zero value, the clawback obligation would have been approximately $1,910.2 million. Since inception, our historical funds have returned $22.0 million in distributions of performance allocations pursuant to our clawback obligations, which were funded primarily through collection of partner receivables related to clawback obligations.
Risks Related to Our Organizational Structure
The historical and pro forma financial information and related notes in this report may not permit you to assess our future performance.
This report includes certain historical and pro forma financial information, including the historical financial information for the years ended December 31, 2023 and 2021, as well as pro forma financial information reflecting our recent acquisition of Angelo Gordon, that may not permit you to assess our future performance.
We completed our acquisition of Angelo Gordon on November 1, 2023 and, as a result, the results of TPG Angelo Gordon included in our consolidated statements of operations are only from November 1, 2023 to December 31, 2023. Accordingly, our consolidated statements of operations for the year ended December 31, 2023 do not reflect what the combined company’s actual results of operations would have been had the Acquisition been completed on January 1, 2023. This report also includes unaudited pro forma condensed combined financial information giving effect to the Acquisition as if it had occurred on January 1, 2023. This pro forma financial information is presented for informational purposes only and is not intended to reflect, and is not necessarily indicative of, what the combined company’s actual financial condition or results of operations would have been had the Acquisition been completed on January 1, 2023. It does not reflect potential revenue synergies or cost savings expected to be realized from the Acquisition. No assurance can be given that cost savings or synergies will be realized at all. The assumptions used in preparing the pro forma financial information are based on currently available information that we believe are reasonable in order to reflect, on a pro forma basis, the effect of the Acquisition, the financing and the change in compensation arrangements for TPG Angelo Gordon subsequent to the closing of the Acquisition. These assumptions may not prove to be accurate and other factors may affect our combined company’s financial condition or results of operations moving forward. Accordingly, the Company’s financial condition and results of operations in the future may not be evident from or consistent with such pro forma financial information.
The historical financial information in this report for the year ended December 31, 2021 does not reflect the post-IPO changes that we implemented to our compensation and partner incentive models, the added costs we have incurred and expect to continue to incur as a public company or the resulting changes that occurred in our capital structure and operations. Historically, 50% of the fee-related earnings, or “FRE,” we generated was paid to our service partners as an annual discretionary cash bonus. In connection with the implementation of our compensation and incentive model, we reduced the amount we pay as bonuses from management fees. We increased the share of performance allocations available to our partners and professionals. However, we could elect in the future to compensate our employees out of our management fees and otherwise modify our approach in ways that are inconsistent with the adjustments in the pro forma financial information.
We no longer receive any performance allocations relating to the Excluded Funds (as defined herein). In addition, RemainCo is entitled to a portion of our performance allocations from Included Funds (as defined herein). As a result, the revenues we generate from performance allocations declined relative to the amounts reflected in our historical financial information for the year ended December 31, 2021. Nevertheless, we will have primary contractual liability for certain claims related to our funds, including clawback obligations, even after performance allocations have been distributed. We have entered into a reimbursement agreement with RemainCo, pursuant to which RemainCo has agreed to certain
reimbursement and indemnification obligations. However, there can be no assurance that RemainCo will be able to satisfy such obligations.
For more information on our historical financial information and pro forma financial information, see “Item 7. Management’s Discussion and Analysis of Financial Condition and Results of Operations” and the historical consolidated financial statements.
If we fail to maintain an effective system of internal control over financial reporting or comply with the rules that apply to public companies, including Section 404 of the Sarbanes-Oxley Act, we could be subject to sanctions or other penalties that would harm our business.
Pursuant to Section 404 of the Sarbanes-Oxley Act of 2002 (the “Sarbanes-Oxley Act”), we are required to conduct annual assessments on, among other things, the effectiveness of our internal control over financial reporting. These assessments require disclosure of any material weaknesses identified in our internal control over financial reporting. A material weakness is a deficiency, or combination of deficiencies, in internal control over financial reporting, such that there is a reasonable possibility that a material misstatement of a company’s annual and interim financial statements will not be detected or prevented on a timely basis. Despite our efforts, there is a risk that we will not be able to always conclude, within the prescribed timeframe or at all, that our internal control over financial reporting is effective as required by Section 404 of the Sarbanes-Oxley Act. If we identify one or more material weaknesses, it could result in an adverse reaction in the financial markets due to a loss of confidence in the reliability of our financial statements.
During the course of our review and testing, we may also in the future, identify deficiencies and be unable to remediate them before we must provide the required reports. Furthermore, if we have a material weakness in our internal control over financial reporting, we may not detect errors on a timely basis and our financial statements may be materially misstated. We or our independent registered public accounting firm may not be able to conclude on an ongoing basis that we have effective internal control over financial reporting, which could harm our operating results, cause investors to lose confidence in our reported financial information and cause the trading price of our stock to decline. In addition, as a public company we are required to file accurate and timely quarterly and annual reports with the SEC under the Exchange Act. Any failure to report our financial results on an accurate and timely basis could result in sanctions, lawsuits, delisting of our common stock from Nasdaq or other adverse consequences that would materially harm our business and reputation.
As a result of disclosure of information as a public company, our business and financial condition are visible, which may result in threatened or actual litigation, including by stockholders and competitors and other third parties. If the claims are successful, our business, financial condition and results of operations could be materially and adversely affected. Even if the claims do not result in litigation or are resolved in our favor, these claims, and the time and resources necessary to resolve them, could divert the resources of our management and adversely affect our business operations and financial results.
We are a “controlled company” within the meaning of Nasdaq listing standards and, as a result, until the Sunset, will qualify for, and intend to rely on, exemptions from certain corporate governance requirements. Our stockholders do not have the same protections afforded to stockholders of companies that are subject to such requirements and you will have limited voting power compared to holders of our Class B common stock.
Holders of our Class B common stock control a majority of the voting power of our outstanding common stock by virtue of their ownership of Class B common stock. Prior to the Sunset and for so long as TPG Group Holdings holds shares of Class B common stock representing at least 8.9% of all of the outstanding shares of our common stock, the Class B stockholders hold a majority of our outstanding voting power by virtue of their ownership of Class B common stock, and GP LLC, as the owner of the general partner of TPG Group Holdings, controls the outcome of matters submitted to a stockholder vote prior to the Sunset, including the appointment of all company directors. As a result of the voting power held by TPG Group Holdings, we qualify as a “controlled company” within the meaning of Nasdaq’s corporate governance standards. Under these rules, a listed company of which more than 50% of the voting power is held by an individual, group or another company is a “controlled company” and may elect not to comply with certain corporate governance requirements, including the requirement that (i) a majority of our board of directors consist of independent directors, (ii) director nominees be selected or recommended to the board by independent directors or an independent nominating committee and (iii) we have a compensation committee that is composed entirely of independent directors.
We rely on some or all of these exemptions and expect to continue to do so. As a result, we will not have a majority of independent directors, our directors will not be nominated or selected by independent directors and most compensation decisions will not be made by an independent compensation committee. Accordingly, our stockholders do not have the
same protections afforded to stockholders of companies that are subject to all of Nasdaq’s corporate governance requirements. After the Sunset becomes effective, the Class B common stock will have one vote per share instead of ten votes per share, meaning that GP LLC, as the general partner of TPG Group Holdings, will no longer control the appointment of directors or be able to direct the vote on all matters that are submitted to our stockholders for a vote. The control over the voting of Class B common stock will instead be passed through to the individual partners of the TPG Partner Vehicles, including TPG Partner Holdings.
We are a holding company and our only material asset is our interest in the TPG Operating Group, and we are accordingly dependent upon distributions from the TPG Operating Group to pay taxes, make payments under the Tax Receivable Agreement and pay dividends.
We are a holding company and have no material assets other than our indirect ownership of Common Units representing approximately 23% of the Common Units as of February 22, 2024 and 100% of the interests in certain intermediate holding companies. As such, we have no independent means of generating revenue or cash flow, and our ability to pay our taxes and operating expenses, including to satisfy our obligations under the Tax Receivable Agreement, or declare and pay dividends in the future, depend upon the results of operations and cash flows of the TPG Operating Group and its consolidated subsidiaries and distributions we receive from the TPG Operating Group. Deterioration in the financial condition, earnings or cash flow of the TPG Operating Group and its subsidiaries for any reason could limit or impair its ability to pay such distributions. Additionally, to the extent that we need funds, and the TPG Operating Group is restricted from making such distributions under applicable law or regulation or under the terms of our financing arrangements, or is otherwise unable to provide such funds, such restriction could materially adversely affect our liquidity and financial condition.
We anticipate that the TPG Operating Group partnership will be treated as a partnership for U.S. federal income tax purposes and, as such, generally will not be subject to any entity-level U.S. federal income tax (except potentially in the case of an IRS audit). Instead, taxable income will be allocated to holders of Common Units, including us. Accordingly, we will be required to pay income taxes on our allocable share of any net taxable income of the TPG Operating Group partnership. However, under certain rules, the TPG Operating Group partnership (or other subsidiary partnership) may be liable in the event of an adjustment by the IRS to the tax return of the TPG Operating Group partnership (or subsidiary partnership), absent an election to the contrary (including an election to “push out” the partners in the year being audited). The TPG Operating Group may be subject to material liabilities under these rules and related guidance if, for example, its calculations of taxable income are incorrect (including for years prior to the admission of us to the TPG Operating Group partnership). Further any “push out” election will require consent of (i) a majority of the holders of Common Units and (ii) TPG Group Holdings for the tax periods ending on or prior to December 31, 2021.
Under the terms of the limited partnership agreement of the TPG Operating Group (the “Limited Partnership Agreement”), the TPG Operating Group partnership is generally obligated to make tax distributions to holders of Common Units (including us) at certain assumed tax rates for taxable periods (or portions thereof). These tax distributions may in certain periods exceed our tax liabilities and obligations to make payments under the Tax Receivable Agreement. Our board of directors and, until the Sunset, our Executive Committee, in their sole discretion, will make any determination from time to time with respect to the use of any such excess cash so accumulated, which may include, among other uses, paying dividends, which may include special dividends, on its Class A common stock and nonvoting Class A common stock. We have no obligation to distribute such cash (or other available cash other than any declared dividend) to our stockholders. To the extent that we do not distribute such excess cash as dividends on our Class A common stock and nonvoting Class A common stock or otherwise undertake ameliorative actions between Common Units and shares of Class A common stock and nonvoting Class A common stock and instead, for example, hold such cash balances, the direct owners of Common Units may benefit from any value attributable to such cash balances as a result of their ownership of Class A common stock and nonvoting Class A common stock following a redemption or exchange of their Common Units, notwithstanding that such pre-IPO owners of the TPG Operating Group may previously have participated as holders of Common Units in distributions by the TPG Operating Group that resulted in our excess cash balances.
Our current intention is to pay holders of our Class A common stock and nonvoting Class A common stock a quarterly dividend representing at least 85% of TPG Inc.’s share of distributable earnings (“DE”) attributable to the TPG Operating Group, subject to adjustment as determined by the our board of directors and, until the Sunset, our Executive Committee, to be necessary or appropriate to provide for the conduct of our business, to make appropriate investments in our business and funds, to comply with applicable law, any of our debt instruments or other agreements, or to provide for future cash requirements such as tax-related payments and clawback obligations. Although we expect to pay at least 85% of our DE as a dividend, the percentage of our DE paid out as a dividend could fall below that target minimum. All of the
foregoing is subject to the further qualification that the declaration and payment of any dividends are at the sole discretion of our board of directors and, until the Sunset, our Executive Committee and the board of directors and Executive Committee may change our dividend policy at any time, including, without limitation, to reduce such dividends or even to eliminate such dividends entirely. Any future determination as to the declaration and payment of dividends, if any, will be at the discretion of our board of directors and, until the Sunset, our Executive Committee after taking into account various factors, including our business, operating results and financial condition, current and anticipated cash needs, plans for expansion and any legal or contractual limitations on our ability to pay dividends. Certain of our existing credit facilities include, and any financing arrangement that we enter into in the future may include restrictive covenants that limit our ability to pay dividends. In addition, the TPG Operating Group is generally prohibited under Delaware law from making a distribution to a limited partner to the extent that, at the time of the distribution, after giving effect to the distribution, liabilities of the TPG Operating Group (with certain exceptions) exceed the fair value of its assets. Subsidiaries of the TPG Operating Group are generally subject to similar legal limitations on their ability to make distributions to the TPG Operating Group. See “—We may continue to pay dividends to our stockholders, but our ability to do so is subject to the discretion of our board of directors and may be limited by our holding company structure and applicable provisions of Delaware law.”
If we are deemed an “investment company” subject to regulation under the Investment Company Act as a result of our ownership of the TPG Operating Group, applicable restrictions could make it impractical for us to continue our business as contemplated and could have a material adverse effect on our business.
An issuer will generally be deemed to be an “investment company” for purposes of the Investment Company Act if:
•it is or holds itself out as being engaged primarily, or proposes to engage primarily, in the business of investing, reinvesting or trading in securities; or
•absent an applicable exemption, it owns or proposes to acquire investment securities having a value exceeding 40% of the value of its total assets (exclusive of U.S. government securities and cash items) on an unconsolidated basis.
We regard ourselves as an alternative asset management firm. We believe that we are engaged primarily in the business of providing asset management services and not in the business of investing, reinvesting or trading in securities. We also believe that the primary source of income from each of our businesses is properly characterized as income earned in exchange for the provision of services. We hold ourselves out as an alternative asset management firm and do not propose to engage primarily in the business of investing, reinvesting or trading in securities.
The Investment Company Act and the rules thereunder contain detailed parameters for the organization and operations of investment companies. Among other things, the Investment Company Act and the rules thereunder limit or prohibit transactions with affiliates, impose limitations on the issuance of debt and equity securities, prohibit the issuance of stock options and impose certain governance requirements. We intend to conduct our operations so that TPG Inc. will not be deemed to be an investment company under the Investment Company Act. The need to comply with the 40% test in section 3(a)(1)(C) may cause us to (i) restrict our business and that of our subsidiaries with respect to the assets in which we can invest and/or the types of securities we may issue, (ii) sell investment securities, including on unfavorable terms, (iii) acquire assets or businesses that could change the nature of our business or (iv) potentially take other actions that may be viewed as adverse by the holders of our Class A common stock or nonvoting Class A common stock in order to ensure conformity with exceptions provided by, and rules and regulations promulgated under, the Investment Company Act. However, if anything were to happen that would cause TPG Inc. to be deemed to be an investment company under the Investment Company Act, requirements imposed by the Investment Company Act, including limitations on our capital structure, ability to transact business with affiliates and ability to compensate key employees, could make it impractical for us to continue our business as currently conducted, impair the agreements and arrangements between and among the TPG Operating Group, us or our senior leadership team, or any combination thereof, and have a material adverse effect on our results of operations, financial condition and cash flow. See “Item 1. Business—Regulation and Compliance—United States—Regulation Under the Investment Company Act.”
A change of control of our company could result in an assignment of our investment advisory agreements.
Under the Advisers Act, each of the investment advisory agreements for the funds and other accounts we manage now or in the future must provide that it may not be assigned without the consent of the particular fund or other client. An assignment may occur under the Advisers Act if, among other things, our subsidiaries that are registered as investment
advisers undergo a change of control. After the Sunset becomes effective, the Class B common stock will have one vote per share instead of ten votes per share, meaning that GP LLC, as the general partner of TPG Partner Holdings, will no longer control the appointment of directors or be able to direct the vote on all matters that are submitted to our stockholders for a vote. After the Sunset becomes effective, the control over the votes of TPG Partner Holdings will be passed through to the individual partners of TPG Partner Holdings. In addition, in the second phase of our governance evolution, we will expand from the original three members, Messrs. Bonderman, Coulter and Winkelried (the “Control Group”), to five members. While we do not believe that the Sunset or the expansion of the Control Group will result in an assignment under the Advisers Act, there can be no assurance that the SEC or a court would agree. Furthermore, if a third party acquired a sufficient number of shares to be able, alone or with others, to control the appointment of directors and other matters submitted to our stockholders for a vote, it could be deemed a change of control of our subsidiaries that are registered as investment advisers, and thus an assignment. If such an assignment occurs, we cannot be certain that our subsidiaries that are registered as investment advisers will be able to obtain the necessary consents from our funds and other clients, which could cause us to lose the management fees and performance allocations we earn from such funds and other clients.
The disparity in the voting rights among the classes of our common stock and inability of the holders of our Class A common stock to influence decisions submitted to a vote of our stockholders may have an adverse effect on the price of our Class A common stock.
Holders of our Class A common stock and Class B common stock will generally vote together as a single class on almost all matters submitted to a vote of our stockholders. Shares of our Class A common stock and Class B common stock entitle the respective holders to identical non-economic rights, except that each share of our Class A common stock entitles its holder to one vote on all matters to be voted on by stockholders generally, while each share of our Class B common stock entitles its holder to ten votes until the Sunset becomes effective; provided that, prior to the Sunset, shares of “Free Float” (as defined under the rules of FTSE Russell relating to the Russell indices) Class A common stock are entitled to at least 5.1% of the aggregate voting power (the “Free Float Threshold”) and the voting power of the Class B common stock will be reduced proportionately until the Free Float Threshold is met. After the Sunset becomes effective, each share of our Class B common stock will entitle its holder to one vote and GP LLC will no longer vote all shares attributable to TPG Partner Holdings. Prior to the Sunset, GP LLC will exercise control over all matters requiring the approval of our stockholders, including the election of our directors and members of our Executive Committee and the approval of significant corporate transactions. After the Sunset becomes effective, the control over the votes of TPG Partner Holdings will be passed through to the individual partners of TPG Partner Holdings. The difference in voting rights could adversely affect the value of our Class A common stock to the extent that investors view, or any potential future purchaser of our company views, the superior voting rights and implicit control of the Class B common stock to have value.
We may continue to pay dividends to our stockholders, but our ability to do so is subject to the discretion of our board of directors and may be limited by our holding company structure and applicable provisions of Delaware law.
Subject to funds being legally available, we intend to continue to cause the TPG Operating Group partnership to make pro rata cash distributions to holders of Common Units, including us, that will enable us, when combined with the tax distributions we receive, to pay our taxes, make all payments required under the Tax Receivable Agreement and pay other expenses. Our current intention is to pay holders of our Class A common stock and nonvoting Class A common stock a quarterly dividend representing at least 85% of TPG Inc.’s share of DE attributable to the TPG Operating Group, subject to adjustment as determined by the Executive Committee of our board of directors to be necessary or appropriate to provide for the conduct of our business, to make appropriate investments in our business and funds, to comply with applicable law, any of our debt instruments or other agreements, or to provide for future cash requirements such as tax-related payments and clawback obligations. Although we expect to pay at least 85% of our DE as a dividend, the percentage of our DE paid out as a dividend could fall below that target minimum. The declaration and payment by us of any future dividends to holders of our Class A common stock is at the sole discretion of our Executive Committee until the Sunset, and then by the board of directors after the Sunset. However, the ability of the TPG Operating Group to make such distributions to us is subject to its operating results, cash requirements and financial condition. Our ability to declare and pay dividends to our stockholders is likewise subject to Delaware law (which may limit the amount of funds available for dividends). If, as a consequence of these various limitations and restrictions, we are unable to generate sufficient distributions from our business, we may not be able to make, or may be required to reduce or eliminate, any payment of dividends on our Class A common stock and nonvoting Class A common stock.
Our share price may decline due to the large number of shares eligible for future sale and for exchange.
The market price of our Class A common stock could decline as a result of sales of a large number of shares of Class A common stock in the market or the perception that such sales could occur. These sales, or the possibility that these sales may occur, also might make it more difficult for us to sell equity securities in the future at a time and at a price that we deem appropriate. As of December 31, 2023, we have outstanding 72,337,600 shares of Class A common stock and 8,258,901 shares of nonvoting Class A common stock and 281,657,626 shares of Class A common stock that are authorized but unissued that are issuable upon exchange of 281,657,626 Common Units. This number includes the shares of our Class A common stock sold in the IPO, which may be resold in the public market. Shares of Class A common stock issued in the Reorganization to Pre-IPO Investors are “restricted securities” and their resale is subject to future registration or reliance on an exemption from registration.
Pursuant to the A&R Investor Rights Agreement (as defined herein), our partners, the TPG Partner Vehicles and Pre-IPO Investors are restricted from transferring or exchanging their Class A common stock, Class B common stock or Common Units, as applicable, prior to the second anniversary of the IPO. Between the second and third anniversary of the IPO, the TPG Partner Vehicles and the TPG partners may transfer or exchange up to 33.33% of their Class A common stock, or any shares of Class B common stock or any Common Units owned as of the closing of the IPO, as applicable; between the third and fourth anniversary of the IPO, the TPG Partner Vehicles and the TPG partners may transfer or exchange up to 66.66% of their original holdings of Class A common stock, or any shares of Class B common stock or any Common Units owned as of the closing of the IPO, as applicable; and after the fourth anniversary of the IPO, the TPG Partner Vehicles and the TPG partners may transfer or exchange up to 100% of their original holdings Class A common stock, or any shares of Class B common stock or any Common Units, as applicable (in each case, with respect to Common Units, subject to the terms of the A&R Exchange Agreement (as defined herein)). Upon an exchange of Common Units for Class A common stock, pursuant to the A&R Exchange Agreement, an equal number of Class B common stock will be cancelled for no additional consideration. The foregoing restrictions are subject to customary exceptions, including with respect to certain existing pledges and assignments of distributions from the TPG Operating Group and for transfers to related parties and charitable organizations. Up to $100 million (based on the IPO price per share of Class A common stock) of Class A common stock or equity instruments exchangeable for Class A common stock can be transferred to charitable organizations after expiration of the restricted period (as defined herein) and prior to the two year anniversary of the IPO free of any subsequent transfer restrictions. In addition, we may waive the foregoing restrictions under certain circumstances as contemplated in the A&R Investor Rights Agreement.
Pursuant to the A&R Investor Rights Agreement, the API Feeder Partnerships and API partners are restricted from transferring or exchanging any Class A common stock, Class B common stock or Common Units prior to the first anniversary of the closing of the Transaction (the “Closing”). Between the first and second anniversary of the Closing, the API Feeder Partnerships and API partners may transfer or exchange up to 33.33% of their Class A common stock, Class B common stock or any Common Units directly or indirectly owned as of the Closing, as applicable; between the second and third anniversary of the closing, the API Feeder Partnerships and API partners may transfer or exchange up to 66.66% of their Class A common stock, Class B common stock or any Common Units directly or indirectly owned as of the Closing, as applicable; and after the third anniversary of the Closing, the API Feeder Partnerships and API partners may transfer or exchange up to 100% of their Class A common stock, Class B common stock or any Common Units, as applicable (in each case, with respect to Common Units, subject to the terms of the A&R Exchange Agreement). Any additional Common Units received by the API Feeder Partnerships and API partners shall be deemed to have been received as of the date of the Closing.
Furthermore, between the one-year and eighteen-month anniversary of the IPO, the Pre-IPO Investors may sell up to 50% of their Class A common stock, Class B common stock or Common Units; between the eighteen-month and second-year anniversary of the IPO, the Pre-IPO Investors may sell up to 75% of their Class A common stock, Class B common stock or Common Units; and after the second-year anniversary, the Pre-IPO Investors may sell 100% of their Class A common stock, Class B common stock or Common Units, in each case, subject to the terms of the A&R Exchange Agreement. Pursuant to the A&R Investor Rights Agreement, we have agreed to register the resale of our common stock under certain circumstances.
The holders of outstanding Common Units have the right to have their Common Units exchanged for cash or (at our option) shares of Class A common stock and any disclosure of such exchange or the subsequent sale (or any disclosure of an intent to enter into such an exchange or subsequent sale) of such shares of Class A common stock may cause volatility in our stock price.
As of December 31, 2023, we had an aggregate of 281,657,626 shares of Class A common stock that are issuable upon exchange of Common Units that are held by the Common Unit holders of the TPG Operating Group. The holders of Common Units are entitled to have their Common Units exchanged for cash from a substantially concurrent public offering or private sale (based on the closing price per share of the Class A common stock on the day before the pricing of such public offering or private sale (taking into account customary brokerage commissions or underwriting discounts actually incurred)) or (at our option) shares of our Class A common stock.
We cannot predict the timing, size, or disclosure of any future issuances of our Class A common stock resulting from the exchange of Common Units or the effect, if any, that future issuances, disclosure, if any, or sales of shares of our Class A common stock may have on the market price of our Class A common stock. Sales or distributions of substantial amounts of our Class A common stock, or the perception that such sales or distributions could occur, may cause the market price of our Class A common stock to decline.
The market price of our Class A common stock may be volatile, which could cause the value of our stockholders’ investments to decline.
Securities markets worldwide experience significant price and volume fluctuations. This market volatility, as well as general economic, market or political conditions, could reduce the market price of our Class A common stock in spite of our operating performance. Our Class A common stock has been volatile and may continue to be volatile in the future. In addition, our operating results could be below the expectations of public market analysts and investors, and in response, the market price of our Class A common stock could decrease significantly.
Anti-takeover provisions in our charter documents and under Delaware law could make an acquisition of us more difficult, limit attempts by our stockholders to replace or remove our current management and may negatively affect the market price of our Class A common stock.
Provisions in our restated certificate of incorporation and bylaws may have the effect of delaying or preventing a change of control or changes in our management. Our restated certificate of incorporation and amended and restated bylaws include provisions that:
•provide that vacancies on our board of directors may be filled only by a majority of directors then in office, even though less than a quorum following the Sunset, before which time vacancies may be filled only by the Control Group;
•require that any action to be taken by our stockholders be effected at a duly called annual or special meeting and not by written consent, except that action by written consent is allowed for as long as we are a controlled company;
•specify that special meetings of our stockholders can be called only by our board of directors or the executive chairman (or if there is no executive chairman, our chairman) of our board of directors;
•establish an advance notice procedure for stockholder proposals to be brought before an annual meeting, including proposed nominations of persons for election to our board of directors;
•authorize our board of directors to issue, without further action by the stockholders, up to 25,000,000 shares of undesignated preferred stock in one or more classes or series; and
•reflect three classes of common stock, with Class B common stock having 10 votes per share and voting Class A common stock generally having one vote per share and nonvoting Class A common stock without voting rights until the shares are transferred, until the Sunset becomes effective, as discussed above.
These and other provisions may frustrate or prevent any attempts by our stockholders to replace or remove our current management by making it more difficult for stockholders to replace members of our board of directors, which is responsible for appointing the members of our management. Also, the Tax Receivable Agreement provides that, in the event of a change of control, we will be required to make a payment equal to the present value of estimated future payments under the Tax Receivable Agreement, which would result in a significant payment becoming due in the event of a change of control. In addition, Section 203 of the Delaware General Corporation Law (the “DGCL”) generally prohibits a Delaware corporation from engaging in any of a broad range of business combinations with any “interested” stockholder, in particular those owning 15% or more of our outstanding voting stock, for a period of three years following the date on which the stockholder became an “interested” stockholder. While we have elected in our restated certificate of incorporation not to be subject to Section 203 of the DGCL, our restated certificate of incorporation contains provisions that have the same effect as Section 203 of the DGCL, except that they provide that the TPG Operating Group, its affiliates, groups that include the TPG Operating Group and certain of their direct and indirect transferees are not deemed to be “interested stockholders,” regardless of the percentage of our voting stock owned by them, and accordingly are not subject to such restrictions. As a result, in the event of a business combination with any such persons, we will not be required to obtain the same stockholder approvals for certain transactions as other public companies subject to DGCL Section 203 and our stockholders will therefore not have the same protections with respect to certain transactions as stockholders of other public companies.
If securities analysts do not publish research or reports about our business or if they publish negative evaluations of our Class A common stock, the price of our Class A common stock could decline.
The trading market for our Class A common stock relies in part on the research and reports that industry or financial analysts publish about us or our business. If one or more of the analysts covering our business downgrade their evaluations of our stock, the price of our Class A common stock could decline. If one or more of these analysts cease to cover our Class A common stock, we could lose visibility in the market for our stock, which in turn could cause our Class A common stock price to decline.
We are required to pay certain holders of Common Units (or their assignees under the Tax Receivable Agreement) for most of the tax benefits that we may claim as a result of the Covered Tax Items (as defined below).
We, the TPG Operating Group partnership and one of our wholly-owned subsidiaries have entered into the Tax Receivable Agreement with certain holders of Common Units (“TRA holders”) that provides for the payment by us (or our subsidiary) to such holders (or their assignees under the Tax Receivable Agreement) of 85% of the benefits, if any, that we realize, or we are deemed to realize (calculated using certain assumptions), as a result of (i) adjustments to the tax basis of the assets of the TPG Operating Group as a result of certain exchanges of Common Units and (ii) certain other tax benefits, including tax benefits attributable to payments under the Tax Receivable Agreement (the “Covered Tax Items”). The Covered Tax Items may increase and, therefore, may reduce the amount of tax that we would otherwise be required to pay in the future, although the IRS may challenge all or part of the validity of the Covered Tax Items, and a court could sustain such a challenge. Actual tax benefits realized by us may differ from tax benefits calculated under the Tax Receivable Agreement as a result of the use of certain assumptions in the Tax Receivable Agreement, including the use of an assumed weighted-average state and local income tax rate to calculate tax benefits.
The payment obligation under the Tax Receivable Agreement is our (or our wholly-owned subsidiary’s) obligation and not an obligation of the TPG Operating Group. While the amount of the Covered Tax Items, as well as the amount and timing of any payments under the Tax Receivable Agreement, will vary depending upon a number of factors, we expect the payments that we may make under the Tax Receivable Agreement will be substantial. The actual amounts payable will depend upon, among other things, the timing of purchases or exchanges, tax rates, the price of shares of our Class A common stock at the time of such purchases or exchanges, the extent to which such purchases or exchanges are taxable and the amount and timing of our taxable income. The payments under the Tax Receivable Agreement are not conditioned upon continued ownership of us by the TRA holders. See “—In certain cases, payments under the Tax Receivable Agreement may be accelerated and/or significantly exceed the actual benefits we realize in respect of the tax attributes subject to the Tax Receivable Agreement.”
In certain cases, payments under the Tax Receivable Agreement may be accelerated and/or significantly exceed the actual benefits we realize in respect of the tax attributes subject to the Tax Receivable Agreement.
Our payment obligations under the Tax Receivable Agreement will be accelerated in the event of certain changes of control, in certain events of bankruptcy or liquidation or if we elect to terminate the Tax Receivable Agreement early. The accelerated payments required in such circumstances will be calculated by reference to the present value (at a discount rate equal to the lesser of (i) 6.5% per annum and (ii) one-month SOFR (as defined herein) (or its successor rate) plus 100 basis points) of all future payments that holders of Common Units or other recipients would have been entitled to receive under the Tax Receivable Agreement, and such accelerated payments and any other future payments under the Tax Receivable Agreement will utilize certain valuation assumptions, including that we will have sufficient taxable income to fully utilize the Covered Tax Items and that we are not subject to any alternative minimum tax. In addition, recipients of payments under the Tax Receivable Agreement will not reimburse us for any payments previously made under the Tax Receivable Agreement if the tax attributes or our utilization of tax attributes underlying the relevant Tax Receivable Agreement payment are successfully challenged by the IRS (although any such detriment would be taken into account as an offset against future payments due to the relevant recipient under the Tax Receivable Agreement). Our ability to achieve benefits from the Covered Tax Items, will depend upon a number of factors, including the timing and amount of our future income. As a result, even in the absence of a change of control or an election to terminate the Tax Receivable Agreement early, payments under the Tax Receivable Agreement could be in excess of 85% of our actual cash tax benefits.
Accordingly, it is possible that the actual cash tax benefits realized by us may be significantly less than the corresponding Tax Receivable Agreement payments. It is also possible that payments under the Tax Receivable Agreement may be made years in advance of the actual realization, if any, of the anticipated future tax benefits, including in circumstances in which we are subject to an alternative minimum tax and as a result are not able to realize the tax benefits associated with Covered Tax Items. There may be a material negative effect on our liquidity if the payments under the Tax Receivable Agreement exceed the actual cash tax benefits that we realize in respect of the tax attributes subject to the Tax Receivable Agreement and/or if distributions to us by the TPG Operating Group are not sufficient to permit us to make payments under the Tax Receivable Agreement after we have paid taxes and other expenses. The actual amounts we will be required to pay may materially differ from these hypothetical amounts, depending on the actual timing of the termination of the Tax Receivable Agreement, the fair market value of our Class A common stock at the time of such termination, the prevailing one-month SOFR at the time of such termination and a number of other factors. We may need to incur additional indebtedness to finance payments under the Tax Receivable Agreement to the extent our cash resources are insufficient to meet our obligations under the Tax Receivable Agreement as a result of timing discrepancies or otherwise, and these obligations could have the effect of delaying, deferring or preventing certain mergers, asset sales, other forms of business combinations or other changes of control.
The acceleration of payments under the Tax Receivable Agreement in the case of certain changes of control may impair our ability to consummate change of control transactions or negatively impact the value received by owners of our Class A common stock.
In the case of certain changes of control, payments under the Tax Receivable Agreement will be accelerated and may significantly exceed the actual benefits we realize in respect of the tax attributes subject to the Tax Receivable Agreement. We expect that the payments that we may make under the Tax Receivable Agreement in the event of a change of control will be substantial. As a result, our accelerated payment obligations and/or the assumptions adopted under the Tax Receivable Agreement in the case of a change of control may impair our ability to consummate change of control transactions or negatively impact the value received by owners of our Class A common stock in a change of control transaction.
Our restated certificate of incorporation designates the Court of Chancery of the State of Delaware as the sole and exclusive forum for certain types of actions and proceedings that may be initiated by our stockholders and designates the U.S. federal district courts as the sole and exclusive forum for claims arising under the Securities Act (as defined herein), which, in each case, could limit our stockholders’ ability to obtain a favorable judicial forum for disputes with us or our directors, officers, employees, agents or other stockholders.
Our restated certificate of incorporation provides that, unless we consent in writing to an alternative forum, the Court of Chancery of the State of Delaware shall, to the fullest extent permitted by law, be the sole and exclusive forum for any (i) derivative action or proceeding brought on behalf of the Company; (ii) action asserting a claim of breach of a fiduciary duty owed by or other wrongdoing by any current or former director, officer, employee, agent or stockholder of the Company to the Company or the Company’s stockholders; (iii) action asserting a claim arising under any provision of the DGCL or our restated certificate of incorporation or our bylaws (as either may be amended from time to time), or as to which the DGCL confers jurisdiction on the Court of Chancery of the State of Delaware; or (iv) action asserting a claim governed by the internal affairs doctrine. For the avoidance of doubt, our restated certificate of incorporation also provides that the foregoing exclusive forum provision does not apply to actions brought to enforce any liability or duty created by the Securities Act of 1933, as amended (the “Securities Act”) or the Exchange Act, or any other claim or cause of action for which the federal courts have exclusive jurisdiction.
Our restated certificate of incorporation also provides that, unless we consent in writing to an alternative forum, the federal district courts of the United States of America shall be the sole and exclusive forum for the resolution of any action asserting a claim arising under the Securities Act or the rules and regulations promulgated thereunder, and that its provisions will not preclude or contract the scope of exclusive federal jurisdiction for suits brought under the Exchange Act or the rules and regulations promulgated thereunder. However, Section 22 of the Securities Act creates concurrent jurisdiction for federal and state courts over all suits asserting a claim arising under the Securities Act or the rules and regulations promulgated thereunder; accordingly, we cannot be certain that a court would enforce such provision. Pursuant to the Exchange Act, claims arising thereunder must be brought in federal district courts of the United States of America.
To the fullest extent permitted by law, any person or entity purchasing or otherwise acquiring or holding any interest in any shares of our capital stock shall be deemed to have notice of and consented to the forum provision in our restated certificate of incorporation. This choice of forum provision may limit a stockholder’s ability to bring a claim in a different judicial forum, including one that it may find favorable or convenient for a specified class of disputes with us or our directors, officers, other stockholders, agents or employees, which may discourage such lawsuits, make them more difficult or expensive to pursue, and result in outcomes that are less favorable to such stockholders than outcomes that may have been attainable in other jurisdictions. By agreeing to this provision, however, our stockholders will not be deemed to have waived (and cannot waive) compliance with the federal securities laws and the rules and regulations promulgated thereunder. The enforceability of similar choice of forum provisions in other companies’ certificates of incorporation has been challenged in legal proceedings, and it is possible that a court could find these types of provisions to be inapplicable or unenforceable. If a court were to find the choice of forum provisions in our restated certificate of incorporation to be inapplicable or unenforceable in an action, we may incur additional costs associated with resolving such action in other jurisdictions, which could have a material adverse effect on our business, financial condition and results of operations.
Risks Related to Our Indebtedness
Our use of borrowings to finance our business exposes us to risks.
We use indebtedness as a means to finance our business operations, which exposes us to the typical risks associated with using leverage, including those discussed under “—Dependence on significant leverage by certain of our funds and their investments could adversely affect the ability of our funds to achieve attractive rates of return on those investments.” We have outstanding securitization notes due June 20, 2038, a term credit facility as well as revolving credit facilities with various maturity dates. See Note 12, “Debt Obligations,” to the Consolidated Financial Statements for further information regarding our outstanding indebtedness. We are dependent on financial institutions extending credit to us on reasonable terms to finance our business, and on our ability to access the debt and equity capital markets, which can be volatile. In particular, global markets struggled in 2023 in the face of rapidly rising inflation, a fluctuating interest rate environment and geopolitical concerns such as the war in Ukraine and conflict in the Middle East. There is no guarantee that such financial institutions will continue to extend credit to us or will renew the existing credit agreements we have with them, or that we will be able to refinance our outstanding notes or other obligations when they mature. In addition, the incurrence of additional debt in the future could result in downgrades of our existing corporate credit ratings, which could limit the availability of future financing or increase our cost of borrowing. As borrowings under our credit facilities or any other
indebtedness mature, we may be required to refinance them by either entering into new facilities or issuing additional debt, which could result in higher borrowing costs, or issuing additional equity, which would dilute existing stockholders. We could also repay them by using cash on hand, cash provided by our continuing operations or cash from the sale of our assets, which could reduce the amount of cash available to facilitate the growth and expansion of our businesses and pay dividends to our stockholders and operating expenses and other obligations as they arise. We may be unable to enter into new facilities or issue debt or equity securities in the future on attractive terms, or at all.
Furthermore, the existing credit agreements and instruments governing our debt contain covenants with which we need to comply. Non-compliance with any of the covenants without cure or waiver would constitute an event of default, and an event of default resulting from a breach of certain covenants could result, at the option of the lenders, in an acceleration of the principal and interest outstanding, and a termination of the credit agreements or instruments governing our debt.
We have significant liquidity requirements, and adverse market and economic conditions may negatively impact our sources of liquidity, which could have a material adverse effect on our results of operations, financial condition and cash flow.
We expect that our primary liquidity needs include cash required to:
•continue growing our businesses, including seeding new strategies, pursuing strategic investments or acquisitions, funding our capital commitments made to existing and future funds and co-investments, funding any net capital requirements of our broker-dealer and otherwise supporting investment vehicles that we sponsor;
•support our working capital needs;
•service debt obligations, including the payment of obligations at maturity, on interest payment dates or upon redemption, as well as any contingent liabilities that may give rise to future cash payments;
•fund cash operating expenses, including compensation and contingencies, including for clawback obligations or litigation matters;
•pay amounts that may become due under the Tax Receivable Agreement;
•pay cash dividends in accordance with our dividend policy for our Class A common stock;
•warehouse investments in portfolio companies or other investments for the benefit of one or more of our funds or other investment pending contribution of committed capital by the investors in such vehicles and advance capital to them for other operational needs;
•address capital needs of regulated and other subsidiaries, including our broker-dealer; and
•exchange Common Units pursuant to the A&R Exchange Agreement or repurchase or redeem other securities issued by us.
These liquidity requirements are significant and, in some cases, involve capital that will remain invested for extended periods of time. As of December 31, 2023, we had approximately $521.3 million of remaining unfunded capital commitments to our funds. Our commitments to our funds will require significant cash outlays over time, and there can be no assurance that we will be able to generate sufficient cash flows from realizations of investments to fund them. We have used our balance sheet to provide credit support to the Co-Invest Leverage Facility used by certain personnel in connection with their commitments to our funds and the GP Services Credit Facility to facilitate and manage the investments by partners, employees and other participants in certain of our funds. In addition, we have used our balance sheet to provide credit support to backstop certain clawback obligations to our funds. We have also used our balance sheet to provide credit support for guarantees related to certain operating leases for our offices.
In addition, as of December 31, 2023, we had $945.1 million of indebtedness outstanding under our credit facilities and secured borrowings and $665.2 million of cash and cash equivalents. Depending on market conditions, we may be unable to refinance or renew all or part of our secured borrowings or our credit facilities, or find alternate sources of financing (including issuing equity), on commercially reasonable terms or at all. Furthermore, the incurrence of additional debt by us or our subsidiaries in the future could result in downgrades of our existing corporate credit ratings, which could limit the availability of future financing and increase our costs of borrowing.
In addition, our broker-dealer from time to time makes significant drawdowns under a revolving credit facility to satisfy net capital requirements arising from its underwriting commitments. These drawdowns could also put pressure on our liquidity or limit our ability to allocate our capital efficiently across our businesses. To the extent we do not have access to our broker-dealer’s revolving credit facility or other liquidity, regulatory net capital requirements could limit our broker-dealer’s ability to participate in underwriting or other transactions.
Finally, if cumulative distributions to our funds’ investors are not in accordance with the distributions described in the applicable fund governing documents, the general partner is required to make payments to the investors in an amount necessary to correct the deficiency. We typically guarantee such clawback obligations on behalf of each fund’s general partner. Adverse economic conditions may increase the likelihood of triggering these general partner obligations. If one or more such general partner obligations were triggered, we may not have available cash to repay the performance allocations and satisfy such obligations. If we were unable to repay such performance allocations, we would be in breach of the relevant governing agreements with our fund investors and could be subject to liability. Any of the foregoing could lead to a substantial decrease in our revenues and to material adverse impacts on our reputation.
In the event that our liquidity requirements were to exceed available liquid assets for the reasons we specify above or for any other reasons, we could be forced to sell assets or seek to raise debt or equity capital on unfavorable terms. For further discussion of our liquidity needs, see “Item 7. Management’s Discussion and Analysis of Financial Condition and Results of Operations—Liquidity and Capital Resources.”
Dependence on significant leverage by certain of our funds and their investments could adversely affect the ability of our funds to achieve attractive rates of return on those investments.
Many of our funds’ investments rely on the use of leverage, and our ability to achieve attractive rates of return on investments will depend on our ability to access sufficient sources of indebtedness at attractive rates. The absence of available sources of sufficient debt financing at attractive rates for extended periods of time could therefore materially and adversely affect our funds and investments. In addition, in March 2013, the U.S. Federal Reserve Board and other U.S. federal banking agencies issued updated leveraged lending guidance covering transactions characterized by a degree of financial leverage. Such guidance may limit the amount or cost of financing we are able to obtain for our transactions, and as a result, the returns on our investments may suffer. However, the status of the 2013 leveraged lending guidance remains uncertain following a determination by the Government Accountability Office in October 2017 that resulted in such guidance being required to be submitted to the U.S. Congress for review. The possibility exists that, under the current administration, the U.S. federal bank regulatory agencies could apply the leveraged lending guidance in its current form, or implement a revised or new rule that limits leveraged lending. Such regulatory action could limit the amount of funding and increase the cost of financing available for our business.
An increase in the overall cost of debt required by providers of that indebtedness would make it more expensive to finance those investments, thereby reducing returns. Further, the interest payments on the indebtedness used to finance our funds’ investments are generally deductible expenses for income tax purposes, subject to limitations under applicable tax law and policy. Any change in such tax law or policy to eliminate or limit these income tax deductions, as has been discussed from time to time in various jurisdictions, would reduce the after-tax rates of return on the affected investments. See “—Changes in the debt financing markets or higher interest rates could negatively impact the ability of certain of our funds and their investments to obtain attractive financing or re-financing and could increase the cost of such financing if it is obtained, which could lead to lower-yielding investments and could potentially decrease our net income.”
In addition, a portion of the indebtedness used to finance our funds’ investments often includes leveraged loans and debt instruments privately placed with institutional investors. Availability of capital from the leveraged loan, high-yield and private debt markets is subject to market volatility, and there may be times when our funds might not be able to access those markets at attractive rates, or at all, when completing an investment. Additionally, to the extent there is a reduction in the availability of financing for extended periods of time, the purchasing power of a prospective buyer may be more limited, adversely impacting the fair value of our funds’ investments and thereby reducing the acquisition price.
Investments in highly leveraged entities are also inherently more sensitive to declines in revenues, increases in expenses and interest rates and volatile or adverse economic, market and industry developments. Additionally, the interests (whether in securities or otherwise) acquired by our funds in their investments may be the most junior in what could be a complex capital structure, and thus subject us to the greatest risk of loss in the event of insolvency, liquidation, dissolution, reorganization or bankruptcy of one of these investments. Furthermore, the incurrence of a significant amount of indebtedness by an investment could, among other things:
•subject the entity to a number of affirmative, negative and financial covenants, terms and conditions, any violation of which would be viewed by creditors as an event of default and could materially impact our ability to realize value from the investment;
•give rise to an obligation to make mandatory prepayments of debt using excess cash flow, which might limit the entity’s ability to respond to changing industry conditions to the extent additional cash is needed for the response, to make unplanned but necessary capital expenditures or to take advantage of growth opportunities;
•allow even moderate reductions in operating cash flow to render the entity unable to service its indebtedness, leading to a bankruptcy or other reorganization of the entity and a loss of part or all of the equity investment in it;
•limit the entity’s ability to adjust to changing market conditions, thereby placing it at a competitive disadvantage compared to its competitors who have relatively less debt;
•limit the entity’s ability to engage in strategic acquisitions that might be necessary to generate attractive returns or further growth; and
•limit the entity’s ability to obtain additional financing or increase the cost of obtaining such financing, including for capital expenditures, working capital or other general corporate purposes.
A leveraged investment’s equity value also tends to increase or decrease at a greater rate than would otherwise be the case if money had not been borrowed. As a result, the risk of loss associated with a leveraged investment is generally greater than for investments with comparatively less debt. For example, leveraged investments could default on their debt obligations due to a decrease in cash flow precipitated by an economic downturn or by poor relative performance at such a company. Similarly, the leveraged nature of the investments of our real assets funds increases the risk that a decline in the fair value of the underlying real estate or tangible assets will result in their abandonment or foreclosure.
When our funds’ existing investments reach the point when debt incurred to finance those investments matures in significant amounts and must be either repaid or refinanced, those investments may materially suffer if they have generated insufficient cash flow to repay maturing debt and there is insufficient capacity and availability in the financing markets to permit them to refinance maturing debt on satisfactory terms, or at all. If a limited availability of financing for such purposes were to persist for an extended period of time, when significant amounts of the debt incurred to finance our funds’ investments came due, these funds could be materially and adversely affected. Additionally, if such limited availability of financing persists, our funds may also not be able to recoup their investments, as issuers of debt become unable to repay their borrowings, which will adversely affect both their equity and debt investors. Moreover, in the event of default or potential default under applicable financing arrangements, one or more of our investments may go bankrupt, which could give rise to substantial investment losses, adverse claims or litigation against us or our employees and damage to our reputation.
Many of our funds may choose to use leverage as part of their investment programs and regularly borrow a substantial amount of their capital. The use of leverage poses a significant degree of risk and enhances the possibility of a significant loss in the value of the investment portfolio. A fund may borrow money from time to time to purchase or carry securities or debt obligations or may enter into derivative transactions (such as total return swaps) with counterparties that have embedded leverage. The interest expense and other costs incurred in connection with such borrowing may not be recovered by appreciation in the securities purchased or carried and will be lost, and the timing and magnitude of such losses may be accelerated or exacerbated, in the event of a decline in the market value of such securities or debt obligations. Gains realized with borrowed funds may cause the fund’s net asset value to increase at a faster rate than would be the case without borrowings. However, if investment results fail to cover the cost of borrowings, the fund’s net asset value will also decrease faster than if there had been no borrowings. Interest rate increases, including those approved by the U.S. Federal Reserve in 2023, could also decrease the value of fixed-rate debt investment that our investment funds make.
In addition, to the extent that any changes in tax law make debt financing less attractive to certain categories of borrowers, this could adversely affect the investment opportunities for funds, particularly those that invest in debt securities, loans and other credit-related investments.
Any of the foregoing circumstances could have a material adverse effect on our results of operations, financial condition and cash flow.
Changes in the debt financing markets or higher interest rates could negatively impact the ability of certain of our funds and their investments to obtain attractive financing or re-financing and could increase the cost of such financing if it is obtained, which could lead to lower-yielding investments and could potentially decrease our net income.
A period of sharply rising interest rates could create downward pressure on the price of real estate, increase the cost and availability of debt financing for the transactions our funds pursue and decrease the value of fixed-rate debt investments made by our funds, each of which may have an adverse impact on our business. Interest rates rose steadily in 2023 and, to the extent that interest rates continue to rise, may have further material adverse impacts on our business and that of our investment funds and their investments. In addition, a significant contraction or weakening in the market for debt financing or other adverse change relating to the terms of debt financing, including higher equity requirements or more restrictive covenants, could have a material adverse impact on our business and that of our investment funds and their investments. Moreover, the financing of new investments or the operations of our funds’ investments may become less attractive due to limitations on the deductibility of net interest expense. See“—Risks Related to Our Industry—Changes in relevant tax laws, regulations or treaties or an adverse interpretation of these items by tax authorities could negatively impact our effective tax rate and tax liability.”
If our funds are unable to obtain committed debt financing for potential acquisitions, can only obtain debt financing at an increased interest rate or on unfavorable terms or the ability to deduct corporate interest expense is substantially limited, our funds may face increased competition from strategic buyers of assets who may have an overall lower cost of capital or the ability to benefit from a higher amount of cost savings following an acquisition, or may have difficulty completing otherwise profitable acquisitions or may generate profits that are lower than would otherwise be the case, each of which could lead to a decrease in our revenues. In addition, rising interest rates, coupled with periods of significant equity and credit market volatility may potentially make it more difficult for us to find attractive opportunities for our funds to exit and realize value from their existing investments. Furthermore, any failure by lenders to provide previously committed financing can also expose us to potential claims by sellers of businesses that we may have contracted to purchase.
Our funds’ portfolio company investments also regularly utilize the corporate loan and bond markets to obtain financing for their operations. Certain portfolio companies are facing, or may face in the future, increased credit and liquidity risk due to volatility in financial markets, increased costs of existing floating rate indebtedness in light of the rising interest rate environment, reduced revenue streams and limited or higher cost of access to preferred sources of funding, which could negatively affect us or our funds’ investments. To the extent monetary policy, tax or other regulatory changes or difficult credit markets render such financing difficult to obtain, more expensive or otherwise less attractive, this may negatively impact the financial results of those investments and, therefore, the investment returns on our funds.
In addition, to the extent that conditions in the credit markets or tax or other regulatory changes impair the ability of our investments to refinance or extend maturities on their outstanding debt, either on favorable terms or at all, the financial results of those portfolio companies may be negatively impacted, which could impair the value of our funds’ investments and lead to a decrease in the investment income earned by us. In some cases, the inability of our funds’ investments to refinance or extend maturities may result in the inability of those investments to repay debt at maturity or pay interests when due, and may cause the portfolio companies to sell assets, undergo a recapitalization or seek bankruptcy protection, any of which would also likely impair the value of our funds’ investment and lead to a decrease in investment income earned by us.
Interest rates on our and our investments’ outstanding financial instruments might be subject to change based on regulatory developments, which could adversely affect our revenue, expenses and the value of those financial instruments.
Certain floating rate benchmark indices, including, without limitation, the Euro Interbank Offered Rate, Tokyo Interbank Offered Rate, Hong Kong Interbank Offered Rate and Singapore Interbank Offered Rate (collectively, “IBORs”), are the subject of recent national, international and regulatory guidance and proposals for reform. These reforms may cause such benchmarks to perform differently than in the past or have other consequences which cannot be predicted.
As a result, interest rates on our, our funds’ and their investments’ floating rate obligations, loans, deposits, derivatives, and other financial instruments tied to IBORs, as well as the revenue and expenses associated with those financial instruments, may be adversely affected. Further, any uncertainty regarding the continued use and reliability of any IBOR as a benchmark interest rate could adversely affect the value of our, our funds’ and their investments’ financial instruments tied to such rates. There is no guarantee that a transition from any IBOR to an alternative rate will not result in financial market disruptions or a significant increase in volatility in risk-free benchmark rates or borrowing costs to borrowers, any of which could have a direct or indirect adverse effect on our business, results of operations, financial condition and share price. We continue to monitor and manage the foregoing changes and related risks on our and our funds’ investments to reduce any adverse effect it may have on us and our investments. In addition, we continue to oversee or manage (as appropriate to our level of day-to-day involvement in the oversight and management of our investments) our funds’ investments’ monitoring and management of the foregoing changes and related risks.
In addition, meaningful time and effort is required to transition to the use of new benchmark rates, including with respect to the negotiation and implementation of any necessary changes to existing contractual arrangements and the implementation of changes to our, our funds’ and their investments’ systems and processes. Negotiating and implementing necessary amendments to our, our funds’ or their investments’ existing contractual arrangements may be particularly costly and time consuming. We are actively evaluating the operational and other impacts of such changes and managing transition efforts accordingly.
The replacement of LIBOR with an alternative reference rate may result in an overall increase to borrowing costs or cause other disruptions, which could have a material adverse effect on our results of operations, financial condition and cash flow.
Prior to June 2023, the London Inter-Bank Offered Rate (“LIBOR”) was widely used as a reference for setting the interest rate on loans, bonds and derivatives globally. LIBOR was discontinued effective June 2023. In its place, the U.S. Federal Reserve, in conjunction with the Alternative Reference Rates Committee, recommended a new reference rate derived from short-term repurchase agreements backed by Treasury securities, the Secured Overnight Financing Rate (“SOFR”).
Certain of our funds’ investments and/or indebtedness of our portfolio companies may have previously had interest rates with a LIBOR reference. While substantially all of such references in our funds’ instruments and our applicable portfolio company indebtedness may have been removed or replaced with an alternate interest rate (e.g., SOFR), the transition process away from LIBOR is complex, time-consuming and costly, and could cause a disruption in the credit markets globally, which could adversely impact our funds and/or portfolio companies. Even if replacement conventions (e.g., SOFR) are widely adopted in the lending and bond markets, it is uncertain whether they might affect the funds as investors in floating-rate instruments, including by:
•affecting liquidity of the funds’ investments in the secondary market and their market value;
•reducing the interest rate earned by the funds as holders of such investments (either generally or in certain market cycles) due to the use of a collateralized, overnight rate and credit spread adjustments instead of an unsecured, term rate; or
•causing the funds to incur expenses to manage the transition away from LIBOR.
Our funds and our funds’ portfolio companies may have previously entered into swaps and similar instruments that referenced LIBOR, including swaps used to manage long-term interest rate risk related to assets and/or liabilities. With respect to such instruments, there may be different conventions that arise in different but related market segments, which could result in mismatches between different assets and liabilities and, in turn, cause possible unexpected gains and/or
losses for the funds or portfolio companies and possibly cause the funds or portfolio companies to owe greater payments or receive less payment under their derivatives, at least during certain market cycles. Some of the rates replacing may also be subject to compounding or similar adjustments that cause the amount of any payment referencing a replacement rate not to be determined until the end of the relevant calculation period, rather than at the beginning, which could lead to administrative challenges for the funds. Furthermore, the determination of such replacement rate may require further negotiation and there can be no assurance that an agreement between the parties will be reached. The terms of the funds’ and/or portfolio companies’ credit facilities may also provide that, during any applicable transition period, the amounts drawn under the credit facilities may bear interest at a higher rate. In addition, even if an agreement is reached with respect to a replacement rate for LIBOR, the applicable lender may have the ability to make certain changes to the terms of a credit facility to implement the new rate, which the fund or portfolio company may have no control over.
In addition, SOFR, which replaced LIBOR as the reference rate under our credit facilities pursuant to amendments thereto, is intended to be a broad measure of the cost of borrowing cash overnight collateralized by U.S. Treasury securities and is not the economic equivalent of LIBOR. While SOFR is a secured rate, LIBOR is an unsecured rate. As a result, we cannot assure you that SOFR will perform in the same ways as LIBOR would have at any time, and any increased volatility in the interest rates payable under our credit facilities could increase our funding costs.
If the transition from LIBOR results in an overall increase to borrowing costs, higher interest expense could negatively affect the financial results and valuations of our funds’ portfolio companies. There is no guarantee that a transition from LIBOR to an alternative will not result in significant increases or volatility in risk-free benchmark rates or borrowing costs to borrowers, any of which could have a material adverse effect on our results of operations, financial condition and cash flow.
Risks Related to Our Industry
The investment management business is intensely competitive, which could have a material adverse effect on our results of operations, financial condition and cash flow.
We compete as an investment manager for both fund investors and investment opportunities. The investment management business is highly fragmented, with our principal competitors being sponsors of private funds and operating companies acting as strategic buyers of businesses. Competition for fund investors is based on a variety of factors, including:
•investment performance;
•investor liquidity and willingness to invest;
•investor perception of investment managers’ drive, focus and alignment of interest;
•business reputation;
•quality of services provided to and duration of relationships with fund investors;
•pricing and fund terms, including fees;
•the relative attractiveness of the types of investments that have been or will be made; and
•consideration of ESG issues.
Further, we believe that competition for investment opportunities is based primarily on the pricing, terms and structure of a proposed investment and certainty of execution.
A variety of factors could exacerbate the competitive risks we face, including:
•fund investors may reduce their investments in our funds or decrease their allocations in new funds based on a variety of factors, such as the occurrence of an economic downturn, their available capital, regulatory requirements or a desire to consolidate their relationships with investment firms;
•some of our competitors may have agreed, or may agree, to terms on their funds or products that are more favorable to fund investors than those of our funds or products, such as lower management fees, greater fee sharing or higher hurdles for performance allocations, and we may be unable to match or otherwise revise our terms;
•some of our funds may not perform as well as competitors’ funds or other available investment products;
•some of our competitors may have raised, or may raise, significant amounts of capital and may have similar investment objectives and strategies to our funds, which could create additional competition for investment opportunities and reduce the size and duration of pricing inefficiencies that many alternative investment strategies seek to exploit;
•some of our competitors may have a lower cost of capital and access to funding sources that are not available to us;
•some of our competitors may have higher risk tolerances, different risk assessments or lower return thresholds, which could allow them to consider a wider variety of investments and bid more aggressively than us for investments;
•some of our competitors may be subject to less regulation or less regulatory scrutiny and, accordingly, may have more flexibility to undertake and execute certain businesses or investments than we do and/or bear less expense to comply with such regulations than we bear;
•there are relatively few barriers to entry impeding the formation of new funds, including a relatively low cost of entering these businesses, and the successful efforts of new entrants into our various lines of business have resulted, and may continue to result, in increased competition;
•if, as we expect, allocation of assets to alternative investment strategies increases, there may be increased competition for alternative investments and access to fund general partners and managers;
•some of our competitors may have instituted, or may institute, low cost, high speed financial applications and services based on artificial intelligence, and new competitors may enter the investment management space using new investment platforms based on artificial intelligence;
•some investors may prefer to pursue investments directly instead of investing through one of our funds;
•some investors may prefer to invest with an investment manager that is not publicly traded, is smaller or manages fewer investment products; and
•other industry participants continuously seek to recruit our investment professionals and other key personnel away from us.
We may lose investment opportunities in the future if we do not match investment prices, structures and terms offered by competitors. For example, competitors that are corporate buyers may be able to achieve synergistic cost savings in respect of an investment, which may allow them to submit a higher bid. Alternatively, we may experience decreased investment returns and increased risks of loss if we match investment prices, structures and terms offered by competitors. As a result, if we are forced to compete with other investment firms on the basis of price, we may be unable to maintain our current fees or other terms. There is a risk that management fees and performance allocations in the alternative investment management industry will decline, without regard to the historical performance of a manager. Management fee or performance allocation income reductions on existing or future funds, without corresponding decreases in our cost structure, would negatively impact our revenues and profitability and could have a material adverse effect on our results of operations, financial condition and cash flow.
In addition, if market conditions for competing investment products were to become more favorable, such products could offer rates of return superior to those achieved by our funds and the attractiveness of our funds relative to investments in other investment products could decrease. This competitive pressure could negatively impact our ability to make successful investments and limit our ability to raise future funds, either of which could have a material adverse effect on our results of operations, financial condition and cash flow.
Climate change and climate change-related regulation could adversely affect our business.
TPG and our portfolio companies face risks associated with climate change including risks related to the impact of climate-and ESG-related legislation and regulation (both domestically and internationally), risks related to climate-related business trends, and risks stemming from the physical impacts of climate change. In addition, uncertainties related to climate change and climate change-related regulation may adversely impact TPG Rise Climate, our dedicated climate impact investing product or other funds, or their investments, that may be subject to regulatory or disclosure requirements.
New climate change-related regulations or interpretations of existing laws may result in enhanced disclosure obligations and changes to tax and permitting requirements, which could negatively affect us or our portfolio companies and materially increase our regulatory burden. Increased regulations generally increase our costs, and we could continue to experience higher costs if new laws and regulatory requirements require us to spend more time, hire additional personnel or buy new technology to comply effectively. In particular, compliance with climate- and other ESG-related rules, including in the EU, is expected to result in increased legal and compliance costs and expenses which would be borne by us and our funds. See “—Risks Related to Our Business—We are subject to increasing scrutiny from fund investors and regulators on ESG matters, which may constrain investment opportunities for our funds and negatively impact our ability to raise capital from such investors.” At the portfolio company level, while we have increasingly and substantially sought to invest in sectors that are inherently lower carbon intensity (e.g., technology, healthcare) which decreases some exposure to transition risk, there are still individual portfolio companies in these and other sectors that could face transition risks related to carbon-related regulations or taxes if such measures are implemented. Further, advances in climate science may change society’s understanding of sources and magnitudes of negative effects on climate, which could negatively impact portfolio company financial performance and regulatory jeopardy.
In addition, TPG faces business trend-related climate risks including the increased attention to climate-related legislation and regulation by our fund investors. Certain fund investors have considered ESG factors, including climate risks, in determining whether to invest in our funds. See “—Risks Related to Our Business—We are subject to increasing scrutiny from fund investors and regulators on ESG matters, which may constrain investment opportunities for our funds and negatively impact our ability to raise capital from such investors.” For our portfolio companies, business trends related to climate change may require capital expenditures, product or service redesigns, and changes to operations and supply chains to meet changing customer expectations. While this can create opportunities, not addressing these changed expectations could create business risks for portfolio companies, which could negatively impact the returns in our funds.
Further, significant physical effects of climate change including extreme weather events such as hurricanes or floods, can also have an adverse impact on certain of our portfolio companies and investments, especially our real asset investments and portfolio companies that rely on physical factories, plants or stores located in the affected areas. As the effects of climate change increase, we expect the frequency and impact of weather and climate related events and conditions to increase as well. For example, unseasonal or violent weather events can have a material impact to businesses or properties that focus on tourism or recreational travel.
While the geographic distribution of our portfolio diversifies TPG’s physical climate risk, some physical risk is inherent in the companies in our portfolio, particularly in some real estate holdings and Asia- and Africa-based investments and in the unknown potential for extreme weather that could occur related to climate change.
We expect TPG Rise Climate to face climate-related risks of a different nature. For example, an absence of future regulation, particularly in the United States, the U.K. and the European Union, around climate change and carbon output control could lead to diminished market demand in TPG Rise Climate’s investment sectors. Additionally, implementation of the Paris Agreement and other climate-related initiatives by international, federal, state and regional policymakers and regulatory authorities and the pace of private actors seeking to reduce greenhouse gas emissions are uncertain. Uneven or slow implementation could negatively impact the speed of growth for the companies in TPG Rise Climate. Further, non-implementation could negatively impact the fund overall. In addition, different jurisdictions could classify investments made by TPG Rise Climate differently in terms of their sustainability, and thereby could open some assets to so-called transition risks.
Difficult economic and market conditions could negatively impact our businesses in many ways, including by reducing the value or hampering the performance of our funds’ investments or reducing our funds’ ability to raise or deploy capital, each of which could have a material adverse effect on our results of operations, financial condition and cash flow.
Our business is materially affected by conditions in the global financial markets and economic conditions or events throughout the world that are outside of our control, such as fluctuating interest rates, availability of credit, inflation rates, economic uncertainty, changes in laws (including laws relating to taxation and regulations on the financial industry), pandemics or other severe public health events, trade barriers, commodity prices, currency exchange rates and controls, national and international political circumstances (including government shutdowns, wars, terrorist acts or security operations) and the effects of climate change. Recently, markets have been affected by U.S. interest rates, slower economic growth or recession, inflation, the imposition of trade barriers, ongoing trade negotiations with major U.S. trading partners, changes in U.S. tax regulations and geopolitical events such as the ongoing war in Ukraine and conflicts in the Middle East. These conditions, events and factors are outside our control and may affect the level and volatility of securities prices and the liquidity and the value of investments, and we may not be able to or may choose not to manage our exposure to them.
Volatility in the global financial markets or a financial downturn could negatively impact our business in a number of ways. Volatility or unfavorable market and economic conditions could reduce opportunities for our funds to make, exit and realize value from, and expected returns on, their existing investments. When financing is not available or becomes too costly, it is difficult for potential buyers to raise sufficient capital to purchase our funds’ investments, and we may earn lower-than-expected returns on them, which could cause us to realize diminished or no performance allocations. Further, volatility caused by the COVID-19 pandemic or future pandemics could continue to have a greater negative effect on industries that are more sensitive to changes in consumer demand, such as the travel and leisure, gaming and real estate industries. If not otherwise offset, declines in the equity, debt and commodity markets would likely cause us to write down our funds’ investments. Our profitability may also be negatively impacted by our fixed costs and the possibility that we would be unable to scale back other costs within a time frame sufficient to match any decreases in net income relating to a downturn in market and economic conditions.
During periods of difficult market conditions or slowdowns, our funds’ portfolio companies or assets in which we have invested may experience adverse operating performance, decreased revenues, financial losses, credit rating downgrades, difficulty in obtaining access to financing and increased funding costs. These companies may also have difficulty expanding their businesses and operations, meeting their debt service obligations or paying other expenses as they become due, including amounts payable to us. Negative financial results in our funds’ portfolio companies could result in less appreciation across the portfolio and lower investment returns for our funds. Because our funds generally make a limited number of investments, negative financial results in a few of a fund’s portfolio companies could severely impact the fund’s total returns, which could negatively affect our ability to raise new funds, the performance allocations we receive and the value of our investments. Further, such negative market conditions could potentially result in a portfolio company entering bankruptcy proceedings, or in the case of certain real estate funds, the abandonment or foreclosure of investments, which could result in a complete loss of the fund’s investment in such portfolio company and negatively impact the fund’s performance and, consequently, the performance allocations we receive and the value of our investment, as well as our reputation.
Receipt of lower investment returns from our funds during a period of difficult market conditions could cause our cash flow from operations to significantly decrease, which could negatively impact our liquidity position and the amount of cash we have on hand to conduct our operations and pay dividends to our stockholders. The generation of less performance allocations could also affect our leverage ratios, external credit ratings and compliance with our credit facility covenants as well as our ability to renew or refinance all or part of our credit facility and contractual obligations. Having less cash on hand could in turn require us to rely on other sources of cash, such as the capital markets, to conduct our operations.
In addition, volatility or unfavorable market and economic conditions could make it difficult for our funds to find suitable investments or secure financing for investments on attractive terms. Heightened equity and credit market volatility could negatively impact availability and cost of financing for significant acquisitions and dispositions. If credit markets weaken, our funds may be unable to consummate significant acquisitions and dispositions on acceptable terms or at all. A general slowdown in global merger and acquisition activity due to the lack of suitable financing or an increase in uncertainty could slow in our investment pace, which in turn could negatively impact our ability to generate future performance allocations and fully invest the available capital in our funds. A slowdown in the deployment of our available
capital could impact the management fees we earn on funds that generate fees based on invested (and not committed) capital, including our ability to raise, and the timing of raising, successor funds.
Market volatility could also negatively impact our fundraising efforts in several ways. We generally raise capital for a successor fund following the substantial and successful deployment of capital from the existing fund. Poor performance by existing funds as a result of market conditions could impair our ability to raise new funds as could any change in or rebalancing of fund investors’ asset allocation policies. Investors often allocate to alternative asset classes (including private equity) based on a target percentage of their overall portfolio. If the value of an investor’s portfolio decreases as a whole, the amount available to allocate to alternative assets (including private equity) could decline. Further, investors often take into account the amount of distributions they have received from existing funds when considering commitments to new funds. General market volatility or a reduction in distributions to investors could cause investors to delay making new commitments to funds or negotiate for lower fees, different fee sharing arrangements for transaction or other fees and other concessions. The outcome of such negotiations could result in our agreement to terms that are materially less favorable to us than for prior funds we have managed, and a decrease in the amount an investor commits to our funds could have an impact on the ultimate size of the fund and amount of management fees we generate.
Extensive regulation of our businesses affects our activities and creates the potential for significant liabilities and penalties. Increased regulatory focus on the alternative asset industry or legislative or regulatory changes could result in additional burdens and expenses on our business.
Our business is subject to extensive regulation, including periodic examinations, by governmental agencies and self-regulatory organizations in the jurisdictions in which we operate around the world. Many of these regulators, including U.S. and foreign government agencies and self-regulatory organizations, are empowered to conduct investigations and administrative proceedings that can result in fines, suspensions of personnel or other sanctions, including censure, the issuance of cease-and-desist orders or the suspension or expulsion of a broker-dealer or investment adviser from registration or memberships. If the SEC or any other governmental authority, regulatory agency or similar body takes issue with our past practices, including, for example, past investment and co-investment activities, internal operating policies and procedures or arrangements with our people, including our senior advisors, we will be at risk for regulatory sanction. Even if an investigation or proceeding does not result in a significant sanction, the costs incurred in responding to such matters could be material. Further, the adverse publicity relating to the investigation, proceeding or imposition of these sanctions could harm our reputation and cause us to lose existing investors or clients or fail to attract new investors or clients, as well as discourage others from doing business with us. Some of our funds invest in businesses that operate in highly regulated industries. The regulatory regimes to which such businesses are subject may, among other things, condition our funds’ ability to invest in those businesses upon the satisfaction of applicable ownership restrictions or qualification requirements for receipt of regulatory approval. Obtaining regulatory approval is often a lengthy and expensive process with an uncertain outcome. Portfolio companies may be unable to obtain necessary regulatory approvals on a timely basis, if at all, and the failure to obtain such approvals may prevent our funds from consummating the applicable investments, which could materially and adversely affect their performance. Our failure to obtain or maintain any regulatory approvals necessary for our funds to invest in such industries may disqualify our funds from participating in certain investments or require our funds to divest certain assets.
In recent years, the SEC and its staff have focused on issues relevant to global investment firms and have formed specialized units devoted to examining such firms and, in certain cases, bringing enforcement actions against the firms, their principals and their employees. Such actions and settlements involving U.S.-based private fund advisers generally have involved a number of issues, including the undisclosed allocation of the fees, costs and expenses related to unconsummated co-investment transactions (i.e., the allocation of broken deal expenses), undisclosed legal fee arrangements affording the adviser greater discounts than those afforded to funds advised by such adviser and the undisclosed acceleration of certain special fees. We have in the past and may in the future be subject to SEC enforcement actions and settlements. Recent SEC focus areas have also included the use and compensation of, and disclosure regarding, operating partners or consultants, outside business activities of firm principals and employees, group purchasing arrangements, management fee calculations, general conflicts of interest disclosures and cybersecurity. The SEC has also commenced an industry-wide review of alternative asset manger’s maintenance and preservation of electronic communications, of which we are a part. See Note 17, “Commitments and Contingencies—Legal Actions and Other Proceedings.” We generally expect the SEC’s oversight of global investment firms to continue to focus on concerns related to transparency, investor disclosure practices, fees and expenses, valuation, compliance policies and procedures and conflicts of interest, which could impact us in various ways. We further expect a continued greater level of SEC enforcement activity under the Biden administration, and while we have a robust compliance program in place, it is possible this enforcement activity will target practices that we believe are compliant and that were not targeted by the prior
administration. We regularly are subject to requests for information and informal or formal investigations by the SEC and other regulatory authorities, with which we routinely cooperate and, in the current environment, even historical practices that have been previously examined are being revisited.
In August 2023, the SEC adopted new rules and amendments to existing rules under the Advisers Act (collectively, the “Private Fund Rules”) specifically related to registered and non-registered advisers and their activities with respect to private funds. The Private Fund Rules will impose new and substantial requirements on advisers to private funds, including us, and are expected to significantly impact our business and operations. In particular, the Private Fund Rules:
•require quarterly reporting by private funds to investors concerning performance, fees, expenses and compensation paid to the adviser;
•require registered advisers to obtain an annual audit for a private fund;
•enhance requirements, including the need to obtain a fairness opinion and make certain disclosures, in connection with adviser-led secondary transactions (also known as GP-led secondaries);
•prohibit advisers from engaging in certain fee and expense practices without either disclosure or consent from investors, as applicable, such as charging to private fund clients fees and expenses associated with an examination or investigation of the adviser, or regulatory and compliance fees and expenses of the adviser, and charging fees or expenses related to a portfolio investment on a non-pro rata basis;
•prohibit an adviser from reducing the amount of its clawback of carried interest by the amount of certain taxes without disclosure to investors; and
•prohibit certain preferential treatment of private fund investors and require disclosure of other forms of preferential treatment of private fund investors in side letters or other arrangements with an adviser.
Amendments to the existing books and records and compliance rules under the Advisers Act complement the Private Fund Rules and also require that all registered advisers document their annual compliance review in writing. Proposed amendments to Regulation S-P issued in March 2023 would, if adopted, apply safeguarding requirements directly to investment advisers that manage private funds. The compliance burdens and associated costs for us and our funds are expected to increase as a result of the Private Fund Rules. Many provisions of the Private Funds Rules will require us to make a variety of subjective determinations as to whether and how such rules apply to our funds and our related obligations. We will face conflicts of interest in making such determinations, which determinations may be questioned by a regulator. We will be subject to increased risk of exposure to additional regulatory scrutiny, litigation, censure and penalties for non-compliance or perceived non-compliance as a result of the Private Fund Rules, and any non-compliance or perceived non-compliance with such rules may negatively impact our reputation as well as our ability to raise capital and effectively execute on our investment activities. Certain elements of the Private Funds Rules will impact our ability to provide certain preferential treatment to investors, which may also impede our ability to raise capital.
Additionally, the SEC recently adopted an expansion of the reporting obligations under Form PF and changes to the beneficial ownership reporting regime applicable to positions in public companies. The SEC has also recently adopted amendments to the existing custody rule, which would, among other changes, expand the scope of assets that are subject to the rule, new rules prohibiting registered advisers from outsourcing certain services without first meeting minimum requirements, and new rules to address certain conflicts of interest associated with the use of predictive data analytics, such as artificial intelligence and machine learning with, if adopted, would require advisers to, among other things, eliminate or neutralize the effect of conflicts of interest associated with the adviser’s use of these technologies. The SEC has also included in its regulatory agenda potential rulemaking on climate change disclosures and corporate diversity. These newly adopted or proposed rules are expected to increase compliance burdens and associated regulatory costs and complexity and impose limitations on our investing activities. In addition, even if not adopted, evaluating and responding to proposed rules could result in increased costs and require significant attention from management, and the new or proposed rules enhance the risk of regulatory action, which could adversely impact our reputation and our fundraising efforts, including as a result of public regulatory sanctions.
We regularly rely on exemptions from various requirements of the Securities Act, Exchange Act, the Investment Company Act, the Commodity Exchange Act of 1936, as amended, and the U.S. Employee Retirement Income Security Act of 1974, as amended, or “ERISA,” in conducting our asset management activities in the United States. If these
exemptions were to become unavailable to us, we could become subject to regulatory action or third-party claims, and our business could be negatively impacted. For example, in 2014, the SEC amended Rule 506 of Regulation D under the Securities Act, an exemption on which we routinely rely to market interests in our funds, to impose “bad actor” disqualification provisions that ban an issuer from offering or selling securities pursuant to the safe harbor in Rule 506 if the issuer, or any other “covered person,” is the subject of a criminal, regulatory or court order or other disqualifying event under the rule which has not been waived by the SEC. The definition of “covered person” under the rule includes an issuer’s directors, general partners, managing members and executive officers; affiliates who are also issuing securities in the offering; beneficial owners of 20% or more of the issuer’s outstanding equity securities; and promoters and persons compensated for soliciting investors in the offering. Accordingly, we would be unable to rely on Rule 506 to offer or sell securities if we or any “covered person” is the subject of a disqualifying event under the rule and we are unable to obtain a waiver from the SEC.
Similarly, in conducting our asset management activities outside the United States, we rely on exemptions from the regulatory regimes of various foreign jurisdictions. Exemptions from U.S. and foreign regulations are often highly complex and may, in certain circumstances, depend on compliance by third parties we do not control. If these exemptions were to become unavailable to us, our business could be negatively impacted, as these regulations often serve to limit our activities and impose burdensome compliance requirements. See “Item 1. Business—Regulation and Compliance.” Moreover, the requirements imposed by our regulators are designed primarily to ensure the integrity of the financial markets and to protect our fund investors and not our stockholders.
Changes in the U.S. political environment and financial regulatory changes in the United States could negatively impact our business.
The current U.S. political environment and the resulting uncertainties regarding actual and potential shifts in U.S. foreign investment, trade, taxation, economic, environmental and other policies under the Biden administration could lead to disruption, instability and volatility in the global markets. The consequences of previously enacted legislation could also impact our business operations in the future. For example, bipartisan legislation enacted in August 2018 has increased and may continue to significantly increase the number of transactions that are subject to the jurisdiction of the Committee on Foreign Investment in the United States (the “CFIUS”), which has the authority to review and potentially block or impose conditions on certain foreign investments in U.S. companies or real estate. CFIUS’ expanded jurisdiction may reduce the number of potential buyers of certain of our funds’ portfolio companies and thus limit the ability of our funds to exit from certain investments, as well as limit our flexibility in structuring or financing certain transactions. On August 16, 2022, the U.S. government enacted the Inflation Reduction Act of 2022 which, among other things, includes changes to the U.S. corporate income tax system, including a 15% minimum tax based on “adjusted financial statement income” for certain large corporations and a 1% excise tax on share repurchases. Such changes could materially increase the taxes imposed on us or our funds’ portfolio companies. See “—Risks Related to Taxation—Changes in relevant tax laws, regulations or treaties or an adverse interpretation of these items by tax authorities could negatively impact our effective tax rate and tax liability.” Further, negative public sentiment could lead to heightened scrutiny and criticisms of our business model generally, or our business and investments in particular.
The Dodd-Frank Wall Street Reform and Consumer Protection Act (the “Dodd-Frank Act”), enacted in 2010, has imposed significant changes on almost every aspect of the U.S. financial services industry, including aspects of our business. On May 24, 2018, the Economic Growth, Regulatory Relief and Consumer Protection Act (the “Reform Act”) was signed into law. The Reform Act amends various sections of the Dodd-Frank Act.
The Reform Act and various other proposals focused on deregulation of the U.S. financial services industry could have the effect of increasing competition or otherwise reducing investment opportunities, which could negatively impact our business. The Reform Act also modified automatic additional regulatory compliance issues for financial entities that were deemed “Systemically Important Financial Institutions” from $50 billion AUM to $250 billion AUM. There is legislative risk under the Biden administration that such designation will revert back to $50 billion and expand its application to include private equity asset management firms.
Under applicable SEC rules, investment advisers are required to implement compliance policies designed, among other matters, to track campaign contributions by certain of the adviser’s employees and engagements of third parties that solicit government entities and to keep certain records to enable the SEC to determine compliance with the rule. In addition, there have been similar rules on a state level regarding “pay to play” practices by investment advisers. FINRA adopted its own set of “pay to play” regulations, which went into effect on August 20, 2017, that are similar to the SEC’s regulations. In addition, many pay to play regimes (including the SEC pay to play rule for investment advisers) impute the
personal political activities of certain executives and employees, and in some instances their spouses and family members, to the manager for purposes of potential pay to play liability.
The Dodd-Frank Act also imposes a regulatory structure on the “swaps” market, including requirements for clearing, exchange trading, capital, margin, reporting and recordkeeping. The Commodity Futures Trading Commission (the “CFTC”) has finalized many rules applicable to swap market participants, including business conduct standards for swap dealers, reporting and recordkeeping, mandatory clearing for certain swaps, exchange trading rules applicable to swaps, initial and variation margin requirements for uncleared swap transactions and regulatory requirements for cross-border swap activities. These requirements could reduce market liquidity and negatively impact our business, including by reducing our ability to enter swaps.
The Dodd-Frank Act authorizes federal regulatory agencies to review and, in certain cases, prohibit compensation arrangements at financial institutions that give employees incentives to engage in conduct deemed to encourage inappropriate risk taking by covered financial institutions. In May 2016, the SEC and other federal regulatory agencies proposed a rule that would apply requirements on incentive-based compensation arrangements of “covered financial institutions,” including certain registered investment advisers and broker-dealers above a specific asset threshold. This, if adopted, could limit our ability to recruit and retain investment professionals and senior management executives. However, the proposed rule remains pending and may be subject to significant modifications.
Furthermore, negative public sentiment could lead to heightened scrutiny and criticisms of our business model generally, or our business and investments in particular. For example, in June 2019, certain members of the U.S. Congress introduced the Stop Wall Street Looting Act of 2019, a comprehensive bill intended to fundamentally reform the private equity industry. Following the 2020 presidential and congressional elections in the United States, there has been an increased risk of legislative and regulatory action that could adversely limit and affect our and our funds’ portfolio companies’ businesses. In August 2021, legislation was introduced in the Senate proposing to change the definition of carried interest. The “Ending the Carried Interest Loophole Act” proposed to close the tax rate differential between carried interests and ordinary income and accelerate the recognition and payment of tax on the receipt of carried interest and would have material impact on our business if enacted. Other potential changes in legislation or regulation may include higher corporate tax rate, greater scrutiny on the private equity industry or elimination of carried interest or limitations of the capital gains tax. If the proposed bills or parts thereof, or other similar legislation, were to become law, it could negatively impact affect us, our funds’ portfolio companies and our investors.
Future legislation, regulation or guidance could negatively impact the fund industry generally and/or us specifically. Financial services and private funds may in the future be subject to further governmental scrutiny, an increase in regulatory investigations and/or enhanced regulation, including as a result of changes in the presidency or congressional leadership. Any changes in the regulatory framework applicable to our business, including the changes described above, may impose additional compliance and other costs on us, require the attention of our senior management or result in limitations on the manner in which we conduct our business, all of which could negatively impact our profitability.
Changing regulations regarding derivatives and commodity interest transactions could negatively impact our business.
The regulation of derivatives and commodity interest transactions in the United States and other countries is a rapidly changing area of law and is subject to ongoing modification by governmental and judicial action. We and our affiliates enter into derivatives transactions for various purposes, including to manage the financial risks related to our business. Accordingly, the impact of this evolving regulatory regime on our business is difficult to predict, but it could be substantial and adverse.
Managers of certain pooled investment vehicles with exposure to certain types of derivatives may be required to register with the CFTC as commodity pool operators and/or commodity trading advisors and become members of the National Futures Association. As such, certain of our or our affiliates’ risk management or other commodities interest-related activities may be subject to CFTC oversight. To date, we have concluded that the covered activities in which our affiliates engage do not rise to the level of requiring the subsidiaries to register with the CFTC or become members of the National Futures Association, or the “NFA,” and instead, these affiliates rely on exemptions from such registration requirements. As part of ensuring the affiliates continue to be exempt from registration, we have instituted procedures to monitor our exposure to covered activities and comply with exemption renewal requirements. In the event that the frequency of our affiliates’ engagement in covered activities exceeds the threshold for exemption from registration, such affiliates could become subject to a wide range of other regulatory requirements, such as reporting, recordkeeping and operational requirements as well as periodic examinations.
Newly instituted and amended regulations could significantly increase the cost of entering into derivative contracts (including through requirements to post collateral, which could negatively impact our available liquidity), materially alter the terms of derivative contracts, reduce the availability of derivatives to protect against risks that we encounter, reduce our ability to restructure our existing derivative contracts and increase our exposure to less creditworthy counterparties. If we reduce our use of derivatives as a result of such regulations (and any new regulations), our results of operations may become more volatile and our cash flows may be less predictable.
Federal, state and foreign anti-corruption and trade sanctions laws applicable to us, our funds and our funds’ portfolio companies create the potential for significant liabilities and penalties, the inability to complete transactions and reputational harm.
We are subject to a number of laws and regulations governing payments, offers and contributions to or for the benefit of public officials or other parties, including restrictions imposed by the FCPA, as well as economic sanctions and export control laws administered by OFAC, the U.S. Department of Commerce and the U.S. Department of State. The FCPA prohibits bribery of foreign public officials, government employees and political parties and requires public companies in the United States to keep books and records that accurately and fairly reflect their transactions. The U.S. Department of Commerce and the U.S. Department of State administer and enforce certain export control laws and regulations, and OFAC and the U.S. Department of State administer and enforce economic sanctions based on U.S. foreign policy and national security goals against targeted countries, jurisdictions, territories, regimes, entities, organizations and individuals. These laws and regulations relate to a number of aspects of our businesses, including servicing existing fund investors, finding new fund investors and sourcing new investments, as well as the activities of our funds’ portfolio companies. U.S. government regulators, including the U.S. Department of Justice, the SEC and OFAC, have devoted more resources to enforcement of the FCPA and export control laws as enforcement has become more of a priority in recent years. A number of other countries, including countries where we and our funds’ portfolio companies maintain operations or conduct business, have also expanded significantly their enforcement activities, especially in the anti-corruption area. Recently, the U.S. government has also used sanctions and export controls to address broader foreign and international economic policy goals. While we have developed and implemented policies and procedures designed to ensure compliance by us and our personnel with the FCPA, economic sanctions laws and other applicable anti-bribery laws, as well as with sanctions and export control laws, such policies and procedures may not be effective in all instances to prevent violations. Any determination that we have violated these laws could subject us to, among other things, civil and criminal penalties, material fines, profit disgorgement, injunctions on future conduct, securities litigation, disbarment and a general loss of investor confidence, any one of which could have a material adverse effect on our results of operations, financial condition and cash flow.
Laws in non-U.S. jurisdictions as well as other applicable anti-bribery, anti-corruption, anti-money laundering, economic sanctions or other export control laws abroad, may also impose stricter or more onerous requirements than the FCPA, OFAC, the U.S. Department of Commerce and the U.S. Department of State, and implementing them may disrupt our business or cause us to incur significantly more costs to comply with those laws. Differences between such U.S. and non-U.S. laws increase the risks and complexities of compliance and sometimes present actual conflicts of law (especially in the sanctions area). For example, in the U.K., we are subject to laws regarding the prevention of money laundering and the financing of terrorism as well as laws prohibiting bribery, including the U.K. Bribery Act 2010. We cannot predict the nature, scope or effect of future regulatory requirements to which we might be subject or the manner in which existing laws might be administered, interpreted or enforced. Our funds’ portfolio companies’ compliance policies and procedures may not prevent all instances of money laundering or bribery, or other prohibited transactions, including those arising from actions by employees, for which we or they might be held responsible. If we fail to comply with this multitude of laws and regulations, even where conflicts of law arise, we could be exposed to claims for damages, civil or criminal penalties, reputational harm, incarceration of our employees, restrictions on our operations (including disbarment) and other liabilities, which could have a material adverse effect on our results of operations, financial condition and cash flow. In addition, depending on the circumstances, we could be liable for violations of applicable anti-corruption, sanctions or export control laws committed by companies in which we or our funds invest.
In addition, the recently enacted Foreign Investment Risk Review Modernization Act (“FIRRMA”) and related regulations significantly expanded the types of transactions that are subject to the jurisdiction of the CFIUS. Under the FIRRMA, the CFIUS has the authority to review and potentially block or impose conditions on certain foreign investments in U.S. companies or real estate, which may reduce the number of potential buyers and limit the ability of our funds to exit from certain investments. In addition, we may be subject to successor liability for FCPA violations or other acts of bribery, or violations of applicable sanctions or other export control laws, committed by companies in which we or our funds invest or which we or our funds acquire. Allegations that our funds’ portfolio companies engaged in conduct that is perceived to
have violated anti-corruption laws, economic sanctions laws, or export control laws could negatively impact us, create legal liability, or cause reputational and business harm that could negatively impact the valuation of a fund’s investments.
Regulatory initiatives in jurisdictions outside the United States could negatively impact our business.
Similar to the United States, the current environment in non-U.S. jurisdictions in which we operate, in particular the EU and the U.K., has become subject to an expanding body of regulation. Governmental regulators and other authorities have proposed or implemented a number of initiatives and additional rules and regulations that could negatively impact our business.
AIFMD. The Alternative Investment Fund Managers Directive (“AIFMD”), as implemented in each member state of the European Economic Area (“EEA”) and as implemented and retained by the U.K. following its departure from the EU, imposes certain initial and ongoing regulatory obligations with respect to the marketing of alternative investment funds to investors domiciled in the EEA or the U.K. or with a registered office or otherwise based in the EEA or the U.K. by alternative investment fund managers. AIFMD, as implemented in the EEA and U.K., applies to us to the extent that we actively market our funds to investors in the EEA and U.K. We may also be required to comply with additional obligations under the AIFMD to the extent we perform delegated portfolio management services with respect to an E.U.-based alternative investment fund. AIFMD is currently under review by the European Commission and negotiations to reach the final amended text are currently ongoing. It is therefore difficult at this time to predict the final form of the changes to AIFMD but they may, amongst other things, increase the cost and complexity of raising capital. It is not yet clear to what extent (if any) the U.K. would reflect any changes to AIFMD in its domestic rules.
Anti-Money Laundering. During 2020, two new EU Anti-Money Laundering (AML) Directives came into force: the fifth AML EU Directive (“AMLD5”) and the sixth AML EU Directive (“AMLD6”). AMLD5 was implemented into U.K. law on January 10, 2020. The changes under AMLD5 include new, more stringent customer due diligence measures and reporting requirements. AMLD5 has added complexity to our internal processes and any perceived shortcomings in our adoption of AMLD5 could create reputational risks to our business. AMLD6 harmonizes the definition of money laundering across the EU, expands the number of offenses that fall under the definition of money laundering and extends criminal liability to include punishments for legal persons. The U.K. government has not implemented AMLD6 for the time being.
Information Reporting Requirements. Many countries have significantly increased their information reporting regimes over the past few years. On 25 May 2018 the EU Council adopted a directive (2018/822 amending Directive 2011/16/EU as regards mandatory automatic exchange of information in the field of taxation in relation to reportable cross-border arrangements) that imposes a reporting obligation on parties involved in transactions that may be associated with aggressive tax planning (“DAC6”).
ESG risk management. Regulation (EU) 2019/2088 of the European Parliament and of the Council of 27 November 2019 on sustainability‐related disclosures in the financial services sector (the “SFDR”), which captures this Fund, defines “sustainability risks” as environmental, social or governance events or conditions that, if they occur, could cause an actual or a potential material negative impact on the value of an investment. TPG, the AIFM, the Fund, the Fund’s portfolio companies, and other parties, such as service providers or the Fund or portfolio company counterparties, may be negatively affected by sustainability risks. If appropriate for an investment, the AIFM (or its delegate) may conduct sustainability risk-related due diligence and/or take steps to mitigate sustainability risks and preserve the value of the investment; however, there can be no assurance that all such risks will be mitigated in whole or in part, nor identified prior to the date the risk materializes. TPG, the AIFM (or its delegate), the Fund, the Fund’s portfolio companies, and other parties may maintain insurance to protect against certain sustainability risks, where available on reasonable commercial terms, although such insurance is subject to customary deductibles and coverage limits and may not be sufficient to recoup all losses. Sustainability risks may therefore adversely affect the performance of the Fund and its investments.
SFDR. Funds that raise capital across one or more European Member States must comply with the EU’s detailed sustainability-related disclosure regime. In particular (and as relevant for the Fund), the SFDR requires certain disclosures in relation to whether and, if so, how sustainability risks are taken into account in the investment process. In addition, for those financial products that have a sustainable investment objective or which promote environmental or social characteristics, there is an obligation to disclose such an objective or characteristics in pre-contractual disclosures and report on an ongoing basis their performance in achieving those commitments, among other requirements. In addition, on June 22, 2020, the Official Journal of the European Union published a classification system that establishes a list of environmentally sustainable economic activities and sets out four overarching conditions that an economic activity has to
meet in order to qualify as environmentally sustainable (Regulation (EU) 2020/852 of the European Parliament and of the Council of 18 June 2020 on the establishment of a framework to facilitate sustainable investment, and amending Regulation (EU) 2019/2088, “Taxonomy Regulation”). The Taxonomy Regulation, amongst other things, introduces mandatory disclosure and reporting requirements and supplements the framework set out in the SFDR. The SFDR regime and Taxonomy Regulation are evolving and subject to ongoing interpretation by regulators.
The disclosure requirements in the SFDR are supplemented by the Commission Delegated Regulation (EU) 2022/1288 of 6 April 2022 supplementing Regulation (EU) 2019/2088 of the European Parliament and of the Council with regard to regulatory technical standards specifying the details of the content and presentation of the information in relation to the principle of ‘do no significant harm’, specifying the content, methodologies and presentation of information in relation to sustainability indicators and adverse sustainability impacts, and the content and presentation of the information in relation to the promotion of environmental or social characteristics and sustainable investment objectives in pre-contractual documents, on websites and in periodic reports.
The European Securities and Markets Association published its Consultation Paper on Guidelines on funds’ names using ESG or sustainability-related terms in February 2023, which was subsequently updated through its Public Statement on 14 December 2023. The guidelines and related public statement both specify minimum requirements for the portfolio composition of funds using ESG or sustainability-related terms in their name. Such requirements include (but are not limited to) exclusions in respect of businesses in the oil and gas value chain. Once finalized and effective, the guidelines may apply to funds which have closed to investment and that changes to the investment portfolio of the Fund may be necessary.
Comparable national regimes to the SFDR. In recent years, several other regulators (including in the United States and the UK) have announced upcoming regulatory initiatives requiring ESG-related disclosures, and sustainability related labels and marketing. For instance, on November 28, 2023, the UK Financial Conduct Authority published PS23/16, the FCA’s Policy Statement on the Sustainability Disclosure Requirements and investment labels and GC23/3, the Guidance on the UK Anti-Greenwashing Rule (the latter of which captures all FCA-authorised firms).
UK TCFD reporting. Further, the U.K. Government’s stated policy goal is to introduce economy-wide mandatory Taskforce on Climate-related Financial Disclosures (“TCFD”) reporting by 2025. The U.K. is in the process of introducing mandatory TCFD-aligned disclosure requirements for U.K. firms. The regime captures (amongst others) any firm providing portfolio management (which includes managing investment or private equity or other private market activities consisting of either advising on investments or managing investments on a recurring or ongoing basis in connection with an arrangement which aims to invest in unlisted securities) where the assets under management exceed £5 billion calculated as a three-year rolling average.
Corporate Sustainability Due Diligence Directive. On February 23, 2022, the European Commission published its proposal for the Corporate Sustainability Due Diligence Directive (“CSDD”), which if adopted, will intensify scrutiny of human rights and environmental diligence systems for companies. Compliance with the CSDD will likely create an additional compliance burden and increased legal, compliance, governance, reporting and other costs because of the need to collect certain information from portfolio companies to meet the reporting requirements.
Corporate Sustainability Reporting Directive. On January 5, 2023, the Corporate Sustainability Reporting Directive (Directive (EU) 2022/2464 of the European Parliament and of the Council of 14 December 2022 amending Regulation (EU) No 537/2014, Directive 2004/109/EC, Directive 2006/43/EC and Directive 2013/34/EU, regarding corporate sustainability reporting (the “CSRD”) came into force. The CSRD introduces more detailed sustainability reporting requirements, including but not limited to, climate and environmental issues and factors related to social and corporate governance, such as equality, human rights and fair working conditions. In addition, CSRD requires external auditing and assurance of sustainability reports and is expected to implement mandatory ESG standards with more detailed reporting requirements. Compliance with the CSRD will create an additional compliance burden and likely increase legal, compliance, governance, reporting and other costs.
Compliance with frameworks of this nature may create an additional compliance burden and increased legal, compliance, governance, reporting and other costs to funds and/or fund managers and/or portfolio companies, including the Fund and TPG, because of the need to collect certain information to meet the disclosure requirements. In addition, where there are uncertainties regarding the operation of the framework, a lack of official, conflicting or inconsistent regulatory guidance, a lack of established market practice and/or data gaps or methodological challenges affecting the ability to collect relevant data, funds and/or fund managers may be required to engage third party advisors and/or service providers to fulfil the requirements, thereby exacerbating any increase in compliance burden and costs. Compliance with requirements of this nature also increase risks relating to financial supervision and enforcement action. To the extent that any applicable
jurisdictions enact similar laws and/or frameworks, there is a risk that the Fund may not be able to maintain alignment of a particular investment with such frameworks, and/or may be subject to additional compliance burdens and costs, which might adversely affect the investment returns of the Fund.
Leveraged Transactions. In May 2017, the European Central Bank (“ECB”) issued guidance on leveraged transactions that applies to significant credit institutions supervised by the ECB in member states of the euro zone (i.e., those EU member states that have adopted the euro as their currency). Under the guidance, credit institutions should have in place internal policies that include a definition of “leveraged transactions.” Loans or credit exposures to a borrower should be regarded as leveraged transactions if (i) the borrower’s post-financing level of leverage exceeds a total debt to EBITDA ratio of 4.0 times or (ii) the borrower is owned by one or more “financial sponsors.” For these purposes, a financial sponsor is an investment firm that undertakes private equity investments in and/or leveraged buyouts of companies. Following these guidelines, credit institutions in the euro zone could in the future limit, delay or restrict the availability of credit and/or increase the cost of credit for our funds or our funds’ portfolio companies involved in leveraged transactions.
Foreign Direct Investment. A number of jurisdictions continue to establish or strengthen restrictions on foreign direct investment. These countries often authorize their heads of state and/or regulatory bodies to block or impose conditions on certain transactions, such as investments, acquisitions and divestitures, if they threaten national security. In addition, many jurisdictions restrict foreign investment in assets important to national security by taking steps such as limiting foreign equity investment, implementing investment screening or approval mechanisms and restricting foreigners from serving as key personnel. These laws could limit our funds’ ability to make or exit investments or impose burdensome notification requirements, operational restrictions or delays in pursuing and consummating transactions.
Hong Kong Security Law. On June 30, 2020, the National People’s Congress of China passed a national security law (the “National Security Law”), which criminalizes certain offenses, including secession, subversion of the Chinese government, terrorism and collusion with foreign entities. The National Security Law also applies to non-permanent residents. Although the extra-territorial reach of the National Security Law remains unclear, there is a risk that its application to conduct outside the Hong Kong Special Administrative Region of the People Republic of China (“Hong Kong”) by non-permanent residents of Hong Kong could limit the activities of or negatively impact us, our funds and/or our funds’ portfolio companies. The United States, the United Kingdom and several EU countries have expressed concerns regarding the National Security Law. The United States and other countries may take action against China, its leaders and leaders of Hong Kong, which may include the imposition of sanctions. Escalation of tensions resulting from the National Security Law, including conflict between China and other countries, protests and other government measures, as well as other economic, social or political unrest in the future, could negatively impact the security and stability of the region and have a material adverse effect on countries in which we, our funds and our funds’ portfolio companies or any of their respective personnel or assets are located. While we maintain offices in Hong Kong and our funds invest in portfolio companies that operate in Hong Kong or are currently or expected to be listed on the Stock Exchange of Hong Kong (which investments comprise approximately 3% of our AUM), none of our funds invests exclusively in Hong Kong; our Hong Kong operations, including our personnel and investments, do not represent a significant portion of our business; and our portfolio companies do not generally engage in commercial practices that would implicate the National Security Law. Nevertheless, the aforementioned risks, including an expansionary application of the National Security Law in unpredictable circumstances by the Chinese authorities, and any downturn in Hong Kong’s economy could negatively impact the industries in which we participate, negatively impact our, our funds’ or their portfolio companies’ operations and have a material adverse effect on our results of operations, financial condition and cash flow. See “—Risks Related to Our Business—Changes in China’s governmental policies could have an adverse effect on our business and operations.”
Data Privacy. We and our funds’ portfolio companies collect personally identifiable information and other sensitive and confidential data as an integral part of our business processes. Our compliance obligations include those relating to U.S. data privacy and security laws such as the California Consumer Privacy Act (the “CCPA”) and the California Privacy Rights Act (the “CPRA”), which provides for enhanced consumer protections for California residents, a private right of action for data breaches and statutory fines and damages for data breaches or other CCPA or CPRA violations, as well as a requirement of “reasonable” cybersecurity.
The adoption, interpretation and application of privacy laws or regulations in the U.S., EU (and its member states), the U.K. and elsewhere are often uncertain and in flux, and in some cases, laws or regulations in one country may be inconsistent with, or contrary to, those of another country. Federal, state, and foreign government bodies or agencies have in the past adopted, and may in the future adopt, laws and regulations affecting data privacy. Any of our U.S. operations may be impacted by a growing movement to adopt comprehensive privacy and data protection laws similar to the GDPR,
where such laws focus on privacy as an individual right in general. For example, the State of California has passed the CCPA. The CCPA generally applies to businesses that collect personal information about California consumers, and either meet certain thresholds with respect to revenue or buying and/or selling consumers’ personal information. The CCPA imposes stringent legal and operational obligations on such businesses as well as certain affiliated entities that share common branding. The CCPA is enforceable by the California Attorney General. Additionally, if unauthorized access, theft or disclosure of a consumer’s personal information occurs, and the business did not maintain reasonable security practices, consumers could file a civil action (including a class action) without having to prove actual damages. Statutory damages range from $100 to $750 per consumer per incident, or actual damages, whichever is greater. The California Attorney General also may impose civil penalties ranging from $2,500 to $7,500 per violation. Further, California passed the CPRA to amend and extend the protections of the CCPA. Under the CPRA, California will establish a new state agency focused on the enforcement of its privacy laws, likely leading to greater levels of enforcement and greater costs related to compliance with the CCPA and CPRA.
Other states in the U.S., have either passed, proposed or are considering similar laws and regulations to the CCPA and GDPR (such as the Nevada Privacy of Information Collected on the Internet from Consumers Act, which became effective on October 1, 2021, the Virginia Consumer Data Protection Act passed March 2, 2021, the Colorado Privacy Act passed on July 8, 2021, the Utah Consumer Privacy Act passed on March 24, 2022, and the Connecticut Data Privacy Act passed on May 10, 2022, all of which will become effective in 2023), which could impose similarly significant costs, potential liabilities and operational and legal obligations. Such laws and regulations are expected to vary from jurisdiction to jurisdiction, thus further increasing costs, operational and legal burdens, and the potential for significant liability on regulated entities.
Many foreign countries and governmental bodies, including the EU and other relevant jurisdictions where we and our funds’ portfolio companies conduct business, have laws and regulations concerning the collection and use of personally identifiable information and other data obtained from their residents or by businesses operating within their jurisdiction that are more restrictive than those in the United States. These more restrictive laws include, but are not limited to, the GDPR, as it forms part of the laws of England, Wales, Scotland and Northern Ireland by virtue of section 3 of the European Union (Withdrawal) Act 2018 (“UK GDPR”), the Hong Kong Personal Data (Privacy) Ordinance and the Australian Privacy Act. Privacy and cybersecurity laws in China, Hong Kong, Singapore, Korea, India and other jurisdictions may also impact data in those jurisdictions, including by requiring the localization of such data or subjecting such systems to intrusive governmental inspections. These legal and contractual arrangements heighten our privacy obligations in the ordinary course of conducting our business in the United States and internationally.
While we have made significant efforts and investment to develop policies and procedures to address data privacy laws, we potentially remain exposed to liability, particularly given the continued and rapid development of privacy laws and regulations around the world and increased enforcement action. Any inability, or perceived inability, by us or our funds’ portfolio companies to adequately address privacy concerns, or comply with applicable laws, regulations, policies, industry standards and guidance, contractual obligations, or other legal obligations, even if unfounded, could result in significant regulatory liability (for example, depending on the nature and severity of the breach (and with a requirement on regulators to ensure any enforcement action taken is proportionate), non-compliance with the GDPR and UK GDPR could (in the worst case) attract regulatory penalties up to the greater of: (i) €20 million / £17.5 million (as applicable); and (ii) 4% of an entire group’s total annual worldwide turnover, as well as the possibility of other enforcement actions), third-party liability, increased costs, disruption of our and our funds’ portfolio companies’ business and operations and loss of client (including investor) confidence and other reputational damage. Furthermore, as new privacy-related laws and regulations are implemented, the time and resources needed for us and our funds’ portfolio companies to comply with such laws and regulations continues to increase.
New prudential regimes for U.K. investment firms. The U.K. has implemented a new prudential regime for investment firms (which mirrors similar measures being implemented in the EU) known as the Investment Firms Prudential Regime (the “IFPR”). The IFPR applies to TPG Europe, LLP, our London-based affiliate (“TPG Europe”), and relates to the firm’s regulatory capital requirements, remuneration rules as well as internal governance, disclosure, reporting and liquidity requirements.
The withdrawal of the U.K. from the EU could have a range of adverse consequences for us, our funds or our funds’ portfolio companies.
Brexit has impacted our European operations. TPG Europe is authorized and regulated in the U.K. as an investment firm by the FCA and is permitted to carry on certain regulated activities, acting as a sub-advisor mainly to our U.S.
operations. Prior to the end of the transition period, TPG Europe benefitted from access to the cross-border services “passport” under the European Markets in Financial Instruments Directive (the “MiFID Passport”). The MiFID Passport allowed U.K. regulated firms such as TPG Europe to provide regulated services to clients in EEA member states without needing to be separately authorized or licensed in each jurisdiction. The MiFID Passport ceased to be available to TPG Europe at the end of the above-described transition period and, where relevant, it must now operate on a cross-border basis pursuant to licensing exemptions. In light of the continuing uncertainty surrounding Brexit, there can be no assurance that any renegotiated laws or regulations will not have an adverse impact on TPG Europe and its operations.
Risks Related to Taxation
Our structure involves complex provisions of U.S. federal income tax law for which no clear precedent or authority may be available. Our structure is also subject to on-going future potential legislative, judicial or administrative change and differing interpretations, possibly on a retroactive basis.
The U.S. federal income tax treatment of our structure and transactions undertaken by us depends in some instances on determinations of fact and interpretations of complex provisions of U.S. federal income tax law for which no clear precedent or authority may be available.
The U.S. federal income tax rules are constantly under review by persons involved in the legislative process, the IRS and the U.S. Department of the Treasury, frequently resulting in revised interpretations of established concepts, statutory changes, revisions to regulations and other modifications and interpretations. For example, it is possible that future legislation increases the U.S. federal income tax rates applicable to corporations. No prediction can be made as to whether any particular proposed legislation will be enacted or, if enacted, what the specific provisions or the effective date of any such legislation would be, or whether it would have any effect on us. As such, we cannot assure our stockholders that future legislative, administrative or judicial developments will not result in an increase in the amount of U.S. tax payable by us, our funds, portfolio companies owned by our funds or by investors in our Class A common stock. If any such developments occur, our business, results of operation and cash flows could be adversely affected and such developments could have an adverse effect on our stockholders’ investment in our Class A common stock.
Changes in relevant tax laws, regulations or treaties or an adverse interpretation of these items by tax authorities could negatively impact our effective tax rate and tax liability.
Our effective tax rate and tax liability is based on the application of current income tax laws, regulations and treaties. These laws, regulations and treaties are complex, and the manner which they apply to us and our funds is sometimes open to interpretation. Significant management judgment is required in determining our provision for income taxes, our deferred tax assets and liabilities and any valuation allowance recorded against our net deferred tax assets. Although management believes its application of current laws, regulations and treaties to be correct and sustainable upon examination by the tax authorities, the tax authorities could challenge our interpretation, resulting in additional tax liability or adjustment to our income tax provision that could increase our effective tax rate. Regarding the impact of our status as a corporation on our income taxes, see Note 13, “Income Taxes,” to the Consolidated Financial Statements. Tax laws, regulations or treaties newly enacted or enacted in the future may cause us to revalue our net deferred tax assets and have a material change to our effective tax rate and tax liabilities. For example, the TCJA, and guidance interpreting the TCJA since its enactment in 2017, have resulted in many significant changes to the U.S. federal income tax laws, some of which could adversely impact us and/or our portfolio companies. Further, foreign, state and local governments may enact tax laws in response to the TCJA that could result in further changes to foreign, state and local taxation and have a material adverse effect on our results of operations, financial condition and cash flow.
Moreover, on August 16, 2022, the Inflation Reduction Act of 2022 (“IRA”) was enacted in the United States. The IRA, among other things, includes a 15% minimum tax on adjusted financial statement income of corporations with average annual adjusted financial statement income in excess of $1 billion over a three-year period, a 1% excise tax on stock repurchases and additional clean energy tax incentives. There are significant uncertainties relating to the application of the IRA. Although the IRS and Treasury have released certain guidance under the IRA, significant uncertainties remain after such guidance was issued, and it is not clear when additional guidance will be issued. The Company will continue to evaluate its future impact if additional guidance is issued by the U.S. Department of the Treasury.
The U.S. Congress, the Organization for Economic Co-operation and Development (the “OECD”) and other government agencies in jurisdictions in which we invest or do business remain focused on the taxation of organizations,
such as TPG. The OECD, which represents a coalition of member countries, is contemplating changes to numerous longstanding tax principles through its base erosion and profit shifting (“BEPS”) project, which focuses on a number of issues, including profit shifting among affiliated entities in different jurisdictions, interest deductibility and eligibility for the benefits of double tax treaties. Several of the proposed measures, including measures relating to the deductibility of interest expense, local nexus requirements, transfer pricing, treaty qualification and hybrid instruments could potentially be relevant to some of our ownership structures and could have an adverse tax impact on us, our funds, investors and/or our funds’ portfolio companies. Some member countries have been moving forward on the BEPS agenda but, because the timing of implementation and the specific measures adopted will vary among participating states, significant uncertainty remains regarding the impact of the BEPS proposals. If implemented, these and other proposals could result in increased taxes on income from our investments and increased non-U.S. taxes on our management fees. In addition, on October 8, 2021, the OECD/G20 inclusive framework on BEPS (the “Inclusive Framework”) published a statement updating and finalizing the key components of a two-pillar plan on global tax reform under the BEPS project originally agreed on July 1, 2021, and a timetable for implementation. Under pillar one, a portion of the residual profits of multinational businesses with global turnover above €20 billion and a profit margin above 10% will be allocated to market countries where such allocated profits would be taxed, and under pillar two, the Inclusive Framework has agreed on a global minimum corporate tax rate of 15% for companies with revenue above €750 million, calculated on a country-by-country basis. Over 130 members of the Inclusive Framework are participating in the two-pillar plan. The OECD has published model rules and other guidance with respect to the two-pillar plan, and further additional guidance is expected to be published in 2024. A number of jurisdictions, including the United Kingdom and certain European Union Member States, have announced proposals to implement aspects of the pillar two proposals with effect from December 31, 2023 (broadly, the “income inclusion rule” and the “domestic top-up tax”) with further aspects to be introduced from December 31, 2024 (broadly, the “undertaxed payments rule”). As the two-pillar plan has partially taken effect in some, but not all, jurisdictions for the taxable year beginning on January 1, 2024, there is still uncertainty as to how the two-pillar plan will be applied evenly during this transition period. We are currently monitoring the developments of the two-pillar plan and are evaluating its potential impact on our financial results, though the implementation of any new legislation could negatively impact us, our funds, our funds’ portfolio companies and our investors.
Legislative changes have been proposed that would, if enacted, modify the tax treatment of partnership interests. If this or any similar legislation or regulation were to be enacted and apply to us, we could incur a substantial increase in our compensation costs and it could result in a reduction in the value of our Class A common stock.
Under the TCJA, investments must be held for more than three years, rather than the prior requirement of more than one year, for performance allocations to be treated for U.S. federal income tax purposes as capital gain. In connection with the enactment of the IRA, certain proposals were made, that if enacted, would have significantly extended the required holding period rules and the scope of the rules governing the taxation of certain performance allocations. While these proposals were not ultimately included in the IRA, those proposals, or other similar proposals, could be adopted pursuant to future legislation. The longer holding period requirement under the TCJA (or as may be enacted under any current future proposals) may result in some or all of our performance allocations being treated as short-term capital gain, which would materially increase the amount of taxes that our employees and other key personnel holding equity would be required to pay. In January 2021, the IRS released regulations implementing the performance allocation provisions that were enacted as part of the TCJA. The tax consequences of such regulations are uncertain. Although most proposals regarding the taxation of performance allocations still require gain realization before applying short-term capital gain rates, legislation has been proposed that would assume a deemed annual return on performance allocations and tax that amount annually, with a true-up once the assets are sold. In addition, following the TCJA, the tax treatment of performance allocations has continued to be an area of focus for policymakers and government officials, which could result in a further regulatory action by federal or state governments. For example, certain states, including New York and California, have proposed legislation to levy additional state tax on performance allocations. Tax authorities and legislators in other jurisdictions that TPG has investments or employees in could clarify, modify or challenge their treatment of performance allocations. See “Risks Related to Our Industry—Changes in the U.S. political environment and financial regulatory changes in the United States could negatively impact our business.”
We may be required to fund withholding tax upon certain exchanges of Common Units into shares of our Class A common stock (or, in certain cases, shares of our nonvoting Class A common stock) by non-U.S. holders.
In the event of a transfer by a non-U.S. transferor of an interest in a partnership, the transferee generally must withhold tax in an amount equal to ten percent of the amount realized (as determined for U.S. federal income tax purposes) by the transferor on such transfer absent an exception. Holders of Common Units may include non-U.S. holders. Pursuant to the A&R Exchange Agreement, a non-U.S. holder of Common Units is entitled to have such holder’s Common Units
exchanged for cash from a substantially concurrent public offering or private sale (based on the closing price per share of the Class A common stock on the day before the pricing of such public offering or private sale (taking into account customary brokerage commissions or underwriting discounts actually incurred)) or (at our option) shares of our Class A common stock (or, in certain cases, shares of our nonvoting Class A common stock). To the extent withholding is required and we elect to deliver shares of our Class A common stock (or, in certain cases, shares of our nonvoting Class A common stock) rather than cash, we may not have sufficient cash to satisfy such withholding obligation, and we may be required to incur additional indebtedness or sell shares of our Class A common stock in the open market to raise additional cash in order to satisfy our withholding tax obligations.
If the TPG Operating Group partnership were to become a publicly traded partnership taxable as a corporation for U.S. federal income tax purposes, we and the TPG Operating Group partnership might be subject to potentially significant tax inefficiencies, and we would not be able to recover payments previously made under the Tax Receivable Agreement even if the corresponding tax benefits were subsequently determined to have been unavailable due to such status.
We intend to operate such that the TPG Operating Group partnership does not become a publicly traded partnership taxable as a corporation for U.S. federal income tax purposes. A “publicly traded partnership” is a partnership the interests of which are traded on an established securities market or readily tradable on a secondary market or the substantial equivalent thereof. Under certain circumstances, exchanges of Common Units pursuant to the A&R Exchange Agreement or other transfers of Common Units could cause the TPG Operating Group partnership to be treated like a publicly traded partnership. From time to time, the U.S. Congress has considered legislation to change the tax treatment of partnerships and there can be no assurance that any such legislation will not be enacted or if enacted will not be adverse to us.
If the TPG Operating Group partnership were to become a publicly traded partnership taxable as a corporation for U.S. federal income tax purposes, significant tax inefficiencies might result for us and the TPG Operating Group partnership, including as a result of our inability to file a consolidated U.S. federal income tax return with the TPG Operating Group partnership. In addition, we may not be able to realize tax benefits covered under the Tax Receivable Agreement and would not be able to recover any payments previously made under the Tax Receivable Agreement, even if the corresponding tax benefits (including any claimed increase in the tax basis of the TPG Operating Group partnership’s assets) were subsequently determined to have been unavailable.
Item 1B. Unresolved Staff Comments
None
Item 1C. Cybersecurity
Risk Management and Strategy
We have adopted processes designed to identify, assess and manage material risks from cybersecurity threats. Those processes include responses to and assessments of internal and external threats to the security, confidentiality, integrity and availability of the Company’s data and systems along with other material risks to firm operations, at least annually or whenever there are material changes to our systems or operations. As part of our risk management process, we engage outside providers to conduct periodic internal and external penetration testing. We use NIST Cybersecurity Framework and CIS Critical Security Controls as a guide to help us identify, assess, and manage cybersecurity relevant to our business. This does not imply that we meet any particular technical standards, specifications, or requirements. We store firm data in cloud environments with security appropriate to the data involved and have adopted controls around, among other things, vendor risk assessment, access and acceptable use and backup and recovery.
We have processes to oversee and identify material risks associated with the use of third-party service providers, taking into account the nature of the services provided, the sensitivity and quantity of information processed, and the identity of the service provider.
Governance
We have established an Enterprise Risk Committee (“ERC”) to manage overall risk across the Company including cybersecurity risks identified by the cybersecurity team; the ERC includes representatives from relevant functions and is led by our Chief Executive Officer (“CEO”). We have also established an Operational Risk Committee (“ORC”) which is responsible for applying the policy decisions of the ERC. Operational responsibility for ensuring the adequacy and effectiveness of our risk management, control and governance processes is assigned to our Chief Information Security
Officer, who periodically reports, among other things, potentially material cybersecurity incidents to the ORC and, in coordination with the Chief Information Officer and Head of Operations, reports to the ERC at least annually. The Chief Information Security Officer leads the Company’s cybersecurity team, which includes individuals dedicated to incident detection and response. This team is responsible for identifying threats that can impact the Company and designing controls to mitigate vulnerabilities before they are exploited and to detect and neutralize any threats that do materialize. The Chief Information Security Officer and Chief Information Officer each have more than 20 years of experience in their fields. The Chief Information Security Officer and senior members of the cybersecurity team hold industry standard certifications.
Our Audit Committee is briefed on cybersecurity risks at least once each year and as needed in connection with any potentially material cybersecurity incidents. The Chief Information Security Officer reports at least annually, to our Audit Committee and such report may address overall assessment of the Company’s compliance with this and other cybersecurity policies, including topics such as risk assessment, risk management and control decisions, service provider arrangements, test results, security incidents and responses, and recommendations for changes and updates to policies and procedures.
As of the date of this report, we are not aware of any risks from cybersecurity threats, including as a result of any previous cybersecurity incidents, that have materially affected or are reasonably likely to materially affect us, including our business strategy, results of operations, or financial condition.
Item 2. Properties
Our principal executive offices are located in leased office space at 301 Commerce Street, Fort Worth, Texas 76102. We also lease office space in Amsterdam, Beijing, Chicago, Dubai, Frankfurt, Guangdong, Hong Kong, London, Los Angeles, Luxembourg, Melbourne, Miami, Milan, Mumbai, New York, San Francisco, Seoul, Shanghai, Singapore, Tokyo and Washington, D.C. We do not own any real property. We consider these facilities to be suitable and adequate for the management and operation of our business.
Item 3. Legal Proceedings
From time to time, we are involved in litigation and claims incidental to the conduct of our business. Our business is also subject to extensive regulation, which may result in regulatory proceedings against us. See “Item 1A.—Risk Factors—Risks Related to Our Industry—Extensive regulation of our businesses affects our activities and creates the potential for significant liabilities and penalties. Increased regulatory focus on the alternative asset industry or legislative or regulatory changes could result in additional burdens and expenses on our business.” We are not currently subject to any pending legal (including judicial, regulatory, administrative or arbitration) proceedings that we expect to have a material impact on our Consolidated Financial Statements. However, given the inherent unpredictability of these types of proceedings, an adverse outcome in certain matters could have a material effect on TPG’s financial results in any particular period. See Note 17, “Commitments and Contingencies,” to the Consolidated Financial Statements included in this Report.
Item 4. Mine Safety Disclosures
Not applicable.
Part II
Item 5. Market for Registrant's Common Equity, Related Stockholder Matters and Issuer Purchases of Equity Securities
Shares of our Class A common stock are listed on the Nasdaq Global Select Market under the symbol “TPG.”
The number of holders of record of our common stock was 77 as of February 20, 2024. This does not include the number of stockholders that hold shares in “street-name” through banks or broker-dealers.
Dividend Policy
Our current intention is to pay holders of our Class A common stock and nonvoting Class A common stock a quarterly dividend representing at least 85% of TPG Inc.’s share of DE attributable to the TPG Operating Group, subject to adjustment as determined by our board of directors and, until the Sunset, the Executive Committee of our board of directors to be necessary or appropriate to provide for the conduct of our business, to make appropriate investments in our business and funds, to comply with applicable law, any of our debt instruments or other agreements, or to provide for future cash
requirements such as tax-related payments and clawback obligations. Although we expect to pay at least 85% of our DE as a dividend, the percentage of our DE paid out as a dividend could fall below that target minimum. All of the foregoing is subject to the further qualification that the declaration and payment of any dividends are at the sole discretion of the board of directors and, until the Sunset, the Executive Committee and the board of directors and Executive Committee may change our dividend policy at any time, including, without limitation, to reduce such dividends or even to eliminate such dividends entirely. For more information on DE, see “Item 7.—Management’s Discussion and Analysis of Financial Results of Operation—Non-GAAP Financial Metrics—Distributable Earnings.”
Prior to the Sunset, any future determination as to the declaration and payment of dividends, if any, will be at the discretion of the board of directors and Executive Committee and will depend on a number of factors, including:
•general economic and business conditions;
•our strategic plans and prospects;
•our business and investment opportunities;
•our financial condition and operating results;
•our available cash and current and anticipated cash needs;
•our capital requirements;
•contractual, legal, tax and regulatory restrictions and implications on the payment of dividends by us to our stockholders or by our subsidiaries (including payment obligations pursuant to the Tax Receivable Agreement) to us; and
•such other factors as the board of directors and Executive Committee may deem relevant.
In addition, the TPG Operating Group Limited Partnership agreements generally require that pro rata cash distributions be made to holders of Common Units, including us, at certain assumed tax rates, which we refer to as “tax distributions.” Further, subject to funds being legally available, we intend to cause the TPG Operating Group to make pro rata cash distributions to holders of Common Units, including us, that will enable us, when combined with the tax distributions we receive, to pay our taxes, make all payments required under the Tax Receivable Agreement and pay other expenses.
We are a holding company, and our only material assets are Common Units representing 22% of the Common Units and 100% of the interests in certain intermediate holding companies. We need to cause the TPG Operating Group to make distributions to us sufficient to pay our taxes and other obligations (including those pursuant to the Tax Receivable Agreement), and if we decide to pay a dividend, in an amount sufficient to cover such dividend. If the TPG Operating Group makes such distributions to us, the other holders of Common Units, including the TPG Partner Vehicles and certain Pre-IPO Investors, will be entitled to receive pro rata distributions. Holders of our Class B common stock will not be entitled to cash dividends distributed by TPG Inc. Holders of Promote Units will not be entitled to cash distributions from the TPG Operating Group, except certain distributions of performance allocations received by the TPG Operating Group.
Recent Sales of Unregistered Securities
In connection with the closing of the Angelo Gordon acquisition, on November 1, 2023 (“Closing”), the Angelo Gordon Parties received (i) 53.0 million Common Units, subject to certain adjustments, (ii) 8.4 million RSUs that, subject to the terms and conditions of the RSUs, will settle in shares of our Class A common stock, subject to certain adjustments and (iii) rights to an earnout payment of up to $400 million in value (the “Earnout Payment”), subject to the satisfaction of certain fee-related revenue targets during the period beginning on January 1, 2026 and ending on December 31, 2026. The Earnout Payment is payable, at TPG Operating Group II, L.P.’s election, subject to certain limitations set forth in the Transaction Agreement, in cash, Common Units (and an equal number of shares of Class B common stock) (the “Earnout Equity Payment”). On November 13, 2023, upon effectiveness of our Certificate of Amendment of the Amended and Restated Certificate of Incorporation, we issued to the Angelo Gordon Parties 53.0 million shares of Class B common stock. The Common Units and shares of Class B common stock issued in connection with the Acquisition were not and will not be registered under the Securities Act, and were issued in reliance on the exemption from registration provided by Section 4(a)(2) of the Securities Act. The Common Units and shares of Class B common stock are subject to the terms of our A&R Investor Rights Agreement, which sets forth certain transfer restrictions and customary registration rights with respect to the shares of Class A common stock, shares of Class B common stock and Common Units (including any Common Units received as part of the Earnout Equity Payment). In particular, applicable Angelo Gordon Parties may not transfer or exchange (i) any shares of Class A common stock, shares of Class B common stock or Common Units prior to the first anniversary of Closing; (ii) from the first anniversary until the second anniversary of Closing, more than one third (1/3) of the number of shares of Class A common stock, shares of Class B common stock or Common Units owned, directly or indirectly, by the applicable Angelo Gordon Parties as of Closing; and (iii) between the second and third anniversary of Closing, more than two thirds (2/3) of the number of shares of Class A common stock, shares of Class B common stock or Common Units owned, directly or indirectly, by the applicable Angelo Gordon Parties as of Closing.
Issuer Purchases of Equity Securities
Not Applicable.
Item 6. Selected Financial Data
(Removed and Reserved)
Item 7. Management's Discussion and Analysis of Financial Condition and Results of Operations
The following discussion and analysis of our financial condition and results of operations should be read in conjunction with the information presented in our historical financial statements and the related notes included elsewhere in this report. In addition to historical information, the following discussion contains forward-looking statements, such as statements regarding our expectation for future performance, liquidity and capital resources that involve risks, uncertainties and assumptions. Our actual results may differ materially from those contained in or implied by any forward-looking statements. Factors that could cause or contribute to these differences include, but are not limited to, those identified below and elsewhere in this report, particularly in “Cautionary Note Regarding Forward-Looking Statements,” “Item 1A.—Risk Factors” and “—Unaudited Pro Forma Condensed Consolidated Financial Information and Other Data.” We assume no obligation to update any of these forward-looking statements.
On January 12, 2022, we completed a corporate reorganization (the “Reorganization”), which included a corporate conversion of TPG Partners, LLC to a Delaware corporation named TPG Inc., in conjunction with an initial public offering (the “IPO”) of our Class A common stock. The IPO closed on January 18, 2022. Unless the context suggests otherwise, references in this report to “TPG”, “the Company”, “we”, “us” and “our” refer (i) prior to the completion of the Reorganization and IPO to TPG Group Holdings SBS, L.P. and its consolidated subsidiaries and (ii) from and after the completion of the Reorganization and IPO to TPG Inc. and its consolidated subsidiaries.
We completed the Acquisition on November 1, 2023. Accordingly, the results of TPG Angelo Gordon included in our consolidated results of operations are from November 1, 2023 through December 31, 2023.
Business Overview
We are a leading global alternative asset manager with approximately $221.6 billion in assets under management (“AUM”) as of December 31, 2023. We primarily invest in complex asset classes such as private equity, credit, real estate and public market strategies. We have built our firm through more than 30 years of successful innovation and growth, and believe that we have delivered attractive risk-adjusted returns to our clients and established a premier investment business focused on the fastest-growing segments of both the alternative asset management industry and the global economy. We believe that we have a distinctive business approach as compared to other alternative asset managers and a diversified, innovative array of multi-strategy investment platforms that position us well to continue generating sustainable growth across our business.
Trends Affecting our Business
Our business is affected by a variety of factors, including conditions in the financial markets and economic and political conditions. Changes in global economic conditions and regulatory or other governmental policies or actions can materially affect the values of funds managed by TPG, as well as our ability to source attractive investments and deploy the capital that we have raised. However, we believe our disciplined investment philosophy across our diversified investment platforms and our shared investment themes focusing on attractive and resilient sectors of the global economy has historically contributed to the stability of our performance throughout market cycles.
The market environment improved in 2023 as inflation slowed, the Federal Reserve tapered and ultimately paused its rate hiking cycle, and the domestic economy remained strong, all despite ongoing geopolitical instability and stress within the regional banking sector during the early part of the year.
The U.S. Consumer Price Index (“CPI”) reading for the last month of 2023 showed a 3.1% year-over-year increase in prices, a much slower rate of increase relative to the December 2022 reading of 6.5%. Core CPI, which excludes food and energy, also declined from 5.7% in December 2022 to 3.9% in the December 2023 reading. As inflation tapered, the Federal Reserve began to slow its pace of rate hikes. After increasing the target federal funds rate by 4.25% over the course of 2022, the Federal Reserve increased rates only by another 1.00% in 2023 via 0.25% increases at four of its first five meetings of 2023. The Central Bank has held rates steady since, at 5.25% - 5.50%. The timing of the Federal Reserve’s first rate cut and the pace of the rate cutting cycle remains a significant question impacting markets. Economic data has remained strong despite the extended period of elevated rates. The U.S. added 2.8 million payrolls over the course of 2023, and the unemployment rate ended the year at 3.7%, a modest increase from 2022’s final reading of 3.4%.
U.S. Treasuries experienced a degree of volatility over the twelve months ending December 31, 2023, though finished the year relatively flat to yields seen at the end of 2022. Treasury yields fell sharply early in the year, particularly
at the shorter end of the curve, as stress within the U.S. regional banking sector drove a flight to safety. Yields steadily widened over the following months, with the 10-Year Treasury touching above 5% in October. However, Treasury bonds rallied significantly heading into the end of the year. The 10 Year Treasury yield ended the year at 3.879%, little changed from its yield at the end of 2022. 2 Year Yields touched as high as 5.212% during 2023 but closed the year at 4.250%.
In corporate credit markets, both U.S. and European high yield markets performed positively during 2023. According to J.P. Morgan data, the U.S. high yield market saw gains of 13.5% in the United States and the European market saw gains of 12.7% during the year. Notably, lower-rated CCCs significantly outperformed higher-rated BBs over this period, generating returns of 19.9% and 11.8%, respectively. In U.S. high, yield bonds further tightened and ended the year at 377 basis points compared to 490 basis points to start the year. In Europe, high yield spreads tightened 44 points ending the year at 449 basis points. The high yield default rate rose modestly to 2.8% in the United States and 2.4% in Europe. Additionally, the J.P. Morgan U.S. Leveraged Loan Index posted a 13.5% return and the J.P. Morgan European Leveraged Loan Index posted a 13.6% return for the year ended 2023. From a spread and yield basis, the US Leveraged Loan Index ended the year at a yield of 8.6% and 500 basis point spread while the European Leverage Loan Index ended the year at a yield of 7.96% and 542 basis point spread.
Major U.S. equity indices rallied significantly in 2023, after posting losses in 2022. The S&P 500, Dow Jones, and Nasdaq gained 24.2%, 13.7%, and 43.4% respectively during the year. Growth oriented sectors were market leaders, with the Information Technology and Communication Services sectors rising 56.4% and 54.4% respectively on the year. Energy and Utilities were laggards, declining (4.8%) and (10.2%) respectively. Volatility, as measured by the CBOE Volatility Index, continued its downward trend over the year from 21.7 at the start of the year to 12.5 at the end of 2023.
In commercial real estate, the Green Street Commercial Property Price Index ended December 2023 down 9.5% from its the beginning of 2023. Commercial property transaction volume in the United States and Europe remained relatively muted, consistent with 2022, primarily due to continued elevated borrowing rates and reductions in liquidity and credit availability. Major Asian markets faced similar challenges, with commercial property transaction volume for the year declining 17 year-over-year overall; however, Q4 2023 saw an uptick in volume, registering a 3% rise year-on-year. In Hong Kong full year 2023 investment volume reached HK$40.4 billion, marking the weakest period since 2008. In China, transaction volume fell 13.0% year-over-year, largely due to prolonged overseas interest rate hikes and ongoing geopolitical tension. Similarly, Japan saw investment volume decline 3.0% year-over-year, mostly due to a decrease in foreign investment.
U.S. residential real estate improved slightly during the quarter, with national U.S. home prices rising approximately 6.0% year-to-date through November 2023, slightly above the peak recorded in June 2022 according to the S&P/Case-Shiller U.S. National Home Price Index, in part due to constrained housing supply.
Organization
We are a holding company and our only business is to act as the owner of the entities serving as the general partner of the TPG Operating Group partnerships and our only material assets are Common Units representing approximately 22% of the legally outstanding Common Units and 100% of the interests in certain intermediate holding companies as of December 31, 2023. In our capacity as the sole indirect owner of the entities serving as the general partner of the TPG Operating Group partnerships, we indirectly control all of the TPG Operating Group’s business and affairs.
Acquisition of Angelo Gordon
On November 1, 2023, we acquired Angelo Gordon pursuant to the terms and subject to the conditions set forth in the Transaction Agreement. Pursuant to the Transaction Agreement, we acquired Angelo Gordon for both cash and non-cash consideration under U.S. GAAP equal to $1,145.9 million (the “Purchase Price”), comprised of:
•$740.7 million in cash paid at closing;
•$18.8 million in payable as of December 31, 2023 to the escrow agent on behalf of the sellers of Angelo Gordon, subject to adjustment;
•9.2 million vested Common Units (and an equal number of Class B common stock) and 43.8 million unvested Common Units which are deemed to be compensatory under U.S. GAAP;
•the rights to an aggregate cash payment, payable in three payments of up to $50.0 million each, reflecting an aggregate of $150.0 million (the “Aggregate Annual Cash Holdback Amount”); and
•the non-compensatory portion under U.S. GAAP of a total earnout payment of up to $400.0 million in value (the “Earnout Payment”), subject to the satisfaction of certain fee-related revenue (“FRR”) targets during the period beginning on January 1, 2026 and ending on December 31, 2026 (the “Measurement Period”).
On November 1, 2023, Angelo Gordon had $75.3 billion in assets under management, with $57.4 billion attributable to its credit business and $17.9 billion attributable to its real estate business.
Operating Segments
We operate our business in a single operating and reportable segment, which is consistent with how our CEO, who is our chief operating decision maker, reviews financial performance and allocates resources. We operate collaboratively across platforms with a single expense pool.
Basis of Accounting
We consolidate the financial results of TPG Inc., TPG Operating Group and its consolidated subsidiaries, management companies, the general partners of funds and entities that meet the definition of a variable interest entity (“VIE”) for which we are considered the primary beneficiary.
When an entity is consolidated, we reflect the accounts of the consolidated entity, including its assets, liabilities, revenues, expenses, investment income, cash flows and other amounts, on a gross basis. While the consolidation of an entity does not impact the amounts of net income attributable to controlling interests, the consolidation does impact the financial statement presentation in accordance with accounting principles generally accepted in the United States of America (“U.S. GAAP”). This is a result of the fact that the accounts of the consolidated entities being reflected on a gross basis, with intercompany transactions eliminated, while the allocable share of those amounts that are attributable to third parties are reflected as single line items. The single line items in which the accounts attributable to third parties are recorded are presented as non-controlling interests on the Consolidated Statements of Financial Condition and net income (loss) attributable to non-controlling interests on the Consolidated Statements of Operations.
We are not required under U.S. GAAP to consolidate the majority of investment funds we advise in our Consolidated Financial Statements because we do not have a more than insignificant variable interest. Following our Reorganization and IPO, we no longer have a controlling financial interest in certain TPG Funds. Public SPACs are consolidated pursuant to U.S. GAAP. Management fees and performance allocations from the consolidated Public SPACs are eliminated in the Consolidated Financial Statements. The assets and liabilities of the consolidated Public SPACs are generally held within separate legal entities and, as a result, the liabilities of the consolidated Public SPACs are non-recourse to us. Since we only consolidate a limited portion of our TPG investment funds, the performance of the consolidated Public SPACs is not necessarily consistent with or representative of the aggregate performance trends of our TPG investment funds.
Key Financial Measures
Our key financial and operating measures are discussed below.
Revenues
Fees and Other. Fees and other consists primarily of (i) management and incentive fees, (ii) monitoring fees, (iii) transaction fees, (iv) incentive fee income and (v) expense reimbursements from unconsolidated funds, portfolio companies and third parties. These fee arrangements are documented within the contractual terms of the governing agreements and are recognized when earned, which generally coincides with the period during which the related services are performed and in the case of transaction fees, upon closing of the transaction. Monitoring fees may provide for a termination payment following an initial public offering or change of control. These termination payments are recognized in the period in which the related transaction closes.
Capital Allocation-Based Income (Loss). Capital allocation-based income (loss) is earned from the TPG funds when we have (i) a general partner’s capital interest and (ii) performance allocations which entitle us to a disproportionate
allocation of investment income or loss from investment funds. We are entitled to a performance allocation (typically 20%) based on cumulative fund or account performance to date, irrespective of whether such amounts have been realized. These performance allocations are subject to the achievement of preferred returns or high water marks, where applicable, in accordance with the terms set forth in the respective fund’s governing documents. We account for our investment balances in the TPG funds, including performance allocations, under the equity method of accounting because we are presumed to have significant influence as the general partner or managing member; however, we do not have control as defined by Accounting Standards Codification (“ASC”) Topic 810, Consolidation. The Company accounts for its general partner interests in capital allocation-based arrangements as financial instruments under ASC Topic 323, Investments – Equity Method and Joint Ventures as the general partner has significant governance rights in the TPG funds in which it invests which demonstrates significant influence. Accordingly, performance allocations are not deemed to be within the scope of ASC Topic 606, Revenue from Contracts with Customers (“ASC 606”).
Expenses
Compensation and Benefits. Compensation and benefits expense includes (i) cash-based compensation and benefits, (ii) equity based compensation and (iii) performance allocation compensation. Bonuses are accrued over the service period to which they relate. In addition, we have equity-based compensation arrangements that require certain TPG executives and employees to vest ownership of a portion of their equity interests over a service period of generally one to six years, which under U.S. GAAP will result in compensation charges over current and future periods. In connection with our IPO and subsequent acquisition, we granted restricted stock units (“RSUs”) to executives and employees. Distributions of performance allocations in the legal form of equity made directly or indirectly to our partners and professionals are allocated and distributed, when realized, pro rata based on ownership percentages in the underlying investment partnership and are accounted for as distributions on the equity held by such partners rather than as compensation and benefits expense prior to the Reorganization and IPO. We account for these distributions as performance allocation compensation.
General, Administrative and Other. General and administrative expenses include costs primarily related to professional services, occupancy, travel, communication and information services and other general operating items.
Depreciation and Amortization. Depreciation and amortization of tenant improvements, furniture and equipment and intangible assets are expensed on a straight-line basis over the useful life of the asset.
Interest Expense. Interest expense includes interest paid and accrued on our outstanding debt and the amortization of deferred financing costs.
Expenses of Consolidated TPG Funds and Public SPACs. Expenses of consolidated TPG Funds and Public SPACs consist of interest expense and other expenses related primarily to professional services fees, research expenses, trustee fees, travel expenses and other costs associated with organizing and offering these entities.
Investment Income
Net Gains (Losses) from Investment Activities. Realized gains (losses) may be recognized when we redeem all or a portion of an investment interest or when we receive a distribution of capital. Unrealized gains (losses) result from the appreciation (depreciation) in the fair value of our investments. Fluctuations in net gains (losses) from investment activities between reporting periods are primarily driven by changes in the fair value of our investment portfolio and, to a lesser extent, the gains (losses) on investments disposed of during the period. The fair value of, as well as the ability to recognize gains (losses) from, our investments is significantly impacted by the global financial markets. This impact affects the net gains (losses) from investment activities recognized in any given period. Upon the disposition of an investment, previously recognized unrealized gains (losses) are reversed and an offsetting realized gain (loss) is recognized in the period in which the investment is sold. Since our investments are carried at fair value, fluctuations between periods could be significant due to changes to the inputs to our valuation process over time.
Interest, Dividends and Other. Interest income is recognized on an accrual basis to the extent that such amounts are expected to be collected using the effective interest method. Dividends and other investment income are recorded when the right to receive payment is established.
Net Gains from Investment Activities of consolidated TPG Funds and Public SPACs. Net gains (losses) from investment activities includes (i) realized gains (losses) from the sale of equity, securities sold and not yet purchased, debt and derivative instruments and (ii) unrealized gains (losses) from changes in the fair value of such instruments.
Unrealized Gains (Losses) on Derivative Liabilities of Consolidated Public SPACs. Unrealized gains (losses) on derivative liabilities of consolidated Public SPACs are changes in the fair value of derivative contracts entered into by our consolidated Public SPAC entities, which are included in current period earnings.
Interest, Dividends and Other of Consolidated TPG Funds and Public SPACs. Interest income is recognized on an accrual basis to the extent that such amounts are expected to be collected using the effective interest method. Dividends and other investment income are recorded when the right to receive payment is established.
Income Tax Expense
The Company is treated as a corporation for U.S. federal and state income tax purposes. We are subject to U.S. federal and state income taxes, in addition to local and foreign income taxes, with respect to our allocable share of taxable income generated by the TPG Operating Group partnerships.
Non-Controlling Interests
For entities that are consolidated, but not 100% owned, a portion of the income or loss and corresponding equity is allocated to owners other than TPG. The aggregate of the income or loss and corresponding equity that is not owned by us is included in non-controlling interests in the Consolidated Financial Statements.
Key Components of our Results of Operations
Results of Operations
The following table provides information regarding our consolidated results of operations for the periods presented:
| | | | | | | | | | | | | | | | | |
| Year Ended December 31, |
| 2023 | | 2022 | | 2021 |
| | | | | |
| (dollars in thousands, except share and per share data) |
| Revenues | | | | | |
| Fees and other | $ | 1,534,626 | | | $ | 1,246,635 | | | $ | 977,904 | |
| Capital allocation-based income | 855,285 | | | 756,252 | | | 3,998,483 | |
| Total revenues | 2,389,911 | | | 2,002,887 | | | 4,976,387 | |
| Expenses | | | | | |
| Compensation and benefits: | | | | | |
| Cash-based compensation and benefits | 547,377 | | | 473,696 | | | 579,698 | |
| Equity-based compensation | 654,922 | | | 627,714 | | | — | |
| Performance allocation compensation | 591,676 | | | 416,556 | | | — | |
| Total compensation and benefits | 1,793,975 | | | 1,517,966 | | | 579,698 | |
| General, administrative and other | 482,574 | | | 368,915 | | | 278,590 | |
| Depreciation and amortization | 47,673 | | | 32,990 | | | 21,223 | |
| Interest expense | 38,528 | | | 21,612 | | | 16,291 | |
| Expenses of consolidated TPG Funds and Public SPACs: | | | | | |
| Interest expense | — | | | — | | | 740 | |
| Other | 1,053 | | | 3,316 | | | 20,024 | |
| Total expenses | 2,363,803 | | | 1,944,799 | | | 916,566 | |
| Investment income (loss) | | | | | |
| Income (loss) from investments: | | | | | |
| Net gains (losses) from investment activities | 6,564 | | | (110,131) | | | 353,219 | |
| | | | | |
| Interest, dividends and other | 42,622 | | | 9,168 | | | 6,460 | |
| Investment income of consolidated TPG Funds and Public SPACs: | | | | | |
| Net gains from investment activities | — | | | — | | | 23,392 | |
| Unrealized gains on derivative liabilities of Public SPACs | 667 | | | 12,382 | | | 211,822 | |
| Interest, dividends and other | 7,692 | | | 6,741 | | | 10,321 | |
| Total investment income (loss) | 57,545 | | | (81,840) | | | 605,214 | |
| Income (loss) before income taxes | 83,653 | | | (23,752) | | | 4,665,035 | |
| Income tax expense | 60,268 | | | 32,483 | | | 9,038 | |
| Net income (loss) | 23,385 | | | (56,235) | | | 4,655,997 | |
| | | | | | | | | | | | | | | | | |
| Year Ended December 31, |
| 2023 | | 2022 | | 2021 |
| | | | | |
| (dollars in thousands, except share and per share data) |
| Net (loss) income attributable to redeemable equity in Public SPACs prior to Reorganization and IPO | — | | | (517) | | | 155,131 | |
| Net income attributable to non-controlling interests in consolidated TPG Funds prior to Reorganization and IPO | — | | | — | | | 19,287 | |
| Net income attributable to other non-controlling interests prior to Reorganization and IPO | — | | | 966 | | | 2,455,825 | |
| Net income attributable to TPG Group Holdings prior to Reorganization and IPO | — | | | 5,256 | | | 2,025,754 | |
| Net income attributable to redeemable equity in Public SPACs | 12,044 | | | 15,165 | | | — | |
| Net loss attributable to non-controlling interests in TPG Operating Group | (92,411) | | | (180,824) | | | — | |
| Net income attributable to other non-controlling interests | 23,662 | | | 11,293 | | | — | |
| Net income attributable to TPG Inc. subsequent to Reorganization and IPO | $ | 80,090 | | (1) | $ | 92,426 | | | $ | — | |
| Net income (loss) per share data: | | | | | |
| Net income (loss) available to Class A common stock per share | | | | | |
| Basic | $ | 0.89 | | | $ | 1.10 | | | $ | — | |
| Diluted | $ | (0.04) | | | $ | (0.19) | | | $ | — | |
| Weighted-average shares of Class A common stock outstanding | | | | | |
| Basic | 80,334,871 | | | 79,255,411 | | — |
| Diluted | 317,944,496 | | | 308,908,052 | | — |
___________
(1)Includes amounts from TPG Angelo Gordon from November 1, 2023, the date of the Acquisition, through December 31, 2023.
Year Ended December 31, 2023 Compared to Year Ended December 31, 2022
Revenues
Revenues consisted of the following for the years ended December 31, 2023 and 2022:
| | | | | | | | | | | | | | | | | | | | | | | |
| Year Ended December 31, |
| 2023 | | 2022 | | Change | | % |
| | | | | | | |
| ($ in thousands) |
| Management fees | $ | 1,187,947 | | | $ | 919,830 | | | $ | 268,117 | | | 29 | % |
| Transaction, monitoring and other fees, net | 113,108 | | | 117,422 | | | (4,314) | | | (4) | % |
| Expense reimbursements and other | 233,571 | | | 209,383 | | | 24,188 | | | 12 | % |
| Total fees and other | 1,534,626 | | | 1,246,635 | | | 287,991 | | | 23 | % |
| Performance allocations | 808,248 | | | 720,106 | | | 88,142 | | | 12 | % |
| Capital interests | 47,037 | | | 36,146 | | | 10,891 | | | 30 | % |
| Total capital allocation-based income | 855,285 | | | 756,252 | | | 99,033 | | | 13 | % |
| Total revenues | $ | 2,389,911 | | (1) | $ | 2,002,887 | | | $ | 387,024 | | | 19 | % |
___________
(1)Includes amounts from TPG Angelo Gordon from November 1, 2023, the date of the Acquisition, through December 31, 2023.
Fees and other revenues increased by $288.0 million, or 23%, during the year ended December 31, 2023 compared to the year ended December 31, 2022. This change resulted from a $268.1 million increase in management fees, a $24.2 million increase in expense reimbursements and other and a $4.3 million decrease in transaction, monitoring and other fees, net.
Management Fees. Management fees increased by $268.1 million, or 29%, for the year ended December 31, 2023 compared to the year ended December 31, 2022. This change was primarily driven by fee earning capital raised resulting in additional management fees of $107.6 million from TPG IX, $47.9 million from Asia VIII, $40.7 million from THP II, and $29.2 million from Rise III, each of which were activated during the third quarter of 2022. Management fees also increased $87.3 million due to the additional fees earned from TPG Angelo Gordon, primarily $18.8 million from Middle Market Direct Lending funds, $12.4 million from Real Estate Multi-Strategy funds, and $9.8 million from Credit Solutions funds. These increases were partially offset by a decrease in management fees of $36.9 million earned from Asia VII resulting from a decrease in fee earning AUM during the year ended December 31, 2023 compared to the year ended December 31, 2022.
Certain management fees totaling $41.5 million earned during the year ended December 31, 2023 were considered catch-up fees as a result of additional capital commitments from limited partners primarily related to TPG IX of $18.0 million, THP II of $8.7 million, Rise III of $6.7 million and Asia VIII in the amount of $6.3 million.
Transaction, Monitoring and Other Fees, Net. Transaction, monitoring and other fees, net decreased by $4.3 million, or 4%, for the year ended December 31, 2023 compared to the year ended December 31, 2022. This change was primarily driven by a $9.5 million decrease in transaction, monitoring and incentive fees earned from portfolio companies in our Real Estate and Capital platforms, partially offset by a $6.3 million increase in our Market Solutions platform as a result of increased capital markets activity among our portfolio companies involving our broker-dealer.
Expense Reimbursements and Other. Expense reimbursements and other increased by $24.2 million, or 12%, for the year ended December 31, 2023 compared to the year ended December 31, 2022. This change was primarily driven by a $21.2 million increase in income from services rendered to TPG funds and a $5.1 million increase in additional reimbursements from funds, mainly due to increase in expense reimbursements attributable to TPG Angelo Gordon.
Performance Allocations. Performance allocations increased by $88.1 million to $808.2 million, or 12%, for the year ended December 31, 2023 compared to the year ended December 31, 2022. Realized performance allocations for the year ended December 31, 2023 and 2022 totaled $582.2 million and $1,409.8 million, respectively. Unrealized performance allocation gains for the year ended December 31, 2023 was $226.0 million. The change in unrealized performance allocations for the year ended December 31, 2022 was a loss of $689.7 million.
The table below highlights performance allocations for the years ended December 31, 2023 and 2022, and separates the entities listed into two categories to reflect the Reorganization: (i) TPG general partner entities from which the TPG Operating Group Common Unit holders are expected to receive a 20% performance allocation and (ii) TPG general partner entities from which the TPG Operating Group Common Unit holders are not expected to receive any performance allocation.
| | | | | | | | | | | | | | | | | | | | | | | |
| Year Ended December 31, |
| 2023 | | 2022 | | Change | | % |
| | | | | | | |
| ($ in thousands) |
| TPG Operating Group Shared: | | | | | | | |
| TPG VII | $ | 13,538 | | | $ | 171,926 | | | $ | (158,388) | | | (92) | % |
| TPG VIII | 318,945 | | | 445,242 | | | (126,297) | | | (28) | % |
| TPG IX | 32,253 | | | 1,146 | | | 31,107 | | | NM |
Asia VI(2) | (48,407) | | | (50,005) | | | 1,598 | | | 3 | % |
| Asia VII | (7,058) | | | 9,400 | | | (16,458) | | | (175) | % |
| Asia VIII | 23,241 | | | — | | | 23,241 | | | NM |
| TPG Healthcare Partners | 60,933 | | | 5,381 | | | 55,552 | | | NM |
| TPG Healthcare Partners II | 12,059 | | | 2,529 | | | 9,530 | | | NM |
| TES | 1,986 | | | 11,618 | | | (9,632) | | | (83) | % |
| TPG AAF | 31,051 | | | 135,098 | | | (104,047) | | | (77) | % |
| Platform: Capital | 438,541 | | | 732,335 | | | (293,794) | | | (40) | % |
| | | | | | | | | | | | | | | | | | | | | | | |
| Year Ended December 31, |
| 2023 | | 2022 | | Change | | % |
| | | | | | | |
| ($ in thousands) |
Growth III(2) | (5,521) | | | (47,831) | | | 42,310 | | | 88 | % |
| Growth IV | 64,362 | | | 21,141 | | | 43,221 | | | 204 | % |
| Growth V | 80,780 | | | 68,890 | | | 11,890 | | | 17 | % |
| TTAD | (13,195) | | | 455 | | | (13,650) | | | NM |
| TDM | (4,757) | | | 33,305 | | | (38,062) | | | (114) | % |
| Platform: Growth | 121,669 | | | 75,960 | | | 45,709 | | | 60 | % |
| Rise | (3,649) | | | (16,836) | | | 13,187 | | | 78 | % |
| Rise II | 55,927 | | | 19,739 | | | 36,188 | | | 183 | % |
| Rise Climate | 177,333 | | | — | | | 177,333 | | | NM |
| Platform: Impact | 229,611 | | | 2,903 | | | 226,708 | | | NM |
| TREP III | (73,335) | | | 12,728 | | | (86,063) | | | (676) | % |
| | | | | | | |
| Platform: Real Estate | (73,335) | | | 12,728 | | | (86,063) | | | (676) | % |
| TPEP | 33,455 | | | 9,107 | | | 24,348 | | | 267 | % |
| NewQuest III | (20,193) | | | (17,590) | | | (2,603) | | | NM |
| NewQuest IV | 1,157 | | | 18,374 | | | (17,217) | | | NM |
| NewQuest V | 8,820 | | | — | | | 8,820 | | | NM |
| Strategic Capital | — | | | (2,793) | | | 2,793 | | | NM |
| Platform: Market Solutions | 23,239 | | | 7,098 | | | 16,141 | | | 227 | % |
| Credit Solutions II | 53,539 | | | — | | | 53,539 | | | NM |
| Credit Solutions II Dislocation A | 17,157 | | | — | | | 17,157 | | | NM |
| Credit Solutions I | 15,303 | | | — | | | 15,303 | | | NM |
| MVP | 13,953 | | | — | | | 13,953 | | | NM |
| MMDL IV | 7,410 | | | — | | | 7,410 | | | NM |
| MMDL III | 4,001 | | | — | | | 4,001 | | | NM |
| CDPQ Cap Solutions | 2,814 | | | — | | | 2,814 | | | NM |
| Asset Based Credit | 2,643 | | | — | | | 2,643 | | | NM |
| MMDL IV Annex | 2,161 | | | — | | | 2,161 | | | NM |
| MMDL V | 2,104 | | | — | | | 2,104 | | | NM |
| Other | 18,279 | | | — | | | 18,279 | | | NM |
| TPG Angelo Gordon Credit | 139,364 | | | — | | | 139,364 | | | NM |
| Net Lease Realty III | 15,687 | | | — | | | 15,687 | | | NM |
| Asia Realty IV | (1,673) | | | — | | | (1,673) | | | NM |
| Net Lease Realty IV | (1,845) | | | — | | | (1,845) | | | NM |
| Growth Capital I | (2,315) | | | — | | | (2,315) | | | NM |
| Realty X | (3,828) | | | — | | | (3,828) | | | NM |
| Europe Realty III | (5,722) | | | — | | | (5,722) | | | NM |
| Europe Realty II | (15,586) | | | — | | | (15,586) | | | NM |
| Other | 3,245 | | | — | | | 3,245 | | | NM |
| TPG Angelo Gordon Real Estate | (12,037) | | | — | | | (12,037) | | | — | % |
| Total TPG Operating Group Shared: | $ | 867,052 | | | $ | 831,024 | | | $ | 36,028 | | | 4 | % |
| | | | | | | |
| | | | | | | | | | | | | | | | | | | | | | | |
| Year Ended December 31, |
| 2023 | | 2022 | | Change | | % |
| | | | | | | |
| ($ in thousands) |
| TPG Operating Group Excluded: | | | | | | | |
| TPG IV | $ | (495) | | | $ | (569) | | | $ | 74 | | | 13 | % |
| TPG V | 3 | | | — | | | 3 | | | NM |
| TPG VI | (24,561) | | | (19,913) | | | (4,648) | | | (23) | % |
| Asia IV | — | | | 108 | | | (108) | | | NM |
| Asia V | (24,388) | | | (42,864) | | | 18,476 | | | 43 | % |
| MMI | 1,329 | | | 117 | | | 1,212 | | | NM |
| TPG TFP | — | | | (750) | | | 750 | | | NM |
| Platform: Capital | (48,112) | | | (63,871) | | | 15,759 | | | 25 | % |
| Growth II | 1,383 | | | 8,977 | | | (7,594) | | | (85) | % |
| Gator | (22,945) | | | 11,731 | | | (34,676) | | | (296) | % |
| Biotech II | — | | | 203 | | | (203) | | | NM |
| Biotech III | 12,566 | | | (34,974) | | | 47,540 | | | 136 | % |
| Biotech IV | (347) | | | (533) | | | 186 | | | 35 | % |
| Biotech V | — | | | — | | | — | | | NM |
| Platform: Growth | (9,343) | | | (14,596) | | | 5,253 | | | 36 | % |
| TREP II | (250) | | | (17,337) | | | 17,087 | | | 99 | % |
| DASA RE | (1,099) | | | (1,507) | | | 408 | | | 27 | % |
| Platform: Real Estate | (1,349) | | | (18,844) | | | 17,495 | | | 93 | % |
| TSI | — | | | 124 | | | (124) | | | NM |
| Evercare | — | | | (13,731) | | | 13,731 | | | NM |
| Platform: Impact | — | | | (13,607) | | | 13,607 | | | NM |
Total TPG Operating Group Excluded(3) | $ | (58,804) | | | $ | (110,918) | | | $ | 52,114 | | | 47 | % |
| Total Performance Allocations | $ | 808,248 | | (1) | $ | 720,106 | | | $ | 88,142 | | | 12 | % |
___________
(1)Includes amounts from TPG Angelo Gordon from November 1, 2023, the date of the Acquisition, through December 31, 2023.
(2)After the Reorganization, we retained an economic interest in performance allocations from the Growth III and Asia VI general partner entities, which entitles us to a performance allocation equal to 10%; however, we intend to allocate the full amount as performance allocation compensation expense. As such, net income available to controlling interest holders is zero for each of these funds following the Reorganization.
(3)The TPG Operating Group Excluded entities’ performance allocations are not a component of net income attributable to TPG following the Reorganization; however, the TPG general partner entities continue to be consolidated by us. We transferred the rights to the performance allocations the TPG Operating Group historically would have received to RemainCo on December 31, 2021. As such, net income available to controlling interest holders will be zero for each of the TPG Operating Group Excluded entities beginning January 1, 2022.
The increase in total performance allocations for the year ended December 31, 2023 compared to the year ended December 31, 2022 was primarily driven by higher realized and unrealized appreciation in TPG VIII, THP I, Growth IV, Growth V, Rise Climate and Rise II. These increases were partially offset by lower realized and unrealized appreciation in TREP III and Asia VI. Performance allocations also increased $127.3 million due to the acquisition of TPG Angelo Gordon primarily due to realized and unrealized appreciation from TPG AG Credit.
As of December 31, 2023, accrued performance allocations presented as investments in the Consolidated Statement of Financial Condition for Common Unit holders TPG Operating Group shared TPG general partner entities totaled $5.3 billion. As of December 31, 2023, accrued performance allocations presented as investments in the Consolidated Statement of Financial Condition for Common Unit holders TPG Operating Group excluded TPG general partner entities totaled $0.4 billion.
Capital Interests. Capital interests income increased by $10.9 million, or 30%, for the year ended December 31, 2023 compared to the year ended December 31, 2022. This change was primarily driven by an increase in income from our investments in TRTX in our Real Estate platform and Rise Climate in our Impact platform. These increases were partially offset by a decrease in income from our investments in TPG VII, TPG VIII and TPG AAF in our Capital platform.
Expenses
Cash-Based Compensation and Benefits. Cash-based compensation and benefits expense increased by $73.7 million, or 16%, for the year ended December 31, 2023 compared to the year ended December 31, 2022. This change was primarily driven by a $63.9 million increase in salaries and benefits driven by an increase in headcount as a result of the Acquisition for the year ended December 31, 2023, and an $8.7 million increase in bonuses for the year ended December 31, 2023.
Equity-Based Compensation. Equity-based compensation expense increased by $27.2 million for the year ended December 31, 2023 compared to the year ended December 31, 2022. This change was primarily attributable to a net $36.6 million increase in expenses largely associated with RSUs granted to TPG employees and certain of our executives and a $12.8 million expense associated with RSUs granted to TPG Angelo Gordon employees as a result of the Angelo Gordon acquisition, partially offset by the vesting of certain Other Awards, as defined in Note 19, during the year ended December 31, 2022.
Performance Allocation Compensation. Performance allocation compensation increased by $175.1 million for the year ended December 31, 2023 compared to the year ended December 31, 2022. This change was primarily attributable to the increase in performance allocations, which drives the compensation allocated to our partners and professionals during the year ended December 31, 2023, inclusive of $103.4 million attributable to TPG Angelo Gordon.
General, Administrative and Other. General and administrative expenses increased by $113.7 million, or 31%, for the year ended December 31, 2023 compared to the year ended December 31, 2022. This change was primarily driven by a $78.0 million increase in professional fees and an increase of $7.6 million in travel and other administrative expenses. General and administrative expense also increased $39.1 million from TPG Angelo Gordon. These increases were partially offset by a decrease in insurance expenses, primarily related to a $20.6 million insurance policy purchased in connection with the IPO during the year ended December 31, 2022.
Depreciation and Amortization. Depreciation and amortization increased by $14.7 million for the year ended December 31, 2023 compared to the year ended December 31, 2022. This change was primarily due to the amortization of intangible assets resulting from the acquisition of Angelo Gordon in November 2023.
Interest Expense. Interest expense increased by $16.9 million, or 78%, for the year ended December 31, 2023 compared to the year ended December 31, 2022, primarily due to higher interest rates on certain borrowings and increased interest expense on draws under our Senior Unsecured Revolving Credit Facility to partially fund the Acquisition.
Expenses of Consolidated TPG Funds and Public SPACs. Expenses of consolidated TPG Funds and Public SPACs decreased by $2.3 million, or 68%, for the year ended December 31, 2023 compared to the year ended December 31, 2022.
Net Gains (Losses) from Investment Activities. Net gains (losses) from investment activities was a gain of $6.6 million for year ended December 31, 2023 compared to a loss of $110.1 million for the year ended December 31, 2022. This change was primarily attributable to a gain of $15.3 million from our investment in Nerdy Inc, partially offset by a loss of $7.7 million from our investment in Vacasa, Inc. during the year ended December 31, 2023.
Interest, Dividends and Other. Interest, dividends and other increased by $33.5 million for the year ended December 31, 2023 compared to the year ended December 31, 2022. This change was primarily driven by additional interest income earned due to higher interest rates during the year ended December 31, 2023 compared to the year ended December 31, 2022.
Unrealized Gains on Derivative Liabilities of Public SPACs. The $0.7 million and $12.4 million of unrealized gain on derivative instruments recognized during the year ended December 31, 2023 and 2022, respectively, were attributable to warrants issued by the consolidated Public SPAC entities and forward purchase agreements held by third parties. The warrants held by public investors and forward purchase agreements are treated as liability instruments rather than equity instruments and subject to mark-to-market adjustments each period. Upon the consummation of acquisitions of target companies by our Public SPACs or the wind down of a Public SPAC, the associated liability will no longer be included in our Consolidated Financial Statements. Pursuant to the redemption of Class A Ordinary shares of AFTR and YTPG during the year ended December 31, 2023, we no longer have any derivative liabilities associated with SPACs in our Consolidated Financial Statements as of December 31, 2023.
Interest, Dividends and Other of Consolidated TPG Funds and Public SPACs. Interest, dividends and other of consolidated TPG Funds and Public SPACs increased by $1.0 million, or 14%, for the year ended December 31, 2023 compared to the year ended December 31, 2022.
Income Tax Expense. Income tax expense increased by $27.8 million for the year ended December 31, 2023 compared to the year ended December 31, 2022 primarily due to the Pre-Closing TPG Transactions, (as defined herein) which resulted in an increase to our valuation allowance for the year ended December 31, 2023.
Year Ended December 31, 2022 Compared to Year Ended December 31, 2021
Revenues
Revenues consisted of the following for the years ended December 31, 2021 and December 31, 2020:
| | | | | | | | | | | | | | | | | | | | | | | |
| Year Ended December 31, |
| 2022 | | 2021 | | Change | | % |
| | | | | | | |
| ($ in thousands) |
| Management fees | $ | 919,830 | | | $ | 718,344 | | | $ | 201,486 | | | 28 | % |
| Transaction, monitoring and other fees, net | 117,422 | | | 104,930 | | | 12,492 | | | 12 | % |
| Expense reimbursements and other | 209,383 | | | 154,630 | | | 54,753 | | | 35 | % |
| Total fees and other | 1,246,635 | | | 977,904 | | | 268,731 | | | 27 | % |
| Performance allocations | 720,106 | | | 3,792,861 | | | (3,072,755) | | | (81) | % |
| Capital interests | 36,146 | | | 205,622 | | | (169,476) | | | (82) | % |
| Total capital allocation-based income | 756,252 | | | 3,998,483 | | | (3,242,231) | | | (81) | % |
| Total revenues | $ | 2,002,887 | | | $ | 4,976,387 | | | $ | (2,973,500) | | | (60) | % |
Fees and other revenues increased by $268.7 million, or 27%, during the year ended December 31, 2022 compared to the year ended December 31, 2021. This change resulted from a $201.5 million increase in management fees, a $54.8 million increase in expense reimbursements and other and a $12.5 million increase in transaction, monitoring and other fees, net.
Management Fees. Management fees increased by $201.5 million, or 28%, for the year ended December 31, 2022 compared to the year ended December 31, 2021. This change was primarily driven by fee earning capital raised resulting in additional management fees of $40.3 million from TPG IX, $22.0 million from Asia VIII, $19.4 million from Rise III and $10.4 million from TPH II, each of which were activated during the third quarter of 2022; $76.2 million from TREP IV, which was activated during the first quarter of 2022; and $65.4 million from Rise Climate, which was activated during the third quarter of 2021. These increases were partially offset by a decrease in management fees of $29.9 million earned from TPG VII resulting from a decrease in fee earning AUM during the year ended December 31, 2022 compared to the year ended December 31, 2021.
Certain management fees in the year ended December 31, 2022 were considered catch-up fees as a result of additional capital commitments from limited partners to Rise Climate and TTAD II in the amount of $2.8 million.
Transaction, Monitoring and Other Fees, Net. Transaction, monitoring and other fees, net increased by $12.5 million, or 12%, for the year ended December 31, 2022 compared to the year ended December 31, 2021. This change was primarily driven by a $9.6 million increase in transaction fees earned from portfolio companies in our Real Estate and Capital platforms and a $5.1 million increase in our Market Solutions platform as a result of increased capital markets activity among our portfolio companies involving our broker-dealer.
Expense Reimbursements and Other. Expense reimbursements and other increased by $54.8 million, or 35%, for the year ended December 31, 2022 compared to the year ended December 31, 2021. This change was primarily driven by a $18.4 million increase in additional reimbursements from TPG funds due to increased fundraising activities, $19.8 million in administrative service fees from RemainCo earned during the year ended December 31, 2022, and a $14.9 million increase in income from services rendered to TPG funds and Portfolio Companies.
Performance Allocations. Performance allocations decreased by $3,072.8 million to $720.1 million, or 81%, for the year ended December 31, 2022 compared to the year ended December 31, 2021. This change was primarily driven by an 8% appreciation of our realized and unrealized portfolio during the year ended December 31, 2022 compared to a 38% appreciation of our realized and unrealized portfolio during the year ended December 31, 2021. Realized performance allocations for the year ended December 31, 2022 and 2021 totaled $1,409.8 million and $1,956.2 million, respectively. The change in unrealized performance allocations for the year ended December 31, 2022 was a loss of $689.7 million. Unrealized performance allocation gains for the year ended December 31, 2021 totaled $1,836.7 million.
The table below highlights performance allocations for the years ended December 31, 2022 and 2021, and separates the entities listed into two categories to reflect the Reorganization: (i) TPG general partner entities from which the TPG Operating Group Common Unit holders are expected to receive a 20% performance allocation and (ii) TPG general partner entities from which the TPG Operating Group Common Unit holders are not expected to receive any performance allocation.
| | | | | | | | | | | | | | | | | | | | | | | |
| Year Ended December 31, |
| 2022 | | 2021 | | Change | | % |
| | | | | | | |
| ($ in thousands) |
| TPG Operating Group Shared: | | | | | | | |
| TPG VII | $ | 171,926 | | | $ | 902,941 | | | $ | (731,015) | | | (81) | % |
| TPG VIII | 445,242 | | | 558,759 | | | (113,517) | | | (20) | % |
TPG IX | 1,146 | | | — | | | 1,146 | | | NM |
Asia VI(1) | (50,005) | | | 381,295 | | | (431,300) | | | (113) | % |
| Asia VII | 9,400 | | | 426,270 | | | (416,870) | | | (98) | % |
| THP I | 5,381 | | | 114,805 | | | (109,424) | | | (95) | % |
THP II | 2,529 | | | — | | | 2,529 | | | NM |
| TES | 11,618 | | | 8,232 | | | 3,386 | | | 41 | % |
TPG AAF | 135,098 | | | 32,237 | | | 102,861 | | | 319 | % |
| Platform: Capital | 732,335 | | | 2,424,539 | | | (1,692,204) | | | (70) | % |
Growth III(1) | (47,831) | | | 64,111 | | | (111,942) | | | (175) | % |
| Growth IV | 21,141 | | | 326,824 | | | (305,683) | | | (94) | % |
| Growth V | 68,890 | | | 82,612 | | | (13,722) | | | (17) | % |
| TTAD I | 455 | | | 108,458 | | | (108,003) | | | (100) | % |
| TDM | 33,305 | | | 54,325 | | | (21,020) | | | (39) | % |
| Platform: Growth | 75,960 | | | 636,330 | | | (560,370) | | | (88) | % |
| Rise I | (16,836) | | | 142,938 | | | (159,774) | | | (112) | % |
| Rise II | 19,739 | | | 69,253 | | | (49,514) | | | (71) | % |
| Platform: Impact | 2,903 | | | 212,191 | | | (209,288) | | | (99) | % |
| TREP III | 12,728 | | | 152,658 | | | (139,930) | | | (92) | % |
| Platform: Real Estate | 12,728 | | | 152,658 | | | (139,930) | | | (92) | % |
| TPEP | 9,107 | | | 29,804 | | | (20,697) | | | (69) | % |
| NewQuest | 784 | | | 16,186 | | | (15,402) | | | (95) | % |
| Strategic Capital | (2,793) | | | 2,793 | | | (5,586) | | | (200) | % |
| Platform: Market Solutions | 7,098 | | | 48,783 | | | (41,685) | | | (85) | % |
| Total TPG Operating Group Shared: | 831,024 | | | 3,474,501 | | | (2,643,477) | | | (76) | % |
| | | | | | | |
| | | | | | | |
| | | | | | | | | | | | | | | | | | | | | | | |
| Year Ended December 31, |
| 2022 | | 2021 | | Change | | % |
| | | | | | | |
| ($ in thousands) |
| TPG Operating Group Excluded: | | | | | | | |
| TPG IV | (569) | | | 3,580 | | | (4,149) | | | (116) | % |
| TPG VI | (19,913) | | | 32,031 | | | (51,944) | | | (162) | % |
| Asia IV | 108 | | | 1,430 | | | (1,322) | | | (92) | % |
| Asia V | (42,864) | | | 74,956 | | | (117,820) | | | (157) | % |
| MMI | 117 | | | 1,333 | | | (1,216) | | | (91) | % |
| TPG TFP | (750) | | | 201 | | | (951) | | | (473) | % |
| Platform: Capital | (63,871) | | | 113,531 | | | (177,402) | | | (156) | % |
| Growth II | 8,977 | | | 45,141 | | | (36,164) | | | (80) | % |
| Growth II Gator | 11,731 | | | 65,167 | | | (53,436) | | | (82) | % |
| Biotech II | 203 | | | (342) | | | 545 | | | 159 | % |
| Biotech III | (34,974) | | | 30,681 | | | (65,655) | | | (214) | % |
| Biotech IV | (533) | | | 1,977 | | | (2,510) | | | (127) | % |
| Biotech V | — | | | (4,095) | | | 4,095 | | | 100 | % |
| Platform: Growth | (14,596) | | | 138,529 | | | (153,125) | | | (111) | % |
| TREP II | (17,337) | | | 40,000 | | | (57,337) | | | (143) | % |
| DASA - Real Estate | (1,507) | | | (1,954) | | | 447 | | | 23 | % |
| Platform: Real Estate | (18,844) | | | 38,046 | | | (56,890) | | | (150) | % |
| TSI | 124 | | | 14,523 | | | (14,399) | | | (99) | % |
| Evercare | (13,731) | | | 13,731 | | | (27,462) | | | (200) | % |
| Platform: Impact | (13,607) | | | 28,254 | | | (41,861) | | | (148) | % |
Total TPG Operating Group Excluded (2) | $ | (110,918) | | | $ | 318,360 | | | $ | (429,278) | | | (135) | % |
| Total Performance Allocations | $ | 720,106 | | | $ | 3,792,861 | | | $ | (3,072,755) | | | (81) | % |
___________
(1)After the Reorganization, we retained an economic interest in performance allocations from the Growth III and Asia VI general partner entities, which entitles us to a performance allocation equal to 10%; however, we intend to allocate the full amount as performance allocation compensation expense. As such, net income available to controlling interest holders is zero for each of these funds following the Reorganization.
(2)The TPG Operating Group Excluded entities’ performance allocations are not a component of net income attributable to TPG following the Reorganization; however, the TPG general partner entities continue to be consolidated by us. We transferred the rights to the performance allocations the TPG Operating Group historically would have received to RemainCo on December 31, 2021. As such, net income available to controlling interest holders will be zero for each of the TPG Operating Group Excluded entities beginning January 1, 2022. See “—Unaudited Pro Forma Condensed Consolidated Financial Information and Other Data” which reflects the projected impact of the Reorganization.
The decrease in total performance allocations for the year ended December 31, 2022 compared to the year ended December 31, 2021 was primarily driven by lower realized and unrealized appreciation in TPG VII, Asia VI, Asia VII, Growth III, Growth IV, THP I, Rise I and TREP III. For the year ended December 31, 2022, our investments have generated realized and unrealized portfolio appreciation of 8% compared to 38% for the year ended December 31, 2021.
As of December 31, 2022, accrued performance allocations presented as investments in the Consolidated Statement of Financial Condition for Common Unit holders TPG Operating Group shared TPG general partner entities totaled $4.1 billion. As of December 31, 2022, accrued performance allocations presented as investments in the Consolidated Statement of Financial Condition for Common Unit holders TPG Operating Group excluded TPG general partner entities totaled $0.6 billion.
Capital Interests. Capital interests income decreased by $169.5 million, or 82%, for the year ended December 31, 2022 compared to the year ended December 31, 2021. This change was primarily driven by a decrease in income from our investments in TPG VII, TPG VIII, Asia VI and Asia VII in our Capital platform, TRTX in our Real Estate platform, Growth III, Growth IV and TTAD I in our Growth platform, and Rise I in our Impact platform. These decreases were partially offset by an increase in income from our investment in AAF in our Capital platform.
Expenses
Cash-Based Compensation and Benefits. Cash-based compensation and benefits expense decreased by $106.0 million, or 18%, for the year ended December 31, 2022 compared to the year ended December 31, 2021. This change was primarily driven by a $127.7 million decrease in bonuses for senior professionals for the year ended December 31, 2022 which, following our Reorganization and IPO, are recorded in performance allocation compensation expense. This decrease was partially offset by increases in salaries and benefits and accrued bonuses of $29.8 million and $11.0 million, respectively, driven by an increase in headcount for the year ended December 31, 2022.
Equity-Based Compensation. Equity-based compensation expense increased by $627.7 million for the year ended December 31, 2022 compared to the year ended December 31, 2021. This change was primarily attributable to the Reorganization and IPO, which resulted in $550.0 million of expense associated with unvested units granted prior to or in conjunction with the IPO to certain of our employees at TPG Partner Holdings, RemainCo, and the TPG Operating Group as well as $77.7 million of expense associated with RSUs granted to TPG employees and certain of our executives upon completion of our IPO in January 2022. We had no such expense during the year ended December 31, 2021.
Performance Allocation Compensation. Performance allocation compensation increased by $416.6 million for the year ended December 31, 2022 compared to the year ended December 31, 2021. This change was primarily attributable to the recognition of partnership distributions to our partners and professionals as compensation expense following our IPO. We had no such expense during the year ended December 31, 2021 as we were a private partnership.
General, Administrative and Other. General and administrative expenses increased by $90.3 million, or 32%, for the year ended December 31, 2022 compared to the year ended December 31, 2021. This change was primarily driven by a $18.4 million increase in expenses related to our fundraising activities that are ultimately reimbursable from TPG funds, a $28.8 million increase in office overhead and other, inclusive of a $20.6 million insurance policy purchased in connection with the IPO and a $26.5 million increase of other administrative expenses.
Depreciation and Amortization. Depreciation and amortization increased by $11.8 million for the year ended December 31, 2022 compared to the year ended December 31, 2021. This change was primarily due to the amortization of intangible assets resulting from the acquisition of NewQuest in July 2021.
Interest Expense. Interest expense increased by $5.3 million, or 33%, for the year ended December 31, 2022 compared to the year ended December 31, 2021 primarily due to higher interest rates on certain borrowings.
Expenses of Consolidated TPG Funds and Public SPACs. Expenses of consolidated TPG Funds and Public SPACs decreased by $17.4 million, or 84%, for the year ended December 31, 2022 compared to the year ended December 31, 2021. This change was primarily driven by a reduction in non-recurring professional services expenses as a result of business combinations associated with TPG PACE Tech Opportunities Corp. (“PACE”) and TPG Pace Solutions Corp. (“TPGS”) during the year ended December 31, 2021.
Net (Losses) Gains from Investment Activities. Net losses from investment activities for the year ended December 31, 2022 were $110.1 million compared to a gain of $353.2 million for the year ended December 31, 2021. This change was primarily attributable to a gain of $122.7 million recognized on the deconsolidation of PACE, a gain of $109.9 million on the deconsolidation of TPGS, and a gain of $95.0 million recognized on the acquisition of NewQuest during the year ended December 31, 2021. Additionally, we incurred losses of $80.4 million and $25.1 million from our investments in Vacasa, Inc. and Nerdy Inc, respectively, during the year ended December 31, 2022. Following the Reorganization, we no longer recognize net gains or losses from certain strategic investments that were transferred to RemainCo on December 31, 2021.
Interest, Dividends and Other. Interest, dividends and other increased by $2.7 million, or 42%, for the year ended December 31, 2022 compared to the year ended December 31, 2021.
Net Gains (Losses) from Investment Activities of Consolidated TPG Funds and Public SPACs. Net gains (losses) from investment activities of consolidated TPG Funds and Public SPACs had no activity during the year ended December 31, 2022 compared to a net gain of $23.4 million for the year ended December 31, 2021. Following certain Reorganization activities, we no longer consolidate TPEP as we do not have a controlling financial interest.
Unrealized Gains on Derivative Liabilities of Public SPACs. The $12.4 million and $211.8 million of unrealized gain on derivative instruments recognized during the year ended December 31, 2022 and 2021, respectively, were attributable to warrants issued by the consolidated Public SPAC entities and forward purchase agreements held by third parties. The warrants held by public investors and forward purchase agreements are treated as liability instruments rather than equity instruments and subject to mark-to-market adjustments each period. Upon the consummation of acquisitions of target companies by our Public SPACs or the wind down of a Public SPAC, the associated liability will no longer be included in our Consolidated Financial Statements.
Interest, Dividends and Other of Consolidated TPG Funds and Public SPACs. Interest, dividends and other of consolidated TPG Funds and Public SPACs decreased by $3.6 million, or 35%, for the year ended December 31, 2022 compared to the year ended December 31, 2021. This change was primarily related to an expense reimbursement of EUR 15.0 million on the termination of a proposed business combination, recognized by TPG Pace Beneficial Finance Corp. during the year ended December 31, 2021. These decreases were partially offset by increased interest income resulting from higher interest rates on the balance of assets held in Trust Accounts by Consolidated Public SPACs.
Income Tax Expense. Income tax expense increased by $23.4 million for the year ended December 31, 2022 compared to the year ended December 31, 2021. This change was due to the Company now being treated as a corporation for U.S. federal and state income taxes in connection with the Reorganization and IPO, beginning in January of 2022.
Unaudited Condensed Consolidated Statements of Financial Condition (U.S. GAAP basis)
| | | | | | | | | | | |
| December 31, |
| 2023 | | 2022 |
| | | |
| ($ in thousands) |
| Assets | | | |
| Cash and cash equivalents | $ | 665,188 | | | $ | 1,107,484 | |
| Investments | 6,724,112 | | | 5,329,868 | |
| Due from affiliates | 418,977 | | | 202,639 | |
| Intangible assets and goodwill | 1,085,587 | | | 366,381 | |
| Other assets | 475,808 | | | 276,177 | |
| Assets of consolidated Public SPACs | — | | | 659,189 | |
| Total assets | $ | 9,369,672 | | | $ | 7,941,738 | |
| | | |
| Liabilities, Redeemable Equity and Equity | | | |
| Debt obligations | $ | 945,052 | | | $ | 444,566 | |
| Due to affiliates | 143,175 | | | 139,863 | |
| Accrued performance allocation compensation | 4,096,052 | | | 3,269,889 | |
| Other liabilities | 824,259 | | | 324,261 | |
| Liabilities of consolidated Public SPACs | — | | | 23,653 | |
| Total liabilities | $ | 6,008,538 | | | $ | 4,202,232 | |
| | | |
| Redeemable equity from consolidated Public SPACs | $ | — | | | $ | 653,635 | |
| | | |
| Equity | | | |
| Class A common stock $0.001 par value, 2,340,000,000 shares authorized (80,596,501 and 79,240,058 shares issued and outstanding as of December 31, 2023 and December 31, 2022, respectively) | $ | 80 | | | $ | 79 | |
| Class B common stock $0.001 par value, 750,000,000 shares authorized (281,657,626 and 229,652,641 shares issued and outstanding as of December 31, 2023 and December 31, 2022, respectively) | 282 | | | 230 | |
| Preferred stock, $0.001 par value, 25,000,000 shares authorized (0 issued and outstanding as of December 31, 2023 and December 31, 2022) | — | | | — | |
| Additional paid-in-capital | 613,476 | | | 506,639 | |
| Retained (deficit) earnings | (34,681) | | | 2,724 | |
| | | |
| Other non-controlling interests | 2,781,977 | | | 2,576,199 | |
| Total equity | 3,361,134 | | | 3,085,871 | |
| Total liabilities, redeemable equity and equity | $ | 9,369,672 | | | $ | 7,941,738 | |
Cash and cash equivalents decreased $442.3 million during the year ended December 31, 2023 primarily due to the acquisition of Angelo Gordon. The acquisition resulted in cash paid of $740.7 million, which is comprised of $270.7 million of cash on hand and $470.0 million of proceeds from drawing on our Senior Unsecured Revolving Credit Facility. This is partially offset by cash and cash equivalents acquired in the transaction of $383.9 million.
Investments increased $1,394.2 million during the year ended December 31, 2023 primarily attributable the acquisition of Angelo Gordon of $1,046.4 million. Investments also increased due to net capital allocation-based income of $855.3 million, which was partially offset by net proceeds from performance allocations of $582.2 million.
Goodwill and intangible assets increased $719.2 million for the year ended December 31, 2023, primarily due to the acquisition of Angelo Gordon. As a result of the acquisition, we recognized $547.5 million of intangible assets and $205.9 million of goodwill.
Debt obligations increased $500.5 million during the year ended December 31, 2023 primarily due to borrowings on our Senior Unsecured Revolving Credit Facility used to finance the Angelo Gordon acquisition.
Accrued performance allocation compensation increased $826.2 million for the year ended December 31, 2023, primarily attributable the acquisition of Angelo Gordon of $745.0 million and net increases in performance fee compensation expense of $591.7 million, partially offset by settlements of performance allocation compensation of $497.8 million during the year ended December 31, 2023.
Other liabilities increased $500.0 million for the year ended December 31, 2023. The majority of the change is attributable to the acquisition of Angelo Gordon which resulted in $99.9 million of lease obligations, $80.3 million of accounts payable and accrued expenses, and $83.3 million of repurchase agreement liabilities as of December 31, 2023. In addition, we recorded contingent consideration related to the acquisition valued at $156.3 million, as well as $73.8 million in amounts payable to the sellers of Angelo Gordon.
Redeemable equity from consolidated Public SPACs decreased $653.6 million primarily due to the redemption of Class A ordinary shares of YTPG and AFTR during the year ended December 31, 2023. See Note 15 to our Consolidated Financial Statements.
Total equity increased $275.3 million, primarily due to the Common Units granted at fair value of $233.9 million in connection with the Angelo Gordon acquisition, as well as net income for the year ended December 31, 2023 of $23.4 million offset by payments of dividends and distributions to our Class A common stockholders and to holders of non-controlling interests in subsidiaries.
Non-GAAP Financial Measures
Distributable Earnings. Distributable Earnings (“DE”) is used to assess performance and amounts potentially available for distributions to partners. DE is derived from and reconciled to, but not equivalent to, its most directly comparable U.S. GAAP measure of net income. DE differs from U.S. GAAP net income computed in accordance with U.S. GAAP in that it does not include (i) unrealized performance allocations and related compensation and benefit expense, (ii) unrealized investment income, (iii) equity-based compensation expense, (iv) net income (loss) attributable to non-controlling interests in consolidated entities, or (v) certain other items, such as contingent reserves.
While we believe that the inclusion or exclusion of the aforementioned U.S. GAAP income statement items provides investors with a meaningful indication of our core operating performance, the use of DE without consideration of the related U.S. GAAP measures is not adequate due to the adjustments described herein. This measure supplements U.S. GAAP net income and should be considered in addition to and not in lieu of the results of operations presented in accordance with U.S. GAAP discussed further under “—Key Components of our Results of Operations—Results of Operations” prepared in accordance with U.S. GAAP.
After-Tax Distributable Earnings. After-tax Distributable Earnings (“After-tax DE”) is a non-GAAP performance measure of our distributable earnings after reflecting the impact of income taxes. We use it to assess how income tax expense affects amounts available to be distributed to our Class A common stock holders and Common Unit holders. After-tax DE differs from U.S. GAAP net income computed in accordance with U.S. GAAP in that it does not include the items described in the definition of DE herein; however, unlike DE, it does reflect the impact of income taxes. Income taxes, for purposes of determining After-tax DE, represent the total U.S. GAAP income tax expense adjusted to include only the current tax expense (benefit) calculated on U.S. GAAP net income before income tax and includes the current payable under our Tax Receivable Agreement, which is recorded within other liabilities in our Consolidated Statements of Financial Condition. Further, the current tax expense (benefit) utilized when determining After-tax DE reflects the benefit of deductions available to the Company on certain expense items that are excluded from the underlying calculation of DE, such as equity-based compensation charges. We believe that including the amount currently payable under the Tax Receivable Agreement and utilizing the current income tax expense (benefit), as described above, when determining After-tax DE is meaningful as it increases comparability between periods and more accurately reflects earnings that are available for distribution to shareholders.
We believe that while the inclusion or exclusion of the aforementioned U.S. GAAP income statement items provides investors with a meaningful indication of our core operating performance, the use of After-tax DE without consideration of the related U.S. GAAP measures is not adequate due to the adjustments described herein. This measure supplements U.S. GAAP net income and should be considered in addition to and not in lieu of the results of operations presented in accordance with U.S. GAAP discussed further under “—Key Components of our Results of Operations-Results of Operations.”
Fee-Related Earnings. Fee-Related Earnings (“FRE”) is a supplemental performance measure and is used to evaluate our business and make resource deployment and other operational decisions. FRE differs from net income computed in accordance with U.S. GAAP in that it adjusts for the items included in the calculation of DE and also adjusts to exclude (i) realized performance allocations and related compensation expense, (ii) realized investment income from investments and financial instruments, (iii) net interest (interest expense less interest income), (iv) depreciation, (v) amortization and (vi) certain non-core income and expenses. We use FRE to measure the ability of our business to cover compensation and operating expenses from fee revenues other than capital allocation-based income. The use of FRE without consideration of the related U.S. GAAP measures is not adequate due to the adjustments described herein.
Fee-Related Revenues. Fee-related revenues is a component of FRE. Fee-related revenues is comprised of (i) management fees, (ii) fee-related performance revenues, (iii) transaction, monitoring and other fees, net, and (iv) other income. Fee-related performance revenues refers to incentive fees from perpetual capital vehicles that are: (i) measured and expected to be received on a recurring basis and (ii) not dependent on realization events from the underlying investments. Fee-related revenue differs from revenue computed in accordance with U.S. GAAP in that it excludes certain reimbursement expense arrangements. Refer to “—Reconciliation to U.S. GAAP Measures” to the comparable line items on the combined statements of operations.
Fee-Related Expenses. Fee-related expenses is a component of FRE. Fee-related expenses differs from expenses computed in accordance with U.S. GAAP in that it is net of certain reimbursement arrangements and does not include performance allocation compensation. Fee-related expenses is used in management’s review of the business. Refer to “—Reconciliation to U.S. GAAP Measures” to the comparable line items on the combined statements of operations.
Fee-related revenues and fee-related expenses are presented separately in our calculation of non-GAAP measures in order to better illustrate the profitability of our FRE. The use of fee-related revenues and FRE without consideration of the related U.S. GAAP measures is not adequate due to the adjustments described herein.
Our calculations of DE, FRE, fee-related revenues and fee-related expenses may differ from the calculations of other investment managers. As a result, these measures may not be comparable to similar measures presented by other investment managers.
The following table sets forth our total FRE and DE for the years ended December 31, 2023, 2022 and 2021:
| | | | | | | | | | | | | | | | | |
| Year Ended December 31, |
| 2023 | | 2022 | | 2021 |
| | | | | |
| ($ in thousands) |
| Management fees | $ | 1,178,721 | | | $ | 929,860 | | | $ | 718,364 | |
| Fee-related performance revenues | 1,642 | | | 5,182 | | | — | |
| Transaction, monitoring and other fees, net | 107,713 | | | 103,896 | | | 102,041 | |
| Other income | 49,178 | | | 47,069 | | | 46,673 | |
| Fee-Related Revenues | 1,337,254 | | | 1,086,007 | | | 867,078 | |
| Cash-based compensation and benefits, net | 452,270 | | | 392,968 | | | 521,413 | |
| Fee-related performance compensation | 1,401 | | | — | | | — | |
| Operating expenses, net | 277,252 | | | 239,189 | | | 167,114 | |
| Fee-Related Expenses | 730,923 | | | 632,157 | | | 688,527 | |
| Fee-Related Earnings | $ | 606,331 | | | $ | 453,850 | | | $ | 178,551 | |
| Realized performance allocations, net | 74,027 | | | 282,383 | | | 999,603 | |
| Realized investment income and other, net | (47,241) | | | 42,038 | | | 92,720 | |
| Depreciation expense | (6,589) | | | (4,590) | | | (6,775) | |
| Interest expense, net | 1,401 | | | (13,795) | | | (14,928) | |
| Distributable Earnings | $ | 627,929 | | | $ | 759,886 | | | $ | 1,249,171 | |
| Income taxes | (42,623) | | | (59,623) | | | (9,308) | |
| After-Tax Distributable Earnings | $ | 585,306 | | (1) | $ | 700,263 | | | $ | 1,239,863 | |
___________
(1)Includes amounts from TPG Angelo Gordon from November 1, 2023, the date of the Acquisition, through December 31, 2023.
Year Ended December 31, 2023 Compared to Year Ended December 31, 2022
Fee-Related Revenues
Fee-related revenues increased by $251.2 million, or 23%, for the year ended December 31, 2023 compared to the year ended December 31, 2022. The increase was primarily due to additional management fees of $248.9 million.
Management Fees
The following table presents management fees in our platforms for the years ended December 31, 2023 and 2022:
| | | | | | | | | | | |
| Year Ended December 31, |
| 2023 | | 2022 |
| | | |
| ($ in thousands) |
| Capital | $ | 513,920 | | | $ | 382,992 | |
| Growth | 155,410 | | | 141,735 | |
| Impact | 201,271 | | | 179,742 | |
| TPG Angelo Gordon | | | |
| TPG AG Credit | 50,477 | | | — | |
| TPG AG Real Estate | 33,589 | | | — | |
| Real Estate | 149,555 | | | 153,908 | |
| Market Solutions | 74,499 | | | 71,483 | |
| Total Management Fees | $ | 1,178,721 | | (1) | $ | 929,860 | |
___________
(1)Includes amounts from TPG Angelo Gordon from November 1, 2023, the date of the Acquisition, through December 31, 2023.
Management fees increased by $248.9 million, or 27%, for the year ended December 31, 2023 compared to the year ended December 31, 2022. This change was largely due to fee earning capital raised resulting in additional management fees of $130.9 million earned from the Capital platform, largely from the activation of TPG IX, Asia VIII and THP II in the third quarter of 2022, partially offset by a decrease of $36.7 million in Asia VII. Management fees also increased $50.5 million and $33.6 million due to the additional fees earned from TPG AG Credit and TPG AG Real Estate, respectively, which we acquired in November 2023. Management fees generated from the Impact platform increased $21.5 million, primarily due to the activation of Rise III in the second quarter of 2022. Management fees for the Growth platform increased $13.7 million primarily from additional actively invested capital in TTAD II, and the activation of LSI in the first quarter of 2023.
Certain management fees totaling $41.5 million earned during the year ended December 31, 2023 were considered catch-up fees as a result of additional capital commitments from limited partners primarily related to TPG IX of $18.0 million, THP II of $8.7 million, Rise III of $6.7 million and Asia VIII in the amount of $6.3 million.
Fee-related Performance Revenues
The following table presents fee-related performance revenues for the years ended December 31, 2023 and 2022:
| | | | | | | | | | | |
| Year Ended December 31, |
| 2023 | | 2022 |
| | | |
| ($ in thousands) |
| TPG AG Credit | $ | 1,642 | | | $ | — | |
| | | |
| Real Estate | — | | | 5,182 | |
| Total Fee-Related Performance Revenues | $ | 1,642 | | (1) | $ | 5,182 | |
___________
(1)Includes amounts from TPG Angelo Gordon from November 1, 2023, the date of the Acquisition, through December 31, 2023.
Fee-related performance revenues decreased $3.5 million for the year ended December 31, 2023 compared to the year ended December 31, 2022. Performance revenues for the year ended December 31, 2022 related to incentive fees earned from TRTX in our Real Estate platform.
Transaction, Monitoring and Other Fees, Net
The following table presents transaction, monitoring and other fees, net in our platforms for the years ended December 31, 2023 and 2022:
| | | | | | | | | | | |
| Year Ended December 31, |
| 2023 | | 2022 |
| | | |
| ($ in thousands) |
| Capital | $ | 2,293 | | | $ | 5,094 | |
| Growth | 386 | | | 647 | |
| Impact | 6,291 | | | 6,730 | |
| TPG Angelo Gordon | | | |
| TPG AG Credit | 739 | | | — | |
| TPG AG Real Estate | 105 | | | — | |
| Market Solutions | 97,899 | | | 91,425 | |
| | | |
| Total Transaction, Monitoring and Other Fees, Net | $ | 107,713 | | (1) | $ | 103,896 | |
___________
(1)Includes amounts from TPG Angelo Gordon from November 1, 2023, the date of the Acquisition, through December 31, 2023.
Transaction, monitoring and other fees, net increased by $3.8 million, or 4%, for the year ended December 31, 2023 compared to the year ended December 31, 2022, primarily attributable to an increase in fees received by our Market Solutions platform as a result of increased capital markets activity among our portfolio companies involving our broker-dealer.
Other Income
The following table presents other income for the years ended December 31, 2023 and 2022:
| | | | | | | | | | | |
| Year Ended December 31, |
| 2023 | | 2022 |
| | | |
| ($ in thousands) |
| Former affiliate funds | $ | 33,141 | | | $ | 27,915 | |
| Other income | 16,037 | | | 19,154 | |
| | | |
| Total Other Income | $ | 49,178 | | (1) | $ | 47,069 | |
___________
(1)Includes amounts from TPG Angelo Gordon from November 1, 2023, the date of the Acquisition, through December 31, 2023.
Total other income increased by $2.1 million, or 4%, for the year ended December 31, 2023 compared to the year ended December 31, 2022.
Fee-Related Expenses
Fee-related expenses increased by $98.8 million, or 16%, for the year ended December 31, 2023 compared to the year ended December 31, 2022, comprised primarily of higher cash-based compensation and benefits, net of $59.3 million and increased operating expenses, net of $38.1 million.
Cash-based Compensation and Benefits, Net
The following table presents cash-based compensation and benefits, net for the years ended December 31, 2023 and 2022:
| | | | | | | | | | | |
| Year Ended December 31, |
| 2023 | | 2022 |
| | | |
| ($ in thousands) |
| Salaries | $ | 237,165 | | | $ | 197,587 | |
| Bonuses | 212,294 | | | 196,083 | |
| Benefits and other | 83,206 | | | 71,061 | |
| Reimbursements | (80,395) | | | (71,764) | |
| Total Cash-Based Compensation and Benefits, Net | $ | 452,270 | | (1) | $ | 392,968 | |
___________
(1)Includes amounts from TPG Angelo Gordon from November 1, 2023, the date of the Acquisition, through December 31, 2023.
Total cash-based compensation and benefits, net increased by $59.3 million, or 15%, for the year ended December 31, 2023 compared to the year ended December 31, 2022. This change was primarily due to an increase in salaries of $39.6 million and benefits and other of $12.1 million as a result of headcount growth due to the acquisition of TPG Angelo Gordon. Total cash-based compensation and benefits, net also increased due to an increase of $16.2 million in bonuses, primarily due to bonus expense for TPG Angelo Gordon. These increases were partially offset by an increase in compensation reimbursements related to services provided to certain fund and portfolio companies of $8.6 million.
Fee-related Performance Compensation
The following table presents fee-related performance compensation for the years ended December 31, 2023 and 2022:
| | | | | | | | | | | |
| Year Ended December 31, |
| 2023 | | 2022 |
| | | |
| ($ in thousands) |
| TPG AG Credit | $ | 1,407 | | | $ | — | |
| TPG AG Real Estate | (6) | | | — | |
| Total Fee-related Performance Compensation | $ | 1,401 | | (1) | $ | — | |
___________
(1)Includes amounts from TPG Angelo Gordon from November 1, 2023, the date of the Acquisition, through December 31, 2023.
Total fee-related performance compensation increased by $1.4 million for the year ended December 31, 2023 compared to the year ended December 31, 2022.
Operating Expenses, Net
Operating expenses, net includes general and administrative expenses as well as reimbursements for professional services and travel expenses related to investment management and advisory services provided to investment funds that we manage and monitoring services provided to our portfolio companies. Operating expenses, net were $277.3 million and $239.2 million for the year ended December 31, 2023 and 2022, respectively, with the increase of $38.1 million primarily due to an increase in professional fees of $22.9 million, travel expenses of $8.2 million, and other administrative expenses of $7.0 million.
Realized Performance Allocations, Net
The following table presents realized performance allocations, net from our platforms for the years ended December 31, 2023 and 2022:
| | | | | | | | | | | |
| Year Ended December 31, |
| 2023 | | 2022 |
| | | |
| ($ in thousands) |
| Capital | $ | 54,513 | | | $ | 250,382 | |
| Growth | 2,139 | | | 13,681 | |
| Impact | 799 | | | 15,961 | |
| TPG Angelo Gordon | | | |
| TPG AG Credit | 5,552 | | | — | |
| TPG AG Real Estate | 389 | | | — | |
| Real Estate | 4,076 | | | 1,110 | |
| Market Solutions | 6,559 | | | 1,249 | |
| Total Realized Performance Allocations, Net | $ | 74,027 | | (1) | $ | 282,383 | |
___________
(1)Includes amounts from TPG Angelo Gordon from November 1, 2023, the date of the Acquisition, through December 31, 2023.
Realized performance allocations, net of $74.0 million for the year ended December 31, 2023 were largely generated from realizations of $39.5 million from TPG AAF and $14.9 million from TPG VIII in the Capital platform, $6.6 million from TPEP in the Market Solutions platform, and $4.1 million from TREP III within the Real Estate platform. Realizations also include $5.6 million primarily from MVP Fund in TPG AG Credit. This activity included realizations sourced from portfolio companies such as Creative Artists Agency, DirecTV and Alloy Properties.
Realized Investment Income and Other, Net
The following table presents realized investment income and other, net for the years ended December 31, 2023 and 2022:
| | | | | | | | | | | |
| Year Ended December 31, |
| 2023 | | 2022 |
| | | |
| ($ in thousands) |
| Investments in TPG funds | $ | 27,543 | | | $ | 82,174 | |
| | | |
| Non-core income (expense) | (74,784) | | | (40,136) | |
| Total Realized Investment Income and Other, Net | $ | (47,241) | | (1) | $ | 42,038 | |
___________
(1)Includes amounts from TPG Angelo Gordon from November 1, 2023, the date of the Acquisition, through December 31, 2023.
Realized investment income and other, net decreased by $89.3 million, or 212%, due to lower realizations of $54.6 million from investments in funds we manage, plus additional non-core expenses of $34.6 million primarily driven by the Acquisition.
Depreciation
Depreciation expense increased $2.0 million, or 44%, for the year ended December 31, 2023 compared to the year ended December 31, 2022.
Interest Expense, Net
The following table presents interest expense, net for the years ended December 31, 2023 and 2022:
| | | | | | | | | | | |
| Year Ended December 31, |
| 2023 | | 2022 |
| | | |
| ($ in thousands) |
| Interest expense | $ | 38,531 | | | $ | 21,601 | |
| Interest (income) | (39,932) | | | (7,806) | |
| Interest Expense, Net | $ | (1,401) | | (1) | $ | 13,795 | |
___________
(1)Includes amounts from TPG Angelo Gordon from November 1, 2023, the date of the Acquisition, through December 31, 2023.
The decrease in interest expense, net during the year ended December 31, 2023 compared to the year ended December 31, 2022 was primarily due to higher interest income from interest earned on cash and cash equivalents, partially offset by higher interest rates on certain borrowings and increased interest expense on draws under our Senior Unsecured Revolving Credit Facility to partially fund the Acquisition.
Distributable Earnings
The decrease in DE for the year ended December 31, 2023 compared to the year ended December 31, 2022 was primarily due to lower realized performance allocations, net, partially offset by a 34% increase in our Fee-Related Earnings.
Income Taxes
Income taxes decreased $17.0 million for the year ended December 31, 2023 compared to the year ended December 31, 2022, driven by lower realized performance allocations, net.
Year Ended December 31, 2022 Compared to Year Ended December 31, 2021
Fee-Related Revenues
Fee-related revenues increased by $218.9 million, or 25%, for the year ended December 31, 2022 compared to the year ended December 31, 2021. The increase was primarily due to additional management fees of $211.5 million and fee-related performance revenues of $5.2 million.
Management Fees
The following table presents management fees in our platforms for the years ended December 31, 2022 and 2021:
| | | | | | | | | | | |
| Year Ended December 31, |
| 2022 | | 2021 |
| | | |
| ($ in thousands) |
| Capital | $ | 382,992 | | | $ | 335,376 | |
| Impact | 179,742 | | | 106,096 | |
| Real Estate | 153,908 | | | 70,442 | |
| Growth | 141,735 | | | 142,388 | |
| Market Solutions | 71,483 | | | 64,062 | |
| Total Management Fees | $ | 929,860 | | | $ | 718,364 | |
Management fees increased by $211.5 million, or 29%, for the year ended December 31, 2022 compared to the year ended December 31, 2021. This change was largely due to fee earning capital raised resulting in additional management fees of $83.5 million earned from the Real Estate platform, primarily as a result of the activation of TREP IV during the first quarter of 2022. Management fees generated from the Impact platform increased $73.6 million, due to the activation of
Rise Climate in the third quarter of 2021, and Rise III in the second quarter of 2022. The Capital platform had an increase of $47.6 million in management fees, largely from the activation of both TPG IX and Asia VIII in the third quarter of 2022, partially offset by a decrease of $30.0 million in TPG VII. The Market Solutions platform also contributed $7.4 million to the overall management fee increase primarily due to the acquisition of NewQuest in July 2021.
Certain management fees earned during the year ended December 31, 2022 were considered catch-up fees as a result of additional capital commitments from limited partners to Rise Climate and TTAD II in the amount of $2.8 million.
Fee-related Performance Revenues
The following table presents fee-related performance revenues for the years ended December 31, 2022 and 2021:
| | | | | | | | | | | |
| Year Ended December 31, |
| 2022 | | 2021 |
| | | |
| ($ in thousands) |
| Real Estate | $ | 5,182 | | | $ | — | |
| | | |
| Total Fee-Related Performance Revenues | $ | 5,182 | | | $ | — | |
Fee-related performance revenues increased $5.2 million for the year ended December 31, 2022 compared to the year ended December 31, 2021, attributable to the Real Estate platform driven by TRTX incentive fees.
Transaction, Monitoring and Other Fees, Net
The following table presents transaction, monitoring and other fees, net in our platforms for the years ended December 31, 2022 and 2021:
| | | | | | | | | | | |
| Year Ended December 31, |
| 2022 | | 2021 |
| | | |
| ($ in thousands) |
| Market Solutions | $ | 91,425 | | | $ | 91,737 | |
| Impact | 6,730 | | | 4,264 | |
| | | |
| Capital | 5,094 | | | 5,545 | |
| Growth | 647 | | | 495 | |
| Total Transaction, Monitoring and Other Fees, Net | $ | 103,896 | | | $ | 102,041 | |
Transaction, monitoring and other fees, net increased by $1.9 million, or 2%, for the year ended December 31, 2022 compared to the year ended December 31, 2021.
Other Income
The following table presents other income for the years ended December 31, 2022 and 2021:
| | | | | | | | | | | |
| Year Ended December 31, |
| 2022 | | 2021 |
| | | |
| ($ in thousands) |
| Former affiliate funds | $ | 27,915 | | | $ | 38,942 | |
| Other income | 19,154 | | | 2,570 | |
| Other investments | — | | | 5,161 | |
Total Other Income(1) | $ | 47,069 | | | $ | 46,673 | |
___________
(1) Includes other income of $13.5 million during the year ended December 31, 2021, generated by certain other investments that were transferred to RemainCo as Excluded Assets on December 31, 2021. Accordingly, there was no impact for the year ended December 31, 2022.
Total other income increased by $0.4 million, or 1%, for the year ended December 31, 2022 compared to the year ended December 31, 2021. This change primarily resulted from an increase in income earned from RemainCo under the RemainCo administrative agreement, offset by the transfer of certain of our strategic investments to RemainCo on December 31, 2021.
Fee-Related Expenses
Fee-related expenses decreased by $56.4 million, or 8%, for the year ended December 31, 2022 compared to the year ended December 31, 2021, comprised primarily of lower cash-based compensation and benefits, net of $128.4 million partially offset by increased operating expenses, net of $72.1 million.
Cash-Based Compensation and Benefits, Net
The following table presents cash-based compensation and benefits, net for the years ended December 31, 2022 and 2021:
| | | | | | | | | | | |
| Year Ended December 31, |
| 2022 | | 2021 |
| | | |
| ($ in thousands) |
| Salaries | $ | 197,587 | | | $ | 169,552 | |
Bonuses(1) | 196,083 | | | 342,276 | |
| Benefits and other | 71,061 | | | 71,065 | |
| Reimbursements | (71,764) | | | (61,480) | |
Total Cash-Based Compensation and Benefits, Net | $ | 392,968 | | | $ | 521,413 | |
___________
(1)Includes bonus compensation of $140.3 million during the year ended December 31, 2021 for TPG senior professionals.
Total cash-based compensation and benefits, net decreased by $128.4 million, or 25%, for the year ended December 31, 2022 compared to the year ended December 31, 2021. This change was primarily due to a decrease in bonuses of $146.2 million as a result of certain TPG senior professionals no longer receiving discretionary bonuses, and increased compensation reimbursements related to services provided to certain fund and portfolio companies. The decrease was partially offset by increased salaries of $28.0 million driven by firm headcount expansion.
Operating Expenses, Net
Operating expenses, net includes general and administrative expenses as well as reimbursements for professional services and travel expenses related to investment management and advisory services provided to TPG funds and monitoring services provided to our portfolio companies. Operating expenses, net were $239.2 million and $167.1 million for the year ended December 31, 2022 and 2021, respectively, with the increase of $72.1 million primarily due to an increase in professional fees of $26.1 million, travel expenses of $19.8 million, and other administrative expenses of $26.3 million.
Realized Performance Allocations, Net
The following table presents realized performance allocations, net from our platforms for the years ended December 31, 2022 and 2021:
| | | | | | | | | | | |
| Year Ended December 31, |
| 2022 | | 2021 |
| | | |
| ($ in thousands) |
| Capital | $ | 250,382 | | | $ | 725,171 | |
| Impact | 15,961 | | | 568 | |
| Growth | 13,681 | | | 234,025 | |
| Real Estate | 1,110 | | | 27,707 | |
| Market Solutions | 1,249 | | | 12,132 | |
Total Realized Performance Allocations, Net(1) | $ | 282,383 | | | $ | 999,603 | |
___________
(1)Includes realized performance allocation, net of $794.9 million during the year ended December 31, 2021 attributable to the TPG Operating Group Excluded entities. As previously described herein, these entities’ performance allocations are not a component of distributable earnings beginning in the fiscal year ending December 31, 2022.
Realized performance allocations, net of $282.4 million for the year ended December 31, 2022 were largely generated from realizations of $191.8 million from TPG VII, $25.9 million from TPG VIII and $19.4 million from Asia VII within the Capital platform. Realizations within the Impact platform of $16.0 million were generated from Rise I. This activity consisted of realizations sourced from portfolio companies including McAfee, Wind River, Kelsey-Seybold Clinics, Greencross, and DirecTV.
Realized performance allocations, net of $999.6 million for the year ended December 31, 2021 were largely generated from realizations in TPG VII of $501.6 million, TPG VI of $173.5 million and Asia VI of $28.4 million in the Capital platform. Realizations from the Growth platform were generated from Growth III of $131.2 million, Growth II of $35.8 million, Biotech III of $27.8 million, TSI of $24.0 million and TTAD I of $11.2 million. Realizations from the Real Estate platform were generated from Real Estate II of $24.5 million. The activity consisted of realizations sourced from portfolio companies including Astound, Kindred at Home, Transplace Holdings, Creative Artists Agency, DirecTV and Medical Solutions.
Realized Investment Income and Other, Net
The following table presents realized investment income and other, net for the years ended December 31, 2022 and 2021:
| | | | | | | | | | | |
| Year Ended December 31, |
| 2022 | | 2021 |
| | | |
| ($ in thousands) |
| Investments in TPG funds | $ | 82,174 | | | $ | 111,151 | |
| Other investments | — | | | 23,647 | |
| Non-core income (expense) | (40,136) | | | (42,078) | |
Total Realized Investment Income and Other, Net(1) | $ | 42,038 | | | $ | 92,720 | |
___________
(1)Includes realized investment income and other, net of $26.0 million during the year ended December 31, 2021 generated by certain other investments that were transferred to RemainCo as of December 31, 2021.
Realized investment income and other, net decreased by $50.7 million, or 55%, resulting from lower realizations of $29.0 million from our investments in TPG funds and the transfer of certain of our strategic investments to RemainCo on December 31, 2021.
Depreciation
Depreciation expense decreased $2.2 million, or 32%, for the year ended December 31, 2022 compared to the year ended December 31, 2021.
Interest Expense, Net
The following table presents interest expense, net for the years ended December 31, 2022 and 2021:
| | | | | | | | | | | |
| Year Ended December 31, |
| 2022 | | 2021 |
| | | |
| ($ in thousands) |
| Interest expense | $ | 21,601 | | | $ | 15,728 | |
| Interest (income) | (7,806) | | | (800) | |
| Interest Expense, Net | $ | 13,795 | | | $ | 14,928 | |
The decrease in interest expense, net during the year ended December 31, 2022 compared to the year ended December 31, 2021 was primarily due to higher interest income from interest earned on cash and cash equivalents, partially offset by higher interest rates on certain borrowings.
Distributable Earnings
The decrease in DE for the year ended December 31, 2022 compared to the year ended December 31, 2021 was primarily due to lower realized performance allocations, net, partially offset by a 154% increase in our Fee-Related Earnings.
Income Taxes
Income taxes increased $50.3 million for the year ended December 31, 2022 compared to the year ended December 31, 2021. The increase in income taxes is a result of the Company being subject to federal income taxes subsequent to the Reorganization and IPO.
Unaudited Non-GAAP Balance Sheet Measures
Book assets, book liabilities and net book value are non-GAAP performance measures of TPG Operating Group’s assets, liabilities and equity on a deconsolidated basis which reflects our investments in subsidiaries as equity method investments. Additionally, the book assets, book liabilities and net book value include the tax assets and liabilities of TPG Inc. We utilize these measures to assess the unrealized value of our book assets after deducting for book liabilities as well as assess our indirect interest in accrued performance allocations from our TPG funds and our co-investments in TPG funds and third-party investments. We believe these measures are useful to investors as they provide additional insight into the net assets of the TPG Operating Group on a deconsolidated basis. These non-GAAP financial measures should not be considered as a substitute for, or superior to, similar financial measures calculated in accordance with U.S. GAAP. These non-GAAP financial measures may differ from the calculations of other alternative asset managers and, as a result, may not be comparable to similar measures presented by other companies. Refer to “––Reconciliation to U.S. GAAP Measures” for reconciliations of the Consolidated Statements of Financial Condition to the non-GAAP Balance Sheet.
The following table sets forth our non-GAAP book assets, book liabilities and net book value as of December 31, 2023 and December 31, 2022:
| | | | | | | | | | | |
| December 31, |
| 2023 | | 2022 |
| ($ in thousands) | | | |
| Book Assets | | | |
| Cash and cash equivalents | $ | 105,480 | | | $ | 691,687 | |
| | | |
| Net accrued performance | 891,455 | | | 642,519 | |
| Investments in funds | 877,802 | | | 576,814 | |
| Intangible assets and goodwill | 1,007,899 | | | 274,481 | |
| Other assets | 679,638 | | | 314,926 | |
| Total Book Assets | $ | 3,562,274 | | | $ | 2,500,427 | |
| Book Liabilities | | | |
| Accounts payable, accrued expenses and other | $ | 296,147 | | | $ | 48,183 | |
| Debt obligations | 945,052 | | | 444,566 | |
| Total Book Liabilities | $ | 1,241,199 | | | $ | 492,749 | |
| Net Book Value | $ | 2,321,075 | | | $ | 2,007,678 | |
| | | |
During the year ended December 31, 2023, net book value increased primarily due to vested equity interest of $233.9 million recognized in connection with the acquisition of Angelo Gordon. Net book value also increased due to increases in net accrued performance and investments in funds, primarily associated with TPG VIII, Rise Climate, Growth V, Growth IV and THP I. This was partially offset by the distribution of proceeds received during the year ended December 31, 2023 from TPG AAF and TPG VIII.
Reconciliation to U.S. GAAP Measures
The following tables reconcile the most directly comparable financial measures calculated and presented in accordance with U.S. GAAP to non-GAAP financial measures for the years ended December 31, 2023, 2022 and 2021:
Revenue
| | | | | | | | | | | | | | | | | |
| Year Ended December 31, |
| 2023 | | 2022 | | 2021 |
| | | | | |
| ($ in thousands) |
| GAAP Revenue | $ | 2,389,911 | | | $ | 2,002,887 | | | $ | 4,976,387 | |
| Capital-allocation based income | (855,285) | | | (756,252) | | | (3,998,483) | |
| | | | | |
| Expense reimbursements | (185,554) | | | (166,090) | | | (132,810) | |
| Investment (income) loss and other | (11,818) | | | 5,462 | | | 21,984 | |
| Fee-Related Revenues | $ | 1,337,254 | | | $ | 1,086,007 | | | $ | 867,078 | |
Expenses
| | | | | | | | | | | | | | | | | |
| Year Ended December 31, |
| 2023 | | 2022 | | 2021 |
| | | | | |
| ($ in thousands) |
| GAAP Expenses | $ | 2,363,803 | | | $ | 1,944,799 | | | $ | 916,566 | |
| Depreciation and amortization expense | (47,673) | | | (32,990) | | | (21,223) | |
| Interest expense | (38,528) | | | (21,612) | | | (16,291) | |
| Expenses related to consolidated TPG Funds and Public SPACs | (1,053) | | | (3,316) | | | (20,764) | |
| | | | | |
| Expense reimbursements | (185,554) | | | (166,090) | | | (132,810) | |
| Performance allocation compensation | (591,676) | | | (416,556) | | | — | |
| Equity-based compensation | (654,922) | | | (627,714) | | | — | |
| Acquisition success fees | (20,000) | | | — | | | — | |
| Non-core expenses and other | (93,474) | | | (44,364) | | | (36,951) | |
| Fee-Related Expenses | $ | 730,923 | | | $ | 632,157 | | | $ | 688,527 | |
Net income
| | | | | | | | | | | | | | | | | |
| Year Ended December 31, |
| 2023 | | 2022 | | 2021 |
| | | | | |
| ($ in thousands) |
| Net income (loss) | $ | 23,385 | | | $ | (56,235) | | | $ | 4,655,997 | |
| Net income attributable to redeemable interests in Public SPACs | (12,044) | | | (14,648) | | | (155,131) | |
| Net income attributable to non-controlling interests in consolidated TPG Funds | — | | | — | | | (19,287) | |
| Net income attributable to other non-controlling interests | (23,662) | | | (11,293) | | | (2,081,170) | |
| | | | | |
| Amortization expense | 26,968 | | | 14,153 | | | 14,195 | |
| Equity-based compensation | 652,814 | | | 634,759 | | | — | |
| Unrealized performance allocations, net | (112,250) | | | 117,924 | | | (856,505) | |
| Unrealized investment (income) loss | (11,836) | | | 48,796 | | | (295,390) | |
| Unrealized gain on derivatives | (59) | | | (1,119) | | | (20,626) | |
| Income taxes | 18,028 | | | (26,454) | | | — | |
| Acquisition success fees | 20,000 | | | — | | | — | |
| Non-recurring and other | 3,962 | | | (5,620) | | | (2,220) | |
| After-tax Distributable Earnings | $ | 585,306 | | | $ | 700,263 | | | $ | 1,239,863 | |
| Income taxes | 42,623 | | | 59,623 | | | 9,308 | |
| Distributable Earnings | $ | 627,929 | | | $ | 759,886 | | | $ | 1,249,171 | |
| Realized performance allocations, net | (74,027) | | | (282,383) | | | (999,603) | |
| Realized investment loss (income) and other, net | 47,241 | | | (42,038) | | | (92,720) | |
| Depreciation expense | 6,589 | | | 4,590 | | | 6,775 | |
| Interest expense, net | (1,401) | | | 13,795 | | | 14,928 | |
| | | | | |
| Fee-Related Earnings | $ | 606,331 | | | $ | 453,850 | | | $ | 178,551 | |
Balance sheet
The following tables reconcile the most directly comparable financial measures calculated and presented in accordance with U.S. GAAP to non-GAAP financial measures as of December 31, 2023 and 2022:
| | | | | | | | | | | | | | |
| | December 31, |
| ($ in thousands) | | 2023 | | 2022 |
| Total GAAP Assets | | $ | 9,369,672 | | | $ | 7,941,738 | |
| Impact of consolidated Public SPACs | | | | |
| Cash and cash equivalents | | — | | | (5,097) | |
| Assets held in Trust Account | | — | | | (653,635) | |
| Due from affiliates | | — | | | (45) | |
| Other assets | | — | | | (412) | |
| Subtotal for consolidated Public SPACs | | — | | | (659,189) | |
| Impact of other consolidated entities | | | | |
| Cash and cash equivalents | | (559,708) | | | (415,797) | |
| Due from affiliates | | (346,910) | | | (211,097) | |
| Investments | | (4,954,855) | | | (4,110,535) | |
| Intangible assets and goodwill | | (77,688) | | | (91,900) | |
| Other assets | | (285,406) | | | (42,605) | |
| Subtotal for other consolidated entities | | (6,224,567) | | | (4,871,934) | |
Reclassification adjustments(1) | | | | |
| Restricted cash | | (13,183) | | | (13,166) | |
| Due from affiliates | | (72,067) | | | 8,458 | |
| Investments | | (1,769,257) | | | (1,219,333) | |
| Net accrued performance | | 891,455 | | | 642,519 | |
| Investments in funds | | 877,802 | | | 576,814 | |
| Other assets | | 502,419 | | | 94,520 | |
| Subtotal for reclassification adjustments | | 417,169 | | | 89,812 | |
| Total Book Assets | | $ | 3,562,274 | | | $ | 2,500,427 | |
| | | | |
| | | | | | | | | | | | | | |
| | December 31, |
| ($ in thousands) | | 2023 | | 2022 |
| Total GAAP Liabilities | | $ | 6,008,538 | | | $ | 4,202,232 | |
| Impact of consolidated Public SPACs | | | | |
| Accounts payable and accrued expenses | | — | | | (236) | |
| Derivative liabilities of Public SPACs | | — | | | (667) | |
| Deferred underwriting | | — | | | (22,750) | |
| Subtotal for consolidated Public SPACs | | — | | | (23,653) | |
| Impact of other consolidated entities | | | | |
| Accounts payable and accrued expenses | | (167,235) | | | (90,685) | |
| Due to affiliates | | (137,479) | | | (134,562) | |
| Accrued performance allocation compensation | | (4,096,052) | | | (3,269,889) | |
| Other liabilities | | (377,727) | | | (206,276) | |
| Subtotal for other consolidated entities | | (4,778,493) | | | (3,701,412) | |
Reclassification adjustments(1) | | | | |
| Accounts payable and accrued expenses | | 291,586 | | | 40,698 | |
| Due to affiliates | | (5,696) | | | (5,301) | |
| Other liabilities | | (274,736) | | | (19,815) | |
| Subtotal for reclassification adjustments | | 11,154 | | | 15,582 | |
| Total Book Liabilities | | $ | 1,241,199 | | | $ | 492,749 | |
| | | | |
| Total GAAP redeemable equity from consolidated Public SPACs | | $ | — | | | $ | 653,635 | |
Impact of consolidated TPG Funds and Public SPACs(2) | | — | | | (653,635) | |
| Total Book redeemable equity from consolidated Public SPACs | | $ | — | | | $ | — | |
| Total GAAP Equity | | $ | 3,361,134 | | | $ | 3,085,871 | |
| Impact of consolidated Public SPACs | | — | | | 18,099 | |
| Impact of other consolidated entities | | (1,446,074) | | | (1,170,522) | |
Reclassification adjustments(1) | | 406,015 | | | 74,230 | |
| Net Book Value | | $ | 2,321,075 | | | $ | 2,007,678 | |
___________(1)Certain amounts were reclassified to reflect how we utilize our non-GAAP balance sheet measures. We separately analyze our investments on a non-GAAP basis between accrued performance fees and other investments, which consists of co-investments into our funds and other equity method investments. Additionally, we reclassified U.S. GAAP financial statement amounts due from affiliates and certain amounts within other assets, net for non-GAAP purposes and reclassified U.S. GAAP financial statement amounts due to affiliates and other liabilities within accounts payable, accrued expenses and other for non-GAAP purposes.
(2)The $653.6 million redeemable equity represents ownership interest in each SPAC that is not owned by the TPG Operating Group and is presented separately from U.S. GAAP partners’ capital in the accompanying Consolidated Financial Statements.
SUPPLEMENTAL UNAUDITED PRO FORMA CONDENSED COMBINED FINANCIAL INFORMATION AND OTHER DATA
Defined terms included below have the same meaning as terms defined and included elsewhere in this Form 10-K.
The following unaudited pro forma condensed combined statement of operations for the year ended December 31, 2023 depicts the accounting required under U.S. GAAP for the Acquisition, the related borrowing under the Senior Unsecured Revolving Credit Facility and certain changes in compensation arrangements assuming they occurred on January 1, 2023. An unaudited pro forma condensed combined statement of financial condition is not presented because the Acquisition, the related borrowing under the Senior Unsecured Revolving Credit Facility and certain changes in compensation arrangements are fully reflected in the consolidated statement of financial condition of TPG Inc. as of December 31, 2023 in this Annual Report on Form 10-K. The following unaudited pro forma condensed combined financial information has been prepared in accordance with Article 11 of Regulation S-X. Management believes this pro forma presentation is meaningful as the Acquisition is a material acquisition, which occurred close to year-end.
Pursuant to the Transaction Agreement, TPG purchased the Acquired Interests for a combination of cash, vested Common Units, the Aggregate Annual Cash Holdback Amount and the portion of the Earnout Payment not considered compensatory under U.S. GAAP. Total consideration in accordance with U.S. GAAP was $1,145.9 million (“Purchase Price”) as described in Note 2. All Common Units issued were accompanied by an equal number of Class B Shares.
TPG funded the cash consideration for the Acquisition by drawing $470.0 million under its Senior Unsecured Revolving Credit Facility and paid the remainder with cash on hand.
In addition to the Purchase Price, TPG issued to certain Angelo Gordon partners unvested Common Units and RSUs under the TPG Omnibus Plan, in each case as reflected in the Transaction Agreement. The issuance of the unvested Common Units and RSUs is considered compensation under U.S. GAAP, and is subject to ongoing service requirements intended to promote retention. Additionally, following the consummation of the Acquisition, TPG aligned the compensation structure for Angelo Gordon partners with TPG’s, which resulted in replacing some historically received cash-based compensation with a greater share of performance allocation compensation.
The unaudited pro forma condensed combined financial information is being furnished solely for informational purposes and is not necessarily indicative of the results of operations that might have been achieved for the period indicated, nor is it necessarily indicative of the future results of the combined company. It does not reflect potential revenue synergies or cost savings expected to be realized from the Acquisition. No assurance can be given that cost savings or synergies will be realized at all. The adjustments contained in the unaudited pro forma condensed combined financial information are based on currently available information and assumptions that we believe are reasonable in order to reflect, on a pro forma basis, the effect of the Acquisition, the financing and the change in compensation arrangements for Angelo Gordon subsequent to the closing of the Acquisition. Such assumptions include, but are not limited to, the Purchase Price allocation of Angelo Gordon’s assets acquired and liabilities assumed based on fair value and post-combination compensation expense. The unaudited pro forma condensed combined financial information does not project TPG’s results of operations for any future period or date.
The unaudited pro forma condensed consolidated financial information should be read together with “Management’s Discussion and Analysis of Financial Condition and Results of Operations” and the historical financial statements and related notes included elsewhere in this Annual Report on Form 10-K.
| | | | | | | | | | | | | | | | | | | | | | | | | | | | | | | | | | | | | | | | | |
| Unaudited Pro Forma Condensed Combined Statement of Operations and Other Data |
| For the Year Ended December 31, 2023 |
| Historical | | | | | | | | | | |
| For the Year Ended December 31, 2023 | | For the period January 1 through October 31, 2023 | | | | | | | | | | |
| ($ in thousands, except share and per share amounts) | TPG Inc. | | Angelo Gordon | | Transaction Accounting Adjustments | | Notes | | Transaction Accounting Compensation Adjustments | | Notes | | Pro Forma Combined |
| Revenues | | | | | | | | | | | | | |
| Fees and other | $ | 1,534,626 | | | $ | 483,413 | | | $ | (464) | | | 3 (A), (D) | | $ | — | | | | | $ | 2,017,575 | |
| Capital allocation-based income (loss) | 855,285 | | | 173,329 | | | (1,046) | | | 3 (A) | | — | | | | | 1,027,568 | |
| Total revenues | 2,389,911 | | | 656,742 | | | (1,510) | | | | | — | | | | | 3,045,143 | |
| Expenses | | | | | | | | | | | | | |
| Compensation and benefits: | | | | | | | | | | | | | |
| Cash-based compensation and benefits | 547,377 | | | 338,226 | | | — | | | | | (92,720) | | | 3 (J) | | 792,883 | |
| Equity-based compensation | 654,922 | | | 13,438 | | | — | | | | | 267,507 | | | 3 (H) | | 935,867 | |
| Performance allocation compensation | 591,676 | | | 83,337 | | | — | | | | | 52,880 | | | 3 (I) | | 727,893 | |
| Total compensation and benefits | 1,793,975 | | | 435,001 | | | — | | | | | 227,667 | | | | | 2,456,643 | |
| General, administrative and other | 482,574 | | | 245,116 | | | 839 | | | 3 (A), (E) | | (4,887) | | | 3 (I) | | 723,642 | |
| Depreciation and amortization | 47,673 | | | 8,315 | | | 70,300 | | | 3 (B) | | — | | | | | 126,288 | |
| Interest expense | 38,528 | | | 5,776 | | | 23,505 | | | 3 (C) | | — | | | | | 67,809 | |
| Expenses of consolidated Public SPACs and Investment Funds: | | | | | | | | | | | | | |
| Interest expense | — | | | 50,450 | | | (50,450) | | | 3 (A) | | — | | | | | — | |
| General, administrative and other | — | | | 956 | | | (956) | | | 3 (A) | | — | | | | | — | |
| Other | 1,053 | | | — | | | — | | | | | — | | | | | 1,053 | |
| Total expenses | 2,363,803 | | | 745,614 | | | 43,238 | | | | | 222,780 | | | | | 3,375,435 | |
| Investment income | | | | | | | | | | | | | |
| Income (loss) from investments: | | | | | | | | | | | | | |
| Net gains (losses) from investment activities | 6,564 | | | (3,736) | | | — | | | | | — | | | | | 2,828 | |
| Interest, dividends and other | 42,622 | | | 17,584 | | | — | | | | | — | | | | | 60,206 | |
| Investment income of consolidated Public SPACs and Investment Funds: | | | | | | | | | | | | | |
| Unrealized gains (losses) on derivative liabilities of Public SPACs | 667 | | | — | | | — | | | | | — | | | | | 667 | |
| Net gains (losses) from consolidated fund investment activities | — | | | (12,148) | | | 12,148 | | | 3 (A) | | — | | | | | — | |
| Interest, dividends and other | 7,692 | | | 64,855 | | | (64,855) | | | 3 (A) | | — | | | | | 7,692 | |
| Total investment income (loss) | 57,545 | | | 66,555 | | | (52,707) | | | | | — | | | | | 71,393 | |
| Income (loss) before income taxes | 83,653 | | | (22,317) | | | (97,455) | | | | | (222,780) | | | | | (258,899) | |
| Income tax expense | 60,268 | | | 4,412 | | | (8,266) | | | 3 (F) | | (10,174) | | | 3 (F) | | 46,240 | |
| Net (loss) income | 23,385 | | | (26,729) | | | (89,189) | | | | | (212,606) | | | | | (305,139) | |
| Less: | | | | | | | | | | | | | |
| Net income attributable to redeemable equity in Public SPACs | 12,044 | | | — | | | — | | | | | — | | | | | 12,044 | |
| Net loss attributable to non-controlling interests in TPG Operating Group | (92,411) | | | — | | | (88,245) | | | 3 (G) | | (178,547) | | | 3 (H), (I) | | (359,203) | |
| Net income (loss) attributable to other non-controlling interests | 23,662 | | | (1,332) | | | 1,332 | | | 3 (G) | | — | | | | | 23,662 | |
| Net income attributable to TPG Inc./controlling interest | $ | 80,090 | | | $ | (25,397) | | | $ | (2,276) | | | | | $ | (34,059) | | | | | $ | 18,358 | |
| Pro forma net income (loss) per share data: | | | | | | | | | | | | | |
| Net income available to Class A common stock per share | | | | | | | | | | | | | |
| Basic | $ | 0.89 | | | | | | | | | | | | | $ | 0.17 | |
| Diluted | $ | (0.04) | | | | | | | | | | | | | $ | (0.77) | |
| Weighted-average shares of Class A common stock outstanding | | | | | | | | | | | | | |
| Basic | 80,334,871 | | | | | | | | | | | | 80,596,501 |
| Diluted | 317,944,496 | | | | | | | | | | | | 362,254,127 |
Notes to Unaudited Pro Forma Condensed Combined Financial Information
Note 1 – Basis of Presentation
The unaudited pro forma condensed combined financial information is derived from TPG’s and Angelo Gordon’s historical audited and unaudited consolidated financial statements and depicts the accounting for the Acquisition using the acquisition method of accounting in accordance with ASC 805, Business Combinations, with TPG being deemed the accounting acquirer. ASC 805 references fair value, as defined under ASC 820, Fair Value Measurements and Disclosures. Fair value determinations are inherently subjective, and reasonable persons evaluating the same facts and circumstances may develop different assumptions and arrive at different estimates. The accounting for the related financing and the change in compensation arrangements is depicted under ASC 835, Interest, and ASC 718, Compensation - Stock Compensation, respectively.
Note 2 – Purchase Price
The following table provides additional information on the total Purchase Price (in thousands):
| | | | | | | | |
Cash(1) | | $ | 740,703 | |
Amounts payable to seller(2) | | 18,845 | |
Common Units(3) | | 233,894 | |
Fair value of Aggregate Annual Cash Holdback Amount(4) | | 125,158 | |
Fair value of Earnout Payment(5) | | 27,315 | |
Total Purchase Price | | $ | 1,145,915 | |
_________________
1.Represents the closing cash consideration of $740.7 million which is comprised of $270.7 million of cash on hand and $470.0 million of proceeds from drawing on the Company’s Senior Unsecured Revolving Credit Facility. Out of the closing cash consideration of $740.7 million, $100.0 million was held in escrow on behalf of the sellers.
2.Represents the expected difference between the Estimated Cash Consideration paid at closing and the Final Cash Consideration to be determined no later than 120 days from closing in accordance with the terms of the Transaction Agreement.
3.Represents the fair value of approximately 9.2 million vested Common Units granted to the Angelo Gordon partners upon consummation of the Acquisition. The fair value of Common Units is based on a $28.18 closing price for the shares of Class A common stock on the Acquisition Date, adjusted for a discount for lack of marketability. Approximately 43.8 million unvested Common Units and 8.4 million RSUs available to be granted in connection with the Acquisition were considered compensatory under U.S. GAAP and not part of the Purchase Price.
4.Represents the estimated fair value of the Aggregate Annual Cash Holdback Amount of up to $150.0 million, which is payable in three equal annual installments of $50.0 million, subject to the absence of promote shortfall in each respective calendar year (2024, 2025, and 2026). The estimated fair value of $125.2 million, reflected as contingent consideration, was determined using a present value approach. Inputs to fair value include the present value period and the discount rate applied to the annual payments.
5.Represents the estimated fair value of the non-compensatory portion of the Earnout Payment expected to be paid in the form of cash and vested Common Units to Angelo Gordon partners upon satisfaction of certain FRR targets during the Measurement Period. This amount, reflected as contingent consideration, was determined using a multiple probability simulation approach. Inputs to the fair value include probability adjusted FRR amounts and FRR target thresholds. The compensatory portion of the Earnout Payment to the Angelo Gordon partners is treated as post-combination compensation expense, as services are required from such partners post-Closing.
The total Purchase Price was allocated to the fair value of assets acquired and liabilities assumed as of the Acquisition Date, with the excess Purchase Price recorded as goodwill. A third-party valuation specialist assisted the Company with the fair value estimates for the assets acquired and liabilities assumed. As the Acquisition Date was close to December, 31, 2023, the purchase accounting analysis is subject to subsequent adjustments that are identified through the measurement period, which is limited to one year from the Acquisition Date.
Note 3 - Transaction Accounting Adjustments to Unaudited Pro Forma Condensed Statement of Operations
(A)Reflects statement of operations activities that will not continue for the combined company, including:
1.Removal of amounts related to Angelo Gordon’s CLOs that were deconsolidated in Angelo Gordon’s unaudited consolidated financial statements as of June 30, 2023 in accordance with the terms of the Transaction Agreement. Such activities include:
i.Removal of interest expense of $50.5 million, general, administrative and other of $1.0 million and total net investment income of $52.7 million for the year ended December 31, 2023.
ii.Recognition of $3.0 million in management fee income (before the management fee reduction adjustment in Note (D)) and $1.0 million of capital allocation-based loss for the year ended December 31, 2023.
2.Removal of $1.3 million recorded within Angelo Gordon’s general, administrative and other expenses, related to an insurance policy for a founder partner of Angelo Gordon that did not continue after closing.
(B)The following table presents the amortization expense of the acquired finite lived intangible assets following the consummation of the Acquisition (refer to Note 3 to our Consolidated Financial Statements for estimated fair values and useful lives):
| | | | | | | | |
| ($ in thousands) | | Year Ended December 31, 2023 |
| Trade name | | $ | 2,818 | |
| Technology | | 11,500 | |
| Acquired carried interest | | 30,615 | |
| Investment management agreements | | 34,761 | |
| Non-compete agreements | | 4,667 | |
Less: Related intangible amortization recorded within historical TPG financials: | | (14,061) | |
| Total amortization pro forma adjustment | | $ | 70,300 | |
(C)Reflects an adjustment to interest expense of $25.2 million for the year ended December 31, 2023 related to the $470.0 million draw on the Company’s Senior Unsecured Revolving Credit Facility using an estimated effective interest rate of 6.54% per annum based on the terms of the facility. The effective interest rate is based on the one-month SOFR plus 110 basis points. The portion of historical unused commitment fee was reversed, partially offsetting the increase in interest expense. A 0.25% change in the interest rate of the Senior Unsecured Revolving Credit Facility would cause a corresponding increase or decrease in interest expense of $1.2 million for the year ended December 31, 2023.
This adjustment also reflects the removal of interest expense of $1.7 million for the year ended December 31, 2023 as a result of the repayment and termination of an Angelo Gordon credit facility prior to closing.
(D)Represents the reduction of management fee income related to a certain fund where TPG did not acquire 100% of the on-going management fee stream. This arrangement results in a reduction of management fees of $3.5 million for the year ended December 31, 2023.
(E)Represents the net increase of Angelo Gordon lease expense of $2.1 million for the year ended December 31, 2023, as a result of remeasuring Angelo Gordon’s right of use asset and lease liability balances in conjunction with the Acquisition.
(F)TPG Operating Group has been and is expected to continue to be treated as partnerships for U.S. federal and state income tax purposes. Following the Acquisition, the income from the Acquired Interests allocable to TPG Inc. from its ownership interest in the TPG Operating Group, is subject to U.S. federal income taxes and local income taxes.
As a result, the unaudited pro forma condensed combined financial information reflects adjustments to income tax expense to incorporate the income tax effects in connection with the additional allocable income from the Acquired Interests and the transaction accounting adjustments attributable to TPG Inc. at a blended statutory income tax rate of 23.0%. The blended statutory income tax rate was calculated on a pro forma basis, assuming the U.S. federal rate currently in effect of 21% and the statutory income tax rates applicable to each state and local jurisdiction where we estimate our income will be taxable.
The applicable blended statutory tax rate used for the unaudited pro forma condensed combined financial information will likely vary from the actual effective tax rates in future periods subsequent to the Acquisition.
The following table summarizes pro forma income tax expense associated with Transaction Accounting Adjustments:
| | | | | | | | |
| ($ in thousands) | | Year Ended December 31, 2023 |
| Additional allocable income from the Acquired Interests | | $ | (25,397) | |
| Transaction Accounting Adjustments attributable to TPG Inc. | | (10,542) | |
| Additional net income attributable to TPG Inc. | | (35,939) | |
| TPG Inc. effective tax rate | | 23.0 | % |
| Total income tax expense pro forma adjustment associated with Transaction Accounting Adjustments | | $ | (8,266) | |
The following table summarizes pro forma income tax expense associated with Transaction Accounting Compensation Adjustments:
| | | | | | | | |
| ($ in thousands) | | Year Ended December 31, 2023 |
| Transaction Accounting Compensation Adjustments attributable to TPG Inc. | | $ | (44,234) | |
| TPG Inc. effective tax rate | | 23.0 | % |
| Total income tax expense pro forma adjustment associated with Transaction Accounting Compensation Adjustments | | $ | (10,174) | |
(G)For purposes of the unaudited pro forma condensed combined statement of operations, TPG owns approximately 25.31% of the Common Units, while non-controlling interest holders of the TPG Operating Group, including former Angelo Gordon partners who received Common Units, own the remaining 74.69% for the year ended December 31, 2023. The following table presents the calculation of the pro forma income attributable to other non-controlling interests in the TPG Operating Group:
| | | | | | | | |
| ($ in thousands) | | Year Ended December 31, 2023 |
| Loss before provision for income taxes | | $ | (258,899) | |
| Less: | | |
| Provision for local and foreign income taxes | | 64,680 | |
| Net income attributable to redeemable equity in Public SPACs | | 12,044 | |
| Allocable Income | | (335,623) | |
| Less: | | |
| Net loss attributable to non-controlling interest in TPG Operating Group and its consolidated subsidiaries | | (359,203) | |
| Net income attributable to other non-controlling interests | | 23,662 | |
| TPG Inc.’s income before provision for income taxes in the TPG Operating Group | | (82) | |
| Provision for income taxes | | (18,440) | |
| Net income attributable to TPG Inc. | | $ | 18,358 | |
In order to reflect the net loss attributable to non-controlling interests in TPG Operating Group and to adjust historical allocations of loss to non-controlling interests for Angelo Gordon, we made pro forma adjustments of $88.2 million and $1.3 million, respectively, for the year ended December 31, 2023.
Transaction Accounting Adjustment - Compensation Adjustments
As described in the summary of the Acquisition above, TPG issued unvested Common Units and RSUs to Angelo Gordon partners that are considered compensatory under U.S. GAAP and are not included in the Purchase Price. Such offering of equity instruments is considered a separate transaction entered into between TPG and Angelo Gordon and is therefore presented separately from the Acquisition.
(H)At Closing, TPG issued to certain partners approximately 43.8 million unvested Common Units. TPG also granted approximately 7.0 million RSUs to certain partners and professionals out of a pool of 8.4 million RSUs. The unvested Common Units and RSUs were determined to be compensatory for the combined company. The unvested Common Units and RSUs will generally vest over five years, subject to the recipient’s continued provision of services to the combined company through the vesting date.
A total grant date fair value of $1,110.4 million for the unvested Common Units will be recognized as post-combination compensation expense during the periods in which the Angelo Gordon partners provide services. The grant date fair value of the unvested Common Units is based on the same inputs as the vested Common Units as detailed in Note 2. The issuance of such unvested Common Units results in the recognition of an additional $186.9 million of compensation expense for year ended December 31, 2023.
A total grant date fair value of $201.8 million for the RSUs will be recognized as post-combination compensation expense during the periods in which the Angelo Gordon partners and employees provide services. The grant date fair value of the RSUs is based on the closing price for the shares of Class A common stock on the grant date. The RSU grants result in the recognition of an additional $31.9 million of compensation expense for the year ended December 31, 2023.
Additionally, post-combination expense is recognized for the portion of the Earnout Payment that requires provision of on-going services from Angelo Gordon partners. As the Earnout Payment contains both a performance condition and a requisite service period, the Company recognizes compensation expense using the accelerated attribution method. The compensatory portion of the Earnout Payment results in the recognition of an additional $62.1 million of compensation expense for the year ended December 31, 2023.
Angelo Gordon historical equity-based compensation of $13.4 million for the year ended December 31, 2023 is reversed.
(I)Reflects the additional performance allocation income that is attributed to certain partners of Angelo Gordon as a result of an additional 30% increase in their share of performance allocations. Approximately $52.9 million for the year ended December 31, 2023 is reflected as additional performance allocation compensation allocated to those Angelo Gordon partners and professionals. Within this amount, approximately $4.9 million represents cash amounts paid to certain legacy interest holders of Angelo Gordon, which were reflected within General, administrative and other expenses during the year ended December 31, 2023.
(J)Reflects the reduction of cash-based bonuses that were historically paid to certain Angelo Gordon partners and professionals and reflected within compensation and benefits, net. After the Acquisition, the share of performance allocations to certain Angelo Gordon partners and professionals increased to approximately 80%. Additionally, share-based compensation was granted to such partners in the form of unvested Common Units (as discussed in Note (H). The reduction of cash-based bonuses amounts to $92.7 million for year ended December 31, 2023.
Note 4 - Earnings Per Share
The following table presents a reconciliation of the numerator and denominator used to compute pro forma basic and diluted net income (loss) per share (in thousands, except share and per share data):
| | | | | | | | | | | |
| | | | | Year Ended December 31, 2023 |
Pro forma basic net income per share: | | | | | |
| Numerator: | | | | | |
Net loss | | | | | $ | (305,139) | |
| Less: | | | | | |
Net income attributable to redeemable equity in Public SPACs | | | | | 12,044 | |
Net loss attributable to non-controlling interests in TPG Operating Group | | | | | (359,203) | |
Net income attributable to other non-controlling interests | | | | | 23,662 | |
| Net income attributable to Class A Common Stockholders prior to distributions | | | | | 18,358 | |
| Reallocation of earnings to unvested participating restricted stock units(a) | | | | | (5,024) | |
| Net income attributable to Class A Common Stockholders - Basic | | | | | 13,334 | |
Reallocation of loss from participating securities assuming exchange of Common Units | | | | | (291,293) | |
Net loss attributable to Class A Common Stockholders - Diluted | | | | | $ | (277,959) | |
| Denominator: | | | | | |
Class A Common Stock outstanding - Basic(1) | | | | | 80,596,501 |
Exchange of Common Units to Class A Common Stock(2) | | | | | 281,657,626 |
Shares of Common Stock Outstanding - Diluted | | | | | 362,254,127 |
| | | | | |
| Net income (loss) available to Class A common stock per share | | | | | |
| Basic | | | | | $ | 0.17 | |
| Diluted | | | | | $ | (0.77) | |
_________________1.Represents the Class A Common Stock outstanding at Transaction closing.
2.The assumed exchange of Common Units to Class A Common Stock includes closing Common Units of 228.7 million and 53.0 million vested and unvested Common Units granted to the Angelo Gordon partners upon consummation of the Acquisition.
In computing the dilutive effect, if any, that share-based awards would have on earnings per share, TPG considers the reallocation of net income between holders of its Class A Shares and non-controlling interests.
Unaudited Pro Forma Non-GAAP Financial Measures
Distributable Earnings. DE is used to assess performance and amounts potentially available for distributions to partners. DE is derived from and reconciled to, but not equivalent to, its most directly comparable U.S. GAAP measure of net income. DE differs from U.S. GAAP net income computed in accordance with U.S. GAAP in that it does not include (i) unrealized performance allocations and related compensation and benefit expense, (ii) unrealized investment income, (iii) equity-based compensation expense, (iv) net income (loss) attributable to non-controlling interests in consolidated entities or (v) certain non-cash items, such as contingent reserves.
While TPG and Angelo Gordon believe that the inclusion or exclusion of the aforementioned U.S. GAAP income statement items provides investors with a meaningful indication of core operating performance, the use of DE without consideration of the related U.S. GAAP measures is not adequate due to the adjustments described herein. This measure supplements U.S. GAAP net income and should be considered in addition to and not in lieu of the results of operations presented in accordance with U.S. GAAP.
After-Tax Distributable Earnings. After-tax DE is a non-GAAP performance measure of our distributable earnings after reflecting the impact of income taxes. We use it to assess how income tax expense affects amounts available to be distributed to holders of our Class A Shares and Common Unit holders. After-tax DE differs from U.S. GAAP net income computed in accordance with U.S. GAAP in that it does not include the items described in the definition of DE herein; however, unlike DE, it does reflect the impact of income taxes. Income taxes, for purposes of determining After-tax DE, represent the total U.S. GAAP income tax expense adjusted to include only the current tax expense (benefit) calculated on U.S. GAAP net income before income tax and includes the current payable under our Tax Receivable Agreement, which is recorded within other liabilities in our Consolidated Statement of Financial Condition. Further, the current tax expense (benefit) utilized when determining After-tax DE reflects the benefit of deductions available to TPG on certain expense items that are excluded from the underlying calculation of DE, such as equity-based compensation charges. We believe that including the amount currently payable under the Tax Receivable Agreement and utilizing the current income tax expense (benefit), as described above, when determining After-tax DE is meaningful as it increases comparability between periods and more accurately reflects earnings that are available for distribution to stockholders.
TPG and Angelo Gordon believe that while the inclusion or exclusion of the aforementioned U.S. GAAP income statement items provides investors with a meaningful indication of core operating performance, the use of After-tax DE without consideration of the related U.S. GAAP measures is not adequate due to the adjustments described herein. This measure supplements U.S. GAAP net income and should be considered in addition to and not in lieu of the results of operations presented in accordance with U.S. GAAP.
Fee-Related Earnings. FRE is a supplemental performance measure and is used to evaluate our business and make resource deployment and other operational decisions. FRE differs from net income computed in accordance with U.S. GAAP in that it adjusts for the items included in the calculation of DE and also adjusts to exclude (i) realized performance allocations and related compensation expense, (ii) realized investment income from investments and financial instruments, (iii) net interest (interest expense less interest income), (iv) depreciation, (v) amortization and (vi) certain non-core income and expenses. We use FRE to measure the ability of our business to cover compensation and operating expenses from fee revenues other than capital allocation-based income. The use of FRE without consideration of the related U.S. GAAP measures is not adequate due to the adjustments described herein.
Fee-Related Revenues. Fee-related revenues is a component of FRE. Fee-related revenues is comprised of (i) management fees, (ii) fee-related performance revenues, (iii) transaction, monitoring and other fees, net, and (iv) other income. Fee-related performance revenues refers to incentive fees from perpetual capital vehicles that are: (i) measured and expected to be received on a recurring basis and (ii) not dependent on realization events from the underlying investments. Fee-related revenue differs from revenue computed in accordance with U.S. GAAP in that it excludes certain reimbursement expense arrangements. Refer to “Angelo Gordon Information—Management’s Discussion and Analysis of Financial Condition and Results of Operations of Angelo Gordon—Reconciliation to U.S. GAAP Measures” to the comparable line items on the combined statements of operations.
Fee-Related Expenses. Fee-related expenses is a component of FRE. Fee-related expenses differs from expenses computed in accordance with U.S. GAAP in that it is net of certain reimbursement arrangements and does not include performance allocation compensation. Fee-related expenses is used in our review of the business. Refer to “Angelo Gordon Information—Management’s Discussion and Analysis of Financial Condition and Results of Operations of Angelo Gordon—Reconciliation to U.S. GAAP Measures” to the comparable line items on the combined statements of operations.
The following table sets forth the pro forma non-GAAP financial measures after Adjustments for the year ended December 31, 2023:
| | | | | | | | | | | | | | | | | | | | | | | | | | | | | | | | | | | | | | | | | |
| Year Ended December 31, 2023 |
| Historical | | Pro Forma Adjustments | | |
| ($ in thousands) | TPG Inc. | | Angelo Gordon | | Transaction Accounting Adjustments | | Notes | | Transaction Compensation Adjustments | | Notes | | Pro Forma
Non-GAAP Combined |
| Management fees | $ | 1,178,721 | | | $ | 401,193 | | | $ | (3,451) | | | (6) | | $ | — | | | | | $ | 1,576,463 | |
| Transaction, monitoring, and other fees, net | 107,713 | | | 2,798 | | | — | | | | | — | | | | | 110,511 | |
| Fee-related performance revenues | 1,642 | | | 7,828 | | | 1,173 | | | (5) | | — | | | | | 10,643 | |
| Other income | 49,178 | | | (295) | | | — | | | | | — | | | | | 48,883 | |
| Fee Related Revenues | 1,337,254 | | | 411,524 | | | (2,278) | | | | | — | | | | | 1,746,500 | |
| Cash-based compensation and benefits, net | 452,270 | | | 327,246 | | | — | | | | | (92,720) | | | (9) | | 686,796 | |
| Fee-related performance compensation | 1,401 | | | 3,914 | | | — | | | | | — | | | | | 5,315 | |
| Operating expenses, net | 277,252 | | | 77,159 | | | 839 | | | (1), (2) | | (4,887) | | | (8) | | 350,363 | |
| Fee Related Expenses | 730,923 | | | 408,319 | | | 839 | | | | | (97,607) | | | | | 1,042,474 | |
| Total Fee-Related Earnings | $ | 606,331 | | | $ | 3,205 | | | $ | (3,117) | | | | | $ | 97,607 | | | | | $ | 704,026 | |
| Realized performance allocations, net | 74,027 | | | 85,038 | | | — | | | | | (39,713) | | | (8) | | 119,352 | |
| Realized investment income and other, net | (47,241) | | | (48,037) | | | — | | | | | — | | | | | (95,278) | |
| Depreciation expense | (6,589) | | | (8,882) | | | — | | | | | — | | | | | (15,471) | |
| Interest expense, net | 1,401 | | | 10,810 | | | (23,505) | | | (3), (4) | | — | | | | | (11,294) | |
| Distributable Earnings | $ | 627,929 | | | $ | 42,134 | | | $ | (26,622) | | | | | $ | 57,894 | | | | | $ | 701,335 | |
| Income taxes | (42,623) | | | (4,246) | | | (794) | | | (7) | | (2,963) | | | (7) | | (50,626) | |
| After-Tax Distributable Earnings | $ | 585,306 | | | $ | 37,888 | | | $ | (27,416) | | | | | $ | 54,931 | | | | | $ | 650,709 | |
Notes to the Unaudited Pro Forma Non-GAAP Financial Measures
Transaction Accounting Adjustments
1.Relates to the removal of charges related to an insurance program of $1.3 million for the year ended December 31, 2023, that did not continue after the consummation of the Acquisition.
2.Relates to additional lease expense of $2.1 million as a result of the Acquisition.
3.Relates to the removal of interest expense of $1.7 million for the year ended December 31, 2023 for an Angelo Gordon credit facility that was repaid and terminated on September 25, 2023.
4.The Senior Unsecured Revolving Credit Facility carries an interest rate of 1 Month Term SOFR plus 110 basis points. The impact of the adjustment is an increase to interest expense of $25.2 million for year ended December 31, 2023.
5.Relates to an increase to Fee-related performance revenues of $1.2 million for the year ended December 31, 2023 that would have been allocable to TPG as of January 1, 2023 for pro forma purposes.
6.Represents the reduction of management fee income related to a certain fund where the Company did not acquire 100% of the on-going management fee interests. This arrangement results in a reduction of management fees of $3.5 million for the year ended December 31, 2023.
7.The TPG Operating Group has been and is expected to continue to be treated as partnerships for U.S. federal and state income tax purposes. Following the Acquisition, the income from the Acquired Interests allocable to TPG Inc. from its partnership interest in the TPG Operating Group, will be subject to U.S. federal income taxes in addition to state and local income taxes.
As a result, the pro forma non-GAAP financial measure incorporates the income tax effect in connection with the additional allocable income from the Acquired Interests and the transaction accounting adjustments attributable to TPG Inc. at a blended statutory income tax rate of 23.0%. The blended statutory income tax rate was calculated on a
pro forma basis, assuming the U.S. federal rate currently in effect of 21% and the statutory income tax rates applicable to each state and local jurisdiction where we estimate our income will be taxable.
Transaction Accounting Adjustments - Compensation Related
As described in the summary of the Acquisition above, TPG issued unvested Common Units and RSUs to Angelo Gordon partners that are considered compensatory and not included in the Purchase Price. Such offering of equity instruments was considered a separate transaction entered into by TPG and Angelo Gordon and is therefore presented separately from the Acquisition
8.Following the consummation of the Acquisition, TPG Operating Group received 20% of the performance allocations associated with the general partner entities of Angelo Gordon that TPG Operating Group retained an economic interest in. TPG increased the share of performance allocations of certain partners and professionals from 45%-60% to approximately 80%. The impact of this is a decrease in realized performance fees, net of $39.7 million for the year ended December 31, 2023 Within this amount, approximately $4.9 million represents cash amounts paid to certain legacy interest holders of Angelo Gordon, which were included within operating expenses, net during the year ended December 31, 2023.
9.This adjustment reflects the reduction of cash-based bonuses that were historically paid to Angelo Gordon partners within compensation and benefits, net, resulting in a decrease of $92.7 million for the year ended December 31, 2023. After the Acquisition, the share of performance allocations for certain Angelo Gordon partners were increased to approximately 80%.
| | | | | |
| ($ in thousands) | Year Ended December 31, 2023 |
| Total Pro Forma GAAP Net Loss | $ | (305,139) | |
| Net income attributable to redeemable equity in Public SPACs | (12,044) | |
| Net income attributable to other non-controlling interests | (8,630) | |
| Amortization expense | 97,268 | |
| Equity-based compensation expense | 933,420 | |
| Unrealized performance allocations, net | (114,014) | |
Unrealized investment income | (7,676) | |
Unrealized gains on derivatives | (59) | |
| Income-tax expense | (3,669) | |
Acquisition success fees | 63,824 | |
| Non-recurring and other | 7,428 | |
| Pro Forma After-tax Distributable Earnings | $ | 650,709 | |
| Income tax expense | 50,626 | |
| Pro Forma Distributable Earnings | $ | 701,335 | |
| Realized performance fees, net | (119,352) | |
| Realized investment income and other, net | 95,278 | |
| Depreciation expense | 15,471 | |
| Interest expense, net | 11,294 | |
| Total Pro Forma Fee-Related Earnings | $ | 704,026 | |
Operating Metrics
We monitor certain operating metrics that are common to the alternative asset management industry and that we believe provide important data regarding our business. The following operating metrics do not include other investments that are not included in the TPG Operating Group.
Assets Under Management
Assets Under Management (“AUM”) represents the sum of:
i.fair value of the investments and financial instruments held by our private equity, credit and real estate funds (including fund-level asset-related leverage), other than as described below, as well as related co-investment vehicles managed or advised by us, plus the capital that we are entitled to call from investors in those funds and vehicles, pursuant to the terms of their respective capital commitments, net of outstanding leverage associated with subscription-related credit facilities, and including capital commitments to funds that have yet to commence their investment periods;
ii.the gross amount of assets (including leverage where applicable) for our real estate investment trusts and BDCs;
iii.the net asset value of certain of our hedge funds;
iv.the aggregate par amount of collateral assets, including principal cash, for our collateralized loan obligation vehicles; and
v.IPO proceeds held in trust, excluding interest, as well as forward purchase agreements and proceeds associated with the private investment in public equity related to our Public SPACs upon the consummation of a business combination.
Our definition of AUM is not based on any definition of AUM that may be set forth in the agreements governing the investment funds that we manage, or calculated pursuant to any regulatory definitions.
The tables below present rollforwards of our total AUM for the years ended December 31, 2023, 2022 and 2021:
| | | | | | | | | | | | | | | | | |
| Year Ended December 31, |
| 2023 | | 2022 | | 2021 |
| | | | | |
| ($ in millions) |
| Balance as of Beginning of Period | $ | 135,034 | | | $ | 113,618 | | | $ | 89,526 | |
Acquisition(1) | 75,305 | | | — | | | — | |
| Capital Raised | 15,743 | | | 30,024 | | | 20,456 | |
| Realizations | (10,234) | | | (14,017) | | | (24,103) | |
Outflows(2) | (1,135) | | | (1,156) | | | (872) | |
Changes in Investment Value and Other(3) | 6,910 | | | 6,565 | | | 28,611 | |
| AUM as of end of period | $ | 221,623 | | | $ | 135,034 | | | $ | 113,618 | |
___________(1)Represents AUM of TPG Angelo Gordon as of November 1, 2023.
(2)Outflows represent redemptions and withdrawals.
(3)Changes in Investment Value and Other consists of changes in fair value, capital invested, available capital, and net fund-level asset related leverage activity plus other investment activities, including MITT’s acquisition of the assets of Western Asset Mortgage Capital Corporation during December 2023.
The following table summarizes our AUM by platform as of December 31, 2023, 2022 and 2021: | | | | | | | | | | | | | | | | | |
| | | | | |
| December 31, |
| 2023 | | 2022 | | 2021 |
| | | | | |
| ($ in millions) |
| Capital | $ | 71,310 | | | $ | 66,392 | | | $ | 55,337 | |
| Growth | 26,516 | | | 23,138 | | | 21,960 | |
| Impact | 19,079 | | | 16,429 | | | 13,549 | |
| TPG Angelo Gordon | | | | | |
| TPG AG Credit | 59,631 | | | — | | | — | |
| TPG AG Real Estate | 18,268 | | | — | | | — | |
| Real Estate | 17,940 | | | 19,503 | | | 12,678 | |
| Market Solutions | 8,879 | | | 9,572 | | | 10,094 | |
| AUM as of end of period | $ | 221,623 | | | $ | 135,034 | | | $ | 113,618 | |
AUM increased from approximately $135.0 billion as of December 31, 2022 to approximately $221.6 billion as of December 31, 2023. This increase was primarily attributable to the $75.3 billion of assets managed by TPG Angelo Gordon, which we acquired in November 2023. During the year ended December 31, 2023, new capital of $15.7 billion was raised primarily attributable to TPG IX and THP II within the Capital platform, Growth VI within the Growth platform, Rise III within the Impact platform and TRECO within the Real Estate platform. Realizations totaled $10.2 billion and were primarily attributable to TPG VI, TPG VIII, Asia VI and TPG AAF within the Capital platform and TREP III within the Real Estate platform.
AUM increased from approximately $113.6 billion as of December 31, 2021 to approximately $135.0 billion as of December 31, 2022. During the year ended December 31, 2022, new capital of $30.0 billion was raised primarily attributable to TPG IX, Asia VIII and THP II within the Capital platform, TREP IV within the Real Estate platform and Rise III within the Impact platform. Realizations totaled $14.0 billion and were primarily attributable to TPG VII, TPG VIII and Asia VII within the Capital platform, Growth IV within the Growth platform, TRTX and TREP III within the Real Estate platform and Rise I within the Impact platform. AUM also increased due to portfolio appreciation of 8% recognized during the year ended December 31, 2022.
Fee Earning Assets Under Management
Fee earning AUM, or FAUM, represents only the AUM from which we are entitled to receive management fees. FAUM is the sum of all the individual fee bases that are used to calculate our management fees and differs from AUM in the following respects: (i) assets and commitments from which we are not entitled to receive a management fee are excluded (e.g., assets and commitments with respect to which the firm is entitled to receive only performance allocations or are otherwise not currently entitled to receive a management fee) and (ii) certain assets, primarily in our credit and real estate funds, have different methodologies for calculating management fees that are not based on the fair value of the respective funds’ underlying investments. We believe this measure is useful to investors as it provides additional insight into the capital base upon which we earn management fees. Our definition of FAUM is not based on any definition of AUM or FAUM that is set forth in the agreements governing the investment funds and products that we manage.
The table below present rollforwards of our FAUM for the years ended December 31, 2023, 2022 and 2021:
| | | | | | | | | | | | | | | | | |
| | | | | |
| Year Ended December 31, |
| 2023 | | 2022 | | 2021 |
| | | | | |
| ($ in millions) |
| Balance as of Beginning of Period | $ | 77,945 | | | $ | 60,094 | | | $ | 50,655 | |
Acquisition(1) | 51,624 | | | — | | | — | |
Fee Earning Capital Raised(2) | 9,005 | | | 23,769 | | | 10,443 | |
Net Change in Investment Activity(3) | 1,719 | | | (215) | | | (137) | |
Outflows(4) | (1,109) | | | (1,150) | | | (866) | |
Reduction in Fee Base of Certain Funds(5) | (2,389) | | | (4,553) | | | (1) | |
| FAUM as of end of period | $ | 136,794 | | | $ | 77,945 | | | $ | 60,094 | |
___________(1)Represents FAUM of TPG Angelo Gordon as of November 1, 2023.
(2)Fee Earning Capital Raised represents capital raised by our funds for which management fees calculated based on commitments were activated during the period.
(3)Net Change in Investment Activity includes capital called or invested during the period, net of return of capital distributions and changes in net asset value of hedge funds. It also includes adjustments related to funds with a fee structure based on the lower of cost or fair value.
(4)Outflows represent redemptions and withdrawals.
(5)Reduction in Fee Base represents decreases in the fee basis for funds where the investment or commitment fee period has expired, and the fee base has reduced from commitment base to actively invested capital. It also includes reductions for funds that are no longer fee paying.
The following table summarizes our FAUM by platform as of December 31, 2023, 2022 and 2021:
| | | | | | | | | | | | | | | | | |
| December 31, |
| 2023 | | 2022 | | 2021 |
| | | | | |
| ($ in millions) |
| Capital | $ | 38,972 | | | $ | 35,371 | | | $ | 26,208 | |
| Growth | 12,339 | | | 10,830 | | | 10,514 | |
| Impact | 13,727 | | | 12,739 | | | 10,801 | |
| TPG Angelo Gordon | | | | | |
| TPG AG Credit | 40,005 | | | — | | | — | |
| TPG AG Real Estate | 14,035 | | | — | | | — | |
| Real Estate | 11,298 | | | 13,324 | | | 6,235 | |
| Market Solutions | 6,418 | | | 5,681 | | | 6,336 | |
| FAUM as of end of period | $ | 136,794 | | | $ | 77,945 | | | $ | 60,094 | |
FAUM increased from $77.9 billion as of December 31, 2022 to $136.8 billion as of December 31, 2023. The increase was primarily attributable to $51.6 billion of assets managed by TPG Angelo Gordon, which we acquired in November 2023. This increase was also related to fee earning capital raised activity totaling $9.0 billion primarily attributable to the subsequent closings of TPG IX, Asia VIII and THP II within the Capital platform, which were activated during the third quarter of 2022, LSI and Growth VI within Growth platform, which were activated during the first and fourth quarters of 2023, respectively, and Rise III and TPG Next in the Impact platform, which were activated during the second quarter of 2022 and the fourth quarter of 2023, respectively. These increases were partially offset by a $1.2 million decrease in actively invested capital related to TPG AAF. For the year ended December 31, 2023, annualized weighted average management fees as a percentage of FAUM, which represent annualized management fees divided by the average of each applicable period’s FAUM, were 1.10%.
FAUM increased from $60.1 billion as of December 31, 2021 to $77.9 billion as of December 31, 2022. The increase was related to fee earning capital raised activity totaling $23.8 billion primarily attributable to the activation of TPG IX, Asia VIII and THP II within the Capital platform, which were activated during the third quarter of 2022. The increase was also attributable to the activation of TREP IV in the Real Estate platform, which was activated during the first quarter of 2022 and the activation of Rise III in the Impact platform, which was activated during the second quarter of 2022. These increases were partially offset by a decrease in actively invested capital of TPG VII within the Capital platform and reduction in fee base of TPG VIII and Asia VII within the Capital platform. For the year ended December 31, 2022, annualized weighted average management fees as a percentage of FAUM, which represent annualized management fees divided by the average of each applicable period’s FAUM, were 1.35%.
Net Accrued Performance
Net accrued performance represents both unrealized and undistributed performance allocations and fee-related performance revenues resulting from our general partner interests in investment funds that we manage. We believe this measure is useful to investors as it provides additional insight into the accrued performance to which the TPG Operating Group Common Unit holders are expected to receive.
The table below summarizes our net accrued performance by fund vintage year and platform as of December 31, 2023 and 2022:
| | | | | | | | | | | |
| December 31, |
| 2023 | | 2022 |
| | | |
| ($ in millions) |
| Fund Vintage | | | |
| 2017 & Prior | $ | 363 | | | $ | 298 | |
| 2018 | 77 | | | 54 | |
| 2019 | 269 | | | 193 | |
| 2020 | 104 | | | 62 | |
| 2021 | 56 | | | 35 | |
| 2022 | 22 | | | 1 | |
| Net Accrued Performance | $ | 891 | | | $ | 643 | |
| | | | | | | | | | | |
| December 31, |
| 2023 | | 2022 |
| | | |
| ($ in millions) |
| Platform | | | |
| Capital | $ | 404 | | | $ | 362 | |
| Growth | 185 | | | 162 | |
| Impact | 107 | | | 62 | |
| TPG Angelo Gordon | | | |
| TPG AG Credit | 59 | | | — | |
| TPG AG Real Estate | 97 | | | — | |
| Real Estate | 12 | | | 30 | |
| Market Solutions | 27 | | | 27 | |
| Net Accrued Performance | $ | 891 | | | $ | 643 | |
Net accrued performance were primarily comprised of TPG VII, TPG VIII, THP I, Asia VII, Growth IV, Growth V, Rise I, Rise II and Rise Climate as of December 31, 2023 and TPG VII, TPG VIII, Asia VII and Growth IV as of December 31, 2022.
We also utilize Performance Generating AUM and Performance Eligible AUM as key metrics to understand AUM that could produce performance allocations or fee related performance revenues. Performance Generating AUM refers to
the AUM of funds we manage that are currently above their respective hurdle rate or preferred return, and profit of such funds are being allocated to, or earned by, us in accordance with the applicable limited partnership agreements or other governing agreements. Performance Eligible AUM refers to the AUM that is currently, or may eventually, produce performance allocations or fee-related performance revenues. All funds for which we are entitled to receive a performance allocation incentive fee or fee-related performance revenue are included in Performance Eligible AUM.
Performance Generating AUM totaled $150.8 billion and $85.3 billion as of December 31, 2023 and December 31, 2022, respectively. Across the investment funds that we manage, Performance Eligible AUM totaled $191.8 billion and $121.0 billion as of December 31, 2023 and December 31, 2022, respectively.
AUM Subject to Fee Earning Growth
AUM Subject to Fee Earning Growth represents capital commitments that when deployed have the ability to grow our fees through earning new management fees (AUM Not Yet Earning Fees) or when management fees can be charged at a higher rate as capital is invested or for certain funds as management fee rates increase during the life of a fund (FAUM Subject to Step-Up).
AUM Not Yet Earning Fees represents the amount of capital commitments to TPG’s funds and co-investment vehicles that has not yet been invested or considered active, and as this capital is invested or activated, the fee-paying portion will be included in FAUM. FAUM Subject to Step-Up represents capital raised within certain funds where the management fee rate increases once capital is invested or as a fund reaches a certain point in its life where the fee rate for certain investors increases. FAUM Subject to Step-Up is included within FAUM.
The table below reflects AUM Subject to Fee Earning Growth by platform as of December 31, 2023, 2022 and 2021:
| | | | | | | | | | | | | | | | | |
| | | | | |
| December 31, |
| 2023 | | 2022 | | 2021 |
| | | | | |
| ($ in millions) |
| AUM Not Yet Earning Fees: | | | | | |
| Capital | $ | 2,444 | | | $ | 3,551 | | | $ | 1,054 | |
| Growth | 2,979 | | | 2,863 | | | 3,279 | |
| Impact | 173 | | | 939 | | | 258 | |
| TPG Angelo Gordon | | | | | |
| TPG AG Credit | 3,721 | | | — | | | — | |
| TPG AG Real Estate | 1,206 | | | — | | | — | |
| Real Estate | 2,720 | | | 1,172 | | | 1,201 | |
| Market Solutions | 809 | | | 1,573 | | | 1,056 | |
| Total AUM Not Yet Earning Fees | $ | 14,052 | | | $ | 10,098 | | | $ | 6,848 | |
| | | | | |
| FAUM Subject to Step-Up: | | | | | |
| Capital | $ | 1,565 | | | $ | 2,129 | | | $ | 1,865 | |
| TPG Angelo Gordon | | | | | |
| TPG AG Credit | 6,389 | | | — | | | — | |
| TPG AG Real Estate | 2,389 | | | — | | | — | |
| Real Estate | — | | | 777 | | | 678 | |
| Total FAUM Subject to Step-Up: | 10,343 | | | 2,906 | | | 2,543 | |
| Total AUM Subject to Fee Earning Growth | $ | 24,395 | | | $ | 13,004 | | | $ | 9,391 | |
As of December 31, 2023, AUM Not Yet Earning Fees was $14.1 billion, which primarily consisted of TPG VIII and Asia VII within the Capital platform, TTAD II and TDM within the Growth platform, TREP III and TAC+ within the Real Estate platform, MMDL V and Credit Solutions II within TPG AG Credit and Asia Realty IV and Japan Value within TPG AG Real Estate.
As of December 31, 2022, AUM Not Yet Earning Fees was $10.1 billion, which primarily consisted of TPG VII, TPG VIII and Asia VII within the Capital platform, TTAD II and TDM within the Growth platform, TAC+ within the Real Estate platform and TSCF within the Market Solutions platform.
Associated with FAUM Subject to Step-Up, management fee rates on undrawn commitments for these respective underlying funds range between 0.05% and 1.70% and step-up to rates in the range of 0.25% and 1.75% after capital is invested or as a fund reaches a certain point in its life where the fee rate for certain investors increases. FAUM Subject to Step-Up as of December 31, 2023 relates primarily to TPG IX within the Capital platform, MMDL IV, MMDL V and Credit Solutions II within TPG AG Credit and Realty Value XI and Asia Realty V within TPG AG Real Estate.
Capital Raised
Capital raised is the aggregate amount of subscriptions and capital raised by our investment funds and co-investment vehicles during a given period, as well as the senior and subordinated notes issued through the firm’s CLOs and equity raised through our perpetual vehicles. We believe this measure is useful to investors as it measures access to capital across TPG and our ability to grow our management fee base. The table below presents capital raised by platform for the years ended December 31, 2023, 2022 and 2021:
| | | | | | | | | | | | | | | | | |
| Year Ended December 31, |
| 2023 | | 2022 | | 2021 |
| | | | | |
| ($ in millions) |
| Capital | $ | 9,047 | | | $ | 15,319 | | | $ | 4,174 | |
| Growth | 2,673 | | | 2,207 | | | 4,893 | |
| Impact | 1,047 | | | 3,616 | | | 7,172 | |
| TPG Angelo Gordon | | | | | |
| TPG AG Credit | 694 | | | — | | | — | |
| TPG AG Real Estate | 370 | | | — | | | — | |
| Real Estate | 994 | | | 7,295 | | | 1,970 | |
| Market Solutions | 918 | | | 1,587 | | | 2,247 | |
| Total Capital Raised | $ | 15,743 | | (1) | $ | 30,024 | | | $ | 20,456 | |
___________
(1)Includes amounts from TPG Angelo Gordon from November 1, 2023, the date of the Acquisition, through December 31, 2023.
Capital raised totaled approximately $15.7 billion for the year ended December 31, 2023. This was primarily attributable to the fundraising activities of TPG IX and THP II within the Capital platform, Growth VI within the Growth platform, Rise III within the Impact platform and TRECO within the Real Estate platform during the year ended December 31, 2023.
Capital raised totaled approximately $30.0 billion for the year ended December 31, 2022. This was primarily attributable to the fundraising activities of TPG IX, Asia VIII and THP II within the Capital platform, Rise III within the Impact platform, TREP IV within the Real Estate platform and TDM within the Growth platform during the year ended December 31, 2022.
Available Capital
Available capital is the aggregate amount of unfunded capital commitments and recallable distributions that partners have committed to our funds and co-investment vehicles to fund future investments, as well as IPO and forward purchase agreement proceeds associated with our Public SPACs, and private investment in public equity commitments by investors upon the consummation of a business combination associated with our Public SPACs. Available capital is reduced for investments completed using fund-level subscription-related credit facilities; however, it is not reduced for investments that we have committed to make yet remain unfunded at the reporting date. We believe this measure is useful to investors as it provides additional insight into the amount of capital that is available to our investment funds and co-investment vehicles to make future investments. The table below presents available capital by platform as of December 31, 2023, 2022 and 2021:
| | | | | | | | | | | | | | | | | |
| December 31, |
| 2023 | | 2022 | | 2021 |
| | | | | |
| ($ in millions) |
| Capital | $ | 17,056 | | | $ | 19,759 | | | $ | 10,696 | |
| Growth | 5,021 | | | 4,211 | | | 4,943 | |
| Impact | 4,761 | | | 7,697 | | | 7,951 | |
| TPG Angelo Gordon | | | | | |
| TPG AG Credit | 7,087 | | | — | | | — | |
| TPG AG Real Estate | 7,344 | | | — | | | — | |
| Real Estate | 8,370 | | | 8,193 | | | 2,278 | |
| Market Solutions | 1,683 | | | 3,098 | | | 2,552 | |
| Available Capital | $ | 51,322 | | | $ | 42,958 | | | $ | 28,420 | |
Available capital increased from approximately $43.0 billion as of December 31, 2022 to approximately $51.3 billion as of December 31, 2023. The change was attributable to the $14.4 billion of available capital for TPG Angelo Gordon, which we acquired in November 2023. Available capital for TPG AG Credit related to MMDL V and Essential Housing II within TPG AG Credit and Realty Value XI, Europe Realty IV and Asia Realty V within TPG AG Real Estate. Available capital also increased due to fundraising activities of THP II within the Capital platform, Growth VI within the Growth platform and TRECO within the Real Estate platform during the year ended December 31, 2023. These increases were partially offset by capital invested in TPG IX and Asia VIII within the Capital platform, Growth V within the Growth platform, Rise Climate within the Impact platform and TREP IV within the Real Estate platform.during the year ended December 31, 2023.
Available capital increased from approximately $28.4 billion as of December 31, 2021 to approximately $43.0 billion as of December 31, 2022. The increase was attributable to capital raised in TPG IX, Asia VIII and THP II within the Capital platform, TREP IV within the Real Estate platform, and Rise III within the Impact platform, partially offset by capital invested in TPG VIII within the Capital platform and Rise Climate within the Impact platform.
Capital Invested
Capital invested is the aggregate amount of capital invested during a given period by our investment funds, co-investment vehicles, CLOs, as well as SPACs in conjunction with the completion of a business combination and increases in gross assets of certain perpetual funds. It excludes certain hedge fund activity, but includes investments made using investment financing arrangements like credit facilities, as applicable. We believe this measure is useful to investors as it measures capital deployment across the firm. The table below presents capital invested by platform for the years ended December 31, 2023, 2022 and 2021:
| | | | | | | | | | | | | | | | | |
| Year Ended December 31, |
| 2023 | | 2022 | | 2021 |
| | | | | |
| ($ in millions) |
| Capital | $ | 9,988 | | | $ | 6,250 | | | $ | 10,624 | |
| Growth | 2,198 | | | 3,123 | | | 3,333 | |
| Impact | 3,909 | | | 3,667 | | | 1,711 | |
| TPG Angelo Gordon | | | | | |
| TPG AG Credit | 3,081 | | | — | | | — | |
| TPG AG Real Estate | 322 | | | — | | | — | |
| Real Estate | 1,840 | | | 2,954 | | | 4,537 | |
| Market Solutions | 879 | | | 559 | | | 1,434 | |
| Capital Invested | $ | 22,217 | | (1) | $ | 16,553 | | | $ | 21,639 | |
___________
(1)Includes amounts from TPG Angelo Gordon from November 1, 2023, the date of the Acquisition, through December 31, 2023.
Capital invested was $22.2 billion for the year ended December 31, 2023, which was primarily attributable to TPG IX, Asia VIII and THP II within the Capital platform, Growth V within the Growth platform, Rise Climate within the Impact platform, TREP IV within the Real Estate platform and MITT within TPG AG Credit.
Capital invested was $16.6 billion for the year ended December 31, 2022 which was primarily attributable to TPG VIII within the Capital platform, Rise Climate within the Impact platform, TTAD II within the Growth platform and TRTX within the Real Estate platform.
Realizations
Realizations represent distributions sourced from proceeds from the disposition of investments and current income, in addition to investment proceeds from Public SPACs in conjunction with the completion of a business combination. The table below presents realizations by platform for the years ended December 31, 2023, 2022 and 2021:
| | | | | | | | | | | | | | | | | |
| | | | | |
| Year Ended December 31, |
| 2023 | | 2022 | | 2021 |
| | | | | |
| ($ in millions) |
| Capital | $ | 6,271 | | | $ | 9,782 | | | $ | 15,773 | |
| Growth | 750 | | | 2,223 | | | 4,423 | |
| Impact | 301 | | | 548 | | | 1,131 | |
| TPG Angelo Gordon | | | | | |
| TPG AG Credit | 641 | | | — | | | — | |
| TPG AG Real Estate | 293 | | | — | | | — | |
| Real Estate | 1,703 | | | 1,060 | | | 1,736 | |
| Market Solutions | 275 | | | 404 | | | 1,040 | |
| Total Realizations | $ | 10,234 | | (1) | $ | 14,017 | | | $ | 24,103 | |
___________
(1)Includes amounts from TPG Angelo Gordon from November 1, 2023, the date of the Acquisition, through December 31, 2023.
Realizations were $10.2 billion for the year ended December 31, 2023 compared to $14.0 billion for the year ended December 31, 2022. This was primarily attributable to a lower pace of realization activities in TPG VII within the Capital platform and Growth IV within the Growth platform, partially offset by higher realizations in TPG AAF and TPG VI within the Capital platform during the year ended December 31, 2023.
Realizations were $14.0 billion for the year ended December 31, 2022 compared to $24.1 billion for the year ended December 31, 2021. This was primarily attributable to lower realization activities during the year ended December 31, 2022 in TPG VII, TPG VIII, Asia VII and THP I within the Capital platform, Growth IV and TTAD I within the Growth platform and TRTX and TREP III within the Real Estate platform.
Fund Performance Metrics
Fund performance information for our investment funds as of December 31, 2023 is included throughout this discussion and analysis to facilitate an understanding of our results of operations for the periods presented. These fund performance metrics do not include co-investment vehicles, SMAs or certain other legacy or discontinued funds. Additionally, these fund performance metrics exclude the firm’s CLOs and real estate investment trusts. The fund return information for individual funds reflected in this discussion and analysis is not necessarily indicative of our firmwide performance and is also not necessarily indicative of the future performance of any particular fund. An investment in us is not an investment in any of our funds. This track record presentation is unaudited and does not purport to represent the respective fund’s financial results in accordance with U.S. GAAP. There can be no assurance that any of our funds or our other existing and future funds will achieve similar returns. See “Item 1A.Risk Factors—Risks Related to Our Business—Our funds’ historical returns should not be considered as indicative of our or our funds’ future results or of any returns expected on an investment in our Class A common stock.”
The following tables reflect the performance of our selected funds as of December 31, 2023 ($ in millions):
| | | | | | | | | | | | | | | | | | | | | | | | | | | | | | | | | | | | | | | | | | | | | | | | | | | | | | | | | | | |
| Fund | Vintage Year(1) | | Capital Committed(2) | | Capital Invested(3) | | Realized Value(4) | | Unrealized Value(5) | | Total Value(6) | | Gross IRR(7) | | Gross MoM(7) | | Net IRR(8) | | Net MoM(9) |
| | | | | | | | | | | | | | | | | | | |
| Platform: Capital | | | | | | | | | | | | | | | | | | | |
| Capital Funds | | | | | | | | | | | | | | | | | | | |
| Air Partners | 1993 | | $ | 64 | | | $ | 64 | | | $ | 697 | | | $ | — | | | $ | 697 | | | 81 | % | | 10.9x | | 73 | % | | 8.9x |
| TPG I | 1994 | | 721 | | | 696 | | | 3,095 | | | — | | | 3,095 | | | 47 | % | | 4.4x | | 36 | % | | 3.5x |
| TPG II | 1997 | | 2,500 | | | 2,554 | | | 5,010 | | | — | | | 5,010 | | | 13 | % | | 2.0x | | 10 | % | | 1.7x |
| TPG III | 1999 | | 4,497 | | | 3,718 | | | 12,360 | | | — | | | 12,360 | | | 34 | % | | 3.3x | | 26 | % | | 2.6x |
| TPG IV | 2003 | | 5,800 | | | 6,157 | | | 13,733 | | | — | | | 13,733 | | | 20 | % | | 2.2x | | 15 | % | | 1.9x |
| TPG V | 2006 | | 15,372 | | | 15,564 | | | 22,071 | | | 1 | | | 22,072 | | | 6 | % | | 1.4x | | 5 | % | | 1.4x |
| TPG VI | 2008 | | 18,873 | | | 19,220 | | | 33,344 | | | 196 | | | 33,540 | | | 14 | % | | 1.7x | | 10 | % | | 1.5x |
| TPG VII | 2015 | | 10,495 | | | 10,205 | | | 19,422 | | | 4,506 | | | 23,928 | | | 26 | % | | 2.3x | | 20 | % | | 1.9x |
| TPG VIII | 2019 | | 11,505 | | | 10,737 | | | 3,264 | | | 15,438 | | | 18,702 | | | 37 | % | | 1.7x | | 25 | % | | 1.5x |
| TPG IX | 2022 | | 12,014 | | | 4,662 | | | — | | | 5,225 | | | 5,225 | | | 225 | % | | 1.2x | | 39 | % | | 1.0x |
| Capital Funds | | | 81,841 | | | 73,577 | | | 112,996 | | | 25,366 | | | 138,362 | | | 23 | % | | 1.9x | | 15 | % | | 1.6x |
| Asia Funds | | | | | | | | | | | | | | | | | | | |
| Asia I | 1994 | | 96 | | | 78 | | | 71 | | | — | | | 71 | | | (3 | %) | | 0.9x | | (10 | %) | | 0.7x |
| Asia II | 1998 | | 392 | | | 764 | | | 1,669 | | | — | | | 1,669 | | | 17 | % | | 2.2x | | 14 | % | | 1.9x |
| Asia III | 2000 | | 724 | | | 623 | | | 3,316 | | | — | | | 3,316 | | | 46 | % | | 5.3x | | 31 | % | | 3.8x |
| Asia IV | 2005 | | 1,561 | | | 1,603 | | | 4,089 | | | — | | | 4,089 | | | 23 | % | | 2.6x | | 17 | % | | 2.1x |
| Asia V | 2007 | | 3,841 | | | 3,257 | | | 5,405 | | | 166 | | | 5,571 | | | 10 | % | | 1.7x | | 6 | % | | 1.4x |
| Asia VI | 2012 | | 3,270 | | | 3,285 | | | 3,380 | | | 3,505 | | | 6,885 | | | 15 | % | | 2.1x | | 11 | % | | 1.7x |
| Asia VII | 2017 | | 4,630 | | | 4,522 | | | 2,341 | | | 5,652 | | | 7,993 | | | 21 | % | | 1.7x | | 14 | % | | 1.4x |
| Asia VIII | 2022 | | 4,319 | | | 2,022 | | | — | | | 2,375 | | | 2,375 | | | 686 | % | | 1.2x | | 129 | % | | 1.1x |
| Asia Funds | | | 18,833 | | | 16,154 | | | 20,271 | | | 11,698 | | | 31,969 | | | 20 | % | | 2.0x | | 14 | % | | 1.7x |
| Healthcare Funds | | | | | | | | | | | | | | | | | | | |
| THP I | 2019 | | 2,704 | | | 2,405 | | | 840 | | | 2,978 | | | 3,818 | | | 33 | % | | 1.6x | | 19 | % | | 1.3x |
| THP II | 2022 | | 3,576 | | | 1,093 | | | — | | | 1,294 | | | 1,294 | | | 339 | % | | 1.3x | | 85 | % | | 1.1x |
| Healthcare Funds | | | 6,280 | | | 3,498 | | | 840 | | | 4,272 | | | 5,112 | | | 35 | % | | 1.5x | | 20 | % | | 1.3x |
| Continuation Vehicles | | | | | | | | | | | | | | | | | | | |
| TPG AAF | 2021 | | 1,317 | | | 1,314 | | | 2,720 | | | — | | | 2,720 | | | 43 | % | | 2.1x | | 37 | % | | 1.9x |
| TPG AION | 2021 | | 207 | | | 207 | | | — | | | 182 | | | 182 | | | (5 | %) | | 0.9x | | (6 | %) | | 0.9x |
| Continuation Vehicles | | | 1,524 | | | 1,521 | | | 2,720 | | | 182 | | | 2,902 | | | 37 | % | | 1.9x | | 31 | % | | 1.7x |
| | | | | | | | | | | | | | | | | | | |
| Platform: Growth | | | | | | | | | | | | | | | | | | | |
| Growth Funds | | | | | | | | | | | | | | | | | | | |
| STAR | 2007 | | 1,264 | | | 1,259 | | | 1,865 | | | 42 | | | 1,907 | | | 13 | % | | 1.5x | | 6 | % | | 1.3x |
| Growth II | 2011 | | 2,041 | | | 2,185 | | | 4,734 | | | 598 | | | 5,332 | | | 22 | % | | 2.5x | | 16 | % | | 2.0x |
| Growth III | 2015 | | 3,128 | | | 3,370 | | | 4,675 | | | 2,306 | | | 6,981 | | | 26 | % | | 2.0x | | 18 | % | | 1.7x |
| Growth IV | 2017 | | 3,739 | | | 3,612 | | | 1,946 | | | 4,890 | | | 6,836 | | | 22 | % | | 1.8x | | 15 | % | | 1.5x |
| Gator | 2019 | | 726 | | | 686 | | | 661 | | | 608 | | | 1,269 | | | 31 | % | | 1.8x | | 25 | % | | 1.6x |
| Growth V | 2020 | | 3,558 | | | 3,225 | | | 403 | | | 4,375 | | | 4,778 | | | 29 | % | | 1.5x | | 18 | % | | 1.3x |
| Growth VI | 2023 | | 1,112 | | | 144 | | | — | | | 144 | | | 144 | | | NM | | NM | | NM | | NM |
| Growth Funds | | | 15,568 | | | 14,481 | | | 14,284 | | | 12,963 | | | 27,247 | | | 20 | % | | 1.9x | | 14 | % | | 1.6x |
| Tech Adjacencies Funds | | | | | | | | | | | | | | | | | | | |
| TTAD I | 2018 | | 1,574 | | | 1,497 | | | 941 | | | 1,709 | | | 2,650 | | | 25 | % | | 1.7x | | 20 | % | | 1.5x |
| TTAD II | 2021 | | 3,198 | | | 1,763 | | | 63 | | | 1,896 | | | 1,959 | | | 9 | % | | 1.1x | | 4 | % | | 1.0x |
| Tech Adjacencies Funds | | | 4,772 | | | 3,260 | | | 1,004 | | | 3,605 | | | 4,609 | | | 22 | % | | 1.4x | | 16 | % | | 1.3x |
| TDM | 2017 | | 1,326 | | | 571 | | | — | | | 1,142 | | | 1,142 | | | 20 | % | | 2.0x | | 16 | % | | 1.7x |
| LSI | 2023 | | 367 | | | 84 | | | — | | | 84 | | | 84 | | | NM | | NM | | NM | | NM |
| | | | | | | | | | | | | | | | | | | |
| | | | | | | | | | | | | | | | | | | |
| | | | | | | | | | | | | | | | | | | |
| | | | | | | | | | | | | | | | | | | |
| | | | | | | | | | | | | | | | | | | |
| | | | | | | | | | | | | | | | | | | | | | | | | | | | | | | | | | | | | | | | | | | | | | | | | | | | | | | | | | | |
| Fund | Vintage Year(1) | | Capital Committed(2) | | Capital Invested(3) | | Realized Value(4) | | Unrealized Value(5) | | Total Value(6) | | Gross IRR(7) | | Gross MoM(7) | | Net IRR(8) | | Net MoM(9) |
| | | | | | | | | | | | | | | | | | | |
| Platform: Impact | | | | | | | | | | | | | | | | | | | |
| The Rise Funds | | | | | | | | | | | | | | | | | | | |
| Rise I | 2017 | | $ | 2,106 | | | $ | 1,996 | | | $ | 1,318 | | | $ | 2,511 | | | $ | 3,829 | | | 21 | % | | 1.9x | | 13 | % | | 1.5x |
| Rise II | 2020 | | 2,176 | | | 1,973 | | | 128 | | | 2,817 | | | 2,945 | | | 25 | % | | 1.5x | | 16 | % | | 1.3x |
| Rise III | 2022 | | 2,700 | | | 1,103 | | | 5 | | | 1,261 | | | 1,266 | | | 98 | % | | 1.2x | | (2 | %) | | 1.0x |
| The Rise Funds | | | 6,982 | | | 5,072 | | | 1,451 | | | 6,589 | | | 8,040 | | | 22 | % | | 1.6x | | 14 | % | | 1.3x |
| TSI | 2018 | | 333 | | | 133 | | | 368 | | | — | | | 368 | | | 35 | % | | 2.8x | | 25 | % | | 2.1x |
| Evercare | 2019 | | 621 | | | 432 | | | 29 | | | 326 | | | 355 | | | (5 | %) | | 0.8x | | (10 | %) | | 0.7x |
| Rise Climate | 2021 | | 7,268 | | | 4,579 | | | 208 | | | 5,839 | | | 6,047 | | | 54 | % | | 1.4x | | 27 | % | | 1.2x |
| TPG NEXT | 2023 | | 510 | | | 3 | | | — | | | 3 | | | 3 | | | NM | | NM | | NM | | NM |
| | | | | | | | | | | | | | | | | | | |
| Platform: Real Estate | | | | | | | | | | | | | | | | | | | |
| TPG Real Estate Partners | | | | | | | | | | | | | | | | | | | |
| DASA RE | 2012 | | 1,078 | | | 576 | | | 1,069 | | | — | | | 1,069 | | | 21 | % | | 1.9x | | 15 | % | | 1.6x |
| TREP II | 2014 | | 2,065 | | | 2,213 | | | 3,520 | | | 60 | | | 3,580 | | | 28 | % | | 1.7x | | 18 | % | | 1.5x |
| TREP III | 2018 | | 3,722 | | | 4,151 | | | 2,630 | | | 2,606 | | | 5,236 | | | 14 | % | | 1.3x | | 9 | % | | 1.2x |
| TREP IV | 2022 | | 6,820 | | | 1,708 | | | 208 | | | 1,481 | | | 1,689 | | | (14 | %) | | 0.9x | | (63 | %) | | 0.5x |
| TPG Real Estate Partners | | | 13,685 | | | 8,648 | | | 7,427 | | | 4,147 | | | 11,574 | | | 21 | % | | 1.5x | | 13 | % | | 1.3x |
| TAC+ | 2021 | | 1,797 | | | 916 | | | 98 | | | 815 | | | 913 | | | (1 | %) | | 1.0x | | (4 | %) | | 0.9x |
| TRECO | | | 378 | | | — | | | — | | | — | | | — | | | NM | | NM | | NM | | NM |
| | | | | | | | | | | | | | | | | | | |
| Platform: Market Solutions | | | | | | | | | | | | | | | | | | | |
| NewQuest Funds | | | | | | | | | | | | | | | | | | | |
NewQuest I(11) | 2011 | | 390 | | | 291 | | | 767 | | | — | | | 767 | | | 48 | % | | 3.2x | | 37 | % | | 2.3x |
NewQuest II(11) | 2013 | | 310 | | | 342 | | | 646 | | | 115 | | | 761 | | | 25 | % | | 2.3x | | 19 | % | | 1.8x |
NewQuest III(11) | 2016 | | 541 | | | 543 | | | 412 | | | 450 | | | 862 | | | 13 | % | | 1.6x | | 8 | % | | 1.3x |
NewQuest IV(11) | 2020 | | 1,000 | | | 879 | | | 132 | | | 1,108 | | | 1,240 | | | 23 | % | | 1.4x | | 13 | % | | 1.2x |
NewQuest V(11) | 2022 | | 502 | | | 272 | | | 7 | | | 344 | | | 351 | | | NM | | NM | | NM | | NM |
| NewQuest Funds | | | 2,743 | | | 2,327 | | | 1,964 | | | 2,017 | | | 3,981 | | | 35 | % | | 1.8x | | 23 | % | | 1.5x |
| | | | | | | | | | | | | | | | | | | |
TGS(11) | 2022 | | 749 | | | 272 | | | — | | | 295 | | | 295 | | | NM | | NM | | NM | | NM |
| | | | | | | | | | | | | | | | | | | |
| | | | | | | | | | | | | | | | | | | |
| | | | | | | | | | | | | | | | | | | |
| Platform: TPG Angelo Gordon | | | | | | | | | | | | | | | | | | | |
| Credit Solutions | | | | | | | | | | | | | | | | | | | |
| Credit Solutions | | | | | | | | | | | | | | | | | | | |
| Credit Solutions I | 2019 | | 1,805 | | | 1,801 | | | 1,475 | | | 1,156 | | | 2,631 | | | 17 | % | | 1.5x | | 13 | % | | 1.4x |
| Credit Solutions I Dislocation A | 2020 | | 909 | | | 602 | | | 795 | | | — | | | 795 | | | 34 | % | | 1.3x | | 27 | % | | 1.3x |
| Credit Solutions I Dislocation B | 2020 | | 308 | | | 176 | | | 211 | | | — | | | 211 | | | 28 | % | | 1.2x | | 21 | % | | 1.2x |
| Credit Solutions II | 2021 | | 3,134 | | | 2,559 | | | 245 | | | 2,655 | | | 2,900 | | | 16 | % | | 1.1x | | 11 | % | | 1.1x |
| Credit Solutions II Dislocation A | 2022 | | 1,310 | | | 868 | | | 5 | | | 1,001 | | | 1,006 | | | 34 | % | | 1.2x | | 25 | % | | 1.1x |
| Credit Solutions | | | 7,466 | | | 6,006 | | | 2,731 | | | 4,812 | | | 7,543 | | | 19 | % | | 1.3x | | 14 | % | | 1.2x |
| Essential Housing | | | | | | | | | | | | | | | | | | | |
| Essential Housing I | 2020 | | 642 | | | 456 | | | 470 | | | 102 | | | 572 | | | 15 | % | | 1.3x | | 12 | % | | 1.2x |
| Essential Housing II | 2021 | | 2,534 | | | 1,071 | | | 59 | | | 1,112 | | | 1,171 | | | 14 | % | | 1.1x | | 10 | % | | 1.1x |
| Essential Housing | | | 3,176 | | | 1,527 | | | 529 | | | 1,214 | | | 1,743 | | | 14 | % | | 1.2x | | 11 | % | | 1.1x |
| Structured Credit & Specialty Finance | | | | | | | | | | | | | | | | | | | |
| ABC Fund | 2021 | | 1,005 | | | 653 | | | 29 | | | 709 | | | 738 | | | 17 | % | | 1.1x | | 13 | % | | 1.1x |
| Structured Credit & Specialty Finance | | | 1,005 | | | 653 | | | 29 | | | 709 | | | 738 | | | 17 | % | | 1.1x | | 13 | % | | 1.1x |
| | | | | | | | | | | | | | | | | | | | | | | | | | | | | | | | | | | | | | | | | | | | | | | | | | | | | | | | | | | |
| Fund | Vintage Year(1) | | Capital Committed(2) | | Capital Invested(3) | | Realized Value(4) | | Unrealized Value(5) | | Total Value(6) | | Gross IRR(7) | | Gross MoM(7) | | Net IRR(8) | | Net MoM(9) |
| | | | | | | | | | | | | | | | | | | |
Middle Market Direct Lending(12) | | | | | | | | | | | | | | | | | | | |
| MMDL I | 2015 | | $ | 594 | | | $ | 572 | | | $ | 846 | | | $ | — | | | $ | 846 | | | 14 | % | | 1.6x | | 10 | % | | 1.4x |
| MMDL II | 2016 | | 1,580 | | | 1,563 | | | 1,684 | | | 608 | | | 2,292 | | | 14 | % | | 1.6x | | 11 | % | | 1.5x |
| MMDL III | 2018 | | 2,751 | | | 2,548 | | | 1,929 | | | 1,648 | | | 3,577 | | | 14 | % | | 1.5x | | 10 | % | | 1.4x |
| MMDL IV | 2020 | | 2,671 | | | 2,522 | | | 457 | | | 2,713 | | | 3,170 | | | 16 | % | | 1.3x | | 12 | % | | 1.3x |
| MMDL IV Annex | 2021 | | 797 | | | 672 | | | 69 | | | 700 | | | 769 | | | 15 | % | | 1.2x | | 11 | % | | 1.2x |
| MMDL V | 2022 | | 1,972 | | | 603 | | | 6 | | | 668 | | | 674 | | | 18 | % | | 1.2x | | 14 | % | | 1.2x |
| Middle Market Direct Lending | | | 10,365 | | | 8,480 | | | 4,991 | | | 6,337 | | | 11,328 | | | 15 | % | | 1.5x | | 11 | % | | 1.4x |
| U.S. Real Estate | | | | | | | | | | | | | | | | | | | |
| Realty | | | | | | | | | | | | | | | | | | | |
| Realty I | 1994 | | 30 | | | 30 | | | 65 | | | — | | | 65 | | | 27 | % | | 2.2x | | 20 | % | | 1.9x |
| Realty II | 1995 | | 33 | | | 33 | | | 81 | | | — | | | 81 | | | 31 | % | | 2.4x | | 22 | % | | 2.2x |
| Realty III | 1997 | | 61 | | | 94 | | | 120 | | | — | | | 120 | | | 5 | % | | 1.3x | | 3 | % | | 1.3x |
| Realty IV | 1999 | | 255 | | | 332 | | | 492 | | | — | | | 492 | | | 11 | % | | 1.5x | | 8 | % | | 1.5x |
| Realty V | 2001 | | 333 | | | 344 | | | 582 | | | — | | | 582 | | | 32 | % | | 1.7x | | 26 | % | | 1.6x |
| Realty VI | 2005 | | 514 | | | 558 | | | 657 | | | — | | | 657 | | | 5 | % | | 1.2x | | 3 | % | | 1.1x |
| Realty VII | 2007 | | 1,257 | | | 1,675 | | | 2,543 | | | 1 | | | 2,544 | | | 17 | % | | 1.7x | | 12 | % | | 1.5x |
| Realty VIII | 2011 | | 1,265 | | | 2,129 | | | 2,758 | | | 213 | | | 2,971 | | | 16 | % | | 1.7x | | 11 | % | | 1.5x |
| Realty IX | 2015 | | 1,329 | | | 1,972 | | | 2,171 | | | 314 | | | 2,485 | | | 9 | % | | 1.4x | | 5 | % | | 1.3x |
| Realty Value X | 2018 | | 2,775 | | | 4,312 | | | 3,492 | | | 2,101 | | | 5,593 | | | 20 | % | | 1.4x | | 13 | % | | 1.3x |
| Realty Value XI | 2022 | | 2,558 | | | 1,284 | | | 389 | | | 998 | | | 1,387 | | | 20 | % | | 1.1x | | (3 | %) | | 1.0x |
| Realty | | | 10,410 | | | 12,763 | | | 13,350 | | | 3,627 | | | 16,977 | | | 15 | % | | 1.5x | | 10 | % | | 1.3x |
| Core Plus Realty | | | | | | | | | | | | | | | | | | | |
| Core Plus Realty I | 2003 | | 534 | | | 532 | | | 876 | | | — | | | 876 | | | 20 | % | | 1.6x | | 18 | % | | 1.5x |
| Core Plus Realty II | 2006 | | 794 | | | 1,112 | | | 1,456 | | | — | | | 1,456 | | | 11 | % | | 1.4x | | 8 | % | | 1.3x |
| Core Plus Realty III | 2011 | | 1,014 | | | 1,420 | | | 2,231 | | | — | | | 2,231 | | | 23 | % | | 1.8x | | 19 | % | | 1.6x |
| Core Plus Realty IV | 2015 | | 1,308 | | | 1,994 | | | 1,988 | | | 359 | | | 2,347 | | | 6 | % | | 1.3x | | 3 | % | | 1.2x |
| Core Plus Realty | | | 3,650 | | | 5,058 | | | 6,551 | | | 359 | | | 6,910 | | | 15 | % | | 1.5x | | 11 | % | | 1.4x |
| Asia Real Estate | | | | | | | | | | | | | | | | | | | |
| Asia Realty | | | | | | | | | | | | | | | | | | | |
| Asia Realty I | 2006 | | 526 | | | 506 | | | 645 | | | — | | | 645 | | | 6 | % | | 1.3x | | 3 | % | | 1.2x |
| Asia Realty II | 2010 | | 616 | | | 602 | | | 1,071 | | | — | | | 1,071 | | | 24 | % | | 1.8x | | 17 | % | | 1.6x |
| Asia Realty III | 2015 | | 847 | | | 844 | | | 969 | | | 244 | | | 1,213 | | | 14 | % | | 1.5x | | 9 | % | | 1.3x |
| Asia Realty IV | 2018 | | 1,315 | | | 1,245 | | | 747 | | | 1,117 | | | 1,864 | | | 20 | % | | 1.5x | | 13 | % | | 1.4x |
| Asia Realty V | 2022 | | 1,854 | | | 326 | | | 17 | | | 346 | | | 363 | | | NM | | NM | | NM | | NM |
| Asia Realty | | | 5,158 | | | 3,523 | | | 3,449 | | | 1,707 | | | 5,156 | | | 13 | % | | 1.5x | | 9 | % | | 1.3x |
| Japan Value | | | | | | | | | | | | | | | | | | | |
Japan Value(13) | 2023 | | 398 | | | 15 | | | — | | | 17 | | | 17 | | | NM | | NM | | NM | | NM |
| Japan Value | | | 398 | | | 15 | | | — | | | 17 | | | 17 | | | NM | | NM | | NM | | NM |
| Europe Real Estate | | | | | | | | | | | | | | | | | | | |
| Europe Realty I | 2014 | | 570 | | | 1,184 | | | 1,709 | | | 15 | | | 1,724 | | | 24 | % | | 2.0x | | 17 | % | | 1.7x |
| Europe Realty II | 2017 | | 843 | | | 1,657 | | | 1,489 | | | 787 | | | 2,276 | | | 12 | % | | 1.5x | | 9 | % | | 1.4x |
Europe Realty III(14) | 2019 | | 1,515 | | | 1,784 | | | 582 | | | 1,236 | | | 1,818 | | | 14 | % | | 1.3x | | 9 | % | | 1.2x |
Europe Realty IV(14) | 2023 | | 1,163 | | | 36 | | | — | | | 36 | | | 36 | | | NM | | NM | | NM | | NM |
| Europe Realty | | | 4,091 | | | 4,661 | | | 3,780 | | | 2,074 | | | 5,854 | | | 17 | % | | 1.6x | | 12 | % | | 1.4x |
| Net Lease | | | | | | | | | | | | | | | | | | | |
| Net Lease Realty I | 2006 | | 159 | | | 209 | | | 457 | | | — | | | 457 | | | 18 | % | | 2.4x | | 14 | % | | 2.2x |
| Net Lease Realty II | 2010 | | 559 | | | 1,060 | | | 1,854 | | | — | | | 1,854 | | | 16 | % | | 2.4x | | 11 | % | | 2.0x |
| Net Lease Realty III | 2013 | | 1,026 | | | 2,352 | | | 2,202 | | | 1,002 | | | 3,204 | | | 12 | % | | 1.8x | | 8 | % | | 1.5x |
| Net Lease Realty IV | 2019 | | 997 | | | 1,736 | | | 1,132 | | | 795 | | | 1,927 | | | 10 | % | | 1.2x | | 6 | % | | 1.1x |
| Net Lease Realty V | | | 99 | | | — | | | — | | | — | | | — | | | NM | | NM | | NM | | NM |
| Net Lease | | | 2,840 | | | 5,357 | | | 5,645 | | | 1,797 | | | 7,442 | | | 15 | % | | 1.8x | | 10 | % | | 1.5x |
The following table reflects the performance of our significant perpetual funds as of December 31, 2023 ($ in millions):
| | | | | | | | | | | | | | | | | | | | |
| Fund | | Vintage Year(1) | | AUM | | Total Return(10) |
| | | | | | |
| Platform: Market Solutions | | | | | | |
TPEP Long/Short(15) | | 2013 | | $ | 2,099 | | | 126 | % |
TPEP Long Only(15) | | 2013 | | 1,915 | | | 39 | % |
| | | | | | |
| Platform: TPG Angelo Gordon | | | | | | |
| Credit Solutions | | | | | | |
Corporate Credit Opportunities(16) | | 1988 | | 333 | | | 10 | % |
| Structured Credit & Specialty Finance | | | | | | |
MVP Fund(17) | | 2009 | | 5,883 | | | 12 | % |
| Middle Market Direct Lending | | | | | | |
TCAP(18) | | 2022 | | 1,478 | | | 9 | % |
| MMDL Evergreen | | 2022 | | 698 | | | NM |
| | | | | | |
| | | | | | |
| Multi-Strategy | | | | | | |
Super Fund(17) | | 1993 | | 902 | | | 9 | % |
__________
Note:
Past performance is not indicative of future results.
“NM” signifies that the relevant data would not be meaningful. Performance metrics are generally deemed “NM” when, among other reasons, there has been limited time since initial investment.
Performance metrics generally exclude amounts attributable to the fund’s general partner, its affiliated entities and “friends-of-the-firm” entities that generally pay no or reduced management fees and performance allocations. These metrics also represent an average of returns for all included investors and do not necessarily reflect the actual return of any particular investor.
Amounts shown are in U.S. dollars.
Unless otherwise noted, when an investment is made in another currency, (i) Capital Invested is calculated using the exchange rate at the time of the investment, (ii) Unrealized Value is calculated using the exchange rate at the period end and (iii) Realized Value reflects actual U.S. dollar proceeds to the fund.
(1)Vintage Year represents the year in which the fund consummated its first investment (or, if earlier, received its first capital contributions from investors). For platforms other than TPG Angelo Gordon, for consistency with prior reporting, however, the Vintage Year classification of any fund that held its initial closing before 2018 represents the year of such fund’s initial closing.
(2)Capital Committed represents the amount of inception to date commitments a particular fund has received. Certain of our newer vintage funds are actively fundraising and capital committed is subject to change.
(3)Capital Invested represents cash outlays by the fund for its investments, whether funded through investor capital contributions or borrowing under the fund’s credit facility. For TPG AG Credit funds, Capital Invested represents inception-to-date investor contributed capital net of returned contributions, excluding borrowings under the fund’s credit facility.
(4)Realized Value represents total cash received or earned by the fund in respect of such investment or investments through the period end, including all interest, dividends and other proceeds. For TPG AG Credit funds, Realized Value represents inception-to-date capital distributed by the fund, including any performance distributions net of recalled distributions, if any.
(5)Unrealized Value, with respect to an investment in a publicly traded security, is based on the closing market price of the security as of the period end on the principal exchange on which the security trades, as adjusted by the general partner for any restrictions on disposition. Unrealized Value, with respect to an investment that is not a publicly traded security, represents the general partner’s estimate of the unrealized fair value of the fund’s investment. Unrealized Value, with respect to TPG AG Credit funds, represents the ending NAV for such fund, which is the period end ending capital balances of the investors and general partner. Valuations entail a degree of subjectivity, and therefore actual value may differ from such estimated value and these differences may be material and adverse. Except as otherwise noted, valuations are as of the period end.
(6)Total Value is the sum of Realized Value and Unrealized Value of investments.
(7)Gross IRR and Gross MoM represent investment level performance by the fund and incorporates the impact of fund level credit facilities, to the extent utilized by the fund. Gross IRR and Gross MoM are calculated by adjusting Net IRR and Net MoM to generally approximate investor performance metrics excluding management fees, fund expenses (other than interest expense and other fees arising from amounts borrowed under the fund’s credit facility to fund investments) and performance allocations. Gross IRR is the discount rate at which (i) the present value of all Capital Invested in an investment or investments is equal to (ii) the present value of all realized and unrealized returns from such investment or investments. Gross IRR and Gross MoM for TPG AG Credit funds are calculated at the fund level and do not consider the impact of credit facilities and exclude fund expenses.
(8)Net IRR represents the compound annualized return rate (i.e., the implied discount rate) of a fund, which is calculated using investor cash flows in the fund, including cash received from capital called from investors, cash distributed to investors and the investors’ ending capital balances as of the period end. Net IRR is the discount rate at which (i) the present value of all capital contributed by investors to the fund (which excludes, for the avoidance of doubt, any amounts borrowed by the fund in lieu of calling capital) is equal to (ii) the present value of all cash distributed to investors and the investors’ ending capital balances.
(9)Net MoM represents the multiple-of-money on contributions to the fund by investors. Net MoM is calculated as the sum of cash distributed to investors and the investors’ ending capital balances as of the period end, divided by the amount of capital contributed to the fund by investors (which amount excludes, for the avoidance of doubt, any amounts borrowed by the fund in lieu of calling capital).
(10)Total Return represents net performance data for investors (excluding certain classes/series with special fee arrangements), net of all expenses including actual quarterly management fees payable by the fund and the accrual of carried interest to the general partner.
(11)Unless otherwise specified, the fund performance information presented above for certain funds is, due to the nature of their strategy, as of September 30, 2023.
(12)Each Middle Market Direct Lending fund is comprised of four vehicles: onshore levered, onshore unlevered, offshore levered and offshore unlevered. Capital Committed, Capital Invested, Realized Value, Unrealized Value and Total Value for each fund are presented on a consolidated basis across the four vehicles. Performance metrics are presented only for the onshore levered vehicle of each fund. The Net IRRs and Net MoMs for TPG AG Middle Market Direct Lending funds on a consolidated basis were: (i) for the onshore unlevered vehicles, 7% and 1.3x, (ii) for the offshore levered vehicles, 10% and 1.3x and (iii) for the offshore unlevered vehicles, 7% and 1.1x.
(13)Japanese-Yen denominated fund. Commitments, Capital Invested and Realized Value are calculated using the exchange rate at the end of the quarter in which the relevant commitment was made or transaction occurred, as applicable.
(14)Includes Euro denominated fund entity with Commitments, Capital Invested and Realized Value calculated using the exchange rate at the end of the quarter in which the relevant commitment was made or transaction occurred, as applicable. Performance metrics only reflects capital committed in U.S. dollars, which represents the majority of capital committed to each fund. Net IRR and Net MoM were: (i) for the euro-denominated vehicle of Europe Realty III, 7% and 1.2x and (ii) for the euro-denominated vehicle of Europe Realty IV, NM and NM.
(15)These performance estimates represent the composite performance of TPG Public Equity Partners, LP and TPG Public Equity Partners Master Fund, L.P., adjusted as described below. The performance estimates are based on an investment in TPG Public Equity Partners, LP made on September 1, 2013, the date of TPEP’s inception, with the performance estimates for the period from January 1, 2016 to present being based on an investment in TPG Public Equity Partners Master Fund, L.P. made through TPG Public Equity Partners-A, L.P., the “onshore feeder.” As of December 31, 2023, TPEP Long/Short had estimated inception-to-date gross returns of 172% and net returns of 126%. Gross performance figures (i) are presented after any investment-related expenses, net interest, other expenses and the reinvestment of dividends; (ii) include any gains or losses from “new issue” securities; and (iii) are adjusted for illustration purposes to reflect the reduction of a hypothetical 1.5% annual management fee.
These performance estimates represent performance for TPEP Long Only and are based on an investment in TPEP Long Only made on May 1, 2019, the date of TPEP Long Only’s inception, through TPG Public Equity Partners Long Opportunities-A, L.P., the “onshore feeder.” As of December 31, 2023, TPEP Long Only had estimated inception-to-date gross returns of 39% and net returns of 39%. Gross performance figures are presented after any investment-related expenses, a 1% annual management fee, net interest, other expenses and the reinvestment of dividends, and include any gains or losses from “new issue” securities.
(16)Total Return includes onshore investors participating directly through the master fund and investors through the offshore vehicle. Total Return for the offshore vehicle was 4%.
(17)Total Returns for onshore funds only. Total Returns for the offshore vehicles were: (i) for the MVP Fund, 11% and (ii) for the Super Fund, 8%.
(18)TCAP launched on January 1, 2023. Total Return includes AGTB Private BDC, which commenced operations on May 10, 2022 and merged with TCAP on January 1, 2023. Total Return is calculated as the change in NAV per share during the period, plus distributions per share (assuming dividends and distributions are reinvested) divided by the beginning NAV per share. Inception-to-date figures for Class I, Class D, and Class S shares use the initial offering price per share as the beginning NAV. Total Return presented is for Class I and is prior to the impact of any potential upfront placement fees. An investment in TCAP is subject to a maximum upfront placement fee of 1.5% for Class D and 3.5% for Class S, which would reduce the amount of capital available for investment, if applicable. There are no upfront placement fees for Class I shares. Total Return has been annualized for periods less than or greater than one year. On July 28, 2023, TCAP completed its merger with AGTB where TCAP paid cash consideration for each share of common stock of AGTB. TCAP will continue as the surviving company. At the completion of the merger, AGTB’s final Net IRR was 6.1%.
Liquidity and Capital Resources
We have historically primarily derived revenues from third party assets under management and have required limited capital resources to support the working capital or operating needs of our business. We believe that our current sources of liquidity described below are sufficient to meet our projected capital needs and other obligations as they arise for at least the next 12 months. To the extent that our current liquidity is insufficient to fund future activities, we may need to raise additional funds. In the future, we may attempt to raise additional capital through the sale of equity securities or through debt financing arrangements. If we raise additional funds by issuing equity securities, the ownership of our existing investors will be diluted. The incurrence of additional debt financing would result in incremental debt service obligations, and any future instruments governing such debt could include operating and financial covenants that could restrict our operations.
As of December 31, 2023, our total liquidity was $1,544.2 million, comprised of $665.2 million of cash and cash equivalents, excluding $13.2 million of restricted cash, as well as $699.0 million and $30.0 million of incremental borrowing capacity under the Senior Unsecured Revolving Credit Facility and the Subordinated Credit Facility (each as defined herein), respectively and $150.0 million of the 364-day revolving credit facility. Total cash of $678.4 million as of December 31, 2023 includes $105.5 million of cash that is attributable to the TPG Operating Group and on balance sheet securitization vehicles.
Sources of Liquidity
We have multiple sources of liquidity to meet our capital needs, including:
•cash generated by our operating activities, such as management fees, monitoring, transaction and other fees, realized capital allocation-based income and investment sales from our consolidated funds,
•cash received from investing activities, including amounts received from notes receivable from affiliates, and
•cash received from our financing activities, including cash and funds available under our credit facilities.
Cash and Cash Equivalents
Our consolidated cash and cash equivalents totaled approximately $678.4 million at December 31, 2023.
Credit Facilities
Senior Unsecured Revolving Credit Facility
In March 2011, TPG Holdings, L.P. entered into a $400.0 million credit facility (the “Senior Unsecured Revolving Credit Facility”). The Senior Unsecured Revolving Credit Facility, as amended May 2018, November 2020, November 2021, July 2022, August 2022 and September 2023, has aggregate revolving commitments of $1.2 billion and is scheduled to mature on September 26, 2028.
Dollar-denominated principal amounts outstanding under the Senior Unsecured Revolving Credit Facility accrue interest, at the option of the applicable borrower, either (i) at a base rate plus applicable margin not to exceed 0.25% per annum or (ii) at a term SOFR rate plus a 0.10% per annum adjustment and an applicable margin not to exceed 1.25%. We are also required to pay a quarterly commitment fee on the unused commitments under the Amended Senior Unsecured Revolving Credit Facility not to exceed 0.15% per annum, as well as certain customary fees for any issued letters of credit.
During the year ended December 31, 2023, we borrowed $470.0 million from the Senior Unsecured Revolving Credit Facility to partially fund the cash consideration of the Acquisition, and borrowed an additional $31.0 million for working capital purposes, resulting in a balance of $501.0 million outstanding at December 31, 2023. As of December 31, 2023, $699.0 million was available to be borrowed under the terms of the Senior Unsecured Revolving Credit Facility.
During January 2024, we drew $58.5 million under our Senior Unsecured Revolving Credit Facility.
Senior Unsecured Term Loan
In December 2021, we entered into a credit agreement (the “Senior Unsecured Term Loan Agreement”) pursuant to which the lenders thereunder agreed to make term loans in a principal amount of up to $300.0 million during the period commencing on December 2, 2021 and ending on the date that is 30 days thereafter. Unused commitments were terminated at the end of such period. The proceeds from the term loan were used to make a ratable distribution to each of our investors and are not available for our operations. The Senior Unsecured Term Loan Agreement, as amended in July 2022 and September 2023, is scheduled to mature on March 31, 2026.
Principal amounts outstanding under the amended Senior Unsecured Term Loan Agreement accrue interest, at the option of the borrower, either (i) at a base rate plus an applicable margin of 0.00% or (ii) at a term SOFR rate plus a 0.10% per annum adjustment and an applicable margin of 1.00%.
As of December 31, 2023, $200.0 million was outstanding under the Senior Unsecured Term Loan Agreement.
Secured Borrowings
Our secured borrowings are issued using on-balance sheet securitization vehicles. The secured borrowings are required to be repaid only from collections on the underlying securitized equity method investments and restricted cash of the securitization vehicles. The secured borrowings are separated into two tranches. Tranche A secured borrowings (the “Series A Securitization Notes”) were issued in May 2018 at a fixed rate of 5.33% with an aggregate principal balance of $200.0 million due June 20, 2038, with interest payable semiannually. Tranche B secured borrowings (the “Series B Securitization Notes” or, collectively with the Series A Securitization Notes, the “Securitization Notes”) were issued in October 2019 at a fixed rate of 4.75% with an aggregate principal balance of $50.0 million due June 20, 2038, with interest payable semiannually. The secured borrowings contain an optional redemption feature giving us the right to call the notes in full or in part, subject to a prepayment penalty if called before May 2023. If the secured borrowings are not redeemed on or prior to June 20, 2028, we will pay additional interest equal to 4.00% per annum.
The secured borrowings contain covenants and conditions customary in transactions of this nature, including negative pledge provisions, default provisions and financial covenants and limitations on certain consolidations, mergers and sales of assets. As of December 31, 2023, we were in compliance with these covenants and conditions.
Subordinated Credit Facility
In August 2014, one of our consolidated subsidiaries entered into two $15.0 million subordinated revolving credit facilities (collectively, the “Subordinated Credit Facility”), for a total commitment of $30.0 million. The Subordinated Credit Facility is available for direct borrowings and is guaranteed by certain members of TPG Operating Group. In August 2023, the subsidiary extended the maturity date of the Subordinated Credit Facility from August 2024 to August 2025. The interest rate for borrowings under the Subordinated Credit Facility is calculated at a term Secured Overnight Financing Rate (“SOFR”) rate plus a 0.10% per annum adjustment and 2.25%.
During the year ended December 31, 2023, the subsidiary did not borrow or make repayments on the Subordinated Credit Facility, resulting in a zero balance outstanding at December 31, 2023.
364-Day Credit Facility
On April 14, 2023, a consolidated subsidiary of the Company entered into a 364-day revolving credit facility (the “364-Day Credit Facility”) with Mizuho Bank, Ltd., acting as administrative agent, to provide the subsidiary with revolving borrowings of up to $150.0 million. Borrowings under the 364-Day Credit Facility are subject to one of three interest rates depending on the type of drawdown requested. Alternate Base Rate (“ABR”) loans are denominated in U.S. Dollars and subject to a variable interest rate computed daily as the higher of the Federal Funds Rate plus 0.50% or the one-month Term SOFR plus 1.00%, plus an applicable margin of between 1.00% and 2.00%, depending on the term of the loan. Term Benchmark Loans may be denominated in U.S. Dollars or Euros, and are subject to a fixed interest rate computed as the SOFR rate for a period comparable to the term of the loan in effect two business days prior to the date of borrowing, plus an applicable margin of between 2.00% and 3.00%, depending on the term of the loan. Risk-Free Rate (“RFR”) loans are denominated in Sterling and subject to a fixed interest rate computed daily as the Sterling Overnight Index Average (“SONIA”) in effect five business days prior to the date of borrowing, plus an applicable margin of between
2.00% and 3.00%, depending on the term of the loan. The subsidiary is also required to a pay a quarterly facility fee equal to 0.30% per annum of the total facility capacity of $150.0 million, as well as certain customary fees for any issued loans.
The Company entered into an equity commitment letter in connection with the 364-Day Credit Facility, committing to provide capital contributions, if and when required, to the consolidated subsidiary throughout the life of the facility.
During the year ended December 31, 2023, the subsidiary borrowed and made repayments of $150.0 million on the 364-Day Credit Facility, resulting in a zero balance outstanding at December 31, 2023.
Our Liquidity Needs
We expect that our primary liquidity needs include cash required to:
•support our working capital needs;
•fund cash operating expenses, including compensation and contingencies, including for clawback obligations or litigation matters;
•service debt obligations, including the payment of obligations at maturity, on interest payment dates or upon redemption, as well as any contingent liabilities that may give rise to future cash payments;
•continue growing our businesses, including seeding new strategies, pursuing strategic investments or acquisitions, funding our capital commitments made to existing and future funds and co-investments, funding any net capital requirements of our broker-dealer and otherwise supporting investment vehicles that we sponsor;
•pay amounts that may become due under the Tax Receivable Agreement;
•pay earnouts and contingent cash consideration associated with our Acquisition;
•pay cash dividends in accordance with our dividend policy for our Class A common stock;
•warehouse investments in portfolio companies or other investments for the benefit of one or more of our funds or other investment pending contribution of committed capital by the investors in such vehicles and advance capital to them for other operational needs;
•risk retention for CLOs
•address capital needs of regulated and other subsidiaries, including our broker-dealer; and
•exchange Common Units pursuant to the Exchange Agreement or repurchase or redeem other securities issued by us.
Contractual Obligations
In the ordinary course of business, we enter into contractual arrangements that require future cash payments. The following table sets forth information regarding our anticipated future cash payments under our contractual obligations as of December 31, 2023 (in thousands):
| | | | | | | | | | | | | | | | | | | | | | | | | | | | | | | | | | | | | | | | | |
| Payments Due by Period |
| Total | | 2024 | | 2025 | | 2026 | | 2027 | | 2028 | | 2029 and Thereafter |
Debt obligations(1) | $ | 951,000 | | | $ | — | | | $ | — | | | $ | 200,000 | | | $ | — | | | $ | 501,000 | | | $ | 250,000 | |
Interest on debt obligations(2) | 473,877 | | | 59,008 | | | 58,883 | | | 49,043 | | | 45,822 | | | 42,289 | | | 218,832 | |
Capital commitments(3) | 521,295 | | | 521,295 | | | — | | | — | | | — | | | — | | | — | |
| Operating lease obligations | 282,302 | | | 43,553 | | | 39,221 | | | 37,353 | | | 37,581 | | | 36,321 | | | 88,273 | |
Repurchase agreements(4) | 83,336 | | | 1,928 | | | 5,862 | | | 27,660 | | | 23,191 | | | 24,695 | | | — | |
| Total contractual obligations | $ | 2,311,810 | | | $ | 625,784 | | | $ | 103,966 | | | $ | 314,056 | | | $ | 106,594 | | | $ | 604,305 | | | $ | 557,105 | |
__________
(1)Debt obligations presented in the table reflect scheduled principal payments related to the Securitization Notes, our senior unsecured term loan and our senior unsecured revolving credit facility.
(2)Estimated interest payments on our debt obligations include estimated future interest payments based on the terms of the debt agreements. See Note 12 to the Consolidated Financial Statements for further discussion of these debt obligations.
(3)Capital commitments represent our obligations to provide general partner capital funding to the TPG funds. These amounts are generally due on demand, and accordingly, have been presented as obligations payable in the “2024” column. We generally utilize proceeds from return of capital distributions and proceeds from secured borrowings to help fund these commitments.
(4)See Note 9 to the Consolidated Financial Statements for further discussion of the repurchase agreements.
Additional Contingent Obligations
As of December 31, 2023 and December 31, 2022, if all investments held by the TPG funds were liquidated at their current unrealized fair value, there would be clawback of $58.3 million related to STAR, net of tax, for which a performance allocation reserve was recorded within other liabilities in the Consolidated Statements of Financial Condition. The potential liquidation of STAR could require clawback payments. Additionally, if all remaining investments were deemed worthless, a possibility management views as remote, the amount of performance allocations subject to projected clawback as of December 31, 2023 and December 31, 2022 would be $1,910.2 million and $1,869.4 million, respectively.
As of December 31, 2023 and December 31, 2022, we had guarantees outstanding totaling $73.6 million and $100.8 million, respectively, related to employee guarantees primarily related to a third-party lending program which enables certain of our eligible employees to obtain financing for co-invest capital commitment obligations with a maximum potential exposure of $176.3 million and $163.7 million, respectively.
Dividends
The table below presents information regarding the quarterly dividends on the Class A common stock, which were made at the sole discretion of our Executive Committee and Board of Directors.
| | | | | | | | | | | | | | | | | | | | |
| Date Declared | | Record Date | | Payment Date | | Dividend per Class A Common Share |
| May 10, 2022 | | May 20, 2022 | | June 3, 2022 | | $ | 0.44 | |
| August 9, 2022 | | August 19, 2022 | | September 2, 2022 | | 0.39 | |
| November 9, 2022 | | November 21, 2022 | | December 2, 2022 | | 0.26 | |
| February 15, 2023 | | February 27, 2023 | | March 10, 2023 | | 0.50 | |
| Total 2022 Dividend Year | | | | | | $ | 1.59 | |
| | | | | | |
| May 15, 2023 | | May 25, 2023 | | June 5, 2023 | | $ | 0.20 | |
| August 8, 2023 | | August 18, 2023 | | September 1, 2023 | | 0.22 | |
| November 7, 2023 | | November 17, 2023 | | December 1, 2023 | | 0.48 | |
| February 13, 2024 | | February 23, 2024 | | March 8, 2024 | | 0.44 | |
| Total 2023 Dividend Year (through Q4 2023) | | | | | | $ | 1.34 | |
Tax Receivable Agreement
The future exchanges by owners of Common Units for cash from a substantially concurrent public offering, reorganization or private sale (based on the price per share of the Class A common stock on the day before the pricing of such public offering or private sale) or, at our election, for shares of our Class A common stock on a one-for-one basis (or, in certain cases, for shares of nonvoting Class A common stock) are expected to produce or otherwise deliver to us favorable tax attributes that can reduce our taxable income. We (and our wholly-owned subsidiaries) are a party to a tax receivable agreement, under which generally we (or our wholly-owned subsidiaries) are required to pay the beneficiaries of the Tax Receivable Agreement 85% of the applicable cash savings, if any, in U.S. federal, state and local income tax that we actually realize or, in certain circumstances, are deemed to realize as a result of the Covered Tax Items. We generally retain the benefit of the remaining 15% of the applicable tax savings. The payment obligations under the Tax Receivable Agreement are obligations of TPG Inc. (or our wholly-owned subsidiaries), and we expect that the payments we will be required to make under the Tax Receivable Agreement will be substantial.
On March 31, 2023, a pre-IPO Investor exchanged 1,000,000 Common Units of each TPG Operating Group partnership for 1,000,000 shares of Class A common stock. This exchange resulted in an increase in the Company’s tax basis of its investment in the TPG Operating Group partnerships and is subject to the Tax Receivable Agreement. The Company recognized an additional liability associated with the Tax Receivable Agreement in the amount of $6.3 million in connection with the exchange.
Net Cash Flows
The following table presents a summary of our cash flows for the periods presented:
| | | | | | | | | | | | | | | | | | | | |
| | | | | | |
| | Year Ended December 31, |
| | 2023 | | 2022 | | 2021 |
| | | | | | |
| | ($ in thousands) |
| Net cash provided by operating activities | | $ | 720,518 | | | $ | 1,375,878 | | | $ | 1,474,820 | |
| Net cash used in investing activities | | (373,563) | | | (3,012) | | | (37,745) | |
| Net cash used in financing activities | | (789,234) | | | (1,238,080) | | | (1,322,566) | |
| Net (decrease) increase in cash and cash equivalents | | (442,279) | | | 134,786 | | | 114,509 | |
| Cash and cash equivalents, beginning of period | | 1,120,650 | | | 985,864 | | | 871,355 | |
| Cash and cash equivalents, end of period | | $ | 678,371 | | | $ | 1,120,650 | | | $ | 985,864 | |
Operating Activities
Operating activities provided $720.5 million and $1,375.9 million of cash for the year ended December 31, 2023 and 2022, respectively. Key drivers consisted of performance allocation and co-investment proceeds totaling $798.5 million and $1,567.7 million for the year ended December 31, 2023 and 2022, respectively. This was partially offset by changes in operating assets and liabilities for the year ended December 31, 2023 and 2022, respectively.
Investing Activities
Investing activities used $373.6 million and $3.0 million of cash during the year ended December 31, 2023 and 2022, respectively. During the year ended December 31, 2023, cash used by investing activities is primarily related to our acquisition of Angelo Gordon. During the year ended December 31, 2022, cash used by investing activities is primarily related to repayments and advances on notes receivable from affiliates.
Financing Activities
Financing activities used $789.2 million and $1,238.1 million of cash during the year ended December 31, 2023 and 2022, respectively. During the year ended December 31, 2023, cash used in financing activities primarily reflects the payments of dividends and distributions to our Class A common stockholders and to holders of non-controlling interests in subsidiaries and the redemption of the outstanding YTPG and AFTR Class A Ordinary Shares, which were funded by our Assets held in Trust Account. This was partially offset by net proceeds from our credit facilities. Cash used in financing activities during year ended December 31, 2022 primarily reflects the net impact of distributions to partners and non-controlling interests, the repayment of amounts borrowed under the Subordinated Credit Facility, and purchase of partnership interests with IPO proceeds, which is partially offset by the net proceeds from the IPO in January 2022.
Off-Balance Sheet Arrangements
We have not entered into any off-balance sheet arrangements, as defined in Regulation S-K.
Critical Accounting Estimates
The preparation of the Consolidated Financial Statements in conformity with U.S. GAAP requires management to make estimates and assumptions that affect the reported amounts of revenues, expenses, assets, and liabilities and disclosure of contingent assets and liabilities in our Consolidated Financial Statements. We regularly assess these estimates; however, actual amounts could differ from those estimates. The impact of changes in estimates is recorded in the period in which they become known.
An accounting policy is considered to be critical if the nature of the estimates or assumptions is material due to the levels of subjectivity and judgment necessary to account for highly uncertain matters or the susceptibility of such matters to change, and the effect of the estimates and assumptions on financial condition or operating performance. The accounting policies we believe to reflect our more significant estimates, judgments and assumptions that are most critical to understanding and evaluating our reported financial results are: revenue recognition and fair value measurements.
Revenues
We recognize revenue in accordance with ASC 606. Revenue is recognized in a manner that depicts the transfer of promised goods or services to customers and for an amount that reflects the consideration to which we expect to be entitled in exchange for those goods or services. We are required to identify our contracts with customers, identify the performance obligations in a contract, determine the transaction price, allocate the transaction price to the performance obligations in the contract and recognize revenue when (or as) the entity satisfies a performance obligation. In determining the transaction price, variable consideration is included only to the extent that it is probable that a significant reversal in the amount of cumulative revenue recognized would not occur when the uncertainty associated with the variable consideration is resolved. The guidance requires us to assess whether we are the principal versus agent in the arrangement based on the notion of control, which affects recognition of revenue on a gross or net basis. Essentially all of our revenue and operations are directly or indirectly supporting affiliated investment funds and derived from or related to their underlying investments.
Management fees related to our funds are generally based on a fixed percentage of the committed capital, invested capital, cost of investments or Net Asset Value (“NAV”). The corresponding fee calculations are both objective in nature and therefore do not require the use of significant estimates or assumptions.
Incentive fees within the scope of the revenue guidance are generally calculated as a percentage of the profits earned in respect of certain accounts for which we are the investment adviser, subject to the achievement of minimum return levels or performance benchmarks. Incentive fees are typically subject to reversal until the end of a defined performance period, as these fees are affected by changes in the fair value of the AUM or advisement over such performance period. Moreover, incentive fees that are received prior to the end of the defined performance period are typically subject to clawback, net of tax. We recognize incentive fee revenue only when these amounts are no longer subject to significant reversal, which is typically at the end of a defined performance period and/or upon expiration of the associated clawback period.
Incentive fees structured as performance allocations are accounted for under the equity method of accounting.
For open-ended funds, we calculate revenue based on a percentage of annual fund profits, reduced by minimum return hurdles, and subject to prior year loss carry-forwards. Performance allocations for open-end funds are either paid in the first quarter following the performance year or during the calendar year if there are investor redemptions, and are generally not subject to repayment by the Company. Performance allocations attributed to certain non-liquid investments (“side pocket investments”) owned by open-ended funds are paid when the associated side pocket investments are realized.
For closed-ended funds, Capital Allocation-Based Income is a disproportionate allocation (typically 20%) of performance allocations. Certain funds will allocate performance allocations to us, based on cumulative fund performance to date, irrespective of whether such amounts have been realized. These performance allocations are subject to limited partner preferred returns or high watermarks, where applicable, in accordance with the terms set forth in each respective fund’s governing documents. We recognize income attributable to performance allocations from a fund based on the amount that would be due to us pursuant to the fund’s governing documents, assuming the fund was liquidated based on the current fair value of its underlying investments as of that date. Accordingly, the amount recognized as performance allocation income reflects our share of the gains and losses of the associated fund’s underlying investments measured at their then-fair values, relative to the fair values as of the end of the prior period. Performance allocations are generally realized when an underlying investment is profitably disposed of and the fund’s cumulative returns are in excess of the specific hurdle rates, as defined in the applicable governing documents. For any given period, performance allocations on our consolidated statements of operations may include reversals of previously recognized amounts due to a decrease in the value of a particular fund that results in a decrease of cumulative performance allocations earned to date. Since fund minimum level of returns are cumulative, previously recognized performance allocations also may be reversed in a period of appreciation that is lower than the particular fund’s minimum return levels. Each fund is considered separately in this regard and, for a given fund, performance allocations can never be negative over the life of a fund. If upon a hypothetical liquidation of a fund’s investments, at their then current fair values, previously recognized and distributed performance allocation would be required to be returned, a liability is established for the potential clawback obligation. Our actual obligation, however, would not become payable or realized until the end of a fund’s life.
Fair Value Measurements
GAAP establishes a hierarchical disclosure framework, which prioritizes and ranks the level of market price observability used in measuring financial instruments at fair value. Market price observability is affected by a number of factors, including the type of financial instrument, the characteristics specific to the financial instrument and the state of the marketplace—including the existence and transparency of transactions between market participants. Financial instruments with readily available quoted prices in active markets generally will have a higher degree of market price observability and a lesser degree of judgment used in measuring fair value.
Financial instruments measured and reported at fair value are classified and disclosed based on the observability of inputs used in the determination of their fair values, as follows:
•Level I—Pricing inputs are unadjusted, quoted prices in active markets for identical assets or liabilities as of the measurement date.
•Level II—Pricing inputs are other than quoted prices in active markets, which are either directly or indirectly observable as of the measurement date, and fair value is determined through the use of models or other valuation methodologies. The types of financial instruments generally classified in this category include
securities with less liquidity traded in active markets, securities traded in other than active markets, corporate bonds and loans, and government and agency securities.
•Level III—Pricing inputs are unobservable for the financial instruments and include situations where there is little, if any, market activity for the financial instrument. The inputs into the determination of fair value require significant management judgment or estimation.
In certain cases, the inputs used to measure fair value may fall into different levels of the fair value hierarchy. In such cases, the level in the fair value hierarchy within which the fair value measurement in its entirety falls has been determined based on the lowest level input that is significant to the fair value measurement in its entirety. Our assessment of the significance of a particular input to the fair value measurement in its entirety requires judgment and consideration of factors specific to the financial instrument.
The fair value of the investments held by TPG funds is the primary input to the calculation of certain of our management fees, incentive fees, capital allocation based income, and performance allocation compensation. The TPG funds are accounted for as investment companies in accordance with U.S. GAAP guidance and reflect their investments, including majority-owned and controlled investments, at fair value. In the absence of observable market prices, we utilize valuation methodologies applied on a consistent basis and assumptions that we believe market participants would use to determine the fair value of the investments. For investments where little market activity exists, management’s determination of fair value is based on the best information available in the circumstances, which may incorporate management’s own assumptions and involves a significant degree of judgment, and the consideration of a combination of internal and external factors, including the appropriate risk adjustments for non-performance and liquidity risks.
TPG has also elected the fair value option for certain other proprietary investments. TPG is required to measure certain financial instruments at fair value, including equity securities and derivatives.
Fair Value of Investments or Instruments that are Exchange Traded
Securities that are exchange traded and for which a quoted market exists will be valued at the closing price of such securities in the principal market in which the security trades, or in the absence of a principal market, in the most advantageous market on the valuation date. When a quoted price in an active market exists, no block discounts or control premiums are permitted regardless of the size of the public security held. In some cases, securities will include legal restrictions limiting their purchase and sale for a period of time, such as may be required under SEC Rule 144. A discount to publicly traded price may be appropriate in those cases; the amount of the discount, if taken, shall be determined based on the time period that must pass before the restricted security becomes unrestricted or otherwise available for sale.
Fair Value of Investments or Instruments that are not Exchange Traded
In the absence of observable market prices, we rely on valuation methodologies that primarily employ management’s determination as to fair value based off of available information and management’s own assumptions about the business. These assumptions involve a significant degree of judgement, taking into consideration a combination of internal and external factors.
Equity Investments. We determine the fair value of our equity investments using the market approach, income approach or some combination of both. We primarily use the market approach for determining the fair values of our investments. The market approach relies upon valuations for comparable public companies, transactions or assets, and thus requires that we use our discretion to identify comparable companies, transactions and assets. We may also choose to incorporate a secondary methodology, generally used to corroborate the results of the market approach. This would typically be the income approach, which provides an indication of fair value based on the present value of cash flows that a business, security or property is expected to generate in the future. The most widely used methodology under the income approach is the discounted cash flow method, which includes significant assumptions about the underlying investment’s projected net earnings or cash flows, discount rate, capitalization rate or exit multiple. Depending on the facts and circumstances associated with the investment, different primary and secondary methodologies may be used including direct capitalization method, option value, contingent claims or scenario analysis, yield analysis, projected cash flow through maturity or expiration, probability weighted methods or recent round of financing.
Credit Investments. The fair values of credit-oriented investments are generally determined on the basis of prices between market participants provided by reputable dealers or pricing services. In determining the value of a particular investment, pricing services may use certain information with respect to transactions in such investments, quotations from dealers, pricing matrices, market transactions in comparable investments and various relationships between investments. Investments in distressed debt and corporate loans and bonds, we generally determine fair value by comparing against similar investments. We review and analyze the prices obtained from external pricing sources to evaluate their reliability and accuracy, and at times exclude vendor prices and broker quotations that we believe do not reflect fair value. Certain credit financial instruments may not trade or prices are not readily available, or trade infrequently and, when they are traded, the price may be unobservable and, as a result, multiple external pricing sources may not be available. In such instances, we may use an internal pricing model as either a corroborating or sole data point in determining the price. We generally engage specialized third-party valuation service providers to assess and corroborate the valuation of a selection of the investments on a periodic basis.
Management Process on Fair Value
Due to the importance of fair value throughout the Consolidated Financial Statements and the significant judgment required to be applied in arriving at those fair values, we have developed a process around valuation that incorporates several levels of approval and review from both internal and external sources. Investments held by TPG funds and investment vehicles are valued on at least a quarterly basis by our internal valuation or asset management teams, which are independent from our investment teams.
For investments valued utilizing a forward-looking market approach and/or income method, and where TPG has information rights, we generally have a direct line of communication with each of the portfolio company finance teams and collect financial data used to support projections used in the analysis. The respective product’s valuation team or deal team then analyzes the data received and updates the valuation models, reflecting any changes in the underlying forecast, cash flow projections, weighted-average cost of capital, exit multiple and any other valuation input relevant economic conditions.
The results of all valuations of investments held by TPG funds and investment vehicles are initially reviewed and approved by the relevant subcommittee. Each subcommittee is comprised of at least one member who does not participate in the process of making or disposing of investments. The valuations are aggregated and significant matters are presented for final approval by TPG’s Global Valuation Committee, which is comprised of senior employees and includes its Chief Financial Officer, General Counsel, Chief Compliance Officer, Chief Operating Officer and Chief Accounting Officer. Approval by any member of the Valuation Committee is related to such member’s role in the Committee, such that control function members’ (i.e., those members who do not participate in the process of making or disposing of investments) approval, for example, represents their confirmation that the process was run appropriately and that the deliberations were on the merits.
Additionally, we will generally engage an independent valuation firm to assist with valuations of certain Level III valuations. The valuation firm will either perform certain procedures in order to assess the reasonableness of our valuation or provide a valuation range from which we will select a point in the range to determine the final valuation.
Business Combinations
We account for business combinations using the acquisition method under ASC Topic 805, Business Combinations (“ASC 805”) under which the purchase price of the acquisition is allocated to the assets acquired and liabilities assumed using the fair values determined by management as of the acquisition date. Management’s determination of fair value of assets acquired and liabilities assumed at the acquisition date is based on the best information available in the circumstances and may incorporate management’s own assumptions and involve a significant degree of judgment. Management uses its best estimates and assumptions to accurately assign fair value to the tangible and identifiable intangible assets acquired and liabilities assumed at the acquisition date as well as the useful lives of those acquired intangible assets. Examples of critical estimates in valuing certain of the intangible assets we have acquired include, but are not limited to, future expected cash inflows and outflows, future fundraising assumptions, expected useful life, discount rates and income tax rates. Our estimates for future cash flows are based on historical data, various internal estimates and certain external sources, and are based on assumptions that are consistent with the plans and estimates we are using to manage the underlying assets acquired. Unanticipated events and circumstances may occur that could affect the accuracy or validity of such assumptions, estimates or actual results. For business combinations accounted for under the acquisition
method, the purchase consideration, including the fair value of certain elements of contingent consideration as of the acquisition date, in excess of the fair value of net assets acquired is recorded as goodwill.
Intangible Assets
Our intangible assets consist of the fair value of our interests in future promote of certain funds and the fair value of acquired investor relationships representing the fair value of management fees earned from existing investors in future funds. Finite-lived intangible assets are amortized over their estimated useful lives, which range from 2 years to 20 years, and are reviewed for impairment whenever events or changes in circumstances indicate that the carrying amount of the intangible asset may not be recoverable. Amortization expense is included in depreciation and amortization expense in the Consolidated Financial Statements.
Recent Accounting Developments
Information regarding recent accounting developments and their effects to us can be found in Note 2, “Summary of Significant Accounting Policies,” to our audited Consolidated Financial Statements included elsewhere in this report. Item 7A. Quantitative and Qualitative Disclosures About Market Risk
Our exposure to market risks primarily relates to our role as investment advisor or general partner to our TPG funds and the impact of movements in the underlying fair value of their investments. Our management fees, performance allocation and net gains from investments are the primary sources of income that could be impacted. The fair value of investments may fluctuate in response to changes in the values of investments, general equity and other market conditions, and foreign currency exchange rates. Additionally, interest rate movements can adversely impact the amount of interest that we pay on debt obligations bearing variable rates. Although our investment funds share many common themes, each of our platforms runs its own investment and risk management processes, subject to our overall risk tolerance and philosophy. The investment process of our TPG funds involves a comprehensive due diligence approach, including review of reputation of investors and management, company size and sensitivity of cash flow generation, business sector and competitive risks, portfolio fit, exit risks and other key factors highlighted by the deal team. Key investment decisions are subject to approval by the investment committee, which generally includes one or more of the key members of management, one product leader, and one or more advisors and senior investment professionals associated with that particular fund. Once an investment in a portfolio company has been made, our fund teams closely monitor the performance of the portfolio company, generally through frequent contact with management and the receipt of financial and management reports. For the valuation process that is used in the determination of fair value, we assume a reasonable period of time for liquidation of the investment and take into consideration the following: financial condition, the nature of the investment, restrictions on marketability, market conditions, foreign currency exposures and other factors. Throughout this process, we exercise significant judgment and use the best information available as of the measurement date.
Effect on Management Fees
TPG provides investment management services to the funds and other vehicles in exchange for a management fee. Management fees will only be directly affected by short-term changes in market conditions to the extent they are based on net asset value (“NAV”) or represent permanent impairments of value. Such management fees will be increased (or reduced) in direct proportion to the effect of changes in the market value of our investments in the related funds. In addition, the terms of the governing agreements with respect to certain of our TPG funds provide that the management fee base will be reduced when the aggregate fair market value of a fund’s investments is below its cost. The proportion of our management fees that are based on NAV is dependent on the number and types of investment funds in existence and the current stage of each fund’s life cycle.
Effect on Performance Allocations
Performance allocations reflect revenue primarily from performance allocations on our TPG funds. In our discussion of “Key Financial Measures” and “Critical Accounting Estimates,” we disclose that performance allocations are recognized upon appreciation of the valuation of our TPG funds’ investments above certain return hurdles and are based upon the amount that would be due to TPG at each reporting date as if the funds were liquidated at their then-current fair values. Changes in the fair value of the funds’ investments may materially impact performance allocations depending upon the respective funds’ performance to date as compared to its hurdle rate and the related performance allocation waterfall. An
immediate, hypothetical 10% decline in the fair value of investments would result in a decrease of performance allocations totaling $1,900.6 million, or $335.9 million net of accrued performance allocation compensation and other allocations.
Effect on Investment Income
Investment income is earned from our investments in TPG funds and other investments. We record these investments under the equity method of accounting and recognize our pro rata share of income. Net changes in the fair value of the underlying investments of our TPG funds and other investment’s underlying portfolio investments may materiality impact the net gains (losses) from investment activities in our consolidated statement of operations depending upon the respective funds’ performance to date as compared to its hurdle rate. An immediate, hypothetical 10% decline in the fair value of investments would result in a decrease of investment income totaling $91.7 million.
Exchange Rate Risk
Our investment funds hold investments that are denominated in non-USD currencies that may be affected by movements in the rate of exchange between the USD and non-USD currencies. Non-USD denominated assets and liabilities are translated at year-end rates of exchange, and the consolidated statements of operations accounts are translated at rates of exchange in effect throughout the year. In our capacity as investment manager, certain of the funds we manage may seek to mitigate risks from this exposure by employing hedging techniques, including using foreign currency options and foreign exchange forward contracts to help insulate us from future changes in exchange rates. This may include hedging amounts in excess of our capital invested, to reduce exposure on projected unrealized on projected unrealized investment profits. We estimate that as of December 31, 2023, if the USD strengthened 10% against all foreign currencies, the impact on our consolidated results of operations for the year then ended would be as follows: (a) performance allocations would decrease by $446.3 million, or $59.9 million net of accrued performance allocation compensation and other allocations and (b) net gains from investments would decrease by $22.5 million. The majority of our TPG funds are USD denominated and have functional currency in the USD. As such, our management fees are not significantly impacted by fluctuations in exchange rates.
Interest Rate Risk
Interest rate risk represents exposure we have to instruments whose values vary with the change in interest rates. These instruments include, but are not limited to, loans, borrowings and derivative instruments. We may seek to mitigate risks associated with the exposures by taking offsetting positions in derivative contracts. We have obligations under our loans that accrue interest at variable rates. Interest rate changes may therefore affect the amount of interest payments, future earnings and cash flows. The loans generally incur interest at SOFR plus an applicable rate. We do not have any interest rate swaps in place for these borrowings. Based on our debt obligations payable as of December 31, 2023, we estimate that interest expense relating to variable-rate debt would increase by approximately $2.9 million on an annual basis in the event interest rates were to have been one percentage point during the period.
Credit Risk
We are party to agreements providing for various financial services and transactions that contain an element of risk in the event that the counterparties are unable to meet the terms of such agreements. In such agreements, we depend on the respective counterparty to make payment or otherwise perform. We generally endeavor to minimize our risk of exposure by limiting the counterparties with which we enter into financial transactions to reputable financial institutions. In other circumstances, availability of financing from financial institutions may be uncertain due to market events, and we may not be able to access these financing markets.
Item 8. Financial Statements
Report of Independent Registered Public Accounting Firm
To the Shareholders and the Board of Directors of TPG Inc.
Opinion on the Financial Statements
We have audited the accompanying consolidated statements of financial condition of TPG Inc. and subsidiaries (the "Company") as of December 31, 2023 and 2022, the related consolidated statements of operations, changes in equity, and cash flows, for each of the three years in the period ended December 31, 2023, and the related notes (collectively referred to as the "financial statements"). We also have audited the Company’s internal control over financial reporting as of December 31, 2023, based on criteria established in Internal Control — Integrated Framework (2013) issued by the Committee of Sponsoring Organizations of the Treadway Commission (COSO).
In our opinion, the financial statements present fairly, in all material respects, the financial position of the Company as of December 31, 2023 and 2022, and the results of its operations and its cash flows for each of the three years in the period ended December 31, 2023, in conformity with accounting principles generally accepted in the United States of America. Also, in our opinion, the Company maintained, in all material respects, effective internal control over financial reporting as of December 31, 2023, based on criteria established in Internal Control — Integrated Framework (2013) issued by COSO.
As described in Management's Annual Report on Internal Control over Financial Reporting, management excluded from its assessment the internal control over financial reporting at Angelo Gordon & Co, L.P., AG Funds L.P., and AG Partners Investments, L.P. (collectively, “Angelo Gordon”), which was acquired on November 1, 2023, and whose financial statements constitute 19.2% of the Company’s total assets and 9.8% of total revenues of the consolidated financial statement amounts as of and for the year ended December 31, 2023. Accordingly, our audit did not include the internal control over financial reporting at Angelo Gordon.
Basis for Opinion
The Company’s management is responsible for these financial statements, for maintaining effective internal control over financial reporting, and for its assessment of the effectiveness of internal control over financial reporting, included in the accompanying Management's Annual Report on Internal Control over Financial Reporting. Our responsibility is to express an opinion on these financial statements and an opinion on the Company’s internal control over financial reporting based on our audits. We are a public accounting firm registered with the Public Company Accounting Oversight Board (United States) (PCAOB) and are required to be independent with respect to the Company in accordance with the U.S. federal securities laws and the applicable rules and regulations of the Securities and Exchange Commission and the PCAOB.
We conducted our audits in accordance with the standards of the PCAOB. Those standards require that we plan and perform the audits to obtain reasonable assurance about whether the financial statements are free of material misstatement, whether due to error or fraud, and whether effective internal control over financial reporting was maintained in all material respects.
Our audits of the financial statements included performing procedures to assess the risks of material misstatement of the financial statements, whether due to error or fraud, and performing procedures to respond to those risks. Such procedures included examining, on a test basis, evidence regarding the amounts and disclosures in the financial statements. Our audits also included evaluating the accounting principles used and significant estimates made by management, as well as evaluating the overall presentation of the financial statements. Our audit of internal control over financial reporting included obtaining an understanding of internal control over financial reporting, assessing the risk that a material weakness exists, and testing and evaluating the design and operating effectiveness of internal control based on the assessed risk. Our audits also included performing such other procedures as we considered necessary in the circumstances. We believe that our audits provide a reasonable basis for our opinions.
Definition and Limitations of Internal Control over Financial Reporting
A company’s internal control over financial reporting is a process designed to provide reasonable assurance regarding the reliability of financial reporting and the preparation of financial statements for external purposes in accordance with generally accepted accounting principles. A company’s internal control over financial reporting includes those policies and procedures that (1) pertain to the maintenance of records that, in reasonable detail, accurately and fairly reflect the transactions and dispositions of the assets of the company; (2) provide reasonable assurance that transactions are recorded as necessary to permit preparation of financial statements in accordance with generally accepted accounting principles, and that receipts and expenditures of the company are being made only in accordance with authorizations of management and directors of the company; and (3) provide reasonable assurance regarding prevention or timely detection of unauthorized acquisition, use, or disposition of the company’s assets that could have a material effect on the financial statements.
Because of its inherent limitations, internal control over financial reporting may not prevent or detect misstatements. Also, projections of any evaluation of effectiveness to future periods are subject to the risk that controls may become inadequate because of changes in conditions, or that the degree of compliance with the policies or procedures may deteriorate.
Critical Audit Matter
The critical audit matters communicated below are matters arising from the current-period audit of the financial statements that were communicated or required to be communicated to the audit committee and that (1) relate to accounts or disclosures that are material to the financial statements and (2) involved our especially challenging, subjective, or complex judgments. The communication of critical audit matters does not alter in any way our opinion on the financial statements, taken as a whole, and we are not, by communicating the critical audit matters below, providing separate opinions on the critical audit matters or on the accounts or disclosures to which they relate.
Fair Value — Underlying Investments Without Readily Determinable Fair Values Used in the Calculation of Performance Allocations — Refer to Notes 2 and 4 of the financial statements
Critical Audit Matter Description
The Company, as a general partner, is entitled to an allocation of income from certain TPG Funds (“TPG Funds”), assuming certain investment returns are achieved, referred to as “Performance Allocations”. Performance Allocations are accrued based on cumulative fund performance as of each reporting date, and after specified investment returns to the TPG Funds’ limited partners are achieved. The fair value of the underlying investments held by the TPG Funds is a significant input into this calculation.
As the fair value of underlying investments varies between reporting periods, it is necessary to make adjustments to amounts recorded as Performance Allocations to reflect either (a) positive performance resulting in an increase in the Performance Allocations or (b) negative performance that would cause the amount due to the general partner to be less than the amount previously recognized, resulting in a negative adjustment to Performance Allocations. In each case, Performance Allocations are calculated on a cumulative basis and cumulative results are compared to amounts previously recorded with a current period adjustment, positive or negative, recorded. Accrued but unpaid Performance Allocations as of the reporting date are reflected in Investments in the consolidated statements of financial condition.
We identified the valuation of certain investments without readily determinable fair values used in the calculation of Performance Allocations as a critical audit matter because of the valuation techniques, assumptions, and subjectivity of the unobservable inputs used in the valuation, and changes in the fair value of these investments directly impacts the amount of Performance Allocations the Company accrues for the period. Auditing these inputs required a high degree of auditor judgment and an increased extent of effort, including the need to involve our fair value specialists who possess significant investment valuation expertise.
How the Critical Audit Matter Was Addressed in the Audit
Our audit procedures related to valuation techniques, assumptions, and unobservable pricing inputs used by management to estimate the fair values of certain investments with unobservable inputs (“Level III”) included the following, among others:
•We involved more senior, more experienced audit team members to perform audit procedures.
•We tested the effectiveness of internal controls over the determination of the fair value of certain Level III Investments.
•We utilized our fair value specialists to assist in the evaluation of management’s valuation methodologies and valuation assumptions including the unobservable pricing inputs used to estimate fair value. Our fair value specialist procedures included testing the underlying source information of the assumptions, as well as developing a range of independent estimates and comparing those to the inputs used by management.
•We assessed the consistency by which management applied its valuation process.
•We evaluated management’s ability to accurately forecast future revenues and operating margins by comparing actual results to management’s historical forecasts.
•We evaluated management’s ability to accurately estimate the fair value of Level III investments by comparing the previous estimates of fair value to subsequent market transactions.
Intangible Assets - Valuation of Investment Management Agreement and Acquired Carried Interest Intangible Assets for the Angelo Gordon Acquisition – Refer to Note 3 of the financial statements
Critical Audit Matter Description
On November 1, 2023, the Company completed the acquisition of Angelo Gordon and its subsidiaries. The acquisition was accounted for as a business combination under ASC Topic 805, Business Combinations, with the assets acquired and liabilities assumed recorded at fair value, including identified intangible assets. The intangible assets included investment management agreements and acquired carried interest. Management, with the assistance of a third-party valuation specialist, estimated the fair value of the intangible assets by discounting the forecasted future cash flows. The determination of fair value of the identified intangible assets involves significant estimates and assumptions related to the forecasted future cash flows and the selection of the discount rates.
We identified the valuation of the investment management agreement and acquired carried interest intangible assets as a critical audit matter because the fair value determination requires management to make significant valuation estimates and assumptions in determining the forecasted future cash flows and the selection of the respective discount rates. Performing audit procedures to evaluate the reasonableness of these estimates and assumptions required a high degree of auditor judgment and an increased extent of effort, including the involvement of our fair value specialists who possess significant valuation expertise.
How the Critical Audit Matter Was Addressed in the Audit
Our audit procedures related to the forecasts of future cash flows and the selection of the discount rate for the investment management agreement and acquired carried interest intangible assets included the following, among others:
•We involved more senior, more experienced audit team members to perform audit procedures.
•We tested the effectiveness of controls over the valuation of the investment management agreement and acquired carried interest intangible assets, including management’s controls over forecasts of future cash flows and selection of the discount rate.
•We assessed the knowledge, skill, ability, and objectivity of management’s valuation specialist and evaluated the work performed.
•With the assistance of our fair value specialists, we evaluated the reasonableness of the (1) valuation methodology and (2) discount rate by:
•Testing the source information underlying the determination of the discount rate and testing the mathematical accuracy of the calculation.
•Developing a range of independent estimates and comparing those to the discount rate selected by management.
•We assessed the reasonableness of management’s forecasts of future cash flows by comparing the projections to governing documents, market data, industry data, and historical results, where applicable.
•We evaluated whether the estimated future cash flows were consistent with evidence obtained in other areas of the audit, including the consideration of any contradictory evidence.
/s/ DELOITTE & TOUCHE LLP
Fort Worth, Texas
February 23, 2024
We have served as the Company’s auditor since 2015.
TPG Inc.
Consolidated Statements of Financial Condition
(dollars in thousands, except share data) | | | | | | | | | | | |
| December 31, 2023 | | December 31, 2022 |
| Assets | | | |
| Cash and cash equivalents | $ | 665,188 | | | $ | 1,107,484 | |
Restricted cash(1) | 13,183 | | | 13,166 | |
| Due from affiliates | 418,977 | | | 202,639 | |
Investments (includes assets pledged of $648,529 and $475,110 as of December 31, 2023 and December 31, 2022, respectively(1)) | 6,724,112 | | | 5,329,868 | |
| Intangible assets | 649,508 | | | 136,187 | |
| Goodwill | 436,079 | | | 230,194 | |
| Other assets | 462,625 | | | 263,011 | |
Assets of consolidated Public SPACs(1): | | | |
| Cash and cash equivalents | — | | | 5,097 | |
| Assets held in Trust Accounts | — | | | 653,635 | |
| Other assets | — | | | 457 | |
| Total assets | $ | 9,369,672 | | | $ | 7,941,738 | |
| | | |
| Liabilities, Redeemable Equity and Equity | | | |
| Liabilities | | | |
| Accounts payable and accrued expenses | $ | 171,796 | | | $ | 98,171 | |
| Due to affiliates | 143,175 | | | 139,863 | |
Debt obligations(1) | 945,052 | | | 444,566 | |
| Accrued performance allocation compensation | 4,096,052 | | | 3,269,889 | |
| Other liabilities | 652,463 | | | 226,090 | |
Liabilities of consolidated Public SPACs(1): | | | |
| Derivative liabilities | — | | | 667 | |
| Deferred underwriting | — | | | 22,750 | |
| Other liabilities | — | | | 236 | |
| Total liabilities | 6,008,538 | | | 4,202,232 | |
| | | |
Commitments and contingencies (Note 17) | | | |
| | | |
Redeemable equity attributable to consolidated Public SPACs(1) | — | | | 653,635 | |
| | | |
| Equity | | | |
Class A common stock $0.001 par value, 2,340,000,000 shares authorized (80,596,501 and 79,240,058 shares issued and outstanding as of December 31, 2023 and December 31, 2022, respectively) | 80 | | | 79 | |
Class B common stock $0.001 par value, 750,000,000 shares authorized (281,657,626 and 229,652,641 shares issued and outstanding as of December 31, 2023 and December 31, 2022, respectively) | 282 | | | 230 | |
Preferred stock, $0.001 par value, 25,000,000 shares authorized (0 issued and outstanding as of December 31, 2023 and December 31, 2022) | — | | | — | |
| Additional paid-in-capital | 613,476 | | | 506,639 | |
| Retained (deficit) earnings | (34,681) | | | 2,724 | |
| Other non-controlling interests | 2,781,977 | | | 2,576,199 | |
| Total equity | 3,361,134 | | | 3,085,871 | |
| Total liabilities, redeemable equity and equity | $ | 9,369,672 | | | $ | 7,941,738 | |
_________________
(1)The Company’s consolidated total assets and liabilities as of December 31, 2023 and December 31, 2022 include assets and liabilities of variable interest entities (“VIEs”). The assets can be used only to satisfy obligations of the VIEs, and the creditors of the VIEs have recourse only to these assets, and not to TPG Inc. These amounts include the assets and liabilities of consolidated Public SPACs, restricted cash, assets pledged of securitization vehicles, secured borrowings of securitization vehicles, and redeemable equity of consolidated Public SPACs. See Notes 2, 11, 12 and 15 to the Consolidated Financial Statements.
See accompanying notes to Consolidated Financial Statements.
166
TPG Inc.
Consolidated Statements of Operations
(dollars in thousands, except share and per share data) | | | | | | | | | | | | | | | | | |
| Year Ended December 31, |
| 2023 | | 2022 | | 2021 |
| Revenues | | | | | |
| Fees and other | $ | 1,534,626 | | | $ | 1,246,635 | | | $ | 977,904 | |
| Capital allocation-based income | 855,285 | | | 756,252 | | | 3,998,483 | |
| Total revenues | 2,389,911 | | | 2,002,887 | | | 4,976,387 | |
| Expenses | | | | | |
| Compensation and benefits: | | | | | |
| Cash-based compensation and benefits | 547,377 | | | 473,696 | | | 579,698 | |
| Equity-based compensation | 654,922 | | | 627,714 | | | — | |
| Performance allocation compensation | 591,676 | | | 416,556 | | | — | |
| Total compensation and benefits | 1,793,975 | | | 1,517,966 | | | 579,698 | |
| General, administrative and other | 482,574 | | | 368,915 | | | 278,590 | |
| Depreciation and amortization | 47,673 | | | 32,990 | | | 21,223 | |
| Interest expense | 38,528 | | | 21,612 | | | 16,291 | |
| Expenses of consolidated TPG Funds and Public SPACs: | | | | | |
| Interest expense | — | | | — | | | 740 | |
| Other | 1,053 | | | 3,316 | | | 20,024 | |
| Total expenses | 2,363,803 | | | 1,944,799 | | | 916,566 | |
| Investment income (loss) | | | | | |
| Income (loss) from investments: | | | | | |
| Net gains (losses) from investment activities | 6,564 | | | (110,131) | | | 353,219 | |
| | | | | |
| Interest, dividends and other | 42,622 | | | 9,168 | | | 6,460 | |
| Investment income of consolidated TPG Funds and Public SPACs: | | | | | |
| Net gains from investment activities | — | | | — | | | 23,392 | |
| Unrealized gains on derivative liabilities of Public SPACs | 667 | | | 12,382 | | | 211,822 | |
| Interest, dividends and other | 7,692 | | | 6,741 | | | 10,321 | |
| Total investment income (loss) | 57,545 | | | (81,840) | | | 605,214 | |
| Income (loss) before income taxes | 83,653 | | | (23,752) | | | 4,665,035 | |
| Income tax expense | 60,268 | | | 32,483 | | | 9,038 | |
| Net income (loss) | 23,385 | | | (56,235) | | | 4,655,997 | |
| Net (loss) income attributable to redeemable equity in Public SPACs prior to Reorganization and IPO | — | | | (517) | | | 155,131 | |
| Net income attributable to non-controlling interests in consolidated TPG Funds prior to Reorganization and IPO | — | | | — | | | 19,287 | |
| Net income attributable to other non-controlling interests prior to Reorganization and IPO | — | | | 966 | | | 2,455,825 | |
| Net income attributable to TPG Group Holdings prior to Reorganization and IPO | — | | | 5,256 | | | 2,025,754 | |
| Net income attributable to redeemable equity in Public SPACs | 12,044 | | | 15,165 | | | — | |
| Net loss attributable to non-controlling interests in TPG Operating Group | (92,411) | | | (180,824) | | | — | |
| Net income attributable to other non-controlling interests | 23,662 | | | 11,293 | | | — | |
| Net income attributable to TPG Inc. subsequent to Reorganization and IPO | $ | 80,090 | | | $ | 92,426 | | | $ | — | |
| Net income (loss) per share data: | | | | | |
| Net income (loss) available to Class A common stock per share | | | | | |
| Basic | $ | 0.89 | | | $ | 1.10 | | | $ | — | |
| Diluted | $ | (0.04) | | | $ | (0.19) | | | $ | — | |
| Weighted-average shares of Class A common stock outstanding | | | | | |
| Basic | 80,334,871 | | | 79,255,411 | | — |
| Diluted | 317,944,496 | | | 308,908,052 | | — |
See accompanying notes to Consolidated Financial Statements.
167
TPG Inc.
Consolidated Statements of Changes in Equity
(dollars in thousands, except share data)
| | | | | | | | | | | | | | | | | | | | | | | | | | | | | | | | | | | | | | | | | | | | | | | | | | | | | | | | | | | | | | | | | |
| | | Shares of TPG Inc. | | TPG Inc. | | |
| Partners' Capital | | Class A Common Stock | | Class B Common Stock | | Class A Common Stock, at par value | | Class B Common Stock, at par value | | Additional Paid-In Capital | | Retained Earnings (Deficit) | | Accumulated Other Comprehensive Income (Loss) | | Total TPG Inc. Equity | | Other Non-Controlling Interests | | Total Partners' Capital/
Equity |
| Balance at January 1, 2021 | $ | 2,460,868 | | | — | | | — | | | $ | — | | | $ | — | | | $ | — | | | $ | — | | | $ | — | | | $ | — | | | $ | 2,259,834 | | | $ | 4,720,702 | |
| Net income | 2,025,754 | | | — | | | — | | | — | | | — | | | — | | | — | | | — | | | — | | | 2,475,112 | | | 4,500,866 | |
| Capital contributions | — | | | — | | | — | | | — | | | — | | | — | | | — | | | — | | | — | | | 29,776 | | | 29,776 | |
| Capital distributions | (1,230,510) | | | — | | | — | | | — | | | — | | | — | | | — | | | — | | | — | | | (1,219,184) | | | (2,449,694) | |
| Deconsolidation of previously consolidated entities | 36,386 | | | — | | | — | | | — | | | — | | | — | | | — | | | — | | | — | | | 61,151 | | | 97,537 | |
| Change in redemption value of redeemable non-controlling interest | 35,157 | | | — | | | — | | | — | | | — | | | — | | | — | | | — | | | — | | | 53,292 | | | 88,449 | |
| Acquisition of NewQuest | — | | | — | | | — | | | — | | | — | | | — | | | — | | | — | | | — | | | 301,189 | | | 301,189 | |
| Reorganization | (1,721,062) | | | — | | | — | | | — | | | — | | | — | | | — | | | — | | | — | | | 693,651 | | | (1,027,411) | |
| Balance at December 31, 2021 | $ | 1,606,593 | | | — | | | — | | | $ | — | | | $ | — | | | $ | — | | | $ | — | | | $ | — | | | $ | — | | | $ | 4,654,821 | | | $ | 6,261,414 | |
See accompanying notes to Consolidated Financial Statements.
168
TPG Inc.
Consolidated Statements of Changes in Equity
(dollars in thousands, except share data)
| | | | | | | | | | | | | | | | | | | | | | | | | | | | | | | | | | | | | | | | | | | | | | | | | | | | | | | | | | | | | | | | | |
| | | Shares of TPG Inc. | | TPG Inc. | | |
| Partners' Capital | | Class A Common Stock | | Class B Common Stock | | Class A Common Stock, at par value | | Class B Common Stock, at par value | | Additional Paid-In Capital | | Retained Earnings (Deficit) | | Accumulated Other Comprehensive Income (Loss) | | Total TPG Inc. Equity | | Other Non-Controlling Interests | | Total Partners' Capital/
Equity |
| Balance at January 1, 2022 | $ | 1,606,593 | | | — | | | — | | | $ | — | | | $ | — | | | $ | — | | | $ | — | | | $ | — | | | $ | — | | | $ | 4,654,821 | | | $ | 6,261,414 | |
| Net income prior to Reorganization and IPO | 5,256 | | | — | | | — | | | — | | | — | | | — | | | — | | | — | | | — | | | 966 | | | 6,222 | |
| Change in redemption value of redeemable non-controlling interest prior to Reorganization and IPO | (110) | | | — | | | — | | | — | | | — | | | — | | | — | | | — | | | — | | | (407) | | | (517) | |
| Effect of Reorganization and purchase of units in the Partnership | (1,611,739) | | | 48,984,961 | | | 229,652,641 | | | 49 | | | 230 | | | 271,780 | | | (27) | | | — | | | 272,032 | | | 1,341,603 | | | 1,896 | |
| Issuance of common stock in IPO, net of underwriting discount and issuance costs | — | | | 28,310,194 | | | — | | | 28 | | | — | | | 784,611 | | | — | | | — | | | 784,639 | | | (25,426) | | | 759,213 | |
| Purchase of Partnership Interests with IPO proceeds | — | | | — | | | — | | | — | | | — | | | — | | | — | | | — | | | — | | | (379,597) | | | (379,597) | |
| Issuance of common stock from Underwriters' exercise of over-allotment option, net of underwriting discount and issuance costs | — | | | 1,775,410 | | | — | | | 2 | | | — | | | 49,754 | | | — | | | — | | | 49,756 | | | — | | | 49,756 | |
| Equity reallocation between controlling and non-controlling interests prior to Reorganization and IPO | — | | | — | | | — | | | — | | | — | | | (654,129) | | | — | | | — | | | (654,129) | | | 654,129 | | | — | |
| Acquisition of NewQuest | — | | | — | | | — | | | — | | | — | | | 33,584 | | | — | | | — | | | 33,584 | | | (33,584) | | | — | |
| Deferred tax effect resulting from purchase of Class A Units, net of amounts payable under Tax Receivable Agreement | — | | | — | | | — | | | — | | | — | | | (13,232) | | | — | | | — | | | (13,232) | | | — | | | (13,232) | |
| Liability-based performance allocation compensation | — | | | — | | | — | | | — | | | — | | | — | | | — | | | — | | | — | | | (3,525,767) | | | (3,525,767) | |
| Net income (loss) subsequent to Reorganization and IPO | — | | | — | | | — | | | — | | | — | | | — | | | 92,426 | | | — | | | 92,426 | | | (169,531) | | | (77,105) | |
| Shares issued for equity-based awards | — | | | 169,493 | | | — | | | 0 | | | — | | | 1,088 | | | — | | | — | | | 1,088 | | | (901) | | | 187 | |
| Equity-based compensation subsequent to Reorganization and IPO | — | | | — | | | — | | | — | | | — | | | 31,841 | | | — | | | — | | | 31,841 | | | 602,647 | | | 634,488 | |
| Capital contributions subsequent to Reorganization and IPO | — | | | — | | | — | | | — | | | — | | | — | | | — | | | — | | | — | | | 13,039 | | | 13,039 | |
| Dividends/Distributions | — | | | — | | | — | | | — | | | — | | | — | | | (89,675) | | | — | | | (89,675) | | | (576,955) | | | (666,630) | |
| Change in redemption value of redeemable non-controlling interest subsequent to Reorganization and IPO | — | | | — | | | — | | | — | | | — | | | 1,342 | | | — | | | — | | | 1,342 | | | 21,162 | | | 22,504 | |
| Balance at December 31, 2022 | $ | — | | | 79,240,058 | | | 229,652,641 | | | $ | 79 | | | $ | 230 | | | $ | 506,639 | | | $ | 2,724 | | | $ | — | | | $ | 509,672 | | | $ | 2,576,199 | | | $ | 3,085,871 | |
See accompanying notes to Consolidated Financial Statements.
169
TPG Inc.
Consolidated Statements of Changes in Equity
(dollars in thousands, except share data)
| | | | | | | | | | | | | | | | | | | | | | | | | | | | | | | | | | | | | | | | | | | | | | | | | | | | | | | | | | | |
| | | Shares of TPG Inc. | | TPG Inc. | | |
| | | Class A Common Stock | | Class B Common Stock | | Class A Common Stock, at par value | | Class B Common Stock, at par value | | Additional Paid-In Capital | | Retained Earnings (Deficit) | | | | Total TPG Inc. Equity | | Other Non-Controlling Interests | | Total Partners' Capital/
Equity |
| Balance at January 1, 2023 | | | 79,240,058 | | | 229,652,641 | | | $ | 79 | | | $ | 230 | | | $ | 506,639 | | | $ | 2,724 | | | | | $ | 509,672 | | | $ | 2,576,199 | | | $ | 3,085,871 | |
| Net income (loss) | | | — | | | — | | | — | | | — | | | — | | | $ | 80,090 | | | | | 80,090 | | | (68,749) | | | 11,341 | |
| Equity-based compensation | | | — | | | — | | | — | | | — | | | 49,579 | | | — | | | | | 49,579 | | | 590,443 | | | 640,022 | |
| Capital contributions | | | — | | | — | | | — | | | — | | | — | | | — | | | | | — | | | 21,769 | | | 21,769 | |
| Dividends/distributions | | | — | | | — | | | — | | | | | — | | | (117,495) | | | | | (117,495) | | | (539,309) | | | (656,804) | |
| Change in redemption value of redeemable non-controlling interest | | | — | | | — | | | — | | | — | | | 1,457 | | | — | | | | | 1,457 | | | 25,971 | | | 27,428 | |
| Shares issued for net settlement of equity-based awards | | | 356,443 | | | — | | | 0 | | — | | | 0 | | — | | | | | — | | | — | | | — | |
| Withholding taxes paid on net settlement of equity-based awards | | | — | | | — | | | — | | | — | | | (1,752) | | | — | | | | | (1,752) | | | (5,126) | | | (6,878) | |
| Deferred tax effects resulting from changes in equity | | | — | | | — | | | — | | | — | | | (767) | | | — | | | | | (767) | | | — | | | (767) | |
| Exchange of Common Units to TPG Inc. Class A Common stock | | | 1,000,000 | | | (1,000,000) | | | 1 | | | (1) | | | 1,085 | | | — | | | | | 1,085 | | | — | | | 1,085 | |
| Acquisition (see Note 3) | | | — | | | 53,004,985 | | | — | | | 53 | | | (53) | | | — | | | | | — | | | 238,067 | | | 238,067 | |
| Equity reallocation between controlling and non-controlling interest | | | — | | | — | | | — | | | — | | | 57,288 | | | — | | | | | 57,288 | | | (57,288) | | | — | |
| | | | | | | | | | | | | | | | | | | | | |
| Balance at December 31, 2023 | | | 80,596,501 | | | 281,657,626 | | | $ | 80 | | | $ | 282 | | | $ | 613,476 | | | $ | (34,681) | | | | | $ | 579,157 | | | $ | 2,781,977 | | | $ | 3,361,134 | |
See accompanying notes to Consolidated Financial Statements.
170
TPG Inc.
Consolidated Statements of Cash Flows
(dollars in thousands)
| | | | | | | | | | | | | | | | | |
| Year Ended December 31, |
| 2023 | | 2022 | | 2021 |
| Operating activities: | | | | | |
| Net income (loss) | $ | 23,385 | | | $ | (56,235) | | | $ | 4,655,997 | |
| Adjustments to reconcile net income (loss) to net cash provided by operating activities: | | | | | |
| Equity-based compensation | 654,922 | | | 627,714 | | | — | |
| Performance allocation compensation | 591,676 | | | 416,556 | | | — | |
| Net (gains) losses from investment activities | (6,564) | | | 110,131 | | | (353,219) | |
| Capital allocation-based income | (855,285) | | | (756,252) | | | (3,998,483) | |
| Other non-cash activities | 100,628 | | | 29,939 | | | 45,729 | |
| Unrealized gains from investment activities of consolidated TPG Funds and Public SPACs | (667) | | | (12,382) | | | (235,214) | |
| Changes in operating assets and liabilities: | | | | | |
| Purchases of investments | (303,118) | | | (109,093) | | | (173,885) | |
| Proceeds from investments | 798,478 | | | 1,567,684 | | | 2,179,064 | |
| Due from affiliates | 41,268 | | | (42,378) | | | (42,826) | |
| Other assets | (44,475) | | | (35,893) | | | (22,586) | |
| Accounts payable and accrued expenses | (231,542) | | | (14,235) | | | 51,148 | |
| Due to affiliates | (161,833) | | | (12,528) | | | 11,129 | |
| Accrued performance allocation compensation | (505,024) | | | (672,375) | | | — | |
| Other liabilities | (40,283) | | | (22,515) | | | (26,931) | |
| Changes related to consolidated TPG Funds and Public SPACs: | | | | | |
| Purchases of investments | — | | | — | | | (216,657) | |
| Proceeds from investments | — | | | — | | | 218,695 | |
| Cash and cash equivalents | 5,097 | | | 274 | | | 5,839 | |
| Assets held in Trust Accounts | 653,635 | | | 346,392 | | | (630,281) | |
| Other assets | 457 | | | 18,611 | | | (12,583) | |
| Other liabilities | (237) | | | (7,537) | | | 19,884 | |
| Net cash provided by operating activities | 720,518 | | | 1,375,878 | | | 1,474,820 | |
| | | | | |
| Investing activities: | | | | | |
| Acquisitions, net of cash acquired (Note 3) | (356,835) | | | — | | | 24,817 | |
| Repayments of notes receivable from affiliates | — | | | 14,937 | | | 23,282 | |
| Advances on notes receivable from affiliates | — | | | (15,500) | | | (9,053) | |
| Purchases of fixed assets | (16,728) | | | (2,449) | | | (1,791) | |
| Transfers related to Reorganization Activities | — | | | — | | | (75,000) | |
| Net cash used in investing activities | (373,563) | | | (3,012) | | | (37,745) | |
| | | | | |
| Financing activities: | | | | | |
| Proceeds from issuance of common stock in IPO, net of underwriting and issuance costs | — | | | 770,865 | | | — | |
| Proceeds from issuance of common stock from underwriters' exercise of over-allotment option, net of underwriting and issuance costs | — | | | 49,756 | | | — | |
| Purchase of partnership interests with IPO proceeds | — | | | (379,597) | | | — | |
| Reorganization activities | — | | | 2,124 | | | — | |
| Proceeds from debt obligations | 651,000 | | | 30,000 | | | 200,000 | |
| Repayment of debt obligations | (150,000) | | | (30,000) | | | (50,000) | |
| Issuance costs on debt obligations | (900) | | | — | | | (520) | |
| | | | | |
| Withholding taxes paid on net settlement of equity-based awards | (6,878) | | | — | | | — | |
| Contributions from holders of other non-controlling interests | 21,769 | | | 7,822 | | | 4,636 | |
See accompanying notes to Consolidated Financial Statements.
171
| | | | | | | | | | | | | | | | | |
| Year Ended December 31, |
| 2023 | | 2022 | | 2021 |
| Distributions to holders of other non-controlling interests prior to Reorganization and IPO | — | | | (318,942) | | | (1,009,242) | |
| Dividends/Distributions | (643,224) | | | (662,812) | | | — | |
| Distributions to partners prior to Reorganization and IPO | — | | | (355,282) | | | (1,066,680) | |
| Changes related to TPG Funds and Public SPACs: | | | | | |
| Proceeds from SPAC IPOs | — | | | — | | | 935,000 | |
| Payments of underwriting and offering costs | — | | | — | | | (18,700) | |
| Redemption of redeemable equity | (661,001) | | | (352,014) | | | (304,760) | |
| Contributions from holders of non-controlling interests | — | | | — | | | 540 | |
| Distributions to holders of non-controlling interests | — | | | — | | | (12,840) | |
| Net cash used in financing activities | $ | (789,234) | | | $ | (1,238,080) | | | $ | (1,322,566) | |
| Net change in cash, cash equivalents and restricted cash | $ | (442,279) | | | $ | 134,786 | | | $ | 114,509 | |
| Cash, cash equivalents and restricted cash, beginning of period | 1,120,650 | | | 985,864 | | | 871,355 | |
| Cash, cash equivalents and restricted cash, end of period | $ | 678,371 | | | $ | 1,120,650 | | | $ | 985,864 | |
| | | | | |
| Supplemental disclosures of other cash flow information: | | | | | |
| Cash paid for income taxes | $ | 51,130 | | | $ | 48,327 | | | $ | 8,548 | |
| Cash paid for interest | 33,549 | | | 18,352 | | | 15,728 | |
| Supplemental disclosures of non-cash operating activities: | | | | | |
| Investment in equity method investments | — | | | — | | | (3,138) | |
| In-kind proceeds from investments | — | | | — | | | 36,334 | |
| Increase in due from affiliates | — | | | — | | | (3,045) | |
| Supplemental disclosures of non-cash investing and financing activities: | | | | | |
| Reorganization | — | | | — | | | (952,411) | |
| NewQuest contingent consideration | — | | | — | | | 8,400 | |
| Equity interests transferred for NewQuest acquisition | — | | | — | | | 24,600 | |
| Deferred underwriting related to Public SPACs | 22,750 | | | 12,250 | | | (35,441) | |
| Distributions in-kind to holders of other non-controlling interests | — | | | — | | | (33,197) | |
| Distributions payable to partners | — | | | — | | | 352,722 | |
| Distributions payable to holders of other non-controlling interests | 17,779 | | | 3,964 | | | 355,282 | |
| Repayments of notes receivable to affiliates | — | | | — | | | 3,045 | |
| Reconciliation of cash, cash equivalents and restricted cash, end of period: | | | | | |
| Cash and cash equivalents | $ | 665,188 | | | $ | 1,107,484 | | | $ | 972,729 | |
| Restricted cash | 13,183 | | | 13,166 | | | 13,135 | |
| Cash, cash equivalents and restricted cash, end of period | $ | 678,371 | | | $ | 1,120,650 | | | $ | 985,864 | |
| | | | | |
See accompanying notes to Consolidated Financial Statements.
172
TPG Inc.
Notes to Consolidated Financial Statements
1. Organization
TPG Inc., along with its consolidated subsidiaries (collectively “TPG,” or the “Company”) is a leading global alternative asset manager on behalf of third-party investors under the “TPG” brand name. TPG Inc. includes the consolidated accounts of management companies, general partners of pooled investment entities and variable interest entities, in which the Company is the primary beneficiary, held by TPG Operating Group II, L.P., a holding company (“TPG Operating Group”).
Reorganization and IPO
The owners of TPG Group Holdings and the TPG Operating Group completed a series of actions on January 12, 2022 as part of a corporate reorganization (the “Reorganization”), in conjunction with an initial public offering (“IPO”) that was completed on January 18, 2022. TPG Partners, LLC was created on August 4, 2021 to effectuate the IPO and acquire Common Units of the TPG Operating Group on behalf of public investors. TPG Partners, LLC was designed as a holding company, and its only business was to act as the owner of the entities serving as the general partner of the TPG Operating Group partnerships. The TPG Operating Group (and the entities through which its direct and indirect partners held their interests) was restructured and recapitalized.
On December 31, 2021, the TPG Operating Group transferred certain assets to RemainCo and distributed the interests in RemainCo to the owners of the TPG Operating Group. Following the transfer of certain assets, the Company deconsolidated certain TPG Funds (“TPG Funds”) as of December 31, 2021 as the Company is no longer their primary beneficiary. On January 12, 2022, the following steps were completed:
•TPG Group Holdings, the TPG Operating Group, and TPG Partners, LLC completed the remaining steps of the planned Reorganization. The TPG Operating Group created Common Units and issued them to the Company and the other non-controlling interest holders of the TPG Operating Group. Immediately following the Reorganization, the TPG Operating Group and its subsidiaries were controlled by the same parties and as such, the Reorganization is a transfer of interests under common control. Accordingly, the Company will carry forward the existing value of the members’ interests in the assets and liabilities in these Consolidated Financial Statements prior to the IPO into the financial statements following the IPO.
•TPG Partners, LLC changed its name to TPG Inc. and converted to a corporation.
•TPG Inc. offered 33,900,000 shares of Class A common stock at a price of $29.50 per share, including 5,589,806 shares sold by a non-controlling interest holder of the TPG Operating Group, in the IPO. Additionally, certain Pre-IPO Investors exchanged their interests in the TPG Operating Group for interests in TPG Inc. totaling 35,136,254 Class A voting and 8,258,901 Class A non-voting common stock. The IPO closed on January 18, 2022, and TPG Inc. received proceeds totaling $770.9 million, net of $41.8 million in underwriting discounts and commissions, as well as $22.5 million of issuance costs. Proceeds of $379.6 million were used to repurchase Common Units of the TPG Operating Group from certain existing non-controlling interest holders, acquire newly issued Common Units of the TPG Operating Group and the remaining net proceeds are available for general corporate purposes. As a result of the Reorganization and IPO, TPG Inc. only holds Common Units of the TPG Operating Group.
On February 9, 2022, the Company and the selling stockholder sold an additional 1,775,410 and 1,614,590 Class A common stock, respectively, at the initial public offering price pursuant to the underwriters’ exercise of their option to purchase additional shares. TPG Inc. received additional net proceeds totaling approximately $49.8 million. The underwriters’ exercise of their option in addition to the IPO related transactions resulted in a total of 70,811,664 and 8,258,901 of Class A voting and Class A non-voting common stock outstanding, respectively.
As of December 31, 2023, TPG Inc.’s legal ownership of the TPG Operating Group totaled approximately 22%.
TPG Inc.
Notes to Consolidated Financial Statements
2. Summary of Significant Accounting Policies
Basis of Presentation
The accompanying consolidated financial statements (the “Consolidated Financial Statements”) have been prepared in accordance with accounting principles generally accepted in the United States of America (“U.S. GAAP”) and reflect all adjustments, consisting only of normal recurring adjustments, which are, in the opinion of management, necessary for a fair presentation of the Company’s Consolidated Financial Statements. All dollar amounts are stated in thousands unless otherwise indicated. All intercompany transactions and balances have been eliminated. Certain comparative amounts for the prior fiscal period have been reclassified to conform to the financial statement presentation as of and for the period ended December 31, 2023.
The Consolidated Financial Statements include the accounts of TPG Inc., TPG Operating Group and their consolidated subsidiaries, management companies, the general partners of funds and entities that meet the definition of a variable interest entity (“VIE”) for which the Company is considered the primary beneficiary.
The financial statements for periods prior to the Reorganization and IPO present the consolidated accounts of TPG Group Holdings, which is considered the predecessor for accounting purposes. Following the completion of our IPO, TPG Inc. is the successor for accounting purposes.
Prior to the Reorganization and IPO, the Company’s predecessor consolidated certain TPG Funds and Public SPACs (herein referred to as “consolidated TPG Funds and Public SPACs”) pursuant to U.S. GAAP, as the Company’s predecessor was considered the primary beneficiary. Following the Reorganization and IPO, the Company no longer has a controlling financial interest in certain TPG Funds. Public SPACs are consolidated pursuant to U.S. GAAP, and the accompanying Consolidated Financial Statements include the assets, liabilities, revenues, expenses and cash flows of the consolidated Public SPACs. The ownership interest in certain TPG Funds held by entities or persons outside of TPG are reflected as other non-controlling interests in the accompanying Consolidated Financial Statements for fiscal years beginning prior to January 1, 2022.
All of the management fees and other amounts earned from the consolidated TPG Funds and Public SPACs are eliminated in consolidation. In addition, the equivalent expense amounts recorded by the consolidated TPG Funds and Public SPACs are also eliminated, with such reduction of expenses allocated to controlling interest holders. Accordingly, the consolidation of these entities has no net effect on net income attributable to TPG Inc. or net income attributable to other non-controlling interests.
Use of Estimates
The preparation of the Consolidated Financial Statements in accordance with U.S. GAAP requires management to make estimates and assumptions that affect the reported amounts of assets and liabilities and the disclosure of contingent assets and liabilities at the date of the Consolidated Financial Statements, and the reported amounts of revenues, expenses, and investment income during the reporting periods. Actual results could differ from those estimates and such differences could be material to the Consolidated Financial Statements.
Principles of Consolidation
The types of entities TPG assesses for consolidation include subsidiaries, management companies, broker-dealers, general partners of investment funds, investment funds, SPACs and other entities. Each of these entities is assessed for consolidation on a case by case basis depending on the specific facts and circumstances surrounding that entity.
TPG first considers whether an entity is considered a VIE and therefore whether to apply the consolidation guidance under the VIE model. Entities that do not qualify as VIEs are assessed for consolidation as voting interest entities (“VOE”) under the voting interest model.
An entity is considered to be a VIE if any of the following conditions exist: (i) the equity investment at risk is not sufficient to finance the activities of the entity without additional subordinated financial support, (ii) as a group, the holders of the equity investment at risk lack the power to direct the activities that most significantly impact the entity’s economic
TPG Inc.
Notes to Consolidated Financial Statements
performance or the obligation to absorb the expected losses or right to receive the expected residual returns, and (iii) the voting rights of some holders of the equity investment at risk are disproportionate to their obligation to absorb losses or right to receive returns, and substantially all of the activities are conducted on behalf of the holder of equity investment at risk with disproportionately few voting rights. For limited partnerships, partners lack power if neither (i) a simple majority or lower threshold (including a single limited partner) with equity at risk is able to exercise substantive kick-out rights through voting interests over the general partner, nor (ii) limited partners with equity at risk are able to exercise substantive participating rights over the general partners.
TPG consolidates all VIEs in which it is the primary beneficiary. An entity is determined to be the primary beneficiary if it holds a controlling financial interest in a VIE. A controlling financial interest is defined as (i) the power to direct the activities of a VIE that most significantly impact the VIE’s economic performance and (ii) the obligation to absorb losses of the VIE or the right to receive benefits from the VIE that could potentially be significant to the VIE. The consolidation guidance requires an analysis to determine (i) whether an entity in which TPG holds a variable interest is a VIE and (ii) whether TPG’s involvement, through holding interest directly or indirectly in the entity or contractually through other variable interests, would give it a controlling financial interest. Performance of that analysis requires judgment. The analysis can generally be performed qualitatively; however, if it is not readily apparent that TPG is not the primary beneficiary, a quantitative analysis may also be performed. TPG factors in all economic interests including interests held through related parties, to determine if it holds a variable interest. Fees earned by TPG that are customary and commensurate with the level of effort required for the services provided, and where TPG does not hold other economic interests in the entity that would absorb more than an insignificant amount of the expected losses or returns of the entity, would not be considered variable interests. TPG determines whether it is the primary beneficiary of a VIE at the time it becomes involved with a VIE and continuously reconsiders that conclusion when facts and circumstances change.
Entities that are determined not to be VIEs are generally considered to be VOEs and are evaluated under the voting interest model. TPG consolidates VOEs that it controls through a majority voting interest or through other means.
Investments
Investments consist of investments in private equity funds, real estate funds, hedge funds and credit funds, including our share of any performance allocations and equity method and other proprietary investments. Investments denominated in currencies other than the U.S. dollar are valued based on the spot rate of the respective currency at the end of the reporting period with changes related to exchange rate movements reflected in the Consolidated Financial Statements.
Equity Method – Performance Allocations and Capital Interests
Investments in which the Company is deemed to have significant influence, but not control, are accounted for using the equity method of accounting except in cases where the fair value option has been elected. The Company as general partner has significant influence over the TPG funds in which it invests but does not consolidate. The Company uses the equity method of accounting for these interests whereby it records both its proportionate and disproportionate allocation of the underlying profits or losses of these entities in revenues in the accompanying Consolidated Financial Statements. The carrying amounts of equity method investments are included in investments in the Consolidated Financial Statements. The Company evaluates its equity method investments for impairment whenever events or changes in circumstances indicate that the carrying amounts of such investments may not be recoverable. The difference between the carrying value and its estimated fair value is recognized as an impairment when the loss is deemed other than temporary.
The TPG funds are considered investment companies under Accounting Standards Codification (“ASC”) Topic 946, Financial Services – Investment Companies (“ASC 946”). The Company, along with the TPG funds, applies the specialized accounting promulgated in ASC 946 and, as such, neither the Company nor the TPG funds consolidate wholly-owned, majority-owned and/or controlled portfolio companies. The TPG funds record all investments in the portfolio companies at fair value. Investments in publicly traded securities are generally valued at quoted market prices based upon the last sales price on the measurement date. Discounts are applied, where appropriate, to reflect restrictions on the marketability of the investment.
When observable prices are not available for investments, the general partners use the market and income approaches to determine fair value. The market approach consists of utilizing observable market data, such as current trading or acquisition multiples of comparable companies, and applying it to key financial metrics, such as earnings before
TPG Inc.
Notes to Consolidated Financial Statements
interest, depreciation and taxes, of the portfolio company. The comparability of the identified set of comparable companies to the portfolio company, among other factors, is considered in the application of the market approach.
The general partners, depending on the type of investment or stage of the portfolio company’s lifecycle, may also utilize a discounted cash flow analysis, an income approach, in combination with the market approach in determining fair value of investments. The income approach involves discounting projected cash flows of the portfolio company at a rate commensurate with the level of risk associated with those cash flows. In accordance with ASC Topic 820, Fair Value Measurement (“ASC 820”) market participant assumptions are used in the determination of the discount rate.
In applying valuation techniques used in the determination of fair value, the general partners assume a reasonable period of time for liquidation of the investment and take into consideration the financial condition and operating results of the underlying portfolio company, the nature of the investment, restrictions on marketability, market conditions, foreign currency exposures and other factors. In determining the fair value of investments, the general partners exercise significant judgment and use the best information available as of the measurement date. Due to the inherent uncertainty of valuations, the fair values reflected in the accompanying Consolidated Financial Statements may differ materially from values that would have been used had a readily available market existed for such investments and may differ materially from the values that may ultimately be realized.
Investments Held to Maturity
The Company holds investments in the notes issued by CLO funds that are held to maturity. The Company has the intent and ability to hold these investments until maturity. Held to maturity securities are stated at amortized cost, adjusted for amortization of premiums and accretion of discounts to maturity computed under the effective interest method. The effective interest method uses projected cash flows and includes uncertainties and contingencies that are difficult to predict and are subject to future events that may impact estimated interest income prospectively. Certain tranches of the notes were purchased at a discount and are being amortized back to par value until they mature at various dates between 2033 to 2035. If the Company failed to keep these investments as held to maturity it would be required to reclassify them as trading securities and would measure at fair value. Where applicable, impairment is recognized related to investments in the CLO funds in accordance with U.S. GAAP. The CLO funds evaluate securities for impairment on a security-by-security basis based on adverse changes in expected cash flows.
Those investments were fair valued in purchase accounting as discussed in Note 3.
Equity Method Investments – Other
The Company holds non-controlling, limited partnership interests in certain other partnerships in which it has significant influence over their operations. The Company uses the equity method of accounting for these interests whereby it records its proportionate share of the underlying income or losses of these entities in net gains (losses) from investment activities in the accompanying Consolidated Financial Statements. The carrying amounts of equity method investments are included in investments in the Consolidated Financial Statements. The Company evaluates its equity method investments for impairment whenever events or changes in circumstances indicate that the carrying amounts of such investments may not be recoverable. The difference between the carrying value and its estimated fair value is recognized as an impairment when the loss is deemed other than temporary and recorded in net gains (losses) from investment activities within the Consolidated Financial Statements.
Equity Method – Fair Value Option
The Company elects the fair value option for certain investments that would otherwise be accounted for using the equity method of accounting. Such election is irrevocable and is applied on an investment-by-investment basis at initial recognition. The fair value of such investments is based on quoted prices in an active market. Changes in the fair value of these equity method investments are recognized in net gains (losses) from investment activities in the Consolidated Financial Statements.
TPG Inc.
Notes to Consolidated Financial Statements
Equity Investments
The Company holds non-controlling ownership interests in which it does not have significant influence over their operations. The Company records such investments at fair value when there is a readily determinable fair value. For certain nonpublic partnerships without readily determinable fair values, the Company has elected to measure those investments at cost, less any impairment, plus or minus changes resulting from observable price changes in orderly transactions for the identical or a similar investment of the same issuer. Impairment is evaluated when significant changes occur that may impact the investee in an adverse manner. Impairment, if any, is recognized in net gains (losses) from investment activities in the Consolidated Financial Statements.
Non-Controlling Interests
Non-controlling interests consists of ownership interests held by third-party investors in certain entities that are consolidated, but not 100% owned. The aggregate of the income or loss and corresponding equity that is not owned by the Company is included in non-controlling interests in the Consolidated Financial Statements. Allocation of income to non-controlling interest holders is based on the respective entities’ governing documents.
Revenues
Revenues consisted of the following (in thousands):
| | | | | | | | | | | | | | | | | |
| | | | | |
| Year Ended December 31, |
| 2023 | | 2022 | | 2021 |
| Management fees | $ | 1,187,947 | | | $ | 919,830 | | | $ | 718,344 | |
| Monitoring fees | 10,866 | | | 14,330 | | | 14,324 | |
| Transaction fees | 99,427 | | | 97,909 | | | 90,606 | |
| Incentive fees | 2,815 | | | 5,183 | | | — | |
| Expense reimbursements and other | 233,571 | | | 209,383 | | | 154,630 | |
| Total fees and other | 1,534,626 | | | 1,246,635 | | | 977,904 | |
| | | | | |
| Performance allocations | 808,248 | | | 720,106 | | | 3,792,861 | |
| Capital interests | 47,037 | | | 36,146 | | | 205,622 | |
| Total capital allocation-based income | 855,285 | | | 756,252 | | | 3,998,483 | |
| | | | | |
| Total revenues | $ | 2,389,911 | | | $ | 2,002,887 | | | $ | 4,976,387 | |
TPG Inc.
Notes to Consolidated Financial Statements
Fees and Other
Fees and other are accounted for as contracts with customers under ASC Topic 606, Revenue from Contracts with Customers (“ASC 606”). The guidance for contracts with customers provides a five-step framework that requires the Company to (i) identify the contract with a customer, (ii) identify the performance obligations in the contract, (iii) determine the transaction price, (iv) allocate the transaction price to the performance obligations in the contract and (v) recognize revenue when the Company satisfies its performance obligations. In determining the transaction price, the Company includes variable consideration only to the extent that it is probable that a significant reversal in the amount of cumulative revenue recognized would not occur when the uncertainty associated with the variable consideration is resolved.
| | | | | | | | | | | | | | | | | |
| | | | | |
Revenue Streams | Customer | Performance Obligations satisfied over time or point in time(a) | Variable or Fixed Consideration | Revenue Recognition | Classification of Uncollected Amounts(b) |
Management Fees | TPG funds, limited partners and other vehicles | Asset management services are satisfied over time (daily) because the customer receives and consumes the benefits of the advisory services daily | Consideration is variable since over time the management fee varies based on fluctuations in the basis of the calculation of the fee | Management fees are recognized each reporting period based on the value provided to the customer for that reporting period | Due from affiliates – unconsolidated VIEs |
Monitoring Fees | Portfolio companies | In connection with the investment advisory services provided, the Company earns monitoring fees for providing oversight and advisory services to certain portfolio companies over time | Consideration is variable when based on fluctuations in the basis of the calculation of the fee Consideration is fixed when based on a fixed agreed-upon amount | Monitoring fees are recognized each reporting period based on the value provided to the customer for that reporting period | Due from affiliates – portfolio companies |
Transaction Fees | Portfolio companies, third-parties and other vehicles | The company provides advisory services, debt and equity arrangements, and underwriting and placement services for a fee at a point in time | Consideration is fixed and is based on a point in time | Transaction fees are recognized on or shortly after the transaction is completed | Due from affiliates – portfolio companies Other assets - other |
Incentive Fees | TPG funds, limited partners and other vehicles | Investment management services performed over a period of time that result in achievement of minimum investment return levels | Consideration is variable since incentive fees are contingent upon the TPG Fund or vehicles achieving more than the stipulated investment threshold return | Incentive fees are recognized at the end of the performance measurement period if the investment performance is achieved | Due from affiliates – unconsolidated VIEs |
Expense Reimbursements and other | TPG funds, portfolio companies and third-parties | Expense reimbursements incurred at a point in time relate to providing investment, management and monitoring services. Other revenue is performed over time. | Expense reimbursements and other are fixed consideration | Expense reimbursements and other are recognized as the expenses are incurred or services are rendered | Due from affiliates – portfolio companies and unconsolidated VIEs Other assets – other |
_________________
(a)There were no significant judgments made in evaluating when a customer obtains control of the promised service for performance obligations satisfied at a point in time.
(b)See Note 14 to the Consolidated Financial Statements for amounts classified in due from affiliates. Management Fees
The Company provides investment management services to the TPG funds, limited partners, SMAs and clients, and other vehicles in exchange for a management fee. Management fees also include catch-up fees, also known as out of period management fees, which are fees paid in any given period that relate to a prior period, usually as the result of a new limited partner coming into a fund in a subsequent close. Management fees are determined quarterly based on an annual rate and are generally based upon a percentage of capital committed, net funded capital commitments, cost of investments, Net Asset Value (“NAV”) or actively invested capital or as otherwise defined in the respective management agreements. Since some of the factors that cause management fees to fluctuate are outside of the Company’s control, management fees are considered constrained and are not included in the transaction price until the uncertainty relating to the constraint is subsequently resolved. After the contract is established, management does not make any significant judgments in determining the transaction price.
TPG Inc.
Notes to Consolidated Financial Statements
Management fee rates generally range between the following:
| | | | | | | | | | | | | | |
| Management fee base | | Low | | High |
| Committed capital | | 0.50 | % | | 2.00 | % |
| Actively invested capital | | 0.25 | % | | 2.00 | % |
| Net funded capital commitments | | 0.63 | % | | 1.75 | % |
| Cost of investments | | 0.50 | % | | 1.00 | % |
| NAV | | 0.50 | % | | 1.50 | % |
Under the terms of the management agreements with certain TPG funds, the Company is required to reduce management fees payable by funds by an agreed upon percentage of certain fees, including monitoring and transaction fees earned from portfolio companies. These amounts are generally applied as a reduction of the management fee that is otherwise billed to the investment fund and are recorded as a reduction of revenues in the Consolidated Statement of Operations. For the years ended December 31, 2023, 2022 and 2021, these amounts totaled $6.4 million, $11.5 million and $13.6 million, respectively. Amounts payable to investment funds are recorded in due to affiliates in the Consolidated Financial Statements. See Note 14 to the Consolidated Financial Statements. Management fees charged to consolidated Public SPACs are eliminated in consolidation. Monitoring Fees
The Company provides monitoring services to certain portfolio companies in exchange for a fee, which is recognized over time as services are rendered. After the monitoring contract is established, there are no significant judgments made in determining the transaction price.
Transaction Fees
The Company provides capital structuring and other advice to portfolio companies, third parties and other vehicles generally in connection with debt and equity arrangements, as well as underwriting and placement services for a fee at a point in time when the underlying advisory services rendered are complete. Transaction fees are separately negotiated for each transaction and are generally based on the underlying transaction value. After the contract is established, management makes no significant judgments when determining the transaction price.
Incentive Fees
The Company provides investment management services to certain TPG funds and other vehicles in exchange for a management fee as discussed above and, in some cases, an incentive fee when the Company is not entitled to performance allocations, as further discussed below. Incentive fees are considered variable consideration in the scope of the revenue guidance as these fees are affected by changes in the fair value of investments over the performance period. The Company recognizes incentive fees only when these amounts are no longer subject to significant reversal, which is typically at the end of a defined performance period and/or upon expiration of the associated clawback period. After the contract is established, there are no significant judgments made when determining the transaction price.
Expense Reimbursements and Other
In providing investment management and advisory services to TPG funds and monitoring services to the portfolio companies, TPG routinely contracts for services from third parties. In situations where the Company is viewed, for accounting purposes only, as having incurred these third-party costs on behalf of the TPG funds or portfolio companies, the cost of such services is presented net as a reduction of the Company’s revenues. In all other situations, the expenses and related reimbursements associated with these services are presented on a gross basis, which are classified as part of the Company’s expenses, and reimbursements of such costs are classified as expense reimbursements within revenues in the Consolidated Financial Statements. After the contract is established, there are no significant judgments made when determining the transaction price.
TPG Inc.
Notes to Consolidated Financial Statements
Capital Allocation-Based Income (Loss)
Capital allocation-based income (loss) is earned from the TPG funds when the Company has a general partner’s capital interest and is entitled to a disproportionate allocation of investment income (referred to hereafter as “performance allocations”). The Company records capital allocation-based income (loss) under the equity method of accounting assuming the fund was liquidated as of each reporting date pursuant to each TPG fund’s governing agreements. Accordingly, these general partner interests are accounted for outside of the scope of ASC 606.
Other arrangements surrounding contractual incentive fees through an advisory contract are separate and distinct and accounted for in accordance with ASC 606. In these incentive fee arrangements, the Company’s economics in the entity do not involve an allocation of capital. See discussion above regarding “Incentive Fees”.
Open-end funds can issue and redeem interests to investors on an on-going basis at the then-current net asset values subject to the fund’s policies as specified in governing documents. The Company generally receives performance allocations from its open-end funds based on a percentage of annual fund profits, reduced by minimum return hurdles, and subject to prior year loss carry-forwards. Performance allocations are either paid in the first quarter following the performance year or during the calendar year if there are investor redemptions and are generally not subject to repayment by the Company. Performance allocations attributed to certain non-liquid investments (“side pocket investments”) owned by open-end funds is paid when the associated side pocket investments are realized.
Performance allocations for closed-end funds are allocated to the general partners based on cumulative fund performance as of each reporting date, and after specified investment returns to the funds’ limited partners are achieved. At the end of each reporting period, the TPG funds calculate and allocate the performance allocations that would then be due to the general partner for each TPG fund, pursuant to the TPG fund governing agreements, as if the fair value of the underlying investments were realized as of such date, irrespective of whether such amounts have been realized. As the fair value of underlying investments (and the investment returns to the funds’ limited partners) varies between reporting periods, it is necessary to make adjustments to amounts recorded as performance allocations to reflect either (i) positive performance resulting in an increase in the performance allocations allocated to the general partner or (ii) negative performance that would cause the amount due to the general partner to be less than the amount previously recognized, resulting in a negative adjustment to performance allocations allocated to the general partner. In each case, performance allocations are calculated on a cumulative basis and cumulative results are compared to amounts previously recorded with a current period adjustment, positive or negative, recorded.
The Company ceases to record negative performance allocations once previously recognized performance allocations for a TPG fund have been fully reversed, including realized performance allocations. The general partner is not obligated to make payments for guaranteed returns or hurdles of a fund and, therefore, cannot have negative performance allocations over the life of a fund. Accrued but unpaid performance allocations as of the reporting date are reflected in investments in the Company’s Consolidated Financial Statements. Performance allocations received by the general partners of the respective TPG funds are subject to clawback to the extent the performance allocations received by the general partner exceed the amount the general partner is ultimately entitled to receive based on cumulative fund results. Generally, the actual clawback liability does not become due until eighteen months after the realized loss is incurred; however, individual fund terms vary. For disclosures at December 31, 2023 related to clawback, see Note 17 to the Consolidated Financial Statements. Revenue related to performance allocations for consolidated TPG funds is eliminated in consolidation. The Company earns management fees, incentive fees and capital allocation-based income (loss) from investment funds and other vehicles whose primary focus is making investments in varying geographical locations and earns transaction and monitoring fees from portfolio companies located in varying geographies, including North America, Europe and Asia-Pacific. The primary geographic region in which the Company invests in is North America and the majority of its revenues from contracts with customers are also generated in North America.
TPG Inc.
Notes to Consolidated Financial Statements
Investment Income
Income from equity method investments
The carrying value of equity method investments in proprietary investments where the Company exerts significant influence is generally determined based on the amounts invested, adjusted for the equity in earnings or losses of the investee allocated based on the Company’s ownership percentage, less distributions and any impairment. The Company records its proportionate share of investee’s equity in earnings or losses based on the most recently available financial information, which in certain cases may lag the date of TPG’s financial statements by up to three calendar months. Income from equity method investments is recorded in net gains (losses) from investment activities on the Consolidated Financial Statements.
Income from equity method investments for which the fair value option was elected
Income from equity method investments for which the fair value option was elected includes realized gains and losses from the sale of investments, and unrealized gains and losses from changes in the fair value during the period as a result of quoted prices in an active market. Discounts are applied, where appropriate, to reflect restrictions on the marketability of the investment. Income from equity method investments for which the fair value option was elected is recorded in net gains (losses) from investment activities on the Consolidated Financial Statements.
Income from equity investments
Income from equity investments, which represent investments held through equity securities of an investee that the Company does not hold significant influence over, includes realized gains from the sale of investments and unrealized gains and losses result from observable price changes in orderly transactions for the identical or a similar investment of the same issuer. Income from equity investments is recorded in net gains (losses) from investment activities on the Consolidated Financial Statements.
Unrealized gains (losses) from derivative liabilities of Public SPACs
Unrealized gains (losses) from derivative liabilities of Public SPACs includes unrealized gains and losses from changes in fair value of warrants and forward purchase agreements (“FPAs”).
Interest, dividends and other
Interest income is recognized as earned. Dividend income is recognized by the Company on the ex-dividend date, or in the absence of a formal declaration, on the date it is received.
Compensation and Benefits
Cash-based compensation and benefits includes (i) salaries and wages, (ii) benefits and (iii) discretionary cash bonuses. Bonuses are accrued over the service period to which they relate.
Compensation expense related to the issuance of equity-based awards is measured at grant-date fair value. Compensation expense for awards that vest over a future service period is recognized over the relevant service period on a straight-line basis. Compensation expense for awards that do not require future service is recognized immediately. Compensation expense for awards that contain both market and service conditions is based on grant-date fair value that factors in the probability that the market conditions will be achieved and is recognized on a tranche by tranche basis using the accelerated attribution method. The requisite service period for those awards is the longer of the explicit service period and the derived service period. Compensation expense for awards that contain both performance and service conditions is recognized, if the Company deems it probable that the performance condition will be met, over the longer of the implicit or explicit service period. Compensation expense for awards to recipients with retirement eligibility provisions (allowing such recipient to continue vesting upon departure from TPG) is either expensed immediately or amortized to the retirement
TPG Inc.
Notes to Consolidated Financial Statements
eligibility date. The Company recognizes equity-based award forfeitures in the period they occur as a reversal of previously recognized compensation expense.
Performance allocation compensation expense and accrued performance allocation compensation is the portion of performance allocations that TPG allocates to certain of its employees and certain other advisors of the Company. Performance allocations due to our partners and professionals are accounted for as compensation expense in conjunction with the recognition of the related performance allocations and, until paid, are recognized as accrued performance allocation compensation. Accordingly, upon a reversal of performance allocations, the related compensation expense, if any, is also reversed.
Net Income (Loss) Per Share of Class A Common Stock
Basic income (loss) per share of Class A common stock is calculated by dividing net income (loss) attributable to TPG Inc. by the weighted-average shares of Class A common stock, unvested participating shares of Class A common stock outstanding for the period and vested deferred restricted shares of Class A common stock that have been earned for which issuance of the related shares of Class A common stock is deferred until future periods. Diluted income (loss) per share of Class A Common Stock reflects the impact of all dilutive securities. Unvested participating shares of common stock are excluded from the computation in periods of loss as they are not contractually obligated to share in losses.
The Company applies the treasury stock method to determine the dilutive weighted-average common shares represented by the unvested restricted stock units. The Company applies the if-converted method to the TPG Operating Group partnership units to determine the dilutive impact, if any, of the exchange right included in the TPG Operating Group partnership units.
Cash, Cash Equivalents and Restricted Cash
Cash and cash equivalents include cash on deposit with banks and other short-term investments with an initial maturity of 90 days or less. Restricted cash balances relate to cash balances reserved for the payment of interest on the Company’s secured borrowings.
Cash and Cash Equivalents Held by Consolidated Public SPACs
Cash and cash equivalents held by consolidated Public SPACs represent cash and cash equivalents that are held by consolidated Public SPACs and are not available to fund the general liquidity needs of the Company.
Assets Held in Trust Accounts
Proceeds from equity issued by certain consolidated Public SPACs had been deposited into trust accounts (“Trust Accounts”) and could only be utilized for specific purposes. Therefore, such cash and investments are reported separately in assets held in Trust Accounts on the Consolidated Financial Statements.
As of December 31, 2023, TPG Pace Beneficial II Corp. (“YTPG”) had no assets held in Trust Accounts and held no cash. As of December 31, 2022, YTPG assets held in Trust Accounts were deposited into a non-interest-bearing U.S. based account. On April 17, 2023, YTPG used these funds to redeem all of its outstanding Class A ordinary shares, par value $0.0001 (the “YTPG Class A Ordinary Shares”). See Note 15 to the Consolidated Financial Statements.
As of December 31, 2023, AfterNext HealthTech Acquisition Corp. (“AFTR”) had no assets held in Trust Accounts and held no cash. As of December 31, 2022, AFTR assets held in Trust Accounts were invested in money market funds meeting certain conditions under Rule 2a-7 under the Investment Company Act, which invest only in direct U.S. government treasury obligations. On August 16, 2023, AFTR used these funds to redeem its outstanding Class A ordinary shares, par value $0.0001 (the “AFTR Class A Ordinary Shares”). See Note 15 to the Consolidated Financial Statements.
TPG Inc.
Notes to Consolidated Financial Statements
Derivative Liabilities of Public SPACs
Financial derivative assets and liabilities related to our consolidated Public SPACs’ investment activities consist of warrant liabilities and forward purchase agreements.
The Company recognizes these derivative instruments as assets or liabilities at fair value in the accompanying Consolidated Financial Statements. Changes in the fair value of derivative contracts entered into by the Company are included in current period earnings. These derivative contracts are not designated as hedging instruments for accounting purposes.
These derivatives were agreements in which a consolidated Public SPAC and a counterparty agreed to exchange cash flows based on agreed-upon terms. As a result of the derivative transaction, the Company was exposed to the risk that counterparties would have failed to fulfill their contractual obligations. To mitigate such counterparty risk, the applicable Public SPAC only entered into contracts with major financial institutions, all of which had investment grade ratings. Counterparty credit risk is evaluated in determining the fair value of the derivative instruments. In the normal course of business, the Company incurs commitments and is exposed to risks resulting from its investment and financing transactions, including derivative instruments. The value of a derivative instrument is based upon an underlying instrument. These instruments are subject to various risks similar to non-derivative instruments including market, credit, liquidity, performance and operational risks. The Company manages these risks on an aggregate basis as part of its risk management policies and as such, does not distinguish derivative income or loss from any other category of instruments for financial statement presentation purposes. The leverage inherent in the Company’s derivative instruments increases the sensitivity of the Company’s earnings to market changes. Notional amounts often are used to express the volume of these transactions, but the amounts potentially subject to risk are much smaller. The Company routinely evaluates its contractual arrangements to determine whether embedded derivatives exist. Embedded derivatives are separated from the host contract and accounted for separately if the economic characteristics and risks of the host contract and the embedded derivative are not closely related, if a separate instrument with the same terms as the embedded derivative would meet the definition of a derivative and if the combined instrument is not measured at fair value through profit or loss.
For derivative contracts where an enforceable master netting agreement is in place, the Company has elected to offset derivative assets and liabilities, as well as cash that may have been received or pledged, as part of collateral arrangements with the respective counterparty in the Consolidated Financial Statements. The master netting agreements provide the Company and the counterparty the right to liquidate collateral and the right to offset each other’s obligations in the event of default by either party.
Certain of the Company’s consolidated Public SPACs issued public warrants and FPAs in conjunction with their IPO. The Company accounts for warrants and FPAs of the consolidated Public SPAC’s ordinary shares that are not indexed to its own stock as liabilities at fair value on the balance sheet. These warrants and FPAs are subject to remeasurement at each balance sheet date and any change in fair value is recognized in the Company’s Consolidated Financial Statements. For issued or modified warrants that meet all of the criteria for equity classification, the warrants are required to be recorded as a component of additional paid-in capital at the time of issuance. For issued or modified warrants and FPAs that do not meet all the criteria for equity classification, the warrants and FPAs are required to be recorded as a liability at their initial fair value on the date of issuance, and each balance sheet date thereafter. Changes in the estimated fair value of the warrants and FPAs are recognized as a non-cash gain or loss on the Consolidated Financial Statements.
Fair Value Measurement
ASC 820 establishes a fair value hierarchy that prioritizes and ranks the level of observability of inputs used to measure the investments at fair value. The observability of inputs is impacted by a number of factors, including the type of investment, characteristics specific to the investment, market conditions and other factors. The hierarchy gives the highest priority to unadjusted quoted prices in active markets for identical assets or liabilities (Level I measurements) and the lowest priority to unobservable inputs (Level III measurements).
Investments with readily available quoted prices or for which fair value can be measured from quoted prices in active markets will typically have a higher degree of input observability and a lesser degree of judgment applied in determining fair value.
TPG Inc.
Notes to Consolidated Financial Statements
The three levels of the fair value hierarchy under ASC 820 are as follows:
Level I – Quoted prices (unadjusted) in active markets for identical investments at the measurement date are used. The types of investment generally included in Level I are publicly listed equities, debt and securities sold, not yet purchased.
Level II – Pricing inputs are other than quoted prices included within Level I that are observable for the investment, either directly or indirectly. Level II pricing inputs include quoted prices for similar investments in active markets, quoted prices for identical or similar investments in markets that are not active, inputs other than quoted prices that are observable for the investment, and inputs that are derived principally from or corroborated by observable market data by correlation or other means. The types of investments generally included in Level II are restricted securities listed in active markets, corporate bonds and loans.
Level III – Pricing inputs are unobservable and include situations where there is little, if any, market activity for the investment. The inputs used in determination of fair value require significant judgment and estimation. The types of investments generally included in Level III are privately held debt and equity securities.
In some cases, the inputs used to measure fair value might fall within different levels of the fair value hierarchy. In such cases, the level in the fair value hierarchy within which the investment is categorized in its entirety is determined based on the lowest level input that is significant to the investment. Assessing the significance of a particular input to the valuation of an investment in its entirety requires judgment and considers factors specific to the investment. The categorization of an investment within the hierarchy is based upon the pricing transparency of the investment and does not necessarily correspond to the perceived risk of that investment.
In certain instances, an investment that is measured and reported at fair value may be transferred into or out of Level I, II, or III of the fair value hierarchy.
In certain cases, debt and equity securities are valued on the basis of prices from an orderly transaction between market participants provided by reputable dealers or pricing services. In determining the value of a particular investment, pricing services may use certain information with respect to transactions in such investments, quotations from dealers, pricing matrices, market transactions in comparable investments and various relationships between investments. When a security is valued based on dealer quotes, the Company subjects those quotes to various criteria in making the determination as to whether a particular investment would qualify for treatment as a Level II or Level III investment. Some of the factors considered include the number and quality of quotes, the standard deviations of the observed quotes and the corroboration of the quotes to independent pricing services.
Level III investments may include common and preferred equity securities, corporate debt, and other privately issued securities. When observable prices are not available for these securities, one or more valuation techniques (e.g., the market approach and/or the income approach) for which sufficient and reliable data is available are used. Within Level III, the use of the market approach generally consists of using comparable market transactions or other data, while the use of the income approach generally utilizes the net present value of estimated future cash flows, adjusted, as appropriate, for liquidity, credit, market and other risk factors. Due to the inherent uncertainty of these valuations, the fair values reflected in the accompanying Consolidated Financial Statements may differ materially from values that would have been used had a readily available market for the investments existed and may differ materially from the values that may ultimately be realized. The period of time over which the underlying assets of the investments will be liquidated is unknown.
Financial Instruments
Financial assets and financial liabilities are classified in their entirety based on the lowest level of input that is significant to the fair value measurement. Except for secured borrowings, the fair value of the Company’s assets and liabilities, which qualify as financial instruments under ASC 820, approximates the carrying amounts represented in the Consolidated Financial Statements due to their short-term nature. In the case of our senior unsecured term loan and senior unsecured revolving credit facility, the fair values approximate the carrying amounts represented in the Consolidated Financial Statements due to their variable rate nature. See Note 12 to the Consolidated Financial Statements.
TPG Inc.
Notes to Consolidated Financial Statements
Due From and Due To Affiliates
The Company considers current and former limited partners of funds and employees, including their related entities, entities controlled by the Company’s Founders but not consolidated by the Company, portfolio companies of TPG funds, and unconsolidated TPG funds to be affiliates (“Affiliates”). Receivables from and payables to affiliates are recorded at their expected settlement amount in due from and due to affiliates in the Consolidated Financial Statements.
Business Combinations
The Company accounts for business combinations using the acquisition method under ASC Topic 805, Business Combinations (“ASC 805”) under which the purchase price of the acquisition is allocated to the assets acquired and liabilities assumed using the fair values determined by management as of the acquisition date. Management’s determination of fair value of assets acquired and liabilities assumed at the acquisition date is based on the best information available in the circumstances and may incorporate management’s own assumptions and involve a significant degree of judgment. Management uses its best estimates and assumptions to accurately assign fair value to the tangible and identifiable intangible assets acquired and liabilities assumed at the acquisition date as well as the useful lives of those acquired intangible assets. Examples of critical estimates in valuing certain of the intangible assets we have acquired include, but are not limited to, future expected cash inflows and outflows, future fundraising assumptions, expected useful life, discount rates and income tax rates. Our estimates for future cash flows are based on historical data, various internal estimates and certain external sources, and are based on assumptions that are consistent with the plans and estimates we are using to manage the underlying assets acquired. Unanticipated events and circumstances may occur that could affect the accuracy or validity of such assumptions, estimates or actual results. For business combinations accounted for under the acquisition method, the purchase consideration, including the fair value of certain elements of contingent consideration as of the acquisition date, in excess of the fair value of net assets acquired is recorded as goodwill.
Goodwill
Goodwill represents the excess of the purchase price over the fair value of acquired identifiable net tangible and intangible assets. Goodwill is not amortized. Goodwill is reviewed for impairment at least annually utilizing a qualitative or quantitative approach, and more frequently if circumstances indicate impairment may have occurred. The impairment testing for goodwill under the qualitative approach is based first on a qualitative assessment to determine if it is more likely than not that the fair value of the Company’s reporting unit is less than its respective carrying value. If it is determined that it is more likely than not that a reporting unit’s fair value is less than its carrying value, the Company performs a quantitative analysis. When the quantitative approach indicates an impairment, an impairment loss is recognized to the extent by which the carrying value exceeds the fair value, not to exceed the total amount of goodwill. As of December 31, 2023, we believe it is more likely than not that the fair value of our reporting unit exceeds its carrying value.
Intangible Assets
The Company’s intangible assets primarily consist of the fair value of its interests in future promote of certain funds and the fair value of acquired investor relationships representing the fair value of management fees earned from existing investors in future funds. Finite-lived intangible assets are amortized over their estimated useful lives, which range from two to 20 years, and are reviewed for impairment whenever events or changes in circumstances indicate that the carrying amount of the intangible asset may not be recoverable. Amortization expense is included in depreciation and amortization expense in the Consolidated Financial Statements.
Operating Leases
At contract inception, the Company determines if an arrangement contains a lease by evaluating whether (i) an identified asset has been deployed in a contract explicitly or implicitly and (ii) the Company obtains substantially all the economic benefits from the use of that underlying asset and directs how and for what purpose the asset is used during the term of the contract. Additionally, at contract inception the Company will evaluate whether the lease is an operating or finance lease. Right-of use (“ROU”) assets represent the Company’s right to use an underlying asset for the lease term and operating lease liabilities represent the Company’s obligation to make lease payments arising from the lease. Operating lease liabilities are recognized at the commencement date based on the present value of the lease payments over the lease term. To the extent these payments are fixed or determinable, they are included as part of the lease payments used to
TPG Inc.
Notes to Consolidated Financial Statements
measure the lease liability. The Company’s ROU assets are recognized as the initial measurement of the lease liabilities plus any initial direct costs and any prepaid lease payments less lease incentives received, if any. The lease terms may include options to extend or terminate the lease which are accounted for when it is reasonably certain that the Company will exercise that option. As the discount rate implicit to the lease is not readily determinable, incremental borrowing rates of the Company were used. The incremental borrowing rates are based on the information available including, but not limited to, collateral assumptions, the term of the lease, and the economic environment in which the lease is denominated at the commencement date.
The Company elected the package of practical expedients provided under the guidance. The practical expedient package applies to leases commenced prior to the adoption of the new standard and permits companies not to reassess whether existing or expired contracts are or contain a lease, the lease classification, and any initial direct costs for any existing leases. The Company has elected to not separate the lease and non-lease components within the contract. Therefore, all fixed payments associated with the lease are included in the ROU asset and the lease liability. These costs often relate to the fixed payments for a proportionate share of real estate taxes, common area maintenance and other operating costs in addition to a base rent. Any variable payments related to the lease are recorded as lease expense when and as incurred. The Company has elected this practical expedient for all lease classes. The Company did not elect the hindsight practical expedient. The Company has elected the short-term lease expedient. A short-term lease is a lease that, as of the commencement date, has a lease term of 12 months or less and does not include an option to purchase the underlying asset that the lessee is reasonably certain to exercise. For such leases, the Company will not apply the recognition requirements of ASC Topic 842, Leases (“ASC 842”) and instead will recognize the lease payments as lease cost on a straight-line basis over the lease term. Additionally, the Company elected the practical expedient which allows an entity to not reassess whether any existing land easements are or contain leases.
The Company’s leases primarily consist of operating leases for real estate, which have remaining terms of one to 10 years. Some of those leases include options to extend for additional terms ranging from one to 10 years. The Company’s other leases, including those for office equipment, vehicles, and aircrafts, are not significant. Additionally, the Company’s leases do not contain restrictions or covenants that restrict the Company from incurring other financial obligations. The Company also does not provide any residual value guarantees for the leases or have any significant leases that have yet to be commenced. From time to time, the Company enters into certain sublease agreements that have terms similar to the remaining terms of the master lease agreements between TPG and the landlord. Sublease income is recorded as an offset to general, administrative and other in the accompanying Consolidated Financial Statements.
Operating lease expense is recognized on a straight-line basis over the lease term and is recorded within general, administrative and other in the accompanying Consolidated Financial Statements (see Note 16 to the Consolidated Financial Statements). Fixed Assets
Fixed assets consist primarily of leasehold improvements, furniture, fixtures and equipment, computer hardware and software and other fixed assets which are recorded at cost, less accumulated depreciation. Leasehold improvements are amortized using the straight-line method, over the shorter of the respective estimated useful life or the lease term. Depreciation of furniture, fixtures, equipment and computer hardware and software is recorded over the estimated useful life of the asset, generally three to seven years, using the straight-line method. The Company evaluates long-lived assets for impairment whenever events or changes in circumstances indicate the carrying amount of an asset may not be recoverable. When evidence of loss in value has occurred, management compares the estimated undiscounted cash flows associated with the long-lived asset to its carrying value to determine whether an impairment has occurred. If the undiscounted cash flows are less than the carrying value, an impairment is recorded as the difference between the fair value of the long-lived asset and its carrying value. Fair value is based on estimated discounted cash flows associated with the long-lived asset.
Foreign Currency
The functional currency of the Company’s international subsidiaries is the U.S. Dollar. Non-U.S. dollar denominated assets and liabilities of foreign operations are remeasured at rates of exchange as of the end of the reporting period. Non-U.S. dollar revenues and expenses of foreign operations are remeasured at average rates of exchange during the period. Gains and losses resulting from remeasurement are included in general, administrative and other in the accompanying Consolidated Statements of Operations. Foreign currency gains and losses resulting from transactions in
TPG Inc.
Notes to Consolidated Financial Statements
currencies other than the functional currency are also included in general, administrative and other in the Consolidated Statements of Operations during the period the transaction occurred.
Repurchase Agreements
The Company, through its a subsidiary, has financed the purchase of certain investments in the debt tranches of certain CLO Funds through a repurchase agreement. The Company records these investments as an asset and the related borrowings under the repurchase agreements are recorded as a liability on the Consolidated Statements of Financial Condition. The amount borrowed is the amount equal to the debt investment outstanding in the CLO. Interest income earned and interest expense incurred on the repurchase obligation are reported on the Consolidated Statements of Operations. Accrued interest receivable on investments and accrued interest payable on repurchase agreements are included in accounts payable and accrued expenses on the Consolidated Statements of Financial Condition.
Securities sold under agreements to repurchase are accounted for as collateralized financing transactions. The Company provides securities to counterparties to collateralize amounts borrowed under repurchase agreements on terms that permit the counterparties to repledge or resell the securities to others. Securities transferred to counterparties under repurchase agreements are included within investments in the Consolidated Statements of Financial Condition. Cash received under a repurchase agreement is recognized as a liability within other liabilities in the Consolidated Statements of Financial Condition. Interest expense is recognized on an effective yield basis and is included within interest expense in the Consolidated Statements of Operations.
Redeemable Equity from Consolidated Public SPACs
Redeemable equity from consolidated Public SPACs represents the shares issued by the Company’s consolidated Public SPACs that are redeemable for cash by the public shareholders in the event of an election to redeem by individual public shareholders at the time of the business combination. The Company accounts for redeemable equity in accordance with ASC Topic 480-10-S99, Distinguishing Liabilities from Equity (“ASC 480”), which states redemption provisions not solely within the control of the Company require ordinary shares subject to redemption to be classified outside of permanent equity. The redeemable non-controlling interests are initially recorded at their original issuance price and are subsequently allocated their proportionate share of the underlying gains or losses of the Public SPACs. The Company adjusts the redeemable equity to full redemption value on a quarterly basis.
If a Public SPAC is unable to complete a business combination within the time period required by its governing documents, this equity becomes redeemable and is reclassified out of redeemable equity and into Public SPAC current redeemable equity in accordance with ASC 480 as the Public SPAC prepares for dissolution.
Income Taxes
The Company is treated as a corporation for U.S. federal and state income tax purposes. The Company is subject to U.S. federal and state income taxes, in addition to local and foreign income taxes, with respect to our allocable share of taxable income generated by the TPG Operating Group partnerships. Prior to the Reorganization and the IPO, the Company was treated as a partnership for U.S. federal income tax purposes and therefore was not subject to U.S. federal and state income taxes except for certain consolidated subsidiaries that were subject to taxation in the U.S. (federal, state and local) and foreign jurisdictions as a result of their entity classification for tax reporting purposes. The provision for income taxes in the historical Consolidated Financial Statements consists of U.S. (federal, state and local) and foreign income taxes with respect to certain consolidated subsidiaries.
Deferred tax assets and liabilities are recognized for future tax consequences attributable to temporary differences between the financial statement carrying amounts of existing assets and liabilities and their respective tax bases. Deferred tax assets and liabilities are measured using enacted tax rates expected to apply to taxable income in the periods in which those temporary differences are expected to be recovered or settled. The effect on deferred tax assets and liabilities of a change in tax rates is recognized in the period in which the enactment date occurs.
TPG Inc.
Notes to Consolidated Financial Statements
Under ASC Topic 740, Income Taxes, a valuation allowance is established when management believes it is more likely than not that a deferred tax asset will not be realized. The realization of deferred tax assets is dependent on the amount of our future taxable income. When evaluating the realizability of deferred tax assets, all evidence (both positive and negative) is considered. This evidence includes, but is not limited to, expectations regarding future earnings, future reversals of existing temporary tax differences and tax planning strategies.
Tax laws are complex and subject to different interpretations by the taxpayer and respective governmental taxing authorities. Significant judgment is required in determining tax expense and in evaluating tax positions including evaluating uncertainties. The Company reviews its tax positions quarterly and adjusts its tax balances as new information becomes available. The Company recognizes interest and penalties relating to unrecognized tax benefits as income tax expense (benefit) within the Consolidated Financial Statements.
Segment
The Company has identified its Chief Executive Officer as its chief operating decision maker (the “CODM”). The Company operates its business in a single operating and reportable segment, consistent with how the CODM reviews financial performance and allocates resources. The Company operates collaboratively across product lines with a single expense pool.
Regulated Entities
At December 31, 2023, the Company consolidates a registered broker-dealer subsidiary that is subject to the minimum net capital requirements of the SEC and FINRA which may restrict the Company’s ability to withdraw funds from the broker-dealer. The broker-dealer has continuously operated in excess of its minimum net capital requirements.
Certain other U.S. and non-U.S. entities are subject to various investment adviser, commodity pool operator and trader regulations. This includes a number of U.S. entities that are registered as investment advisers with the SEC.
TPG Inc.
Notes to Consolidated Financial Statements
Recent Accounting Pronouncements
On December 14, 2023, the FASB issued Accounting Standards Update 2023-09 entitled Improvements to Income Tax Disclosures (ASU 2023-09), which is primarily applicable to public companies and requires a significant expansion of the granularity of the income tax rate reconciliation as well as an expansion of other income tax disclosures. ASU 2023-09 requires a company to disclose specific income tax categories within the rate reconciliation table and provide additional information for reconciling items that meet a quantitative threshold (if the effect of those reconciling items is equal to or greater than 5 percent of the amount computed by multiplying pretax income (or loss) by the applicable statutory income tax rate. There are also additional disclosures related to income taxes paid disaggregated by jurisdictions, and to income taxes paid. The ASU is effective for annual periods beginning after December 15, 2024. The guidance will be applied on a prospective basis with the option to apply the standard retrospectively. Early adoption is permitted. The Company is currently evaluating the impact of adoption of ASU 2023-09 on its Consolidated Financial Statements and disclosures.
In November 2023, the FASB issued ASU 2023-07, Segment Reporting (Topic 280): Improvements to Reportable Segment Disclosures. The ASU requires public entities to disclose, on an annual and interim basis, significant segment expenses that are regularly provided to the CODM and included within each reported measure of segment profit or loss and an amount and description of the composition of other segment items. The ASU also requires public entities to provide all annual disclosures about a reportable segments profit or loss and assets in interim periods. Further, if the CODM uses more than one measure of a segments profitability, the entity would be permitted to disclose those additional measures. All disclosure requirements under ASU 2023-07 are applicable to public entities with a single reportable segment. The ASU is effective for the Company’s Annual Report on Form 10-K for the fiscal year ended December 31, 2024, with early adoption permitted. The Company is currently evaluating the impact of adoption of ASU 2023-07 on its Consolidated Financial statements and disclosures.
On October 9, 2023, the FASB issued ASU 2023-06, Disclosure Improvements: Codification Amendments in Response to the SEC’s Disclosure Update and Simplification Initiative, which amends the disclosure or presentation requirements related to various subtopics in the FASB Accounting Standards Codification (the “Codification”). The ASU was issued in response to the SEC’s August 2018 final rule that updated and simplified disclosure requirements that the SEC believed were “redundant, duplicative, overlapping, outdated, or superseded.” The new guidance is intended to align U.S. GAAP requirements with those of the SEC and to facilitate the application of U.S. GAAP for all entities. The effective date for each amendment will be the date on which the SEC’s removal of that related disclosure requirement from Regulation S-X or Regulation S-K becomes effective, with early adoption prohibited. The Company does not expect the adoption of ASU 2023-06 to have a material impact on its Consolidated Financial Statements.
Recently Adopted Accounting Guidance
In June 2022, the FASB issued Accounting Standard Update (“ASU”) 2022-03, Fair Value Measurement of Equity Securities Subject to Contractual Sale Restrictions (“ASU 2022-03”) which (1) clarifies the guidance in ASC 820 on the fair value measurement of an equity security that is subject to a contractual sale restriction and (2) requires specific disclosures related to such an equity security. Under current guidance, stakeholders have observed diversity in practice related to whether contractual sale restrictions should be considered in the measurement of the fair value of equity securities that are subject to such restrictions. The amendments in ASU 2022-03 should be applied to equity securities with a contract containing a sale restriction that is executed or modified on or after the adoption date. For equity securities with a contract containing a sale restriction that was executed before the adoption date, companies should continue to apply the historical accounting policy for measuring such securities until the contractual restriction expires or is modified. This ASU is effective for fiscal years beginning after December 15, 2023, and interim periods within those fiscal years, with early adoption permitted. The Company’s adoption of ASU 2022-03 on a prospective basis beginning January 1, 2023 did not have a material impact to its Consolidated Financial Statements.
TPG Inc.
Notes to Consolidated Financial Statements
3. Acquisitions
Angelo Gordon Acquisition
On November 1, 2023 (the “Acquisition Date”), the Company and certain of its affiliated entities (the “TPG Parties”) completed the acquisition (the “Acquisition”) of all of the voting interests and significant economics in Angelo, Gordon & Co., L.P., AG Funds L.P. and AG Partners, L.P. (collectively, “Angelo Gordon”) and certain of their affiliated entities (together with Angelo Gordon, the “Angelo Gordon Parties”), an alternative investment firm focused on credit and real estate investing, pursuant to the terms and conditions set forth in the Transaction Agreement (as amended, the “Transaction Agreement”), dated as of May 14, 2023, by and among the TPG Parties and Angelo Gordon Parties. As a result of the Acquisition, the Company expanded its platform diversity, with Angelo Gordon’s alternative investment focus on credit and real estate investing.
The Acquisition was accounted for as a business combination under ASC Topic 805, Business Combinations (“ASC 805”) with assets acquired and liabilities assumed recorded at fair value.
Pursuant to the Transaction Agreement, the Company acquired Angelo Gordon for both cash and non-cash consideration under U.S. GAAP equal to $1,145.9 million (“Purchase Price”) as described below. The Purchase Price includes a combination of:
•$740.7 million in cash paid at closing;
•$18.8 million in payable as of December 31, 2023 to the escrow agent on behalf of the sellers of Angelo Gordon, subject to adjustment;
•9.2 million vested Common Units (and an equal number of Class B common stock) and 43.8 million unvested Common Units which are deemed to be compensatory under U.S. GAAP;
•the rights to an aggregate cash payment, payable in three payments of $50.0 million each, reflecting an aggregate of $150.0 million (the “Aggregate Annual Cash Holdback Amount”); and
•the non-compensatory portion under U.S. GAAP of a total earnout payment of up to $400.0 million in value (the “Earnout Payment”), subject to the satisfaction of certain fee-related revenue (“FRR”) targets during the period beginning on January 1, 2026 and ending on December 31, 2026 (the “Measurement Period”).
TPG Inc.
Notes to Consolidated Financial Statements
The following table summarized the fair value of amounts recognized for the assets acquired and liabilities assumed and resulting goodwill as of the Acquisition Date (in thousands):
| | | | | | | | |
| | November 1, 2023 |
| Purchase Price | | |
Cash(1) | | $ | 740,703 | |
Amounts payable to seller(2) | | 18,845 | |
Common Units(3) | | 233,894 | |
Fair value of Aggregate Annual Cash Holdback Amount(4) | | 125,158 | |
Fair value of Earnout Payment(5) | | 27,315 | |
| Total Purchase Price | | $ | 1,145,915 | |
| | |
Recognized amounts of identifiable assets acquired and liabilities assumed | | |
| Cash and cash equivalents | | $ | 383,868 | |
| Due from affiliates | | 184,252 | |
| Investments | | 1,046,375 | |
| Intangible assets | | 547,500 | |
| Other assets | | 172,282 | |
| Total assets | | 2,334,277 | |
| Accounts payable and accrued expenses | | 304,797 | |
| Due to affiliates | | 150,228 | |
| Accrued performance allocation compensation | | 744,903 | |
| Other liabilities | | 190,147 | |
| Total liabilities | | 1,390,075 | |
| Assets acquired/liabilities assumed | | 944,202 | |
| | |
| Total Purchase Price | | 1,145,915 | |
| Non-controlling interest of Angelo Gordon | | 4,172 | |
| Goodwill | | $ | 205,885 | |
(1)Represents the closing cash consideration of $740.7 million, which is comprised of $270.7 million of cash on hand and $470.0 million of proceeds from drawing on the Company’s Senior Unsecured Revolving Credit Facility. Out of the closing cash consideration of $740.7 million, $100.0 million was held in escrow on behalf of the sellers.
(2)Represents the expected difference between the estimated cash consideration paid at closing and the final cash consideration to be determined no later than 120 days from closing in accordance with the terms of the Transaction Agreement.
(3)Represents the fair value of approximately 9.2 million vested Common Units granted to the Angelo Gordon partners upon consummation of the Acquisition. The fair value of Common Units is based on a $28.18 closing price for the shares of Class A common stock on the Acquisition Date, adjusted for a discount for lack of marketability. Approximately 43.8 million unvested Common Units and 8.4 million RSUs available to be granted in connection with the Acquisition are considered compensatory under U.S. GAAP and are not part of the Purchase Price. Refer to Note 19 for details.
(4)Represents the estimated fair value of the Aggregate Annual Cash Holdback Amount of $150.0 million, which is payable in three equal annual installments of $50.0 million, subject to the absence of promote shortfall in each respective calendar year (2024, 2025 and 2026). The estimated fair value of $125.2 million, reflected as contingent consideration, was determined using a present value approach. Inputs to fair value include the present value period and the discount rate applied to the annual payments.
(5)Represents the estimated fair value of the non-compensatory portion of the Earnout Payment expected to be paid in the form of cash and vested Common Units to Angelo Gordon partners upon satisfaction of certain FRR targets during the Measurement Period. This amount, reflected as contingent consideration, was determined using a multiple probability simulation approach. Inputs to the fair value include probability adjusted FRR amounts and FRR target thresholds. The compensatory portion of the Earnout Payment to the Angelo Gordon partners is treated as post-combination compensation expense, as services are required from such partners post-Closing. See Note 19 for details.
The total Purchase Price was allocated to the fair value of assets acquired and liabilities assumed as of the Acquisition Date, with the excess Purchase Price recorded as goodwill. A third-party valuation specialist assisted the Company with the fair value estimates for the assets acquired and liabilities assumed. As the Acquisition Date was close to
TPG Inc.
Notes to Consolidated Financial Statements
December, 31, 2023, the purchase accounting analysis is subject to subsequent adjustments that are identified through the measurement period, which is limited to one year from the Acquisition Date.
The Company recorded $205.9 million of goodwill as of the Acquisition Date. Goodwill is primarily attributable to the scale, skill sets, operations and expected synergies that can be achieved subsequent to the Acquisition. The goodwill recorded is not expected to be deductible for tax purposes.
The fair value and weighted average estimated useful lives of identifiable intangible assets acquired in the Acquisition consist of the following (in thousands):
| | | | | | | | | | | | | | | | | |
| Fair Value | | Valuation Methodology | | Estimated Average Useful Life (in years) |
| Investment management agreements | $ | 287,000 | | | Multi-period excess earnings method ("MPEEM") | | 5-12.5 |
| Acquired carried interest | 199,000 | | | Discounted cash flow analysis | | 6.5 |
| Technology | 46,000 | | | Replacement cost analysis and relief from royalty analysis | | 4 |
| Trade name | 15,500 | | | Relief from royalty method | | 5.5 |
| Fair value of intangible assets acquired | $ | 547,500 | | | | | |
During the year ended December 31, 2023, the Company incurred $73.4 million of acquisition related costs that were expensed and reported within general, administrative and other expenses in the Consolidated Statements of Operations.
Angelo Gordon’s revenues and net income of $234.0 million and $38.7 million, respectively, are included in the Company’s Consolidated Statements of Operations from the Acquisition Date through December 31, 2023.
The following unaudited pro forma information presents a summary of the Company’s Consolidated Statements of Operations for the years ended December 31, 2023 and 2022, as if the acquisition was completed as of January 1, 2022 (in thousands):
| | | | | | | | | | | |
| Year Ended December 31, |
| 2023 | | 2022 |
| Revenues | $ | 3,045,143 | | | $ | 2,600,420 | |
Net income (loss) attributable to TPG Inc./controlling interest | 66,550 | | | (25,798) | |
These pro forma amounts have been calculated after applying the following material adjustments that were directly attributable to the Acquisition:
•adjustments to exclude amounts related to Angelo Gordon’s CLOs that were deconsolidated as of June 30, 2023 in accordance with the terms of the Transaction Agreement;
•adjustments to include the impact of the additional amortization that would have been recorded assuming the fair value adjustments to intangible assets had been applied on January 1, 2022;
•adjustments to interest expense for additional funding obtained by TPG in connection with the Acquisition;
•adjustments to include additional equity-based compensation expense related to Common Units and RSUs issued to Angelo Gordon partners and professionals, as if the grants occurred on January 1, 2022;
•adjustments for changes in the performance allocation compensation to Angelo Gordon partners in connection with the Acquisition;
TPG Inc.
Notes to Consolidated Financial Statements
•adjustments to allocation of net income to reflect the pro-rata economic ownership attributable to TPG post Acquisition;
•adjustments to reflect the tax effects of the Angelo Gordon Acquisition and the related adjustments as if Angelo Gordon had been included in the Company’s results as of January 1, 2022; and
•adjustments to include transaction costs in earnings as if the Acquisition occurred on January 1, 2022.
NewQuest Acquisition
In January 2022, the Company completed its acquisition of the remaining 33.3% interest in NewQuest Holdings (Cayman) Limited (“NQ Manager”) in exchange for equity interests in the Company, which consisted of 1,638,866 shares of Class A common stock and 1,072,998 Common Units of the TPG Operating Group. All of the granted equity interests are subject to a three-year service vesting condition and as such, will be recognized on a straight-line basis as post-combination compensation expense. The effect of the acquisition was a reallocation of equity between controlling and non-controlling interest of $33.6 million. This transaction was an acquisition under common control in which no gain or loss was recognized.
4. Investments
Investments consist of the following (in thousands):
| | | | | | | | | | | |
| December 31, |
| 2023 | | 2022 |
| Equity method - performance allocations | $ | 5,664,550 | | | $ | 4,677,017 | |
Equity method - capital interests (includes assets pledged of $570,806 and $475,110 as of December 31, 2023 and December 31, 2022, respectively) | 923,440 | | | 607,964 | |
Investments held to maturity, at amortized cost (includes assets pledged of $77,723 as of December 31, 2023) | 83,512 | | | — | |
| Equity method - fair value option | 36,171 | | | 20,907 | |
| Equity method - other | 11,761 | | | 11,908 | |
| Equity investments | 4,678 | | | 12,072 | |
| Total investments | $ | 6,724,112 | | | $ | 5,329,868 | |
Net gains (losses) from performance allocations and capital interests are disclosed in the Revenue section of Note 2 to the Consolidated Statements of Operations. The following table summarizes net gains (losses) from investment activities (in thousands): | | | | | | | | | | | | | | | | | |
| | | | | |
| Year Ended December 31, |
| 2023 | | 2022 | | 2021 |
| | | | | |
Net gains (losses) of equity method investments, fair value option(a) | $ | 15,264 | | | $ | (25,106) | | | $ | 45,435 | |
Net (losses) gains of equity method investments - other(b) | (1,306) | | | 802 | | | 230,186 | |
Net (losses) gains from equity investments(c) | (7,394) | | | (85,827) | | | 77,598 | |
| Total net gains (losses) from investment activities | $ | 6,564 | | | $ | (110,131) | | | $ | 353,219 | |
___________
(a)In September 2021, TPG Pace Tech Opportunities Corp. (“PACE”) completed a business combination which resulted in a gain on deconsolidation of PACE in an amount of $122.7 million.
(b)Includes pre-tax gain of $95.0 million for the year ended December 31, 2021 on remeasurement of the Company’s pre-existing equity investment in NewQuest at fair value prior to consolidation.
(c)In December 2021, TPG PACE Solutions Corp. (“TPGS”) completed a business combination which resulted in a gain on deconsolidation of TPGS in an amount of $109.9 million.
TPG Inc.
Notes to Consolidated Financial Statements
Investments Held to Maturity, at Amortized Cost
In connection with the Acquisition described in Note 3, the Company acquired investments held to maturity, and the carrying value of these investments are included in investments on the Consolidated Statements of Financial Condition. The Company estimates an allowance for credit losses (“ACL”) on the investments classified as held to maturity securities. The fair value of investments held to maturity, excluding ACL of $1.9 million, is $83.8 million as of December 31, 2023.
Equity Method Investments, Fair Value Option
As of December 31, 2023, the Company held a 6.1% beneficial ownership interest in Nerdy Inc. (“NRDY”), consisting of 10.5 million shares of Class A common stock, with an aggregate fair value of $36.2 million. In September 2023, the Company exchanged, in a non-cash transaction, 4.9 million warrants for 1.2 million shares of Class A common stock in NRDY and surrendered 2.4 million Class A earnout shares for cancellation, with the remaining 1.6 million Class A earnout shares no longer being subject to forfeiture. As of December 31, 2022, the Company held a 9.0% beneficial ownership interest in NRDY, consisting of 7.7 million shares of Class A common stock, 4.0 million Class A earnout shares and 4.9 million warrants, with an aggregate fair value of $20.9 million.
Equity Method Investments
The Company evaluates its equity method investments in which it has not elected the fair value option for impairment whenever events or changes in circumstances indicate that the carrying amounts of such investments may not be recoverable. During the years ended December 31, 2023, 2022 and 2021, the Company did not recognize any impairment losses on an equity method investment without a readily determinable fair value.
Equity Investments
Equity investments represent proprietary investment securities held by the Company. At December 31, 2023 and December 31, 2022, the Company held equity investments with readily determinable fair values of $4.7 million and $12.1 million, respectively.
In December 2021, TPG PACE Solutions Corp. (“TPGS”) completed a business combination with Vacasa Holdings, LLC, a leading vacation rental management platform. The business combination was approved on November 30, 2021 by TPGS stockholders and closed on December 7, 2021. At the time of the business combination, a reconsideration event occurred whereby the Company no longer has power over TPGS. As a result, the Company deconsolidated TPGS and recorded a gain of $109.9 million, which is included in net gains (losses) from investment activities. Beginning December 7, 2021, Vacasa’s common stock started trading on the Nasdaq Stock Exchange under the ticker symbol “VCSA”. The Company concluded that it does not exercise significant influence over Vacasa’s operating and financial policies. As such, the Company accounts for its investment in VCSA as an equity investment.
Summarized Financial Information
TPG evaluates each of its equity method investments to determine if any are significant as defined in the regulations promulgated by the U.S. Securities and Exchange Commission (the "SEC"). As of and for the years ended December 31, 2023, 2022 and 2021, no individual equity method investment held by TPG met the significance criteria. As such, TPG is not required to present separate financial statements for any of its equity method investments.
TPG Inc.
Notes to Consolidated Financial Statements
The following table shows summarized financial information relating to the Consolidated Statements of Financial Condition for all of TPG’s equity method investments assuming 100% ownership as of December 31, 2023 and 2022 (in thousands):
| | | | | | | | | | | |
| December 31, |
| 2023 | | 2022 |
| Total assets | $ | 138,435,777 | | | $ | 78,079,182 | |
| Total liabilities | 25,778,711 | | | 14,299,814 | |
| Total equity | 112,657,066 | | | 63,779,368 | |
The following table shows summarized financial information relating to the Consolidated Statements of Operations for all of TPG’s equity method investments assuming 100% ownership for the years ended December 31, 2023, 2022 and 2021 (in thousands):
| | | | | | | | | | | | | | | | | |
| Year Ended December 31, |
| 2023 | | 2022 | | 2021 |
| Revenues | $ | 11,092,500 | | | $ | 5,838,155 | | | $ | 25,609,002 | |
| Expenses | 4,134,838 | | | 1,855,509 | | | 1,871,086 | |
| | | | | |
| Net income | $ | 6,957,662 | | | $ | 3,982,646 | | | $ | 23,737,916 | |
Investment Activities of Consolidated TPG Funds
As part of the Reorganization described in Note 1 to the Consolidated Financial Statements, all TPG Funds were deconsolidated as of December 31, 2021, thus the Company had no gains (losses) from investment activities of consolidated TPG Funds for the years ended December 31, 2023 and 2022. Net gains from investment activities of consolidated TPG Funds were $23.4 million for the year ended December 31, 2021. The following table presents the supplemental cash flow disclosures from activities related to deconsolidation of previously consolidated TPG Funds and Public SPACs during the year ended December 31, 2021 (in thousands):
| | | | | | | | |
| Cash and cash equivalents | | $ | 491,523 | |
| Investments held in Trust Accounts | | 430,265 | |
| Other assets | | 3,696 | |
| Derivative liabilities of Public SPACs | | (50,898) | |
| Other liabilities | | (32,580) | |
| Accounts payable and accrued expenses | | (7,278) | |
| Notes payable to affiliates | | (2,000) | |
| Amounts due to shareholders | | (500,000) | |
| Redeemable equity | | (430,265) | |
| Controlling interests | | 36,386 | |
| Other non-controlling interests | | 61,151 | |
5. Derivative Instruments
The consolidated Public SPACs enter into derivative contracts in connection with their proprietary trading activities, including warrants and FPAs, which meet the definition of a derivative in accordance with ASC Topic 815, Derivatives and Hedging (“ASC 815”). As a result of the use of derivative contracts, the consolidated Public SPACs are exposed to the risk that counterparties will fail to fulfill their contractual obligations and are exposed to the volatility of the underlying instruments. These warrants and FPAs are included in derivative liabilities of Public SPACs on the Consolidated Statements of Financial Condition. As of December 31, 2023 and December 31, 2022, the Company did not hold any FPAs.
TPG Inc.
Notes to Consolidated Financial Statements
As of December 31, 2023, the Company held no warrants. As of December 31, 2022, the fair value of the warrants totaled $0.7 million.
There were no related offsets or cash collateral pledged or received for the warrants as of December 31, 2023 and December 31, 2022.
For the years ended December 31, 2023, 2022 and 2021, the Company recorded unrealized gains on warrants and FPAs totaling $0.7 million, $12.4 million and $211.8 million, respectively.
Net gains (losses) on derivative instruments are included in the Consolidated Statements of Operations as net gains (losses) from investment activities of consolidated TPG Funds and Public SPACs or unrealized gains (losses) on derivative liabilities of Public SPACs. The following are net gains recognized on derivative instruments of consolidated TPG Funds and Public SPACs (in thousands):
| | | | | | | | | | | | | | | | | |
| Year Ended December 31, |
| 2023 | | 2022 | | 2021 |
| Realized losses, net on total return swaps | $ | — | | | $ | — | | | $ | (10,269) | |
| Realized losses, net on foreign currency forwards | — | | | — | | | (175) | |
| Unrealized gains, net on total return swaps | — | | | — | | | 10,068 | |
| Unrealized gains, net on foreign currency forwards | — | | | — | | | 28 | |
| Total net losses on derivative instruments from investment activities of consolidated TPG Funds | — | | | — | | | (348) | |
| Unrealized gains, net on public warrants | 667 | | | 10,996 | | | 52,128 | |
| Unrealized gains, net on forward purchase agreements | — | | | 1,386 | | | 159,694 | |
| Total net gains on derivative instruments of Public SPACs | 667 | | | 12,382 | | | 211,822 | |
| Net gains on derivative instruments | $ | 667 | | | $ | 12,382 | | | $ | 211,474 | |
6. Fair Value Measurement
The following tables summarize the valuation of the Company’s financial assets and liabilities that fall within the fair value hierarchy (in thousands):
| | | | | | | | | | | | | | | | | | | | | | | |
| December 31, 2023 |
| Level I | | Level II | | Level III | | Total |
| Assets | | | | | | | |
| Equity method investments - fair value option | $ | 36,171 | | | $ | — | | | $ | — | | | $ | 36,171 | |
| Equity investments | 4,678 | | | — | | | — | | | 4,678 | |
| Total assets | $ | 40,849 | | | $ | — | | | $ | — | | | $ | 40,849 | |
| | | | | | | |
| Liabilities | | | | | | | |
Aggregate Annual Cash Holdback Amount(a) | $ | — | | | $ | — | | | $ | 126,779 | | | $ | 126,779 | |
Earnout Payment(a) | — | | | — | | | 29,520 | | | 29,520 | |
| Total liabilities | $ | — | | | $ | — | | | $ | 156,299 | | | $ | 156,299 | |
_______________
(a)Contingent consideration related to the acquisition of Angelo Gordon described in Note 3 to the Consolidated Financial Statements.
TPG Inc.
Notes to Consolidated Financial Statements
| | | | | | | | | | | | | | | | | | | | | | | |
| December 31, 2022 |
| Level I | | Level II | | Level III | | Total |
| Assets | | | | | | | |
| Equity method investments - fair value option | $ | 20,907 | | | $ | — | | | $ | — | | | $ | 20,907 | |
| Equity investments | 12,072 | | | — | | | — | | | 12,072 | |
| Total assets | $ | 32,979 | | | $ | — | | | $ | — | | | $ | 32,979 | |
| | | | | | | |
| Liabilities | | | | | | | |
| Liabilities of consolidated Public SPACs: | | | | | | | |
| Public warrants | $ | 667 | | | $ | — | | | $ | — | | | $ | 667 | |
| Total liabilities | $ | 667 | | | $ | — | | | $ | — | | | $ | 667 | |
The valuation methodology used in the determination of the changes in fair value of financial instruments for which Level III inputs were used at December 31, 2023 included a combination of the present value approach and multiple probability simulation approach.
The following tables summarize the changes in the fair value of financial instruments for which the Company has used Level III inputs to determine fair value (in thousands):
| | | | | | | | | | | |
| Year Ended December 31, |
| 2023 | | 2022 |
| Financial liabilities | | | |
| Balance, beginning of period | $ | — | | | $ | — | |
| | | |
| | | |
| | | |
| | | |
Acquisition(a) | 152,473 | | | — | |
| Unrealized losses | 3,826 | | | — | |
| Balance, end of period | $ | 156,299 | | | $ | — | |
| | | |
| Derivative liabilities | | | |
| Balance, beginning of period | $ | — | | | $ | 1,386 | |
| Unrealized gains | — | | | (1,386) | |
| | | |
| Balance, end of period | $ | — | | | $ | — | |
_______________
(a)Contingent consideration established in connection with the acquisition of Angelo Gordon described in Note 3 to the Consolidated Financial Statements.
Total realized and unrealized gains and losses recorded for Level III financial liabilities and derivative liabilities are reported in interest, dividends and other and unrealized gains (losses) on derivative liabilities of Public SPACs, respectively, in the Consolidated Statements of Operations.
The following tables provide qualitative information about instruments categorized in Level III of the fair value hierarchy as of December 31, 2023. In addition to the techniques and inputs noted in the table below, in accordance with the valuation policy, other valuation techniques and methodologies are used when determining fair value measurements. The below table is not intended to be all-inclusive, but rather provides information on the significant Level III inputs as they relate to the Company’s fair value measurements (fair value measurements in thousands):
TPG Inc.
Notes to Consolidated Financial Statements
| | | | | | | | | | | | | | | | | | | | | | | |
| Fair Value December 31, 2023 | | Valuation
Technique(s) | | Unobservable Input(s)(a) | | Range (Weighted Average)(b) |
| Liabilities | | | | | | | |
| Aggregate Annual Cash Holdback Amount | $ | 126,779 | | | Present value | | Discount rate | | 8.0% |
| Earnout Payment | 29,520 | | | Multiple probability simulation | | Estimated revenue volatility | | 22.8% |
| $ | 156,299 | | | | | | | |
_______________
(a)In determining certain of these inputs, management evaluates a variety of factors including economic conditions, industry and market developments, market valuations of comparable companies and company-specific developments including exit strategies and realization opportunities. Management has determined that market participants would take these inputs into account when valuing the instruments.
(b)Inputs weighted based on fair value of instruments in range.
7. Intangible Assets and Goodwill
As discussed in Note 3 to the Consolidated Financial Statements, the Company completed the acquisition of Angelo Gordon on November 1, 2023, which resulted in the recognition of certain identifiable intangible assets and goodwill, which are presented as intangible assets and goodwill, respectively, on the Consolidated Statements of Financial Condition.
Intangible Assets
The following table summarizes the carrying values of intangible assets as of December 31, 2023 and 2022 (in thousands):
| | | | | | | | | | | | | | | | | | | | | | | | | | | | | | | | | | | |
| December 31, |
| 2023 | | 2022 |
| Gross Carrying Value | | Accumulated Amortization | | Net Carrying Value | | Gross Carrying Value | | Accumulated Amortization | | Net Carrying Value |
Contractual performance fee allocations(a) | $ | 331,600 | | | $ | (54,707) | | | $ | 276,893 | | | $ | 132,600 | | | $ | (30,009) | | | $ | 102,591 | |
Management contracts(a) | 307,000 | | | (20,553) | | | 286,447 | | | 20,000 | | | (9,375) | | | 10,625 | |
Technology(a) | 46,000 | | | (1,917) | | | 44,083 | | | — | | | — | | | — | |
| Investor relationships | 25,000 | | | (5,208) | | | 19,792 | | | 25,000 | | | (3,125) | | | 21,875 | |
Trade name(a) | 15,500 | | | (500) | | | 15,000 | | | — | | | — | | | — | |
Other intangible assets(b) | 8,494 | | | (1,201) | | | 7,293 | | | 1,494 | | | (398) | | | 1,096 | |
| Total intangible assets | $ | 733,594 | | | $ | (84,086) | | | $ | 649,508 | | | $ | 179,094 | | | $ | (42,907) | | | $ | 136,187 | |
_______________(a)Includes intangible assets with a net carrying value of $540.4 million as of December 31, 2023 related to the acquisition of Angelo Gordon described in Note 3 to the Consolidated Financial Statements. (b)Includes infinite-lived intangible assets of $1.0 million as of December 31, 2023 and 2022.
No impairment losses on intangible assets were recorded during the years ended December 31, 2023, 2022 and 2021.
Intangible asset amortization expense was $41.2 million, $28.4 million and $19.8 million for the years ended December 31, 2023, 2022 and 2021, respectively.
TPG Inc.
Notes to Consolidated Financial Statements
The following table presents estimated remaining amortization expense for finite-lived intangible assets that existed as of December 31, 2023 (in thousands):
| | | | | | | | |
| 2024 | | $ | 110,220 | |
| 2025 | | 105,239 | |
| 2026 | | 99,949 | |
| 2027 | | 96,149 | |
| 2028 | | 76,244 | |
| Thereafter | | 160,713 | |
| Total | | $ | 648,514 | |
Goodwill
The following table summarizes the carrying value of the Company’s goodwill as of December 31, 2023 and 2022 (in thousands):
| | | | | | | | | | | |
| December 31, |
| 2023 | | 2022 |
| Goodwill | | | |
| Balance, beginning of period | $ | 230,194 | | | $ | 230,194 | |
| Acquisition | 205,885 | | | — | |
| Balance, end of period | $ | 436,079 | | | $ | 230,194 | |
No impairment losses on goodwill were recorded during the years ended December 31, 2023, 2022 and 2021.
8. Other Assets
Other assets consist of the following (in thousands):
| | | | | | | | | | | |
| December 31, |
| 2023 | | 2022 |
| Fixed assets, net: | | | |
| Leasehold improvements | $ | 142,545 | | | $ | 39,946 | |
| Computer hardware and software | 33,955 | | | 8,874 | |
| Furniture, fixtures and equipment | 13,728 | | | 6,878 | |
| Other fixed assets | 31,350 | | | 11,347 | |
| Accumulated depreciation | (139,900) | | | (42,992) | |
| Total fixed assets, net | 81,678 | | | 24,053 | |
| | | |
| | | |
| Right-of-use assets | 227,610 | | | 130,357 | |
| Prepaid expenses | 56,398 | | | 23,809 | |
| Other | 96,939 | | | 84,792 | |
| Other assets | $ | 462,625 | | | $ | 263,011 | |
TPG Inc.
Notes to Consolidated Financial Statements
9. Accounts Payable and Accrued Expenses, and Other Liabilities
Accounts payable and accrued expenses consist of the following (in thousands):
| | | | | | | | | | | |
| December 31, |
| 2023 | | 2022 |
| Trade accounts payable | $ | 42,565 | | | $ | 44,186 | |
| Accrued expenses | 129,231 | | | 53,985 | |
| Accounts payable and accrued expenses | $ | 171,796 | | | $ | 98,171 | |
Other liabilities consist of the following (in thousands):
| | | | | | | | | | | |
| December 31, |
| 2023 | | 2022 |
| Lease obligation | $ | 235,537 | | | $ | 147,887 | |
| Clawback liability (see Note 17) | 58,317 | | | 58,317 | |
| Contingent consideration | 156,299 | | | — | |
| Repurchase agreements | 83,336 | | | — | |
| Other | 118,974 | | | 19,886 | |
| Other liabilities | $ | 652,463 | | | $ | 226,090 | |
Contingent Consideration
In connection with the Acquisition described in Note 3, the Company recorded contingent consideration liabilities of $152.5 million to reflect the estimated fair value of the contingent consideration for the Earnout Payment and Aggregate Annual Cash Holdback Amount as of the Acquisition Date. Contingent consideration is included in other liabilities on the Consolidated Statements of Financial Condition. Contingent consideration is remeasured at each reporting period, and any changes in fair value are recognized as interest, dividends and other in the Consolidated Statements of Operations. As of December 31, 2023, other liabilities include $156.3 million related to contingent consideration.
Repurchase Agreements
In connection with the Acquisition described in Note 3, the Company holds various investments in CLO funds. Northwoods European Management, LLC (“ECLO”), a consolidated subsidiary of the Company has a master repurchase agreement with NWCC Cayman LLC (“Nearwater”) with respect to the Company’s investment in the debt tranches of various CLO Funds. The repurchase agreement extends a facility of a maximum of 100,000 Euros to ECLO for future investment in the debt issued by CLO Funds. The repurchase agreement bears interest at a rate of 0.5% spread above the interest earned by ECLO on the tranches of notes subject to the master repurchase agreement. The weighted average interest rate for the period December 31, 2023 is 6.1%.
ECLO had outstanding borrowings under the repurchase agreement with Nearwater as of December 31, 2023 to finance its investments in the debt of three CLO Funds with maturity dates ranging from November 25, 2033 through March 15, 2034. At December 31, 2023, $62.8 million of borrowings are outstanding on the facility which is recorded in other liabilities on the Consolidated Statements of Financial Condition. ECLO pledges as collateral its investments in the debt of the CLO Funds fully collateralizing all outstanding borrowings drawn under the repurchase agreement. All outstanding borrowings drawn from the repurchase agreement mature in a period greater than 90 days.
ECLO entered into an additional master repurchase agreement with Citibank, N.A. on December 22, 2021, to finance the purchase of the Company’s investment in one of the CLO funds managed by the entity. The repurchase agreement bears interest at a rate of 0.5% spread above the interest earned by ECLO on the tranches of notes subject to the master repurchase agreement. The weighted average interest rate for the periods ended December 31, 2023 is 6.3%. ECLO had outstanding borrowings under the repurchase agreement as of December 31, 2023 to finance the investment in the debt of one CLO Fund with a maturity date of October 15, 2035. As of December 31, 2023, $20.5 million of borrowings are
TPG Inc.
Notes to Consolidated Financial Statements
outstanding on the repurchase agreement which is recorded in other liabilities on the Consolidated Statements of Financial Condition. ECLO pledges as collateral its investments in the debt of the CLO Funds fully collateralizing all outstanding borrowings drawn under the repurchase agreement. All outstanding borrowings drawn from the repurchase agreement mature in a period greater than 90 days.
10. Credit and Market Risk
The Company holds substantially all of its excess cash in bank deposits at highly rated banking corporations or investments in highly rated money market funds, which are included in cash and cash equivalents, restricted cash, investments held in Trust Accounts and cash and cash equivalents held by consolidated TPG Funds and Public SPACs in the Consolidated Financial Statements. The Company continually monitors the risk associated with these deposits and investments. Management believes the carrying values of these assets are reasonable taking into consideration credit and market risks along with estimated collateral values, payment histories and other information.
In the normal course of business, TPG encounters market and credit risk concentrations. Market risk reflects changes in the value of investments due to changes in interest rates, credit spreads or other market factors. The TPG Funds are subject to credit risk to the extent any counterparty is unable to deliver cash balances, securities, or the fair value of swaps, or clear security transactions on the TPG Funds’ behalf. The settlement, clearing and depository operations for the TPG Funds’ securities trading activities are performed pursuant to agreements with counterparties, which are primarily global financial institutions. The TPG Funds manage this risk by monitoring daily the financial condition and credit quality of the parties with which the TPG Funds conduct business, but in the event of default by any of the TPG Funds’ counterparties, the loss to the TPG Funds could be material.
The Company is subject to potential concentration risk related to the investors’ commitments to TPG Funds. At December 31, 2023, no individual investor accounted for more than 10% of the total committed capital to TPG’s active funds.
Furthermore, certain of the TPG Funds’ investments are made in private companies and there are generally no public markets for the underlying securities at the current time. The TPG Funds’ ability to liquidate their publicly-traded investments are often subject to limitations, including discounts that may be required to be taken on quoted prices due to the number of shares being sold. Subordinate investments held by TPG may be less marketable, or in some instances illiquid, because of the absence of registration under federal securities laws, contractual restrictions on transfer, the small size of the market and the small size of the issue (relative to issues of comparable interests). As a result, the TPG Funds may encounter difficulty in selling its investments or may, if required to liquidate investments to satisfy redemption requests of its investors or debt service obligations, be compelled to sell such investments at less than fair value. Other limitations for TPG to dispose of an investment and realize value include currency fluctuations and natural disasters.
The TPG Funds make investments outside of the United States. Investments outside the United States may be subject to less developed bankruptcy, corporate, partnership and other laws (which may have the effect of disregarding or otherwise circumventing the limited liability structures potentially causing the actions or liabilities of one fund or a portfolio company to adversely impact the TPG Funds or an unrelated fund or portfolio company). Non-U.S. investments are subject to the same risks associated with the TPG Funds’ U.S. investments as well as additional risks, such as fluctuations in foreign currency exchange rates, unexpected changes in regulatory requirements, heightened risk of political and economic instability, difficulties in managing non-U.S. investments, potentially adverse tax consequences and the burden of complying with a wide variety of foreign laws.
Furthermore, TPG is exposed to economic risk concentrations related to certain large investments as well as concentrations of investments in certain industries and geographies.
TPG is exposed to economic risk concentrations insofar as the Company is dependent on the ability of the TPG Funds that it manages to compensate it for the services it provides to these TPG Funds. Further, the incentive income component of this compensation is based on the ability of such TPG Funds to generate returns above certain specified thresholds.
Additionally, TPG is exposed to interest rate risk. TPG has debt obligations that have variable rates. Interest rate changes may therefore affect the amount of interest payments, future earnings and cash flows.
TPG Inc.
Notes to Consolidated Financial Statements
TPG’s derivative financial instruments contain credit risk to the extent that its counterparties may be unable to meet the terms of the agreements. Some of the markets in which the Company may effect its transactions are “over-the-counter” or “interdealer” markets. The participants in such markets are typically not subject to credit evaluation and regulatory oversight unlike members of exchange-based markets. This exposes the Company to the risk that a counterparty will not settle a transaction in accordance with its terms and conditions because of a dispute over the terms of the applicable contract (whether or not such dispute is bona fide) or because of a credit or liquidity problem, causing the Company to suffer losses. Such “counterparty risk” is accentuated for contracts with longer maturities where events may intervene to prevent settlement, or where the Company has concentrated its transactions with a single or small group of counterparties. TPG attempts to minimize this risk by limiting its counterparties to major financial institutions with strong credit ratings.
11. Variable Interest Entities
TPG consolidates VIEs in which it is considered the primary beneficiary as described in Note 2 to the Consolidated Financial Statements. TPG’s investment strategies differ by TPG fund; however, the fundamental risks have similar characteristics, including loss of invested capital and loss of management fees and performance allocations. The Company does not provide performance guarantees and has no other financial obligation to provide funding to consolidated VIEs other than its own capital commitments. The assets of consolidated VIEs may only be used to settle obligations of these consolidated VIEs. In addition, there is no recourse to the Company for the consolidated VIEs’ liabilities.
The Company holds variable interests in certain VIEs which are not consolidated as it is determined that the Company is not the primary beneficiary. The Company’s involvement with such entities is in the form of direct equity interests and fee arrangements. The fundamental risks have similar characteristics, including loss of invested capital and loss of management fees and performance allocations. Accordingly, disaggregation of TPG’s involvement by type of VIE would not provide more useful information. TPG may have an obligation as general partner to provide commitments to unconsolidated VIEs. For the years ended December 31, 2023 and 2022, TPG did not provide any amounts to unconsolidated VIEs other than its obligated commitments.
The maximum exposure to loss represents the loss of assets recognized by TPG relating to non-consolidated entities and any amounts due to non-consolidated entities.
The assets and liabilities recognized in the Company’s Consolidated Statements of Financial Condition related to its interest in these non-consolidated VIEs and its maximum exposure to loss relating to non-consolidated VIEs were as follows (in thousands):
| | | | | | | | | | | |
| December 31, 2023 | | December 31, 2022 |
Investments (includes assets pledged of $570,806 and $475,110 as of December 31, 2023 and December 31, 2022, respectively) | $ | 903,119 | | | $ | 607,964 | |
| Due from affiliates | 293,233 | | | 88,847 | |
| Potential clawback obligation | 1,910,247 | | | 1,869,395 | |
| Due to affiliates | 56,262 | | | 47,572 | |
| Maximum exposure to loss | $ | 3,162,861 | | | $ | 2,613,778 | |
Additionally, cumulative performance allocations of $5.7 billion and $4.7 billion as of December 31, 2023 and 2022, respectively, are subject to reversal in the event of future losses.
RemainCo
In conjunction with the Reorganization described in Note 1 to the Consolidated Financial Statements, the TPG Operating Group and RemainCo entered into certain agreements to effectuate the go-forward relationship between the entities. The arrangements discussed below represent the TPG Operating Group’s variable interests in RemainCo, which do not provide the TPG Operating Group with the power to direct the activities that most significantly impact RemainCo’s performance and operations. As a result, RemainCo represents a non-consolidated VIE.
TPG Inc.
Notes to Consolidated Financial Statements
RemainCo Performance Earnings Agreement
In accordance with the TPG Operating Group’s agreement with RemainCo (the “RemainCo Performance Earnings Agreement”), RemainCo is entitled to distributions in respect of performance allocations from TPG funds as described below. For certain existing TPG funds that are advanced in their life cycles, which we refer to as the “Excluded Funds,” RemainCo is generally entitled to receive distributions of performance allocations not previously designated for partners and employees or unaffiliated third parties, and the TPG Operating Group is not entitled to further performance allocations from the Excluded Funds. For TPG funds of a more recent vintage and for future TPG funds, which we collectively refer to as the “Included Funds,” RemainCo is entitled to a base performance allocation ranging from 10% to 15% (subject to limited exceptions, including TPG funds acquired in a business combination or formed with meaningful participation by the counterparty of such business combination) depending upon the Included Fund (the “Base Entitlement”).
With respect to any TPG Fund that holds a first closing involving non-affiliated investors (a “First Closing”) on or after the fifth anniversary of the IPO, the Base Entitlement will step down ratably for each annual period following the fifth anniversary of the IPO through the fifteenth anniversary. RemainCo will not be entitled to distributions of performance allocations with respect to TPG funds that have not held a First Closing on or prior to the fifteenth anniversary of the IPO. Once determined, RemainCo’s entitlement to the performance allocation percentage with respect to any TPG Fund will remain in effect for the life of the applicable fund.
RemainCo is obligated to fund its pro rata share of clawback obligations with respect to any TPG fund (in proportion to the Base Entitlement with respect to such TPG fund) either directly or through indemnity or similar obligations to the TPG Operating Group. In the event that the underlying assets of RemainCo are not sufficient to cover the clawback amount, the TPG Operating Group is obligated to cover any shortfall of the clawback. This shortfall covered by the TPG Operating Group would be required to be repaid by RemainCo out of future distributions.
Further, in the calendar years 2022, 2023 and 2024, if the amount otherwise available under the new discretionary performance allocation program is less than $110.0 million, $120.0 million and $130.0 million, respectively, our Chief Executive Officer can determine to increase the performance allocations available under such performance allocation program by an amount equal to the shortfall plus $10.0 million (which we refer to as “Performance Allocation Increases”), by allocating amounts to the holders of Promote Units that would have otherwise been distributable to RemainCo. The maximum Performance Allocation Increase in any year is $40.0 million. In the calendar year 2023, the Performance Allocation Increase to the holders of Promote Units was $29.2 million. In the calendar year 2022, there was no Performance Allocation Increase.
RemainCo Administrative Services Agreement
The TPG Operating Group has entered into an administrative services agreement with RemainCo whereby the TPG Operating Group provides RemainCo with certain administrative services, including maintaining RemainCo’s books and records, tax and financial reporting and similar support which began on January 1, 2022. In exchange for these services, RemainCo pays the TPG Operating Group an annual administration fee in the amount of 1% per annum of the net asset value of RemainCo’s assets, with such amount payable quarterly in advance and recorded in expense reimbursements and other within revenues in the Consolidated Statements of Operations.
Securitization Vehicles
During 2018, certain subsidiaries of the Company issued $200.0 million in privately placed securitization notes. Certain equity interests of these subsidiaries serve as collateral for the notes. The Company used one or more special purpose entities that are considered VIEs to issue notes to third-party investors in the securitization transactions. The notes issued by these VIEs are backed by the cash flows related to the Company’s equity method investments (“Participation Rights”) in certain funds. The Company determined that it is the primary beneficiary of the securitization vehicles because (i) its servicing responsibilities for the Participation Rights give the Company the power to direct the activities that most significantly impact the performance of the VIEs, and (ii) its variable interests in the VIEs give the Company the obligation to absorb losses and the right to receive residual returns that could potentially be significant. In 2019, certain subsidiaries of the Company issued an additional $50.0 million in privately placed securitization notes.
TPG Inc.
Notes to Consolidated Financial Statements
The transfer of Participation Rights to the special purpose entities are considered sales for legal purposes. However, the Participation Rights and the related debt remain on the Company’s Consolidated Statements of Financial Condition. The Company recognizes interest expense on the secured borrowings issued by the special purpose entities.
The Participation Rights of the VIEs, cash and restricted cash serve as the sole source of repayment for the notes issued by these entities. Investors in the notes issued by the VIEs do not have recourse to the Company or to its other assets. Additionally, the Participation Rights and other assets directly held by the VIEs are not available to satisfy the general obligations of the Company.
As the primary beneficiary of these entities, the Company is exposed to credit, interest rate and market risk from the Participation Rights in the VIEs. However, the Company’s exposure to these risks did not change as a result of the transfer of Participation Rights to the VIEs. The Company may also be exposed to interest rate risk arising from the secured notes issued by the VIEs.
As of December 31, 2023 and December 31, 2022, the carrying amount of secured notes issued by the VIEs was $245.6 million and $245.3 million, respectively, and is shown in the Company’s Consolidated Statements of Financial Condition as debt obligations, net of unamortized issuance costs of $4.4 million and $4.7 million, respectively.
The following table depicts the total assets and liabilities related to VIE securitization transactions included in the Company’s Consolidated Statements of Financial Condition (in thousands):
| | | | | | | | | | | |
| December 31, 2023 | | December 31, 2022 |
| Cash and cash equivalents | $ | 6,057 | | | $ | 33,612 | |
| Restricted cash | 13,183 | | | 13,166 | |
Participation rights receivable(a) | 570,806 | | | 475,110 | |
| Due from affiliates | 434 | | | 436 | |
| Total assets | $ | 590,480 | | | $ | 522,324 | |
| | | |
| Accrued interest | $ | 191 | | | $ | 191 | |
| Due to affiliates and other | 5,484 | | | 280 | |
| Secured borrowings, net | 245,567 | | | 245,259 | |
| Total liabilities | $ | 251,242 | | | $ | 245,730 | |
_______________
(a)Participation rights receivable related to VIE securitization transactions are included in investments in the Company’s Consolidated Statements of Financial Condition.
TPG Inc.
Notes to Consolidated Financial Statements
12. Debt Obligations
The following table summarizes the Company’s and its subsidiaries’ debt obligations (in thousands):
| | | | | | | | | | | | | | | | | | | | | | | | | | | | | | | | | | | | | | | | | | | |
| | | | | | | | | As of December 31, 2023 | | As of December 31, 2022 |
| Debt Origination Date | | | | Maturity Date | | Borrowing Capacity | | Carrying Value | | Interest Rate | | Carrying Value | | Interest Rate |
Senior Unsecured Revolving Credit Facility(a) | March 2011 | | | | September 2028 | | $ | 1,200,000 | | | $ | 501,000 | | | 6.45 | % | | $ | — | | | 5.46 | % |
Senior Unsecured Term Loan(b) | December 2021 | | | | March 2026 | | 200,000 | | | 198,485 | | | 6.45 | % | | 199,307 | | | 5.46 | % |
Secured Borrowings - Tranche A(c) | May 2018 | | | | June 2038 | | 200,000 | | | 196,434 | | | 5.33 | % | | 196,186 | | | 5.33 | % |
Secured Borrowings - Tranche B(c) | October 2019 | | | | June 2038 | | 50,000 | | | 49,133 | | | 4.75 | % | | 49,073 | | | 4.75 | % |
364-Day Revolving Credit Facility(d) | April 2023 | | | | April 2024 | | 150,000 | | | — | | | 7.35 | % | | — | | | — | % |
Subordinated Credit Facility(e) | August 2014 | | | | August 2025 | | 30,000 | | | — | | | 7.70 | % | | — | | | 6.71 | % |
| Total debt obligations | | | | | | | $ | 1,830,000 | | | $ | 945,052 | | | | | $ | 444,566 | | | |
_______________
(a)The Senior Unsecured Revolving Credit Facility, as amended, has aggregate revolving commitments of $1.2 billion and is scheduled to mature on September 26, 2028. Dollar-denominated principal amounts outstanding under the Amended Senior Unsecured Revolving Credit Facility accrue interest, at the option of the applicable borrower, either (i) at a base rate plus applicable margin not to exceed 0.25% per annum or (ii) at a term SOFR rate plus a 0.10% per annum adjustment and an applicable margin not to exceed 1.25%. The Senior Unsecured Revolving Credit Facility contains customary representations, covenants and events of default. Financial covenants consist of a maximum leverage ratio and a requirement to keep a minimum amount of fee-earning assets under management, each tested quarterly. At December 31, 2023, the Company is in compliance with these covenants and conditions. During the year ended December 31, 2023, the Company borrowed $470.0 million from the Senior Unsecured Revolving Credit Facility to partially fund the cash consideration of the Acquisition, and an additional $31.0 million for working capital purposes.
(b)The Senior Unsecured Term Loan is scheduled to mature on March 31, 2026. Principal amounts outstanding under the Senior Unsecured Term Loan Agreement accrue interest, at the option of the borrower, either (i) at a base rate plus an applicable margin of 0.00% or (ii) at a term SOFR rate plus a 0.10% per annum adjustment and an applicable margin of 1.00%.
(c)The Company’s secured borrowings are issued using on-balance sheet securitization vehicles, as further discussed in Note 11 to the Consolidated Financial Statements. The secured borrowings are repayable only from collections on the underlying securitized equity method investments and restricted cash. The secured borrowings are separated into two tranches. Tranche A secured borrowings were issued in May 2018 at a fixed rate of 5.33% with an aggregate principal balance of $200.0 million due June 21, 2038, with interest paid semiannually. Tranche B secured borrowings were issued in October 2019 at a fixed rate of 4.75% with an aggregate principal balance of $50.0 million due June 21, 2038, with interest paid semiannually. The secured borrowings contain an optional redemption feature giving the Company the right to call the notes in full or in part. If the secured borrowings are not redeemed on or prior to June 20, 2028, the Company is required to pay additional interest equal to 4.00% per annum. The secured borrowings contain covenants and conditions customary in transactions of this nature, including negative pledge provisions, default provisions and operating covenants, limitations on certain consolidations, mergers and sales of assets. At December 31, 2023, the Company is in compliance with these covenants and conditions.
(d)On April 14, 2023, a consolidated subsidiary of the Company entered into a 364-day revolving credit facility (the “364-Day Credit Facility”) with Mizuho Bank, Ltd., acting as administrative agent, to provide the subsidiary with revolving borrowings of up to $150.0 million. Borrowings under the 364-Day Credit Facility are subject to one of three interest rates depending on the type of drawdown requested. Alternate Base Rate (“ABR”) loans are denominated in US Dollars and subject to a variable interest rate computed daily as the higher of the Federal Funds Rate plus 0.50% or the one-month Term SOFR plus 1.00%, plus an applicable margin of between 1.00% and 2.00%, depending on the term of the loan. Term Benchmark Loans may be denominated in US Dollars or Euros, and are subject to a fixed interest rate computed as the SOFR rate for a period comparable to the term of the loan in effect two business days prior to the date of borrowing, plus an applicable margin of between 2.00% and 3.00%, depending on the term of the loan. Risk-Free Rate (“RFR”) loans are denominated in Sterling and subject to a fixed interest rate computed daily as the Sterling Overnight Index Average (“SONIA”) in effect five business days prior to the date of borrowing, plus an applicable margin of between 2.00% and 3.00%, depending on the term of the loan. The subsidiary is also required to a pay a quarterly facility fee equal to 0.30% per annum of the total facility capacity of $150.0 million, as well as certain customary fees for any issued loans. The Company entered into an equity commitment letter in connection with the 364-Day Credit Facility, committing to provide capital contributions, if and when required, to the consolidated subsidiary throughout the life of the facility.
(e)A consolidated subsidiary of the Company entered into two $15.0 million subordinated revolving credit facilities (collectively, the “Subordinated Credit Facility”), for a total commitment of $30.0 million. The Subordinated Credit Facility is available for direct borrowings and is guaranteed by certain members of the TPG Operating Group. In August 2023, the subsidiary extended the maturity date of the Subordinated Credit Facility from August 2024 to August 2025. The interest rate for borrowings under the Subordinated Credit Facility is calculated at a term SOFR rate plus a 0.10% per annum adjustment and 2.25%.
TPG Inc.
Notes to Consolidated Financial Statements
During the years ended December 31, 2023, 2022 and 2021, the Company incurred interest expense of $31.8 million, $19.0 million and $14.3 million, respectively, on its debt obligations.
At December 31, 2023 and 2022, the fair value of the Company’s senior unsecured term loan was $200.0 million and $199.2 million, respectively, which approximates its carrying amount represented in the Consolidated Statements of Financial Condition due to its variable rate nature.
At December 31, 2023 and 2022, the estimated fair value of the secured borrowings based on current market rates and credit spreads for debt with similar maturities was $240.7 million and $231.5 million, respectively, and the carrying value, excluding unamortized issuance costs, was $250.0 million at December 31, 2023 and 2022.
During January 2024, the Company drew $58.5 million under its Senior Unsecured Revolving Credit Facility.
13. Income Taxes
As a result of the Reorganization, the Company is treated as a corporation for U.S. federal and state income tax purposes. The Company is subject to U.S. federal and state income taxes, in addition to local and foreign income taxes, with respect to its allocable share of taxable income generated by the TPG Operating Group. Prior to the Reorganization, the Company was treated as a partnership for U.S. federal income tax purposes and therefore was not subject to U.S. federal and state income taxes except for certain consolidated subsidiaries that were subject to taxation in the U.S. (federal, state and local) and in foreign jurisdictions.
The income (loss) before income taxes includes the following components (in thousands):
| | | | | | | | | | | | | | | | | | | | |
| | Year Ended December 31, |
| | 2023 | | 2022 | | 2021 |
| Income (loss) before income taxes | | | | | | |
| United States | | $ | 18,303 | | | $ | 80,872 | | | $ | 3,171,385 | |
| International | | 65,350 | | | (104,624) | | | 1,493,650 | |
| | $ | 83,653 | | | $ | (23,752) | | | $ | 4,665,035 | |
The Company has provided U.S. federal, foreign and state and local corporate income tax for certain consolidated subsidiaries. The provision for income taxes consists of the following (in thousands):
| | | | | | | | | | | | | | | | | |
| Year Ended December 31, |
| 2023 | | 2022 | | 2021 |
| Current income taxes (benefit) | | | | | |
| Federal | $ | 24,314 | | | $ | 44,714 | | | $ | 1,950 | |
| State and local | 6,680 | | | 9,466 | | | 1,954 | |
| International | 9,198 | | | 5,443 | | | 5,010 | |
| 40,192 | | | 59,623 | | | 8,914 | |
| Deferred income taxes (benefit) | | | | | |
| Federal | 18,258 | | | (21,639) | | | (223) | |
| State and local | 1,570 | | | (4,769) | | | (105) | |
| International | 248 | | | (732) | | | 452 | |
| 20,076 | | | (27,140) | | | 124 | |
| Income tax expense (benefit) | $ | 60,268 | | | $ | 32,483 | | | $ | 9,038 | |
TPG Inc.
Notes to Consolidated Financial Statements
Income taxes are provided at the applicable statutory rates. The tax effects of temporary differences resulted in the following deferred tax assets and liabilities (in thousands):
| | | | | | | | | | | |
| December 31, |
| 2023 | | 2022 |
| Deferred tax assets | | | |
| Investment in TPG Operating Group | $ | 86,571 | | | $ | 99,018 | |
| Accruals | 1,245 | | | 2,063 | |
| Fixed Assets | 629 | | | 369 | |
| Straight line rent | — | | | 6 | |
| Net operating loss carryforwards | 25 | | | — | |
| Equity based compensation | 20,021 | | | 10,674 | |
| Lease liability | 2,029 | | | 12,638 | |
| Foreign tax credit | 1,830 | | | — | |
| Other | 5,797 | | | 603 | |
| 118,147 | | | 125,371 | |
| Less: valuation allowance | (92,599) | | | (80,340) | |
| Deferred tax assets, net | $ | 25,548 | | | $ | 45,031 | |
| | | |
| Deferred tax liabilities | | | |
| Accruals | $ | — | | | $ | 42 | |
| Right-of-use assets | 1,890 | | | 11,157 | |
| Fixed assets | — | | | 155 | |
| Intangibles | 6,989 | | | 218 | |
| Deferred tax liabilities, net | $ | 8,879 | | | $ | 11,572 | |
As of December 31, 2023 and 2022, the Company has recognized net deferred tax assets before the considerations of valuation allowances in the amount of $109.3 million and $113.8 million, respectively, which primarily relate to excess income tax basis versus book basis differences in connection with the Company’s investment in the TPG Operating Group. The excess of income tax basis in the TPG Operating Group was primarily due to the Reorganization which resulted in a step-up in the tax basis of certain assets to the Company that will be recovered as those underlying assets are sold or the tax basis is amortized.
At December 31, 2023, the Company has foreign tax credits available in the U.S., in the amount of $1.8 million, which will begin to expire in 2032, if not utilized. The Company does not have any U.S. federal, state or foreign net operating loss carryforwards, net of valuation allowance, for the period ended December 31, 2023.
The Company evaluates the realizability of its deferred tax asset on a quarterly basis and adjusts the valuation allowance when it is more-likely-than-not that all or a portion of the deferred tax asset may not be realized. Management considers the scheduled reversal of deferred tax liabilities, projected future taxable income, and tax planning strategies in making this assessment. In projecting its taxable income, the Company begins with historic results and incorporates assumptions of the amount of future pretax operating income. The assumptions about future taxable income require significant judgment and are consistent with the plans and estimates that the Company uses to manage its business. The Company’s projections of future taxable income that include the effects of originating and reversing temporary differences, including those for the tax basis intangibles, indicate that it is more likely than not that the benefits from our deferred tax assets will be realized.
As of December 31, 2023 and 2022, the Company has recognized a valuation allowance of $92.6 million and $80.3 million, respectively, which primarily relates to the Company’s investment in the TPG Operating Group. In evaluating the realizability of the deferred tax asset related to the Company’s investment in the TPG Operating Group, the Company determined that the excess income tax basis in the TPG Operating Group will only reverse upon a sale of the Company’s interest in the TPG Operating Group which is not expected to occur in the foreseeable future.
TPG Inc.
Notes to Consolidated Financial Statements
In addition, the Company has recognized valuation allowances against certain foreign tax credits available for use in the U.S., in the amount of $0.9 million, which are expected to expire, as well as a valuation allowance of $5.1 million against certain foreign deferred tax assets as it is more-likely-than not that this portion of our deferred tax assets is not realizable.
The current year net increase in our valuation allowance, as compared to the prior year, was $12.3 million of which a $18.7 million increase was charged to income tax expense, a $12.1 million decrease was recognized through equity and a $5.7 million increase was recognized through Goodwill in connection with the Acquisition.
Additionally, the Company recorded a payable pursuant to the Tax Receivable Agreement within other liabilities in the Consolidated Statements of Financial Condition of $24.6 million, related to the Reorganization and subsequent exchanges of TPG Operating Group partnership units for common stock.
The following table reconciles the U.S. federal statutory tax rate to the effective income tax rate of the Company’s income tax expense:
| | | | | | | | | | | | | | | | | |
| Year Ended December 31, |
| 2023 | | 2022 | | 2021 |
| U.S. federal taxes at statutory rate | 21.0 | % | | 21.0 | % | | 21.0 | % |
| Income passed through to partners | 9.6 | | | (136.2) | | | (20.1) | |
| State and local income taxes | 12.0 | | | (25.9) | | | — | |
| Foreign Taxes, net of U.S. foreign tax credits | 7.7 | | | (17.3) | | | (0.8) | |
| Equity based compensation | (1.3) | | | 2.0 | | | — | |
Change in TPG Operating Group tax basis estimate
| — | | | 21.7 | | | — | |
| Return to Provision | (0.9) | | | 3.9 | | | — | |
| Change in valuation allowance | 20.8 | | | (4.3) | | | — | |
| Change in tax status of statutory subsidiaries | 2.9 | | | — | | | — | |
| Other reconciling items | 0.2 | | | (1.7) | | | — | |
| Effective income tax rate | 72.0 | % | | (136.8 | %) | | 0.2 | % |
The Company’s effective tax rate was 72.0%, (136.8%) and 0.2% for the years ended December 31, 2023, 2022, and 2021, respectively. The Company’s effective tax rate is dependent on many factors, including the estimated amount of income subject to tax. Consequently, the effective tax rate can vary from period to period. The Company’s overall effective tax rate in each of the periods described above deviates from the statutory rate because (i) the Company was not subject to U.S. federal taxes prior to the Reorganization and (ii) the portion of income and losses that are allocated to non-controlling interests, as the tax liability on such income or loss is borne by the holders of such non-controlling interests. In addition, during the year ended December 31, 2023, the Company recognized additional income tax expense due to the increase in valuation allowance as a result of the pre-closing reorganization transactions of certain TPG Parties (the “Pre-Closing TPG Transactions”). Further, for the year ended December 31, 2022, an additional income tax benefit was recognized in connection with certain changes in estimate of the income tax basis of the Company's investments in the TPG Operating Group at the time of the Reorganization.
TPG Inc.
Notes to Consolidated Financial Statements
The following is a tabular reconciliation of unrecognized tax benefits, excluding interest and penalties (in thousands):
| | | | | | | | | | | | | | | | | |
| | | | | |
| Year Ended December 31, |
| 2023 | | 2022 | | 2021 |
| Unrecognized tax benefits - January 1 | $ | 2,024 | | | $ | 1,965 | | | $ | 1,760 | |
| Additions related to current year positions | 711 | | | 259 | | | 359 | |
| Additions related to prior year positions | — | | | — | | | — | |
| Reductions for tax positions of prior years | (360) | | | — | | | (119) | |
| Settlements | — | | | — | | | — | |
| Lapse of statute of limitations | (386) | | | — | | | — | |
| Exchange rate fluctuations | (2) | | | (200) | | | (35) | |
| Unrecognized tax benefits - December 31 | $ | 1,987 | | | $ | 2,024 | | | $ | 1,965 | |
The Company recognizes interest accrued on uncertain tax benefits in income tax expense. For the years ended December 31, 2023, 2022 and 2021, the Company recognized interest of $0.9 million, $1.1 million and $0.9 million, respectively. The Company recognized penalties of $1.1 million, $1.3 million and $1.3 million for the years ended December 31, 2023, and 2022 and 2021, respectively.
As of December 31, 2023, the Company has unrecognized tax benefits of $4.0 million, which, if recognized, would impact the effective tax rate. The Company does not believe that it has any tax position for which it is reasonably possible that it will be required to record significant amounts of unrecognized tax benefits within the next twelve months. The Company applies the provisions of ASC 740, which clarifies the accounting and disclosure for uncertainty in tax positions. The Company analyzed its tax filing positions for all federal, state, local and foreign tax jurisdictions where it is required to file income tax returns, as well as for all open tax years in these jurisdictions.
In the normal course of business, the Company is subject to examination by U.S. federal and certain state, local and foreign tax regulators. At December 31, 2023, U.S. federal tax returns related to 2022 and predecessor entities for the years 2020 through 2021 are generally open under the normal statute of limitations and therefore subject to examination. State and local tax returns of our predecessor entities are generally open to audit for tax years between 2019 to 2021. In addition, certain foreign subsidiaries’ tax returns from 2010 to 2022 are also open for examination by various regulators. The Company files its tax returns as prescribed by the tax laws of the jurisdictions in which it operates. Although the outcome of tax audits is always uncertain, the Company does not believe the outcome of any current or future audit will have a material adverse effect on the Company’s Consolidated Financial Statements.
TPG Inc.
Notes to Consolidated Financial Statements
14. Related Party Transactions
Due From and Due To Affiliates
Due from affiliates and due to affiliates consist of the following (in thousands):
| | | | | | | | | | | |
| Year Ended December 31, |
| 2023 | | 2022 |
| Portfolio companies | $ | 60,227 | | | $ | 57,492 | |
| Partners and employees | 2,293 | | | 2,270 | |
| Other related entities | 63,224 | | | 54,030 | |
| Unconsolidated VIEs | 293,233 | | | 88,847 | |
| Due from affiliates | $ | 418,977 | | | $ | 202,639 | |
| | | |
| Portfolio companies | $ | 8,461 | | | $ | 10,367 | |
| Partners and employees | 51,647 | | | 60,309 | |
| Other related entities | 26,805 | | | 21,615 | |
| Unconsolidated VIEs | 56,262 | | | 47,572 | |
| Due to affiliates | $ | 143,175 | | | $ | 139,863 | |
Affiliate receivables and payables historically have been settled in the normal course of business without formal payment terms, generally do not require any form of collateral and do not bear interest.
Fund Investments
Certain of the Company’s investment professionals and other individuals have made investments of their own capital in the TPG funds. These investments are generally not subject to management fees or performance allocations at the discretion of the general partner. Investments made by these individuals during the years ended December 31, 2023 and 2022 totaled $267.0 million and $154.8 million, respectively.
Fee Income from Affiliates
Substantially all revenues are generated from TPG funds, limited partners of TPG funds, or portfolio companies. The Company disclosed revenues in Note 2 to the Consolidated Financial Statements. Loans to Affiliates
From time to time, the Company may enter into transactions in which it arranges short-term funding for affiliates, such as portfolio companies, as part of the Company’s capital markets activities. Under this arrangement, the Company may draw all or substantially all of its availability for borrowings under the 364-Day Credit Facility. Borrowings made under this facility are generally expected to be repaid promptly as these short-term fundings are intended to be syndicated to third parties.
Notes Receivable from Affiliates
From time to time, the Company makes loans to its employees and other affiliates. Certain of these loans are collateralized by underlying investment interests of the borrowers. The outstanding balance of these notes was $0.1 million and $1.6 million as of December 31, 2023 and 2022, respectively, which is included in other assets in the Consolidated Statements of Financial Condition.
These notes generally incur interest at floating rates, and such interest, which is included in interest, dividends and other in the Consolidated Statements of Operations, totaled less than $0.1 million for each of the years ended December 31, 2023 and 2022, and $0.5 million for the year ended December 31, 2021.
TPG Inc.
Notes to Consolidated Financial Statements
Aircraft Services
The Company terminated its leases of aircraft owned by entities controlled by certain partners of the Company in January 2022. The termination of the leases resulted in the derecognition of a right-of-use asset and a corresponding lease liability of $13.6 million.
RemainCo Administrative Services Agreement
In exchange for services provided by TPG Operating Group, RemainCo pays TPG Operating Group an annual administration fee in the amount of 1% per annum of the net asset value of RemainCo’s assets, with such amount payable quarterly in advance. The fees earned by the Company for the years ended December 31, 2023 and 2022 were $17.8 million and $19.8 million, respectively, and recorded in fees and other in the Consolidated Statements of Operations.
Other Related Party Transactions
The Company has entered into contracts to provide services or facilities for a fee with certain related parties. A portion of these fees are recognized as fees and other in the Consolidated Statements of Operations in the amount of $28.9 million, $23.5 million and $21.8 million for the years ended December 31, 2023, 2022 and 2021 respectively. During the years ended December 31, 2023, 2022 and 2021, these related parties have made payments associated with these arrangements of $35.8 million, $26.2 million and $27.9 million, respectively.
15. Redeemable Equity
Investment in SPACs
The Company has invested in and sponsored SPACs which were formed for the purposes of effecting a merger, asset acquisition, stock purchase, reorganization or other business combination. In the IPO of each of these SPACs, either common shares or units (which include one Class A ordinary share and, in some cases, a fraction of a redeemable public warrant which entitled the holder to purchase one share of Class A ordinary shares at a fixed exercise price) were sold to investors. Each SPAC provided its public shareholders the option to redeem their shares either (i) in connection with a shareholder meeting to approve the business combination or (ii) by means of a tender offer. Assets held in Trust Accounts relate to gross proceeds received from the IPO and can only be used for the initial business combination and any possible investor redemptions. If the SPAC is unable to complete a business combination within a specified time frame, typically within 24 months of the IPO close date, the SPACs will redeem all public shares. The ownership interest in each SPAC which is not owned by the Company is reflected as redeemable equity attributable to Public SPACs in the accompanying Consolidated Financial Statements. As of August 16, 2023, the Company no longer had any investment in consolidated Public SPACs.
The Company consolidates these SPACs during the period before the initial business combination, and therefore the Class F ordinary shares, Class G ordinary shares, private placement shares, private placement warrants and FPAs with consolidated related parties are eliminated in consolidation.
In August 2021, AFTR, a SPAC, completed an initial public offering. AFTR sold 25,000,000 units at a price of $10.00 per unit for total IPO proceeds of $250.0 million. Each unit consisted of one Class A ordinary share of AFTR at $0.0001 par value and one-third of one warrant.
On August 16, 2023, AFTR redeemed all of its AFTR Class A Ordinary Shares at a per-share redemption price of approximately $10.41, because AFTR did not consummate an initial business combination within the time period required by its Amended and Restated Memorandum and Articles of Association. As of August 16, 2023, the AFTR Class A Ordinary Shares were deemed cancelled and represented only the right to receive the redemption amount, and there were no redemption rights or liquidating distributions with respect to AFTR’s warrants, which expired with no value. After August 16, 2023, AFTR ceased all operations except for those required to wind up its business.
In April 2021, YTPG, a SPAC, completed an initial public offering. YTPG sold 40,000,000 shares at a price of $10.00 per share for total IPO proceeds of $400.0 million. Each share consisted of one YTPG Class A Ordinary Share of YTPG at $0.0001 par value.
TPG Inc.
Notes to Consolidated Financial Statements
On April 17, 2023, YTPG redeemed all of its YTPG Class A Ordinary Shares at a per-share redemption price of approximately $10.00, because YTPG did not consummate an initial business combination within the time period required by its Amended and Restated Memorandum and Articles of Association. As of April 17, 2023, the YTPG Class A Ordinary Shares were deemed cancelled and represented only the right to receive the redemption amount. FPAs entered into by YTPG at the time of its IPO were terminated on April 17, 2023. After April 17, 2023, YTPG ceased all operations except for those required to wind up its business.
In October 2020, TPG PACE Beneficial Finance Corp. (”TPGY”), a SPAC, completed an initial public offering. TPGY sold 35,000,000 units at a price of $10.00 per unit for a total IPO price of $350.0 million. Each unit consisted of one Class A ordinary share of TPGY at $0.0001 par value and one-fifth of one warrant.
On October 11, 2022, TPGY redeemed all of its Class A Shares at a per-share redemption price of approximately $10.06, because TPGY did not consummate an initial business combination within the time period required by its Amended and Restated Memorandum and Articles of Association. As of October 11, 2022, the Class A Shares were deemed cancelled and represented only the right to receive the Redemption Amount. There will be no redemption rights or liquidating distributions with respect to the TPGY’s warrants, which expired with no value. FPAs entered into by TPGY at the time of its IPO were terminated on October 11, 2022. After October 11, 2022, TPGY ceased all operations except for those required to wind up its business.
Redeemable Equity from Consolidated Public SPACs
Redeemable equity from consolidated Public SPACs represents the shares issued by the Company’s consolidated Public SPACs that are redeemable for cash in the event of an election to redeem by individual public shareholders at the time of the business combination. Additionally, these shares become automatically redeemable with the Public SPAC’s failure to complete a business combination, tender offer or stockholder approval provisions. The ownership interest in each SPAC which is not owned by the Company is reflected as redeemable equity from consolidated Public SPACs in the accompanying Consolidated Financial Statements.
Offering costs related to Class A ordinary shares issued by SPACs consisted of legal, accounting, underwriting fees and other costs incurred that are directly related to the IPO. Offering costs for the year ended December 31, 2021 totaled approximately $54.1 million, inclusive of $32.7 million in deferred underwriting commissions, and were charged to redeemable equity. The Company had no such activity during the years ended December 31, 2023 and 2022.
As of December 31, 2023, the Company held no redeemable equity. As of December 31, 2022, the redeemable equity consisted of 65.0 million outstanding Class A ordinary shares, and these interests were classified outside of partners’ capital totaling $653.6 million, which represented the full redemption value and equaled the assets held in Trust Accounts.
The following table summarizes the adjustments to redeemable equity (in thousands):
| | | | | | | | | | | | | | | | | |
| Year Ended December 31, |
| 2023 | | 2022 | | 2021 |
| Beginning balance | $ | 653,635 | | | $ | 1,000,027 | | | $ | 800,011 | |
| IPO share proceeds | — | | | — | | | 935,000 | |
| Current and deferred offering costs | 22,750 | | | 12,959 | | | (54,141) | |
| Bifurcation of warrant liabilities | — | | | — | | | (12,500) | |
| Net income attributable to redeemable equity | 12,044 | | | 14,648 | | | 155,131 | |
| Redemptions / withdrawals | (661,001) | | | (352,014) | | | (304,760) | |
| Deconsolidation | — | | | — | | | (430,265) | |
| Change in redemption value of redeemable non-controlling interest | (27,428) | | | (21,985) | | | (88,449) | |
| Total redeemable equity | $ | — | | | $ | 653,635 | | | $ | 1,000,027 | |
TPG Inc.
Notes to Consolidated Financial Statements
16. Operating Leases
The following tables summarize the Company’s lease cost, cash flows, and other supplemental information related to its operating leases.
The components of lease expense were as follows (in thousands): | | | | | | | | | | | | | | | | | |
| Year Ended December 31, |
| 2023 | | 2022 | | 2021 |
Lease cost (a): | | | | | |
| Operating lease cost | $ | 29,878 | | | $ | 26,371 | | | $ | 37,330 | |
| Short-term lease costs | 587 | | | 562 | | | 416 | |
| Variable lease cost | 8,089 | | | 6,381 | | | 5,067 | |
| Sublease income | (3,400) | | | (3,947) | | | (5,807) | |
| Total lease cost | $ | 35,154 | | | $ | 29,367 | | | $ | 37,006 | |
| Weighted-average remaining lease term | 6.7 | | 7.1 | | 7.4 |
| Weighted-average discount rate | 5.09 | % | | 4.11 | % | | 4.11 | % |
___________
(a)Office rent expense for the years ended December 31, 2023, 2022 and 2021 was $29.7 million, $26.1 million and $32.0 million, respectively.
Supplemental Consolidated Statements of Cash Flows information related to leases were as follows (in thousands):
| | | | | | | | | | | | | | | | | |
| Year Ended December 31, |
| 2023 | | 2022 | | 2021 |
| Cash paid for amounts included in the measurement of lease liabilities | $ | 34,492 | | | $ | 28,458 | | | $ | 29,224 | |
| Right-of-use assets obtained in the Acquisition (see Note 3) | 107,716 | | | — | | | — | |
| Other non-cash changes in right-of-use assets | 13,057 | | | 6,311 | | | 5,634 | |
| Non-cash right-of-use assets and lease liability termination | (743) | | | (13,375) | | | — | |
The following table shows the undiscounted cash flows on an annual basis for operating lease liabilities as of December 31, 2023 (in thousands):
| | | | | | | | |
| Year Due | | Lease Amount |
| 2024 | | $ | 43,553 | |
| 2025 | | 39,221 | |
| 2026 | | 37,353 | |
| 2027 | | 37,581 | |
| 2028 | | 36,321 | |
| Thereafter | | 88,273 | |
| Total future undiscounted operating lease payments | | 282,302 | |
| Less: imputed interest | | (46,765) | |
| Present value of operating lease liabilities | | $ | 235,537 | |
TPG Inc.
Notes to Consolidated Financial Statements
17. Commitments and Contingencies
Guarantees
Certain of the Company’s consolidated entities have guaranteed debt or obligations. At December 31, 2023 and 2022, the maximum obligations guaranteed under these agreements totaled $1,789.3 million and $1,120.8 million, respectively. At December 31, 2023, the guarantees had expiration dates as follows (in thousands):
| | | | | | | | |
| Maturity Date | | Guarantee Amount |
| | |
| April 2024 | | $ | 150,000 | |
| August 2025 | | 30,000 | |
| March 2026 | | 200,000 | |
| June 2026 | | 60,000 | |
| December 2026 | | 116,284 | |
| September 2028 | | 1,200,000 | |
| June 2030 | | 32,972 | |
| Total | | $ | 1,789,256 | |
At December 31, 2023 and 2022, the outstanding amount of debt on obligations related to these guarantees was $807.6 million and $327.8 million, respectively.
Letters of Credit
The Company had $0.5 million in letters of credit outstanding for each of the years ended December 31, 2023 and 2022.
Commitments
As of August 16, 2023, the Company no longer had any investment in or commitments to consolidated Public SPACs. See Note 15.
At December 31, 2023, the TPG Operating Group had unfunded investment commitments of $521.3 million to the investment funds that the Company manages and other strategic investments.
Contingent Obligations (Clawback) With Affiliates
The governing agreements of the TPG funds that pay performance allocations generally include a clawback provision that, if triggered, may give rise to a contingent obligation requiring the general partner to return amounts to the fund for distribution to the fund investors at the end of the life of the fund. Performance allocations received by the general partners of the respective TPG funds are subject to clawback to the extent the performance allocations received by the general partners exceeds the amount the general partners are ultimately entitled to receive based on cumulative fund results.
At December 31, 2023, if all investments held by the TPG funds were liquidated at their current unrealized fair value, there would be clawback of $58.3 million, net of tax, for which a performance fee reserve was recorded within other liabilities in the Consolidated Statements of Financial Condition.
At December 31, 2023, if all remaining investments were deemed worthless, a possibility management views as remote, the amount of performance allocations subject to potential clawback would be $1,910.2 million.
During the year ended December 31, 2023, the general partners made no payments on the clawback liability.
TPG Inc.
Notes to Consolidated Financial Statements
Legal Actions and Other Proceedings
From time to time, the Company is involved in legal proceedings, litigation and claims incidental to the conduct of our business, including with respect to acquisitions, bankruptcy, insolvency and other types of proceedings. Such lawsuits may involve claims against our portfolio companies that adversely affect the value of certain investments owned by TPG’s funds. The Company’s business is also subject to extensive regulation, which has and may result in the Company becoming subject to examinations, inquiries and investigations by various U.S. and non-U.S. governmental and regulatory agencies, including but not limited to the SEC, Department of Justice, state attorneys general, Financial Industry Regulatory Authority and the U.K. Financial Conduct Authority. Such examinations, inquiries and investigations may result in the commencement of civil, criminal or administrative proceedings or fines against the Company or its personnel.
The Company accrues a liability for legal proceedings in accordance with U.S. GAAP. In particular, the Company establishes an accrued liability for loss contingencies when a settlement arising from a legal proceeding is both probable and reasonably estimable. If the matter is not probable or reasonably estimable, no such liability is recorded. Examples of this include: (i) the proceedings may be in early stages; (ii) damages sought may be unspecified, unsupportable, unexplained or uncertain; (iii) discovery may not have started or is incomplete; (iv) there may be uncertainty as to the outcome of pending appeals or motions; (v) there may be significant factual issues to be resolved or (vi) there may be novel legal issues or unsettled legal theories to be presented or a large number of parties. Consequently, management is unable to estimate a range of potential loss, if any, related to such matters. Even when the Company accrues a liability for a loss contingency in such cases, there may be an exposure to loss in excess of any amounts accrued. Loss contingencies may be, in part or in whole, subject to insurance or other payments such as contributions and/or indemnity, which may reduce any ultimate loss.
Based on information presently known by management, the Company has not recorded a potential liability related to any pending legal proceeding and is not subject to any legal proceedings that we expect to have a material impact on our operations, financial positions or cash flows. It is not possible, however, to predict the ultimate outcome of all pending legal proceedings, and the claimants in the matter discussed below seek potentially large and indeterminate amounts. As such, although we do not consider such an outcome likely, given the inherent unpredictability of legal proceedings, it is possible that an adverse outcome in the matter described below or certain other matters could have a material effect on the Company’s financial results in any particular period.
Since 2011, a number of TPG-related entities and individuals, including David Bonderman and Jim Coulter, have been named as defendants/respondents in a series of lawsuits in the United States, United Kingdom, and Luxembourg concerning an investment TPG held from 2005-2007 in a Greek telecommunications company, known then as TIM Hellas (“Hellas”). Entities and individuals related to Apax Partners, a London based investment firm also invested in Hellas at the time, are named in the suits as well. The cases all allege generally that a late 2006 refinancing of the Hellas group of companies was improper.
To date, most of the lawsuits filed in New York Federal and State courts against TPG and Apax-related defendants have been dismissed, with those dismissals upheld on appeal, or the appeal period has passed. A lawsuit pending in the District Court of Luxembourg against two former TPG partners and two individuals related to Apax involved in the investment has been decided after trial in their favor on all claims and is now on appeal. In February 2018, a High Court case in London against a number of TPG and Apax-related parties and individuals was abandoned by the claimants in the early days of a scheduled six-week trial with costs of $9.5 million awarded to the TPG and Apax-related parties, of which $3.4 million was awarded to TPG.
In addition to the Luxembourg appeal, two cases in New York state court are active against TPG and Apax-related parties concerning the Hellas investment. Motions to dismiss by all defendants were made in both actions with the Court now having granted and denied in part those motions, paring back the parties, claims and amounts at issue. Appeals are pending as to the dismissal ruling in one matter (with immediate appeals possible as to the dismissal ruling in the other). The court has ruled on summary judgment motions in one case, further paring back the parties and claims in the case. Appeals are pending as to those summary judgment rulings as well. There is no pending trial date in either action. The prior noted stayed federal actions have now been dismissed by court order and stipulation.
The Company believes that the suits related to the Hellas investment are without merit and intends to continue to defend them vigorously.
TPG Inc.
Notes to Consolidated Financial Statements
In October 2022, the Company received a document request from the SEC focusing on the use and retention of business-related electronic communications, which, as has been publicly reported, is part of an industry-wide review. The Company is cooperating with the SEC’s request.
Indemnifications
In the normal course of business, the Company enters into contracts that contain a variety of representations and warranties that provide general indemnifications. In addition, certain of the Company’s funds have provided certain indemnities relating to environmental and other matters and has provided nonrecourse carve-out guarantees for fraud, willful misconduct and other customary wrongful acts, each in connection with the financing of certain real estate investments that the Company has made. The Company’s maximum exposure under these arrangements is unknown as this would involve future claims that may be made against the Company that have not yet occurred. However, based on experience, the Company expects the risk of material loss to be remote.
18. Net Income (Loss) Per Class A Common Share
The Company calculates its basic and diluted income (loss) per share using the two-class method for all periods presented, which defines unvested share-based payment awards that contain nonforfeitable rights to dividends as participating securities. The two-class method is an allocation formula that determines income per share for each share of common stock and participating securities according to dividends declared and participation rights in undistributed earnings. Under this method, all income (distributed and undistributed) is allocated to common shares and participating securities based on their respective rights to receive dividends.
In computing the dilutive effect that the exchange of TPG Operating Group partnership units would have on net income available to Class A common stock per share, TPG considered that net income (loss) available to holders of shares of Class A common stock would increase due to the elimination of non-controlling interests in the TPG Operating Group, inclusive of any tax impact. The hypothetical conversion may be dilutive to the extent there is activity at the TPG Inc. level that has not previously been attributed to the non-controlling interests or if there is a change in tax rate as a result of a hypothetical conversion.
Basic and diluted net income (loss) per share of Class A common stock for the year ended December 31, 2022 is presented from January 13, 2022 through December 31, 2022, the period following the Reorganization and IPO. There were no shares of Class A common stock outstanding prior to January 13, 2022, therefore no income per share information has been presented for any period prior to that date.
TPG Inc.
Notes to Consolidated Financial Statements
The following table sets forth reconciliations of the numerators and denominators used to compute basic and diluted net income (loss) per share of Class A common stock (in thousands, except share and per share data):
| | | | | | | | | | | | | | | | | |
| | | Year Ended December 31, |
| | | | | 2023 | | 2022 |
| Numerator: | | | | | | | |
| Net income (loss) | | | | | $ | 23,385 | | | $ | (56,235) | |
| Less: | | | | | | | |
| Net loss attributable to redeemable equity in Public SPACs prior to IPO | | | | | — | | | (517) | |
| Net income attributable to other non-controlling interests prior to Reorganization and IPO | | | | | — | | | 966 | |
| Net income attributable to TPG Group Holdings prior to Reorganization and IPO | | | | | — | | | 5,256 | |
| Net income (loss) subsequent to IPO | | | | | 23,385 | | | (61,940) | |
| Less: | | | | | | | |
| | | | | | | |
| Net income attributable to redeemable equity in Public SPACs subsequent to IPO | | | | | 12,044 | | | 15,165 | |
| Net loss attributable to non-controlling interests in TPG Operating Group subsequent to IPO | | | | | (92,411) | | | (180,824) | |
| Net income attributable to other non-controlling interests subsequent to IPO | | | | | 23,662 | | | 11,293 | |
| Net income attributable to Class A Common Stockholders prior to distributions | | | | | 80,090 | | | 92,426 | |
Reallocation of earnings to unvested participating restricted stock units(a) | | | | | (8,872) | | | (4,994) | |
| Net income attributable to Class A Common Stockholders - Basic | | | | | 71,218 | | | 87,432 | |
| | | | | | | |
| Net loss assuming exchange of non-controlling interest | | | | | (82,900) | | | (147,133) | |
| Reallocation of income from participating securities assuming exchange of Common Units | | | | | — | | | 132 | |
| Net (loss) income attributable to Class A Common Stockholders - Diluted | | | | | $ | (11,682) | | | $ | (59,569) | |
| Denominator: | | | | | | | |
| Weighted-Average Shares of Common Stock Outstanding - Basic | | | | | 80,334,871 | | 79,255,411 |
| Exchange of Common Units to Class A Common Stock | | | | | 237,609,625 | | 229,652,641 |
| Weighted-Average Shares of Common Stock Outstanding - Diluted | | | | | 317,944,496 | | 308,908,052 |
| Net income (loss) available to Class A common stock per share | | | | | | | |
| Basic | | | | | $ | 0.89 | | | $ | 1.10 | |
| Diluted | | | | | $ | (0.04) | | | $ | (0.19) | |
Dividends declared per share of Class A Common Stock(b) | | | | | $ | 1.40 | | | $ | 1.09 | |
___________
(a)No undistributed losses were allocated to unvested participating restricted stock units during the year ended December 31, 2023 and the year ended December 31, 2022, as the holders do not have a contractual obligation to share in the losses of the Company with common stockholders.
(b)Dividends declared reflects the calendar date of the declaration for each distribution. The fourth quarter dividends were declared on February 13, 2024 and are payable on March 8, 2024.
TPG Inc.
Notes to Consolidated Financial Statements
19. Equity-Based Compensation
Restricted Stock Awards
Under the Company’s 2021 Omnibus Equity Incentive Plan (the “Omnibus Plan”), the Company is permitted to grant equity awards representing ownership interests in TPG Inc.’s Class A common stock. On January 13, 2022, the Omnibus Plan became effective and the Company authorized for issuance 30,694,780 shares of TPG Inc.’s Class A common stock. On January 6, 2023, additional 12,797,983 shares of Class A common stock were registered, increasing the share reserve to 30,889,270 of which 14,245,386 may be issued as of December 31, 2023.
In conjunction with the IPO in 2022, TPG employees, certain of the Company’s executives and certain non-employees received one-time grants of equity-based awards in the form of restricted stock units which entitle the holder to one share of Class A common stock upon vesting.
In conjunction with the Angelo Gordon Acquisition, described in Note 3, the Company granted 7.0 million of RSUs (the “Acquisition Service Awards”) to former Angelo Gordon employees to promote retention post closing. These units generally vest over a term of five years. There are approximately 1.4 million of Angelo Gordon Service Awards to be granted at a later date.
Further, in the ordinary course of business the Company also grants equity awards that are subject to either service conditions (“Service Awards”), a combination of service and performance conditions (“Performance Condition Awards”) or a combination of service and market conditions (“Market Condition Awards”).
The following table summarizes the outstanding restricted stock unit awards as of December 31, 2023 (in millions, including share data):
| | | | | | | | | | | | | | | | | | | | | | | |
| Units Outstanding as of
December 31, 2023 | | Compensation Expense for the Year Ended | | Unrecognized Compensation Expense as of December 31, 2023 |
| | December 31, 2023 | | December 31, 2022 | |
| Restricted Stock Units | | | | | | | |
| Special Purpose Awards: | | | | | | | |
| IPO Service Awards | 9.3 | | $ | 61.0 | | | $ | 75.2 | | | $ | 158.6 | |
| IPO Market Condition Awards | 1.1 | | 6.5 | | | 5.2 | | | 6.5 | |
| Acquisition Service Awards | 7.0 | | 12.8 | | | — | | | 189.0 | |
| Executive Service Awards | 2.6 | | 1.9 | | | — | | | 88.9 | |
| Executive Market Condition Awards | 3.9 | | 2.3 | | | — | | | 79.8 | |
| | | | | | | |
Ordinary Awards: | | | | | | | |
| Service Awards | 4.4 | | 44.3 | | | 2.8 | | | 103.4 | |
| Performance Condition Awards | 0.1 | | 1.0 | | | 0.6 | | | 2.0 | |
| | | | | | | |
| Total Restricted Stock Units | 28.4 | | $ | 129.8 | | $ | 83.8 | | $ | 628.2 | |
For the years ended December 31, 2023 and 2022, the Company recorded total restricted stock unit compensation expense of $129.8 million and $83.8 million, respectively. The expense associated with awards granted to certain non-employees of the Company is recognized in general, administrative and other in our Consolidated Statements of Operations and totaled $3.7 million and $7.1 million for the years ended December 31, 2023 and 2022, respectively.
For the years ended December 31, 2023 and 2022, the Company had 562,790 and 169,493 restricted stock units vest at a fair value of $18.5 million and $4.6 million, respectively (excluding vested, but unsettled units). The restricted stock units were settled by issuing 356,443 shares of TPG Inc. Class A Common stock, net of withholding tax of $6.9 million for the year ended December 31, 2023 (excluding vested, but unsettled units) and by issuing 169,493 shares of TPG Inc. Class A Common stock for the year ended December 31, 2022.
TPG Inc.
Notes to Consolidated Financial Statements
Service Awards
For the year ended December 31, 2023, the Company issued 7.0 million of Acquisition Service Awards and 13.6 million of Ordinary Service Awards. The grant date fair value of the Acquisition Awards was the closing public share price of the Company’s Class A common stock on November 1, 2023 of $28.18, and for the Ordinary Service Awards the public share price on their respective grant date. The following table presents the rollforward of the Company’s unvested Service Awards for the year ended December 31, 2023 (awards in millions):
| | | | | | | | | | | |
| Service Awards | | Weighted-Average Grant Date Fair Value |
| Balance at December 31, 2022 | 11.2 | | $ | 30.68 | |
| Granted | 13.6 | | 31.51 | |
| Vested | (0.6) | | 29.29 | |
| Forfeited | (0.9) | | 30.11 | |
| Balance at December 31, 2023 | 23.3 | | $ | 30.62 | |
As of December 31, 2023, there was approximately $539.8 million of total estimated unrecognized compensation expense related to unvested Service Awards, which is expected to be recognized over the weighted average remaining requisite service period of 3.7 years.
In January 2024, the Company issued 2.4 million shares of Class A common stock in connection with the first vesting of both IPO and Ordinary Service Awards. In January 2024, the Company granted 3.6 million in Ordinary Service Awards and 0.9 million in Acquisition Service Awards. The units vest in equal tranches over a period of three to five years.
Performance Condition Awards
In 2022 the Company also granted 0.1 million of Ordinary Performance Condition Awards. The weighted-average grant date fair value per share was $26.93 for these awards. The Company recorded equity-based compensation expense of $1.0 million and $0.6 million for the years ended December 31, 2023 and 2022, respectively. Further, as of December 31, 2023, there was approximately $2.0 million of total estimated unrecognized compensation expense related to unvested Ordinary Performance Condition Awards, which is expected to be recognized over the weighted average remaining requisite service period of 2.1 years.
Market Condition Awards
IPO Awards
Under the Omnibus Plan, the Company also granted 2.2 million of Executive Awards in order to incentivize and retain key members of management and further their alignment with our shareholders in conjunction with the IPO. The Executive Awards include awards of (i) 1.1 million restricted stock units subject to service-based vesting over a five-year service period beginning with the second anniversary of the grant date (included in IPO Service Awards) and (ii) 1.1 million market and service based restricted stock units (“IPO Market Condition Awards”). Each IPO Market Condition Award is comprised of two parts: (i) a time-based component requiring a five-year service period and (ii) a market price component with a target Class A common stock share price at either $44.25 within five years or $59.00 within eight years. Dividend equivalents are paid on vested and unvested Executive Service Awards when the dividend occurs. Dividend equivalents accrue for vested and unvested IPO Market Condition Awards and are paid only when both the applicable service and performance conditions are satisfied.
Compensation expense for Executive Service Awards is recognized on a straight-line basis and for the IPO Market Condition Awards using the accelerated attribution method on a tranche by tranche basis.
Executive Awards
Under the Omnibus Plan, the Company granted a long-term performance incentive award to the Company’s Chief Executive Officer, Jon Winkelried, on November 30, 2023. The award comprised of 2.6 million Executive Service Awards
TPG Inc.
Notes to Consolidated Financial Statements
and 3.9 million Executive Market Condition Awards and is intended to incentivize Mr. Winkelried to drive shareholder value in a manner that is aligned with stockholder interests, reward him for organic and inorganic Company growth, and bring his compensation in-line with peer competitors in order to promote and ensure retention.
The Service Awards vest ratably over a term of five years. The Market Condition Awards are scheduled to service vest ratably over a period of five years, and are only earned upon achievement of a stock price vesting condition that will be met when the 30-day volume weighted average trading price of a share of Class A common stock meets or exceeds certain stock price hurdles. 25% of each service vesting tranche of the Market Condition Awards are eligible to be earned and vest following achievement of each of the following Class A common stock prices: $52.50 (“Type I”), $58.45 (“Type II”), $64.05 (“Type III”) and $70.00 (“Type IV”). These stock price hurdles represent a premium of 150%, 167%, 183% and 200% of the closing price of a share of Class A common stock on the date of grant. The first market hurdle must be achieved by January 13, 2029, and the remaining hurdles by January 13, 2030. If the applicable market hurdles are not achieved by the specified periods, the applicable Market Condition Awards will be forfeited. Dividend equivalents are paid on vested and unvested Service Awards when the dividend occurs. Dividend equivalents accrue for vested and unvested Market Condition Awards and are paid only if and when both the applicable service and market conditions are satisfied.
The fair value of the Executive Service Awards is based on the grant date fair value, which considers the public share price of the Company’s Class A common stock. Compensation expense for those awards is recognized on a straight-line basis. The grant date fair value of the Executive Market Condition Awards made during the year ended December 31, 2023 was based on a Monte-Carlo simulation valuation model. Compensation expense for those awards is recognized using the accelerated attribution method on a tranche by tranche basis.
Below is a summary of the grant date fair value based on the Monte-Carlo simulation valuation model.
| | | | | | | | |
| Vesting Condition | | Grant Date Fair Value |
| Type I | | $ | 23.48 | |
| Type II | | $ | 22.24 | |
| Type III | | $ | 20.32 | |
| Type IV | | $ | 18.37 | |
| | | | | | | | | | | | | | | | | | | | | | | | | | |
| Significant Assumptions | | Type I | | Type II | | Type III | | Type IV |
| TPG Class A common stock share price as of valuation date | | $ | 35.00 | | | $ | 35.00 | | | $ | 35.00 | | | $ | 35.00 | |
| Volatility | | 38.0 | % | | 36.9 | % | | 36.9 | % | | 36.9 | % |
| Dividend Yield | | 4.5 | % | | 4.5 | % | | 4.5 | % | | 4.5 | % |
| Risk-free rate | | 4.27 | % | | 4.3 | % | | 4.3 | % | | 4.3 | % |
The following table presents the roll forwards of the Company’s unvested Market Condition Awards for the year ended December 31, 2023 (awards in millions):
| | | | | | | | | | | |
| Market Condition Awards | | Weighted Average Grant Date Fair Value |
| Balance at December 31, 2022 | 1.1 | | $ | 16.58 | |
| Granted | 3.9 | | | 21.10 | |
| Vested | — | | | — | |
| Forfeited | — | | | — | |
| Balance at December 31, 2023 | 5.0 | | $ | 20.10 | |
As of December 31, 2023, there was approximately $86.3 million of total estimated unrecognized compensation expense related to unvested Market Condition Awards, which is expected to be recognized over the weighted average remaining requisite service period of 3.2 years.
TPG Inc.
Notes to Consolidated Financial Statements
Other Awards
As a result of the Reorganization and the IPO in 2022, the Company’s current partners hold restricted indirect interests in Common Units through TPG Partner Holdings and indirect economic interests through RemainCo. TPG Partner Holdings and RemainCo are presented as non-controlling interest holders within the Company’s Consolidated Financial Statements. The interests in TPG Partner Holdings (“TPH Units”) and indirectly in RemainCo (“RPH Units”) are generally subject to service, or, in certain cases, to both service and performance conditions. Holders of these interests participate in distributions regardless of the vesting status. Additionally, as a result of the Reorganization, the IPO and the acquisition of the final 33.3% of NQ Manager in 2022 discussed in Note 3 to the Consolidated Financial Statements, certain TPG partners and NewQuest principals were granted Common Units directly at TPG Operating Group and Class A common stock subject to both service and performance conditions, which are deemed probable of achieving. In conjunction with the Angelo Gordon Acquisition, as described in Note 3, the Company granted 43.8 million of unvested Common Units to former Angelo Gordon partners (the “Acquisition Common Units”), which are considered compensatory under ASC 718. The grant fair value of the Acquisition Common Units was based on a $28.18 closing price for the Class A Shares on November 1, 2023, applying an applicable discount for lack of marketability. These units generally vest over a term of five years and participate in distributions at the TPG Operating Group along with all vested equity.
The following table summarizes the outstanding Other Awards as of December 31, 2023 (in millions, including share data):
| | | | | | | | | | | | | | | | | | | | | | | |
| Unvested Units/Shares Outstanding as of December 31, 2023 | | Compensation Expense for the Year Ended | | Unrecognized Compensation Expense as of December 31, 2023 |
| | December 31, 2023 | | December 31, 2022 | |
| TPH and RPH Units | | | | | | | |
| TPH units | 37.2 | | $ | 363.3 | | $ | 426.9 | | $ | 847.1 | |
| RPH units | 0.3 | | 73.3 | | 81.7 | | 133.9 | |
| Total TPH and RPH Units | 37.5 | | $ | 436.6 | | $ | 508.6 | | $ | 981.0 | |
| | | | | | | |
| Common Units and Class A Common Stock | | | | | | | |
| Common Units | 1.6 | | $ | 17.5 | | $ | 24.3 | | $ | 18.5 | |
| Class A Common Stock | 1.1 | | 17.6 | | 17.1 | | 17.7 | |
| Acquisition Common Units | 43.8 | | 37.4 | | — | | 1,073.0 | |
| Total TOG Units and Class A Common Stock | 46.5 | | $ | 72.5 | | $ | 41.4 | | $ | 1,109.2 | |
TPH and RPH Units
The Company accounts for the TPH Units and RPH Units as compensation expense in accordance with ASC Topic 718, Compensation – Stock Compensation (“ASC 718”). The unvested TPH and RPH Units are recognized as equity-based compensation subject to primarily service vesting conditions and in certain cases performance conditions, which are currently deemed probable of achieving. The Company recognized compensation expense of $436.6 million and $508.6 million for the years ended December 31, 2023 and 2022, respectively. There is no additional dilution to our stockholders related to these interests. Contractually these units are only related to non-controlling interest holders of the TPG Operating Group, and there is no impact to the allocation of income and distributions to TPG Inc. Therefore, the Company has allocated these expense amounts to its non-controlling interest holders.
TPG Inc.
Notes to Consolidated Financial Statements
The following table presents the roll forwards of the Company’s unvested TPH Units and RPH Units for the year ended December 31, 2023 (units in millions):
| | | | | | | | | | | | | | | | | | | | | | | |
| TPH Units | | RPH Units |
| Partnership Units | | Grant Date Fair Value | | Partnership Units | | Grant Date Fair Value |
| Balance at December 31, 2022 | 50.3 | | | $ | 24.38 | | | 0.4 | | | $ | 457.10 | |
| Reallocated | 0.7 | | | 28.41 | | | — | | | — | |
| Vested | (13.1) | | | 24.13 | | | (0.1) | | | 457.10 | |
| Forfeited | (0.7) | | | 24.79 | | | (0.0) | | | 457.10 | |
| Balance at December 31, 2023 | 37.2 | | | 24.54 | | | 0.3 | | | 457.10 | |
TPH Units, which were forfeited by certain holders upon termination, were reallocated to certain existing unit holders in accordance with the applicable governing documents. The grant date fair value of the reallocated awards was determined based on the fair value of TPG’s common stock at the time of reallocation. As of December 31, 2023, there was approximately $981.0 million of total estimated unrecognized compensation expense related to outstanding unvested awards, of which TPH Units and RPH Units represented $847.1 million and $133.9 million, respectively.
Common Units and Class A Common Stock
In accordance with ASC 718, all Other Awards are also recognized as equity-based compensation. The expense for totaled $72.5 million and $41.4 million for the years ended December 31, 2023 and 2022, respectively. As TPG Operating Group holders would accrete pro-rata or benefit directly upon forfeiture of those awards, this compensation expense was allocated pro-rata to all controlling and non-controlling interest holders of TPG Inc.
The following table presents the roll forwards of the Company’s unvested TOG Units and Class A Common Stock Awards for the year ended December 31, 2023 (awards in millions):
| | | | | | | | | | | | | | | | | | | | | | | |
| Common Units | | Class A Common Stock |
| Partnership Units | | Grant Date Fair Value | | Partnership Units | | Grant Date Fair Value |
| Balance at December 31, 2022 | 2.2 | | | $ | 27.29 | | | 1.7 | | | $ | 29.50 | |
| Granted | 43.8 | | | 25.36 | | | — | | | — | |
| Vested | (0.6) | | | 27.29 | | | (0.6) | | | 29.50 | |
| Forfeited | — | | | — | | | — | | | — | |
| Balance at December 31, 2023 | 45.4 | | | 25.43 | | | 1.1 | | | 29.50 | |
Total unrecognized compensation expense related to outstanding unvested awards as of December 31, 2023 was $1,109.2 million, of which the TOG Units and Class A common stock represented $1,091.5 million and $17.7 million, respectively.
Other Liability-Classified Awards
In conjunction with the Acquisition discussed in Note 3, the Company granted liability-classified Common Unit awards with a grant date fair value of $206.6 million to Angelo Gordon partners. Those awards represent the compensatory portion of the Earnout Payment under ASC 718 and as such, require both continuous service over a period of five years and the satisfaction of the FRR targets during the Measurement Period defined in Note 3.
These liability-classified awards will be settled with a variable number of both vested and unvested Common Units upon the satisfaction of the FRR targets and do not participate in TPG Operating Group distributions before settlement. The fair value of these awards will be remeasured every reporting period and is based on the satisfaction of the respective FRR targets. During the year ended December 31, 2023, the Company recognized compensation expense of $12.4 million related to its liability-classified awards with a corresponding increase in Other liabilities. Compensation expense for those
TPG Inc.
Notes to Consolidated Financial Statements
awards is recognized using the accelerated attribution method on a tranche by tranche basis. Total unrecognized compensation expense related to these awards as of December 31, 2023 was $194.1 million.
TRTX Awards
Certain employees of the Company receive awards (“TRTX Awards”) from TPG RE Finance Trust, Inc. (“TRTX”), a publicly traded real estate investment trust, externally managed and advised by TPG RE Finance Trust Management, L.P., a wholly-owned subsidiary of the Company, for services provided to TRTX. Generally, the TRTX Awards vest over four years for employees and at grant date for directors of TRTX.
The TRTX Awards granted to certain employees of the Company are recorded in other assets and due to affiliates in the Consolidated Statements of Financial Condition. The grant date fair value of the asset is amortized through compensation and benefits expense on a straight-line basis over the vesting period in the Consolidated Statements of Operations. Compensation and benefits expense is offset by related management fees earned by the Company from TRTX. During the year ended December 31, 2023 the Company recognized $7.2 million of management fees and compensation and benefits expense. During the year ended December 31, 2022 the Company recognized less than $0.01 million of such expense.
Other Compensation Matters
TPG provides voluntary defined contribution plans for its U.S. and U.K. employees who meet certain eligibility requirements. The current defined contribution plan for U.S. employees is a 401(k) profit-sharing plan that was adopted in May 1996. The current defined contribution plan for U.K. employees is a pension plan that was adopted in January 2010. Employees may elect to make contributions up to legally established limits. Both plans provide for employer contributions at the Company’s discretion. The Company’s contribution expenses were $15.2 million, $12.7 million and $10.9 million, for the years ended December 31, 2023, 2022 and 2021, respectively.
Compensation includes a significant performance-based component in the form of discretionary bonuses. The Company incurred discretionary bonus expense of $220.7 million, $205.4 million and $340.9 million for the years ended December 31, 2023, 2022 and 2021, respectively.
TPG Inc.
Notes to Consolidated Financial Statements
20. Equity
The Company has three classes of common stock outstanding, Class A common stock, nonvoting Class A common stock and Class B common stock. Class A common stock is traded on the Nasdaq Global Select Market. The Company is authorized to issue 2,240,000,000 shares of Class A common stock with a par value of $0.001 per share, 100,000,000 shares of nonvoting Class A common stock, 750,000,000 shares of Class B common stock with a par value of $0.001 per share, and 25,000,000 shares of preferred stock, with a par value of $0.001 per share. Each share of the Company’s Class A common stock entitles its holder to one vote, and each share of our Class B common stock entitles its holder to ten votes. Holders of Class A common stock and Class B common stock generally vote together as a single class on all matters presented to the Company’s stockholders for their vote or approval. The nonvoting Class A common stock have the same rights and privileges as, rank equally and share ratably with, and are identical in all respects as to all matters to, the Class A common stock, except that the nonvoting Class A common stock have no voting rights other than such rights as may be required by law. Holders of Class A common stock are entitled to receive dividends when and if declared by the board of directors. Holders of the Class B common stock are not entitled to dividends in respect of their shares of Class B common stock. In connection with the Acquisition described in Note 3, the Company issued 9.2 million Common Units where all Common Units issued are accompanied by an equal number of Class B common stock. As of December 31, 2023, 72,337,600 shares of Class A common stock and 8,258,901 shares of nonvoting Class A common stock were outstanding, 281,657,626 shares of Class B common stock were outstanding, and there were no shares of preferred stock outstanding.
Dividends and distributions are reflected in the Consolidated Statements of Changes in Equity when declared by the board of directors. Dividends are made to Class A common stockholders and distributions are made to holders of non-controlling interests in subsidiaries.
The table below presents information regarding the quarterly dividends on the Class A common stock, which were made at the sole discretion of the Board of Directors of the Company.
| | | | | | | | | | | | | | | | | | | | |
| Date Declared | | Record Date | | Payment Date | | Dividend per Class A Common Share |
| May 10, 2022 | | May 20, 2022 | | June 3, 2022 | | $ | 0.44 | |
| August 9, 2022 | | August 19, 2022 | | September 2, 2022 | | 0.39 | |
| November 9, 2022 | | November 21, 2022 | | December 2, 2022 | | 0.26 | |
| February 15, 2023 | | February 27, 2023 | | March 10, 2023 | | 0.50 | |
| Total 2022 Dividend Year | | | | | | $ | 1.59 | |
| | | | | | |
| May 15, 2023 | | May 25, 2023 | | June 5, 2023 | | $ | 0.20 | |
| August 8, 2023 | | August 18, 2023 | | September 1, 2023 | | 0.22 | |
| November 7, 2023 | | November 17, 2023 | | December 1, 2023 | | 0.48 | |
| February 13, 2024 | | February 23, 2024 | | March 8, 2024 | | 0.44 | |
| Total 2023 Dividend Year (through Q4 2023) | | | | | | $ | 1.34 | |
Exchange of Common Units
Pursuant to the exchange agreement entered into at the time of our IPO (the “Exchange Agreement”), on March 30, 2023 a pre-IPO Investor exchanged 1,000,000 Common Units of each TPG Operating Group partnership for 1,000,000 shares of Class A common stock. This exchange resulted in the issuance of 1,000,000 shares of Class A common stock and the cancellation of 1,000,000 shares of Class B common stock for no additional consideration.
21. Subsequent Events
Other than the events noted in Notes 12, 19 and 20 to the Consolidated Financial Statements, there have been no additional events since December 31, 2023 that require recognition or disclosure in the Consolidated Financial Statements.
Item 9. Changes in and Disagreements With Accountants on Accounting and Financial Disclosures
None.
Item 9A. Controls and Procedures
Evaluation of Disclosure Controls and Procedures
Our disclosure controls and procedures (as defined in Exchange Act Rules 13a-15(e) and 15d-15(e)) are designed to ensure that information required to be disclosed by us in reports we file or submit under the Exchange Act is recorded, processed, summarized and reported within the appropriate time periods, and that such information is accumulated and communicated to our management, including our Chief Executive Officer and Chief Financial Officer, as appropriate, to allow timely discussions regarding required disclosure.
In designing and evaluating our disclosure controls and procedures, management recognizes that any disclosure controls and procedures, no matter how well designed and operated, can provide only reasonable assurance of achieving the desired control objectives. In addition, the design of disclosure controls and procedures must reflect the fact that there are resource constraints and that management is required to apply its judgment in evaluating the benefits of possible controls and procedures relative to their costs.
We, under the supervision of and with participation of our management, including our Chief Executive Officer and Chief Financial Officer, have evaluated the effectiveness of our disclosure controls and procedures. Based on that evaluation, our Chief Executive Officer and Chief Financial Officer concluded that the design and operation of our disclosure controls and procedures were effective as of December 31, 2023.
Management’s Annual Report on Internal Control Over Financial Reporting
Management of the Company is responsible for establishing and maintaining adequate internal control over financial reporting. The Company’s internal control over financial reporting is a process designed under the supervision of its principal executive and principal financial officer and effected by the Company’s board of directors, management and other personnel, to provide reasonable assurance regarding the reliability of financial reporting and the preparation of its consolidated financial statements for external reporting purposes in accordance with U.S. generally accepted accounting principles.
The Company’s internal control over financial reporting includes policies and procedures that pertain to the maintenance of records that, in reasonable detail, accurately and fairly reflect transactions and dispositions of the Company’s assets; provide reasonable assurance that transactions are recorded as necessary to permit preparation of consolidated financial statements in accordance with U.S. generally accepted accounting principles, and that receipts and expenditures of the Company are being made only in accordance with authorizations of management and the directors; and provide reasonable assurance regarding prevention or timely detection of unauthorized acquisition, use or disposition of the Company’s assets that could have a material effect on its consolidated financial statements.
Because of its inherent limitations, internal control over financial reporting may not prevent or detect misstatements. In addition, projections of any evaluation of effectiveness to future periods are subject to the risk that controls may become inadequate because of changes in conditions or that the degree of compliance with the policies or procedures may deteriorate.
We completed our acquisition of Angelo Gordon on November 1, 2023. Consistent with guidance issued by the SEC that an assessment of a recently acquired business may be omitted from management’s report on internal control over financial reporting in the year of acquisition, management elected to exclude an assessment of the effectiveness of the Company’s internal control over financial reporting related to TPG Angelo Gordon. Total assets and total revenues of TPG Angelo Gordon that were excluded from management’s assessment constitute 19.2% of the Company’s total assets and 9.8% of total revenues as of and for the year ended December 31, 2023.
Management conducted an assessment of the effectiveness of the Company’s internal control over financial reporting as of December 31, 2023 based on the framework established in Internal Control—Integrated Framework (2013) issued by the Committee of Sponsoring Organizations of the Treadway Commission. Based on this assessment,
management has determined that the Company’s internal control over financial reporting as of December 31, 2023 was effective.
Changes in Internal Control Over Financial Reporting
There has been no change in our internal control over financial reporting during the fiscal quarter ended December 31, 2023 that has materially affected, or is reasonably likely to materially affect, our internal control over financial reporting.
Attestation Report of the Independent Registered Public Accounting Firm
Deloitte & Touche LLP, our independent registered public accounting firm that audited the financial statements included in this Form 10-K, has issued its attestation report on our internal control over financial reporting as of December 31, 2023, which is included herein.
Item 9B. Other Information
(b) Our directors and officers (as defined in Exchange Act Rule 16a-1(f) of the Exchange Act) may from time to time enter into plans or other arrangements for the purchase or sale of our stock that are intended to satisfy the affirmative defense conditions of Rule 10b5–1(c) or may represent a non-Rule 10b5-1 trading arrangement under the Exchange Act. During the quarter ended December 31, 2023, Deborah Messemer, our independent director, adopted the following Rule 10b5-1 plan (the “Rule 10b5-1 Plan”):
| | | | | | | | | | | | | | | | | | | | |
| Name | Title | Type of Trading Arrangement | Security | Date of Action | Duration of Trading Arrangement | Aggregate Number of Securities Covered |
Deborah Messemer | Independent Director | Rule 10b5-1 | Class A common stock | November 17, 2023 | February 28, 2024 to July 31, 2024 | 10,479 shares of Class A common stock |
The Rule 10b5-1 Plan reported above was adopted during an authorized trading period and when the plan participant was not in possession of material non-public information. The Rule 10b5-1 Plan is subject to a number of conditions, including the price at which, and timing of when, sales may occur, and is subject to modification or termination in accordance with applicable law.
Item 9C. Disclosure Regarding Foreign Jurisdictions that Prevent Inspections
Not applicable.
Part III
Item 10. Directors, Executive Officers and Corporate Governance
Information about our directors and executive officers as well as corporate governance matters will be in our 2024 Proxy Statement, which is expected to be filed no later than 120 days after the end of our fiscal year ended December 31, 2023 under the captions “Corporate Governance,” “Election of Directors” and “Executive Officers” and is incorporated in this Form 10-K by reference.
Code of Conduct and Ethics
We have a code of conduct and ethics that applies to all of our directors, employees and officers. A copy of the code is available on our website located at www.tpg.com. Any amendments or waivers to our code for our principal executive officer, principal financial officer, principal accounting officer or controller, or persons performing similar functions, will be disclosed on our Internet website promptly following the date of such amendment or waiver, as and if required by applicable law.
Corporate Governance Guidelines
We have adopted corporate governance guidelines in accordance with the corporate governance rules of Nasdaq. These guidelines cover a number of areas, including director responsibilities, director elections and re-elections, composition of the board of directors, including director qualifications and diversity and board committees, executive sessions, director access to management and, as necessary and appropriate, independent advisors, director orientation and continuing education, board materials, management succession and evaluations of the board of directors and the board’s committees. A copy of our corporate governance guidelines is available on our website at www.tpg.com.
Item 11. Executive Compensation
Information relating to our executive officer and director compensation and the compensation committee of the board of directors will be in the 2024 Proxy Statement under the caption “Executive Compensation” and is incorporated in this Form 10-K by reference.
Item 12. Security Ownership of Certain Beneficial Owner and Management and Related Stockholder Matters
Information relating to securities authorized for issuance under equity compensation plans, security ownership of certain beneficial owners of our common stock and information relating to the security ownership of our management will be in the 2024 Proxy Statement under the caption “Security Ownership of Certain Beneficial Owners and Management” and is incorporated in this Form 10-K by reference.
Item 13. Certain Relationships and Related Transactions, and Director Independence
Information regarding certain relationships and related transactions and director independence will be in the 2024 Proxy Statement under the captions “Certain Relationships and Related Transactions” and “Controlled Company Status and Director Independence” and is incorporated in this Form 10-K by reference.
Item 14. Principal Accounting Fees and Services
Information regarding principal accounting fees and services will be in the 2024 Proxy Statement under the caption “Ratification of Deloitte & Touche LLP, the member firms of Deloitte Touche Tohmatsu and their respective affiliates (collectively, the “Deloitte Entities”) as our Independent Registered Public Accounting Firm for 2024” and is incorporated in this Form 10-K by reference.
Part IV
Item 15. Exhibits, Financial Statement Schedules
(a) The following documents are filed as part of this annual report.
1. Financial Statements:
See Item 8 above.
2. Financial Statement Schedules:
All schedules are omitted because they are not applicable or the required information is shown in the Consolidated Financial Statements or notes thereto.
3. Exhibits:
Exhibits are included below. | | | | | | | | |
| Exhibit No. | | Description |
| 2.1 | | Transaction Agreement, dated May 14, 2023, among TPG Inc., TPG Operating Group II, L.P., TPG GP A, LLC, Angelo, Gordon & Co., L.P., AG Funds, L.P., AG Partner Investments, L.P., Alabama Investments (Parallel) Founder A L.P., Alabama Investments (Parallel) Founder G L.P., Alabama Investments (Parallel), LP, AG GP, LLC and Michael Gordon 2011 Revocable Trust (incorporated by reference to Exhibit 2.1 to the Company’s Current Report on Form 8-K, filed on May 15, 2023). |
| 2.2 | | |
| 2.3 | | |
| 3.1 | | |
| 3.2 | | |
| 4.1* | | |
10.1* | | |
| 10.2 | | |
| 10.3 | | |
| 10.4 | | Indenture, dated as of May 9, 2018 and Amended as of October 1, 2019 between TPG Holdings I FinanceCo, L.P., TPG Holdings II FinanceCo, L.P., TPG Holdings III FinanceCo, L.P. and U.S. Bank National Association, as trustee (incorporated by reference to Exhibit 10.4 to the Company’s Registration Statement on Form S-1, filed on December 16, 2021). |
| 10.5 | | Sixth Amended and Restated Credit Agreement, dated as of September 26, 2023, among TPG Operating Group II, L.P., acting through its general partner, TPG Holdings II-A, LLC, the co-borrowers party thereto, the subsidiary borrowers from time to time party thereto, the lenders from time to time party thereto and Bank of America, N.A., as administrative agent (incorporated by reference to Exhibit 10.1 to the Company’s Current Report on Form 8-K, filed on September 27, 2023). |
| | | | | | | | |
| 10.6 | | Second Amended and Restated Credit Agreement, dated as of September 26, 2023, among TPG Operating Group II, L.P. as borrower, TPG Operating Group I, L.P., TPG Holdings II Sub, L.P., TPG Operating Group III, L.P., as guarantors, the lenders party thereto and Wells Fargo Bank, N.A., as administrative agent (incorporated by reference to Exhibit 10.2 to the Company’s Current Report on Form 8-K, filed on September 27, 2023). |
| 10.7 | | Reorganization Agreement, dated as of December 31, 2021, among TPG Holdings I, L.P., TPG Holdings II, L.P., TPG Holdings III, L.P., TPG Group Advisors (Cayman), Inc., TPG Group Advisors (Cayman), LLC, TPG Partner Holdings Advisors, Inc., TPG Group Holdings (SBS) Advisors, Inc., TPG Group Holdings (SBS) Advisors, LLC, David Bonderman, James G. Coulter, Jon Winkelried and TPG GP A, LLC (incorporated by reference to Exhibit 10.7 to the Company’s Annual Report on Form 10-K, filed on March 29, 2022). |
| 10.8 | | Amended and Restated Tax Receivable Agreement, dated November 1, 2023, among TPG Inc., TPG OpCo Holdings, L.P., TPG Operating Group II, L.P., TPG GP A, LLC, Alabama Investments (Parallel), LP, Alabama Investments (Parallel) Founder A, LP, Alabama Investments (Parallel) Founder G, LP and API Representative, LLC. (incorporated by reference to Exhibit 10.3 to the Company’s Current Report on Form 8-K, filed on November 2, 2023). |
| 10.9 | | Amended and Restated Exchange Agreement, dated November 1, 2023, among TPG Inc., TPG Operating Group I, L.P., TPG Operating Group II, L.P., TPG Operating Group III, L.P., TPG OpCo Holdings, L.P., Alabama Investments (Parallel) LP, Alabama Investments (Parallel) Founder A, LP, Alabama Investments (Parallel) Founder G, LP and API Representative, LLC.(incorporated by reference to Exhibit 10.2 to the Company’s Current Report on Form 8-K, filed on November 2, 2023). |
| 10.10 | | Amended and Restated Investor Rights Agreement, dated November 1, 2023, among TPG Inc., TPG GP A, LLC, Alabama Investments (Parallel) LP, Alabama Investments (Parallel) Founder A, LP, Alabama Investments (Parallel) Founder G, LP and API Representative, LLC. (incorporated by reference to Exhibit 10.1 to the Company’s Current Report on Form 8-K, filed on November 2, 2023). |
| 10.11 | | |
| 10.12 | | Performance Earnings Agreement, dated as of December 31, 2021, among Tarrant Remain Co I, L.P., Tarrant Remain Co II, L.P., Tarrant Remain Co III, L.P., TPG Holdings I, L.P., TPG Holdings II, L.P., TPG Holdings III, L.P. and TPG Partners, LLC (incorporated by reference to Exhibit 10.12 to the Company’s Annual Report on Form 10-K, filed on March 29, 2022). |
| 10.13 | | Master Contribution Agreement, dated as of December 31, 2021, among TPG Holdings I, L.P., TPG Holdings II, L.P., TPG Holdings III, L.P., Tarrant Remain Co I, L.P., Tarrant Remain Co II, L.P., Tarrant Remain Co III, L.P. and each of the other persons party thereto (incorporated by reference to Exhibit 10.13 to the Company’s Annual Report on Form 10-K, filed on March 29, 2022). |
| 10.14 | | |
10.15† | | Employment Agreement, dated as of December 15, 2021, among TPG Global, LLC, TPG Holdings, L.P., TPG Partner Holdings, L.P., TPG Group Advisors (Cayman), Inc. and Jon Winkelried (incorporated by reference to Exhibit 10.15 to the Company’s Annual Report on Form 10-K, filed on March 29, 2022). |
10.16† | | Employment Agreement, dated as of December 15, 2021, among TPG Global, LLC, TPG Holdings, L.P., TPG Partner Holdings, L.P., TPG Group Advisors (Cayman), Inc., TPG Partners, LLC and James G. Coulter (incorporated by reference to Exhibit 10.16 to the Company’s Annual Report on Form 10-K, filed on March 29, 2022). |
10.17† | | Letter Agreement, dated as of December 15, 2021, among TPG Global, LLC, TPG Holdings, L.P., TPG Partner Holdings, L.P., TPG Group Advisors (Cayman), Inc., TPG Partners, LLC and David Bonderman (incorporated by reference to Exhibit 10.17 to the Company’s Annual Report on Form 10-K, filed on March 29, 2022). |
10.18† | | |
10.19† | | |
10.20† | | |
| | | | | | | | |
10.21† | | |
10.22*† | | |
10.23† | | |
10.24*† | | |
10.25*† | | |
10.26*† | | |
10.27*† | | |
10.28*† | | Partner Acknowledgment and Joinder Agreement, dated as of May 14, 2023, among Josh Baumgarten, TPG Operating Group II, L.P., AG Partner Investments, L.P., Alabama Investments (Parallel), LP, AG GP, LLC and Angelo, Gordon & Co., L.P. |
10.29† | | |
10.30† | | |
| 10.31 | | Founder Exchange Agreement, dated as of January 12, 2022, among David Bonderman, James G. Coulter, BondCo, Inc., CoulCo, Inc., TPG Holdings II Sub, L.P., TPG GP Advisors, Inc., TPG PEP GenPar Advisors, Inc., TPG GP A, LLC, New TPG GP Advisors, Inc., TPG Group Holdings (SBS) Advisors, Inc., TPG Partner Holdings Advisors, Inc. and TPG Inc. (incorporated by reference to Exhibit 10.28 to the Company’s Annual Report on Form 10-K, filed on March 29, 2022). |
| 10.32 | | Founder Net Settlement Agreement, dated as of December 31 2021, among David Bonderman, James G. Coulter, TPG Europe, LLC, TPG Europe II, LLC, BondCo, Inc., CoulCo, Inc., TPG Holdings II Sub, L.P., TPG Global Advisors, LLC, TPG Global, LLC, TPG International, LLC and Tarrant Capital, LLC (incorporated by reference to Exhibit 10.29 to the Company’s Annual Report on Form 10-K, filed on March 29, 2022). |
10.33† | | |
| 21.1* | | |
| 23.1* | | |
| 31.1* | | |
| 31.2* | | |
| 32.1* | | |
| 32.2* | | |
| 97.1*† | | |
| 101.INS* | | Inline XBRL Instance Document – the instance document does not appear in the Interactive Data File because its XBRL tags are embedded within the Inline XBRL document. |
| 101.SCH* | | Inline XBRL Taxonomy Extension Schema Document |
| 101.CAL* | | Inline XBRL Taxonomy Extension Calculation Linkbase Document |
| 101.DEF* | | Inline XBRL Taxonomy Extension Definition Linkbase Document |
| 101.LAB* | | Inline XBRL Taxonomy Extension Label Linkbase Document |
| 101.PRE* | | Inline XBRL Taxonomy Extension Presentation Linkbase Document |
| 104* | | Cover Page Interactive Data File (embedded within the Inline XBRL document). |
________________
* Filed herewith
† Management compensatory plan or arrangement
Item 16. Form 10-K Summary
Not applicable.
Signatures
Pursuant to the requirements of Section 13 or 15(d) of the Securities Exchange Act of 1934, the Registrant has duly caused this report to be signed on its behalf by the undersigned, thereunto duly authorized.
| | | | | | | | | | | | | | |
| | | | |
Date: February 23, 2024 | | By: /s/ Jon Winkelried |
| | | Name: Jon Winkelried |
| | | Title: Chief Executive Officer and Director |
Pursuant to the requirements of the Securities Exchange Act of 1934, this report has been signed below by the following persons on behalf of the registrant and in the capacities and on the dates indicated.
| | | | | | | | |
| |
Signature | Title | Date |
| | |
/s/ David Bonderman David Bonderman | Founding Partner, Non-Executive Chairman and Director | February 23, 2024 |
| | |
/s/ James G. Coulter James G. Coulter | Founding Partner, Executive Chairman and Director | February 23, 2024 |
| | |
/s/ Jon Winkelried Jon Winkelried | Chief Executive Officer and Director (Principal Executive Officer) | February 23, 2024 |
| | |
/s/ Jack Weingart Jack Weingart | Chief Financial Officer and Director (Principal Financial Officer) | February 23, 2024 |
| | |
/s/ Martin Davidson Martin Davidson | Chief Accounting Officer (Principal Accounting Officer) | February 23, 2024 |
| | |
/s/ Todd Sisitsky Todd Sisitsky | Director | February 23, 2024 |
| | |
/s/ Anilu Vazquez-Ubarri Anilu Vazquez-Ubarri | Director | February 23, 2024 |
| | |
/s/ Josh Baumgarten Josh Baumgarten | Director | February 23, 2024 |
/s/ Maya Chorengel Maya Chorengel | Director | February 23, 2024 |
| | |
/s/ Jonathan Coslet Jonathan Coslet | Director | February 23, 2024 |
| | |
/s/ Kelvin Davis Kelvin Davis | Director | February 23, 2024 |
| | |
/s/ Nehal Raj Nehal Raj | Director | February 23, 2024 |
| | |
/s/ Jeffrey Rhodes Jeffrey Rhodes | Director | February 23, 2024 |
| | |
/s/ Ganen Sarvanathan Ganen Sarvanathan | Director | February 23, 2024 |
| | |
/s/ David Trujillo David Trujillo | Director | February 23, 2024 |
| | |
/s/ Gunther Bright Gunther Bright | Director | February 23, 2024 |
| | |
/s/ Mary Cranston Mary Cranston | Director | February 23, 2024 |
| | |
/s/ Deborah M. Messemer Deborah M. Messemer | Director | February 23, 2024 |