Exhibit 99.1

Wallbox Announces Fourth Quarter and Full Year 2022 Financial Results
BARCELONA, SPAIN—March 1, 2023—Wallbox N.V. (NYSE:WBX), a leading provider of electric vehicle (EV) charging and energy management solutions worldwide, today announced its financial results for the fourth quarter and full year ended December 31, 2022 and provided a business update.
Full Year 2022 Highlights:
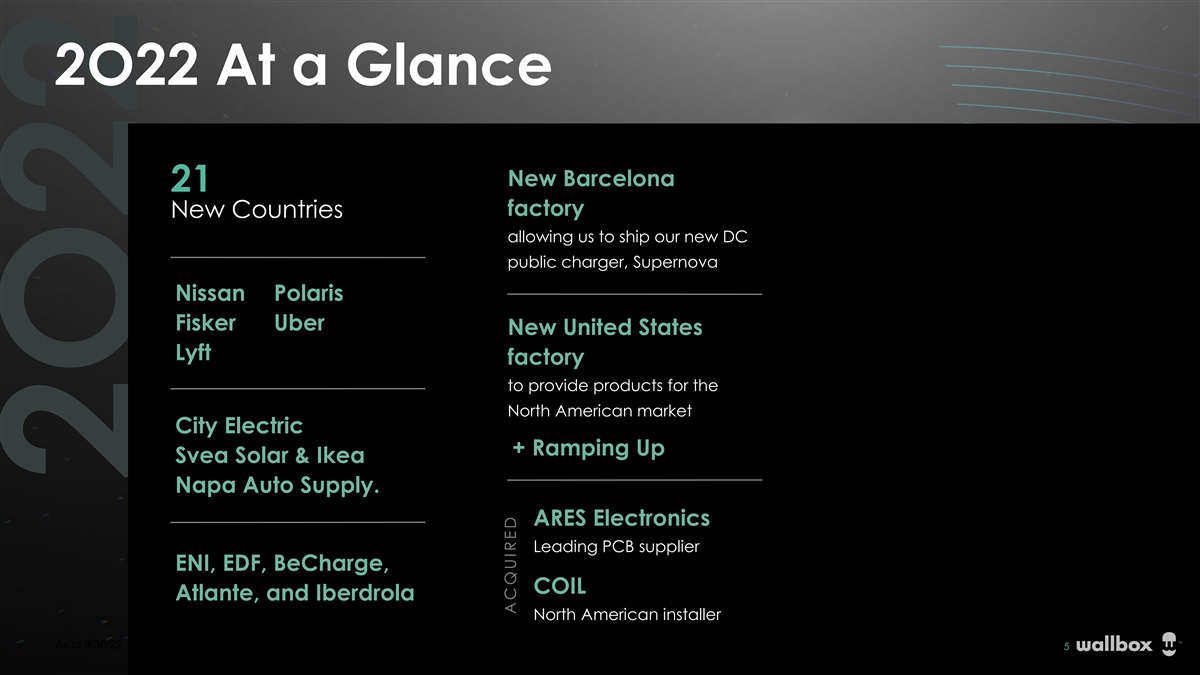
| • | Opened two new state of the art factories, one in Arlington, Texas, the other in Barcelona, Spain |
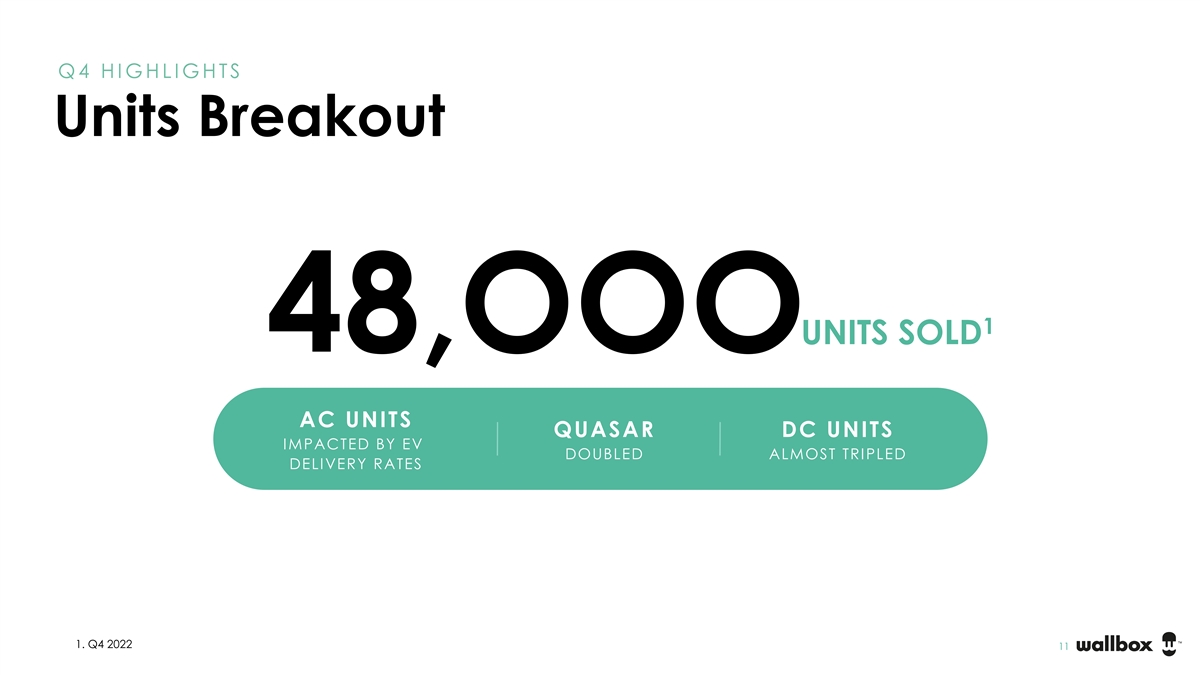
| • | Sold more than 230,000 chargers worldwide |
| • | Acquired two attractive companies, ARES Electronics and Coil, Inc. |
| • | Launched Supernova, a new public DC fast charger |
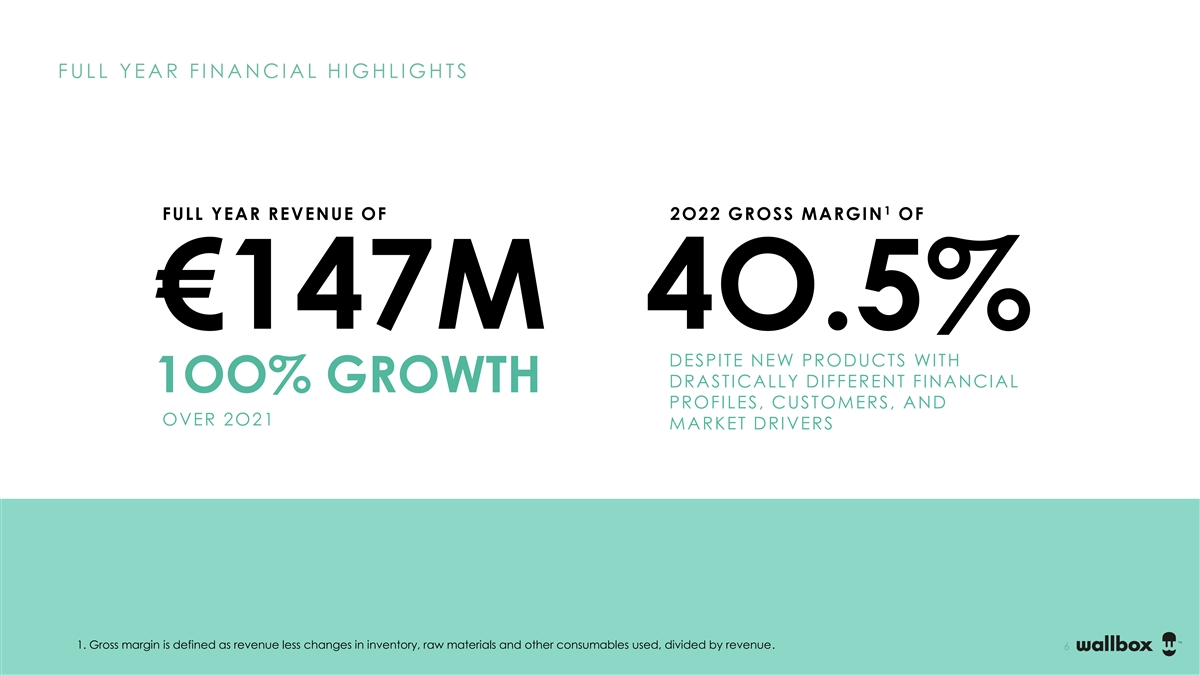
| • | Generated record revenues of €147 million, an increase of more than 100% compared to 2022, and achieved gross margins1 of 40.5% |
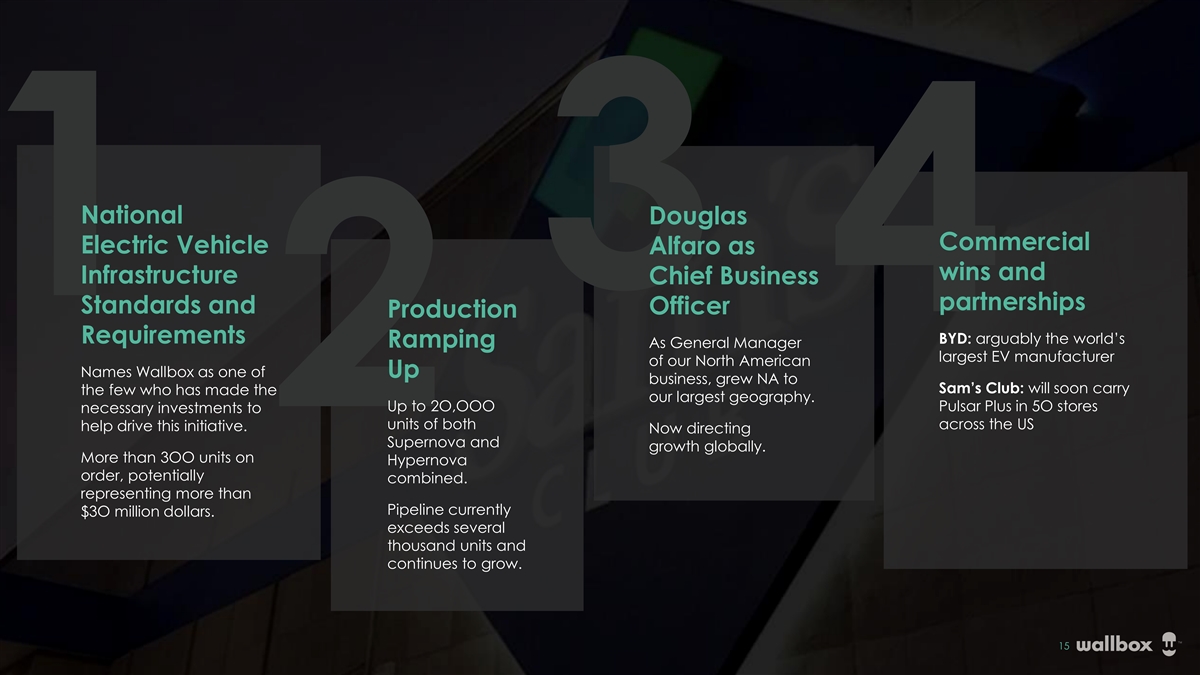
| • | Announced strategic partnerships with, among others, Nissan, Fisker, Uber, BestBuy, and Lyft to provide chargers and installation services to their customers. |
Fourth Quarter 2022 Highlights:
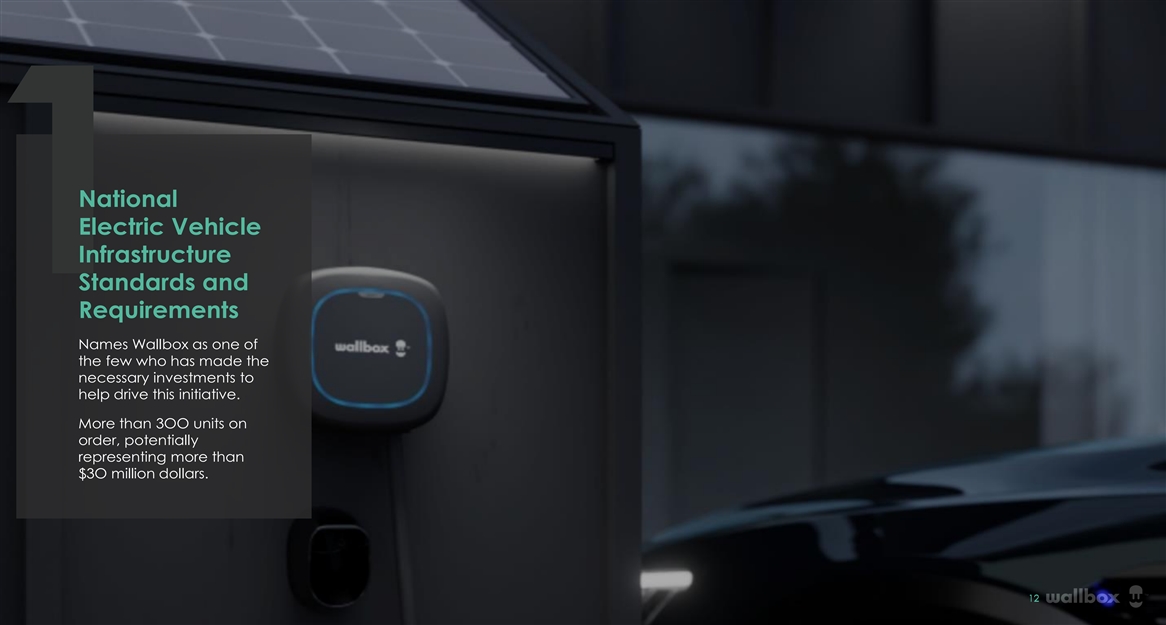
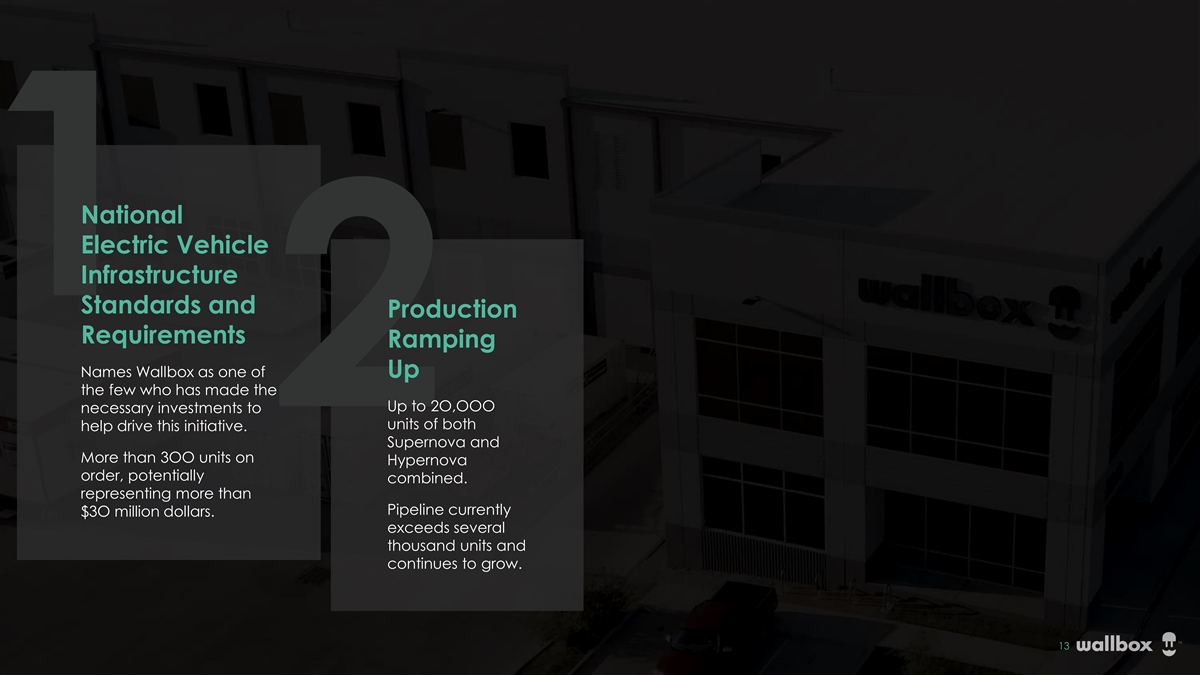
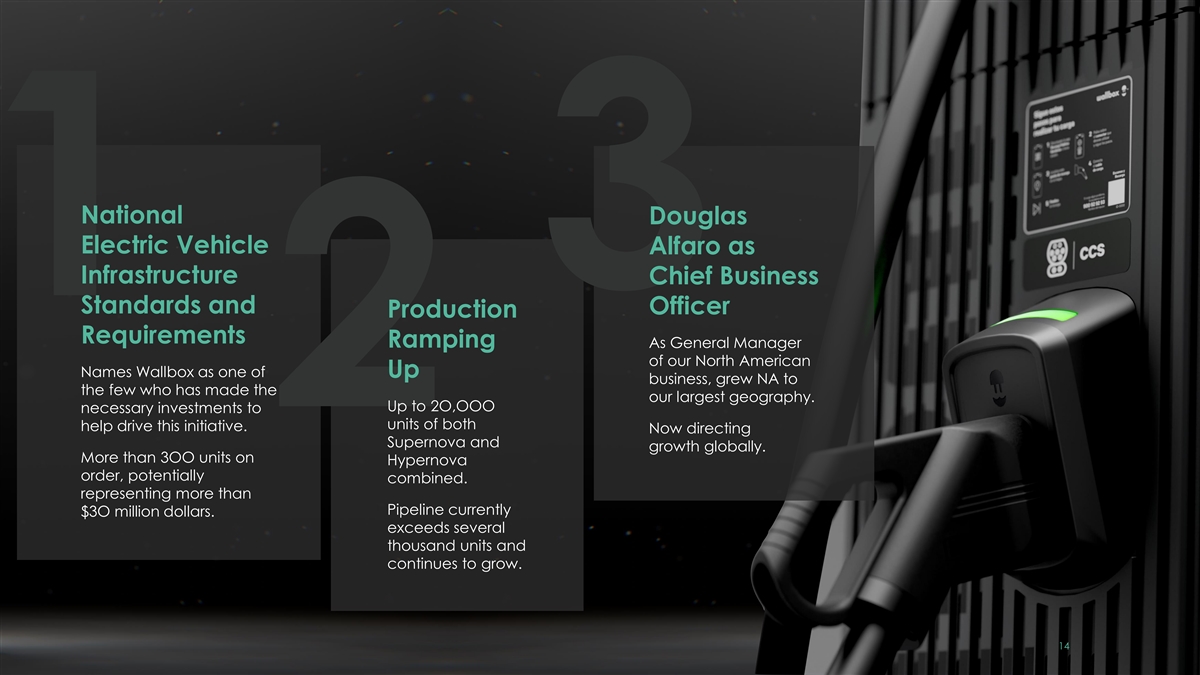
| • | Secured letters of intent totaling nearly $30 million for Hypernova, the company’s 400kW DC fast charging station designed to satisfy current U.S. government subsidy requirements. |
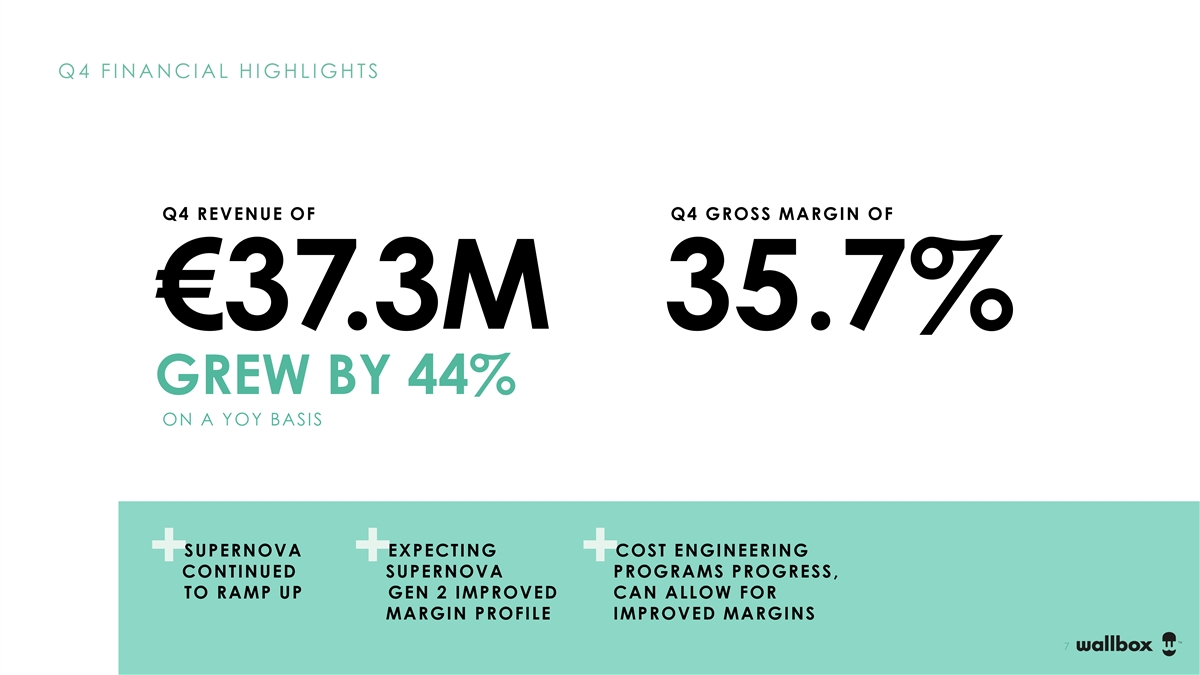
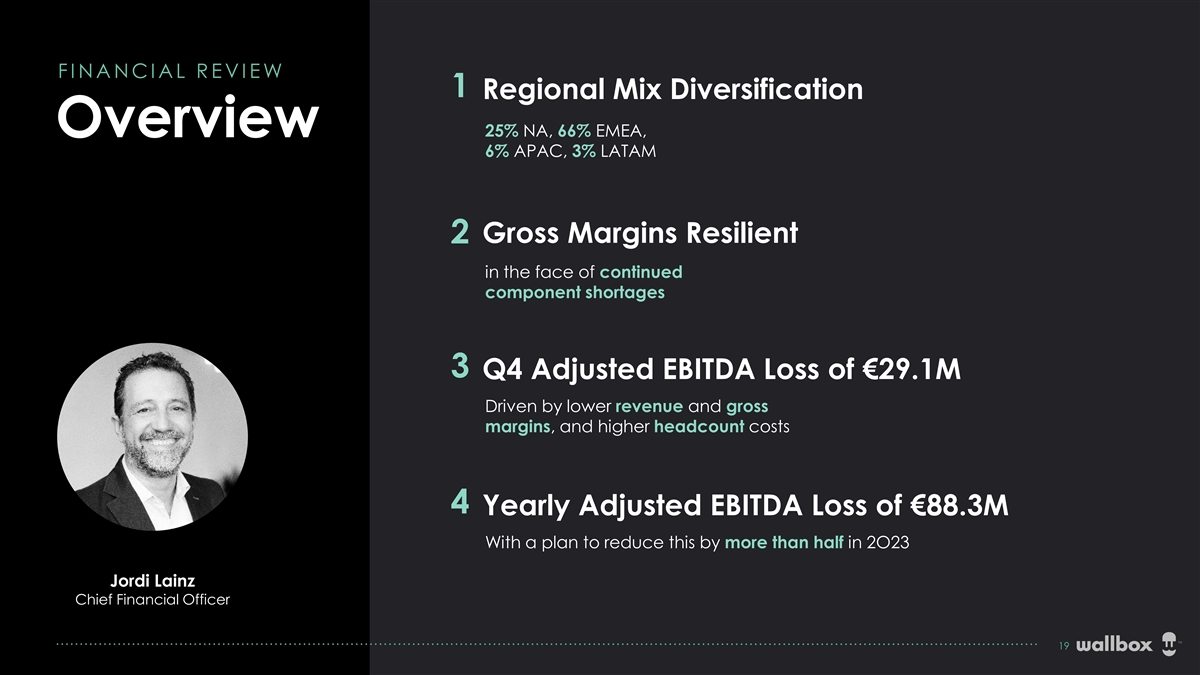
| • | Generated revenues of €37.3 million, an increase of 44% compared to the fourth quarter of 2021 and again exceeding the global EV market growth |
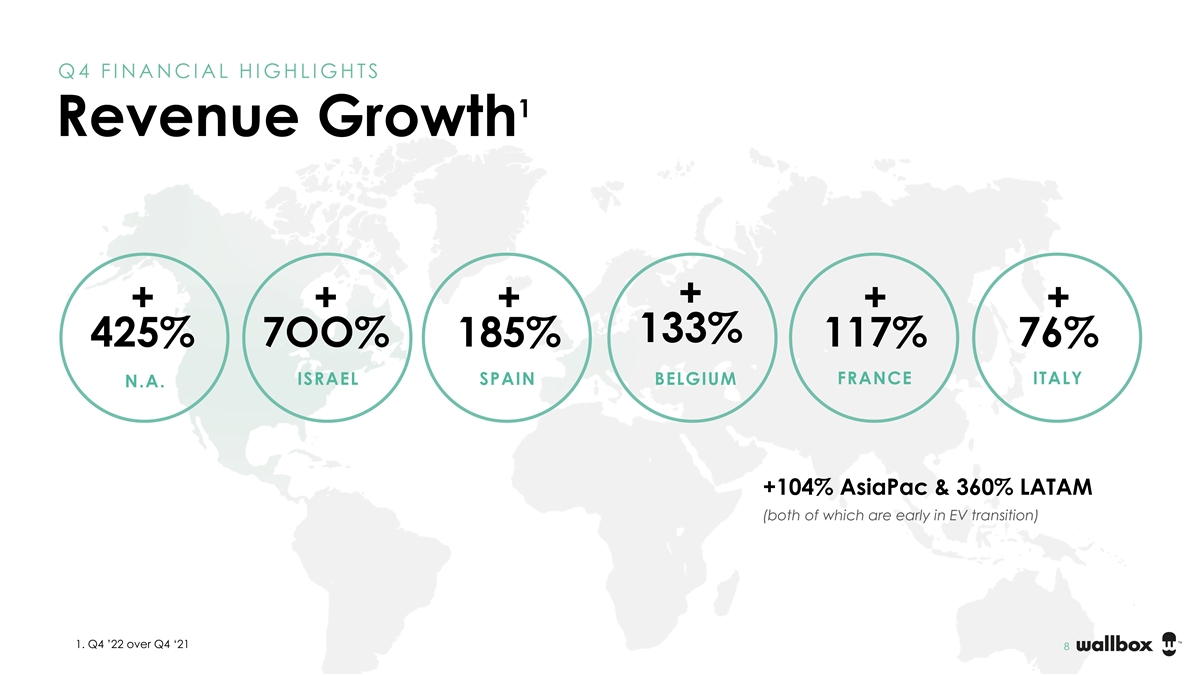
| • | Delivered exceptional revenue growth of 425% in North America |
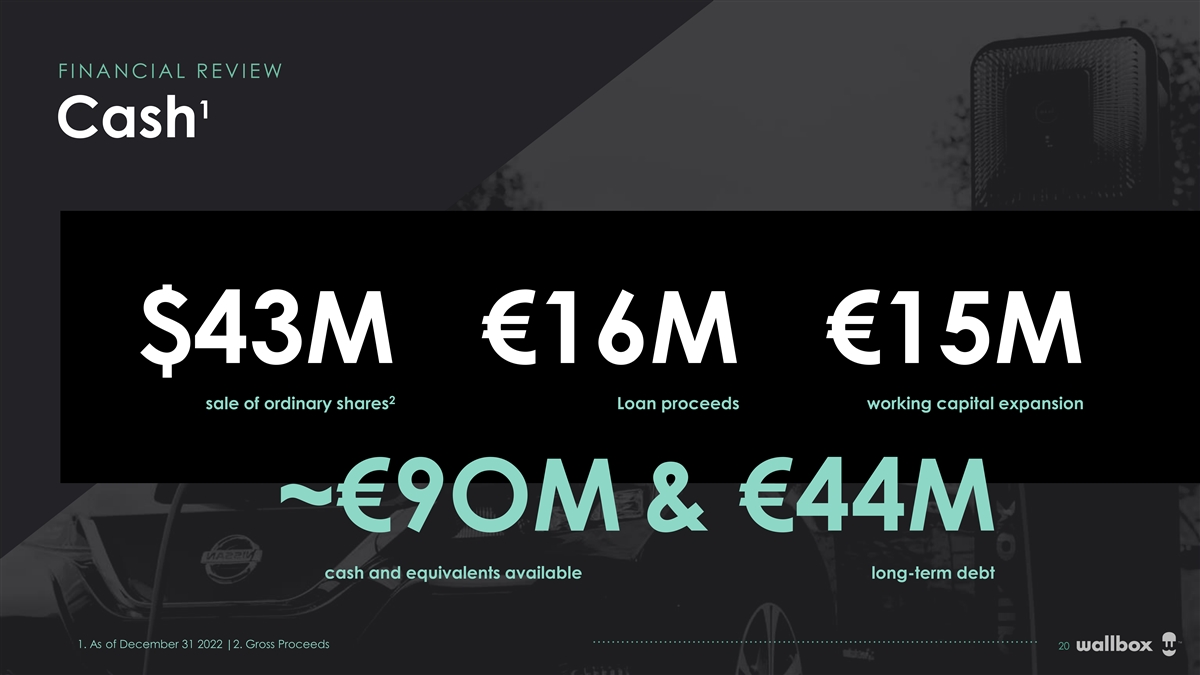
| • | Raised €43.5 million through the sale of common shares to private investors including company management, board members, and strategic partners. |
Executive Commentary
Enric Asuncion, CEO of Wallbox, said, “2022 was an eventful year for us, doubling the size of our business, opening two new factories, completing several acquisitions, launching new products, and forging exciting new partnerships. However, EV deliveries in Europe were challenged by multiple factors, including disruptive economic and geopolitical events. And while our results came in slightly shy of the expected range, consistently growing our business in excess of the market is a testament to the strength of our portfolio and operations.”
| 1 | Gross margin is defined as revenue less changes in inventory, raw materials and other consumables used divided by revenues. |
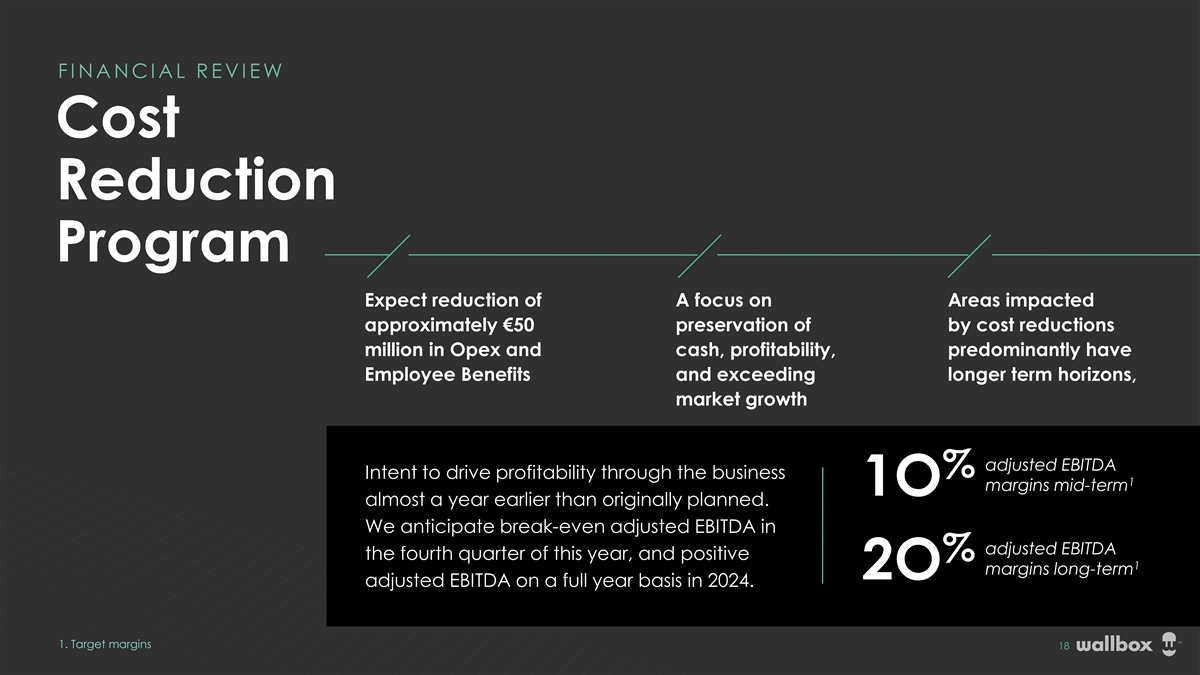
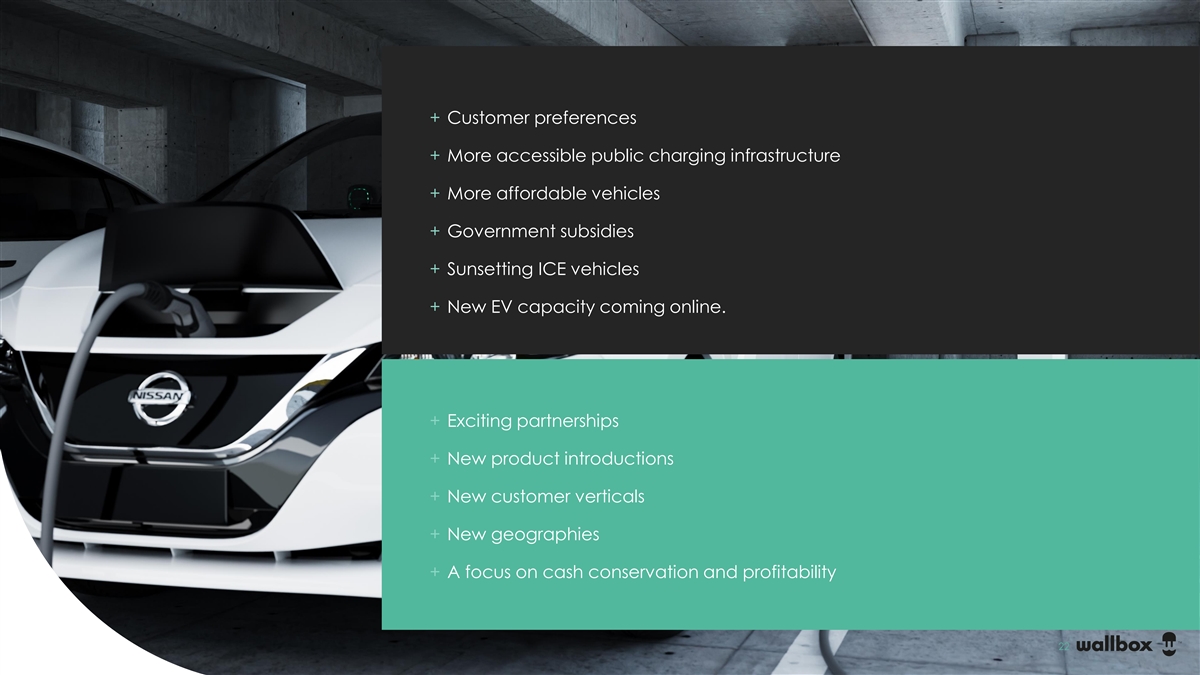
Mr. Asuncion continued, “Looking forward, the business environment in the near-term remains complex, and industry sources have once again revised European EV forecasts down for 2023, but we remain constructive on the underlying fundamentals of the market and our competitive position. To ensure we are best positioned for the massive wave of charging infrastructure needed in the future, we are focused on optimizing our business today, conserving cash, and achieving profitability so that we are able to offer customers best in class solutions, while creating value for shareholders.”
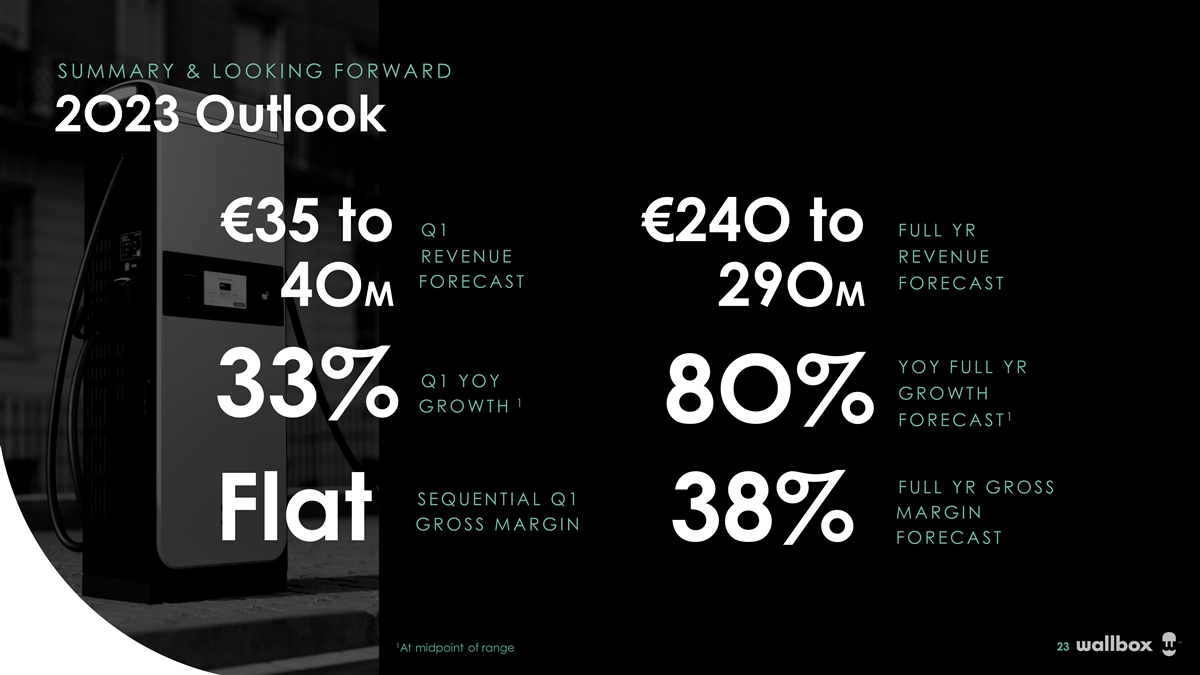
Financial Outlook
The following reflects the company’s expectations for select key financial metrics for the first quarter and full year 2023.
First Quarter 2023
| • | Expect first quarter 2023 revenue between €35 million and €40 million, representing an approximate quarterly year-over-year growth rate between 25% and 45% |
| • | Expect gross margin flat sequentially |
Full year 2023
| • | Expect full-year 2023 revenue between €240 million and €290 million, representing an approximate annual year-over-year growth rate between 60% and 100% |
| • | Expect gross margin of approximately 38% |
Conference Call Information
Wallbox NV will host a conference call to discuss the results and provide a business update at 8:00 AM Eastern Time today, March 1, 2022. The live audio webcast and accompanying presentation, will be accessible on Wallbox’s Investor Relations website at https://investors.wallbox.com/overview/default.aspx. A recording of the webcast will also be available following the conference call.
Fourth Quarter 2022 Unaudited Financial Results
Wallbox N.V.
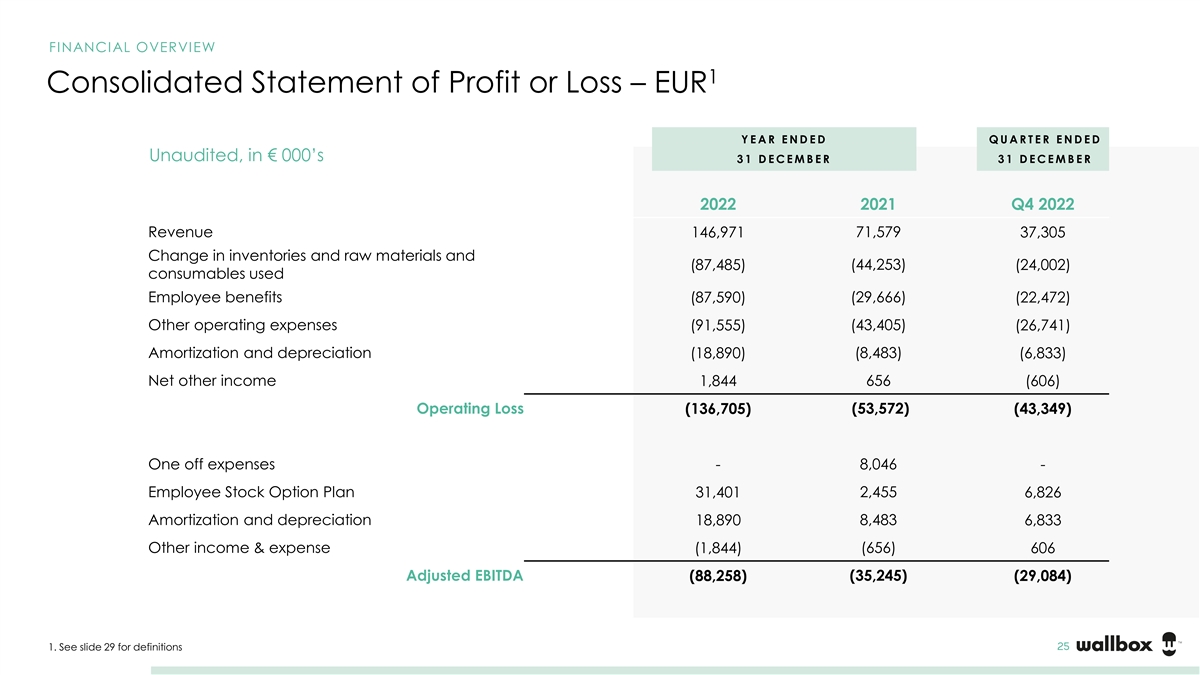
Abbreviated Income Statement – EUR
| Consolidated Statements of Profit or Loss Data | ||||||||||||
| (In thousand Euros) | ||||||||||||
| Year Ended December 31 |
Quarter Ended December 31 |
|||||||||||
| 2022 | 2021 | Q4 2022 | ||||||||||
| Revenue |
146,971 | 71,579 | 37,305 | |||||||||
| Changes in inventories and raw materials and consumables used |
(87,485 | ) | (44,253 | ) | (24,002 | ) | ||||||
| Employee benefits |
(87,590 | ) | (29,666 | ) | (22,472 | ) | ||||||
| Other operating expenses |
(91,555 | ) | (43,405 | ) | (26,741 | ) | ||||||
| Amortization and depreciation |
(18,890 | ) | (8,483 | ) | (6,833 | ) | ||||||
| Net other income |
1,844 | 656 | (606 | ) | ||||||||
|
|
|
|
|
|
|
|||||||
| Operating Loss |
(136,705 | ) | (53,572 | ) | (43,349 | ) | ||||||
| One off expenses |
— | 8,046 | — | |||||||||
| Employee Stock Options Plan |
31,401 | 2,455 | 6,826 | |||||||||
| Amortization and depreciation |
18,890 | 8,483 | 6,833 | |||||||||
| Other income |
(1,844 | ) | (656 | ) | 606 | |||||||
|
|
|
|
|
|
|
|||||||
| Adjusted EBITDA |
(88,258 | ) | (35,245 | ) | (29,084 | ) | ||||||
Adjusted EBITDA is defined as loss for the year before depreciation and amortization, income tax credits, and financial income and interest expense further adjusted to take account of the impact of certain non-cash and other items that we do not consider in our evaluation of ongoing operating performance. These non-cash and other items include, but not are limited to; change in fair value of convertible bonds and derivative warrants, share listing expenses, foreign exchange gains and losses, share based payments expense and other one-off expenses/income related to special operations.
Wallbox N.V.
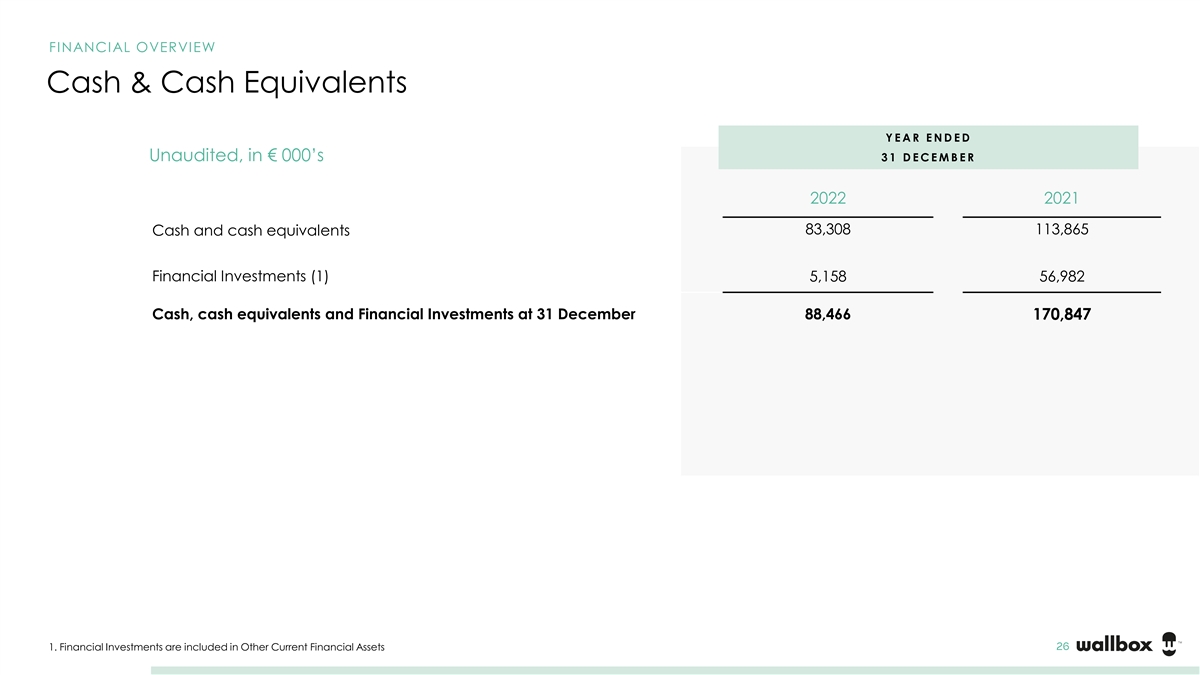
Cash & Cash Equivalents – EUR
| Cash and Cash Equivalents | ||||||||
| (In thousand Euros) | ||||||||
| Year Ended December 31 | ||||||||
| 2022 | 2021 | |||||||
| Cash and cash equivalents |
83,308 | 113,865 | ||||||
| Financial Investments (1) |
5,158 | 56,982 | ||||||
|
|
|
|
|
|||||
| Cash, cash equivalents and Financial Investments at 31 December |
88,466 | 170,847 | ||||||
| (1) | Financial Investments are included in Other current financial assets |
Wallbox N.V.
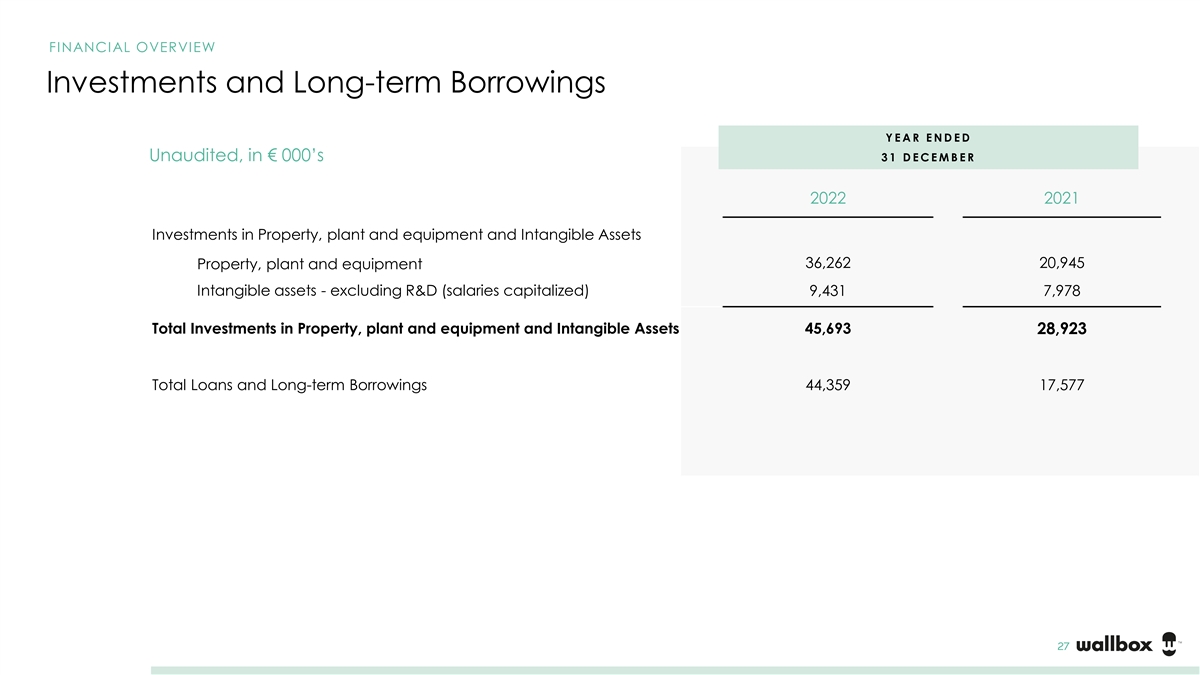
Investments in PP&E and Long-term Borrowings - EUR
| Investments and Long-term Borrowings | ||||||||
| (In thousand Euros) | Year Ended December 31 | |||||||
| 2022 | 2021 | |||||||
| Investments in Property, plant and equipment and Intangible Assets |
||||||||
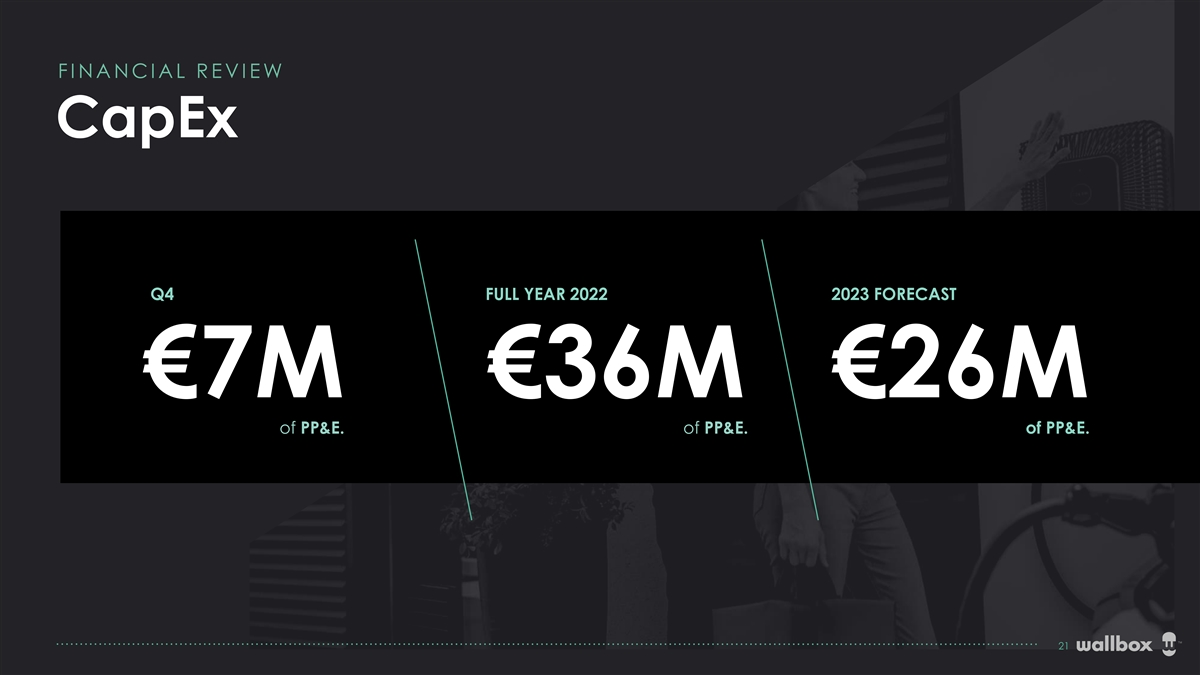
| Property, plant and equipment |
36,262 | 20,945 | ||||||
| Intangible assets - excluding R&D (salaries capitalized) |
9,431 | 7,978 | ||||||
|
|
|
|
|
|||||
| Total Investments in Property, plant and equipment and Intangible Assets |
45,693 | 28,923 | ||||||
| Total Loans and borrowings long term |
44,359 | 17,577 | ||||||
Wallbox Forward Looking Statements
This press release contains forward-looking statements within the meaning of the Private Securities Litigation Reform Act of 1995. We intend such forward-looking statements to be covered by the safe harbor provisions for forward-looking statements contained in Section 27A of the Securities Act of 1933, as amended (the “Securities Act”) and Section 21E of the Securities Exchange Act of 1934, as amended (the “Exchange Act”). All statements contained in this press release other than statements of historical fact should be considered forward-looking statements, including, without limitation, statements regarding Wallbox’s future operating results and financial position, business strategy and plans, market growth and objectives for future operations. The words “anticipate,” “believe,” “can,” “continue,” “could,” “estimate,” “expect,” “forecast,” “intend,” “may,” “might,” “plan,” “possible,” “potential,” “predict,” “project,” “should,” “”target,” will,” “would” and similar expressions are intended to identify forward-looking statements, though not all forward-looking statements use these words or expressions. These statements are neither promises nor guarantees, but involve known and unknown risks, uncertainties and other important factors that may cause our actual results, performance or achievements to be materially different from any future results, performance or achievements expressed or implied by the forward-looking statements, including, but not limited to: Wallbox’s history of operating losses as an early stage company; the adoption and demand for electric vehicles including the success of alternative fuels, changes to rebates, tax credits and the impact of government incentives; Wallbox’s ability to successfully manage its growth; the accuracy of Wallbox’s forecasts and projections including those regarding its market opportunity; competition; risks related to health pandemics including those of COVID-19; losses or disruptions in Wallbox’s supply or manufacturing partners; impacts resulting from the conflict between Russia and Ukraine; risks related to macro-economic conditions and inflation; Wallbox’s reliance on the third-parties outside of its control; risks related to Wallbox’s technology, intellectual property and infrastructure; as well as the other important factors discussed under the caption “Risk Factors’’ in Wallbox’s Post-Effective Amendment No. 3 to Wallbox’s Registration Statement on Form F-1 (File No. 333-260652) filed on September 28, 2022 and Wallbox’s Registration Statement on Form F-3 (File No. 333-268792) filed on December 14, 2022, as such factors may be updated from time to time in its other filings with the Securities and Exchange Commission (the “SEC”), accessible on the SEC’s website at www.sec.gov and the Investors Relations section of Wallbox’s website at investors.wallbox.com. Any such forward-looking statements represent management’s estimates as of the date of this press release. Any forward-looking statement that Wallbox makes in this press release speaks only as of the date of such statement. Except as required by law, Wallbox disclaims any obligation to update or revise, or to publicly announce any update or revision to, any of the forward-looking statements, whether as a result of new information, future events or otherwise.
Non-IFRS Financial Measures
Wallbox reports its financial information required in accordance with IFRS. This release includes financial measures not based on IFRS, including Adjusted EBITDA (the “Non-IFRS Measures”).
Wallbox defines Adjusted EBITDA as net income (loss) before depreciation and amortization, provision (benefit) for income taxes and interest expense adjusted to take account of the impact of certain non-cash and other items that we do not consider in our evaluation of our ongoing operating performance. These non-cash and other items include, but not are limited to: change in fair value of convertible bonds and derivative warrants, share listing expenses, foreign exchange gains/(losses), share based payment expenses, costs relating to the business combination, other items outside the scope of our ordinary activities and share of profit of equity-accounted investees. Management uses these Non-IFRS Measures as measurements of operating performance because they assist management in comparing the Company’s operating performance on a consistent basis, as they remove the impact of items not directly resulting from the Company’s core operations; for planning purposes, including the preparation of management’s internal annual operating budget and financial projections; to evaluate the performance and effectiveness of our strategic initiatives; and to evaluate the Company’s capacity to fund capital expenditures and expand its business.
The Non-IFRS Measures may not be comparable to similar measures disclosed by other companies, because not all companies and analysts calculate these measures in the same manner. We present the Non-IFRS Measures because we consider them to be important supplemental measures of our performance, and we believe they are frequently used by securities analysts, investors and other interested parties in the evaluation of companies. Management believes that investors’ understanding of our performance is enhanced by including the Non-IFRS Measures as a reasonable basis for comparing our ongoing results of operations. By providing the Non-IFRS Measures, together with reconciliations to IFRS, we believe we are enhancing investors’ understanding of our business and our results of operations, as well as assisting investors in evaluating how well we are executing our strategic initiatives.
Items excluded from the Non-IFRS Measures are significant components in understanding and assessing financial performance. The Non-IFRS Measures have limitations as analytical tools and should not be considered in isolation, or as an alternative to, or a substitute for loss for the year, revenue or other financial statement data presented in our consolidated financial statements as indicators of financial performance. Some of the limitations are: such measures do not reflect revenue related to fulfillment, which is necessary to the operation of our business; such measures do not reflect our expenditures, or future requirements for capital expenditures or contractual commitments; such measures do not reflect changes in our working capital needs; such measures do not reflect our share based payments, income tax benefit/(expense) or the amounts necessary to pay our taxes; although depreciation and amortization are not included in the calculation of Adjusted EBITDA, the assets being depreciated and amortized will often have to be replaced in the future and such measures do not reflect any costs for such replacements; and other companies may calculate such measures differently than we do, limiting their usefulness as comparative measures.
Due to these limitations, Adjusted EBITDA should not be considered as a measure of discretionary cash available to us to invest in the growth of our business and are in addition to, not a substitute for or superior to, measures of financial performance prepared in accordance with IFRS. In addition, the Non-IFRS Measures we use may differ from the non-IFRS financial measures used by other companies and are not intended to be considered in isolation or as a substitute for the financial information prepared and presented in accordance with IFRS. Furthermore, not all companies or analysts may calculate similarly titled measures in the same manner. We compensate for these limitations by relying primarily on our IFRS results and using the Non-IFRS Measures only as supplemental measures.
A reconciliation of the Company’s Adjusted EBITDA guidance to the most directly comparable IFRS financial measure cannot be provided without unreasonable efforts and is not provided herein because of the inherent difficulty in forecasting and quantifying certain amounts that are necessary for such reconciliations, including adjustments that are made for future changes in the fair value of cash-settled share-based payment liabilities; foreign exchange gains/(losses) and the other adjustments reflected in our reconciliation of historical non-IFRS financial measures, the amounts of which, could be material.
About Wallbox
Wallbox is a global technology company, dedicated to changing the way the world uses energy. Wallbox creates advanced electric vehicle charging and energy management systems that redefine users’ relationship to the grid. Wallbox goes beyond electric vehicle charging to give users the power to control their consumption, save money, and live more sustainably. Wallbox offers a complete portfolio of charging and energy management solutions for residential, semi-public and public use in more than 113 countries around the world. Founded in 2015 and headquartered in Barcelona, the company now employs more than 1,250 people in its offices in Europe, Asia, and the Americas. For additional information, please visit www.wallbox.com.
| Wallbox Public Relations Contact: | Wallbox Investor Contact: | |
| Elyce Behrsin | Matt Tractenberg | |
| Public Relations | VP, Investor Relations | |
| Press@wallbox.com | Matt.Tractenberg@wallbox.com | |
| +34 622 513 358 | +1 404-574-1504 |
Source: Wallbox NV