UNITED STATES
SECURITIES AND EXCHANGE COMMISSION
WASHINGTON, D.C. 20549
FORM
(Amendment No. 1)
CURRENT REPORT
Pursuant to Section 13 or 15(d)
of the Securities Exchange Act of 1934
Date of report (Date of earliest event reported):
(Exact name of registrant as specified in its charter)
(State or other jurisdiction of incorporation) |
(Commission File Number) |
(I.R.S. Employer Identification Number) |
(Address of principal executive offices)
+
(Registrant’s telephone number, including area code)
Not Applicable
(Former name or former address, if changed since last report)
Check the appropriate box below if the Form 8-K filing is intended to simultaneously satisfy the filing obligations of the registrant under any of the following provisions.
Written communications pursuant to Rule 425 under the Securities Act (17 CFR 230.425) |
Soliciting material pursuant to Rule 14a-12 under the Exchange Act (17 CFR 240.14a-12) |
Pre-commencement communications pursuant to Rule 14d-2(b) under the Exchange Act (17 CFR 240.14d-2(b)) |
Pre-commencement communications pursuant to Rule 13e-4(c) under the Exchange Act (17 CFR 240.13e-4(c)) |
Securities registered pursuant to Section 12(b) of the Act:
Title of Each Class |
Trading |
Name of Each Exchange on Which Registered | ||
Indicate by check mark whether the registrant is an emerging growth company as defined in Rule 405 of the Securities Act of 1933 (§230.405 of this chapter) or Rule 12b-2 of the Securities Exchange Act of 1934 (§240.12b-2 of this chapter).
Emerging growth company
If an emerging growth company, indicate by check mark if the registrant has elected not to use the extended transition period for complying with any new or revised financial accounting standards provided pursuant to Section 13(a) of the Exchange Act.
EXPLANATORY NOTE
This Amendment No. 1 to AERWINS Technologies Inc.’s (the “Company”) Current Report on Form 8-K (the “Original Report”) originally filed by the Company with the U.S. Securities and Exchange Commission on February 9, 2023, is being filed solely for the purpose of amending the financial statements provided under Items 9.01(a) and 9.01(b) in the Original Report to include the audited consolidated financial statements of AERWINS, Inc. (formerly named AERWINS Technologies Inc. (which was its name on 12/31/2022) until it changed its name to AERWINS, Inc. on January 24, 2023 and referred to herein as “Legacy AERWINS”) as of December 31, 2022 and 2021 and the related Management’s Discussion and Analysis of Financial Condition and Results of Operations of Legacy AERWINS for the year ended December 31, 2022 as well as including the Unaudited Pro Forma Financial Statements as of December 31, 2022. This Amendment No. 1 does not amend any other item of the Original Report or purport to provide an update or a discussion of any developments at the Company subsequent to the filing date of the Original Report. Capitalized terms used but not defined herein have the meanings assigned to them in the Original Report.
Item 9.01. | Financial Statement and Exhibits. |
(a) Financial statements of businesses acquired.
The audited financial statements of Legacy AERWINS for the years ended December 31, 2021 and 2020, together with the notes thereto, are included in the Proxy Statement/Prospectus filed with the SEC on January 13, 2023 beginning on page F-51, are incorporated herein by reference. The unaudited financial statements of Legacy AERWINS for the nine months ended September 30, 2022, together with the notes thereto, included in the Proxy Statement/Prospectus filed with the SEC on January 13, 2023 beginning on page F-77, are incorporated herein by reference.
The audited financial statements of Legacy AERWINS for the years ended December 31, 2022 and 2021, together with the notes thereto, are filed as Exhibit 99.3 to this Current Report on Form 8-K and incorporated herein by reference. The Management’s Discussion and Analysis and Results of Operations for Legacy AERWINS as of December 31, 2022, is filed as Exhibit 99.4 to this Current Report on Form 8-K and incorporated herein by reference.
(b) Pro forma financial information.
Information responsive to Item 9.01(b) of Form 8-K is set forth in the unaudited pro forma financial statements as of September 30, 2022 and for the year ended December 31, 2021, are filed as Exhibit 99.3 to this Current Report on Form 8-K and incorporated herein by reference. Information responsive to Item 9.01(b) of Form 8-K is set forth in the unaudited pro forma financial statements as of and for the years ended December 31, 2022 and 2021, are filed as Exhibit 99.5 to this Current Report on Form 8-K and incorporated herein by reference.
(d) Exhibits
* | Filed herewith |
+ | Indicates a management or compensatory plan. |
† | Schedules to this exhibit have been omitted pursuant to Item 601(b)(2) of Registration S-K. The Registrant hereby agrees to furnish a copy of any omitted schedules to the SEC upon request. |
SIGNATURES
Pursuant to the requirements of the Securities Exchange Act of 1934, the Registrant has duly caused this report to be signed on its behalf by the undersigned hereunto duly authorized.
AERWINS Technologies Inc. | ||||||
Dated: April 27, 2023 | By: | /s/ Taiji Ito | ||||
Taiji Ito | ||||||
Chief Executive Officer |
Exhibit 99.3
REPORT OF INDEPENDENT REGISTERED PUBLIC ACCOUNTING FIRM
To the Stockholders and Board of Directors of
Aerwins Inc. and subsidiaries (formerly known as AERWINS Technologies Inc.)
Opinion on the Consolidated Financial Statements
We have audited the accompanying consolidated balance sheets of Aerwins Inc. and subsidiaries (formerly known as AERWINS Technologies Inc.) (the Company) as of December 31, 2022 and 2021 and the related consolidated statements of operations and comprehensive income (loss), stockholders equity and cash flows for each of the years ended December 31, 2022 and 2021, and the related notes (collectively referred to as the consolidated financial statements). In our opinion, the consolidated financial statements present fairly, in all material respects, the financial position of the Company as of December 31, 2022 and 2021, and the results of its operations and its cash flows for the years ended December 31, 2022 and 2021, in conformity with accounting principles generally accepted in the United States of America.
Going Concern Matter
The accompanying consolidated financial statements have been prepared assuming that the Company will continue as a going concern. As discussed in Note 2 to the consolidated financial statements, the Companys significant operating losses raise substantial doubt about its ability to continue as a going concern. Managements plans in regard to these matters are also described in Note 2. The consolidated financial statements do not include any adjustments that might result from the outcome of this uncertainty.
Basis for Opinion
These consolidated financial statements are the responsibility of the Companys management. Our responsibility is to express an opinion on the Companys consolidated financial statements based on our audits. We are a public accounting firm registered with the Public Company Accounting Oversight Board (United States) (PCAOB) and are required to be independent with respect to the Company in accordance with the U.S. federal securities laws and the applicable rules and regulations of the Securities and Exchange Commission and the PCAOB. We conducted our audits in accordance with the standards of the PCAOB. Those standards require that we plan and perform the audit to obtain reasonable assurance about whether the consolidated financial statements are free of material misstatement, whether due to error or fraud. The Company is not required to have, nor were we engaged to perform, an audit of its internal control over financial reporting. As part of our audits, we are required to obtain an understanding of internal control over financial reporting, but not for the purpose of expressing an opinion on the effectiveness of the Companys internal control over financial reporting. Accordingly, we express no such opinion.
Our audits included performing procedures to assess the risks of material misstatement of the consolidated financial statements, whether due to error or fraud, and performing procedures that respond to those risks. Such procedures included examining, on a test basis, evidence regarding the amounts and disclosures in the consolidated financial statements. Our audits also included evaluating the accounting principles used and significant estimates made by management, as well as evaluating the overall presentation of the consolidated financial statements. We believe that our audits provide a reasonable basis for our opinion.
/s/ TAAD LLP
We have served as the Companys auditor since 2022.
Diamond Bar, California
April 27, 2023
AERWINS INC. (formerly known as AERWINS Technologies Inc.)
CONSOLIDATED BALANCE SHEET
December 31, | December 31, | |||||||
2022 | 2021 | |||||||
ASSETS | ||||||||
Current Assets: |
||||||||
Cash and cash equivalents |
$ | 1,278,026 | $ | 10,020,459 | ||||
Notes receivable |
3,488 | | ||||||
Accounts receivable, net |
980,688 | 725,287 | ||||||
Others receivable |
2,089,921 | 1,034,690 | ||||||
Advances and prepayments to suppliers |
611,959 | 419,146 | ||||||
Inventory |
2,687,092 | 240,859 | ||||||
Escrow deposit |
575,000 | | ||||||
|
|
|
|
|||||
Total current assets |
8,226,174 | 12,440,441 | ||||||
|
|
|
|
|||||
Long-term Assets |
||||||||
Property and equipment, net |
1,390,547 | 1,446,898 | ||||||
Intangible assets, net |
150,576 | 203,618 | ||||||
Investment-equity method |
997,470 | 1,059,966 | ||||||
Operating lease right-of-use assets |
693,474 | 1,130,480 | ||||||
Long-term loans receivable |
107,735 | 140,666 | ||||||
Investment securities |
| 39,556 | ||||||
Other non-current assets |
213,370 | 236,311 | ||||||
|
|
|
|
|||||
Total long-term assets |
3,553,172 | 4,257,495 | ||||||
|
|
|
|
|||||
Total Assets |
$ | 11,779,346 | $ | 16,697,936 | ||||
|
|
|
|
|||||
LIABILITIES AND STOCKHOLDERS EQUITY | ||||||||
Current Liabilities: |
||||||||
Accounts payable |
3,333,675 | 2,433,663 | ||||||
Others payable |
230,060 | 219,574 | ||||||
Accrued expenses |
402,036 | 415,935 | ||||||
Contract liability |
1,104,582 | 228,304 | ||||||
Current portion of long-term loans |
54,624 | 195,624 | ||||||
Finance leases liabilities-current |
102,114 | 104,729 | ||||||
Operating leases liabilities-current |
293,710 | 434,409 | ||||||
Other current liabilities |
380,344 | 347,313 | ||||||
|
|
|
|
|||||
Total Current Liabilities |
5,901,145 | 4,379,551 | ||||||
|
|
|
|
|||||
Longer-term liabilities |
||||||||
Long-term loans |
54,624 | 3,792,654 | ||||||
Convertible bond |
| 7,176,348 | ||||||
Finance leases liabilities-non-current |
87,056 | 147,745 | ||||||
Operating leases liabilities-non-current |
397,720 | 685,335 | ||||||
Other long-term liabilities |
225,284 | 458,705 | ||||||
|
|
|
|
|||||
Total long-term liabilities |
3,969,297 | 12,260,787 | ||||||
|
|
|
|
|||||
Total Liabilities |
9,870,442 | 16,640,338 | ||||||
|
|
|
|
|||||
Stockholders Equity: |
||||||||
Common stock, par value $0.0001, 200,000,000 shares authorized; |
||||||||
30,000,000 shares and 26,341,974 shares issued and outstanding respectively in 2022 and 2021 |
3,000 | 2,634 | ||||||
Preferred stock, par value $0.001, 20,000,000 shares authorized; |
||||||||
No shares issued and outstanding |
| | ||||||
Additional paid-in capital |
49,296,390 | 32,286,106 | ||||||
Accumulated deficit |
(46,472,904 | ) | (31,993,085 | ) | ||||
Accumulated other comprehensive loss |
(917,582 | ) | (238,057 | ) | ||||
|
|
|
|
|||||
Stockholders Equity |
1,908,904 | 57,598 | ||||||
|
|
|
|
|||||
Total Liabilities and Stockholders Equity |
$ | 11,779,346 | $ | 16,697,936 | ||||
|
|
|
|
See Notes to Consolidated Financial Statements
2
AERWINS INC. (formerly known as AERWINS Technologies Inc.)
CONSOLIDATED STATEMENTS OF OPERATIONS AND COMPREHENSIVE INCOME (LOSS)
For the year ended December 31, |
|||||||
2022 | 2021 | |||||||
Revenues |
$ | 5,207,490 | $ | 7,830,130 | ||||
Cost of revenues |
5,070,507 | 6,433,913 | ||||||
|
|
|
|
|||||
Gross profit |
136,983 | 1,396,217 | ||||||
Operating expenses: |
||||||||
Selling expenses |
90,654 | 259,799 | ||||||
General and administrative expenses |
7,212,327 | 5,839,433 | ||||||
Research and development expenses |
8,926,205 | 9,335,977 | ||||||
|
|
|
|
|||||
Total operating expenses |
16,229,186 | 15,435,209 | ||||||
|
|
|
|
|||||
Loss from operations |
(16,092,203 | ) | (14,038,992 | ) | ||||
|
|
|
|
|||||
Other income (expenses): |
||||||||
Interest income (expenses), net |
(25,065 | ) | (36,763 | ) | ||||
Gain(Loss) on foreign currency transaction |
60,533 | 912 | ||||||
Gain(Loss) on disposal of fixed assets |
(9,316 | ) | (6,919 | ) | ||||
Impairment on fixed assets |
(511,695 | ) | | |||||
Commission fees |
| (910,391 | ) | |||||
Equity in loss of investee |
(16,964 | ) | | |||||
Gain on sale of investment securities |
1,801,660 | | ||||||
Gain on disposal of business |
| 580,177 | ||||||
Other income (expenses), net |
314,774 | (115,045 | ) | |||||
|
|
|
|
|||||
Total other income (expenses) |
1,613,927 | (488,029 | ) | |||||
Loss before income tax provision |
(14,478,276 | ) | (14,527,021 | ) | ||||
Income tax benefit (expense) |
(1,543 | ) | | |||||
|
|
|
|
|||||
Net loss |
(14,479,819 | ) | (14,527,021 | ) | ||||
Less: net loss attributable to non-controlling interest |
| | ||||||
Net loss from continuing operations |
(14,479,819 | ) | (14,527,021 | ) | ||||
|
|
|
|
|||||
Discontinued operations (Note 17) |
||||||||
Income from discontinued operations |
| 228,836 | ||||||
Loss on disposal of discontinued operations |
| (215,116 | ) | |||||
Income tax expense |
| (42,369 | ) | |||||
|
|
|
|
|||||
Loss on discontinued operations |
| (28,649 | ) | |||||
|
|
|
|
|||||
Net loss |
$ | (14,479,819 | ) | $ | (14,555,670 | ) | ||
|
|
|
|
|||||
Other comprehensive income: |
||||||||
Foreign currency translation adjustment |
(679,525 | ) | (679,996 | ) | ||||
|
|
|
|
|||||
Total comprehensive loss |
$ | (15,159,344 | ) | $ | (15,235,666 | ) | ||
|
|
|
|
|||||
Net loss per common share from continuing operations |
||||||||
Basic |
$ | (0.51 | ) | $ | (0.55 | ) | ||
|
|
|
|
|||||
Diluted |
$ | (0.51 | ) | $ | (0.55 | ) | ||
|
|
|
|
|||||
Net Income (loss) per common share from discontinued operations |
||||||||
Basic |
$ | | $ | (0.00 | ) | |||
|
|
|
|
|||||
Diluted |
$ | | $ | (0.00 | ) | |||
|
|
|
|
|||||
Weighted average common shares outstanding* |
||||||||
Basic |
28,565,198 | 26,341,974 | ||||||
Effect of dilutive securities |
||||||||
Conversion of option warrants |
2,862,486 | 2,606,895 | ||||||
|
|
|
|
|||||
Diluted |
31,427,684 | 28,948,869 | ||||||
|
|
|
|
See Notes to Consolidated Financial Statements
3
AERWINS INC. (formerly known as AERWINS Technologies Inc.)
CONSOLIDATED STATEMENTS OF CHANGES IN SHAREHOLDERS EQUITY (DEFICIENCY)
Common Stock | Preferred stock | Additional | Retained | Accumulated | ||||||||||||||||||||||||||||
200,000,000 authorized | 20,000,000 authorized | Paid-in | Earnings | Other | ||||||||||||||||||||||||||||
$0.0001 Par Value | $0.0001 Par Value | (Registered) | (Accumulated | Comprehensive | ||||||||||||||||||||||||||||
Shares | Amount | Shares | Amount | Capital | Deficit) | Income | Totals | |||||||||||||||||||||||||
Balance at January 1, 2021* |
26,341,974 | $ | 2,634 | | $ | | $ | 32,286,106 | $ | (17,437,415 | ) | $ | 438,939 | $ | 15,290,264 | |||||||||||||||||
Net loss |
| | | | | (14,555,670 | ) | | (14,555,670 | ) | ||||||||||||||||||||||
Other comprehensive loss |
| | | | | | (676,996 | ) | (676,996 | ) | ||||||||||||||||||||||
|
|
|
|
|
|
|
|
|
|
|
|
|
|
|
|
|||||||||||||||||
Balances at December 31, 2021 |
26,341,974 | $ | 2,634 | | $ | | $ | 32,286,106 | $ | (31,993,085 | ) | $ | (238,057 | ) | $ | 57,598 | ||||||||||||||||
|
|
|
|
|
|
|
|
|
|
|
|
|
|
|
|
|||||||||||||||||
Corporate bond conversion |
1,300,650 | 130 | | | 7,176,218 | | | 7,176,348 | ||||||||||||||||||||||||
Issuance of common stock |
1,693,835 | 170 | | | 8,399,014 | | | 8,399,184 | ||||||||||||||||||||||||
Issuance of common stock upon exercise of stock options |
663,541 | 66 | | | 1,434,920 | | | 1,434,986 | ||||||||||||||||||||||||
Stock-based compensation |
| | | | 132 | | | 132 | ||||||||||||||||||||||||
Net loss |
| | | | | (14,479,819 | ) | | (14,479,819 | ) | ||||||||||||||||||||||
Other comprehensive loss |
| | | | | | (679,525 | ) | (679,525 | ) | ||||||||||||||||||||||
|
|
|
|
|
|
|
|
|
|
|
|
|
|
|
|
|||||||||||||||||
Balances at December 31, 2022 |
30,000,000 | $ | 3,000 | | $ | | $ | 49,296,390 | $ | (46,472,904 | ) | $ | (917,582 | ) | $ | 1,908,904 | ||||||||||||||||
|
|
|
|
|
|
|
|
|
|
|
|
|
|
|
|
* | Retrospectively restated for effect of share issuances on August 5, 2022. |
4
AERWINS INC. (formerly known as AERWINS Technologies Inc.)
CONSOLIDATED STATEMENTS OF CASH FLOWS
For the Year ended | ||||||||
December 31, | December 31, | |||||||
2022 | 2,021 | |||||||
CASH FLOWS FROM OPERATING ACTIVITIES |
||||||||
Net loss |
$ | (14,479,819 | ) | $ | (14,555,670 | ) | ||
Net loss from discontinued operations |
| (28,649 | ) | |||||
|
|
|
|
|||||
Net loss from continuing operations |
(14,479,819 | ) | (14,527,021 | ) | ||||
Adjustments to reconcile net loss to net cash provided (used) by operating activities: |
||||||||
Depreciation expenses |
327,576 | 193,812 | ||||||
Amortization expenses |
51,813 | 60,906 | ||||||
Non-cash lease expense |
295,078 | 498,159 | ||||||
Revert of bad debt expenses |
(647 | ) | (39,283 | ) | ||||
Impairment loss |
511,695 | | ||||||
Loss on disposal of fixed assets |
9,316 | 6,919 | ||||||
Gain on sale of investment securities |
(1,801,660 | ) | | |||||
Equity in earnings of investee |
16,964 | | ||||||
Gain on disposal of a business |
| (580,177 | ) | |||||
Loss on disposal of a subsidiary |
| 215,116 | ||||||
Decrease (Increase) in operating assets: |
||||||||
Accounts receivable |
(350,739 | ) | 3,289,638 | |||||
Others Receivable |
(550,876 | ) | (278,455 | ) | ||||
Prepaid expenses |
(305,795 | ) | 13,203 | |||||
Advances and prepayments to suppliers |
59,412 | (5,600 | ) | |||||
Inventory |
(2,483,254 | ) | 591,728 | |||||
Increase (Decrease) in operating liabilities: |
||||||||
Accounts payable |
1,210,467 | 126,017 | ||||||
Others payable |
65,586 | 6,992 | ||||||
Accrued expenses |
38,713 | (40,429 | ) | |||||
Deferred revenue |
907,517 | 84,745 | ||||||
Operating lease liabilities-current |
(86,087 | ) | (53,201 | ) | ||||
Other current liabilities |
77,082 | 442,255 | ||||||
Operating lease liabilities-Non-current |
(201,634 | ) | (451,663 | ) | ||||
Other non-current liabilities |
(175,982 | ) | 327,236 | |||||
|
|
|
|
|||||
Net cash used by continuing operating activities |
(16,865,274 | ) | (10,119,103 | ) | ||||
Net cash provided by discontinued operations |
| 242,631 | ||||||
|
|
|
|
|||||
Net cash used by operating activities |
(16,865,274 | ) | (9,876,472 | ) | ||||
|
|
|
|
|||||
CASH FLOWS FROM INVESTING ACTIVITIES |
||||||||
Purchase of fixed assets |
(950,500 | ) | (866,862 | ) | ||||
Purchase of intangible assets |
(24,403 | ) | (268,504 | ) | ||||
Proceeds from disposal of subsidiary |
| 473,123 | ||||||
Proceeds from disposal of a business |
| 819,352 | ||||||
Deposit in escrow |
(575,000 | ) | | |||||
Proceeds from disposal of investments |
1,189,725 | | ||||||
Repayment of loans receivable |
15,214 | 136,194 | ||||||
|
|
|
|
|||||
Net cash provided (used) by continuing operations |
(344,964 | ) | 293,303 | |||||
Net cash provided (used) by discontinued operations |
| (12,699 | ) | |||||
|
|
|
|
|||||
Net cash (used) by investing activities |
(344,964 | ) | 280,604 | |||||
|
|
|
|
|||||
CASH FLOWS FROM FINANCING ACTIVITIES |
||||||||
Proceeds from capital contribution (Net of issuance cost) |
9,834,302 | | ||||||
Proceeds from bond |
| 7,524,383 | ||||||
Proceeds from loans |
| 1,165,937 | ||||||
Repayments to loans |
(171,384 | ) | (2,262,294 | ) | ||||
Payments for finance leases |
(83,799 | ) | (47,979 | ) | ||||
|
|
|
|
|||||
Net cash provided by continuing operations |
9,579,119 | 6,380,047 | ||||||
Net cash used by discontinued operations |
| (68,462 | ) | |||||
|
|
|
|
|||||
Net cash provided by financing activities |
9,579,119 | 6,311,585 | ||||||
|
|
|
|
|||||
Net decrease in cash and cash equivalents |
(7,631,119 | ) | (3,284,283 | ) | ||||
Effects of exchange rates change on cash |
(1,111,314 | ) | (1,603,633 | ) | ||||
Cash and cash equivalents at beginning of period |
10,020,459 | 14,619,164 | ||||||
Cash and cash equivalents at beginning of period held by discontinued operation |
| 289,211 | ||||||
|
|
|
|
|||||
Cash and cash equivalents at end of period |
$ | 1,278,026 | $ | 10,020,459 | ||||
|
|
|
|
|||||
Supplemental Disclosures of Cash Flow Information: |
||||||||
Cash paid (received) during year for: |
||||||||
Interest |
$ | 25,539 | $ | 35,407 | ||||
|
|
|
|
|||||
Income taxes |
$ | 31,136 | $ | 23,133 | ||||
|
|
|
|
See Notes to Consolidated Financial Statements
5
AERWINS INC. (formerly known as AERWINS Technologies Inc.)
NOTES TO CONSOLIDATED FINANCIAL STATEMENTS
NOTE 1 - ORGANIZATION AND DESCRIPTION OF BUSINESS
Aerwins Technologies Inc. (Aerwins or the Company), a holding company, was incorporated under the laws of the State of Delaware on June 7, 2022. Aerwins Technologies Inc. changed its name to Aerwins, Inc. on January 24, 2023.
On August 5, 2022, Aerwins executed a Share Exchange Agreement with all shareholders of A.L.I. Technologies Inc. (A.L.I.), a company that was incorporated in Japan in September 2016. Pursuant to the terms of the Share Exchange Agreement, Aerwins issued 30,000,000 shares of its common shares to the shareholders of A.L.I. in exchange for 2,006,689 common shares issued by A.L.I., representing 100% of A.L.I.s outstanding common shares. As a result, A.L.I. becomes a wholly owned operating subsidiary of Aerwins.
The share exchange has been accounted for as a reverse recapitalization rather than a business combination since the shareholders of A.L.I. own a majority of the outstanding shares of Aerwinss common stock immediately following the share exchange and there was not a change of control. The consolidation of Aerwins and its subsidiary has been accounted for at historical cost and prepared on the basis as if the transaction had become effective as of the beginning of the earliest period presented in the accompanying consolidated financial statements. Consequently, the assets and liabilities and the historical operations that were reflected in the consolidated financial statements for periods prior to the share exchange were those of A.L.I. and its subsidiaries and were recorded at the historical cost basis. After completion of the share exchange, Aerwinss consolidated financial statements included the assets and liabilities of both Aerwins and A.L.I., the historical operations of A.L.I. and its subsidiaries, and the operations of Aerwins from the closing date of the share exchange.
On September 20, 2018, A.L.I. acquired 100% equity ownership of A.L.I. Works (ALIW), which was incorporated in Japan on July 11, 2016, and is engaged in the business of managing web media and providing video production services.
On November 26, 2019, A.L.I. acquired 100% equity ownership of ASC HR Agent Inc. (currently ASC TECH Agent Co.), which was incorporated in Japan on December 1, 2014, and is engaged in the business of providing technology resources services. Management determined the Companys operations constituted two reportable segments in accordance with ASC 280Air mobility segment and Technology HR outsourcing segment. On December 29, 2021, the board of A.L.I. decided to dispose 51% equity ownership of ASC TECH Agent, and the transaction was completed on December 30, 2021. The Technology HR outsourcing segment is classified as discontinued operations on the consolidated statements of operations and comprehensive income (loss). As a result, the Company does not identify a segment, and therefore, segment information is not disclosed in the notes.
Aerwins, via its wholly owned operating subsidiary, A.L.I., and its subsidiaries, is engaged in the business of developing and providing air mobility domain, comprehensive computing solution, and technology human resources services in Japan. Aerwins, A.L.I. and its subsidiaries are hereafter referred to as Aerwins.
NOTE 2 - GOING CONCERN
The Companys consolidated financial statements are prepared using generally accepted accounting principles in the United States of America applicable to a going concern, which contemplates the realization of assets and the satisfaction of liabilities in the normal course of business. As of and for the year ended December 31, 2022, the Company has incurred operating losses of $16,092,203 and accumulated deficit of $46,472,904. These factors raise substantial doubt on the Companys ability to continue as a going concern.
Although the Company is attempting to commence operations and generate sufficient revenue, the Companys cash position may not be sufficient to support the Companys daily operations. Management intends to raise additional funds by way of debt, or a private or public offering. While the Company believes in the viability of its strategy to commence operations and generate sufficient revenue and in its ability to raise additional funds, there can be no assurances to that effect. The ability of the Company to continue as a going concern is dependent upon the Companys ability to further implement its business plan and generate sufficient revenue and its ability to raise additional funds by way of debt, or a public or private offering. The financial statements do not include any adjustments related to the recoverability and classification of recorded asset amounts or the amounts and classification of liabilities that might be necessary should the Company be unable to continue as a going concern.
NOTE 3 - SUMMARY OF SIGNIFICANT ACCOUNTING POLICIES
Basis of Presentation and Principles of Consolidation
The accompanying consolidated financial statements have been prepared in accordance with accounting principles generally accepted in the United States of America (U.S. GAAP) and pursuant to the rules and regulations of the Securities and Exchange Commission (SEC). The consolidated financial statements include the accounts of the Company and its subsidiaries. All significant intercompany accounts and transactions have been eliminated.
6
Name of Subsidiary |
Place of Organization | Percentage of Effective Ownership | ||||||||
2022 | 2021 | |||||||||
ASC TECH Agent |
Japan | 48.81 | % | 48.81 | % | |||||
ALIW |
Japan | 100 | % | 100 | % |
Use of Estimates
In preparing the consolidated financial statements in conformity with U.S. GAAP, the management is required to make certain estimates and assumptions that affect the reported amounts of assets and liabilities and disclosure of contingent assets and liabilities at the date of the financial statements and the reported amounts of revenues and expenses during the reporting period. These estimates are based on information available as of the date of the consolidated financial statements. Significant estimates required to be made by management include, but are not limited to, the allowance for doubtful accounts, useful lives of property and equipment, the impairment of long-lived assets, and valuation allowance of deferred tax assets. Actual results could differ from those estimates.
COVID-19
While the duration and extent of the COVID-19 pandemic depends on future developments that cannot be accurately predicted at this time, such as the extent and effectiveness of containment actions, it has already had an adverse effect on the global economy and the lasting effects of the pandemic continue to be unknown. The Company may experience customer losses, including due to bankruptcy or customers ceasing operations, which may result in delays in collections or an inability to collect accounts receivable from these customers. As of the date of issuance of these financial statements, the Company is not aware of any specific event or circumstance that would require an update to its estimates or judgments or an adjustment to the carrying value of the Companys assets or liabilities.
Reclassification
Certain classification has been made to the prior year financial statements to conform to the current year presentation. Income tax of $31,136 for the year ended December 31, 2021, has been reclassified to General and administrative expenses. The reclassification had no impact on previously reported net loss or accumulated deficit.
Cash and Cash Equivalents
Cash and cash equivalents include cash on hand and deposits in banks that are unrestricted as to withdrawal or use, and which have original maturities of three months or less.
Accounts Receivable
Accounts receivable, net represent the amounts that the Company has an unconditional right to consideration, which are stated at the original amount less an allowance for doubtful receivables. The Company reviews the accounts receivable on a periodic basis and makes general and specific allowances when there is doubt as to the collectability of individual balances. The Company usually determines the adequacy of reserves for doubtful accounts based on individual account analysis and historical collection trends. The Company establishes a provision for doubtful receivables when there is objective evidence that the Company may not be able to collect amounts due. The allowance is based on managements best estimates of specific losses on individual exposures, as well as a provision on historical trends of collections. The provision is recorded against accounts receivables balances, with a corresponding charge recorded in the consolidated statements of operations and comprehensive income. Delinquent account balances are written off against the allowance for doubtful accounts after management has determined that the likelihood of collection is remote. In circumstances in which the Company receives payment for accounts receivable that have previously been written off, the Company reverses the allowance and bad debt.
Inventories
Inventories consist principally of raw materials used for rendering computing sharing services and work in progress mainly of hoverbikes. Work in progress represents the costs incurred to date on unfinished products or services. The costs recognized as work in progress include direct materials, direct labor, and overhead costs that are directly attributable to the production of the unfinished product or service. Inventories are stated at the lower of cost or net realizable value, cost being determined by the first-in, first-out method for merchandise. Net realizable value is calculated at estimated selling price in the ordinary course of business, less reasonably predictable costs of completion, disposal, and transportation. Loss from inventories written down to net realizable value should be recognized whenever the utility of goods is impaired by damage, deterioration, obsolescence, changes in price levels, or other causes. When inventories have been written down below cost, the reduced amount is to be considered the cost for subsequent accounting purposes.
7
Fixed assets
Property and equipment are stated at cost less accumulated depreciation. Depreciation is calculated using the straight-line method over the estimated useful lives, as more details follow:
Depreciation Method | Useful Life | |||
Building and building accessories | Straight-line method | 8-38 years | ||
Office equipment and furniture | Straight-line method | 2-10 years | ||
Software | Straight-line method | 5 years | ||
Design right | Straight-line method | 7 years |
Expenditures for maintenance and repairs, which do not materially extend the useful lives of the assets, are charged to expense as incurred. Expenditures for major renewals and betterments which substantially extend the useful life of assets are capitalized. The cost and related accumulated depreciation of assets retired or sold are removed from the respective accounts, and any gain or loss is recognized in the consolidated statements of operations and comprehensive income (loss).
Lease-Lessee
In accordance with the Accounting Standards Update (ASU) 2016-02, Leases (Topic 842) the Company determines whether a contract is or contains a lease at inception of the contract and whether that lease meets the classification criteria of a finance or operating lease. Lease terms of certain operating leases include the non-cancellable period for which the Company has the right to use the underlying asset, together with renewal option periods when the exercise of the renewal option is reasonably certain.
The Company leases office facilities, office equipment and furniture, and a vehicle, which are classified as operating leases and leases containers, which are classified as a finance lease in accordance with Topic 842. Under Topic 842, lessees are required to recognize the following for all leases on the commencement date: (i) lease liability, which is a lessees obligation to make lease payments arising from a lease, measured on a discounted basis; and (ii) right-of-use asset, which is an asset that represents the lessees right to use, or control the use of, a specified asset for the lease term. Operating leases are included in operating lease right-of-use assets, operating lease liabilities, current, and operating lease liabilities, non-current, and finance leases are included in property and equipment, finance lease liabilities, current, and finance lease liabilities, non-current in the consolidated balance sheet.
The operating lease right-of-use asset also includes any lease payments made and excludes lease incentives. Lease expense for lease payments is recognized on a straight-line basis over the lease term. All operating lease right-of-use assets are reviewed for impairment annually.
As most of the Companys leases do not provide an implicit rate, the Company uses its incremental borrowing rate based on the information available at commencement date in determining the present value of future payments.
The Company has elected the short-term lease exception, and therefore operating lease right-of-use assets and liabilities do not include leases with a lease term of twelve months or less.
Impairment of Long-Lived Assets
Long-lived assets with finite lives, primarily property and equipment, are reviewed for impairment whenever events or changes in circumstances indicate that the carrying amount of an asset may not be recoverable. If the estimated cash flows from the use of the asset and its eventual disposition are below the assets carrying value, then the asset is deemed to be impaired and written down to its fair value.
8
Equity Method
We apply the equity method to an investment in unconsolidated entities over which we have the ability to exercise significant influence. We initially record our investments based on the acquisition cost. Under the equity method, the carrying amount of the investment is adjusted to recognize changes in the Companys share of net assets of the investment.
Foreign Currency Translation
The Company maintains its books and record in its local currency, Japanese YEN (JPY), which is a functional currency as being the primary currency of the economic environment in which its operation is conducted. Transactions denominated in currencies other than the functional currency are translated into the functional currency at the exchange rates prevailing at the dates of the transaction. Monetary assets and liabilities denominated in currencies other than the functional currency are translated into the functional currency using the applicable exchange rates at the balance sheet dates. The resulting exchange differences are recorded in the statements of operations.
The reporting currency of the Company is the United States Dollars (US$), and the accompanying consolidated financial statements have been expressed in US$. In accordance with ASC Topic 830-30, Translation of Financial Statements, assets and liabilities of the Company whose functional currency is not US$ are translated into US$, using the exchange rate on the balance sheet date. Revenues and expenses are translated at average rates prevailing during the period. The gains and losses resulting from the translation of financial statements are recorded as a separate component of accumulated other comprehensive loss within the statements of changes in shareholders deficit.
Translation of amounts from the local currency of the Company into US$1 has been made at the following exchange rates:
December 31, 2022 |
December 31, 2021 |
|||||||
Current JPY: US$1 exchange rate |
131.81 | 115.17 | ||||||
Average JPY: US$1 exchange rate |
131.46 | 109.84 |
Consolidated Statements of Cash Flows
In accordance with FASB ASC 830-230, Statement of Cash Flows, cash flows from the Companys operations are calculated based upon the functional currency. As a result, amounts related to assets and liabilities reported on the statement of cash flows may not necessarily agree with changes in the corresponding balances on the balance sheet.
Revenue Recognition
The Company recognizes revenue in accordance with ASC Topic 606, Revenue from Contracts with Customers.
To determine revenue recognition for contracts with customers, the Company performs the following five steps : (i) identify the contract(s) with the customer, (ii) identify the performance obligations in the contract, (iii) determine the transaction price, including variable consideration to the extent that it is probable that a significant future reversal will not occur, (iv) allocate the transaction price to the respective performance obligations in the contract, and (v) recognize revenue when (or as) the Company satisfies the performance obligation. Revenue amount represents the invoiced value and net of a value-added tax (Consumption Tax). The Consumption Tax on sales is calculated at 10% of gross sales.
When another party is involved in providing goods or services to our customer, we apply the principal versus agent guidance in ASC Topic 606 to determine if we are the principal or an agent to the transaction. When we control the specified goods or services before they are transferred to our customer, we report revenue gross, as principal. If we do not control the goods or services before they are transferred to our customer, revenue is reported net of the fees paid to the other party, as agent.
9
Cost of Revenues
Cost of revenues primarily consists of salaries and related expenses (e.g. bonuses, employee benefits, and payroll taxes) for personnel directly involved in the delivery of services and products directly to customers. Cost of revenues also includes royalty/license payments to vendors, and hosting and infrastructure costs related to the delivery of the Companys products and services.
Advertising Expenses
Advertising expenses consist primarily of costs of promotion and marketing for the Companys image and products, and costs of direct advertising, and are included in selling expenses. The Company expenses advertising costs as incurred, in accordance with the ASC 720-35, Advertising Costs. The advertising expenses were $90,654 and $259,799 for the years ended December 31, 2022 and 2021, respectively.
Concentration of Credit Risk
Financial instruments that potentially subject the Company to credit risk consist primarily of accounts and other receivables. The Company does not require collateral or other security to support these receivables. The Company conducts periodic reviews of the financial condition and payment practices of its customers to minimize collection risk on accounts receivable.
For the year ended December 31, 2022, Customer A and Customer B accounts for respectively 14.9% and 8.0% of the Companys total revenues. For the year ended December 31, 2021, Customer C and Customer D accounts for respectively 17.2% and 10.5% of the Companys total revenues
As of December 31, 2022, Customer E, Customer F and Customer G accounts for respectively 16.2%, 15.1% and 12.8% of the Companys total accounts receivable. As of December 31, 2021, Customer H, Customer I and Customer J accounts for respectively 26.3%, 20.4% and 13.3% of the Companys total accounts receivable.
For the year ended December 31, 2022, Vendor A and F accounts for 29.6% and 12.2% of the Companys total raw material purchases. For the year ended December 31, 2021, Vendor A accounts for 32.1% of the Companys total raw material purchases.
As of December 31, 2022, Vendor A, Vendor B and Vendor C account for respectively 20.1%, 7.8% and 6.0% of the Companys total accounts payable. As of December 31, 2021, Vendor D, Vendor E and Vendor B account for respectively 21.4%, 16.9% and 14.4% of the Companys total accounts payable.
Comprehensive Income or Loss
ASC 220, Comprehensive Income, establishes standards for reporting and display of comprehensive income or loss, its components and accumulated balances. Comprehensive income or loss as defined includes all changes in equity during a period from non-owner sources. Accumulated other comprehensive loss, as presented in the accompanying consolidated statements of changes in shareholders deficit, consists of changes in unrealized gains and losses on foreign currency translation.
10
Earnings (Loss) Per Share
The Company computes basic and diluted earnings (loss) per share in accordance with ASC 260, Earnings per Share. Basic earnings (loss) per share is computed by dividing net income (loss) by the weighted average number of common shares outstanding during the reporting period. Diluted earnings (loss) per share reflects the potential dilution that could occur if stock options and other commitments to issue common shares were exercised or equity awards vest resulting in the issuance of common shares that could share in the earnings (loss) of the Company.
Related Parties and Transactions
The Company identifies related parties, and accounts for, discloses related party transactions in accordance with ASC 850, Related Party Disclosures and other relevant ASC standards.
Parties, which can be an entity or individual, are considered to be related if they have the ability, directly or indirectly, to control the Company or exercise significant influence over the Company in making financial and operational decisions. Entities are also considered to be related if they are subject to common control or common significant influence.
Transactions involving related parties cannot be presumed to be carried out on an arms-length basis, as the requisite conditions of competitive, free market dealings may not exist. Representations about transactions with related parties, if made, shall not imply that the related party transactions were consummated on terms equivalent to those that prevail in arms-length transactions unless such representations can be substantiated.
Income Taxes
Income taxes are accounted for using an asset and liability method of accounting for income taxes in accordance with ASC 740, Income Taxes. Under this method, income tax expense is recognized for the amount of: (i) taxes payable or refundable for the current period and (ii) deferred tax consequences of temporary differences resulting from matters that have been recognized in an entitys financial statements or tax returns. Deferred tax assets also include the prior years net operating losses carried forward. Deferred tax assets and liabilities are measured using enacted tax rates expected to apply to taxable income in the years in which those temporary differences are expected to be recovered or settled. The effect on deferred tax assets and liabilities of a change in tax rates is recognized in the results of operations in the period that includes the enactment date. A valuation allowance is provided to reduce the deferred tax assets reported if based on the weight of the available positive and negative evidence, it is more likely than not some portion or all of the deferred tax assets will not be realized.
The Company follows ASC 740, which prescribes a more-likely-than-not threshold for financial statement recognition and measurement of a tax position taken or expected to be taken in a tax return. ASC 740 also provides guidance on recognition of income tax assets and liabilities, classification of current and deferred income tax assets and liabilities, accounting for interest and penalties associated with tax positions, accounting for income taxes in interim periods, and income tax disclosures.
Under the provisions of ASC 740, when tax returns are filed, it is likely that some positions taken would be sustained upon examination by the taxing authorities, while others are subject to uncertainty about the merits of the position taken or the amount of the position that would be ultimately sustained. The benefit of a tax position is recognized in the financial statements in the period during which, based on all available evidence, management believes it is more likely than not that the position will be sustained upon examination, including the resolution of appeals or litigation processes, if any. Tax positions taken are not offset or aggregated with other positions. Tax positions that meet the more-likely-than-not recognition threshold are measured as the largest amount of tax benefit that is more than 50% likely of being realized upon settlement with the applicable taxing authority. The portion of the benefits associated with tax positions taken that exceeds the amount measured as described above is reflected as a liability for unrecognized tax benefits in the accompanying balance sheets along with any associated interest and penalties that would be payable to the taxing authorities upon examination. Interest associated with unrecognized tax benefits is classified as interest expense and penalties are classified in selling, general and administrative expenses in the statements of operations.
11
Fair Value Measurements
The Company performs fair value measurements in accordance with ASC 820. Fair value is defined as the price that would be received to sell an asset or paid to transfer a liability in an orderly transaction between market participants at the measurement date. ASC 820 establishes a fair value hierarchy that requires an entity to maximize the use of observable inputs and minimize the use of unobservable inputs when measuring fair value. An assets or a liabilitys categorization within the fair value hierarchy is based upon the lowest level of input that is significant to the fair value measurement. ASC 820 establishes three levels of inputs that may be used to measure fair value:
| Level 1: quoted prices in active markets for identical assets or liabilities; |
| Level 2: inputs other than Level 1 that are observable, either directly or indirectly; or |
| Level 3: unobservable inputs that are supported by little or no market activity and that are significant to the fair values of the assets or liabilities. |
As of December 31, 2022 and 2021, the carrying values of cash and cash equivalents, accounts receivable, other receivable, escrow deposit, short-term loans payable, accounts payable, accrued expenses, contract liability, current portion of long-term debts, current operating and finance lease liabilities and other current liabilities approximated their fair values reported in the consolidated balance sheets mainly due to the short-term maturities of these instruments.
NOTE 4 - ACCOUNTS RECEIVABLE, NET AND OTHER RECEIVABLE
Accounts receivable, net consists of the following:
December 31, | December 31, | |||||||
2022 | 2021 | |||||||
Accounts receivable |
$ | 980,688 | $ | 726,026 | ||||
Less: allowance for doubtful accounts |
| (739 | ) | |||||
|
|
|
|
|||||
Accounts receivable, net |
$ | 980,688 | $ | 725,287 | ||||
|
|
|
|
Allowance for doubtful accounts movement is as follows:
December 31, | December 31, | |||||||
2022 | 2021 | |||||||
Beginning balance |
$ | (739 | ) | $ | (42,640 | ) | ||
Change during the year |
739 | 39,284 | ||||||
Foreign currency translation adjustment |
| 2,617 | ||||||
|
|
|
|
|||||
Ending balance |
$ | | $ | (739 | ) | |||
|
|
|
|
Other receivable movement is as follows:
December 31, | December 31, | |||||||
2022 | 2021 | |||||||
Beginning balance |
$ | 1,034,690 | 696,465 | |||||
Change during the year |
1,189,020 | 236,054 | ||||||
Foreign currency translation adjustment |
(133,789 | ) | 102,171 | |||||
|
|
|
|
|||||
Ending balance |
$ | 2,089,921 | $ | 1,034,690 | ||||
|
|
|
|
The change during the year in 2022 is mainly from increase of consumption tax receivable that will be refunded in the next fiscal year.
12
NOTE 5 - INVENTORY
Inventory consists of the following:
For the Years Ended December 31, |
||||||||
2022 | 2021 | |||||||
Raw materials |
$ | 1,533,784 | $ | 155,866 | ||||
Work in progress |
1,135,852 | 69,339 | ||||||
Stored item |
17,456 | 15,654 | ||||||
Total |
$ | 2,687,092 | $ | 240,859 |
NOTE 6 - SEGMENT INFORMATION
Management determined the Companys operations constituted two reportable segments in accordance with ASC 280Air mobility segment and Technology HR outsourcing segment. On December 29, 2021, the board of A.L.I. decided to dispose 51% equity ownership of ASC TECH Agent, and the transaction was completed on December 30, 2021. The Technology HR outsourcing segment is classified as discontinued operations on the consolidated statements of operations and comprehensive income (loss). As a result, the Company does not identify a segment, and therefore, segment information is not disclosed in the notes.
NOTE 7 - REVENUE RECOGNITION
The Company currently generates its revenue from the following main sources:
Revenue from Sales of Computing Equipment
Revenues from the sale of equipment are recognized at the point in time when obligations under the terms of a contract with our customer are satisfied and control has been transferred to the customer. For equipment placements that require us to install the product at the customer location, revenue is normally recognized when the equipment has been delivered and installed at the customer location. Sales of customer installable products are recognized upon shipment or receipt by the customer according to the customers shipping terms.
Revenue from Computing Power Sharing services with Equipment Installation
The Company provides customers with computing power sharing services with equipment installation, which includes a one-time equipment installation and a certain period of time technology service. The Company recognizes revenue from one-time equipment installation at the point in time when the installation is completed and accepted by the customer. The Company recognizes revenue from technology service over time when the service is rendered and accepted by the customer, normally monthly.
Revenue from Computing Power Sharing services without Equipment Installation
The Company also provides customers with computing power sharing services without equipment installation, which includes a one-time platform set up without equipment installation, and a certain period of time technology service. The Company recognizes revenue from one-time platform set up at the point in time when the platform is set up to function and accepted by the customer. The Company recognizes revenue from technology service over time when the service is rendered and accepted by the customer, normally monthly.
Revenue from Air Mobility Drone Solution
The Company provides customers with air mobility drone solution, which includes UAS (Unmanned Aircraft Systems) main equipment, laser scanner, software package, camera system, etc. The solution includes a one-time system set up and a certain period of time technology service. The Company recognizes revenue from one-time system set up at the point in time when the system is set up to function and accepted by the customer. The Company recognizes revenue from technology service over time when the service is rendered and accepted by the customer, normally monthly.
13
Revenue from Project Management
The Company provides customers with project management, which includes project planning and implementation, and providing needed technology human resources, such as construction engineers and software engineers for various projects. The Company recognizes revenue from project management over time when the service is rendered and accepted by the customer, normally monthly.
Revenue from Outsourcing Service
The Company provides customers with outsourcing service of temporary staffing for construction or technology industries. The Company recognizes revenue from outsourcing over time as the service is rendered, normally monthly.
Disaggregation of Revenue
The Company disaggregates its revenues from contracts by service types, as the Company believes it best depicts how the nature, amount, timing and uncertainty of the revenue and cash flows are affected by economic factors. The Companys disaggregation of revenues for the years ended December 31, 2022 and 2021 is as following:
For the Years Ended December 31, |
||||||||
2022 | 2021 | |||||||
Revenue from Project Management |
$ | 1,727,601 | $ | 1,507,409 | ||||
Revenue from Computing Power Sharing services |
1,092,012 | 2,166,953 | ||||||
Revenue from Sales of Computing Equipment |
894,736 | 879,164 | ||||||
Revenue from Air Mobility Drone Solution |
797,396 | 822,078 | ||||||
Revenue from Project Management for Computing Share |
595,745 | 2,172,421 | ||||||
Other |
100,000 | 282,105 | ||||||
Total Revenue |
$ | 5,207,490 | $ | 7,830,130 |
* | 1 Revenue from Outsourcing Service is included in income from discontinued operations. |
As of December 31, 2022 and 2021, and for the years then ended, almost all of the revenue generated are attributed to the Companys operation in Japan.
Contract Liability
As of December 31, 2022 and 2021, the Company recognizes contract liability of $1,104,582 and $228,304 respectively. Contract liability primarily represents the Companys remaining performance obligations under its service agreement at the end of the year, for which consideration has been received and revenue had not been recognized.
NOTE 8 - RELATED PARTY TRANSACTIONS
Guarantee provided by a director of A.L.I.
For the year ended December 31, 2022, the Company received a debt guarantee from the Representative Director of A.L.I. Daisuke Katano for a particular building lease agreement. The transaction amount is $ 25,559 which is calculated by the total rental fees paid during the period from January 1, 2022 to December 31, 2022 for the contracts for which guarantees were provided as of December 31, 2022. No warranty fees are paid.
14
NOTE 9 - PROPERTY AND EQUIPMENT, NET
Property and equipment consist of the following:
December 31, | December 31, | |||||||
2022 | 2021 | |||||||
Building |
$ | 233,869 | $ | 206,683 | ||||
Accessory equipment |
211,879 | 220,661 | ||||||
Structures |
47,568 | |||||||
Vehicles |
4,512 | 5,164 | ||||||
Tools, furniture, and fixtures |
1,751,969 | 1,595,895 | ||||||
Lease assets |
186,871 | 291,743 | ||||||
Construction in process |
| 44,604 | ||||||
Accumulated depreciation and impairment |
(1,046,121 | ) | (917,853 | ) | ||||
|
|
|
|
|||||
Property and equipment, net |
$ | 1,390,547 | $ | 1,446,898 | ||||
|
|
|
|
Depreciation expense was $327,576 and $193,812 for the years ended December 31, 2022 and 2021, respectively.
The Company specifies as the minimum unit each farm and service for the shared computing business, and each location for other businesses. For the year ended December 31, 2022, the Company recorded impairment loss of $511,695 as described in Note 16.
NOTE 10 - INTANGIBLE ASSETS, NET
The components of intangible assets as of December 31. 2022 and 2021 are as follows:
December 31, | December 31, | |||||||
2022 | 2021 | |||||||
Software |
$ | 706,320 | $ | 788,921 | ||||
Design right |
111,334 | 127,420 | ||||||
Accumulated amortization |
(667,078 | ) | (712,723 | ) | ||||
|
|
|
|
|||||
Intangible assets, net |
$ | 150,576 | $ | 203,618 | ||||
|
|
|
|
Amortization expense was $51,813 and $60,696 for the years ended December 31, 2022 and 2021, respectively.
NOTE 11 - DEPOSIT IN ESCROW
Contribution to Pono Capital Corp
On November 9, 2022, the Company deposited $575,000 into the trust account of Pono Capital Corp to further extend the period from the closing of Pono Capital Corps initial public offering to consummate a business combination for an additional three months to February 13, 2023. The Company received 57,500 Placement Units.
NOTE 12 - LEASES
The Company has entered into new lease for testing facilities in Minobu City in 2022, which were classified as operating leases.
The components of lease costs are as follows:
For the Years Ended | ||||||||
December 31, | ||||||||
2022 | 2021 | |||||||
Short-term lease costs |
$ | 1,088 | $ | 1,202 | ||||
Finance lease costs |
97,500 | 53,425 | ||||||
Operating lease costs |
403,086 | 542,982 | ||||||
|
|
|
|
|||||
Total lease costs |
$ | 501,674 | $ | 597,609 | ||||
|
|
|
|
15
The following table presents supplemental information related to the Companys leases:
For the Years Ended | ||||||||
December 31, | ||||||||
2022 | 2021 | |||||||
Cash paid for amounts included in the measurement of lease liabilities: |
||||||||
Operating cash flows from operating leases |
287,721 | 504,864 | ||||||
Financing cash flows from finance lease |
83,799 | 47,979 | ||||||
Weighted average remaining lease term (years) |
||||||||
Finance leases |
1.9 | 1. 8 | ||||||
Operating leases |
1.7 | 2.4 | ||||||
Weighted-average discount rate: (per annum) |
||||||||
Finance leases |
0.80 | % | 1.71 | % | ||||
Operating leases |
0.94 | % | 0.94 | % |
As of December 31, 2022, the future maturity of lease liabilities is as follows:
Year ending December 31, |
Finance lease | Operating lease | ||||||
2023 |
$ | 105,775 | $ | 298,580 | ||||
2024 |
54,888 | 244,125 | ||||||
2025 |
11.271 | 157,099 | ||||||
2026 |
11,271 | | ||||||
Thereafter |
14,088 | | ||||||
|
|
|
|
|||||
Total lease payments |
197,293 | 699,804 | ||||||
Less: imputed interest |
(8,123 | ) | (8,374 | ) | ||||
Total lease liabilities |
189,170 | 691,430 | ||||||
|
|
|
|
|||||
Less: current portion |
102,114 | 293,710 | ||||||
|
|
|
|
|||||
Non-current lease liabilities |
$ | 87,056 | $ | 397,720 | ||||
|
|
|
|
Pursuant to the operating lease agreements, the Company made security deposits to the lessors. The security deposits amounted to $174,111 and $196,628 as of December 31, 2022 and 2021, respectively.
NOTE 13 - CONVERTIBLE BOND
On December 28, 2021, the Company issued a convertible bond of 870,000 thousand yen (approximately $7,554,050). The Company incurred 43,500 thousand yen (approximately $377,702) of debt issuance costs relating to the issuance. After deducting the issuance costs, the Company recognizes the convertible bond as a non-current liability at $7,176,348 as of December 31, 2021.
The convertible bond bears no interest. The convertible bond matures on December 28, 2024, unless earlier repurchased, redeemed or converted into the Companys stock.
The holder of the corporate bond has 29 units of the right to convert the convertible bond to the Companys stock. Each unit can be converted to 3,000 shares of the company with the exercise price per unit of 30,000 thousand yen (approximately $260,484). The holder is not required to pay additional consideration when exercising the stock acquisition right because the holder contributes the bond in exchange for the shares when exercising the stock acquisition right.
The Company adopted ASU 2020-06 and analyzed the conversion option in the convertible bond for derivative accounting treatment under ASC 815, and determined that the instrument does not qualify for derivative accounting.
16
On March 1, 2022, all of the convertible debt was converted to 87,000 shares of A.L.I.s common stock (Aerwins shares of 1,300,650).
NOTE 14 - LONG-TERM DEBTS
The Companys long-term debts included bond payable and loans borrowed from banks and other financial institutions, which consist of the following:
Name of Financial Institutions |
Original Amount Borrowed (JPY) |
Loan Duration |
Annual Interest Rate |
Balance as of December 31, 2022 |
Balance as of December 31, 2021 |
|||||||||||||||
Mizuho Bank, Ltd. |
40,000,000 | |
1/22/2021 1/22/2028 |
|
0.00 | % | 303,467 | 347,313 | ||||||||||||
Mizuho Bank, Ltd. |
60,000,000 | |
1/22/2021 1/22/2028 |
|
0.00 | % | 455,201 | 520,969 | ||||||||||||
Mizuho Bank, Ltd. |
50,000,000 | |
1/22/2021 1/22/2028 |
|
1.70 | % | 379,334 | 434,141 | ||||||||||||
Japan Finance Corporation |
50,000,000 | |
12/29/2020 12/31/2027 |
|
1.11 | % | 279,190 | 382,044 | ||||||||||||
Japan Finance Corporation |
250,000,000 | |
12/29/2020 1/31/2026 |
|
0.50 | % | 1,896,669 | 2,170,703 | ||||||||||||
Sumitomo Mitsui Banking Corporation |
80,000,000 | |
7/26/2019 7/26/2022 |
|
0.83 | % | | 133,108 | ||||||||||||
Aggregate outstanding principal balances |
3,313,861 | 3,988,278 | ||||||||||||||||||
Less: current portion |
(54,624 | ) | (195,624 | ) | ||||||||||||||||
|
|
|
|
|||||||||||||||||
Non-current portion |
$ | 3,259,237 | $ | 3,792,654 | ||||||||||||||||
|
|
|
|
Interest expense for long-term debts was $19,341 and $34,607 for the years ended December 31, 2022 and 2021, respectively.
As of December 31, 2022, future minimum loan payments are as follows:
Year ending December 31, 2022 | Loan | |||
Payment | ||||
2023 |
$ | 77,930 | ||
2024 |
332,900 | |||
2025 |
354,339 | |||
2026 |
2,240,117 | |||
2027 |
341,942 | |||
Thereafter |
23,352 | |||
|
|
|||
Total |
3,370,580 | |||
|
|
|||
Less interest |
56,719 | |||
|
|
|||
Balance as of December 31, 2022 |
3,313,861 | |||
|
|
17
NOTE 15 - INCOME TAXES
United States
Aerwins Technologies Inc. is a holding company registered in the State of Delaware incorporated in June 2022. The U.S. federal income tax rate is 21%.
Japan
The Company conducts its major businesses in Japan and is subject to tax in this jurisdiction. During the years ended December 31, 2022 and 2021, all taxable income (loss) of the Company is generated in Japan. As a result of its business activities, the Company files tax returns that are subject to examination by the local tax authority.
Income taxes in Japan applicable to the Company are imposed by the national, prefectural, and municipal governments, and in the aggregate resulted in an effective statutory rate of approximately 34.59% for the years ended December 31, 2022 and 2021.
For the years ended December 31, 2022 and 2021, the Companys income tax expenses are as follows:
For the Years Ended | ||||||||
December 31, | ||||||||
2022 | 2021 | |||||||
Current |
$ | 1,543 | $ | | ||||
Deferred |
| | ||||||
|
|
|
|
|||||
Total |
$ | 1,543 | $ | | ||||
|
|
|
|
A reconciliation of the effective income tax rates reflected in the accompanying consolidated statements of operations to the Japanese statutory tax rate for the years ended December 31, 2022 and 2021 is as follows:
For the Years Ended | ||||||||
December 31, | ||||||||
2022 | 2021 | |||||||
Japanese statutory tax rate |
34.59 | % | 34.59 | % | ||||
Change in valuation allowance |
(34.59 | )% | (34.59 | )% | ||||
Other |
(0.01 | ) | | |||||
|
|
|
|
|||||
Effective tax rate |
(0.01 | )% | (0.00 | )% | ||||
|
|
|
|
The tax effects of temporary differences that give rise to the deferred tax assets at December 31, 2022 and 2021 are presented below:
December 31, | December 31, | |||||||
2022 | 2021 | |||||||
Deferred tax assets |
||||||||
Bonus allowance |
$ | 131,209 | $ | 120,133 | ||||
Impairment loss |
321,764 | 269,079 | ||||||
Bad debt allowance |
102,587 | 117,664 | ||||||
Net operating loss carryforward |
14,041,559 | 10,543,029 | ||||||
Other |
26,589 | 77,262 | ||||||
|
|
|
|
|||||
Subtotal |
14,623,708 | 11,127,167 | ||||||
Less valuation allowance |
(14,623,708 | ) | (11,118,711 | ) | ||||
|
|
|
|
|||||
Total deferred tax assets |
$ | | $ | 8,457 | ||||
Deferred tax liabilities |
| | ||||||
Excess depreciation |
| (8,457 | ) | |||||
|
|
|
|
|||||
Total deferred tax liabilities |
| (8,457 | ) | |||||
|
|
|
|
|||||
Net deferred tax assets |
| | ||||||
|
|
|
|
18
The realization of deferred tax assets is dependent upon the generation of sufficient taxable income of the appropriate character in future periods. The Company regularly assesses the ability to realize its deferred tax assets and establish a valuation allowance if it is more-likely-than-not that some portion of the deferred tax assets will not be realized. The Company weighs all available positive and negative evidence, including its earnings history and results of recent operations, projected future taxable income, and tax planning strategies. The Company determined it was not more-likely-than-not that the deferred tax assets will be realized.
The company has net operating loss carryforwards for tax purposes of $40,610,168. The company does not recognize deferred tax assets for the net operating loss and the operating loss carryforwards for tax purposes expire as follows:
2023-2028 |
$ | 156,870 | ||
2029-2033 |
40,453,298 | |||
2034- |
| |||
Total |
40,610,168 |
Uncertain tax positions
The Company evaluates each uncertain tax position (including the potential application of interest and penalties) based on the technical merits, and measures the unrecognized benefits associated with the tax positions. As of December 31, 2022 and 2021, the management considered the Company did not have any significant unrecognized uncertain tax positions. The Company did not incur any interest or penalties tax for the years ended December 31, 2022 and 2021. The Company does not anticipate any significant increases or decreases in unrecognized tax benefits in the next twelve months from December 31, 2022. The Companys Japan subsidiary income tax return filed for the tax years ending from December 31, 2018 through December May 31, 2022 are subject to examination by the relevant taxing authorities.
NOTE 16 - IMPAIRMENT LOSS
For year ended December 31, 2022, the Company recognized impairment losses for the following asset groups.
Location |
Primary Use |
Type |
Impairment loss |
|||||
Kanagawa |
Hiratsuka Farm | Accessory equipment | 1,584 | |||||
Niigata |
Yuzawa Farm | Tools, furniture and fixtures | 432,327 | |||||
Chiba |
Noda Farm | Tools, furniture and fixtures | 1,184 | |||||
Saitama |
Kawaguchi Farm | Accessory equipment | 1,408 | |||||
Fukushima |
Sirakawa | Tools, furniture and fixtures | 72,979 | |||||
Tokyo |
Shiba Koen annex | Accessory equipment | 2,214 | |||||
Total |
511,695 |
The Company specifies as the minimum unit each farm and service for the shared computing business, and each location for other businesses. For the year ended December 31, 2022, the Company reduced the book value of the groups of assets above to the recoverable amount because operating profit from the groups of assets continued to be negative. The Company recognized the reduction as impairment in the line item of impairment on fixed assets. The Company reduces the book value to zero and recognizes the amount as impairment because the future cash flows from these assets were uncertain at the end of this fiscal year.
19
For year ended December 31, 2021, the Company did not recognize impairment losses for fixed assets.
NOTE 17 - DISCONTINUED OPERATION
On December 30, 2021, the Company transferred its shares of ASC TECH Agent to Yamada Incentive Limited Business LLC, a third party, for $886,255. As a result of the transfer, the ratio of voting rights held by the Company changed from 100% to 48.81%, and accordingly ASC TECH Agent was excluded from the scope of consolidation and the Company used equity method to record its investment therein after the transfer.
The following table summarizes the carrying value of the assets and liabilities disposed of ASC TECH Agent at the closing date of disposal. The excess of the carrying value of the net assets disposed over the selling price was recorded as loss from disposal of subsidiary.
Amount | ||||
Cash |
$ | 413,132 | ||
Accounts receivable |
782,355 | |||
Other current assets |
88,077 | |||
Fixed assets (net) |
29,318 | |||
Operating Lease Right-of-use Assets |
194,912 | |||
Goodwill |
1,615,932 | |||
Other non-current assets |
468,566 | |||
Accrued liabilities and other payables |
(1,236,043 | ) | ||
Other current liabilities |
(132,724 | ) | ||
Non-current liabilities |
(62,188 | ) | ||
Selling price |
886,255 | |||
Remaining amount of share |
1,059,966 | |||
|
|
|||
Loss on disposal |
$ | 215,116 | ||
|
|
Net income from operations of discontinued subsidiary for the years ended December 31, 2021 consist of following. For the year ended December 31, 2022, net income from ASC TECH agent is recognized as equity in loss of investee of $16,964 in the consolidated statements of operations and comprehensive income (loss).
For the year December 31, |
||||
2021 | ||||
Revenues |
$ | 6,368,247 | ||
Cost of revenues |
4,938,521 | |||
|
|
|||
Gross profit |
1,429,726 | |||
Operating expenses |
1,266,450 | |||
|
|
|||
Income from operations |
163,276 | |||
Other Income (loss) |
65,560 | |||
Provision for income tax (benefit) expenses |
42,369 | |||
|
|
|||
Net income |
186,467 |
NOTE 18 DISPOSAL OF BUSINESS AND INVESTMENT SECURITIES
On September 21, 2021, the Company disposed of the whole of Zeroboard business including share of A.L.I. Energy, which is engaged in the business of computing sharing. Since the disposal does not represents a strategic shift, the disposal of Zeroboard business is not considered as a discontinued operation, pursuant to ASC 205-20-45-1B.
The difference of $580,177 between the cash consideration of $910,391 and the carrying amount of net assets of Zeroboard business of $330,214 was recorded as gain on disposal included into the consolidated statements of operations in 2021.
20
On December 22, 2022, the Company disposed of Zeroboard shares at $1,379,992. The company recognized profit of $1,379,302 as gain on sale of investment securities.
On June 30, 2022, the Company disposed of Liberaware shares at $456,414. The company recognized profit of $422,358 as gain on sale of investment securities.
NOTE 19 SHAREHOLDERS EQUITY (DEFICIENCY)
Aerwins was authorized to issue 200,000,000 shares of common shares, par value of $0.0001 per share, and 20,000,000 shares of preferred shares, par value of $0.0001 per share.
Common stock issuance
On May 31, 2022, A.L.I. issued 33,100 shares of common stocks (Aerwins shares of 494,845) at 10,250 Yen (approximately $79.75) per share for an aggregate of 339,275,000 Yen (approximately $2,639,656) of proceeds in a private placement.
On June 30, 2022, A.L.I. issued 1,000 shares of common stocks (Aerwins shares of 14,950) at 10,250 Yen (approximately $75.54) per share for an aggregate of 10,250,000 Yen (approximately $ 75,540) of proceeds in a private placement.
On July 29, 2022, A.L.I. issued 40,200 shares of common stocks (Aerwins shares of 600,990) at 10,250 Yen (approximately $75.30) per share for an aggregate of 412,050,000 Yen (approximately $3,027,108) of proceeds in a private placement.
On July 31, 2022, A.L.I. issued 39,000 shares of common stocks (Aerwins shares of 583,050) at 10,250 Yen (approximately $75.30) per share for an aggregate of 399,750,000 Yen (approximately $2,936,747) of proceeds in a private placement.
Issuance costs related to the above common stock issuance were 35,896,589 Yen (approximately $279,868).
Exercise of stock acquisition rights
On June 29, 2022, 22 of stock acquisition rights were exercised to purchase 22 shares of A.L.I.s common stock (Aerwins shares of 329) at 5,000 Yen (approximately $36.63) per share for an aggregate of 110,000 Yen (approximately $806).
On June 30, 2022, 15,000 of stock acquisition rights were exercised to purchase 15,000 shares of A.L.I.s common stock (Aerwins shares of 224,250) at 3,307 Yen (approximately $24.37) per share for an aggregate of 49,605,000 Yen (approximately $365,576).
On July 19, 2022, 3,500 of stock acquisition rights were exercised to purchase 3,500 shares of A.L.I.s common stock (Aerwins shares of 52,325) at 5,000 Yen (approximately $36.25) per share for an aggregate of 17,500,000 Yen (approximately $126,867).
On July 27, 2022, 25,862 of stock acquisition rights were exercised to purchase 25,862 shares of A.L.I.s common stock (Aerwins shares of 386,637) at 5,000 Yen (approximately $36.41) per share for an aggregate of 129,310,000 Yen (approximately $941,737).
On September 14, 2022, the Company decided to acquire all outstanding stock acquisition rights issued by A.L.I. without consideration and cancelled them.
On July 21, 2022, A.L.I. issued common stock in exchange for preferred stock at a ratio of one share of common stock to one share of preferred stock. A.L.I. issued aggregate of 462,055 shares of common stock to exchange for 81,527 shares of Type A preferred stock, 60,478 shares of Type B preferred stock, 20,000 shares of Type C preferred stock, 300,000 shares of Type D preferred stock. No preferred shares were issued by Aerwins and outstanding as of September 30, 2022 (unaudited), and December 31, 2021.
21
On August 5, 2022, Aerwins issued 30,000,000 shares of its common shares to the shareholders of A.L.I. in exchange for 2,006,689 shares of common shares issued by A.L.I., representing 100% of A.L.I.s outstanding common shares. Under this share exchange, Aerwins is the legal acquirer. However, the share exchange has been accounted for as a recapitalization because Aerwins did not constitute a business. The consolidation of Aerwins and its subsidiaries has been accounted for at historical cost and prepared on the basis as if the transaction had become effective as of the beginning of the earliest presented in the accompanying consolidated financial statements.
The Company issued new shares of 3,658,026 for the year ended in December 31, 2022, and recognized Common stock of $365 and Additional Paid-in Capital of $17,010,152. As of December 31, 2022, there were 30,000,000 of common shares issued. The numbers of common shares are retrospectively presented and A.L.I.s legal capital is adjusted to reflect the legal capital of Aerwins.
No preferred shares were issued by Aerwins and outstanding as of December 31, 2022 and 2021.
NOTE 20 EARNINGS (LOSS) PER SHARE
Basic earnings (loss) per share is calculated on the basis of weighted-average outstanding common shares. Diluted earnings (loss) per share is computed on the basis of basic weighted-average outstanding common shares adjusted for the dilutive effect of stock options. Dilutive common shares are determined by applying the treasury stock method to the assumed conversion of share repurchase liability to common shares related to the early exercised stock options (also see NOTE 21).
The computation of basic and diluted earnings (loss) per share for the years ended December 31, 2022 and 2021 is as follows:
For the Years Ended | ||||||||
December 31, | ||||||||
2022 | 2021 | |||||||
Loss per share basic |
||||||||
Numerator: |
||||||||
Net loss from continuing operations |
$ | (14,479,819 | ) | $ | (14,527,021 | ) | ||
Net income (loss) from discontinued operations |
| (28,649 | ) | |||||
Denominator: |
||||||||
Weighted average number of common shares outstanding used in calculating basic earnings (loss) per share |
28,565,198 | 26,341,974 | ||||||
|
|
|
|
|||||
Denominator used for earnings (loss) per share |
||||||||
Earnings (loss) per share from continuing operations- basic |
$ | (0.51 | ) | $ | (0.55 | ) | ||
Earnings (loss) per share from discontinued operations - basic |
| (0.00 | ) |
Diluted basis loss per share are not disclosed because of no dilution.
NOTE 21 STOCK ACQUISITION RIGHTS
A.L.I. issued the following stock acquisition rights to its directors and employees.
22
1st | 2nd | 3rd | 4th | 5th | 6th | 7th | 8th | |||||||||||||||||||||||||
Grant date |
March 31, 2017 | July 11, 2018 | July 11, 2018 | October 17, 2018 | March 14, 2019 | March 13, 2019 | March 14, 2019 | December 29, 2020 | ||||||||||||||||||||||||
Number of shares at grant date |
150,000 | 15,000 | 45,000 | 10,000 | 67,000 | 5,750 | 27,000 | 5,000 | ||||||||||||||||||||||||
Outstanding at December 31, 2020 |
5,000 | 15,000 | 42,450 | 7,500 | 67,000 | 5,750 | 27,000 | 5,000 | ||||||||||||||||||||||||
Forfeited |
| | (11,500 | ) | | (3,900 | ) | (4,500 | ) | | | |||||||||||||||||||||
Outstanding at December 31, 2021 |
5,000 | 15,000 | 30,950 | 7,500 | 64,100 | 1,250 | 27,000 | 5,000 | ||||||||||||||||||||||||
Exercised |
| (15,000 | ) | | | (3,522 | ) | | (25,862 | ) | | |||||||||||||||||||||
Forfeited |
(5,000 | ) | | (30,950 | ) | (7,500 | ) | (60,578 | ) | (1,250 | ) | (1,138 | ) | (5,000 | ) | |||||||||||||||||
Outstanding at December 31, 2022 |
| | | | | | | | ||||||||||||||||||||||||
Exercise price (JPY) |
900 | 3,307 | 1,800 | 3,500 | 5,000 | 5,000 | 5,000 | 10,000 | ||||||||||||||||||||||||
|
(Approximately $6.82) |
|
|
(Approximately $13.65) |
|
|
(Approximately $13.65) |
|
|
(Approximately $26.55) |
|
|
(Approximately $37.93) |
|
|
(Approximately $37.93) |
|
|
(Approximately $37.93) |
|
|
(Approximately $75.86) |
|
The company does not recognize expenses from the stock acquisition rights because the Company determined that the compensation expenses are immaterial. On September 14, 2022, the Company decided to acquire all the stock acquisition rights without consideration and to cancel them.
NOTE 22 STOCK-BASED COMPENSATION
On July 27, 2022, Aerwins issued stock options to certain directors of the Company which can be exercised for a total of 2,648,000 shares of the Companys common stock with an exercise price of $0.00015 per share and a vesting period shall commence on the first business day following the occurrence of going public (the Trigger Date), and thereafter (i) one third of the option shall vest on the three months anniversary of the Trigger Date, (ii) one third of the option shall vest on the fifteen month anniversary of the Trigger Date; and (iii) the remaining one third of the option shall vest on the twenty seven month anniversary of the Trigger Date. The remaining weighted average contractual life as of December 31, 2022, is 9.58 years.
Grant date |
July 27, 2022 | |||
Number of shares at grant date |
2,648,000 | |||
Outstanding at December 31, 2022 |
2,648,000 | |||
Exercise price |
$ | 0.00015 | ||
Consideration paid to the Company |
$ | 132 |
The Company estimated the fair value of the stock-based compensation at $0.00005 using the Binomial Option Pricing Model with the following assumption inputs.
Exercise period |
5 years | |||
Share price on the issuance date |
$ | 0.0001 | ||
Volatility |
64.22 | % | ||
Expected dividend rate |
0 | % | ||
Risk-free interest rate |
2.88 | % |
23
NOTE 23 - SUBSEQUENT EVENTS
On February 3, 2023, following the approval at the special meeting of the shareholders of Pono Capital Corp, Pono Merger Sub, Inc., a wholly-owned subsidiary of Pono Capital Corp consummated a merger with and into AERWINS, Inc. (formerly named AERWINS Technologies Inc.) pursuant to an agreement and plan of merger. At the closing on February 3, 2023 of the business combination, Pono Merger Sub merged with and into AERWINS with AERWINS surviving the merger as a wholly-owned subsidiary of Pono Capital Corp, and Pono Capital Corp changed its name to AERWINS Technologies Inc.
On February 27, 2023, the Companys wholly owned subsidiary in Japan, A.L.I. Technologies, entered into a loan agreement with Shuhei Komatsu, the Companys Chief Executive Officer. Pursuant to the Agreement, Mr. Komatsu agreed to lend A.L.I. 200,000,000 yen (approximately $1,469,400 US Dollars based on a conversion rate of $0.007347 US Dollar for each $1 yen as of February 27, 2023). The maturity date of the loan is April 15, 2023. The interest rate under the agreement is 2.475% per annum, and the interest period is from February 27, 2023 until the maturity date. The Company has paid 100,000,000 yen (approximately $734,700) as of April 27, 2023.
24
Exhibit 99.4
MANAGEMENTS DISCUSSION AND ANALYSIS OF FINANCIAL CONDITION AND RESULTS OF OPERATIONS OF AERWINS
The following discussion and analysis of AERWINS financial condition and results of operations should be read in conjunction with AERWINS financial statements and related notes that appear elsewhere in this proxy statement/prospectus. In addition to historical information, this discussion and analysis contains forward-looking statements that involve risks, uncertainties, assumptions and other factors that could cause actual results to differ materially from those made, projected or implied in the forward-looking statements. Factors that could cause or contribute to these differences include, but are not limited to, those discussed below and elsewhere particularly in the Risk Factors and Cautionary Note Regarding Forward-Looking Statements sections of this proxy statement/prospectus.
Business Overview
We were incorporated in the State of Delaware on June 9, 2022. We conduct business activities principally through our 100%-owned subsidiary, A. L. I. Technologies Inc., a Japanese corporation (A. L. I. Technologies), which was established in Japan in September 2016 and was acquired by us in August, 2022.
The acquisition of A. L. I. Technologies was accounted for as a recapitalization among entities under common control since the same controlling shareholders controlled all these entities before and after the transaction. The consolidation of the Company and its subsidiaries has been accounted for at historical cost and prepared on the basis as if the transaction had become effective as of the beginning of the first period presented in the accompanying consolidated financial statements.
We are developing our air mobility business with the aim of contributing to society as a global company that leads the air mobility society by providing infrastructure that enables anyone to use the airspace safely, securely, and conveniently through the constant challenge of new technologies and their implementation in society.
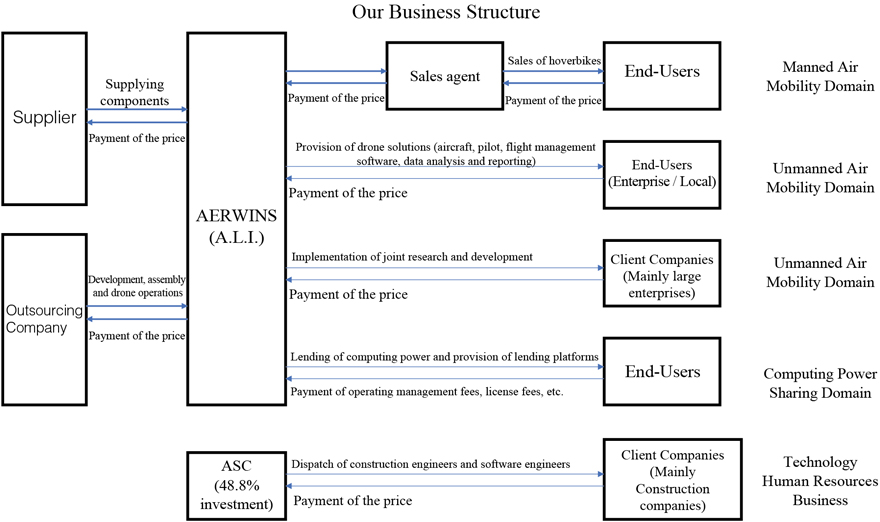
To realize this vision, we are developing the following business areas:
(1) manned air mobility area, which involves the sale and development of hoverbikes that can float at low altitude through difficult-to-move zones in times of disaster,
(2) unmanned air mobility domain, which provides solutions utilizing industrial drones (integrated provision of R&D, aircraft rental or sales, operators, operation management, and other software); and
(3) the computing power sharing domain, which provides services such as blockchain verification and AI.
1
Significant Market Opportunities
In todays increasingly populated and interconnected world, traditional modes of urban transportation continue to contribute to congestion and pollution, and they are largely confined to land-based infrastructure. Mobility for the future requires a revolutionary solution.
The market opportunities created by our technology are significant. According to an analysis by Frost & Sullivan, the autonomous vehicle services market is expected to grow from a mere $1.1 billion in 2019 to $202.5 billion in 2030 at a CAGR of 60.1%, facilitated by mutually beneficial business models across the entire mobility value chain. To capture the significant growth potential in the AAV market, we strive to continue to innovate and expand the boundaries for air-based mobility.
The sky above has always held possibilities, and we have already completed our first manned flight test with a test aircraft in 2019, and our business is progressing well since then. We plan to work with business partners, mainly in the Middle East area, for additional development, production and sales to realize products that can be utilized in the Middle East area. In the future, we are also preparing to develop new models that are electrically powered and even more compact, and to provide infrastructure such as airways and air traffic control systems in an air mobility society.
We are one step closer to making safe, cost-effective, and easy-to-use air mobility solutions a reality. Our air mobility enables urban mobility to expand into three-dimensional space. We believe our technology will change the future of transportation, improve lives, and create new industries.
We design, develop, manufacture, market, and operate unmanned aircraft and their supporting systems and infrastructure for a wide range of industries and applications, including passenger transportation, logistics, and smart city management. Our goal is to ensure that both passengers and goods take to the skies safely and conveniently.
Orders, Delivery and Financial Results
We are developing the following business areas:
(1) manned air mobility area, which involves the sale and development of hoverbikes that can float at low altitude through difficult-to-move zones in times of disaster;
2
(2) unmanned air mobility domain, which provides solutions utilizing industrial drones (integrated provision of R&D, aircraft rental or sales, operators, operation management, and other software); and
(3) the computing power sharing domain, which provides services such as blockchain verification and AI.
For the fiscal years ended December 31, 2022 and 2021, we generated revenues of $5,270,490 and $7,830,130, respectively, from continuing operations, and reported net loss of $14,479,819 and net loss of $14,527,021, respectively from continuing operations, and cash flows used in operating activities of $16,865,274 and $10,119,103, respectively. As noted in our consolidated financial statements, as of December 31, 2022, we had an accumulated deficit of $46,472,904.
Key Factors that Affect Our Results of Operations
We believe the following key factors may affect our financial condition and results of operations:
Our Ability to Strength Our Competitive Advantages
Our results of operations rely on our purported product superiority. Both hardware and software technologies are key factors intended to strengthen our competitive advantages. Regarding hardware, we developed air mobility CFRP material for XTURISMO which reduced the weight of the open propeller and its body. CFRP is also easy to process and corresponds to various designs, and has strong resistance to dust and salt air. We also developed an original body and steering wheel which enables a driver to drive manually easier. The original hybrid engine has high power generation with low revolution with electric supply support to control system device. Regarding software, the stability control of XTURISMO assists driving by sensor fusion surrounding the body and links with cloud real time with encrypted driving and control data communication. Also, C.O.S.M.O.S., the air traffic control platform connects with each hoverbike and provides flight and network management. These hardware and software are all made in Japan.
Our Ability to Expand International Market
We are seeking to promote global expansion using partnerships, and our ability to succeed in this endeavor will affect our results of operations. Especially in Gulf Cooperation Council, we have partners for creating the business in the area and will raise fund which we believe enables the Company to establish an office and R&D center in the area and we also intend that the area can be a distribution, manufacturing and marketing hub for the vehicles. After that or at the same time, we plan to expand sales channels to other regions including the United States. Also, in order to facilitate such global expansion, the Company plans to acquire human resources in various countries, and the Company intends that by 2024, over 50% of its employees will be non-Japanese.
Our Ability to Control Costs and Expenses and Improve Our Operating Efficiency
We are aiming to establish a highly profitable structure for a mass production of hoverbikes by using a fabless model which focuses on design and supply chain control. We plan to select subcontractors and suppliers appropriately based on cost, quality, and delivery date, and seek to build an efficient production system. We also hope to sign a partnership agreement with a local government to implement hoverbikes in society. We aim to reduce the cost of developing advanced technologies and implementing our products in society by utilizing subsidies as part of such support.
3
A Severe or Prolonged Slowdown in the Global and Japan Economy Could Materially and Adversely Affect Our Business and Our Financial Condition
In recent years, the economic indicators in Japan have shown mixed signs, and future growth of the Japanese economy is subject to many factors beyond our control. The Japanese economy is gradually recovering due to the effects of various government policies which encourage the transition to the post-covid society. However, it is necessary to note downside risks due to fluctuations in the financial markets, price increase, and supply-chain constraints as global monetary tightening is progressing. Any future deterioration of the Japanese or global economy may result in a decline in consumption that would have a negative impact on demand for our products and their prices.
Results of Operations
Comparison of Results of Operations for the Fiscal Years Ended December 31, 2022 and 2021
The following table summarizes our operating results as reflected in our statements of income during the fiscal years ended December 31, 2022 and 2021, respectively, and provides information regarding the dollar and percentage increase or (decrease) during such periods.
For the Years ended December 31, | ||||||||||||||||||||||||
2022 | 2021 | Variance | ||||||||||||||||||||||
Amount | % of revenue |
Amount | % of | |||||||||||||||||||
REVENUE |
$ | 5,207,490 | 100.0 | % | $ | 7,830,130 | 100 | % | $ | (2,622,640 | ) | -33.5 | % | |||||||||||
COST OF REVENUE |
5,070,507 | 97.4 | % | 6,433,913 | 82.2 | % | (1,363,406 | ) | -21.2 | % | ||||||||||||||
|
|
|
|
|
|
|
|
|
|
|
|
|||||||||||||
GROSS PROFIT |
136,983 | 2.6 | % | 1,396,217 | 17.8 | % | (1,259,234 | ) | -90.2 | % | ||||||||||||||
|
|
|
|
|
|
|
|
|
|
|
|
|||||||||||||
Operating expenses |
||||||||||||||||||||||||
Selling expenses |
90,654 | 1.7 | % | 259,799 | 3.3 | % | (169,145 | ) | -65.1 | % | ||||||||||||||
General and administrative expenses |
7,212,327 | 138.5 | % | 5,839,433 | 74.6 | % | 1,372,894 | 23.5 | % | |||||||||||||||
Research and development expenses |
8,926,205 | 171.4 | % | 9,335,977 | 119.2 | % | (409,772 | ) | -4.4 | % | ||||||||||||||
Total operating expenses |
16,229,186 | 311.7 | % | 15,435,209 | 197.1 | % | 793,977 | 5.1 | % | |||||||||||||||
|
|
|
|
|
|
|
|
|
|
|
|
|||||||||||||
Loss from operations |
(16,092,203 | ) | -309.0 | % | (14,038,992 | ) | -179.3 | % | (2,053,211 | ) | 14.6 | % | ||||||||||||
|
|
|
|
|
|
|
|
|
|
|
|
|||||||||||||
Other income (expenses) |
1,613,927 | 31.0 | % | (488,029 | ) | -6.2 | % | 2,101,956 | -430.7 | % | ||||||||||||||
|
|
|
|
|
|
|
|
|
|
|
|
|||||||||||||
Loss before income tax provision |
(14,478,276 | ) | -278.0 | % | (14,527,021 | ) | -185.5 | % | 48,745 | -0.3 | % | |||||||||||||
|
|
|
|
|
|
|
|
|
|
|
|
|||||||||||||
Income taxes expense |
(1,543 | ) | -0.0 | % | | | (1,543 | ) | | |||||||||||||||
|
|
|
|
|
|
|
|
|
|
|
|
4
For the Years ended December 31, | ||||||||||||||||||||||||
2022 | 2021 | Variance | ||||||||||||||||||||||
Amount | % of revenue |
Amount | % of | |||||||||||||||||||
Net loss from continuing operations |
(14,479,819 | ) | -278.1 | % | (14,527,021 | ) | -185.5 | % | 47,202 | -0.3 | % | |||||||||||||
|
|
|
|
|
|
|
|
|
|
|
|
|||||||||||||
Less: net income (loss) attributable to non-controlling interest |
| | % | | % | % | ||||||||||||||||||
|
|
|
|
|
|
|||||||||||||||||||
Net loss from discontinued operations |
| | 28,649 | -0.4 | % | 28,649 | -100.0 | % | ||||||||||||||||
NET INCOME (LOSS) ATTRIBUTABLE TO AERWINS TECHNOLOGIES INC. |
$ | (14,479,819 | ) | -278.1 | % | $ | (14,555,670 | ) | -185.9 | % | $ | 75,851 | -0.5 | % | ||||||||||
|
|
|
|
|
|
|
|
|
|
|
|
Revenue
Our total revenues decreased by $2,622,640, or 33.5%, to $5,207,490 for the year ended December 31, 2022 from $7,830,130 for the year ended December 31, 2021. The decrease in our revenues was mainly due to the depreciation of JPY and decrease in sales from shared computing business.
Cost of Revenue
Our total costs of revenues decreased by $1,363,406, or 21.2%, to $5,070,507 for the year ended December 31, 2022 from $6,433,913 for the year ended December 31, 2021. The decrease in our costs was attributable to the decrease of the sales described above.
5
Gross Profit
Our total gross profit decreased by $1,259,234, or 90.2%, to $136,983 for the year ended December 31, 2022 from $1,396,217 for the year ended December 31, 2021. For the reasons discussed above, our overall gross profit margin decreased by 15.2% to 2.6% in the fiscal year 2022 from 17.8% in the fiscal year 2021.
Operating Expenses
The following table sets forth the breakdown of our operating expenses for the fiscal years ended December 31, 2022 and 2021:
For the Years ended December 31, | ||||||||||||||||||||||||
2022 | 2021 | Variance | ||||||||||||||||||||||
% of | % of | |||||||||||||||||||||||
Amount | revenue | Amount | revenue | Amount | % of | |||||||||||||||||||
Total revenue |
$ | 5,207,490 | 100 | % | $ | 7,830,130 | 100 | % | $ | (2,622,640 | ) | (33.5 | )% | |||||||||||
Operating expenses |
||||||||||||||||||||||||
Selling expenses (advertising expenses) |
90,654 | 1.7 | % | 259,799 | 3.3 | % | (169,145 | ) | (65.1 | )% | ||||||||||||||
General and administrative expenses |
7,212,327 | 138.5 | % | 5,839,433 | 74.6 | % | 1,372,894 | 23.5 | % | |||||||||||||||
Research and development expenses |
8,926,205 | 171.4 | % | 9,335,977 | 119.2 | % | (409,772 | ) | (4.4 | )% | ||||||||||||||
|
|
|
|
|
|
|
|
|
|
|
|
|||||||||||||
Total operating expenses |
$ | 16,229,186 | 311.7 | % | $ | 15,435,209 | 197.1 | % | $ | 793,977 | 5.1 | % | ||||||||||||
|
|
|
|
|
|
|
|
|
|
|
|
General and Administrative Expenses
Our general and administrative expenses primarily consist of employee salaries and welfare, consulting and professional service fees incurred for company reorganization and going public, depreciation and amortization expenses, rental expenses, office, utility and other expenses, bad debt expenses, and travel and entertainment expenses.
For the Years ended December 31, | ||||||||||||||||||||||||
2022 | 2021 | Variance | ||||||||||||||||||||||
Amount | % of* | Amount | % of | Amount | % of | |||||||||||||||||||
General and Administrative Expenses |
||||||||||||||||||||||||
Salaries and welfare |
$ | 2,744,757 | 38.1 | % | $ | 2,800,058 | 48.0 | % | $ | (55,301 | ) | (2.0 | )% | |||||||||||
Consulting and professional service fees |
2,680,345 | 37.2 | % | 1,527,311 | 26.2 | % | 1,153,034 | 75.5 | % | |||||||||||||||
Depreciation expense |
141,026 | 2.0 | % | 86,025 | 1.5 | % | 55,001 | 63.9 | % | |||||||||||||||
Rent expense |
148,474 | 2.1 | % | 243,265 | 4.2 | % | (94,791 | ) | (39.0 | )% | ||||||||||||||
Office, utility and other expenses |
674,238 | 9.3 | % | 472,868 | 8.1 | % | 201,370 | 42.6 | % | |||||||||||||||
Travel and entertainment expense |
395,708 | 5.5 | % | 145,598 | 2.5 | % | 250,110 | 171.8 | % | |||||||||||||||
|
|
|
|
|
|
|
|
|
|
|
|
|||||||||||||
Commission fees expenses |
46,673 | 0.6 | % | 302,495 | 5.2 | % | (255,822 | ) | (84.6 | )% | ||||||||||||||
|
|
|
|
|
|
|
|
|
|
|
|
|||||||||||||
Other expenses |
381,106 | 5.3 | % | 261, | 4.5 | % | 119,2 | 45.6 | % | |||||||||||||||
|
|
|
|
|
|
|
|
|
|
|
|
|||||||||||||
Total general and administrative expenses |
$ | 7,212,327 | 100 | % | $ | 5,839,433 | 100 | % | $ | 1,372,894 | 23.5 | % | ||||||||||||
|
|
|
|
|
|
|
|
|
|
|
|
* | Refers to the percentage of total general and administrative expenses. |
Our general and administrative expenses increased by $1,372,894 or 23.5%, to $7,212,327 in the fiscal year 2022 from $5,839,433 in the fiscal year 2021, primarily attributable to an increase of consulting and professional service fees, mainly outsourcing fees paid to professionals for the completion of the merger with Pono Capiral Corp.
6
The overall increase in our general and administrative expenses in fiscal year 2022 as compared to fiscal year 2021 reflected the above-mentioned factors combined. As a percentage of revenues, general and administrative expenses were 138.5% and 74.6% of our revenue for the fiscal years ended December 31, 2022 and 2021, respectively.
Research and development expenses
Our research and development expenses primarily consist of employee salaries and welfare, and outsourcing expenses.
For the Years ended December 31, | ||||||||||||||||||||||||
2022 | 2021 | Variance | ||||||||||||||||||||||
Amount | % of* | Amount | % of | Amount | % of | |||||||||||||||||||
Research and Development Expenses |
||||||||||||||||||||||||
Raw materials |
$ | 2,727,178 | 30.6 | % | $ | 2,434,512 | 26.1 | % | $ | 292,666 | 12.0 | % | ||||||||||||
Labor cost |
1,675,129 | 18.8 | 1,142,652 | 12.2 | 532,478 | 46.6 | ||||||||||||||||||
Outsourcing expenses |
3,762,590 | 42.2 | 5,062,176 | 54.2 | -1,299,586 | (25.7 | ) | |||||||||||||||||
|
|
|
|
|
|
|
|
|
|
|
|
|||||||||||||
Other expenses |
761,307 | 8.4 | 696,637 | 7.5 | 64,670 | 9.3 | ||||||||||||||||||
|
|
|
|
|
|
|
|
|
|
|
|
|||||||||||||
Total research and development expenses |
$ | 8,926,205 | 100.0 | % | $ | 9,335,977 | 100.0 | % | $ | -409,772 | (4.4 | )% | ||||||||||||
|
|
|
|
|
|
|
|
|
|
|
|
* | Refers to the percentage of total research and development expenses. |
Our research and development expenses decreased by $409,772, or 4.4%, to $8,926,205 in the year ended December 31, 2022 from $9,335,977 in the year ended December 31, 2021, primarily attributable to the decrease in outsourcing expenses for development of XTURISMO.
As a percentage of revenues, research and development expenses were 171.4% and 119.2% of our revenue for the fiscal years ended December 31, 2022 and 2021, respectively.
Other Income (Expenses), net
Our other income (expenses) primarily includes gain or loss on disposal of fixed assets, impairment on fixed assets and financial related expenses. Total other income in the fiscal year 2022 was $1,613,927, and the total net expenses in the fiscal year 2021 was $422,469.
The Company disposed part of its business of Zeroboard and recognized $580,177 of gain on disposal of the business in the fiscal year 2021.
In the fiscal year 2022, the Company recognized impairment loss of fixed assets of $511,695 and recognized $1,801,660 of gain on sale of investment securities from sale of Zeroboard and Liberaware stocks (See Note 18).
Provision for Income Taxes
Our provision for income taxes was $1,543 and zero in the fiscal year 2022 and 2021 respectively.
7
Net Income (Loss)
As a result of the foregoing, we reported a net loss of $14,479,819 for the fiscal year ended December 31, 2022, representing a $47,202 or 0.3% decrease from a net loss of $14,527,021 for the fiscal year ended December 31, 2021. All net income is attributable to AERWINS Technologies Inc.
Liquidity and Capital Resources
As of December 31, 2022, we had $1,278,026 in cash as compared to $10,020,459 as of December 31, 2021. We also had $980,688 in accounts receivable as of December 31, 2022 as compared to $725,287 as of December 31, 2021. Our accounts receivable primarily include balance due from customers AMVs sold and services provided and accepted by customers.
As of December 31, 2022, our working capital balance was $2,325,029. In assessing our liquidity, management monitors and analyzes our cash, our ability to generate sufficient revenue in the future, and our operating and capital expenditure commitments. We believe that our current cash and cash flows provided by operating activities, borrowings from banks and from our principal shareholders, and other capital raising contracts including the standby equity purchase agreement will be sufficient to meet our working capital needs in the next 12 months from the date the audited financial statements were issued. Even though we face uncertainties with regards to the size and timing of capital-raising, we are confident that we can continue to meet operational needs solely by utilizing cash flows generated from our operating activities and shareholder working capital funding, as necessary.
Cash Flows for the Years Ended December 31, 2022 and 2021
The following table sets forth summary of our cash flows for the periods indicated:
For the Years Ended December 31, |
||||||||
2022 | 2021 | |||||||
Net cash provided by (used in) operating activities |
$ | (16,865,274 | ) | $ | (10,119,103 | ) | ||
Net cash provided by (used in) investing activities |
(344,964 | ) | 293,303 | |||||
Net cash provided by (used in) financing activities |
9,579,119 | 6,380,047 | ||||||
Effect of exchange rate changes |
(1,111,314 | ) | (1,603,633 | ) | ||||
Net increase (decrease) in cash and cash equivalents |
(7,631,119 | ) | (3,284,283 | ) | ||||
Cash and cash equivalents, beginning of the year |
10,020,459 | 14,619,164 | ||||||
|
|
|
|
|||||
Cash and cash equivalents, end of the year |
$ | 1,278,026 | $ | 10,020,459 | ||||
|
|
|
|
Operating Activities
Net cash used in operating activities was $16,865,274 for the year ended December 31, 2022, primarily consisting of the following:
| Net loss of $14,479,819 for the fiscal year. |
| Depreciation expenses of $327,576. |
| An increase in inventory of $2,483,254, as raw materials increased to prepare for manufacturing hoverbikes. |
| Gain on sale of investment securities of $1,801,660. |
8
Net cash used in operating activities was $10,119,103 for the year ended December 31, 2021, primarily consisting of the following:
| Net loss of $14,527,021 for the fiscal year. |
| Depreciation expenses of $193,812. |
| A decrease in accounts receivable of $3,289,638, as the relevant sales increased from the prior year |
| Gain on disposal of business of $580,177. |
Investing Activities
Net cash used by investing activities amounted to $344,964 for the year ended December 31, 2022, and primarily included purchase of fixed assets of $950,500, purchase of investment securities of $575,000 and proceeds from disposal of investments of $1,189,725.
Net cash provided by investing activities amounted to $293,303 for the year ended December 31, 2021, and primarily included purchase of fixed assets of $866,862, proceeds from disposal of a subsidiary of $473,123 and proceeds from disposal of a business of $819,352.
Financing Activities
Net cash provided by financing activities amounted to $9,579,119 for the fiscal year ended December 31, 2022, primarily consisting of proceeds from capital contribution of $9,834,302 and repayments to loans of $171,384.
Net cash provided by financing activities amounted to $6,380,047 for the fiscal year ended December 31, 2021, primarily consisting of proceeds from issuance of bonds of $7,524,383 and proceeds from loans of $1,165,937 and repayment to loans of $2,262,294.
Contractual obligations
Lease commitment
The Companys subsidiary, A. L. I. Technologies entered into 13 leases for its office space, multi-function printers and a vehicle, which were classified as operating leases. A. L. I. Technologies also entered into two leases for containers, and these leases were classified as finance leases.
As of December 31, 2022, future minimum lease payments under the non-cancelable lease agreements are as follows:
Year ending December 31, |
Finance lease |
Operating lease |
||||||
2023 |
$ | 105,775 | $ | 298,580 | ||||
2024 |
54,888 | 244,125 | ||||||
2025 |
11,271 | 157,099 | ||||||
2026 |
11,271 | | ||||||
Thereafter |
14,088 | | ||||||
|
|
|
|
|||||
Total lease payments |
197,293 | 699,804 | ||||||
Less: imputed interest |
(8,123 | ) | (8,374 | ) | ||||
|
|
|
|
|||||
Total lease liabilities |
189,170 | 691,430 | ||||||
Less: current portion |
102,114 | 293,710 | ||||||
|
|
|
|
|||||
Non-current lease liabilities |
$ | 87,056 | $ | 397,720 | ||||
|
|
|
|
9
Long Term Debt
The Companys long-term debts included bond payable and loans borrowed from banks and other financial institutions.
As of December 31, 2022, future minimum loan payments are as follows:
Year ending December 31, | Loan Payment |
|||
2023 |
$ | 77,930 | ||
2024 |
332,900 | |||
2025 |
354,339 | |||
2026 |
2,240,117 | |||
2027 |
341,942 | |||
Thereafter |
23,352 | |||
|
|
|||
Total |
3,370,580 | |||
|
|
|||
Less interest |
56,719 | |||
|
|
|||
Balance as of December 31, 2022 |
$ | 3,313,861 | ||
|
|
Off-Balance Sheet Arrangements
We did not have any off-balance sheet arrangements as of December 31, 2022 and 2021.
Critical Accounting Policies and Estimates
Our discussion and analysis of our financial condition and results of operations are based upon our consolidated financial statements. These financial statements are prepared in accordance with U.S. GAAP, which requires us to make estimates and assumptions that affect the reported amounts of our assets and liabilities and revenue and expenses, to disclose contingent assets and liabilities on the date of the consolidated financial statements, and to disclose the reported amounts of revenue and expenses incurred during the financial reporting period. The most significant estimates and assumptions include the valuation of accounts receivable, advances to suppliers, useful lives of property and equipment, the recoverability of long-lived assets, provision necessary for contingent liabilities, and revenue recognition. We continue to evaluate these estimates and assumptions that we believe to be reasonable under the circumstances. We rely on these evaluations as the basis for making judgments about the carrying values of assets and liabilities that are not readily apparent from other sources. Since the use of estimates is an integral component of the financial reporting process, actual results could differ from those estimates. Some of our accounting policies require higher degrees of judgment than others in their application. We believe critical accounting policies as disclosed in this prospectus reflect the more significant judgments and estimates used in preparation of our consolidated financial statements.
The following critical accounting policies rely upon assumptions and estimates and were used in the preparation of our consolidated financial statements:
Use of Estimates
In preparing the consolidated financial statements in conformity U.S. GAAP, the management is required to make certain estimates and assumptions that affect the reported amounts of assets and liabilities and disclosure of contingent assets and liabilities at the date of the financial statements and the reported amounts of revenues and expenses during the reporting period. These estimates are based on information available as of the date of the consolidated financial statements. Significant estimates required to be made by management include, but are not limited to, the allowance for doubtful accounts, useful lives of property and equipment, the impairment of long- lived assets, valuation allowance of deferred tax assets, and revenue recognition. Actual results could differ from those estimates.
10
Accounts Receivable
Accounts receivable, net represent the amounts that the Company has an unconditional right to consideration, which are stated at the original amount less an allowance for doubtful receivables. The Company reviews the accounts receivable on a periodic basis and makes general and specific allowances when there is doubt as to the collectability of individual balances. The Company usually determines the adequacy of reserves for doubtful accounts based on individual account analysis and historical collection trends. The Company establishes a provision for doubtful receivables when there is objective evidence that the Company may not be able to collect amounts due. The allowance is based on managements best estimates of specific losses on individual exposures, as well as a provision on historical trends of collections. The provision is recorded against accounts receivables balances, with a corresponding charge recorded in the consolidated statements of income and comprehensive income. Delinquent account balances are written off against the allowance for doubtful accounts after management has determined that the likelihood of collection is remote. In circumstances in which the Company receives payment for accounts receivable that have previously been written off, the Company reverses the allowance and bad debt.
Lease-Lessee
In accordance with the Accounting Standards Update (ASU) 2016-02 Leases (Topic 842), the Company determines whether a contract is or contains a lease at inception of the contract and whether that lease meets the classification criteria of a finance or operating lease. Lease terms of certain operating leases include the non-cancellable period for which the Company has the right to use the underlying asset, together with renewal option periods when the exercise of the renewal option is reasonably certain.
11
The Company leases office facilities, which are classified as operating leases and leases office equipment and furniture, and a vehicle, which are classified as a finance lease in accordance with Topic 842. Under Topic 842, lessees are required to recognize the following for all leases on the commencement date: (i) lease liability, which is a lessees obligation to make lease payments arising from a lease, measured on a discounted basis; and (ii) right-of-use asset, which is an asset that represents the lessees right to use, or control the use of, a specified asset for the lease term. Operating leases are included in operating lease right-of-use assets, operating lease liabilities, current, and operating lease liabilities, non-current, and finance leases are included in property and equipment, finance lease liabilities, current, and finance lease liabilities, non-current in the consolidated balance sheet.
As most of the Companys leases do not provide an implicit rate, the Company uses its incremental borrowing rate based on the information available at commencement date in determining the present value of future payments.
The Company has elected the short-term lease exception, and therefore operating lease right-of-use assets and liabilities do not include leases with a lease term of twelve months or less.
Foreign Currency Translation
The Company maintains its books and record in its local currency, Japanese YEN (JPY), which is a functional currency as being the primary currency of the economic environment in which its operation is conducted. Transactions denominated in currencies other than the functional currency are translated into the functional currency at the exchange rates prevailing at the dates of the transaction. Monetary assets and liabilities denominated in currencies other than the functional currency are translated into the functional currency using the applicable exchange rates at the balance sheet dates. The resulting exchange differences are recorded in the statements of operations.
The reporting currency of the Company is the United States Dollars (US$), and the accompanying consolidated financial statements have been expressed in US$. In accordance with ASC Topic 830-30, Translation of Financial Statements, assets and liabilities of the Company whose functional currency is not US$ are translated into US$, using the exchange rate on the balance sheet date. Revenues and expenses are translated at average rates prevailing during the period. The gains and losses resulting from the translation of financial statements are recorded as a separate component of accumulated other comprehensive loss within the statements of changes shareholders deficit.
Translation of amounts from the local currency of the Company into US$1 has been made at the following exchange rates:
December 31, 2022 |
December 31, 2021 |
|||||||
Current JPY: US$1 exchange rate |
131.81 | 115.17 | ||||||
Average JPY: US$1 exchange rate |
131.46 | 109.84 |
Revenue Recognition
The Company recognize revenue under ASC 606, Revenue from Contracts with customers.
To determine revenue recognition for contracts with customers, the Company performs the following five steps : (i) identify the contract(s) with the customer, (ii) identify the performance obligations in the contract, (iii) determine the transaction price, including variable consideration to the extent that it is probable that a significant future reversal will not occur, (iv) allocate the transaction price to the respective performance obligations in the contract, and (v) recognize revenue when (or as) the Company satisfies the performance obligation. Revenue amount represents the invoiced value, net of a value-added tax (Consumption Tax) and applicable local government levies. The Consumption Tax on sales is calculated at 8% before October 1, 2020, and 10% afterwards of gross sales.
12
The Company currently generates its revenue from the following main sources:
Revenue from Sales of Computing Equipment
Revenues from the sale of equipment are recognized at the point in time when obligations under the terms of a contract with our customer are satisfied and control has been transferred to the customer. For equipment placements that require us to install the product at the customer location, revenue is normally recognized when the equipment has been delivered and installed at the customer location. Sales of customer installable products are recognized upon shipment or receipt by the customer according to the customers shipping terms.
Revenue from Computing Power Sharing services with Equipment Installation
The Company provides customers with computing power sharing services with equipment installation, which includes a one-time equipment installation and a certain period of time technology service. The Company recognizes revenue from one-time equipment installation at the point in time when the installation is completed and accepted by the customer. The Company recognizes revenue from technology service over time when the service is rendered and accepted by the customer, normally monthly.
Revenue from Computing Power Sharing services without Equipment Installation
The Company also provides customers with computing power sharing services without equipment installation, which includes a one-time platform set up without equipment installation, and a certain period of time technology service. The Company recognizes revenue from one-time platform set up at the point in time when the platform is set up to function and accepted by the customer. The Company recognizes revenue from technology service over time when the service is rendered and accepted by the customer, normally monthly.
Revenue from Air Mobility Drone Solution
The Company provides customers with air mobility drone solution, which includes UAS (Unmanned Aircraft Systems) main equipment, laser scanner, software package, camera system, etc. The solution includes a one-time system set up and a certain period of time technology service. The Company recognizes revenue from one-time system set up at the point in time when the system is set up to function and accepted by the customer. The Company recognize revenue from technology service over time when the service is rendered and accepted by the customer, normally monthly.
Revenue from Project Management
The Company provides customers with project management, which includes project planning and implement, and providing needed technology human resources, such as construction engineers and software engineers for various projects. The Company recognizes revenue from project management over time when the service is rendered and accepted by the customer, normally monthly.
Revenue from Outsourcing Service
The Company provides customers with outsourcing service of temporary staffing for construction or technology industries. The Company recognizes revenue from outsourcing over time as the service is rendered.
13
Disaggregation of Revenue
The Company disaggregates its revenues from contracts by service types, as the Company believes it best depicts how the nature, amount, timing and uncertainty of the revenue and cash flows are affected by economic factors. The Companys disaggregation of revenues for the years ended December 31, 2022 and 2021 is as following:
For the Years Ended | ||||||||
December 31, | ||||||||
2022 | 2021 | |||||||
Revenue from Sales of Computing Equipment |
$ | 894,736 | $ | 879,164 | ||||
Revenue from Computing Power Sharing services |
1,092,012 | 2,166,953 | ||||||
Revenue from Project Management for Computing Share |
595,745 | 2,172,421 | ||||||
Revenue from Air Mobility Drone Solution |
797,396 | 822,078 | ||||||
Revenue from Project Management |
1,727,601 | 1,507,409 | ||||||
Other |
100,000 | 282,105 | ||||||
|
|
|
|
|||||
Total Revenue |
$ | 5,207,490 | $ | 7,830,130 | ||||
|
|
|
|
As of December 31, 2022 and 2021, and for the years then ended, almost all the revenue generated are attributed to the Companys operation in Japan.
Share-based Compensation
The Company accounts for share-based compensation awards in accordance with ASC 718, Compensation Stock Compensation. The cost of services received from employees and non-employees in exchange for awards of equity instruments is recognized in the consolidated statement of operations based on the estimated fair value of those awards on the grant date and amortized on a straight-line basis over the requisite service period or vesting period. The Company records forfeitures as they occur.
14
Exhibit 99.5
UNAUDITED PRO FORMA CONDENSED COMBINED AND CONSOLIDATED FINANCIAL INFORMATION
This Unaudited Pro Forma Condensed Consolidated Combined Financial Information is included as Exhibit 99.5 to the Current Report on Form 8-K/A (the Form 8-K/A) filed by AERWINS Technology Inc. (the Company or AERWINS) with the Securities and Exchange Commission (the SEC) on April 27, 2023. Defined terms included below have the same meaning as terms defined and included in Companys Current Report on Form 8-K filed with the SEC on February 9, 2023 (the Original 8-K) to which the Form 8-K/A relates and, if not defined in the Original Form 8-K, in the final prospectus and definitive proxy statement filed with the SEC pursuant to Rule 424(b)(3) on January 13, 2023 (the Proxy Statement/Prospectus). Unless the context otherwise requires, AERWINS refers to AERWINS Technology Inc. prior to the Closing, and Pono refers to Pono Capital Corp. prior to the Closing.
The following unaudited pro forma condensed consolidated combined financial information has been prepared in accordance with Article 11 of Regulation S-X as amended by the final rule, Release No. 33-10786 Amendments to Financial Disclosures about Acquired and Disposed Businesses.
The historical financial information of Pono was derived from the audited financial statements of Pono as of and for the year ended December 31, 2022. The historical financial information of AERWINS was derived from the audited consolidated financial statements of AERWINS as of and for the year ended December 31, 2022. Such unaudited pro forma financial information has been prepared on a basis consistent with the audited financial statements of Pono and AERWINS, respectively, and should be read in conjunction with the audited historical financial statements and related notes, as well as [Exhibit 99.1] to the Form 8-K/A and Aewins Managements Discussion and Analysis of Financial Condition and Results of Operations included as [Exhibit 99.3] to the Form 8-K/A and Ponos audited financial statements and related notes beginning on page F-1 of Ponos Form 10-K for the fiscal year ended December 31, 2022 filed with the SEC on March 31, 2023 (the Pono 2022 Form 10-K) as well as Ponos Managements Discussion and Analysis of Financial Condition and Results of Operations included in Item 7 of the Pono 2022 Form 10-K.
The Business Combination is accounted for as a reverse recapitalization, with no goodwill or other intangible assets recorded, in accordance with GAAP. Under this method of accounting, Pono is treated as the acquired company for financial reporting purposes. AERWINS has been determined to be the accounting acquirer because existing AERWINS shareholders, as a group, will retain the largest portion of the voting rights in the combined entity when contemplating the various redemption scenarios, the executive officers of AERWINS are the initial executive officers of the combined company, and the operations of AERWINS will be the continued operations of the combined company.
The unaudited pro forma condensed combined and consolidated balance sheet as of December 31, 2022 assumes that the Business Combination and related transactions occurred on December 31, 2022. The unaudited pro forma condensed combined and consolidated statements of operations for the year ended December 31, 2022 give pro forma effect to the Business Combination and related transactions as if they had occurred on January 1, 2022. Pono and AERWINS have not had any historical relationship prior to the Business Combination. Accordingly, no pro forma adjustments were required to eliminate activities between the companies.
These unaudited pro forma condensed combined and consolidated financial statements are for informational purposes only. They do not purport to indicate the results that would have been obtained had the Business Combination and related transactions actually been completed on the assumed date or for the periods presented, or which may be realized in the future. The pro forma adjustments are based on the information currently available and the assumptions and estimates underlying the pro forma adjustments are described in the accompanying notes. Actual results may differ materially from the assumptions within the accompanying unaudited pro forma condensed combined and consolidated financial information.
Description of the Business Combination
On September 7, 2022, the Company entered into an agreement and Plan of Merger with AERWINS, a Delaware corporation. Pursuant to the Merger Agreement, among other things and subject to the terms and conditions contained therein, the outstanding shares of Class A common stock, par value $0.000001 per share, of Pono (Pono Class A common stock), including any shares of Class B common stock, par value $0.000001 per share, of Pono (Pono Class B common stock, and together with the Pono Class A common stock, the Pono common stock) all of which will be converted into Pono Class A common stock in accordance with Ponos third amended and restated certificate of incorporation (the Pono Charter), will be redesignated as common stock, par value $0.0001 per share, of AERWINS (which will be the new name of Pono after the Closing, as described below, New Pono) (referred to herein as New Pono common stock).
In accordance with the terms and subject to the conditions of the Merger Agreement, the aggregate consideration for the Merger, the AERWINS securityholders as of immediately prior to the Effective Time (AERWINS securityholders), shall be entitled to receive from Pono, a number of shares of New Pono common stock in an amount equal to $600 million, subject to adjustments for AERWINS closing debt net of cash (Closing Net Indebtedness), the amount by which AERWINS net working capital is less than or exceeds $3.0 million (Net Working Capital), and unpaid transaction expenses (Transaction Expenses) (collectively, the Merger Consideration), as described below, and upon the Merger (i) all of the issued and outstanding capital stock of AERWINS immediately prior to the Effective Time (other than those properly exercising any applicable appraisal rights under Delaware law) will automatically be cancelled and shall cease to exist, in exchange for the right to receive pro rata shares of the aggregate Merger Consideration to be paid to the AERWINS stockholders as of immediately prior to the Effective Time, and (ii) each outstanding option and warrant to acquire shares of AERWINS common stock (whether vested or unvested) will be assumed by Pono and automatically converted into an option or warrant to acquire shares of New Pono common stock, with its price and number of shares equitably adjusted based on the conversion ratio of the shares of AERWINS common stock into the Merger Consideration, as provided in the Merger Agreement and as more particularly described in the notice.
The pro forma adjustments giving effect to the Business Combination and related transactions are summarized below, and are discussed further in the footnotes to these unaudited pro forma condensed combined and consolidated financial statements:
| the consummation of the Business Combination and reclassification of cash held in Ponos Trust Account to cash and cash equivalents, net of redemptions (see below); and |
| the accounting for deferred offering costs and transaction costs incurred by both Pono and AERWINS. |
Prior to the Closing, Ponos public stockholders holding 11,328,988 shares of Class A common stock elected to redeem such shares.
The following summarizes the pro forma ownership of common stock of AERWINS following the Business Combination and related transactions:
Number of Shares |
Percentage of Outstanding Shares |
|||||||
Aerwins Stockholders |
51,986,565 | 93.3 | % | |||||
Pono Public Stockholders |
171,012 | 0.3 | % | |||||
Pono Sponsor and affiliates |
3,569,175 | 6.4 | % | |||||
|
|
|
|
|||||
Pro forma common stock at December 31, 2022 |
55,726,752 | 100.0 | % | |||||
|
|
|
|
PRO FORMA CONDENSED COMBINED AND CONSOLIDATED BALANCE SHEET
AS OF DECEMBER 31, 2022
Pono Capital Corp (Historical) |
Aerwins Technologies, Inc. (Historical) |
Transaction Accounting Adjustments |
Pro Forma Combined |
|||||||||||||||
ASSETS |
||||||||||||||||||
Current assets |
||||||||||||||||||
Cash and cash equivalents |
$ | 193,829 | $ | 1,278,026 | $ | 1,130,000 | A | $ | 4,744,568 | |||||||||
1,795,997 | C | |||||||||||||||||
| | 5,000,000 | D | | ||||||||||||||
| | 5,321 | E | | ||||||||||||||
| | (4,658,605 | ) | F | | |||||||||||||
Notes receivable |
| 3,488 | 3,488 | |||||||||||||||
Accounts receivable, net |
| 980,688 | | 980,688 | ||||||||||||||
Other receivable |
| 2,089,921 | (5,321 | ) | E | 2,084,600 | ||||||||||||
Inventory |
| 2,687,092 | | 2,687,092 | ||||||||||||||
Escrow deposit |
| 575,000 | | 575,000 | ||||||||||||||
Prepaid expenses and other current assets |
25,750 | 611,959 | | 637,709 | ||||||||||||||
|
|
|
|
|
|
|
|
|||||||||||
Total current assets |
219,579 | 8,226,174 | 3,267,392 | 11,713,145 | ||||||||||||||
Investments held in Trust Account |
120,600,737 | | (118,804,740 | ) | B | | ||||||||||||
(1,795,997 | ) | C | ||||||||||||||||
Equity method investments |
| 997,470 | | 997,470 | ||||||||||||||
Operating lease right-of-use assets |
| 693,474 | | 693,474 | ||||||||||||||
Property and equipment, net |
| 1,390,547 | | 1,390,547 | ||||||||||||||
Intangible assets, net |
| 150,576 | | 150,576 | ||||||||||||||
Other assets |
| 213,370 | | 213,370 | ||||||||||||||
Other long term receivables |
| 107,735 | | 107,735 | ||||||||||||||
|
|
|
|
|
|
|
|
|||||||||||
Total assets |
$ | 120,820,316 | $ | 11,779,346 | $ | (117,333,345 | ) | $ | 15,266,317 | |||||||||
|
|
|
|
|
|
|
|
|||||||||||
LIABILITIES, TEMPORARY EQUITY AND STOCKHOLDERS EQUITY (DEFICIT) |
||||||||||||||||||
Current liabilities |
||||||||||||||||||
Accounts payable |
$ | 720,507 | $ | 3,333,675 | $ | (448,618 | ) | F | $ | 3,605,564 | ||||||||
Others payable |
| 230,060 | | 230,060 | ||||||||||||||
Accrued expenses and other current liabilities |
386,701 | 402,036 | (401,920 | ) | F | 386,817 | ||||||||||||
Income tax payable |
159,122 | | | 159,122 | ||||||||||||||
Franchise tax payable |
200,000 | | | 200,000 | ||||||||||||||
Contract liabilities |
| 1,104,582 | | 1,104,582 | ||||||||||||||
Notes Payablecurrent |
| | 1,580,000 | A | 1,580,000 | |||||||||||||
Other current liabilities |
| 380,344 | | 380,344 | ||||||||||||||
Current portion of long-term liabilities |
| 54,624 | | 54,624 | ||||||||||||||
Finance leases liabilities-current |
| 102,114 | | 102,114 | ||||||||||||||
Operating leases liabilities-current |
| 293,710 | | 293,710 | ||||||||||||||
Sponsor working capital loan |
150,000 | | | 150,000 | ||||||||||||||
|
|
|
|
|
|
|
|
|||||||||||
Total current liabilities |
1,616,330 | 5,901,145 | 729,462 | 8,246,937 | ||||||||||||||
Long-term loans |
| 3,259,237 | | 3,259,237 | ||||||||||||||
Corporate bond |
| | | | ||||||||||||||
Finance leases liabilities-non-current |
| 87,056 | | 87,056 | ||||||||||||||
Operating leases liabilities-non-current |
| 397,720 | | 397,720 | ||||||||||||||
Other long term liabilities |
| 225,284 | | 225,284 | ||||||||||||||
Deferred underwriting fee payable |
3,450,000 | | (450,000 | ) | A | | ||||||||||||
(3,000,000 | ) | F | ||||||||||||||||
Warrant liabilities |
643,213 | | | 643,213 | ||||||||||||||
|
|
|
|
|
|
|
|
|||||||||||
Total liabilities |
5,709,543 | 9,870,442 | (2,720,538 | ) | 12,859,447 | |||||||||||||
|
|
|
|
|
|
|
|
|||||||||||
Class A common stock subject to possible redemption |
120,141,615 | | (118,804,740 | ) | B | | ||||||||||||
(1,336,875 | ) | G | ||||||||||||||||
|
|
|
|
|
|
|
|
|||||||||||
Stockholders equity (deficit) |
||||||||||||||||||
Preferred stock |
| | | | ||||||||||||||
Common stock |
6 | 3,000 | 3 | D | 56 | |||||||||||||
(2,953 | ) | H | ||||||||||||||||
Additional paid-in capital |
| 49,296,390 | 4,999,997 | D | 50,067,698 | |||||||||||||
(537,669 | ) | F | ||||||||||||||||
| | 1,336,875 | G | | ||||||||||||||
| | 2,953 | H | | ||||||||||||||
| | (5,030,848 | ) | I | | |||||||||||||
(Accumulated deficit) retained earnings |
(5,030,848 | ) | (46,472,904 | ) | (270,398 | ) | F | (46,743,302 | ) | |||||||||
| | 5,030,848 | I | | ||||||||||||||
Accumulated other comprehensive loss |
| (917,582 | ) | | (917,582 | ) | ||||||||||||
|
|
|
|
|
|
|
|
|||||||||||
Total stockholders equity (deficit) |
(5,030,842 | ) | 1,908,904 | 5,528,808 | 2,406,870 | |||||||||||||
|
|
|
|
|
|
|
|
|||||||||||
Total liabilities, temporary equity, and stockholders equity |
$ | 120,820,316 | $ | 11,779,346 | $ | (117,333,345 | ) | $ | 15,266,317 | |||||||||
|
|
|
|
|
|
|
|
PRO FORMA CONDENSED COMBINED AND CONSOLIDATED STATEMENT OF OPERATIONS
FOR THE YEAR ENDED DECEMBER 31, 2022
Pono Capital (Historical) |
Aerwins Technologies, Inc. (Historical) |
Transaction Accounting Adjustments |
Pro Forma Combined |
|||||||||||||||||
Revenues |
$ | | $ | 5,207,490 | $ | | $ | 5,207,490 | ||||||||||||
Cost of Sales |
| 5,070,507 | | 5,070,507 | ||||||||||||||||
|
|
|
|
|
|
|
|
|||||||||||||
Gross Profit |
| 136,983 | | 136,983 | ||||||||||||||||
Operating costs |
||||||||||||||||||||
Formation and operations |
2,102,272 | | | 2,102,272 | ||||||||||||||||
Franchise tax expense |
200,000 | | | 200,000 | ||||||||||||||||
Selling expenses |
| 90,654 | | 90,654 | ||||||||||||||||
General and administrative expenses |
| 7,212,327 | 270,398 | AA | 7,482,725 | |||||||||||||||
Research and development expenses |
| 8,926,205 | | 8,926,205 | ||||||||||||||||
|
|
|
|
|
|
|
|
|||||||||||||
Total operating costs |
2,302,272 | 16,229,186 | 270,398 | 18,801,856 | ||||||||||||||||
|
|
|
|
|
|
|
|
|||||||||||||
Operating loss |
(2,302,272 | ) | (16,092,203 | ) | (270,398 | ) | (18,664,873 | ) | ||||||||||||
|
|
|
|
|
|
|
|
|||||||||||||
Other income (expense), net |
||||||||||||||||||||
Interest Income |
(8,321 | ) | | | (8,321 | ) | ||||||||||||||
Dividends earned on marketable securities held in Trust Account |
1,702,524 | | (1,702,524 | ) | BB | | ||||||||||||||
Interest expense |
| (25,065 | ) | | (25,065 | ) | ||||||||||||||
Gain on foreign currency transaction |
| 60,533 | | 60,533 | ||||||||||||||||
Loss on disposal of fixed assets |
| (9,316 | ) | | (9,316 | ) | ||||||||||||||
Impairment on fixed assets |
| (511,695 | ) | | (511,695 | ) | ||||||||||||||
Equity in earning of investee |
| (16,964 | ) | | (16,964 | ) | ||||||||||||||
Gain on sale of investment securities |
| 1,801,660 | | 1,801,660 | ||||||||||||||||
Other income |
| 314,774 | | 314,774 | ||||||||||||||||
Loss on change in fair value of Sponsor Working Capital Loan |
17,400 | | | 17,400 | ||||||||||||||||
Change in fair value of warrant liabilities |
3,612,764 | | | 3,612,764 | ||||||||||||||||
|
|
|
|
|
|
|
|
|||||||||||||
Total other income (expense), net |
5,324,367 | 1,613,927 | (1,702,524 | ) | 5,235,770 | |||||||||||||||
|
|
|
|
|
|
|
|
|||||||||||||
Income (loss) from operations before income taxes |
3,022,095 | (14,478,276 | ) | (1,972,922 | ) | (13,429,103 | ) | |||||||||||||
Income tax expense |
(289,122 | ) | (1,543 | ) | | (290,665 | ) | |||||||||||||
|
|
|
|
|
|
|
|
|||||||||||||
Net income (loss) from continuing operations |
2,732,973 | (14,479,819 | ) | (1,972,922 | ) | (13,719,768 | ) | |||||||||||||
|
|
|
|
|
|
|
|
|||||||||||||
Other comprehensive income |
||||||||||||||||||||
Foreign currency translation adjustment |
| (679,525 | ) | | (679,525 | ) | ||||||||||||||
|
|
|
|
|
|
|
|
|||||||||||||
Total comprehensive income (loss) |
$ | 2,732,973 | $ | (15,159,344 | ) | $ | (1,972,922 | ) | $ | (14,399,293 | ) | |||||||||
|
|
|
|
|
|
|
|
|||||||||||||
Net income (loss) per share (Note 4): |
||||||||||||||||||||
Weighted average shares outstanding of Class A common stock |
12,043,159 | | | |||||||||||||||||
Basic and diluted net income per common stock |
$ | 0.17 | | | ||||||||||||||||
Weighted average shares outstanding of Class B common stock |
2,875,000 | | | |||||||||||||||||
Basic and diluted net income per common stock |
$ | 0.17 | | | ||||||||||||||||
Weighted average shares outstandingbasic |
| 28,565,198 | 55,726,752 | |||||||||||||||||
Weighted average shares outstandingdiluted |
| 31,427,684 | 55,726,752 | |||||||||||||||||
Net loss per sharebasic |
| $ | (0.51 | ) | $ | (0.25 | ) | |||||||||||||
Net loss per sharediluted |
| $ | (0.46 | ) | $ | (0.25 | ) |
NOTES TO PRO FORMA CONDENSED COMBINED AND CONSOLIDATED FINANCIAL INFORMATION
Note 1. Basis of Presentation
The Business Combination has been accounted for as a reverse recapitalization, with no goodwill or other intangible assets recorded, in accordance with GAAP. Under this method of accounting, Pono has been treated as the accounting acquiree and AERWINS as the accounting acquirer for financial reporting purposes. Accordingly, for accounting purposes, the Business Combination has been treated as the equivalent of AERWINS issuing shares for the net assets of Pono, followed by a recapitalization. The net assets of Pono will be stated at historical cost. Operations prior to the Business Combination will be those of AERWINS.
The unaudited pro forma condensed combined and consolidated balance sheet as of December 31, 2022 assumes that the Business Combination and related transactions occurred on December 31, 2022. The unaudited pro forma condensed combined and consolidated statement of operations for the year ended December 31, 2022 gives pro forma effect to the Business Combination and related transactions as if they had occurred on January 1, 2022. These periods are presented on the basis that AERWINS is the acquirer for accounting purposes.
The pro forma adjustments reflecting the consummation of the Business Combination and related transactions are based on certain currently available information and certain assumptions and methodologies that Aerwins believes are reasonable under the circumstances. The unaudited condensed combined and consolidated pro forma adjustments, which are described in the accompanying notes, may be revised as additional information becomes available and is evaluated. Therefore, it is likely that the actual adjustments will differ from the pro forma adjustments and it is possible the difference may be material. Aerwins believes that its assumptions and methodologies provide a reasonable basis for presenting all of the significant effects of the Business Combination and related transactions based on information available to management at the time and that the pro forma adjustments give appropriate effect to those assumptions and are properly applied in the unaudited pro forma condensed combined and consolidated financial information.
The unaudited pro forma condensed combined and consolidated financial information does not give effect to any anticipated synergies, operating efficiencies, tax savings, or cost savings that may be associated with the Business Combination. The unaudited pro forma condensed combined and consolidated financial information is not necessarily indicative of what the actual results of operations and financial position would have been had the Business Combination and related transactions taken place on the dates indicated, nor are they indicative of the future consolidated results of operations or financial position of the post-combination company. They should be read in conjunction with the historical financial statements and notes thereto of Pono and AERWINS.
Note 2. Accounting Policies and Reclassifications
Upon consummation of the Business Combination, management performed a comprehensive review of the two entities accounting policies. As a result of the review, management did not identify any differences between the accounting policies of the two entities that would have a material impact on the unaudited pro forma condensed consolidated combined financial information. As a result, the unaudited pro forma condensed consolidated combined financial information does not assume any differences in accounting policies.
As part of the preparation of these unaudited pro forma condensed combined and consolidated financial statements, certain reclassifications were made to align Pono financial statement presentation with that of AERWINS.
Note 3. Adjustments to Unaudited Pro Forma Condensed Combined and Consolidated Financial Information
The unaudited pro forma condensed combined and consolidated financial information has been prepared to illustrate the effect of the Business Combination and related transactions and has been prepared for informational purposes only.
The following unaudited pro forma condensed combined and consolidated financial information has been prepared in accordance with Article 11 of Regulation S-X as amended by the final rule, Release No. 33-10786 Amendments to Financial Disclosures about Acquired and Disposed Businesses. Release No. 33-10786 replaces the existing pro forma adjustment criteria with simplified requirements to depict the accounting for the transaction (Transaction Accounting Adjustments) and present the reasonably estimable synergies and other transaction effects that have occurred or are reasonably expected to occur (Managements Adjustments). Aerwins has elected not to present Managements Adjustments and will only be presenting Transaction Accounting Adjustments in the unaudited pro forma condensed combined and consolidated financial information. Pono and AERWINS have not had any historical relationship prior to the Business Combination. Accordingly, no pro forma adjustments were required to eliminate activities between the companies.
The pro forma basic and diluted earnings per share amounts presented in the unaudited pro forma condensed combined and consolidated statement of operations are based upon the number of shares of AERWINS common stock outstanding, assuming the Business Combination and related transactions occurred on January 1, 2022.
Adjustments to Unaudited Pro Forma Condensed Combined and Consolidated Balance Sheet
The adjustments included in the unaudited pro forma condensed combined and consolidated balance sheet as of December 31, 2022 are as follows:
A. | Reflects the issuance of two promissory notes to Pono Captial Corp. prior to the closing of the Business Combination. On January 31, 2023, Pono Captial Corp. entered into promissory note agreements in the amounts of $1,130,000 and $450,000 between Mehana Equity LLC and EF Hutton, respectively. |
B. | Reflects the redemption of 11,328,988 Pono Public Shares for aggregate redemption payments of $119.0 million, inclusive of $0.2 million in accrued interest, allocated to New Pono common stock and additional paid-in capital using par value $0.0001 per share and a redemption price of $10.50 per share. |
C. | Reflects the reclassification of $1.8 million of investments held in the Trust Account to cash and cash equivalents that becomes available at closing of the Business Combination. |
D. | Represents the proceeds from the issuance of 3,196,311 Escrow Shares per the Escrow Agreement entered into in connection with the closing of the Business Combination (as previously defined) for an aggregate of $5.0 million. |
E. | Represents the receivables of $5,321 and outstanding to shareholders of AERWINS subject to collection pursuant to the Merger Agreement. |
F. | Represents AERWINS transaction costs of $0.5 million, and Ponos transactions costs of $4.4 million inclusive of advisory, banking, printing, legal and accounting fees that are expensed as a part of the Business Combination, deferred underwriting fees and equity issuance costs that are capitalized into additional paid-in capital. Of the transaction costs, $3.5 million has been incurred and reflected in the historical financial statements of Pono, $0.6 million has been recorded in accounts payable, $0.4 million has been recorded in accrued expenses and $0.2 million in transaction costs already paid in the historical financial statements and reflected in the transaction accounting adjustments in the unaudited condensed combined and consolidated balance sheet. |
G. | Reflects the reclassification of Pono Class A common stock subject to possible redemption into permanent equity. |
H. | Represents the issuance of Ponos common stock at a par value of $0.000001 to AERWINS shareholders as consideration for the Business Combination. |
I. | Reflects the reclassification of Pono historical accumulated deficit into additional paid-in capital as part of the reverse recapitalization. |
Adjustments to Unaudited Pro Forma Condensed Combined and Consolidated Statement of Operations
The pro forma adjustments included in the unaudited pro forma condensed combined and consolidated statement of operations for the year ended December 31, 2022 are as follows:
AA. | Reflects estimated non-recurring transaction costs not already reflected in the historical financial statements of approximately $0.3 million as if incurred on January 1, 2022, the date the Business Combination occurred for the purposes of the unaudited pro forma condensed combined and consolidated statement of operations. |
BB. | Reflects elimination of investment income on the Trust Account. |
Note 4. Net Loss per Share
Net loss per share was calculated using the historical weighted average shares outstanding, and the issuance of additional shares in connection with the Business Combination, assuming the shares were outstanding since January 1, 2022. As the Business Combination is being reflected as if it had occurred at the beginning of the period presented, the calculation of weighted average shares outstanding for basic and diluted net loss per share assumes that the shares issuable relating to the Business Combination have been outstanding for the entirety of all periods presented.
For the Year Ended December 31, 2022(1) |
For the Year Ended December 31, 2021 (1) |
|||||||
Numerator: |
||||||||
Pro forma net loss |
$ | (13,719,768 | ) | $ | (10,215,085 | ) | ||
Denominator: |
||||||||
Weighted average shares outstandingbasic and diluted(2) |
55,726,752 | 55,726,752 | ||||||
Net loss per share: |
||||||||
Basic and diluted |
$ | (0.25 | ) | $ | (0.18 | ) |
(1) | Pro forma net loss per share includes the related pro forma adjustments as referred to within the section Unaudited Pro Forma Condensed Combined and Consolidated Financial Information. |
(2) | The potentially dilutive outstanding securities were excluded from the computation of pro forma net loss per share, basic and diluted, because their effect would have been anti-dilutive and/or issuance or vesting of such shares is contingent upon the satisfaction of certain conditions which were not satisfied by the end of the periods presented. |
@DK@
M^Y!,(]D&Z_BZZB@_04GZ@CA"?J*G+CK%YJUNN+BOK!S>I#,>:'5=&WE*VN4
MF#R_R<,WJJWM,Y[FW.:9<>4H-3&FZ"06<206%/\ )'P&W]F6G4UA<\]12[D#
MR+\RPN0RJC[ [)M55_M+HP= . (][VR525NP2(\S*#UVU!:5L)V>D 6$&]!B[F/@_MOG"$\;.*FJN=[
MA407CVR>'^D.>I[;CBWP@$7F=L(;"06C7LT^:*8-4H9GAO1#;)1&W)@1C ,6M;WO]4,6_\(M[V&2O
M,A/%_,5"UQW=!]>X67RYT'S[I4J1@ !7.*3N.Z8+3=U4^]CUZ/A&,RR*3G:\
ME.;H8$K\TMR\K05*4H>@Z^X# B;_ &C'^/E]GA_.$$_\0^;<"61@,!@,!@,!
M@,!@,!@,!@,!@,!@,!@,!@,!@,!@,!@,!@,!@,!@,!@,!@,!@:RV[VIQYS_*
MRH+>W5'.],S8]H1R F(VEDYY(
M9M\TG.2ZK?&=Y:44AZ1L&UJYEMCK,BL/9#V*I:WOV5_"
F_%@Z4Q7MG-%0,DW:*'ZG=*21WE$9 TO<5 [.\,2ZFD@1FO
M)PAN#$M0"!IU")*/0@J4,ZT[-6V(C>VOJEELD#!Y>9UPD]\Z;JNHR5,AY[7R
M10W&SP3I%V%+/F^P:5A2G4O*7EJ2&94PM)X7!(JV<%4$/=R=UQU_)Y-P_-I3
MU+';R8[OZ7[;YPOFCC:VJ.*&P:O>?7OI@47OY(^PAH;)7&Y###Z@CS7(PN*C
MX 7$RA* E$E6#)4J0PMQYT/:G-G%/BDO1CL=_EO(MFT_+N;YQ6,*9J^>D+-T
MA-5LC'R[.D,L2PM^FQ:";SYL4018DVY?!9$@?F,\PH!1:L)H9NZHZMZOYF
H)+3!+..2J!
M;,+$+6Q 'OU@[UO[N!_/WH1/W[X4^]>._"?OFW#X1^!&WW[W_9_O.UWO?NWO
M'OFU.O:>U];U_7_5>GT_=P*D)H:1-IK.)L;A-!Q)R8E6>K[R
M6<%_^(R3=3W)R/4?3G5%_J+4E5[U?#Y"T05I@5?0R%P%J3&.X4#R2KC,?0R2
M13F=-)R9:_'*E86M.JUHAN0)"BQ".#D#]KL_BF<(?G'J;_>#:.!+#TO0[7";
M-+4FW("0"\3?I03[\%"8<-.6L$D]?WC209Y8@:,V'U-C#L/I].MZSW\NI\OY
MO1C\K+DZ62.3+DRY,OLRY(Y
@>XJ:!T2
MJ49BH@UO&$_0O9[T+ V:JRUJUO"O8I;%/SJ+V56LY:BGN(S>&/")^CC\VFC,
M*VH0.2 TX@P2=2282>5O>C4Z@L91H0& _@,#Y'FZ()./$ TP))1ANRR"
MAG'#T6#8]@))+T(PTT6M>@(0ZWL6_N:^[@615]@MMK5[$+(:&&;1=LF;&B?T
M,>LB&2"O)VT)EP/7+12J$2I$W2.,/!.O_GJ1804>5O\ \P=8%^8$37PA?UWG
MVC/_ 'Y4]^^6]<"65@,!@,!@,!@,!@1,?M=G\4SA#\X]3?[P;1P)9V P& P&
M P& P& P& P(F%._VP7K#\W)$_UCSY@2S\!@,!@,!@,!@,!@,")Q]HP]'\/+
M[/!Z?3Z/QA)/I]'^'T?.'S;Z?1_VX'22[_*=95 NOD!D,NY[A+W3_CNEM,$6
MH]1RY'4JPY?6]RPN(S\$OA$3?*N;8V=*83'9B5M2P*'LO;HH2FE(UGM#$X#
MZ4CZDYR*E+E!5%VUFDG#*ROT@>(8KF+(GE36VQ1@12J5B7,!BP+F0LBL:ZAN_D3DGG2ZYE,NJ++YB7]F].1GNNZHHX+
M[-O2JZ+@=I7O *?4LP4K8-;$ZR02*,,"25.K*C*>0-:06B3]+5HCAAU5X*FT
M>MT%G772W9/\+_DZQT=='48J42*/2UUJA]9D\N)M*#N<@0,C3+UAJE2M:%OL
M92-0_H1FC2G""624' XB_:,?X^7V>'\X03_Q#YMP)9& P& P& P& P& P& P
M& P& P& P& P& P& P& P& P& P& P& P& P& P&!SMZE\37CK[8LM/<74_+
M$#N6S$D7:H6GETD<9BE<"HNR+'5P:F<)3#)FA%M.C6/:HP.]E;,WL[?I%O6M
M:T&M_P"CO>%K^0!4?[=67\NL!^CO>%K^0!4?[=67\NL!^CO>%K^0!4?[=67\
MNL!^CO>%K^0!4?[=67\NL!^CO>%K^0!4?[=67\NL!^CO>%K^0!4?[=67\NL!
M^CO>%K^0!4?[=67\NL!^CO>%K^0!4?[=67\NL!^CO>%K^0!4?[=67\NL!^CO
M>%K^0!4?[=67\NL!^CO>%K^0!4?[=67\NL!^CO>%K^0!4?[=67\NL!^CO>%K
M^0!4?[=67\NL!^CN^%K^0!4?[=67\NL#JS3U05K0%7P>EZ=B3?!*OK:/HXM!
MXO/OBECI"MW<18]A2Z71:P8"L(A#\UI
MYLY.SN6Z*VYV)0M^B5RU*)0 SV1N@J7"GC]1\R=3]B=.QBO(5S?"^I&VIF]/
MS)5KL6XP]#*ZZ,FI\HNJ1I6IL9H8Q3JPS984F$W,2<2,A,W^\G*5"I::!.')
M?[1C_'R^SP_G""?^(?-N!+(P& P& P& P& P& P& P& P& P& P& P& P& P
M& P& P& P& P& P& P& P& P& P& P& P& P& P& P& P& P& P& P& P& P
M& P& P& P& P& P& P& P& P& P& P& P& P& P& P& P& P(F%._P!L%ZP_
M-R1/]8\^8$L_ 8%)=7YC8MMFGMY:F<3T[)6%F"Z."1 )V?%P3C$3,V:5&E;7
MNJLM.8(I.5ZYHPEBWH.]!WZ ^;E)(ZS.,?:'A^96IVEKBJ9XJUN3HA0N,F=D
M+.Y2%:UQ]$J/*4O+BC8&98N-(3!,-+1I3CA!T64,00K6!@5GZHYED-F+:68>
MA*4>[B;51R)RJAIL^%N-E-JI/L03BG*#)'DZ3H-@V#?W3DH [_Z-_=U@9ZWO
MT?=W]S6ON[WO_HP,&5WT]S=;TL?(%5%_4S9DYBX3!RB&P&S(;+I5&-$F>R,U
M)(\P/*]V81A,_4^JK))%O>M^C7W-X&7BGYC/>EL;(>6HZ1-S>A=G!A*<$@WE
M"U.9RQ,VN:MK"=M