0001810523
false
N-2
0001810523
2022-05-31
2023-05-31
0001810523
2023-05-31
0001810523
FTHY:CDXRiskMember
2022-05-31
2023-05-31
0001810523
FTHY:ConsumberDiscretionaryCompaniesRiskMember
2022-05-31
2023-05-31
0001810523
FTHY:CorporateDebtObligationsRiskMember
2022-05-31
2023-05-31
0001810523
FTHY:CreditAgencyRiskMember
2022-05-31
2023-05-31
0001810523
FTHY:CreditAndBelowInvestmentGradeSecuritiesRiskMember
2022-05-31
2023-05-31
0001810523
FTHY:CreditDefaultSwapsRiskMember
2022-05-31
2023-05-31
0001810523
FTHY:CyberSecurityRiskMember
2022-05-31
2023-05-31
0001810523
FTHY:DefaultedAndDistressedSecuritiesRiskMember
2022-05-31
2023-05-31
0001810523
FTHY:EarningsRiskMember
2022-05-31
2023-05-31
0001810523
FTHY:EarningsMarketsRiskMember
2022-05-31
2023-05-31
0001810523
FTHY:EuropeRiskMember
2022-05-31
2023-05-31
0001810523
FTHY:ForeignCurrencyRiskMember
2022-05-31
2023-05-31
0001810523
FTHY:HealthCareCompaniesRiskMember
2022-05-31
2023-05-31
0001810523
FTHY:IlliquidSecuritiesRiskMember
2022-05-31
2023-05-31
0001810523
FTHY:InflationRiskMember
2022-05-31
2023-05-31
0001810523
FTHY:InformationTechonologyCompaniesRiskMember
2022-05-31
2023-05-31
0001810523
us-gaap:InterestRateRiskMember
2022-05-31
2023-05-31
0001810523
FTHY:LeverageRiskMember
2022-05-31
2023-05-31
0001810523
FTHY:LimitedTermRiskMember
2022-05-31
2023-05-31
0001810523
FTHY:ManagementRiskAndRelianceOnKeyPersonnelMember
2022-05-31
2023-05-31
0001810523
FTHY:MarketDiscountFromNetAssetValueMember
2022-05-31
2023-05-31
0001810523
FTHY:MarketRiskMember
2022-05-31
2023-05-31
0001810523
FTHY:NonUSSecuritiesRiskMember
2022-05-31
2023-05-31
0001810523
FTHY:OperationalRiskMember
2022-05-31
2023-05-31
0001810523
FTHY:PotentialConflictOfInterestRiskMember
2022-05-31
2023-05-31
0001810523
FTHY:PrepaymentsRiskMember
2022-05-31
2023-05-31
0001810523
FTHY:ReinvestmentRiskMember
2022-05-31
2023-05-31
0001810523
FTHY:SecondLienLoanRiskMember
2022-05-31
2023-05-31
0001810523
FTHY:SeniorLoanRiskMember
2022-05-31
2023-05-31
0001810523
FTHY:ValuationRiskMember
2022-05-31
2023-05-31
iso4217:USD
xbrli:shares
iso4217:USD
xbrli:shares
xbrli:pure
UNITED STATES
SECURITIES AND EXCHANGE
COMMISSION
Washington, D.C. 20549
FORM N-CSR
CERTIFIED SHAREHOLDER REPORT OF REGISTERED
MANAGEMENT INVESTMENT COMPANIES
Investment Company Act file number 811-23199
First
Trust High Yield Opportunities 2027 Term Fund
(Exact name of registrant as specified in charter)
120 East Liberty Drive, Suite 400
Wheaton, IL 60187
(Address of principal executive offices) (Zip code)
W. Scott Jardine, Esq.
First Trust Portfolios
L.P.
120 East Liberty Drive, Suite 400
Wheaton, IL 60187
(Name
and address of agent for service)
Registrant’s telephone number, including
area code: 630-765-8000
Date of fiscal year end: May
31
Date of reporting period: May
31, 2023
Form N-CSR is to be used by management investment
companies to file reports with the Commission not later than 10 days after the transmission to stockholders of any report that is required
to be transmitted to stockholders under Rule 30e-1 under the Investment Company Act of 1940 (17 CFR 270.30e-1). The Commission may use
the information provided on Form N-CSR in its regulatory, disclosure review, inspection, and policymaking roles.
A registrant is required to disclose the information
specified by Form N-CSR, and the Commission will make this information public. A registrant is not required to respond to the collection
of information contained in Form N-CSR unless the Form displays a currently valid Office of Management and Budget (“OMB”)
control number. Please direct comments concerning the accuracy of the information collection burden estimate and any suggestions for reducing
the burden to Secretary, Securities and Exchange Commission, 100 F Street, NE, Washington, DC 20549. The OMB has reviewed this collection
of information under the clearance requirements of 44 U.S.C. § 3507.
Item 1. Reports to Stockholders.
| (a) |
|
The Report to Shareholders is attached herewith. |

First
Trust
High
Yield Opportunities 2027 Term Fund (FTHY)
Annual
Report
For
the Year Ended
May
31, 2023
First
Trust High Yield Opportunities 2027 Term Fund (FTHY)
Annual
Report
May
31, 2023
|
1
|
|
2
|
|
4
|
|
8
|
|
18
|
|
19
|
|
20
|
|
21
|
|
22
|
|
23
|
|
30
|
|
31
|
|
33
|
|
42
|
|
44
|
Caution
Regarding Forward-Looking Statements
This
report contains certain forward-looking statements within the meaning of the Securities Act of 1933, as amended, and the Securities Exchange
Act of 1934, as amended. Forward-looking statements include statements regarding the goals, beliefs, plans or current expectations of
First Trust Advisors L.P. (“First Trust” or the “Advisor”) and its representatives, taking into account the information
currently available to them. Forward-looking statements include all statements that do not relate solely to current or historical fact.
For example, forward-looking statements include the use of words such as “anticipate,” “estimate,” “intend,”
“expect,” “believe,” “plan,” “may,” “should,” “would” or other
words that convey uncertainty of future events or outcomes.
Forward-looking
statements involve known and unknown risks, uncertainties and other factors that may cause the actual results, performance or achievements
of First Trust High Yield Opportunities 2027 Term Fund (the “Fund”) to be materially different from any future results, performance
or achievements expressed or implied by the forward-looking statements. When evaluating the information included in this report, you are
cautioned not to place undue reliance on these forward-looking statements, which reflect the judgment of the Advisor and its representatives
only as of the date hereof. We undertake no obligation to publicly revise or update these forward-looking statements to reflect events
and circumstances that arise after the date hereof.
Performance
and Risk Disclosure
There
is no assurance that the Fund will achieve its investment objective. The Fund is subject to market risk, which is the possibility that
the market values of securities owned by the Fund will decline and that the value of the Fund’s shares may therefore be less than
what you paid for them. Accordingly, you can lose money by investing in the Fund. See “Principal Risks” in the Investment
Objective, Policies, Risks and Effects of Leverage section of this report for a discussion of certain other risks of investing in the
Fund.
Performance
data quoted represents past performance, which is no guarantee of future results, and current performance may be lower or higher than
the figures shown. For the most recent month-end performance figures, please visit www.ftportfolios.com
or speak with your financial advisor. Investment returns, net asset value and common share price will fluctuate and Fund shares, when
sold, may be worth more or less than their original cost.
The
Advisor may also periodically provide additional information on Fund performance on the Fund’s web page at www.ftportfolios.com.
How
to Read This Report
This
report contains information that may help you evaluate your investment in the Fund. It includes details about the Fund and presents data
and analysis that provide insight into the Fund’s performance and investment approach.
By
reading the portfolio commentary by the portfolio management team of the Fund, you may obtain an understanding of how the market environment
affected the Fund’s performance. The statistical information that follows may help you understand the Fund’s performance compared
to that of a relevant market benchmark.
It
is important to keep in mind that the opinions expressed by personnel of the Advisor are just that: informed opinions. They should not
be considered to be promises or advice. The opinions, like the statistics, cover the period through the date on the cover of this report.
The material risks of investing in the Fund are spelled out in the prospectus, the statement of additional information, this report and
other Fund regulatory filings.
First
Trust High Yield Opportunities 2027 Term Fund (FTHY)
Annual
Letter from the Chairman and CEO
May
31, 2023
Dear
Shareholders,
First
Trust is pleased to provide you with the annual report for the First Trust High Yield Opportunities 2027 Term Fund (the “Fund”),
which contains detailed information about the Fund for the twelve months ended May 31, 2023.
Between
developments at the Federal Reserve (the “Fed”), stock market returns, and the myriad of economic data that we have processed
here at First Trust over the past six months, I have no shortage of developments to share with you. Let’s begin with the Fed. In
a widely expected move, the Fed voted to keep the Federal Funds target rate unchanged at their meeting on June 14, 2023, ending a streak
of ten straight interest rate increases over the past 15 months. That said, the Fed also hinted that at least two more interest rate hikes
are likely if they are going to bring inflation down to their desired level of 2.0%. Inflation, as measured by the 12-month rate of change
in the Consumer Price Index, stood at 4.0% as of June 20, 2023, well below its most recent high of 9.1% in June 2022. Despite tighter
monetary policy, the U.S. added 1.57 million jobs this year, a 2.5% annualized growth rate, and real gross domestic product rose at a
1.3% annualized rate in the first quarter of 2023, according to Brian Wesbury, Chief Economist at First Trust.
Driven
by developments in Artificial Intelligence, the S&P 500®
Index has had an exceptional start to the year, posting a total return of 15.8% for the year-to-date period ended June 16, 2023. The tech-centric
Nasdaq-100 Index® has seen a staggering 38.5% total return
over the same period. When the stock market increases by 20% or more from its most recent low, it is often referred to as a “bull
market.” On June 8, 2023, the S&P 500® Index closed
at 4,293.93, 20.04% above its most recent low of 3,577.03 (which occurred on October 12, 2022). We’ll leave it to the pundits to
debate how long this bull market will last, but history shows that bull markets typically fare better when there are longer pauses between
interest rate hikes, according to Bloomberg.
Meanwhile,
the effects of higher inflation and the Fed’s restrictive monetary policy appear to be taking a toll on the U.S. consumer. U.S.
household debt reached a record $17.05 trillion in the first quarter of 2023. Furthermore, total balances for U.S. credit card holders
did not decline in the first quarter of the year, marking the first time that has happened since 2001. ATTOM, a property data analytics
company, reported that U.S. foreclosure activity (including default notices) for the month of May 2023 increased by 14%, to 35,195 properties,
from the same period a year ago, according to its own release. That said, not all the news is negative. The Fed reported that the net
worth of U.S. households stood at $148.8 trillion at the end of the first quarter of 2023, up $3 trillion from when it stood at $145.8
trillion at the end of the fourth quarter of 2022, according to MarketWatch. Most of the increase in household net worth can be attributed
to the rebound in the stock market. The value of equities held by U.S. households jumped by $2.4 trillion in the first quarter of 2023.
As the great economist Milton Friedman famously said, the effects of monetary policy are long and variable. In my opinion, time will reveal
the full impact of the tighter economic policies of the past 15 months on the consumer and the U.S. economy.
Thank
you for giving First Trust the opportunity to play a role in your financial future. We value our relationship with you and will report
on the Fund again in six months.
Sincerely,
James
A. Bowen
Chairman
of the Board of Trustees
Chief
Executive Officer of First Trust Advisors L.P.
First
Trust High Yield Opportunities 2027 Term Fund (FTHY)
“AT
A GLANCE”
As
of May 31, 2023 (Unaudited)
| Fund
Statistics |
|
| Symbol
on New York Stock Exchange |
FTHY
|
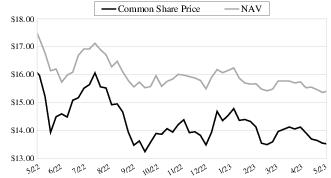
| Common
Share Price |
$13.52
|
| Common
Share Net Asset Value (“NAV”) |
$15.40
|
| Premium
(Discount) to NAV |
(12.21)%
|
| Net
Assets Applicable to Common Shares |
$566,398,969
|
| Current
Distribution per Common Share(1) |
$0.1300
|
| Current
Annualized Distribution per Common Share |
$1.5600
|
| Current
Distribution Rate on Common Share Price(2) |
11.54%
|
| Current
Distribution Rate on NAV(2) |
10.13%
|
Common
Share Price & NAV (weekly closing price)
| Performance
|
|
|
|
|
|
|
|
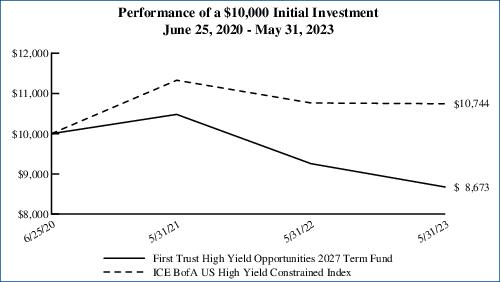
Average
Annual
Total Returns |
|
|
|
1
Year Ended
5/31/23 |
Inception
(6/25/20)
to 5/31/23 |
| Fund Performance(3)
|
|
|
|
| NAV(4)
|
|
-1.86%
|
-0.42%
|
| Market
Value |
|
-6.27%
|
-4.74%
|
| Index
Performance |
|
|
|
| ICE
BofA US High Yield Constrained Index |
|
-0.17%
|
2.48%
|
| (1)
|
Most
recent distribution paid through May 31, 2023. Subject to change in the future. |
| (2)
|
Distribution
rates are calculated by annualizing the most recent distribution paid through the report date and then dividing by Common Share Price
or NAV, as applicable, as of May 31, 2023. Subject to change in the future. |
| (3)
|
Total
return is based on the combination of reinvested dividend, capital gain, and return of capital distributions, if any, at prices obtained
by the Dividend Reinvestment Plan and changes in NAV per share for NAV returns and changes in Common Share Price for market value returns.
Total returns do not reflect sales load and are not annualized for periods of less than one year. Past performance is not indicative of
future results. |
| (4)
|
On
January 3, 2023, the fair value methodology used to value the senior loan investments held by the Fund was changed. Prior to that date,
the senior loans were valued using the bid side price provided by a pricing service. After such date, the senior loans were valued using
the midpoint between the bid and ask price provided by a pricing service. The change in the Fund’s fair value methodology on January
3, 2023, resulted in a one-time increase in the Fund’s NAV of approximately $0.018 per share on that date, which represented a positive
impact on the Fund’s performance of 0.11%. Without the change to the pricing methodology, the performance of the Fund on a NAV basis
would have been -1.92% and -0.44%, in the one-year and since inception periods ended May 31, 2023, respectively. |
First
Trust High Yield Opportunities 2027 Term Fund (FTHY)
“AT
A GLANCE” (Continued)
As
of May 31, 2023 (Unaudited)
| Credit
Quality (S&P Ratings)(5) |
% of Total
Fixed-Income
Investments(6) |
| BBB
|
0.7%
|
| BBB-
|
4.4
|
| BB+
|
7.3
|
| BB
|
4.9
|
| BB-
|
13.4
|
| B+
|
15.7
|
| B
|
13.8
|
| B-
|
19.0
|
| CCC+
|
17.1
|
| CCC
|
3.0
|
| CCC-
|
0.2
|
| Not
Rated |
0.5
|
| Total
|
100.0%
|
| Top
10 Issuers |
% of Total
Long-Term
Investments(6) |
| Charter
Communications Operating, LLC |
4.2%
|
| Verscend
Technologies, Inc. (Cotiviti) |
3.7
|
| Alliant
Holdings I, LLC |
3.5
|
| Nexstar
Broadcasting, Inc. |
3.4
|
| HUB
International Ltd. |
3.3
|
| AssuredPartners,
Inc. |
3.2
|
| SS&C
Technologies Holdings, Inc. |
3.2
|
| Tenet
Healthcare Corp. |
3.2
|
| AmWINS
Group, Inc. |
2.6
|
| PG&E
Corp. |
2.2
|
| Total
|
32.5%
|
| Industry
Classification |
% of Total
Long-Term
Investments(6) |
| Media
|
16.4%
|
| Software
|
15.2
|
| Insurance
|
14.8
|
| Health
Care Providers & Services |
9.7
|
| Health
Care Technology |
7.4
|
| Hotels,
Restaurants & Leisure |
6.0
|
| Containers
& Packaging |
4.2
|
| Electric
Utilities |
2.5
|
| IT
Services |
2.1
|
| Diversified
Telecommunication Services |
2.0
|
| Health
Care Equipment & Supplies |
2.0
|
| Building
Products |
1.6
|
| Commercial
Services & Supplies |
1.5
|
| Trading
Companies & Distributors |
1.4
|
| Life
Sciences Tools & Services |
1.3
|
| Diversified
Consumer Services |
1.2
|
| Machinery
|
1.1
|
| Interactive
Media & Services |
1.1
|
| Entertainment
|
1.0
|
| Specialty
Retail |
0.8
|
| Construction
& Engineering |
0.7
|
| Professional
Services |
0.7
|
| Construction
Materials |
0.7
|
| Diversified
Financial Services |
0.6
|
| Automobiles
|
0.6
|
| Wireless
Telecommunication Services |
0.5
|
| Consumer
Finance |
0.5
|
| Aerospace
& Defense |
0.5
|
| Household
Products |
0.5
|
| Electronic
Equipment, Instruments & Components |
0.4
|
| Independent
Power & Renewable Electricity Producers |
0.4
|
| Capital
Markets |
0.2
|
| Personal
Care Products |
0.2
|
| Food
Products |
0.1
|
| Consumer
Staples Distribution & Retail |
0.1
|
| Electrical
Equipment |
0.0*
|
| Pharmaceuticals
|
0.0*
|
| Total
|
100.0%
|
| *
|
Amount
is less than 0.01%. |
| (5)
|
The
ratings are by S&P Global Ratings except where otherwise indicated. A credit rating is an assessment provided by a nationally recognized
statistical rating organization (NRSRO) of the creditworthiness of an issuer with respect to debt obligations except for those debt obligations
that are only privately rated. Ratings are measured on a scale that generally ranges from AAA (highest) to D (lowest). Investment grade
is defined as those issuers that have a long-term credit rating of BBB- or higher. The credit ratings shown relate to the creditworthiness
of the issuers of the underlying securities in the Fund, and not to the Fund or its shares. Credit ratings are subject to change. |
| (6)
|
Percentages
are based on long-term positions. Money market funds are excluded. |
Portfolio
Commentary
First
Trust High Yield Opportunities 2027 Term Fund (FTHY)
Annual
Report
May
31, 2023 (Unaudited)
Advisor
The
First Trust Advisors L.P. (“First Trust”) Leveraged Finance Team is comprised of 16 experienced investment professionals specializing
in below investment grade securities. The team is comprised of portfolio management, research, trading and operations personnel. As of
May 31, 2023, the First Trust Leveraged Finance Team managed or supervised approximately $5.5 billion in senior secured bank loans and
high yield bonds. These assets are managed across various strategies, including two closed-end funds, an open-end fund, and four exchange-traded
funds on behalf of retail and institutional clients.
Portfolio
Management Team
William
Housey, CFA – Managing Director of Fixed Income, Senior Portfolio Manager
Jeffrey
Scott, CFA – Senior Vice President, Portfolio Manager
Commentary
First
Trust High Yield Opportunities 2027 Term Fund
The
investment objective of the First Trust High Yield Opportunities 2027 Term Fund (“FTHY” or the “Fund”) is to provide
current income. Under normal market conditions, the Fund will seek to achieve its investment objective by investing at least 80% of its
Managed Assets in high yield debt securities of any maturity that are rated below investment grade at the time of purchase or unrated
securities determined by the First Trust Leveraged Finance Team to be of comparable quality. “Managed Assets” means the total
asset value of the Fund minus the sum of its liabilities, other than the principal amount of borrowings. High yield debt securities include
U.S. and non-U.S. corporate debt obligations and senior secured floating rate loans (“Senior Loans”). Securities rated below
investment grade are commonly referred to as “junk” or “high yield” securities and are considered speculative
with respect to the issuer’s capacity to pay interest and repay principal. There can be no assurance that the Fund will achieve
its investment objective or that the Fund’s investment strategies will be successful.
Market
Recap
Two
sweeping themes colored the twelve-month period ended May 31, 2023: the Federal Reserve’s (the “Fed”) fight against
stubbornly high inflation and persistent interest rate volatility. The May 2022 (reported in June 2022) Consumer Price Index (“CPI”)
printed 8.6%, over four times greater than the Fed’s 2.0% target. Consequently, the Fed raised interest rates by 0.75% at their
June 2022 Federal Open Market Committee Meeting, marking the single largest percentage point rate increase in the last 28 years. At the
same time, consumer confidence hit a 16-month low, and equities (the S&P 500®
Index) fell 20.47% from the all-time high reached on January 3, 2022. The Fed went on to deliver three more 0.75% interest rate hikes
at their July, September, and November 2022 meetings (for a total of four 0.75% interest rate hikes in 2022). At this point, the market
postulated that the Fed might “pivot” to a more accommodative interest rate policy, despite the November 2022 (reported in
December 2022) CPI printing 7.1%; again, well above the Fed’s 2.0% target. As the Fed “slowed” its aggressive pace of
rate hikes from 0.75% per meeting to 0.50% per meeting in December 2022, the market still maintained (as evidenced by Fed Fund Futures)
that the Fed was unlikely to reach its ultimate inflation target. However, in light of inflation’s slow deceleration, the Fed forged
on, delivering the equivalent of seventeen 25 basis point (“bps”) rate hikes during the twelve-month period ended May 31,
2023.
Despite
the Fed’s demonstrated resolve, the market’s interpretation of their policy path remained remarkably fickle in the first quarter
of 2023; in early March, after a strong labor market report, the market expected a terminal Federal Funds target rate of 5.50-5.75%, higher
than the Fed’s own “dot plot” projection. However, by the end of the first quarter of 2023, investors had rapidly slashed
rate expectations amid chaos in the banking sector, pricing in a terminal Federal Funds target rate of 4.75-5.00%. In effect, the market
went from expecting as many as three interest rate hikes in 2023, to pricing in as many as four interest rate cuts by January 2024. While
the market waivered in the first quarter of 2023, the Fed did not, as they maintained their forecast of a 5.00-5.25% terminal Federal
Funds target rate at the May 2023 meeting. At the same time, the April 2023 (reported in May 2023) CPI remained 4.9%, proving the Fed’s
battle against inflation had yet to be won.
The
10-Year U.S. Treasury yield (rates) increased from 2.85% on May 31, 2022, to 3.88% on December 30, 2022, after reaching highs of 4.24%
in October 2022. The 10-Year U.S. Treasury yielded 3.65% as of May 31, 2023. Over the last twelve months, investors experienced two stark
return profiles. As rising interest rates plagued fixed income returns in 2022, from May 31, 2022 to December 30, 2022, investment grade
corporate bonds returned -4.07%, senior loans returned 1.70%, high yield bonds returned -3.76%, and equities (the S&P 500®
Index) returned -6.14%. However, as yields rose across nearly all fixed income asset classes in 2023, the bond math improved; from
December 30, 2022 to May 31, 2023, investment grade corporate bonds returned 2.94%, senior loans returned 4.15% and high yield bonds returned
3.73%, while exuberant investor sentiment pushed the S&P 500®
Index up 9.65% over that same time period.
Portfolio
Commentary (Continued)
First
Trust High Yield Opportunities 2027 Term Fund (FTHY)
Annual
Report
May
31, 2023 (Unaudited)
High-Yield
Bond Market
High-yield
bond spreads over U.S. Treasuries increased 48 bps in the 12-month period ended May 31, 2023 to T+471 bps. The current spread is 79 bps
below the high-yield bond market’s long-term average spread over U.S. Treasuries of T+550 bps (December 1997 – May 2023).
High-yield bond funds reported their fifth monthly outflow in the last six months, marking the eighth outflow over the last twelve-month
(“LTM”) period. High-yield bond outflows totaled $24.7 billion in the LTM period.
During
the LTM period, higher quality BB rated high-yield bonds returned -0.49%, underperforming single-B rated bonds (0.32%) and outperforming
CCC rated bonds (-0.57%). The average price of high-yield bonds in the market decreased from $92.46 at the beginning of the period to
$87.48 at the end of the period.(1)
Senior
Loan Market
Senior
loan spreads over the 3-month London Interbank Offered Rate (“LIBOR”) increased 57 bps in the 12-month period ended May 31,
2023 to L+608 bps. The current spread is 91 bps above the senior loan market’s long-term average spread of L+517 bps (December 1997
– May 2023). Loan fund outflows totaled $49.8 billion over the LTM period. Seventeen consecutive monthly inflows totaling $71.70
billion (from December 2020 to April 2022) preceded recent outflows.
During
the LTM period, higher quality BB rated senior loans returned 7.51%, outperforming single-B rated senior loans (6.07%) and CCC rated senior
loans (-1.55%). The average price of senior loans in the market decreased from $94.64 at the beginning of the period to $92.89 at the
end of the period.(1)
Default
Rates
During
the 12-month period ended May 31, 2023, default rates increased within the high-yield bond and senior loan markets, as respectively measured
by the JP Morgan High-Yield Bond Universe and the Morningstar®
LSTA® US Leveraged Loan Index. The LTM default rate within
the high-yield bond market increased from 0.43% at the beginning of the period to 1.49% at the end of the period. The LTM default rate
within the senior loan market increased from 0.21% at the beginning of the period to 1.58% at the end of the period. The default rates
in both the high-yield bond market and the senior loan market are below the long-term average default rates of 3.02% and 2.72%, respectively.(2)
Performance
Analysis
|
|
|
|
Average
Annual Total Returns |
|
|
|
1 Year Ended
5/31/23 |
Inception (6/25/20)
to 5/31/23 |
| Fund
Performance(3)
|
|
|
|
| NAV(4)
|
|
-1.86%
|
-0.42%
|
| Market
Value |
|
-6.27%
|
-4.74%
|
| Index
Performance |
|
|
|
| ICE
BofA US High Yield Constrained Index |
|
-0.17%
|
2.48%
|
| (1)
|
Source:
Bloomberg. Performance of senior loans and high-yield bonds are based on the Morningstar®
LSTA® US Leveraged Loan Index and ICE BofA US High Yield
Constrained Index, respectively. |
| (2)
|
Source:
J.P. Morgan High Yield Market Monitor |
| (3)
|
Total
return is based on the combination of reinvested dividend, capital gain and return of capital distributions, if any, at prices obtained
by the Dividend Reinvestment Plan and changes in NAV per Common Share for NAV returns and changes in Common Share price for market value
returns. Total returns do not reflect sales load and are not annualized for periods of less than one year. |
| (4)
|
On
January 3, 2023, the fair value methodology used to value the senior loan investments held by the Fund was changed. Prior to that date,
the senior loans were valued using the bid side price provided by a pricing service. After such date, the senior loans were valued using
the midpoint between the bid and ask price provided by a pricing service. The change in the Fund’s fair value methodology on January
3, 2023, resulted in a one-time increase in the Fund’s NAV of approximately $0.018 per share on that date, which represented a positive
impact on the Fund’s performance of 0.11%. Without the change to the pricing methodology, the performance of the Fund on a NAV basis
would have been -1.92% and -0.44%, in the one-year and since inception periods ended May 31, 2023, respectively. |
Portfolio
Commentary (Continued)
First
Trust High Yield Opportunities 2027 Term Fund (FTHY)
Annual
Report
May
31, 2023 (Unaudited)
Performance figures assume reinvestment of all distributions and do not reflect the deduction of taxes that a shareholder would pay on
Fund distributions or the redemption or sale of Fund shares. An index is a statistical composite that tracks a specified financial market
or sector. Unlike the Fund, the index does not actually hold a portfolio of securities and therefore does not incur the expenses incurred
by the Fund. These expenses negatively impact the performance of the Fund. The Fund’s past performance does not predict future performance.
During
the 12-month period ended May 31, 2023, the Fund generated a net asset value (“NAV”) return of -1.86% and a market price return(5)
of -6.27%. This compares to the ICE BofA US High Yield Constrained Index’s (the “Index”) return of -0.17% over the same
period. The Fund’s discount to NAV widened from -8.07% at the beginning of the period to -12.21% at the end of the period as the
Fund’s market price deceased more than its NAV.
At
the end of May 2023, the Fund was well diversified across 208 securities (average position size of 0.48%) and the top 10 issuers comprised
32.50% of the Fund. The Fund was also well diversified across 37 different industries, the largest of which was Media at 16.40%, followed
by Software at 15.15%, and Insurance at 14.84%. Additionally, the Fund held 80.72% of its total assets in high yield bonds at the end
of the period. The Fund’s leverage was 17.84% of adjusted net assets (net assets plus borrowings) at the end of the period. The
Fund’s use of leverage proved a modest headwind to performance as risk assets generated negative returns in the LTM period. The
Fund strategically reduced leverage from 30.19% at the beginning of the period to 17.84% at the end of the period. Finally, the Fund
modestly utilized credit default swap indices (“CDX”) as a hedge against volatility during the period which had a nominal
but positive impact to performance during the LTM period.
The
primary contributors to performance relative to the Index in the LTM period were the Fund’s overweight allocation and security selection
within the Insurance industry, as well as the Fund’s security selection within the Technology and Electronics industry. Within the
Insurance industry, the Fund’s overweight positions in insurance brokerage companies drove returns. Within the Technology and Electronics
industries, the Fund’s overweight position in a telecommunications equipment manufacturer, as well as the Fund’s overweight
position in a digital advertising company, drove returns. At the end of the period, the Fund held 80.72% in high yield bonds and 19.25%
in senior loans; this compares to 72.92% and 26.86%, respectively, at the beginning of the period. Senior loans outperformed high yield
bonds in the LTM period, which also benefited the Fund’s return.
The
Fund’s overweight position and security selection within the Media industry partially offset the aforementioned tailwinds to performance.
Within the Media industry, the Fund’s overweight positions in a cable television provider and a radio broadcaster detracted from
performance. The Fund’s underweight position in the Energy industry proved an additional headwind to performance as the Energy sector
outperformed the overall Index in the LTM period.
The
Fund has a practice of seeking to maintain a relatively stable monthly distribution, which may be changed at any time. The practice has
no impact on the Fund’s investment strategy and may reduce the Fund’s NAV. However, the Advisor believes the practice helps
maintain the Fund’s competitiveness and may benefit the Fund’s market price and premium/discount to the Fund’s NAV.
The monthly distribution rate began the period at $0.1344 per share and ended the period at $0.1300 per share. At the $0.1300 per share
monthly distribution rate, the annualized distribution rate at May 31, 2023 was 10.13% at NAV and 11.54% at market price. For the twelve-month
period ended May 31, 2023, 62.78% of the distributions were characterized as ordinary income and 37.22% were characterized as return of
capital. The final determination of the source and tax status of all 2023 distributions will be made after the
| (5)
|
Total
return is based on the combination of reinvested dividend, capital gain and return of capital distributions, if any, at prices obtained
by the Dividend Reinvestment Plan and changes in NAV per Common Share for NAV returns and changes in Common Share price for market value
returns. Total returns do not reflect sales load and are not annualized for periods of less than one year. |
Portfolio
Commentary (Continued)
First
Trust High Yield Opportunities 2027 Term Fund (FTHY)
Annual
Report
May
31, 2023 (Unaudited)
end
of 2023 and will be provided on Form 1099-DIV. The foregoing is not to be construed as tax advice. Please consult your tax advisor for
further information regarding tax matters.
Market
and Fund Outlook
By
the second half of 2022, financial markets had refocused on an increasingly hawkish Fed. While persistent rate volatility depressed fixed
income returns in 2022, higher levels of income supported positive returns in 2023. Though corporate issuer fundamentals proved intact
at the beginning of the period, marked by healthy balance sheets and strong liquidity profiles, we expect volatility to persist as investors
navigate the current business cycle. Given our expectation of a recession in late 2023 or early 2024, we continue to favor defensive positioning
in businesses that exhibit lower cyclicality. In this environment of widespread uncertainty and dislocation, we remain focused on our
detailed credit underwriting process and disciplined approach to risk management.
First
Trust High Yield Opportunities 2027 Term Fund (FTHY)
Portfolio
of Investments
May
31, 2023
Principal
Value |
|
Description
|
|
Stated
Coupon |
|
Stated
Maturity |
|
Value
|
| CORPORATE
BONDS AND NOTES – 87.6% |
|
|
|
Aerospace
& Defense – 0.6% |
|
|
|
|
|
|
| $158,000
|
|
Booz Allen Hamilton, Inc. (a) (b)
|
|
3.88%
|
|
09/01/28
|
|
$141,827
|
| 2,598,000
|
|
TransDigm, Inc. (a) (b)
|
|
6.25%
|
|
03/15/26
|
|
2,582,551
|
| 556,000
|
|
TransDigm, Inc. (a) (b)
|
|
6.75%
|
|
08/15/28
|
|
557,336
|
|
|
|
|
|
3,281,714
|
|
|
|
Agricultural
Products & Services – 0.1% |
|
|
|
|
|
|
| 623,000
|
|
Lamb Weston Holdings, Inc. (a) (b)
|
|
4.88%
|
|
05/15/28
|
|
602,283
|
|
|
|
Apparel
Retail – 0.8% |
|
|
|
|
|
|
| 4,040,000
|
|
Nordstrom, Inc. (b)
|
|
4.00%
|
|
03/15/27
|
|
3,500,438
|
| 1,146,000
|
|
Nordstrom, Inc. (b)
|
|
4.38%
|
|
04/01/30
|
|
912,313
|
|
|
|
|
|
4,412,751
|
|
|
|
Application
Software – 1.5% |
|
|
|
|
|
|
| 1,631,000
|
|
Alteryx, Inc. (a) (b)
|
|
8.75%
|
|
03/15/28
|
|
1,566,921
|
| 5,755,000
|
|
GoTo Group, Inc. (a) (b)
|
|
5.50%
|
|
09/01/27
|
|
3,284,530
|
| 3,000,000
|
|
McAfee Corp. (a) (b)
|
|
7.38%
|
|
02/15/30
|
|
2,525,931
|
| 1,513,000
|
|
Open Text Holdings, Inc. (a) (b)
|
|
4.13%
|
|
12/01/31
|
|
1,242,861
|
|
|
|
|
|
8,620,243
|
|
|
|
Automobile
Manufacturers – 0.7% |
|
|
|
|
|
|
| 3,369,000
|
|
Ford Motor Co. (b)
|
|
9.63%
|
|
04/22/30
|
|
3,843,149
|
| 333,000
|
|
Penske Automotive Group, Inc. (b)
|
|
3.50%
|
|
09/01/25
|
|
316,983
|
|
|
|
|
|
4,160,132
|
|
|
|
Automotive
Retail – 0.0% |
|
|
|
|
|
|
| 83,000
|
|
Group 1 Automotive, Inc. (a) (b)
|
|
4.00%
|
|
08/15/28
|
|
72,767
|
|
|
|
Broadcasting –
12.3% |
|
|
|
|
|
|
| 5,708,000
|
|
Gray Television, Inc. (a) (b)
|
|
5.88%
|
|
07/15/26
|
|
4,913,159
|
| 8,201,000
|
|
Gray Television, Inc. (a) (b)
|
|
7.00%
|
|
05/15/27
|
|
6,764,386
|
| 3,409,000
|
|
Gray Television, Inc. (a) (b)
|
|
4.75%
|
|
10/15/30
|
|
2,212,834
|
| 13,053,000
|
|
iHeartCommunications, Inc. (b)
|
|
8.38%
|
|
05/01/27
|
|
7,380,285
|
| 22,177,000
|
|
Nexstar Media, Inc. (a) (b)
|
|
5.63%
|
|
07/15/27
|
|
20,374,564
|
| 3,150,000
|
|
Nexstar Media, Inc. (a) (b)
|
|
4.75%
|
|
11/01/28
|
|
2,661,746
|
| 611,000
|
|
Scripps Escrow II, Inc. (a) (b)
|
|
3.88%
|
|
01/15/29
|
|
471,289
|
| 17,974,000
|
|
Sinclair Television Group, Inc. (a) (b)
|
|
5.13%
|
|
02/15/27
|
|
14,760,348
|
| 6,745,000
|
|
Sirius XM Radio, Inc. (a) (b)
|
|
3.13%
|
|
09/01/26
|
|
5,958,695
|
| 343,000
|
|
Sirius XM Radio, Inc. (a) (b)
|
|
5.50%
|
|
07/01/29
|
|
299,826
|
| 1,959,000
|
|
Univision Communications, Inc. (a) (b)
|
|
5.13%
|
|
02/15/25
|
|
1,894,412
|
| 2,027,000
|
|
Univision Communications, Inc. (a) (b)
|
|
6.63%
|
|
06/01/27
|
|
1,922,070
|
|
|
|
|
|
69,613,614
|
|
|
|
Building
Products – 0.2% |
|
|
|
|
|
|
| 574,000
|
|
Standard Industries, Inc. (a) (b)
|
|
4.75%
|
|
01/15/28
|
|
527,207
|
| 858,000
|
|
Standard Industries, Inc. (a) (b)
|
|
4.38%
|
|
07/15/30
|
|
725,354
|
|
|
|
|
|
1,252,561
|
|
|
|
Cable
& Satellite – 7.2% |
|
|
|
|
|
|
| 2,262,000
|
|
CCO Holdings, LLC/CCO Holdings Capital Corp. (a) (b)
|
|
5.00%
|
|
02/01/28
|
|
2,058,526
|
| 9,088,000
|
|
CCO Holdings, LLC/CCO Holdings Capital Corp. (a) (b)
|
|
5.38%
|
|
06/01/29
|
|
8,191,817
|
| 4,567,000
|
|
CCO Holdings, LLC/CCO Holdings Capital Corp. (a) (b)
|
|
6.38%
|
|
09/01/29
|
|
4,264,803
|
| 9,913,000
|
|
CCO Holdings, LLC/CCO Holdings Capital Corp. (a) (b)
|
|
4.75%
|
|
03/01/30
|
|
8,372,206
|
| 3,993,000
|
|
CCO Holdings, LLC/CCO Holdings Capital Corp. (a) (b)
|
|
4.50%
|
|
08/15/30
|
|
3,290,599
|
| 1,155,000
|
|
CCO Holdings, LLC/CCO Holdings Capital Corp. (a) (b)
|
|
4.25%
|
|
02/01/31
|
|
926,292
|
| 1,544,000
|
|
CCO Holdings, LLC/CCO Holdings Capital Corp. (a) (b)
|
|
7.38%
|
|
03/03/31
|
|
1,478,810
|
Page
8
See
Notes to Financial Statements
First
Trust High Yield Opportunities 2027 Term Fund (FTHY)
Portfolio
of Investments (Continued)
May
31, 2023
Principal
Value |
|
Description
|
|
Stated
Coupon |
|
Stated
Maturity |
|
Value
|
| CORPORATE
BONDS AND NOTES (Continued) |
|
|
|
Cable
& Satellite (Continued) |
|
|
|
|
|
|
| $2,370,000
|
|
CSC Holdings, LLC (a) (b)
|
|
7.50%
|
|
04/01/28
|
|
$1,287,137
|
| 667,000
|
|
CSC Holdings, LLC (a) (b)
|
|
11.25%
|
|
05/15/28
|
|
632,763
|
| 19,531,000
|
|
CSC Holdings, LLC (a)
|
|
5.75%
|
|
01/15/30
|
|
8,623,817
|
| 3,000,000
|
|
CSC Holdings, LLC (a)
|
|
4.63%
|
|
12/01/30
|
|
1,285,287
|
| 250,000
|
|
CSC Holdings, LLC (a) (b)
|
|
3.38%
|
|
02/15/31
|
|
171,150
|
| 143,000
|
|
Directv Financing, LLC/Directv Financing Co-Obligor, Inc. (a) (b)
|
|
5.88%
|
|
08/15/27
|
|
126,118
|
|
|
|
|
|
40,709,325
|
|
|
|
Casinos
& Gaming – 4.0% |
|
|
|
|
|
|
| 1,438,000
|
|
Boyd Gaming Corp. (a) (b)
|
|
4.75%
|
|
06/15/31
|
|
1,280,202
|
| 1,999,000
|
|
Caesars Entertainment, Inc. (a) (b)
|
|
4.63%
|
|
10/15/29
|
|
1,725,867
|
| 77,000
|
|
Caesars Entertainment, Inc. (a) (b)
|
|
7.00%
|
|
02/15/30
|
|
77,423
|
| 71,000
|
|
CDI Escrow Issuer, Inc. (a) (b)
|
|
5.75%
|
|
04/01/30
|
|
66,618
|
| 9,182,000
|
|
Fertitta Entertainment, LLC/Fertitta Entertainment Finance Co., Inc. (a) (b)
|
|
6.75%
|
|
01/15/30
|
|
7,480,277
|
| 170,000
|
|
MGM Resorts International (b)
|
|
6.75%
|
|
05/01/25
|
|
170,800
|
| 582,000
|
|
MGM Resorts International (b)
|
|
5.75%
|
|
06/15/25
|
|
578,472
|
| 284,000
|
|
Scientific Games Holdings L.P./Scientific Games US FinCo, Inc. (a) (b)
|
|
6.63%
|
|
03/01/30
|
|
249,968
|
| 2,694,000
|
|
Station Casinos, LLC (a) (b)
|
|
4.50%
|
|
02/15/28
|
|
2,400,722
|
| 1,624,000
|
|
VICI Properties L.P./VICI Note Co., Inc. (a) (b)
|
|
3.50%
|
|
02/15/25
|
|
1,550,326
|
| 7,698,000
|
|
VICI Properties L.P./VICI Note Co., Inc. (a) (b)
|
|
4.25%
|
|
12/01/26
|
|
7,230,620
|
| 60,000
|
|
VICI Properties L.P./VICI Note Co., Inc. (a) (b)
|
|
3.75%
|
|
02/15/27
|
|
55,638
|
|
|
|
|
|
22,866,933
|
|
|
|
Commercial
Printing – 0.2% |
|
|
|
|
|
|
| 471,000
|
|
Multi-Color Corp. (LABL, Inc.) (a) (b)
|
|
10.50%
|
|
07/15/27
|
|
439,430
|
| 612,000
|
|
Multi-Color Corp. (LABL, Inc.) (a) (b)
|
|
9.50%
|
|
11/01/28
|
|
615,482
|
|
|
|
|
|
1,054,912
|
|
|
|
Construction
& Engineering – 0.9% |
|
|
|
|
|
|
| 5,605,000
|
|
Pike Corp. (a) (b)
|
|
5.50%
|
|
09/01/28
|
|
5,010,758
|
|
|
|
Construction
Materials – 0.9% |
|
|
|
|
|
|
| 74,000
|
|
GYP Holdings III Corp. (a) (b)
|
|
4.63%
|
|
05/01/29
|
|
64,288
|
| 5,167,000
|
|
Summit Materials, LLC/Summit Materials Finance Corp. (a) (b)
|
|
5.25%
|
|
01/15/29
|
|
4,855,094
|
|
|
|
|
|
4,919,382
|
|
|
|
Consumer
Finance – 0.6% |
|
|
|
|
|
|
| 811,000
|
|
Black Knight InfoServ, LLC (a) (b)
|
|
3.63%
|
|
09/01/28
|
|
728,886
|
| 3,056,000
|
|
FirstCash, Inc. (a) (b)
|
|
4.63%
|
|
09/01/28
|
|
2,723,814
|
|
|
|
|
|
3,452,700
|
|
|
|
Diversified
Support Services – 0.1% |
|
|
|
|
|
|
| 300,000
|
|
Ritchie Bros. Auctioneers, Inc. (a) (b)
|
|
6.75%
|
|
03/15/28
|
|
303,942
|
| 300,000
|
|
Ritchie Bros. Auctioneers, Inc. (a) (b)
|
|
7.75%
|
|
03/15/31
|
|
313,056
|
|
|
|
|
|
616,998
|
|
|
|
Electric
Utilities – 2.4% |
|
|
|
|
|
|
| 13,275,000
|
|
PG&E Corp. (b)
|
|
5.00%
|
|
07/01/28
|
|
12,257,198
|
| 1,588,000
|
|
Vistra Operations Co., LLC (a) (b)
|
|
5.00%
|
|
07/31/27
|
|
1,493,973
|
|
|
|
|
|
13,751,171
|
|
|
|
Electrical
Components & Equipment – 0.1% |
|
|
|
|
|
|
| 333,000
|
|
Sensata Technologies, Inc. (a) (b)
|
|
3.75%
|
|
02/15/31
|
|
282,743
|
See
Notes to Financial Statements
Page
9
First
Trust High Yield Opportunities 2027 Term Fund (FTHY)
Portfolio
of Investments (Continued)
May
31, 2023
Principal
Value |
|
Description
|
|
Stated
Coupon |
|
Stated
Maturity |
|
Value
|
| CORPORATE
BONDS AND NOTES (Continued) |
|
|
|
Environmental
& Facilities Services – 0.3% |
|
|
|
|
|
|
| $1,907,000
|
|
Waste Pro USA, Inc. (a) (b)
|
|
5.50%
|
|
02/15/26
|
|
$1,757,411
|
|
|
|
Financial
Exchanges & Data – 0.1% |
|
|
|
|
|
|
| 565,000
|
|
MSCI, Inc. (a) (b)
|
|
3.25%
|
|
08/15/33
|
|
453,154
|
|
|
|
Food
Distributors – 0.1% |
|
|
|
|
|
|
| 603,000
|
|
US Foods, Inc. (a) (b)
|
|
4.75%
|
|
02/15/29
|
|
550,745
|
|
|
|
Health
Care Equipment – 0.1% |
|
|
|
|
|
|
| 652,000
|
|
Baxter International, Inc. (b)
|
|
1.32%
|
|
11/29/24
|
|
612,666
|
|
|
|
Health
Care Facilities – 6.9% |
|
|
|
|
|
|
| 1,510,000
|
|
Acadia Healthcare Co., Inc. (a) (b)
|
|
5.00%
|
|
04/15/29
|
|
1,386,503
|
| 718,000
|
|
Encompass Health Corp. (b)
|
|
4.75%
|
|
02/01/30
|
|
655,008
|
| 7,218,000
|
|
HCA, Inc. (b)
|
|
5.88%
|
|
02/15/26
|
|
7,254,434
|
| 569,000
|
|
HCA, Inc. (b)
|
|
5.38%
|
|
09/01/26
|
|
566,819
|
| 7,842,000
|
|
Select Medical Corp. (a) (b)
|
|
6.25%
|
|
08/15/26
|
|
7,634,746
|
| 302,000
|
|
Tenet Healthcare Corp. (b)
|
|
4.88%
|
|
01/01/26
|
|
292,403
|
| 19,000,000
|
|
Tenet Healthcare Corp. (b)
|
|
6.25%
|
|
02/01/27
|
|
18,733,195
|
| 1,358,000
|
|
Tenet Healthcare Corp. (b)
|
|
5.13%
|
|
11/01/27
|
|
1,298,881
|
| 1,329,000
|
|
Tenet Healthcare Corp. (b)
|
|
4.63%
|
|
06/15/28
|
|
1,237,149
|
|
|
|
|
|
39,059,138
|
|
|
|
Health
Care Services – 2.6% |
|
|
|
|
|
|
| 8,712,000
|
|
DaVita, Inc. (a) (b)
|
|
4.63%
|
|
06/01/30
|
|
7,472,809
|
| 551,000
|
|
DaVita, Inc. (a) (b)
|
|
3.75%
|
|
02/15/31
|
|
437,932
|
| 10,403,000
|
|
Global Medical Response, Inc. (a) (b)
|
|
6.50%
|
|
10/01/25
|
|
7,038,514
|
|
|
|
|
|
14,949,255
|
|
|
|
Health
Care Supplies – 2.3% |
|
|
|
|
|
|
| 9,847,000
|
|
Medline Borrower L.P. (a) (b)
|
|
3.88%
|
|
04/01/29
|
|
8,503,276
|
| 4,833,000
|
|
Medline Borrower L.P. (a) (b)
|
|
5.25%
|
|
10/01/29
|
|
4,140,323
|
| 330,000
|
|
Owens & Minor, Inc. (a) (b)
|
|
4.50%
|
|
03/31/29
|
|
271,088
|
|
|
|
|
|
12,914,687
|
|
|
|
Health
Care Technology – 2.3% |
|
|
|
|
|
|
| 6,527,000
|
|
AthenaHealth Group, Inc. (a) (b)
|
|
6.50%
|
|
02/15/30
|
|
5,382,047
|
| 397,000
|
|
HealthEquity, Inc. (a) (b)
|
|
4.50%
|
|
10/01/29
|
|
353,020
|
| 7,307,000
|
|
Verscend Escrow Corp. (a) (b)
|
|
9.75%
|
|
08/15/26
|
|
7,333,473
|
|
|
|
|
|
13,068,540
|
|
|
|
Hotels,
Resorts & Cruise Lines – 0.1% |
|
|
|
|
|
|
| 289,000
|
|
Wyndham Hotels & Resorts, Inc. (a) (b)
|
|
4.38%
|
|
08/15/28
|
|
265,536
|
| 575,000
|
|
XHR L.P. (a) (b)
|
|
4.88%
|
|
06/01/29
|
|
493,048
|
|
|
|
|
|
758,584
|
|
|
|
Household
Products – 0.6% |
|
|
|
|
|
|
| 1,121,000
|
|
Energizer Holdings, Inc. (a) (b)
|
|
6.50%
|
|
12/31/27
|
|
1,078,811
|
| 1,746,000
|
|
Energizer Holdings, Inc. (a) (b)
|
|
4.75%
|
|
06/15/28
|
|
1,555,791
|
| 650,000
|
|
Energizer Holdings, Inc. (a) (b)
|
|
4.38%
|
|
03/31/29
|
|
557,700
|
|
|
|
|
|
3,192,302
|
|
|
|
Independent
Power Producers & Energy Traders – 0.4% |
|
|
|
|
|
|
| 2,770,000
|
|
Calpine Corp. (a) (b)
|
|
5.13%
|
|
03/15/28
|
|
2,484,538
|
|
|
|
Industrial
Machinery & Supplies & Components – 1.1% |
|
|
|
|
|
|
| 6,597,000
|
|
Gates Global, LLC/Gates Corp. (a) (b)
|
|
6.25%
|
|
01/15/26
|
|
6,473,603
|
Page
10
See
Notes to Financial Statements
First
Trust High Yield Opportunities 2027 Term Fund (FTHY)
Portfolio
of Investments (Continued)
May
31, 2023
Principal
Value |
|
Description
|
|
Stated
Coupon |
|
Stated
Maturity |
|
Value
|
| CORPORATE
BONDS AND NOTES (Continued) |
|
|
|
Insurance
Brokers – 14.2% |
|
|
|
|
|
|
| $17,071,000
|
|
Alliant Holdings Intermediate, LLC/Alliant Holdings Co-Issuer (a) (b)
|
|
6.75%
|
|
10/15/27
|
|
$15,930,607
|
| 7,588,000
|
|
Alliant Holdings Intermediate, LLC/Alliant Holdings Co-Issuer (a) (b)
|
|
6.75%
|
|
04/15/28
|
|
7,453,186
|
| 210,000
|
|
Alliant Holdings Intermediate, LLC/Alliant Holdings Co-Issuer (a) (b)
|
|
5.88%
|
|
11/01/29
|
|
180,371
|
| 19,532,000
|
|
AmWINS Group, Inc. (a) (b)
|
|
4.88%
|
|
06/30/29
|
|
17,457,752
|
| 8,980,000
|
|
AssuredPartners, Inc. (a) (b)
|
|
7.00%
|
|
08/15/25
|
|
8,867,195
|
| 13,689,000
|
|
AssuredPartners, Inc. (a) (b)
|
|
5.63%
|
|
01/15/29
|
|
11,858,963
|
| 2,092,000
|
|
BroadStreet Partners, Inc. (a) (b)
|
|
5.88%
|
|
04/15/29
|
|
1,812,401
|
| 1,211,000
|
|
GTCR AP Finance, Inc. (a) (b)
|
|
8.00%
|
|
05/15/27
|
|
1,179,876
|
| 7,908,000
|
|
HUB International Ltd. (a) (b)
|
|
7.00%
|
|
05/01/26
|
|
7,798,852
|
| 4,934,000
|
|
HUB International Ltd. (a) (b)
|
|
5.63%
|
|
12/01/29
|
|
4,432,093
|
| 3,801,000
|
|
Ryan Specialty Group, LLC (a) (b)
|
|
4.38%
|
|
02/01/30
|
|
3,375,446
|
|
|
|
|
|
80,346,742
|
|
|
|
Integrated
Telecommunication Services – 0.9% |
|
|
|
|
|
|
| 61,000
|
|
Zayo Group Holdings, Inc. (a) (b)
|
|
4.00%
|
|
03/01/27
|
|
42,680
|
| 8,267,000
|
|
Zayo Group Holdings, Inc. (a) (b)
|
|
6.13%
|
|
03/01/28
|
|
4,989,409
|
|
|
|
|
|
5,032,089
|
|
|
|
Interactive
Media & Services – 1.4% |
|
|
|
|
|
|
| 8,270,000
|
|
Cars.com, Inc. (a) (b)
|
|
6.38%
|
|
11/01/28
|
|
7,679,357
|
|
|
|
Internet
Services & Infrastructure – 1.3% |
|
|
|
|
|
|
| 6,210,000
|
|
Go Daddy Operating Co., LLC/GD Finance Co., Inc. (a) (b)
|
|
5.25%
|
|
12/01/27
|
|
5,938,654
|
| 1,816,000
|
|
Go Daddy Operating Co., LLC/GD Finance Co., Inc. (a) (b)
|
|
3.50%
|
|
03/01/29
|
|
1,573,881
|
|
|
|
|
|
7,512,535
|
|
|
|
Investment
Banking & Brokerage – 0.2% |
|
|
|
|
|
|
| 1,045,000
|
|
LPL Holdings, Inc. (a) (b)
|
|
4.63%
|
|
11/15/27
|
|
970,383
|
|
|
|
IT
Consulting & Other Services – 0.3% |
|
|
|
|
|
|
| 2,000,000
|
|
Gartner, Inc. (a) (b)
|
|
4.50%
|
|
07/01/28
|
|
1,885,575
|
|
|
|
Leisure
Facilities – 0.1% |
|
|
|
|
|
|
| 283,000
|
|
SeaWorld Parks & Entertainment, Inc. (a) (b)
|
|
5.25%
|
|
08/15/29
|
|
254,004
|
|
|
|
Managed
Health Care – 1.7% |
|
|
|
|
|
|
| 6,806,000
|
|
Centene Corp. (b)
|
|
4.25%
|
|
12/15/27
|
|
6,402,268
|
| 2,577,000
|
|
MPH Acquisition Holdings, LLC (a) (b)
|
|
5.50%
|
|
09/01/28
|
|
2,057,221
|
| 1,296,000
|
|
MPH Acquisition Holdings, LLC (a) (b)
|
|
5.75%
|
|
11/01/28
|
|
927,910
|
|
|
|
|
|
9,387,399
|
|
|
|
Metal,
Glass & Plastic Containers – 1.9% |
|
|
|
|
|
|
| 903,000
|
|
Ball Corp. (b)
|
|
6.88%
|
|
03/15/28
|
|
924,726
|
| 4,227,000
|
|
Ball Corp. (b)
|
|
2.88%
|
|
08/15/30
|
|
3,497,315
|
| 5,419,000
|
|
Berry Global, Inc. (a) (b)
|
|
5.63%
|
|
07/15/27
|
|
5,351,805
|
| 75,000
|
|
Crown Americas, LLC (b)
|
|
5.25%
|
|
04/01/30
|
|
71,669
|
| 600,000
|
|
Owens-Brockway Glass Container, Inc. (a) (b)
|
|
7.25%
|
|
05/15/31
|
|
611,250
|
|
|
|
|
|
10,456,765
|
|
|
|
Movies
& Entertainment – 1.2% |
|
|
|
|
|
|
| 4,380,000
|
|
Live Nation Entertainment, Inc. (a) (b)
|
|
5.63%
|
|
03/15/26
|
|
4,286,027
|
| 2,620,000
|
|
Live Nation Entertainment, Inc. (a) (b)
|
|
4.75%
|
|
10/15/27
|
|
2,430,666
|
See
Notes to Financial Statements
Page
11
First
Trust High Yield Opportunities 2027 Term Fund (FTHY)
Portfolio
of Investments (Continued)
May
31, 2023
Principal
Value |
|
Description
|
|
Stated
Coupon |
|
Stated
Maturity |
|
Value
|
| CORPORATE
BONDS AND NOTES (Continued) |
|
|
|
Movies
& Entertainment (Continued) |
|
|
|
|
|
|
| $394,000
|
|
WMG Acquisition Corp. (a) (b)
|
|
3.00%
|
|
02/15/31
|
|
$318,196
|
|
|
|
|
|
7,034,889
|
|
|
|
Other
Specialty Retail – 0.0% |
|
|
|
|
|
|
| 150,000
|
|
PetSmart, Inc./PetSmart Finance Corp. (a) (b)
|
|
4.75%
|
|
02/15/28
|
|
138,922
|
|
|
|
Paper
& Plastic Packaging Products & Materials – 3.0% |
|
|
|
|
|
|
| 12,280,000
|
|
Graham Packaging Co., Inc. (a) (b)
|
|
7.13%
|
|
08/15/28
|
|
10,424,369
|
| 6,200,000
|
|
Pactiv Evergreen Group Issuer, Inc./Pactiv Evergreen Group Issuer, LLC (a) (b)
|
|
4.00%
|
|
10/15/27
|
|
5,471,128
|
| 180,000
|
|
Pactiv, LLC (b)
|
|
7.95%
|
|
12/15/25
|
|
183,126
|
| 617,000
|
|
Sealed Air Corp. (a) (b)
|
|
6.13%
|
|
02/01/28
|
|
611,969
|
| 566,000
|
|
Sealed Air Corp. (a) (b)
|
|
5.00%
|
|
04/15/29
|
|
525,837
|
|
|
|
|
|
17,216,429
|
|
|
|
Personal
Care Products – 0.2% |
|
|
|
|
|
|
| 1,389,000
|
|
Prestige Brands, Inc. (a) (b)
|
|
5.13%
|
|
01/15/28
|
|
1,328,308
|
|
|
|
Research
& Consulting Services – 0.9% |
|
|
|
|
|
|
| 6,126,000
|
|
CoreLogic, Inc. (a) (b)
|
|
4.50%
|
|
05/01/28
|
|
4,934,585
|
|
|
|
Restaurants –
0.9% |
|
|
|
|
|
|
| 5,088,000
|
|
IRB Holding Corp. (a) (b)
|
|
7.00%
|
|
06/15/25
|
|
5,106,118
|
|
|
|
Security
& Alarm Services – 0.3% |
|
|
|
|
|
|
| 2,000,000
|
|
Brink’s (The) Co. (a) (b)
|
|
4.63%
|
|
10/15/27
|
|
1,867,929
|
|
|
|
Specialized
Consumer Services – 1.3% |
|
|
|
|
|
|
| 2,794,000
|
|
Aramark Services, Inc. (a) (b)
|
|
6.38%
|
|
05/01/25
|
|
2,775,560
|
| 4,932,000
|
|
Aramark Services, Inc. (a) (b)
|
|
5.00%
|
|
02/01/28
|
|
4,666,288
|
|
|
|
|
|
7,441,848
|
|
|
|
Specialized
Finance – 0.5% |
|
|
|
|
|
|
| 724,000
|
|
Park Intermediate Holdings, LLC/PK Domestic Property, LLC/PK Finance Co-Issuer (a) (b)
|
|
4.88%
|
|
05/15/29
|
|
623,516
|
| 1,149,000
|
|
Radiate HoldCo, LLC/Radiate Finance, Inc. (a) (b)
|
|
4.50%
|
|
09/15/26
|
|
886,063
|
| 2,284,000
|
|
Radiate HoldCo, LLC/Radiate Finance, Inc. (a) (b)
|
|
6.50%
|
|
09/15/28
|
|
1,150,416
|
|
|
|
|
|
2,659,995
|
|
|
|
Specialty
Chemicals – 1.6% |
|
|
|
|
|
|
| 9,754,000
|
|
Avantor Funding, Inc. (a) (b)
|
|
4.63%
|
|
07/15/28
|
|
9,030,924
|
|
|
|
Systems
Software – 5.5% |
|
|
|
|
|
|
| 2,724,000
|
|
Boxer Parent Co., Inc. (a) (b)
|
|
9.13%
|
|
03/01/26
|
|
2,658,951
|
| 1,931,000
|
|
Gen Digital, Inc. (a) (b)
|
|
7.13%
|
|
09/30/30
|
|
1,929,482
|
| 1,000,000
|
|
Oracle Corp. (b)
|
|
6.15%
|
|
11/09/29
|
|
1,055,171
|
| 1,000,000
|
|
Oracle Corp. (b)
|
|
6.25%
|
|
11/09/32
|
|
1,058,144
|
| 1,796,000
|
|
Oracle Corp. (b)
|
|
6.50%
|
|
04/15/38
|
|
1,920,844
|
| 22,873,000
|
|
SS&C Technologies, Inc. (a) (b)
|
|
5.50%
|
|
09/30/27
|
|
21,853,708
|
| 652,000
|
|
VMware, Inc. (b)
|
|
1.00%
|
|
08/15/24
|
|
615,871
|
|
|
|
|
|
31,092,171
|
|
|
|
Trading
Companies & Distributors – 0.7% |
|
|
|
|
|
|
| 1,035,000
|
|
SRS Distribution, Inc. (a) (b)
|
|
6.13%
|
|
07/01/29
|
|
858,217
|
Page
12
See
Notes to Financial Statements
First
Trust High Yield Opportunities 2027 Term Fund (FTHY)
Portfolio
of Investments (Continued)
May
31, 2023
Principal
Value |
|
Description
|
|
Stated
Coupon |
|
Stated
Maturity |
|
Value
|
| CORPORATE
BONDS AND NOTES (Continued) |
|
|
|
Trading
Companies & Distributors (Continued) |
|
|
|
|
|
|
| $3,884,000
|
|
SRS Distribution, Inc. (a) (b)
|
|
6.00%
|
|
12/01/29
|
|
$3,193,918
|
|
|
|
|
|
4,052,135
|
|
|
|
Total Corporate Bonds and Notes
|
|
496,384,712
|
|
|
|
(Cost
$559,060,320) |
|
|
|
|
|
|
Principal
Value |
|
Description
|
|
Rate
(c) |
|
Stated
Maturity (d) |
|
Value
|
| SENIOR
FLOATING-RATE LOAN INTERESTS – 23.2% |
|
|
|
Application
Software – 9.2% |
|
|
|
|
|
|
| 709,331
|
|
Applied Systems, Inc., 2026 Term Loan, 3 Mo. SOFR + 4.50%, 0.50% Floor (b)
|
|
9.40%
|
|
09/18/26
|
|
709,732
|
| 3,500,000
|
|
Epicor Software Corp., Second Lien Term Loan, 1 Mo. SOFR + 7.75%, 1.00% Floor (b)
|
|
13.00%
|
|
07/30/28
|
|
3,488,135
|
| 8,653,888
|
|
Gainwell Acquisition Corp. (fka Milano), Term Loan B, 3 Mo. LIBOR + 4.00%, 0.75% Floor (b)
|
|
9.00%
|
|
10/01/27
|
|
8,207,650
|
| 4,420,209
|
|
Greeneden U.S. Holdings II, LLC (Genesys Telecommunications Laboratories, Inc.), Initial Dollar Term Loan, 1
Mo. LIBOR + 4.00%, 0.75% Floor (b)
|
|
9.15%
|
|
12/01/27
|
|
4,318,345
|
| 2,231,724
|
|
Hyland Software, Inc., 2nd Lien Term Loan, 1 Mo. LIBOR + 6.25%, 0.75% Floor (b)
|
|
11.40%
|
|
07/10/25
|
|
2,134,889
|
| 2,139,980
|
|
Hyland Software, Inc., Term Loan B, 1 Mo. LIBOR + 3.50%, 0.75% Floor (b)
|
|
8.65%
|
|
07/01/24
|
|
2,103,868
|
| 6,430,562
|
|
Informatica Corporation, Initial Term Loan B, 1 Mo. LIBOR + 2.75%, 0.00% Floor (b)
|
|
7.94%
|
|
10/29/28
|
|
6,397,734
|
| 3,139,781
|
|
Internet Brands, Inc. (Web MD/MH Sub I. LLC), 2020 June New Term Loan, 1 Mo. LIBOR + 3.75%, 1.00% Floor (b)
|
|
8.90%
|
|
09/15/24
|
|
3,135,197
|
| 8,877,441
|
|
Internet Brands, Inc. (Web MD/MH Sub I. LLC), 2nd Lien Term Loan, 1 Mo. SOFR + 6.25%, 0.00% Floor (b)
|
|
11.40%
|
|
02/23/29
|
|
7,812,148
|
| 1,881,280
|
|
Internet Brands, Inc. (Web MD/MH Sub I. LLC), Initial Term Loan, 1 Mo. LIBOR + 3.75%, 0.00% Floor (b)
|
|
8.90%
|
|
09/13/24
|
|
1,881,129
|
| 111,543
|
|
ION Trading Technologies Limited, Term Loan B, 3 Mo. LIBOR + 4.75%, 0.00% Floor (b)
|
|
9.91%
|
|
04/01/28
|
|
107,163
|
| 5,828,206
|
|
LogMeIn, Inc. (GoTo Group, Inc.), Term Loan B, 1 Mo. LIBOR + 4.75%, 0.00% Floor (b)
|
|
9.90%
|
|
08/31/27
|
|
3,583,006
|
| 1,337,534
|
|
Open Text Corp. (GXS), Term Loan B, 1 Mo. LIBOR + 1.75%, 0.00% Floor (b)
|
|
6.90%
|
|
05/30/25
|
|
1,337,013
|
| 3,538,182
|
|
RealPage, Inc., Second Lien Term Loan, 1 Mo. LIBOR + 6.50%, 0.75% Floor (b)
|
|
11.65%
|
|
04/22/29
|
|
3,337,691
|
| 1,200,000
|
|
Ultimate Kronos Group (UKG, Inc.), 2021 Term Loan, 3 Mo. SOFR + 3.25%, 0.50% Floor (b)
|
|
8.27%
|
|
05/03/26
|
|
1,154,532
|
| 2,682,926
|
|
Ultimate Kronos Group (UKG, Inc.), Initial Term Loan B, 3 Mo. SOFR + 3.75%, 0.00% Floor (b)
|
|
8.90%
|
|
05/03/26
|
|
2,594,068
|
|
|
|
|
|
52,302,300
|
|
|
|
Cable
& Satellite – 0.3% |
|
|
|
|
|
|
| 1,550,345
|
|
Cablevision (aka CSC Holdings, LLC), March 2017 Term Loan B-1, 1 Mo. LIBOR + 2.25%, 0.00% Floor (b)
|
|
7.36%
|
|
07/17/25
|
|
1,427,481
|
|
|
|
Education
Services – 0.0% |
|
|
|
|
|
|
| 142,291
|
|
Ascensus Holdings, Inc. (Mercury), Second Lien Term Loan, 1 Mo. LIBOR + 6.50%, 0.50% Floor
|
|
11.63%
|
|
08/02/29
|
|
125,216
|
|
|
|
Electric
Utilities – 0.5% |
|
|
|
|
|
|
| 2,992,308
|
|
PG&E Corp., Term Loan B, 1 Mo. LIBOR + 3.00%, 0.50% Floor (b)
|
|
8.19%
|
|
06/23/25
|
|
2,974,219
|
See
Notes to Financial Statements
Page
13
First
Trust High Yield Opportunities 2027 Term Fund (FTHY)
Portfolio
of Investments (Continued)
May
31, 2023
Principal
Value |
|
Description
|
|
Rate
(c) |
|
Stated
Maturity (d) |
|
Value
|
| SENIOR
FLOATING-RATE LOAN INTERESTS (Continued) |
|
|
|
Electronic
Equipment & Instruments – 0.5% |
|
|
|
|
|
|
| $2,936,714
|
|
Verifone Systems, Inc., Term Loan B, 3 Mo. LIBOR + 4.00%, 0.00% Floor (b)
|
|
9.48%
|
|
08/20/25
|
|
$2,571,460
|
|
|
|
Health
Care Facilities – 0.4% |
|
|
|
|
|
|
| 2,436,864
|
|
Select Medical Corporation, Term Loan B, 1 Mo. SOFR + 2.50%, 0.00% Floor (b)
|
|
7.75%
|
|
03/06/25
|
|
2,429,627
|
|
|
|
Health
Care Technology – 6.6% |
|
|
|
|
|
|
| 2,558,506
|
|
Ciox Health (Healthport/CT Technologies Intermediate Holdings, Inc.), New Term Loan B, 1 Mo. LIBOR + 4.25%, 0.75%
Floor (b)
|
|
9.40%
|
|
12/16/25
|
|
2,402,936
|
| 9,368,205
|
|
Navicure, Inc. (Waystar Technologies, Inc.), Term Loan B, 1 Mo. LIBOR + 4.00%, 0.00% Floor (b)
|
|
9.15%
|
|
10/23/26
|
|
9,315,555
|
| 17,785,669
|
|
Verscend Technologies, Inc. (Cotiviti), New Term Loan B-1, 1 Mo. LIBOR + 4.00%, 0.00% Floor (b)
|
|
9.15%
|
|
08/27/25
|
|
17,772,686
|
| 7,992,347
|
|
Zelis Payments Buyer, Inc., New Term Loan B-1, 1 Mo. LIBOR + 3.50%, 0.00% Floor (b)
|
|
8.65%
|
|
09/30/26
|
|
7,936,960
|
|
|
|
|
|
37,428,137
|
|
|
|
Hotels,
Resorts & Cruise Lines – 0.2% |
|
|
|
|
|
|
| 877,231
|
|
Four Seasons Holdings, Inc., New Term Loan B, 1 Mo. SOFR + 3.25%, 0.50% Floor (b)
|
|
8.50%
|
|
11/30/29
|
|
879,240
|
|
|
|
Industrial
Machinery & Supplies & Components – 0.2% |
|
|
|
|
|
|
| 1,330,403
|
|
Filtration Group Corporation, 2023 Extended Term Loan, 1 Mo. SOFR + 4.25%, 0.50% Floor (b)
|
|
9.46%
|
|
10/21/28
|
|
1,320,425
|
|
|
|
Insurance
Brokers – 3.7% |
|
|
|
|
|
|
| 9,372,986
|
|
HUB International Ltd., New Term Loan B-3, 1 Mo. LIBOR + 3.25%, 0.75% Floor (b)
|
|
8.40%
|
|
04/25/25
|
|
9,324,293
|
| 24,033
|
|
HUB International Ltd., New Term Loan B-3, 2 Mo. LIBOR + 3.25%, 0.75% Floor
|
|
8.41%
|
|
04/25/25
|
|
23,909
|
| 2,366
|
|
HUB International Ltd., Term Loan B4, 1 Mo. SOFR + 4.00%, 0.75% Floor (b)
|
|
9.07%
|
|
11/10/29
|
|
2,342
|
| 941,423
|
|
HUB International Ltd., Term Loan B4, 3 Mo. SOFR + 4.00%, 0.75% Floor
|
|
9.07%
|
|
11/10/29
|
|
932,263
|
| 5,363,435
|
|
Ryan Specialty Group, LLC, Term Loan B, 1 Mo. SOFR + 3.00%, 0.75% Floor (b)
|
|
8.25%
|
|
09/01/27
|
|
5,359,252
|
| 5,177,464
|
|
USI, Inc. (fka Compass Investors Inc.), 2021 New Term Loans, 3 Mo. LIBOR + 3.25%, 0.00% Floor (b)
|
|
8.41%
|
|
12/02/26
|
|
5,165,970
|
|
|
|
|
|
20,808,029
|
|
|
|
Integrated
Telecommunication Services – 0.1% |
|
|
|
|
|
|
| 453,105
|
|
Numericable (Altice France SA or SFR), Term Loan B-13, 3 Mo. LIBOR + 4.00%, 0.00% Floor (b)
|
|
9.32%
|
|
08/14/26
|
|
411,476
|
| 61,000
|
|
Zayo Group Holdings, Inc., Initial Dollar Term Loan, 1 Mo. LIBOR + 3.00%, 0.00% Floor (b)
|
|
8.15%
|
|
03/09/27
|
|
47,134
|
|
|
|
|
|
458,610
|
|
|
|
Other
Specialty Retail – 0.2% |
|
|
|
|
|
|
| 905,500
|
|
Petsmart, Inc., Initial Term Loan B, 1 Mo. SOFR + 3.75%, 0.75% Floor (b)
|
|
9.00%
|
|
02/12/28
|
|
894,635
|
|
|
|
Specialized
Consumer Services – 0.1% |
|
|
|
|
|
|
| 798,269
|
|
Asurion, LLC, Second Lien Term Loan B-3, 1 Mo. LIBOR + 5.25%, 0.00% Floor (b)
|
|
10.40%
|
|
01/31/28
|
|
659,573
|
Page
14
See
Notes to Financial Statements
First
Trust High Yield Opportunities 2027 Term Fund (FTHY)
Portfolio
of Investments (Continued)
May
31, 2023
Principal
Value |
|
Description
|
|
Rate
(c) |
|
Stated
Maturity (d) |
|
Value
|
| SENIOR
FLOATING-RATE LOAN INTERESTS (Continued) |
|
|
|
Specialized
Finance – 0.3% |
|
|
|
|
|
|
| $1,655,270
|
|
WCG Purchaser Corp. (WIRB-Copernicus Group), Term Loan B, 1 Mo. SOFR + 4.00%, 1.00% Floor (b)
|
|
9.27%
|
|
01/08/27
|
|
$1,575,610
|
|
|
|
Systems
Software – 0.3% |
|
|
|
|
|
|
| 1,817,996
|
|
BMC Software Finance, Inc. (Boxer Parent), 2021 Replacement Dollar Term Loan, 1 Mo. LIBOR + 3.75%, 0.00% Floor
(b)
|
|
8.90%
|
|
10/02/25
|
|
1,795,271
|
|
|
|
Wireless
Telecommunication Services – 0.6% |
|
|
|
|
|
|
| 3,537,743
|
|
SBA Senior Finance II LLC, Term Loan B, 1 Mo. LIBOR + 1.75%, 0.00% Floor (b)
|
|
6.91%
|
|
04/11/25
|
|
3,535,160
|
|
|
|
Total Senior Floating-Rate Loan Interests
|
|
131,184,993
|
|
|
|
(Cost
$136,106,036) |
|
|
|
|
|
|
Principal
Value |
|
Description
|
|
Stated
Coupon |
|
Stated
Maturity |
|
Value
|
| FOREIGN
CORPORATE BONDS AND NOTES – 9.5% |
|
|
|
Application
Software – 1.7% |
|
|
|
|
|
|
| 1,721,000
|
|
ION Trading Technologies S.A.R.L. (a) (b)
|
|
5.75%
|
|
05/15/28
|
|
1,432,268
|
| 189,000
|
|
Open Text Corp. (a) (b)
|
|
6.90%
|
|
12/01/27
|
|
193,412
|
| 6,881,000
|
|
Open Text Corp. (a) (b)
|
|
3.88%
|
|
02/15/28
|
|
6,032,629
|
| 2,108,000
|
|
Open Text Corp. (a) (b)
|
|
3.88%
|
|
12/01/29
|
|
1,758,277
|
|
|
|
|
|
9,416,586
|
|
|
|
Building
Products – 1.7% |
|
|
|
|
|
|
| 8,119,000
|
|
Cemex S.A.B. de C.V. (a)
|
|
7.38%
|
|
06/05/27
|
|
8,422,732
|
| 973,000
|
|
Cemex S.A.B. de C.V. (a)
|
|
5.45%
|
|
11/19/29
|
|
937,638
|
|
|
|
|
|
9,360,370
|
|
|
|
Data
Processing & Outsourced Services – 0.8% |
|
|
|
|
|
|
| 5,748,000
|
|
Paysafe Finance PLC/Paysafe Holdings US Corp. (a) (b)
|
|
4.00%
|
|
06/15/29
|
|
4,666,600
|
|
|
|
Environmental
& Facilities Services – 0.9% |
|
|
|
|
|
|
| 473,000
|
|
GFL Environmental, Inc. (a) (b)
|
|
3.75%
|
|
08/01/25
|
|
448,483
|
| 3,000,000
|
|
GFL Environmental, Inc. (a) (b)
|
|
5.13%
|
|
12/15/26
|
|
2,894,194
|
| 1,300,000
|
|
GFL Environmental, Inc. (a) (b)
|
|
4.00%
|
|
08/01/28
|
|
1,162,011
|
| 716,000
|
|
GFL Environmental, Inc. (a) (b)
|
|
4.75%
|
|
06/15/29
|
|
651,020
|
|
|
|
|
|
5,155,708
|
|
|
|
Integrated
Telecommunication Services – 1.4% |
|
|
|
|
|
|
| 2,511,000
|
|
Altice France S.A. (a) (b)
|
|
5.50%
|
|
01/15/28
|
|
1,906,791
|
| 1,000,000
|
|
Altice France S.A. (a) (b)
|
|
5.13%
|
|
01/15/29
|
|
714,184
|
| 4,590,000
|
|
Altice France S.A. (a) (b)
|
|
5.13%
|
|
07/15/29
|
|
3,272,550
|
| 3,069,000
|
|
Altice France S.A. (a) (b)
|
|
5.50%
|
|
10/15/29
|
|
2,229,936
|
|
|
|
|
|
8,123,461
|
|
|
|
Metal,
Glass & Plastic Containers – 0.1% |
|
|
|
|
|
|
| 597,000
|
|
Trivium Packaging Finance B.V. (a) (b)
|
|
5.50%
|
|
08/15/26
|
|
568,167
|
|
|
|
Restaurants –
1.9% |
|
|
|
|
|
|
| 12,722,000
|
|
1011778 BC ULC/New Red Finance, Inc. (a) (b)
|
|
4.00%
|
|
10/15/30
|
|
10,934,350
|
|
|
|
Trading
Companies & Distributors – 1.0% |
|
|
|
|
|
|
| 2,721,000
|
|
VistaJet Malta Finance PLC/XO Management Holding, Inc. (a) (b)
|
|
7.88%
|
|
05/01/27
|
|
2,458,505
|
See
Notes to Financial Statements
Page
15
First
Trust High Yield Opportunities 2027 Term Fund (FTHY)
Portfolio
of Investments (Continued)
May
31, 2023
Principal
Value |
|
Description
|
|
Stated
Coupon |
|
Stated
Maturity |
|
Value
|
| FOREIGN
CORPORATE BONDS AND NOTES (Continued) |
|
|
|
Trading
Companies & Distributors (Continued) |
|
|
|
|
|
|
| $3,858,000
|
|
VistaJet Malta Finance PLC/XO Management Holding, Inc. (a) (b)
|
|
6.38%
|
|
02/01/30
|
|
$3,071,836
|
|
|
|
|
|
5,530,341
|
|
|
|
Total Foreign Corporate Bonds and Notes
|
|
53,755,583
|
|
|
|
(Cost
$58,801,752) |
|
|
|
|
|
|
| Shares
|
|
Description
|
|
Value
|
| COMMON
STOCKS – 0.1% |
| |
|
Pharmaceuticals –
0.1% |
|
|
| 220,989
|
|
Akorn, Inc. (e) (f) (g)
|
|
207,177
|
| |
|
(Cost
$2,534,056) |
|
|
| WARRANTS –
0.0% |
| |
|
Movies
& Entertainment – 0.0% |
|
|
| 367,144
|
|
Cineworld Group PLC (Crown), expiring 11/23/25 (e) (g) (h)
|
|
12,560
|
| |
|
(Cost
$0) |
|
|
| MONEY
MARKET FUNDS – 1.1% |
| 6,442,792
|
|
Morgan Stanley Institutional Liquidity Funds - Treasury Portfolio - Institutional Class - 4.96% (b) (i)
|
|
6,442,792
|
| |
|
(Cost
$6,442,792) |
|
|
| |
|
Total Investments – 121.5%
|
|
687,987,817
|
|
|
|
(Cost
$762,944,956) |
|
|
|
|
|
Outstanding Loan – (21.7)%
|
|
(123,000,000)
|
| |
|
Net Other Assets and Liabilities – 0.2%
|
|
1,411,152
|
|
|
|
Net Assets – 100.0%
|
|
$566,398,969
|
| (a)
|
This
security, sold within the terms of a private placement memorandum, is exempt from registration upon resale under Rule 144A of the Securities
Act of 1933, as amended (the “1933 Act”), and may be resold in transactions exempt from registration, normally to qualified
institutional buyers. Pursuant to procedures adopted by the Fund’s Board of Trustees, this security has been determined to be liquid
by First Trust Advisors L.P. (the “Advisor”). Although market instability can result in periods of increased overall market
illiquidity, liquidity for each security is determined based on security specific factors and assumptions, which require subjective judgment.
At May 31, 2023, securities noted as such amounted to $474,800,968 or 83.8% of net assets. |
| (b)
|
All
or a portion of this security serves as collateral on the outstanding loan. |
| (c)
|
Senior
Floating-Rate Loan Interests (“Senior Loans”) in which the Fund invests pay interest at rates which are periodically predetermined
by reference to a base lending rate plus a premium. These base lending rates are generally (i) the lending rate offered by one or more
major European banks, such as the LIBOR, (ii) the SOFR obtained from the U.S. Department of the Treasury’s Office of Financial Research,
(iii) the prime rate offered by one or more United States banks or (iv) the certificate of deposit rate. Certain Senior Loans are subject
to a LIBOR or SOFR floor that establishes a minimum LIBOR or SOFR rate. When a range of rates is disclosed, the Fund holds more than one
contract within the same tranche with identical LIBOR or SOFR period, spread and floor, but different LIBOR or SOFR reset dates. |
| (d)
|
Senior
Loans generally are subject to mandatory and/or optional prepayment. As a result, the actual remaining maturity of Senior Loans may be
substantially less than the stated maturities shown. |
| (e)
|
This
issuer has filed for protection in bankruptcy court. |
| (f)
|
Security
received in a transaction exempt from registration under the 1933 Act. The security may be resold pursuant to an exemption from registration
under the 1933 Act, typically to qualified institutional buyers (see Note 2E - Restricted Securities in the Notes to Financial Statements).
|
| (g)
|
Non-income
producing security. |
| (h)
|
Pursuant
to procedures adopted by the Fund’s Board of Trustees, this security has been determined to be illiquid by the Advisor. |
| (i)
|
Rate
shown reflects yield as of May 31, 2023. |
| LIBOR
|
London
Interbank Offered Rate |
| SOFR
|
Secured
Overnight Financing Rate |
Page
16
See
Notes to Financial Statements
First
Trust High Yield Opportunities 2027 Term Fund (FTHY)
Portfolio
of Investments (Continued)
May
31, 2023
Valuation
Inputs
A
summary of the inputs used to value the Fund’s investments as of May 31, 2023 is as follows (see Note 2A - Portfolio Valuation in
the Notes to Financial Statements):
|
|
Total
Value at
5/31/2023 |
Level
1
Quoted
Prices |
Level
2
Significant
Observable
Inputs |
Level
3
Significant
Unobservable
Inputs |
|
Corporate Bonds and Notes*
|
$ 496,384,712
|
$ —
|
$ 496,384,712
|
$ —
|
|
Senior Floating-Rate Loan Interests*
|
131,184,993
|
—
|
131,184,993
|
—
|
|
Foreign Corporate Bonds and Notes*
|
53,755,583
|
—
|
53,755,583
|
—
|
|
Common Stocks*
|
207,177
|
—
|
207,177
|
—
|
|
Warrants*
|
12,560
|
—
|
12,560
|
—
|
|
Money Market Funds
|
6,442,792
|
6,442,792
|
—
|
—
|
|
Total Investments
|
$ 687,987,817
|
$ 6,442,792
|
$ 681,545,025
|
$—
|
| *
|
See
Portfolio of Investments for industry breakout. |
See
Notes to Financial Statements
Page
17
First
Trust High Yield Opportunities 2027 Term Fund (FTHY)
Statement
of Assets and Liabilities
May
31, 2023
| ASSETS:
|
|
|
Investments, at value
(Cost $762,944,956)
|
$ 687,987,817
|
|
Cash
|
66,399
|
| Receivables:
|
|
|
Interest
|
10,344,190
|
|
Investment securities sold
|
1,901,331
|
|
Prepaid expenses
|
31,530
|
|
Total Assets
|
700,331,267
|
| LIABILITIES:
|
|
|
Outstanding loan
|
123,000,000
|
| Payables:
|
|
|
Investment securities purchased
|
9,229,951
|
|
Investment advisory fees
|
793,276
|
|
Interest and fees on loan
|
740,851
|
|
Audit and tax fees
|
53,961
|
|
Administrative fees
|
39,700
|
|
Shareholder reporting fees
|
28,971
|
|
Legal fees
|
23,417
|
|
Trustees’ fees and expenses
|
7,747
|
|
Custodian fees
|
7,213
|
|
Transfer agent fees
|
1,517
|
|
Financial reporting fees
|
771
|
|
Other liabilities
|
4,923
|
|
Total Liabilities
|
133,932,298
|
|
NET ASSETS
|
$566,398,969
|
| NET
ASSETS consist of: |
|
|
Paid-in capital
|
$ 713,913,444
|
|
Par value
|
367,730
|
|
Accumulated distributable earnings (loss)
|
(147,882,205)
|
|
NET ASSETS
|
$566,398,969
|
|
NET ASSET VALUE, per Common Share (par value $0.01 per Common Share)
|
$15.40
|
|
Number of Common Shares outstanding (unlimited number of Common Shares has been authorized)
|
36,772,989
|
Page
18
See
Notes to Financial Statements
First
Trust High Yield Opportunities 2027 Term Fund (FTHY)
Statement
of Operations
For
the Year Ended May 31, 2023
| INVESTMENT
INCOME: |
|
|
Interest (net of foreign withholding tax of $3,919)
|
$ 51,685,588
|
|
Other
|
49,441
|
|
Total investment income
|
51,735,029
|
| EXPENSES:
|
|
|
Investment advisory fees
|
10,048,986
|
|
Interest and fees on loan
|
6,989,041
|
|
Administrative fees
|
410,882
|
|
Shareholder reporting fees
|
119,034
|
|
Legal fees
|
118,749
|
|
Audit and tax fees
|
61,192
|
|
Custodian fees
|
46,060
|
|
Listing expense
|
37,008
|
|
Trustees’ fees and expenses
|
18,614
|
|
Transfer agent fees
|
18,199
|
|
Financial reporting fees
|
9,250
|
|
Licensing fees
|
1,782
|
|
Other
|
46,450
|
|
Total expenses
|
17,925,247
|
|
NET INVESTMENT INCOME (LOSS)
|
33,809,782
|
| NET
REALIZED AND UNREALIZED GAIN (LOSS): |
|
| Net
realized gain (loss) on: |
|
|
Investments
|
(66,702,848)
|
|
Swap contracts
|
278,200
|
|
Net realized gain (loss)
|
(66,424,648)
|
|
Net change in unrealized appreciation (depreciation) on investments
|
13,008,655
|
|
NET REALIZED AND UNREALIZED GAIN (LOSS)
|
(53,415,993)
|
|
NET INCREASE (DECREASE) IN NET ASSETS RESULTING FROM OPERATIONS
|
$(19,606,211)
|
See
Notes to Financial Statements
Page
19
First
Trust High Yield Opportunities 2027 Term Fund (FTHY)
Statements
of Changes in Net Assets
|
|
Year
Ended
5/31/2023 |
|
Year
Ended
5/31/2022 |
| OPERATIONS:
|
|
|
|
|
Net investment income (loss)
|
$ 33,809,782
|
|
$ 42,744,195
|
|
Net realized gain (loss)
|
(66,424,648)
|
|
1,735,625
|
|
Net change in unrealized appreciation (depreciation)
|
13,008,655
|
|
(117,321,123)
|
|
Net increase (decrease) in net assets resulting from operations
|
(19,606,211)
|
|
(72,841,303)
|
| DISTRIBUTIONS
TO SHAREHOLDERS FROM: |
|
|
|
|
Investment operations
|
(35,642,807)
|
|
(61,482,853)
|
|
Return of capital
|
(21,134,688)
|
|
—
|
|
Total distributions to shareholders
|
(56,777,495)
|
|
(61,482,853)
|
| CAPITAL
TRANSACTIONS: |
|
|
|
|
Proceeds from Common Shares reinvested
|
—
|
|
965,209
|
|
Net increase (decrease) in net assets resulting from capital transactions
|
—
|
|
965,209
|
|
Total increase (decrease) in net assets
|
(76,383,706)
|
|
(133,358,947)
|
| NET
ASSETS: |
|
|
|
|
Beginning of period
|
642,782,675
|
|
776,141,622
|
|
End of period
|
$ 566,398,969
|
|
$ 642,782,675
|
| CAPITAL
TRANSACTIONS were as follows: |
|
|
|
|
Common Shares at beginning of period
|
36,772,989
|
|
36,726,034
|
|
Common Shares issued as reinvestment under the Dividend Reinvestment Plan
|
—
|
|
46,955
|
|
Common Shares at end of period
|
36,772,989
|
|
36,772,989
|
Page
20
See
Notes to Financial Statements
First
Trust High Yield Opportunities 2027 Term Fund (FTHY)
Statement
of Cash Flows
For
the Year Ended May 31, 2023
| Cash
flows from operating activities: |
|
|
|
Net increase (decrease) in net assets resulting from operations
|
$(19,606,211)
|
|
| Adjustments
to reconcile net increase (decrease) in net assets resulting from operations to net cash provided by operating activities: |
|
|
|
Purchases of investments
|
(556,113,947)
|
|
|
Sales, maturities and paydown of investments
|
732,583,450
|
|
|
Net amortization/accretion of premiums/discounts on investments
|
(2,026,556)
|
|
|
Net realized gain/loss on investments
|
66,702,848
|
|
|
Net change in unrealized appreciation/depreciation on investments
|
(13,008,655)
|
|
| Changes
in assets and liabilities: |
|
|
|
Decrease in interest receivable
|
3,106,526
|
|
|
Decrease in interest reclaims receivable
|
961
|
|
|
Decrease in prepaid expenses
|
1,615
|
|
|
Increase in interest and fees payable on loan
|
430,737
|
|
|
Decrease in investment advisory fees payable
|
(267,388)
|
|
|
Decrease in audit and tax fees payable
|
(3,164)
|
|
|
Increase in legal fees payable
|
17,618
|
|
|
Increase in shareholder reporting fees payable
|
4,924
|
|
|
Decrease in administrative fees payable
|
(11,272)
|
|
|
Decrease in custodian fees payable
|
(7,660)
|
|
|
Increase in transfer agent fees payable
|
1
|
|
|
Increase in trustees’ fees and expenses payable
|
4,605
|
|
|
Increase in other liabilities payable
|
1,567
|
|
|
Cash provided by operating activities
|
|
$211,809,999
|
| Cash
flows from financing activities: |
|
|
|
Distributions to Common Shareholders from investment operations
|
(35,642,807)
|
|
|
Distributions to Common Shareholders from return of capital
|
(21,134,688)
|
|
|
Repayment of borrowing
|
(231,000,000)
|
|
|
Proceeds from borrowing
|
76,000,000
|
|
|
Cash used in financing activities
|
|
(211,777,495)
|
|
Increase in cash
|
|
32,504
|
|
Cash at beginning of period
|
|
33,895
|
|
Cash at end of period
|
|
$66,399
|
| Supplemental
disclosure of cash flow information: |
|
|
|
Cash paid during the period for interest and fees
|
|
$6,558,304
|
See
Notes to Financial Statements
Page
21
First
Trust High Yield Opportunities 2027 Term Fund (FTHY)
Financial
Highlights
For
a Common Share outstanding throughout each period
|
|
Year
Ended |
|
Period
Ended
5/31/2021 (a) |
| 5/31/2023
|
|
5/31/2022
|
|
|
Net asset value, beginning of period
|
$ 17.48
|
|
$ 21.13
|
|
$ 20.00
|
| Income
from investment operations: |
|
|
|
|
|
|
Net investment income (loss)
|
0.92
|
|
1.16
|
|
1.08
|
|
Net realized and unrealized gain (loss)
|
(1.46)
|
|
(3.14)
|
|
1.12
|
|
Total from investment operations
|
(0.54)
|
|
(1.98)
|
|
2.20
|
| Distributions
paid to shareholders from: |
|
|
|
|
|
|
Net investment income
|
(0.97)
|
|
(1.29)
|
|
(1.07)
|
|
Net realized gain
|
—
|
|
(0.38)
|
|
—
|
|
Return of capital
|
(0.57)
|
|
—
|
|
—
|
|
Total distributions paid to Common Shareholders
|
(1.54)
|
|
(1.67)
|
|
(1.07)
|
|
Net asset value, end of period
|
$15.40
|
|
$17.48
|
|
$21.13
|
|
Market value, end of period
|
$13.52
|
|
$16.07
|
|
$19.86
|
|
Total return based on net asset value (b)
|
(1.86)%
|
|
(9.73)%
|
|
11.49%
|
|
Total return based on market value (b)
|
(6.27)%
|
|
(11.70)%
|
|
4.79%
|
| Ratios
to average net assets/supplemental data: |
|
|
|
|
|
|
Net assets, end of period (in 000’s)
|
$ 566,399
|
|
$ 642,783
|
|
$ 776,142
|
|
Ratio of total expenses to average net assets
|
3.05%
|
|
2.41%
|
|
2.28% (c)
|
|
Ratio of total expenses to average net assets excluding interest expense
|
1.86%
|
|
2.02%
|
|
1.93% (c)
|
|
Ratio of net investment income (loss) to average net assets
|
5.75%
|
|
5.81%
|
|
5.62% (c)
|
|
Portfolio turnover rate
|
35%
|
|
39%
|
|
54%
|
| Indebtedness:
|
|
|
|
|
|
|
Total loan outstanding (in 000’s)
|
$ 123,000
|
|
$ 278,000
|
|
$ 309,000
|
|
Asset coverage per $1,000 of indebtedness (d)
|
$ 5,605
|
|
$ 3,312
|
|
$ 3,512
|
| (a)
|
The
Fund was seeded on May 21, 2020 and commenced operations on June 25, 2020. |
| (b)
|
Total
return is based on the combination of reinvested dividend, capital gain and return of capital distributions, if any, at prices obtained
by the Dividend Reinvestment Plan, and changes in net asset value per share for net asset value returns and changes in Common Share Price
for market value returns. Total returns do not reflect sales load and are not annualized for periods of less than one year. Past performance
is not indicative of future results. |
| (c)
|
Annualized.
|
| (d)
|
Calculated
by subtracting the Fund’s total liabilities (not including the loan outstanding) from the Fund’s total assets, and dividing
by the outstanding loan balance in 000’s. |
Page
22
See
Notes to Financial Statements
Notes
to Financial Statements
First
Trust High Yield Opportunities 2027 Term Fund (FTHY)
May
31, 2023
1. Organization
First
Trust High Yield Opportunities 2027 Term Fund (the “Fund”) is a diversified, closed-end management investment company organized
as a Massachusetts business trust on June 25, 2020, and is registered with the Securities and Exchange Commission under the Investment
Company Act of 1940, as amended (the “1940 Act”). The Fund trades under the ticker symbol “FTHY” on the New York
Stock Exchange (“NYSE”).
The
investment objective of the Fund is to provide current income. Under normal market conditions, the Fund will seek to achieve its investment
objective by investing at least 80% of its Managed Assets in high yield debt securities of any maturity that are rated below investment
grade at the time of purchase or unrated securities determined by the Advisor (as defined below) to be of comparable quality. “Managed
Assets” means the total asset value of the Fund minus the sum of its liabilities, other than the principal amount of borrowings.
High yield debt securities include U.S. and non-U.S. corporate debt obligations and senior secured floating rate loans (“Senior
Loans”)(1). Securities rated below investment grade are
commonly referred to as “junk” or “high yield” securities and are considered speculative with respect to the issuer’s
capacity to pay interest and repay principal. There can be no assurance that the Fund will achieve its investment objective or that the
Fund’s investment strategies will be successful.
2. Significant
Accounting Policies
The
Fund is considered an investment company and follows accounting and reporting guidance under Financial Accounting Standards Board Accounting
Standards Codification Topic 946, “Financial Services-Investment Companies.” The following is a summary of significant accounting
policies consistently followed by the Fund in the preparation of the financial statements. The preparation of the financial statements
in accordance with accounting principles generally accepted in the United States of America (“U.S. GAAP”) requires management
to make estimates and assumptions that affect the reported amounts and disclosures in the financial statements. Actual results could differ
from those estimates.
A. Portfolio
Valuation
The
net asset value (“NAV”) of the Common Shares of the Fund is determined daily as of the close of regular trading on the NYSE,
normally 4:00 p.m. Eastern time, on each day the NYSE is open for trading. If the NYSE closes early on a valuation day, the NAV is determined
as of that time. Domestic debt securities and foreign securities are priced using data reflecting the earlier closing of the principal
markets for those securities. The Fund’s NAV per Common Share is calculated by dividing the value of all assets of the Fund (including
accrued interest and dividends), less all liabilities (including accrued expenses, dividends declared but unpaid and any borrowings of
the Fund), by the total number of Common Shares outstanding.
The
Fund’s investments are valued daily at market value or, in the absence of market value with respect to any portfolio securities,
at fair value. Market value prices represent readily available market quotations such as last sale or official closing prices from a national
or foreign exchange (i.e., a regulated market) and are primarily obtained from third-party pricing services. Fair value prices represent
any prices not considered market value prices and are either obtained from a third-party pricing service or are determined by the Pricing
Committee of the Fund’s investment advisor, First Trust Advisors L.P. (“First Trust” or the “Advisor”),
in accordance with valuation procedures approved by the Fund’s Board of Trustees, and in accordance with provisions of the 1940
Act and rules thereunder. Investments valued by the Advisor’s Pricing Committee, if any, are footnoted as such in the footnotes
to the Portfolio of Investments. The Fund’s investments are valued as follows:
Senior
Loans are not listed on any securities exchange or board of trade. Senior Loans are typically bought and sold by institutional investors
in individually negotiated private transactions that function in many respects like an over-the-counter secondary market, although typically
no formal market-makers exist. This market, while having grown substantially since its inception, generally has fewer trades and less
liquidity than the secondary market for other types of securities. Some Senior Loans have few or no trades, or trade infrequently, and
information regarding a specific Senior Loan may not be widely available or may be incomplete. Accordingly, determinations of the market
value of Senior Loans may be based on infrequent and dated information. Because there is less reliable, objective data available, elements
of judgment may play a greater role in valuation of Senior Loans than for other types of securities. Typically, Senior Loans are fair
valued using information provided by a third-party pricing service. The third-party pricing service primarily uses over-the-counter pricing
from dealer runs and broker quotes from indicative sheets to value the Senior Loans. If the third-party pricing service cannot or does
not provide a valuation for a particular Senior Loan or such valuation is deemed unreliable, the Advisor’s Pricing Committee may
value such Senior Loan at a fair value according to procedures approved by the Fund’s Board of Trustees, and in accordance with
the provisions of the 1940 Act and rules thereunder. Fair valuation of a Senior Loan is based on the consideration of all available information,
including, but not limited to the following:
| (1)
|
The
terms “security” and “securities” used throughout the Notes to Financial Statements include Senior Loans. |
Notes
to Financial Statements (Continued)
First
Trust High Yield Opportunities 2027 Term Fund (FTHY)
May
31, 2023
| 1)
|
the
most recent price provided by a pricing service; |
| 2)
|
available
market prices for the fixed-income security; |
| 3)
|
the
fundamental business data relating to the borrower/issuer; |
| 4)
|
an
evaluation of the forces which influence the market in which these securities are purchased and sold; |
| 5)
|
the
type, size and cost of the security; |
| 6)
|
the
financial statements of the borrower/issuer, or the financial condition of the country of issue; |
| 7)
|
the
credit quality and cash flow of the borrower/issuer, or country of issue, based on the Pricing Committee’s, sub-advisor’s
or portfolio manager’s analysis, as applicable, or external analysis; |
| 8)
|
the
information as to any transactions in or offers for the security; |
| 9)
|
the
price and extent of public trading in similar securities (or equity securities) of the borrower/issuer, or comparable companies; |
| 10)
|
the
coupon payments; |
| 11)
|
the
quality, value and salability of collateral, if any, securing the security; |
| 12)
|
the
business prospects of the borrower/issuer, including any ability to obtain money or resources from a parent or affiliate and an assessment
of the borrower’s/issuer’s management; |
| 13)
|
the
prospects for the borrower’s/issuer’s industry, and multiples (of earnings and/or cash flows) being paid for similar businesses
in that industry; |
14) the
borrower’s/issuer’s competitive position within the industry;
15) the
borrower’s/issuer’s ability to access additional liquidity through public and/or private markets; and
16) other
relevant factors.
Corporate
bonds, corporate notes, and other debt securities are fair valued on the basis of valuations provided by a third-party pricing service
approved by the Advisor’s Pricing Committee, which may use the following valuation inputs when available:
| 1)
|
benchmark
yields; |
| 2)
|
reported
trades; |
| 3)
|
broker/dealer
quotes; |
| 4)
|
issuer
spreads; |
| 5)
|
benchmark
securities; |
| 6)
|
bids
and offers; and |
| 7)
|
reference
data including market research publications. |
Common
stocks and other equity securities listed on any national or foreign exchange (excluding The Nasdaq Stock Market LLC (“Nasdaq”)
and the London Stock Exchange Alternative Investment Market (“AIM”)) are valued at the last sale price on the exchange on
which they are principally traded or, for Nasdaq and AIM securities, the official closing price. Securities traded on more than one securities
exchange are valued at the last sale price or official closing price, as applicable, at the close of the securities exchange representing
the primary exchange for such securities.
Shares
of open-end funds are valued based on NAV per share.
Equity
securities traded in an over-the-counter market are valued at the close price or the last trade price.
Credit
default swaps are fair valued using a third-party pricing service or, if the third-party pricing service does not provide a value, by
quotes provided by the selling dealer or financial institution.
Certain
securities may not be able to be priced by pre-established pricing methods. Such securities may be valued by the Advisor’s Pricing
Committee at fair value. These securities generally include, but are not limited to, restricted securities (securities which may not be
publicly sold without registration under the Securities Act of 1933, as amended (the “1933 Act”)) for which a third-party
pricing service is unable to provide a market price; securities whose trading has been formally suspended; a security whose market or
fair value price is not available from a pre-established pricing source; a security with respect to which an event has occurred that is
likely to materially affect the value of the security after the market has closed but before the calculation of the Fund’s NAV or
make it difficult or impossible to obtain a reliable market quotation; and a security whose price, as provided by the third-party pricing
service, does not reflect the security’s fair value. As a general principle, the current fair value of a security would appear to
be the amount which the owner might reasonably expect to receive for the security upon its current sale. When fair value prices are used,
generally they will differ from market quotations or official closing prices on the applicable exchanges. A variety of factors may be
considered in determining the fair value of such securities, including, but not limited to, the following:
Notes
to Financial Statements (Continued)
First
Trust High Yield Opportunities 2027 Term Fund (FTHY)
May
31, 2023
| 1)
|
the
last sale price on the exchange on which they are principally traded or, for Nasdaq and AIM securities, the official closing price; |
| 2)
|
the
type of security; |
| 3)
|
the
size of the holding; |
| 4)
|
the
initial cost of the security; |
| 5)
|
transactions
in comparable securities; |
| 6)
|
price
quotes from dealers and/or third-party pricing services; |
| 7)
|
relationships
among various securities; |
| 8)
|
information
obtained by contacting the issuer, analysts, or the appropriate stock exchange; |
| 9)
|
an
analysis of the issuer’s financial statements; |
| 10)
|
the
existence of merger proposals or tender offers that might affect the value of the security; and |
| 11)
|
other
relevant factors. |
The
Fund is subject to fair value accounting standards that define fair value, establish the framework for measuring fair value and provide
a three-level hierarchy for fair valuation based upon the inputs to the valuation as of the measurement date. The three levels of the
fair value hierarchy are as follows:
| •
|
Level
1 – Level 1 inputs are quoted prices in active markets for identical investments. An active market is a market in which transactions
for the investment occur with sufficient frequency and volume to provide pricing information on an ongoing basis. |
| •
|
Level
2 – Level 2 inputs are observable inputs, either directly or indirectly, and include the following: |
| o
|
Quoted
prices for similar investments in active markets. |
| o
|
Quoted
prices for identical or similar investments in markets that are non-active. A non-active market is a market where there are few transactions
for the investment, the prices are not current, or price quotations vary substantially either over time or among market makers, or in
which little information is released publicly. |
| o
|
Inputs
other than quoted prices that are observable for the investment (for example, interest rates and yield curves observable at commonly quoted
intervals, volatilities, prepayment speeds, loss severities, credit risks, and default rates). |
| o
|
Inputs
that are derived principally from or corroborated by observable market data by correlation or other means. |
| •
|
Level
3 – Level 3 inputs are unobservable inputs. Unobservable inputs may reflect the reporting entity’s own assumptions about the
assumptions that market participants would use in pricing the investment. |
The
inputs or methodologies used for valuing investments are not necessarily an indication of the risk associated with investing in those
investments. A summary of the inputs used to value the Fund’s investments as of May 31, 2023, is included with the Fund’s
Portfolio of Investments.
B. Swap
Agreements
The
Fund may enter into credit default swap contracts (“CDS”) for investment purposes or to manage credit risk. A CDS is an agreement
between two parties (“Counterparties”) to exchange the credit risk of an issuer. Swap agreements may be privately negotiated
in the over-the-counter market as a bilateral contract or centrally cleared. The Fund may also use credit default swap indices (“CDX”)
to take on additional credit risk and obtain exposure to the high yield debt market.
A
buyer of a CDS is said to buy protection by paying a fixed payment over the life of the agreement and in some situations an
upfront
payment to the seller of the CDS. If a defined credit event occurs (such as payment default or bankruptcy), the Fund as a protection buyer
would cease paying its fixed payment, the Fund would deliver eligible bonds issued by the reference entity to the seller, and the seller
would pay the full notional value, or the “par value,” of the referenced obligation to the Fund. A seller of a CDS is said
to sell protection and thus would receive a fixed payment over the life of the agreement and an upfront payment, if applicable. If a credit
event occurs, the Fund as a protection seller would cease to receive the fixed payment stream, the Fund would pay the buyer “par
value” or the full notional value of the referenced obligation, and the Fund would receive the eligible bonds issued by the reference
entity. In turn, these bonds may be sold in order to realize a recovery value. Alternatively, the seller of the CDS and its Counterparty
may agree to net the notional amount and the market value of the bonds and make a cash payment equal to the difference to the buyer of
protection. If no credit event occurs, the Fund receives the fixed payment over the life of the agreement. As the seller, the Fund would
effectively add leverage to its portfolio because, in addition to its total net assets, the Fund would be
subject to investment exposure
on the notional amount of the CDS. In connection with these agreements, cash and securities may be identified as collateral in accordance
with the terms of the respective swap agreements to provide assets of value and recourse in the
Notes
to Financial Statements (Continued)
First
Trust High Yield Opportunities 2027 Term Fund (FTHY)
May
31, 2023
event
of default under the swap agreement or bankruptcy/insolvency of a party to the swap agreement. In the event of a default by the Counterparty,
the Fund will seek withdrawal of this collateral and may incur certain costs exercising its right with respect to the collateral. If a
Counterparty becomes bankrupt or otherwise fails to perform its obligations due to financial difficulties, the Fund may experience significant
delays in obtaining any recovery in a bankruptcy or other reorganization proceeding. The Fund may obtain only limited recovery or may
obtain no recovery in such circumstances.
Upon
entering into a centrally cleared swap, the Fund is required to deposit initial margin with the broker in the form of cash or securities
in an amount that varies depending on the size and risk profile of the particular swap. Cash deposited is segregated and included in “Cash
segregated as collateral for open swap contracts” on the Statement of Assets and Liabilities. The daily change in valuation of centrally
cleared swaps is included in “variation margin on swaps payable” in the Statement of Assets and Liabilities. Payments received
from (paid to) the Counterparty, including at termination, are recorded as “net realized gain (loss) on swap contracts” on
the Statement of Operations.
Credit
default swap contracts are marked to market daily based upon quotations from brokers, market makers or an independent
pricing service
and the change in value, if any, is recorded as unrealized appreciation (depreciation). For a credit default swap
contract sold by
the Fund, payment of the agreed upon amount made by the Fund in the event of default of the referenced debt
obligation is recorded
as the cost of the reference debt obligation purchased/received.
C. Security
Transactions and Investment Income
Security
transactions are recorded as of the trade date. Realized gains and losses from securities transactions are recorded on the identified
cost basis. Interest income is recorded on the accrual basis. Market premiums and discounts are amortized to the earliest call date of
each respective borrowing.
The
United Kingdom’s Financial Conduct Authority (the “FCA”), which regulates the London Interbank Offered Rates (“LIBOR”),
announced on March 5, 2021 that it intended to phase-out all LIBOR reference rates, beginning December 31, 2021. Since that announcement,
the FCA has ceased publication of all non-USD LIBOR reference rates and the 1-week and 2-month USD LIBOR reference rates as of December
31, 2021. The remaining USD LIBOR settings will cease to be published or no longer be representative immediately after June 30, 2023.
The International Swaps and Derivatives Association, Inc. (“ISDA”) confirmed that the FCA’s March 5, 2021 announcement
of its intention to cease providing LIBOR reference rates, constituted an index cessation event under the Interbank Offered Rates (“IBOR”)
Fallbacks Supplement and the ISDA 2020 IBOR Fallbacks Protocol for all 35 LIBOR settings and confirmed that the spread adjustment to be
used in ISDA fallbacks was fixed as of the date of the announcement.
In
the United States, the Alternative Reference Rates Committee (the “ARRC”), a group of market participants convened by the
Board of Governors of the Federal Reserve System and the Federal Reserve Bank of New York in cooperation with other federal and state
government agencies, has since 2014 undertaken efforts to identify U.S. dollar reference interest rates as alternatives to LIBOR and to
facilitate the mitigation of LIBOR-related risks. In June 2017, the ARRC identified the Secured Overnight Financing Rate (“SOFR”),
a broad measure of the cost of cash overnight borrowing collateralized by U.S. Treasury securities, as the preferred alternative for U.S.
dollar LIBOR. The Federal Reserve Bank of New York began daily publishing of SOFR in April 2018. There is no assurance that any alternative
reference rate, including SOFR, will be similar to or produce the same value or economic equivalence as LIBOR or that instruments using
an alternative rate will have the same volume or liquidity.
At
this time, it is not possible to predict the full impact of the elimination of LIBOR and the establishment of an alternative reference
rate on the Fund or its investments.
Securities
purchased or sold on a when-issued, delayed-delivery or forward purchase commitment basis may have extended settlement periods. The value
of the security so purchased is subject to market fluctuations during this period. Due to the nature of the Senior Loan market, the actual
settlement date may not be certain at the time of the purchase or sale for some of the Senior Loans. Interest income on such Senior Loans
is not accrued until settlement date. The Fund maintains liquid assets with a current value at least equal to the amount of its when-issued,
delayed-delivery or forward purchase commitments until payment is made. At May 31, 2023, the Fund had no when-issued, delayed-delivery
or forward purchase commitments.
D. Unfunded
Loan Commitments
The
Fund may enter into certain credit agreements, all or a portion of which may be unfunded. The Fund is obligated to fund these loan commitments
at the borrower’s discretion. Unfunded loan commitments are marked-to-market daily, and any unrealized appreciation (depreciation)
is included in the Statement of Assets and Liabilities and Statement of Operations. In connection with these commitments, the Fund earns
a commitment fee typically set as a percentage of the commitment amount. The commitment fees are included in “Other” under
Investment Income on the Statement of Operations. The Fund had no unfunded loan commitments as of May 31, 2023.
Notes
to Financial Statements (Continued)
First
Trust High Yield Opportunities 2027 Term Fund (FTHY)
May
31, 2023
E. Restricted
Securities
The
Fund holds restricted securities, which are securities that may not be offered for public sale without first being registered under the
1933 Act. Prior to registration, restricted securities may only be resold in transactions exempt from registration under Rule 144A under
the 1933 Act, normally to qualified institutional buyers. As of May 31, 2023, the Fund held restricted securities as shown in the following
table that the Advisor has deemed illiquid pursuant to procedures adopted by the Fund’s Board of Trustees. Although market instability
can result in periods of increased overall market illiquidity, liquidity for each security is determined based on security-specific factors
and assumptions, which require subjective judgment. The Fund does not have the right to demand that such securities be registered. These
securities are valued according to the valuation procedures as stated in the Portfolio Valuation note (Note 2A) and are not expressed
as a discount to the carrying value of a comparable unrestricted security.
| Security
|
Acquisition
Date |
Shares
|
Current
Price |
Carrying
Cost |
Value
|
%
of
Net
Assets |
| Akorn, Inc.
|
10/15/2020
|
220,989
|
$0.94
|
$2,534,056
|
$207,177
|
0.04%
|
F. Dividends
and Distributions to Shareholders
The
Fund will distribute to holders of its Common Shares monthly dividends of all or a portion of its net income after the payment of interest
and dividends in connection with leverage, if any. Distributions of any net long-term capital gains earned by the Fund are distributed
at least annually. Distributions will automatically be reinvested into additional Common Shares pursuant to the Fund’s Dividend
Reinvestment Plan unless cash distributions are elected by the shareholder.
Distributions
from net investment income and realized capital gains are determined in accordance with federal income tax regulations, which may differ
from U.S. GAAP. Certain capital accounts in the financial statements are periodically adjusted for permanent differences in order to reflect
their tax character. These permanent differences are primarily due to the varying treatment of income and gain/loss on portfolio securities
held by the Fund and have no impact on net assets or NAV per share. Temporary differences, which arise from recognizing certain items
of income, expense and gain/loss in different periods for financial statement and tax purposes, will reverse at some point in the future.
Permanent differences incurred during the fiscal year ended May 31, 2023, resulting in book and tax accounting differences, have been
reclassified at year end to reflect an increase in accumulated net investment income (loss) of $1,671,016, and a decrease in accumulated
net realized gain (loss) on investments of $1,671,016. Accumulated distributable earnings (loss) consists of accumulated net investment
income (loss), accumulated net realized gain (loss) on investments, and unrealized appreciation (depreciation) on investments. Net assets
were not affected by these reclassifications.
The
tax character of distributions paid by the Fund during the fiscal years ended May 31, 2023 and 2022, was as follows:
| Distributions
paid from: |
2023
|
2022
|
|
Ordinary income
|
$35,642,807
|
$60,385,741
|
|
Capital gains
|
—
|
1,097,112
|
|
Return of capital
|
21,134,688
|
—
|
As
of May 31, 2023, the components of distributable earnings and net assets on a tax basis were as follows:
|
Undistributed ordinary income
|
$—
|
|
Undistributed capital gains
|
—
|
|
Total undistributed earnings
|
—
|
|
Accumulated capital and other losses
|
(69,905,200)
|
|
Net unrealized appreciation (depreciation)
|
(77,977,005)
|
|
Total accumulated earnings (losses)
|
(147,882,205)
|
|
Other
|
—
|
|
Paid-in capital
|
714,281,174
|
|
Total net assets
|
$566,398,969
|
G. Income
Taxes
The
Fund intends to continue to qualify as a regulated investment company by complying with the requirements under Subchapter M of the Internal
Revenue Code of 1986, as amended, which includes distributing substantially all of its net investment income and net
Notes
to Financial Statements (Continued)
First
Trust High Yield Opportunities 2027 Term Fund (FTHY)
May
31, 2023
realized
gains to shareholders. Accordingly, no provision has been made for federal and state income taxes. However, due to the timing and amount
of distributions, the Fund may be subject to an excise tax of 4% of the amount by which approximately 98% of the Fund’s taxable
income exceeds the distributions from such taxable income for the calendar year.
The
Fund intends to utilize provisions of the federal income tax laws, which allow it to carry a realized capital loss forward indefinitely
following the year of the loss and offset such loss against any future realized capital gains. The Fund is subject to certain limitations
under U.S. tax rules on the use of capital loss carryforwards and net unrealized built-in losses. These limitations apply when there has
been a 50% change in ownership. At May 31, 2023, the Fund had $69,905,200 of non-expiring capital loss carryforwards for federal income
tax purposes.
Certain
losses realized during the current fiscal year may be deferred and treated as occurring on the first day of the following fiscal year
for federal income tax purposes. For the fiscal year ended May 31, 2023, the Fund did not incur any net ordinary losses.
The
Fund is subject to accounting standards that establish a minimum threshold for recognizing, and a system for measuring, the benefits of
a tax position taken or expected to be taken in a tax return. Taxable years ended 2021, 2022, and 2023 remain open to federal and state
audit. As of May 31, 2023, management has evaluated the application of these standards to the Fund and has determined that no provision
for income tax is required in the Fund’s financial statements for uncertain tax positions.
As
of May 31, 2023, the aggregate cost, gross unrealized appreciation, gross unrealized depreciation, and net unrealized appreciation/(depreciation)
on investments (including short positions and derivatives, if any) for federal income tax purposes were as follows:
| Tax
Cost |
|
Gross
Unrealized
Appreciation |
|
Gross
Unrealized
(Depreciation) |
|
Net
Unrealized
Appreciation
(Depreciation) |
| $765,964,822
|
|
$2,057,364
|
|
$(80,034,369)
|
|
$(77,977,005)
|
H. Expenses
The
Fund will pay all expenses directly related to its operations.
3. Investment
Advisory Fee, Affiliated Transactions and Other Fee Arrangements
First
Trust, the investment advisor to the Fund, is a limited partnership with one limited partner, Grace Partners of DuPage L.P., and one general
partner, The Charger Corporation. The Charger Corporation is an Illinois corporation controlled by James A. Bowen, Chief Executive Officer
of First Trust. First Trust is responsible for the selection and ongoing monitoring of the Fund’s investment portfolio, managing
the Fund’s business affairs and providing certain administrative services necessary for the management of the Fund. For these investment
management services, First Trust is entitled to a monthly fee calculated at an annual rate of 1.35% of the Fund’s Managed Assets.
First Trust also provides fund reporting services to the Fund for a flat annual fee in the amount of $9,250.
The
Bank of New York Mellon (“BNYM”) serves as the Fund’s administrator, fund accountant and custodian in accordance with
certain fee arrangements. As administrator and fund accountant, BNYM is responsible for providing certain administrative and accounting
services to the Fund, including maintaining the Fund’s books of account, records of the Fund’s securities transactions, and
certain other books and records. As custodian, BNYM is responsible for custody of the Fund’s assets. BNYM is a subsidiary of The
Bank of New York Mellon Corporation, a financial holding company.
Computershare,
Inc. (“Computershare”) serves as the Fund’s transfer agent in accordance with certain fee arrangements. As transfer
agent, Computershare is responsible for maintaining shareholder records for the Fund.
Each
Trustee who is not an officer or employee of First Trust, any sub-advisor or any of their affiliates (“Independent Trustees”)
is paid a fixed annual retainer that is allocated equally among each fund in the First Trust Fund Complex. Each Independent Trustee is
also paid an annual per fund fee that varies based on whether the fund is a closed-end or other actively managed fund, a target outcome
fund or an index fund.
Additionally,
the Lead Independent Trustee and the Chairs of the Audit Committee, Nominating and Governance Committee and Valuation Committee are paid
annual fees to serve in such capacities, with such compensation allocated pro rata among each fund in the First Trust Fund Complex based
on net assets. Independent Trustees are reimbursed for travel and out-of-pocket expenses in connection with all meetings. The Lead Independent
Trustee and Committee Chairs rotate every three years. The officers and “Interested” Trustee receive no compensation from
the Fund for acting in such capacities.
Notes
to Financial Statements (Continued)
First
Trust High Yield Opportunities 2027 Term Fund (FTHY)
May
31, 2023
4. Purchases
and Sales of Securities
The
cost of purchases and proceeds from sales of securities, excluding short-term investments, for the fiscal year ended May 31, 2023, were
$259,847,880 and $405,340,947, respectively.
5. Derivative
Transactions
The
following table presents the amount of net realized gain (loss) and change in net unrealized appreciation (depreciation), if any, recognized
for the fiscal year ended May 31, 2023, on derivative instruments, as well as the primary underlying risk exposure associated with each
instrument. The Fund did not hold any derivative instruments as of May 31, 2023.
| Statement
of Operations Location |
|
| Credit
Risk Exposure |
|
| Net
realized gain (loss) on swap contracts |
$278,200
|
The
Fund entered into credit default swap agreements on February 9, 2023. For the period February 9, 2023 through May 31, 2023, the average
notional value of credit default swaps was $3,484,375.
6. Borrowings
The
Fund has a committed facility agreement (the “Credit Agreement”) with The Toronto-Dominion Bank, New York Branch that has
a maximum commitment amount of $315,000,000. The borrowing rate under the facility is equal to Term SOFR plus 0.80% plus a credit spread
adjustment of 0.10%. Prior to July 22, 2022, the maximum commitment amount was $340,000,000 and the borrowing rate under the facility
was equal to 1-month LIBOR plus 0.80%. In addition, under the facility, the Fund pays a commitment fee of 0.30% on the undrawn amount
of such facility when the utilization is below 90% of the maximum commitment amount. For the fiscal year ended May 31, 2023, the average
amount outstanding was $155,876,712 with a weighted average interest rate of 4.42%. As of May 31, 2023, the Fund had outstanding borrowings
of $123,000,000, which approximates fair value, under the Credit Agreement. The borrowings are categorized as Level 2 within the fair
value hierarchy. The high and low annual interest rates for the fiscal year ended May 31, 2023 were 6.09% and 1.84%, respectively. The
weighted average interest rate at May 31, 2023 was 6.09%.
7. Indemnification
The
Fund has a variety of indemnification obligations under contracts with its service providers. The Fund’s maximum exposure under
these arrangements is unknown. However, the Fund has not had prior claims or losses pursuant to these contracts and expects the risk of
loss to be remote.
8. Subsequent
Events
Management
has evaluated the impact of all subsequent events on the Fund through the date the financial statements were issued and has determined
that there was the following subsequent event:
Effective
June 7, 2023, the Credit Agreement with The Toronto-Dominion Bank, New York Branch was amended and the maximum commitment amount was reduced
to $280,000,000. Effective July 20, 2023, the Credit Agreement was further amended to change the reference rate to the sum of Term SOFR
plus the Applicable Margin of 105 basis points and the unused commitment fee rate increased to 0.35% per annum.
Report
of Independent Registered Public Accounting Firm
To
the Shareholders and the Board of Trustees of First Trust High Yield Opportunities 2027 Term Fund:
Opinion
on the Financial Statements and Financial Highlights
We
have audited the accompanying statement of assets and liabilities of First Trust High Yield Opportunities 2027 Term Fund (the “Fund”),
including the portfolio of investments, as of May 31, 2023, the related statements of operations and cash flows for the year then ended,
the statements of changes in net assets for each of the two years in the period then ended, the financial highlights for the years ended
May 31, 2023 and 2022, and for the period from June 25, 2020 (commencement of operations) through May 31, 2021, and the related notes.
In our opinion, the financial statements and financial highlights present fairly, in all material respects, the financial position of
the Fund as of May 31, 2023, and the results of its operations and its cash flows for the year then ended, the changes in its net
assets for each of the two years in the period then ended, and the financial highlights for the years ended May 31, 2023 and 2022, and
for the period from June 25, 2020 (commencement of operations) through May 31, 2021 in conformity with accounting principles generally
accepted in the United States of America.
Basis
for Opinion
These
financial statements and financial highlights are the responsibility of the Fund’s management. Our responsibility is to express
an opinion on the Fund’s financial statements and financial highlights based on our audits. We are a public accounting firm registered
with the Public Company Accounting Oversight Board (United States) (PCAOB) and are required to be independent with respect to the Fund
in accordance with the U.S. federal securities laws and the applicable rules and regulations of the Securities and Exchange Commission
and the PCAOB.
We
conducted our audits in accordance with the standards of the PCAOB. Those standards require that we plan and perform the audit to obtain
reasonable assurance about whether the financial statements and financial highlights are free of material misstatement, whether due to
error or fraud. The Fund is not required to have, nor were we engaged to perform, an audit of its internal control over financial reporting.
As part of our audits we are required to obtain an understanding of internal control over financial reporting but not for the purpose
of expressing an opinion on the effectiveness of the Fund’s internal control over financial reporting. Accordingly, we express no
such opinion.
Our
audits included performing procedures to assess the risks of material misstatement of the financial statements and financial highlights,
whether due to error or fraud, and performing procedures that respond to those risks. Such procedures included examining, on a test basis,
evidence regarding the amounts and disclosures in the financial statements and financial highlights. Our audits also included evaluating
the accounting principles used and significant estimates made by management, as well as evaluating the overall presentation of the financial
statements and financial highlights. Our procedures included confirmation of securities owned as of May 31, 2023, by correspondence with
the custodian, agent banks and brokers; when replies were not received from agent banks and brokers, we performed other auditing procedures.
We believe that our audits provide a reasonable basis for our opinion.
Chicago,
Illinois
July
25, 2023
We
have served as the auditor of one or more First Trust investment companies since 2001.
Additional
Information
First
Trust High Yield Opportunities 2027 Term Fund (FTHY)
May
31, 2023 (Unaudited)
Dividend
Reinvestment Plan
If
your Common Shares are registered directly with the Fund or if you hold your Common Shares with a brokerage firm that participates in
the Fund’s Dividend Reinvestment Plan (the “Plan”), unless you elect, by written notice to the Fund, to receive cash
distributions, all dividends, including any capital gain distributions, on your Common Shares will be automatically reinvested by Computershare
Trust Company N.A. (the “Plan Agent”), in additional Common Shares under the Plan. If you elect to receive cash distributions,
you will receive all distributions in cash paid by check mailed directly to you by the Plan Agent, as the dividend paying agent.
If
you decide to participate in the Plan, the number of Common Shares you will receive will be determined as follows:
| (1)
|
If
Common Shares are trading at or above net asset value (“NAV”) at the time of valuation, the Fund will issue new shares at
a price equal to the greater of (i) NAV per Common Share on that date or (ii) 95% of the market price on that date. |
| (2)
|
If
Common Shares are trading below NAV at the time of valuation, the Plan Agent will receive the dividend or distribution in cash and will
purchase Common Shares in the open market, on the NYSE or elsewhere, for the participants’ accounts. It is possible that the market
price for the Common Shares may increase before the Plan Agent has completed its purchases. Therefore, the average purchase price per
share paid by the Plan Agent may exceed the market price at the time of valuation, resulting in the purchase of fewer shares than if the
dividend or distribution had been paid in Common Shares issued by the Fund. The Plan Agent will use all dividends and distributions received
in cash to purchase Common Shares in the open market within 30 days of the valuation date except where temporary curtailment or suspension
of purchases is necessary to comply with federal securities laws. Interest will not be paid on any uninvested cash payments. |
You
may elect to opt-out of or withdraw from the Plan at any time by giving written notice to the Plan Agent, or by telephone at (866) 340-1104,
in accordance with such reasonable requirements as the Plan Agent and the Fund may agree upon. If you withdraw or the Plan is terminated,
you will receive a certificate for each whole share in your account under the Plan, and you will receive a cash payment for any fraction
of a share in your account. If you wish, the Plan Agent will sell your shares and send you the proceeds, minus brokerage commissions.
The
Plan Agent maintains all Common Shareholders’ accounts in the Plan and gives written confirmation of all transactions in the accounts,
including information you may need for tax records. Common Shares in your account will be held by the Plan Agent in non-certificated form.
The Plan Agent will forward to each participant any proxy solicitation material and will vote any shares so held only in accordance with
proxies returned to the Fund. Any proxy you receive will include all Common Shares you have received under the Plan.
There
is no brokerage charge for reinvestment of your dividends or distributions in Common Shares. However, all participants will pay a pro
rata share of brokerage commissions incurred by the Plan Agent when it makes open market purchases.
Automatically
reinvesting dividends and distributions does not mean that you do not have to pay income taxes due upon receiving dividends and distributions.
Capital gains and income are realized although cash is not received by you. Consult your financial advisor for more information.
If
you hold your Common Shares with a brokerage firm that does not participate in the Plan, you will not be able to participate in the Plan
and any dividend reinvestment may be effected on different terms than those described above.
The
Fund reserves the right to amend or terminate the Plan if in the judgment of the Board of Trustees the change is warranted. There is no
direct service charge to participants in the Plan; however, the Fund reserves the right to amend the Plan to include a service charge
payable by the participants. Additional information about the Plan may be obtained by writing Computershare, Inc., P.O. Box 505000, Louisville,
KY 40233-5000.
Proxy
Voting Policies and Procedures
A
description of the policies and procedures that the Fund uses to determine how to vote proxies and information on how the Fund voted proxies
relating to portfolio investments during the most recent 12-month period ended June 30 is available (1) without charge, upon request,
by calling (800) 988-5891; (2) on the Fund’s website at www.ftportfolios.com;
and (3) on the Securities and Exchange Commission’s (“SEC”) website at www.sec.gov.
Portfolio
Holdings
The
Fund files portfolio holdings information for each month in a fiscal quarter within 60 days after the end of the relevant fiscal quarter
on Form N-PORT. Portfolio holdings information for the third month of each fiscal quarter will be publicly available on the
Additional
Information (Continued)
First
Trust High Yield Opportunities 2027 Term Fund (FTHY)
May
31, 2023 (Unaudited)
SEC’s
website at www.sec.gov. The Fund’s complete schedule of portfolio
holdings for the second and fourth quarters of each fiscal year is included in the semi-annual and annual reports to shareholders, respectively,
and is filed with the SEC on Form N-CSR. The semi-annual and annual report for the Fund is available to investors within 60 days after
the period to which it relates. The Fund’s Forms N-PORT and Forms N-CSR are available on the SEC’s website listed above.
Tax Information
Of
the ordinary income (including short-term capital gain) distributions made by the Fund during the fiscal year ended May 31, 2023, none
qualify for the corporate dividends received deduction available to corporate shareholders or as qualified dividend income.
Distributions
paid to foreign shareholders during the Fund’s fiscal year ended May 31, 2023, that were properly designated by the Fund as “interest-related
dividends” or “short-term capital gain dividends,” may not be subject to federal income tax provided that the income
was earned directly by such foreign shareholders.
NYSE
Certification Information
In
accordance with Section 303A-12 of the New York Stock Exchange (“NYSE”) Listed Company Manual, the Fund’s President
has certified to the NYSE that, as of September 22, 2022, he was not aware of any violation by the Fund of NYSE corporate governance listing
standards. In addition, the Fund’s reports to the SEC on Form N-CSR contain certifications by the Fund’s principal executive
officer and principal financial officer that relate to the Fund’s public disclosure in such reports and are required by Rule 30a-2
under the 1940 Act.
Submission
of Matters to a Vote of Shareholders
The
Fund held its Annual Meeting of Shareholders (the “Annual Meeting”) on September 19, 2022. At the Annual Meeting, James A.
Bowen and Robert F. Keith were elected by the Common Shareholders of the First Trust High Yield Opportunities 2027 Term Fund as Class
III Trustees for a three-year term expiring at the Fund’s annual meeting of shareholders in 2025. The number of votes cast in favor
of Mr. Bowen was 29,105,719 and the number of votes withheld was 705,711. The number of votes cast in favor of Mr. Keith was 29,105,719
and the number of votes withheld was 705,711. Richard E. Erickson, Thomas R. Kadlec, Denise M. Keefe and Niel B. Nielson are the other
current and continuing Trustees.
Amended
and Restated By-Laws
On
June 22, 2023, the Board of Trustees of the Fund amended and restated its existing Amended and Restated By-Laws (and as so amended and
restated, the “By-Laws”), effective immediately. The By-Laws were revised to rescind Article XII and its accompanying control
share provisions, along with other conforming amendments.
The
foregoing description is qualified in its entirety by reference to the full text of the By-Laws, a copy of which can be found in the Current
Report on Form 8-K filed by the Fund with the Securities and Exchange Commission on June 23, 2023, which is available at www.sec.gov,
and may also be obtained by writing to the Secretary of the Fund at the Fund’s principal executive office.
Investment
Objective, Policies, Risks and Effects of Leverage
First
Trust High Yield Opportunities 2027 Term Fund (FTHY)
May
31, 2023 (Unaudited)
Changes
Occurring During the Prior Fiscal Year
The
following information is a summary of certain changes during the most recent fiscal year ended May 31, 2023. This information may
not reflect all of the changes that have occurred since you purchased shares of the Fund.
During
the Fund’s most recent fiscal year, the Fund determined it may increase its utilization of derivatives, including through the use
of credit default swap indices (“CDX”), and, accordingly, CDX Risk (as described below) has become a principal risk factor
associated with an investment in the Fund.
Investment
Objective
The
Fund’s investment objective is to provide current income.
Principal
Investment Policies
The
Fund invests at least 80% of its Managed Assets (as defined below) in high yield debt securities of any maturity that are rated below
investment grade (rated below “BBB-” by S&P Global Ratings (“S&P”) and Fitch Ratings, a part of the Fitch
Group (“Fitch”), or below “Baa3” by Moody’s Investor Services, Inc. (“Moody’s”)) at the
time of purchase or unrated securities determined by the Advisor to be of comparable quality. Such securities include U.S and non-U.S.
corporate debt obligations and senior, secured floating rate loans (“Senior Loans”).
“Managed
Assets” means the average daily gross asset value of the Fund (which includes assets attributable to the Fund’s preferred
shares of beneficial interest (“Preferred Shares”), if any, and the principal amount of any borrowings or commercial paper
or notes issued by the Fund), minus the sum of the Fund’s accrued and unpaid dividends on any outstanding Preferred Shares and accrued
liabilities (other than the principal amount of any borrowings of money incurred or of commercial paper or notes issued by the Fund).
Under
normal market circumstances:
| •
|
The
Fund may invest up to 20% of its Managed Assets in (i) investment grade corporate debt obligations, (ii) U.S. and non-U.S. government
debt securities, (iii) warrants and equity securities, including common stock and other equity securities acquired in connection with
the restructuring of the debt of an issuer, the reorganization of a Senior Loan or as part of a package of securities acquired together
with the Senior Loans of an issuer, and (iv) investment companies; |
| •
|
The
Fund may invest no more than 20% of its Managed Assets in corporate debt obligations that, at the time of purchase using the highest available
rating, either are rated “CCC+” or lower by S&P or Fitch, or “Caa1” or lower by Moody’s, or comparably
rated by another nationally recognized statistical rating organization (“NRSRO”) or, if unrated, determined by the Advisor
to be of comparable quality; |
| •
|
The
Fund may invest no more than 25% of its Managed Assets in any single industry in the corporate debt market; and |
| •
|
The
Fund may not invest more than 5% of its Managed Assets in securities issued by a single issuer, other than securities issued by the U.S.
government. |
The
Fund’s investments may include: (i) securities of issuers located in countries considered to be emerging markets, which may entail
additional risks; and (ii) defaulted or distressed securities (i.e., securities of companies whose financial condition is troubled or
uncertain and that may be involved in bankruptcy proceedings, reorganizations or financial restructurings). The Fund may use certain
credit derivatives to take on additional credit risk and obtain exposure to the high yield corporate debt market. If used, these
instruments will be considered to be an investment in high yield debt securities for the purposes of the Fund’s investment policy
to invest, under normal market conditions, at least 80% of its Managed Assets in high yield debt securities that are rated below investment
grade at the time of purchase or unrated securities determined by the Advisor to be of comparable quality. The Fund primarily uses
total return swaps and credit default swaps to gain such exposure to high yield debt securities as part of its investment strategy. The
Fund also may use credit default swap indices (“CDX”) to take on additional credit risk and obtain exposure to the high yield
debt market. The Fund may use CDX exposure in two ways: when the Fund is a buyer of CDX credit protection, it seeks
to hedge its exposure to volatility in the high yield debt market; when the Fund is a seller of CDX credit protection, it seeks
to gain exposure to the high yield debt market, similar to investing directly in a basket of high yield debt securities. The CDX investments
in which the Fund will invest are cleared on an exchange. The Fund’s usage of total return swaps, credit default swaps and
other derivative transactions other than for hedging purposes may not exceed 20% of the Fund’s Managed Assets, as measured by the
total notional amount of such instruments. The Fund may also enter into futures contracts and options on futures contracts, and
may, but is not required to, use various other derivative transactions to seek to manage the risks of the Fund’s portfolio securities
or for other purposes to the extent the Advisor determines that the use of such transactions is consistent with the Fund’s investment
objective, policies and applicable regulatory requirements.
Investment
Objective, Policies, Risks and Effects of Leverage (Continued)
First
Trust High Yield Opportunities 2027 Term Fund (FTHY)
May
31, 2023 (Unaudited)
To
the extent the Fund enters into derivatives transactions, it will do so pursuant to Rule 18f-4 under the 1940 Act. Rule 18f-4 requires
the Fund to implement certain policies and procedures designed to manage its derivatives risks, dependent upon the Fund’s level
of exposure to derivative instruments.
The
Fund intends to liquidate and distribute substantially all of its net assets to shareholders on or about August 1, 2027 (the “Termination
Date”). The Fund is not a so called “target date” or “life cycle” fund whose asset allocation becomes
more conservative over time as its target date, often associated with retirement, approaches. In addition, the Fund is not a “target
term” fund whose investment objective is to return its original NAV on the Termination Date. The Fund’s investment objective
and policies are not designed to seek to return to investors that purchased Common Shares in the initial offering their initial investment
of $20.00 per Common Share on the Termination Date, and such investors and investors that purchased Common Shares after the completion
of the initial offering may receive more or less than their original investment upon termination.
During
temporary defensive periods and the period in which the Fund is approaching its Termination Date (i.e., the “wind-down” period
during which the Fund may begin liquidating its portfolio in anticipation of the Termination Date, which period is expected to begin six
months prior to the Termination Date), the Fund may deviate from its investment policies and objective. During such periods, the
Fund may invest up to 100% of its Managed Assets in cash or short-term investments, including high quality, short-term securities, or
may invest in short- or intermediate-term U.S. Treasury securities. There can be no assurance that such techniques will be successful,
and during such periods, the Fund may not achieve its investment objective.
The
Fund currently uses (and may continue to use) leverage to seek to achieve its investment objective. The Fund anticipates that, under
normal market conditions, it will employ leverage through borrowings from banks or other financial institutions in the amount of approximately
30% of the Fund’s Managed Assets. The costs associated with any issuance and use of leverage are borne by Common Shareholders.
The use of leverage is a speculative technique and investors should note that there are special risks and costs associated with
the leveraging of the Common Shares. There can be no assurance that a leveraging strategy will be successful during any period in
which it is employed. Under normal market conditions, the Fund seeks to limit its overall effective leverage (which represents the
combination of economic leverage, which is when the Fund seeks the right to a return on a capital base that exceeds the investment which
the Fund has contributed to the instrument seeking a return) and the Fund’s senior securities (as defined under the 1940 Act)) to
40% of its Managed Assets.
Fundamental
Investment Policies
The
Fund, as a fundamental policy, may not:
1)
With respect to 75% of its total assets, purchase any securities if, as a result (i) more than 5% of the Fund’s total assets would
then be invested in securities of any single issuer, or (ii) the Fund would hold more than 10% of the outstanding voting securities of
any single issuer; provided, that Government securities (as defined in the 1940 Act), securities issued by other investment companies
and cash items (including receivables) shall not be counted for purposes of this limitation;
2)
Purchase or sell real estate or commodities except as permitted by (i) the 1940 Act and the rules and regulations thereunder, or other
successor law governing the regulation of registered investment companies, or interpretations or modifications thereof by the SEC, SEC
staff or other authority of competent jurisdiction, or (ii) exemptive or other relief or permission from the SEC, SEC staff or other authority
of competent jurisdiction;
3)
Borrow money except as permitted by (i) the 1940 Act and the rules and regulations thereunder, or other successor law governing the regulation
of registered investment companies, or interpretations or modifications thereof by the SEC, SEC staff or other authority of competent
jurisdiction, or (ii) exemptive or other relief or permission from the SEC, SEC staff or other authority of competent jurisdiction;
4)
Issue senior securities except as permitted by (i) the 1940 Act and the rules and regulations thereunder, or other successor law governing
the regulation of registered investment companies, or interpretations or modifications thereof by the SEC, SEC staff or other authority
of competent jurisdiction, or (ii) exemptive or other relief or permission from the SEC, SEC staff or other authority of competent jurisdiction;
5)
Underwrite the securities of other issuers except (a) to the extent that the Fund may be deemed to be an underwriter within the meaning
of the Securities Act of 1933, as amended, in connection with the purchase and sale of portfolio securities; and (b) as permitted by (i)
the 1940 Act and the rules and regulations thereunder, or other successor law governing the regulation of registered investment companies,
or interpretations or modifications thereof by the SEC, SEC staff or other authority of competent jurisdiction, or (ii) exemptive or other
relief or permission from the SEC, SEC staff or other authority of competent jurisdiction;
Investment
Objective, Policies, Risks and Effects of Leverage (Continued)
First
Trust High Yield Opportunities 2027 Term Fund (FTHY)
May
31, 2023 (Unaudited)
6)
Make loans except as permitted by (i) the 1940 Act and the rules and regulations thereunder, or other successor law governing the regulation
of registered investment companies, or interpretations or modifications thereof by the SEC, SEC staff or other authority of competent
jurisdiction, or (ii) exemptive or other relief or permission from the SEC, SEC staff or other authority of competent jurisdiction; or
7)
Purchase any security if as a result 25% or more of the Fund’s total assets (taken at current value) would be invested in securities
of issuers in a single industry, except that such limitation shall not apply to obligations issued or guaranteed by the United States
Government or by its agencies or instrumentalities.
Except
as noted above, the foregoing fundamental investment policies cannot be changed without approval by holders of a “majority of the
outstanding voting securities” of the Fund, as defined in the 1940 Act, which includes Common Shares and Preferred Shares, if any,
voting together as a single class, and of the holders of the outstanding Preferred Shares, if any, voting as a single class. Under
the 1940 Act, a “majority of the outstanding voting securities” means (i) 67% or more of the Fund’s shares present at
a meeting, if the holders of more than 50% of the Fund’s shares are present or represented by proxy, or (ii) more than 50% of the
Fund’s shares, whichever is less.
The
foregoing restrictions and limitations will apply only at the time of purchase of securities, and the percentage limitations will not
be considered violated unless an excess or deficiency occurs or exists immediately after and as a result of an acquisition of securities,
unless otherwise indicated.
Principal
Risks
The
Fund is a closed-end management investment company designed primarily as a long-term investment and not as a trading vehicle. The Fund
is not intended to be a complete investment program and, due to the uncertainty inherent in all investments, there can be no assurance
that the Fund will achieve its investment objective. The following discussion summarizes the principal risks associated with investing
in the Fund, which includes the risk that you could lose some or all of your investment in the Fund. The Fund is subject to the informational
requirements of the Securities Exchange Act of 1934 and the Investment Company Act of 1940 and, in accordance therewith, files reports,
proxy statements and other information that is available for review.
CDX
Risk. CDX is an equally-weighted index of credit default swaps that is designed to track a representative
segment of the credit default swap market (e.g., high yield). A credit default swap is a financial derivative that allows an investor
to swap or offset their credit risk with that of another investor. CDX provides exposure to a basket of underlying credit default swaps
in lieu of buying or selling credit default swaps on individual debt securities. The CDX investments in which the Fund will invest are
cleared on an exchange. Regardless of whether the Fund buys or sells CDX credit protection, such investments can result in gains or losses
that may exceed gains or losses the Fund would have incurred investing directly in high yield debt securities, which may impact the Fund’s
net asset value. It is also possible that returns from CDX investments may not correlate with returns of the broader high yield credit
market. There are additional costs associated with investing in CDX, including the payment of premiums when the Fund is a buyer of CDX
credit protection. When the Fund sells CDX credit protection, it assumes additional credit risk. Investment exposure to CDX credit protection
is subject to the risks of the underlying credit default swap obligations, which include general market risk, liquidity risk, credit risk
and counterparty risk. Counterparty risk may be mitigated somewhat compared to buying or selling credit protection using individual credit
default swaps because CDX investments are cleared on an exchange.
Consumer
Discretionary Companies Risk. Consumer discretionary companies, such as retailers, media companies and
consumer services companies, provide non-essential goods and services. These companies manufacture products and provide discretionary
services directly to the consumer, and the success of these companies is tied closely to the performance of the overall domestic and international
economy, interest rates, competition and consumer confidence. Success depends heavily on disposable household income and consumer spending.
Changes in demographics and consumer tastes can also affect the demand for, and success of, consumer discretionary products in the marketplace.
Corporate
Debt Obligations Risk. The market value of corporate debt obligations generally may be expected to rise
and fall inversely with interest rates. The market value of corporate debt obligations also may be affected by factors directly related
to the issuer, such as investors’ perceptions of the creditworthiness of the issuer, the issuer’s financial performance, perceptions
of the issuer in the marketplace, performance of management of the issuer, the issuer’s capital structure and use of financial leverage
and demand for the issuer’s goods and services. There is a risk that the issuers of corporate debt may not be able to meet their
obligations on interest and/or principal payments at the time called for by an instrument.
Credit
Agency Risk. Credit ratings are determined by credit rating agencies and are only the opinions of such
entities. Ratings assigned by a rating agency are not absolute standards of credit quality and do not evaluate market risk or the liquidity
of securities. Any shortcomings or inefficiencies in credit rating agencies’ processes for determining credit ratings may adversely
affect the credit
Investment
Objective, Policies, Risks and Effects of Leverage (Continued)
First
Trust High Yield Opportunities 2027 Term Fund (FTHY)
May
31, 2023 (Unaudited)
ratings
of securities held by the Fund or such credit rating agency’s ability to evaluate creditworthiness and, as a result, may adversely
affect those securities’ perceived or actual credit risk.
Credit
and Below-Investment Grade Securities Risk. Credit risk is the risk that the issuer or other obligated
party of a debt security in the Fund’s portfolio will fail to pay, or it is perceived that it will fail to pay, dividends and/or
interest or repay principal, when due. Below-investment grade instruments, including instruments that are not rated but judged to be of
comparable quality, are commonly referred to as high yield securities or “junk” bonds and are considered speculative with
respect to the issuer’s capacity to pay dividends or interest and repay principal and are more susceptible to default or decline
in market value than investment grade securities due to adverse economic and business developments. High yield securities are often unsecured
and subordinated to other creditors of the issuer. The market values for high yield securities tend to be very volatile, and these securities
are generally less liquid than investment grade securities. For these reasons, an investment in the Fund is subject to the following specific
risks: (i) increased price sensitivity to changing interest rates and to a deteriorating economic environment; (ii) greater risk of loss
due to default or declining credit quality; (iii) adverse company specific events more likely to render the issuer unable to make dividend,
interest and/or principal payments; (iv) negative perception of the high yield market which may depress the price and liquidity of high
yield securities; (v) volatility; and (vi) liquidity.
Credit
Default Swaps Risk. Credit default swap transactions involve greater risks than if the Fund had invested
in the reference obligation directly. In addition to general market risks, credit default swaps are subject to liquidity risk, counterparty
risk and credit risks. With respect to a reference obligation, a buyer will lose its investment and recover nothing should no event of
default occur. For a seller, if an event of default were to occur, the value of the reference obligation received by the seller, coupled
with the periodic payments previously received, may be less than the full notional value it pays to the buyer, resulting in a loss of
value. When the Fund acts as a seller of a credit default swap agreement, it is exposed to the risks of leverage since if an event of
default occurs with respect to a reference obligation, the seller must pay the buyer the full notional value of the reference obligation.
Cyber
Security Risk. The Fund is susceptible to potential operational risks through breaches in cyber security.
A breach in cyber security refers to both intentional and unintentional events that may cause the Fund to lose proprietary information,
suffer data corruption or lose operational capacity. Such events could cause the Fund to incur regulatory penalties, reputational damage,
additional compliance costs associated with corrective measures and/or financial loss. Cyber security breaches may involve unauthorized
access to the Fund’s digital information systems through “hacking” or malicious software coding, but may also result
from outside attacks such as denial-of-service attacks through efforts to make network services unavailable to intended users. In addition,
cyber security breaches of the Fund’s third-party service providers, such as its administrator, transfer agent or custodian, or
issuers in which the Fund invests, can also subject the Fund to many of the same risks associated with direct cyber security breaches.
The Fund has established risk management systems designed to reduce the risks associated with cyber security. However, there is no guarantee
that such efforts will succeed, especially because the Fund does not directly control the cyber security systems of issuers or third party
service providers. Substantial costs may be incurred by the Fund in order to resolve or prevent cyber incidents in the future.
Defaulted
and Distressed Securities Risk. The Fund may invest in securities that may be in default or distressed—i.e.,
securities of companies whose financial condition is troubled or uncertain and that may be involved in bankruptcy proceedings, reorganizations
or financial restructurings. Distressed securities present a substantial risk of future default which may cause the Fund to incur losses,
including additional expenses, to the extent it is required to seek recovery upon a default in the payment of principal or interest on
those securities. The Fund also will be subject to significant uncertainty as to when, in what manner and for what value the obligations
evidenced by the defaulted or distressed securities will eventually be satisfied.
In
addition, the Fund may invest in loans of borrowers that are experiencing, or are likely to experience, financial difficulty. These loans
are subject to greater credit and liquidity risks than other types of loans. In addition, the Fund can invest in loans of borrowers that
have filed for bankruptcy protection or that have had involuntary bankruptcy petitions filed against them by creditors. A bankruptcy proceeding
or other court proceeding could delay or limit the ability of the Fund to collect the principal and interest payments on that borrower’s
loans or adversely affect the Fund’s rights in collateral relating to a loan.
Earnings
Risk. The Fund’s limited term may cause it to invest in lower yielding securities or hold the
proceeds of securities sold near the end of its term in cash or cash equivalents, which may adversely affect the performance of the Fund
or the Fund’s ability to maintain its dividend.
Emerging
Markets Risk. Investing in emerging market countries, as compared to foreign developed markets, involves
substantial additional risk due to more limited information about the issuer and/or the security (including limited financial and accounting
information); higher brokerage costs; different accounting, auditing and financial reporting standards; less developed legal systems and
thinner trading markets; the possibility of currency blockages or transfer restrictions; an emerging market country’s dependence
on revenue from particular commodities or international aid; and the risk of expropriation, nationalization or other adverse political
or economic developments.
Investment
Objective, Policies, Risks and Effects of Leverage (Continued)
First
Trust High Yield Opportunities 2027 Term Fund (FTHY)
May
31, 2023 (Unaudited)
Emerging
market countries may lack the social, political and economic stability and characteristics of more developed countries, and their political
and economic structures may undergo unpredictable, significant and rapid changes from time to time, any of which could adversely impact
the value of investments in emerging markets as well as the availability of additional investments in such markets. The securities markets
of emerging market countries may be substantially smaller, less developed, less liquid and more volatile than the major securities markets
in the United States and other developed nations. The limited size of these securities markets and the limited trading volume of securities
issued by emerging market issuers could cause prices to be erratic and investments in emerging markets can become illiquid. As a result
of the foregoing risks, it may be difficult to assess the value or prospects of an investment in such securities.
Europe
Risk. The Fund is subject to certain risks associated specifically with investments in securities of
European issuers, in addition to the risks associated with investments in non-U.S. securities generally. Political or economic disruptions
in European countries, even in countries in which the Fund is not invested, may adversely affect security values and thus the Fund’s
holdings. A significant number of countries in Europe are member states in the European Union (“EU”), and the member states
no longer control their own monetary policies by directing independent interest rates for their currencies. In these member states, the
authority to direct monetary policies, including money supply and official interest rates for the Euro, is exercised by the European Central
Bank. In a 2016 referendum, the United Kingdom elected to withdraw from the EU (“Brexit”). After years of negotiations between
the United Kingdom and the EU, a withdrawal agreement was reached whereby the United Kingdom formally left the EU. As the second largest
economy among EU members, the implications of the United Kingdom’s withdrawal are difficult to gauge and cannot be fully known.
Trade between the United Kingdom and the EU is highly integrated through supply chains and trade in services, as well as through multinational
companies. The United Kingdom’s departure may negatively impact the EU and Europe as a whole by causing volatility within the EU,
triggering prolonged economic downturns in certain European countries or sparking additional member states to contemplate departing the
EU (thereby perpetuating political instability in the region).
Foreign
Currency Risk. Currency risk is the risk that fluctuations in exchange rates may adversely affect the
value of the Fund’s investments. Currency exchange rates fluctuate significantly for many reasons, including changes in supply and
demand in the currency exchange markets, actual or perceived changes in interest rates, intervention (or the failure to intervene) by
U.S. or foreign governments, central banks, or supranational agencies such as the International Monetary Fund, and currency controls or
other political and economic developments in the U.S. or abroad.
Health
Care Companies Risk. Through the Fund’s investments in senior loans, the Fund may be significantly
exposed to companies in the health care sector. Health care companies are involved in medical services or health care, including
biotechnology research and production, drugs and pharmaceuticals and health care facilities and services. These companies are subject
to extensive competition, generic drug sales or the loss of patent protection, product liability litigation and increased government regulation.
Research and development costs of bringing new drugs to market are substantial, and there is no guarantee that the product will ever come
to market. Health care facility operators may be affected by the demand for services, efforts by government or insurers to limit rates,
restriction of government financial assistance and competition from other providers.
Illiquid
Securities Risk. The Fund invests a substantial portion of its assets in lower-quality debt issued by
companies that are highly leveraged. Lower-quality debt tends to be less liquid than higher-quality debt. Moreover, smaller debt issues
tend to be less liquid than larger debt issues. Although the resale or secondary market for senior loans is growing, it is currently limited.
There is no organized exchange or board of trade on which senior loans are traded. Instead, the secondary market for senior loans is an
unregulated inter-dealer or inter-bank resale market. In addition, senior loans in which the Fund invests may require the consent of the
borrower and/or agent prior to the settlement of the sale or assignment. These consent requirements can delay or impede the Fund’s
ability to settle the sale of senior loans. Depending on market conditions, the Fund may have difficulty disposing its senior loans, which
may adversely impact its ability to obtain cash to repay debt, to pay dividends, to pay expenses or to take advantage of new investment
opportunities.
Illiquid
securities may be difficult to dispose of at a fair price at the times when the Fund believes it is desirable to do so. The market price
of illiquid securities generally is more volatile than that of more liquid securities, which may adversely affect the price that the Fund
pays for or recovers upon the sale of such securities. Illiquid securities are also more difficult to value, especially in challenging
markets.
Inflation
Risk. Inflation risk is the risk that the value of assets or income from investments will be worth less
in the future as inflation decreases the value of money. As inflation increases, the present value of the Fund’s assets and distributions
may decline. This risk is more prevalent with respect to debt securities. Inflation creates uncertainty over the future real value (after
inflation) of an investment. Inflation rates may change frequently and drastically as a result of various factors, including unexpected
shifts in the domestic or global economy, and the Fund’s investments may not keep pace with inflation, which may result in losses
to Fund investors.
Investment
Objective, Policies, Risks and Effects of Leverage (Continued)
First
Trust High Yield Opportunities 2027 Term Fund (FTHY)
May
31, 2023 (Unaudited)
Information
Technology Companies Risk. Information technology companies produce and provide hardware, software and
information technology systems and services. Information technology companies are generally subject to the following risks: rapidly
changing technologies and existing product obsolescence; short product life cycles; fierce competition; aggressive pricing and reduced
profit margins; the loss of patent, copyright and trademark protections; cyclical market patterns; evolving industry standards; and frequent
new product introductions and new market entrants. Information technology companies may be smaller and less experienced companies,
with limited product lines, markets or financial resources and fewer experienced management or marketing personnel. Information
technology company stocks, particularly those involved with the internet, have experienced extreme price and volume fluctuations that
are often unrelated to their operating performance. In addition, information technology companies are particularly vulnerable to
federal, state and local government regulation, and competition and consolidation, both domestically and internationally, including competition
from foreign competitors with lower production costs. Information technology companies also face competition for services of qualified
personnel and heavily rely on patents and intellectual property rights and the ability to enforce such rights to maintain a competitive
advantage.
Interest
Rate Risk. The yield on the Fund’s common shares may rise or fall as market interest rates rise
and fall, as senior loans pay interest at rates which float in response to changes in market rates. Changes in prevailing interest rates
can be expected to cause some fluctuation in the Fund’s net asset value. Similarly, a sudden and significant increase in market
interest rates may cause a decline in the Fund’s net asset value.
Many
financial instruments use or may use a floating rate based upon the London Interbank Offered Rate (“LIBOR”). The United Kingdom’s
Financial Conduct Authority (the “FCA”), which regulates LIBOR, intends to cease making LIBOR available as a reference rate
over a phase-out period that began in early 2022. However, subsequent announcements by the FCA, the LIBOR administrators, and other regulators
indicate that it is possible that the most widely used LIBOR rates may continue until mid-2023. The unavailability or replacement of LIBOR
may affect the value, liquidity or return on certain Fund investments and may result in costs incurred in connection with closing out
positions and entering into new trades. Any potential effects of the transition away from LIBOR on the Fund or on certain instruments
in which the Fund invests can be difficult to ascertain, and they may vary depending on a variety of factors. In the United States,
it is anticipated that in many instances the Secured Overnight Financing Rate (“SOFR”) will replace LIBOR as the reference
rate for many of the floating rate instruments held by the Fund. There is no assurance that the composition or characteristics of SOFR,
or any alternative reference rate, will be similar to or produce the same value or economic equivalence as LIBOR or that instruments using
an alternative rate will have the same volume or liquidity. As a result, the transition process might lead to increased volatility and
reduced liquidity in markets that currently rely on LIBOR to determine interest rates; a reduction in the value of some LIBOR-based investments;
increased difficulty in borrowing or refinancing and diminished effectiveness of any applicable hedging strategies against instruments
whose terms currently include LIBOR; and/or costs incurred in connection with temporary borrowings and closing out positions and entering
into new agreements. Any such effects (as well as other unforeseen effects) of the transition away from LIBOR and the adoption of
alternative reference rates could result in losses to the Fund.
In
addition, for the Fund’s fixed rate investments, when market interest rates rise, the market value of such securities generally
will fall. Market value generally falls further for fixed rate securities with longer duration. During periods of rising interest rates,
the average life of certain types of securities may be extended because of slower than expected prepayments. This may lock in a below-market
yield, increase the security’s duration and further reduce the value of the security. Investments in fixed rate securities with
long-term maturities may experience significant price declines if long-term interest rates increase.
Leverage
Risk. The use of leverage by the Fund can magnify the effect of any losses. If the income and gains
from the securities and investments purchased with leverage proceeds do not cover the cost of leverage, the return to the common shares
will be less than if leverage had not been used. Leverage involves risks and special considerations for common shareholders including:
(i) the likelihood of greater volatility of net asset value and market price of the common shares than a comparable portfolio without
leverage; (ii) the risk that fluctuations in interest rates on borrowings will reduce the return to the common shareholders or will result
in fluctuations in the dividends paid on the common shares; (iii) in a declining market, the use of leverage is likely to cause a greater
decline in the net asset value of the common shares than if the Fund were not leveraged, which may result in a greater decline in the
market price of the common shares; and (iv) when the Fund uses certain types of leverage, the investment advisory fee payable to the Advisor
will be higher than if the Fund did not use leverage.
Limited
Term Risk. Because the assets of the Fund will be liquidated in connection with the Fund’s termination,
the Fund may be required to sell portfolio securities when it otherwise would not, including at times when market conditions are not favorable,
which may cause the Fund to lose money. In particular, the Fund’s portfolio may still have significant remaining average maturity
and duration, and large exposures to lower-quality credits, as the termination date approaches, and if interest rates are high (and the
value of lower-quality fixed-income securities consequently low) at the time the Fund needs to liquidate its assets in connection with
the termination, the losses due to portfolio liquidation may be significant. Moreover, as the Fund approaches the termination date, its
Investment
Objective, Policies, Risks and Effects of Leverage (Continued)
First
Trust High Yield Opportunities 2027 Term Fund (FTHY)
May
31, 2023 (Unaudited)
portfolio
composition may change as more of its portfolio holdings are called or sold, which may cause the returns to decrease and the NAV of the
Common Shares to fall. Rather than reinvesting the proceeds of matured, called or sold securities, the Fund may distribute the proceeds
in one or more liquidating distributions prior to the final liquidation, which may cause fixed expenses to increase when expressed as
a percentage of assets under management, or the Fund may invest the proceeds in lower yielding securities or hold the proceeds in cash,
which may adversely affect its performance. Because the Fund will invest in below investment grade securities, it may be exposed to the
greater potential for an issuer of its securities to default, as compared to a fund that invests solely in investment grade securities.
As a result, should a Fund portfolio holding default, this may significantly reduce net investment income and, therefore, Common Share
dividends, and also may prevent or inhibit the Fund from fully being able to liquidate its portfolio at or prior to the termination date.
When terminated, the Fund’s final distribution will be based upon its NAV at the end of the term and investors in the Fund may receive
more or less than their original investment.
Management
Risk and Reliance on Key Personnel. The implementation of the Fund’s investment strategy depends
upon the continued contributions of certain key employees of the Advisor, some of whom have unique talents and experience and would be
difficult to replace. The loss or interruption of the services of a key member of the portfolio management team could have a negative
impact on the Fund.
Market
Discount from Net Asset Value. Shares of closed-end investment companies such as the Fund frequently
trade at a discount from their net asset value. The Fund cannot predict whether its common shares will trade at, below or above net asset
value.
Market
Risk. Securities held by the Fund, as well as shares of the Fund itself, are subject to market fluctuations
caused by factors such as general economic conditions, political events, regulatory or market developments, changes in interest rates
and perceived trends in securities prices. Shares of the Fund could decline in value or underperform other investments as a result of
the risk of loss associated with these market fluctuations. In addition, local, regional or global events such as war, acts of terrorism,
spread of infectious diseases or other public health issues, recessions, or other events could have a significant negative impact on the
Fund and its investments. For example, the coronavirus (COVID-19) global pandemic and the aggressive responses taken by many governments,
including closing borders, restricting international and domestic travel, and the imposition of prolonged quarantines or similar restrictions,
had negative impacts, and in many cases severe impacts, on markets worldwide. While the development of vaccines has slowed the spread
of the virus and allowed for the resumption of reasonably normal business activity in the United States, many countries continue to impose
lockdown measures in an attempt to slow the spread. Also, in February 2022, Russia invaded Ukraine which has caused and could continue
to cause significant market disruptions and volatility across markets globally, including the United States. The hostilities and sanctions
resulting from those hostilities could have a significant impact on certain Fund investments as well as Fund performance. As the global
pandemic and conflict in Ukraine have illustrated, such events may affect certain geographic regions, countries, sectors and industries
more significantly than others. Recent and potential future bank failures could result in disruption to the broader banking industry or
markets generally and reduce confidence in financial institutions and the economy as a whole, which may also heighten market volatility
and reduce liquidity. These events also may adversely affect the prices and liquidity of the Fund’s portfolio securities or
other instruments and could result in disruptions in the trading markets. Any of such circumstances could have a materially negative impact
on the value of the Fund’s shares and result in increased market volatility. During any such events, the Fund’s shares may
trade at increased premiums or discounts to their net asset value and the bid/ask spread on the Fund’s shares may widen.
Non-U.S.
Securities Risk. The Fund may invest a portion of its assets in securities of non-U.S. issuers. Investing
in securities of non-U.S. issuers, which are generally denominated in non-U.S. currencies, may involve certain risks not typically associated
with investing in securities of U.S. issuers. These risks include: (i) there may be less publicly available information about non-U.S.
issuers or markets due to less rigorous disclosure or accounting standards or regulatory practices; (ii) non-U.S. markets may be smaller,
less liquid and more volatile than the U.S. market; (iii) potential adverse effects of fluctuations in currency exchange rates or controls
on the value of the Fund’s investments; (iv) the economies of non-U.S. countries may grow at slower rates than expected or may experience
a downturn or recession; (v) the impact of economic, political, social or diplomatic events; (vi) certain non-U.S. countries may impose
restrictions on the ability of non-U.S. issuers to make payments of principal and interest to investors located in the United States due
to blockage of non-U.S. currency exchanges or otherwise; and (vii) withholding and other non-U.S. taxes may decrease the Fund’s
return. Foreign companies are generally not subject to the same accounting, auditing and financial reporting standards as are U.S. companies.
In addition, there may be difficulty in obtaining or enforcing a court judgment abroad. These risks may be more pronounced to the extent
that the Fund invests a significant amount of its assets in companies located in one region or in emerging markets.
Operational
Risk. The Fund is subject to risks arising from various operational factors, including, but not limited
to, human error, processing and communication errors, errors of the Fund’s service providers, counterparties or other third-parties,
failed or inadequate processes and technology or systems failures. The Fund relies on third parties for a range of services, including
custody. Any delay or failure relating to engaging or maintaining such service providers may affect the Fund’s ability to meet its
investment objective.
Investment
Objective, Policies, Risks and Effects of Leverage (Continued)
First
Trust High Yield Opportunities 2027 Term Fund (FTHY)
May
31, 2023 (Unaudited)
Although
the Fund and the Advisor seek to reduce these operational risks through controls and procedures, there is no way to completely protect
against such risks.
Potential
Conflicts of Interest Risk. First Trust and the portfolio managers have interests which may conflict
with the interests of the Fund. In particular, First Trust currently manages and may in the future manage and/or advise other investment
funds or accounts with the same or substantially similar investment objective and strategies as the Fund. In addition, while the Fund
is using leverage, the amount of the fees paid to First Trust for investment advisory and management services are higher than if the Fund
did not use leverage because the fees paid are calculated based on managed assets. Therefore, First Trust has a financial incentive to
leverage the Fund.
Prepayment
Risk. Loans and corporate bonds are subject to prepayment risk. Prepayment risk is the risk that the
borrower on a loan or issuer of a bond will repay principal (in part or in whole) prior to the scheduled maturity date. The degree to
which such repayment occurs may be affected by general business conditions, interest rates, the financial condition of the borrower or
issuer and competitive conditions among investors, among others. As such, prepayments cannot be predicted with accuracy. Upon a prepayment,
either in part or in full, the actual outstanding debt on which the Fund derives interest income will be reduced which, in turn, may result
in a decline in distributions to common shareholders. The Fund may not be able to reinvest the proceeds received on terms as favorable
as the prepaid loan or bond.
Reinvestment
Risk. Reinvestment risk is the risk that income from the Fund’s portfolio will decline if the
Fund invests the proceeds from matured, traded or called instruments at market interest rates that are below the Fund’s portfolio’s
current earnings rate. A decline in income could affect the common shares’ market price, level of distributions or the overall return
of the Fund.
Second
Lien Loan Risk. A second lien loan may have a claim on the same collateral pool as the first lien or
it may be secured by a separate set of assets. Second lien loans are typically secured by a second priority security interest or lien
on specified collateral securing the borrower’s obligation under the interest. Because second lien loans are second to first lien
loans, they present a greater degree of investment risk. Specifically, these loans are subject to the additional risk that the cash flow
of the borrower and property securing the loan may be insufficient to meet scheduled payments after giving effect to those loans with
a higher priority. In addition, loans that have a lower than first lien priority on collateral of the borrower generally have greater
price volatility than those loans with a higher priority and may be less liquid.
Senior
Loan Risk. The Fund invests in senior loans and therefore is subject to the risks associated therewith.
Investments in senior loans are subject to the same risks as investments in other types of debt securities, including credit risk,
interest rate risk, liquidity risk and valuation risk (which may be heightened because of the limited public information available regarding
senior loans and because loan borrowers may be leveraged and tend to be more adversely affected by changes in market or economic conditions).
Further, no active trading market may exist for certain senior loans, which may impair the ability of the Fund to realize full value
in the event of the need to sell a senior loan and which may make it difficult to value senior loans. Senior loans may not be considered
“securities” and the Fund may not be entitled to rely on the anti-fraud protections of the federal securities laws.
In
the event a borrower fails to pay scheduled interest or principal payments on a senior loan held by the Fund, the Fund will experience
a reduction in its income and a decline in the value of the senior loan, which will likely reduce dividends and lead to a decline in the
net asset value of the Fund’s common shares. If the Fund acquires a senior loan from another lender, for example, by acquiring a
participation, the Fund may also be subject to credit risks with respect to that lender. Although senior loans may be secured by specific
collateral, the value of the collateral may not equal the Fund’s investment when the senior loan is acquired or may decline below
the principal amount of the senior loan subsequent to the Fund’s investment. Also, to the extent that collateral consists of stock
of the borrower or its subsidiaries or affiliates, the Fund bears the risk that the stock may decline in value, be relatively illiquid,
and/or may lose all or substantially all of its value, causing the senior loan to be under collateralized. Therefore, the liquidation
of the collateral underlying a senior loan may not satisfy the issuer’s obligation to the Fund in the event of non-payment of scheduled
interest or principal, and the collateral may not be readily liquidated. The senior loan market has seen a significant increase in loans
with weaker lender protections including, but not limited to, limited financial maintenance covenants or, in some cases, no financial
maintenance covenants (i.e., “covenant-lite loans”) that would typically be included in a traditional loan agreement and general
weakening of other restrictive covenants applicable to the borrower such as limitations on incurrence of additional debt, restrictions
on payments of junior debt or restrictions on dividends and distributions. Weaker lender protections such as the absence of financial
maintenance covenants in a loan agreement and the inclusion of “borrower-favorable” terms may impact recovery values and/or
trading levels of senior loans in the future. The absence of financial maintenance covenants in a loan agreement generally means that
the lender may not be able to declare a default if financial performance deteriorates. This may hinder the Fund’s ability to reprice
credit risk associated with a particular borrower and reduce the Fund’s ability to restructure a problematic loan and mitigate potential
loss. As a result, the Fund’s exposure to losses on investments in senior loans may be increased, especially during a downturn in
the credit cycle or changes in market or economic conditions.
Investment
Objective, Policies, Risks and Effects of Leverage (Continued)
First
Trust High Yield Opportunities 2027 Term Fund (FTHY)
May
31, 2023 (Unaudited)
Valuation
Risk. The valuation of senior loans may carry more risk than that of common stock. Market quotations
may not be readily available for some senior loans and securities in which the Fund invests and valuation may require more research than
for liquid securities. In addition, elements of judgment may play a greater role in the valuation of senior loans and certain other securities
than for securities with a secondary market, because there is less reliable objective data available. These difficulties may lead
to inaccurate asset pricing.
Effects
of Leverage
The
aggregate principal amount of borrowings under the credit agreement (the “Credit Agreement”) with The Toronto-Dominion Bank,
New York Branch represented approximately 17.84% of Managed Assets as of May 31, 2023. Asset coverage with respect to the borrowings under
the Credit Agreement was 560.49% as of May 31, 2023 and the Fund had $192,000,000 of unutilized funds available for borrowing under the
Credit Agreement as of that date. As of May 31, 2023, the maximum commitment amount under the Credit Agreement was $315,000,000. As of
May 31, 2023, the approximate average annual interest and fee rate for the borrowings under the Credit Agreement was 6.56%.
Assuming
that the Fund’s leverage costs remain as described above (at an assumed average annual cost of 6.56%), the annual return that the
Fund’s portfolio must experience (net of expenses) in order to cover its leverage costs would be 1.17%.
The
following table is furnished in response to requirements of the SEC. It is designed to illustrate the effect of leverage on Common Share
total return, assuming investment portfolio total returns (comprised of income and changes in the value of securities held in the Fund’s
portfolio) of (10)%, (5)%, 0%, 5% and 10%. These assumed investment portfolio returns are hypothetical figures and are not necessarily
indicative of the investment portfolio returns experienced or expected to be experienced by the Fund.
The
table further assumes leverage representing 17.84% of the Fund’s Managed Assets, net of expenses, and an annual leverage interest
and fee rate of 6.56%.
|
Assumed Portfolio Total Return (Net of Expenses)
|
-10%
|
-5%
|
0%
|
5%
|
10%
|
|
Common Share Total Return
|
-13.60%
|
-7.51%
|
-1.42%
|
4.66%
|
10.75%
|
Common
Share total return is composed of two elements: the Common Share dividends paid by the Fund (the amount of which is largely determined
by the net investment income of the Fund after paying dividends or interest on its leverage) and gains or losses on the value of the securities
the Fund owns. As required by SEC rules, the table above assumes that the Fund is more likely to suffer capital losses than to enjoy capital
appreciation. For example, to assume a total return of 0% the Fund must assume that the distributions it receives on its investments are
entirely offset by losses in the value of those securities.
Board
of Trustees and Officers
First
Trust High Yield Opportunities 2027 Term Fund (FTHY)
May
31, 2023 (Unaudited)
The
following tables identify the Trustees and Officers of the Fund. Unless otherwise indicated, the address of all persons is 120 East Liberty
Drive, Suite 400, Wheaton, IL 60187.
| Name,
Year of Birth and Position with the Fund |
Term
of Office and Year First Elected or Appointed(1) |
Principal
Occupations
During Past 5 Years |
Number
of Portfolios in the First Trust Fund Complex Overseen by Trustee |
Other
Trusteeships or Directorships Held by Trustee During Past 5 Years |
| INDEPENDENT
TRUSTEES |
Richard
E. Erickson, Trustee
(1951) |
• Three Year Term
• Since Fund Inception |
Physician,
Edward-Elmhurst Medical Group; Physician and Officer, Wheaton Orthopedics (1990 to 2021) |
231
|
None
|
Thomas
R. Kadlec, Trustee
(1957) |
• Three Year Term
• Since Fund Inception |
Retired;
President, ADM Investor Services, Inc. (Futures Commission Merchant) (2010 to July 2022) |
231
|
Director,
National Futures Association and ADMIS Singapore Ltd.; Formerly, Director of ADM Investor Services, Inc., ADM Investor Services International,
ADMIS Hong Kong Ltd., and Futures Industry Association |
Denise
M. Keefe, Trustee
(1964) |
• Three Year Term
• Since 2021 |
Executive
Vice President, Advocate Aurora Health and President, Advocate Aurora Continuing Health Division (Integrated Healthcare System) |
231
|
Director
and Board Chair of Advocate Home Health Services, Advocate Home Care Products and Advocate Hospice; Director and Board Chair of Aurora
At Home (since 2018); Director of Advocate Physician Partners Accountable Care Organization; Director of RML Long Term Acute Care Hospitals;
Director of Senior Helpers (since 2021); and Director of MobileHelp (since 2022) |
Robert
F. Keith, Trustee
(1956) |
• Three Year Term
• Since Fund Inception |
President,
Hibs Enterprises (Financial and Management Consulting) |
231
|
Formerly,
Director of Trust Company of Illinois |
Niel
B. Nielson, Trustee
(1954) |
• Three Year Term
• Since Fund Inception |
Senior
Advisor (2018 to Present), Managing Director and Chief Operating Officer (2015 to 2018), Pelita Harapan Educational Foundation (Educational
Products and Services) |
231
|
None
|
| (1)
|
Currently,
Richard E. Erickson and Thomas R. Kadlec, as Class I Trustees, are serving as trustees until the Fund’s 2023 annual meeting of shareholders.
Denise M. Keefe and Niel B. Nielson, as Class II Trustees, are serving as trustees until the Fund’s 2024 annual meeting of shareholders.
James A. Bowen and Robert F. Keith, as Class III Trustees, are serving as trustees until the Fund’s 2025 annual meeting of shareholders.
|
Board
of Trustees and Officers (Continued)
First
Trust High Yield Opportunities 2027 Term Fund (FTHY)
May
31, 2023 (Unaudited)
| Name,
Year of Birth and Position with the Fund |
Term
of Office and Year First Elected or Appointed(1) |
Principal
Occupations
During Past 5 Years |
Number
of Portfolios in the First Trust Fund Complex Overseen by Trustee |
Other
Trusteeships or Directorships Held by Trustee During Past 5 Years |
| INTERESTED
TRUSTEE |
James
A. Bowen(2), Trustee and
Chairman of the Board
(1955)
|
• Three Year Term
• Since Fund Inception |
Chief
Executive Officer, First Trust Advisors L.P. and First Trust Portfolios L.P.; Chairman of the Board of Directors, BondWave LLC (Software
Development Company) and Stonebridge Advisors LLC (Investment Advisor) |
231
|
None
|
| Name
and Year of Birth |
Position
and Offices with Fund |
Term
of Office and Length of Service |
Principal
Occupations
During Past 5 Years |
| OFFICERS(3)
|
James
M. Dykas
(1966) |
President
and Chief Executive Officer |
• Indefinite
Term
• Since Fund Inception |
Managing
Director and Chief Financial Officer, First Trust Advisors L.P. and First Trust Portfolios L.P.; Chief Financial Officer, BondWave LLC
(Software Development Company) and Stonebridge Advisors LLC (Investment Advisor) |
Donald
P. Swade
(1972) |
Treasurer,
Chief Financial Officer and Chief Accounting Officer |
• Indefinite
Term
• Since Fund Inception |
Senior
Vice President, First Trust Advisors L.P. and First Trust Portfolios L.P. |
W.
Scott Jardine
(1960) |
Secretary
and Chief Legal Officer |
• Indefinite
Term
• Since Fund Inception |
General
Counsel, First Trust Advisors L.P. and First Trust Portfolios L.P.; Secretary and General Counsel, BondWave LLC; Secretary, Stonebridge
Advisors LLC |
Daniel
J. Lindquist
(1970) |
Vice
President |
• Indefinite
Term
• Since Fund Inception |
Managing
Director, First Trust Advisors L.P. and First Trust Portfolios L.P. |
Kristi
A. Maher
(1966) |
Chief
Compliance Officer and Assistant Secretary |
• Indefinite
Term
• Since Fund Inception |
Deputy
General Counsel, First Trust Advisors L.P. and First Trust Portfolios L.P. |
| (1)
|
Currently,
Richard E. Erickson and Thomas R. Kadlec, as Class I Trustees, are serving as trustees until the Fund’s 2023 annual meeting of shareholders.
Denise M. Keefe and Niel B. Nielson, as Class II Trustees, are serving as trustees until the Fund’s 2024 annual meeting of shareholders.
James A. Bowen and Robert F. Keith, as Class III Trustees, are serving as trustees until the Fund’s 2025 annual meeting of shareholders.
|
| (2)
|
Mr.
Bowen is deemed an “interested person” of the Fund due to his position as CEO of First Trust Advisors L.P., investment advisor
of the Fund. |
| (3)
|
The
term “officer” means the president, vice president, secretary, treasurer, controller or any other officer who performs a policy
making function. |
Privacy
Policy
First
Trust High Yield Opportunities 2027 Term Fund (FTHY)
May
31, 2023 (Unaudited)
Privacy
Policy
First
Trust values our relationship with you and considers your privacy an important priority in maintaining that relationship. We are committed
to protecting the security and confidentiality of your personal information.
Sources
of Information
We
collect nonpublic personal information about you from the following sources:
| •
|
Information
we receive from you and your broker-dealer, investment professional or financial representative through interviews, applications, agreements
or other forms; |
| •
|
Information
about your transactions with us, our affiliates or others; |
| •
|
Information
we receive from your inquiries by mail, e-mail or telephone; and |
| •
|
Information
we collect on our website through the use of “cookies.” For example, we may identify the pages on our website that your browser
requests or visits. |
Information
Collected
The
type of data we collect may include your name, address, social security number, age, financial status, assets, income, tax information,
retirement and estate plan information, transaction history, account balance, payment history, investment objectives, marital status,
family relationships and other personal information.
Disclosure
of Information
We
do not disclose any nonpublic personal information about our customers or former customers to anyone, except as permitted by law. In addition
to using this information to verify your identity (as required under law), the permitted uses may also include the disclosure of such
information to unaffiliated companies for the following reasons:
| •
|
In
order to provide you with products and services and to effect transactions that you request or authorize, we may disclose your personal
information as described above to unaffiliated financial service providers and other companies that perform administrative or other services
on our behalf, such as transfer agents, custodians and trustees, or that assist us in the distribution of investor materials such as trustees,
banks, financial representatives, proxy services, solicitors and printers. |
| •
|
We
may release information we have about you if you direct us to do so, if we are compelled by law to do so, or in other legally limited
circumstances (for example to protect your account from fraud). |
In
addition, in order to alert you to our other financial products and services, we may share your personal information within First Trust.
Use
of Website Analytics
We
currently use third party analytics tools, Google Analytics and AddThis, to gather information for purposes of improving First Trust’s
website and marketing our products and services to you. These tools employ cookies, which are small pieces of text stored in a file by
your web browser and sent to websites that you visit, to collect information, track website usage and viewing trends such as the number
of hits, pages visited, videos and PDFs viewed and the length of user sessions in order to evaluate website performance and enhance navigation
of the website. We may also collect other anonymous information, which is generally limited to technical and web navigation information
such as the IP address of your device, internet browser type and operating system for purposes of analyzing the data to make First Trust’s
website better and more useful to our users. The information collected does not include any personal identifiable information such
as your name, address, phone number or email address unless you provide that information through the website for us to contact you in
order to answer your questions or respond to your requests. To find out how to opt-out of these services click on: Google
Analytics and AddThis.
Confidentiality
and Security
With
regard to our internal security procedures, First Trust restricts access to your nonpublic personal information to those First Trust employees
who need to know that information to provide products or services to you. We maintain physical, electronic and procedural safeguards to
protect your nonpublic personal information.
Policy
Updates and Inquiries
As
required by federal law, we will notify you of our privacy policy annually. We reserve the right to modify this policy at any time, however,
if we do change it, we will tell you promptly. For questions about our policy, or for additional copies of this notice, please go to www.ftportfolios.com,
or contact us at 1-800-621-1675 (First Trust Portfolios) or 1-800-222-6822 (First Trust Advisors).
March
2023
INVESTMENT
ADVISOR
First
Trust Advisors L.P.
120
East Liberty Drive, Suite 400
Wheaton,
IL 60187
ADMINISTRATOR,
FUND ACCOUNTANT, AND
CUSTODIAN
The
Bank of New York Mellon
240
Greenwich Street
New
York, NY 10286
TRANSFER
AGENT
Computershare,
Inc.
P.O.
Box 505000
Louisville,
KY 40233
INDEPENDENT
REGISTERED
PUBLIC ACCOUNTING FIRM
Deloitte
& Touche LLP
111
South Wacker Drive
Chicago,
IL 60606
LEGAL
COUNSEL
Chapman
and Cutler LLP
320
South Canal Street
Chicago,
IL 60606
Item 2. Code of Ethics.
| (a) |
|
The registrant, as of the end of the period covered by this report, has adopted a code of ethics that applies
to the registrant’s principal executive officer, principal financial officer, principal accounting officer or controller, or persons
performing similar functions, regardless of whether these individuals are employed by the registrant or a third party. |
| (c) |
|
There have been no amendments, during the period covered by this report, to a provision of the code of ethics
that applies to the registrant’s principal executive officer, principal financial officer, principal accounting officer or controller,
or persons performing similar functions, regardless of whether these individuals are employed by the registrant or a third party, and
that relates to any element of the code of ethics description. |
| (d) |
|
The registrant has not granted any waivers, including an implicit waiver, from a provision of the code of
ethics that applies to the registrant’s principal executive officer, principal financial officer, principal accounting officer or
controller, or persons performing similar functions, regardless of whether these individuals are employed by the registrant or a third
party, that relates to one or more of the items set forth in paragraph (b) of this item’s instructions. |
| (f) |
|
A copy of the code of ethics that applies to the registrant’s principal executive officer, principal
financial officer, principal accounting officer or controller is filed as an exhibit pursuant to Item 13(a)(1). |
Item 3. Audit Committee Financial Expert.
As of the end of the period covered by the report,
the registrant’s board of trustees has determined that Thomas R. Kadlec and Robert F. Keith are qualified to serve as audit committee
financial experts serving on its audit committee and that each of them is “independent,” as defined by Item 3 of Form N-CSR.
Item 4. Principal Accountant Fees and Services.
(a) AUDIT FEES (REGISTRANT) --
The aggregate fees billed for each of the last two fiscal years for professional services rendered by the principal accountant for the
audit of the registrant’s annual financial statements or services that are normally provided by the accountant in connection with
statutory and regulatory filings or engagements were $43,125 for 2022 and $49,000 for 2023.
(b) AUDIT-RELATED FEES (REGISTRANT)
-- The aggregate fees billed in each of the last two fiscal years for assurance and related services by the principal accountant that
are reasonably related to the performance of the audit of the registrant’s financial statements and are not reported under paragraph
(a) of this Item were $0 for 2022 and $0 for 2023.
AUDIT-RELATED FEES (INVESTMENT
ADVISOR) -- The aggregate fees billed in each of the last two fiscal years of the registrant for assurance and related services by the
principal accountant that are reasonably related to the performance of the audit of the registrant’s financial statements and are
not reported under paragraph (a) of this Item were $0 for 2022 and $0 for 2023.
(c) TAX FEES (REGISTRANT) -- The
aggregate fees billed in each of the last two fiscal years for professional services rendered by the principal accountant for tax compliance,
tax advice, and tax planning to the registrant were $16,272 for 2022 and $14,023 for 2023. These fees were for tax consultation and/or
tax return preparation and professional services rendered for PFIC (Passive Foreign Investment Company) Identification Services.
TAX FEES (INVESTMENT ADVISOR)
-- The aggregate fees billed in each of the last two fiscal years of the registrant for professional services rendered by the principal
accountant for tax compliance, tax advice, and tax planning to the registrant’s advisor were $0 for 2022 and $0 for 2023.
(d) ALL OTHER FEES (REGISTRANT)
-- The aggregate fees billed in each of the last two fiscal years for products and services provided by the principal accountant to the
registrant, other than the services reported in paragraphs (a) through (c) of this Item were $0 for 2022 and $0 for 2023.
ALL OTHER FEES (INVESTMENT ADVISOR)
-- The aggregate fees billed in each of the last two fiscal years for products and services provided by the principal accountant to the
registrant’s investment advisor, other than services reported in paragraphs (a) through (c) of this Item were $0 for 2022 and $0
for 2023.
(e)(1) Disclose the audit committee’s
pre-approval policies and procedures described in paragraph (c)(7) of Rule 2-01 of Regulation S-X.
Pursuant to its charter
and its Audit and Non-Audit Services Pre-Approval Policy, the Audit Committee (the “Committee”) is responsible for
the pre-approval of all audit services and permitted non-audit services (including the fees and terms thereof) to be performed for the
registrant by its independent auditors. The Chairman of the Committee is authorized to give such pre-approvals on behalf of the Committee
up to $25,000 and report any such pre-approval to the full Committee.
The Committee is also
responsible for the pre-approval of the independent auditor’s engagements for non-audit services with the registrant’s advisor
(not including a sub-advisor whose role is primarily portfolio management and is sub-contracted or overseen by another investment advisor)
and any entity controlling, controlled by or under common control with the investment advisor that provides ongoing services to the registrant,
if the engagement relates directly to the operations and financial reporting of the registrant, subject to the de minimis exceptions
for non-audit services described in Rule 2-01 of Regulation S-X. If the independent auditor has provided non-audit services to the registrant’s
advisor (other than any sub-advisor whose role is primarily portfolio management and is sub-contracted with or overseen by another investment
advisor) and any entity controlling, controlled by or under common control with the investment advisor that provides ongoing services
to the registrant that were not pre-approved pursuant to its policies, the Committee will consider whether the provision of such non-audit
services is compatible with the auditor’s independence.
|
(e)(2) |
The percentage of services described in each of paragraphs (b) through (d) for the registrant and the registrant’s
investment advisor of this Item that were approved by the audit committee pursuant to the pre-approval exceptions included in paragraph
(c)(7)(i)(c) or paragraph (c)(7)(ii) of Rule 2-01 of Regulation S-X are as follows: |
| |
Registrant: |
|
Advisor and Distributor: |
|
| |
(b) 0% |
|
(b) 0% |
|
| |
(c) 0% |
|
(c) 0% |
|
| |
(d) 0% |
|
(d) 0% |
|
|
(f) |
The percentage of hours expended on the principal accountant’s engagement to audit the registrant’s
financial statements for the most recent fiscal year that were attributed to work performed by persons other than the principal accountant’s
full-time, permanent employees was less than fifty percent. |
|
(g) |
The aggregate non-audit fees billed by the registrant’s accountant for services rendered to the registrant,
and rendered to the registrant’s investment advisor (not including any sub-advisor whose role is primarily portfolio management
and is subcontracted with or overseen by another investment advisor), and any entity controlling, controlled by, or under common control
with the advisor that provides ongoing services to the registrant for the fiscal period ended May 31, 2022 were $16,272 for the registrant
and $16,500 for the registrant’s investment advisor and for the fiscal year ended May 31, 2023 were $14,023 for the registrant and
$31,000 for the registrant’s investment advisor. |
|
(h) |
The registrant’s audit committee of its board of trustees determined that the provision of non-audit
services that were rendered to the registrant’s investment advisor (not including any sub-advisor whose role is primarily portfolio
management and is subcontracted with or overseen by another investment advisor), and any entity controlling, controlled by, or under common
control with the investment advisor that provides ongoing services to the registrant that were not pre-approved pursuant to paragraph
(c)(7)(ii) of Rule 2-01 of Regulation S-X is compatible with maintaining the principal accountant’s independence. |
Item 5. Audit Committee of Listed Registrants.
| (a) |
|
The registrant has a separately designated standing audit committee established in accordance with Section
3(a)(58)(A) of the Securities Exchange Act of 1934 consisting of all the independent directors of the registrant. The audit committee
of the registrant is comprised of: Richard E. Erickson, Thomas R. Kadlec, Denise M. Keefe, Robert F. Keith and Niel B. Nielson. |
Item 6. Investments.
|
(a) |
Schedule of Investments in securities of unaffiliated issuers as of the close of the reporting period is included as part of the report
to shareholders filed under Item 1 of this form. |
Item 7. Disclosure of Proxy Voting
Policies and Procedures for Closed-End Management Investment Companies.
The Proxy Voting Policies are attached herewith.
Item 8. Portfolio Managers of Closed-End Management Investment
Companies.
(a)(1) Identification of Portfolio Manager(s) or Management
Team Members and Description of Role of Portfolio Manager(s) or Management Team Members
Information provided as of August 4, 2023
The First Trust Advisors Leveraged Finance
Investment team manages a portfolio comprised primarily of U.S. dollar denominated high yield bonds and senior secured floating-rate loans.
The Portfolio Managers are responsible for directing the investment activities within the Fund. William Housey is the Senior Portfolio
Manager and has primary responsibility for investment decisions. Jeff Scott assists Mr. Housey and there are also Senior Credit Analysts
assigned to certain industries. The Portfolio Managers are supported in their portfolio management activities by the First Trust Advisors
Leveraged Finance investment team, including a team of credit analysts, designated traders, and operations personnel. Senior Credit Analysts
are assigned industries and Associate Credit Analysts support the Senior Credit Analysts. All credit analysts, operations personnel and
portfolio managers report to Mr. Housey.
William Housey, CFA
Managing Director of Fixed Income, Senior Portfolio
Manager
Mr. Housey joined First Trust Advisors L.P. in June
2010 as the Senior Portfolio Manager for the Leveraged Finance Investment Team and has 27 years of investment experience. Mr. Housey
is a Managing Director of Fixed Income and is also a member of the First Trust Strategic Model Investment Committee and the Fixed Income
Sub-Committee. Prior to joining First Trust, Mr. Housey was at Morgan Stanley Investment Management and its wholly owned subsidiary,
Van Kampen Funds, Inc. for 11 years where he last served as Executive Director and Co-Portfolio Manager. Mr. Housey has extensive
experience in the portfolio management of both leveraged and unleveraged credit products, including senior loans, high-yield bonds, credit
derivatives and corporate restructurings. Mr. Housey received a B.S. in Finance from Eastern Illinois University and an M.B.A. in
Finance as well as Management and Strategy from Northwestern University’s Kellogg School of Business. He also holds the FINRA Series
7, Series 52 and Series 63 licenses. Mr. Housey also holds the Chartered Financial Analyst designation. He is a member of
the CFA Institute and the CFA Society of Chicago. Mr. Housey also serves on the Village of Glen Ellyn, IL Police Pension Board.
Jeffrey Scott, CFA
Senior Vice President and Portfolio Manager
Mr. Scott is a Portfolio Manager and a Sector Specialist
Credit Analyst for the Leveraged Finance Investment Team at First Trust Advisors L.P. He has 33 years of experience in the investment
management industry and has extensive experience in credit analysis, product development, and product management. Prior to joining First
Trust, Jeff served as an Assistant Portfolio Manager and as a Senior Credit Analyst for Morgan Stanley/Van Kampen from October 2008 to
June 2010. As Assistant Portfolio Manager, Jeff served on a team that managed over $4.0 billion of Senior Loan assets in three separate
funds: Van Kampen Senior Loan Fund; Van Kampen Senior Income Trust; and Van Kampen Dynamic Credit Opportunities Fund. His responsibilities
included assisting with portfolio construction, buy and sell decision making, and monitoring fund liquidity and leverage. Mr. Scott earned
a B.S. in Finance and Economics from Elmhurst College and an M.B.A. with specialization in Analytical Finance and Econometrics and Statistics
from the University of Chicago. He also holds the Chartered Financial Analyst designation and is a member of the CFA Institute and the
CFA Society of Chicago.
(a)(2) Other Accounts Managed by Portfolio
Manager(s) or Management Team Member and Potential Conflicts of Interest
Information provided as of May 31,
2023
| Name
of Portfolio Manager or Team Member |
Type
of Accounts |
Total
# of Accounts
Managed* |
Total
Assets |
#
of Accounts Managed for which Advisory Fee is
Based on Performance |
Total
Assets for which Advisory Fee is Based on Performance |
| |
|
|
|
|
|
| 1. William Housey, CFA |
Registered Investment Companies: |
6 |
$4.849B |
0 |
$0 |
| |
Other Pooled Investment Vehicles: |
0 |
$0 |
0 |
$0 |
| |
Other Accounts: |
0 |
$0 |
0 |
$0 |
| |
|
|
|
|
|
| 2. Jeffrey Scott CFA |
Registered Investment Companies: |
6 |
$4.849B |
0 |
$0 |
| |
Other Pooled Investment Vehicles: |
0 |
$0 |
0 |
$0 |
| |
Other Accounts: |
0 |
$0 |
0 |
$0 |
* Information excludes the registrant.
Potential Conflicts of Interests
Potential conflicts
of interest may arise when a portfolio manager of the Registrant has day-to-day management responsibilities with respect to one or more
other funds or other accounts. The First Trust Advisors Leveraged Finance Investment Team adheres to its trade allocation policy utilizing
a pro-rata methodology to address this conflict.
First Trust and its
affiliate, First Trust Portfolios L.P. (“FTP”), have in place a joint Code of Ethics and Insider Trading Policies and Procedures
that are designed to (a) prevent First Trust personnel from trading securities based upon material inside information in the possession
of such personnel and (b) ensure that First Trust personnel avoid actual or potential conflicts of interest or abuse of their positions
of trust and responsibility that could occur through such activities as front running securities trades for the Registrant. Personnel
are required to have duplicate confirmations and account statements delivered to First Trust and FTP compliance personnel who then compare
such trades to trading activity to detect any potential conflict situations. In addition to the personal trading restrictions specified
in the Code of Ethics and Insider Trading Policies and Procedures, employees in the First Trust Advisors Leveraged Finance Investment
Team are prohibited from buying or selling equity securities (including derivative instruments such as options, warrants and futures)
and corporate bonds for their personal account and in any accounts over which they exercise control. Employees in the First Trust Advisors
Leveraged Finance Investment Team are also prohibited from engaging in any personal transaction while in possession of material non-public
information regarding the security or the issuer of the security. First Trust and FTP also maintain a restricted list of all issuers for
which the First Trust Advisors Leveraged Finance Investment Team has material non-public information in its possession and all transactions
executed for a product advised or supervised by First Trust or FTP are compared daily against the restricted list.
|
(a)(3) |
Compensation Structure of Portfolio Manager(s) or Management Team Members |
Information provided as of May 31,
2023
The compensation structure
for internal portfolio managers is based upon a fixed salary as well as a discretionary bonus determined by the management of FTA. Salaries
are determined by management and are based upon an individual’s position and overall value to the firm. Bonuses are also determined
by management and are generally based upon an individual’s or team’s overall contribution to the success of the firm, assets
under management and the profitability of the firm. Certain internal portfolio managers have an indirect ownership stake in the firm and
will therefore receive their allocable share of ownership related distributions.
|
(a)(4) |
Disclosure of Securities Ownership as of May 31, 2023 |
|
Name of Portfolio Manager or
Team
Member |
Dollar ($) Range of Fund
Shares Beneficially Owned |
|
William Housey |
$100,001 - $500,000 |
|
Jeffrey Scott |
$10,001-$50,000 |
Item 9. Purchases of Equity Securities
by Closed-End Management Investment Company and Affiliated Purchasers.
Not applicable.
Item 10. Submission of Matters to a Vote of Security Holders.
There have been no material changes to the
procedures by which the shareholders may recommend nominees to the registrant’s board of directors, where those changes were implemented
after the registrant last provided disclosure in response to the requirements of Item 407(c)(2)(iv) of Regulation S-K (17 CFR 229.407)
(as required by Item 22(b)(15) of Schedule 14A (17 CFR 240.14a-101)), or this Item.
Item 11. Controls and Procedures.
|
(a) |
The registrant’s principal executive and principal financial officers, or persons performing similar
functions, have concluded that the registrant’s disclosure controls and procedures (as defined in Rule 30a-3(c) under the Investment
Company Act of 1940, as amended (the “1940 Act”) (17 CFR 270.30a-3(c))) are effective, as of a date within 90 days of the
filing date of the report that includes the disclosure required by this paragraph, based on their evaluation of these controls and procedures
required by Rule 30a-3(b) under the 1940 Act (17 CFR 270.30a-3(b)) and Rules 13a-15(b) or 15d-15(b) under the Securities Exchange Act
of 1934, as amended (17 CFR 240.13a-15(b) or 240.15d-15(b)). |
|
(b) |
There were no changes in the registrant’s internal control over financial reporting (as defined in Rule
30a-3(d) under the 1940 Act (17 CFR 270.30a-3(d)) that occurred during the period covered by this report that has materially affected,
or is reasonably likely to materially affect, the registrant’s internal control over financial reporting. |
Item 12. Disclosure of Securities
Lending Activities for Closed-End Management Investment Companies.
Not applicable.
Item 13. Exhibits.
SIGNATURES
Pursuant to the requirements of the Securities Exchange
Act of 1934 and the Investment Company Act of 1940, the registrant has duly caused this report to be signed on its behalf by the undersigned,
thereunto duly authorized.
| (registrant) |
|
First Trust High Yield Opportunities
2027 Term Fund |
| By (Signature and Title)* |
|
/s/ James M. Dykas |
| |
|
James M. Dykas, President and Chief Executive Officer
(principal executive officer) |
Pursuant
to the requirements of the Securities Exchange Act of 1934 and the Investment Company Act of 1940, this report has been signed below by
the following persons on behalf of the registrant and in the capacities and on the dates indicated.
| By (Signature and Title)* |
|
/s/ James M. Dykas |
| |
|
James M. Dykas, President and Chief Executive Officer
(principal executive officer) |
| By (Signature and Title)* |
|
/s/ Donald P. Swade |
| |
|
Donald P. Swade, Treasurer, Chief Financial Officer
and Chief Accounting Officer
(principal financial
officer) |
* Print the name and title of each signing officer under his
or her signature.