UNITED STATES
SECURITIES AND EXCHANGE COMMISSION
WASHINGTON, D.C. 20549
FORM 10-K
(Mark One)
ANNUAL REPORT PURSUANT TO SECTION 13 OR 15(d) OF THE SECURITIES EXCHANGE ACT OF 1934 | |
For the fiscal year ended June 30, 2020
OR
TRANSITION REPORT PURSUANT TO SECTION 13 OR 15(d) OF THE SECURITIES EXCHANGE ACT OF 1934 | |
For the transition period from to
Commission File Number 1-5828
(Exact name of registrant as specified in its charter)
(State or other jurisdiction of incorporation or organization) | (I.R.S. Employer Identification No.) | ||
(Address of principal executive offices) | (Zip Code) | ||
(Registrant’s telephone number, including area code)
Securities registered pursuant to Section 12(b) of the Act:
Title of each class | Trading Symbol | Name of each exchange on which registered | ||
Securities registered pursuant to 12(g) of the Act: None
Indicate by check mark if the registrant is a well-known seasoned issuer, as defined in Rule 405 of the Securities Act.
Indicate by check mark if the registrant is not required to file reports pursuant to Section 13 or Section 15(d) of the Act.
Yes ☐ No ☒
Indicate by check mark whether the registrant (1) has filed all reports required to be filed by Section 13 or 15(d) of the Securities Exchange Act of 1934 during the preceding 12 months (or for such shorter period that the registrant was required to file such reports), and (2) has been subject to the filing requirements for at least the past 90 days.
Indicate by check mark whether the registrant has submitted electronically every Interactive Data File required to be submitted pursuant to Rule 405 of Regulation S-T during the preceding 12 months (or for such shorter period that the registrant was required to post such files)
Indicate by check mark whether the registrant is a large accelerated filer, an accelerated filer, a non-accelerated filer, a smaller reporting company or an emerging growth company. See the definitions of “large accelerated filer,” “accelerated filer,” “smaller reporting company” and “emerging growth company” in Rule 12b-2 of the Exchange Act.
☒ | Accelerated filer | ☐ | ||
Non-accelerated filer | ☐ | (Do not check if a smaller reporting company) | Smaller reporting company | |
Emerging growth company | ||||
If an emerging growth company, indicate by check mark if the registrant has elected not to use the extended transition period for complying with any new or revised financial accounting standards provided pursuant to Section 13(a) of the Exchange Act. ☐
Indicate by check mark whether the registrant has filed a report on and attestation to its management’s assessment of the effectiveness of its internal control over financial reporting under Section 404(b) of the Sarbanes-Oxley Act (15 U.S.C. 7262(b)) by the registered public accounting firm that prepared or issued its audit report. ☒
Indicate by check mark whether the registrant is a shell company (as defined in Rule 12b-2 of the Exchange Act).
Yes ☐ No ☒
The aggregate market value of the registrants’ voting common stock held by non-affiliates at December 31, 2019 was $2,379,338,145 , based on the closing price per share of the registrant’s common stock on that date of $49.78 as reported on the New York Stock Exchange.
As of August 24, 2020, 47,946,758 shares of the registrant’s common stock were outstanding.
DOCUMENTS INCORPORATED BY REFERENCE
Selected portions of the Company’s fiscal year 2020 definitive Proxy Statement are incorporated by reference into Part III of this Report.
TABLE OF CONTENTS
Page Number | |||
PART I
Item 1. Business
(a) General Development of Business:
Carpenter Technology Corporation, founded in 1889, is engaged in the manufacturing, fabrication and distribution of specialty metals. As used throughout this report, unless the context requires otherwise, the terms “Carpenter”, “Carpenter Technology”, “Company”, “Registrant”, “Issuer”, “we” and “our” refer to Carpenter Technology Corporation.
(b) Financial Information About Segments:
We are organized in two reportable business segments: Specialty Alloys Operations (“SAO”) and Performance Engineered Products (“PEP”). See Note 20 to our consolidated financial statements included in Item 8. “Financial Statements and Supplementary Data” for additional segment reporting information.
(c) Narrative Description of Business:
(1) General:
We are a recognized leader in high-performance specialty alloy-based materials and process solutions for critical applications in the aerospace, defense, medical, transportation, energy, industrial and consumer end-use markets. We have evolved to become a pioneer in premium specialty alloys, including titanium, nickel, and cobalt, as well as alloys specifically engineered for additive manufacturing processes and soft magnetics applications. We have expanded our additive manufacturing capabilities to provide a complete “end-to-end” solution to accelerate materials innovation and streamline parts production.
Reportable Segments
The SAO segment is comprised of the Company’s major premium alloy and stainless steel manufacturing operations. This includes operations performed at mills primarily in Reading and Latrobe, Pennsylvania and surrounding areas as well as South Carolina and Alabama. The combined assets of the SAO segment are managed in an integrated manner to optimize efficiency and profitability across the total system.
The PEP segment is comprised of the Company’s differentiated operations. This segment includes the Dynamet titanium business, the Carpenter Powder Products business, the Amega West business, the Carpenter Additive business and the Latrobe and Mexico distribution businesses. The businesses in the PEP segment are managed with an entrepreneurial structure to promote speed and flexibility and drive overall revenue and profit growth.
(2) Raw Materials:
Our business depends on continued receipt of critical raw materials for our day to day operations. These raw materials include nickel, cobalt, chromium, manganese, molybdenum, titanium, iron and scrap containing the named alloys. Some of the sources of these raw materials, many of which are international, could be subject to potential interruptions of supply as a result of political events, labor unrest or other reasons. These potential interruptions could cause material shortages and affect availability and price. We have arrangements with certain vendors to provide consigned materials at our manufacturing facilities available for our consumption as necessary.
We have long-term relationships with major suppliers who provide availability of material at competitive prices. Purchase prices of certain raw materials have historically been volatile. We use pricing surcharges, indexing mechanisms, base price adjustments and raw material forward contracts to reduce the impact on our business of changing prices for the most significant of these materials. There can be delays between the time of the increase in the price of raw materials and the realization of the benefits of such mechanisms or actions that could have a short-term impact on our results and could affect the comparability of our results from period to period.
2
(3) Patents and Licenses:
We own a number of United States and international patents and have granted licenses under some of them. In addition, certain products that we produce are covered by patents held or owned by other companies from whom licenses have been obtained. The duration of a patent issued in the United States is between 14 and 20 years from the date of filing a patent application or issuance of the patents. The durations of patents issued outside of the United States varies from country to country. Generally, patent licenses are structured to match the duration of the underlying patent. Although these patents and licenses are believed to be of value, we do not consider our business to be materially dependent upon any single such item or related group of such items.
(4) Seasonality of Business:
Our sales are normally influenced by seasonal factors. Historically, our sales in the first two fiscal quarters (the respective three months ending September 30 and December 31) are typically the lowest, principally because of annual plant vacation and maintenance shutdowns by us, as well as by many of our customers. However, the timing of major changes in the general economy or the markets for certain products, such as the widespread economic impact of the global COVID-19 pandemic in the third and fourth quarters of fiscal year 2020, can alter this historical pattern.
The chart below summarizes the percent of net sales by quarter for the past three fiscal years:
Quarter Ended | 2020 | 2019 | 2018 | ||||||
September 30, | 27 | % | 24 | % | 22 | % | |||
December 31, | 26 | 23 | 22 | ||||||
March 31, | 27 | 26 | 27 | ||||||
June 30, | 20 | 27 | 29 | ||||||
100 | % | 100 | % | 100 | % | ||||
(5) Customers:
On a consolidated basis, we are not dependent upon a single customer, or very few customers, such that the loss of any one or more particular customers would have a materially adverse effect on our consolidated statement of income. One customer, Howmet Aerospace Inc. (formerly Arconic Inc.), accounted for approximately 10 percent, 11 percent and 12 percent of net sales for the years ended June 30, 2020, 2019 and 2018, respectively. No single customer accounted for 10 percent or more of the accounts receivable outstanding at June 30, 2020. Approximately 12 percent of the accounts receivable outstanding at June 30, 2019 was due from one customer, Howmet Aerospace Inc. See Note 20 to our consolidated financial statements included in Item 8. “Financial Statements and Supplementary Data” for additional information.
(6) Backlog:
As of June 30, 2020, we had a sales backlog of orders excluding surcharge, believed to be firm, of approximately $539 million, substantially all of which is expected to be shipped within fiscal year 2021. Our backlog of orders excluding surcharge as of June 30, 2019 was approximately $800 million.
3
(7) Competition:
We are leaders in specialty materials for critical applications with over 130 years of metallurgical and manufacturing expertise. Our business is highly competitive. We manufacture and supply materials to a variety of end-use market sectors and compete with various companies depending on the end-use market, product or geography. A significant portion of the products we produce are highly engineered materials for demanding applications. There are less than ten companies producing one or more similar products that we consider our major competitors for our high-value products used in demanding applications, particularly in our Aerospace and Defense and Energy end-use markets. These products are generally required to meet complex customer product specifications and often require the materials to be qualified prior to supplying the customer. Our experience, technical capabilities, product offerings and research and development efforts represent barriers to existing and potential competitors.
For other products, there are several dozen smaller producing companies and converting companies that are also competitors, as well as several hundred independent distributors of products similar to those distributed by us. Additionally, numerous foreign companies produce various specialty metal products similar to those produced by us. Furthermore, a number of different products may, in certain instances, be substituted for our finished products.
(8) Research, Product and Process Development:
Our expenditures for company-sponsored research and development were $28.0 million, $23.3 million and $19.3 million in fiscal years 2020, 2019 and 2018, respectively. We believe that our ability to be an innovator in special material development and manufacturing processes has been and will continue to be an important factor in the success of the Company. Our worldwide staff of expert metallurgists, research and development scientists, engineers and service professionals work closely with our customers to identify and provide innovative solutions to specific product requirements.
(9) Environmental Regulations:
We are subject to various stringent federal, state, local and international environmental laws and regulations relating to pollution, protection of public health and the environment, natural resource damages and occupational safety and health. Management evaluates the liability for future environmental remediation costs on a quarterly basis. We accrue amounts for environmental remediation costs representing management’s best estimate of the probable and reasonably estimable costs relating to environmental remediation. For further information on environmental remediation, see the Contingencies section included in Item 7. “Management’s Discussion and Analysis of Financial Condition and Results of Operations” and the notes to our consolidated financial statements included in Item 8. “Financial Statements and Supplementary Data”.
Our costs of maintaining and operating environmental control equipment were $15.4 million, $15.6 million and $13.0 million for fiscal years 2020, 2019 and 2018, respectively. The capital expenditures for environmental control equipment were $0.1 million, $1.7 million and $1.2 million for fiscal years 2020, 2019 and 2018, respectively. We anticipate spending approximately $2.3 million on domestic environmental capital projects over the next five fiscal years. This includes approximately $1.1 million in fiscal year 2021. Due to the possibility of future regulatory developments, the amount of future capital expenditures may vary from these estimates.
(10) Employees:
As of June 30, 2020, our total workforce consisted of approximately 4,600 employees, which included approximately 190 production employees in Washington, Pennsylvania, who are covered under a collective bargaining agreement which expires on August 31, 2022, and approximately 500 employees in Latrobe, Pennsylvania who are covered under a collective bargaining agreement which expires on August 1, 2023. In July 2020, a union election was held involving 85 employees at our Franklin, Pennsylvania location and a majority of the employees voted for union representation. Negotiations with union representatives for an initial agreement are expected to be initiated in the near future. We believe our relations with our employees are generally good.
4
(d) Financial information about foreign and domestic operations and export sales:
Sales outside of the United States, including export sales, were $787.7 million, $773.5 million and $728.3 million in fiscal years 2020, 2019 and 2018, respectively. Long-lived assets held outside of the United States were $21.8 million and $30.6 million as of June 30, 2020 and 2019, respectively. For further information on domestic and international sales, see Note 20 to our consolidated financial statements included in Item 8. “Financial Statements and Supplementary Data”.
(e) Available Information:
Our Board of Directors has adopted a Code of Ethics for the Chief Executive Officer and Chief Financial Officer of Carpenter Technology Corporation, which is also applicable to our other executive officers. There were no waivers of the Code of Ethics in fiscal year 2020. The Code of Ethics and any information regarding any waivers of the Code of Ethics are disclosed on Carpenter’s website at www.carpentertechnology.com. Our annual reports on Form 10-K, quarterly reports on Form 10-Q and current reports on Form 8-K filed or furnished pursuant to Section 13(a) or 15(d) of the Securities Exchange Act of 1934 are available free of charge through our website as soon as reasonably practicable after we electronically file such material with, or furnish such material to, the Securities and Exchange Commission (“SEC”). Our website and the content contained therein or connected thereto are not intended to be incorporated into this Annual Report on Form 10-K.
The SEC maintains an Internet site that contains reports, proxy and other information regarding issuers that file electronically. Such information can be accessed through the Internet at www.sec.gov.
Item 1A. Risk Factors
There are inherent risks and uncertainties associated with all businesses that could adversely affect operating performances or financial conditions. The following discussion outlines the risks and uncertainties that management believes are the most material to our business. However, these are not the only risks or uncertainties that could affect our business. Certain risks are associated specifically with our business, industry or customer base, while others have a broader effect.
Our results of operations have been adversely affected and could in the future be materially adversely impacted by the global COVID-19 pandemic.
The global spread of the COVID-19 pandemic has created significant economic volatility, uncertainty and disruption. The extent to which the COVID-19 pandemic impacts our business, operations, financial results and financial position will depend on numerous evolving factors that we may not be able to accurately predict, including: the duration and scope of the pandemic; our efforts and efforts by governmental authorities to mitigate the COVID-19 pandemic, such as travel bans, shelter in place orders and business closures, and the related impact on resource allocations and manufacturing and supply chains; the impact of the pandemic on economic activity and actions taken in response; the effect on our customers’ demand for our goods and services and our vendors ability to supply us with raw materials; the impact of providing a safe working environment to our employees, our ability to sell and provide our goods and services, which may be limited as a result of travel restrictions and people working from home; the ability of our customers to pay for our goods and services; and any closures of our offices and facilities and our customers’ offices and facilities. Customers may also slow down decision-making, delay planned work or seek to terminate existing agreements.
Our results may also be impacted by our status as a “critical”, “essential” or “life-sustaining” business in light of COVID-19 business closure laws, orders and guidance being challenged by a governmental body or other applicable authority; and our ability to execute our business continuity, operational, budget and fiscal plans in light of the COVID-19 pandemic.
Further, the effects of the pandemic may also increase our cost of capital or make additional capital, including a future refinancing of our credit facility, more difficult to obtain or available only on terms less favorable to us. A sustained downturn may also result in the carrying value of our goodwill or other intangible assets exceeding their fair value, which may require us to recognize a further impairment to those assets. A sustained downturn in the financial markets and asset values may have the effect of increasing our pension funding obligations in order to ensure that our qualified pension plans continue to be adequately funded, which may divert cash flow from other uses.
5
Cyber-attacks and other malicious internet-based activity continue to increase generally, and cloud-based platform providers of software and services have been targeted. Due to the COVID-19 pandemic, many of our employees are temporarily working remotely, which may pose additional data security risks.
Management is actively monitoring the impact of the global situation on our financial condition, liquidity, operations, suppliers, industry, and workforce. Given the daily evolution of the COVID-19 pandemic and the global responses to curb its spread, we are not able to fully and precisely estimate the effects of the COVID-19 pandemic on our results of operations, financial condition, or liquidity in a particular future quarter or year. Any of these events could cause or contribute to the risks and uncertainties and could materially adversely affect our business, financial condition, results of operations and/or stock price.
The demand for certain products we produce may be cyclical.
Demand in our end-use markets can be cyclical in nature and sensitive to general economic conditions, competitive influences and fluctuations in inventory levels throughout the supply chain. As such, our results of operations, financial condition, cash flows and availability of credit could fluctuate significantly from period to period.
A significant portion of our sales represents products sold to customers in the commercial aerospace and defense and energy markets. The cyclicality of those markets can adversely affect our current business and our expansion objectives.
The commercial aerospace and defense market is historically cyclical due to both external and internal market factors. These factors include general economic conditions, airline profitability, consumer demand for air travel, varying fuel and labor costs, price competition and international and domestic political conditions such as military conflict and the threat of terrorism. The length and degree of cyclical fluctuation can be influenced by any one or combination of these factors and therefore are difficult to predict with certainty. A downturn in the commercial aerospace and defense industry would adversely affect the demand for our products and/or the prices at which we are able to sell our products; our results of operations and financial condition could be materially adversely affected. The uncertainty regarding the return to service of the Boeing 737 MAX aircraft and the related supply chain disruption may continue to adversely affect our results of operations and financial condition.
The energy market has also been historically cyclical, principally as a result of volatile oil prices that impact demand for our products. Our future success requires us to, among other things, expand in key international energy markets by successfully adding to our customer base, distribution channels and product portfolio. The volatility of oil prices and other factors that contribute to the cyclicality of the energy market will impact our ability to expand successfully in this area and may adversely affect our results of operations and financial condition.
Any significant delay or inability to successfully expand our operations in a timely and cost-effective manner could materially adversely affect our business, financial condition and results of operations.
Over the last few years, we have undertaken capital projects associated with expanding our production capacity and capability. These projects place a significant demand on management and operational resources. Our success in expanding our operations in a cost-effective manner depends upon numerous factors including the ability of management to ensure the necessary resources are in place to properly execute these projects, our ability to obtain the necessary internal and customer qualifications to produce material from the facilities and our ability to operate the facilities to maximize the potential opportunities with minimal impacts to our existing operations. If we are not able to achieve the anticipated results from our capital expansion projects, or if we incur unanticipated delays, including those caused by COVID-19 disruptions, or excess costs, our results of operations and financial position may be materially adversely affected.
Periods of reduced demand and excess supply as well as the availability of substitute lower cost materials can adversely affect our ability to price and sell our products at the profitability levels we require to be successful.
Additional worldwide capacity and reduced demand for our products could significantly impact future worldwide pricing which would adversely impact our results of operations and financial condition. In addition, continued availability of lower cost, substitute materials may cause significant fluctuations in future results as our customers opt for a lower cost alternative.
6
We change prices on our products as we deem necessary. In addition to the above general competitive impact, other market conditions and various economic factors beyond our control can adversely affect the timing of our pricing actions. The effects of any pricing actions may be delayed due to long manufacturing lead times or the terms of existing contracts. There is no guarantee that the pricing actions we implement will be effective in maintaining the Company’s profit margin levels.
We rely on third parties to supply certain raw materials and supplies that are critical to the manufacture of our products and we may not be able to access alternative sources of these raw materials if the suppliers are unwilling or unable to meet our demand.
Costs of certain critical raw materials, such as nickel, cobalt, chromium, manganese, molybdenum, titanium, iron and scrap containing these alloys have been volatile due to factors beyond our control. We expect to mitigate most of the adverse impact of rising raw material costs through raw material surcharges, indices to customers and raw material forward contracts, but changes in business conditions could adversely affect our ability to recover rapid increases in raw material costs and may adversely affect our results of operations.
In addition, the availability of critical raw materials and supplies is subject to factors that are not in our control. In some cases, these critical raw materials and supplies are purchased from suppliers operating in countries that may be subject to unstable political and economic conditions. At any given time, we may be unable to obtain an adequate supply of these critical raw materials and supplies on a timely basis, at prices and other terms acceptable to us, or at all.
If suppliers increase the price of critical raw materials or are unwilling or unable to meet our demand, we may not have alternative sources of supply. In addition, to the extent that we have quoted prices to customers and accepted customer orders for products prior to purchasing necessary raw materials, or have existing contracts, we may be unable to raise the price of products to cover all or part of the increased cost of the raw materials to our customers.
The manufacture of some of our products is a complex process and requires long lead times. As a result, we may experience delays or shortages in the supply of raw materials. If unable to obtain adequate and timely receipts of required raw materials, we may be unable to timely manufacture sufficient quantities of products. This could cause us to lose sales, incur additional costs, delay new product introductions or suffer harm to our reputation.
We provide benefits to active and retired employees throughout most of our Company, most of which are not covered by insurance; and thus, our financial condition can be adversely affected if our investment returns are insufficient to meet these obligations.
We have obligations to provide substantial benefits to active and retired employees, and most of the associated costs are paid by the Company and are not covered by insurance. In addition, certain employees are covered by defined benefit pension plans, with the majority of our plans covering employees in the United States. Benefits accrued to eligible participants of our largest qualified defined benefit pension plan and certain non-qualified pension plans were frozen effective December 31, 2016. Many domestic and international competitors do not provide defined benefit plans and/or retiree health care plans, and other international competitors operate in jurisdictions with government sponsored health care plans that may offer them a cost advantage. A decline in the value of plan investments in the future, an increase in costs or liabilities or unfavorable changes in laws or regulations that govern pension plan funding could materially change the timing and amount of required pension funding. A requirement to accelerate or increase pension contributions in the future could have a material adverse effect on our results of operations, cash flows and financial condition.
The extensive environmental, health and safety regulatory regimes applicable to our manufacturing operations create potential exposure to significant liabilities.
The nature of our manufacturing business subjects our operations to numerous and varied federal, state, local and international laws and regulations relating to pollution, protection of public health and the environment, natural resource damages and occupational safety and health. We have used, and currently use and manufacture, substantial quantities of substances that are considered hazardous, extremely hazardous or toxic under worker safety and health laws and regulations. Although we implement controls and procedures designed to reduce continuing risk of adverse impacts and health and safety issues, we could incur substantial cleanup costs, fines and civil or criminal sanctions, third party property damage or personal injury claims as a result of violations, non-compliance or liabilities under these regulatory regimes required at our facilities.
7
We have environmental remediation liabilities at some of our owned operating facilities and have been designated as a potentially responsible party (“PRP”) with respect to certain third party Superfund or similar waste disposal sites and other third party owned sites. Additionally, we have been notified that we may be a PRP with respect to other Superfund sites as to which no proceedings have been instituted against us. From time to time, we are a party to lawsuits and other proceedings involving alleged violations of, or liabilities arising from, environmental laws.
When our liability is probable and we can reasonably estimate our costs, we record environmental liabilities in our financial statements. However, in many cases, we are not able to determine whether we are liable, or if liability is probable, in order to reasonably estimate the loss or range of loss which could result from such environmental liabilities. Estimates of our liability remain subject to additional uncertainties, including the nature and extent of site contamination, available remediation alternatives, the extent of corrective actions that may be required, and the number and financial condition of other PRPs, as well as the extent of their responsibility for the remediation. We adjust our accruals to reflect new information as appropriate. Future adjustments could have a material adverse effect on our results of operations in a given period, but we cannot reliably predict the amounts of such future adjustments. Future developments, administrative actions or liabilities relating to environmental matters could have a material adverse effect on our financial condition, cash flows or results of operations.
Our manufacturing processes, and the manufacturing processes of many of our suppliers and customers, are energy intensive and generate carbon dioxide and other “Greenhouse Gases”, and pending legislation or regulation of Greenhouse Gases, if enacted or adopted in an onerous form, could have a material adverse impact on our results of operations, financial condition and cash flows.
Political and scientific debates related to the impacts of greenhouse gas emissions on the global climate are prevalent. Regulation or some form of legislation aimed at reducing the greenhouse gas emissions is currently being considered both in the United States and globally. As a specialty alloy manufacturer, we will be affected, both directly and indirectly, if climate change legislation, such as use of a “cap and trade” system, is enacted and implemented. Such legislation could have a material adverse impact on our results of operations, financial condition and cash flows.
Product liability and product quality claims could adversely affect our operating results.
We produce ultra-high strength, high temperature and corrosion-resistant alloys designed for our customers’ demanding applications particularly in our Aerospace and Defense, Energy and Medical end-use markets. Failure of the materials that are included in our customers’ applications could give rise to substantial product liability claims. There can be no assurance that our insurance coverage will be adequate or continue to be available on terms acceptable to us. We have a complex manufacturing process necessary to meet our customers’ stringent product specifications. We are also required to adhere to various third party quality certifications and perform sufficient internal quality reviews to ensure compliance with established standards. If we fail to meet the customer specifications for their products, we may be subject to product quality costs and claims. These costs are generally not insured. The impacts of product liability and quality claims could have a material adverse impact on our results of operations, financial condition and cash flows.
Our business subjects us to risks of litigation claims, as a routine matter, and this risk increases the potential for a loss that might not be covered by insurance.
Litigation claims relate to the conduct of our currently and formerly owned businesses, including claims pertaining to product liability, commercial disputes, employment actions, employee benefits, compliance with domestic and international laws and regulations, personal injury, patent infringement and tax issues. Due to the uncertainties of litigation, we can give no assurance that we will prevail on claims made against us in the lawsuits that we currently face or that additional claims will not be made against us in the future. The outcome of litigation cannot be predicted with certainty, and some of these lawsuits, claims or proceedings may be determined adversely to us. The resolution in any reporting period of one or more of these matters could have a material adverse effect on our results of operations for that period. We can give no assurance that any other matters brought in the future will not have a material adverse effect on our results of operations, financial condition and cash flows.
8
A portion of our workforce is covered by collective bargaining agreements and union attempts to organize our other employees may cause work interruptions or stoppages.
Approximately 190 production employees at our Dynamet business unit located in Washington, Pennsylvania are covered by a collective bargaining agreement. This agreement expires in August 2022. Approximately 500 production employees at our Latrobe business unit located in Latrobe, Pennsylvania are covered by a collective bargaining agreement which expires August 1, 2023. In July 2020, a union election was held involving 85 employees at our Franklin, Pennsylvania location and a majority of the employees voted for union representation. Negotiations with union representatives for an initial agreement are expected to be initiated in the near future. There can be no assurance that we will succeed in concluding collective bargaining agreements with the unions to replace those that expire which could result in work interruptions and stoppages. From time to time, the employees at our manufacturing facility in Reading, Pennsylvania, participate in election campaigns or union organizing attempts. There is no guarantee that future organization attempts will not result in union representation.
Our manufacturing processes are complex and depend upon critical, high cost equipment for which there may be only limited or no production alternatives.
It is possible that we could experience prolonged periods of reduced production due to unplanned equipment failures, and we could incur significant repair or replacement costs in the event of those failures. It is also possible that operations could be disrupted due to other unforeseen circumstances such as power outages, explosions, fires, floods, accidents and severe weather conditions. We must make regular, substantial capital investments and changes to our manufacturing processes to lower production costs, improve productivity, manufacture new or improved products and remain competitive. We may not be in a position to take advantage of business opportunities or respond to competitive pressures if we fail to update, replace or make additions to our equipment or our manufacturing processes in a timely manner. The cost to repair or replace much of our equipment or facilities would be significant. We cannot be certain that we will have sufficient internally generated cash or acceptable external financing to make necessary capital expenditures in the future.
A significant portion of our manufacturing and production facilities are located in Reading and Latrobe, Pennsylvania and Athens, Alabama, which increases our exposure to significant disruption to our business as a result of unforeseeable developments in these geographic areas.
It is possible that we could experience prolonged periods of reduced production due to unforeseen catastrophic events occurring in or around our manufacturing facilities in Reading and Latrobe, Pennsylvania and Athens, Alabama. As a result, we may be unable to shift manufacturing capabilities to alternate locations, accept materials from suppliers, meet customer shipment needs or address other severe consequences that may be encountered. Our financial condition, cash flows and results of operations could be materially adversely affected.
We rely on third parties to supply energy consumed at each of our energy-intensive production facilities.
The prices for and availability of electricity, natural gas, oil and other energy resources are subject to volatile market conditions. These market conditions often are affected by political and economic factors beyond our control. Disruptions or lack of availability in the supply of energy resources could temporarily impair the ability to operate our production facilities. Further, increases in energy costs, or changes in costs relative to energy costs paid by competitors, have affected and may continue to adversely affect our profitability. To the extent that these uncertainties cause suppliers and customers to be more cost sensitive, increased energy prices may have an adverse effect on our results of operations, financial condition and cash flows.
9
We consider acquisitions, joint ventures and other business combination opportunities, as well as possible business unit dispositions, as part of our overall business strategy, that involve uncertainties and potential risks that we cannot predict or anticipate fully.
From time to time, management holds discussions with management of other companies to explore such aforementioned opportunities. As a result, the relative makeup of the businesses comprising our Company is subject to change. Acquisitions, joint ventures and other business combinations involve various inherent risks. Such risks include difficulties in integrating the operations, technologies, products and personnel of the acquired companies, diversion of management’s attention from existing operations, difficulties in entering markets in which we have limited or no direct prior experience, dependence on unfamiliar supply chains, insufficient revenues to offset increased expenses associated with acquisitions, loss of key employees of the acquired companies, inaccurate assessment of undisclosed liabilities, difficulties in realizing projected efficiencies, synergies and cost savings, and increases in our debt or limitation on our ability to access additional capital when needed.
Regulations related to conflict minerals could adversely impact our business.
The SEC has promulgated final rules mandated by the Dodd-Frank Act regarding disclosure of the use of tin, tantalum, tungsten and gold, known as conflict minerals, in products manufactured by public companies. These rules require due diligence to determine whether such minerals originated from the Democratic Republic of Congo (the “DRC”) or an adjoining country and whether such minerals helped finance the armed conflict in the DRC. The Company timely filed its latest annual conflict minerals report required by the rules on May 22, 2020. There are costs associated with complying with these disclosure requirements going forward, including costs to determine the origin of conflict minerals used in our products. In addition, the implementation of these rules could adversely affect the sourcing, supply and pricing of materials used in our products. Also, we may face disqualification as a supplier for customers and reputational challenges if the due diligence procedures we continue to implement do not enable us to verify the origins for all conflict minerals or to determine that such minerals are DRC conflict-free.
Our business may be impacted by external factors that we may not be able to control.
War, civil conflict, terrorism, natural disasters and public health issues including domestic or international pandemic have caused and could cause damage or disruption to domestic or international commerce by creating economic or political uncertainties. Additionally, the volatility in the financial markets could negatively impact our business. These events could result in a decrease in demand for our products, affect the availability of credit facilities to us, our customers or other members of the supply chain necessary to transact business, make it difficult or impossible to deliver orders to customers or receive materials from suppliers, affect the availability or pricing of energy sources or result in other severe consequences that may or may not be predictable. As a result, our business, financial condition and results of operations could be materially adversely affected.
Our international operations and global sales expose us to various risks including the impact of tariffs, which may adversely affect our business.
Risks associated with international operations include without limitation: political and economic instability, including weak conditions in the world’s economies; difficulty in collecting accounts receivable; unstable or unenforced export controls; changes in legal and regulatory requirements; policy changes affecting the markets for our products; changes in duties, quotas, tariffs and taxes; changes in taxation including the ability to repatriate earnings; and exchange rate fluctuations (which may affect sales to international customers and the value of profits earned on international sales when converted into U.S. dollars). In addition, we will need to invest in building our capabilities and infrastructure to meet our international growth goals. Any of these factors could materially adversely affect our results for the period in which they occur.
Significant changes to United States and international trade policies continue to emerge and activity levels have increased with regard to new import and export tariffs, retaliatory tariffs, and quotas; modifications to international trade policy; the withdrawal from or renegotiation of certain trade agreements; and other changes. These changes could materially adversely impact our business or require us to make changes to our current business practices or supply chain. We also continue to evaluate the potential effect of Brexit, the United Kingdom’s planned departure from the European Union, on our business operations and financial results.
10
We value most of our inventory using the LIFO method, which could be repealed resulting in adverse effects on our cash flows and financial condition.
The cost of our inventories is primarily determined using the Last-In, First-Out (“LIFO”) method. Under the LIFO inventory valuation method, changes in the cost of raw materials and production activities are recognized in cost of sales in the current period even though these materials and other costs may have been incurred at significantly different values due to the length of time of our production cycle. Generally, in a period of rising prices, LIFO recognizes higher costs of goods sold, which both reduces current income and assigns a lower value to the year-end inventory. From time to time, there have been proposals aimed at repealing the election to use the LIFO method for income tax purposes. According to these proposals, generally taxpayers that currently use the LIFO method would be required to revalue their LIFO inventory to its First-In, First-Out (“FIFO”) value. As of June 30, 2020, if the FIFO method of inventory had been used instead of the LIFO method, our inventories would have been approximately $135 million higher. This increase in inventory would result in a one-time increase in taxable income which may be taken into account over the following several taxable years. The repeal of the LIFO method could result in a substantial tax liability which could adversely impact our cash flows and financial condition.
We depend on the retention of key personnel.
Much of our future success depends on the continued service and availability of skilled personnel, including members of our executive management team, management, metallurgists and production positions. The loss of key personnel could adversely affect our ability to perform until suitable replacements are found.
Cybersecurity attacks and other security breaches or failures in functionality of our information technology (“IT”) and computer systems could adversely impact our financial condition and results of operations and compromise the integrity of confidential data.
Management relies extensively on IT infrastructure, including hardware, network, software, people and processes, to provide useful information to conduct our business and support assessments and conclusions about operating performance. Our inability to produce relevant and/or reliable measures of operating performance in an efficient, cost-effective and well-controlled fashion may have significant negative impacts on our future operations. In addition, any material failure, interruption of service, or compromised data security could adversely affect our operations. Security breaches in our information technology could result in theft, destruction, loss, misappropriation or release of confidential data or intellectual property which could adversely impact our future results.
We are regularly the target of attempted cyber and other security threats and must continuously monitor and develop our IT networks and infrastructure to prevent, detect, address and mitigate the risk of unauthorized access, misuse, computer viruses and other events that could have a security impact. Cybersecurity attacks are evolving in both frequency and sophistication and could be made by both internal and external individuals or groups with an extensive range of motives. If we are unable to prevent cybersecurity attacks and other information security breaches, we may encounter significant disruptions in our operations which could adversely impact our business, financial condition and results of operations or result in the unauthorized disclosure of confidential information. Such breaches may also harm our reputation, result in financial losses or subject us to litigation or other costs or penalties.
We are in the process of implementing a new enterprise resource planning system and problems with the design or implementation of this system could interfere with our business and operations.
We are engaged in a multi-year implementation of a global enterprise resource planning ("ERP") system which is planned to be deployed in phases. The new ERP system will replace multiple current business systems and is being designed to improve manufacturing planning, development and processes, accurately maintain books and records, record transactions and provide important information of the operations of our business to our management. The implementation of the new ERP system has required, and will continue to require, the investment of significant financial resources as well as a considerable allocation of personnel for the project. While we have invested, and continue to invest, significant resources in planning and project management, implementation issues may arise during the course of implementing the ERP system, and it is possible that we may experience significant delays, increased costs and other difficulties that are not presently contemplated. Any disruptions, delays or deficiencies in the design and implementation of the new ERP system could adversely affect our financial condition and results of operations.
11
The carrying value of goodwill and other long-lived assets may not be recoverable.
Goodwill and other long-lived assets including property, plant and equipment and other intangible assets are recorded at fair value on the date of acquisition. We review these assets at least annually for impairment. Impairment may result from, among other things, deterioration in performance, adverse market conditions, adverse changes in applicable laws or regulations and a variety of other factors. Any future impairment of goodwill or other long-lived assets could have a material adverse effect on our results of operations.
Our ability to produce timely and accurate financial statements may be impacted if we fail to maintain an effective system of disclosure controls and internal control over financial reporting.
We are subject to the reporting requirements of the Sarbanes-Oxley Act of 2002 (“Sarbanes-Oxley”). Sarbanes-Oxley requires, among other things, that we maintain effective disclosure controls and procedures and internal control over financial reporting. We are also required to make a formal assessment and provide an annual management report on the effectiveness of our internal control over financial reporting, which must be attested to by our independent registered public accounting firm. In order to maintain the effectiveness of our disclosure controls and procedures and internal control over financial reporting, we have expended, and anticipate that we will continue to expend, resources, including accounting-related costs and management oversight.
As disclosed in Item 8. of our Annual Report on Form 10-K for fiscal year ended June 30, 2019 under the caption “Management’s Report on Internal Control Over Financial Reporting”, we identified a material weakness related to the accuracy and completeness of the data inputs for price, quantity and related customer data during the billing process. There were no misstatements identified in our annual or interim consolidated financial statements. A material weakness is a deficiency, or combination of deficiencies, in internal control over financial reporting, such that there is a reasonable possibility that a material misstatement of the annual or interim financial statements will not be prevented or detected on a timely basis.
During the fiscal year ended June 30, 2020 we implemented changes to our internal control over financial reporting to remediate the material weakness, and the material weakness has been remediated as of June 30, 2020. We cannot assure, however, that remediation efforts will continue to be effective, and the enhanced controls and procedures could require increased management time, attention, and resources.
Item 1B. Unresolved Staff Comments
None.
Item 2. Properties
The principal locations of our primary domestic integrated mills in our SAO segment are located in Reading and Latrobe, Pennsylvania and Athens, Alabama. In addition, SAO manufactures large diameter hollow bar in Orwigsburg, Pennsylvania and Elyria, Ohio and operates a mini mill manufacturing stainless steel bar and wire in Hartsville, South Carolina. The principal locations for PEP businesses include titanium alloy production facilities located in Washington, Pennsylvania and Clearwater, Florida, powder products manufacturing facilities in Bridgeville, Pennsylvania, Athens, Alabama, and Bruceton Mills, West Virginia, additive manufacturing facilities in Camarillo, California and Liverpool, United Kingdom and a facility in Houston, Texas for manufacturing of machined components used in the drilling, exploration and production of oil and gas. The PEP segment includes one owned service center in White House, Tennessee. Properties also include domestic leased warehouses and service centers located in Houston, San Antonio and Midland, Texas; Lafayette, Louisiana; Washington and Imperial, Pennsylvania; Vienna, Ohio and Chicago, Illinois.
The Reading, Hartsville, Washington, Bridgeville, Orwigsburg, Elyria, Latrobe, Houston and Athens facilities are owned. The Clearwater facility is owned, but the land is leased.
We also own or lease manufacturing facilities, distribution centers, service centers and sales offices in a number of foreign countries, including Belgium, Canada, China, Mexico, Singapore, Sweden, Taiwan, the United Arab Emirates and the United Kingdom.
Our corporate offices, located in Philadelphia, Pennsylvania, are leased.
12
Our plants, customer service centers and distribution centers were acquired or leased at various times over several years. There is an active maintenance program to ensure a safe operating environment and to keep facilities in good condition. In addition, we have an active capital spending program to replace equipment as needed to keep it technologically competitive on a worldwide basis. We believe our facilities are in good condition and suitable for our business needs.
Item 3. Legal Proceedings
From time to time, we are a party to lawsuits and other proceedings involving alleged violations of, or liabilities arising from, environmental laws. We have environmental remediation liabilities at some of our owned operating facilities and have been designated as a PRP with respect to certain third party Superfund or similar waste disposal sites and other third party owned sites. Additionally, we have been notified that we may be a PRP with respect to other Superfund sites as to which no proceedings have been instituted against us. Estimates of the amount and timing of future costs of environmental remediation requirements are inherently imprecise because of the continuing evolution of environmental laws and regulatory requirements, the availability and application of technology, the identification of currently unknown remediation sites and the allocation of costs among the PRPs. Based upon information currently available, such future costs are not expected to have a material effect on our financial position, results of operations or cash flows over the long-term. However, such costs could be material to our financial position, results of operations or cash flows in a particular future quarter or year.
In addition, from time to time, we are a party to certain routine claims and legal actions and other contingent liabilities incident to the normal course of business which pertain to litigation, product claims, commercial disputes, employment actions, employee benefits, compliance with domestic and foreign laws and regulations, personal injury claims, patent infringement and tax issues. Based on information currently available, the ultimate resolution of our known contingencies, individually or in the aggregate and including the matters described in Note 13 to the consolidated financial statements in this Form 10-K, is not expected to have a material adverse effect on our financial position, cash flows or results of operations. However, there can be no assurance that an increase in the scope of pending matters or that any future lawsuits, claims, proceedings or investigations will not be material to our financial position, results of operations or cash flows in a particular future quarter or year.
See the “Contingencies” section included in Item 7. “Management’s Discussion and Analysis of Financial Condition and Results of Operation”, and the “Contingencies and Commitments” section included in Note 13 to our consolidated financial statements included in Item 8. “Financial Statements and Supplementary Data”, included in this Form 10-K, the contents of which are incorporated by reference to this Item 3.
Item 4. Mine Safety Disclosures
Not applicable.
Item 4A. Executive Officers of the Registrant
Listed below are the names of our corporate executive officers, including those required to be listed as executive officers for SEC purposes, each of whom assumes office after the annual organization meeting of the Board of Directors which immediately follows the Annual Meeting of Stockholders.
Tony R. Thene was appointed President and Chief Executive Officer effective July 1, 2015. Mr. Thene joined Carpenter Technology in January 2013 and served as the Senior Vice President and Chief Financial Officer. Prior to joining Carpenter Technology, Mr. Thene was employed for 23 years by Alcoa Inc., a leading producer of primary and fabricated aluminum, holding various management positions.
Timothy Lain was appointed Senior Vice President and Chief Financial Officer effective August 11, 2020. Mr. Lain joined Carpenter Technology in June 2007. From June 2013 to September 2018 he served as the Vice President-Controller and Chief Accounting Officer. He served as the Vice President and Chief Financial Officer from September 2018 until August 2020. Prior to joining the Company, Mr. Lain served as Audit Director at McGladrey & Pullen LLP, a certified public accounting firm.
13
James D. Dee was appointed Senior Vice President, General Counsel and Secretary effective August 11, 2020. Mr. Dee served as Vice President, General Counsel and Secretary from September 2010 until August 2020. Mr. Dee joined Carpenter Technology from C&D Technologies where he last served as Senior Vice President, General Counsel, Secretary and Chief Administrative Officer. Prior to his tenure at C&D Technologies, Mr. Dee was employed by the law firm of Montgomery, McCracken, Walker & Rhodes, LLP. Mr. Dee also worked 16 years at SPS Technologies, Inc., where he last served as Vice President, General Counsel and Secretary.
Brian J. Malloy was appointed Senior Vice President and Chief Commercial Officer effective August 11, 2020. Mr. Malloy joined Carpenter Technology in August 2015 as Vice President, Sales & Customer Service for SAO. He served as Vice President and Chief Commercial Officer from March 2016 until August 2020. Prior to joining Carpenter Technology, Mr. Malloy worked for Global Precision Tubes where he was the Senior Vice President & Chief Strategy Officer. During Mr. Malloy's two years in this role, he was responsible for business development, strategy and the commercial organizations. Mr. Malloy's previous experience includes key roles at Alcoa, Inc., where his last position was Vice President, Commercial for Industrial Gas Turbines in the Power and Propulsion business unit.
On June 4, 2020, Michael Murtagh resigned as Vice President and Group President – Specialty Alloys Operations (SAO) of Carpenter Technology, effective June 30, 2020, in conjunction with the Company's reduction of total global salaried positions. Mr. Murtagh will remain an employee of the Company through August 31, 2020.
Assumed Present Position | ||||||
Name | Age | Position | ||||
Tony R. Thene | 59 | President and Chief Executive Officer | July 2015 | |||
Timothy Lain | 48 | Senior Vice President and Chief Financial Officer | August 2020 | |||
James D. Dee | 63 | Senior Vice President, General Counsel and Secretary | August 2020 | |||
Brian J. Malloy | 53 | Senior Vice President and Chief Commercial Officer | August 2020 | |||
14
PART II
Item 5. Market for Registrant’s Common Equity, Related Stockholder Matters and Issuer Purchases of Equity Securities
Our common stock is listed on the New York Stock Exchange (“NYSE”) and traded under the symbol “CRS”. The following table sets forth, for the periods indicated, the high and low prices for our common stock as reported by the NYSE:
Fiscal Year 2020 | Fiscal Year 2019 | |||||||||||||||
Period Ended: | High | Low | High | Low | ||||||||||||
September 30, | $ | 55.88 | $ | 44.13 | $ | 60.78 | $ | 51.52 | ||||||||
December 31, | $ | 53.95 | $ | 48.41 | $ | 60.11 | $ | 32.77 | ||||||||
March 31, | $ | 49.48 | $ | 14.87 | $ | 48.88 | $ | 34.40 | ||||||||
June 30, | $ | 29.27 | $ | 17.92 | $ | 53.00 | $ | 40.04 | ||||||||
Annual June 30, | $ | 55.88 | $ | 14.87 | $ | 60.78 | $ | 32.77 | ||||||||
The range of our common stock price on the NYSE from July 1, 2020 to August 24, 2020 was $20.60 to $24.75. The closing price of the common stock was $21.43 on August 24, 2020.
We have paid quarterly cash dividends on our common stock since 1906. We paid a quarterly dividend of $0.20 per share of common stock during each quarter of fiscal years 2020 and 2019, respectively.
As of August 24, 2020, there were 1,903 common stockholders of record.
Information regarding Securities Authorized for Issuance under Equity Compensation Plans is set forth in Item 12 hereto “Security Ownership of Certain Beneficial Owners and Management and Related Stockholder Matters”.
15
Cumulative Total Stockholder Return
The graph below compares the cumulative total stockholder return on our common stock to the cumulative total return of the S&P MidCap 400 Index, the most widely used index for mid-sized companies, and our Peer Group for fiscal year ended June 30, 2020, and prior four fiscal years. The cumulative total return assumes an investment of $100 on June 30, 2015 and the reinvestment of any dividends during the period. Our Peer Group consists of the companies in the Russell RSCC Materials & Processing Growth Index. We believe the companies included in our Peer Group, taken as a whole, provide a more meaningful comparison in terms of product offerings, markets served, competition and other relevant factors. The total stockholder return for the peer group is weighted according to the respective issuer’s stock market capitalization at the beginning of each period.
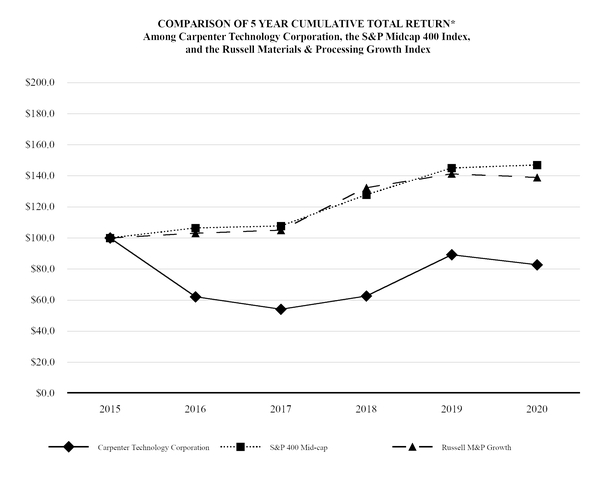
* $100 invested on June 30, 2015 in stock or index, including reinvestment of dividends. Fiscal years ending June 30. |
Data Sourced from Bloomberg |
Copyright © 2020 S&P Dow Jones Indices LLC, a division of S&P Global |
Copyright © 2020 Russell Investments |
2015 | 2016 | 2017 | 2018 | 2019 | 2020 | |||||||||||||||||||
Carpenter Technology Corporation | $ | 100.00 | $ | 62.10 | $ | 54.10 | $ | 62.60 | $ | 89.20 | $ | 82.70 | ||||||||||||
S&P Midcap 400 | $ | 100.00 | $ | 106.40 | $ | 107.80 | $ | 127.80 | $ | 145.00 | $ | 147.00 | ||||||||||||
Russell Materials & Processing Growth | $ | 100.00 | $ | 103.10 | $ | 105.00 | $ | 132.40 | $ | 141.30 | $ | 139.00 | ||||||||||||
Issuer Purchases of Equity Securities
During the fourth quarter of fiscal year 2020, employees surrendered 27,130 shares to the Company, at an average purchase price of $24.39, for the payment of the minimum tax liability withholding obligations upon the vesting of shares of restricted stock. We do not consider this a share buyback program.
16
Item 6. Selected Financial Data
The following selected financial data is qualified by reference to, and should be read in conjunction with, the Consolidated Financial Statements, including the notes thereto, and Management’s Discussion and Analysis of Financial Condition and Results of Operations included elsewhere in this Form 10-K.
Five-Year Financial Summary
in millions, except per share data
(Fiscal years ended June 30,)
2020 (a) | 2019 (b) | 2018 (c) | 2017 (d) | 2016 (e)(f) | ||||||||||||||||
Summary of Operations: | ||||||||||||||||||||
Net sales | $ | 2,181.1 | $ | 2,380.2 | $ | 2,157.7 | $ | 1,797.6 | $ | 1,813.4 | ||||||||||
Operating income | $ | 25.3 | $ | 241.4 | $ | 189.3 | $ | 121.5 | $ | 70.8 | ||||||||||
Net income | $ | 1.5 | $ | 167.0 | $ | 188.5 | $ | 47.0 | $ | 11.3 | ||||||||||
Financial Position at Year-End: | ||||||||||||||||||||
Cash and cash equivalents | $ | 193.1 | $ | 27.0 | $ | 56.2 | $ | 66.3 | $ | 82.0 | ||||||||||
Total assets | $ | 3,227.2 | $ | 3,187.8 | $ | 3,007.0 | $ | 2,878.1 | $ | 2,794.3 | ||||||||||
Long-term debt, net of current portion | $ | 551.8 | $ | 550.6 | $ | 545.7 | $ | 550.0 | $ | 611.3 | ||||||||||
Per Common Share: | ||||||||||||||||||||
Net earnings: | ||||||||||||||||||||
Basic | $ | 0.02 | $ | 3.46 | $ | 3.96 | $ | 0.99 | $ | 0.23 | ||||||||||
Diluted | $ | 0.02 | $ | 3.43 | $ | 3.92 | $ | 0.99 | $ | 0.23 | ||||||||||
Cash dividend-common | $ | 0.80 | $ | 0.80 | $ | 0.72 | $ | 0.72 | $ | 0.72 | ||||||||||
Weighted Average Common Shares Outstanding: | ||||||||||||||||||||
Basic | 48.1 | 47.7 | 47.2 | 47.0 | 48.1 | |||||||||||||||
Diluted | 48.2 | 48.1 | 47.6 | 47.1 | 48.2 | |||||||||||||||
(a) Fiscal year 2020 included $34.6 million of goodwill impairment charges, $29.3 million of inventory write-downs from restructuring and $68.5 million of restructuring and asset impairment charges related to exiting the oil and gas business in our PEP segment, the closure of two domestic powder facilities, a twenty percent global salaried workforce reduction and other asset impairments. See Note 2 in the Notes to the Consolidated Financial Statements included in Item 8 “Financial Statements and Supplementary Data” of this report.
(b) Fiscal year 2019 included $1.2 million of acquisition-related costs related to LPW Technology Ltd. See Note 5 in the Notes to the Consolidated Financial Statements included in Item 8. “Financial Statements and Supplementary Data” of this report.
(c) Fiscal year 2018 included $68.3 million of discrete income tax net benefits related to the U.S. tax reform and other legislative changes. See Note 18 in the Notes to the Consolidated Financial Statements included in Item 8. “Financial Statements and Supplementary Data” of this report.
(d) Fiscal year 2017 included $3.2 million of loss on divestiture of business.
(e) Fiscal year 2016 included $22.5 million of excess inventory write-down charges, $12.5 million of goodwill impairment charges and $18.0 million of restructuring and impairment charges including $7.6 million of impairment of intangible assets and property, plant and equipment and $10.4 million of restructuring costs related primarily to an early retirement incentive and other severance related costs.
(f) The weighted average common shares outstanding for fiscal year 2016 included 5.5 million less shares compared to prior year, related to the share repurchase program authorized in October 2014. During the fiscal year ended June 30, 2016, we repurchased 3,762,200 shares of common stock for $123.9 million.
17
See Item 7. “Management’s Discussion and Analysis of Financial Condition and Results of Operations” for discussion of factors that affect the comparability of the “Selected Financial Data”.
Item 7. Management’s Discussion and Analysis of Financial Condition and Results of Operations
Background and General
Our discussions below in this Item 7 should be read in conjunction with our consolidated financial statements, including the notes thereto, included in this annual report on Form 10-K.
We are a producer and distributor of premium specialty alloys, including titanium alloys, powder metals, stainless steels, alloy steels, and tool steels as well as drilling tools. We are a recognized leader in high-performance specialty alloy-based materials and process solutions for critical applications in the aerospace, defense, medical, transportation, energy, industrial and consumer markets. We have evolved to become a pioneer in premium specialty alloys, including titanium, nickel, and cobalt, as well as alloys specifically engineered for additive manufacturing ("AM") processes and soft magnetics applications. We have expanded our AM capabilities to provide a complete “end-to-end” solution to accelerate materials innovation and streamline parts production. We primarily process basic raw materials such as nickel, cobalt, titanium, manganese, chromium, molybdenum, iron scrap and other metal alloying elements through various melting, hot forming and cold working facilities to produce finished products in the form of billet, bar, rod, wire and narrow strip in many sizes and finishes. We also produce certain metal powders and parts. Our sales are distributed directly from our production plants and distribution network as well as through independent distributors. Unlike many other specialty steel producers, we operate our own worldwide network of service and distribution centers. These service centers, located in the United States, Canada, Mexico, Europe and Asia allow us to work more closely with customers and to offer various just-in-time stocking programs.
As part of our overall business strategy, we have sought out and considered opportunities related to strategic acquisitions and joint collaborations as well as possible business unit dispositions aimed at broadening our offering to the marketplace. We have participated with other companies to explore potential terms and structures of such opportunities and expect that we will continue to evaluate these opportunities.
While we prepare our financial statements in accordance with U.S. generally accepted accounting principles (“U.S. GAAP”), we also utilize and present certain financial measures that are not based on or included in U.S. GAAP (we refer to these as “Non-GAAP financial measures”). Please see the section “Non-GAAP Financial Measures” below for further discussion of these financial measures, including the reasons why we use such financial measures and reconciliations of such financial measures to the nearest U.S. GAAP financial measures.
18
Business Trends
Selected financial results for the past three fiscal years are summarized below:
Years Ended June 30, | ||||||||||||
($ in millions, except per share data) | 2020 | 2019 | 2018 | |||||||||
Net sales | $ | 2,181.1 | $ | 2,380.2 | $ | 2,157.7 | ||||||
Net sales excluding surcharge revenue (1) | $ | 1,828.7 | $ | 1,942.1 | $ | 1,792.3 | ||||||
Operating income | $ | 25.3 | $ | 241.4 | $ | 189.3 | ||||||
Net income | $ | 1.5 | $ | 167.0 | $ | 188.5 | ||||||
Diluted earnings per share | $ | 0.02 | $ | 3.43 | $ | 3.92 | ||||||
Purchases of property, plant, equipment and software | $ | 171.4 | $ | 180.3 | $ | 135.0 | ||||||
Free cash flow (1) | $ | 21.8 | $ | (53.7 | ) | $ | 34.7 | |||||
Pounds sold (in thousands) (2) | 231,736 | 267,536 | 265,620 | |||||||||
(1) See the section “Non-GAAP Financial Measures” below for further discussion of these financial measures.
(2) Includes pounds from Specialty Alloys Operations segment, and certain Performance Engineered Products segment businesses including Dynamet, Carpenter Powder Products and Additive businesses only.
Our sales are across diverse end-use markets. The table below summarizes our sales by end-use market over the past three fiscal years:
Years Ended June 30, | |||||||||||||||||||||
2020 | 2019 | 2018 | |||||||||||||||||||
($ in millions) | Dollars | % of Total | Dollars | % of Total | Dollars | % of Total | |||||||||||||||
Aerospace and Defense | $ | 1,313.7 | 60 | % | $ | 1,327.9 | 56 | % | $ | 1,182.3 | 55 | % | |||||||||
Medical | 197.0 | 9 | 205.0 | 8 | 175.3 | 8 | |||||||||||||||
Transportation | 132.1 | 6 | 157.7 | 6 | 157.0 | 7 | |||||||||||||||
Energy | 135.4 | 6 | 181.7 | 8 | 146.5 | 7 | |||||||||||||||
Industrial and Consumer | 296.0 | 14 | 371.5 | 16 | 364.9 | 17 | |||||||||||||||
Distribution | 106.9 | 5 | 136.4 | 6 | 131.7 | 6 | |||||||||||||||
Total net sales | $ | 2,181.1 | 100 | % | $ | 2,380.2 | 100 | % | $ | 2,157.7 | 100 | % | |||||||||
Impact of Raw Material Prices and Product Mix
We value most of our inventory utilizing the LIFO inventory costing methodology. Under the LIFO inventory costing method, changes in the cost of raw materials and production activities are recognized in cost of sales in the current period even though these materials may have been acquired at potentially significantly different values due to the length of time from the acquisition of the raw materials to the sale of the processed finished goods to the customers. In a period of rising raw material costs, the LIFO inventory valuation normally results in higher cost of sales. Conversely, in a period of decreasing raw material costs, the LIFO inventory valuation normally results in lower cost of sales.
19
The volatility of the costs of raw materials has impacted our operations over the past several years. We, and others in our industry, generally have been able to pass cost increases on major raw materials through to our customers using surcharges that are structured to recover increases in raw material costs. Generally, the formula used to calculate a surcharge is based on published prices of the respective raw materials for the previous month which correlates to the prices we pay for our raw material purchases. However, a portion of our surcharges to customers may be calculated using a different surcharge formula or may be based on the raw material prices at the time of order, which creates a lag between surcharge revenue and corresponding raw material costs recognized in cost of sales. The surcharge mechanism protects our net income on such sales except for the lag effect discussed above. However, surcharges have had a dilutive effect on our gross margin and operating margin percentages as described later in this report.
Approximately 25 percent of our net sales are sales to customers under firm price sales arrangements. Firm price sales arrangements involve a risk of profit margin fluctuations, particularly when raw material prices are volatile. In order to reduce the risk of fluctuating profit margins on these sales, we enter into commodity forward contracts to purchase certain critical raw materials necessary to produce the related products sold. Firm price sales arrangements generally include certain annual purchasing commitments and consumption schedules agreed to by the customers at selling prices based on raw material prices at the time the arrangements are established. If a customer fails to meet the volume commitments (or the consumption schedule deviates from the agreed-upon terms of the firm price sales arrangements), the Company may need to absorb the gains or losses associated with the commodity forward contracts on a temporary basis. Gains or losses associated with commodity forward contracts are reclassified to earnings/loss when earnings are impacted by the hedged transaction. Because we value most of our inventory under the LIFO costing methodology, changes in the cost of raw materials and production activities are recognized in cost of sales in the current period attempting to match the most recently incurred costs with revenues. Gains and/or losses on the commodity forward contracts are reclassified from other comprehensive income together with the actual purchase price of the underlying commodities when the underlying commodities are purchased and recorded in inventory. To the extent that the total purchase price of the commodities, inclusive of the gains or losses on the commodity forward contracts, are higher or lower relative to the beginning of year costs, our cost of goods sold reflects such amounts. Accordingly, the gains and/or losses associated with commodity forward contracts may not impact the same period that the firm price sales arrangements revenue is recognized, and comparisons of gross profit from period to period may be impacted. These firm price sales arrangements are expected to continue as we look to strengthen our long-term customer relationships by expanding, renewing and, in certain cases, extending to a longer term, our customer long-term arrangements.
We produce hundreds of grades of materials, with a wide range of pricing and profit levels depending on the grade. In addition, our product mix within a period is subject to the fluctuating order patterns of our customers as well as decisions we may make on participation in certain products based on available capacity including the impacts of capacity commitments we may have under existing customer agreements. While we expect to see positive contribution from a more favorable product mix in our margin performance over time, the impact by period may fluctuate, and period to period comparisons may vary.
Net Pension Expense
Net pension expense, as we define it below, includes the net periodic benefit costs related to both our pension and other postretirement plans. The net periodic benefit costs are determined annually based on beginning of year balances and are recorded ratably throughout the fiscal year, unless a significant re-measurement event occurs. The following is a summary of the net periodic benefit costs for the years ended June 30, 2020, 2019 and 2018:
Years Ended June 30, | ||||||||||||
($ in millions) | 2020 | 2019 | 2018 | |||||||||
Pension plans | $ | 12.2 | $ | 9.8 | $ | 11.3 | ||||||
Other postretirement plans | 3.1 | 1.8 | 2.9 | |||||||||
Net periodic benefit costs | $ | 15.3 | $ | 11.6 | $ | 14.2 | ||||||
The service cost component of net pension expense represents the estimated cost of future pension liabilities earned associated with active employees. The pension earnings, interest and deferrals (“pension EID”) is comprised of the expected return on plan assets, interest costs on the projected benefit obligations of the plans and amortization of actuarial gains and losses and prior service costs and benefits.
During the year ended June 30, 2020, in connection with a restructuring plan, we reduced our global salaried positions by twenty percent. In certain cases, employees were eligible for severance benefits under one of the Company’s pension plans. As a result, $3.5 million will be funded from the Company's qualified pension plan to cover severance payments and medical coverage for impacted participants.
20
Net pension expense is recorded in accounts that are included in both the cost of sales and selling, general and administrative expenses based on the function of the associated employees and in other income (expense), net. The following is a summary of the classification of net pension expense for the years ended June 30, 2020, 2019 and 2018:
Years Ended June 30, | ||||||||||||
($ in millions) | 2020 | 2019 | 2018 | |||||||||
Service cost included in Cost of sales | $ | 11.0 | $ | 10.0 | $ | 10.5 | ||||||
Service cost included in Selling, general and administrative expenses | 1.5 | 1.5 | 1.6 | |||||||||
Pension earnings, interest and deferrals included in Other income (expense), net | 2.8 | 0.1 | 2.1 | |||||||||
Net pension expense | $ | 15.3 | $ | 11.6 | $ | 14.2 | ||||||
As of June 30, 2020 and 2019, amounts capitalized in gross inventory were $1.6 million and $1.7 million, respectively.
Operating Performance Overview
For fiscal year 2020, we reported net income of $1.5 million, or $0.02 per diluted share, compared with net income of $167.0 million, or $3.43 per diluted share for fiscal year 2019. The second half of fiscal year 2020 was negatively impacted by the financial disruptions of COVID-19 and the Boeing 737 MAX production halt compared to the same period a year ago. As a result of the financial disruptions and lower demand across all our end-use markets, we executed targeted cost reduction actions and portfolio restructurings including exiting the oil and gas business in our PEP segment, the closure of two small powder facilities and global salaried workforce reductions. These actions resulted in inventory write-downs and restructuring and asset impairment expenses of $97.8 million of which $85.7 million are non-cash charges. Our long-term growth projections related to our Additive business unit in the PEP segment were also impacted resulting in a goodwill impairment charge of $34.6 million. However, during this time we were able to generate positive cash flow and strengthen our liquidity position.
Results of Operations — Fiscal Year 2020 Compared to Fiscal Year 2019
For fiscal year 2020, we reported net income of $1.5 million, or $0.02 per diluted share. Excluding special items, earnings per share would have been $2.21 per diluted share for fiscal year 2020. This compares with net income of $167.0 million, or $3.43 per diluted share, a year earlier. Excluding special items, earnings per share would have been $3.46 per diluted share for fiscal year 2019. Our fiscal year 2020 results reflect goodwill impairment charges totaling $34.6 million and inventory write-downs and restructuring and asset impairment charges of $97.8 million.
Net Sales
Net sales for fiscal year 2020 were $2,181.1 million, which was an 8 percent decrease from fiscal year 2019. Excluding surcharge revenue, sales were 6 percent lower than fiscal year 2019 on 13 percent lower volume. The results reflect higher demand and better mix during the first half of fiscal year 2020. This improvement was negated in the second half of the fiscal year by the financial disruptions caused by COVID-19, resulting in lower demand across all end-use markets versus the prior year period.
Geographically, sales outside the United States increased 2 percent from fiscal year 2019 to $787.7 million. The increase is primarily due to stronger product demand in the Aerospace and Defense end-use market in Asia Pacific, Europe and Canada which was partially offset by lower demand in the Consumer and Industrial end-use market in Europe. A portion of our sales outside the United States are denominated in foreign currencies. The impact of fluctuations in foreign currency exchange rates resulted in a $3.5 million decrease in sales during fiscal year 2020 compared to fiscal year 2019. International sales as a percentage of our total net sales represented 36 percent and 32 percent for fiscal year 2020 and fiscal year 2019, respectively.
21
Sales by End-Use Markets
We sell to customers across diversified end-use markets. The following table includes comparative information for our net sales, which includes surcharge revenue, by principal end-use markets. We believe this is helpful supplemental information in analyzing the performance of the business from period to period.
Fiscal Year | $ Decrease | % Decrease | |||||||||||||
($ in millions) | 2020 | 2019 | |||||||||||||
Aerospace and Defense | $ | 1,313.7 | $ | 1,327.9 | $ | (14.2 | ) | (1 | )% | ||||||
Medical | 197.0 | 205.0 | (8.0 | ) | (4 | )% | |||||||||
Transportation | 132.1 | 157.7 | (25.6 | ) | (16 | )% | |||||||||
Energy | 135.4 | 181.7 | (46.3 | ) | (25 | )% | |||||||||
Industrial and Consumer | 296.0 | 371.5 | (75.5 | ) | (20 | )% | |||||||||
Distribution | 106.9 | 136.4 | (29.5 | ) | (22 | )% | |||||||||
Total net sales | $ | 2,181.1 | $ | 2,380.2 | $ | (199.1 | ) | (8 | )% | ||||||
The following table includes comparative information for our net sales by the same principal end-use markets, but excluding surcharge revenue:
Fiscal Year | $ Increase (Decrease) | % Increase (Decrease) | |||||||||||||
($ in millions) | 2020 | 2019 | |||||||||||||
Aerospace and Defense | $ | 1,072.1 | $ | 1,051.5 | $ | 20.6 | 2 | % | |||||||
Medical | 177.2 | 176.3 | 0.9 | 1 | % | ||||||||||
Transportation | 108.7 | 126.6 | (17.9 | ) | (14 | )% | |||||||||
Energy | 116.4 | 154.3 | (37.9 | ) | (25 | )% | |||||||||
Industrial and Consumer | 248.1 | 298.5 | (50.4 | ) | (17 | )% | |||||||||
Distribution | 106.2 | 134.9 | (28.7 | ) | (21 | )% | |||||||||
Total net sales excluding surcharge revenue | $ | 1,828.7 | $ | 1,942.1 | $ | (113.4 | ) | (6 | )% | ||||||
Sales to the Aerospace and Defense market decreased 1 percent from fiscal year 2019 to $1,313.7 million. Excluding surcharge revenue, sales increased 2 percent on 4 percent lower shipment volume. The results reflect stronger demand for materials used across all aerospace sub-markets and defense during the first half of the current fiscal year offset by lower build rates caused by the global travel halt in the second half of the current fiscal year due to the COVID-19 pandemic.
Sales to the Medical market decreased 4 percent to $197.0 million from fiscal year 2019. Excluding surcharge revenue, sales increased 1 percent on 5 percent lower shipment volume. The results reflect the impact of temporary delays of elective medical procedures from the COVID-19 pandemic during the second half of fiscal year 2020 compared to the prior year period.
Transportation market sales of $132.1 million reflected a 16 percent decrease from fiscal year 2019. Excluding surcharge revenue, sales decreased 14 percent on 20 percent lower shipment volume. The results reflect decreased demand caused by COVID-19 related plant closures and production disruptions in North America, Asia and Europe in the second half of fiscal year 2020.
Sales to the Energy market of $135.4 million reflected a 25 percent decrease from fiscal year 2019. Excluding surcharge revenue, sales decreased 25 percent. The results reflect the decreasing demand globally including a 60 percent decrease in North America rig counts.
Industrial and Consumer market sales decreased 20 percent to $296.0 million for fiscal year 2020. Excluding surcharge revenue, sales decreased 17 percent on 26 percent lower shipment volume. The results reflect the impact of reduced demand for materials used in select industrial applications and declines in demand for consumer electronics and sporting goods.
22
Gross Profit
Gross profit in fiscal year 2020 decreased to $329.4 million, or 15.1 percent of net sales from $444.8 million, or 18.7 percent of net sales for fiscal year 2019. During the fiscal year ended June 30, 2020 we recorded $29.3 million of inventory write-downs related to targeted cost reduction actions including exiting the oil and gas business in our PEP segment and the closure of two powder facilities. The current year results were impacted by the COVID-19 pandemic and the 737 MAX production halt. The current year results were also negatively impacted by an accelerated inventory reduction program.
Excluding the impact of the surcharge revenue and the inventory write-downs, our gross margin in fiscal year 2020 was 19.6 percent compared to 22.9 percent in fiscal year 2019. The results reflect the impact of improved product mix and capacity gains during the first half of the year offset by incremental costs and productivity losses due to COVID-19. Fiscal year 2019 also reflects an $11.4 million benefit related to an insurance recovery in our third fiscal quarter.
Our surcharge mechanism is structured to recover increases in raw material costs, although in certain cases with a lag effect as discussed above. While the surcharge generally protects the absolute gross profit dollars, it does have a dilutive effect on gross margin as a percent of sales. The following represents a summary of the dilutive impact of the surcharge on gross margin excluding the impact of inventory write-downs from restructuring. We present and discuss these financial measures because management believes removing the impact of these items provides a more consistent and meaningful basis for comparing results of operations from period to period. See the section “Non-GAAP Financial Measures” below for further discussion of these financial measures.
Fiscal Year | ||||||||
($ in millions) | 2020 | 2019 | ||||||
Net sales | $ | 2,181.1 | $ | 2,380.2 | ||||
Less: surcharge revenue | 352.4 | 438.1 | ||||||
Net sales excluding surcharge revenue | $ | 1,828.7 | $ | 1,942.1 | ||||
Gross profit | $ | 329.4 | $ | 444.8 | ||||
Inventory write-downs from restructuring | 29.3 | — | ||||||
Gross profit excluding the inventory write-downs from restructuring | $ | 358.7 | $ | 444.8 | ||||
Gross margin | 15.1 | % | 18.7 | % | ||||
Gross margin excluding surcharge revenue and inventory write-downs from restructuring | 19.6 | % | 22.9 | % | ||||
Selling, General and Administrative Expenses
Selling, general and administrative expenses in fiscal year 2020 were $201.0 million, or 9.2 percent of net sales (11.0 percent of net sales excluding surcharge revenue), compared to $203.4 million, or 8.5 percent of net sales (10.5 percent of net sales excluding surcharge revenue), in fiscal year 2019. Selling, general and administrative expenses were relatively flat in fiscal year 2020 compared to fiscal year 2019. The current fiscal year results reflect lower salary costs and variable compensation expense offset by higher spending in key growth areas including additive manufacturing compared to the same period a year ago.
Restructuring and Asset Impairment Charges
During fiscal year 2020, we incurred $68.5 million of restructuring and asset impairment charges. This included $56.4 million of non-cash impairment charges to write down property, plant and equipment and other intangible assets primarily related to the exit from the oil and gas business and the closure of two domestic powder facilities. The remaining $12.1 million, consisting primarily of various personnel-related costs for severance payments, medical coverage and related items, resulted from a restructuring plan to reduce the global salaried workforce by twenty percent. No restructuring or asset impairment charges were incurred during the fiscal year ended June 30, 2019.
Activities undertaken in connection with the fiscal year 2020 restructuring plan are expected to be substantially complete in the first quarter of fiscal year 2021.
23
Goodwill Impairment Charge
The Company’s long-term projections for the Additive reporting unit within the PEP Segment have been impacted by slower than expected growth in additive manufacturing applications which was further compounded by the effects from COVID-19. As a result, during fiscal year 2020 we recorded an impairment charge of $34.6 million, which represented a portion of the balance of the goodwill recorded for this reporting unit. No goodwill impairment charges were incurred during the fiscal year ended June 30, 2019.
Operating Income
Our operating income in fiscal year 2020 decreased to $25.3 million, or 1.2 percent of net sales as compared with $241.4 million, or 10.1 percent of net sales in fiscal year 2019. Excluding surcharge revenue and special items, adjusted operating margin was 8.6 percent for the fiscal year 2020 and 12.5 percent for the same period a year ago. The second half of fiscal year 2020 was negatively impacted by the financial disruptions of COVID-19 and the Boeing 737 MAX production halt compared to the same period a year ago. During this time, we executed targeted cost reduction actions and portfolio restructurings including exiting the oil and gas business in our PEP segment, closure of two domestic powder facilities, global salaried workforce reductions and other asset impairments. These actions resulted in inventory write-downs of $29.3 million and restructuring and asset impairment charges of $68.5 million in fiscal year 2020. Operating income in fiscal year 2020 was also impacted by a goodwill impairment charge of $34.6 million.
The following presents our operating income and operating margin, in each case excluding the impact of surcharge on net sales and excluding special items. We present and discuss these financial measures because management believes removing the impact of these items provides a more consistent and meaningful basis for comparing results of operations from period to period. See the section “Non-GAAP Financial Measures” below for further discussion of these financial measures.
Fiscal Year | ||||||||
($ in millions) | 2020 | 2019 | ||||||
Net sales | $ | 2,181.1 | $ | 2,380.2 | ||||
Less: surcharge revenue | 352.4 | 438.1 | ||||||
Net sales excluding surcharge revenue | $ | 1,828.7 | $ | 1,942.1 | ||||
Operating income | $ | 25.3 | $ | 241.4 | ||||
Special items: | ||||||||
Acquisition-related costs | — | 1.2 | ||||||
Inventory write-downs from restructuring | 29.3 | — | ||||||
Restructuring and asset impairment charges | 68.5 | — | ||||||
Goodwill impairment | 34.6 | — | ||||||
Adjusted operating income excluding special items | $ | 157.7 | $ | 242.6 | ||||
Operating margin | 1.2 | % | 10.1 | % | ||||
Adjusted operating margin excluding surcharge revenue and special items | 8.6 | % | 12.5 | % | ||||
Interest Expense
Fiscal year 2020 interest expense was $19.8 million compared to $26.0 million in fiscal year 2019. We have used interest rate swaps to achieve a level of floating rate debt to fixed rate debt. Interest expense for fiscal year 2020 includes net gains from interest rate swaps of $1.4 million compared with $0.2 million of net losses from interest rate swaps for fiscal year 2019. Capitalized interest reduced interest expense by $9.0 million for fiscal year 2020 compared to $5.1 million in fiscal year 2019.
24
Other Income, Net
Other income for fiscal year 2020 of $0.6 million was consistent with other income of $0.6 million a year ago.
Income Taxes
Our effective tax rate (income tax expense (benefit) as a percent of income before taxes) for fiscal year 2020 was 75.4 percent as compared to 22.7 percent for fiscal year 2019. The fiscal year 2020 tax expense includes tax benefits of $1.0 million as a result of changes in the Company's prior tax positions as well as a $2.0 million charge for nondeductible goodwill impairment. The effective tax rate for fiscal year 2020 as compared to 2019 reflects the magnified impact of permanent adjustments on a significantly lower pre-tax income.
Fiscal year 2019 income tax expense includes tax benefits of $1.8 million as a result of changes in the Company’s prior year tax positions.
The Coronavirus Aid, Relief and Economic Security Act (the “CARES Act”) was enacted on March 27, 2020. The CARES Act established new provisions, including but not limited to, expanded deduction of certain qualified capital expenditures, delayed payment of certain employment taxes, expanded use of net operating losses, reduced limitations on deductions of interest expense and extension of funding for defined benefit plans. The Company is continuing to evaluate these provisions but does not anticipate the CARES Act will have a significant impact on our financial position, results of operations or cash flows.
The Tax Cuts and Jobs Act ("the Act") was enacted on December 22, 2017. The Tax Cuts and Jobs Act included provisions that reduced the federal corporate income tax rate, created a territorial tax system with a one-time mandatory tax on previously deferred foreign earnings (i.e. transition tax), and changed certain business deductions including allowing for immediate expensing of certain qualified capital expenditures and limitation on deductions of interest expense. During fiscal year 2019, the Company recorded a discrete tax benefit of $0.2 million for the transition tax offset by a discrete tax charge of $0.2 million for the re-measurement of deferred tax assets and liabilities. The accounting for the income tax effects of the Tax Cuts and Jobs Act was completed by December 31, 2018. Under the Act the transition tax is being paid over an eight year period beginning in fiscal year 2019.
Undistributed earnings of our foreign subsidiaries, totaling $61.7 million were considered permanently reinvested. Following enactment of the Act, the repatriation of cash to the U.S. is generally no longer taxable for federal income tax purposes. If these earnings were to be repatriated, approximately $0.1 million of tax expense would be incurred.
See Note 18 to the consolidated financial statements in Item 8. “Financial Statements and Supplementary Data” for a full reconciliation of the statutory federal tax rate to the effective tax rates.
Business Segment Results
Summary information about our operating results on a segment basis is set forth below. For more detailed segment information, see Note 20 to the consolidated financial statements included in Item 8. “Financial Statements and Supplementary Data”.
The following table includes comparative information for volumes by business segment:
Fiscal Year | (Decrease) Increase | % (Decrease) Increase | ||||||||||
(Pounds sold, in thousands) | 2020 | 2019 | ||||||||||
Specialty Alloys Operations | 221,784 | 256,360 | (34,576 | ) | (13 | )% | ||||||
Performance Engineered Products * | 12,260 | 13,752 | (1,492 | ) | (11 | )% | ||||||
Intersegment | (2,308 | ) | (2,576 | ) | 268 | 10 | % | |||||
Consolidated pounds sold | 231,736 | 267,536 | (35,800 | ) | (13 | )% | ||||||
* Pounds sold data for PEP segment includes Dynamet, Carpenter Powder Products and Additive businesses only.
25
The following table includes comparative information for net sales by business segment:
Fiscal Year | $ (Decrease) Increase | % (Decrease) Increase | |||||||||||||
($ in millions) | 2020 | 2019 | |||||||||||||
Specialty Alloys Operations | $ | 1,831.6 | $ | 1,967.3 | $ | (135.7 | ) | (7 | )% | ||||||
Performance Engineered Products | 401.1 | 479.8 | (78.7 | ) | (16 | )% | |||||||||
Intersegment | (51.6 | ) | (66.9 | ) | 15.3 | 23 | % | ||||||||
Total net sales | $ | 2,181.1 | $ | 2,380.2 | $ | (199.1 | ) | (8 | )% | ||||||
The following table includes comparative information for our net sales by business segment, but excluding surcharge revenue:
Fiscal Year | $ (Decrease) Increase | % (Decrease) Increase | |||||||||||||
($ in millions) | 2020 | 2019 | |||||||||||||
Specialty Alloys Operations | $ | 1,483.0 | $ | 1,536.6 | $ | (53.6 | ) | (3 | )% | ||||||
Performance Engineered Products | 395.2 | 467.0 | (71.8 | ) | (15 | )% | |||||||||
Intersegment | (49.5 | ) | (61.5 | ) | 12.0 | 20 | % | ||||||||
Total net sales excluding surcharge revenue | $ | 1,828.7 | $ | 1,942.1 | $ | (113.4 | ) | (6 | )% | ||||||
Specialty Alloys Operations Segment
Net sales in fiscal year 2020 for the SAO segment decreased 7 percent to $1,831.6 million, as compared with $1,967.3 million in fiscal year 2019. Excluding surcharge revenue, net sales decreased 3 percent from a year ago. The fiscal year 2020 net sales reflected 13 percent lower shipment volume as compared to fiscal year 2019. The SAO segment results reflect higher sales and stronger product mix in key end-use markets during the first half of the fiscal year offset by the impacts of the 737 MAX production halt and the COVID-19 pandemic during the second half of the fiscal year.
Operating income for the SAO segment in fiscal year 2020 was $239.0 million, or 13.0 percent of net sales (16.1 percent of net sales excluding surcharge revenue), compared to $282.2 million, or 14.3 percent of net sales (18.4 percent of net sales excluding surcharge revenue), for fiscal year 2019. The decrease in operating income reflects productivity losses and impacts from an accelerated inventory reduction program in the second half of the current fiscal year due to the COVID-19 pandemic. This was partially offset by the impact of the higher valued product mix and demand in our premium products during the first half of the current year.
Performance Engineered Products Segment
Net sales for fiscal year 2020 for the PEP segment were $401.1 million as compared with $479.8 million for fiscal year 2019. Excluding surcharge revenue, net sales decreased 15 percent from a year ago. The results reflect decreases in sales in all end-use markets except the Medical end-use market. Prolonged weakness in the oil and gas sub-market and impacts of tariffs were the primary drivers for the Energy and Distribution end-use market declines, respectively.
Operating loss for the PEP segment for fiscal year 2020 was $10.4 million, or 2.6 percent of net sales, as compared with operating income of $30.0 million, or 6.3 percent of net sales for fiscal year 2019. The current year results were impacted by weak demand in the oil and gas sub-market, the ongoing trade actions and tariffs on our distribution business and the impacts of COVID-19. The prior year results were impacted by an $11.4 million benefit related to an insurance recovery. During the current fiscal year we approved a plan to exit the oil and gas business in our PEP segment and close two domestic powder facilities.
26
Results of Operations — Fiscal Year 2019 Compared to Fiscal Year 2018
For fiscal year 2019, we reported net income of $167.0 million, or $3.43 per diluted share. Excluding special items, earnings per share would have been $3.46 per diluted share for fiscal year 2019. This compared to net income of $188.5 million, or $3.92 per diluted share, a year earlier. Excluding special items, earnings per share would have been $2.50 per diluted share for fiscal year 2018. Our fiscal year 2019 results reflected strong market conditions combined with our solutions focused approach that drove increasing sales in all of our end-use markets and further implementation of the Carpenter Operating Model.
Net Sales
Net sales for fiscal year 2019 were $2,380.2 million, which was a 10 percent increase from fiscal year 2018. Excluding surcharge revenue, sales were 8 percent higher than fiscal year 2018 on 1 percent higher volume. The results reflect stronger demand and improved product mix across certain end-use markets demonstrating our focus on high-value solutions and market share gain by deepening our existing relationships and adding new customers.
Geographically, sales outside the United States increased 6 percent from fiscal year 2018 to $787.7 million. The increase is primarily due to stronger product demand in the Aerospace and Defense end-use market in Asia Pacific, South America and Canada partially offset by lower demand in Europe. In addition, demand was stronger in the Energy and Medical end-use markets in Europe and Asia Pacific. A portion of our sales outside the United States are denominated in foreign currencies. The impact of fluctuations in foreign currency exchange rates resulted in a $4.5 million increase in sales during fiscal year 2019 compared to fiscal year 2018. International sales as a percentage of our total net sales represented 32 percent and 34 percent for fiscal year 2019 and fiscal year 2018, respectively.
Sales by End-Use Markets
We sell to customers across diversified end-use markets. The following table includes comparative information for our net sales, which includes surcharge revenue, by principal end-use markets. We believe this is helpful supplemental information in analyzing performance of the business from period to period.
Fiscal Year | $ Increase | % Increase | |||||||||||||
($ in millions) | 2019 | 2018 | |||||||||||||
Aerospace and Defense | $ | 1,327.9 | $ | 1,182.3 | $ | 145.6 | 12 | % | |||||||
Medical | 205.0 | 175.3 | 29.7 | 17 | % | ||||||||||
Energy | 181.7 | 146.5 | 35.2 | 24 | % | ||||||||||
Transportation | 157.7 | 157.0 | 0.7 | — | % | ||||||||||
Industrial and Consumer | 371.5 | 364.9 | 6.6 | 2 | % | ||||||||||
Distribution | 136.4 | 131.7 | 4.7 | 4 | % | ||||||||||
Total net sales | $ | 2,380.2 | $ | 2,157.7 | $ | 222.5 | 10 | % | |||||||
The following table includes comparative information for our net sales by the same principal end-use markets, but excluding surcharge revenue:
Fiscal Year | $ Increase (Decrease) | % Increase (Decrease) | |||||||||||||
($ in millions) | 2019 | 2018 | |||||||||||||
Aerospace and Defense | $ | 1,051.5 | $ | 957.1 | $ | 94.4 | 10 | % | |||||||
Medical | 176.3 | 149.3 | 27.0 | 18 | % | ||||||||||
Energy | 154.3 | 131.3 | 23.0 | 18 | % | ||||||||||
Transportation | 126.6 | 127.9 | (1.3 | ) | (1 | )% | |||||||||
Industrial and Consumer | 298.5 | 295.9 | 2.6 | 1 | % | ||||||||||
Distribution | 134.9 | 130.8 | 4.1 | 3 | % | ||||||||||
Total net sales excluding surcharge revenue | $ | 1,942.1 | $ | 1,792.3 | $ | 149.8 | 8 | % | |||||||
27
Sales to the Aerospace and Defense market increased 12 percent from fiscal year 2018 to $1,327.9 million. Excluding surcharge revenue, sales increased 10 percent on 2 percent higher shipment volume. The results reflect the impact of stronger demand for materials used across all aerospace sub-markets and defense, driven by aerospace engines, fasteners, avionics and program specific defense applications.
Sales to the Medical market increased 17 percent to $205.0 million from fiscal year 2018. Excluding surcharge revenue, sales increased 18 percent on 17 percent higher shipment volume. The results reflect improved product mix for higher value solutions, market share gains with key customers and the positive impact of supply chain inventory rebuilding for titanium materials within the surgical and cardiology sub-markets.
Sales to the Energy market of $181.7 million reflected a 24 percent increase from fiscal year 2018. Excluding surcharge revenue, sales increased 18 percent. The results were driven by revenue and volume increases during the first half of the fiscal year in the oil and gas sub-market, particularly rental and replacement activity through our Amega West Services (“Amega West”) business, and higher demand for materials used in power generation applications.
Transportation market sales remained flat from fiscal year 2018 at $157.7 million. Excluding surcharge revenue, sales decreased 1 percent on 6 percent lower shipment volume. The results reflect a strengthening of heavy-duty truck applications, partially offset by trade actions and global economic uncertainty.
Industrial and Consumer market sales increased 2 percent to $371.5 million for fiscal year 2019. Excluding surcharge revenue, sales increased 1 percent on 4 percent lower shipment volume. The results reflect the impact of stronger demand for materials used in consumer goods including the sporting sub-market.
Gross Profit
Gross profit in fiscal year 2019 increased to $444.8 million, or 18.7 percent of net sales from $382.3 million, or 17.7 percent of net sales for fiscal year 2018. Excluding the impact of the surcharge revenue, our gross margin in fiscal year 2019 was 22.9 percent compared to 21.3 percent in fiscal year 2018. The results reflect the impact of improved product mix coupled with capacity gains and operating cost reductions compared to the same period a year ago. Fiscal year 2019 also reflects an $11.4 million benefit related to an insurance recovery in our third fiscal quarter.
Our surcharge mechanism is structured to recover increases in raw material costs, although in certain cases with a lag effect as discussed above. While the surcharge generally protects the absolute gross profit dollars, it does have a dilutive effect on gross margin as a percent of sales. The following represents a summary of the dilutive impact of the surcharge on gross margin. We present and discuss these financial measures because management believes removing the impact of surcharge provides a more consistent and meaningful basis for comparing results of operations from period to period. See the section “Non-GAAP Financial Measures” below for further discussion of these financial measures.
Fiscal Year | ||||||||
($ in millions) | 2019 | 2018 | ||||||
Net sales | $ | 2,380.2 | $ | 2,157.7 | ||||
Less: surcharge revenue | 438.1 | 365.4 | ||||||
Net sales excluding surcharge revenue | $ | 1,942.1 | $ | 1,792.3 | ||||
Gross profit | $ | 444.8 | $ | 382.3 | ||||
Gross margin | 18.7 | % | 17.7 | % | ||||
Gross margin excluding surcharge revenue | 22.9 | % | 21.3 | % | ||||
28
Selling, General and Administrative Expenses
Selling, general and administrative expenses in fiscal year 2019 were $203.4 million, or 8.5 percent of net sales (10.5 percent of net sales excluding surcharge revenue), compared to $193.0 million, or 8.9 percent of net sales (10.8 percent of net sales excluding surcharge revenue), in fiscal year 2018. Selling, general and administrative expenses increased in fiscal year 2019 primarily due to higher depreciation, insurance and acquisition related costs partially offset by lower variable compensation expense compared to fiscal year 2018.
Operating Income
Our operating income in fiscal year 2019 increased to $241.4 million, or 10.1 percent of net sales as compared with $189.3 million, or 8.8 percent of net sales in fiscal year 2018. Excluding surcharge revenue and special items, adjusted operating margin was 12.5 percent for the fiscal year 2019 and 10.6 percent for the same period a year ago. The increase in the operating margin reflects steady demand and improved product mix coupled with operating cost improvements offset by higher selling, general and administrative expenses compared to the same period a year ago.
The following presents our operating income and operating margin, in each case excluding the impact of surcharge on net sales and special items. We present and discuss these financial measures because management believes removing the impact of these items provides a more consistent and meaningful basis for comparing results of operations from period to period. See the section “Non-GAAP Financial Measures” below for further discussion of these financial measures.
Fiscal Year | ||||||||
($ in millions) | 2019 | 2018 | ||||||
Net sales | $ | 2,380.2 | $ | 2,157.7 | ||||
Less: surcharge revenue | 438.1 | 365.4 | ||||||
Net sales excluding surcharge revenue | $ | 1,942.1 | $ | 1,792.3 | ||||
Operating income | $ | 241.4 | $ | 189.3 | ||||
Special item: | ||||||||
Acquisition-related costs | 1.2 | — | ||||||
Adjusted operating income excluding special item | $ | 242.6 | $ | 189.3 | ||||
Operating margin | 10.1 | % | 8.8 | % | ||||
Adjusted operating margin excluding surcharge revenue and special item | 12.5 | % | 10.6 | % | ||||
Interest Expense
Fiscal year 2019 interest expense was $26.0 million compared to $28.3 million in fiscal year 2018. We have used interest rate swaps to achieve a level of floating rate debt to fixed rate debt. Interest expense for fiscal year 2019 includes net losses from interest rate swaps of $0.2 million compared with $0.4 million of net gains from interest rate swaps for fiscal year 2018. Capitalized interest reduced interest expense by $5.1 million for fiscal year 2019 compared to $2.8 million in fiscal year 2018.
Other Income (Expense), Net
Other income for fiscal year 2019 was $0.6 million as compared with other expense of $0.8 million a year ago.
Income Taxes
Our effective tax rate (income tax expense (benefit) as a percent of income before taxes) for fiscal year 2019 was 22.7 percent as compared to negative 17.7 percent in fiscal year 2018. Excluding the discrete tax benefits recorded in connection with U.S. Tax reform of $68.3 million that are discussed below, our effective tax rate for fiscal year 2018 would have been 25.0 percent.
29
An Act to Provide for Reconciliation Pursuant to Titles II and V of the Concurrent Resolution on the Budget for Fiscal Year 2018 (the “Act”) was enacted on December 22, 2017. The Act included provisions that reduced the federal corporate income tax rate, created a territorial tax system with a one-time mandatory tax on previously deferred foreign earnings (i.e. transition tax), and changed certain business deductions including allowing for immediate expensing of certain qualified capital expenditures and limitations on deductions of interest expense. The permanent reduction to the U.S. federal corporate income tax rate from 35 percent to 21 percent was effective January 1, 2018. Based on the Company’s interpretation of the Act, during fiscal year 2018, the Company recorded a provisional tax charge of $5.0 million for the transition tax and a provisional tax benefit of $74.6 million for the remeasurement of deferred tax assets and liabilities. The accounting for the income tax effects of the Act was completed by December 31, 2018. A discrete tax benefit of $0.2 million was recorded for the transition tax offset by a discrete tax charge of $0.2 million for the remeasurement of deferred tax assets and liabilities in the three months ended December 31, 2018. Under the Act, the transition tax is being paid over an eight year period beginning in fiscal year 2019.
Fiscal year 2019 income tax expense includes tax benefits of $1.8 million as a result of changes in the Company’s prior year tax positions.
In addition to the impact of the Act discussed above, fiscal year 2018 tax expense also included a tax charge of $1.3 million for increases in certain state valuation allowances for deferred tax assets resulting from the impact of a state law change that will limit the Company’s ability to utilize state net operating loss carryforwards partially offset by the impact of limitations on interest expense as a result of the Act.
The Act also established new tax provisions that became effective in fiscal year 2019, including but not limited to eliminating the corporate alternative minimum tax, creating the base erosion anti-abuse tax (“BEAT”), establishing new limitations on deductible interest expense and certain executive compensation, creating a new provision designed to tax global intangible low-tax income (“GILTI”) and generally eliminating U.S. federal income taxes on dividends from foreign subsidiaries. The Company has made an accounting policy election to treat future GILTI inclusions in U.S. taxable income as a current period expense when incurred.
Undistributed earnings of our foreign subsidiaries, totaling $77.8 million were considered permanently reinvested. Following enactment of the Act, the repatriation of cash to the U.S. is generally no longer taxable for federal income tax purposes. If these earnings were to be repatriated, approximately $0.3 million of tax expense would be incurred.
See Note 18 to the consolidated financial statements in Item 8. “Financial Statements and Supplementary Data” for a full reconciliation of the statutory federal tax rate to the effective tax rates.
Business Segment Results
Summary information about our operating results on a segment basis is set forth below. For more detailed segment information, see Note 20 to the consolidated financial statements included in Item 8. “Financial Statements and Supplementary Data”.
The following table includes comparative information for volumes by business segment:
Fiscal Year | $ Increase (Decrease) | % Increase (Decrease) | ||||||||||
(Pounds sold, in thousands) | 2019 | 2018 | ||||||||||
Specialty Alloys Operations | 256,360 | 258,326 | (1,966 | ) | (1 | )% | ||||||
Performance Engineered Products * | 13,752 | 12,388 | 1,364 | 11 | % | |||||||
Intersegment | (2,576 | ) | (5,094 | ) | 2,518 | 49 | % | |||||
Consolidated pounds sold | 267,536 | 265,620 | 1,916 | 1 | % | |||||||
* Pounds sold data for PEP segment includes Dynamet, Carpenter Powder Products and LPW Technology Ltd. businesses only.
30
The following table includes comparative information for net sales by business segment:
Fiscal Year | $ Increase | % Increase | |||||||||||||
($ in millions) | 2019 | 2018 | |||||||||||||
Specialty Alloys Operations | $ | 1,967.3 | $ | 1,803.8 | $ | 163.5 | 9 | % | |||||||
Performance Engineered Products | 479.8 | 429.7 | 50.1 | 12 | % | ||||||||||
Intersegment | (66.9 | ) | (75.8 | ) | 8.9 | 12 | % | ||||||||
Total net sales | $ | 2,380.2 | $ | 2,157.7 | $ | 222.5 | 10 | % | |||||||
The following table includes comparative information for our net sales by business segment, but excluding surcharge revenue:
Fiscal Year | $ Increase | % Increase | |||||||||||||
($ in millions) | 2019 | 2018 | |||||||||||||
Specialty Alloys Operations | $ | 1,536.6 | $ | 1,434.1 | $ | 102.5 | 7 | % | |||||||
Performance Engineered Products | 467.0 | 426.3 | 40.7 | 10 | % | ||||||||||
Intersegment | (61.5 | ) | (68.1 | ) | 6.6 | 10 | % | ||||||||
Total net sales excluding surcharge revenue | $ | 1,942.1 | $ | 1,792.3 | $ | 149.8 | 8 | % | |||||||
Specialty Alloys Operations Segment
Net sales in fiscal year 2019 for the SAO segment increased 9 percent to $1,967.3 million, as compared with $1,803.8 million in fiscal year 2018. Excluding surcharge revenue, net sales increased 7 percent from a year ago. The fiscal year 2019 net sales reflected 1 percent lower shipment volume as compared to fiscal year 2018. The results reflect the impact of a higher valued product mix driven by increased demand in our premium products compared to the same period a year ago.
Operating income for the SAO segment in fiscal year 2019 was $282.2 million, or 14.3 percent of net sales (18.4 percent of net sales excluding surcharge revenue), compared to $232.4 million, or 12.9 percent of net sales (16.2 percent of net sales excluding surcharge revenue), for fiscal year 2018. The increase in operating income reflects the impact of the higher valued product mix driven by the increased demand in our premium products compared to the same period a year ago.
Performance Engineered Products Segment
Net sales for fiscal year 2019 for the PEP segment were $479.8 million as compared with $429.7 million for fiscal year 2018. Excluding surcharge revenue, net sales increased 10 percent from a year ago. The results reflect an increase in sales primarily in the Medical and Energy end-use markets.
Operating income for the PEP segment for fiscal year 2019 was $30.0 million, or 6.3 percent of net sales, as compared with operating income of $26.1 million, or 6.1 percent of net sales for fiscal year 2018. The results reflect the continuing demand for titanium products combined with cost reduction initiatives as well as an $11.4 million benefit related to an insurance recovery in our third fiscal quarter.
31
Liquidity and Financial Resources
We ended fiscal year 2020 with $193.1 million of cash and cash equivalents, an increase of $166.1 million from fiscal year 2019. During fiscal year 2020, our cash provided from operating activities was $231.8 million as compared with $232.4 million in fiscal year 2019. Our free cash flow, which we define under “Non-GAAP Financial Measures” below, was positive $21.8 million as compared to negative $53.7 million for the same period a year ago. Net income in the current fiscal year was $1.5 million compared to $167.0 million in the prior fiscal year. The current fiscal year included $120.3 million of non-cash special items consisting of $29.3 million of inventory write-downs from restructuring, $68.5 million of restructuring and asset impairment charges and a goodwill impairment charge of $34.6 million. Operating cash flows in the current year were also negatively impacted by lower earnings resulting from COVID-19 offset by improvements in working capital, primarily inventory. The cash flow improvement from inventory was driven by an inventory reduction program that was accelerated to preserve liquidity. Prior year free cash flow results included the impact of the acquisition of LPW Technology Ltd., for a cash purchase price of $79.0 million.
Capital expenditures for property, plant, equipment and software were $171.4 million for fiscal year 2020 as compared to $180.3 million for fiscal year 2019. In fiscal year 2021, we expect capital expenditures to be approximately $120 million.
Dividends for fiscal year 2020 were $38.8 million, as compared with $38.6 million in the prior year and were paid at the quarterly rate of $0.20 per share of common stock in fiscal year 2020 and 2019, respectively.
For the fiscal years ended June 30, 2020, 2019 and 2018, interest costs totaled $28.8 million, $31.1 million and $31.1 million, respectively, of which $9.0 million, $5.1 million and $2.8 million, respectively, were capitalized as part of the cost of property, plant, equipment and software.
During fiscal year 2020, we made required minimum pension contributions of $6.5 million to one of our qualified pension plans and are required to make cash contributions of $19.3 million to two of our qualified pension plans during fiscal year 2021. Over the next five years, current estimates indicate that we will be required to make about $186.8 million of cash contributions to our pension plans, based on the laws in effect for pension funding as of June 30, 2020, and subject to market returns and interest rate assumptions.
We have demonstrated the ability to generate cash to meet our needs through cash flows from operations, management of working capital and the availability of outside sources of financing to supplement internally generated funds. We generally target minimum liquidity, consisting of cash and cash equivalents added to available borrowing capacity under our credit agreement, of $150.0 million. On March 31, 2017, we entered into a new $400.0 million Credit Agreement (the “Credit Agreement”) that extends to March 2022. As of June 30, 2020, we had $6.0 million of issued letters of credit and $170.0 million of short-term borrowings. The balance of the Credit Agreement ($224.0 million as of June 30, 2020) remains available to us. As of June 30, 2020, we had total liquidity of $417.1 million, including $193.1 million of cash and cash equivalents. The Credit Agreement provides flexibility to fund our ongoing cash requirements as needed. From time to time during the year ended June 30, 2020 we have borrowed under our Credit Agreement. The weighted average daily borrowing under the Credit Agreement during the year ended June 30, 2020 was $106.4 million with daily outstanding borrowings ranging from $11.0 million to $170.0 million.
On July 10, 2020, we issued an underwritten public offering of $400 million in aggregate principal amount of our 6.375% senior notes due 2028. The net proceeds from the offering were used to repay $250 million on August 24, 2020, in principal amount of our senior notes at 5.20% due July 2021. Excess net proceeds will be used for general corporate purposes, including additions to working capital, capital expenditures, repayment of debt, the financing of acquisitions, joint ventures and other business combination opportunities or stock repurchases.
We evaluate liquidity needs for alternative uses including funding external growth opportunities, share repurchases as well as funding consistent dividend payments to stockholders. In fiscal years 2020 and 2019 we declared and paid quarterly cash dividends of $0.20 per share. In fiscal year 2018 and several years before, we declared and paid quarterly cash dividends of $0.18 per share.
32
As of June 30, 2020, we had cash and cash equivalents of approximately $23.5 million held at various foreign subsidiaries. Our global cash deployment considers, among other things, the geographic location of our subsidiaries’ cash balances, the locations of our anticipated liquidity needs and the cost to access international cash balances, as necessary. The Act required a one-time tax on previously deferred foreign earnings and generally provides for tax-free repatriations of these earnings beginning January 1, 2018. During the fiscal year ended June 30, 2020, we repatriated cash of $4.1 million from foreign jurisdictions. From time to time, we may make short-term intercompany borrowings against our cash held outside the United States in order to reduce or eliminate any required borrowing under our Credit Agreement.
We are subject to certain financial and restrictive covenants under the Credit Agreement, which, among other things, require the maintenance of a minimum interest coverage ratio (3.50 to 1.00 as of June 30, 2020). The interest coverage ratio is defined in the Credit Agreement as, for any period, the ratio of consolidated earnings before interest, taxes, depreciation and amortization and non-cash net pension expense (“EBITDA”) to consolidated interest expense for such period. The Credit Agreement also requires the Company to maintain a debt to capital ratio of less than 55 percent. The debt to capital ratio is defined in the Credit Agreement as the ratio of consolidated indebtedness, as defined therein, to consolidated capitalization, as defined therein. As of June 30, 2020, the Company was in compliance with all of the covenants of the Credit Agreement.
The following table shows our actual ratio performance with respect to the financial covenants, as of June 30, 2020:
Covenant | Covenant Requirement | Actual Ratio | ||
Consolidated interest coverage | 3.50 to 1.00 (minimum) | 15.42 to 1.00 | ||
Consolidated debt to capital | 55% (maximum) | 33% | ||
We continue to believe that we will maintain compliance with the financial and restrictive covenants in future periods. To the extent that we do not comply with the covenants under the Credit Agreement, this could reduce our liquidity and flexibility due to potential restrictions on borrowings available to us unless we are able to obtain waivers or modifications of the covenants.
Non-GAAP Financial Measures
The following provides additional information regarding certain non-GAAP financial measures that we use in this report. Our definitions and calculations of these items may not necessarily be the same as those used by other companies.
Net Sales and Gross Margin Excluding Surcharge Revenue and Special Items
This report includes discussions of net sales as adjusted to exclude the impact of raw material surcharge and the resulting impact on gross margins, as well as the inventory write-downs from restructuring, which represent financial measures that have not been determined in accordance with accounting principles generally accepted in the United States of America (“U.S. GAAP”). We present and discuss these financial measures because management believes removing the impact of raw material surcharge from net sales provides a more consistent basis for comparing results of operations from period to period for the reasons discussed earlier in this report. In addition, management believes that excluding the inventory write-downs from gross profit and gross margin is helpful in analyzing our operating performance as the inventory write-downs from restructuring are not indicative of ongoing operating performance. Management uses its results excluding these amounts to evaluate its operating performance and to discuss its business with investment institutions, our board of directors and others. See our earlier discussion of “Gross Profit” for a reconciliation of net sales and gross margin, excluding surcharge revenue and the excess inventory write-down, to net sales as determined in accordance with U.S. GAAP. Net sales and gross margin excluding surcharge revenue and the inventory write-downs from restructuring is not a U.S. GAAP financial measure and should not be considered in isolation of, or as a substitute for, net sales and gross margin calculated in accordance with U.S. GAAP.
33
Adjusted Operating Income and Adjusted Operating Margin Excluding Surcharge Revenue and Special Items
This report includes discussions of operating income and operating margin as adjusted to exclude the impact of raw material surcharge revenue and special items which represent financial measures that have not been determined in accordance with U.S. GAAP. We present and discuss these financial measures because management believes removing the impact of raw material surcharge from net sales provides a more consistent and meaningful basis for comparing results of operations from period to period for the reasons discussed earlier in this report. In addition, management believes that excluding special items from operating income and operating margin is helpful in analyzing our operating performance, as these items are not indicative of ongoing operating performance. Management uses its results excluding these amounts to evaluate its operating performance and to discuss its business with investment institutions, the Company’s board of directors and others. See our earlier discussion of operating income for a reconciliation of adjusted operating income and adjusted operating margin excluding special items to operating income and operating margin determined in accordance with U.S. GAAP. Adjusted operating income and adjusted operating margin excluding surcharge revenue and special items is not a U.S. GAAP financial measure and should not be considered in isolation of, or as a substitute for, operating income and operating margin calculated in accordance with U.S. GAAP.
Adjusted Earnings Per Share
The following provides a reconciliation of adjusted earnings per share, to its most directly comparable U.S. GAAP financial measures:
($ in millions, except per share data) | Income Before Income Taxes | Income Tax Expense | Net Income | Earnings Per Diluted Share* | ||||||||||||
Year ended June 30, 2020, as reported | $ | 6.1 | $ | (4.6 | ) | $ | 1.5 | $ | 0.02 | |||||||
Special items: | ||||||||||||||||
Restructuring and asset impairment charges | 97.8 | (20.0 | ) | 77.8 | 1.62 | |||||||||||
Goodwill impairment | 34.6 | (7.1 | ) | 27.5 | 0.57 | |||||||||||
Total impact of special items | 132.4 | (27.1 | ) | 105.3 | 2.19 | |||||||||||
Year ended June 30, 2020, as adjusted | $ | 138.5 | $ | (31.7 | ) | $ | 106.8 | $ | 2.21 | |||||||
* Impact per diluted share calculated using weighted average common shares outstanding of 48.2 million for the year ended June 30, 2020.
($ in millions, except per share data) | Income Before Income Taxes | Income Tax Expense | Net Income | Earnings Per Diluted Share* | ||||||||||||
Year ended June 30, 2019, as reported | $ | 216.0 | $ | (49.0 | ) | $ | 167.0 | $ | 3.43 | |||||||
Special item: | ||||||||||||||||
Acquisition-related costs | 1.2 | — | 1.2 | 0.03 | ||||||||||||
Year ended June 30, 2019, as adjusted | $ | 217.2 | $ | (49.0 | ) | $ | 168.2 | $ | 3.46 | |||||||
* Impact per diluted share calculated using weighted average common shares outstanding of 48.1 million for the year ended June 30, 2019.
34
Management believes that the presentation of earnings per share adjusted to exclude the impact of special items is helpful in analyzing the operating performance of the Company, as these items are not indicative of ongoing operating performance. Management uses its results excluding these amounts to evaluate its operating performance and to discuss its business with investment institutions, the Company's board of directors and others. Our definitions and calculations of these items may not necessarily be the same as those used by other companies. Adjusted earnings per share is not a U.S. GAAP financial measure and should not be considered in isolation of, or as a substitute for, earnings per share calculated in accordance with U.S. GAAP.
Free Cash Flow
The following provides a reconciliation of free cash flow, as used in this annual report, to its most directly comparable U.S. GAAP financial measures:
Fiscal Year | ||||||||||||
($ in millions) | 2020 | 2019 | 2018 | |||||||||
Net cash provided from operating activities | $ | 231.8 | $ | 232.4 | $ | 209.2 | ||||||
Purchases of property, plant, equipment and software | (171.4 | ) | (180.3 | ) | (135.0 | ) | ||||||
Acquisition of businesses, net of cash acquired | — | (79.0 | ) | (13.3 | ) | |||||||
Proceeds from disposals of property, plant and equipment and assets held for sale | 0.2 | 0.4 | 1.9 | |||||||||
Proceeds from note receivable from sale of equity method investment | — | — | 6.3 | |||||||||
Proceeds from insurance recovery | — | 11.4 | — | |||||||||
Dividends paid | (38.8 | ) | (38.6 | ) | (34.4 | ) | ||||||
Free cash flow | $ | 21.8 | $ | (53.7 | ) | $ | 34.7 | |||||
Management believes that the free cash flow measure provides useful information to investors regarding our financial condition because it is a measure of cash generated which management evaluates for alternative uses. It is management’s current intention to use excess cash to fund investments in capital equipment, acquisition opportunities and consistent dividend payments. Free cash flow is not a U.S. GAAP financial measure and should not be considered in isolation of, or as a substitute for, cash flows calculated in accordance with U.S. GAAP.
Critical Accounting Policies and Estimates
The preparation of the consolidated financial statements in conformity with generally accepted accounting principles requires management to make estimates and assumptions that affect the amounts of assets and liabilities and disclosure of contingent assets and liabilities at the date of the financial statements and the reported amounts of revenues and expenses during the reporting period. Actual results could differ from those estimates. On an on-going basis, we evaluate our estimates, including those related to bad debts, customer claims, inventories, goodwill, intangible assets, income taxes, pensions and other postretirement benefits, contingencies and litigation, environmental liabilities and derivative instruments and hedging activities.
We believe the following are the critical accounting policies and areas affected by significant judgments and estimates impacting the preparation of our consolidated financial statements.
Allowance for Doubtful Accounts
We maintain an allowance for doubtful accounts for estimated losses resulting from the failure of our customers to make required payments. We perform ongoing credit evaluations of our customers and monitor their payment patterns. Should the financial condition of our customers deteriorate, resulting in an impairment of their ability to make payments, additional allowances may be required.
Inventories
Inventories are stated at the lower of cost or new realizable value. The cost of inventories is primarily determined using the LIFO method. We also use the FIFO and average cost methods. As of June 30, 2020 and 2019, $136.3 million and $173.2 million of inventory, respectively, was accounted for using a method other than the LIFO method.
35
Costs include direct materials, direct labor, applicable manufacturing overhead and other direct costs. Under the LIFO inventory valuation method, changes in the cost of raw materials and production activities are recognized in cost of sales in the current period even though these materials and other costs may have been incurred at significantly different values due to the length of time of our production cycle. The prices for many of the raw materials we use have been volatile. Since we value most of our inventory utilizing the LIFO inventory costing methodology, rapid changes in raw material costs have an impact on our operating results. In a period of rising prices, cost of sales expense recognized under LIFO is generally higher than the cash costs incurred to acquire the inventory sold. Conversely, in a period of declining raw material prices, cost of sales recognized under LIFO is generally lower than cash costs incurred to acquire the inventory sold.
Since the LIFO inventory valuation methodology is designed for annual determination, interim estimates of the annual LIFO valuation are required. We recognize the effects of the LIFO inventory valuation method on an interim basis by estimating the expected annual LIFO cost based on cost changes to date. These projections of annual LIFO inventory valuation reserve changes are updated quarterly and are evaluated based upon material, labor and overhead costs.
Pension and Other Postretirement Benefits
The amount of the pension expense, which is determined annually, is based upon the value of the assets in the pension trusts at the beginning of the fiscal year as well as actuarial assumptions, such as the discount rate and the expected long-term rate of return on plan assets. The assumed long-term rate of return on pension plan assets is reviewed at each year-end based on the plan’s investment policies, an analysis of the historical returns of the capital markets and current interest rates. Based on the current funding level, the allocation policy for pension plan assets is to have approximately 60 percent in return seeking assets and 40 percent in liability matching assets. Return seeking assets include domestic and international equities and diversified loan funds. Liability matching assets include long duration bond funds. As the funding level of the plan improves in increments of 5 percent, assets will be shifted from return seeking to liability matching in increments of 4 percent as a de-risking strategy. The plan discount rate is determined by reference to the Bond:Link interest rate model based upon a portfolio of highly rated U.S. corporate bonds with individual bonds that are theoretically purchased to settle the plan’s anticipated cash outflows. The fluctuations in stock and bond markets could cause actual investment results to be significantly different from those assumed, and therefore, significantly impact the valuation of the assets in our pension trusts. Changes in actuarial assumptions could significantly impact the accounting for the pension assets and liabilities. If the assumed long-term rate of return on plan assets was changed by 0.25 percent, the net pension expense would change by $2.4 million. If the discount rate was changed by 0.25 percent, the net pension expense would change by $0.9 million.
Long-Lived Assets
Long-lived assets are reviewed for impairment and written down to fair value whenever events or changes in circumstances indicate that the carrying value may not be recoverable through estimated future undiscounted cash flows. The amount of the impairment loss is the excess of the carrying amount of the impaired assets over the fair value of the assets based upon estimated future discounted cash flows. We evaluate long-lived assets for impairment by individual business unit. Changes in estimated cash flows could have a significant impact on whether or not an asset is impaired and the amount of the impairment.
Goodwill
Goodwill is not amortized but instead is at least annually tested for impairment as of June 30, or more frequently if events or circumstances indicate that the carrying amount of goodwill may be impaired. Potential impairment is identified by comparing the fair value of a reporting unit to its carrying value. The fair value is estimated using a discounted cash flow technique for the Additive reporting unit. The fair value is estimated using a weighting of discounted cash flows and the use of market multiples valuation techniques for the SAO reporting unit and remaining three PEP segment reporting units. If the carrying value of the reporting unit exceeds its fair value, any impairment loss is measured by comparing the carrying value of the reporting unit’s goodwill to its implied fair value. The discounted cash flow technique requires the use of cash flow forecasts. The cash flow forecasts include significant judgments and assumptions related to revenue growth rates, which include perpetual growth rates, gross margin and weighted average cost of capital. The market multiples valuation technique includes significant judgment in the determination of the market multiple. The discount rates used in the discounted cash flow are estimated based on a market participant’s perspective of each reporting unit's weighted average cost of capital. The terminal value, which represents the value attributed to the reporting unit beyond the forecast period, is estimated using a perpetuity growth rate assumption.
36
As of June 30, 2020, we had five reporting units with goodwill recorded. Goodwill associated with our SAO reporting unit is tested at the SAO segment level and represents approximately 67 percent of our total goodwill. All other goodwill is associated with our PEP segment, which includes four reporting units with goodwill recorded. The fair value of the Additive reporting unit approximates the net book value at June 30, 2020. The fair values of the remaining PEP segment reporting units substantially exceeded their carrying values.
Carpenter has experienced slower than expected growth in the additive manufacturing industry with the effects being further compounded by COVID-19. Given current market conditions, the future projections for our Additive reporting unit were lowered. We determined the goodwill associated with this reporting unit was impaired and recorded an impairment charge of $34.6 million during the fiscal year ended June 30, 2020. No other impairment was identified at the impairment testing date. See Note 9 to our consolidated financial statements included in Item 8. “Financial Statements and Supplementary Data”.
As of June 30, 2020, the carrying value of the Additive reporting unit was greater than the fair value by approximately 24.1 percent. The goodwill recorded as of June 30, 2020, after the impairment charge, related to the Additive reporting unit was $45.6 million. For purposes of the discounted cash flow technique for Additive’s fair value, we used a weighted average cost of capital of 17.0 percent and a terminal growth rate assumption of 3 percent. If the fair value of this reporting unit had been hypothetically reduced by 5 percent at June 30, 2020, the Additive reporting unit would have a carrying value in excess of fair value of approximately $5.4 million.
As of June 30, 2020, the fair value of the SAO reporting unit exceeded the carrying value by approximately 4.5 percent. The goodwill recorded related to the SAO reporting unit as of June 30, 2020 was $195.5 million. For purposes of the discounted cash flow technique for SAO’s fair value, we used a weighted average cost of capital of 10.5 percent and a terminal growth rate assumption of 3 percent. If the fair value of this reporting unit had been hypothetically reduced by 5 percent at June 30, 2020, the SAO reporting unit would have a fair value that would approximate net book value.
The estimate of fair value requires significant judgment. We based our fair value estimates on assumptions that we believe to be reasonable but that are unpredictable and inherently uncertain, including estimates of future growth rates and operating margins and assumptions about the overall economic climate and the competitive environment for our business units. There can be no assurance that our estimates and assumptions made for purposes of our goodwill and identifiable intangible asset testing as of the time of testing will prove to be accurate predictions of the future. If our assumptions regarding business projections, competitive environments or anticipated growth rates are not correct, we may be required to record goodwill and/or intangible asset impairment charges in future periods, whether in connection with our next annual impairment testing or earlier, if an indicator of an impairment is present before our next annual evaluation. We continuously monitor for events and circumstances that could negatively impact the key assumptions in determining fair value of the reporting units. Given the evolving nature of and uncertainty driven by the COVID-19 pandemic, we will continue to evaluate the impact on the reporting units as adverse changes to these assumptions could result in future impairments.
Leases
Determination of whether a contract is or contains a lease at contract inception is based on the presence of identified assets and the right to obtain substantially all of the economic benefit from or to direct the use of such assets. When it is determined a lease exists, a right-of-use (“ROU”) asset and corresponding lease liability are recorded on the consolidated balance sheets. ROU assets represent the right to use an underlying asset for the lease term. Lease liabilities represent the obligation to make lease payments arising from the lease. ROU assets are recognized at commencement date at the value of the lease liability and are adjusted for any prepayments, lease incentives received, and initial direct costs incurred. Lease liabilities are recognized at lease commencement date based on the present value of remaining lease payments over the lease term. As the discount rate implicit in the lease is not readily determinable in most leases, an incremental borrowing rate is used. Lease terms include options to extend or terminate the lease when it is reasonably certain that the option will be exercised. Lease contracts with a term of 12 months or less are not recorded in the consolidated balance sheets. Fixed lease expense is recognized for operating leases on a straight-line basis over the lease term. Lease agreements with lease and non-lease components, are accounted for as a single lease component for all underlying asset classes. Accordingly, all costs associated with a lease contract are accounted for as lease costs. Some leasing arrangements require variable payments that are dependent on usage, output, or may vary for other reasons, such as insurance and tax payments. The variable lease payments are not presented as part of the ROU asset or lease liability.
37
Environmental Expenditures
Environmental expenditures that pertain to current operations or to future revenues are expensed or capitalized consistent with Carpenter’s capitalization policy for property, plant and equipment. Expenditures that result from the remediation of an existing condition caused by past operations and that do not contribute to current or future revenues are expensed. Liabilities are recognized for remedial activities when the remediation is probable and the cost can be reasonably estimated. Most estimated liabilities are not discounted to present value due to the uncertainty as to the timing and duration of expected costs. For one former operating facility site, due to the routine nature of the expected costs, the liability for future costs is discounted to present value over 20 years assuming a discount rate of approximately 3 percent as of June 30, 2020 and 2019.
Income Taxes
Deferred income taxes result from temporary differences in the recognition of income and expense for financial and income tax reporting purposes, or differences between the fair value of assets acquired in business combinations accounted for as purchases for financial reporting purposes and their corresponding tax bases. Deferred income taxes represent future tax benefits (assets) or costs (liabilities) to be recognized when those temporary differences reverse. We evaluate on a quarterly basis whether, based on all available evidence, we believe that our deferred income tax assets will be realizable. Valuation allowances are established when it is estimated that it is more likely than not that the tax benefit of the deferred tax assets will not be realized. The evaluation includes the consideration of all available evidence, both positive and negative, regarding historical operating results including recent years with reported losses, the estimated timing of future reversals of existing taxable temporary differences, estimated future taxable income exclusive of reversing temporary differences and carryforwards, and potential tax planning strategies which may be employed to prevent an operating loss or tax credit carryforward from expiring unused. Future realization of deferred income tax assets ultimately depends upon the existence of sufficient taxable income within the carryback or carryforward period available under tax law.
Management determines whether a tax position should be recognized in the financial statements by evaluating whether it is more likely than not that the tax position will be sustained upon examination by the tax authorities based upon the technical merits of the position. For those tax positions which should be recognized, the measurement of a tax position is determined as being the largest amount of benefit that is greater than 50 percent likely of being realized upon ultimate settlement. Interest and penalties on estimated liabilities for uncertain tax positions are recorded as components of the provision for income taxes.
Derivative Financial Instruments
Our current risk management strategies include the use of derivative instruments to reduce certain risks. The critical strategies include: (1) the use of commodity forward contracts to fix the price of a portion of anticipated future purchases of certain raw materials and energy to offset the effects of changes in the costs of those commodities; and (2) the use of foreign currency forward contracts to hedge a portion of anticipated future sales denominated in foreign currencies, principally the Euro and Pound Sterling, in order to offset the effect of changes in exchange rates. The commodity forwards and foreign currency forwards have been designated as cash flow hedges and unrealized net gains and losses are recorded in the accumulated other comprehensive loss component of stockholders’ equity. The unrealized gains or losses are reclassified to the income statement when the hedged transaction affects earnings or if the anticipated transactions are no longer expected to occur. We use interest rate swaps to maintain a certain level of floating rate debt relative to fixed rate debt. Interest rate swaps have been designated as fair value hedges. Accordingly, the mark-to-market values of both the interest rate swap and the underlying debt obligations are recorded as equal and offsetting gains and losses in the interest expense component of the consolidated statement of income. We have also used forward interest rate swaps to manage the risk of cash flow variability associated with fixed interest debt expected to be issued. We also use foreign currency forward contracts to protect certain short-term asset or liability positions denominated in foreign currencies against the effect of changes in exchange rates. These positions do not qualify for hedge accounting and accordingly are marked-to-market at each reporting date through charges to other income and expense.
New Accounting Pronouncements
For information with respect to new accounting pronouncements and the impact of these pronouncements on our consolidated financial statements, see Note 3 to Notes to Consolidated Financial Statements included in Item 8. “Financial Statements and Supplementary Data”.
Off Balance Sheet Arrangements
We had no off balance sheet arrangements during the periods presented.
38
Contractual Obligations
At June 30, 2020, we had the following contractual obligations and other commercial commitments and contingencies:
Fiscal Year | ||||||||||||||||||||||||||||
($ in millions) | Total | 2021 | 2022 | 2023 | 2024 | 2025 | Thereafter | |||||||||||||||||||||
Long-term debt (1) | $ | 550.0 | $ | — | $ | 250.0 | $ | 300.0 | $ | — | $ | — | $ | — | ||||||||||||||
Estimated interest payments (2) | 49.2 | 26.4 | 13.9 | 8.9 | — | — | — | |||||||||||||||||||||
Operating leases | 73.8 | 13.6 | 11.7 | 10.0 | 7.9 | 5.1 | 25.5 | |||||||||||||||||||||
Qualified pension plan contributions (3) | 263.2 | 19.3 | 42.5 | 44.7 | 46.4 | 33.9 | 76.4 | |||||||||||||||||||||
Accrued post-retirement benefits (4) | 143.1 | 14.0 | 14.6 | 14.6 | 14.7 | 14.6 | 70.6 | |||||||||||||||||||||
Purchase obligations (5) | 485.4 | 301.0 | 174.6 | 8.7 | 0.7 | 0.4 | — | |||||||||||||||||||||
Non-qualified pension benefits (6) | 32.7 | 3.5 | 3.5 | 3.4 | 3.3 | 3.3 | 15.7 | |||||||||||||||||||||
Total | $ | 1,597.4 | $ | 377.8 | $ | 510.8 | $ | 390.3 | $ | 73.0 | $ | 57.3 | $ | 188.2 | ||||||||||||||
(1) Refer to Note 11 of our Notes to Consolidated Financial Statements included in Item 8. “Financial Statements and Supplementary Data”.
(2) Estimated interest payments for long-term debt were calculated based on the applicable rates and payment dates for long-term debt outstanding as of June 30, 2020. No consideration was given to financing transactions executed in July 2020. No interest payments are included for any potential borrowings under our revolving credit facility.
(3) Qualified pension plan contributions represent required minimum contributions for plan years beginning January 1, 2019 and thereafter. The amounts were calculated based on actuarial valuations as prescribed by pension funding regulations in the United States effective June 30, 2020. Estimated fiscal year contributions have been included through fiscal year 2030. The actual required pension contributions in future periods may be different.
(4) Postretirement benefits for certain plans may be paid from corporate assets or certain designated plan assets maintained in a Voluntary Employee Benefit Association (“VEBA”) Trust. During fiscal years 2020 and 2019, benefit payments were funded using assets in the VEBA Trust. Estimated fiscal year postretirement benefit payments have been included through fiscal year 2030.
(5) We have entered into purchase commitments primarily for various key raw materials at market related prices, all made in the normal course of business. The commitments include both fixed and variable price provisions. We used June 30, 2020 raw material prices for commitments with variable pricing.
(6) Pension benefits for certain non-qualified plans are paid from corporate assets. There is no guarantee that future payments will be paid from corporate assets rather than plan assets.
Market Sensitive Instruments and Risk Management
See “Item 7A. Quantitative and Qualitative Disclosures About Market Risk” for discussion of market sensitive instruments and associated market risk for Carpenter.
39
Contingencies
Environmental
We are subject to various federal, state, local and international environmental laws and regulations relating to pollution, protection of public health and the environment, natural resource damages and occupational safety and health. Although compliance with these laws and regulations may affect the costs of our operations, compliance costs to date have not been material. We have environmental remediation liabilities at some of our owned operating facilities and have been designated as a potentially responsible party (“PRP”) with respect to certain third party Superfund waste-disposal sites and other third party-owned sites. Additionally, we have been notified that we may be a PRP with respect to other Superfund sites as to which no proceedings have been instituted against us. Neither the exact amount of remediation costs nor the final method of their allocation among all designated PRPs at these Superfund sites have been determined. Accordingly, at this time, we cannot reasonably estimate expected costs for such matters. The liability for future environmental remediation costs that can be reasonably estimated is evaluated on a quarterly basis. We accrue amounts for environmental remediation costs that represent our best estimate of the probable and reasonably estimable future costs related to environmental remediation. The liabilities recorded for environmental remediation costs at Superfund sites, other third party-owned sites and Carpenter-owned current or former operating facilities remaining at June 30, 2020 and 2019 were $16.0 million and $16.1 million, respectively.
Estimates of the amount and timing of future costs of environmental remediation requirements are inherently imprecise because of the continuing evolution of environmental laws and regulatory requirements, the availability and application of technology, the identification of currently unknown remediation sites and the allocation of costs among the PRPs. Based upon information currently available, such future costs are not expected to have a material effect on our financial position, results of operations or cash flows over the long-term. However, such costs could be material to our financial position, results of operations or cash flows in a particular future quarter or year.
Other
We are defending various routine claims and legal actions that are incidental to our business, and that are common to our operations, including those pertaining to product claims, commercial disputes, patent infringement, employment actions, employee benefits, compliance with domestic and foreign laws, personal injury claims and tax issues. Like many other manufacturing companies in recent years we, from time to time, have been named as a defendant in lawsuits alleging personal injury as a result of exposure to chemicals and substances in the workplace. We provide for costs relating to these matters when a loss is probable and the amount of the loss is reasonably estimable. The effect of the outcome of these matters on our future results of operations and liquidity cannot be predicted because any such effect depends on future results of operations and the amount and timing (both as to recording future charges to operations and cash expenditures) of the resolution of such matters. While it is not feasible to determine the outcome of these matters, we believe that the total liability from these matters will not have a material effect on our financial position, results of operations or cash flows over the long-term. However, there can be no assurance that an increase in the scope of pending matters or that any future lawsuits, claims, proceedings or investigations will not be material to our financial position, results of operations or cash flows in a particular future quarter or year.
40
Forward-Looking Statements
This Annual Report on Form 10-K contains forward-looking statements within the meaning of the Private Securities Litigation Act of 1995. These forward-looking statements are subject to risks and uncertainties that could cause actual results to differ from those projected, anticipated or implied. The most significant of these uncertainties are described in this Form 10-K. They include but are not limited to: (1) the cyclical nature of the specialty materials business and certain end-use markets, including aerospace, defense, medical, transportation, energy, industrial and consumer, or other influences on Carpenter Technology’s business such as new competitors, the consolidation of competitors, customers, and suppliers or the transfer of manufacturing capacity from the United States to foreign countries; (2) the ability of Carpenter Technology to achieve cash generation, growth, earnings, profitability, operating income, cost savings and reductions, qualifications, productivity improvements or process changes; (3) the ability to recoup increases in the cost of energy, raw materials, freight or other factors; (4) domestic and foreign excess manufacturing capacity for certain metals; (5) fluctuations in currency exchange rates; (6) the effect of government trade actions; (7) the valuation of the assets and liabilities in Carpenter Technology’s pension trusts and the accounting for pension plans; (8) possible labor disputes or work stoppages; (9) the potential that our customers may substitute alternate materials or adopt different manufacturing practices that replace or limit the suitability of our products; (10) the ability to successfully acquire and integrate acquisitions; (11) the availability of credit facilities to Carpenter Technology, its customers or other members of the supply chain; (12) the ability to obtain energy or raw materials, especially from suppliers located in countries that may be subject to unstable political or economic conditions; (13) Carpenter Technology’s manufacturing processes are dependent upon highly specialized equipment located primarily in facilities in Reading and Latrobe, Pennsylvania and Athens, Alabama for which there may be limited alternatives if there are significant equipment failures or a catastrophic event; (14) the ability to hire and retain key personnel, including members of the executive management team, management, metallurgists and other skilled personnel; (15) fluctuations in oil and gas prices and production; (16) uncertainty regarding the return to service of the Boeing 737 MAX aircraft and the related supply chain disruption; (17) potential impacts of the COVID-19 pandemic on our operations, financial results and financial position; (18) our efforts and efforts by governmental authorities to mitigate the COVID-19 pandemic, such as travel bans, shelter in place orders and business closures, and the related impact on resource allocations and manufacturing and supply chains; (19) our status as a “critical”, “essential” or “life-sustaining” business in light of COVID-19 business closure laws, orders and guidance being challenged by a governmental body or other applicable authority; (20) our ability to execute our business continuity, operational, budget and fiscal plans in light of the COVID-19 pandemic; and (21) our ability to successfully carry out restructuring and business exit activities on the expected terms and timelines. Any of these factors could have an adverse and/or fluctuating effect on Carpenter Technology’s results of operations. The forward-looking statements in this document are intended to be subject to the safe harbor protection provided by Section 27A of the Securities Act of 1933, as amended (the “Securities Act”), and Section 21E of the Securities Exchange Act of 1934, as amended. Carpenter Technology undertakes no obligation to update or revise any forward-looking statements.
Item 7A. Quantitative and Qualitative Disclosures about Market Risk
We use derivative financial instruments to reduce certain types of financial risk. Firm price sales arrangements involve a risk of profit margin fluctuations particularly as raw material prices have been volatile. Firm price sales arrangements generally include certain annual purchasing commitments and consumption schedules agreed to by the customers at selling prices based on raw material prices at the time the arrangements are established. As discussed in Note 17 to the consolidated financial statements included in Part II, Item 8. “Financial Statements and Supplementary Data”, in order to reduce the risk of fluctuating profit margins on these sales, we enter into commodity forward contracts to purchase certain critical raw materials necessary to produce the products sold under the firm price sales arrangements. If a customer fails to perform its obligations under the firm price sales arrangements, we may realize losses as a result of the related commodity forward contracts. As of June 30, 2020, we had approximately $11.1 million of net deferred losses related to commodity forward contracts to purchase certain raw materials. A large portion of this balance is related to commodity forward contracts to support firm price sales arrangements associated with many customers. However, approximately 70 percent of these net deferred losses relate to commodity forward contracts entered into to support sales under firm price sales arrangements with one customer in addition to credit already extended to this customer in connection with outstanding trade receivables. Our customers have historically performed under these arrangements and we believe that they will honor such obligations in the future.
We are actively involved in managing risks associated with energy resources. Risk containment strategies include interaction with primary and secondary energy suppliers as well as obtaining adequate insurance coverage to compensate us for potential business interruption related to lack of availability of energy resources. In addition, we have used forwards to fix the price of a portion of our anticipated future purchases of certain energy requirements to protect against the impact of significant increases in energy costs. We also use surcharge mechanisms to offset a portion of these charges where appropriate.
41
Fluctuations in foreign currency exchange rates could subject us to risk of losses on anticipated future cash flows from our international operations or customers. Foreign currency forward contracts are used to hedge certain foreign exchange risk.
We use interest rate swaps to achieve a level of floating rate debt relative to fixed rate debt where appropriate. Historically, we have entered into forward swap contracts to manage the risk of cash flow variability associated with fixed interest debt expected to be issued.
All hedging strategies are reviewed and approved by senior financial management before being implemented. Senior financial management has established policies regarding the use of derivative instruments that prohibit the use of speculative or leveraged derivatives.
Based on the current funding level, the allocation policy for our largest pension plan assets is to have approximately 60 percent in return seeking assets and 40 percent in liability matching assets. Return seeking assets include domestic and international equities and diversified loan funds. Liability matching assets include long duration bond funds. As the funding level of the plan improves in increments of 5 percent, assets will be shifted from return seeking to liability matching in increments of 4 percent as a de-risking strategy.
The status of our financial instruments as of June 30, 2020 is provided in Note 17 to the consolidated financial statements included in Item 8. “Financial Statements and Supplementary Data”. Assuming on June 30, 2020, (a) an instantaneous 10 percent decrease in the price of raw materials and energy for which we have commodity forward contracts, and (b) a 10 percent strengthening of the U.S. dollar versus foreign currencies for which foreign exchange forward contracts existed, our results of operations would not have been materially affected in either scenario.
42
Item 8. Financial Statements and Supplementary Data
Index to Consolidated Financial Statements and Supplementary Data
Page | |
Consolidated Financial Statements: | |
Management’s Responsibilities for Financial Reporting | |
Management’s Report on Internal Control Over Financial Reporting | |
Report of Independent Registered Public Accounting Firm | |
Consolidated Statements of Income for the Years Ended June 30, 2020, 2019 and 2018 | |
Consolidated Statements of Comprehensive (Loss) Income for the Years Ended June 30, 2020, 2019 and 2018 | |
Consolidated Statements of Cash Flows for the Years Ended June 30, 2020, 2019 and 2018 | |
Consolidated Balance Sheets as of June 30, 2020 and 2019 | |
Consolidated Statements of Changes in Equity for the Years Ended June 30, 2020, 2019 and 2018 | |
Notes to Consolidated Financial Statements | |
Supplementary Data: | |
Quarterly Financial Data (Unaudited) | |
Schedule II. Valuation and Qualifying Accounts for the Years Ended June 30, 2020, 2019 and 2018 | |
43
Management’s Responsibilities for Financial Reporting
Management prepared the financial statements included in this Annual Report on Form 10-K and is responsible for their integrity and objectivity. The statements were prepared in conformity with accounting principles generally accepted in the United States of America and, as such, include amounts based on management’s best judgments and estimates. Financial information elsewhere in this Annual Report is consistent with that in the financial statements.
Carpenter maintains a system of internal controls, supported by a code of conduct, designed to provide reasonable assurance that assets are safeguarded and transactions are properly executed and recorded for the preparation of financial information. We believe Carpenter’s system of internal controls provides this appropriate balance. The system of internal controls and compliance is continually monitored by Carpenter’s internal audit staff.
The Audit/Finance Committee of the Board of Directors, composed of independent directors, meets regularly with management, Carpenter’s internal auditors and our independent registered public accounting firm to consider audit results and to discuss significant internal control, auditing and financial reporting matters. Both the independent registered public accounting firm and internal auditors have unrestricted access to the Audit/Finance Committee.
Management’s Report on Internal Control Over Financial Reporting
Management is responsible for establishing and maintaining adequate internal control over financial reporting. Because of its inherent limitations, internal control over financial reporting may not prevent or detect misstatements. Also, projections of any evaluations of effectiveness to future periods are subject to the risk that controls may become inadequate because of changes in conditions, or that the degree of compliance with the policies or procedures may deteriorate.
Management assessed the effectiveness of Carpenter’s internal control over financial reporting as of June 30, 2020. In making this assessment, it used the criteria set forth by the Committee of Sponsoring Organizations of the Treadway Commission (COSO) in Internal Control — Integrated Framework (2013).
Based on its assessment, management concluded that, as of June 30, 2020, Carpenter’s internal control over financial reporting is effective based on those criteria.
The effectiveness of Carpenter’s internal control over financial reporting as of June 30, 2020 has been audited by PricewaterhouseCoopers LLP, an independent registered public accounting firm, as stated in their report appearing herein.
/s/ Tony R. Thene |
Tony R. Thene |
President and Chief Executive Officer |
/s/ Timothy Lain |
Timothy Lain |
Senior Vice President and Chief Financial Officer |
44
Report of Independent Registered Public Accounting Firm
To the Board of Directors and
Shareholders of Carpenter Technology Corporation
Opinions on the Financial Statements and Internal Control over Financial Reporting
We have audited the accompanying consolidated balance sheets of Carpenter Technology Corporation and its subsidiaries (the “Company”) as of June 30, 2020 and 2019, and the related consolidated statements of income, of comprehensive (loss) income, of changes in equity and of cash flows for each of the three years in the period ended June 30, 2020, including the related notes and financial statement schedule listed in the accompanying index (collectively referred to as the “consolidated financial statements”). We also have audited the Company's internal control over financial reporting as of June 30, 2020, based on criteria established in Internal Control - Integrated Framework (2013) issued by the Committee of Sponsoring Organizations of the Treadway Commission (COSO).
In our opinion, the consolidated financial statements referred to above present fairly, in all material respects, the financial position of the Company as of June 30, 2020 and 2019, and the results of its operations and its cash flows for each of the three years in the period ended June 30, 2020 in conformity with accounting principles generally accepted in the United States of America. Also in our opinion, the Company maintained, in all material respects, effective internal control over financial reporting as of June 30, 2020, based on criteria established in Internal Control - Integrated Framework (2013) issued by the COSO.
Change in Accounting Principle
As discussed in Note 3 to the consolidated financial statements, the Company changed the manner in which it accounts for leases in 2020.
Basis for Opinions
The Company's management is responsible for these consolidated financial statements, for maintaining effective internal control over financial reporting, and for its assessment of the effectiveness of internal control over financial reporting, included in the accompanying Management’s Report on Internal Control Over Financial Reporting. Our responsibility is to express opinions on the Company’s consolidated financial statements and on the Company's internal control over financial reporting based on our audits. We are a public accounting firm registered with the Public Company Accounting Oversight Board (United States) (PCAOB) and are required to be independent with respect to the Company in accordance with the U.S. federal securities laws and the applicable rules and regulations of the Securities and Exchange Commission and the PCAOB.
We conducted our audits in accordance with the standards of the PCAOB. Those standards require that we plan and perform the audits to obtain reasonable assurance about whether the consolidated financial statements are free of material misstatement, whether due to error or fraud, and whether effective internal control over financial reporting was maintained in all material respects.
Our audits of the consolidated financial statements included performing procedures to assess the risks of material misstatement of the consolidated financial statements, whether due to error or fraud, and performing procedures that respond to those risks. Such procedures included examining, on a test basis, evidence regarding the amounts and disclosures in the consolidated financial statements. Our audits also included evaluating the accounting principles used and significant estimates made by management, as well as evaluating the overall presentation of the consolidated financial statements. Our audit of internal control over financial reporting included obtaining an understanding of internal control over financial reporting, assessing the risk that a material weakness exists, and testing and evaluating the design and operating effectiveness of internal control based on the assessed risk. Our audits also included performing such other procedures as we considered necessary in the circumstances. We believe that our audits provide a reasonable basis for our opinions.
45
Definition and Limitations of Internal Control over Financial Reporting
A company’s internal control over financial reporting is a process designed to provide reasonable assurance regarding the reliability of financial reporting and the preparation of financial statements for external purposes in accordance with generally accepted accounting principles. A company’s internal control over financial reporting includes those policies and procedures that (i) pertain to the maintenance of records that, in reasonable detail, accurately and fairly reflect the transactions and dispositions of the assets of the company; (ii) provide reasonable assurance that transactions are recorded as necessary to permit preparation of financial statements in accordance with generally accepted accounting principles, and that receipts and expenditures of the company are being made only in accordance with authorizations of management and directors of the company; and (iii) provide reasonable assurance regarding prevention or timely detection of unauthorized acquisition, use, or disposition of the company’s assets that could have a material effect on the financial statements.
Because of its inherent limitations, internal control over financial reporting may not prevent or detect misstatements. Also, projections of any evaluation of effectiveness to future periods are subject to the risk that controls may become inadequate because of changes in conditions, or that the degree of compliance with the policies or procedures may deteriorate.
Critical Audit Matters
The critical audit matter communicated below is a matter arising from the current period audit of the consolidated financial statements that was communicated or required to be communicated to the audit committee and that (i) relates to accounts or disclosures that are material to the consolidated financial statements and (ii) involved our especially challenging, subjective, or complex judgments. The communication of critical audit matters does not alter in any way our opinion on the consolidated financial statements, taken as a whole, and we are not, by communicating the critical audit matter below, providing a separate opinion on the critical audit matter or on the accounts or disclosures to which it relates.
Goodwill Impairment Assessment - Specialty Alloys Operations and Additive Reporting Units
As described in Notes 1 and 9 to the consolidated financial statements, the Company’s consolidated goodwill balance was $290.4 million as of June 30, 2020 and the goodwill associated with the Specialty Alloys Operations (SAO) and Additive reporting units was $195.5 million and $45.6 million, respectively. Goodwill is annually tested for impairment as of June 30, or more frequently if events or circumstances indicate that the carrying amount of goodwill may be impaired. Potential impairment is identified by comparing the fair value of a reporting unit to its carrying value, including goodwill. The fair value is estimated using a weighting of discounted cash flows and market multiples valuation technique for the SAO reporting unit and is estimated using a discounted cash flow technique for the Additive reporting unit. As described by management, the Company has experienced slower than expected growth in the additive manufacturing industry with the effects being further compounded by the COVID-19 pandemic. Management determined the goodwill associated with the Additive reporting unit was impaired and recorded an impairment charge of $34.6 million during the year ended June 30, 2020. The discounted cash flow technique requires the use of cash flow forecasts. The cash flow forecasts include significant judgments and assumptions related to revenue growth rates, which include perpetual growth rates, gross margin and weighted average cost of capital. The market multiples valuation technique includes significant judgment in the determination of the market multiples.
The principal considerations for our determination that performing procedures relating to the goodwill impairment assessment of the SAO and Additive reporting units is a critical audit matter are the significant judgment by management when developing the fair value measurement of the SAO reporting unit using the discounted cash flow and market multiples valuation techniques and the Additive reporting unit using the discounted cash flow valuation technique, which in turn led to a high degree of auditor judgment, subjectivity, and effort in performing procedures to evaluate management’s significant assumptions related to (i) the revenue growth rates (which include perpetual growth rates) gross margin, weighted average cost of capital and market multiples for the SAO reporting unit and (ii) the revenue growth rates and weighted average cost of capital for the Additive reporting unit. In addition, the audit effort involved the use of professionals with specialized skill and knowledge.
46
Addressing the matter involved performing procedures and evaluating audit evidence in connection with forming our overall opinion on the consolidated financial statements. These procedures included testing the effectiveness of controls relating to management’s goodwill impairment assessment, including controls over the valuation of the Company’s reporting units. These procedures also included, among others, (i) testing management’s process for developing the fair value estimates, which included evaluating the appropriateness of the discounted cash flow and market multiples valuation techniques; (ii) testing the completeness, accuracy and relevance of underlying data used in the estimates; and (iii) evaluating the significant assumptions used by management related to the revenue growth rates (which include perpetual growth rates) gross margin, weighted average cost of capital and market multiples for the SAO reporting unit and the revenue growth rates and weighted average cost of capital for the Additive reporting unit. Evaluating management’s assumptions related to the revenue growth rates (which include perpetual growth rates) gross margin, weighted average cost of capital and market multiples as applicable to the relevant reporting units, involved evaluating whether the assumptions were reasonable considering (i) the current and past performance of the reporting units, (ii) the consistency with external market and industry data and (iii) whether these assumptions were consistent with evidence obtained in other areas of the audit. Professionals with specialized skill and knowledge were used to assist in the evaluation of the Company’s discounted cash flow and market multiple valuation techniques, and the weighted average cost of capital and market multiples assumptions.
/s/ PricewaterhouseCoopers LLP
Philadelphia, Pennsylvania
September 4, 2020
We have served as the Company’s auditor since 1918.
47
CARPENTER TECHNOLOGY CORPORATION
CONSOLIDATED STATEMENTS OF INCOME
For the Years Ended June 30, 2020, 2019 and 2018
($ in millions, except per share data) | 2020 | 2019 | 2018 | |||||||||
Net sales | $ | $ | $ | |||||||||
Cost of sales | ||||||||||||
Cost of sales - inventory write-downs from restructuring | ||||||||||||
Gross profit | ||||||||||||
Selling, general and administrative expenses | ||||||||||||
Restructuring and asset impairment charges | ||||||||||||
Goodwill impairment | ||||||||||||
Operating income | ||||||||||||
Interest expense | ( | ) | ( | ) | ( | ) | ||||||
Other income (expense), net | ( | ) | ||||||||||
Income before income taxes | ||||||||||||
Income tax expense (benefit) | ( | ) | ||||||||||
Net income | $ | $ | $ | |||||||||
EARNINGS PER COMMON SHARE: | ||||||||||||
Basic | $ | $ | $ | |||||||||
Diluted | $ | $ | $ | |||||||||
WEIGHTED AVERAGE COMMON SHARES OUTSTANDING: | ||||||||||||
Basic | ||||||||||||
Diluted | ||||||||||||
See accompanying notes to consolidated financial statements.
48
CARPENTER TECHNOLOGY CORPORATION
CONSOLIDATED STATEMENTS OF COMPREHENSIVE (LOSS) INCOME
For the Years ended June 30, 2020, 2019 and 2018
($ in millions) | 2020 | 2019 | 2018 | |||||||||
Net income | $ | $ | $ | |||||||||
Other comprehensive (loss) income, net of tax | .6 | |||||||||||
Cumulative adjustment upon adoption of ASU 2017-12 reclassified to reinvested earnings | ( | ) | ||||||||||
Pension and postretirement (losses) benefits, net of tax of $13.2, $23.2 and $(26.3), respectively | ( | ) | ( | ) | ||||||||
Net gain (loss) on derivative instruments, net of tax of $(1.2), $13.3 and $(13.7), respectively | ( | ) | ||||||||||
Marketable securities gain, net of tax of $0.0, $0.0 and $0.0, respectively | ||||||||||||
Foreign currency translation | ( | ) | ( | ) | ( | ) | ||||||
Other comprehensive (loss) income, net of tax | ( | ) | ( | ) | ||||||||
Comprehensive (loss) income, net of tax | $ | ( | ) | $ | $ | |||||||
See accompanying notes to consolidated financial statements.
49
CARPENTER TECHNOLOGY CORPORATION
CONSOLIDATED STATEMENTS OF CASH FLOWS
For the Years Ended June 30, 2020, 2019 and 2018
($ in millions) | 2020 | 2019 | 2018 | |||||||||
OPERATING ACTIVITIES | ||||||||||||
Net income | $ | $ | $ | |||||||||
Adjustments to reconcile net income to net cash provided from operating activities: | ||||||||||||
Depreciation and amortization | ||||||||||||
Goodwill impairment charge | ||||||||||||
Non-cash inventory write-downs from restructuring | ||||||||||||
Non-cash restructuring and asset impairment charges | ||||||||||||
Deferred income taxes | ( | ) | ( | ) | ||||||||
Net pension expense | ||||||||||||
Share-based compensation expense | ||||||||||||
Net loss on disposal of property, plant, and equipment and assets held for sale | ||||||||||||
Gain on insurance recovery | ( | ) | ||||||||||
Changes in working capital and other: | ||||||||||||
Accounts receivable | ( | ) | ( | ) | ||||||||
Inventories | ( | ) | ||||||||||
Other current assets | ( | ) | ( | ) | ||||||||
Accounts payable | ( | ) | ||||||||||
Accrued liabilities | ( | ) | ( | ) | ||||||||
Pension plan contributions | ( | ) | ( | ) | ( | ) | ||||||
Other postretirement plan contributions | ( | ) | ( | ) | ( | ) | ||||||
Other, net | ( | ) | ( | ) | ( | ) | ||||||
Net cash provided from operating activities | ||||||||||||
INVESTING ACTIVITIES | ||||||||||||
Purchases of property, plant, equipment and software | ( | ) | ( | ) | ( | ) | ||||||
Acquisition of businesses, net of cash acquired | ( | ) | ( | ) | ||||||||
Proceeds from disposals of property, plant and equipment and assets held for sale | ||||||||||||
Proceeds from insurance recovery | ||||||||||||
Proceeds from note receivable from sale of equity method investment | ||||||||||||
Proceeds from sales and maturities of marketable securities | ||||||||||||
Net cash used for investing activities | ( | ) | ( | ) | ( | ) | ||||||
FINANCING ACTIVITIES | ||||||||||||
Credit agreement borrowings | ||||||||||||
Credit agreement repayments | ( | ) | ( | ) | ||||||||
Net change in short-term credit agreement borrowings | ( | ) | ||||||||||
Dividends paid | ( | ) | ( | ) | ( | ) | ||||||
Payments on long-term debt | ( | ) | ||||||||||
Proceeds from stock options exercised | ||||||||||||
Withholding tax payments on share-based compensation awards | ( | ) | ( | ) | ( | ) | ||||||
Net cash provided from (used for) financing activities | ( | ) | ( | ) | ||||||||
Effect of exchange rate changes on cash and cash equivalents | ( | ) | ( | ) | ||||||||
INCREASE (DECREASE) IN CASH AND CASH EQUIVALENTS | ( | ) | ( | ) | ||||||||
Cash and cash equivalents at beginning of year | ||||||||||||
Cash and cash equivalents at end of year | $ | $ | $ | |||||||||
50
CARPENTER TECHNOLOGY CORPORATION
CONSOLIDATED BALANCE SHEETS
June 30, 2020 and 2019
($ in millions, except share data) | 2020 | 2019 | ||||||
ASSETS | ||||||||
Current assets: | ||||||||
Cash and cash equivalents | $ | $ | ||||||
Accounts receivable, net of allowance for doubtful accounts of $4.6 million and $3.7 million at June 30, 2020 and 2019, respectively | ||||||||
Inventories | ||||||||
Other current assets | ||||||||
Total current assets | ||||||||
Property, plant and equipment, net | ||||||||
Goodwill | ||||||||
Other intangibles, net | ||||||||
Deferred income taxes | ||||||||
Other assets | ||||||||
Total assets | $ | $ | ||||||
LIABILITIES | ||||||||
Current liabilities: | ||||||||
Short-term credit agreement borrowings | $ | $ | ||||||
Accounts payable | ||||||||
Accrued liabilities | ||||||||
Total current liabilities | ||||||||
Long-term debt | ||||||||
Accrued pension liabilities | ||||||||
Accrued postretirement benefits | ||||||||
Deferred income taxes | ||||||||
Other liabilities | ||||||||
Total liabilities | ||||||||
Contingencies and commitments (see Note 13) | ||||||||
STOCKHOLDERS’ EQUITY | ||||||||
Common stock — authorized 100,000,000 shares; issued 56,012,748 shares at June 30, 2020 and 55,808,743 shares at June 30, 2019; outstanding 47,850,468 shares at June 30, 2020 and 47,470,363 shares at June 30, 2019 | ||||||||
Capital in excess of par value | ||||||||
Reinvested earnings | ||||||||
Common stock in treasury (8,162,280 shares and 8,338,380 shares at June 30, 2020 and 2019, respectively), at cost | ( | ) | ( | ) | ||||
Accumulated other comprehensive loss | ( | ) | ( | ) | ||||
Total stockholders' equity | ||||||||
Total liabilities and stockholders' equity | $ | $ | ||||||
See accompanying notes to consolidated financial statements.
51
CARPENTER TECHNOLOGY CORPORATION
CONSOLIDATED STATEMENTS OF CHANGES IN EQUITY
For the Years Ended June 30, 2020, 2019 and 2018
Common Stock | |||||||||||||||||||||||||
($ in millions, except per share data) | Par Value of $5 | Capital in Excess of Par Value | Reinvested Earnings | Common Stock in Treasury | Accumulated Other Comprehensive (Loss) Income | Total Equity | |||||||||||||||||||
Balances at June 30, 2017 | $ | $ | $ | $ | ( | ) | $ | ( | ) | $ | |||||||||||||||
Net income | |||||||||||||||||||||||||
Pension and postretirement benefits gain, net of tax | |||||||||||||||||||||||||
Net gain on derivative instruments, net of tax | |||||||||||||||||||||||||
Foreign currency translation | ( | ) | ( | ) | |||||||||||||||||||||
Cash Dividends: | |||||||||||||||||||||||||
Common @ $0.72 per share | ( | ) | ( | ) | |||||||||||||||||||||
Share-based compensation plans | |||||||||||||||||||||||||
Stock options exercised | |||||||||||||||||||||||||
Balances at June 30, 2018 | ( | ) | ( | ) | |||||||||||||||||||||
Cumulative adjustment upon adoption of ASU 2017-12 | ( | ) | |||||||||||||||||||||||
Net income | |||||||||||||||||||||||||
Pension and postretirement benefits loss, net of tax | ( | ) | ( | ) | |||||||||||||||||||||
Marketable securities gain, net of tax | |||||||||||||||||||||||||
Net loss on derivative instruments, net of tax | ( | ) | ( | ) | |||||||||||||||||||||
Foreign currency translation | ( | ) | ( | ) | |||||||||||||||||||||
Cash Dividends: | |||||||||||||||||||||||||
Common @ $0.80 per share | ( | ) | ( | ) | |||||||||||||||||||||
Share-based compensation plans | |||||||||||||||||||||||||
Stock options exercised | |||||||||||||||||||||||||
Balances at June 30, 2019 | ( | ) | ( | ) | |||||||||||||||||||||
Net income | |||||||||||||||||||||||||
Pension and postretirement benefits loss, net of tax | ( | ) | ( | ) | |||||||||||||||||||||
Net gain on derivative instruments, net of tax | |||||||||||||||||||||||||
Foreign currency translation | ( | ) | ( | ) | |||||||||||||||||||||
Cash Dividends: | |||||||||||||||||||||||||
Common @ $0.80 per share | ( | ) | ( | ) | |||||||||||||||||||||
Share-based compensation plans | ( | ) | |||||||||||||||||||||||
Stock options exercised | |||||||||||||||||||||||||
Balances at June 30, 2020 | $ | $ | $ | $ | ( | ) | $ | ( | ) | $ | |||||||||||||||
See accompanying notes to consolidated financial statements.
52
CARPENTER TECHNOLOGY CORPORATION
CONSOLIDATED STATEMENTS OF CHANGES IN EQUITY (CONTINUED)
For the Years Ended June 30, 2020, 2019 and 2018
Common Shares | |||||||||
Issued | Treasury | Net Outstanding | |||||||
Balances at June 30, 2017 | ( | ) | |||||||
Stock options exercised | — | ||||||||
Share-based compensation plans | — | ||||||||
Balances at June 30, 2018 | ( | ) | |||||||
Stock options exercised | — | ||||||||
Share-based compensation plans | — | ||||||||
Balances at June 30, 2019 | ( | ) | |||||||
Stock options exercised | — | ||||||||
Share-based compensation plans | |||||||||
Balances at June 30, 2020 | ( | ) | |||||||
See accompanying notes to consolidated financial statements.
53
1. Summary of Significant Accounting Policies
Basis of Consolidation
The consolidated financial statements include the accounts of the Company and all majority-owned subsidiaries. All significant intercompany accounts and transactions are eliminated.
Revenue Recognition
Revenue, net of related discounts, rebates, returns and allowances of $25.8 million, $22.6 million and $26.5 million for the years ended June 30, 2020, 2019 and 2018, respectively, is recognized when performance obligations are satisfied under the terms of a customer order or contract. This is determined when title, ownership and risk of loss has transferred to the customer upon shipment or delivery of a product or when the service has been performed. These criteria are generally met upon shipment or delivery of the product based on the applicable shipping terms. Shipping terms may vary for products shipped outside the United States depending on the mode of transportation, the country where the material is shipped and any agreements made with the customers.
Freight and Handling Fees and Costs
Freight and handling costs billed separately to customers are included as part of net sales, and freight and handling costs expensed are included as part of cost of sales on the consolidated statements of income.
Research and Development
Research and development expenditures, which amounted to $28.0 million, $23.3 million and $19.3 million in fiscal years 2020, 2019 and 2018, respectively, are expensed as incurred and are generally reported in cost of sales in the consolidated statements of income. The research and development expenditures consist principally of salaries and benefits, building costs, utilities and administrative expenses. Substantially all development costs are related to developing new products or designing significant improvements to existing products or processes.
Cash Equivalents
Cash equivalents consist of highly liquid instruments with original maturities of three months or less. Cash equivalents are stated at cost, which approximates market.
Accounts Receivable
Inventories
Property, Plant and Equipment and Depreciation
Fixed assets are stated at historical cost, with the exception of assets acquired through acquisitions, which are recorded at fair value, less accumulated depreciation. Depreciation for financial reporting purposes is computed by the straight-line method over the estimated useful lives of the assets. Upon disposal, assets and related depreciation are removed from the accounts and the differences between the net amounts and proceeds from disposal are generally included in cost of goods sold in the consolidated statements of income.
54
Computer Software and Amortization
Goodwill
Goodwill, net of accumulated impairment losses, representing the excess of the cost over the net tangible and identifiable intangible assets of acquired businesses, is stated at cost. Goodwill is not amortized but instead is annually tested for impairment as of June 30, or more frequently if events or circumstances indicate that the carrying amount of goodwill may be impaired. Such events or circumstances include a decline in general economic conditions, adverse changes in the industry and markets, poor financial performance affecting earnings and cash flows and a trend of negative or declining cash flows over multiple periods.
Potential impairment is identified by comparing the fair value of a reporting unit to its carrying value, including goodwill. The fair value is estimated using a discounted cash flow technique for the Additive reporting unit. The fair value is estimated using a weighting of discounted cash flows and the use of market multiples valuation techniques for the SAO reporting unit and remaining three PEP segment reporting units.
The discounted cash flow technique requires the use of cash flow forecasts. The cash flow forecasts include significant judgments and assumptions related to revenue growth rates, which include perpetual growth rates, gross margin and weighted average cost of capital. The market multiples valuation technique includes significant judgment in the determination of the market multiples. If the carrying value of the reporting unit exceeds its fair value, any impairment loss is measured by comparing the carrying value of the reporting unit’s goodwill to its implied fair value.
Intangible assets
The costs of intangible assets, consisting principally of trademarks, trade names, non-compete arrangements, technology, patents and customer relationships are amortized on a straight-line basis over the estimated useful lives ranging from 5 to 30 years.
Impairment of Long-Lived Assets
Long-lived assets, including property, plant, equipment and intangible assets, subject to amortization are reviewed for impairment and written down to fair value whenever events or changes in circumstances indicate that the carrying value may not be recoverable through future undiscounted cash flows. The amount of the impairment loss is the excess of the carrying amount of the impaired assets over the fair value of the assets based upon discounted future cash flows. The Company determined that the impacts caused by COVID-19 represented a significant change in circumstances and as a result reviewed the long-lived assets for impairment as of June 30, 2020. As a result of this impairment analysis, no impairment was identified.
55
Leases
Determination of whether a contract is or contains a lease at contract inception is based on the presence of identified assets and the right to obtain substantially all of the economic benefit from or to direct the use of such assets. When it is determined a lease exists, a ROU asset and corresponding lease liability are recorded on the consolidated balance sheets. ROU assets represent the right to use an underlying asset for the lease term. Lease liabilities represent the obligation to make lease payments arising from the lease. On the lease commencement date, the Company measures and records a ROU asset and lease liability equal to the present value of the remaining lease payments, discounted using the rate implicit in the lease (or if that rate cannot be readily determined, an incremental borrowing rate). Lease terms include options to extend or terminate the lease when it is reasonably certain that the option will be exercised. Lease contracts with a term of 12 months or less are not recorded in the consolidated balance sheets. Fixed lease expense is recognized for operating leases on a straight-line basis over the lease term. Lease agreements with lease and non-lease components, are accounted for as a single lease component for all underlying asset classes. Accordingly, all costs associated with a lease contract are accounted for as lease costs. Some leasing arrangements require variable payments that are dependent on usage, output, or may vary for other reasons, such as insurance and tax payments. The variable lease payments are not presented as part of the ROU asset or lease liability.
Environmental Expenditures
Derivative Financial Instruments
All derivative financial instruments are recorded on the balance sheet at their fair value and changes in fair value are recorded each period in current earnings or other comprehensive income (loss). The Company enters into derivative financial instruments to hedge certain anticipated transactions, firm commitments or assets and liabilities denominated in foreign currencies. In addition, the Company utilizes interest rate swaps to convert fixed rate debt to floating rate debt.
Foreign Currency Translation
Assets and liabilities of international operations are translated into U.S. dollars at exchange rates in effect at year-end, and their income statements are translated at the average monthly exchange rates prevailing during the year. The resulting translation gains and losses are recorded each period as a component of accumulated other comprehensive income (loss) until the international entity is sold or liquidated. Gains and losses from transactions denominated in foreign currencies are reported in other income (expense), net in the consolidated statements of income.
Income Taxes
Deferred income taxes are recognized by applying enacted statutory tax rates, applicable to future years, to temporary differences between the tax basis and financial statement carrying values of the Company’s assets and liabilities. Valuation allowances are recorded to reduce deferred tax assets to amounts that are more likely than not to be realized.
Significant judgments, estimates and assumptions are required in determining tax return reporting positions and in calculating provisions for income tax, which are based on interpretations of tax regulations and accounting pronouncements. Liabilities are established for uncertain tax positions when it is more likely than not that such positions, if challenged, would not be sustained upon review by taxing authorities. These liabilities are re-evaluated as tax regulations and facts and circumstances change, such as the closing of a tax audit or the expiration of the statute of limitations for a specific exposure.
56
Earnings per Share
The Company calculates basic and diluted earnings per share using the two class method. Under the two class method, earnings are allocated to common stock and participating securities (restricted stock units that receive non-forfeitable dividends) according to their participation rights in dividends and undistributed earnings. The earnings available to each class of stock are divided by the weighted average number of shares for the period in each class. Diluted earnings per share assume the issuance of common stock for all potentially dilutive share equivalents outstanding.
Concentration of Credit Risk
Use of Estimates
The preparation of financial statements in conformity with generally accepted accounting principles requires management to make estimates and assumptions that affect the amounts of assets and liabilities and disclosure of contingent assets and liabilities at the date of the financial statements and the reported amounts of revenues and expenses during the reporting period. Actual results could differ from those estimates.
The global spread of the COVID-19 pandemic has created significant economic volatility, uncertainty and disruption. The extent to which the COVID-19 pandemic impacts our business, operations, financial results and financial position will depend on numerous evolving factors that the Company may not be able to accurately predict, including: the duration and scope of the pandemic; our efforts and efforts by governmental authorities to mitigate the COVID-19 pandemic, such as travel bans, shelter in place orders and business closures, and the related impact on resource allocations and manufacturing and supply chains; the impact of the pandemic on economic activity and actions taken in response; the effect on our customers’ demand for our goods and services and our vendors ability to supply us with raw materials; the impact of providing a safe working environment to our employees, our ability to sell and provide our goods and services, which may be limited as a result of travel restrictions and people working from home; the ability of our customers to pay for our goods and services; and any closures of our offices and facilities and our customers’ offices and facilities. Customers may also slow down decision-making, delay planned work or seek to terminate existing agreements.
The Company has assessed various accounting estimates and other matters, including those that require consideration of forecasted financial information, in context with the unknown future impacts of COVID-19 using information that is reasonably available to the Company at this time. As additional information becomes available, the future assessment of these estimates, including expectations at the time regarding the duration, scope and severity of the pandemic, as well as other factors, could materially adversely affect the consolidated financial statements in future reporting periods.
2. Restructuring Charges and Asset Impairment Charges
For fiscal year 2020, restructuring and asset impairment charges were $68.5 million. There were no restructuring and asset impairment charges for fiscal years 2019 or 2018.
57
As a result of the prolonged weakness in oil and gas drilling and exploration activities and the impact this weakness had on certain reporting units in the PEP segment, the Company approved a plan to exit the Amega West oil and gas business. As a result the Company recognized restructuring charges of $31.1 million. This includes non-cash impairment pre-tax charges of $26.8 million on certain long-lived assets, $21.2 million related to property, plant and equipment and $5.6 million associated with certain definite lived intangible assets during the year ended June 30, 2020. The Company also recognized $4.3 million for facility shut-down costs and various personnel-related costs for severance payments, medical coverage and related items.
The Company recorded a pre-tax charge of $20.7 million during the year ended June 30, 2020 to reflect site closure costs for two domestic powder facilities in the PEP segment consisting of non-cash adjustments of property, plant and equipment and other assets.
During the year ended June 30, 2020, the Company implemented a restructuring plan aimed at reducing fixed costs by eliminating 20 percent of global salaried positions across all business segments. In connection with this restructuring plan and other cost saving actions, the Company recorded a pre-tax charge of $8.4 million during the year ended June 30, 2020 consisting primarily of various personnel-related costs for severance payments, medical coverage and related items. Of this charge, $3.5 million will be paid from the Company’s qualified pension plan in fiscal year 2021, $0.9 million was recorded as non-cash forfeiture income related to share-based compensation in fiscal year 2020. The remaining balance will be paid by the Company in fiscal year 2021.
The Company recorded a pre-tax charge of $8.3 million during the year ended June 30, 2020 to reflect a non-cash write-down of software related to costs for an enterprise resource system that will not be implemented at a particular business unit.
Activity for restructuring and asset impairment charges at June 30, 2020 was as follows:
June 30, | ||||
($ in millions) | 2020 | |||
Restructuring charges and asset impairment charges | ||||
Non-cash asset impairment charges | ( | ) | ||
Payments to be made from qualified pension plan associated with restructuring charges | ( | ) | ||
Other items, net of cash payments | ||||
Reserve balance end of year | $ | |||
3. Recent Accounting Pronouncements
In February 2016, the Financial Accounting Standards Board ("FASB") issued Accounting Standards Update ("ASU") 2016-02 Leases (Topic 842) which replaces the existing guidance in ASC 840, Leases. The standard improves transparency and comparability among companies by recognizing lease assets and lease liabilities on the balance sheet and by disclosing key information about leasing arrangements. ASU 2016-02 is effective for public business entities for annual periods, including interim periods within those annual periods, beginning after December 15, 2018, with early adoption permitted. The Company adopted the provisions of ASU 2016-02 in the first quarter of fiscal year 2020 using the modified retrospective transition method, which did not require the Company to adjust comparative periods. Operating leases are included in other assets, accrued liabilities (current) and other liabilities (long-term) on the consolidated balance sheets. The Company’s ROU assets and lease liabilities are recognized on the lease commencement date in an amount that represents the present value of future lease payments. Upon adoption of the new lease guidance, the Company recorded a ROU asset and lease liability on the consolidated balance sheet for several types of operating leases, including land and buildings, equipment (e.g. trucks and forklifts), vehicles and computer equipment. The adoption of the standard had no impact on the Consolidated Statements of Income or the Consolidated Statements of Cash Flows. There was no cumulative effect of adopting the standard at the date of initial application in reinvested earnings.
58
The Company elected the package of practical expedients included in this guidance, which allowed it to not reassess: (i) whether any expired or existing contracts contain leases; (ii) the lease classification for any expired or existing leases; and, (iii) the initial direct costs for existing leases. The Company has elected the practical expedient to not separate lease components from nonlease components for all asset classes. The Company will recognize lease expense in the consolidated statements of operations on a straight-line basis over the lease term. The Company also made a policy election to not recognize ROU assets and lease liabilities for short-term leases with an initial term of 12 months or less for all asset classes. Leases with the option to extend their term or terminate early are reflected in the lease term when it is reasonably certain that the Company will exercise such options. The Company has expanded the disclosure of operating leases included in Note 14.
In February 2018, the FASB issued ASU 2018-02, Income Statement - Reporting Comprehensive Income (Topic 220) - Reclassification of Certain Tax Effects from Accumulated Other Comprehensive Income, which allows a reclassification from accumulated other comprehensive income (loss) to reinvested earnings for standard tax effects resulting from the Act to Provide for Reconciliation Pursuant to Titles II and V of the Concurrent Resolution on the Budget for Fiscal Year 2018 (the “Tax Cuts and Jobs Act”). ASU 2018-02 is effective for public business entities for annual periods, including interim periods within those annual periods, beginning after December 15, 2018, with early adoption permitted. The Company adopted the provisions of ASU 2018-02 in the first quarter of fiscal year 2020. The adoption of ASU 2018-02 did not materially impact the consolidated financial statements.
In August 2018, the FASB issued ASU 2018-15, Intangibles - Goodwill and Other - Internal Use Software (Subtopic 350-40) - Customer's Accounting for Implementation Costs Incurred in a Cloud Computing Arrangement That is a Service Contract, to help entities evaluate the accounting for fees paid by a customer in a cloud computing arrangement. ASU 2018-15 is effective for public business entities for annual periods, including interim periods within those annual periods, beginning after December 15, 2019, with early adoption permitted. The Company early adopted the provisions of ASU 2018-15 in the first quarter of fiscal year 2020 and elected the prospective adoption method. The adoption of ASU 2018-15 did not materially impact the consolidated financial statements.
Recently Issued Accounting Pronouncements - Pending Adoption.
At this time there are no issued pronouncements pending adoption that would materially impact the Company.
4. | Revenue |
The Company recognizes revenue in accordance with Topic 606, Revenue from Contracts. The Company applies the five-step model in the FASB’s guidance, which requires the Company to: (i) identify the contract with a customer; (ii) identify the performance obligations in the contract; (iii) determine the transaction price; (iv) allocate the transaction price to the performance obligations in the contract; and (v) recognize revenue when, or as, the Company satisfies a performance obligation.
The Company recognizes revenue when performance obligations under the terms of a customer purchase order or contract are satisfied. This occurs when control of the goods and services has transferred to the customer, which is generally determined when title, ownership and risk of loss pass to the customer, all of which occurs upon shipment or delivery of the product or the service is performed. Consignment transactions are arrangements where the Company transfers product to a customer location but retains ownership and control of such product until it is used by the customer. Revenue for consignment arrangements is recognized upon usage by the customer. Service revenue is recognized as the services are performed.
The customer purchase order or contract for goods transferred has a single performance obligation for which revenue is recognized at a point in time. The standard terms and conditions of a customer purchase order include general rights of return and product warranty provisions related to nonconforming product. Depending on the circumstances, the product is either replaced or a quality adjustment is issued. Such warranties do not represent a separate performance obligation.
Each customer purchase order or contract sets forth the transaction price for the products and services purchased under that arrangement. Some customer arrangements include variable consideration, such as volume rebates, which generally depend upon the Company’s customers meeting specified performance criteria, such as a purchasing level over a period of time. The Company exercises judgment to estimate the most likely amount of variable consideration at each reporting date.
59
Revenue is measured as the amount of consideration the Company expects to receive in exchange for its product. The normal payment terms are 30 days. The Company has elected to use the practical expedient that permits a Company to not adjust for the effects of a significant financing component if it expects that at the contract inception, the period between when the Company transfers a promised good or service to a customer and when the customer pays for that good or service will be one year or less.
Amounts billed to customers for shipping and handling activities to fulfill the Company’s promise to transfer the goods are included in revenues and costs incurred by the Company for the delivery of goods are classified as cost of sales in the consolidated statements of income. Shipping terms may vary for products shipped outside the United States depending on the mode of transportation, the country where the material is shipped and any agreements made with the customers.
Contract liabilities are recognized when the Company has received consideration from a customer to transfer goods or services at a future point in time when the Company performs under the purchase order or contract. Contract liabilities were $12.3 million and $10.5 million at June 30, 2020 and 2019, respectively, and are included in accrued liabilities on the consolidated balance sheets.
The Company elected the practical expedient that permits the omission of disclosure for remaining performance obligations which are expected to be satisfied in one year or less.
Disaggregation of Revenue
The Company operates in two business segments, Specialty Alloys Operations and Performance Engineered Products. Revenue is disaggregated within these two business segments by diversified end-use markets and by geographical location. Comparative information of the Company’s overall revenues by end-use markets and geography for years ended June 30, 2020, 2019 and 2018 were as follows:
End-Use Market Data | Year Ended June 30, | Year Ended June 30, | Year Ended June 30, | |||||||||||||||
($ in millions) | 2020 | 2019 | 2018 | |||||||||||||||
Aerospace and Defense | $ | $ | $ | |||||||||||||||
Medical | ||||||||||||||||||
Transportation | ||||||||||||||||||
Energy | ||||||||||||||||||
Industrial and Consumer | ||||||||||||||||||
Distribution | ||||||||||||||||||
Total net sales | $ | $ | $ | |||||||||||||||
Geographic Data | Year Ended June 30, | Year Ended June 30, | Year Ended June 30, | |||||||||||||||
($ in millions) | 2020 | 2019 | 2018 | |||||||||||||||
United States | $ | $ | $ | |||||||||||||||
Europe | ||||||||||||||||||
Asia Pacific | ||||||||||||||||||
Mexico | ||||||||||||||||||
Canada | ||||||||||||||||||
Other | ||||||||||||||||||
Total net sales | $ | $ | $ | |||||||||||||||
60
5. Acquisitions
On October 22, 2018, the Company acquired all the outstanding shares of LPW Technology Ltd. (“LPW”), for a cash purchase price of $79.0 million, net of cash acquired. The acquisition combines LPW’s metal powder lifecycle management technology and processes with the Company's technical expertise in producing highly engineered metal powders and additively manufactured components. The purchase price allocation was completed in the fourth quarter of fiscal year 2019 and resulted in the purchase price being allocated to: $2.1 million of accounts receivable, $4.5 million of inventory, $0.5 million of other current assets, $11.9 million of property, plant and equipment, $11.4 million of identifiable intangible assets, $59.0 million of goodwill, $4.4 million of accounts payable, $2.5 million of current liabilities and $3.5 million of other liabilities. The goodwill represented the benefits the Company expects to realize from LPW's metal powder lifecycle management technology and processes combined with the Company's technical expertise in producing highly engineered metal powders and additively manufactured components.
6. Earnings per Common Share
The calculations of basic and diluted earnings per common share for the years ended June 30, 2020, 2019 and 2018 were as follows:
Years Ended June 30, | ||||||||||||
(in millions, except per share data) | 2020 | 2019 | 2018 | |||||||||
Net income | $ | $ | $ | |||||||||
Less: earnings and dividends allocated to participating securities | ( | ) | ( | ) | ( | ) | ||||||
Earnings available for common shareholders used in calculation of basic earnings per share | $ | $ | $ | |||||||||
Weighted average number of common shares outstanding, basic | ||||||||||||
Basic earnings per common share | $ | $ | $ | |||||||||
Net income | $ | $ | $ | |||||||||
Less: earnings and dividends allocated to participating securities | ( | ) | ( | ) | ( | ) | ||||||
Earnings available for common shareholders used in calculation of diluted earnings per share | $ | $ | $ | |||||||||
Weighted average number of common shares outstanding, basic | ||||||||||||
Effect of shares issuable under share-based compensation plans | ||||||||||||
Weighted average number of common shares outstanding, diluted | ||||||||||||
Diluted earnings per common share | $ | $ | $ | |||||||||
61
The following awards issued under share-based compensation plans were excluded from the calculations of diluted earnings per share above because their effects were anti-dilutive:
Years Ended June 30, | |||||||||
(in millions) | 2020 | 2019 | 2018 | ||||||
Stock options | |||||||||
7. Inventories
Inventories consisted of the following components at June 30, 2020 and 2019:
June 30, | ||||||||
($ in millions) | 2020 | 2019 | ||||||
Raw materials and supplies | $ | $ | ||||||
Work in process | ||||||||
Finished and purchased products | ||||||||
Total inventory | $ | $ | ||||||
If the FIFO method of inventory had been used instead of the LIFO method, inventories would have been $134.5 million and $178.4 million higher as of June 30, 2020 and 2019, respectively. Current cost of LIFO-valued inventories was $722.5 million at June 30, 2020 and $793.0 million at June 30, 2019. The reductions in LIFO-valued inventories decreased cost of sales by $1.8 million during fiscal year 2020 and $0.0 million during fiscal year 2019 and $0.6 million during fiscal year 2018.
During the fourth quarter of fiscal year 2020, the Company recorded a $29.3 million inventory adjustment related to certain reporting units in the PEP segment due to targeted cost reduction actions including exiting the oil and gas business and the closure of two domestic powder facilities.
8. Property, Plant and Equipment
Property, plant and equipment consisted of the following components at June 30, 2020 and 2019:
June 30, | ||||||||
($ in millions) | 2020 | 2019 | ||||||
Land | $ | $ | ||||||
Buildings and building equipment | ||||||||
Machinery and equipment | ||||||||
Construction in progress | ||||||||
Total at cost | ||||||||
Less: accumulated depreciation | ||||||||
Total property, plant, and equipment | $ | $ | ||||||
The estimated useful lives of depreciable assets are as follows:
Asset Category | Useful Life (in Years) | |
Buildings and building equipment | 10 – 45 | |
Machinery and equipment | 3 – 30 | |
62
As a result of targeted cost reduction activities, as further described in Note 2, the Company approved a plan to exit the oil and gas business and closed two powder facilities in the PEP segment. As a result, the Company recorded an impairment charge related to property, plant and equipment of $31.4 million during fiscal year 2020.
Depreciation for the years ended June 30, 2020, 2019 and 2018 was $111.0 million, $108.1 million and $104.7 million, respectively.
9. Goodwill and Other Intangible Assets, Net
Goodwill
As of June 30, 2020, the Company had five reporting units with goodwill recorded. Goodwill associated with the SAO reporting unit is tested at the SAO segment level and represents approximately 67 percent of total goodwill. All other goodwill is associated with the PEP segment, which includes four reporting units with goodwill recorded. The fair value is estimated using a discounted cash flow technique for the Additive reporting unit. The fair value is estimated using a weighting of discounted cash flows and the use of market multiples valuation techniques for the SAO reporting unit and remaining three PEP segment reporting units.
The Company conducts goodwill impairment testing at least annually as of June 30, or more often if events, changes or circumstances indicate that the carrying amount may not be recoverable. The Company has experienced slower than expected growth in the additive manufacturing industry with the effects being further compounded by the COVID-19 pandemic. Given current market conditions, the speed of growth in the future projections for the Company's Additive reporting unit were lowered. The Company determined the goodwill associated with this reporting unit was impaired and recorded an impairment charge of $34.6 million during the fiscal year ended June 30, 2020.
As of June 30, 2020, the carrying value of the Additive reporting unit was greater than the fair value by approximately 24.1 percent. The goodwill recorded as of June 30, 2020, after the impairment charge, related to the Additive reporting unit was $45.6 million. For purposes of the discounted cash flow analysis for Additive’s fair value, the Company used a weighted average cost of capital of 17 percent and a terminal growth rate assumption of 3 percent. If the fair value of this reporting unit had been hypothetically reduced by 5 percent at June 30, 2020, the Additive reporting unit would have a carrying value in excess of fair value of approximately $5.4 million.
As of June 30, 2020, the fair value of the SAO reporting unit exceeded the carrying value by approximately 4.5 percent. The goodwill recorded related to the SAO reporting unit as of June 30, 2020 was $195.5 million. For purposes of the discounted cash flow analysis for SAO’s fair value, the Company used a weighted average cost of capital of 10.5 percent and a terminal growth rate assumption of 3 percent. If the fair value of this reporting unit had been hypothetically reduced by 5 percent at June 30, 2020, the SAO reporting unit would have a fair value that approximates net book value.
The fair values of the remaining PEP segment reporting units exceeded their carrying values, in each case, by 10 percent or more and the Company has determined there was no goodwill impairment for the other reporting units for the years ended June 30, 2020 and 2019. The Company continuously monitors for events and circumstances that could negatively impact the key assumptions in determining fair value of the reporting units. Given the evolving nature of and uncertainty driven by the COVID-19 pandemic, the Company will continue to evaluate the impact on the reporting units as adverse changes to these assumptions could result in future impairments.
63
The changes in the carrying amount of goodwill by reportable segment for fiscal years 2020 and 2019 were as follows:
($ in millions) | June 30, 2018 | Acquisition | June 30, 2019 | Impairment | Other | June 30, 2020 | ||||||||||||||||||
Goodwill | $ | $ | $ | $ | — | $ | ( | ) | $ | |||||||||||||||
Accumulated impairment losses | ( | ) | — | ( | ) | ( | ) | — | ( | ) | ||||||||||||||
Total goodwill | $ | $ | $ | $ | ( | ) | $ | ( | ) | $ | ||||||||||||||
Specialty Alloys Operations | $ | $ | — | $ | $ | — | $ | — | $ | |||||||||||||||
Performance Engineered Products | ( | ) | ( | ) | ||||||||||||||||||||
Total goodwill | $ | $ | $ | $ | ( | ) | $ | ( | ) | $ | ||||||||||||||
June 30, 2020 | June 30, 2019 | |||||||||||||||||||||||||||||
($ in millions) | Useful Life (in Years) | Gross Carrying Amount | Accumulated Amortization | Impairment | Net Carrying Amount | Gross Carrying Amount | Accumulated Amortization | Net Carrying Amount | ||||||||||||||||||||||
Trademarks and trade names | 15 - 30 | $ | $ | ( | ) | $ | ( | ) | $ | $ | ( | ) | $ | |||||||||||||||||
Customer relationships | 10 - 15 | ( | ) | ( | ) | ( | ) | |||||||||||||||||||||||
Non-compete agreements | ( | ) | ( | ) | ( | ) | ||||||||||||||||||||||||
Technology | ( | ) | ( | ) | ( | ) | ||||||||||||||||||||||||
Patents | 14 - 20 | ( | ) | ( | ) | |||||||||||||||||||||||||
Total | $ | $ | ( | ) | $ | ( | ) | $ | $ | $ | ( | ) | $ | |||||||||||||||||
The Company recorded $8.3 million of amortization expense related to intangible assets during fiscal year 2020, $7.3 million during fiscal year 2019 and $6.8 million during fiscal year 2018. The estimated annual amortization expense related to intangible assets for each of the succeeding five fiscal years is $6.8 million in fiscal years 2021, 2022, 2023, 2024 and 2025.
As a result of targeted cost reduction activities, the Company approved a plan to exit the oil and gas business and closed two powder facilities in the PEP segment. As a result, the Company recorded an impairment charge of $7.3 million related to definite lived intangible assets during fiscal year 2020. There is no remaining carrying value for these assets as of June 30, 2020.
64
10. Accrued Liabilities
Accrued liabilities consisted of the following as of June 30, 2020 and 2019:
June 30, | ||||||||
($ in millions) | 2020 | 2019 | ||||||
Accrued compensation and benefits | $ | $ | ||||||
Accrued pension liabilities | ||||||||
Accrued postretirement benefits | ||||||||
Deferred revenue | ||||||||
Short-term lease expense | — | |||||||
Derivative financial instruments | ||||||||
Accrued interest expense | ||||||||
Accrued income taxes | ||||||||
Other | ||||||||
Total accrued liabilities | $ | $ | ||||||
11. Debt
On March 31, 2017, the Company entered into a $400.0 million syndicated credit facility (“Credit Agreement”) that extends to March 2022. Interest on the borrowings under the Credit Agreement accrue at variable rates, based upon LIBOR or a defined “Base Rate,” both determined based upon the rating of the Company’s senior unsecured long-term debt (the “Debt Rating”). The applicable margin to be added to LIBOR ranges from 1.00 % to 1.75 % (1.25 % as of June 30, 2020), and for Base Rate-determined loans, from 0.00 % to 0.75 % (0.25 % as of June 30, 2020). The Company also pays a quarterly commitment fee ranging from 0.125 % to 0.400 % (0.20 % as of June 30, 2020), determined based upon the Debt Rating, of the unused portion of the $400.0 million commitment under the Credit Agreement. In addition, the Company must pay certain letter of credit fees, ranging from 1.00 % to 1.75 % (1.50 % as of June 30, 2020), with respect to letters of credit issued under the Credit Agreement. The Company has the right to voluntarily prepay and re-borrow loans and to terminate or reduce the commitments under the facility. As of June 30, 2020, the Company had $6.0 million of issued letters of credit under the Credit Agreement and $170.0 million of short-term borrowings, with the balance of $224.0 million available to the Company. As of June 30, 2020, the borrowing rate for the Credit Agreement was 1.43 %.
The Company is subject to certain financial and restrictive covenants under the Credit Agreement, which, among other things, require the maintenance of a minimum interest coverage ratio of 3.50 to 1.00. The interest coverage ratio is defined in the Credit Agreement as, for any period, the ratio of consolidated earnings before interest, taxes, depreciation and amortization and non-cash net pension expense (“EBITDA”) to consolidated interest expense for such period. The Credit Agreement also requires the Company to maintain a debt to capital ratio of less than 55 percent. The debt to capital ratio is defined in the Credit Agreement as the ratio of consolidated indebtedness, as defined therein, to consolidated capitalization, as defined therein. As of June 30, 2020, the Company was in compliance with all of the covenants of the Credit Agreement.
Long-term debt outstanding as of June 30, 2020 and 2019 consisted of the following:
June 30, | ||||||||
($ in millions) | 2020 | 2019 | ||||||
Senior unsecured notes, 5.20% due July 2021 (face value of $250.0 million at June 30, 2020 and 2019) | $ | $ | ||||||
Senior unsecured notes, 4.45% due March 2023 (face value of $300.0 million at June 30, 2020 and 2019) | ||||||||
Total | ||||||||
Less: amounts due within one year | ||||||||
Long-term debt, net of current portion | $ | $ | ||||||
65
Aggregate maturities of long-term debt for the five fiscal years subsequent to June 30, 2020, are $0.0 million in 2021, $250.0 million in 2022, $300.0 million in 2023 and $0.0 million in 2024 and 2025.
For the years ended June 30, 2020, 2019 and 2018, interest costs totaled $28.8 million, $31.1 million and $31.1 million, respectively, of which $9.0 million, $5.1 million and $2.8 million, respectively, were capitalized as part of the cost of property, plant, equipment and software.
12. Pension and Other Postretirement Benefits
The Company provides several noncontributory defined benefit pension plans to certain employees. The plans provide defined benefits based on years of service and final average salary.
The Company made minimum required contributions of $6.5 million and $5.5 million during fiscal years 2020 and 2019, respectively, to its qualified defined benefit pension plans.
The Company also provides other postretirement benefit plans to certain of its employees. The postretirement benefit plans consist of health care and life insurance plans. Plan assets are maintained in a Voluntary Employee Benefit Association (“VEBA”) Trust. During fiscal years 2020 and 2019, the Company funded benefit payments using assets in the VEBA Trust.
The following provides a reconciliation of benefit obligations, plan assets and funded status of the plans:
Pension Plans | Other Postretirement Plans | |||||||||||||||
($ in millions) | 2020 | 2019 | 2020 | 2019 | ||||||||||||
Change in projected benefit obligation: | ||||||||||||||||
Projected benefit obligation at beginning of year | $ | $ | $ | $ | ||||||||||||
Service cost | ||||||||||||||||
Interest cost | ||||||||||||||||
Benefits paid | ( | ) | ( | ) | ( | ) | ( | ) | ||||||||
Actuarial loss | ||||||||||||||||
Plan settlements | ( | ) | ||||||||||||||
Special termination benefits | ||||||||||||||||
Projected benefit obligation at end of year | ||||||||||||||||
Change in plan assets: | ||||||||||||||||
Fair value of plan assets at beginning of year | ||||||||||||||||
Actual return | ||||||||||||||||
Benefits paid | ( | ) | ( | ) | ( | ) | ( | ) | ||||||||
Contributions | ||||||||||||||||
Plan settlements | ( | ) | ||||||||||||||
Fair value of plan assets at end of year | ||||||||||||||||
Funded status of the plans | $ | ( | ) | $ | ( | ) | $ | ( | ) | $ | ( | ) | ||||
Amounts recognized in the consolidated balance sheets: | ||||||||||||||||
Accrued liabilities - current | ( | ) | ( | ) | ( | ) | ( | ) | ||||||||
Accrued pension liabilities - noncurrent | ( | ) | ( | ) | — | — | ||||||||||
Accrued postretirement benefits - noncurrent | — | — | ( | ) | ( | ) | ||||||||||
$ | ( | ) | $ | ( | ) | $ | ( | ) | $ | ( | ) | |||||
66
Pension Plans | Other Postretirement Plans | |||||||||||||||
($ in millions) | 2020 | 2019 | 2020 | 2019 | ||||||||||||
Amounts recognized in accumulated other comprehensive loss: | ||||||||||||||||
Net actuarial loss | $ | $ | $ | $ | ||||||||||||
Prior service cost (credit) | ( | ) | ( | ) | ||||||||||||
Total | $ | $ | $ | $ | ||||||||||||
Other changes in plan assets and benefit obligations recognized in other comprehensive loss consist of: | ||||||||||||||||
Net actuarial loss | $ | $ | $ | $ | ||||||||||||
Amortization of net loss | ( | ) | ( | ) | ( | ) | ( | ) | ||||||||
Amortization of prior service (cost) benefit | ( | ) | ( | ) | ||||||||||||
Total, before tax effect | $ | $ | $ | $ | ||||||||||||
Additional information: | ||||||||||||||||
Accumulated benefit obligation for all pension plans | $ | $ | N/A | N/A | ||||||||||||
The following is additional information related to plans with projected benefit obligations in excess of plan assets as of June 30, 2020 and 2019:
Pension Plans | Other Postretirement Plans | |||||||||||||||
($ in millions) | 2020 | 2019 | 2020 | 2019 | ||||||||||||
Projected benefit obligation | $ | $ | $ | $ | ||||||||||||
Fair value of plan assets | $ | $ | $ | $ | ||||||||||||
The following additional information is for plans with accumulated benefit obligations in excess of plan assets as of June 30, 2020 and 2019:
Pension Plans | Other Postretirement Plans | |||||||||||||||
($ in millions) | 2020 | 2019 | 2020 | 2019 | ||||||||||||
Accumulated benefit obligation | $ | $ | $ | $ | ||||||||||||
Fair value of plan assets | $ | $ | $ | $ | ||||||||||||
The components of the net periodic benefit cost related to the Company’s pension and other postretirement benefits for the years ended June 30, 2020, 2019 and 2018 are as follows:
Pension Plans | Other Postretirement Plans | |||||||||||||||||||||||
($ in millions) | 2020 | 2019 | 2018 | 2020 | 2019 | 2018 | ||||||||||||||||||
Service cost | $ | $ | $ | $ | $ | $ | ||||||||||||||||||
Interest cost | ||||||||||||||||||||||||
Expected return on plan assets | ( | ) | ( | ) | ( | ) | ( | ) | ( | ) | ( | ) | ||||||||||||
Amortization of net loss | ||||||||||||||||||||||||
Amortization of prior service cost (benefit) | ( | ) | ( | ) | ( | ) | ||||||||||||||||||
Net periodic benefit costs | $ | $ | $ | $ | $ | $ | ||||||||||||||||||
67
The service cost component of the Company’s net pension expense, which represents the estimated cost of future pension liabilities earned associated with active employees, is included in the operating income of the business segments. The residual net pension expense, which is comprised of the expected return on plan assets, interest costs on the projected benefit obligations of the plans, and amortization of actuarial gains and losses and prior service costs and (benefits), is presented in "Other Income (Expense), Net". See Note 19 to our consolidated financial statements included in Item 8. “Financial Statements and Supplementary Data”.
Weighted-average assumptions used to determine benefit obligations at fiscal year end | Pension Plans | Other Postretirement Plans | ||||||||||
2020 | 2019 | 2020 | 2019 | |||||||||
Discount rate | % | % | % | % | ||||||||
Rate of compensation increase | % | % | N/A | N/A | ||||||||
Weighted-average assumptions used to determine net periodic benefit cost for the fiscal year | ||||||||||||||||||
Pension Plans | Other Postretirement Plans | |||||||||||||||||
2020 | 2019 | 2018 | 2020 | 2019 | 2018 | |||||||||||||
Discount rate | % | % | % | % | % | % | ||||||||||||
Expected long-term rate of return on plan assets | % | % | % | % | % | % | ||||||||||||
Long-term rate of compensation increase | % | % | % | N/A | N/A | N/A | ||||||||||||
The following table shows the expected health care rate increase and the future rate and time at which it is expected to remain constant:
June 30, | ||||||
2020 | 2019 | |||||
Assumed health care cost trend rate | % | % | ||||
Rate to which the cost trend rate is assumed to decline and remain (the ultimate trend rate) | % | % | ||||
Year that the rate reaches the ultimate trend rate | 2025 | 2025 | ||||
Assumed health care cost trend rates have an effect on the amounts reported for other postretirement benefits. A one percentage point increase in the assumed health care cost trend rate would increase service and interest cost by $0.1 million and increase the postretirement benefit obligation by $2.5 million. A one percentage point decrease in the assumed health care cost trend rate would decrease service and interest cost by $0.1 million and decrease the postretirement benefit obligation by $2.2 million.
Amounts in other comprehensive loss (gain) that are expected to be recognized as components of net periodic benefit cost in the year ended June 30, 2021 are:
($ in millions) | Pension Plans | Other Postretirement Plans | Total | |||||||||
Amortization of prior service cost (benefit) | $ | $ | ( | ) | $ | ( | ) | |||||
Amortization of net actuarial loss | ||||||||||||
Amortization of accumulated other comprehensive loss (gain) | $ | $ | ( | ) | $ | |||||||
68
The Company’s U.S. pension plans’ weighted-average asset allocations at June 30, 2020 and 2019, by asset category are as follows:
2020 | 2019 | |||||
Equity securities | % | % | ||||
Fixed income securities | ||||||
Total | % | % | ||||
The Company’s policy for developing a pension plan investment strategy includes the periodic development of an asset and liability study by an independent investment consultant. Management considers this study in establishing an asset allocation that is presented to and approved by the Company’s Retirement Plan Committee.
Based on the current funding level, the allocation policy for the Company’s largest pension plan assets is to have approximately 60 percent in return seeking assets and 40 percent in liability matching assets. Return seeking assets include domestic and international equities and diversified loan funds. Liability matching assets include long duration bond funds. As the funding level of the plan improves in increments of 5 percent, assets will be shifted from return seeking to liability matching in increments of 4 percent as a de-risking strategy. The assets related to the Company’s other postretirement benefit plans were invested in approximately 76 percent U.S. equities and 24 percent short term investments as of June 30, 2020. Management establishes the expected long-term rate of return assumption by reviewing historical trends and analyzing the current and projected market conditions in relation to the plan’s asset allocation and risk management objectives. In determining the expected long-term rate of return, the Company considered historical returns for individual asset classes and the impact of active portfolio management.
The fair values of the Company’s pension plan assets as of June 30, 2020 and 2019, by asset category and by the levels of inputs used to determine fair value were as follows:
June 30, 2020 | ||||||||||||||||
Fair Value Measurements Using Input Type | ||||||||||||||||
($ in millions) | Level 1 | Level 2 | Net Asset Value | Total | ||||||||||||
Short-term investments | $ | $ | $ | $ | ||||||||||||
Domestic and international equities | ||||||||||||||||
Commingled funds | ||||||||||||||||
Limited partnerships | ||||||||||||||||
Government agency bonds | ||||||||||||||||
Corporate bonds | ||||||||||||||||
Mutual funds | ||||||||||||||||
Mortgage/asset backed securities and other | ||||||||||||||||
$ | $ | $ | $ | |||||||||||||
69
June 30, 2019 | ||||||||||||||||
Fair Value Measurements Using Input Type | ||||||||||||||||
($ in millions) | Level 1 | Level 2 | Net Asset Value | Total | ||||||||||||
Short-term investments | $ | $ | $ | $ | ||||||||||||
Domestic and international equities | ||||||||||||||||
Commingled funds | ||||||||||||||||
Limited partnerships | ||||||||||||||||
Government agency bonds | ||||||||||||||||
Corporate bonds | ||||||||||||||||
Mutual funds | ||||||||||||||||
Mortgage/asset backed securities and other | ||||||||||||||||
$ | $ | $ | $ | |||||||||||||
The fair values of the Company’s other postretirement benefit plans as of June 30, 2020 and 2019, by asset category and by the level of inputs used to determine fair value, were as follows:
June 30, 2020 | ||||||||||||||||
Fair Value Measurements Using Input Type | ||||||||||||||||
($ in millions) | Level 1 | Level 2 | Net Asset Value | Total | ||||||||||||
Commingled fund | $ | $ | $ | $ | ||||||||||||
Short-term investments | ||||||||||||||||
Government agency bonds | ||||||||||||||||
$ | $ | $ | $ | |||||||||||||
June 30, 2019 | ||||||||||||||||
Fair Value Measurements Using Input Type | ||||||||||||||||
($ in millions) | Level 1 | Level 2 | Net Asset Value | Total | ||||||||||||
Commingled fund | $ | $ | $ | $ | ||||||||||||
Short-term investments | ||||||||||||||||
Government agency bonds | ||||||||||||||||
Corporate bonds and other | ||||||||||||||||
$ | $ | $ | $ | |||||||||||||
A financial instrument’s categorization within the valuation hierarchy is based upon the lowest level of input that is significant to the fair value measurement. Investments in domestic and international equities are generally valued at the closing price reported on the active market on which they are traded. Commingled funds, limited partnerships and mutual funds are valued based on the net asset value (“NAV”) established for the fund at each valuation date. The NAV is based on the value of the underlying assets owned by the fund, minus its liabilities, and then divided by the number of units/shares outstanding. Corporate and government agency bonds and other fixed income securities are valued using closing bid prices on an active market when possible, otherwise using evaluated bid prices.
70
Cash Flows — Employer Contributions
The Company made contributions to the qualified U.S. pension plans of $6.5 million, $5.5 million and $6.7 million during fiscal years 2020, 2019 and 2018, respectively. The Company currently expects to make $19.3 million in required cash pension contributions to the qualified defined benefit pension plans during fiscal year 2021. During the years ended June 30, 2020, 2019 and 2018, the Company made contributions of $3.3 million, $3.2 million and $3.3 million to other non-qualified pension plans, respectively.
Estimated Future Benefit Payments
The following benefit payments, which reflect expected future service, as appropriate, are expected to be paid. Pension benefits are currently paid from plan assets and other benefits are currently paid from both corporate assets and the VEBA trust.
($ in millions) | Pension Benefits | Other Benefits | ||||||
2021 | $ | $ | ||||||
2022 | $ | $ | ||||||
2023 | $ | $ | ||||||
2024 | $ | $ | ||||||
2025 | $ | $ | ||||||
2026-2030 | $ | $ | ||||||
Other Benefit Plans
13. Contingencies and Commitments
Environmental
The Company is subject to various federal, state, local and international environmental laws and regulations relating to pollution, protection of public health and the environment, natural resource damages and occupational safety and health. Although compliance with these laws and regulations may affect the costs of the Company’s operations, compliance costs to date have not been material. The Company has environmental remediation liabilities at some of its owned operating facilities and has been designated as a potentially responsible party (“PRP”) with respect to certain third party Superfund waste-disposal sites and other third party-owned sites. Additionally, the Company has been notified that it may be a PRP with respect to other Superfund sites as to which no proceedings have been instituted against the Company. Neither the exact amount of remediation costs nor the final method of their allocation among all designated PRPs at these Superfund sites have been determined. Accordingly, at this time, we cannot reasonably estimate expected costs for such matters. The liability for future environmental remediation costs that can be reasonably estimated is evaluated by management on a quarterly basis. The Company accrues amounts for environmental remediation costs that represent management’s best estimate of the probable and reasonably estimable future costs related to environmental remediation. For fiscal year 2020 the Company decreased the liability for a company-owned former operating site by $0.1 million. During fiscal years 2019 and 2018, the Company had no change to the liability for a company-owned former operating site. The liabilities recorded for environmental remediation costs at Superfund sites, other third party-owned sites and Carpenter-owned current or former operating facilities remaining at June 30, 2020 and 2019 were $16.0 million and $16.1 million, respectively.
71
Other
The Company is defending various routine claims and legal actions that are incidental to its business and common to its operations, including those pertaining to product claims, commercial disputes, patent infringement, employment actions, employee benefits, compliance with domestic and foreign laws and regulations, personal injury claims and tax issues. Like many other manufacturing companies in recent years, the Company, from time to time, has been named as a defendant in lawsuits alleging personal injury as a result of exposure to chemicals and substances in the workplace. The Company provides for costs relating to these matters when a loss is probable and the amount of the loss is reasonably estimable. The effect of the outcome of these matters on the Company’s future results of operations and liquidity cannot be predicted because any such effect depends on future results of operations and the amount and timing (both as to recording future charges to operations and cash expenditures) of the resolution of such matters. While it is not feasible to determine the outcome of these matters, management believes that the total liability from these matters will not have a material effect on the Company’s financial position, results of operations or cash flows over the long-term. However, there can be no assurance that an increase in the scope of pending matters or that any future lawsuits, claims, proceedings or investigations will not be material to the Company’s financial position, results of operations or cash flows in a particular future quarter or year.
The Company has entered into purchase agreements primarily for various key raw materials at market related prices, all made in the normal course of business. The commitments include both fixed and variable price provisions. Raw material prices as of June 30, 2020 were used for commitments with variable pricing. The purchase commitments covered by these agreements aggregate to $485.4 million as of June 30, 2020. Of this amount $301.0 million relates to fiscal year 2021, $174.6 million to fiscal year 2022, $8.7 million to fiscal year 2023, $0.7 million to fiscal year 2024 and $0.4 million to fiscal year 2025.
14. Leases
As a result of adoption of ASU 2016-02, Leases, the Company recorded ROU assets and operating lease liabilities, each in the amount of $53.4 million, on the consolidated balance sheet as of July 1, 2019 for several types of operating leases, including land and buildings, equipment (e.g. trucks and forklifts), vehicles, and computer equipment. On the lease commencement date, the Company measures and records a ROU asset and lease liability equal to the present value of the remaining lease payments, discounted using the rate implicit in the lease (or if that rate cannot be readily determined, the Company’s incremental borrowing rate). Operating leases are included in other assets, accrued liabilities (current) and other liabilities (long-term) on the consolidated balance sheets.
The Company elected the practical expedient to not separate lease components from nonlease components for all asset classes. The Company recognizes lease expense in the consolidated statements of operations on a straight-line basis over the lease term. The Company elected to not recognize ROU assets and lease liabilities for short-term leases with an initial term of 12 months or less for all asset classes. Leases with the option to extend their term or terminate early are reflected in the lease term when it is reasonably certain that the Company will exercise such options. Some leasing arrangements require variable payments that are dependent on usage, output, or may vary for other reasons, such as insurance and tax payments. The variable lease payments are not presented as part of the ROU asset or lease liability. The leases have remaining terms of one to seventeen years .
Operating lease cost was $14.8 million, $16.1 million and $13.4 million for the fiscal years ended June 30, 2020, 2019 and 2018, respectively. The following table sets forth the components of the Company’s lease cost for the twelve months ended June 30, 2020:
72
Year Ended June 30, | ||||
($ in millions) | 2020 | |||
Operating lease cost | $ | |||
Variable lease cost | ||||
Total lease cost | $ | |||
Operating cash flow payments from operating leases | $ | |||
Non-cash ROU assets obtained in exchange for lease obligations | $ | |||
Weighted-average remaining lease term - operating leases | ||||
Weighted-average discount rate - operating leases | % | |||
The following table sets forth the Company’s ROU assets and lease liabilities at June 30, 2020:
($ in millions) | June 30, 2020 | |||
Operating lease assets: | ||||
Other assets | $ | |||
Operating lease liabilities: | ||||
Other accrued liabilities | $ | |||
Other liabilities | ||||
Total operating lease liabilities | $ | |||
Minimum lease payments for operating leases expiring subsequent to June 30, 2020 are as follows:
($ in millions) | June 30, 2020 | |||
2021 | $ | |||
2022 | ||||
2023 | ||||
2024 | ||||
2025 | ||||
Thereafter | ||||
Total future minimum lease payments | ||||
Less imputed interest | ( | ) | ||
Total | $ | |||
73
The below table as of June 30, 2019 is carried forward, including certain amounts that were historically included in the table as a result of the historical lease term conclusions but were not included in the initial ROU asset and lease liability measurement at adoption. Minimum lease payments for operating leases under ASC 840 expiring subsequent to June 30, 2019 were as follows:
($ in millions) | June 30, 2019 | |||
2020 | $ | |||
2021 | ||||
2022 | ||||
2023 | ||||
2024 | ||||
Thereafter | ||||
Total future minimum lease payments | $ | |||
15. Fair Value Measurements
The fair value hierarchy has three levels based on the inputs used to determine fair value. Level 1 refers to quoted prices in active markets for identical assets or liabilities. Level 2 refers to observable inputs other than quoted prices included in Level 1, such as quoted prices for similar assets and liabilities in active markets; quoted prices for identical or similar assets and liabilities in markets that are not active; or other inputs that are observable or can be corroborated by observable market data. Level 3 refers to unobservable inputs that are supported by little or no market activity and that are significant to the fair value of the assets and liabilities. This includes certain pricing models, discounted cash flow methodologies and similar techniques that use significant unobservable inputs.
The following tables present the Company’s assets and liabilities that are measured at fair value on a recurring basis and are categorized using the fair value hierarchy:
June 30, 2020 | Fair Value Measurements Using Input Type | |||||||
($ in millions) | Level 2 | Total | ||||||
Assets: | ||||||||
Derivative financial instruments | $ | $ | ||||||
Liabilities: | ||||||||
Derivative financial instruments | $ | $ | ||||||
June 30, 2019 | Fair Value Measurements Using Input Type | |||||||
($ in millions) | Level 2 | Total | ||||||
Assets: | ||||||||
Derivative financial instruments | ||||||||
Liabilities: | ||||||||
Derivative financial instruments | $ | $ | ||||||
The Company’s derivative financial instruments consist of commodity forward contracts, foreign currency forward contracts, interest rate swaps and forward interest rate swaps. These instruments are measured at fair value using the market method valuation technique. The inputs to this technique utilize information related to foreign exchange rates, commodity prices and interest rates published by third party leading financial news and data providers. This is observable data; however, the valuation of these instruments is not based on actual transactions for the same instruments and, as such, they are classified as Level 2. The Company’s use of derivatives and hedging policies are more fully discussed in Note 17.
74
The Company has currently chosen not to elect the fair value option for any items that are not already required to be measured at fair value in accordance with accounting principles generally accepted in the United States of America.
The carrying amounts of other financial instruments not listed in the table below approximate fair value due to the short-term nature of these items. The carrying amounts and estimated fair values of the Company’s financial instruments not recorded at fair value in the financial statements were as follows:
June 30, 2020 | June 30, 2019 | |||||||||||||||
($ in millions) | Carrying Value | Fair Value | Carrying Value | Fair Value | ||||||||||||
Long-term debt | $ | $ | $ | $ | ||||||||||||
Company-owned life insurance | $ | $ | $ | $ | ||||||||||||
The fair values of long-term debt as of June 30, 2020 and June 30, 2019 were determined by using current interest rates for debt with terms and maturities similar to the Company’s existing debt arrangements and accordingly would be classified as Level 2 inputs in the fair value hierarchy.
The carrying amount of company-owned life insurance reflects cash surrender values based upon the market values of underlying securities, using Level 2 inputs, net of any outstanding policy loans. The carrying value associated with the cash surrender value of these policies is recorded in other assets in the accompanying consolidated balance sheets.
16. Share-Based Compensation
The Company has two share-based compensation plans: Amended and Restated Stock-Based Incentive Compensation Plan for Officers and Key Employees (the “Omnibus Plan”) and the Stock-Based Compensation Plan for Non-Employee Directors (“Director's Plan”). The Company recognizes compensation cost based on the fair value of the awards on the date of grant. The compensation cost is recognized over the requisite service period of the award, which is generally the shorter of the vesting period that the holder is required to provide service, or the period from the grant date to the date on which the employee is eligible to retire. Upon retirement, as defined in the Company’s share-based compensation plans, outstanding awards are subject to certain accelerated vesting terms.
Awards granted under the share-based compensation plans are paid from shares held in treasury and newly issued shares. The total compensation cost that has been charged against income related to these share-based compensation plans was $10.9 million, $17.6 million and $17.6 million for the years ended June 30, 2020, 2019 and 2018, respectively.
Omnibus Plan
The Omnibus Plan provides that the Board of Directors or a designated committee may grant stock options, restricted stock and restricted stock units, and determine the terms and conditions of each grant. The Omnibus Plan provides the Chief Executive Officer with limited authority to grant awards. As of June 30, 2020, 2,991,773 shares were available for awards which may be granted under this plan.
75
Director’s Plan
The Director’s Plan provides for the granting of stock options and stock units to non-employee directors. As of June 30, 2020, 464,921 shares were available for awards which may be granted under this plan.
Stock Options (all plans)
Stock options granted under the plans above are granted with an exercise price equal to at least the fair market value of the Company’s common stock on the date of grant. The options are typically exercisable after one to three years of service and expire no longer than ten years from the grant date.
The fair value of stock options awarded in fiscal years 2020, 2019 and 2018 was estimated on the date of each grant using a Black-Scholes option pricing model with the following weighted-average assumptions:
Years Ended June 30, | |||||||||
2020 | 2019 | 2018 | |||||||
Expected volatility | % | % | % | ||||||
Dividend yield | % | % | % | ||||||
Risk-free interest rate | % | % | % | ||||||
Expected term (in years) | |||||||||
The assumptions are based on multiple factors, including historical exercise patterns of employees in relatively homogeneous groups with respect to exercise and post-vesting employment termination behaviors, expected future exercising patterns for these same homogeneous groups and the implied volatility of our stock price based on historical performance for the same expected term of the options granted. The risk-free interest rate is based on the U.S. Treasury yield curve in effect at the time of each grant.
Number of Awards | Weighted Average Exercise Price | Weighted Average Remaining Contractual Term | Aggregate Intrinsic Value ($ in millions) | ||||||||||
Outstanding at June 30, 2017 | $ | ||||||||||||
Granted | $ | ||||||||||||
Exercised | ( | ) | $ | ||||||||||
Forfeited | ( | ) | $ | ||||||||||
Expired | ( | ) | $ | ||||||||||
Outstanding at June 30, 2018 | $ | ||||||||||||
Granted | $ | ||||||||||||
Exercised | ( | ) | $ | ||||||||||
Forfeited | ( | ) | $ | ||||||||||
Outstanding at June 30, 2019 | $ | ||||||||||||
Granted | $ | ||||||||||||
Exercised | ( | ) | $ | ||||||||||
Forfeited | ( | ) | $ | ||||||||||
Expired | ( | ) | $ | ||||||||||
Outstanding at June 30, 2020 | $ | $ | |||||||||||
Exercisable at June 30, 2020 | $ | $ | |||||||||||
76
Outstanding and Exercisable Options
Exercise Price Range | Number Outstanding at June 30, 2020 | Weighted Average Remaining Contractual Term (in Years) | Weighted Average Exercise Price | Number Exercisable at June 30, 2020 | Weighted Average Exercise Price | |||||||||||
$30.01 - $40.00 | $ | $ | ||||||||||||||
$40.01 - $50.00 | $ | $ | ||||||||||||||
$50.01 - $59.53 | $ | $ | ||||||||||||||
$ | $ | |||||||||||||||
The weighted average grant date fair value of options awarded during fiscal years 2020, 2019 and 2018 was $13.57 , $18.35 and $11.65 , respectively. Share-based compensation charged against income related to stock options for the years ended June 30, 2020, 2019 and 2018 was $2.1 million, $3.6 million and $5.0 million, respectively. As of June 30, 2020, $1.1 million of compensation cost related to nonvested stock options will be recognized over a weighted average remaining life of 1.3 years.
Of the options outstanding at June 30, 2020, 1,935,344 relate to the Omnibus Plan and 214,197 relate to the Directors’ Plan.
Restricted Stock Unit Awards (Omnibus Plan)
Restricted stock unit awards are granted to employees with performance and/or service conditions. Earned restricted stock unit awards receive non-forfeitable cash dividends during the restriction period. The fair value of the restricted stock unit awards is determined based on the close price of the Company’s stock on the grant date.
Performance-based restricted stock unit awards are earned dependent upon how certain performance goals are achieved during a specified performance period according to the terms determined at the date of the grant. These shares typically vest zero to two years from the date of the attainment of the specified performance goals. Compensation cost is determined and charged to expense beginning in the performance period through the vesting period.
Time-based restricted stock unit awards typically vest zero to three years from the date of grant. Compensation cost related to time-based stock unit awards is recognized over the vesting period of the award.
77
Amounts charged to compensation expense for restricted stock unit awards were $8.1 million, $9.8 million and $8.8 million for the years ended June 30, 2020, 2019 and 2018, respectively. As of June 30, 2020, $4.3 million of compensation cost related to restricted stock unit awards remains to be recognized over a weighted average remaining life of 1.4 years.
Number of Awards | Weighted Average Grant Date Fair Value | ||||||
Restricted Balance at June 30, 2017 | $ | ||||||
Time-based granted | $ | ||||||
Performance-based granted | $ | ||||||
Vested | ( | ) | $ | ||||
Forfeited | ( | ) | $ | ||||
Restricted Balance at June 30, 2018 | $ | ||||||
Time-based granted | $ | ||||||
Vested | ( | ) | $ | ||||
Forfeited | ( | ) | $ | ||||
Restricted Balance at June 30, 2019 | $ | ||||||
Time-based granted | $ | ||||||
Vested | ( | ) | $ | ||||
Forfeited | ( | ) | $ | ||||
Restricted Balance at June 30, 2020 | $ | ||||||
The Company granted performance-based awards in fiscal year 2020 and 2019 within the Omnibus Plan. The awards are granted at a target number of shares. These awards are earned dependent upon how certain performance goals are achieved during a specified performance period according to the terms determined at the date of the grant. The actual number of shares awarded may range from a minimum of 0 percent of the target shares to a maximum of 200 percent of the target shares. Participants do not have any rights to dividends (or equivalents) during the performance period. These shares typically vest on the date of the attainment of the specified performance goals. Compensation cost is determined and charged to expense beginning in the performance period through the vesting period. In fiscal year 2020 a benefit of $1.4 million was recognized for these awards due to reversals for attainment based on performance. Compensation costs related to these awards granted in fiscal year 2019 was $1.4 million.
Total Stockholder Return Awards
The Company granted Total Stockholder Return (“TSR”) awards in fiscal year 2018. The TSR awards are granted at a target number of shares. The TSR awards are earned based on the Company’s total stockholder return compared to the total stockholder returns of the Russell RSCC Materials & Processing Growth Index at the end of a three-year period. The actual number of shares awarded may range from a minimum of 0 percent of the target shares to a maximum of 200 percent of the target shares. Participants do not have any rights to dividends (or equivalents) during the performance period. The fair value of the TSR awards was estimated using Monte Carlo valuation models. Compensation cost related to TSR awards recognized in fiscal years 2020, 2019 and 2018 was $0.9 million, $1.7 million and $2.8 million, respectively.
Director Stock Units
According to the provisions of the Director’s Plan, on the date of each annual stockholders’ meeting or on such other regularly scheduled date as the Board of Directors may determine from time to time in light of the Company’s prevailing practices for the grant of equity awards to employees, each Director shall be granted, in place of cash compensation, a number of stock units determined by dividing 50 percent of the Director’s annual retainer by the fair market value of the Company’s common stock on that date. These stock units vest as to one-quarter of the units for every three months of service following the grant date and are fully vested on the first anniversary of the grant date. At the Director’s election, the remaining 50 percent of the annual retainer and 100 percent of committee chair fees may be paid in stock units in lieu of cash. These units are immediately vested.
78
In addition to the grant of retainer stock units described above, each Director may be granted annually an additional award of stock units as the Board may determine by resolution. These stock units vest as to one-quarter of the units for every three months of service following the grant date and are fully vested on the first anniversary of the grant date.
Additional units are credited to each Director on a quarterly basis to reflect dividend equivalents on the Company’s common stock.
In the case of separation from service due to death or disability, all stock units shall immediately vest.
Following a Director’s separation from service, or such other elected distribution date or event, the number of stock units credited to the Director’s account will be converted to an equivalent number of the Company’s common stock.
Number of Units | Weighted Average Grant Date Fair Value | ||||||
Outstanding at June 30, 2017 | $ | ||||||
Granted | $ | ||||||
Distributed | ( | ) | $ | ||||
Dividend equivalents | $ | ||||||
Outstanding at June 30, 2018 | $ | ||||||
Granted | $ | ||||||
Distributed | ( | ) | $ | ||||
Dividend equivalents | $ | ||||||
Outstanding at June 30, 2019 | $ | ||||||
Granted | $ | ||||||
Distributed | ( | ) | $ | ||||
Dividend equivalents | $ | ||||||
Outstanding at June 30, 2020 | $ | ||||||
Compensation cost is determined using the grant date fair value and charged to expense over the vesting period of one year and amounted to $1.2 million, $1.1 million and $1.0 million for the years ended June 30, 2020, 2019 and 2018, respectively. As of June 30, 2020, $0.3 million of compensation cost related to director stock units remains to be recognized over a weighted average remaining life of 0.3 years.
17. Derivatives and Hedging Activities
The Company uses commodity forwards, interest rate swaps, forward interest rate swaps and foreign currency forwards to manage risks generally associated with commodity price, interest rate and foreign currency rate fluctuations. The following explains the various types of derivatives and includes a recap about the impact the derivative instruments had on the Company’s financial position, results of operations and cash flows.
Cash Flow Hedging — Commodity forward contracts: The Company enters into commodity forward contracts to fix the price of a portion of anticipated future purchases of certain critical raw materials and energy to manage the risk of cash flow variability associated with volatile commodity prices. The commodity forward contracts have been designated as cash flow hedges. The qualifying hedge contracts are marked-to-market at each reporting date and any unrealized gains or losses are included in accumulated other comprehensive income (“AOCI”) to the extent effective, and reclassified to cost of sales in the period during which the hedged transaction affects earnings or it becomes probable that the forecasted transaction will not occur. As of June 30, 2020, the Company had forward contracts to purchase 12.3 million pounds of certain raw materials with settlement dates through December 2023.
79
Cash Flow Hedging — Forward interest rate swaps: Historically, the Company has entered into forward interest rate swap contracts to manage the risk of cash flow variability associated with fixed interest debt expected to be issued. The forward interest rate swaps were designated as cash flow hedges. The qualifying hedge contracts were marked-to-market at each reporting date and any unrealized gains or losses were included in AOCI to the extent effective and reclassified to interest expense in the period during which the hedged transaction affects earnings or it becomes probable that the forecasted transaction will not occur. For the years ended June 30, 2020, 2019 and 2018 net gains of $0.3 million, $0.3 million, $0.3 million, respectively, were recorded as a reduction to interest expense. These amounts represent the impact of previously terminated swaps which are being amortized over the remaining term of the underlying debt.
Cash Flow Hedging — Foreign currency forward contracts: The Company uses foreign currency forward contracts to hedge a portion of anticipated future sales denominated in foreign currencies, principally the Euro and Pound Sterling, in order to offset the effect of changes in exchange rates. The qualifying hedge contracts are marked-to-market at each reporting date and any unrealized gains or losses are included in AOCI to the extent effective and reclassified to net sales in the period during which the transaction affects earnings or it becomes probable that the forecasted transaction will not occur.
The Company also uses foreign currency forward contracts to protect certain short-term asset positions denominated in foreign currencies against the effect of changes in exchange rates. These positions do not qualify for hedge accounting and accordingly are marked-to-market at each reporting date through charges to other income and expense. As of June 30, 2020, the fair value of the outstanding foreign currency forwards not designated as hedging instruments and the charges to income for changes in fair value for these contracts were not material.
Fair Value Hedging — Interest rate swaps: The Company uses interest rate swaps to achieve a level of floating rate debt relative to fixed rate debt. The Company has designated fixed to floating interest rate swaps as fair value hedges. Accordingly, the changes in the fair value of these instruments are immediately recorded in earnings. The mark-to-market values of both the fair value hedging instruments and the underlying debt obligations are recorded as equal and offsetting gains and losses in interest expense in the consolidated statements of income. As of June 30, 2020 and 2019, the total notional amount of floating interest rate contracts was $150.0 million and $150.0 million, respectively. For the years ended June 30, 2020, 2019 and 2018, net gains of $1.4 million were recorded as a reduction to interest expense, net losses of $0.2 million were recorded as an increase to interest expense and net gains $0.4 million were recorded as a reduction interest expense, respectively.
The fair value and location of outstanding derivative contracts recorded in the accompanying consolidated balance sheets were as follows as of June 30, 2020 and 2019:
June 30, 2020 ($ in millions) | Interest Rate Swaps | Foreign Currency Contracts | Commodity Contracts | Total Derivatives | ||||||||||||
Asset Derivatives: | ||||||||||||||||
Derivatives designated as hedging instruments: | ||||||||||||||||
Other current assets | $ | $ | $ | $ | ||||||||||||
Other assets | ||||||||||||||||
Total asset derivatives | $ | $ | $ | $ | ||||||||||||
Liability Derivatives: | ||||||||||||||||
Derivatives designated as hedging instruments: | ||||||||||||||||
Accrued liabilities | $ | $ | $ | $ | ||||||||||||
Other liabilities | ||||||||||||||||
Total liability derivatives | $ | $ | $ | $ | ||||||||||||
80
June 30, 2019 ($ in millions) | Interest Rate Swaps | Foreign Currency Contracts | Commodity Contracts | Total Derivatives | ||||||||||||
Asset Derivatives: | ||||||||||||||||
Derivatives designated as hedging instruments: | ||||||||||||||||
Other current assets | $ | $ | $ | $ | ||||||||||||
Other assets | ||||||||||||||||
Total asset derivatives | $ | $ | $ | $ | ||||||||||||
Liability Derivatives: | ||||||||||||||||
Derivatives designated as hedging instruments: | ||||||||||||||||
Accrued liabilities | $ | $ | $ | $ | ||||||||||||
Other liabilities | ||||||||||||||||
Total liability derivatives | $ | $ | $ | $ | ||||||||||||
Substantially all of the Company’s derivative contracts are subject to master netting arrangements, or similar agreements with each counterparty, which provide for the option to settle contracts on a net basis when they settle on the same day and in the same currency. In addition, these arrangements provide for a net settlement of all contracts with a given counterparty in the event that the arrangement is terminated due to the occurrence of default or a termination event. The Company presents the outstanding derivative contracts on a net basis by counterparty in the consolidated balance sheets. If the Company had chosen to present the derivative contracts on a gross basis, the total asset derivatives would have been $11.9 million and total liability derivatives would have been $19.7 million as of June 30, 2020.
According to the provisions of the Company’s derivative arrangements, in the event that the fair value of outstanding derivative positions with certain counterparties exceeds certain thresholds, the Company may be required to issue cash collateral to the counterparties. As of June 30, 2020 the Company had no cash collateral held by counterparties.
The Company is exposed to credit loss in the event of nonperformance by counterparties on its derivative instruments as well as credit or performance risk with respect to its customer commitments to perform. Although nonperformance is possible, the Company does not anticipate nonperformance by any of the parties. In addition, various master netting arrangements are in place with counterparties to facilitate settlements of gains and losses on these contracts.
Cash Flow Hedges
For derivative instruments that are designated and qualify as cash flow hedges, the effective portion of the gain or loss on the derivative is reported as a component of AOCI and reclassified into earnings in the same period or periods during which the hedged transactions affect earnings or it becomes probable the forecasted transactions will not occur. The following is a summary of the (losses) gains related to cash flow hedges recognized during the years ended June 30, 2020, 2019 and 2018:
Amount of (Loss) Gain Recognized in AOCI on Derivatives Years Ended June 30, | ||||||||||||
($ in millions) | 2020 | 2019 | 2018 | |||||||||
Derivatives in Cash Flow Hedging Relationship: | ||||||||||||
Commodity contracts | $ | ( | ) | $ | $ | |||||||
Foreign exchange contracts | ( | ) | ( | ) | ( | ) | ||||||
Total | $ | ( | ) | $ | $ | |||||||
81
Amount of Gain (Loss) Reclassified from AOCI into Income Years Ended June 30, | ||||||||||||||
($ in millions) | Location of Gain (Loss) Reclassified from AOCI into Income | 2020 | 2019 | 2018 | ||||||||||
Derivatives in Cash Flow Hedging Relationship: | ||||||||||||||
Commodity contracts | Cost of sales | $ | $ | $ | ||||||||||
Foreign exchange contracts | Net sales | ( | ) | |||||||||||
Forward interest rate swaps | Interest expense | |||||||||||||
Total | $ | $ | $ | |||||||||||
The following is a summary of total amounts presented in the consolidated statements of income in which the effects of cash flow and fair value hedges are recorded during the years ended June 30, 2020 and 2019:
Year Ended June 30, 2020 | Year Ended June 30, 2019 | |||||||||||||||||||||||
($ in millions) | Net Sales | Cost of Sales | Interest Expense | Net Sales | Cost of Sales | Interest Expense | ||||||||||||||||||
Total amounts presented in the consolidated statements of income in which the effects of cash flow and fair value hedges are recorded | $ | $ | $ | $ | $ | $ | ||||||||||||||||||
Gain on Derivatives in Cash Flow Hedging Relationship: | ||||||||||||||||||||||||
Commodity contracts | ||||||||||||||||||||||||
Amount of gain reclassified from AOCI to income | ||||||||||||||||||||||||
Foreign currency forward contracts | ||||||||||||||||||||||||
Amount of gain reclassified from AOCI to income | ||||||||||||||||||||||||
Interest rate swap agreements | ||||||||||||||||||||||||
Amount of gain reclassified from AOCI to income | ||||||||||||||||||||||||
(Loss) Gain on Derivatives in Fair Value Hedging Relationship: | ||||||||||||||||||||||||
Interest rate swap agreements | ||||||||||||||||||||||||
Hedged Item | ( | ) | ||||||||||||||||||||||
Derivatives designated as hedging instruments | ( | ) | ||||||||||||||||||||||
Total gain | $ | $ | $ | $ | $ | $ | ||||||||||||||||||
The Company estimates that $5.6 million of net derivative losses included in AOCI as of June 30, 2020 will be reclassified into earnings within the next twelve months. No significant cash flow hedges were discontinued during the year ended June 30, 2020.
82
As of June 30, 2020, and June 30, 2019, the following amounts were recorded on the consolidated balance sheets related to cumulative basis adjustments for fair value hedges of interest rate risk:
Carrying amount of the hedged liabilities | Cumulative amount of fair value loss (gain) in the carrying amount of the hedged liabilities | |||||||||||||||
June 30, | June 30, | |||||||||||||||
($ in millions) | 2020 | 2019 | 2020 | 2019 | ||||||||||||
Line item in the consolidated balance sheets in which the hedged item is included: | ||||||||||||||||
Long-Term Debt | $ | $ | $ | $ | ||||||||||||
The changes in AOCI associated with derivative hedging activities during the years ended June 30, 2020, 2019 and 2018 were as follows:
Years Ended June 30, | ||||||||||||
($ in millions) | 2020 | 2019 | 2018 | |||||||||
Balance, beginning | $ | ( | ) | $ | $ | ( | ) | |||||
Cumulative adjustment upon adoption of ASU 2017-12 reclassified to reinvested earnings | ( | ) | ||||||||||
Current period changes in fair value, net of tax | ( | ) | ||||||||||
Reclassification to earnings, net of tax | ( | ) | ( | ) | ( | ) | ||||||
Balance, ending | $ | ( | ) | $ | ( | ) | $ | |||||
18. Income Taxes
Income (loss) before income taxes for the Company’s domestic and foreign operations was as follows:
Years Ended June 30, | ||||||||||||
($ in millions) | 2020 | 2019 | 2018 | |||||||||
Domestic | $ | $ | $ | |||||||||
Foreign | ( | ) | ||||||||||
Income before income taxes | $ | $ | $ | |||||||||
The provision (benefit) for income taxes from continuing operations consisted of the following:
Years Ended June 30, | ||||||||||||
($ in millions) | 2020 | 2019 | 2018 | |||||||||
Current: | ||||||||||||
Federal | $ | $ | $ | |||||||||
State | ||||||||||||
Foreign | ||||||||||||
Total current | ||||||||||||
Deferred: | ||||||||||||
Federal | ( | ) | ( | ) | ||||||||
State | ||||||||||||
Foreign | ( | ) | ||||||||||
Total deferred | ( | ) | ( | ) | ||||||||
Total income tax expense (benefit) | $ | $ | $ | ( | ) | |||||||
83
The following is a reconciliation of income taxes computed at the U.S. Federal income tax rate to the Company’s effective income tax rates:
Years Ended June 30, | |||||||||
(% of pre-tax income) | 2020 | 2019 | 2018 | ||||||
Statutory federal income tax rate | % | % | % | ||||||
State income taxes, net of federal tax benefit | |||||||||
Foreign tax rate differential | ( | ) | |||||||
Domestic manufacturing deduction | ( | ) | |||||||
Research and development tax credit | ( | ) | ( | ) | ( | ) | |||
Adjustments of prior years' income taxes | ( | ) | |||||||
Remeasurement of U.S. deferred taxes | ( | ) | |||||||
Transition tax on foreign earnings | ( | ) | |||||||
Non-deductible goodwill impairment | |||||||||
Non-taxable income | ( | ) | ( | ) | ( | ) | |||
Non-deductible expenses | |||||||||
Share-based compensation | ( | ) | ( | ) | ( | ) | |||
Changes in valuation allowances | ( | ) | |||||||
Law changes | ( | ) | ( | ) | |||||
Other, net | ( | ) | ( | ) | ( | ) | |||
Effective income tax rate | % | % | ( | )% | |||||
Deferred taxes are recorded for temporary differences between the carrying amounts of assets and liabilities and their tax bases. The significant components of deferred tax assets and liabilities that are recorded in the consolidated balance sheets are summarized in the table below. A valuation allowance is required when it is more likely than not that all or a portion of a deferred tax asset will not be realized. As of June 30, 2020, the Company had net operating loss carryforwards of $4.1 million and $1.5 million in the United Kingdom and Singapore, respectively. These losses have an indefinite carryforward period. However, realization of these future tax benefits is expected to be limited to approximately $2.3 million in the United Kingdom and $0.0 million in Singapore. The company also had state net operating loss carryforwards of $292.5 million expiring between fiscal years 2021 and 2040. A significant portion of the state net operating loss carryforwards are subject to an annual limitation that, under current law, is likely to limit future tax benefits to approximately $3.1 million. Realization is dependent on generating sufficient taxable income prior to expiration of the loss carryforwards. Although realization is not assured, management believes it is more likely than not that all of the deferred tax asset will be realized. The amount of the deferred tax asset considered realizable, however, could be reduced in the near term if estimates of future taxable income during the carryforward period are reduced.
Valuation allowances decreased by $0.4 million during fiscal year 2020. The expiration of $4.0 million net operating losses for which no tax benefit was recognized, caused a reduction in the valuation allowance. This was partially offset by a $3.6 million increase in net operating losses incurred in certain tax jurisdictions for which no tax benefit was recognized.
84
June 30, | ||||||||
($ in millions) | 2020 | 2019 | ||||||
Deferred tax assets: | ||||||||
Pensions | $ | $ | ||||||
Postretirement provisions | ||||||||
Net operating loss carryforwards | ||||||||
Operating lease liability | ||||||||
Other | ||||||||
Gross deferred tax assets | ||||||||
Valuation allowances | ( | ) | ( | ) | ||||
Total deferred tax assets | ||||||||
Deferred tax liabilities: | ||||||||
Depreciation | ( | ) | ( | ) | ||||
Intangible assets | ( | ) | ( | ) | ||||
Inventories | ( | ) | ( | ) | ||||
Operating lease right-of-use asset | ( | ) | ||||||
Other | ( | ) | ( | ) | ||||
Total deferred tax liabilities | ( | ) | ( | ) | ||||
Deferred tax liabilities, net | $ | ( | ) | $ | ( | ) | ||
The Company does no t have unrecognized tax benefits as of June 30, 2020, 2019 and 2018. The Company recognizes interest and penalties accrued on any unrecognized tax benefits as a component of income tax expense.
All years prior to fiscal year 2017 have been settled with the Internal Revenue Service and with most significant state, local and foreign tax jurisdictions.
Undistributed earnings of our foreign subsidiaries, totaling $61.7 million were considered permanently reinvested. Following enactment of the Act, the repatriation of cash to the U.S. is generally no longer taxable for federal income tax purposes. If these earnings were to be repatriated, approximately $0.1 million of tax expense would be incurred.
19. Other Income (Expense), Net
Other income (expense), net consists of the following:
Years Ended June 30, | ||||||||||||
($ in millions) | 2020 | 2019 | 2018 | |||||||||
Unrealized gains on company owned life insurance contracts and investments held in rabbi trusts | $ | $ | $ | |||||||||
Interest income | ||||||||||||
Foreign exchange | ( | ) | ( | ) | ||||||||
Pension earnings, interest and deferrals | ( | ) | ( | ) | ( | ) | ||||||
Other | ||||||||||||
Total other income (expense), net | $ | $ | $ | ( | ) | |||||||
20. Segment Information, Geographic and Product Data
The Company has two reportable segments, Specialty Alloys Operations (“SAO”) and Performance Engineered Products (“PEP”).
85
The SAO segment is comprised of the Company’s major premium alloy and stainless steel manufacturing operations. This includes operations performed at mills primarily in Reading and Latrobe, Pennsylvania and surrounding areas as well as South Carolina and Alabama. The combined assets of the SAO operations are being managed in an integrated manner to optimize efficiency and profitability across the total system.
The PEP segment is comprised of the Company’s differentiated operations. This segment includes the Dynamet titanium business, the Carpenter Powder Products business, the Amega West business, the Carpenter Additive business, and the Latrobe and Mexico distribution businesses. The businesses in the PEP segment are managed with an entrepreneurial structure to promote flexibility and agility to quickly respond to market dynamics.
The Company’s executive management evaluates the performance of these operating segments based on sales, operating income and cash flow generation. Segment operating profit excludes general corporate costs, which include executive and director compensation, and other corporate facilities and administrative expenses not allocated to the segments. Also excluded are items that management considers not representative of ongoing operations, such as loss on divestiture of business and other specifically identified income or expense items.
The service cost component of the Company’s net pension expense, which represents the estimated cost of future pension liabilities earned associated with active employees, is included in the operating income of the business segments. The residual net pension expense, which is comprised of the expected return on plan assets, interest costs on the projected benefit obligations of the plans and amortization of actuarial gains and losses and prior service costs, is included under “Other income (expense), net.”
On a consolidated basis, one customer, Howmet Aerospace Inc. (formerly Arconic Inc.), accounted for approximately 10 percent, 11 percent and 12 percent of net sales for the years ended June 30, 2020, 2019 and 2018, respectively. No single customer accounted for 10 percent or more of the accounts receivable outstanding at June 30, 2020. One customer, Howmet Aerospace Inc. accounted for approximately 12 percent of the accounts receivable outstanding at June 30, 2019.
86
Segment Data | Years Ended June 30, | |||||||||||
($ in millions) | 2020 | 2019 | 2018 | |||||||||
Net Sales: | ||||||||||||
Specialty Alloys Operations | $ | $ | $ | |||||||||
Performance Engineered Products | ||||||||||||
Intersegment | ( | ) | ( | ) | ( | ) | ||||||
Consolidated net sales | $ | $ | $ | |||||||||
Years Ended June 30, | ||||||||||||
($ in millions) | 2020 | 2019 | 2018 | |||||||||
Operating Income (Loss): | ||||||||||||
Specialty Alloys Operations | $ | $ | $ | |||||||||
Performance Engineered Products | ( | ) | ||||||||||
Corporate costs (including restructuring and asset impairment charges) | ( | ) | ( | ) | ( | ) | ||||||
Intersegment | ( | ) | ||||||||||
Consolidated operating income | $ | $ | $ | |||||||||
Years Ended June 30, | ||||||||||||
($ in millions) | 2020 | 2019 | 2018 | |||||||||
Depreciation and Amortization: | ||||||||||||
Specialty Alloys Operations | $ | $ | $ | |||||||||
Performance Engineered Products | ||||||||||||
Corporate | ||||||||||||
Intersegment | ( | ) | ( | ) | ( | ) | ||||||
Consolidated depreciation and amortization | $ | $ | $ | |||||||||
Years Ended June 30, | ||||||||||||
($ in millions) | 2020 | 2019 | 2018 | |||||||||
Capital Expenditures: | ||||||||||||
Specialty Alloys Operations | $ | $ | $ | |||||||||
Performance Engineered Products | ||||||||||||
Corporate | ||||||||||||
Intersegment | ( | ) | ( | ) | ||||||||
Consolidated capital expenditures | $ | $ | $ | |||||||||
June 30, | ||||||||||||
($ in millions) | 2020 | 2019 | ||||||||||
Total Assets: | ||||||||||||
Specialty Alloys Operations | $ | $ | ||||||||||
Performance Engineered Products | ||||||||||||
Corporate | ||||||||||||
Intersegment | ( | ) | ( | ) | ||||||||
Consolidated total assets | $ | $ | ||||||||||
87
Geographic Data | Years Ended June 30, | |||||||||||
($ in millions) | 2020 | 2019 | 2018 | |||||||||
Net Sales: (a) | ||||||||||||
United States | $ | $ | $ | |||||||||
Europe | ||||||||||||
Asia Pacific | ||||||||||||
Mexico | ||||||||||||
Canada | ||||||||||||
Other | ||||||||||||
Consolidated net sales | $ | $ | $ | |||||||||
(a) Net sales were attributed to countries based on the location of the customer.
June 30, | ||||||||
($ in millions) | 2020 | 2019 | ||||||
Long-lived assets: | ||||||||
United States | $ | $ | ||||||
Europe | ||||||||
Asia Pacific | ||||||||
Canada | ||||||||
Mexico | ||||||||
Consolidated long-lived assets | $ | $ | ||||||
21. Reclassifications from Accumulated Other Comprehensive (Loss) Income
The changes in AOCI by component, net of tax, for the years ended June 30, 2020 and 2019 were as follows:
($ in millions) (a) | Cash flow hedging items | Pension and other postretirement benefit plan items | Unrealized losses on available-for-sale securities | Foreign currency items | Total | |||||||||||||||
Balance at June 30, 2019 | $ | ( | ) | $ | ( | ) | $ | $ | ( | ) | $ | ( | ) | |||||||
Other comprehensive income (loss) before reclassifications | ( | ) | ( | ) | ( | ) | ||||||||||||||
Amounts reclassified from AOCI (b) | ( | ) | ||||||||||||||||||
Net current-period other comprehensive income (loss) | ( | ) | ( | ) | ( | ) | ||||||||||||||
Balance at June 30, 2020 | $ | ( | ) | $ | ( | ) | $ | $ | ( | ) | $ | ( | ) | |||||||
88
($ in millions) (a) | Cash flow hedging items | Pension and other postretirement benefit plan items | Unrealized losses on available-for-sale securities | Foreign currency items | Total | |||||||||||||||
Balance at June 30, 2018 | $ | $ | ( | ) | $ | ( | ) | $ | ( | ) | $ | ( | ) | |||||||
Cumulative adjustment upon adoption of ASU 2017-12 reclassified to reinvested earnings | ( | ) | $ | ( | ) | |||||||||||||||
Other comprehensive (loss) income before reclassifications | ( | ) | ( | ) | ( | ) | ( | ) | ||||||||||||
Amounts reclassified from AOCI (b) | ( | ) | ||||||||||||||||||
Net current-period other comprehensive (loss) income | ( | ) | ( | ) | ( | ) | ( | ) | ||||||||||||
Balance at June 30, 2019 | $ | ( | ) | $ | ( | ) | $ | $ | ( | ) | $ | ( | ) | |||||||
(a) All amounts are net of tax. Amounts in parentheses indicate debits.
(b) See separate table below for further details.
The following is a summary of amounts reclassified from AOCI for the years ended June 30, 2020 and 2019:
Amount Reclassified from AOCI | ||||||||||
Years Ended June 30, | ||||||||||
($ in millions) (a) | Location of gain (loss) | 2020 | 2019 | |||||||
Details about AOCI Components | ||||||||||
Cash flow hedging items | ||||||||||
Commodity contracts | Cost of sales | $ | $ | |||||||
Foreign exchange contracts | Net sales | |||||||||
Forward interest rate swaps | Interest expense | |||||||||
Total before tax | ||||||||||
Tax expense | ( | ) | ( | ) | ||||||
Net of tax | $ | $ | ||||||||
Amortization of pension and other postretirement benefit plan items | ||||||||||
Net actuarial loss | (b) | $ | ( | ) | $ | ( | ) | |||
Prior service cost | (b) | |||||||||
Total before tax | ( | ) | ( | ) | ||||||
Tax benefit | ||||||||||
Net of tax | $ | ( | ) | $ | ( | ) | ||||
(a) Amounts in parentheses indicate debits to income/loss.
(b) These AOCI components are included in the computation of net periodic benefit cost (see Note 12 for additional details).
89
22. Supplemental Data
The following are additional required disclosures and other material items:
Years Ended June 30, | ||||||||||||
($ in millions) | 2020 | 2019 | 2018 | |||||||||
Cost Data: | ||||||||||||
Repairs and maintenance costs | $ | $ | $ | |||||||||
Cash Flow Data: | ||||||||||||
Noncash investing and financing activities: | ||||||||||||
Noncash purchases of property, plant, equipment and software | $ | $ | $ | |||||||||
Cash paid during the year for: | ||||||||||||
Interest payments, net | $ | $ | $ | |||||||||
Income tax payments (refunds), net | $ | $ | $ | |||||||||
23. Subsequent Event
On July 10, 2020, the Company issued $400 million in aggregate principal amount of its 6.375 % senior notes due 2028 in an underwritten public offering. The Company utilized a portion of the net proceeds from the offering to repay $250 million, on August 24, 2020, in principal amount of Carpenter Technology Corporation’s senior notes at 5.20 % due July 2021.
SUPPLEMENTARY DATA
Quarterly Financial Data (Unaudited)
Quarterly sales and earnings results are normally influenced by seasonal factors. Historically, the first two fiscal quarters (three months ending September 30 and December 31) are typically the lowest principally because of annual plant vacation and maintenance shutdowns by the Company and by many of its customers. However, the timing of major changes in the general economy or the markets for certain products can alter this pattern.
90
($ in millions) | First Quarter | Second Quarter | Third Quarter | Fourth Quarter | ||||||||||||
Results of Operations | ||||||||||||||||
Fiscal Year 2020 | ||||||||||||||||
Net sales | $ | $ | $ | $ | ||||||||||||
Gross profit (loss) | $ | $ | $ | $ | ( | ) | ||||||||||
Operating income (loss) | $ | $ | $ | $ | ( | ) | ||||||||||
Net income (loss) | $ | $ | $ | $ | ( | ) | ||||||||||
Fiscal Year 2019 | ||||||||||||||||
Net sales | $ | $ | $ | $ | ||||||||||||
Gross profit | $ | $ | $ | $ | ||||||||||||
Operating income | $ | $ | $ | $ | ||||||||||||
Net income | $ | $ | $ | $ | ||||||||||||
During the quarters ended December 31, 2019 and June 30, 2020, the Company recorded restructuring and asset impairment charges of $2.3 million and $130.1 million, respectively. See Note 2, Restructuring Charges and Asset Impairment Charges and Note 7, Inventories to Notes to Consolidated Financial Statements included in Item 8. “Financial Statements and Supplementary Data”.
(per share amount) | First Quarter | Second Quarter | Third Quarter | Fourth Quarter | ||||||||||||
Earnings (Loss) per common share | ||||||||||||||||
Fiscal Year 2020 | ||||||||||||||||
Basic earnings (loss) | $ | $ | $ | $ | ( | ) | ||||||||||
Diluted earnings (loss) | $ | $ | $ | $ | ( | ) | ||||||||||
Fiscal Year 2019 | ||||||||||||||||
Basic earnings | $ | $ | $ | $ | ||||||||||||
Diluted earnings | $ | $ | $ | $ | ||||||||||||
(shares in millions) | First Quarter | Second Quarter | Third Quarter | Fourth Quarter | ||||||||
Weighted average common shares outstanding | ||||||||||||
Fiscal Year 2020 | ||||||||||||
Basic | ||||||||||||
Diluted | ||||||||||||
Fiscal Year 2019 | ||||||||||||
Basic | ||||||||||||
Diluted | ||||||||||||
Item 9. Changes in and Disagreements with Accountants on Accounting and Financial Disclosure
Not applicable.
91
Item 9A. Controls and Procedures
(a) Conclusion Regarding the Effectiveness of Disclosure Controls and Procedures
The Company’s management, with the participation of the Company’s Chief Executive Officer and Chief Financial Officer, evaluated the effectiveness of the Company’s disclosure controls and procedures as defined in Rules 13a-15(e) and 15d-15(e) of the Securities Exchange Act of 1934, as amended, (the “Exchange Act”) as of June 30, 2020. Based on that evaluation, the Chief Executive Officer and Chief Financial Officer concluded that the Company’s disclosure controls and procedures as of June 30, 2020 were effective in providing a reasonable level of assurance that information we are required to disclose in reports that we file or submit under the Exchange Act is recorded, processed, summarized and reported within the time periods required under the Securities and Exchange Commission’s rules and forms, including that information required to be disclosed by us in such reports is accumulated and communicated to the Company’s management, including the Company’s Chief Executive Officer and Chief Financial Officer, as appropriate to allow timely decisions regarding required disclosure.
(b) Management’s Report on Internal Control over Financial Reporting
Management’s Report on the Company’s internal control over financial reporting is included in Item 8. of this Annual Report on Form 10-K under the caption “Management’s Report on Internal Control Over Financial Reporting” and is incorporated herein by reference. PricewaterhouseCoopers LLP, an independent registered public accounting firm has audited the effectiveness of the Company’s internal control over financial reporting as stated in their report which appears in Item 8. of this Annual Report on Form 10-K under the caption “Report of Independent Registered Public Accounting Firm” and is incorporated herein by reference.
(c) Changes in Internal Control over Financial Reporting
There have been no changes in the Company’s internal control over financial reporting that occurred during the quarter ended June 30, 2020 that have materially affected, or are likely to materially affect, the Company’s internal control over financial reporting.
Remediation of Previously Reported Material Weakness
As disclosed in Item 8. of the 2019 Form 10-K under the caption “Management’s Report on Internal Control Over Financial Reporting”, we previously identified a material weakness related to the accuracy and completeness of the data inputs for price, quantity and related customer data during the billing process. There were no misstatements identified in our annual or interim consolidated financial statements. A material weakness is a deficiency, or combination of deficiencies, in internal control over financial reporting, such that there is a reasonable possibility that a material misstatement of the annual or interim financial statements will not be prevented or detected on a timely basis.
We implemented changes to our internal control over financial reporting by enhancing the design of controls over the billing process to remediate the control deficiency that led to the material weakness. In carrying out our remediation plan, management designed and implemented new controls related to the accuracy and completeness of price, quantity and related customer data during the billing process and we have tested the operating effectiveness of these controls.
The applicable measures have been implemented for a sufficient period of time and management has concluded, through testing, that the enhanced controls are operating effectively. Management concluded the material weakness was remediated as of June 30, 2020.
Item 9B. Other Information
Not applicable.
PART III
Item 10. Directors, Executive Officers and Corporate Governance
The information required as to the officers is set forth in Part I hereof.
92
The information required as to directors and the committees of the Board of Directors is incorporated herein by reference to the Company’s fiscal year 2020 definitive Proxy Statement under the captions “Election of Directors” and “Corporate Governance”.
The information concerning compliance with Section 16(a) of the Securities and Exchange Act of 1934, as amended, is incorporated herein by reference to the Company’s fiscal year 2020 definitive Proxy Statement under the caption “Corporate Governance”.
The information concerning Carpenter’s Code of Ethics and certain additional information relating to the Company’s Corporate Governance is incorporated herein by reference to the Company’s fiscal year 2020 definitive Proxy Statement under the caption “Corporate Governance”.
The information concerning the Audit Committee and its financial experts is incorporated herein by reference to the Company’s fiscal year 2020 definitive Proxy Statement under the caption “Audit/Finance Committee Report”.
The information concerning material changes to the procedures by which shareholders may recommend nominees to the Board of Directors is incorporated herein by reference to the Company’s fiscal year 2020 definitive Proxy Statement under the caption “General Information”.
On October 15, 2019, we filed with the New York Stock Exchange (“NYSE”) the Annual CEO Certification regarding our compliance with the NYSE’s Corporate Governance listing standards as required by Section 303 A-12(a) of the NYSE Listed Company Manual. In addition, we have filed as exhibits to our annual report on Form 10-K for the fiscal year ended June 30, 2020, the applicable certifications of our Chief Executive Officer and our Chief Financial Officer required under Section 302 of the Sarbanes-Oxley Act of 2002, regarding the quality of Carpenter’s public disclosures.
Item 11. Executive Compensation
Certain information required by this item is incorporated herein by reference to the Company’s fiscal year 2020 definitive Proxy Statement under the captions “Compensation Discussion and Analysis” and “Executive Compensation”.
Item 12. Security Ownership of Certain Beneficial Owners and Management and Related Stockholder Matters
The information required by this item is incorporated herein by reference to the Company’s fiscal year 2020 definitive Proxy Statement under the caption “Security Ownership of Certain Persons”.
Equity Compensation Plan Information
The following table shows the securities authorized for issuance under equity compensation plans as of June 30, 2020:
Plan category | Number of securities to be issued upon exercise of outstanding options, warrants and rights (a) | Weighted average exercise price of outstanding options, warrants and rights (b) | Number of securities remaining available for future issuance under equity compensation plans (excluding securities reflected in column (a)) (c) | ||||||||||
Equity compensation plans approved by security holders | 2,149,541 | $ | 44.50 | 3,456,694 | (1 | ) | |||||||
Equity compensation plans not approved by security holders | — | — | — | ||||||||||
Total | 2,149,541 | $ | 44.50 | 3,456,694 | (1 | ) | |||||||
(1) Includes 2,991,773 shares available for issuance under the Amended and Restated Stock-Based Incentive Compensation Plan for Officers and Key Employees (which provides for the issuance of stock options, restricted stock and restricted stock units) and 464,921 shares available under the Stock-Based Compensation Plan for Non-Employee Directors (which provides for issuance of stock options, stock units and performance units).
There were no reportable purchases during the quarter ended June 30, 2020, provided however that 27,130 shares, at an average purchase price of $24.39, were surrendered by employees to the Company for the payment of the minimum tax liability withholding obligations upon the vesting of shares of restricted stock. We do not consider this a share repurchase program.
93
Item 13. Certain Relationships, Related Transactions and Director Independence
The information required by this item is incorporated herein by reference to the Company’s fiscal year 2020 definitive Proxy Statement under the captions “Corporate Governance” and “Executive Compensation”.
Item 14. Principal Accounting Fees and Services
The information required by this item is incorporated herein by reference to the Company’s fiscal year 2020 definitive Proxy Statement under the caption “Approval of Appointment of Independent Registered Public Accounting Firm”.
PART IV
Item 15. Exhibits and Financial Statement Schedules
(a) Financial Statement Schedule:
(1) The following consolidated financial statement schedule should be read in conjunction with the consolidated financial statements (see Item 8. “Financial Statements and Supplementary Data”):
Schedule II — Valuation and Qualifying Accounts
All other schedules are omitted because they are not applicable or the required information is contained in the consolidated financial statements or notes thereto.
(b) Exhibits
Exhibits required to be filed by Item 601 of Regulation S-K are listed below. Documents not designated as being incorporated herein by reference are filed herewith. The exhibit numbers correspond to the paragraph numbers designated in Item 601 of Regulation S-K.
Exhibit No. | Description | |
Restated Certificate of Incorporation, dated October 26, 1998 (Exhibit 3(A) to our Annual Report on Form 10-K filed on September 9, 2005 and incorporated herein by reference). | ||
By-Laws, amended as of August 11, 2015 (Exhibit 3.1 to our Current Report on Form 8-K filed on August 17, 2015 and incorporated herein by reference). | ||
Indenture, dated January 12, 1994, between Carpenter Technology Corporation and U.S. Bank Trust National Association (formerly known as First Trust of New York, National Association, as successor Trustee to Morgan Guaranty Trust Company of New York) (Exhibit 4(A) to our Quarterly Report on Form 10-Q filed on February 10, 1994 and incorporated herein by reference). | ||
Forms of Fixed Rate and Floating Rate Medium-Term Note, Series B (Exhibit 4(F) to our Annual Report on Form 10-K filed on September 3, 2004 and incorporated herein by reference). | ||
First Supplemental Indenture, dated May 22, 2003, between Carpenter Technology Corporation and U.S. Bank Trust National Association (formerly known as First Trust of New York, National Association as successor Trustee to Morgan Guaranty Trust Company of New York) (Exhibit 4(I) to our Annual Report on Form 10-K filed on September 12, 2003 and incorporated herein by reference). | ||
Second Supplemental Indenture, dated as of June 30, 2011, between Carpenter Technology Corporation and U.S. Bank National Association (Exhibit 4.1 to our Current Report on Form 8-K filed on June 30, 2011 and incorporated herein by reference). | ||
94
Form of 5.20% Senior Notes Due 2021 (Exhibit 4.2 to our Current Report on Form 8-K filed on June 30, 2011 and incorporated herein by reference). | ||
Registration Rights Agreement, dated February 29, 2012, by and among Carpenter, Watermill-Toolrock Partners, L.P., Watermill-Toolrock Partners II, L.P., Watermill-Toolrock Enterprises, LLC and HHEP-Latrobe, L.P. (Exhibit 10.2 to our Current Report on Form 8-K filed on March 1, 2012 and incorporated herein by reference). | ||
Third Supplemental Indenture, dated as of February 26, 2013, between Carpenter Technology Corporation and U.S. Bank National Association (Exhibit 4.1 to our Current Report on Form 8-K filed on February 26, 2013 and incorporated herein by reference). | ||
Fourth Supplemental Indenture, dated July 24, 2020, by and between Carpenter Technology Corporation and U.S. Bank National Association (Exhibit 4.2 to our Current Report on Form 8-K filed on July 24, 2020 and incorporated herein by reference). | ||
Form of 4.450% Senior Notes Due 2023 (Exhibit 4.2 to our Current Report on Form 8-K filed on February 26, 2013 and incorporated herein by reference). | ||
Form of Note related to the Credit Agreement, dated as of March 31, 2017, among Carpenter Technology Corporation, as borrower, Bank of America, N.A., as Administrative Agent, Swing Line Lender and L/C Issuer, and the other lenders party thereto, JPMorgan Chase Bank, N.A., as Syndication Agent, PNC Bank, National Association, US Bank, National Association and Wells Fargo Bank, National Association, each, as Documentation Agent and Merrill Lynch, Pierce, Fenner & Smith Incorporated and JPMorgan Chase Bank, N.A., as Joint Lead Arrangers and Joint Bookrunners (Exhibit 4(I) to our Annual Report on Form 10-K filed on August 11, 2017 and incorporated herein by reference). | ||
Form of 6.375% Senior Notes Due 2028 (Exhibit 4.3 to our Current Report on Form 8-K filed on July 24, 2020 and incorporated herein by reference). | ||
Supplemental Retirement Plan for Executives of Carpenter Technology Corporation (Exhibit 10(A) to our Annual Report on Form 10-K filed on August 20, 2010 and incorporated herein by reference). | ||
First Amendment to the Supplemental Retirement Plan for Executives of Carpenter Technology Corporation (Exhibit 10(A) to our Quarterly Report on Form 10-Q filed on October 27, 2016 and incorporated herein by reference.) | ||
Amended and Restated Deferred Compensation Plan for Non-Management Directors of Carpenter Technology Corporation (Exhibit 10(B) to our Annual Report on Form 10-K filed on August 24, 2011 and incorporated herein by reference). | ||
Second Amendment to the Amended and Restated Deferred Compensation Plan for Non-Management Directors of Carpenter Technology Corporation (Exhibit 10(D) to our Annual Report on Form 10-K filed on August 29, 2019 and incorporated herein by reference). | ||
Amended and Restated Deferred Compensation Plan for Officers and Key Employees of Carpenter Technology Corporation (Exhibit 10(D) to our Annual Report on Form 10-K filed on August 11, 2017 and incorporated herein by reference). | ||
Second Amendment to the Amended and Restated Deferred Compensation Plan for Officers and Key Employees of Carpenter Technology Corporation ( Exhibit 10(F) to our Annual Report on Form 10-K filed on August 29, 2019 and incorporated herein by reference). | ||
95
Stock-Based Compensation Plan For Non-Employee Directors, as amended (Exhibit 10(E) to our Annual Report on Form 10-K filed on August 24, 2011 and incorporated herein by reference). | ||
Second Amendment to the Stock-Based Compensation Plan for Non-Employee Directors, as amended (Exhibit 10(H) to our Annual Report on Form 10-K filed on August 29, 2019 and incorporated herein by reference). | ||
Trust Agreement for Non-Qualified Employee Benefits Trust between Carpenter Technology Corporation and JP Morgan Chase Bank, N.A., effective as of August 15, 2014 (Exhibit 10(G) to our Annual Report on Form 10-K filed on August 25, 2015 and incorporated herein by reference). | ||
Amended and Restated Stock-Based Incentive Compensation Plan for Officers and Key Employees (Exhibit A to our Definitive Proxy Statement filed on September 19, 2016 and incorporated herein by reference). | ||
Form of Restricted Stock Unit Award Agreement (pursuant to Carpenter’s Stock-Based Incentive Compensation Plan for Officers and Key Employees) (Exhibit 10(K) to our Annual Report filed on August 14, 2018 and incorporated herein by reference). | ||
Form of Performance Stock Unit Award Agreement (pursuant to Carpenter’s Stock-Based Incentive Compensation Plan for Officers and Key Employees) (Exhibit 10(L) to our Annual Report filed on August 14, 2018 and incorporated herein by reference). | ||
Form of Stock Option Award Agreement (pursuant to Carpenter’s Stock-Based Incentive Compensation Plan for Officers and Key Employees) (Exhibit 10(M) to our Annual Report filed on August 14, 2018 and incorporated herein by reference). | ||
Form of Three-Year Performance Stock Unit Award Agreement (pursuant to Carpenter’s Stock-Based Incentive Compensation Plan for Officers and Key Employees) (filed herewith). | ||
Form of FY19 and FY20 Three-Year Performance Stock Unit Award Agreement (As Amended) (pursuant to Carpenter’s Stock-Based Incentive Compensation Plan for Officers and Key Employees) (filed herewith). | ||
Amended and Restated Carpenter Technology Corporation Change of Control Severance Plan (Exhibit 10.A to our Quarterly Report on Form 10-Q filed on February 1, 2018 and incorporated herein by reference). | ||
Benefits Restoration Plan of Carpenter Technology Corporation (Exhibit 10.1 to our Quarterly Report on Form 10-Q filed on May 2, 2016 and incorporated herein by reference). | ||
First Amendment to the Benefits Restoration Plan of Carpenter Technology Corporation (Exhibit 10(A) to our Quarterly Report on Form 10-Q filed on October 27, 2016 and incorporated herein by reference). | ||
Form of Indemnification Agreement for Directors and Officers (Exhibit 10.1 to our Quarterly Report on Form 10-Q filed on May 7, 2015 and incorporated herein by reference). | ||
Amended and Restated Severance Pay Plan for Executives of Carpenter Technology Corporation (Exhibit 10(S) to our Annual Report on Form 10-K filed on August 11, 2017 and incorporated herein by reference). | ||
96
Credit Agreement, dated as of March 31, 2017, among Carpenter Technology Corporation, as borrower, Bank of America, N.A., as Administrative Agent, Swing Line Lender and L/C Issuer, and the other lenders party thereto, JPMorgan Chase Bank, N.A., as Syndication Agent, PNC Bank, National Association, US Bank, National Association and Wells Fargo Bank, National Association, each, as Documentation Agent and Merrill Lynch, Pierce, Fenner & Smith Incorporated and JPMorgan Chase Bank, N.A., as Joint Lead Arrangers and Joint Bookrunners (Exhibit 10.1 to our Current Report on Form 8-K filed on April 4, 2017 and incorporated herein by reference). | ||
Offer Letter, dated June 1, 2015, by and between Carpenter Technology Corporation and Tony R. Thene (Exhibit 10.1 to our Current Report on Form 8-K filed on June 3, 2015 and incorporated herein by reference). | ||
Offer Letter, dated August 6, 2018, by and between Carpenter Technology Corporation and Timothy Lain (Exhibit 10.1 to our Current Report on Form 8-K filed on August 8, 2018 and incorporated herein by reference). | ||
Employment Letter of Agreement, dated August 13, 2010, by and between Carpenter Technology Corporation and James D. Dee (Exhibit 10(F) of Carpenter's Form 10-Q for the quarter ended September 30, 2010 filed November 5, 2010 and incorporated herein by reference). | ||
Offer Letter, dated June 29, 2015, by and between Carpenter Technology Corporation and Brian J. Malloy ( Exhibit 10(AA) to our Annual Report on Form 10-K filed on August 29, 2019 and incorporated herein by reference). | ||
Offer Letter, dated April 24, 2018, by and between Carpenter Technology Corporation and Michael Murtagh ( Exhibit 10(AB) to our Annual Report on Form 10-K filed on August 29, 2019 and incorporated herein by reference). | ||
Subsidiaries of the Registrant (filed herewith). | ||
Consent of PricewaterhouseCoopers LLP (filed herewith). | ||
Powers of Attorney in favor of James D. Dee or Timothy Lain (filed herewith). | ||
Certification of Chief Executive Officer required by the Securities and Exchange Commission Rule 13a-14(a)/15d-14(a) (filed herewith). | ||
Certification of Chief Financial Officer required by the Securities and Exchange Commission Rule 13a-14(a)/15d-14(a) (filed herewith). | ||
Certification pursuant to 18 U.S.C Section 1350 (filed herewith). | ||
101 | The following financial information from this Annual Report on Form 10-K for the fiscal year ended June 30, 2020, formatted in XBRL (Extensible Business Reporting Language) and furnished electronically herewith: (i) the Consolidated Balance Sheets; (ii) the Consolidated Statements of Income; (iii) the Consolidated Statements of Comprehensive Income (Loss); (iv) the Consolidated Statements of Cash Flows; (v) the Consolidated Statements of Changes in Equity; and (vi) the Notes to the Consolidated Financial Statements (filed herewith). | |
† Denotes employment- or compensation- related agreement, document or plan.
Item 16. Form 10-K Summary
None.
97
SIGNATURES
Pursuant to the requirements of Section 13 or 15(d) of the Securities Exchange Act of 1934, the registrant has duly caused this Report to be signed on its behalf by the undersigned, thereunto duly authorized.
CARPENTER TECHNOLOGY CORPORATION | ||
By | /s/ Timothy Lain | |
Timothy Lain | ||
Senior Vice President and Chief Financial Officer | ||
Date: September 4, 2020 | ||
Pursuant to the requirements of the Securities Exchange Act of 1934, this Report has been signed by the following persons on behalf of the registrant in the capacities and on the dates indicated.
/s/ Tony R. Thene | President and Chief Executive Officer | September 4, 2020 | ||
Tony R. Thene | and Director | |||
(Principal Executive Officer) | ||||
/s/ Timothy Lain | Senior Vice President and Chief Financial Officer | September 4, 2020 | ||
Timothy Lain | (Principal Financial Officer) | |||
/s/ Elizabeth Socci | Vice President - Controller, Chief Accounting | September 4, 2020 | ||
Elizabeth Socci | Officer | |||
(Principal Accounting Officer) | ||||
98
* | Chairman and Director | September 4, 2020 | ||
Gregory A. Pratt | ||||
* | Director | September 4, 2020 | ||
Viola L. Acoff | ||||
* | Director | September 4, 2020 | ||
A. John Hart | ||||
* | Director | September 4, 2020 | ||
I. Martin Inglis | ||||
* | Director | September 4, 2020 | ||
Steven E. Karol | ||||
* | Director | September 4, 2020 | ||
Kathleen Ligocki | ||||
* | Director | September 4, 2020 | ||
Robert R. McMaster | ||||
* | Director | September 4, 2020 | ||
Jeffrey Wadsworth | ||||
* | Director | September 4, 2020 | ||
Stephen M. Ward, Jr. | ||||
Original Powers of Attorney authorizing James D. Dee or Timothy Lain to sign this Report on behalf of: Gregory A. Pratt, Viola L. Acoff, A. John Hart, I. Martin Inglis, Steven E. Karol, Kathleen Ligocki, Robert R. McMaster, Jeffrey Wadsworth, and Stephen M. Ward, Jr., being filed with the Securities and Exchange Commission.
*By | /s/ James D. Dee | |
James D. Dee | ||
Attorney-in-fact | ||
99
CARPENTER TECHNOLOGY CORPORATION AND SUBSIDIARIES
SCHEDULE II. VALUATION AND QUALIFYING ACCOUNTS
($ in millions)
Column A | Column B | Column C Additions | Column D | Column E | ||||||||||||||||
Description | Balance at Beginning of Period | Charged to Costs & Expenses | Charged to Other Accounts | Deductions | Balance at End of Period | |||||||||||||||
Year Ended June 30, 2020 | ||||||||||||||||||||
Allowance for doubtful accounts receivable | $ | $ | $ | ( | ) | $ | $ | |||||||||||||
Deferred tax valuation allowance | $ | $ | ( | ) | $ | $ | $ | |||||||||||||
Year Ended June 30, 2019 | ||||||||||||||||||||
Allowance for doubtful accounts receivable | $ | $ | $ | ( | ) | $ | $ | |||||||||||||
Deferred tax valuation allowance | $ | $ | $ | $ | $ | |||||||||||||||
Year Ended June 30, 2018 | ||||||||||||||||||||
Allowance for doubtful accounts receivable | $ | $ | $ | ( | ) | $ | $ | |||||||||||||
Deferred tax valuation allowance | $ | $ | $ | $ | $ | |||||||||||||||
100