UNITED STATES
SECURITIES AND EXCHANGE COMMISSION
Washington, D.C. 20549
FORM N-CSR
CERTIFIED SHAREHOLDER REPORT OF REGISTERED MANAGEMENT INVESTMENT COMPANIES
Investment Company Act file number: 811-23402
| Name of Fund: | BlackRock ETF Trust |
| BlackRock Future Health ETF |
| BlackRock Future Innovators ETF |
| BlackRock Future Tech ETF |
| BlackRock U.S. Carbon Transition Readiness ETF |
| BlackRock U.S. Equity Factor Rotation ETF |
| BlackRock World ex U.S. Carbon Transition Readiness ETF |
| Fund Address: | 100 Bellevue Parkway, Wilmington, DE 19809 |
Name and address of agent for service: John M. Perlowski, Chief Executive Officer, BlackRock ETF Trust, 55 East 52nd Street, New York, NY 10055
Registrant’s telephone number, including area code: (800) 441-7762
Date of fiscal year end: 07/31/2021
Date of reporting period: 07/31/2021
| Item 1 – | Report to Stockholders |
(a) The Report to Shareholders is attached herewith.
|
|
JULY 31, 2021 |

| 2021 Annual Report
| ||
BlackRock ETF Trust
| · | BlackRock Future Health ETF | BMED | NYSE Arca |
| · | BlackRock Future Innovators ETF | BFTR | NYSE Arca |
| · | BlackRock Future Tech ETF | BTEK | NYSE Arca |
| · | BlackRock U.S. Carbon Transition Readiness ETF | LCTU | NYSE Arca |
| · | BlackRock U.S. Equity Factor Rotation ETF | DYNF | NYSE Arca |
| · | BlackRock World ex U.S. Carbon Transition Readiness ETF | LCTD | NYSE Arca |
| Not FDIC Insured • May Lose Value • No Bank Guarantee |
Dear Shareholder,
The 12-month reporting period as of July 31, 2021 was a remarkable period of adaptation and recovery, as the global economy dealt with the implications of the coronavirus (or “COVID-19”) pandemic. The United States, along with most of the world, began the reporting period emerging from a severe recession, prompted by pandemic-related restrictions that disrupted many aspects of daily life. However, easing restrictions and robust government intervention led to a strong rebound, and the economy grew at a significant pace for the reporting period, eventually regaining the output lost from the pandemic.
Equity prices rose with the broader economy, as strong fiscal and monetary support, as well as the development of vaccines, made investors increasingly optimistic about the economic outlook. The implementation of mass vaccination campaigns and passage of two additional fiscal stimulus packages further boosted stocks, and many equity indices neared or surpassed all-time highs late in the reporting period. In the United States, returns of small-capitalization stocks, which benefited the most from the resumption of in-person activities, outpaced large-capitalization stocks. International equities also gained, as both developed and emerging markets rebounded substantially.
The 10-year U.S. Treasury yield (which is inversely related to bond prices) had fallen sharply prior to the beginning of the reporting period, which meant bonds were priced for extreme risk avoidance and economic disruption. Despite expectations of doom and gloom, the economy expanded rapidly, stoking inflation concerns in early 2021, which led to higher yields and a negative overall return for most U.S. Treasuries. In the corporate bond market, support from the U.S. Federal Reserve (the “Fed”) assuaged credit concerns and led to solid returns for high-yield corporate bonds, although investment-grade corporates declined slightly.
The Fed remained committed to accommodative monetary policy by maintaining near zero interest rates and by reiterating that inflation could exceed its 2% target for a sustained period without triggering a rate increase. In response to rising inflation late in the period, the Fed changed its market guidance, raising the likelihood of less bond purchasing and the possibility of higher rates in 2023.
Looking ahead, we believe that the global expansion will continue to broaden as Europe and other developed market economies gain momentum, although the delta variant remains a threat, particularly in emerging markets. While we expect inflation to remain elevated in the medium-term as the expansion continues, we believe the recent uptick owes more to temporary supply disruptions than a lasting change in fundamentals. The change in Fed policy also means that moderate inflation is less likely to be followed by interest rate hikes that could threaten the economic expansion.
Overall, we favor a moderately positive stance toward risk, with an overweight in equities. Sectors that are better poised to manage the transition to a lower-carbon world, such as technology and healthcare, are particularly attractive in the long-term. U.S. small-capitalization stocks and European equities are likely to benefit from the continuing vaccine-led restart. We are underweight long-term credit, but inflation-protected U.S. Treasuries, Asian fixed income, and Chinese government bonds offer potential opportunities. We believe that international diversification and a focus on sustainability can help provide portfolio resilience, and the disruption created by the coronavirus appears to be accelerating the shift toward sustainable investments.
In this environment, our view is that investors need to think globally, extend their scope across a broad array of asset classes, and be nimble as market conditions change. We encourage you to talk with your financial advisor and visit blackrock.com for further insight about investing in today’s markets.
Sincerely,

Rob Kapito
President, BlackRock Advisors, LLC

Rob Kapito
President, BlackRock Advisors, LLC
| Total Returns as of July 31, 2021 | ||||||||
| 6-Month | 12-Month | |||||||
| U.S. large cap equities (S&P 500® Index) |
19.19% | 36.45% | ||||||
| U.S. small cap equities (Russell 2000® Index) |
7.86 | 51.97 | ||||||
| International equities (MSCI Europe, Australasia, Far East Index) |
10.83 | 30.31 | ||||||
| Emerging market equities (MSCI Emerging Markets Index) |
(2.76) | 20.64 | ||||||
| 3-month Treasury bills (ICE BofA 3-Month U.S. Treasury Bill Index) |
0.02 | 0.08 | ||||||
| U.S. Treasury securities (ICE BofA 10-Year U.S. Treasury Index) |
(0.59) | (5.12) | ||||||
| U.S. investment grade bonds (Bloomberg Barclays U.S. Aggregate Bond Index) |
0.21 | (0.70) | ||||||
| Tax-exempt municipal bonds (S&P Municipal Bond Index) |
1.38 | 3.47 | ||||||
| U.S. high yield bonds (Bloomberg Barclays U.S. Corporate High Yield 2% Issuer Capped Index) |
3.66 | 10.62 | ||||||
Past performance is not an indication of future results. Index performance is shown for illustrative purposes only. You cannot invest directly in an index.
| 2 | T H I S P A G E I S N O T P A R T O F Y O U R F U N D R E P O R T |
| Page | ||||
| 2 | ||||
| 4 | ||||
| 14 | ||||
| 14 | ||||
| 15 | ||||
| Financial Statements: |
||||
| 43 | ||||
| 45 | ||||
| 47 | ||||
| 50 | ||||
| 56 | ||||
| 67 | ||||
| 68 | ||||
| 69 | ||||
| 75 | ||||
| 76 | ||||
| 80 | ||||
| 82 | ||||
| 3 |
| Fund Summary as of July 31, 2021 | BlackRock Future Health ETF |
Investment Objective
The BlackRock Future Health ETF (the “Fund”) seeks to maximize total return.
Performance
| Cumulative Total Returns | ||||
| Since Inception |
||||
| Fund NAV |
19.50 | % | ||
| Fund Market |
19.62 | |||
| MSCI ACWI Index |
30.25 | |||
GROWTH OF $10,000 INVESTMENT
(SINCE INCEPTION AT NET ASSET VALUE)
The inception date of the Fund was 9/29/20. The first day of secondary market trading was 10/1/20.
MSCI All Country World Index comprises large and mid-capitalization developed and emerging market equities.
Past performance is no guarantee of future results. Performance results do not reflect the deduction of taxes that a shareholder would pay on fund distributions or on the redemption or sale of fund shares. See “About Fund Performance” on page 14 for more information.
Expense Example
| Actual | Hypothetical 5% Return | |||||||||||||||||||||||||||||
| |
Beginning Account Value (02/01/21) |
|
|
Ending Account Value (07/31/21) |
|
|
Expenses Paid During the Period |
(a) |
|
Beginning Account Value (02/01/21) |
|
|
Ending Account Value (07/31/21) |
|
|
Expenses Paid During the Period |
(a) |
|
Annualized Expense Ratio |
| ||||||||||
| $ 1,000.00 | $ 1,012.50 | $ 4.24 | $ 1,000.00 | $ 1,020.60 | $ 4.26 | 0.85 | % | |||||||||||||||||||||||
| (a) | Expenses are calculated using the Fund’s annualized expense ratio (as disclosed in the table), multiplied by the average account value for the period, multiplied by the number of days in the period (181 days) and divided by the number of days in the year (365 days). Other fees, such as brokerage commissions and other fees to financial intermediaries, may be paid which are not reflected in the tables and examples above. See “Shareholder Expenses” on page 14 for more information. |
| 4 | 2 0 2 1 B L A C K R O C K A N N U A L R E P O R T T O S H A R E H O L D E R S |
| Fund Summary as of July 31, 2021 (continued) | BlackRock Future Health ETF |
Portfolio Management Commentary
The stocks of innovative and emerging companies in the healthcare sector advanced during the reporting period. The medical devices and supplies sub-sector contributed the most to the Fund’s return.
Medical device companies with exposure to elective procedures benefited as a reduction on COVID-19 cases allowed hospitals to resume elective procedures. Devices used in nonemergency healthcare, like hearing aids, posted strong sales growth after pandemic-related restrictions were lifted, allowing care providers to reopen for less acute health needs. Life sciences tools and services companies also contributed meaningfully to the Fund’s performance. Contract research organizations benefited from demand for laboratory services from pharmaceuticals companies conducting research and development, particularly for coronavirus vaccine studies. The biotechnology industry contributed meaningfully, supported by regulatory approvals for several new cancer therapies and strategic collaborations for developing cancer and autoimmune treatments.
In terms of the largest individual drivers of performance, Chinese contract research organization WuXi Biologics was the largest individual stock contributor to the Fund’s return during the reporting period. The company benefited from increased demand for research and development services for coronavirus vaccine and treatment production. Switzerland-based Straumann Holding advanced amid consumer spending gains on elective procedures such as specialty dental treatments as pandemic-related restrictions were lifted. Leading individual detractors from the Fund’s return included two U.S.-based biotechnology companies. Seagen, a growth-oriented maker of antibody conjugates, was challenged by the reversal of market sentiment from growth to value. Forma Therapeutics’ stock also declined following pandemic-related delays in its clinical trial.
Portfolio Information
ALLOCATION BY SECTOR
| Sector | |
Percent of Total Investments |
(a) | |
| Biotechnology |
33.0 | % | ||
| Health Care Equipment & Supplies |
31.7 | |||
| Health Care Providers & Services |
14.8 | |||
| Life Sciences Tools & Services |
14.7 | |||
| Pharmaceuticals |
3.5 | |||
| Diversified Financial Services |
1.7 | |||
| Other (each representing less than 1%) |
0.6 |
TEN LARGEST HOLDINGS
| Security | |
Percent of Total Investments |
(a) | |
| Genmab A/S |
3.7 | % | ||
| Seagen Inc. |
2.9 | |||
| Intuitive Surgical Inc. |
2.7 | |||
| Straumann Holding AG |
2.3 | |||
| Amedisys Inc. |
2.2 | |||
| Teleflex Inc. |
2.1 | |||
| Alcon Inc. |
2.1 | |||
| LHC Group Inc. |
2.0 | |||
| Wuxi Biologics Cayman Inc. |
1.9 | |||
| ICON PLC |
1.9 |
| (a) | Excludes money market funds. |
| F U N D S U M M A R Y |
5 |
| Fund Summary as of July 31, 2021 | BlackRock Future Innovators ETF |
Investment Objective
The BlackRock Future Innovators ETF (the “Fund”) seeks long-term capital appreciation.
Performance
| Cumulative Total Returns | ||||
| Since Inception |
||||
| Fund NAV |
42.27 | % | ||
| Fund Market |
42.24 | |||
| Russell 2500™ Growth Index |
34.20 | |||
GROWTH OF $10,000 INVESTMENT
(SINCE INCEPTION AT NET ASSET VALUE)
The inception date of the Fund was 9/29/20. The first day of secondary market trading was 10/1/20.
Certain sectors and markets performed exceptionally well based on market conditions since the Fund commenced operations. Achieving such exceptional returns involves the risk of volatility and investors should not expect that such exceptional returns will be repeated.
The Russell 2500™ Growth Index measures the performance of the small to mid-cap growth segment of the US equity universe. It includes those Russell 2500™ companies with higher growth earning potential as defined by FTSE Russell’s leading style methodology.
Past performance is no guarantee of future results. Performance results do not reflect the deduction of taxes that a shareholder would pay on fund distributions or on the redemption or sale of fund shares. See “About Fund Performance” on page 14 for more information.
Expense Example
| Actual | Hypothetical 5% Return | |||||||||||||||||||||||||||||
| |
Beginning Account Value (02/01/21) |
|
|
Ending Account Value (07/31/21) |
|
|
Expenses Paid During the Period |
(a) |
|
Beginning Account Value (02/01/21) |
|
|
Ending Account Value (07/31/21) |
|
|
Expenses Paid During the Period |
(a) |
|
Annualized Expense Ratio |
| ||||||||||
| $ 1,000.00 | $ 1,020.60 | $ 4.01 | $ 1,000.00 | $ 1,020.80 | $ 4.01 | 0.80 | % | |||||||||||||||||||||||
| (a) | Expenses are calculated using the Fund’s annualized expense ratio (as disclosed in the table), multiplied by the average account value for the period, multiplied by the number of days in the period (181 days) and divided by the number of days in the year (365 days). Other fees, such as brokerage commissions and other fees to financial intermediaries, may be paid which are not reflected in the tables and examples above. See “Shareholder Expenses” on page 14 for more information. |
| 6 | 2 0 2 1 B L A C K R O C K A N N U A L R E P O R T T O S H A R E H O L D E R S |
| Fund Summary as of July 31, 2021 (continued) | BlackRock Future Innovators ETF |
Portfolio Management Commentary
Stocks of innovative, small- and medium-capitalization growth companies advanced strongly for the reporting period, propelled by a recovering economy and the continuation of trends toward increasing automation. The health care sector was the leading contributor to the Fund’s return led by the biotechnology sub-sector and followed by the health care technology and pharmaceuticals sub-sectors. In health care technology, increased automation of patient check-in procedures at medical facilities, motivated in part by social distancing recommendations, drove gains among makers of platforms that manage patient intake.
Following health care, the industrials sector also contributed to the Fund’s performance. The electrical equipment industry as well as the aerospace & defense and machinery sub-sectors led returns for the sector. In addition to health care and industrials, information technology contributed to the Fund’s return, led by the software industry. The pandemic accelerated adoption of software that assists in managing office functions in an environment with many employees working online. As more businesses migrated office functions to cloud computing platforms, sales of software providing payroll and other back-office services to smaller businesses grew significantly. Semiconductors and semiconductor equipment stocks benefited from a global microchip shortage, which helped bolster profit margins at companies that provide materials for chip manufacturers.
In terms of relative performance, the Fund significantly outperformed the broader market, as represented by the Russell 2500 Growth Index. On a relative basis, the leading contributor to the Fund’s return was Plug Power, a developer of hydrogen-powered fuel-cell technologies. The company initiated ventures to develop alternative power systems for vehicles in South Korea and France and announced plans to build North America’s largest hydrogen facility in New York state. Amyris, a maker of synthetic chemicals, was another notable contributor to the Fund’s relative performance, benefiting from the economic recovery and the related rebound in consumer spending. Amyris creates and sells sustainable ingredients to use in products such as cosmetics and foods while continuing to expand its pipeline of ingredients in active development.
On the downside, Kahoot!, a company in the entertainment industry that creates educational technology platforms, detracted from the Fund’s relative performance. Slow organic growth constrained the Norwegian company, although it continued to make acquisitions during the reporting period, such as Clever, which makes educational portal software. Used car sales platform Vroom also weighed on the Fund’s relative return amid slowing revenue growth and labor constraints.
Portfolio Information
ALLOCATION BY SECTOR
| Sector | |
Percent of Total Investments |
(a) | |
| Software |
18.2 | % | ||
| Life Sciences Tools & Services |
9.3 | |||
| Semiconductors & Semiconductor Equipment |
8.6 | |||
| Health Care Equipment & Supplies |
7.4 | |||
| Health Care Technology |
6.7 | |||
| IT Services |
6.4 | |||
| Aerospace & Defense |
5.0 | |||
| Hotels, Restaurants & Leisure |
4.6 | |||
| Specialty Retail |
4.1 | |||
| Biotechnology |
3.5 | |||
| Diversified Consumer Services |
3.2 | |||
| Chemicals |
2.9 | |||
| Auto Components |
2.8 | |||
| Food Products |
2.6 | |||
| Electronic Equipment, Instruments & Components |
2.1 | |||
| Machinery |
1.8 | |||
| Building Products |
1.7 | |||
| Entertainment |
1.6 | |||
| Personal Products |
1.5 | |||
| Equity Real Estate Investment Trusts (REITs) |
1.5 | |||
| Electrical Equipment |
1.2 | |||
| Road & Rail |
1.1 | |||
| Internet & Direct Marketing Retail |
1.0 | |||
| Other (each representing less than 1%) |
1.2 |
TEN LARGEST HOLDINGS
| Security | |
Percent of Total Investments |
(a) | |
| Axon Enterprise Inc. |
3.6 | % | ||
| Avalara Inc. |
3.3 | |||
| Phreesia Inc. |
3.1 | |||
| Bio-Techne Corp. |
3.0 | |||
| Amyris Inc. |
2.9 | |||
| Entegris Inc. |
2.8 | |||
| Lightspeed POS Inc. |
2.8 | |||
| Vroom Inc. |
2.8 | |||
| Fox Factory Holding Corp. |
2.8 | |||
| Five9 Inc. |
2.7 |
| (a) | Excludes money market funds. |
| F U N D S U M M A R Y |
7 |
| Fund Summary as of July 31, 2021 | BlackRock Future Tech ETF |
Investment Objective
The BlackRock Future Tech ETF (the “Fund”) seeks to maximize total return.
Performance
| Cumulative Total Returns | ||||
| Since Inception |
||||
| Fund NAV |
43.68 | % | ||
| Fund Market |
43.76 | |||
| MSCI ACWI Index |
30.25 | |||
GROWTH OF $10,000 INVESTMENT
(SINCE INCEPTION AT NET ASSET VALUE)
The inception date of the Fund was 9/29/20. The first day of secondary market trading was 10/1/20.
Certain sectors and markets performed exceptionally well based on market conditions since the Fund commenced operations. Achieving such exceptional returns involves the risk of volatility and investors should not expect that such exceptional returns will be repeated.
MSCI All Country World Index comprises large and mid-capitalization developed and emerging market equities.
Past performance is no guarantee of future results. Performance results do not reflect the deduction of taxes that a shareholder would pay on fund distributions or on the redemption or sale of fund shares. See “About Fund Performance” on page 14 for more information.
Expense Example
| Actual | Hypothetical 5% Return | |||||||||||||||||||||||||||||
| |
Beginning Account Value (02/01/21) |
|
|
Ending Account Value (07/31/21) |
|
|
Expenses Paid During the Period |
(a) |
|
Beginning Account Value (02/01/21) |
|
|
Ending Account Value (07/31/21) |
|
|
Expenses Paid During the Period |
(a) |
|
Annualized Expense Ratio |
| ||||||||||
| $ 1,000.00 | $ 999.20 | $ 4.36 | $ 1,000.00 | $ 1,020.40 | $ 4.41 | 0.88 | % | |||||||||||||||||||||||
| (a) | Expenses are calculated using the Fund’s annualized expense ratio (as disclosed in the table), multiplied by the average account value for the period, multiplied by the number of days in the period (181 days) and divided by the number of days in the year (365 days). Other fees, such as brokerage commissions and other fees to financial intermediaries, may be paid which are not reflected in the tables and examples above. See “Shareholder Expenses” on page 14 for more information. |
| 8 | 2 0 2 1 B L A C K R O C K A N N U A L R E P O R T T O S H A R E H O L D E R S |
| Fund Summary as of July 31, 2021 (continued) | BlackRock Future Tech ETF |
Portfolio Management Commentary
The stocks of companies developing innovative and emerging technologies in the technology sector advanced significantly during the reporting period. The semiconductors industry contributed the most to the Fund’s return, driven in part by a global shortage of semiconductors as a fast-paced economic recovery boosted demand, putting pressure on supply. The most notable contributors within the semiconductors industry were semiconductor capital equipment manufacturers that benefitted from increased investments from foundries, as well as semiconductor manufacturers tied to secular growth themes such as the build out of 5G infrastructure and the broader adoption of electric vehicles.
Internet companies were another source of strength as many companies posted strong earnings and growth on the back of increased ad spending as a result of the economic recovery. The software industry also contributed to the Fund’s return. Cloud software companies experienced considerable growth over the period as the pandemic continued to accelerate the digital transformation of enterprises from on-premise computing to cloud computing.
A position in Canadian payment software provider Lightspeed was the largest individual stock contributor to return over the period. The company benefitted from the reopening of its merchant base and an increase in payments monetization. A position in US-based social media company Snap Inc was the second largest individual stock contributor to return over the period, as the company’s flagship app, Snapchat, saw high growth in both revenue and daily active users.
A position in Japanese cloud security SaaS provider Hennge KK was the largest individual stock detractor from return over the period, as the adoption of SaaS has picked up slower than expected in Japan. A position in US-based e-commerce company ContextLogic was the second largest individual stock detractor from performance over the period. The company’s stock came under pressure as the economic restart led to a deceleration of revenue growth.
Portfolio Information
ALLOCATION BY SECTOR
| Sector | |
Percent of Total Investments |
(a) | |
| Semiconductors & Semiconductor Equipment |
27.2 | % | ||
| Software |
24.8 | |||
| IT Services |
15.3 | |||
| Interactive Media & Services |
6.8 | |||
| Internet & Direct Marketing Retail |
4.9 | |||
| Entertainment |
4.9 | |||
| Electronic Equipment, Instruments & Components |
3.4 | |||
| Professional Services |
2.1 | |||
| Automobiles |
2.0 | |||
| Machinery |
1.6 | |||
| Diversified Consumer Services |
1.3 | |||
| Road & Rail |
1.3 | |||
| Other (each representing less than 1%) |
4.4 |
TEN LARGEST HOLDINGS
| Security | |
Percent of Total Investments |
(a) | |
| Kakao Corp. |
2.4 | % | ||
| Lightspeed POS Inc. |
2.1 | |||
| Marvell Technology Inc. |
2.1 | |||
| Silergy Corp. |
2.1 | |||
| Snap Inc., Class A |
1.9 | |||
| Tesla Inc. |
1.7 | |||
| Samsung SDI Co. Ltd. |
1.7 | |||
| Square Inc., Class A |
1.7 | |||
| Shift4 Payments Inc., Class A |
1.7 | |||
| Enphase Energy Inc. |
1.6 |
| (a) | Excludes money market funds. |
| F U N D S U M M A R Y |
9 |
| Fund Summary as of July 31, 2021 | BlackRock U.S. Carbon Transition Readiness ETF |
Investment Objective
The BlackRock U.S. Carbon Transition Readiness ETF (the “Fund”) seeks long-term capital appreciation by investing in large- and mid-capitalization U.S. equity securities that may be better positioned to benefit from the transition to a low-carbon economy.
Performance
| Cumulative Total Returns | ||||
| Since Inception |
||||
| Fund NAV |
8.74 | % | ||
| Fund Market |
8.81 | |||
| Russell 1000® Index |
7.97 | |||
For the fiscal period ended 7/31/21, the Fund did not have six months of performance and therefore line graphs are not presented.
The inception date of the Fund was 4/6/21. The first day of secondary market trading was 4/8/21.
The Russell 1000® Index measures the performance of the large-cap segment of the U.S. equity universe. It is a subset of the Russell 3000® Index and includes approximately 1,000 of the largest securities based on a combination of their market capitalization and current index membership. The index represents approximately 92% of the total market capitalization of the Russell 3000® Index.
Past performance is no guarantee of future results. Performance results do not reflect the deduction of taxes that a shareholder would pay on fund distributions or on the redemption or sale of fund shares. See “About Fund Performance” on page 14 for more information.
Expense Example
| Actual | Hypothetical 5% Return | |||||||||||||||||||||||||||||
| |
Beginning Account Value |
|
|
Ending Account Value (07/31/21) |
|
|
Expenses Paid During the Period |
(b) |
|
Beginning Account Value (02/01/21) |
|
|
Ending Account Value (07/31/21) |
|
|
Expenses Paid During the Period |
(b) |
|
Annualized Expense Ratio |
| ||||||||||
| $ 1,000.00 | $ 1,087.40 | $ 0.46 | $ 1,000.00 | $ 1,024.10 | $ 0.70 | 0.14 | % | |||||||||||||||||||||||
| (a) | The beginning of the period (commencement of operations) is April 06, 2021. |
| (b) | Expenses are calculated using the Fund’s annualized expense ratio (as disclosed in the table), multiplied by the average account value for the period, multiplied by the number of days in the period (116 days for actual and 181 days for hypothetical expenses) and divided by the number of days in the year (365 days). Other fees, such as brokerage commissions and other fees to financial intermediaries, may be paid which are not reflected in the tables and examples above. See “Shareholder Expenses” on page 14 for more information. |
Portfolio Information
ALLOCATION BY SECTOR
| Sector | |
Percent of Total Investments |
(a) | |
| Information Technology |
28.3 | % | ||
| Health Care |
13.3 | |||
| Consumer Discretionary |
11.9 | |||
| Communication Services |
10.8 | |||
| Financials |
10.8 | |||
| Industrials |
9.4 | |||
| Consumer Staples |
5.1 | |||
| Real Estate |
3.1 | |||
| Materials |
2.6 | |||
| Energy |
2.5 | |||
| Utilities |
2.2 |
TEN LARGEST HOLDINGS
| Security | |
Percent of Total Investments |
(a) | |
| Apple Inc. |
5.4 | % | ||
| Microsoft Corp. |
5.0 | |||
| Amazon.com Inc. |
2.9 | |||
| Facebook Inc., Class A |
2.2 | |||
| Alphabet Inc., Class C |
2.0 | |||
| Alphabet Inc., Class A |
1.9 | |||
| Tesla Inc. |
1.4 | |||
| Berkshire Hathaway Inc., Class B |
1.3 | |||
| JPMorgan Chase & Co. |
1.2 | |||
| NVIDIA Corp. |
1.1 |
| (a) | Excludes money market funds. |
| 10 | 2 0 2 1 B L A C K R O C K A N N U A L R E P O R T T O S H A R E H O L D E R S |
| Fund Summary as of July 31, 2021 | BlackRock U.S. Equity Factor Rotation ETF |
Investment Objective
The BlackRock U.S. Equity Factor Rotation ETF (the “Fund”) seeks to outperform the investment results of the large- and mid-capitalization U.S. equity markets by providing diversified and tactical exposure to style factors via a factor rotation model. The Fund is an actively managed exchange-traded fund and does not seek to replicate the performance of a specified index.
Performance
| Average Annual Total Returns | Cumulative Total Returns | |||||||||||||||||||
| 1 Year | Since Inception |
1 Year | Since Inception |
|||||||||||||||||
| Fund NAV |
37.87 | % | 19.89 | % | 37.87 | % | 53.72 | % | ||||||||||||
| Fund Market |
37.98 | 19.88 | 37.98 | 53.67 | ||||||||||||||||
| MSCI USA Index |
37.70 | 23.99 | 37.70 | 66.23 | ||||||||||||||||
GROWTH OF $10,000 INVESTMENT
(SINCE INCEPTION AT NET ASSET VALUE)
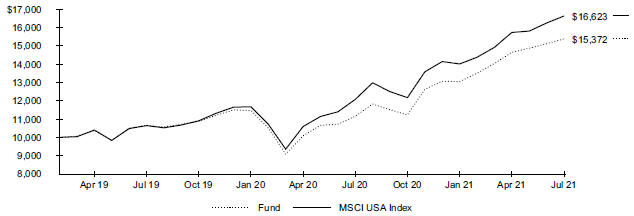
The inception date of the Fund was 3/19/19. The first day of secondary market trading was 3/21/19.
Certain sectors and markets performed exceptionally well based on market conditions during the one-year period. Achieving such exceptional returns involves the risk of volatility and investors should not expect that such exceptional returns will be repeated.
The MSCI USA Index is designed to measure the performance of the large and mid cap segments of the US market. The index covers approximately 85% of the free float-adjusted market capitalization in the US. Effective September 23, 2019, the Fund changed its benchmark against which it measures its performance from a custom weighted index composed of the 80% MSCI USA Index / 20% MSCI USA Minimum Volatility (USD) Index to the MSCI USA Index.
Past performance is no guarantee of future results. Performance results do not reflect the deduction of taxes that a shareholder would pay on fund distributions or on the redemption or sale of fund shares. See “About Fund Performance” on page 14 for more information.
Expense Example
| Actual | Hypothetical 5% Return | |||||||||||||||||||||||||||||
| |
Beginning Account Value (02/01/21) |
|
|
Ending Account Value (07/31/21) |
|
|
Expenses Paid During the Period |
(a) |
|
Beginning Account Value (02/01/21) |
|
|
Ending Account Value (07/31/21) |
|
|
Expenses Paid During the Period |
(a) |
|
Annualized Expense Ratio |
| ||||||||||
| $ 1,000.00 | $ 1,178.50 | $ 1.08 | $ 1,000.00 | $ 1,023.80 | $ 1.00 | 0.20 | % | |||||||||||||||||||||||
| (a) | Expenses are calculated using the Fund’s annualized expense ratio (as disclosed in the table), multiplied by the average account value for the period, multiplied by the number of days in the period (181 days) and divided by the number of days in the year (365 days). Other fees, such as brokerage commissions and other fees to financial intermediaries, may be paid which are not reflected in the tables and examples above. See “Shareholder Expenses” on page 14 for more information. |
| F U N D S U M M A R Y |
11 |
| Fund Summary as of July 31, 2021 (continued) | BlackRock U.S. Equity Factor Rotation ETF |
Portfolio Management Commentary
The Fund advanced for the reporting period, driven in large part by the information technology and consumer discretionary sectors. Among information technology stocks, the software and services industry gained, buoyed by an increase in investments to support remote work. Increased adoption of cloud computing, which provides a steady revenue stream for software makers, bolstered earnings in the industry. Sales of cloud products that build and deploy applications and services grew significantly, strengthening revenues in the industry. The semiconductors and semiconductor equipment industry benefited from a global microchip shortage and higher demand for advanced graphics cards amid an increase in gaming. The technology hardware and equipment industry also advanced as continued working and studying from home boosted demand for computers, mobile devices, and technology services.
The consumer discretionary sector was supported by robust consumer spending, which was particularly beneficial for automobiles and components manufacturers and retailers. Massive fiscal stimulus payments along with an improving employment landscape drove consumer spending, particularly among electric carmakers and multiline retailers.
Financials stocks were also meaningful contributors to the Fund’s return as robust retail stock trading and strong revenues from asset management and investment banking services benefited the diversified financials industry. Healthcare stocks gained amid development and distribution of coronavirus vaccines, which drove strong returns of biotechnology and pharmaceuticals stocks.
In terms of relative performance, the Fund outperformed the broader market, as represented by the MSCI USA Index. The Fund’s actively managed factor rotation strategy seeks diversified exposure to five style factors: value, low size, momentum, quality, and minimum volatility. The Fund seeks to outperform the broader market through the efficacy of these factors, as well as by actively emphasizing exposure to the factors that BlackRock Fund Advisors believes will perform best based on forward-looking insights.
The factors benefited the Fund’s relative performance as the value, low size, and quality factors outperformed the MSCI USA Index, while the minimum volatility and momentum factors trailed the broader market. The environment for factors with high sensitivity to economic growth, such as value and low size, improved as subsiding political uncertainty following the U.S. presidential election and vaccine rollouts heightened expectations for an economic recovery. The Fund’s factor tilting contributed to relative performance, driven primarily by limited exposure to the minimum volatility factor and overweight exposure to the low size factor.
Portfolio Information
ALLOCATION BY SECTOR
| Sector | Percent of Total Investments(a) |
|||
| Information Technology |
23.7 | % | ||
| Financials |
14.5 | |||
| Industrials |
12.2 | |||
| Consumer Discretionary |
12.1 | |||
| Health Care |
12.1 | |||
| Communication Services |
9.4 | |||
| Consumer Staples |
4.1 | |||
| Real Estate |
3.5 | |||
| Materials |
3.4 | |||
| Utilities |
3.0 | |||
| Energy |
2.0 | |||
| (a) | Excludes money market funds. |
TEN LARGEST HOLDINGS
| Security | Percent of Total Investments(a) |
|||
| Tesla Inc. |
2.0 | % | ||
| Alphabet Inc., Class C |
1.9 | |||
| Alphabet Inc., Class A |
1.8 | |||
| Facebook Inc., Class A |
1.7 | |||
| Berkshire Hathaway Inc., Class B |
1.6 | |||
| Target Corp. |
1.5 | |||
| Nike Inc., Class B |
1.4 | |||
| Applied Materials Inc. |
1.4 | |||
| Bank of America Corp. |
1.4 | |||
| PayPal Holdings Inc. |
1.4 | |||
| 12 | 2 0 2 1 B L A C K R O C K A N N U A L R E P O R T T O S H A R E H O L D E R S |
| Fund Summary as of July 31, 2021 | BlackRock World ex U.S. Carbon Transition Readiness ETF |
Investment Objective
The BlackRock World ex U.S. Carbon Transition Readiness ETF (the “Fund”) seeks long-term capital appreciation by investing in large- and mid-capitalization World ex U.S. equity securities that may be better positioned to benefit from the transition to a low-carbon economy.
Performance
| Cumulative Total Returns | ||||
| Since Inception |
||||
| Fund NAV |
4.77 | % | ||
| Fund Market |
5.01 | |||
| MSCI World ex USA Index |
4.54 | |||
For the fiscal period ended 7/31/21, the Fund did not have six months of performance and therefore line graphs are not presented.
The inception date of the Fund was 4/6/21. The first day of secondary market trading was 4/8/21.
The MSCI World ex USA Index captures large- and mid-cap representation across certain developed markets countries, excluding the United States. The index covers approximately 85% of the free float-adjusted market capitalization in each country.
Past performance is no guarantee of future results. Performance results do not reflect the deduction of taxes that a shareholder would pay on fund distributions or on the redemption or sale of fund shares. See “About Fund Performance” on page 14 for more information.
Expense Example
| Actual | Hypothetical 5% Return | |||||||||||||||||||||||||||||
|
|
Beginning Account Value (04/06/21) |
(a) |
|
Ending Account Value (07/31/21) |
|
|
Expenses Paid During the Period |
(b) |
|
Beginning Account Value (02/01/21) |
|
|
Ending Account Value (07/31/21) |
|
|
Expenses Paid During the Period |
(b) |
|
Annualized Expense Ratio |
| ||||||||||
| $ 1,000.00 | $ 1,047.70 | $ 0.65 | $ 1,000.00 | $ 1,023.80 | $ 1.00 | 0.20% | ||||||||||||||||||||||||
| (a) | The beginning of the period (commencement of operations) is April 06, 2021. |
| (b) | Expenses are calculated using the Fund’s annualized expense ratio (as disclosed in the table), multiplied by the average account value for the period, multiplied by the number of days in the period (116 days for actual and 181 days for hypothetical expenses) and divided by the number of days in the year (365 days). Other fees, such as brokerage commissions and other fees to financial intermediaries, may be paid which are not reflected in the tables and examples above. See “Shareholder Expenses” on page 14 for more information. |
Portfolio Information
ALLOCATION BY SECTOR
| Sector | Percent of Total Investments(a) |
|||
| Financials |
17.8 | % | ||
| Industrials |
15.5 | |||
| Consumer Discretionary |
11.4 | |||
| Health Care |
11.3 | |||
| Consumer Staples |
9.9 | |||
| Information Technology |
9.8 | |||
| Materials |
8.8 | |||
| Communication Services |
4.8 | |||
| Energy |
4.4 | |||
| Utilities |
3.5 | |||
| Real Estate |
2.8 | |||
| (a) | Excludes money market funds. |
TEN LARGEST GEOGRAPHIC ALLOCATION
| Country/Geographic Region | Percent of Total Investments(a) |
|||
| Japan |
20.6 | % | ||
| United Kingdom |
11.3 | |||
| Canada |
10.2 | |||
| France |
9.5 | |||
| Switzerland |
9.1 | |||
| Germany |
8.1 | |||
| Australia |
7.2 | |||
| Netherlands |
5.1 | |||
| Sweden |
4.2 | |||
| Denmark |
2.8 | |||
| F U N D S U M M A R Y |
13 |
| About Fund Performance |
Past performance is not an indication of future results. Financial markets have experienced extreme volatility and trading in many instruments has been disrupted. These circumstances may continue for an extended period of time and may continue to affect adversely the value and liquidity of the fund’s investments. As a result, current performance may be lower or higher than the performance data quoted. Performance data current to the most recent month-end is available at blackrock.com. Performance results assume reinvestment of all dividends and capital gain distributions and do not reflect the deduction of taxes that a shareholder would pay on fund distributions or on the redemption or sale of fund shares. The investment return and principal value of shares will vary with changes in market conditions. Shares may be worth more or less than their original cost when they are redeemed or sold in the market. Performance for certain funds may reflect a waiver of a portion of investment advisory fees. Without such a waiver, performance would have been lower.
Net asset value or “NAV” is the value of one share of a fund as calculated in accordance with the standard formula for valuing mutual fund shares. Beginning August 10, 2020, the price used to calculate market return (“Market Price”) is the closing price. Prior to August 10, 2020, Market Price was determined by using the midpoint between the highest bid and the lowest ask on the primary stock exchange on which shares of a fund are listed for trading, as of the time that such fund’s NAV is calculated. Since shares of a fund may not trade in the secondary market until after the fund’s inception, for the period from inception to the first day of secondary market trading in shares of the fund, the NAV of the fund is used as a proxy for the Market Price to calculate market returns. Market and NAV returns assume that dividends and capital gain distributions have been reinvested at Market Price and NAV, respectively.
An index is a statistical composite that tracks a specified financial market or sector. Unlike a fund, an index does not actually hold a portfolio of securities and therefore does not incur the expenses incurred by a fund. These expenses negatively impact fund performance. Also, market returns do not include brokerage commissions that may be payable on secondary market transactions. If brokerage commissions were included, market returns would be lower.
As a shareholder of your Fund, you incur two types of costs: (1) transaction costs, including brokerage commissions on purchases and sales of fund shares and (2) ongoing costs, including management fees and other fund expenses. The expense example, which is based on an investment of $1,000 invested at the beginning of the period (or from the commencement of operations if less than 6 months) and held through the end of the period, is intended to help you understand your ongoing costs (in dollars and cents) of investing in your Fund and to compare these costs with the ongoing costs of investing in other funds.
Actual Expenses – The table provides information about actual account values and actual expenses. Annualized expense ratios reflect contractual and voluntary fee waivers, if any. To estimate the expenses that you paid on your account over the period, simply divide your account value by $1,000 (for example, an $8,600 account value divided by $1,000 = 8.6), then multiply the result by the number under the heading entitled “Expenses Paid During the Period.”
Hypothetical Example for Comparison Purposes – The table also provides information about hypothetical account values and hypothetical expenses based on your Fund’s actual expense ratio and an assumed rate of return of 5% per year before expenses. You may use this information to compare the ongoing costs of investing in your Fund and other funds. To do so, compare this 5% hypothetical example with the 5% hypothetical examples that appear in the shareholder reports of the other funds.
Please note that the expenses shown in the table are meant to highlight your ongoing costs only and do not reflect any transactional costs, such as brokerage commissions and other fees paid on purchases and sales of fund shares. Therefore, the hypothetical examples are useful in comparing ongoing costs only and will not help you determine the relative total costs of owning different funds. In addition, if these transactional costs were included, your costs would have been higher.
| 14 | 2 0 2 1 B L A C K R O C K A N N U A L R E P O R T T O S H A R E H O L D E R S |
|
July 31, 2021 |
BlackRock Future Health ETF (Percentages shown are based on Net Assets) |
| Security | Shares | Value | ||||||
| Common Stocks |
||||||||
| Biotechnology — 30.8% | ||||||||
| Acceleron Pharma Inc.(a)(b) |
946 | $ | 118,307 | |||||
| Acumen Pharmaceuticals Inc., NVS |
502 | 7,771 | ||||||
| Agios Pharmaceuticals Inc.(a) |
1,106 | 53,187 | ||||||
| Akeso Inc.(a)(c) |
3,000 | 19,959 | ||||||
| Allakos Inc.(a) |
563 | 44,792 | ||||||
| Alnylam Pharmaceuticals Inc.(a) |
695 | 124,363 | ||||||
| ALX Oncology Holdings Inc.(a) |
162 | 9,487 | ||||||
| Ambrx Biopharma Inc., ADR |
322 | 6,295 | ||||||
| Annexon Inc.(a) |
460 | 9,688 | ||||||
| Apellis Pharmaceuticals Inc.(a) |
427 | 27,324 | ||||||
| Applied Molecular Transport Inc.(a)(b) |
416 | 11,660 | ||||||
| Argenx SE, ADR(a) |
302 | 91,938 | ||||||
| Arrowhead Pharmaceuticals Inc.(a) |
214 | 14,828 | ||||||
| Beam Therapeutics Inc.(a) |
82 | 7,544 | ||||||
| BioAtla Inc.(a) |
325 | 13,322 | ||||||
| Biohaven Pharmaceutical Holding Co. Ltd.(a) |
258 | 32,511 | ||||||
| BioMarin Pharmaceutical Inc.(a) |
505 | 38,749 | ||||||
| Biomea Fusion Inc.(a) |
1,181 | 15,577 | ||||||
| Blueprint Medicines Corp.(a) |
191 | 16,783 | ||||||
| Bridgebio Pharma Inc.(a) |
561 | 29,985 | ||||||
| C4 Therapeutics Inc.(a) |
854 | 36,842 | ||||||
| CareDx Inc.(a) |
571 | 47,987 | ||||||
| Connect Biopharma Holdings Ltd.(a) |
159 | 3,500 | ||||||
| Cytokinetics Inc.(a) |
648 | 19,233 | ||||||
| Decibel Therapeutics Inc.(a) |
353 | 2,520 | ||||||
| Deciphera Pharmaceuticals Inc.(a) |
206 | 6,281 | ||||||
| Design Therapeutics Inc.(a) |
183 | 2,833 | ||||||
| Dicerna Pharmaceuticals Inc.(a) |
1,007 | 37,773 | ||||||
| Enanta Pharmaceuticals Inc.(a) |
188 | 7,943 | ||||||
| Fate Therapeutics Inc.(a) |
123 | 10,184 | ||||||
| Genetron Holdings Ltd., ADR(a)(b) |
2,443 | 34,691 | ||||||
| Genmab A/S(a) |
548 | 247,684 | ||||||
| Genmab A/S, ADR(a) |
1,730 | 77,954 | ||||||
| Global Blood Therapeutics Inc.(a) |
854 | 23,340 | ||||||
| Gritstone bio Inc.(a) |
715 | 4,776 | ||||||
| Horizon Therapeutics PLC(a) |
526 | 52,610 | ||||||
| Icosavax Inc., NVS |
1,548 | 38,468 | ||||||
| Ideaya Biosciences Inc.(a) |
804 | 19,698 | ||||||
| Imago Biosciences Inc., NVS(a) |
288 | 5,276 | ||||||
| Immuneering Corp., Cass A, NVS |
168 | 2,955 | ||||||
| Immunocore Holdings PLC(a) |
140 | 4,581 | ||||||
| Kadmon Holdings Inc.(a) |
5,670 | 21,319 | ||||||
| Keros Therapeutics Inc.(a) |
532 | 19,578 | ||||||
| Kinnate Biopharma Inc.(a)(b) |
633 | 13,660 | ||||||
| Kodiak Sciences Inc.(a) |
192 | 16,097 | ||||||
| Krystal Biotech Inc.(a) |
256 | 14,961 | ||||||
| Kymera Therapeutics Inc.(a) |
681 | 40,983 | ||||||
| Mirati Therapeutics Inc.(a) |
227 | 36,334 | ||||||
| Monte Rosa Therapeutics Inc.(a) |
344 | 8,435 | ||||||
| Morphic Holding Inc.(a) |
222 | 12,792 | ||||||
| Natera Inc.(a) |
862 | 98,716 | ||||||
| Nkarta Inc.(a) |
319 | 10,131 | ||||||
| Olema Pharmaceuticals Inc.(a) |
573 | 13,454 | ||||||
| Omega Therapeutics Inc., NVS |
276 | 4,416 | ||||||
| ORIC Pharmaceuticals Inc.(a) |
493 | 8,208 | ||||||
| PMV Pharmaceuticals Inc.(a) |
1,185 | 40,302 | ||||||
| Prometheus Biosciences Inc.(a) |
710 | 14,889 | ||||||
| Prothena Corp. PLC(a) |
910 | 45,591 | ||||||
| Security | Shares | Value | ||||||
| Biotechnology (continued) | ||||||||
| PTC Therapeutics Inc.(a) |
547 | $ | 20,966 | |||||
| RAPT Therapeutics Inc.(a) |
473 | 14,507 | ||||||
| Relay Therapeutics Inc.(a) |
139 | 4,509 | ||||||
| Rubius Therapeutics Inc.(a) |
369 | 7,930 | ||||||
| Seagen Inc.(a) |
1,252 | 192,044 | ||||||
| Talaris Therapeutics Inc.(a) |
287 | 3,963 | ||||||
| Taysha Gene Therapies Inc.(a)(b) |
449 | 7,763 | ||||||
| TCR2 Therapeutics Inc.(a) |
573 | 7,128 | ||||||
| Tenaya Therapeutics Inc., NVS |
354 | 5,434 | ||||||
| Translate Bio Inc.(a) |
826 | 22,831 | ||||||
| TScan Therapeutics Inc., NVS(a) |
350 | 3,395 | ||||||
| United Therapeutics Corp.(a) |
149 | 27,108 | ||||||
| Zai Lab Ltd., ADR(a) |
486 | 70,280 | ||||||
| Zentalis Pharmaceuticals Inc.(a) |
571 | 30,383 | ||||||
|
|
|
|||||||
| 2,219,306 | ||||||||
| Diversified Financial Services — 1.6% | ||||||||
| DA32 Life Science Tech Acquisition Corp., Class A, NVS(a) |
3,181 | 31,810 | ||||||
| Eucrates Biomedical Acquisition Corp. |
1,857 | 18,087 | ||||||
| Health Assurance Acquisition Corp., Class A(a) |
2,816 | 27,484 | ||||||
| Helix Acquisition Corp., Class A |
445 | 4,441 | ||||||
| Lifesci Acquisition II Corp.(a) |
1,515 | 14,999 | ||||||
| MedTech Acquisition Corp./NY, Class A(a) |
1,908 | 18,508 | ||||||
|
|
|
|||||||
| 115,329 | ||||||||
| Electronic Equipment, Instruments & Components — 0.3% | ||||||||
| 908 Devices Inc.(a) |
648 | 20,250 | ||||||
|
|
|
|||||||
| Health Care Equipment & Supplies — 29.6% | ||||||||
| ABIOMED Inc.(a) |
202 | 66,082 | ||||||
| Alcon Inc.(b) |
1,954 | 142,251 | ||||||
| ConvaTec Group PLC(c) |
11,764 | 38,738 | ||||||
| Cooper Companies Inc. (The) |
264 | 111,347 | ||||||
| Demant A/S(a) |
1,039 | 63,501 | ||||||
| DENTSPLY SIRONA Inc. |
1,330 | 87,833 | ||||||
| Dexcom Inc.(a) |
129 | 66,501 | ||||||
| Edwards Lifesciences Corp.(a) |
704 | 79,038 | ||||||
| GN Store Nord A/S |
409 | 35,842 | ||||||
| Hill-Rom Holdings Inc. |
365 | 50,538 | ||||||
| Insulet Corp.(a) |
357 | 99,849 | ||||||
| Intuitive Surgical Inc.(a) |
186 | 184,412 | ||||||
| Masimo Corp.(a) |
468 | 127,478 | ||||||
| Nevro Corp.(a) |
628 | 97,340 | ||||||
| Novocure Ltd.(a) |
55 | 8,471 | ||||||
| NuVasive Inc.(a) |
343 | 21,935 | ||||||
| Nyxoah SA, NVS |
1,368 | 44,357 | ||||||
| Penumbra Inc.(a) |
137 | 36,473 | ||||||
| Pulmonx Corp.(a) |
245 | 9,717 | ||||||
| ResMed Inc. |
456 | 123,941 | ||||||
| Shenzhen Mindray Bio-Medical Electronics Co. Ltd., Class A |
600 | 36,354 | ||||||
| SI-BONE Inc.(a) |
341 | 10,346 | ||||||
| Sonova Holding AG, Registered |
180 | 70,674 | ||||||
| STERIS PLC |
348 | 75,847 | ||||||
| Straumann Holding AG, Registered |
83 | 153,883 | ||||||
| Tandem Diabetes Care Inc.(a) |
346 | 37,600 | ||||||
| Teleflex Inc. |
362 | 143,870 | ||||||
| Zimmer Biomet Holdings Inc. |
657 | 107,367 | ||||||
|
|
|
|||||||
| 2,131,585 | ||||||||
| Health Care Providers & Services — 13.8% | ||||||||
| Addus HomeCare Corp.(a) |
111 | 9,634 | ||||||
| agilon health Inc.(a)(b) |
634 | 23,325 | ||||||
| S C H E D U L E O F I N V E S T M E N T S |
15 |
| Schedule of Investments (continued) July 31, 2021 |
BlackRock Future Health ETF (Percentages shown are based on Net Assets) |
| Security | Shares | Value | ||||||
| Health Care Providers & Services (continued) | ||||||||
| Alignment Healthcare Inc.(a) |
780 | $ | 16,247 | |||||
| Amedisys Inc.(a) |
580 | 151,160 | ||||||
| Amplifon SpA |
1,620 | 80,003 | ||||||
| Cardinal Health Inc. |
913 | 54,214 | ||||||
| Centene Corp.(a) |
963 | 66,071 | ||||||
| Chemed Corp. |
60 | 28,561 | ||||||
| Cigna Corp. |
310 | 71,142 | ||||||
| Encompass Health Corp. |
1,040 | 86,580 | ||||||
| Guardant Health Inc.(a) |
305 | 33,489 | ||||||
| Humana Inc. |
204 | 86,875 | ||||||
| Innovage Holding Corp.(a) |
182 | 3,069 | ||||||
| Jinxin Fertility Group Ltd.(c) |
50,000 | 93,969 | ||||||
| LHC Group Inc.(a) |
622 | 133,842 | ||||||
| LifeStance Health Group Inc.(a) |
877 | 20,785 | ||||||
| Privia Health Group Inc.(a) |
297 | 12,325 | ||||||
| Rede D’Or Sao Luiz SA(c) |
1,944 | 25,755 | ||||||
|
|
|
|||||||
| 997,046 | ||||||||
| Health Care Technology — 0.3% | ||||||||
| Doximity Inc., Class A(a) |
211 | 13,061 | ||||||
| Sophia Genetics SA, NVS |
619 | 9,687 | ||||||
|
|
|
|||||||
| 22,748 | ||||||||
| Life Sciences Tools & Services — 13.7% | ||||||||
| Avantor Inc.(a) |
1,923 | 72,266 | ||||||
| Bruker Corp. |
487 | 40,056 | ||||||
| Charles River Laboratories International Inc.(a) |
227 | 92,371 | ||||||
| Cytek Biosciences Inc., NVS(a) |
1,786 | 39,614 | ||||||
| Gerresheimer AG |
689 | 71,941 | ||||||
| ICON PLC |
529 | 128,690 | ||||||
| Illumina Inc.(a) |
88 | 43,626 | ||||||
| IQVIA Holdings Inc.(a) |
363 | 89,915 | ||||||
| Joinn Laboratories China Co. Ltd., Class H(c) |
840 | 14,059 | ||||||
| Lonza Group AG, Registered |
90 | 70,076 | ||||||
| Olink Holding AB, ADR(a) |
63 | 2,354 | ||||||
| Rapid Micro Biosystems Inc., Cass A, NVS(a) |
241 | 5,348 | ||||||
| Sotera Health Co.(a) |
2,797 | 66,289 | ||||||
| WuXi AppTec Co. Ltd., Class H(c) |
5,500 | 121,909 | ||||||
| Wuxi Biologics Cayman Inc., New(a)(c) |
8,500 | 129,831 | ||||||
|
|
|
|||||||
| 988,345 | ||||||||
| Pharmaceuticals — 3.3% | ||||||||
| Astellas Pharma Inc. |
2,500 | 39,819 | ||||||
| Eisai Co. Ltd. |
500 | 41,126 | ||||||
| Marinus Pharmaceuticals Inc.(a) |
1,183 | 17,390 | ||||||
| Merck KGaA |
199 | 40,736 | ||||||
| Security | Shares | Value | ||||||
| Pharmaceuticals (continued) | ||||||||
| Nektar Therapeutics, Class A(a) |
890 | $ | 14,053 | |||||
| UCB SA |
749 | 81,010 | ||||||
|
|
|
|||||||
| 234,134 | ||||||||
|
|
|
|||||||
| Total Common Stocks — 93.4% |
6,728,743 | |||||||
|
|
|
|||||||
| Warrants |
||||||||
| Diversified Financial Services — 0.0% | ||||||||
| Eucrates Biomedical Acquisition Corp., (Expires 12/14/25) |
619 | 520 | ||||||
| Health Assurance Acquisition Corp., (Expires 11/12/25) |
704 | 979 | ||||||
| MedTech Acquisition Corp./NY, (Expires 12/18/25) |
636 | 573 | ||||||
|
|
|
|||||||
| 2,072 | ||||||||
|
|
|
|||||||
| Total Warrants — 0.0% |
2,072 | |||||||
|
|
|
|||||||
| Short-Term Investments |
||||||||
| Money Market Funds — 8.5% | ||||||||
| BlackRock Cash Funds: Institutional, SL Agency Shares, 0.06%(d)(e)(f) |
185,189 | 185,281 | ||||||
| BlackRock Cash Funds: Treasury, SL Agency Shares, 0.00%(d)(e) |
430,000 | 430,000 | ||||||
|
|
|
|||||||
| 615,281 | ||||||||
|
|
|
|||||||
| Total Short-Term Investments — 8.5% |
615,281 | |||||||
|
|
|
|||||||
| Total Investments in Securities — 101.9% |
7,346,096 | |||||||
| Other Assets, Less Liabilities — (1.9)% |
(137,517 | ) | ||||||
|
|
|
|||||||
| Net Assets — 100.0% |
$ | 7,208,579 | ||||||
|
|
|
|||||||
| (a) | Non-income producing security. |
| (b) | All or a portion of this security is on loan. |
| (c) | Security exempt from registration pursuant to Rule 144A under the Securities Act of 1933, as amended. These securities may be resold in transactions exempt from registration to qualified institutional investors. |
| (d) | Affiliate of the Fund. |
| (e) | Annualized 7-day yield as of period-end. |
| (f) | All or a portion of this security was purchased with cash collateral received from loaned securities. |
| 16 | 2 0 2 1 B L A C K R O C K A N N U A L R E P O R T T O S H A R E H O L D E R S |
| Schedule of Investments (continued) July 31, 2021 |
BlackRock Future Health ETF |
Affiliates
Investments in issuers considered to be affiliate(s) of the Fund during the period ended July 31, 2021 for purposes of Section 2(a)(3) of the Investment Company Act of 1940, as amended, were as follows:
| Affiliated Issuer | |
Value at 09/29/20 |
(a) |
|
Purchases at Cost |
|
|
Proceeds from Sales |
|
|
Net Realized Gain (Loss) |
|
|
Change in Unrealized Appreciation (Depreciation) |
|
|
Value at 07/31/21 |
|
|
Shares Held at 07/31/21 |
|
Income | |
Capital Gain |
| |||||||||||
| BlackRock Cash Funds: Institutional, SL Agency Shares |
$ | — | $ | 185,326 | (b) | $ | — | $ | (45 | ) | $ | — | $ | 185,281 | 185,189 | $ | 604 | (c) | $ | — | ||||||||||||||||
| BlackRock Cash Funds: Treasury, SL Agency Shares |
— | 430,000 | (b) | — | — | — | 430,000 | 430,000 | 45 | — | ||||||||||||||||||||||||||
|
|
|
|
|
|
|
|
|
|
|
|||||||||||||||||||||||||||
| $ | (45 | ) | $ | — | $ | 615,281 | $ | 649 | $ | — | ||||||||||||||||||||||||||
|
|
|
|
|
|
|
|
|
|
|
| (a) | The Fund commenced operations on September 29, 2020. |
| (b) | Represents net amount purchased (sold). |
| (c) | All or a portion represents securities lending income earned from the reinvestment of cash collateral from loaned securities, net of fees and collateral investment expenses, and other payments to and from borrowers of securities. |
Fair Value Measurements
Various inputs are used in determining the fair value of financial instruments. For description of the input levels and information about the Fund’s policy regarding valuation of financial instruments, refer to the Notes to Financial Statements.
The following table summarizes the value of the Fund’s investments according to the fair value hierarchy as of July 31, 2021. The breakdown of the Fund’s investments into major categories is disclosed in the Schedule of Investments above.
| Level 1 | Level 2 | Level 3 | Total | |||||||||||||
| Investments |
||||||||||||||||
| Assets |
||||||||||||||||
| Common Stocks |
$ | 5,316,367 | $ | 1,412,376 | $ | — | $ | 6,728,743 | ||||||||
| Warrants |
2,072 | — | — | 2,072 | ||||||||||||
| Money Market Funds |
615,281 | — | — | 615,281 | ||||||||||||
|
|
|
|
|
|
|
|
|
|||||||||
| $ | 5,933,720 | $ | 1,412,376 | $ | — | $ | 7,346,096 | |||||||||
|
|
|
|
|
|
|
|
|
|||||||||
See notes to financial statements.
|
S C H E D U L E O F I N V E S T M E N T S |
17 |
| Schedule of Investments July 31, 2021 |
BlackRock Future Innovators ETF (Percentages shown are based on Net Assets) |
| Security | Shares | Value | ||||||
| Common Stocks |
||||||||
| Aerospace & Defense — 5.0% | ||||||||
| Axon Enterprise Inc.(a) |
4,452 | $ | 828,161 | |||||
| HEICO Corp. |
2,393 | 323,653 | ||||||
|
|
|
|||||||
| 1,151,814 | ||||||||
| Auto Components — 2.8% | ||||||||
| Fox Factory Holding Corp.(a) |
3,944 | 637,114 | ||||||
|
|
|
|||||||
| Beverages — 0.5% | ||||||||
| Celsius Holdings Inc.(a)(b) |
1,735 | 119,073 | ||||||
|
|
|
|||||||
| Biotechnology — 3.5% | ||||||||
| Halozyme Therapeutics Inc.(a) |
8,474 | 350,230 | ||||||
| Invitae Corp.(a)(b) |
6,687 | 187,169 | ||||||
| Natera Inc.(a) |
2,324 | 266,145 | ||||||
|
|
|
|||||||
| 803,544 | ||||||||
| Building Products — 1.7% | ||||||||
| AZEK Co. Inc. (The), Class A(a) |
10,678 | 388,359 | ||||||
|
|
|
|||||||
| Chemicals — 2.9% | ||||||||
| Amyris Inc.(a) |
45,053 | 656,873 | ||||||
|
|
|
|||||||
| Diversified Consumer Services — 3.2% | ||||||||
| Bright Horizons Family Solutions Inc.(a)(b) |
2,014 | 301,093 | ||||||
| Chegg Inc.(a) |
4,854 | 430,210 | ||||||
| Duolingo Inc.(a) |
74 | 10,379 | ||||||
|
|
|
|||||||
| 741,682 | ||||||||
| Electrical Equipment — 1.2% | ||||||||
| Shoals Technologies Group Inc., Class A(a) |
9,732 | 283,104 | ||||||
|
|
|
|||||||
| Electronic Equipment, Instruments & Components — 2.1% | ||||||||
| 908 Devices Inc.(a) |
8,021 | 250,656 | ||||||
| Halma PLC |
5,937 | 238,317 | ||||||
|
|
|
|||||||
| 488,973 | ||||||||
| Entertainment — 1.6% | ||||||||
| Kahoot! ASA(a) |
84,695 | 376,927 | ||||||
|
|
|
|||||||
| Equity Real Estate Investment Trusts (REITs) — 1.5% | ||||||||
| Innovative Industrial Properties Inc. |
898 | 193,061 | ||||||
| Rexford Industrial Realty Inc. |
2,346 | 144,326 | ||||||
|
|
|
|||||||
| 337,387 | ||||||||
| Food Products — 2.6% | ||||||||
| Freshpet Inc.(a) |
3,891 | 569,837 | ||||||
| Vital Farms Inc.(a) |
1,897 | 33,027 | ||||||
|
|
|
|||||||
| 602,864 | ||||||||
| Health Care Equipment & Supplies — 7.4% | ||||||||
| Eargo Inc.(a) |
9,406 | 338,616 | ||||||
| Inmode Ltd.(a) |
2,479 | 281,788 | ||||||
| Masimo Corp.(a) |
2,239 | 609,881 | ||||||
| Outset Medical Inc.(a) |
6,773 | 277,422 | ||||||
| Pulmonx Corp.(a) |
4,705 | 186,600 | ||||||
|
|
|
|||||||
| 1,694,307 | ||||||||
| Health Care Providers & Services — 0.7% | ||||||||
| Guardant Health Inc.(a) |
1,372 | 150,646 | ||||||
|
|
|
|||||||
| Health Care Technology — 6.7% | ||||||||
| Certara Inc.(a) |
11,836 | 322,058 | ||||||
| Doximity Inc., Class A(a) |
648 | 40,111 | ||||||
| Health Catalyst Inc.(a) |
8,030 | 466,222 | ||||||
| Phreesia Inc.(a) |
10,527 | 719,520 | ||||||
|
|
|
|||||||
| 1,547,911 | ||||||||
| Security | Shares | Value | ||||||
| Hotels, Restaurants & Leisure — 4.6% | ||||||||
| Penn National Gaming Inc.(a)(b) |
6,218 | $ | 425,187 | |||||
| Planet Fitness Inc., Class A(a) |
4,563 | 343,275 | ||||||
| Wingstop Inc. |
1,627 | 278,721 | ||||||
|
|
|
|||||||
| 1,047,183 | ||||||||
| Internet & Direct Marketing Retail — 1.0% | ||||||||
| Fiverr International Ltd.(a) |
947 | 235,718 | ||||||
|
|
|
|||||||
| IT Services — 6.4% | ||||||||
| Globant SA(a) |
1,890 | 452,012 | ||||||
| Marqeta Inc., Class A(a) |
6,438 | 172,732 | ||||||
| MongoDB Inc., Class A(a) |
961 | 344,922 | ||||||
| Nuvei Corp.(a)(c) |
1,374 | 112,874 | ||||||
| Wix.com Ltd.(a) |
1,288 | 384,648 | ||||||
|
|
|
|||||||
| 1,467,188 | ||||||||
| Life Sciences Tools & Services — 9.3% | ||||||||
| 10X Genomics Inc., Class A(a) |
3,347 | 613,271 | ||||||
| Bio-Techne Corp. |
1,415 | 682,369 | ||||||
| Olink Holding AB, ADR(a)(b) |
4,941 | 184,645 | ||||||
| Repligen Corp.(a) |
1,823 | 447,911 | ||||||
| Seer Inc., Class A(a) |
6,956 | 222,175 | ||||||
|
|
|
|||||||
| 2,150,371 | ||||||||
| Machinery — 1.8% | ||||||||
| Chart Industries Inc.(a)(b) |
2,650 | 411,942 | ||||||
|
|
|
|||||||
| Personal Products — 1.5% | ||||||||
| Honest Co. Inc. (The)(a)(b) |
24,321 | 349,493 | ||||||
|
|
|
|||||||
| Road & Rail — 1.1% | ||||||||
| Saia Inc.(a) |
1,133 | 256,058 | ||||||
|
|
|
|||||||
| Semiconductors & Semiconductor Equipment — 8.6% | ||||||||
| Brooks Automation Inc. |
2,926 | 260,443 | ||||||
| Cree Inc.(a)(b) |
1,736 | 161,031 | ||||||
| Entegris Inc. |
5,321 | 641,925 | ||||||
| Lattice Semiconductor Corp.(a) |
5,074 | 287,950 | ||||||
| Monolithic Power Systems Inc. |
1,396 | 627,167 | ||||||
|
|
|
|||||||
| 1,978,516 | ||||||||
| Software — 18.2% | ||||||||
| 8x8 Inc.(a) |
4,725 | 120,771 | ||||||
| Avalara Inc.(a) |
4,475 | 748,086 | ||||||
| Bill.com Holdings Inc.(a) |
2,743 | 567,307 | ||||||
| Blackline Inc.(a) |
2,666 | 304,964 | ||||||
| Five9 Inc.(a) |
3,140 | 632,051 | ||||||
| Lightspeed POS Inc.(a)(b) |
7,495 | 641,047 | ||||||
| nCino Inc.(a)(b) |
6,277 | 399,029 | ||||||
| Paylocity Holding Corp.(a) |
2,814 | 583,792 | ||||||
| Q2 Holdings Inc.(a) |
946 | 97,731 | ||||||
| Vonage Holdings Corp.(a) |
6,866 | 97,909 | ||||||
|
|
|
|||||||
| 4,192,687 | ||||||||
| Specialty Retail — 4.1% | ||||||||
| Leslie’s Inc.(a) |
12,928 | 314,797 | ||||||
| Vroom Inc.(a) |
17,243 | 638,681 | ||||||
|
|
|
|||||||
| 953,478 | ||||||||
|
|
|
|||||||
| Total Common Stocks — 100.0% |
23,023,212 | |||||||
|
|
|
|||||||
| 18 | 2 0 2 1 B L A C K R O C K A N N U A L R E P O R T T O S H A R E H O L D E R S |
| Schedule of Investments (continued) July 31, 2021 |
BlackRock Future Innovators ETF (Percentages shown are based on Net Assets) |
| Security | Shares | Value | ||||||
| Short-Term Investments |
||||||||
| Money Market Funds — 13.9% | ||||||||
| BlackRock Cash Funds: Institutional, SL Agency Shares, 0.06%(d)(e)(f) |
3,152,840 | $ | 3,154,417 | |||||
| BlackRock Cash Funds: Treasury, SL Agency Shares, 0.00%(d)(e) |
50,000 | 50,000 | ||||||
|
|
|
|||||||
| 3,204,417 | ||||||||
|
|
|
|||||||
| Total Short-Term Investments — 13.9% |
3,204,417 | |||||||
|
|
|
|||||||
| Total Investments in Securities — 113.9% |
26,227,629 | |||||||
| Other Assets, Less Liabilities — (13.9)% |
(3,202,850 | ) | ||||||
|
|
|
|||||||
| Net Assets — 100.0% |
$ | 23,024,779 | ||||||
|
|
|
|||||||
| (a) | Non-income producing security. |
| (b) | All or a portion of this security is on loan. |
| (c) | Security exempt from registration pursuant to Rule 144A under the Securities Act of 1933, as amended. These securities may be resold in transactions exempt from registration to qualified institutional investors. |
| (d) | Affiliate of the Fund. |
| (e) | Annualized 7-day yield as of period-end. |
| (f) | All or a portion of this security was purchased with cash collateral received from loaned securities. |
Affiliates
Investments in issuers considered to be affiliate(s) of the Fund during the period ended July 31, 2021 for purposes of Section 2(a)(3) of the Investment Company Act of 1940, as amended, were as follows:
| Affiliated Issuer | |
Value at 09/29/20 |
(a) |
|
Purchases at Cost |
|
|
Proceeds from Sales |
|
|
Net Realized Gain (Loss) |
|
|
Change in Unrealized Appreciation (Depreciation) |
|
|
Value at 07/31/21 |
|
|
Shares Held at 07/31/21 |
|
Income | |
Capital Gain |
| |||||||||||
| BlackRock Cash Funds: Institutional, SL Agency Shares |
$ | — | $ | 3,154,584 | (b) | $ | — | $ | (167 | ) | $ | — | $ | 3,154,417 | 3,152,840 | $ | 3,415 | (c) | $ | — | ||||||||||||||||
| BlackRock Cash Funds: Treasury, SL Agency Shares |
— | 50,000 | (b) | — | — | — | 50,000 | 50,000 | 7 | — | ||||||||||||||||||||||||||
|
|
|
|
|
|
|
|
|
|
|
|||||||||||||||||||||||||||
| $ | (167 | ) | $ | — | $ | 3,204,417 | $ | 3,422 | $ | — | ||||||||||||||||||||||||||
|
|
|
|
|
|
|
|
|
|
|
| (a) | The Fund commenced operations on September 29, 2020. |
| (b) | Represents net amount purchased (sold). |
| (c) | All or a portion represents securities lending income earned from the reinvestment of cash collateral from loaned securities, net of fees and collateral investment expenses, and other payments to and from borrowers of securities. |
Fair Value Measurements
Various inputs are used in determining the fair value of financial instruments. For description of the input levels and information about the Fund’s policy regarding valuation of financial instruments, refer to the Notes to Financial Statements.
The following table summarizes the value of the Fund’s investments according to the fair value hierarchy as of July 31, 2021. The breakdown of the Fund’s investments into major categories is disclosed in the Schedule of Investments above.
| Level 1 | Level 2 | Level 3 | Total | |||||||||||||
| Investments |
||||||||||||||||
| Assets |
||||||||||||||||
| Common Stocks |
$ | 22,407,968 | $ | 615,244 | $ | — | $ | 23,023,212 | ||||||||
| Money Market Funds |
3,204,417 | — | — | 3,204,417 | ||||||||||||
|
|
|
|
|
|
|
|
|
|||||||||
| $ | 25,612,385 | $ | 615,244 | $ | — | $ | 26,227,629 | |||||||||
|
|
|
|
|
|
|
|
|
|||||||||
See notes to financial statements.
|
S C H E D U L E O F I N V E S T M E N T S |
19 |
| Schedule of Investments July 31, 2021 |
BlackRock Future Tech ETF (Percentages shown are based on Net Assets) |
| Security | Shares | Value | ||||||
| Common Stocks |
||||||||
| Automobiles — 2.0% | ||||||||
| Arrival SA(a) |
4,606 | $ | 59,279 | |||||
| Tesla Inc.(a)(b) |
498 | 342,226 | ||||||
|
|
|
|||||||
| 401,505 | ||||||||
| Diversified Consumer Services — 1.2% | ||||||||
| Chegg Inc.(b) |
2,702 | 239,478 | ||||||
| Duolingo Inc.(b) |
89 | 12,482 | ||||||
|
|
|
|||||||
| 251,960 | ||||||||
| Diversified Telecommunication Services — 0.6% | ||||||||
| Bandwidth Inc., Class A(b) |
985 | 127,715 | ||||||
|
|
|
|||||||
| Electrical Equipment — 0.4% | ||||||||
| Shoals Technologies Group Inc., Class A(b) |
2,886 | 83,954 | ||||||
|
|
|
|||||||
| Electronic Equipment, Instruments & Components — 3.2% | ||||||||
| Cognex Corp. |
1,635 | 147,820 | ||||||
| II-VI Inc.(a)(b) |
2,433 | 169,848 | ||||||
| Samsung SDI Co. Ltd. |
530 | 342,136 | ||||||
|
|
|
|||||||
| 659,804 | ||||||||
| Entertainment — 4.7% | ||||||||
| Bilibili Inc., ADR(a)(b) |
2,754 | 235,687 | ||||||
| NCSoft Corp. |
166 | 119,059 | ||||||
| Roku Inc.(b) |
714 | 305,813 | ||||||
| Take-Two Interactive Software Inc.(b) |
794 | 137,696 | ||||||
| Zynga Inc., Class A(b) |
15,016 | 151,662 | ||||||
|
|
|
|||||||
| 949,917 | ||||||||
| Health Care Providers & Services — 0.7% | ||||||||
| agilon health Inc.(a)(b) |
3,953 | 145,431 | ||||||
|
|
|
|||||||
| Health Care Technology — 0.2% | ||||||||
| Doximity Inc., Class A(a)(b) |
730 | 45,187 | ||||||
|
|
|
|||||||
| Hotels, Restaurants & Leisure — 0.8% | ||||||||
| Expedia Group Inc.(b) |
1,047 | 168,431 | ||||||
|
|
|
|||||||
| Interactive Media & Services — 6.6% | ||||||||
| Acast AB |
14,809 | 53,329 | ||||||
| Bumble Inc., Class A(b) |
1,742 | 88,633 | ||||||
| Eventbrite Inc., Class A(a)(b) |
5,853 | 104,008 | ||||||
| Kakao Corp. |
3,601 | 460,982 | ||||||
| Kanzhun Ltd.(b) |
1,800 | 62,010 | ||||||
| Snap Inc., Class A, NVS(b) |
5,007 | 372,621 | ||||||
| ZoomInfo Technologies Inc., Class A(b) |
3,518 | 189,092 | ||||||
|
|
|
|||||||
| 1,330,675 | ||||||||
| Internet & Direct Marketing Retail — 4.7% | ||||||||
| Delivery Hero SE(b)(c) |
1,364 | 203,908 | ||||||
| Farfetch Ltd., Class A(b) |
4,947 | 247,943 | ||||||
| MercadoLibre Inc.(b) |
151 | 236,874 | ||||||
| Ozon Holdings PLC, ADR(b) |
5,015 | 261,833 | ||||||
|
|
|
|||||||
| 950,558 | ||||||||
| IT Services — 14.7% | ||||||||
| Adyen NV(b)(c) |
71 | 192,413 | ||||||
| Affirm Holdings Inc.(a)(b) |
287 | 16,164 | ||||||
| Dlocal Ltd./Uruguay(a) |
2,727 | 123,097 | ||||||
| Endava PLC, ADR(b) |
2,096 | 269,588 | ||||||
| GMO Payment Gateway Inc. |
1,400 | 179,966 | ||||||
| Locaweb Servicos de Internet SA(c) |
54,736 | 261,791 | ||||||
| MongoDB Inc., Class A(a)(b) |
609 | 218,582 | ||||||
| Okta Inc.(a)(b) |
862 | 213,595 | ||||||
| Pagseguro Digital Ltd., Class A(a) |
3,423 | 189,771 | ||||||
| Security | Shares | Value | ||||||
| IT Services (continued) | ||||||||
| Paymentus Holdings Inc., Class A(b) |
2,175 | $ | 63,075 | |||||
| Shift4 Payments Inc., Class A(b) |
3,636 | 324,295 | ||||||
| Square Inc., Class A(b) |
1,351 | 334,048 | ||||||
| StoneCo Ltd., Class A |
2,942 | 173,107 | ||||||
| Twilio Inc., Class A(b) |
791 | 295,510 | ||||||
| Wix.com Ltd.(b) |
459 | 137,076 | ||||||
|
|
|
|||||||
| 2,992,078 | ||||||||
| Machinery — 1.6% | ||||||||
| Airtac International Group |
3,000 | 96,946 | ||||||
| Berkshire Grey Inc., Class A(a) |
10,287 | 97,315 | ||||||
| Hiwin Technologies Corp. |
11,000 | 126,566 | ||||||
|
|
|
|||||||
| 320,827 | ||||||||
| Multiline Retail — 0.8% | ||||||||
| Magazine Luiza SA |
41,235 | 163,095 | ||||||
|
|
|
|||||||
| Professional Services — 2.1% | ||||||||
| CoStar Group Inc.(b) |
1,681 | 149,357 | ||||||
| Legalzoomcom Inc. |
3,597 | 132,298 | ||||||
| TransUnion |
1,158 | 139,029 | ||||||
|
|
|
|||||||
| 420,684 | ||||||||
| Road & Rail — 1.2% | ||||||||
| Lyft Inc., Class A(b) |
3,299 | 182,501 | ||||||
| TuSimple Holdings Inc., Class A(b) |
1,705 | 62,744 | ||||||
|
|
|
|||||||
| 245,245 | ||||||||
| Semiconductors & Semiconductor Equipment — 26.2% | ||||||||
| Alphawave IP Group PLC |
22,896 | 135,704 | ||||||
| Ambarella Inc.(b) |
1,398 | 137,689 | ||||||
| Andes Technology Corp. |
8,000 | 164,951 | ||||||
| ASM International NV |
654 | 232,111 | ||||||
| BE Semiconductor Industries NV |
2,702 | 237,124 | ||||||
| Canadian Solar Inc.(a)(b) |
1,998 | 80,420 | ||||||
| Cree Inc.(a)(b) |
2,361 | 219,006 | ||||||
| Enphase Energy Inc.(b) |
1,644 | 311,702 | ||||||
| Entegris Inc. |
2,235 | 269,630 | ||||||
| KLA Corp. |
463 | 161,198 | ||||||
| Lasertec Corp. |
1,600 | 300,371 | ||||||
| Lattice Semiconductor Corp.(b) |
4,819 | 273,478 | ||||||
| MACOM Technology Solutions Holdings Inc.(a)(b) |
3,026 | 186,765 | ||||||
| Marvell Technology Inc. |
6,851 | 414,554 | ||||||
| Monolithic Power Systems Inc. |
619 | 278,092 | ||||||
| Nordic Semiconductor ASA(b) |
6,316 | 206,816 | ||||||
| ON Semiconductor Corp.(b) |
5,364 | 209,518 | ||||||
| Qorvo Inc.(b) |
1,190 | 225,612 | ||||||
| Silergy Corp. |
3,000 | 407,054 | ||||||
| SkyWater Technology Inc.(b) |
3,489 | 60,220 | ||||||
| SOITEC(b) |
1,150 | 275,710 | ||||||
| Tower Semiconductor Ltd. |
4,257 | 118,557 | ||||||
| Ultra Clean Holdings Inc.(b) |
4,888 | 264,001 | ||||||
| Will Semiconductor Co. Ltd. Shanghai, Class A |
3,200 | 150,090 | ||||||
|
|
|
|||||||
| 5,320,373 | ||||||||
| Software — 23.9% | ||||||||
| Alkami Technology Inc.(b) |
443 | 13,861 | ||||||
| Altium Ltd. |
7,295 | 182,193 | ||||||
| AppLovin Corp., Class A(a)(b) |
1,758 | 108,064 | ||||||
| Atlassian Corp. PLC, Class A(b) |
817 | 265,623 | ||||||
| Avalara Inc.(a)(b) |
1,147 | 191,744 | ||||||
| Bill.com Holdings Inc.(a)(b) |
546 | 112,924 | ||||||
| Cloudflare Inc., Class A(b) |
1,741 | 206,535 | ||||||
| Confluent Inc., Class A(b) |
1,779 | 69,719 | ||||||
| 20 | 2 0 2 1 B L A C K R O C K A N N U A L R E P O R T T O S H A R E H O L D E R S |
| Schedule of Investments (continued) July 31, 2021 |
BlackRock Future Tech ETF (Percentages shown are based on Net Assets) |
| Security | Shares | Value | ||||||
| Software (continued) | ||||||||
| Coupa Software Inc.(b) |
540 | $ | 117,180 | |||||
| Crowdstrike Holdings Inc., Class A(b) |
1,013 | 256,907 | ||||||
| CS Disco Inc.(b) |
2,604 | 107,623 | ||||||
| Dolby Laboratories Inc., Class A |
1,592 | 154,583 | ||||||
| Elastic NV(b) |
1,246 | 184,483 | ||||||
| Five9 Inc.(b) |
1,253 | 252,216 | ||||||
| Freee KK(b) |
2,000 | 171,679 | ||||||
| Glodon Co. Ltd., Class A |
11,871 | 116,049 | ||||||
| Latch Inc.(b) |
11,491 | 153,175 | ||||||
| Lightspeed POS Inc.(b) |
4,896 | 419,237 | ||||||
| Ming Yuan Cloud Group Holdings Ltd. |
40,000 | 149,577 | ||||||
| Olo Inc., Class A(b) |
1,536 | 53,868 | ||||||
| Plaid Inc.(b) |
2,700 | 60,773 | ||||||
| Procore Technologies Inc.(b) |
439 | 45,340 | ||||||
| Rakus Co. Ltd. |
8,700 | 244,899 | ||||||
| Synopsys Inc.(b) |
830 | 239,032 | ||||||
| Trade Desk Inc. (The), Class A(b) |
2,076 | 170,045 | ||||||
| Tuya Inc.(b) |
2,630 | 52,284 | ||||||
| Unity Software Inc.(b) |
1,681 | 180,069 | ||||||
| Xero Ltd.(b) |
1,855 | 192,461 | ||||||
| Zendesk Inc.(b) |
1,256 | 163,946 | ||||||
| Zscaler Inc.(b) |
905 | 213,499 | ||||||
|
|
|
|||||||
| 4,849,588 | ||||||||
| Specialty Retail — 0.7% | ||||||||
| Vroom Inc.(a)(b) |
3,958 | 146,604 | ||||||
|
|
|
|||||||
| Total Common Stocks — 96.3% |
19,573,631 | |||||||
|
|
|
|||||||
| Security | Shares | Value | ||||||
| Short-Term Investments |
||||||||
| Money Market Funds — 19.0% | ||||||||
| BlackRock Cash Funds: Institutional, SL Agency Shares, 0.06%(d)(e)(f) |
2,978,631 | $ | 2,980,120 | |||||
| BlackRock Cash Funds: Treasury, SL Agency Shares, 0.00%(d)(e) |
870,000 | 870,000 | ||||||
|
|
|
|||||||
| 3,850,120 | ||||||||
|
|
|
|||||||
| Total Short-Term Investments — 19.0% |
3,850,120 | |||||||
|
|
|
|||||||
| Total Investments in Securities — 115.3% |
23,423,751 | |||||||
| Other Assets, Less Liabilities — (15.3)% |
(3,104,931 | ) | ||||||
|
|
|
|||||||
| Net Assets — 100.0% |
$ | 20,318,820 | ||||||
|
|
|
|||||||
| (a) | All or a portion of this security is on loan. |
| (b) | Non-income producing security. |
| (c) | Security exempt from registration pursuant to Rule 144A under the Securities Act of 1933, as amended. These securities may be resold in transactions exempt from registration to qualified institutional investors. |
| (d) | Affiliate of the Fund. |
| (e) | Annualized 7-day yield as of period-end. |
| (f) | All or a portion of this security was purchased with cash collateral received from loaned securities. |
Affiliates
Investments in issuers considered to be affiliate(s) of the Fund during the period ended July 31, 2021 for purposes of Section 2(a)(3) of the Investment Company Act of 1940, as amended, were as follows:
| Affiliated Issuer | |
Value at 09/29/20 |
(a) |
|
Purchases at Cost |
|
|
Proceeds from Sales |
|
|
Net Realized Gain (Loss) |
|
|
Change in Unrealized Appreciation (Depreciation) |
|
|
Value at 07/31/21 |
|
|
Shares Held at 07/31/21 |
|
Income | |
Capital Gain |
| |||||||||||
| BlackRock Cash Funds: Institutional, SL Agency Shares |
$ | — | $ | 2,980,293 | (b) | $ | — | $ | (173 | ) | $ | — | $ | 2,980,120 | 2,978,631 | $ | 11,425 | (c) | $ | — | ||||||||||||||||
| BlackRock Cash Funds: Treasury, SL Agency Shares |
— | 870,000 | (b) | — | — | — | 870,000 | 870,000 | 26 | — | ||||||||||||||||||||||||||
|
|
|
|
|
|
|
|
|
|
|
|||||||||||||||||||||||||||
| $ | (173 | ) | $ | — | $ | 3,850,120 | $ | 11,451 | $ | — | ||||||||||||||||||||||||||
|
|
|
|
|
|
|
|
|
|
|
| (a) | The Fund commenced operations on September 29, 2020. |
| (b) | Represents net amount purchased (sold). |
| (c) | All or a portion represents securities lending income earned from the reinvestment of cash collateral from loaned securities, net of fees and collateral investment expenses, and other payments to and from borrowers of securities. |
Fair Value Measurements
Various inputs are used in determining the fair value of financial instruments. For description of the input levels and information about the Fund’s policy regarding valuation of financial instruments, refer to the Notes to Financial Statements.
|
S C H E D U L E O F I N V E S T M E N T S |
21 |
| Schedule of Investments (continued) July 31, 2021 |
BlackRock Future Tech ETF |
Fair Value Measurements (continued)
The following table summarizes the value of the Fund’s investments according to the fair value hierarchy as of July 31, 2021. The breakdown of the Fund’s investments into major categories is disclosed in the Schedule of Investments above.
| Level 1 | Level 2 | Level 3 | Total | |||||||||||||
| Investments |
||||||||||||||||
| Assets |
||||||||||||||||
| Common Stocks |
$ | 14,759,797 | $ | 4,813,834 | $ | — | $ | 19,573,631 | ||||||||
| Money Market Funds |
3,850,120 | — | — | 3,850,120 | ||||||||||||
|
|
|
|
|
|
|
|
|
|||||||||
| $ | 18,609,917 | $ | 4,813,834 | $ | — | $ | 23,423,751 | |||||||||
|
|
|
|
|
|
|
|
|
|||||||||
See notes to financial statements.
| 22 | 2 0 2 1 B L A C K R O C K A N N U A L R E P O R T T O S H A R E H O L D E R S |
| Schedule of Investments July 31, 2021 |
BlackRock U.S. Carbon Transition Readiness ETF (Percentages shown are based on Net Assets) |
| Security | Shares | Value | ||||||
| Common Stocks |
||||||||
| Aerospace & Defense — 0.8% | ||||||||
| Axon Enterprise Inc.(a) |
2,061 | $ | 383,387 | |||||
| Howmet Aerospace Inc.(a) |
32,654 | 1,071,704 | ||||||
| L3Harris Technologies Inc. |
19,142 | 4,340,257 | ||||||
| Raytheon Technologies Corp. |
69,812 | 6,070,154 | ||||||
|
|
|
|||||||
| 11,865,502 | ||||||||
| Air Freight & Logistics — 0.9% | ||||||||
| CH Robinson Worldwide Inc. |
28,150 | 2,510,136 | ||||||
| Expeditors International of Washington Inc. |
31,528 | 4,043,466 | ||||||
| United Parcel Service Inc., Class B |
29,276 | 5,602,255 | ||||||
|
|
|
|||||||
| 12,155,857 | ||||||||
| Airlines — 0.2% | ||||||||
| Alaska Air Group Inc.(a) |
27,024 | 1,568,203 | ||||||
| American Airlines Group Inc.(a) |
32,654 | 665,488 | ||||||
| Southwest Airlines Co.(a) |
16,890 | 853,283 | ||||||
|
|
|
|||||||
| 3,086,974 | ||||||||
| Auto Components — 0.4% | ||||||||
| Aptiv PLC(a) |
27,024 | 4,508,955 | ||||||
| BorgWarner Inc. |
20,900 | 1,023,682 | ||||||
| Lear Corp. |
2,252 | 394,055 | ||||||
| QuantumScape Corp., Class A(a)(b) |
9,008 | 206,373 | ||||||
|
|
|
|||||||
| 6,133,065 | ||||||||
| Automobiles — 1.5% | ||||||||
| Ford Motor Co.(a) |
38,284 | 534,062 | ||||||
| General Motors Co.(a) |
45,040 | 2,560,074 | ||||||
| Tesla Inc.(a) |
27,596 | 18,963,971 | ||||||
|
|
|
|||||||
| 22,058,107 | ||||||||
| Banks — 3.8% | ||||||||
| Bank of America Corp. |
276,213 | 10,595,531 | ||||||
| Citigroup Inc. |
74,056 | 5,007,667 | ||||||
| Citizens Financial Group Inc. |
14,638 | 617,138 | ||||||
| Comerica Inc. |
3,722 | 255,553 | ||||||
| East West Bancorp. Inc. |
2,401 | 170,831 | ||||||
| Fifth Third Bancorp |
29,626 | 1,075,128 | ||||||
| First Republic Bank/CA |
5,619 | 1,095,817 | ||||||
| Huntington Bancshares Inc./OH |
34,906 | 491,476 | ||||||
| JPMorgan Chase & Co. |
107,134 | 16,260,799 | ||||||
| KeyCorp |
32,654 | 641,978 | ||||||
| M&T Bank Corp. |
4,504 | 602,860 | ||||||
| PNC Financial Services Group Inc. (The) |
15,136 | 2,760,958 | ||||||
| Regions Financial Corp. |
28,150 | 541,887 | ||||||
| Signature Bank/New York NY |
2,252 | 511,136 | ||||||
| SVB Financial Group(a) |
2,567 | 1,411,747 | ||||||
| Truist Financial Corp. |
49,939 | 2,718,180 | ||||||
| U.S. Bancorp |
51,322 | 2,850,424 | ||||||
| Wells Fargo & Co. |
146,380 | 6,724,697 | ||||||
|
|
|
|||||||
| 54,333,807 | ||||||||
| Beverages — 1.8% | ||||||||
| Coca-Cola Co. (The) |
215,564 | 12,293,615 | ||||||
| Constellation Brands Inc., Class A |
7,741 | 1,736,616 | ||||||
| Molson Coors Beverage Co., Class B(a) |
43,914 | 2,146,955 | ||||||
| PepsiCo Inc. |
58,461 | 9,175,454 | ||||||
|
|
|
|||||||
| 25,352,640 | ||||||||
| Biotechnology — 2.3% | ||||||||
| AbbVie Inc. |
59,678 | 6,940,551 | ||||||
| Alnylam Pharmaceuticals Inc.(a) |
4,504 | 805,946 | ||||||
| Amgen Inc. |
10,134 | 2,447,766 | ||||||
| Biogen Inc.(a) |
4,258 | 1,391,216 | ||||||
| Security | Shares | Value | ||||||
| Biotechnology (continued) | ||||||||
| Gilead Sciences Inc. |
99,088 | $ | 6,766,719 | |||||
| Incyte Corp.(a) |
42,788 | 3,309,652 | ||||||
| Moderna Inc.(a) |
11,260 | 3,981,536 | ||||||
| Novavax Inc.(a) |
3,378 | 605,777 | ||||||
| Regeneron Pharmaceuticals Inc.(a) |
1,126 | 647,011 | ||||||
| Seagen Inc.(a) |
5,630 | 863,586 | ||||||
| Vertex Pharmaceuticals Inc.(a) |
25,898 | 5,220,519 | ||||||
|
|
|
|||||||
| 32,980,279 | ||||||||
| Building Products — 1.7% | ||||||||
| A O Smith Corp. |
68,686 | 4,830,686 | ||||||
| Allegion PLC |
24,772 | 3,383,855 | ||||||
| Carrier Global Corp. |
24,772 | 1,368,653 | ||||||
| Johnson Controls International PLC |
143,002 | 10,213,203 | ||||||
| Masco Corp. |
9,008 | 537,868 | ||||||
| Owens Corning |
7,882 | 757,933 | ||||||
| Trane Technologies PLC |
12,386 | 2,521,914 | ||||||
|
|
|
|||||||
| 23,614,112 | ||||||||
| Capital Markets — 3.0% | ||||||||
| Ameriprise Financial Inc. |
5,284 | 1,360,947 | ||||||
| Apollo Global Management Inc., Class A |
6,289 | 370,171 | ||||||
| Bank of New York Mellon Corp. (The) |
18,016 | 924,761 | ||||||
| BlackRock Inc.(c) |
5,630 | 4,882,167 | ||||||
| Blackstone Group Inc. (The), NVS |
13,512 | 1,557,528 | ||||||
| Charles Schwab Corp. (The) |
52,437 | 3,563,094 | ||||||
| CME Group Inc. |
12,386 | 2,627,442 | ||||||
| Evercore Inc., Class A |
1,089 | 143,966 | ||||||
| FactSet Research Systems Inc. |
437 | 156,131 | ||||||
| Franklin Resources Inc. |
6,288 | 185,810 | ||||||
| Goldman Sachs Group Inc. (The) |
12,252 | 4,593,030 | ||||||
| Interactive Brokers Group Inc., Class A |
4,504 | 278,617 | ||||||
| Intercontinental Exchange Inc. |
15,764 | 1,889,000 | ||||||
| Invesco Ltd. |
10,290 | 250,870 | ||||||
| KKR & Co. Inc. |
19,054 | 1,214,883 | ||||||
| MarketAxess Holdings Inc. |
2,252 | 1,070,083 | ||||||
| Moody’s Corp. |
5,630 | 2,116,880 | ||||||
| Morgan Stanley |
54,873 | 5,266,711 | ||||||
| MSCI Inc., Class A |
3,378 | 2,013,153 | ||||||
| Northern Trust Corp. |
5,630 | 635,346 | ||||||
| Raymond James Financial Inc. |
2,172 | 281,231 | ||||||
| S&P Global Inc. |
10,134 | 4,344,649 | ||||||
| State Street Corp. |
12,386 | 1,079,316 | ||||||
| T Rowe Price Group Inc. |
7,882 | 1,609,189 | ||||||
|
|
|
|||||||
| 42,414,975 | ||||||||
| Chemicals — 1.5% | ||||||||
| Albemarle Corp. |
4,633 | 954,583 | ||||||
| DuPont de Nemours Inc. |
78,598 | 5,898,780 | ||||||
| Element Solutions Inc. |
115,978 | 2,712,725 | ||||||
| FMC Corp. |
47,292 | 5,057,879 | ||||||
| International Flavors & Fragrances Inc. |
6,756 | 1,017,724 | ||||||
| PPG Industries Inc. |
12,386 | 2,025,359 | ||||||
| Sherwin-Williams Co. (The) |
11,260 | 3,276,998 | ||||||
|
|
|
|||||||
| 20,944,048 | ||||||||
| Commercial Services & Supplies — 0.3% | ||||||||
| Cintas Corp. |
3,760 | 1,482,117 | ||||||
| MSA Safety Inc. |
16,890 | 2,778,067 | ||||||
|
|
|
|||||||
| 4,260,184 | ||||||||
| Communications Equipment — 0.8% | ||||||||
| Arista Networks Inc.(a) |
2,252 | 856,638 | ||||||
| Cisco Systems Inc. |
113,726 | 6,297,009 | ||||||
| S C H E D U L E O F I N V E S T M E N T S |
23 |
| Schedule of Investments (continued) July 31, 2021 |
BlackRock U.S. Carbon Transition Readiness ETF (Percentages shown are based on Net Assets) |
| Security | Shares | Value | ||||||
| Communications Equipment (continued) | ||||||||
| CommScope Holding Co. Inc.(a) |
43,914 | $ | 929,220 | |||||
| Juniper Networks Inc. |
101,340 | 2,851,708 | ||||||
| Ubiquiti Inc. |
2,252 | 705,101 | ||||||
|
|
|
|||||||
| 11,639,676 | ||||||||
| Construction & Engineering — 0.1% | ||||||||
| AECOM(a) |
12,386 | 779,823 | ||||||
|
|
|
|||||||
| Construction Materials — 0.2% | ||||||||
| Martin Marietta Materials Inc. |
7,882 | 2,863,531 | ||||||
|
|
|
|||||||
| Consumer Finance — 0.8% | ||||||||
| Ally Financial Inc. |
12,386 | 636,145 | ||||||
| American Express Co. |
29,220 | 4,982,886 | ||||||
| Capital One Financial Corp. |
15,764 | 2,549,039 | ||||||
| Discover Financial Services |
13,512 | 1,679,812 | ||||||
| OneMain Holdings Inc. |
3,397 | 207,217 | ||||||
| Synchrony Financial |
27,024 | 1,270,668 | ||||||
| Upstart Holdings Inc.(a) |
2,626 | 317,116 | ||||||
|
|
|
|||||||
| 11,642,883 | ||||||||
| Containers & Packaging — 0.3% | ||||||||
| Amcor PLC |
200,428 | 2,316,948 | ||||||
| Ball Corp. |
20,268 | 1,639,276 | ||||||
| Westrock Co. |
11,260 | 554,104 | ||||||
|
|
|
|||||||
| 4,510,328 | ||||||||
| Distributors — 0.7% | ||||||||
| Genuine Parts Co. |
50,561 | 6,417,202 | ||||||
| Pool Corp. |
6,756 | 3,228,152 | ||||||
|
|
|
|||||||
| 9,645,354 | ||||||||
| Diversified Financial Services — 1.2% | ||||||||
| Berkshire Hathaway Inc., Class B(a) |
63,056 | 17,547,854 | ||||||
|
|
|
|||||||
| Diversified Telecommunication Services — 0.8% | ||||||||
| AT&T Inc. |
253,385 | 7,107,449 | ||||||
| Verizon Communications Inc. |
82,198 | 4,585,005 | ||||||
|
|
|
|||||||
| 11,692,454 | ||||||||
| Electric Utilities — 1.6% | ||||||||
| Avangrid Inc. |
13,757 | 717,290 | ||||||
| Edison International |
76,568 | 4,172,956 | ||||||
| Eversource Energy |
86,702 | 7,479,782 | ||||||
| Exelon Corp. |
38,323 | 1,793,516 | ||||||
| NextEra Energy Inc. |
116,157 | 9,048,630 | ||||||
|
|
|
|||||||
| 23,212,174 | ||||||||
| Electrical Equipment — 0.3% | ||||||||
| Acuity Brands Inc. |
11,260 | 1,974,779 | ||||||
| ChargePoint Holdings Inc.(a)(b) |
6,756 | 159,779 | ||||||
| Generac Holdings Inc.(a) |
586 | 245,745 | ||||||
| Plug Power Inc.(a) |
24,772 | 675,780 | ||||||
| Rockwell Automation Inc. |
3,378 | 1,038,465 | ||||||
| Sunrun Inc.(a)(b) |
12,386 | 656,087 | ||||||
| Vertiv Holdings Co., Class A |
7,882 | 221,011 | ||||||
|
|
|
|||||||
| 4,971,646 | ||||||||
| Electronic Equipment, Instruments & Components — 0.5% | ||||||||
| Amphenol Corp., Class A |
49,544 | 3,591,445 | ||||||
| Arrow Electronics Inc.(a) |
16,948 | 2,009,524 | ||||||
| Coherent Inc.(a) |
1,052 | 258,729 | ||||||
| IPG Photonics Corp.(a) |
3,378 | 736,945 | ||||||
| Zebra Technologies Corp., Class A(a) |
1,809 | 999,436 | ||||||
|
|
|
|||||||
| 7,596,079 | ||||||||
| Security | Shares | Value | ||||||
| Energy Equipment & Services — 0.2% | ||||||||
| Baker Hughes Co., Class A |
33,780 | $ | 717,487 | |||||
| Halliburton Co. |
29,276 | 605,428 | ||||||
| Schlumberger Ltd. |
68,686 | 1,980,217 | ||||||
|
|
|
|||||||
| 3,303,132 | ||||||||
| Entertainment — 2.0% | ||||||||
| Activision Blizzard Inc. |
24,772 | 2,071,435 | ||||||
| Netflix Inc.(a) |
22,520 | 11,655,676 | ||||||
| Roku Inc.(a) |
4,504 | 1,929,108 | ||||||
| Skillz Inc., Class A(a)(b) |
22,520 | 317,082 | ||||||
| Spotify Technology SA(a) |
9,008 | 2,059,859 | ||||||
| Walt Disney Co. (The)(a) |
58,552 | 10,306,323 | ||||||
|
|
|
|||||||
| 28,339,483 | ||||||||
| Equity Real Estate Investment Trusts (REITs) — 3.1% | ||||||||
| American Homes 4 Rent, Class A |
37,158 | 1,560,636 | ||||||
| Apartment Income REIT Corp. |
10,134 | 533,454 | ||||||
| Boston Properties Inc. |
36,032 | 4,229,436 | ||||||
| Brixmor Property Group Inc. |
55,174 | 1,270,105 | ||||||
| CyrusOne Inc. |
11,260 | 802,500 | ||||||
| Equinix Inc. |
3,378 | 2,771,345 | ||||||
| Equity Residential |
47,292 | 3,978,676 | ||||||
| Essex Property Trust Inc. |
15,764 | 5,172,168 | ||||||
| Extra Space Storage Inc. |
4,504 | 784,327 | ||||||
| Federal Realty Investment Trust |
21,394 | 2,514,437 | ||||||
| Hudson Pacific Properties Inc. |
52,922 | 1,442,654 | ||||||
| Kilroy Realty Corp. |
47,292 | 3,275,917 | ||||||
| Kimco Realty Corp. |
36,032 | 768,563 | ||||||
| Mid-America Apartment Communities Inc. |
9,008 | 1,739,445 | ||||||
| Prologis Inc. |
5,630 | 720,865 | ||||||
| Regency Centers Corp. |
30,402 | 1,988,595 | ||||||
| Simon Property Group Inc. |
12,386 | 1,567,077 | ||||||
| SL Green Realty Corp. |
5,630 | 419,210 | ||||||
| Sun Communities Inc. |
5,630 | 1,104,099 | ||||||
| UDR Inc. |
102,499 | 5,636,420 | ||||||
| Ventas Inc. |
15,764 | 942,372 | ||||||
| Welltower Inc. |
4,504 | 391,217 | ||||||
|
|
|
|||||||
| 43,613,518 | ||||||||
| Food & Staples Retailing — 1.0% | ||||||||
| Kroger Co. (The) |
40,536 | 1,649,815 | ||||||
| Sysco Corp. |
4,504 | 334,197 | ||||||
| U.S. Foods Holding Corp.(a) |
5,630 | 193,334 | ||||||
| Walgreens Boots Alliance Inc. |
58,552 | 2,760,727 | ||||||
| Walmart Inc. |
62,077 | 8,849,076 | ||||||
|
|
|
|||||||
| 13,787,149 | ||||||||
| Food Products — 0.8% | ||||||||
| Beyond Meat Inc.(a) |
2,252 | 276,321 | ||||||
| Campbell Soup Co. |
42,788 | 1,870,691 | ||||||
| General Mills Inc. |
36,032 | 2,120,844 | ||||||
| Hain Celestial Group Inc. (The)(a) |
69,904 | 2,789,869 | ||||||
| Kellogg Co. |
25,898 | 1,640,897 | ||||||
| Kraft Heinz Co. (The) |
42,788 | 1,646,054 | ||||||
| Lamb Weston Holdings Inc. |
2,252 | 150,366 | ||||||
| Pilgrim’s Pride Corp.(a) |
10,109 | 223,914 | ||||||
| Post Holdings Inc.(a) |
10,134 | 1,037,114 | ||||||
|
|
|
|||||||
| 11,756,070 | ||||||||
| Gas Utilities — 0.4% | ||||||||
| UGI Corp. |
126,112 | 5,799,891 | ||||||
|
|
|
|||||||
| Health Care Equipment & Supplies — 3.7% | ||||||||
| Abbott Laboratories |
79,946 | 9,671,867 | ||||||
| 24 | 2 0 2 1 B L A C K R O C K A N N U A L R E P O R T T O S H A R E H O L D E R S |
| Schedule of Investments (continued) July 31, 2021 |
BlackRock U.S. Carbon Transition Readiness ETF (Percentages shown are based on Net Assets) |
| Security | Shares | Value | ||||||
| Health Care Equipment & Supplies (continued) | ||||||||
| Becton Dickinson and Co. |
14,638 | $ | 3,743,669 | |||||
| Boston Scientific Corp.(a) |
28,150 | 1,283,640 | ||||||
| Danaher Corp. |
4,064 | 1,208,999 | ||||||
| Edwards Lifesciences Corp.(a) |
46,166 | 5,183,057 | ||||||
| Hill-Rom Holdings Inc. |
16,981 | 2,351,189 | ||||||
| Hologic Inc.(a) |
14,638 | 1,098,436 | ||||||
| ICU Medical Inc.(a) |
13,512 | 2,746,854 | ||||||
| IDEXX Laboratories Inc.(a) |
3,631 | 2,463,742 | ||||||
| Medtronic PLC |
102,466 | 13,454,810 | ||||||
| Novocure Ltd.(a) |
2,252 | 346,831 | ||||||
| Stryker Corp. |
13,512 | 3,660,941 | ||||||
| West Pharmaceutical Services Inc. |
11,260 | 4,636,080 | ||||||
| Zimmer Biomet Holdings Inc. |
2,252 | 368,022 | ||||||
|
|
|
|||||||
| 52,218,137 | ||||||||
| Health Care Providers & Services — 2.0% | ||||||||
| Anthem Inc. |
5,630 | 2,161,976 | ||||||
| Centene Corp.(a) |
5,299 | 363,564 | ||||||
| Cigna Corp. |
7,316 | 1,678,949 | ||||||
| CVS Health Corp. |
92,332 | 7,604,463 | ||||||
| Encompass Health Corp. |
6,756 | 562,437 | ||||||
| Guardant Health Inc.(a) |
1,375 | 150,975 | ||||||
| HCA Healthcare Inc. |
6,756 | 1,676,839 | ||||||
| Humana Inc. |
2,252 | 959,037 | ||||||
| Quest Diagnostics Inc. |
7,882 | 1,117,668 | ||||||
| UnitedHealth Group Inc. |
28,150 | 11,603,993 | ||||||
| Universal Health Services Inc., Class B |
2,338 | 375,039 | ||||||
|
|
|
|||||||
| 28,254,940 | ||||||||
| Health Care Technology — 0.4% | ||||||||
| Cerner Corp. |
22,520 | 1,810,383 | ||||||
| Teladoc Health Inc.(a)(b) |
6,756 | 1,002,928 | ||||||
| Veeva Systems Inc., Class A(a) |
7,882 | 2,622,420 | ||||||
|
|
|
|||||||
| 5,435,731 | ||||||||
| Hotels, Restaurants & Leisure — 2.4% | ||||||||
| Booking Holdings Inc.(a) |
3,982 | 8,673,831 | ||||||
| Caesars Entertainment Inc.(a) |
3,378 | 295,102 | ||||||
| Carnival Corp.(a) |
18,016 | 390,047 | ||||||
| Darden Restaurants Inc. |
9,008 | 1,314,087 | ||||||
| DraftKings Inc., Class A(a) |
7,882 | 382,277 | ||||||
| McDonald’s Corp. |
39,410 | 9,565,201 | ||||||
| Penn National Gaming Inc.(a) |
5,630 | 384,979 | ||||||
| Royal Caribbean Cruises Ltd.(a) |
10,134 | 779,001 | ||||||
| Starbucks Corp. |
37,158 | 4,512,096 | ||||||
| Travel + Leisure Co. |
15,764 | 816,575 | ||||||
| Yum China Holdings Inc. |
5,630 | 350,130 | ||||||
| Yum! Brands Inc. |
46,166 | 6,065,751 | ||||||
|
|
|
|||||||
| 33,529,077 | ||||||||
| Household Durables — 0.6% | ||||||||
| Leggett & Platt Inc. |
76,568 | 3,677,561 | ||||||
| Newell Brands Inc. |
115,978 | 2,870,456 | ||||||
| Whirlpool Corp. |
7,882 | 1,746,178 | ||||||
|
|
|
|||||||
| 8,294,195 | ||||||||
| Household Products — 1.1% | ||||||||
| Church & Dwight Co. Inc. |
16,890 | 1,462,336 | ||||||
| Clorox Co. (The) |
11,630 | 2,103,751 | ||||||
| Colgate-Palmolive Co. |
52,697 | 4,189,412 | ||||||
| Procter & Gamble Co. (The) |
50,670 | 7,206,794 | ||||||
|
|
|
|||||||
| 14,962,293 | ||||||||
| Security | Shares | Value | ||||||
| Independent Power and Renewable Electricity Producers — 0.0% | ||||||||
| Brookfield Renewable Corp., Class A |
5,630 | $ | 238,937 | |||||
|
|
|
|||||||
| Industrial Conglomerates — 0.9% | ||||||||
| 3M Co. |
18,016 | 3,566,087 | ||||||
| General Electric Co. |
340,052 | 4,403,674 | ||||||
| Honeywell International Inc. |
19,142 | 4,475,208 | ||||||
|
|
|
|||||||
| 12,444,969 | ||||||||
| Insurance — 1.8% | ||||||||
| Aflac Inc. |
27,877 | 1,533,235 | ||||||
| Allstate Corp. (The) |
6,756 | 878,618 | ||||||
| American Financial Group Inc./OH |
1,950 | 246,655 | ||||||
| American International Group Inc. |
29,276 | 1,386,219 | ||||||
| Aon PLC, Class A |
9,688 | 2,519,171 | ||||||
| Arch Capital Group Ltd.(a) |
16,890 | 658,710 | ||||||
| Arthur J Gallagher & Co. |
4,504 | 627,452 | ||||||
| Athene Holding Ltd., Class A(a) |
4,946 | 319,611 | ||||||
| Brown & Brown Inc. |
5,949 | 323,626 | ||||||
| Cincinnati Financial Corp. |
5,630 | 663,664 | ||||||
| Everest Re Group Ltd. |
1,018 | 257,381 | ||||||
| First American Financial Corp. |
2,037 | 137,110 | ||||||
| Globe Life Inc. |
1,686 | 156,983 | ||||||
| Hartford Financial Services Group Inc. (The) |
14,638 | 931,270 | ||||||
| Lemonade Inc.(a) |
6,756 | 588,177 | ||||||
| Lincoln National Corp. |
12,386 | 763,225 | ||||||
| Loews Corp. |
2,806 | 150,486 | ||||||
| Markel Corp.(a) |
230 | 277,419 | ||||||
| Marsh & McLennan Companies Inc. |
18,016 | 2,652,316 | ||||||
| MetLife Inc. |
37,670 | 2,173,559 | ||||||
| Principal Financial Group Inc. |
18,924 | 1,175,748 | ||||||
| Progressive Corp. (The) |
22,116 | 2,104,559 | ||||||
| Prudential Financial Inc. |
18,016 | 1,806,644 | ||||||
| Reinsurance Group of America Inc. |
1,659 | 182,789 | ||||||
| RenaissanceRe Holdings Ltd. |
1,126 | 171,929 | ||||||
| Travelers Companies Inc. (The) |
10,606 | 1,579,446 | ||||||
| W R Berkley Corp. |
3,190 | 233,412 | ||||||
| Willis Towers Watson PLC |
5,630 | 1,160,230 | ||||||
|
|
|
|||||||
| 25,659,644 | ||||||||
| Interactive Media & Services — 6.2% | ||||||||
| Alphabet Inc., Class A(a) |
9,721 | 26,193,526 | ||||||
| Alphabet Inc., Class C, NVS(a) |
10,134 | 27,406,592 | ||||||
| Facebook Inc., Class A(a) |
85,327 | 30,402,010 | ||||||
| IAC/InterActiveCorp.(a) |
7,882 | 1,082,120 | ||||||
| Match Group Inc.(a) |
3,245 | 516,831 | ||||||
| Pinterest Inc., Class A(a) |
12,205 | 718,874 | ||||||
| TripAdvisor Inc.(a) |
16,890 | 640,976 | ||||||
| Twitter Inc.(a) |
20,268 | 1,413,693 | ||||||
| Zillow Group Inc., Class C, NVS(a) |
5,630 | 598,244 | ||||||
|
|
|
|||||||
| 88,972,866 | ||||||||
| Internet & Direct Marketing Retail — 3.2% | ||||||||
| Amazon.com Inc.(a) |
12,331 | 41,032,512 | ||||||
| DoorDash Inc., Class A(a) |
5,630 | 981,253 | ||||||
| Etsy Inc.(a) |
10,134 | 1,859,690 | ||||||
| Qurate Retail Inc., Series A |
87,828 | 1,041,640 | ||||||
| Wayfair Inc., Class A(a) |
1,755 | 423,587 | ||||||
|
|
|
|||||||
| 45,338,682 | ||||||||
| IT Services — 4.6% | ||||||||
| Accenture PLC, Class A |
32,654 | 10,373,523 | ||||||
| Automatic Data Processing Inc. |
4,504 | 944,174 | ||||||
| Broadridge Financial Solutions Inc. |
11,260 | 1,953,497 | ||||||
| S C H E D U L E O F I N V E S T M E N T S |
25 |
| Schedule of Investments (continued) July 31, 2021 |
BlackRock U.S. Carbon Transition Readiness ETF (Percentages shown are based on Net Assets) |
| Security | Shares | Value | ||||||
| IT Services (continued) | ||||||||
| DXC Technology Co.(a) |
6,756 | $ | 270,105 | |||||
| Fidelity National Information Services Inc. |
9,008 | 1,342,642 | ||||||
| Global Payments Inc. |
5,851 | 1,131,642 | ||||||
| Globant SA(a) |
2,252 | 538,588 | ||||||
| International Business Machines Corp. |
30,402 | 4,285,466 | ||||||
| Mastercard Inc., Class A |
28,914 | 11,159,069 | ||||||
| MongoDB Inc., Class A(a) |
1,111 | 398,760 | ||||||
| Okta Inc.(a) |
2,252 | 558,023 | ||||||
| Paychex Inc. |
5,630 | 640,807 | ||||||
| PayPal Holdings Inc.(a) |
40,536 | 11,168,884 | ||||||
| Snowflake Inc., Class A(a) |
5,630 | 1,496,004 | ||||||
| Square Inc., Class A(a) |
14,706 | 3,636,206 | ||||||
| StoneCo Ltd., Class A |
12,386 | 728,792 | ||||||
| Twilio Inc., Class A(a) |
4,282 | 1,599,712 | ||||||
| Visa Inc., Class A |
49,544 | 12,207,146 | ||||||
| Wix.com Ltd.(a) |
2,252 | 672,537 | ||||||
|
|
|
|||||||
| 65,105,577 | ||||||||
| Leisure Products — 0.1% | ||||||||
| Peloton Interactive Inc., Class A(a) |
10,134 | 1,196,319 | ||||||
|
|
|
|||||||
| Life Sciences Tools & Services — 1.3% | ||||||||
| Illumina Inc.(a) |
10,134 | 5,023,930 | ||||||
| IQVIA Holdings Inc.(a) |
20,268 | 5,020,384 | ||||||
| PerkinElmer Inc. |
5,855 | 1,066,957 | ||||||
| Thermo Fisher Scientific Inc. |
13,625 | 7,357,636 | ||||||
|
|
|
|||||||
| 18,468,907 | ||||||||
| Machinery — 2.0% | ||||||||
| Caterpillar Inc. |
21,153 | 4,373,383 | ||||||
| Cummins Inc. |
5,630 | 1,306,723 | ||||||
| Deere & Co. |
7,607 | 2,750,615 | ||||||
| Dover Corp. |
69,244 | 11,572,057 | ||||||
| Ingersoll Rand Inc.(a) |
37,762 | 1,845,429 | ||||||
| Middleby Corp. (The)(a) |
7,882 | 1,509,324 | ||||||
| PACCAR Inc. |
3,451 | 286,398 | ||||||
| Pentair PLC |
47,292 | 3,484,002 | ||||||
| Xylem Inc./NY |
10,134 | 1,275,364 | ||||||
|
|
|
|||||||
| 28,403,295 | ||||||||
| Media — 1.0% | ||||||||
| Charter Communications Inc., Class A(a) |
4,504 | 3,351,201 | ||||||
| Comcast Corp., Class A |
175,656 | 10,333,843 | ||||||
| ViacomCBS Inc., Class B, NVS |
19,142 | 783,482 | ||||||
|
|
|
|||||||
| 14,468,526 | ||||||||
| Metals & Mining — 0.5% | ||||||||
| Royal Gold Inc. |
30,402 | 3,694,451 | ||||||
| Steel Dynamics Inc. |
58,552 | 3,773,676 | ||||||
|
|
|
|||||||
| 7,468,127 | ||||||||
| Multi-Utilities — 0.1% | ||||||||
| CenterPoint Energy Inc. |
7,882 | 200,676 | ||||||
| Consolidated Edison Inc. |
16,890 | 1,245,975 | ||||||
|
|
|
|||||||
| 1,446,651 | ||||||||
| Multiline Retail — 0.3% | ||||||||
| Nordstrom Inc.(a) |
19,371 | 641,180 | ||||||
| Target Corp. |
15,764 | 4,115,192 | ||||||
|
|
|
|||||||
| 4,756,372 | ||||||||
| Oil, Gas & Consumable Fuels — 2.2% | ||||||||
| Cheniere Energy Inc.(a) |
33,780 | 2,868,935 | ||||||
| Chevron Corp. |
44,692 | 4,550,093 | ||||||
| ConocoPhillips |
79,946 | 4,481,773 | ||||||
| Security | Shares | Value | ||||||
| Oil, Gas & Consumable Fuels (continued) | ||||||||
| Devon Energy Corp. |
18,016 | $ | 465,533 | |||||
| Diamondback Energy Inc. |
4,504 | 347,394 | ||||||
| EOG Resources Inc. |
10,134 | 738,363 | ||||||
| EQT Corp.(a) |
52,922 | 973,236 | ||||||
| Exxon Mobil Corp. |
40,536 | 2,333,658 | ||||||
| Kinder Morgan Inc. |
567,504 | 9,863,219 | ||||||
| Marathon Petroleum Corp. |
11,260 | 621,777 | ||||||
| Pioneer Natural Resources Co. |
3,378 | 491,060 | ||||||
| Valero Energy Corp. |
5,630 | 377,041 | ||||||
| Williams Companies Inc. (The) |
136,246 | 3,412,962 | ||||||
|
|
|
|||||||
| 31,525,044 | ||||||||
| Personal Products — 0.4% | ||||||||
| Coty Inc., Class A(a) |
87,828 | 766,738 | ||||||
| Estee Lauder Companies Inc. (The), Class A |
13,512 | 4,510,711 | ||||||
|
|
|
|||||||
| 5,277,449 | ||||||||
| Pharmaceuticals — 3.5% | ||||||||
| Bristol-Myers Squibb Co. |
136,246 | 9,247,016 | ||||||
| Catalent Inc.(a) |
13,512 | 1,618,873 | ||||||
| Eli Lilly & Co. |
41,662 | 10,144,697 | ||||||
| Johnson & Johnson |
77,694 | 13,378,907 | ||||||
| Merck & Co. Inc. |
77,694 | 5,972,338 | ||||||
| Nektar Therapeutics, Class A(a) |
77,694 | 1,226,788 | ||||||
| Perrigo Co. PLC |
30,809 | 1,479,756 | ||||||
| Pfizer Inc. |
141,876 | 6,073,712 | ||||||
| Viatris Inc. |
42,788 | 602,027 | ||||||
|
|
|
|||||||
| 49,744,114 | ||||||||
| Professional Services — 1.3% | ||||||||
| CoStar Group Inc.(a) |
101,340 | 9,004,059 | ||||||
| Equifax Inc. |
2,252 | 586,871 | ||||||
| IHS Markit Ltd. |
4,504 | 526,247 | ||||||
| Jacobs Engineering Group Inc. |
38,284 | 5,177,911 | ||||||
| Leidos Holdings Inc. |
16,890 | 1,797,434 | ||||||
| TransUnion |
2,252 | 270,375 | ||||||
| Verisk Analytics Inc., Class A |
4,504 | 855,490 | ||||||
|
|
|
|||||||
| 18,218,387 | ||||||||
| Real Estate Management & Development — 0.0% | ||||||||
| Opendoor Technologies Inc.(a) |
29,276 | 433,870 | ||||||
|
|
|
|||||||
| Road & Rail — 0.9% | ||||||||
| CSX Corp. |
124,986 | 4,039,547 | ||||||
| JB Hunt Transport Services Inc. |
12,386 | 2,086,422 | ||||||
| Knight-Swift Transportation Holdings Inc. |
55,174 | 2,741,596 | ||||||
| Old Dominion Freight Line Inc. |
1,126 | 303,063 | ||||||
| Uber Technologies Inc.(a) |
13,512 | 587,232 | ||||||
| Union Pacific Corp. |
12,386 | 2,709,561 | ||||||
|
|
|
|||||||
| 12,467,421 | ||||||||
| Semiconductors & Semiconductor Equipment — 5.2% | ||||||||
| Advanced Micro Devices Inc.(a) |
70,938 | 7,532,906 | ||||||
| Analog Devices Inc. |
30,402 | 5,089,903 | ||||||
| Applied Materials Inc. |
22,520 | 3,151,224 | ||||||
| Broadcom Inc. |
19,142 | 9,291,527 | ||||||
| Intel Corp. |
90,080 | 4,839,098 | ||||||
| Marvell Technology Inc. |
48,356 | 2,926,021 | ||||||
| Maxim Integrated Products Inc. |
63,292 | 6,323,504 | ||||||
| Microchip Technology Inc. |
22,520 | 3,223,062 | ||||||
| MKS Instruments Inc. |
6,756 | 1,056,909 | ||||||
| Monolithic Power Systems Inc. |
2,252 | 1,011,733 | ||||||
| NVIDIA Corp. |
81,072 | 15,808,229 | ||||||
| QUALCOMM Inc. |
21,394 | 3,204,821 | ||||||
| 26 | 2 0 2 1 B L A C K R O C K A N N U A L R E P O R T T O S H A R E H O L D E R S |
| Schedule of Investments (continued) July 31, 2021 |
BlackRock U.S. Carbon Transition Readiness ETF (Percentages shown are based on Net Assets) |
| Security | Shares | Value | ||||||
| Semiconductors & Semiconductor Equipment (continued) | ||||||||
| Skyworks Solutions Inc. |
6,756 | $ | 1,246,550 | |||||
| Texas Instruments Inc. |
30,402 | 5,795,229 | ||||||
| Universal Display Corp. |
12,386 | 2,904,393 | ||||||
| Xilinx Inc. |
5,008 | 750,399 | ||||||
|
|
|
|||||||
| 74,155,508 | ||||||||
| Software — 10.9% | ||||||||
| Adobe Inc.(a) |
23,733 | 14,753,145 | ||||||
| Atlassian Corp. PLC, Class A(a) |
2,252 | 732,170 | ||||||
| Autodesk Inc.(a) |
3,378 | 1,084,777 | ||||||
| Bill.com Holdings Inc.(a) |
1,126 | 232,879 | ||||||
| C3.ai Inc., Class A(a) |
5,630 | 283,470 | ||||||
| Cadence Design Systems Inc.(a) |
30,402 | 4,488,855 | ||||||
| Citrix Systems Inc. |
6,756 | 680,667 | ||||||
| Cloudflare Inc., Class A(a) |
9,008 | 1,068,619 | ||||||
| Coupa Software Inc.(a) |
1,126 | 244,342 | ||||||
| Crowdstrike Holdings Inc., Class A(a) |
4,857 | 1,231,784 | ||||||
| Datadog Inc., Class A(a) |
2,252 | 249,296 | ||||||
| DocuSign Inc., Class A(a) |
4,504 | 1,342,372 | ||||||
| Dolby Laboratories Inc., Class A |
65,567 | 6,366,556 | ||||||
| Fortinet Inc.(a) |
4,504 | 1,226,169 | ||||||
| Guidewire Software Inc.(a) |
7,882 | 908,006 | ||||||
| Intuit Inc. |
29,718 | 15,749,648 | ||||||
| Microsoft Corp. |
245,468 | 69,936,288 | ||||||
| NortonLifeLock Inc. |
129,490 | 3,213,942 | ||||||
| Oracle Corp. |
41,662 | 3,630,427 | ||||||
| Palantir Technologies Inc., Class A(a) |
65,308 | 1,417,837 | ||||||
| Palo Alto Networks Inc.(a) |
2,705 | 1,079,430 | ||||||
| Proofpoint Inc.(a) |
5,745 | 1,003,422 | ||||||
| PTC Inc.(a) |
2,371 | 321,152 | ||||||
| salesforce.com Inc.(a) |
41,662 | 10,079,288 | ||||||
| ServiceNow Inc.(a) |
12,894 | 7,580,254 | ||||||
| Trade Desk Inc. (The), Class A(a) |
4,504 | 368,923 | ||||||
| Unity Software Inc.(a) |
2,252 | 241,234 | ||||||
| Workday Inc., Class A(a) |
15,764 | 3,695,082 | ||||||
| Zoom Video Communications Inc., Class A(a) |
6,756 | 2,554,444 | ||||||
|
|
|
|||||||
| 155,764,478 | ||||||||
| Specialty Retail — 2.1% | ||||||||
| AutoNation Inc.(a) |
22,520 | 2,732,352 | ||||||
| Best Buy Co. Inc. |
4,504 | 506,024 | ||||||
| Carvana Co., Class A(a) |
2,252 | 760,185 | ||||||
| GameStop Corp., Class A(a) |
2,252 | 362,842 | ||||||
| Home Depot Inc. (The) |
40,536 | 13,303,510 | ||||||
| L Brands Inc. |
4,637 | 371,285 | ||||||
| Lowe’s Companies Inc. |
34,906 | 6,726,037 | ||||||
| Ross Stores Inc. |
10,134 | 1,243,340 | ||||||
| Security | Shares | Value | ||||||
| Specialty Retail (continued) | ||||||||
| TJX Companies Inc. (The) |
32,654 | $ | 2,246,922 | |||||
| Ulta Beauty Inc.(a) |
2,252 | 756,222 | ||||||
| Williams-Sonoma Inc. |
2,252 | 341,628 | ||||||
|
|
|
|||||||
| 29,350,347 | ||||||||
| Technology Hardware, Storage & Peripherals — 5.8% | ||||||||
| Apple Inc. |
521,413 | 76,053,300 | ||||||
| Dell Technologies Inc., Class C(a) |
27,024 | 2,611,059 | ||||||
| Hewlett Packard Enterprise Co. |
183,735 | 2,664,157 | ||||||
| Pure Storage Inc., Class A(a) |
61,930 | 1,208,874 | ||||||
|
|
|
|||||||
| 82,537,390 | ||||||||
| Textiles, Apparel & Luxury Goods — 0.5% | ||||||||
| Lululemon Athletica Inc.(a) |
3,378 | 1,351,774 | ||||||
| Nike Inc., Class B |
35,912 | 6,015,619 | ||||||
|
|
|
|||||||
| 7,367,393 | ||||||||
| Thrifts & Mortgage Finance — 0.0% | ||||||||
| Rocket Companies Inc., Class A |
23,646 | 407,657 | ||||||
|
|
|
|||||||
| Wireless Telecommunication Services — 0.6% | ||||||||
| T-Mobile U.S. Inc.(a) |
61,561 | 8,866,015 | ||||||
|
|
|
|||||||
| Total Common Stocks — 98.6% |
1,404,678,913 | |||||||
|
|
|
|||||||
| Short-Term Investments |
||||||||
| Money Market Funds — 1.3% | ||||||||
| BlackRock Cash Funds: Institutional, SL Agency Shares, 0.06%(c)(d)(e) |
1,051,299 | 1,051,825 | ||||||
| BlackRock Cash Funds: Treasury, SL Agency Shares, 0.00%(c)(d) |
17,150,000 | 17,150,000 | ||||||
|
|
|
|||||||
| 18,201,825 | ||||||||
|
|
|
|||||||
| Total Short-Term Investments — 1.3% |
18,201,825 | |||||||
|
|
|
|||||||
| Total Investments in Securities — 99.9% |
1,422,880,738 | |||||||
| Other Assets, Less Liabilities — 0.1% |
1,008,142 | |||||||
|
|
|
|||||||
| Net Assets — 100.0% |
$ | 1,423,888,880 | ||||||
|
|
|
|||||||
| (a) | Non-income producing security. |
| (b) | All or a portion of this security is on loan. |
| (c) | Affiliate of the Fund. |
| (d) | Annualized 7-day yield as of period-end. |
| (e) | All or a portion of this security was purchased with cash collateral received from loaned securities. |
| S C H E D U L E O F I N V E S T M E N T S |
27 |
| Schedule of Investments (continued) July 31, 2021 |
BlackRock U.S. Carbon Transition Readiness ETF |
Affiliates
Investments in issuers considered to be affiliate(s) of the Fund during the period ended July 31, 2021 for purposes of Section 2(a)(3) of the Investment Company Act of 1940, as amended, were as follows:
| Affiliated Issuer | |
Value at 04/06/21 |
(a) |
|
Purchases at Cost |
|
|
Proceeds from Sales |
|
|
Net Realized Gain (Loss) |
|
|
Change in Unrealized Appreciation (Depreciation) |
|
|
Value at 07/31/21 |
|
|
Shares Held at 07/31/21 |
|
Income | |
Capital Gain |
| |||||||||||
| BlackRock Cash Funds: Institutional, SL Agency Shares |
$ | — | $ | 1,052,324 | (b) | $ | — | $ | (438 | ) | $ | (61 | ) | $ | 1,051,825 | 1,051,299 | $ | 27,448 | (c) | $ | — | |||||||||||||||
| BlackRock Cash Funds: Treasury, SL Agency Shares |
— | 17,150,000 | (b) | — | — | — | 17,150,000 | 17,150,000 | 260 | — | ||||||||||||||||||||||||||
| BlackRock Inc. |
— | 4,516,854 | (8,025 | ) | 208 | 373,130 | 4,882,167 | 5,630 | 23,252 | — | ||||||||||||||||||||||||||
|
|
|
|
|
|
|
|
|
|
|
|||||||||||||||||||||||||||
| $ | (230 | ) | $ | 373,069 | $ | 23,083,992 | $ | 50,960 | $ | — | ||||||||||||||||||||||||||
|
|
|
|
|
|
|
|
|
|
|
| (a) | The Fund commenced operations on April 06, 2021. |
| (b) | Represents net amount purchased (sold). |
| (c) | All or a portion represents securities lending income earned from the reinvestment of cash collateral from loaned securities, net of fees and collateral investment expenses, and other payments to and from borrowers of securities. |
Futures Contracts
| Description | Number of Contracts |
Expiration Date |
Notional Amount (000) |
Value/ Unrealized Appreciation (Depreciation) |
||||||||||||
| Long Contracts |
||||||||||||||||
| S&P 500 E-Mini Index |
81 | 09/17/21 | $ | 17,777 | $ | 324,095 | ||||||||||
|
|
|
|||||||||||||||
Derivative Financial Instruments Categorized by Risk Exposure
As of July 31, 2021, the fair values of derivative financial instruments located in the Statements of Assets and Liabilities were as follows:
| Equity Contracts |
||||
| Assets — Derivative Financial Instruments |
||||
| Futures contracts |
||||
| Unrealized appreciation on futures contracts(a) |
$ | 324,095 | ||
|
|
|
|||
| (a) | Net cumulative appreciation (depreciation) on futures contracts are reported in the Schedule of Investments. In the Statements of Assets and Liabilities, only current day’s variation margin is reported in receivables or payables and the net cumulative unrealized appreciation (depreciation) is included in accumulated earnings (loss). |
For the period ended July 31, 2021, the effect of derivative financial instruments in the Statements of Operations was as follows:
| Equity Contracts |
||||
| Net Realized Gain (Loss) from: |
||||
| Futures contracts |
$ | 395,044 | ||
|
|
|
|||
| Net Change in Unrealized Appreciation (Depreciation) on: |
||||
| Futures contracts |
$ | 324,095 | ||
|
|
|
|||
Average Quarterly Balances of Outstanding Derivative Financial Instruments
| Futures contracts: |
||||
| Average notional value of contracts — long |
$ | 15,463,418 | ||
For more information about the Fund’s investment risks regarding derivative financial instruments, refer to the Notes to Financial Statements.
| 28 | 2 0 2 1 B L A C K R O C K A N N U A L R E P O R T T O S H A R E H O L D E R S |
| Schedule of Investments (continued) July 31, 2021 |
BlackRock U.S. Carbon Transition Readiness ETF |
Fair Value Measurements
Various inputs are used in determining the fair value of financial instruments. For description of the input levels and information about the Fund’s policy regarding valuation of financial instruments, refer to the Notes to Financial Statements.
The following table summarizes the value of the Fund’s investments according to the fair value hierarchy as of July 31, 2021. The breakdown of the Fund’s investments into major categories is disclosed in the Schedule of Investments above.
| Level 1 | Level 2 | Level 3 | Total | |||||||||||||
| Investments |
||||||||||||||||
| Assets |
||||||||||||||||
| Common Stocks |
$ | 1,404,678,913 | $ | — | $ | — | $ | 1,404,678,913 | ||||||||
| Money Market Funds |
18,201,825 | — | — | 18,201,825 | ||||||||||||
|
|
|
|
|
|
|
|
|
|||||||||
| $ | 1,422,880,738 | $ | — | $ | — | $ | 1,422,880,738 | |||||||||
|
|
|
|
|
|
|
|
|
|||||||||
| Derivative financial instruments(a) |
||||||||||||||||
| Assets |
||||||||||||||||
| Futures Contracts |
$ | 324,095 | $ | — | $ | — | $ | 324,095 | ||||||||
|
|
|
|
|
|
|
|
|
|||||||||
| (a) | Shown at the unrealized appreciation (depreciation) on the contracts. |
See notes to financial statements.
| S C H E D U L E O F I N V E S T M E N T S |
29 |
| Schedule of Investments July 31, 2021 |
BlackRock U.S. Equity Factor Rotation ETF (Percentages shown are based on Net Assets) |
| Security | Shares | Value | ||||||
| Common Stocks |
||||||||
| Communication Services — 9.4% | ||||||||
| Activision Blizzard Inc. |
2,882 | $ | 240,993 | |||||
| Alphabet Inc., Class A(a) |
658 | 1,773,001 | ||||||
| Alphabet Inc., Class C, NVS(a) |
667 | 1,803,848 | ||||||
| Altice USA Inc., Class A(a) |
1,498 | 46,034 | ||||||
| AT&T Inc. |
4,034 | 113,154 | ||||||
| Cable One Inc. |
32 | 60,416 | ||||||
| Charter Communications Inc., Class A(a) |
88 | 65,476 | ||||||
| Comcast Corp., Class A |
1,074 | 63,183 | ||||||
| Discovery Inc., Class A(a) |
532 | 15,433 | ||||||
| Discovery Inc., Class C, NVS(a) |
1,135 | 30,770 | ||||||
| DISH Network Corp., Class A(a) |
1,165 | 48,802 | ||||||
| Electronic Arts Inc. |
1,389 | 199,960 | ||||||
| Facebook Inc., Class A(a) |
4,640 | 1,653,232 | ||||||
| Fox Corp., Class A, NVS |
1,864 | 66,470 | ||||||
| Fox Corp., Class B |
1,150 | 38,226 | ||||||
| IAC/InterActiveCorp.(a) |
942 | 129,327 | ||||||
| Interpublic Group of Companies Inc. (The) |
4,785 | 169,198 | ||||||
| Liberty Broadband Corp., Class A(a) |
27 | 4,635 | ||||||
| Liberty Broadband Corp., Class C, NVS(a) |
324 | 57,507 | ||||||
| Liberty Global PLC, Class A(a)(b) |
858 | 23,037 | ||||||
| Liberty Global PLC, Class C, NVS(a) |
1,526 | 40,988 | ||||||
| Liberty Media Corp.-Liberty Formula One, Class C, NVS(a) |
1,236 | 58,006 | ||||||
| Liberty Media Corp.-Liberty SiriusXM, Class A(a) |
418 | 19,516 | ||||||
| Liberty Media Corp.-Liberty SiriusXM, Class C, NVS(a) |
1,002 | 46,292 | ||||||
| Live Nation Entertainment Inc.(a) |
602 | 47,492 | ||||||
| Lumen Technologies Inc. |
3,996 | 49,830 | ||||||
| Match Group Inc.(a)(b) |
343 | 54,630 | ||||||
| Netflix Inc.(a) |
99 | 51,239 | ||||||
| News Corp., Class A, NVS |
5,425 | 133,618 | ||||||
| Omnicom Group Inc. |
2,339 | 170,326 | ||||||
| Pinterest Inc., Class A(a) |
3,459 | 203,735 | ||||||
| Roku Inc.(a) |
473 | 202,591 | ||||||
| Sirius XM Holdings Inc.(b) |
9,413 | 60,902 | ||||||
| Snap Inc., Class A, NVS(a) |
5,055 | 376,193 | ||||||
| T-Mobile U.S. Inc.(a) |
421 | 60,632 | ||||||
| Take-Two Interactive Software Inc.(a) |
685 | 118,793 | ||||||
| Twitter Inc.(a) |
896 | 62,496 | ||||||
| Verizon Communications Inc. |
1,302 | 72,626 | ||||||
| ViacomCBS Inc., Class B, NVS |
2,806 | 114,850 | ||||||
| Walt Disney Co. (The)(a) |
2,498 | 439,698 | ||||||
| Zillow Group Inc., Class A(a) |
133 | 14,248 | ||||||
| Zillow Group Inc., Class C, NVS(a) |
308 | 32,728 | ||||||
|
|
|
|||||||
| 9,034,131 | ||||||||
| Consumer Discretionary — 12.1% | ||||||||
| Advance Auto Parts Inc. |
270 | 57,256 | ||||||
| Airbnb Inc., Class A(a) |
341 | 49,107 | ||||||
| Amazon.com Inc.(a) |
15 | 49,914 | ||||||
| Aptiv PLC(a) |
397 | 66,239 | ||||||
| Aramark |
1,461 | 51,325 | ||||||
| Autoliv Inc. |
576 | 58,107 | ||||||
| AutoZone Inc.(a) |
36 | 58,449 | ||||||
| Best Buy Co. Inc. |
2,354 | 264,472 | ||||||
| Booking Holdings Inc.(a) |
24 | 52,278 | ||||||
| BorgWarner Inc. |
1,161 | 56,866 | ||||||
| Burlington Stores Inc.(a) |
413 | 138,272 | ||||||
| Caesars Entertainment Inc.(a) |
77 | 6,727 | ||||||
| CarMax Inc.(a) |
416 | 55,723 | ||||||
| Carnival Corp.(a) |
1,765 | 38,212 | ||||||
| Security | Shares | Value | ||||||
| Consumer Discretionary (continued) | ||||||||
| Carvana Co., Class A(a) |
425 | $ | 143,463 | |||||
| Chewy Inc., Class A(a)(b) |
669 | 55,995 | ||||||
| Chipotle Mexican Grill Inc., Class A(a) |
40 | 74,538 | ||||||
| Darden Restaurants Inc. |
371 | 54,122 | ||||||
| Dollar General Corp. |
285 | 66,302 | ||||||
| Dollar Tree Inc.(a) |
483 | 48,199 | ||||||
| Domino’s Pizza Inc. |
123 | 64,635 | ||||||
| DR Horton Inc. |
3,225 | 307,762 | ||||||
| DraftKings Inc., Class A(a) |
1,070 | 51,895 | ||||||
| eBay Inc. |
6,231 | 425,017 | ||||||
| Etsy Inc.(a) |
712 | 130,659 | ||||||
| Expedia Group Inc.(a) |
1,008 | 162,157 | ||||||
| Ford Motor Co.(a) |
5,430 | 75,749 | ||||||
| Garmin Ltd. |
1,586 | 249,319 | ||||||
| General Motors Co.(a) |
7,729 | 439,316 | ||||||
| Genuine Parts Co. |
458 | 58,129 | ||||||
| Hasbro Inc. |
547 | 54,394 | ||||||
| Hilton Worldwide Holdings Inc.(a) |
504 | 66,251 | ||||||
| Home Depot Inc. (The) |
199 | 65,310 | ||||||
| L Brands Inc. |
2,638 | 211,225 | ||||||
| Las Vegas Sands Corp.(a) |
947 | 40,105 | ||||||
| Lear Corp. |
322 | 56,344 | ||||||
| Lennar Corp., Class A |
602 | 63,300 | ||||||
| LKQ Corp.(a) |
1,100 | 55,825 | ||||||
| Lowe’s Companies Inc. |
290 | 55,880 | ||||||
| Lululemon Athletica Inc.(a) |
1,089 | 435,785 | ||||||
| Marriott International Inc./MD, Class A(a) |
411 | 59,998 | ||||||
| McDonald’s Corp. |
285 | 69,172 | ||||||
| MercadoLibre Inc.(a) |
172 | 269,816 | ||||||
| MGM Resorts International |
2,947 | 110,601 | ||||||
| Mohawk Industries Inc.(a) |
509 | 99,204 | ||||||
| Newell Brands Inc. |
1,940 | 48,015 | ||||||
| Nike Inc., Class B |
8,341 | 1,397,201 | ||||||
| NVR Inc.(a) |
38 | 198,459 | ||||||
| O’Reilly Automotive Inc.(a) |
110 | 66,422 | ||||||
| Peloton Interactive Inc., Class A(a) |
490 | 57,845 | ||||||
| Pool Corp. |
613 | 292,904 | ||||||
| PulteGroup Inc. |
2,911 | 159,727 | ||||||
| Ross Stores Inc. |
416 | 51,039 | ||||||
| Royal Caribbean Cruises Ltd.(a) |
569 | 43,739 | ||||||
| Starbucks Corp. |
552 | 67,029 | ||||||
| Target Corp. |
5,653 | 1,475,716 | ||||||
| Tesla Inc.(a) |
2,797 | 1,922,098 | ||||||
| TJX Companies Inc. (The) |
779 | 53,603 | ||||||
| Tractor Supply Co. |
1,626 | 294,192 | ||||||
| Ulta Beauty Inc.(a) |
159 | 53,392 | ||||||
| Vail Resorts Inc.(a) |
172 | 52,494 | ||||||
| VF Corp. |
649 | 52,050 | ||||||
| Wayfair Inc., Class A(a)(b) |
151 | 36,445 | ||||||
| Whirlpool Corp. |
241 | 53,391 | ||||||
| Wynn Resorts Ltd.(a) |
426 | 41,889 | ||||||
| Yum! Brands Inc. |
540 | 70,951 | ||||||
|
|
|
|||||||
| 11,612,015 | ||||||||
| Consumer Staples — 4.1% | ||||||||
| Altria Group Inc. |
1,466 | 70,427 | ||||||
| Archer-Daniels-Midland Co. |
3,362 | 200,779 | ||||||
| Boston Beer Co. Inc. (The), Class A, NVS(a) |
74 | 52,540 | ||||||
| Brown-Forman Corp., Class B, NVS |
1,795 | 127,301 | ||||||
| Bunge Ltd. |
1,450 | 112,563 | ||||||
| Campbell Soup Co. |
1,178 | 51,502 | ||||||
| 30 | 2 0 2 1 B L A C K R O C K A N N U A L R E P O R T T O S H A R E H O L D E R S |
| Schedule of Investments (continued) July 31, 2021 |
BlackRock U.S. Equity Factor Rotation ETF (Percentages shown are based on Net Assets) |
| Security | Shares | Value | ||||||
| Consumer Staples (continued) | ||||||||
| Church & Dwight Co. Inc. |
1,527 | $ | 132,208 | |||||
| Clorox Co. (The) |
869 | 157,193 | ||||||
| Coca-Cola Co. (The) |
1,244 | 70,945 | ||||||
| Colgate-Palmolive Co. |
937 | 74,492 | ||||||
| Conagra Brands Inc. |
1,795 | 60,115 | ||||||
| Constellation Brands Inc., Class A |
244 | 54,739 | ||||||
| Costco Wholesale Corp. |
1,715 | 736,970 | ||||||
| Estee Lauder Companies Inc. (The), Class A |
1,111 | 370,885 | ||||||
| General Mills Inc. |
1,041 | 61,273 | ||||||
| Hershey Co. (The) |
1,213 | 216,981 | ||||||
| Hormel Foods Corp. |
1,376 | 63,819 | ||||||
| JM Smucker Co. (The) |
496 | 65,031 | ||||||
| Kellogg Co. |
979 | 62,029 | ||||||
| Keurig Dr Pepper Inc. |
1,730 | 60,913 | ||||||
| Kimberly-Clark Corp. |
489 | 66,367 | ||||||
| Kraft Heinz Co. (The) |
1,494 | 57,474 | ||||||
| Kroger Co. (The) |
1,631 | 66,382 | ||||||
| Lamb Weston Holdings Inc. |
698 | 46,605 | ||||||
| McCormick & Co. Inc./MD, NVS |
751 | 63,212 | ||||||
| Molson Coors Beverage Co., Class B(a) |
993 | 48,548 | ||||||
| Mondelez International Inc., Class A |
1,253 | 79,265 | ||||||
| Monster Beverage Corp.(a) |
2,414 | 227,688 | ||||||
| PepsiCo Inc. |
502 | 78,789 | ||||||
| Philip Morris International Inc. |
631 | 63,157 | ||||||
| Procter & Gamble Co. (The) |
554 | 78,795 | ||||||
| Sysco Corp. |
605 | 44,891 | ||||||
| Tyson Foods Inc., Class A |
788 | 56,310 | ||||||
| Walmart Inc. |
901 | 128,438 | ||||||
| Walgreens Boots Alliance Inc. |
1,172 | 55,260 | ||||||
|
|
|
|||||||
| 3,963,886 | ||||||||
| Energy — 2.0% | ||||||||
| Baker Hughes Co., Class A |
8,018 | 170,302 | ||||||
| Cheniere Energy Inc.(a) |
1,746 | 148,288 | ||||||
| Chevron Corp. |
586 | 59,661 | ||||||
| ConocoPhillips |
1,057 | 59,255 | ||||||
| Devon Energy Corp. |
5,064 | 130,854 | ||||||
| EOG Resources Inc. |
3,307 | 240,948 | ||||||
| Exxon Mobil Corp. |
1,043 | 60,045 | ||||||
| Halliburton Co. |
2,148 | 44,421 | ||||||
| Hess Corp. |
640 | 48,922 | ||||||
| Kinder Morgan Inc. |
7,441 | 129,324 | ||||||
| Marathon Petroleum Corp. |
6,585 | 363,624 | ||||||
| Occidental Petroleum Corp. |
5,999 | 156,574 | ||||||
| ONEOK Inc. |
876 | 45,526 | ||||||
| Phillips 66 |
658 | 48,317 | ||||||
| Pioneer Natural Resources Co. |
420 | 61,055 | ||||||
| Schlumberger Ltd. |
1,696 | 48,896 | ||||||
| Valero Energy Corp. |
391 | 26,185 | ||||||
| Williams Companies Inc. (The) |
2,166 | 54,258 | ||||||
|
|
|
|||||||
| 1,896,455 | ||||||||
| Financials — 14.5% | ||||||||
| Aflac Inc. |
6,292 | 346,060 | ||||||
| AGNC Investment Corp. |
3,255 | 51,657 | ||||||
| Alleghany Corp.(a) |
95 | 62,994 | ||||||
| Allstate Corp. (The) |
466 | 60,603 | ||||||
| Ally Financial Inc. |
3,349 | 172,005 | ||||||
| American Express Co. |
388 | 66,166 | ||||||
| American Financial Group Inc./OH |
438 | 55,403 | ||||||
| American International Group Inc. |
3,127 | 148,063 | ||||||
| Security | Shares | Value | ||||||
| Financials (continued) | ||||||||
| Ameriprise Financial Inc. |
1,698 | $ | 437,337 | |||||
| Annaly Capital Management Inc. |
6,387 | 54,226 | ||||||
| Aon PLC, Class A |
1,918 | 498,738 | ||||||
| Apollo Global Management Inc., Class A |
946 | 55,682 | ||||||
| Arch Capital Group Ltd.(a) |
1,517 | 59,163 | ||||||
| Arthur J Gallagher & Co. |
1,444 | 201,164 | ||||||
| Assurant Inc. |
215 | 33,929 | ||||||
| Athene Holding Ltd., Class A(a) |
888 | 57,383 | ||||||
| Bank of America Corp. |
35,851 | 1,375,244 | ||||||
| Bank of New York Mellon Corp. (The) |
1,262 | 64,778 | ||||||
| Berkshire Hathaway Inc., Class B(a) |
5,616 | 1,562,877 | ||||||
| Blackstone Group Inc. (The), NVS |
3,735 | 430,533 | ||||||
| Brown & Brown Inc. |
1,301 | 70,774 | ||||||
| Capital One Financial Corp. |
2,839 | 459,066 | ||||||
| Carlyle Group Inc. (The) |
2,082 | 105,079 | ||||||
| Cboe Global Markets Inc. |
486 | 57,576 | ||||||
| Charles Schwab Corp. (The) |
7,743 | 526,137 | ||||||
| Cincinnati Financial Corp. |
1,058 | 124,717 | ||||||
| Citigroup Inc. |
1,120 | 75,734 | ||||||
| Citizens Financial Group Inc. |
3,123 | 131,666 | ||||||
| CME Group Inc. |
259 | 54,942 | ||||||
| Discover Financial Services |
432 | 53,706 | ||||||
| Equitable Holdings Inc. |
3,544 | 109,403 | ||||||
| Erie Indemnity Co., Class A, NVS |
490 | 90,596 | ||||||
| Everest Re Group Ltd. |
244 | 61,691 | ||||||
| FactSet Research Systems Inc. |
492 | 175,782 | ||||||
| Fidelity National Financial Inc. |
2,039 | 90,960 | ||||||
| Fifth Third Bancorp |
4,505 | 163,486 | ||||||
| First Republic Bank/CA |
315 | 61,431 | ||||||
| Franklin Resources Inc. |
1,512 | 44,680 | ||||||
| Globe Life Inc. |
1,344 | 125,140 | ||||||
| Goldman Sachs Group Inc. (The) |
858 | 321,647 | ||||||
| Hartford Financial Services Group Inc. (The) |
2,324 | 147,853 | ||||||
| Huntington Bancshares Inc./OH |
3,723 | 52,420 | ||||||
| Intercontinental Exchange Inc. |
582 | 69,741 | ||||||
| Invesco Ltd. |
5,200 | 126,776 | ||||||
| JPMorgan Chase & Co. |
305 | 46,293 | ||||||
| KeyCorp |
2,833 | 55,697 | ||||||
| KKR & Co. Inc. |
1,063 | 67,777 | ||||||
| Lincoln National Corp. |
869 | 53,548 | ||||||
| Loews Corp. |
2,132 | 114,339 | ||||||
| M&T Bank Corp. |
387 | 51,800 | ||||||
| Markel Corp.(a) |
54 | 65,133 | ||||||
| MarketAxess Holdings Inc. |
451 | 214,302 | ||||||
| Marsh & McLennan Companies Inc. |
447 | 65,807 | ||||||
| MetLife Inc. |
3,030 | 174,831 | ||||||
| Moody’s Corp. |
184 | 69,184 | ||||||
| Morgan Stanley |
2,982 | 286,212 | ||||||
| MSCI Inc., Class A |
112 | 66,748 | ||||||
| Nasdaq Inc. |
399 | 74,505 | ||||||
| Northern Trust Corp. |
495 | 55,861 | ||||||
| PNC Financial Services Group Inc. (The) |
2,308 | 421,002 | ||||||
| Principal Financial Group Inc. |
1,025 | 63,683 | ||||||
| Progressive Corp. (The) |
6,016 | 572,483 | ||||||
| Prudential Financial Inc. |
744 | 74,608 | ||||||
| Raymond James Financial Inc. |
1,134 | 146,830 | ||||||
| Regions Financial Corp. |
2,902 | 55,863 | ||||||
| Reinsurance Group of America Inc. |
437 | 48,149 | ||||||
| RenaissanceRe Holdings Ltd. |
396 | 60,465 | ||||||
| S&P Global Inc. |
163 | 69,881 | ||||||
| S C H E D U L E O F I N V E S T M E N T S |
31 |
| Schedule of Investments (continued) July 31, 2021 |
BlackRock U.S. Equity Factor Rotation ETF (Percentages shown are based on Net Assets) |
| Security | Shares | Value | ||||||
| Financials (continued) | ||||||||
| SEI Investments Co. |
2,039 | $ | 123,971 | |||||
| State Street Corp. |
669 | 58,297 | ||||||
| SVB Financial Group(a) |
806 | 443,268 | ||||||
| Synchrony Financial |
1,133 | 53,274 | ||||||
| T Rowe Price Group Inc. |
2,435 | 497,130 | ||||||
| Tradeweb Markets Inc., Class A |
659 | 57,155 | ||||||
| Travelers Companies Inc. (The) |
436 | 64,929 | ||||||
| Truist Financial Corp. |
1,038 | 56,498 | ||||||
| U.S. Bancorp |
1,134 | 62,982 | ||||||
| Voya Financial Inc. |
950 | 61,180 | ||||||
| W R Berkley Corp. |
846 | 61,902 | ||||||
| Wells Fargo & Co. |
6,012 | 276,191 | ||||||
| Willis Towers Watson PLC |
212 | 43,689 | ||||||
|
|
|
|||||||
| 13,930,475 | ||||||||
| Health Care — 12.0% | ||||||||
| 10X Genomics Inc., Class A(a) |
699 | 128,078 | ||||||
| Abbott Laboratories |
485 | 58,675 | ||||||
| AbbVie Inc. |
619 | 71,990 | ||||||
| ABIOMED Inc.(a) |
283 | 92,581 | ||||||
| Agilent Technologies Inc. |
2,280 | 349,364 | ||||||
| Align Technology Inc.(a) |
500 | 347,900 | ||||||
| Alnylam Pharmaceuticals Inc.(a) |
361 | 64,597 | ||||||
| AmerisourceBergen Corp., Class A |
499 | 60,963 | ||||||
| Amgen Inc. |
1,453 | 350,958 | ||||||
| Anthem Inc. |
153 | 58,753 | ||||||
| Avantor Inc.(a) |
3,392 | 127,471 | ||||||
| Baxter International Inc. |
774 | 59,869 | ||||||
| Becton Dickinson and Co. |
252 | 64,449 | ||||||
| Biogen Inc.(a) |
504 | 164,672 | ||||||
| BioMarin Pharmaceutical Inc.(a) |
686 | 52,637 | ||||||
| Bio-Rad Laboratories Inc., Class A(a) |
92 | 68,035 | ||||||
| Bio-Techne Corp. |
349 | 168,302 | ||||||
| Boston Scientific Corp.(a) |
1,422 | 64,843 | ||||||
| Bristol-Myers Squibb Co. |
1,162 | 78,865 | ||||||
| Cardinal Health Inc. |
1,032 | 61,280 | ||||||
| Catalent Inc.(a) |
527 | 63,140 | ||||||
| Centene Corp.(a) |
770 | 52,830 | ||||||
| Cerner Corp. |
904 | 72,672 | ||||||
| Charles River Laboratories International Inc.(a) |
416 | 169,279 | ||||||
| Cigna Corp. |
245 | 56,225 | ||||||
| Cooper Companies Inc. (The) |
271 | 114,300 | ||||||
| CVS Health Corp. |
829 | 68,276 | ||||||
| Danaher Corp. |
239 | 71,100 | ||||||
| DaVita Inc.(a) |
469 | 56,397 | ||||||
| DENTSPLY SIRONA Inc. |
840 | 55,474 | ||||||
| Dexcom Inc.(a) |
146 | 75,264 | ||||||
| Edwards Lifesciences Corp.(a) |
1,810 | 203,209 | ||||||
| Elanco Animal Health Inc.(a) |
1,412 | 51,496 | ||||||
| Eli Lilly & Co. |
2,342 | 570,277 | ||||||
| Exact Sciences Corp.(a) |
496 | 53,489 | ||||||
| Gilead Sciences Inc. |
921 | 62,895 | ||||||
| HCA Healthcare Inc. |
252 | 62,546 | ||||||
| Henry Schein Inc.(a) |
960 | 76,944 | ||||||
| Hologic Inc.(a) |
805 | 60,407 | ||||||
| Horizon Therapeutics PLC(a) |
1,256 | 125,625 | ||||||
| Humana Inc. |
118 | 50,251 | ||||||
| IDEXX Laboratories Inc.(a) |
676 | 458,686 | ||||||
| Illumina Inc.(a) |
125 | 61,969 | ||||||
| Incyte Corp.(a) |
679 | 52,521 | ||||||
| Insulet Corp.(a) |
214 | 59,854 | ||||||
| Security | Shares | Value | ||||||
| Health Care (continued) | ||||||||
| Intuitive Surgical Inc.(a) |
69 | $ | 68,411 | |||||
| IQVIA Holdings Inc.(a) |
260 | 64,402 | ||||||
| Jazz Pharmaceuticals PLC(a) |
319 | 54,077 | ||||||
| Johnson & Johnson |
6,153 | 1,059,547 | ||||||
| Laboratory Corp. of America Holdings(a) |
204 | 60,415 | ||||||
| Masimo Corp.(a) |
246 | 67,008 | ||||||
| McKesson Corp. |
303 | 61,760 | ||||||
| Medtronic PLC |
530 | 69,594 | ||||||
| Merck & Co. Inc. |
7,009 | 538,782 | ||||||
| Mettler-Toledo International Inc.(a) |
131 | 193,056 | ||||||
| Moderna Inc.(a) |
2,882 | 1,019,075 | ||||||
| Molina Healthcare Inc.(a) |
148 | 40,405 | ||||||
| Neurocrine Biosciences Inc.(a) |
560 | 52,198 | ||||||
| Novavax Inc.(a) |
523 | 93,790 | ||||||
| Novocure Ltd.(a) |
627 | 96,564 | ||||||
| Oak Street Health Inc.(a)(b) |
835 | 52,638 | ||||||
| PerkinElmer Inc. |
383 | 69,794 | ||||||
| Pfizer Inc. |
1,875 | 80,269 | ||||||
| PPD Inc.(a) |
1,510 | 69,641 | ||||||
| Quest Diagnostics Inc. |
431 | 61,116 | ||||||
| Regeneron Pharmaceuticals Inc.(a) |
340 | 195,367 | ||||||
| ResMed Inc. |
552 | 150,034 | ||||||
| Royalty Pharma PLC, Class A |
1,254 | 47,903 | ||||||
| Seagen Inc.(a) |
347 | 53,226 | ||||||
| STERIS PLC |
303 | 66,039 | ||||||
| Stryker Corp. |
257 | 69,632 | ||||||
| Teladoc Health Inc.(a) |
341 | 50,621 | ||||||
| Teleflex Inc. |
145 | 57,627 | ||||||
| Thermo Fisher Scientific Inc. |
121 | 65,341 | ||||||
| UnitedHealth Group Inc. |
2,033 | 838,043 | ||||||
| Universal Health Services Inc., Class B |
358 | 57,427 | ||||||
| Veeva Systems Inc., Class A(a) |
477 | 158,703 | ||||||
| Vertex Pharmaceuticals Inc.(a) |
274 | 55,233 | ||||||
| Viatris Inc. |
3,362 | 47,303 | ||||||
| Waters Corp.(a) |
177 | 68,996 | ||||||
| West Pharmaceutical Services Inc. |
331 | 136,283 | ||||||
| Zimmer Biomet Holdings Inc. |
383 | 62,590 | ||||||
| Zoetis Inc. |
1,278 | 259,051 | ||||||
|
|
|
|||||||
| 11,611,369 | ||||||||
| Industrials — 12.2% | ||||||||
| 3M Co. |
3,063 | 606,290 | ||||||
| A O Smith Corp. |
1,488 | 104,651 | ||||||
| Allegion PLC |
864 | 118,022 | ||||||
| AMERCO |
171 | 100,541 | ||||||
| AMETEK Inc. |
574 | 79,815 | ||||||
| Boeing Co. (The)(a) |
197 | 44,617 | ||||||
| Booz Allen Hamilton Holding Corp., Class A |
661 | 56,720 | ||||||
| Carrier Global Corp. |
4,925 | 272,106 | ||||||
| Caterpillar Inc. |
183 | 37,835 | ||||||
| CH Robinson Worldwide Inc. |
1,184 | 105,577 | ||||||
| Cintas Corp. |
167 | 65,828 | ||||||
| Clarivate PLC(a) |
1,670 | 38,076 | ||||||
| Copart Inc.(a) |
1,496 | 219,912 | ||||||
| CoStar Group Inc.(a) |
645 | 57,308 | ||||||
| CSX Corp. |
2,165 | 69,973 | ||||||
| Cummins Inc. |
264 | 61,274 | ||||||
| Deere & Co. |
2,196 | 794,052 | ||||||
| Delta Air Lines Inc.(a) |
1,202 | 47,960 | ||||||
| Dover Corp. |
492 | 82,223 | ||||||
| Eaton Corp. PLC |
509 | 80,447 | ||||||
| 32 | 2 0 2 1 B L A C K R O C K A N N U A L R E P O R T T O S H A R E H O L D E R S |
| Schedule of Investments (continued) July 31, 2021 |
BlackRock U.S. Equity Factor Rotation ETF (Percentages shown are based on Net Assets) |
| Security | Shares | Value | ||||||
| Industrials (continued) | ||||||||
| Emerson Electric Co. |
694 | $ | 70,018 | |||||
| Equifax Inc. |
710 | 185,026 | ||||||
| Expeditors International of Washington Inc. |
1,406 | 180,320 | ||||||
| Fastenal Co. |
4,275 | 234,142 | ||||||
| FedEx Corp. |
198 | 55,430 | ||||||
| Fortive Corp. |
880 | 63,941 | ||||||
| Fortune Brands Home & Security Inc. |
558 | 54,388 | ||||||
| Generac Holdings Inc.(a) |
618 | 259,164 | ||||||
| General Dynamics Corp. |
396 | 77,628 | ||||||
| General Electric Co. |
12,696 | 164,413 | ||||||
| HEICO Corp. |
213 | 28,808 | ||||||
| HEICO Corp., Class A |
198 | 24,015 | ||||||
| Honeywell International Inc. |
303 | 70,838 | ||||||
| Howmet Aerospace Inc.(a) |
3,357 | 110,177 | ||||||
| Huntington Ingalls Industries Inc. |
469 | 96,206 | ||||||
| IDEX Corp. |
308 | 69,821 | ||||||
| IHS Markit Ltd. |
1,852 | 216,388 | ||||||
| Illinois Tool Works Inc. |
1,921 | 435,433 | ||||||
| Ingersoll Rand Inc.(a) |
1,177 | 57,520 | ||||||
| Jacobs Engineering Group Inc. |
441 | 59,645 | ||||||
| JB Hunt Transport Services Inc. |
352 | 59,294 | ||||||
| Johnson Controls International PLC |
4,802 | 342,959 | ||||||
| Kansas City Southern |
829 | 222,006 | ||||||
| Knight-Swift Transportation Holdings Inc. |
1,192 | 59,230 | ||||||
| L3Harris Technologies Inc. |
303 | 68,702 | ||||||
| Leidos Holdings Inc. |
568 | 60,447 | ||||||
| Lennox International Inc. |
177 | 58,309 | ||||||
| Lockheed Martin Corp. |
1,923 | 714,721 | ||||||
| Lyft Inc., Class A(a) |
3,150 | 174,258 | ||||||
| Masco Corp. |
1,005 | 60,009 | ||||||
| Nordson Corp. |
298 | 67,387 | ||||||
| Norfolk Southern Corp. |
245 | 63,168 | ||||||
| Northrop Grumman Corp. |
180 | 65,344 | ||||||
| Old Dominion Freight Line Inc. |
1,041 | 280,185 | ||||||
| Otis Worldwide Corp. |
758 | 67,879 | ||||||
| Owens Corning |
605 | 58,177 | ||||||
| PACCAR Inc. |
723 | 60,002 | ||||||
| Parker-Hannifin Corp. |
199 | 62,094 | ||||||
| Pentair PLC |
889 | 65,493 | ||||||
| Plug Power Inc.(a) |
6,207 | 169,327 | ||||||
| Raytheon Technologies Corp. |
800 | 69,560 | ||||||
| Republic Services Inc., Class A |
719 | 85,101 | ||||||
| Robert Half International Inc. |
1,744 | 171,278 | ||||||
| Rockwell Automation Inc. |
1,000 | 307,420 | ||||||
| Rollins Inc. |
2,673 | 102,456 | ||||||
| Roper Technologies Inc. |
139 | 68,296 | ||||||
| Sensata Technologies Holding PLC(a) |
1,083 | 63,485 | ||||||
| Snap-on Inc. |
460 | 100,271 | ||||||
| Southwest Airlines Co.(a) |
974 | 49,206 | ||||||
| Stanley Black & Decker Inc. |
278 | 54,780 | ||||||
| Sunrun Inc.(a)(b) |
1,191 | 63,087 | ||||||
| Teledyne Technologies Inc.(a) |
140 | 63,388 | ||||||
| Textron Inc. |
2,156 | 148,786 | ||||||
| Trane Technologies PLC |
1,185 | 241,278 | ||||||
| TransDigm Group Inc.(a) |
88 | 56,416 | ||||||
| TransUnion |
561 | 67,354 | ||||||
| Uber Technologies Inc.(a) |
6,548 | 284,576 | ||||||
| Union Pacific Corp. |
302 | 66,066 | ||||||
| United Parcel Service Inc., Class B |
3,283 | 628,235 | ||||||
| United Rentals Inc.(a) |
532 | 175,321 | ||||||
| Security | Shares | Value | ||||||
| Industrials (continued) | ||||||||
| Verisk Analytics Inc., Class A |
360 | $ | 68,378 | |||||
| Waste Connections Inc. |
584 | 73,987 | ||||||
| Waste Management Inc. |
575 | 85,250 | ||||||
| Westinghouse Air Brake Technologies Corp. |
759 | 64,416 | ||||||
| WW Grainger Inc. |
384 | 170,719 | ||||||
| XPO Logistics Inc.(a) |
372 | 51,593 | ||||||
| Xylem Inc./NY |
545 | 68,588 | ||||||
|
|
|
|||||||
| 11,784,830 | ||||||||
| Information Technology — 23.6% | ||||||||
| Accenture PLC, Class A |
1,619 | 514,324 | ||||||
| Adobe Inc.(a) |
1,202 | 747,199 | ||||||
| Advanced Micro Devices Inc.(a) |
627 | 66,581 | ||||||
| Akamai Technologies Inc.(a)(b) |
466 | 55,883 | ||||||
| Amphenol Corp., Class A |
1,069 | 77,492 | ||||||
| Analog Devices Inc. |
453 | 75,841 | ||||||
| ANSYS Inc.(a) |
173 | 63,744 | ||||||
| Apple Inc. |
8,419 | 1,227,995 | ||||||
| Applied Materials Inc. |
9,831 | 1,375,652 | ||||||
| Arista Networks Inc.(a) |
161 | 61,243 | ||||||
| Arrow Electronics Inc.(a) |
867 | 102,800 | ||||||
| Autodesk Inc.(a) |
594 | 190,751 | ||||||
| Automatic Data Processing Inc. |
1,319 | 276,502 | ||||||
| Avalara Inc.(a) |
419 | 70,044 | ||||||
| Bentley Systems Inc., Class B(b) |
1,370 | 83,310 | ||||||
| Black Knight Inc.(a) |
861 | 71,299 | ||||||
| Broadcom Inc. |
134 | 65,044 | ||||||
| Broadridge Financial Solutions Inc. |
382 | 66,273 | ||||||
| Cadence Design Systems Inc.(a) |
1,039 | 153,408 | ||||||
| CDW Corp./DE |
357 | 65,456 | ||||||
| Ceridian HCM Holding Inc.(a) |
588 | 57,859 | ||||||
| Cisco Systems Inc. |
10,078 | 558,019 | ||||||
| Citrix Systems Inc. |
440 | 44,330 | ||||||
| Cloudflare Inc., Class A(a)(b) |
2,579 | 305,947 | ||||||
| Cognex Corp. |
726 | 65,638 | ||||||
| Cognizant Technology Solutions Corp., Class A |
890 | 65,442 | ||||||
| Corning Inc. |
1,488 | 62,288 | ||||||
| Coupa Software Inc.(a) |
217 | 47,089 | ||||||
| Crowdstrike Holdings Inc., Class A(a) |
1,623 | 411,609 | ||||||
| Datadog Inc., Class A(a) |
572 | 63,320 | ||||||
| Dell Technologies Inc., Class C(a) |
2,016 | 194,786 | ||||||
| DocuSign Inc., Class A(a) |
248 | 73,914 | ||||||
| Dropbox Inc., Class A(a) |
1,961 | 61,752 | ||||||
| Dynatrace Inc.(a) |
1,655 | 105,705 | ||||||
| Enphase Energy Inc.(a) |
392 | 74,323 | ||||||
| EPAM Systems Inc.(a) |
404 | 226,159 | ||||||
| F5 Networks Inc.(a) |
315 | 65,051 | ||||||
| Fair Isaac Corp.(a) |
193 | 101,115 | ||||||
| Fidelity National Information Services Inc. |
499 | 74,376 | ||||||
| Fiserv Inc.(a) |
581 | 66,879 | ||||||
| FleetCor Technologies Inc.(a) |
211 | 54,484 | ||||||
| Fortinet Inc.(a) |
1,231 | 335,127 | ||||||
| Gartner Inc.(a) |
233 | 61,682 | ||||||
| Global Payments Inc. |
315 | 60,924 | ||||||
| GoDaddy Inc., Class A(a) |
671 | 56,263 | ||||||
| Guidewire Software Inc.(a) |
591 | 68,083 | ||||||
| Hewlett Packard Enterprise Co. |
10,684 | 154,918 | ||||||
| HP Inc. |
10,046 | 290,028 | ||||||
| HubSpot Inc.(a) |
366 | 218,143 | ||||||
| Intel Corp. |
9,906 | 532,150 | ||||||
| International Business Machines Corp. |
586 | 82,603 | ||||||
| S C H E D U L E O F I N V E S T M E N T S |
33 |
| Schedule of Investments (continued) July 31, 2021 |
BlackRock U.S. Equity Factor Rotation ETF (Percentages shown are based on Net Assets) |
| Security | Shares | Value | ||||||
| Information Technology (continued) | ||||||||
| Intuit Inc. |
619 | $ | 328,051 | |||||
| IPG Photonics Corp.(a) |
276 | 60,212 | ||||||
| Jack Henry & Associates Inc. |
501 | 87,219 | ||||||
| Juniper Networks Inc. |
2,436 | 68,549 | ||||||
| Keysight Technologies Inc.(a) |
416 | 68,453 | ||||||
| KLA Corp. |
1,147 | 399,340 | ||||||
| Lam Research Corp. |
1,145 | 729,834 | ||||||
| Marvell Technology Inc. |
1,135 | 68,679 | ||||||
| Mastercard Inc., Class A |
2,513 | 969,867 | ||||||
| Maxim Integrated Products Inc. |
1,258 | 125,687 | ||||||
| Microchip Technology Inc. |
404 | 57,820 | ||||||
| Micron Technology Inc.(a) |
998 | 77,425 | ||||||
| Microsoft Corp. |
4,393 | 1,251,610 | ||||||
| MongoDB Inc., Class A(a)(b) |
182 | 65,323 | ||||||
| Monolithic Power Systems Inc. |
257 | 115,460 | ||||||
| Motorola Solutions Inc. |
276 | 61,802 | ||||||
| NetApp Inc. |
1,662 | 132,279 | ||||||
| NortonLifeLock Inc. |
1,978 | 49,094 | ||||||
| NVIDIA Corp. |
5,029 | 980,605 | ||||||
| NXP Semiconductors NV |
1,250 | 257,987 | ||||||
| Okta Inc.(a) |
218 | 54,018 | ||||||
| ON Semiconductor Corp.(a) |
1,560 | 60,934 | ||||||
| Oracle Corp. |
643 | 56,031 | ||||||
| Palantir Technologies Inc., Class A(a) |
6,690 | 145,240 | ||||||
| Palo Alto Networks Inc.(a) |
572 | 228,257 | ||||||
| Paychex Inc. |
1,332 | 151,608 | ||||||
| Paycom Software Inc.(a) |
252 | 100,800 | ||||||
| PayPal Holdings Inc.(a) |
4,833 | 1,331,636 | ||||||
| PTC Inc.(a) |
441 | 59,733 | ||||||
| Qorvo Inc.(a) |
783 | 148,449 | ||||||
| QUALCOMM Inc. |
411 | 61,568 | ||||||
| RingCentral Inc., Class A(a)(b) |
206 | 55,058 | ||||||
| salesforce.com Inc.(a) |
322 | 77,901 | ||||||
| Seagate Technology Holdings PLC |
2,024 | 177,910 | ||||||
| ServiceNow Inc.(a) |
110 | 64,668 | ||||||
| Skyworks Solutions Inc. |
688 | 126,943 | ||||||
| Snowflake Inc., Class A(a) |
212 | 56,333 | ||||||
| SolarEdge Technologies Inc.(a) |
220 | 57,086 | ||||||
| Splunk Inc.(a) |
436 | 61,903 | ||||||
| Square Inc., Class A(a) |
2,147 | 530,867 | ||||||
| SS&C Technologies Holdings Inc. |
947 | 74,235 | ||||||
| Synopsys Inc.(a) |
250 | 71,998 | ||||||
| TE Connectivity Ltd. |
539 | 79,486 | ||||||
| Teradyne Inc. |
829 | 105,283 | ||||||
| Texas Instruments Inc. |
2,785 | 530,877 | ||||||
| Trade Desk Inc. (The), Class A(a) |
623 | 51,030 | ||||||
| Trimble Inc.(a) |
2,180 | 186,390 | ||||||
| Twilio Inc., Class A(a) |
650 | 242,834 | ||||||
| Tyler Technologies Inc.(a) |
133 | 65,521 | ||||||
| Unity Software Inc.(a) |
525 | 56,238 | ||||||
| VeriSign Inc.(a) |
278 | 60,151 | ||||||
| Visa Inc., Class A |
3,576 | 881,091 | ||||||
| VMware Inc., Class A(a)(b) |
318 | 48,889 | ||||||
| Western Digital Corp.(a) |
737 | 47,853 | ||||||
| Western Union Co. (The) |
2,316 | 53,754 | ||||||
| Workday Inc., Class A(a) |
224 | 52,506 | ||||||
| Xilinx Inc. |
936 | 140,250 | ||||||
| Zebra Technologies Corp., Class A(a) |
388 | 214,362 | ||||||
| Zendesk Inc.(a) |
428 | 55,867 | ||||||
| Zoom Video Communications Inc., Class A(a) |
146 | 55,203 | ||||||
| Security | Shares | Value | ||||||
| Information Technology (continued) | ||||||||
| Zscaler Inc.(a) |
285 | $ | 67,234 | |||||
|
|
|
|||||||
| 22,754,138 | ||||||||
| Materials — 3.4% | ||||||||
| Air Products & Chemicals Inc. |
922 | 268,330 | ||||||
| Albemarle Corp. |
1,005 | 207,070 | ||||||
| Amcor PLC |
4,970 | 57,453 | ||||||
| Avery Dennison Corp. |
1,014 | 213,629 | ||||||
| Ball Corp. |
686 | 55,484 | ||||||
| Celanese Corp., Class A |
806 | 125,551 | ||||||
| CF Industries Holdings Inc. |
1,838 | 86,845 | ||||||
| Corteva Inc. |
1,284 | 54,930 | ||||||
| Crown Holdings Inc. |
589 | 58,759 | ||||||
| Dow Inc. |
775 | 48,174 | ||||||
| DuPont de Nemours Inc. |
687 | 51,559 | ||||||
| Eastman Chemical Co. |
516 | 58,164 | ||||||
| Ecolab Inc. |
288 | 63,599 | ||||||
| FMC Corp. |
555 | 59,357 | ||||||
| Freeport-McMoRan Inc. |
5,011 | 190,919 | ||||||
| International Flavors & Fragrances Inc. |
402 | 60,557 | ||||||
| International Paper Co. |
924 | 53,370 | ||||||
| Linde PLC |
237 | 72,851 | ||||||
| LyondellBasell Industries NV, Class A |
520 | 51,652 | ||||||
| Martin Marietta Materials Inc. |
363 | 131,878 | ||||||
| Mosaic Co. (The) |
3,600 | 112,428 | ||||||
| Newmont Corp. |
935 | 58,737 | ||||||
| Nucor Corp. |
1,787 | 185,884 | ||||||
| Packaging Corp. of America |
394 | 55,751 | ||||||
| PPG Industries Inc. |
1,177 | 192,463 | ||||||
| RPM International Inc. |
695 | 60,180 | ||||||
| Sealed Air Corp. |
992 | 56,296 | ||||||
| Sherwin-Williams Co. (The) |
1,245 | 362,332 | ||||||
| Steel Dynamics Inc. |
2,120 | 136,634 | ||||||
| Vulcan Materials Co. |
284 | 51,117 | ||||||
| Westrock Co. |
912 | 44,880 | ||||||
|
|
|
|||||||
| 3,286,833 | ||||||||
| Real Estate — 3.5% | ||||||||
| Alexandria Real Estate Equities Inc. |
368 | 74,093 | ||||||
| American Tower Corp. |
223 | 63,064 | ||||||
| AvalonBay Communities Inc. |
659 | 150,140 | ||||||
| Boston Properties Inc. |
525 | 61,624 | ||||||
| Camden Property Trust |
539 | 80,521 | ||||||
| CBRE Group Inc., Class A(a) |
3,274 | 315,810 | ||||||
| Crown Castle International Corp. |
306 | 59,086 | ||||||
| Digital Realty Trust Inc. |
343 | 52,877 | ||||||
| Duke Realty Corp. |
2,323 | 118,194 | ||||||
| Equinix Inc. |
75 | 61,531 | ||||||
| Equity LifeStyle Properties Inc. |
938 | 78,604 | ||||||
| Equity Residential |
1,643 | 138,226 | ||||||
| Essex Property Trust Inc. |
358 | 117,460 | ||||||
| Extra Space Storage Inc. |
397 | 69,134 | ||||||
| Healthpeak Properties Inc. |
1,888 | 69,799 | ||||||
| Host Hotels & Resorts Inc.(a) |
3,006 | 47,886 | ||||||
| Invitation Homes Inc. |
1,695 | 68,953 | ||||||
| Iron Mountain Inc. |
1,249 | 54,656 | ||||||
| Medical Properties Trust Inc. |
2,966 | 62,375 | ||||||
| Mid-America Apartment Communities Inc. |
406 | 78,399 | ||||||
| Omega Healthcare Investors Inc. |
1,534 | 55,654 | ||||||
| Prologis Inc. |
2,513 | 321,765 | ||||||
| Public Storage |
817 | 255,296 | ||||||
| 34 | 2 0 2 1 B L A C K R O C K A N N U A L R E P O R T T O S H A R E H O L D E R S |
| Schedule of Investments (continued) July 31, 2021 |
BlackRock U.S. Equity Factor Rotation ETF (Percentages shown are based on Net Assets) |
| Security | Shares | Value | ||||||
| Real Estate (continued) | ||||||||
| Realty Income Corp. |
1,853 | $ | 130,247 | |||||
| Regency Centers Corp. |
891 | 58,280 | ||||||
| SBA Communications Corp., Class A |
190 | 64,788 | ||||||
| Simon Property Group Inc. |
441 | 55,795 | ||||||
| Sun Communities Inc. |
383 | 75,110 | ||||||
| UDR Inc. |
1,341 | 73,742 | ||||||
| Ventas Inc. |
928 | 55,476 | ||||||
| VEREIT Inc. |
1,255 | 61,457 | ||||||
| VICI Properties Inc. |
3,070 | 95,753 | ||||||
| Vornado Realty Trust |
1,212 | 52,722 | ||||||
| Welltower Inc. |
676 | 58,717 | ||||||
| Weyerhaeuser Co. |
1,503 | 50,696 | ||||||
| WP Carey Inc. |
853 | 68,829 | ||||||
|
|
|
|||||||
| 3,356,759 | ||||||||
| Utilities — 3.0% | ||||||||
| AES Corp. (The) |
4,884 | 115,751 | ||||||
| Alliant Energy Corp. |
8,061 | 471,810 | ||||||
| Ameren Corp. |
856 | 71,836 | ||||||
| American Electric Power Co. Inc. |
766 | 67,500 | ||||||
| American Water Works Co. Inc. |
411 | 69,915 | ||||||
| Atmos Energy Corp. |
4,671 | 460,514 | ||||||
| CenterPoint Energy Inc. |
2,192 | 55,808 | ||||||
| CMS Energy Corp. |
1,064 | 65,745 | ||||||
| Consolidated Edison Inc. |
732 | 54,000 | ||||||
| Dominion Energy Inc. |
875 | 65,511 | ||||||
| DTE Energy Co. |
539 | 63,235 | ||||||
| Duke Energy Corp. |
646 | 67,901 | ||||||
| Edison International |
1,114 | 60,713 | ||||||
| Entergy Corp. |
596 | 61,340 | ||||||
| Essential Utilities Inc. |
1,367 | 67,147 | ||||||
| Evergy Inc. |
1,043 | 68,024 | ||||||
| Eversource Energy |
740 | 63,840 | ||||||
| Exelon Corp. |
1,644 | 76,939 | ||||||
| FirstEnergy Corp. |
1,448 | 55,487 | ||||||
| NextEra Energy Inc. |
901 | 70,188 | ||||||
| NiSource Inc. |
2,548 | 63,114 | ||||||
| NRG Energy Inc. |
1,561 | 64,376 | ||||||
| Security | Shares | Value | ||||||
| Utilities (continued) | ||||||||
| PG&E Corp.(a) |
4,910 | $ | 43,159 | |||||
| Pinnacle West Capital Corp. |
721 | 60,240 | ||||||
| PPL Corp. |
2,216 | 62,868 | ||||||
| Public Service Enterprise Group Inc. |
1,061 | 66,026 | ||||||
| Sempra Energy |
462 | 60,360 | ||||||
| Southern Co. (The) |
1,156 | 73,834 | ||||||
| UGI Corp. |
1,462 | 67,237 | ||||||
| Vistra Corp. |
3,404 | 65,187 | ||||||
| WEC Energy Group Inc. |
657 | 61,850 | ||||||
| Xcel Energy Inc. |
919 | 62,722 | ||||||
|
|
|
|||||||
| 2,904,177 | ||||||||
|
|
|
|||||||
| Total Common Stocks — 99.8% |
96,135,068 | |||||||
|
|
|
|||||||
| Short-Term Investments |
||||||||
| Money Market Funds — 1.0% | ||||||||
| BlackRock Cash Funds: Institutional, |
637,047 | 637,365 | ||||||
| BlackRock Cash Funds: Treasury, |
282,000 | 282,000 | ||||||
|
|
|
|||||||
| 919,365 | ||||||||
|
|
|
|||||||
| Total Short-Term Investments — 1.0% |
919,365 | |||||||
|
|
|
|||||||
| Total Investments In Securities — 100.8% |
97,054,433 | |||||||
| Other Assets, Less Liabilities — (0.8)% |
(766,248 | ) | ||||||
|
|
|
|||||||
| Net Assets — 100.0% |
$ | 96,288,185 | ||||||
|
|
|
|||||||
| (a) | Non-income producing security. |
| (b) | All or a portion of this security is on loan. |
| (c) | Affiliate of the Fund. |
| (d) | Annualized 7-day yield as of period-end. |
| (e) | All or a portion of this security was purchased with cash collateral received from loaned securities. |
Affiliates
Investments in issuers considered to be affiliate(s) of the Fund during the year ended July 31, 2021 for purposes of Section 2(a)(3) of the Investment Company Act of 1940, as amended, were as follows:
| Affiliated Issuer | Value at 07/31/20 |
Purchases at Cost |
Proceeds from Sales |
Net Realized Gain (Loss) |
Change in Unrealized Appreciation (Depreciation) |
Value at 07/31/21 |
Shares Held at 07/31/21 |
Income | Capital Gain Distributions from Underlying Funds |
|||||||||||||||||||||||||||
| BlackRock Cash Funds: Institutional, SL Agency Shares |
$ | 677,741 | $ | — | $ | (40,028 | )(a) | $ | (117 | ) | $ | (231 | ) | $ | 637,365 | 637,047 | $ | 1,922 | (b) | $ | — | |||||||||||||||
| BlackRock Cash Funds: Treasury, SL Agency Shares |
132,000 | 150,000 | (a) | — | — | — | 282,000 | 282,000 | 63 | — | ||||||||||||||||||||||||||
|
|
|
|
|
|
|
|
|
|
|
|||||||||||||||||||||||||||
| $ | (117 | ) | $ | (231 | ) | $ | 919,365 | $ | 1,985 | $ | — | |||||||||||||||||||||||||
|
|
|
|
|
|
|
|
|
|
|
|||||||||||||||||||||||||||
| (a) | Represents net amount purchased (sold). |
| (b) | All or a portion represents securities lending income earned from the reinvestment of cash collateral from loaned securities, net of fees and collateral investment expenses, and other payments to and from borrowers of securities. |
| S C H E D U L E O F I N V E S T M E N T S |
35 |
| Schedule of Investments (continued) July 31, 2021 |
BlackRock U.S. Equity Factor Rotation ETF |
Fair Value Measurements
Various inputs are used in determining the fair value of financial instruments. For description of the input levels and information about the Fund’s policy regarding valuation of financial instruments, refer to the Notes to Financial Statements.
The following table summarizes the value of the Fund’s investments according to the fair value hierarchy as of July 31, 2021. The breakdown of the Fund’s investments into major categories is disclosed in the Schedule of Investments above.
| Level 1 | Level 2 | Level 3 | Total | |||||||||||||
| Investments |
||||||||||||||||
| Assets |
||||||||||||||||
| Common Stocks |
$ | 96,135,068 | $ | — | $ | — | $ | 96,135,068 | ||||||||
| Money Market Funds |
919,365 | — | — | 919,365 | ||||||||||||
|
|
|
|
|
|
|
|
|
|||||||||
| $ | 97,054,433 | $ | — | $ | — | $ | 97,054,433 | |||||||||
|
|
|
|
|
|
|
|
|
|||||||||
See notes to financial statements.
| 36 | 2 0 2 1 B L A C K R O C K A N N U A L R E P O R T T O S H A R E H O L D E R S |
| Schedule of Investments July 31, 2021 |
BlackRock World ex U.S. Carbon Transition Readiness ETF (Percentages shown are based on Net Assets) |
| Security | Shares | Value | ||||||
| Common Stocks |
||||||||
| Australia — 7.2% | ||||||||
| ASX Ltd. |
1,680 | $ | 95,171 | |||||
| Australia & New Zealand Banking Group Ltd. |
115,584 | 2,353,126 | ||||||
| BlueScope Steel Ltd. |
35,280 | 625,632 | ||||||
| Brambles Ltd. |
236,712 | 2,026,650 | ||||||
| Cochlear Ltd. |
31,920 | 5,774,931 | ||||||
| Commonwealth Bank of Australia |
60,480 | 4,433,672 | ||||||
| CSL Ltd. |
15,301 | 3,257,439 | ||||||
| Glencore PLC |
420,168 | 1,887,037 | ||||||
| Insurance Australia Group Ltd. |
50,064 | 178,536 | ||||||
| Macquarie Group Ltd. |
15,960 | 1,842,876 | ||||||
| Magellan Financial Group Ltd. |
5,712 | 206,084 | ||||||
| National Australia Bank Ltd. |
124,656 | 2,377,158 | ||||||
| Oil Search Ltd. |
257,880 | 720,771 | ||||||
| Qantas Airways Ltd.(a) |
229,320 | 773,043 | ||||||
| QBE Insurance Group Ltd. |
68,712 | 550,651 | ||||||
| Ramsay Health Care Ltd. |
5,544 | 262,197 | ||||||
| Rio Tinto Ltd. |
23,520 | 2,305,194 | ||||||
| Rio Tinto PLC |
46,536 | 3,952,787 | ||||||
| Seek Ltd. |
46,368 | 1,003,030 | ||||||
| Sonic Healthcare Ltd. |
4,536 | 134,022 | ||||||
| Stockland |
115,920 | 374,899 | ||||||
| Suncorp Group Ltd. |
65,352 | 555,025 | ||||||
| Tabcorp Holdings Ltd. |
130,368 | 475,857 | ||||||
| Treasury Wine Estates Ltd. |
70,392 | 617,459 | ||||||
| Wesfarmers Ltd. |
66,696 | 3,007,099 | ||||||
| Westpac Banking Corp. |
132,888 | 2,386,993 | ||||||
| Woodside Petroleum Ltd. |
82,824 | 1,330,481 | ||||||
|
|
|
|||||||
| 43,507,820 | ||||||||
| Austria — 0.2% | ||||||||
| Erste Group Bank AG |
6,760 | 261,954 | ||||||
| Verbund AG |
10,080 | 929,776 | ||||||
|
|
|
|||||||
| 1,191,730 | ||||||||
| Belgium — 1.0% | ||||||||
| Ageas SA/NV |
6,552 | 345,983 | ||||||
| Anheuser-Busch InBev SA/NV |
79,800 | 5,036,345 | ||||||
| KBC Group NV |
8,359 | 673,089 | ||||||
|
|
|
|||||||
| 6,055,417 | ||||||||
| Canada — 10.2% | ||||||||
| Alimentation Couche-Tard Inc., Class B |
34,440 | 1,388,256 | ||||||
| Ballard Power Systems Inc.(a) |
40,488 | 655,545 | ||||||
| Bank of Montreal |
22,008 | 2,179,103 | ||||||
| Bank of Nova Scotia (The) |
41,832 | 2,610,979 | ||||||
| BlackBerry Ltd.(a) |
25,368 | 258,235 | ||||||
| Brookfield Asset Management Inc., Class A |
138,432 | 7,473,064 | ||||||
| CAE Inc.(a) |
7,896 | 240,943 | ||||||
| Cameco Corp. |
18,144 | 322,712 | ||||||
| Canadian Imperial Bank of Commerce |
12,264 | 1,426,049 | ||||||
| Enbridge Inc. |
151,368 | 5,966,879 | ||||||
| Fairfax Financial Holdings Ltd. |
1,176 | 495,379 | ||||||
| Franco-Nevada Corp. |
36,792 | 5,884,774 | ||||||
| Great-West Lifeco Inc. |
18,648 | 561,114 | ||||||
| Hydro One Ltd.(b) |
154,392 | 3,811,537 | ||||||
| iA Financial Corp. Inc. |
6,048 | 334,589 | ||||||
| IGM Financial Inc. |
4,872 | 171,941 | ||||||
| Intact Financial Corp. |
3,864 | 526,515 | ||||||
| Keyera Corp. |
27,384 | 733,108 | ||||||
| Manulife Financial Corp. |
110,880 | 2,143,656 | ||||||
| National Bank of Canada |
8,400 | 642,927 | ||||||
| Security | Shares | Value | ||||||
| Canada (continued) | ||||||||
| Northland Power Inc. |
45,719 | $ | 1,604,343 | |||||
| Onex Corp. |
2,352 | 179,284 | ||||||
| Open Text Corp. |
17,976 | 933,669 | ||||||
| Parkland Corp./Canada |
16,968 | 540,076 | ||||||
| Power Corp. of Canada |
23,352 | 745,332 | ||||||
| RioCan REIT |
87,024 | 1,575,723 | ||||||
| Royal Bank of Canada |
43,680 | 4,417,716 | ||||||
| Shopify Inc., Class A(a) |
3,528 | 5,296,525 | ||||||
| Sun Life Financial Inc. |
21,672 | 1,128,765 | ||||||
| TC Energy Corp. |
41,328 | 2,014,723 | ||||||
| Toronto-Dominion Bank (The) |
61,152 | 4,065,853 | ||||||
| West Fraser Timber Co. Ltd. |
1,344 | 96,405 | ||||||
| Wheaton Precious Metals Corp. |
22,344 | 1,032,129 | ||||||
| WSP Global Inc. |
1,176 | 139,591 | ||||||
|
|
|
|||||||
| 61,597,439 | ||||||||
| Denmark — 2.8% | ||||||||
| Carlsberg A/S, Class B |
12,432 | 2,297,252 | ||||||
| DSV Panalpina A/S |
25,536 | 6,224,779 | ||||||
| GN Store Nord A/S |
672 | 58,890 | ||||||
| Novozymes A/S, Class B |
31,416 | 2,468,191 | ||||||
| Orsted A/S(b) |
11,424 | 1,694,409 | ||||||
| Vestas Wind Systems A/S |
109,200 | 4,026,700 | ||||||
|
|
|
|||||||
| 16,770,221 | ||||||||
| Finland — 1.2% | ||||||||
| Neste OYJ |
5,208 | 320,140 | ||||||
| Nokia OYJ(a) |
118,104 | 725,671 | ||||||
| Orion OYJ, Class B |
67,032 | 2,853,248 | ||||||
| Sampo OYJ, Class A |
6,384 | 307,253 | ||||||
| Stora Enso OYJ, Class R |
25,536 | 505,656 | ||||||
| UPM-Kymmene OYJ |
22,848 | 933,692 | ||||||
| Wartsila OYJ Abp |
100,632 | 1,515,970 | ||||||
|
|
|
|||||||
| 7,161,630 | ||||||||
| France — 9.4% | ||||||||
| Air Liquide SA |
2,352 | 409,033 | ||||||
| Airbus SE(a) |
16,464 | 2,258,344 | ||||||
| Atos SE |
6,384 | 305,300 | ||||||
| AXA SA |
72,072 | 1,866,450 | ||||||
| BioMerieux |
9,240 | 1,101,744 | ||||||
| BNP Paribas SA |
42,840 | 2,612,346 | ||||||
| Bollore SA |
278,208 | 1,554,716 | ||||||
| Bouygues SA |
2,688 | 103,599 | ||||||
| Capgemini SE |
10,920 | 2,360,387 | ||||||
| Carrefour SA |
70,056 | 1,301,239 | ||||||
| Cie. de Saint-Gobain |
19,656 | 1,404,976 | ||||||
| Cie. Generale des Etablissements Michelin SCA |
8,904 | 1,454,400 | ||||||
| CNP Assurances |
11,592 | 197,043 | ||||||
| Credit Agricole SA |
52,752 | 735,548 | ||||||
| Dassault Systemes SE |
27,888 | 1,538,363 | ||||||
| Electricite de France SA |
45,024 | 546,571 | ||||||
| Gecina SA |
2,520 | 399,649 | ||||||
| Getlink SE |
115,920 | 1,856,874 | ||||||
| Hermes International |
336 | 513,669 | ||||||
| Ipsen SA |
7,560 | 807,865 | ||||||
| Kering SA |
1,680 | 1,507,193 | ||||||
| Klepierre SA |
24,024 | 581,668 | ||||||
| La Francaise des Jeux SAEM(b) |
30,912 | 1,652,610 | ||||||
| Legrand SA |
35,616 | 4,013,776 | ||||||
| L’Oreal SA |
5,208 | 2,382,626 | ||||||
| LVMH Moet Hennessy Louis Vuitton SE |
7,896 | 6,322,067 | ||||||
| S C H E D U L E O F I N V E S T M E N T S |
37 |
| Schedule of Investments (continued) July 31, 2021 |
BlackRock World ex U.S. Carbon Transition Readiness ETF (Percentages shown are based on Net Assets) |
| Security | Shares | Value | ||||||
| France (continued) | ||||||||
| Pernod Ricard SA |
1,680 | $ | 370,787 | |||||
| Publicis Groupe SA |
5,880 | 371,208 | ||||||
| Remy Cointreau SA |
672 | 147,619 | ||||||
| Renault SA(a) |
10,584 | 401,987 | ||||||
| Sanofi |
41,832 | 4,311,758 | ||||||
| Sartorius Stedim Biotech |
672 | 383,607 | ||||||
| SEB SA |
1,848 | 307,060 | ||||||
| Societe Generale SA |
34,104 | 998,760 | ||||||
| Teleperformance |
5,208 | 2,196,717 | ||||||
| Thales SA |
2,688 | 282,118 | ||||||
| TotalEnergies SE |
90,384 | 3,941,349 | ||||||
| Vinci SA |
7,056 | 747,050 | ||||||
| Vivendi SE |
4,704 | 158,931 | ||||||
| Worldline SA(a)(b) |
25,872 | 2,421,620 | ||||||
|
|
|
|||||||
| 56,828,627 | ||||||||
| Germany — 6.8% | ||||||||
| adidas AG |
4,872 | 1,768,309 | ||||||
| Allianz SE, Registered |
10,584 | 2,630,794 | ||||||
| BASF SE |
11,760 | 924,082 | ||||||
| Bayer AG, Registered |
46,536 | 2,772,568 | ||||||
| Bayerische Motoren Werke AG |
15,288 | 1,520,105 | ||||||
| Bechtle AG |
840 | 173,446 | ||||||
| Commerzbank AG(a) |
18,112 | 116,640 | ||||||
| Daimler AG, Registered |
37,128 | 3,313,281 | ||||||
| Delivery Hero SE(a)(b) |
672 | 100,459 | ||||||
| Deutsche Bank AG, Registered(a) |
60,480 | 762,426 | ||||||
| Deutsche Boerse AG |
1,712 | 285,671 | ||||||
| Deutsche Post AG, Registered |
2,688 | 182,169 | ||||||
| Deutsche Telekom AG, Registered |
208,152 | 4,320,017 | ||||||
| Evonik Industries AG |
1,848 | 64,255 | ||||||
| Fresenius SE & Co. KGaA |
7,560 | 397,353 | ||||||
| HeidelbergCement AG |
21,504 | 1,905,635 | ||||||
| HelloFresh SE(a) |
2,688 | 251,971 | ||||||
| Henkel AG & Co. KGaA |
9,408 | 855,422 | ||||||
| Infineon Technologies AG |
62,664 | 2,394,650 | ||||||
| KION Group AG |
5,040 | 535,218 | ||||||
| LANXESS AG |
5,208 | 377,182 | ||||||
| Muenchener Rueckversicherungs-Gesellschaft AG in Muenchen, Registered |
3,192 | 861,278 | ||||||
| SAP SE |
31,584 | 4,532,659 | ||||||
| Siemens AG, Registered |
31,752 | 4,954,360 | ||||||
| Siemens Healthineers AG(b) |
10,584 | 698,770 | ||||||
| Telefonica Deutschland Holding AG |
33,096 | 89,212 | ||||||
| United Internet AG, Registered |
47,208 | 1,953,812 | ||||||
| Volkswagen AG |
1,848 | 613,326 | ||||||
| Zalando SE(a)(b) |
17,808 | 1,978,688 | ||||||
|
|
|
|||||||
| 41,333,758 | ||||||||
| Hong Kong — 2.6% | ||||||||
| AIA Group Ltd. |
537,600 | 6,432,793 | ||||||
| Bank of East Asia Ltd. (The) |
67,200 | 110,721 | ||||||
| BOC Hong Kong Holdings Ltd. |
252,000 | 809,243 | ||||||
| Budweiser Brewing Co. APAC Ltd.(b) |
588,000 | 1,640,998 | ||||||
| Futu Holdings Ltd., ADR(a) |
4,368 | 447,545 | ||||||
| Galaxy Entertainment Group Ltd.(a) |
13,000 | 88,102 | ||||||
| Hang Seng Bank Ltd. |
50,400 | 965,233 | ||||||
| Melco Resorts & Entertainment Ltd., ADR(a) |
10,416 | 144,991 | ||||||
| MTR Corp. Ltd. |
357,500 | 2,119,492 | ||||||
| Swire Pacific Ltd., Class A |
124,000 | 770,267 | ||||||
| WH Group Ltd.(b) |
1,008,000 | 835,195 | ||||||
| Security | Shares | Value | ||||||
| Hong Kong (continued) | ||||||||
| Wynn Macau Ltd.(a) |
201,600 | $ | 258,372 | |||||
| Xinyi Glass Holdings Ltd. |
336,000 | 1,255,753 | ||||||
|
|
|
|||||||
| 15,878,705 | ||||||||
| Ireland — 0.1% | ||||||||
| Kerry Group PLC, Class A |
3,528 | 523,136 | ||||||
| Smurfit Kappa Group PLC |
4,368 | 246,416 | ||||||
|
|
|
|||||||
| 769,552 | ||||||||
| Israel — 0.4% | ||||||||
| Bank Hapoalim BM(a) |
37,128 | 295,462 | ||||||
| Bank Leumi Le-Israel BM(a) |
46,032 | 351,739 | ||||||
| Israel Discount Bank Ltd., Class A(a) |
26,880 | 125,919 | ||||||
| Mizrahi Tefahot Bank Ltd.(a) |
3,360 | 101,827 | ||||||
| Nice Ltd.(a) |
3,528 | 981,782 | ||||||
| Teva Pharmaceutical Industries Ltd., ADR(a) |
45,024 | 434,482 | ||||||
| Wix.com Ltd.(a) |
840 | 250,858 | ||||||
|
|
|
|||||||
| 2,542,069 | ||||||||
| Italy — 1.9% | ||||||||
| Amplifon SpA |
23,520 | 1,161,523 | ||||||
| Assicurazioni Generali SpA |
17,640 | 351,709 | ||||||
| Atlantia SpA(a) |
66,024 | 1,197,575 | ||||||
| CNH Industrial NV |
32,592 | 544,207 | ||||||
| Enel SpA |
668,976 | 6,164,967 | ||||||
| Intesa Sanpaolo SpA |
472,920 | 1,306,463 | ||||||
| Poste Italiane SpA(b) |
10,080 | 133,383 | ||||||
| UniCredit SpA |
74,592 | 892,222 | ||||||
|
|
|
|||||||
| 11,752,049 | ||||||||
| Japan — 20.4% | ||||||||
| Advantest Corp. |
5,100 | 450,233 | ||||||
| Aeon Co. Ltd. |
2,400 | 65,676 | ||||||
| Ajinomoto Co. Inc. |
47,300 | 1,205,057 | ||||||
| Asahi Kasei Corp. |
16,800 | 183,203 | ||||||
| Astellas Pharma Inc. |
139,800 | 2,226,647 | ||||||
| Capcom Co. Ltd. |
3,300 | 90,736 | ||||||
| Central Japan Railway Co. |
16,800 | 2,443,806 | ||||||
| Chugai Pharmaceutical Co. Ltd. |
26,600 | 980,223 | ||||||
| Daifuku Co. Ltd. |
12,100 | 1,084,272 | ||||||
| Dai-ichi Life Holdings Inc. |
33,600 | 618,409 | ||||||
| Daiichi Sankyo Co. Ltd. |
63,600 | 1,259,553 | ||||||
| Daikin Industries Ltd. |
15,800 | 3,299,556 | ||||||
| Daiwa House REIT Investment Corp. |
336 | 1,000,372 | ||||||
| Denso Corp. |
6,100 | 419,077 | ||||||
| Eisai Co. Ltd. |
9,800 | 806,077 | ||||||
| ENEOS Holdings Inc. |
450,300 | 1,891,527 | ||||||
| Fast Retailing Co. Ltd. |
1,700 | 1,152,945 | ||||||
| FUJIFILM Holdings Corp. |
41,100 | 2,949,452 | ||||||
| Fujitsu Ltd. |
19,100 | 3,249,491 | ||||||
| Hankyu Hanshin Holdings Inc. |
42,000 | 1,241,972 | ||||||
| Honda Motor Co. Ltd. |
100,800 | 3,237,481 | ||||||
| Ito En Ltd. |
1,800 | 106,207 | ||||||
| Japan Metropolitan Fund Invest |
336 | 351,972 | ||||||
| Japan Post Holdings Co. Ltd. |
50,400 | 427,817 | ||||||
| Japan Real Estate Investment Corp. |
168 | 1,055,115 | ||||||
| Kajima Corp. |
11,400 | 146,750 | ||||||
| Komatsu Ltd. |
50,400 | 1,262,975 | ||||||
| Kubota Corp. |
33,600 | 702,625 | ||||||
| Kurita Water Industries Ltd. |
48,000 | 2,331,290 | ||||||
| M3 Inc. |
17,900 | 1,170,780 | ||||||
| Mazda Motor Corp.(a) |
27,200 | 268,325 | ||||||
| Misumi Group Inc. |
24,800 | 864,408 | ||||||
| 38 | 2 0 2 1 B L A C K R O C K A N N U A L R E P O R T T O S H A R E H O L D E R S |
| Schedule of Investments (continued) July 31, 2021 |
BlackRock World ex U.S. Carbon Transition Readiness ETF (Percentages shown are based on Net Assets) |
| Security | Shares | Value | ||||||
| Japan (continued) | ||||||||
| Mitsubishi Electric Corp. |
134,400 | $ | 1,823,437 | |||||
| Mitsubishi Heavy Industries Ltd. |
50,400 | 1,456,218 | ||||||
| Mitsubishi UFJ Financial Group Inc. |
352,800 | 1,863,728 | ||||||
| Miura Co. Ltd. |
1,600 | 70,654 | ||||||
| Mizuho Financial Group Inc. |
16,800 | 240,065 | ||||||
| Nabtesco Corp. |
16,800 | 636,324 | ||||||
| Nidec Corp. |
34,300 | 3,849,952 | ||||||
| Nihon M&A Center Inc. |
16,800 | 467,863 | ||||||
| Nintendo Co. Ltd. |
8,100 | 4,164,234 | ||||||
| Nippon Building Fund Inc. |
168 | 1,085,725 | ||||||
| Nippon Express Co. Ltd. |
17,900 | 1,307,590 | ||||||
| Nippon Paint Holdings Co. Ltd. |
50,400 | 643,315 | ||||||
| Nippon Prologis REIT Inc. |
504 | 1,683,140 | ||||||
| Nippon Shinyaku Co. Ltd. |
16,800 | 1,263,888 | ||||||
| Nippon Steel Corp. |
18,100 | 313,986 | ||||||
| Nippon Telegraph & Telephone Corp. |
136,500 | 3,495,507 | ||||||
| Nissan Chemical Corp. |
7,400 | 362,701 | ||||||
| Nissan Motor Co. Ltd.(a) |
39,100 | 226,930 | ||||||
| Nisshin Seifun Group Inc. |
100,800 | 1,625,157 | ||||||
| Nitto Denko Corp. |
6,600 | 490,370 | ||||||
| Nomura Holdings Inc. |
100,800 | 504,764 | ||||||
| Nomura Real Estate Master Fund Inc. |
504 | 800,843 | ||||||
| Nomura Research Institute Ltd. |
33,600 | 1,081,243 | ||||||
| NTT Data Corp. |
50,400 | 780,672 | ||||||
| Obayashi Corp. |
156,200 | 1,277,287 | ||||||
| Olympus Corp. |
66,700 | 1,372,642 | ||||||
| Omron Corp. |
42,400 | 3,628,381 | ||||||
| Ono Pharmaceutical Co. Ltd. |
111,800 | 2,552,187 | ||||||
| Oriental Land Co. Ltd. |
8,400 | 1,150,803 | ||||||
| ORIX Corp. |
50,400 | 881,768 | ||||||
| Orix JREIT Inc. |
504 | 961,674 | ||||||
| Otsuka Corp. |
6,300 | 327,352 | ||||||
| Panasonic Corp. |
183,200 | 2,212,152 | ||||||
| Pigeon Corp. |
17,200 | 495,243 | ||||||
| Recruit Holdings Co. Ltd. |
50,400 | 2,612,263 | ||||||
| Renesas Electronics Corp.(a) |
12,800 | 138,927 | ||||||
| Ryohin Keikaku Co. Ltd. |
75,300 | 1,527,549 | ||||||
| Sekisui Chemical Co. Ltd. |
244,800 | 4,224,135 | ||||||
| Sekisui House Ltd. |
94,700 | 1,875,580 | ||||||
| Shimadzu Corp. |
23,100 | 931,634 | ||||||
| Shimizu Corp. |
29,600 | 217,990 | ||||||
| Shin-Etsu Chemical Co. Ltd. |
8,200 | 1,337,659 | ||||||
| Shiseido Co. Ltd. |
38,400 | 2,566,490 | ||||||
| Softbank Corp. |
26,400 | 344,816 | ||||||
| SoftBank Group Corp. |
16,800 | 1,056,479 | ||||||
| Sony Group Corp. |
30,300 | 3,165,334 | ||||||
| Subaru Corp. |
3,400 | 66,800 | ||||||
| SUMCO Corp. |
72,100 | 1,667,552 | ||||||
| Sumitomo Dainippon Pharma Co. Ltd. |
46,600 | 806,892 | ||||||
| Sumitomo Metal Mining Co. Ltd. |
34,900 | 1,414,405 | ||||||
| Sumitomo Mitsui Financial Group Inc. |
33,600 | 1,132,624 | ||||||
| Sysmex Corp. |
4,700 | 559,256 | ||||||
| Tokio Marine Holdings Inc. |
2,900 | 138,217 | ||||||
| Tokyo Electron Ltd. |
800 | 329,940 | ||||||
| Tokyu Corp. |
62,700 | 840,349 | ||||||
| Toray Industries Inc. |
84,000 | 553,071 | ||||||
| Toshiba Corp. |
36,300 | 1,562,405 | ||||||
| Toyo Suisan Kaisha Ltd. |
5,000 | 190,887 | ||||||
| Toyota Motor Corp. |
103,700 | 9,309,717 | ||||||
| United Urban Investment Corp. |
504 | 741,373 | ||||||
| Security | Shares | Value | ||||||
| Japan (continued) | ||||||||
| Z Holdings Corp. |
153,100 | $ | 766,293 | |||||
|
|
|
|||||||
| 123,720,461 | ||||||||
| Netherlands — 5.0% | ||||||||
| Aegon NV |
88,032 | 374,805 | ||||||
| Akzo Nobel NV |
55,440 | 6,848,349 | ||||||
| ArcelorMittal SA |
16,296 | 569,145 | ||||||
| ASML Holding NV |
11,928 | 9,117,569 | ||||||
| EXOR NV |
4,200 | 345,054 | ||||||
| ING Groep NV |
128,184 | 1,644,690 | ||||||
| Koninklijke Ahold Delhaize NV |
50,064 | 1,556,231 | ||||||
| Koninklijke DSM NV |
12,936 | 2,607,656 | ||||||
| Koninklijke Philips NV |
36,792 | 1,696,458 | ||||||
| Koninklijke Vopak NV |
4,604 | 194,945 | ||||||
| Prosus NV |
13,104 | 1,169,118 | ||||||
| Royal Dutch Shell PLC, Class A |
134,400 | 2,701,568 | ||||||
| Royal Dutch Shell PLC, Class B |
87,528 | 1,729,481 | ||||||
|
|
|
|||||||
| 30,555,069 | ||||||||
| New Zealand — 0.1% | ||||||||
| a2 Milk Co. Ltd. (The)(a) |
57,590 | 250,394 | ||||||
| Mercury NZ Ltd. |
53,256 | 245,033 | ||||||
| Meridian Energy Ltd. |
20,328 | 73,910 | ||||||
|
|
|
|||||||
| 569,337 | ||||||||
| Norway — 0.6% | ||||||||
| DNB Bank ASA |
14,616 | 299,525 | ||||||
| Norsk Hydro ASA |
461,664 | 3,071,447 | ||||||
| Orkla ASA |
56,280 | 511,158 | ||||||
|
|
|
|||||||
| 3,882,130 | ||||||||
| Portugal — 0.2% | ||||||||
| Galp Energia SGPS SA |
97,776 | 953,484 | ||||||
|
|
|
|||||||
| Singapore — 1.0% | ||||||||
| CapitaLand Integrated Commercial Trust |
69,600 | 110,287 | ||||||
| DBS Group Holdings Ltd. |
57,100 | 1,277,689 | ||||||
| Keppel Corp. Ltd. |
690,100 | 2,789,927 | ||||||
| Mapletree Commercial Trust |
45,000 | 71,643 | ||||||
| Oversea-Chinese Banking Corp. Ltd. |
100,800 | 911,961 | ||||||
| United Overseas Bank Ltd. |
33,600 | 649,608 | ||||||
|
|
|
|||||||
| 5,811,115 | ||||||||
| Spain — 2.5% | ||||||||
| Amadeus IT Group SA(a) |
21,000 | 1,377,196 | ||||||
| Banco Bilbao Vizcaya Argentaria SA |
250,824 | 1,605,644 | ||||||
| Banco Santander SA |
644,784 | 2,361,942 | ||||||
| CaixaBank SA |
143,136 | 425,101 | ||||||
| Iberdrola SA |
505,407 | 6,082,615 | ||||||
| Industria de Diseno Textil SA |
18,816 | 638,170 | ||||||
| Repsol SA |
12,432 | 136,167 | ||||||
| Siemens Gamesa Renewable Energy SA(a) |
51,408 | 1,433,710 | ||||||
| Telefonica SA |
225,792 | 1,032,964 | ||||||
|
|
|
|||||||
| 15,093,509 | ||||||||
| Sweden — 4.2% | ||||||||
| Alfa Laval AB |
22,008 | 919,074 | ||||||
| Assa Abloy AB, Class B |
43,853 | 1,406,641 | ||||||
| Atlas Copco AB, Class A |
35,448 | 2,400,716 | ||||||
| Atlas Copco AB, Class B |
2,688 | 152,835 | ||||||
| Boliden AB |
40,824 | 1,590,991 | ||||||
| Electrolux AB, Series B |
68,712 | 1,804,607 | ||||||
| EQT AB |
7,728 | 372,506 | ||||||
| Evolution AB(b) |
7,056 | 1,227,746 | ||||||
| Fastighets AB Balder, Class B(a) |
13,272 | 915,881 | ||||||
| S C H E D U L E O F I N V E S T M E N T S |
39 |
| Schedule of Investments (continued) July 31, 2021 |
BlackRock World ex U.S. Carbon Transition Readiness ETF (Percentages shown are based on Net Assets) |
| Security | Shares | Value | ||||||
| Sweden (continued) | ||||||||
| H & M Hennes & Mauritz AB, Class B(a) |
4,003 | $ | 83,690 | |||||
| Hexagon AB, Class B |
316,848 | 5,244,975 | ||||||
| Husqvarna AB, Class B |
62,664 | 876,897 | ||||||
| ICA Gruppen AB |
88,536 | 4,376,199 | ||||||
| Investor AB, Class B |
4,704 | 116,492 | ||||||
| Lundin Energy AB |
27,216 | 848,441 | ||||||
| Skanska AB, Class B |
16,464 | 464,773 | ||||||
| Telefonaktiebolaget LM Ericsson, Class B |
119,616 | 1,379,672 | ||||||
| Volvo AB, Class B |
42,840 | 1,010,242 | ||||||
|
|
|
|||||||
| 25,192,378 | ||||||||
| Switzerland — 9.1% | ||||||||
| Adecco Group AG, Registered |
2,184 | 130,791 | ||||||
| Chocoladefabriken Lindt & Spruengli AG, Participation Certificates, NVS |
168 | 1,882,431 | ||||||
| Chocoladefabriken Lindt & Spruengli AG, Registered |
1 | 115,913 | ||||||
| Credit Suisse Group AG, Registered |
98,952 | 993,409 | ||||||
| Geberit AG, Registered |
3,192 | 2,620,880 | ||||||
| Givaudan SA, Registered |
1,008 | 5,031,173 | ||||||
| Holcim Ltd. |
55,608 | 3,259,805 | ||||||
| Julius Baer Group Ltd. |
8,232 | 543,328 | ||||||
| Kuehne + Nagel International AG, Registered |
672 | 226,688 | ||||||
| Nestle SA, Registered |
85,680 | 10,849,629 | ||||||
| Novartis AG, Registered |
74,592 | 6,898,147 | ||||||
| Partners Group Holding AG |
545 | 931,058 | ||||||
| Roche Holding AG, NVS |
26,712 | 10,319,168 | ||||||
| Siemens Energy AG(a) |
41,664 | 1,133,462 | ||||||
| Sonova Holding AG, Registered |
1,680 | 659,627 | ||||||
| STMicroelectronics NV |
38,136 | 1,569,439 | ||||||
| Swiss Life Holding AG, Registered |
504 | 259,965 | ||||||
| Swiss Prime Site AG, Registered |
18,480 | 1,967,803 | ||||||
| Swiss Re AG |
9,576 | 868,165 | ||||||
| Temenos AG, Registered |
5,544 | 880,656 | ||||||
| UBS Group AG, Registered |
126,840 | 2,089,787 | ||||||
| Zurich Insurance Group AG |
4,200 | 1,693,334 | ||||||
|
|
|
|||||||
| 54,924,658 | ||||||||
| United Kingdom — 11.2% | ||||||||
| 3i Group PLC |
27,888 | 495,659 | ||||||
| Abrdn PLC |
91,896 | 362,524 | ||||||
| Antofagasta PLC |
8,736 | 181,388 | ||||||
| AstraZeneca PLC |
40,992 | 4,710,386 | ||||||
| Auto Trader Group PLC(a)(b) |
212,856 | 1,928,509 | ||||||
| Aviva PLC |
160,104 | 859,861 | ||||||
| Barclays PLC |
747,936 | 1,809,317 | ||||||
| Berkeley Group Holdings PLC |
26,208 | 1,764,531 | ||||||
| BP PLC |
574,056 | 2,304,275 | ||||||
| British Land Co. PLC (The) |
33,096 | 234,317 | ||||||
| BT Group PLC(a) |
670,992 | 1,616,242 | ||||||
| Coca-Cola Europacific Partners PLC |
33,264 | 2,064,364 | ||||||
| Diageo PLC |
25,368 | 1,257,904 | ||||||
| Entain PLC(a) |
29,232 | 737,123 | ||||||
| Experian PLC |
29,232 | 1,286,962 | ||||||
| Ferguson PLC |
42,504 | 5,958,597 | ||||||
| GlaxoSmithKline PLC |
282,912 | 5,585,767 | ||||||
| Halma PLC |
24,192 | 971,091 | ||||||
| Hargreaves Lansdown PLC |
5,376 | 121,932 | ||||||
| Hikma Pharmaceuticals PLC |
8,232 | 302,703 | ||||||
| HSBC Holdings PLC |
663,600 | 3,663,201 | ||||||
| Informa PLC(a) |
18,816 | 129,291 | ||||||
| Intertek Group PLC |
2,688 | 192,584 | ||||||
| Security | Shares | Value | ||||||
| United Kingdom (continued) | ||||||||
| J Sainsbury PLC |
530,712 | $ | 2,089,853 | |||||
| JD Sports Fashion PLC |
40,152 | 500,302 | ||||||
| Johnson Matthey PLC |
16,800 | 694,416 | ||||||
| Land Securities Group PLC |
41,832 | 411,726 | ||||||
| Legal & General Group PLC |
248,640 | 900,690 | ||||||
| Lloyds Banking Group PLC |
2,546,712 | 1,610,202 | ||||||
| London Stock Exchange Group PLC |
10,080 | 1,051,055 | ||||||
| M&G PLC |
148,344 | 464,501 | ||||||
| Melrose Industries PLC |
85,848 | 190,778 | ||||||
| Natwest Group PLC |
252,168 | 707,764 | ||||||
| Ocado Group PLC(a) |
11,928 | 307,355 | ||||||
| Pearson PLC |
13,440 | 161,958 | ||||||
| Prudential PLC |
87,696 | 1,646,828 | ||||||
| RELX PLC |
60,816 | 1,787,643 | ||||||
| Rentokil Initial PLC |
32,760 | 258,066 | ||||||
| Rolls-Royce Holdings PLC(a) |
131,208 | 181,214 | ||||||
| Sage Group PLC (The) |
86,520 | 843,344 | ||||||
| Segro PLC |
112,056 | 1,894,221 | ||||||
| St. James’s Place PLC |
12,096 | 266,499 | ||||||
| Standard Chartered PLC |
85,008 | 509,606 | ||||||
| Taylor Wimpey PLC |
166,824 | 381,404 | ||||||
| Unilever PLC |
119,112 | 6,855,083 | ||||||
| Vodafone Group PLC |
2,543,688 | 4,090,127 | ||||||
| Whitbread PLC(a) |
15,120 | 639,058 | ||||||
| Wm Morrison Supermarkets PLC |
251,496 | 935,475 | ||||||
| WPP PLC |
17,808 | 230,311 | ||||||
|
|
|
|||||||
| 68,148,007 | ||||||||
|
|
|
|||||||
| Total Common Stocks — 98.1% |
594,239,165 | |||||||
|
|
|
|||||||
| Preferred Stocks |
||||||||
| Germany — 1.2% | ||||||||
| Bayerische Motoren Werke AG, Preference Shares, NVS |
18,312 | 1,571,792 | ||||||
| Henkel AG & Co. KGaA, Preference Shares, NVS |
30,240 | 3,065,870 | ||||||
| Porsche Automobil Holding SE, Preference Shares, NVS |
5,712 | 618,216 | ||||||
| Volkswagen AG, Preference Shares, NVS |
7,896 | 1,923,232 | ||||||
|
|
|
|||||||
| 7,179,110 | ||||||||
|
|
|
|||||||
| Total Preferred Stocks — 1.2% |
7,179,110 | |||||||
|
|
|
|||||||
| Short-Term Investments |
||||||||
| Money Market Funds — 0.5% | ||||||||
| BlackRock Cash Funds: Treasury, |
3,020,000 | 3,020,000 | ||||||
|
|
|
|||||||
| Total Short-Term Investments — 0.5% |
3,020,000 | |||||||
|
|
|
|||||||
| Total Investments in Securities — 99.8% |
604,438,275 | |||||||
| Other Assets, Less Liabilities — 0.2% |
1,161,187 | |||||||
|
|
|
|||||||
| Net Assets — 100.0% |
$ | 605,599,462 | ||||||
|
|
|
|||||||
| (a) | Non-income producing security. |
| (b) | Security exempt from registration pursuant to Rule 144A under the Securities Act of 1933, as amended. These securities may be resold in transactions exempt from registration to qualified institutional investors. |
| 40 | 2 0 2 1 B L A C K R O C K A N N U A L R E P O R T T O S H A R E H O L D E R S |
| Schedule of Investments (continued) July 31, 2021 |
BlackRock World ex U.S. Carbon Transition Readiness ETF |
| (c) | Affiliate of the Fund. |
| (d) | Annualized 7-day yield as of period-end. |
Affiliates
Investments in issuers considered to be affiliate(s) of the Fund during the period ended July 31, 2021 for purposes of Section 2(a)(3) of the Investment Company Act of 1940, as amended, were as follows:
| Affiliated Issuer | Value at 04/06/21(a) |
Purchases at Cost |
Proceeds from Sales |
Net Realized Gain (Loss) |
Change in Unrealized Appreciation (Depreciation) |
Value at 07/31/21 |
Shares Held at 07/31/21 |
Income | Capital Gain from Funds |
|||||||||||||||||||||||||||||||
| BlackRock Cash Funds: Treasury, SL Agency Shares |
$ | — | $ | 3,020,000 | (b) | $ | — | $ | — | $ | — | $ | 3,020,000 | 3,020,000 | $ | 139 | $ | — | ||||||||||||||||||||||
|
|
|
|
|
|
|
|
|
|
|
|||||||||||||||||||||||||||||||
| (a) | The Fund commenced operations on April 06, 2021. |
| (b) | Represents net amount purchased (sold). |
Futures Contracts
| Description | Number of Contracts |
Expiration Date |
Notional Amount (000) |
Value/ Unrealized Appreciation (Depreciation) |
||||||||||||||
| Long Contracts |
||||||||||||||||||
| MSCI EAFE Index |
33 | 09/17/21 | $ | 3,827 | $ | (810 | ) | |||||||||||
|
|
|
|||||||||||||||||
Derivative Financial Instruments Categorized by Risk Exposure
As of July 31, 2021, the fair values of derivative financial instruments located in the Statements of Assets and Liabilities were as follows:
| Equity Contracts |
||||
| Liabilities — Derivative Financial Instruments |
||||
| Futures contracts |
||||
| Unrealized depreciation on futures contracts(a) |
$ | 810 | ||
|
|
|
|||
| (a) | Net cumulative appreciation (depreciation) on futures contracts are reported in the Schedule of Investments. In the Statements of Assets and Liabilities, only current day’s variation margin is reported in receivables or payables and the net cumulative unrealized appreciation (depreciation) is included in accumulated earnings (loss). |
For the period ended July 31, 2021, the effect of derivative financial instruments in the Statements of Operations was as follows:
| Equity Contracts |
||||
| Net Realized Gain (Loss) from: |
||||
| Futures contracts |
$ | 393,112 | ||
|
|
|
|||
| Net Change in Unrealized Appreciation (Depreciation) on: |
||||
| Futures contracts |
$ | (810 | ) | |
|
|
|
|||
Average Quarterly Balances of Outstanding Derivative Financial Instruments
| Futures contracts: |
||||
| Average notional value of contracts — long |
$ | 7,951,783 |
For more information about the Fund’s investment risks regarding derivative financial instruments, refer to the Notes to Financial Statements.
| S C H E D U L E O F I N V E S T M E N T S |
41 |
| Schedule of Investments (continued) July 31, 2021 |
BlackRock World ex U.S. Carbon Transition Readiness ETF |
Fair Value Measurements
Various inputs are used in determining the fair value of financial instruments. For description of the input levels and information about the Fund’s policy regarding valuation of financial instruments, refer to the Notes to Financial Statements.
The following table summarizes the value of the Fund’s investments according to the fair value hierarchy as of July 31, 2021. The breakdown of the Fund’s investments into major categories is disclosed in the Schedule of Investments above.
| Level 1 | Level 2 | Level 3 | Total | |||||||||||||
| Investments |
||||||||||||||||
| Assets |
||||||||||||||||
| Common Stocks |
$ | 78,317,333 | $ | 515,921,832 | $ | — | $ | 594,239,165 | ||||||||
| Preferred Stocks |
— | 7,179,110 | — | 7,179,110 | ||||||||||||
| Money Market Funds |
3,020,000 | — | — | 3,020,000 | ||||||||||||
|
|
|
|
|
|
|
|
|
|||||||||
| $ | 81,337,333 | $ | 523,100,942 | $ | — | $ | 604,438,275 | |||||||||
|
|
|
|
|
|
|
|
|
|||||||||
| Derivative financial instruments(a) |
||||||||||||||||
| Liabilities |
||||||||||||||||
| Futures Contracts |
$ | (810 | ) | $ | — | $ | — | $ | (810 | ) | ||||||
|
|
|
|
|
|
|
|
|
|||||||||
| (a) | Shown at the unrealized appreciation (depreciation) on the contracts. |
See notes to financial statements.
| 42 | 2 0 2 1 B L A C K R O C K A N N U A L R E P O R T T O S H A R E H O L D E R S |
Statements of Assets and Liabilities
July 31, 2021
| BlackRock Future Health ETF |
BlackRock Future Innovators ETF |
BlackRock Future Tech ETF |
BlackRock U.S. Carbon Transition Readiness ETF |
|||||||||||||
| ASSETS |
||||||||||||||||
| Investments in securities, at value (including securities on loan)(a): |
||||||||||||||||
| Unaffiliated(b) |
$ | 6,730,815 | $ | 23,023,212 | $ | 19,573,631 | $ | 1,399,796,746 | ||||||||
| Affiliated(c) |
615,281 | 3,204,417 | 3,850,120 | 23,083,992 | ||||||||||||
| Cash |
384 | 2,897 | 1,805 | 84,504 | ||||||||||||
| Foreign currency, at value(d) |
29 | 291 | 1,885 | — | ||||||||||||
| Cash pledged: |
||||||||||||||||
| Futures contracts |
— | — | — | 900,000 | ||||||||||||
| Receivables: |
||||||||||||||||
| Investments sold |
87,847 | 13,426 | — | — | ||||||||||||
| Securities lending income — Affiliated |
117 | 595 | 781 | 1,558 | ||||||||||||
| Dividends |
9 | 1,315 | 1,846 | 1,336,234 | ||||||||||||
| Tax reclaims |
343 | — | — | — | ||||||||||||
|
|
|
|
|
|
|
|
|
|||||||||
| Total assets |
7,434,825 | 26,246,153 | 23,430,068 | 1,425,203,034 | ||||||||||||
|
|
|
|
|
|
|
|
|
|||||||||
| LIABILITIES |
||||||||||||||||
| Collateral on securities loaned, at value |
185,326 | 3,154,584 | 2,980,294 | 1,052,324 | ||||||||||||
| Payables: |
||||||||||||||||
| Investments purchased |
35,742 | 51,361 | 115,856 | — | ||||||||||||
| Variation margin on futures contracts |
— | — | — | 90,335 | ||||||||||||
| Investment advisory fees |
5,178 | 15,429 | 15,098 | 171,495 | ||||||||||||
|
|
|
|
|
|
|
|
|
|||||||||
| Total liabilities |
226,246 | 3,221,374 | 3,111,248 | 1,314,154 | ||||||||||||
|
|
|
|
|
|
|
|
|
|||||||||
| NET ASSETS |
$ | 7,208,579 | $ | 23,024,779 | $ | 20,318,820 | $ | 1,423,888,880 | ||||||||
|
|
|
|
|
|
|
|
|
|||||||||
| NET ASSETS CONSIST OF: |
||||||||||||||||
| Paid-in capital |
$ | 6,005,026 | $ | 21,386,952 | $ | 18,056,333 | $ | 1,320,078,789 | ||||||||
| Accumulated earnings |
1,203,553 | 1,637,827 | 2,262,487 | 103,810,091 | ||||||||||||
|
|
|
|
|
|
|
|
|
|||||||||
| NET ASSETS |
$ | 7,208,579 | $ | 23,024,779 | $ | 20,318,820 | $ | 1,423,888,880 | ||||||||
|
|
|
|
|
|
|
|
|
|||||||||
| Shares outstanding |
240,000 | 460,000 | 560,000 | 28,150,000 | ||||||||||||
|
|
|
|
|
|
|
|
|
|||||||||
| Net asset value |
$ | 30.04 | $ | 50.05 | $ | 36.28 | $ | 50.58 | ||||||||
|
|
|
|
|
|
|
|
|
|||||||||
| Shares authorized |
Unlimited | Unlimited | Unlimited | Unlimited | ||||||||||||
|
|
|
|
|
|
|
|
|
|||||||||
| Par value |
None | None | None | None | ||||||||||||
|
|
|
|
|
|
|
|
|
|||||||||
| (a) Securities loaned, at value |
$ | 178,604 | $ | 3,055,580 | $ | 2,888,973 | $ | 1,022,222 | ||||||||
| (b) Investments, at cost — Unaffiliated |
$ | 5,522,696 | $ | 21,085,640 | $ | 16,557,719 | $ | 1,302,571,802 | ||||||||
| (c) Investments, at cost — Affiliated |
$ | 615,281 | $ | 3,204,417 | $ | 3,850,120 | $ | 22,710,923 | ||||||||
| (d) Foreign currency, at cost |
$ | 29 | $ | 291 | $ | 1,888 | $ | — | ||||||||
See notes to financial statements.
| F I N A N C I A L S T A T E M E N T S |
43 |
Statements of Assets and Liabilities (continued)
July 31, 2021
| BlackRock U.S. Equity Factor Rotation ETF |
BlackRock World ex U.S. Carbon Transition Readiness ETF |
|||||||
| ASSETS |
||||||||
| Investments in securities, at value (including securities on loan)(a): |
||||||||
| Unaffiliated(b) |
$ | 96,135,068 | $ | 601,418,275 | ||||
| Affiliated(c) |
919,365 | 3,020,000 | ||||||
| Cash |
5,665 | 29,384 | ||||||
| Foreign currency, at value(d) |
— | 404,478 | ||||||
| Cash pledged: |
||||||||
| Futures contracts |
— | 238,000 | ||||||
| Receivables: |
||||||||
| Securities lending income — Affiliated |
95 | — | ||||||
| Dividends |
78,650 | 479,843 | ||||||
| Tax reclaims |
— | 357,955 | ||||||
|
|
|
|
|
|||||
| Total assets |
97,138,843 | 605,947,935 | ||||||
|
|
|
|
|
|||||
| LIABILITIES |
||||||||
| Collateral on securities loaned, at value |
637,707 | — | ||||||
| Payables: |
||||||||
| Investments purchased |
197,436 | 224,555 | ||||||
| Variation margin on futures contracts |
— | 21,780 | ||||||
| Investment advisory fees |
15,515 | 102,138 | ||||||
|
|
|
|
|
|||||
| Total liabilities |
850,658 | 348,473 | ||||||
|
|
|
|
|
|||||
| NET ASSETS |
$ | 96,288,185 | $ | 605,599,462 | ||||
|
|
|
|
|
|||||
| NET ASSETS CONSIST OF: |
||||||||
| Paid-in capital |
$ | 74,902,172 | $ | 586,499,102 | ||||
| Accumulated earnings |
21,386,013 | 19,100,360 | ||||||
|
|
|
|
|
|||||
| NET ASSETS |
$ | 96,288,185 | $ | 605,599,462 | ||||
|
|
|
|
|
|||||
| Shares outstanding |
2,600,000 | 12,600,000 | ||||||
|
|
|
|
|
|||||
| Net asset value |
$ | 37.03 | $ | 48.06 | ||||
|
|
|
|
|
|||||
| Shares authorized |
Unlimited | Unlimited | ||||||
|
|
|
|
|
|||||
| Par value |
None | None | ||||||
|
|
|
|
|
|||||
| (a) Securities loaned, at value |
$ | 651,817 | $ | — | ||||
| (b) Investments, at cost — Unaffiliated |
$ | 78,617,129 | $ | 585,155,325 | ||||
| (c) Investments, at cost — Affiliated |
$ | 919,162 | $ | 3,020,000 | ||||
| (d) Foreign currency, at cost |
$ | — | $ | 406,232 | ||||
See notes to financial statements.
| 44 | 2 0 2 1 B L A C K R O C K A N N U A L R E P O R T T O S H A R E H O L D E R S |
Period Ended July 31, 2021
| |
BlackRock Future Health ETF |
(a) |
|
BlackRock Future Innovators ETF |
(a) |
|
BlackRock Future Tech ETF |
(a) |
|
BlackRock U.S. Carbon |
| |||||
|
|
||||||||||||||||
| INVESTMENT INCOME |
||||||||||||||||
| Dividends — Unaffiliated |
$ | 12,981 | $ | 12,993 | $ | 16,248 | $ | 5,081,982 | ||||||||
| Dividends — Affiliated |
45 | 7 | 26 | 23,512 | ||||||||||||
| Securities lending income — Affiliated — net |
604 | 3,415 | 11,425 | 27,448 | ||||||||||||
| Foreign taxes withheld |
(1,358 | ) | — | (1,419 | ) | — | ||||||||||
|
|
|
|
|
|
|
|
|
|||||||||
| Total investment income |
12,272 | 16,415 | 26,280 | 5,132,942 | ||||||||||||
|
|
|
|
|
|
|
|
|
|||||||||
| EXPENSES |
||||||||||||||||
| Investment advisory fees |
49,315 | 103,756 | 95,190 | 1,245,114 | ||||||||||||
|
|
|
|
|
|
|
|
|
|||||||||
| Total expenses |
49,315 | 103,756 | 95,190 | 1,245,114 | ||||||||||||
| Less: |
||||||||||||||||
| Investment advisory fees waived |
(158 | ) | (38 | ) | (212 | ) | (636,291 | ) | ||||||||
|
|
|
|
|
|
|
|
|
|||||||||
| Total expenses after fees waived |
49,157 | 103,718 | 94,978 | 608,823 | ||||||||||||
|
|
|
|
|
|
|
|
|
|||||||||
| Net investment income (loss) |
(36,885 | ) | (87,303 | ) | (68,698 | ) | 4,524,119 | |||||||||
|
|
|
|
|
|
|
|
|
|||||||||
| REALIZED AND UNREALIZED GAIN (LOSS) |
||||||||||||||||
| Net realized gain (loss) from: |
||||||||||||||||
| Investments — Unaffiliated |
(4,076 | ) | (299,587 | ) | (694,000 | ) | 3,561,141 | |||||||||
| Investments — Affiliated |
(45 | ) | (167 | ) | (173 | ) | (438 | ) | ||||||||
| In-kind redemptions — Unaffiliated |
— | — | — | 50,068 | ||||||||||||
| In-kind redemptions — Affiliated |
— | — | — | 208 | ||||||||||||
| Futures contracts |
— | — | — | 395,044 | ||||||||||||
| Foreign currency transactions |
(159 | ) | (1,294 | ) | (3,913 | ) | — | |||||||||
|
|
|
|
|
|
|
|
|
|||||||||
| Net realized gain (loss) |
(4,280 | ) | (301,048 | ) | (698,086 | ) | 4,006,023 | |||||||||
|
|
|
|
|
|
|
|
|
|||||||||
| Net change in unrealized appreciation (depreciation) on: |
||||||||||||||||
| Investments — Unaffiliated |
1,208,119 | 1,937,572 | 3,015,912 | 97,224,944 | ||||||||||||
| Investments — Affiliated |
— | — | — | 373,069 | ||||||||||||
| Futures contracts |
— | — | — | 324,095 | ||||||||||||
| Foreign currency translations |
(2 | ) | 9 | 20 | — | |||||||||||
|
|
|
|
|
|
|
|
|
|||||||||
| Net change in unrealized appreciation (depreciation) |
1,208,117 | 1,937,581 | 3,015,932 | 97,922,108 | ||||||||||||
|
|
|
|
|
|
|
|
|
|||||||||
| Net realized and unrealized gain |
1,203,837 | 1,636,533 | 2,317,846 | 101,928,131 | ||||||||||||
|
|
|
|
|
|
|
|
|
|||||||||
| NET INCREASE IN NET ASSETS RESULTING FROM OPERATIONS |
$ | 1,166,952 | $ | 1,549,230 | $ | 2,249,148 | $ | 106,452,250 | ||||||||
|
|
|
|
|
|
|
|
|
|||||||||
| (a) | For the period from September 29, 2020 (commencement of operations) to July 31, 2021. |
| (b) | For the period from April 06, 2021 (commencement of operations) to July 31, 2021. |
See notes to financial statements.
| F I N A N C I A L S T A T E M E N T S |
45 |
Statements of Operations (continued)
Year Ended July 31, 2021
| |
BlackRock U.S. Equity Factor Rotation ETF |
|
BlackRock World ex U.S. Carbon Transition Readiness ETF |
(a) | ||||
|
|
||||||||
| INVESTMENT INCOME |
||||||||
| Dividends — Unaffiliated |
$ | 1,391,230 | $ | 5,419,016 | ||||
| Dividends — Affiliated |
63 | 139 | ||||||
| Non-cash dividends — Unaffiliated |
— | 386,121 | ||||||
| Securities lending income — Affiliated — net |
1,922 | — | ||||||
| Foreign taxes withheld |
(631 | ) | (629,391 | ) | ||||
|
|
|
|
|
|||||
| Total investment income |
1,392,584 | 5,175,885 | ||||||
|
|
|
|
|
|||||
| EXPENSES |
||||||||
| Investment advisory fees |
259,132 | 651,613 | ||||||
|
|
|
|
|
|||||
| Total expenses |
259,132 | 651,613 | ||||||
| Less: |
||||||||
| Investment advisory fees waived |
(86,377 | ) | (280,324 | ) | ||||
|
|
|
|
|
|||||
| Total expenses after fees waived |
172,755 | 371,289 | ||||||
|
|
|
|
|
|||||
| Net investment income |
1,219,829 | 4,804,596 | ||||||
|
|
|
|
|
|||||
| REALIZED AND UNREALIZED GAIN (LOSS) |
||||||||
| Net realized gain (loss) from: |
||||||||
| Investments — Unaffiliated |
8,451,883 | 1,490,047 | ||||||
| Investments — Affiliated |
(117 | ) | — | |||||
| In-kind redemptions — Unaffiliated |
10,006,526 | — | ||||||
| Futures contracts |
— | 393,112 | ||||||
| Foreign currency transactions |
— | 6,320 | ||||||
|
|
|
|
|
|||||
| Net realized gain |
18,458,292 | 1,889,479 | ||||||
|
|
|
|
|
|||||
| Net change in unrealized appreciation (depreciation) on: |
||||||||
| Investments — Unaffiliated |
8,499,606 | 16,262,950 | ||||||
| Investments — Affiliated |
(231 | ) | — | |||||
| Futures contracts |
— | (810 | ) | |||||
| Foreign currency translations |
— | (3,972 | ) | |||||
|
|
|
|
|
|||||
| Net change in unrealized appreciation (depreciation) |
8,499,375 | 16,258,168 | ||||||
|
|
|
|
|
|||||
| Net realized and unrealized gain |
26,957,667 | 18,147,647 | ||||||
|
|
|
|
|
|||||
| NET INCREASE IN NET ASSETS RESULTING FROM OPERATIONS |
$ | 28,177,496 | $ | 22,952,243 | ||||
|
|
|
|
|
|||||
| (a) | For the period from April 06, 2021 (commencement of operations) to July 31, 2021. |
See notes to financial statements.
| 46 | 2 0 2 1 B L A C K R O C K A N N U A L R E P O R T T O S H A R E H O L D E R S |
Statements of Changes in Net Assets
| BlackRock Future Health ETF |
BlackRock Future Innovators ETF |
|||||||
| |
Period From 09/29/20 to 07/31/21 |
(a)
|
|
Period From 09/29/20 to 07/31/21 |
a)
| |||
|
|
||||||||
| INCREASE (DECREASE) IN NET ASSETS |
||||||||
| OPERATIONS |
||||||||
| Net investment loss |
$ | (36,885 | ) | $ | (87,303 | ) | ||
| Net realized loss |
(4,280 | ) | (301,048 | ) | ||||
| Net change in unrealized appreciation (depreciation) |
1,208,117 | 1,937,581 | ||||||
|
|
|
|
|
|||||
| Net increase in net assets resulting from operations |
1,166,952 | 1,549,230 | ||||||
|
|
|
|
|
|||||
| DISTRIBUTIONS TO SHAREHOLDERS(b) |
||||||||
| Decrease in net assets resulting from distributions to shareholders |
— | — | ||||||
|
|
|
|
|
|||||
| CAPITAL SHARE TRANSACTIONS |
||||||||
| Net increase in net assets derived from capital share transactions |
6,041,627 | 21,475,549 | ||||||
|
|
|
|
|
|||||
| NET ASSETS |
||||||||
| Total increase in net assets |
7,208,579 | 23,024,779 | ||||||
| Beginning of period |
— | — | ||||||
|
|
|
|
|
|||||
| End of period |
$ | 7,208,579 | $ | 23,024,779 | ||||
|
|
|
|
|
|||||
| (a) | Commencement of operations. |
| (b) | Distributions for annual periods determined in accordance with U.S. federal income tax regulations. |
See notes to financial statements.
| F I N A N C I A L S T A T E M E N T S |
47 |
Statements of Changes in Net Assets (continued)
| BlackRock Future Tech ETF |
BlackRock U.S. Carbon Transition Readiness ETF |
|||||||
| |
Period From 09/29/20 to 07/31/21 |
(a)
|
|
Period From 04/06/21 to 07/31/21 |
(a)
| |||
|
|
||||||||
| INCREASE (DECREASE) IN NET ASSETS |
||||||||
| OPERATIONS |
||||||||
| Net investment income (loss) |
$ | (68,698 | ) | $ | 4,524,119 | |||
| Net realized gain (loss) |
(698,086 | ) | 4,006,023 | |||||
| Net change in unrealized appreciation (depreciation) |
3,015,932 | 97,922,108 | ||||||
|
|
|
|
|
|||||
| Net increase in net assets resulting from operations |
2,249,148 | 106,452,250 | ||||||
|
|
|
|
|
|||||
| DISTRIBUTIONS TO SHAREHOLDERS(b) |
||||||||
| Decrease in net assets resulting from distributions to shareholders |
— | (2,591,883 | ) | |||||
|
|
|
|
|
|||||
| CAPITAL SHARE TRANSACTIONS |
||||||||
| Net increase in net assets derived from capital share transactions |
18,069,672 | 1,320,028,513 | ||||||
|
|
|
|
|
|||||
| NET ASSETS |
||||||||
| Total increase in net assets |
20,318,820 | 1,423,888,880 | ||||||
| Beginning of period |
— | — | ||||||
|
|
|
|
|
|||||
| End of period |
$ | 20,318,820 | $ | 1,423,888,880 | ||||
|
|
|
|
|
|||||
| (a) | Commencement of operations. |
| (b) | Distributions for annual periods determined in accordance with U.S. federal income tax regulations. |
See notes to financial statements.
| 48 | 2 0 2 1 B L A C K R O C K A N N U A L R E P O R T T O S H A R E H O L D E R S |
Statements of Changes in Net Assets (continued)
| BlackRock U.S. Equity Factor Rotation ETF |
BlackRock World ex U.S. Carbon Transition Readiness ETF |
|||||||||||
| |
Year Ended 07/31/21 |
|
|
Year Ended 07/31/20 |
|
|
Period From 04/06/21 to 07/31/21 |
(a)
| ||||
|
|
||||||||||||
| INCREASE (DECREASE) IN NET ASSETS |
||||||||||||
| OPERATIONS |
||||||||||||
| Net investment income |
$ | 1,219,829 | $ | 1,358,176 | $ | 4,804,596 | ||||||
| Net realized gain (loss) |
18,458,292 | (1,973,552 | ) | 1,889,479 | ||||||||
| Net change in unrealized appreciation (depreciation) |
8,499,375 | 7,774,743 | 16,258,168 | |||||||||
|
|
|
|
|
|
|
|||||||
| Net increase in net assets resulting from operations |
28,177,496 | 7,159,367 | 22,952,243 | |||||||||
|
|
|
|
|
|
|
|||||||
| DISTRIBUTIONS TO SHAREHOLDERS(b) |
||||||||||||
| Decrease in net assets resulting from distributions to shareholders |
(1,313,062 | ) | (1,213,492 | ) | (3,851,883 | ) | ||||||
|
|
|
|
|
|
|
|||||||
| CAPITAL SHARE TRANSACTIONS |
||||||||||||
| Net increase (decrease) in net assets derived from capital share transactions |
(20,568,074 | ) | 62,831,748 | 586,499,102 | ||||||||
|
|
|
|
|
|
|
|||||||
| NET ASSETS |
||||||||||||
| Total increase in net assets |
6,296,360 | 68,777,623 | 605,599,462 | |||||||||
| Beginning of period |
89,991,825 | 21,214,202 | — | |||||||||
|
|
|
|
|
|
|
|||||||
| End of period |
$ | 96,288,185 | $ | 89,991,825 | $ | 605,599,462 | ||||||
|
|
|
|
|
|
|
|||||||
| (a) | Commencement of operations. |
| (b) | Distributions for annual periods determined in accordance with U.S. federal income tax regulations. |
See notes to financial statements.
| F I N A N C I A L S T A T E M E N T S |
49 |
(For a share outstanding throughout the period)
| BlackRock Future Health ETF |
||||
| |
Period From 09/29/20 to 07/31/21 |
(a)
| ||
|
|
||||
| Net asset value, beginning of period |
$ | 25.13 | ||
|
|
|
|||
| Net investment loss(b) |
(0.15 | ) | ||
| Net realized and unrealized gain(c) |
5.06 | |||
|
|
|
|||
| Net increase from investment operations |
4.91 | |||
|
|
|
|||
| Net asset value, end of period |
$ | 30.04 | ||
|
|
|
|||
| Total Return |
||||
| Based on net asset value |
19.50 | %(d) | ||
|
|
|
|||
| Ratios to Average Net Assets |
||||
| Total expenses |
0.85 | %(e) | ||
|
|
|
|||
| Total expenses after fees waived |
0.85 | %(e) | ||
|
|
|
|||
| Net investment loss |
(0.64 | )%(e) | ||
|
|
|
|||
| Supplemental Data |
||||
| Net assets, end of period (000) |
$ | 7,209 | ||
|
|
|
|||
| Portfolio turnover rate(f) |
39 | %(d) | ||
|
|
|
|||
| (a) | Commencement of operations. |
| (b) | Based on average shares outstanding. |
| (c) | The amount reported for a share outstanding may not accord with the change in aggregate gains and losses in securities for the fiscal period due to the timing of capital share transactions in relation to the fluctuating market values of the Fund’s underlying securities. |
| (d) | Not annualized. |
| (e) | Annualized. |
| (f) | Portfolio turnover rate excludes in-kind transactions. |
See notes to financial statements.
| 50 | 2 0 2 1 B L A C K R O C K A N N U A L R E P O R T T O S H A R E H O L D E R S |
Financial Highlights (continued)
(For a share outstanding throughout the period)
| BlackRock Future Innovators ETF |
||||
| |
Period From 09/29/20 to |
(a)
| ||
|
|
||||
| Net asset value, beginning of period |
$ | 35.18 | ||
|
|
|
|||
| Net investment loss(b) |
(0.27 | ) | ||
| Net realized and unrealized gain(c) |
15.14 | |||
|
|
|
|||
| Net increase from investment operations |
14.87 | |||
|
|
|
|||
| Net asset value, end of period |
$ | 50.05 | ||
|
|
|
|||
| Total Return |
||||
| Based on net asset value |
42.27 | %(d) | ||
|
|
|
|||
| Ratios to Average Net Assets |
||||
| Total expenses |
0.80 | %(e) | ||
|
|
|
|||
| Total expenses after fees waived |
0.80 | %(e) | ||
|
|
|
|||
| Net investment loss |
(0.67 | )%(e) | ||
|
|
|
|||
| Supplemental Data |
||||
| Net assets, end of period (000) |
$ | 23,025 | ||
|
|
|
|||
| Portfolio turnover rate(f) |
50 | %(d) | ||
|
|
|
|||
| (a) | Commencement of operations. |
| (b) | Based on average shares outstanding. |
| (c) | The amount reported for a share outstanding may not accord with the change in aggregate gains and losses in securities for the fiscal period due to the timing of capital share transactions in relation to the fluctuating market values of the Fund’s underlying securities. |
| (d) | Not annualized. |
| (e) | Annualized. |
| (f) | Portfolio turnover rate excludes in-kind transactions. |
See notes to financial statements.
| F I N A N C I A L H I G H L I G H T S |
51 |
Financial Highlights (continued)
(For a share outstanding throughout the period)
| BlackRock Future Tech ETF |
||||
| |
Period From 09/29/20 to |
(a) | ||
|
|
||||
| Net asset value, beginning of period |
$ | 25.25 | ||
|
|
|
|||
| Net investment loss(b) |
(0.18 | ) | ||
| Net realized and unrealized gain(c) |
11.21 | |||
|
|
|
|||
| Net increase from investment operations |
11.03 | |||
|
|
|
|||
| Net asset value, end of period |
$ | 36.28 | ||
|
|
|
|||
| Total Return |
||||
| Based on net asset value |
43.68 | %(d) | ||
|
|
|
|||
| Ratios to Average Net Assets |
||||
| Total expenses |
0.88 | %(e) | ||
|
|
|
|||
| Total expenses after fees waived |
0.88 | %(e) | ||
|
|
|
|||
| Net investment loss |
(0.64 | )%(e) | ||
|
|
|
|||
| Supplemental Data |
||||
| Net assets, end of period (000) |
$ | 20,319 | ||
|
|
|
|||
| Portfolio turnover rate(f) |
38 | %(d) | ||
|
|
|
|||
| (a) | Commencement of operations. |
| (b) | Based on average shares outstanding. |
| (c) | The amount reported for a share outstanding may not accord with the change in aggregate gains and losses in securities for the fiscal period due to the timing of capital share transactions in relation to the fluctuating market values of the Fund’s underlying securities. |
| (d) | Not annualized. |
| (e) | Annualized. |
| (f) | Portfolio turnover rate excludes in-kind transactions. |
See notes to financial statements.
| 52 | 2 0 2 1 B L A C K R O C K A N N U A L R E P O R T T O S H A R E H O L D E R S |
Financial Highlights (continued)
(For a share outstanding throughout the period)
| BlackRock U.S. Carbon Transition Readiness ETF |
||||
| |
Period From 04/06/21 to 07/31/21 |
(a)
| ||
|
|
||||
| Net asset value, beginning of period |
$ | 46.60 | ||
|
|
|
|||
| Net investment income(b) |
0.17 | |||
| Net realized and unrealized gain(c) |
3.90 | |||
|
|
|
|||
| Net increase from investment operations |
4.07 | |||
|
|
|
|||
| Distributions(d) |
||||
| From net investment income |
(0.09 | ) | ||
|
|
|
|||
| Total distributions |
(0.09 | ) | ||
|
|
|
|||
| Net asset value, end of period |
$ | 50.58 | ||
|
|
|
|||
| Total Return |
||||
| Based on net asset value |
8.74 | %(e) | ||
|
|
|
|||
| Ratios to Average Net Assets |
||||
| Total expenses |
0.29 | %(f) | ||
|
|
|
|||
| Total expenses after fees waived |
0.14 | %(f) | ||
|
|
|
|||
| Net investment income |
1.07 | %(f) | ||
|
|
|
|||
| Supplemental Data |
||||
| Net assets, end of period (000) |
$ | 1,423,889 | ||
|
|
|
|||
| Portfolio turnover rate(g) |
13 | %(e) | ||
|
|
|
|||
| (a) | Commencement of operations. |
| (b) | Based on average shares outstanding. |
| (c) | The amount reported for a share outstanding may not accord with the change in aggregate gains and losses in securities for the fiscal period due to the timing of capital share transactions in relation to the fluctuating market values of the Fund’s underlying securities. |
| (d) | Distributions for annual periods determined in accordance with U.S. federal income tax regulations. |
| (e) | Not annualized. |
| (f) | Annualized. |
| (g) | Portfolio turnover rate excludes in-kind transactions. |
See notes to financial statements.
| F I N A N C I A L H I G H L I G H T S |
53 |
Financial Highlights (continued)
(For a share outstanding throughout each period)
| BlackRock U.S. Equity Factor Rotation ETF | ||||||||||||
| |
Year Ended 07/31/21 |
|
|
Year Ended 07/31/20 |
|
|
Period From 03/19/19 to 07/31/19 |
(a)
| ||||
|
|
||||||||||||
| Net asset value, beginning of period |
$ | 27.27 | $ | 26.52 | $ | 25.00 | ||||||
|
|
|
|
|
|
|
|||||||
| Net investment income(b) |
0.45 | 0.52 | 0.16 | |||||||||
| Net realized and unrealized gain(c) |
9.78 | 0.67 | 1.48 | |||||||||
|
|
|
|
|
|
|
|||||||
| Net increase from investment operations |
10.23 | 1.19 | 1.64 | |||||||||
|
|
|
|
|
|
|
|||||||
| Distributions(d) |
||||||||||||
| From net investment income |
(0.47 | ) | (0.44 | ) | (0.12 | ) | ||||||
|
|
|
|
|
|
|
|||||||
| Total distributions |
(0.47 | ) | (0.44 | ) | (0.12 | ) | ||||||
|
|
|
|
|
|
|
|||||||
| Net asset value, end of period |
$ | 37.03 | $ | 27.27 | $ | 26.52 | ||||||
|
|
|
|
|
|
|
|||||||
| Total Return |
||||||||||||
| Based on net asset value |
37.87 | % | 4.61 | % | 6.59 | %(e) | ||||||
|
|
|
|
|
|
|
|||||||
| Ratios to Average Net Assets |
||||||||||||
| Total expenses |
0.30 | % | 0.30 | % | 0.30 | %(f) | ||||||
|
|
|
|
|
|
|
|||||||
| Total expenses after fees waived |
0.20 | % | 0.20 | % | 0.20 | %(f) | ||||||
|
|
|
|
|
|
|
|||||||
| Net investment income |
1.41 | % | 1.97 | % | 1.74 | %(f) | ||||||
|
|
|
|
|
|
|
|||||||
| Supplemental Data |
||||||||||||
| Net assets, end of period (000) |
$ | 96,288 | $ | 89,992 | $ | 21,214 | ||||||
|
|
|
|
|
|
|
|||||||
| Portfolio turnover rate(g) |
146 | % | 175 | % | 42 | %(e) | ||||||
|
|
|
|
|
|
|
|||||||
| (a) | Commencement of operations. |
| (b) | Based on average shares outstanding. |
| (c) | The amounts reported for a share outstanding may not accord with the change in aggregate gains and losses in securities for the fiscal period due to the timing of capital share transactions in relation to the fluctuating market values of the Fund’s underlying securities. |
| (d) | Distributions for annual periods determined in accordance with U.S. federal income tax regulations. |
| (e) | Not annualized. |
| (f) | Annualized. |
| (g) | Portfolio turnover rate excludes in-kind transactions. |
See notes to financial statements.
| 54 | 2 0 2 1 B L A C K R O C K A N N U A L R E P O R T T O S H A R E H O L D E R S |
Financial Highlights (continued)
(For a share outstanding throughout the period)
| BlackRock World ex U.S. Carbon Transition Readiness ETF |
||||
| |
Period From 04/06/21 to 07/31/21 |
(a)
| ||
|
|
||||
| Net asset value, beginning of period |
$ | 46.16 | ||
|
|
|
|||
| Net investment income(b) |
0.39 | |||
| Net realized and unrealized gain(c) |
1.82 | |||
|
|
|
|||
| Net increase from investment operations |
2.21 | |||
|
|
|
|||
| Distributions(d) |
||||
| From net investment income |
(0.31 | ) | ||
|
|
|
|||
| Total distributions |
(0.31 | ) | ||
|
|
|
|||
| Net asset value, end of period |
$ | 48.06 | ||
|
|
|
|||
| Total Return |
||||
| Based on net asset value |
4.77 | %(e) | ||
|
|
|
|||
| Ratios to Average Net Assets |
||||
| Total expenses |
0.35 | %(f) | ||
|
|
|
|||
| Total expenses after fees waived |
0.20 | %(f) | ||
|
|
|
|||
| Net investment income |
2.58 | %(f) | ||
|
|
|
|||
| Supplemental Data |
||||
| Net assets, end of period (000) |
$ | 605,599 | ||
|
|
|
|||
| Portfolio turnover rate(g) |
19 | %(e) | ||
|
|
|
|||
| (a) | Commencement of operations. |
| (b) | Based on average shares outstanding. |
| (c) | The amount reported for a share outstanding may not accord with the change in aggregate gains and losses in securities for the fiscal period due to the timing of capital share transactions in relation to the fluctuating market values of the Fund’s underlying securities. |
| (d) | Distributions for annual periods determined in accordance with U.S. federal income tax regulations. |
| (e) | Not annualized. |
| (f) | Annualized. |
| (g) | Portfolio turnover rate excludes in-kind transactions. |
See notes to financial statements.
| F I N A N C I A L H I G H L I G H T S |
55 |
| 1. | ORGANIZATION |
BlackRock ETF Trust (the “Trust”) is registered under the Investment Company Act of 1940, as amended (the “1940 Act”), as an open-end management investment company. The Trust is organized as a Delaware statutory trust and is authorized to have multiple series or portfolios.
These financial statements relate only to the following funds (each, a “Fund,” and collectively, the “Funds”):
| BlackRock ETF | Diversification Classification | |
| Future Health(a) |
Non-diversified | |
| Future Innovators(a) |
Non-diversified | |
| Future Tech(a) |
Non-diversified | |
| U.S. Carbon Transition Readiness(b) |
Non-diversified | |
| U.S. Equity Factor Rotation |
Non-diversified | |
| World ex U.S. Carbon Transition Readiness(b) |
Non-diversified |
| (a) | The Fund commenced operations on September 29, 2020. |
| (b) | The Fund commenced operations on April 06, 2021. |
The Funds, together with certain other registered investment companies advised by BlackRock Fund Advisors (“BFA” or the “Manager”) or its affiliates, are included in a complex of equity, multi-asset, index and money market funds referred to as the BlackRock Multi-Asset Complex.
| 2. | SIGNIFICANT ACCOUNTING POLICIES |
The financial statements are prepared in conformity with accounting principles generally accepted in the United States of America (“U.S. GAAP”), which may require management to make estimates and assumptions that affect the reported amounts of assets and liabilities in the financial statements, disclosure of contingent assets and liabilities at the date of the financial statements and the reported amounts of increases and decreases in net assets from operations during the reporting period. Actual results could differ from those estimates. Each Fund is considered an investment company under U.S. GAAP and follows the accounting and reporting guidance applicable to investment companies. Below is a summary of significant accounting policies:
Investment Transactions and Income Recognition: For financial reporting purposes, investment transactions are recorded on the dates the transactions are executed. Realized gains and losses on investment transactions are determined using the specific identification method. Dividend income and capital gain distributions, if any, are recorded on the ex-dividend date. Non-cash dividends, if any, are recorded on the ex-dividend date at fair value. Dividends from foreign securities where the ex-dividend date may have passed are subsequently recorded when the Funds are informed of the ex-dividend date. Under the applicable foreign tax laws, a withholding tax at various rates may be imposed on capital gains, dividends and interest. Upon notification from issuers or as estimated by management, a portion of the dividend income received from a real estate investment trust may be redesignated as a reduction of cost of the related investment and/or realized gain.
Foreign Currency Translation: Each Fund’s books and records are maintained in U.S. dollars. Securities and other assets and liabilities denominated in foreign currencies are translated into U.S. dollars using prevailing market rates as quoted by one or more data service providers. Purchases and sales of investments are recorded at the rates of exchange prevailing on the respective dates of such transactions. Generally, when the U.S. dollar rises in value against a foreign currency, the investments denominated in that currency will lose value; the opposite effect occurs if the U.S. dollar falls in relative value.
Each Fund does not isolate the effect of fluctuations in foreign exchange rates from the effect of fluctuations in the market prices of investments for financial reporting purposes. Accordingly, the effects of changes in exchange rates on investments are not segregated in the statements of operations from the effects of changes in market prices of those investments, but are included as a component of net realized and unrealized gain (loss) from investments. Each Fund reports realized currency gains (losses) on foreign currency related transactions as components of net realized gain (loss) for financial reporting purposes, whereas such components are generally treated as ordinary income for U.S. federal income tax purposes.
Foreign Taxes: Certain Funds may be subject to foreign taxes (a portion of which may be reclaimable) on income, stock dividends, capital gains on investments, or certain foreign currency transactions. All foreign taxes are recorded in accordance with the applicable foreign tax regulations and rates that exist in the foreign jurisdictions in which each Fund invests. These foreign taxes, if any, are paid by each Fund and are reflected in its statements of operations as follows: foreign taxes withheld at source are presented as a reduction of income, foreign taxes on securities lending income are presented as a reduction of securities lending income, foreign taxes on stock dividends are presented as “Other foreign taxes”, and foreign taxes on capital gains from sales of investments and foreign taxes on foreign currency transactions are included in their respective net realized gain (loss) categories. Foreign taxes payable or deferred as of July 31, 2021, if any, are disclosed in the statements of assets and liabilities.
The Funds file withholding tax reclaims in certain jurisdictions to recover a portion of amounts previously withheld. The Funds may record a reclaim receivable based on collectability, which includes factors such as the jurisdiction’s applicable laws, payment history and market convention. The statements of operations includes tax reclaims recorded as well as professional and other fees, if any, associated with recovery of foreign withholding taxes.
Segregation and Collateralization: In cases where a Fund enters into certain investments (e.g., futures contracts ) that would be treated as “senior securities” for 1940 Act purposes, a Fund may segregate or designate on its books and record cash or liquid assets having a market value at least equal to the amount of its future obligations
| 56 | 2 0 2 1 B L A C K R O C K A N N U A L R E P O R T T O S H A R E H O L D E R S |
Notes to Financial Statements (continued)
under such investments. Doing so allows the investment to be excluded from treatment as a “senior security.” Furthermore, if required by an exchange or counterparty agreement, the Funds may be required to deliver/deposit cash and/or securities to/with an exchange, or broker-dealer or custodian as collateral for certain investments or obligations.
In-kind Redemptions: For financial reporting purposes, in-kind redemptions are treated as sales of securities resulting in realized capital gains or losses to the Funds. Because such gains or losses are not taxable to the Funds and are not distributed to existing Fund shareholders, the gains or losses are reclassified from accumulated net realized gain (loss) to paid-in capital at the end of the Funds’ tax year. These reclassifications have no effect on net assets or net asset value (“NAV”) per share.
Distributions: Dividends and distributions paid by each Fund are recorded on the ex-dividend dates. Distributions are determined on a tax basis and may differ from net investment income and net realized capital gains for financial reporting purposes. Dividends and distributions are paid in U.S. dollars and cannot be automatically reinvested in additional shares of the Funds. The character and timing of distributions are determined in accordance with U.S. federal income tax regulations, which may differ from U.S. GAAP.
Indemnifications: In the normal course of business, each Fund enters into contracts that contain a variety of representations that provide general indemnification. The Funds’ maximum exposure under these arrangements is unknown because it involves future potential claims against the Funds, which cannot be predicted with any certainty.
3. INVESTMENT VALUATION AND FAIR VALUE MEASUREMENTS
Investment Valuation Policies: Each Fund’s investments are valued at fair value (also referred to as “market value” within the financial statements) each day that the Fund’s listing exchange is open and, for financial reporting purposes, as of the report date. U.S. GAAP defines fair value as the price a fund would receive to sell an asset or pay to transfer a liability in an orderly transaction between market participants at the measurement date. Each Fund determines the fair values of its financial instruments using various independent dealers or pricing services under policies approved by the Board of Trustees of the Trust (the “Board”). If a security’s market price is not readily available or does not otherwise accurately represent the fair value of the security, the security will be valued in accordance with a policy approved by the Board as reflecting fair value. The BlackRock Global Valuation Methodologies Committee (the “Global Valuation Committee”) is the committee formed by management to develop global pricing policies and procedures and to oversee the pricing function for all financial instruments.
Fair Value Inputs and Methodologies: The following methods and inputs are used to establish the fair value of each Fund’s assets and liabilities:
| • | Equity investments traded on a recognized securities exchange are valued at that day’s official closing price, as applicable, on the exchange where the stock is primarily traded. Equity investments traded on a recognized exchange for which there were no sales on that day are valued at the last traded price. |
| • | Investments in open-end U.S. mutual funds (including money market funds) are valued at that day’s published NAV. |
| • | Futures contracts are valued based on that day’s last reported settlement or trade price on the exchange where the contract is traded. |
Generally, trading in foreign instruments is substantially completed each day at various times prior to the close of trading on the New York Stock Exchange (“NYSE”). Each business day, the Funds use current market factors supplied by independent pricing services to value certain foreign instruments (“Systematic Fair Value Price”). The Systematic Fair Value Price is designed to value such foreign securities at fair value as of the close of trading on the NYSE, which follows the close of the local markets.
If events (e.g., market volatility, company announcement or a natural disaster) occur that are expected to materially affect the value of such investment, or in the event that application of these methods of valuation results in a price for an investment that is deemed not to be representative of the market value of such investment, or if a price is not available, the investment will be valued by the Global Valuation Committee, in accordance with a policy approved by the Board as reflecting fair value (“Fair Valued Investments”). The fair valuation approaches that may be used by the Global Valuation Committee include market approach, income approach and cost approach. Valuation techniques such as discounted cash flow, use of market comparables and matrix pricing are types of valuation approaches and are typically used in determining fair value. When determining the price for Fair Valued Investments, the Global Valuation Committee, or its delegate, seeks to determine the price that each Fund might reasonably expect to receive or pay from the current sale or purchase of that asset or liability in an arm’s-length transaction. Fair value determinations shall be based upon all available factors that the Global Valuation Committee, or its delegate, deems relevant and consistent with the principles of fair value measurement. The pricing of all Fair Valued Investments is subsequently reported to the Board or a committee thereof on a quarterly basis.
Fair Value Hierarchy: Various inputs are used in determining the fair value of financial instruments. These inputs to valuation techniques are categorized into a fair value hierarchy consisting of three broad levels for financial reporting purposes as follows:
| • | Level 1 – Unadjusted price quotations in active markets/exchanges for identical assets or liabilities that each Fund has the ability to access; |
| • | Level 2 – Other observable inputs (including, but not limited to, quoted prices for similar assets or liabilities in markets that are active, quoted prices for identical or similar assets or liabilities in markets that are not active, inputs other than quoted prices that are observable for the assets or liabilities (such as interest rates, yield curves, volatilities, prepayment speeds, loss severities, credit risks and default rates) or other market-corroborated inputs); and |
| • | Level 3 – Unobservable inputs based on the best information available in the circumstances, to the extent observable inputs are not available, (including the Global Valuation Committee’s assumptions used in determining the fair value of financial instruments). |
The hierarchy gives the highest priority to unadjusted quoted prices in active markets for identical assets or liabilities (Level 1 measurements) and the lowest priority to unobservable inputs (Level 3 measurements). Accordingly, the degree of judgment exercised in determining fair value is greatest for instruments categorized in Level 3. The inputs used to measure fair value may fall into different levels of the fair value hierarchy. In such cases, for disclosure purposes, the fair value hierarchy classification is determined based on the lowest level input that is significant to the fair value measurement in its entirety. Investments classified within Level 3 have significant unobservable inputs used by the Global Valuation Committee in determining the price for Fair Valued Investments. Level 3 investments include equity or debt issued by privately held
| N O T E S T O F I N A N C I A L S T A T E M E N T S |
57 |
Notes to Financial Statements (continued)
companies or funds that may not have a secondary market and/or may have a limited number of investors. The categorization of a value determined for financial instruments is based on the pricing transparency of the financial instruments and is not necessarily an indication of the risks associated with investing in those securities.
4. SECURITIES AND OTHER INVESTMENTS
Warrants: Warrants entitle a fund to purchase a specified number of shares of common stock and are non-income producing. The purchase price and number of shares are subject to adjustment under certain conditions until the expiration date of the warrants, if any. If the price of the underlying stock does not rise above the strike price before the warrant expires, the warrant generally expires without any value and a fund will lose any amount it paid for the warrant. Thus, investments in warrants may involve more risk than investments in common stock. Warrants may trade in the same markets as their underlying stock; however, the price of the warrant does not necessarily move with the price of the underlying stock.
Securities Lending: Each Fund may lend its securities to approved borrowers, such as brokers, dealers and other financial institutions. The borrower pledges and maintains with the Fund collateral consisting of cash, an irrevocable letter of credit issued by an approved bank, or securities issued or guaranteed by the U.S. government. The initial collateral received by each Fund is required to have a value of at least 102% of the current market value of the loaned securities for securities traded on U.S. exchanges and a value of at least 105% for all other securities. The collateral is maintained thereafter at a value equal to at least 100% of the current value of the securities on loan. The market value of the loaned securities is determined at the close of each business day of the Fund and any additional required collateral is delivered to the Fund or excess collateral is returned by the Fund, on the next business day. During the term of the loan, each Fund is entitled to all distributions made on or in respect of the loaned securities but does not receive interest income on securities received as collateral. Loans of securities are terminable at any time and the borrower, after notice, is required to return borrowed securities within the standard time period for settlement of securities transactions.
As of period end, any securities on loan were collateralized by cash and/or U.S. Government obligations. Cash collateral invested in money market funds managed by BlackRock Fund Advisors (“BFA”), the Funds’ investment adviser, or its affiliates is disclosed in the schedules of investments. Any non-cash collateral received cannot be sold, re-invested or pledged by the Fund, except in the event of borrower default. The securities on loan, if any, are also disclosed in each Fund’s schedule of investments. The market value of any securities on loan and the value of any related cash collateral are disclosed in the statements of assets and liabilities.
Securities lending transactions are entered into by the Funds under Master Securities Lending Agreements (each, an “MSLA”) which provide the right, in the event of default (including bankruptcy or insolvency) for the non-defaulting party to liquidate the collateral and calculate a net exposure to the defaulting party or request additional collateral. In the event that a borrower defaults, the Funds, as lender, would offset the market value of the collateral received against the market value of the securities loaned. When the value of the collateral is greater than that of the market value of the securities loaned, the lender is left with a net amount payable to the defaulting party. However, bankruptcy or insolvency laws of a particular jurisdiction may impose restrictions on or prohibitions against such a right of offset in the event of an MSLA counterparty’s bankruptcy or insolvency. Under the MSLA, absent an event of default, the borrower can resell or re-pledge the loaned securities, and the Funds can reinvest cash collateral received in connection with loaned securities. Upon an event of default, the parties’ obligations to return the securities or collateral to the other party are extinguished, and the parties can resell or re-pledge the loaned securities or the collateral received in connection with the loaned securities in order to satisfy the defaulting party’s net payment obligation for all transactions under the MSLA. The defaulting party remains liable for any deficiency.
As of period end, the following table is a summary of the securities on loan by counterparty which are subject to offset under an MSLA:
| BlackRock ETF and Counterparty | |
Market Value of Securities on Loan |
|
|
Cash Collateral Received |
(a) |
|
Non-Cash Collateral Received |
|
Net Amount | ||||||
| Future Health |
||||||||||||||||
| Barclays Bank PLC |
$ | 140,123 | $ | 140,123 | $ | — | $ | — | ||||||||
| BofA Securities, Inc. |
6,173 | 6,173 | — | — | ||||||||||||
| Citadel Clearing LLC |
11,800 | 11,800 | — | — | ||||||||||||
| Jefferies LLC |
12,948 | 12,948 | — | — | ||||||||||||
| UBS AG |
7,560 | 7,560 | — | — | ||||||||||||
|
|
|
|
|
|
|
|
|
|||||||||
| $ | 178,604 | $ | 178,604 | $ | — | $ | — | |||||||||
|
|
|
|
|
|
|
|
|
|||||||||
| Future Innovators |
||||||||||||||||
| Barclays Bank PLC |
$ | 577,261 | $ | 577,261 | $ | — | $ | — | ||||||||
| BofA Securities, Inc. |
632,922 | 632,922 | — | — | ||||||||||||
| Citadel Clearing LLC |
395,024 | 395,024 | — | — | ||||||||||||
| Citigroup Global Markets Inc. |
930,341 | 930,341 | — | — | ||||||||||||
| Pershing LLC |
99,153 | 99,153 | — | — | ||||||||||||
| UBS AG |
420,879 | 420,879 | — | — | ||||||||||||
|
|
|
|
|
|
|
|
|
|||||||||
| $ | 3,055,580 | $ | 3,055,580 | $ | — | $ | — | |||||||||
|
|
|
|
|
|
|
|
|
| 58 | 2 0 2 1 B L A C K R O C K A N N U A L R E P O R T T O S H A R E H O L D E R S |
Notes to Financial Statements (continued)
|
|
||||||||||||||||
| BlackRock ETF and Counterparty | |
Market Value of Securities on Loan |
|
|
Cash Collateral Received |
(a) |
|
Non-Cash Collateral Received |
|
Net Amount | ||||||
|
|
||||||||||||||||
| Future Tech |
||||||||||||||||
| Barclays Bank PLC |
$ | 611,873 | $ | 611,873 | $ | — | $ | — | ||||||||
| BNP Paribas Securities Corp. |
231,408 | 231,408 | — | — | ||||||||||||
| BofA Securities, Inc. |
117,364 | 117,364 | — | — | ||||||||||||
| Citigroup Global Markets Inc. |
912,677 | 912,677 | — | — | ||||||||||||
| Goldman Sachs & Co. |
676,157 | 676,157 | — | — | ||||||||||||
| Nomura Securities International Inc. |
122,714 | 122,714 | — | — | ||||||||||||
| TD Prime Services LLC |
216,780 | 216,780 | — | — | ||||||||||||
|
|
|
|
|
|
|
|
|
|||||||||
| $ | 2,888,973 | $ | 2,888,973 | $ | — | $ | — | |||||||||
|
|
|
|
|
|
|
|
|
|||||||||
| U.S. Carbon Transition Readiness |
||||||||||||||||
| Credit Suisse Securities (USA) LLC |
$ | 204,288 | $ | 204,288 | $ | — | $ | — | ||||||||
| JPMorgan Securities LLC |
817,934 | 817,934 | — | — | ||||||||||||
|
|
|
|
|
|
|
|
|
|||||||||
| $ | 1,022,222 | $ | 1,022,222 | $ | — | $ | — | |||||||||
|
|
|
|
|
|
|
|
|
|||||||||
| U.S. Equity Factor Rotation |
||||||||||||||||
| BNP Paribas Prime Brokerage International Ltd. |
$ | 125,437 | $ | 121,351 | $ | — | $ | (4,086) | (b) | |||||||
| BNP Paribas Securities Corp. |
7,724 | 7,724 | — | — | ||||||||||||
| Credit Suisse Securities (USA) LLC |
20,003 | 18,548 | — | (1,455) | (b) | |||||||||||
| JPMorgan Securities LLC |
48,384 | 48,328 | — | (56) | (b) | |||||||||||
| Morgan Stanley & Co. LLC |
105,547 | 102,138 | — | (3,409) | (b) | |||||||||||
| Scotia Capital (USA) Inc. |
53,233 | 53,233 | — | — | ||||||||||||
| State Street Bank & Trust Company |
252 | 243 | — | (9) | (b) | |||||||||||
| UBS AG |
291,237 | 285,382 | — | (5,855) | (b) | |||||||||||
|
|
|
|
|
|
|
|
|
|||||||||
| $ | 651,817 | $ | 636,947 | $ | — | $ | (14,870) | |||||||||
|
|
|
|
|
|
|
|
|
|||||||||
| (a) | Collateral received in excess of the market value of securities on loan is not presented in this table. The total cash collateral received by each Fund is disclosed in the Fund’s statement of assets and liabilities. |
| (b) | The market value of the loaned securities is determined as of July 31, 2021. Additional collateral is delivered to the Fund on the next business day in accordance with the MSLA. The net amount would be subject to the borrower default indemnity in the event of default by a counterparty. |
The risks of securities lending include the risk that the borrower may not provide additional collateral when required or may not return the securities when due. To mitigate these risks, each Fund benefits from a borrower default indemnity provided by BlackRock, Inc. (“BlackRock”). BlackRock’s indemnity allows for full replacement of the securities loaned to the extent the collateral received does not cover the value of the securities loaned in the event of borrower default. Each Fund could incur a loss if the value of an investment purchased with cash collateral falls below the market value of the loaned securities or if the value of an investment purchased with cash collateral falls below the value of the original cash collateral received. Such losses are borne entirely by each Fund.
5. DERIVATIVE FINANCIAL INSTRUMENTS
Futures Contracts: Futures contracts are purchased or sold to gain exposure to, or manage exposure to, changes in interest rates (interest rate risk) and changes in the value of equity securities (equity risk) or foreign currencies (foreign currency exchange rate risk).
Futures contracts are exchange-traded agreements between the Funds and a counterparty to buy or sell a specific quantity of an underlying instrument at a specified price and on a specified date. Depending on the terms of a contract, it is settled either through physical delivery of the underlying instrument on the settlement date or by payment of a cash amount on the settlement date. Upon entering into a futures contract, the Funds are required to deposit initial margin with the broker in the form of cash or securities in an amount that varies depending on a contract’s size and risk profile. The initial margin deposit must then be maintained at an established level over the life of the contract. Amounts pledged, which are considered restricted, are included in cash pledged for futures contracts in the statements of assets and liabilities.
Securities deposited as initial margin are designated in the schedule of investments and cash deposited, if any, are shown as cash pledged for futures contracts in the statements of assets and liabilities. Pursuant to the contract, the Funds agree to receive from or pay to the broker an amount of cash equal to the daily fluctuation in market value of the contract (“variation margin”). Variation margin is recorded as unrealized appreciation (depreciation) and, if any, shown as variation margin receivable (or payable) on futures contracts in the statements of assets and liabilities. When the contract is closed, a realized gain or loss is recorded in the statements of operations equal to the difference between the notional amount of the contract at the time it was opened and the notional amount at the time it was closed. The use of futures contracts involves the risk of an imperfect correlation in the movements in the price of futures contracts and interest rates, foreign currency exchange rates or underlying assets.
| N O T E S T O F I N A N C I A L S T A T E M E N T S |
59 |
Notes to Financial Statements (continued)
6. INVESTMENT ADVISORY AGREEMENT AND OTHER TRANSACTIONS WITH AFFILIATES
Investment Advisory Fees: Pursuant to an Investment Advisory Agreement with the Trust, BFA manages the investment of each Fund’s assets. BFA is a California corporation indirectly owned by BlackRock. Under the Investment Advisory Agreement, BFA is responsible for substantially all expenses of the Funds, except (i) interest and taxes; (ii) brokerage commissions and other expenses connected with the execution of portfolio transactions; (iii) distribution fees; (iv) the advisory fee payable to BFA; and (v) litigation expenses and any extraordinary expenses (in each case as determined by a majority of the independent trustees).
For its investment advisory services to the BlackRock Future Health ETF, BFA will be paid a management fee from the Fund based on a percentage of the Fund’s average daily net assets as follows:
| Average Daily Net Assets | Investment Advisory Fee | |||
| First $1 billion |
0.85 | % | ||
| Over $1 billion, up to and including $3 billion |
0.80 | |||
| Over $3 billion, up to and including $5 billion |
0.77 | |||
| Over $5 billion, up to and including $10 billion |
0.74 | |||
| Over $10 billion |
0.72 | |||
For its investment advisory services to the BlackRock Future Innovators ETF, BFA will be paid a management fee from the Fund based on a percentage of the Fund’s average daily net assets as follows:
| Average Daily Net Assets | Investment Advisory Fee | |||
| First $1 billion |
0.80 | % | ||
| Over $1 billion, up to and including $3 billion |
0.75 | |||
| Over $3 billion, up to and including $5 billion |
0.72 | |||
| Over $5 billion, up to and including $10 billion |
0.70 | |||
| Over $10 billion |
0.68 | |||
For its investment advisory services to the BlackRock Future Tech ETF, BFA will be paid a management fee from the Fund based on a percentage of the Fund’s average daily net assets as follows:
| Average Daily Net Assets | Investment Advisory Fee | |||
| First $1 billion |
0.88 | % | ||
| Over $1 billion, up to and including $3 billion |
0.83 | |||
| Over $3 billion, up to and including $5 billion |
0.79 | |||
| Over $5 billion, up to and including $10 billion |
0.77 | |||
| Over $10 billion |
0.75 | |||
For its investment advisory services to the BlackRock U.S. Carbon Transition Readiness ETF and BlackRock U.S. Equity Factor Rotation ETF, BFA will be paid a management fee from the Fund based on a percentage of the Fund’s average daily net assets as follows:
| Average Daily Net Assets | Investment Advisory Fee | |||
| First $1 billion |
0.30 | % | ||
| Over $1 billion, up to and including $3 billion |
0.28 | |||
| Over $3 billion, up to and including $5 billion |
0.27 | |||
| Over $5 billion, up to and including $10 billion |
0.26 | |||
| Over $10 billion |
0.25 | |||
For its investment advisory services to the BlackRock World ex U.S. Carbon Transition Readiness ETF, BFA will be paid a management fee from the Fund based on a percentage of the Fund’s average daily net assets as follows:
| Average Daily Net Assets | Investment Advisory Fee | |||
| First $1 billion |
0.35 | % | ||
| Over $1 billion, up to and including $3 billion |
0.33 | |||
| Over $3 billion, up to and including $5 billion |
0.32 | |||
| Over $5 billion, up to and including $10 billion |
0.30 | |||
| Over $10 billion |
0.29 | |||
Expense Waivers: Effective April 27, 2021, BFA has contractually agreed to waive 0.15% of its management fee payable for each of the U.S. Carbon Transition Readiness and World ex U.S. Carbon Transition Readiness ETFs, through June 30, 2024. The contractual agreement may be terminated upon 90 days’ notice by a majority of the
| 60 | 2 0 2 1 B L A C K R O C K A N N U A L R E P O R T T O S H A R E H O L D E R S |
Notes to Financial Statements (continued)
non-interested trustees of the Trust or by a vote of a majority of the outstanding voting securities of the Fund. Prior to April 27, 2021, such agreement to waive a portion of each Fund’s management fee was voluntary.
For the U.S. Equity Factor Rotation ETF, BFA has voluntarily agreed to waive its management fee payable by the U.S. Equity Factor Rotation ETF to limit the annual management fee paid by the Fund to 0.20%. BFA may also from time to time voluntarily waive and/or reimburse fees or expenses in order to limit total annual fund operating expenses (excluding acquired fund fees and expenses, if any). Any such voluntary waiver or reimbursement may be eliminated by BFA at any time.
These amounts are included in investment advisory fees waived in the Statements of Operations. For the year ended July 31, 2021, the amounts waived in investment advisory fees pursuant to this arrangement were as follows:
| BlackRock ETF | Amounts waived | |||
| U.S. Carbon Transition Readiness |
$ | 633,851 | ||
| U.S. Equity Factor Rotation |
86,372 | |||
| World ex U.S. Carbon Transition Readiness |
279,262 | |||
Additionally, BFA has contractually agreed to waive its management fees by the amount of investment advisory fees the Fund pays to BFA indirectly through its investment in money market funds managed by BFA or its affiliates, through June 30, 2023 for each of the U.S. Carbon Transition Readiness and World ex U.S. Carbon Transition Readiness ETFs, and through November 30, 2021 for each of the Future Health ETF, Future Innovators ETF, Future Tech ETF and U.S. Equity Factor Rotation ETF. These amounts are included in investment advisory fees waived in the Statements of Operations. For the year ended July 31, 2021, the amounts waived in investment advisory fees pursuant to this arrangement were as follows:
| BlackRock ETF | Amounts waived | |||
| Future Health |
$ | 158 | ||
| Future Innovators |
38 | |||
| Future Tech |
212 | |||
| U.S. Carbon Transition Readiness |
2,440 | |||
| U.S. Equity Factor Rotation |
5 | |||
| World ex U.S. Carbon Transition Readiness |
1,062 | |||
Distributor: BlackRock Investments, LLC, an affiliate of BFA, is the distributor for each Fund. Pursuant to the distribution agreement, BFA is responsible for any fees or expenses for distribution services provided to the Funds.
Securities Lending: The U.S. Securities and Exchange Commission (the “SEC”) has issued an exemptive order which permits BlackRock Institutional Trust Company, N.A. (“BTC”), an affiliate of BFA, to serve as securities lending agent for the Funds, subject to applicable conditions. As securities lending agent, BTC bears all operational costs directly related to securities lending. The Funds are responsible for fees in connection with the investment of cash collateral received for securities on loan (the “collateral investment fees”). The cash collateral is invested in a money market fund, BlackRock Cash Funds: Institutional or BlackRock Cash Funds: Treasury, managed by BFA or its affiliates. However, BTC has agreed to reduce the amount of securities lending income it receives in order to effectively limit the collateral investment fees the Funds bear to an annual rate of 0.04%. The SL Agency Shares of such money market fund will not be subject to a sales load, distribution fee or service fee. The money market fund in which the cash collateral has been invested may, under certain circumstances, impose a liquidity fee of up to 2% of the value redeemed or temporarily restrict redemptions for up to 10 business days during a 90 day period, in the event that the money market fund’s weekly liquid assets fall below certain thresholds.
Securities lending income is equal to the total of income earned from the reinvestment of cash collateral, net of fees and other payments to and from borrowers of securities, and less the collateral investment fees. Each Fund retains a portion of securities lending income and remits a remaining portion to BTC as compensation for its services as securities lending agent.
Pursuant to the current securities lending agreement, each of BlackRock Future Health ETF, BlackRock Future Innovators ETF, BlackRock U.S. Carbon Transition Readiness ETF and BlackRock U.S. Equity Factor Rotation ETF (the “Group 1 Funds”), retains 77% of securities lending income (which excludes collateral investment fees) and the amount retained can never be less than 70% of the total of securities lending income plus the collateral investment fees.
Pursuant to the current securities lending agreement, each of BlackRock Future Tech ETF and BlackRock World ex U.S. Carbon Transition Readiness ETF (the “Group 2 Funds”), retains 82% of securities lending income (which excludes collateral investment fees) and the amount retained can never be less than 70% of the total of securities lending income plus the collateral investment fees.
In addition, commencing the business day following the date that the aggregate securities lending income plus the collateral investment fees earned across the BlackRock Multi-Asset Complex in a calendar year exceeds a specified threshold: (1) each Group 1 Fund, pursuant to the securities lending agreement, will retain for the remainder of that calendar year 81% of securities lending income (which excludes collateral investment fees), and the amount retained can never be less than 70% of the total of securities lending income plus the collateral investment fees, and (2) each Group 2 Fund will retain for the remainder of that calendar year 85% of securities lending income (which excludes collateral investment fees), and the amount retained can never be less than 70% of the total of securities lending income plus the collateral investment fees.
Prior to January 1, 2021, each Group 1 Fund retained 75% of securities lending income (which excludes collateral investment fees) and the amount retained was not less than 70% of the total of securities lending income plus the collateral investment fees. Each Group 2 Fund retained 82% of securities lending income (which excludes collateral investment fees) and the amount retained was not less than 70% of the total of securities lending income plus the collateral investment fees. In addition, commencing the business day following the date that the aggregate securities lending income plus the collateral investment fees earned across the BlackRock Multi-Asset
| N O T E S T O F I N A N C I A L S T A T E M E N T S |
61 |
Notes to Financial Statements (continued)
Complex in a calendar year exceeded a specified threshold: (1) each Group 1 Fund, pursuant to the securities lending agreement, retained for the remainder of that calendar year 80% of securities lending income (which excludes collateral investment fees), and the amount retained could never be less than 70% of the total of securities lending income plus the collateral investment fees, and (2) each Group 2 Fund, pursuant to the securities lending agreement, retained for the remainder of that calendar year 85% of securities lending income (which excludes collateral investment fees), and the amount retained could never be less than 70% of the total of securities lending income plus the collateral investment fees.
The share of securities lending income earned by each Fund is shown as securities lending income – affiliated – net in its statements of operations. For the year ended July 31, 2021, the Funds paid BTC the following amounts for securities lending agent services:
| BlackRock ETF | Fees Paid to BTC |
|||
| Future Health |
$ | 245 | ||
| Future Innovators |
1,318 | |||
| Future Tech |
2,865 | |||
| U.S. Carbon Transition Readiness |
8,400 | |||
| U.S. Equity Factor Rotation |
757 | |||
Officers and Trustees: Certain officers and/or trustees of the Trust are officers and/or trustees of BlackRock or its affiliates.
Other Transactions: Cross trading is the buying or selling of portfolio securities between funds to which BFA (or an affiliate) serves as investment adviser. At its regularly scheduled quarterly meetings, the Board reviews such transactions as of the most recent calendar quarter for compliance with the requirements and restrictions set forth by Rule 17a-7.
For the year ended July 31, 2021, transactions executed by the Funds pursuant to Rule 17a-7 under the 1940 Act were as follows:
| BlackRock ETF | Purchases | Sales | Net Realized Gain (Loss) |
|||||||||
| U.S. Equity Factor Rotation |
$ | 4,742,454 | $ | 8,415,696 | $ | 536,105 | ||||||
Each Fund may invest its positive cash balances in certain money market funds managed by BFA or an affiliate. The income earned on these temporary cash investments is shown as dividends – affiliated in the statements of operations.
7. PURCHASES AND SALES
For the year ended July 31, 2021, purchases and sales of investments, excluding short-term investments and in-kind transactions, were as follows:
| BlackRock ETF | Purchases | Sales | ||||||
| Future Health |
$ | 2,588,888 | $ | 2,967,232 | ||||
| Future Innovators |
7,709,354 | 7,703,296 | ||||||
| Future Tech |
7,486,913 | 4,829,270 | ||||||
| U.S. Carbon Transition Readiness |
147,287,083 | 149,880,970 | ||||||
| U.S. Equity Factor Rotation |
125,062,825 | 126,161,040 | ||||||
| World ex U.S. Carbon Transition Readiness |
112,462,520 | 91,444,980 | ||||||
For the year ended July 31, 2021, in-kind transactions were as follows:
| BlackRock ETF | In-kind Purchases |
In-kind Sales |
||||||
| Future Health |
$ | 5,908,522 | $ | — | ||||
| Future Innovators |
21,383,470 | — | ||||||
| Future Tech |
14,597,925 | — | ||||||
| U.S. Carbon Transition Readiness |
1,308,773,960 | 2,336,441 | ||||||
| U.S. Equity Factor Rotation |
14,263,725 | 33,722,044 | ||||||
| World ex U.S. Carbon Transition Readiness |
562,472,369 | — | ||||||
8. INCOME TAX INFORMATION
Each Fund is treated as an entity separate from the Trust’s other funds for federal income tax purposes. It is each Fund’s policy to comply with the requirements of the Internal Revenue Code of 1986, as amended, applicable to regulated investment companies, and to distribute substantially all of its taxable income to its shareholders. Therefore, no U.S. federal income tax provision is required.
| 62 | 2 0 2 1 B L A C K R O C K A N N U A L R E P O R T T O S H A R E H O L D E R S |
Notes to Financial Statements (continued)
Management has analyzed tax laws and regulations and their application to the Funds as of July 31, 2021, inclusive of the open tax return years, and does not believe that there are any uncertain tax positions that require recognition of a tax liability in the Funds’ financial statements.
U.S. GAAP requires that certain components of net assets be adjusted to reflect permanent differences between financial and tax reporting. These reclassifications have no effect on net assets or NAV per share. As of July 31, 2021, the following permanent differences attributable to certain deemed distributions, net operating loss and realized gains (losses) from in-kind redemptions were reclassified to the following accounts:
| BlackRock ETF | Paid-in Capital | Accumulated Earnings |
||||||
| Future Health |
$ | (36,601 | ) | $ | 36,601 | |||
| Future Innovators |
(88,597 | ) | 88,597 | |||||
| Future Tech |
(13,339 | ) | 13,339 | |||||
| U.S. Carbon Transition Readiness |
50,276 | (50,276 | ) | |||||
| U.S. Equity Factor Rotation |
9,078,541 | (9,078,541 | ) | |||||
The tax character of distributions paid was as follows:
| BlackRock ETF | Period Ended 07/31/21 |
|||
| U.S. Carbon Transition Readiness |
$ | 2,591,883 | ||
|
|
|
|||
| BlackRock ETF | Year Ended 07/31/21 |
Year Ended 07/31/20 |
||||||
| U.S. Equity Factor Rotation(a) |
||||||||
| Ordinary income |
$ | 1,341,151 | $ | 1,213,492 | ||||
| Long-term capital gains(b) |
35,485 | — | ||||||
|
|
|
|
|
|||||
| $ | 1,376,636 | $ | 1,213,492 | |||||
|
|
|
|
|
|||||
| BlackRock ETF | Period Ended 07/31/21 |
|||
| World ex U.S. Carbon Transition Readiness |
||||
| Ordinary income |
$ | 3,851,883 | ||
|
|
|
|||
| (a) | Distribution amounts may include a portion of the proceeds from redeemed shares. |
| (b) | The Fund designate these amounts paid during the fiscal year ended July 31, 2021 as capital gain dividends, subject to a long-term capital gains tax rate of not greater than 20%. |
As of July 31, 2021, the tax components of accumulated net earnings (losses) were as follows:
| BlackRock ETF | |
Undistributed Ordinary Income |
|
|
Undistributed Long-Term Capital Gains |
|
|
Non-expiring Capital Loss Carryforwards |
(a) |
|
Net Unrealized Gains (Losses) |
(b) |
|
Qualified Late-Year Losses |
(c) |
Total | ||||||||
| Future Health |
$ | — | $ | — | $ | (3,716 | ) | $ | 1,207,269 | $ | — | $ | 1,203,553 | |||||||||||
| Future Innovators |
— | — | (183,439 | ) | 1,821,266 | — | 1,637,827 | |||||||||||||||||
| Future Tech |
— | — | (685,890 | ) | 3,007,649 | (59,272 | ) | 2,262,487 | ||||||||||||||||
| U.S. Carbon Transition Readiness |
6,234,126 | 431,483 | — | 97,144,482 | — | 103,810,091 | ||||||||||||||||||
| U.S. Equity Factor Rotation |
2,175,909 | 2,630,619 | — | 16,579,485 | — | 21,386,013 | ||||||||||||||||||
| World ex U.S. Carbon Transition |
||||||||||||||||||||||||
| Readiness |
3,067,710 | 235,381 | — | 15,797,269 | — | 19,100,360 | ||||||||||||||||||
| (a) | Amounts available to offset future realized capital gains. |
| (b) | The difference between book-basis and tax-basis unrealized gains (losses) was attributable primarily to the tax deferral of losses on wash sales, the realization for tax purposes of unrealized gains (losses) on certain futures contracts and the realization for tax purposes of unrealized gains on investments in passive foreign investment companies. |
| (c) | The Funds have elected to defer certain qualified late-year losses and recognize such losses in the next taxable year. |
For the year ended July 31, 2021, the U.S. Equity Factor Rotation utilized $2,957,755 of its capital loss carryforwards.
A fund may own shares in certain foreign investment entities, referred to, under U.S. tax law, as “passive foreign investment companies.” Such fund may elect to mark-to-market annually the shares of each passive foreign investment company and would be required to distribute to shareholders any such marked-to-market gains.
| N O T E S T O F I N A N C I A L S T A T E M E N T S |
63 |
Notes to Financial Statements (continued)
As of July 31, 2021, gross unrealized appreciation and depreciation based on cost of investments (including short positions and derivatives, if any) for U.S. federal income tax purposes were as follows:
| BlackRock ETF | Tax Cost | Gross Unrealized Appreciation |
Gross Unrealized Depreciation |
Net Unrealized Appreciation (Depreciation) |
||||||||||||
| Future Health |
$ | 6,138,825 | $ | 1,350,888 | $ | (143,617) | $ | 1,207,271 | ||||||||
| Future Innovators |
24,406,372 | 3,388,252 | (1,566,995 | ) | 1,821,257 | |||||||||||
| Future Tech |
20,416,122 | 3,429,659 | (422,030 | ) | 3,007,629 | |||||||||||
| U.S. Carbon Transition Readiness |
1,325,736,256 | 116,229,164 | (19,084,682 | ) | 97,144,482 | |||||||||||
| U.S. Equity Factor Rotation |
80,474,948 | 17,549,661 | (970,176 | ) | 16,579,485 | |||||||||||
| World ex U.S. Carbon Transition Readiness |
588,637,034 | 33,631,717 | (17,830,476 | ) | 15,801,241 | |||||||||||
9. LINE OF CREDIT
BlackRock ETF Trust, on behalf of each Fund, along with certain other funds managed by the Manager and its affiliates (“Participating Funds”), is a party to a 364-day, $2.25 billion credit agreement with a group of lenders. Under this agreement, the Funds may borrow to fund shareholder redemptions. Excluding commitments designated for certain individual funds, the Participating Funds, including the Funds, can borrow up to an aggregate commitment amount of $1.75 billion at any time outstanding, subject to asset coverage and other limitations as specified in the agreement. The credit agreement has the following terms: a fee of 0.10% per annum on unused commitment amounts and interest at a rate equal to the higher of (a) one-month LIBOR (but, in any event, not less than 0.00%) on the date the loan is made plus 0.80% per annum or (b) the Fed Funds rate (but, in any event, not less than 0.00%) in effect from time to time plus 0.80% per annum on amounts borrowed. The agreement expires in April 2022 unless extended or renewed. These fees were allocated among such funds based upon portions of the aggregate commitment available to them and relative net assets of Participating Funds. During the year ended July 31, 2021, the Funds did not borrow under the credit agreement.
10. PRINCIPAL RISKS
In the normal course of business, each Fund invests in securities or other instruments and may enter into certain transactions, and such activities subject the Fund to various risks, including, among others, fluctuations in the market (market risk) or failure of an issuer to meet all of its obligations. The value of securities or other instruments may also be affected by various factors, including, without limitation: (i) the general economy; (ii) the overall market as well as local, regional or global political and/or social instability; (iii) regulation, taxation or international tax treaties between various countries; or (iv) currency, interest rate or price fluctuations. Local, regional or global events such as war, acts of terrorism, the spread of infectious illness or other public health issues, recessions, or other events could have a significant impact on the Funds and their investments. Each Fund’s prospectus provides details of the risks to which the Fund is subject.
The Funds may be exposed to additional risks when reinvesting cash collateral in money market funds that do not seek to maintain a stable NAV per share of $1.00, which may be subject to redemption gates or liquidity fees under certain circumstances.
Market Risk: An outbreak of respiratory disease caused by a novel coronavirus has developed into a global pandemic and has resulted in closing borders, quarantines, disruptions to supply chains and customer activity, as well as general concern and uncertainty. The impact of this pandemic, and other global health crises that may arise in the future, could affect the economies of many nations, individual companies and the market in general in ways that cannot necessarily be foreseen at the present time. This pandemic may result in substantial market volatility and may adversely impact the prices and liquidity of a fund’s investments. The duration of this pandemic and its effects cannot be determined with certainty.
Valuation Risk: The market values of equities, such as common stocks and preferred securities or equity related investments, such as futures and options, may decline due to general market conditions which are not specifically related to a particular company. They may also decline due to factors which affect a particular industry or industries. A fund may invest in illiquid investments. An illiquid investment is any investment that a fund reasonably expects cannot be sold or disposed of in current market conditions in seven calendar days or less without the sale or disposition significantly changing the market value of the investment. A fund may experience difficulty in selling illiquid investments in a timely manner at the price that it believes the investments are worth. Prices may fluctuate widely over short or extended periods in response to company, market or economic news. Markets also tend to move in cycles, with periods of rising and falling prices. This volatility may cause a fund’s NAV to experience significant increases or decreases over short periods of time. If there is a general decline in the securities and other markets, the NAV of a fund may lose value, regardless of the individual results of the securities and other instruments in which a fund invests.
Counterparty Credit Risk: The Funds may be exposed to counterparty credit risk, or the risk that an entity may fail to or be unable to perform on its commitments related to unsettled or open transactions, including making timely interest and/or principal payments or otherwise honoring its obligations. The Funds manage counterparty credit risk by entering into transactions only with counterparties that the Manager believes have the financial resources to honor their obligations and by monitoring the financial stability of those counterparties. Financial assets, which potentially expose the Funds to market, issuer and counterparty credit risks, consist principally of financial instruments and receivables due from counterparties. The extent of the Funds’ exposure to market, issuer and counterparty credit risks with respect to these financial assets is approximately their value recorded in the statements of assets and liabilities, less any collateral held by the Funds.
A derivative contract may suffer a mark-to-market loss if the value of the contract decreases due to an unfavorable change in the market rates or values of the underlying instrument. Losses can also occur if the counterparty does not perform under the contract.
| 64 | 2 0 2 1 B L A C K R O C K A N N U A L R E P O R T T O S H A R E H O L D E R S |
Notes to Financial Statements (continued)
With exchange-traded futures, there is less counterparty credit risk to the Funds since the exchange or clearinghouse, as counterparty to such instruments, guarantees against a possible default. The clearinghouse stands between the buyer and the seller of the contract; therefore, credit risk is limited to failure of the clearinghouse. While offset rights may exist under applicable law, a Fund does not have a contractual right of offset against a clearing broker or clearinghouse in the event of a default (including the bankruptcy or insolvency). Additionally, credit risk exists in exchange-traded futures with respect to initial and variation margin that is held in a clearing broker’s customer accounts. While clearing brokers are required to segregate customer margin from their own assets, in the event that a clearing broker becomes insolvent or goes into bankruptcy and at that time there is a shortfall in the aggregate amount of margin held by the clearing broker for all its clients, typically the shortfall would be allocated on a pro rata basis across all the clearing broker’s customers, potentially resulting in losses to the Funds.
Concentration Risk: A diversified portfolio, where this is appropriate and consistent with a fund’s objectives, minimizes the risk that a price change of a particular investment will have a material impact on the NAV of a fund. The investment concentrations within each Fund’s portfolio are disclosed in its schedule of investments.
Certain Funds invest a significant portion of their assets in securities of issuers located in Europe or with significant exposure to European issuers or countries. The European financial markets have recently experienced volatility and adverse trends due to concerns about economic downturns in, or rising government debt levels of, several European countries. These events may spread to other countries in Europe and may affect the value and liquidity of certain of the Funds’ investments.
Responses to the financial problems by European governments, central banks and others, including austerity measures and reforms, may not work, may result in social unrest and may limit future growth and economic recovery or have other unintended consequences. Further defaults or restructurings by governments and others of their debt could have additional adverse effects on economies, financial markets and asset valuations around the world. In addition, the United Kingdom has withdrawn from the European Union, and one or more other countries may withdraw from the European Union and/or abandon the Euro, the common currency of the European Union. The impact of these actions, especially if they occur in a disorderly fashion, is not clear but could be significant and far reaching.
Certain Funds invest a significant portion of their assets in securities within a single or limited number of market sectors. When a Fund concentrates its investments in this manner, it assumes the risk that economic, regulatory, political and social conditions affecting such sectors may have a significant impact on the fund and could affect the income from, or the value or liquidity of, the fund’s portfolio. Investment percentages in specific sectors are presented in the schedule of investments.
LIBOR Transition Risk: The United Kingdom’s Financial Conduct Authority announced a phase out of the London Interbank Offered Rate (“LIBOR”). Although many LIBOR rates will be phased out by the end of 2021, a selection of widely used USD LIBOR rates will continue to be published through June 2023 in order to assist with the transition. The Funds may be exposed to financial instruments tied to LIBOR to determine payment obligations, financing terms, hedging strategies or investment value. The transition process away from LIBOR might lead to increased volatility and illiquidity in markets for, and reduce the effectiveness of new hedges placed against, instruments whose terms currently include LIBOR. The ultimate effect of the LIBOR transition process on the Funds is uncertain.
11. CAPITAL SHARE TRANSACTIONS
Capital shares are issued and redeemed by each Fund only in aggregations of a specified number of shares or multiples thereof (“Creation Units”) at NAV. Except when aggregated in Creation Units, shares of each Fund are not redeemable.
Transactions in capital shares were as follows:
|
|
||||||||
| Period Ended 07/31/21 |
||||||||
| BlackRock ETF | Shares | Amount | ||||||
|
|
||||||||
| Future Health |
||||||||
| Shares sold |
240,000 | $ | 6,041,627 | |||||
|
|
|
|
|
|||||
| Future Innovators |
||||||||
| Shares sold |
460,000 | $ | 21,475,549 | |||||
|
|
|
|
|
|||||
| Future Tech |
||||||||
| Shares sold |
560,000 | $ | 18,069,672 | |||||
|
|
|
|
|
|||||
| U.S. Carbon Transition Readiness |
||||||||
| Shares sold |
28,200,000 | $ | 1,322,397,975 | |||||
| Shares redeemed |
(50,000 | ) | (2,369,462 | ) | ||||
|
|
|
|
|
|||||
| Net increase |
28,150,000 | $ | 1,320,028,513 | |||||
|
|
|
|
|
|||||
|
|
||||||||||||||||
| Year Ended 07/31/21 |
Year Ended 07/31/20 |
|||||||||||||||
| BlackRock ETF | Shares | Amount | Shares | Amount | ||||||||||||
|
|
||||||||||||||||
| U.S. Equity Factor Rotation |
||||||||||||||||
| Shares sold |
400,000 | $ | 14,424,612 | 3,300,000 | $ | 84,056,705 | ||||||||||
| Shares redeemed |
(1,100,000 | ) | (34,992,686 | ) | (800,000 | ) | (21,224,957 | ) | ||||||||
|
|
|
|
|
|
|
|
|
|||||||||
| Net increase (decrease) |
(700,000 | ) | $ | (20,568,074 | ) | 2,500,000 | $ | 62,831,748 | ||||||||
|
|
|
|
|
|
|
|
|
|||||||||
| N O T E S T O F I N A N C I A L S T A T E M E N T S |
65 |
Notes to Financial Statements (continued)
|
|
||||||||
| Period Ended 07/31/21 |
||||||||
| BlackRock ETF | Shares | Amount | ||||||
|
|
||||||||
| World ex U.S. Carbon Transition Readiness |
||||||||
| Shares sold |
12,600,000 | $ | 586,499,102 | |||||
|
|
|
|
|
|||||
The consideration for the purchase of Creation Units of a fund in the Trust generally consists of the in-kind deposit of a designated portfolio of securities and a specified amount of cash. Certain funds in the Trust may be offered in Creation Units solely or partially for cash in U.S. dollars. Investors purchasing and redeeming Creation Units may pay a purchase transaction fee and a redemption transaction fee directly to State Street Bank and Trust Company, the Trust’s administrator, to offset transfer and other transaction costs associated with the issuance and redemption of Creation Units, including Creation Units for cash. Investors transacting in Creation Units for cash may also pay an additional variable charge to compensate the relevant fund for certain transaction costs (i.e., stamp taxes, taxes on currency or other financial transactions, and brokerage costs) and market impact expenses relating to investing in portfolio securities. Such variable charges, if any, are included in shares sold in the table above.
From time to time, settlement of securities related to in-kind contributions or in-kind redemptions may be delayed. In such cases, securities related to in-kind transactions are reflected as a receivable or a payable in the statements of assets and liabilities.
As of July 31, 2021, shares owned by BlackRock Financial Management, Inc., an affiliate of the Funds, were as follows:
|
|
||||
| BlackRock ETF | Shares | |||
|
|
||||
| U.S. Carbon Transition Readiness |
50,000 | |||
| World ex U.S. Carbon Transition Readiness |
75,000 | |||
|
|
||||
| 12. | SUBSEQUENT EVENTS |
Management has evaluated the impact of all subsequent events on the Funds through the date the financial statements were available to be issued and has determined that there were no subsequent events requiring adjustment or additional disclosure in the financial statements.
| 66 | 2 0 2 1 B L A C K R O C K A N N U A L R E P O R T T O S H A R E H O L D E R S |
Report of Independent Registered Public Accounting Firm
To the Board of Trustees of BlackRock ETF Trust and Shareholders of BlackRock Future Health ETF,
BlackRock Future Innovators ETF, BlackRock Future Tech ETF, BlackRock U.S. Carbon Transition Readiness ETF,
BlackRock World ex U.S. Carbon Transition Readiness ETF and BlackRock U.S. Equity Factor Rotation ETF
Opinions on the Financial Statements
We have audited the accompanying statements of assets and liabilities, including the schedules of investments, of BlackRock Future Health ETF, BlackRock Future Innovators ETF, BlackRock Future Tech ETF, BlackRock U.S. Carbon Transition Readiness ETF, BlackRock World ex U.S. Carbon Transition Readiness ETF and BlackRock U.S. Equity Factor Rotation ETF (constituting BlackRock ETF Trust, hereafter collectively referred to as the “Funds”) as of July 31, 2021, the related statements of operations and of changes in net assets for each of the periods indicated in the table below, including the related notes, and the financial highlights for each of the periods indicated in the table below (collectively referred to as the “financial statements”). In our opinion, the financial statements present fairly, in all material respects, the financial position of each of the Funds as of July 31, 2021, the results of each of their operations, the changes in each of their net assets, and each of the financial highlights for each of the periods indicated in the table below, in conformity with accounting principles generally accepted in the United States of America.
| Fund | Statements of operations
|
Statements of changes in net assets
|
Financial highlights | |||
|
BlackRock Future Health ETF
|
For the period September 29, 2020 (commencement of operations) to July 31, 2021
| |||||
|
BlackRock Future Innovators ETF
|
For the period September 29, 2020 (commencement of operations) to July 31, 2021
| |||||
|
BlackRock Future Tech ETF
|
For the period September 29, 2020 (commencement of operations) to July 31, 2021
| |||||
|
BlackRock U.S. Carbon Transition Readiness ETF
|
For the period April 6, 2021 (commencement of operations) to July 31, 2021
| |||||
|
BlackRock World ex U.S. Carbon Transition Readiness ETF
|
For the period April 6, 2021 (commencement of operations) to July 31, 2021
| |||||
|
BlackRock U.S. Equity Factor Rotation ETF
|
For the year ended July 31, 2021 |
For the two years ended July 31, 2021 |
For the two years ended July 31, 2021 and the period March 19, 2019 (commencement of operations) to July 31, 2019
| |||
Basis for Opinions
These financial statements are the responsibility of the Fund’s management. Our responsibility is to express an opinion on the Fund’s financial statements based on our audits. We are a public accounting firm registered with the Public Company Accounting Oversight Board (United States) (PCAOB) and are required to be independent with respect to the Fund in accordance with the U.S. federal securities laws and the applicable rules and regulations of the Securities and Exchange Commission and the PCAOB.
We conducted our audits of these financial statements in accordance with the standards of the PCAOB. Those standards require that we plan and perform the audit to obtain reasonable assurance about whether the financial statements are free of material misstatement, whether due to error or fraud.
Our audits included performing procedures to assess the risks of material misstatement of the financial statements, whether due to error or fraud, and performing procedures that respond to those risks. Such procedures included examining, on a test basis, evidence regarding the amounts and disclosures in the financial statements. Our audits also included evaluating the accounting principles used and significant estimates made by management, as well as evaluating the overall presentation of the financial statements. Our procedures included confirmation of securities owned as of July 31, 2021 by correspondence with the custodian, transfer agent and brokers; when replies were not received from brokers, we performed other auditing procedures. We believe that our audits provide a reasonable basis for our opinions.
/s/PricewaterhouseCoopers LLP
Philadelphia, Pennsylvania
September 21, 2021
We have served as the auditor of one or more BlackRock investment companies since 2000.
| R E P O R T O F I N D E P E N D E N T R E G I S T E R E D P U B L I C A C C O U N T I N G F I R M |
67 |
Important Tax Information (unaudited)
The following percentage, or maximum percentage allowable by law, of ordinary income distributions paid during the fiscal year ended July 31, 2021 qualified for the dividends-received deduction for corporate shareholders:
| BlackRock ETF
|
Dividends-Received
|
|||
|
U.S. Carbon Transition Readiness |
|
100.00 |
% | |
| U.S. Equity Factor Rotation
|
|
94.24
|
%
| |
The following amount(s), or maximum amount(s) allowable by law, are hereby designated as qualified dividend income for individuals for the fiscal year ended July 31, 2021:
| BlackRock ETF
|
Qualified Dividend
|
|||
|
Future Health |
$ |
12,631 |
| |
| Future Innovators |
8,179 | |||
| Future Tech |
13,321 | |||
| U.S. Carbon Transition Readiness |
5,048,746 | |||
| U.S. Equity Factor Rotation |
1,274,648 | |||
| World ex U.S. Carbon Transition Readiness
|
|
5,054,777
|
| |
The Funds intend to pass through to their shareholders the following amount(s), or maximum amount(s) allowable by law, of foreign source income earned and foreign taxes paid for the fiscal year ended July 31, 2021:
| iShares ETF
|
Foreign Source
|
Foreign
|
||||||
|
World ex U.S. Carbon Transition Readiness
|
$ |
5,806,418 |
|
$ |
513,500 |
| ||
The following amount(s), or maximum amount(s) allowable by law, are hereby designated as qualified business income for individuals for the fiscal year ended July 31, 2021:
| BlackRock ETF
|
Qualified Business
|
|||
|
U.S. Equity Factor Rotation
|
$
|
31,669
|
| |
| 68 | 2 0 2 1 B L A C K R O C K A N N U A L R E P O R T T O S H A R E H O L D E R S |
Disclosure of Investment Advisory Agreement
The Board of Trustees (the “Board,” the members of which are referred to as “Board Members”) of BlackRock ETF Trust (the “Trust”) met on January 7, 2021 (the “Organizational Meeting”) to consider the approval of the proposed investment advisory agreement (the “Agreement”) between the Trust, on behalf of BlackRock U.S. Carbon Transition Readiness ETF (the “U.S. Carbon Transition Readiness ETF”) and BlackRock World ex U.S. Carbon Transition Readiness ETF (the “World ex U.S. Carbon Transition Readiness ETF” and, together with the U.S. Carbon Transition Readiness ETF, the “Funds” and, each individually, a “Fund”) and BlackRock Fund Advisors (the “Manager” or “BlackRock”), each Fund’s investment advisor. The Agreement was the same agreement that had been previously approved by the Board with respect to certain series of the Trust.
The Approval Process
Consistent with the requirements of the Investment Company Act of 1940 (the “1940 Act”), the Trust is required to consider the initial approval of the Agreement. The Board members whom are not “interested persons” of the Funds, as defined in the 1940 Act, are considered independent Board members (the “Independent Board Members”). In connection with this deliberative process, the Board assessed, among other things, the nature, extent and quality of the services to be provided to the Funds by BlackRock, BlackRock’s personnel and affiliates, including (as applicable): investment management services; accounting oversight; administrative and shareholder services; oversight of each Fund’s service providers; risk management and oversight; and legal, regulatory and compliance services.
At the Organizational Meeting, the Board received and reviewed materials relating to its consideration of the proposed Agreement. The Board considered all factors it believed relevant with respect to the Funds, including, among other things: (a) the nature, extent and quality of the services to be provided by BlackRock; (b) the investment performance of each Funds as compared with a peer group of funds and to other metrics, as applicable; (c) the advisory fee and the estimated cost of the services and estimated profits to be realized by BlackRock and its affiliates from their relationship with the Funds; (d) the existence and sharing of potential economies of scale; (e) any fall-out benefits to BlackRock and its affiliates as a result of BlackRock’s relationship with the Funds; (f) possible alternatives to the proposed Agreement; (g) the policies and practices of BlackRock with respect to portfolio transactions for each Fund; (h) BlackRock’s portfolio compliance systems and capabilities; and (i) other factors deemed relevant by the Board Members.
In considering approval of the Agreement, the Board met with the relevant investment advisory personnel from BlackRock and considered all information it deemed reasonably necessary to evaluate the terms of the Agreement. The Board received materials in advance of the Organizational Meeting relating to its consideration of the Agreement, including (a) information independently compiled and prepared by Broadridge Financial Solutions, Inc. (“Broadridge”) regarding each Fund’s fees and estimated expense ratio as compared with a peer group of funds as determined by Broadridge (“Expense Peers”); (b) information regarding BlackRock’s economic outlook for each Fund and its general investment outlook for the markets; (c) information regarding fees paid to service providers that are affiliates of BlackRock; and (d) information outlining the legal duties of the Board under the 1940 Act with respect to the consideration and approval of the Agreement. The Board also noted information received at prior Board meetings concerning compliance records and regulatory matters relating to BlackRock.
The Board also considered other matters it deemed important to the approval process, such as other payments made to BlackRock or its affiliates relating to securities lending and cash management and BlackRock’s services related to the valuation and pricing of the Funds’ portfolio holdings. The Board noted the willingness of BlackRock’s personnel to engage in open, candid discussions with the Board. The Board Members did not identify any particular information or any single factor as determinative, and each Board Member may have attributed different weights to the various items and factors considered.
A. Nature, Extent and Quality of the Services Provided by BlackRock
The Board, including the Independent Board Members, reviewed the nature, extent and quality of services to be provided by BlackRock, including the investment advisory services to be provided to the Funds. The Board received information concerning the investment philosophy and investment process to be used by BlackRock in managing the Funds, as well as a description of the capabilities, personnel and services of BlackRock. The Board considered the scope of the services provided by BlackRock to the Funds under the Agreement relative to services typically provided by third parties to other funds. The Board noted that the standard of care applicable under the Agreement was comparable to that found generally in investment company advisory agreements. The Board concluded that the scope of BlackRock’s services to be provided to the Funds was consistent with each Fund’s operational requirements, including, in addition to seeking to meet the pertinent Fund’s investment objective(s), compliance with investment restrictions, tax and reporting requirements and related shareholder services.
The Board, including the Independent Board Members, also considered the quality of the administrative and other non-investment advisory services to be provided by BlackRock and its affiliates to the Funds. The Board evaluated the procedures of BlackRock designed to fulfill its fiduciary duty to the Funds with respect to possible conflicts of interest, including BlackRock’s code of ethics (regulating the personal trading of BlackRock’s officers and employees), the procedures by which BlackRock allocates trades among its various investment advisory clients, the integrity of the systems in place to ensure compliance with the foregoing and the record of BlackRock in these matters. The Board also noted information received at prior Board meetings concerning standards of BlackRock with respect to the execution of portfolio transactions.
The Board considered, among other factors, with respect to BlackRock: the number, education and experience of investment personnel generally and each Fund’s portfolio management team; research capabilities; investments by portfolio managers in the funds they manage; portfolio trading capabilities; use of technology; commitment to compliance; credit analysis capabilities; risk analysis and oversight capabilities; and the approach to training and retaining portfolio managers and other research, advisory and management personnel. The Board also considered BlackRock’s overall risk management program, including the continued efforts of BlackRock and its affiliates to address cybersecurity risks and the role of BlackRock’s Risk & Quantitative Analysis Group. The Board engaged in a review of BlackRock’s compensation structure with respect to the Fund’s portfolio management team and BlackRock’s ability to attract and retain high-quality talent and create performance incentives. The Board also considered the business reputation of BlackRock and its financial resources and concluded that BlackRock would be able to meet any reasonably foreseeable obligation under the Agreement.
| D I S C L O S U R E O F I N V E S T M E N T A D V I S O R Y A G R E E M E N T |
69 |
Disclosure of Investment Advisory Agreement (continued)
In addition to investment advisory services, the Board considered the nature and quality of the administrative and other non-investment advisory services to be provided to the Funds. The Board considered that BlackRock and its affiliates will provide the Funds with certain administrative, shareholder and other services (in addition to any such services provided to the Funds by third parties) and officers and other personnel as are necessary for the operations of the pertinent Fund. In particular, BlackRock and its affiliates will provide the Funds with administrative services, including, among others: (i) responsibility for disclosure documents, such as the prospectus, the summary prospectus (as applicable), the statement of additional information and periodic shareholder reports; (ii) oversight of daily accounting and pricing; (iii) responsibility for periodic filings with regulators; (iv) overseeing and coordinating the activities of third-party service providers, including, among others, each Fund’s custodian, fund accountant, transfer agent, and auditor; (v) organizing Board meetings and preparing the materials for such Board meetings; (vi) providing legal and compliance support; (vii) furnishing analytical and other support to assist the Board in its consideration of strategic issues such as the merger, consolidation or repurposing of certain open-end funds; and (viii) performing or managing administrative functions necessary for the operation of the Funds, such as tax reporting, expense management, fulfilling regulatory filing requirements, overseeing each Fund’s distribution partners, and shareholder call center and other services. The Board reviewed the structure and duties of BlackRock’s fund administration, shareholder services, and legal and compliance departments and considered BlackRock’s policies and procedures for assuring compliance with applicable laws and regulations.
B. The Investment Performance of the Funds and BlackRock
The Board, including the Independent Board Members, previously received and considered information about BlackRock’s investment performance for other funds. The Board, however, did not consider the performance history of the Funds because the Funds was newly organized and had not yet commenced operations as of the date of the Organizational Meeting.
C. Consideration of the Advisory/Management Fees and the Estimated Cost of the Services to be Provided and Estimated Profits to be Realized by BlackRock and its Affiliates from their Relationship with the Funds
In connection with the initial approval of the Agreement, the Board, including the Independent Board Members, reviewed each Fund’s contractual management fee rate compared with those of its Expense Peers. The contractual management fee rate represents a combination of the advisory fee and any administrative fees, before taking into account any reimbursements or fee waivers. The Board also compared each Fund’s estimated total expense ratio, as well as its estimated actual management fee rate, to those of its Expense Peers. The total expense ratio represents a fund’s total net operating expenses, including any 12b-1 or non-12b-1 service fees. The total expense ratio gives effect to any expense reimbursements or fee waivers that benefit a fund, and the actual management fee rate gives effect to any management fee reimbursements or waivers that benefit a fund. Additionally, the Board noted information received at prior Board meetings concerning the services provided and the fees charged by BlackRock and its affiliates to other types of clients with similar investment mandates, as applicable, including institutional accounts and sub-advised mutual funds (including mutual funds sponsored by third parties).
The Board noted that each of U.S. Carbon Transition Readiness ETF’s and World ex U.S. Carbon Transition Readiness ETF’s contractual management fee rate ranked in the second quartile, and that the estimated actual management fee rate and estimated total expense ratio each ranked in the first quartile relative to the pertinent Fund’s Expense Peers.
The Board also noted that each Fund has a management fee arrangement that includes breakpoints that adjust the fee rate downward as the size of the Fund increases above certain contractually specified levels. The Board noted that if the size of a Fund were to decrease, the Fund could lose the benefit of one or more breakpoints. In addition, the Board noted that BlackRock has voluntarily agreed to waive a portion of the management fee payable by each Fund.
Following consideration of this information, the Board, including the independent Board Members, concluded that the fees to be paid pursuant to the Agreement were fair and reasonable in light of the services provided.
As the Funds had not commenced operations as of the date of the Organizational Meeting, BlackRock was not able to provide the Board with specific information concerning the expected profits to be realized by BlackRock and its affiliates from their relationships with the Funds. BlackRock, however, will provide the Board with such information at future meetings.
D. Economies of Scale
The Board, including the Independent Board Members, considered the extent to which economies of scale might be realized as the assets of the Funds increase, including the existence of fee waivers and/or expense caps, as applicable, noting that any contractual fee waivers and expense caps had been approved by the Board.
E. Other Factors Deemed Relevant by the Board Members
The Board, including the Independent Board Members, also took into account other ancillary or “fall-out” benefits that BlackRock or its affiliates may derive from BlackRock’s respective relationships with the Funds, both tangible and intangible, such as BlackRock’s ability to leverage its investment professionals who manage other portfolios and risk management personnel, an increase in BlackRock’s profile in the investment advisory community, and the engagement of BlackRock’s affiliates as service providers to the Funds, including for administrative, distribution, securities lending and cash management services. The Board also considered BlackRock’s overall operations and its efforts to expand the scale of, and improve the quality of, its operations. The Board also noted that, subject to applicable law, BlackRock may use and benefit from third-party research obtained by soft dollars generated by certain registered fund transactions to assist in managing all or a number of its other client accounts.
In connection with its consideration of the Agreement, the Board also received information regarding BlackRock’s brokerage and soft dollar practices. The Board received reports from BlackRock which included information on brokerage commissions and trade execution practices throughout the year.
| 70 | 2 0 2 1 B L A C K R O C K A N N U A L R E P O R T T O S H A R E H O L D E R S |
Disclosure of Investment Advisory Agreement (continued)
The Board noted the competitive nature of the ETF marketplace, and that shareholders are able to redeem or sell their Fund shares if they believe that the pertinent Fund’s fees and expenses are too high or if they are dissatisfied with the performance of the Fund.
Conclusion
The Board Members present at the Organizational Meeting, including the Independent Board Members, unanimously approved the Agreement between the Manager and the Trust, with respect to each Fund, for a two-year term beginning on the effective date of the Agreement. Based upon its evaluation of all of the aforementioned factors in their totality, as well as other information, the Board, including the Independent Board Members, was satisfied that the terms of the Agreement were fair and reasonable and in the best interest of each Fund and its shareholders. In arriving at its decision to approve the Agreement, the Board did not identify any single factor or group of factors as all-important or controlling, but considered all factors together, and different Board Members may have attributed different weights to the various factors considered. The Independent Board Members were also assisted by the advice of independent legal counsel in making this determination.
| D I S C L O S U R E O F I N V E S T M E N T A D V I S O R Y A G R E E M E N T |
71 |
Disclosure of Investment Advisory Agreement (continued)
The Board of Trustees (the “Board,” the members of which are referred to as “Board Members”) of BlackRock ETF Trust (the “Trust”) met on April 7, 2021 (the “April Meeting”) and May 10-12, 2021 (the “May Meeting”) to consider the approval to continue the investment advisory agreement (the “Agreement”) between the Trust, on behalf of BlackRock U.S. Equity Factor Rotation ETF (the “Fund”), and BlackRock Fund Advisors (the “Manager” or “BlackRock”), the Fund’s investment advisor.
The Approval Process
Consistent with the requirements of the Investment Company Act of 1940 (the “1940 Act”), the Board considers the approval of the continuation of the Agreement for the Fund on an annual basis. The Board members whom are not “interested persons” of the Trust, as defined in the 1940 Act, are considered independent Board members (the “Independent Board Members”). The Board’s consideration entailed a year-long deliberative process during which the Board and its committees assessed BlackRock’s various services to the Fund, including through the review of written materials and oral presentations, and the review of additional information provided in response to requests from the Independent Board Members. The Board had four quarterly meetings per year, each typically extending for two days, as well as additional ad hoc meetings and executive sessions throughout the year, as needed. The committees of the Board similarly met throughout the year. The Board also had a fifth one-day meeting to consider specific information surrounding the renewal of the Agreement. In particular, the Board assessed, among other things, the nature, extent and quality of the services provided to the Fund by BlackRock, BlackRock’s personnel and affiliates, including (as applicable): investment management services; accounting oversight; administrative and shareholder services; oversight of the Fund’s service providers; risk management and oversight; and legal, regulatory and compliance services. Throughout the year, including during the contract renewal process, the Independent Board Members were advised by independent legal counsel, and met with independent legal counsel in various executive sessions outside of the presence of BlackRock’s management.
During the year, the Board, acting directly and through its committees, considered information that was relevant to its annual consideration of the renewal of the Agreement, including the services and support provided by BlackRock to the Fund and its shareholders. BlackRock also furnished additional information to the Board in response to specific questions from the Board. Among the matters the Board considered were: (a) investment performance for one-year, three-year, five-year, and/or since inception periods, as applicable, against peer funds, relevant benchmarks, and other performance metrics, as applicable, as well as BlackRock senior management’s and portfolio managers’ analyses of the reasons for any outperformance or underperformance relative to its peers, benchmarks, and other performance metrics, as applicable; (b) fees, including advisory, administration, if applicable, and other amounts paid to BlackRock and its affiliates by the Fund for services; (c) Fund operating expenses and how BlackRock allocates expenses to the Fund; (d) the resources devoted to, risk oversight of, and compliance reports relating to, implementation of the Fund’s investment objective, policies and restrictions, and meeting regulatory requirements; (e) BlackRock’s and the Fund’s adherence to applicable compliance policies and procedures; (f) the nature, character and scope of non-investment management services provided by BlackRock and its affiliates and the estimated cost of such services, as available; (g) BlackRock’s and other service providers’ internal controls and risk and compliance oversight mechanisms; (h) BlackRock’s implementation of the proxy voting policies approved by the Board; (i) the use of brokerage commissions and execution quality of portfolio transactions; (j) BlackRock’s implementation of the Fund’s valuation and liquidity procedures; (k) an analysis of management fees paid to BlackRock for products with similar investment mandates across the open-end fund, exchange-traded fund (“ETF”), closed-end fund, sub-advised mutual fund, separately managed account, collective investment trust, and institutional separate account product channels, as applicable, and the similarities and differences between these products and the services provided as compared to the Fund; (l) BlackRock’s compensation methodology for its investment professionals and the incentives and accountability it creates, along with investment professionals’ investments in the fund(s) they manage; and (m) periodic updates on BlackRock’s business.
Prior to and in preparation for the April Meeting, the Board received and reviewed materials specifically relating to the renewal of the Agreement. The Independent Board Members continuously engaged in a process with their independent legal counsel and BlackRock to review the nature and scope of the information provided to the Board to better assist its deliberations. The materials provided in connection with the April Meeting included, among other things: (a) information independently compiled and prepared by Broadridge Financial Solutions, Inc. (“Broadridge”), based on either a Lipper classification or Morningstar category, regarding the Fund’s fees and expenses as compared with a peer group of funds as determined by Broadridge (“Expense Peers”) and the investment performance of the Fund as compared with a peer group of funds (“Performance Peers”); (b) information on the composition of the Expense Peers and Performance Peers and a description of Broadridge’s methodology; (c) information on the estimated profits realized by BlackRock and its affiliates pursuant to the Agreement and a discussion of fall-out benefits to BlackRock and its affiliates; (d) a general analysis provided by BlackRock concerning investment management fees received in connection with other types of investment products, such as institutional accounts, sub-advised mutual funds, ETFs, closed-end funds, open-end funds, and separately managed accounts, under similar investment mandates, as well as the performance of such other products, as applicable; (e) a review of non-management fees; (f) the existence, impact and sharing of potential economies of scale, if any, with the Fund; (g) a summary of aggregate amounts paid by the Fund to BlackRock; (h) sales and redemption data regarding the Fund’s shares; and (i) various additional information requested by the Board as appropriate regarding BlackRock’s and the Fund’s operations.
At the April Meeting, the Board reviewed materials relating to its consideration of the Agreement. As a result of the discussions that occurred during the April Meeting, and as a culmination of the Board’s year-long deliberative process, the Board presented BlackRock with questions and requests for additional information. BlackRock responded to these questions and requests with additional written information in advance of the May Meeting.
At the May Meeting, the Board concluded its assessment of, among other things: (a) the nature, extent and quality of the services provided by BlackRock; (b) the investment performance of the Fund as compared to its Performance Peers and to other metrics, as applicable; (c) the advisory fee and the estimated cost of the services and estimated profits realized by BlackRock and its affiliates from their relationship with the Fund; (d) the Fund’s fees and expenses compared to its Expense Peers; (e) the existence and sharing of potential economies of scale; (f) any fall-out benefits to BlackRock and its affiliates as a result of BlackRock’s relationship with the Fund; and (g) other factors deemed relevant by the Board Members.
The Board also considered other matters it deemed important to the approval process, such as other payments made to BlackRock or its affiliates relating to securities lending and cash management, and BlackRock’s services related to the valuation and pricing of Fund portfolio holdings. The Board noted the willingness of BlackRock’s personnel to engage in open, candid discussions with the Board. The members of the Board gave attention to all of the information that was furnished, and each Board Member placed varying degrees of importance on the various pieces of information that were provided to them. The Board evaluated the information available to it on a fund
| 72 | 2 0 2 1 B L A C K R O C K A N N U A L R E P O R T T O S H A R E H O L D E R S |
Disclosure of Investment Advisory Agreement (continued)
by fund basis. The following paragraphs provide more information about some of the primary factors that were relevant to the Board’s decision. The Board Members did not identify any particular information, or any single factor as determinative, and each Board Member may have attributed different weights to the various items and factors considered.
A. Nature, Extent and Quality of the Services Provided by BlackRock
The Board, including the Independent Board Members, reviewed the nature, extent and quality of services provided by BlackRock, including the investment advisory services, and the resulting performance of the Fund. Throughout the year, the Board compared Fund performance to the performance of a comparable group of mutual funds, relevant benchmarks, and performance metrics, as applicable. The Board met with BlackRock’s senior management personnel responsible for investment activities, including the senior investment officers. The Board also reviewed the materials provided by the Fund’s portfolio management team discussing the Fund’s performance, investment strategies and outlook.
The Board considered, among other factors, with respect to BlackRock: the number, education and experience of investment personnel generally and the Fund’s portfolio management team; research capabilities; investments by portfolio managers in the funds they manage; portfolio trading capabilities; use of technology; commitment to compliance; credit analysis capabilities; risk analysis and oversight capabilities; and the approach to training and retaining portfolio managers and other research, advisory and management personnel. The Board also considered BlackRock’s overall risk management program, including the continued efforts of BlackRock and its affiliates to address cybersecurity risks and the role of BlackRock’s Risk & Quantitative Analysis Group. The Board engaged in a review of BlackRock’s compensation structure with respect to the Fund’s portfolio management team and BlackRock’s ability to attract and retain high-quality talent and create performance incentives.
In addition to investment advisory services, the Board considered the nature and quality of the administrative and other non-investment advisory services provided to the Fund. BlackRock and its affiliates provide the Fund with certain administrative, shareholder and other services (in addition to any such services provided to the Fund by third parties) and officers and other personnel as are necessary for the operations of the Fund. In particular, BlackRock and its affiliates provide the Fund with administrative services including, among others: (i) responsibility for disclosure documents, such as the prospectus, the summary prospectus (as applicable), the statement of additional information and periodic shareholder reports; (ii) oversight of daily accounting and pricing; (iii) responsibility for periodic filings with regulators; (iv) overseeing and coordinating the activities of third-party service providers including, among others, the Fund’s custodian, fund accountant, transfer agent, and auditor; (v) organizing Board meetings and preparing the materials for such Board meetings; (vi) providing legal and compliance support; (vii) furnishing analytical and other support to assist the Board in its consideration of strategic issues such as the merger, consolidation or repurposing of certain open-end funds; and (viii) performing or managing administrative functions necessary for the operation of the Fund, such as tax reporting, expense management, fulfilling regulatory filing requirements, overseeing the Fund’s distribution partners, and shareholder call center and other services. The Board reviewed the structure and duties of BlackRock’s fund administration, shareholder services, and legal and compliance departments and considered BlackRock’s policies and procedures for assuring compliance with applicable laws and regulations. The Board considered the operation of BlackRock’s business continuity plans, including in light of the ongoing COVID-19 pandemic.
B. The Investment Performance of the Fund and BlackRock
The Board, including the Independent Board Members, reviewed and considered the performance history of the Fund throughout the year and at the April Meeting. In preparation for the April Meeting, the Board was provided with reports independently prepared by Broadridge, which included an analysis of the Fund’s performance as of December 31, 2020, as compared to its Performance Peers. Broadridge ranks funds in quartiles, ranging from first to fourth, where first is the most desirable quartile position and fourth is the least desirable. In connection with its review, the Board received and reviewed information regarding the investment performance of the Fund as compared to its Performance Peers. The Board and its Performance Oversight Committee regularly review and meet with Fund management to discuss the performance of the Fund throughout the year.
In evaluating performance, the Board focused particular attention on funds with less favorable performance records. The Board also noted that while it found the data provided by Broadridge generally useful, it recognized the limitations of such data, including in particular, that notable differences may exist between a fund and its Performance Peers (for example, the investment objectives and strategies). Further, the Board recognized that the performance data reflects a snapshot of a period as of a particular date and that selecting a different performance period could produce significantly different results. The Board also acknowledged that long-term performance could be impacted by even one period of significant outperformance or underperformance, and that a single investment theme could have the ability to disproportionately affect long-term performance.
The Board noted that for each of the one-year and since-inception periods reported, the Fund ranked in the third quartile against its Performance Peers. The Board and BlackRock reviewed the Fund’s underperformance relative to its Performance Peers during the applicable periods.
C. Consideration of the Advisory/Management Fees and the Estimated Cost of the Services and Estimated Profits Realized by BlackRock and its Affiliates from their Relationship with the Fund
The Board, including the Independent Board Members, reviewed the Fund’s contractual management fee rate compared with those of its Expense Peers. The contractual management fee rate represents a combination of the advisory fee and any administrative fees, before taking into account any reimbursements or fee waivers. The Board also compared the Fund’s total expense ratio, as well as its actual management fee rate, to those of its Expense Peers. The total expense ratio represents a fund’s total net operating expenses, including any 12b-1 or non-12b-1 service fees. The total expense ratio gives effect to any expense reimbursements or fee waivers, and the actual management fee rate gives effect to any management fee reimbursements or waivers. The Board considered the services provided and the fees charged by BlackRock and its affiliates to other types of clients with similar investment mandates, as applicable, including institutional accounts and sub-advised mutual funds (including mutual funds sponsored by third parties).
| D I S C L O S U R E O F I N V E S T M E N T A D V I S O R Y A G R E E M E N T |
73 |
Disclosure of Investment Advisory Agreement (continued)
The Board received and reviewed statements relating to BlackRock’s financial condition. The Board reviewed BlackRock’s profitability methodology and was also provided with an estimated profitability analysis that detailed the revenues earned and the expenses incurred by BlackRock for services provided to the Fund. The Board reviewed BlackRock’s estimated profitability with respect to the Fund and other funds the Board currently oversees for the year ended December 31, 2020 compared to available aggregate estimated profitability data provided for the prior two years. The Board reviewed BlackRock’s estimated profitability with respect to certain other U.S. fund complexes managed by the Manager and/or its affiliates. The Board reviewed BlackRock’s assumptions and methodology of allocating expenses in the estimated profitability analysis, noting the inherent limitations in allocating costs among various advisory products. The Board recognized that profitability may be affected by numerous factors including, among other things, fee waivers and expense reimbursements by the Manager, the types of funds managed, precision of expense allocations and business mix. The Board thus recognized that calculating and comparing profitability at the individual fund level is difficult.
The Board noted that, in general, individual fund or product line profitability of other advisors is not publicly available. The Board reviewed BlackRock’s overall operating margin, in general, compared to that of certain other publicly traded asset management firms. The Board considered the differences between BlackRock and these other firms, including the contribution of technology at BlackRock, BlackRock’s expense management, and the relative product mix.
The Board considered whether BlackRock has the financial resources necessary to attract and retain high quality investment management personnel to perform its obligations under the Agreement and to continue to provide the high quality of services that is expected by the Board. The Board further considered factors including but not limited to BlackRock’s commitment of time, assumption of risk, and liability profile in servicing the Fund, including in contrast to what is required of BlackRock with respect to other products with similar investment mandates across the open-end fund, ETF, closed-end fund, sub-advised mutual fund, separately managed account, collective investment trust, and institutional separate account product channels, as applicable.
The Board noted that the Fund’s contractual management fee rate ranked in the second quartile, and that the actual management fee rate and total expense ratio each ranked in the first quartile relative to the Fund’s Expense Peers. The Board also noted that the Fund has an advisory fee arrangement that includes breakpoints that adjust the fee rate downward as the size of the Fund increases above certain contractually specified levels. The Board noted that if the size of the Fund were to decrease, the Fund could lose the benefit of one or more breakpoints. The Board also noted that BlackRock had voluntarily agreed to waive a portion of the advisory fee payable by the Fund.
D. Economies of Scale
The Board, including the Independent Board Members, considered the extent to which economies of scale might be realized as the assets of the Fund increase, including the existence of fee waivers and/or expense caps, as applicable, noting that any contractual fee waivers and contractual expense caps had been approved by the Board. In its consideration, the Board further considered the continuation and/or implementation of fee waivers and/or expense caps, as applicable. The Board also considered the extent to which the Fund benefits from such economies of scale in a variety of ways, and whether there should be changes in the advisory fee rate or breakpoint structure in order to enable the Fund to more fully participate in these economies of scale. The Board considered the Fund’s asset levels and whether the current fee schedule was appropriate.
E. Other Factors Deemed Relevant by the Board Members
The Board, including the Independent Board Members, also took into account other ancillary or “fall-out” benefits that BlackRock or its affiliates may derive from BlackRock’s respective relationships with the Fund, both tangible and intangible, such as BlackRock’s ability to leverage its investment professionals who manage other portfolios and its risk management personnel, an increase in BlackRock’s profile in the investment advisory community, and the engagement of BlackRock’s affiliates as service providers to the Fund, including for administrative, distribution, securities lending and cash management services. The Board also considered BlackRock’s overall operations and its efforts to expand the scale of, and improve the quality of, its operations. The Board also noted that, subject to applicable law, BlackRock may use and benefit from third-party research obtained by soft dollars generated by certain registered fund transactions to assist in managing all or a number of its other client accounts.
In connection with its consideration of the Agreement, the Board also received information regarding BlackRock’s brokerage and soft dollar practices. The Board received reports from BlackRock which included information on brokerage commissions and trade execution practices throughout the year.
The Board noted the competitive nature of the ETF marketplace, and that shareholders are able to redeem or sell their Fund shares if they believe that the Fund’s fees and expenses are too high or if they are dissatisfied with the performance of the Fund.
Conclusion
The Board, including the Independent Board Members, unanimously approved the continuation of the Agreement between the Manager and the Trust, on behalf of the Fund, for a one-year term ending June 30, 2022. Based upon its evaluation of all of the aforementioned factors in their totality, as well as other information, the Board, including the Independent Board Members, was satisfied that the terms of the Agreement were fair and reasonable and in the best interest of the Fund and its shareholders. In arriving at its decision to approve the Agreement, the Board did not identify any single factor or group of factors as all-important or controlling, but considered all factors together, and different Board Members may have attributed different weights to the various factors considered. The Independent Board Members were also assisted by the advice of independent legal counsel in making this determination.
| 74 | 2 0 2 1 B L A C K R O C K A N N U A L R E P O R T T O S H A R E H O L D E R S |
Supplemental Information (unaudited)
Regulation Regarding Derivatives
On October 28, 2020, the Securities and Exchange Commission (the “SEC”) adopted new regulations governing the use of derivatives by registered investment companies (“Rule 18f-4”). The Funds will be required to implement and comply with Rule 18f-4 by August 19, 2022. Once implemented, Rule 18f-4 will impose limits on the amount of derivatives a fund can enter into, eliminate the asset segregation framework currently used by funds to comply with Section 18 of the 1940 Act, treat derivatives as senior securities and require funds whose use of derivatives is more than a limited specified exposure amount to establish and maintain a comprehensive derivatives risk management program and appoint a derivatives risk manager.
Section 19(a) Notices
The amounts and sources of distributions reported are estimates and are being provided pursuant to regulatory requirements and are not being provided for tax reporting purposes. The actual amounts and sources for tax reporting purposes will depend upon each Fund’s investment experience during the year and may be subject to changes based on tax regulations. Shareholders will receive a Form 1099-DIV each calendar year that will inform them how to report these distributions for federal income tax purposes.
July 31, 2021
|
Total Cumulative Distributions for the Fiscal Year
|
% Breakdown of the Total Cumulative Distributions for the Fiscal Year
|
|||||||||||||||||||||||||||||||||||
| BlackRock ETF
|
Net
|
Net Realized
|
Return of
|
Total Per
|
Net
|
Net Realized
|
Return of
|
Total Per
|
||||||||||||||||||||||||||||
| U.S. Equity Factor Rotation(a)
|
$
|
0.462638
|
|
$
|
—
|
|
$
|
0.009433
|
|
$
|
0.472071
|
|
|
98
|
%
|
|
—
|
%
|
|
2
|
%
|
|
100
|
%
| ||||||||||||
| (a) | The Fund estimates that it has distributed more than its net investment income and net realized capital gains; therefore, a portion of the distribution may be a return of capital. A return of capital may occur, for example, when some or all of the shareholder’s investment in the Fund is returned to the shareholder. A return of capital does not necessarily reflect the Fund’s investment performance and should not be confused with “yield” or “income”. When distributions exceed total return performance, the difference will incrementally reduce the Fund’s net asset value per share. |
| S U P P L E M E N T A L I N F O R M A T I O N |
75 |
Trustee and Officer Information
| Independent Trustees(a) | ||||||||
| Name Year of Birth(b)
|
Position(s) Held (Length of Service)
|
Principal Occupation(s) During Past Five Years
|
Number of BlackRock-Advised Registered Investment Companies (“RICs”) Consisting of Investment Portfolios (“Portfolios”) Overseen
|
Public Company and Investment Company During Past Five Years
| ||||
| Mark Stalnecker 1951 |
Chair of the Board and Trustee (Since 2019) |
Chief Investment Officer, University of Delaware from 1999 to 2013; Trustee and Chair of the Finance and Investment Committees, Winterthur Museum and Country Estate from 2005 to 2016; Member of the Investment Committee, Delaware Public Employees’ Retirement System since 2002; Member of the Investment Committee, Christiana Care Health System from 2009 to 2017; Member of the Investment Committee, Delaware Community Foundation from 2013 to 2014; Director and Chair of the Audit Committee, SEI Private Trust Co. from 2001 to 2014.
|
36 RICs consisting of 155 Portfolios | None | ||||
| Bruce R. Bond 1946 |
Trustee (Since 2019) |
Board Member, Amsphere Limited (software) since 2018; Trustee and Member of the Governance Committee, State Street Research Mutual Funds from 1997 to 2005; Board Member of Governance, Audit and Finance Committee, Avaya Inc. (computer equipment) from 2003 to 2007.
|
36 RICs consisting of 155 Portfolios | None | ||||
| Susan J. Carter 1956 |
Trustee (Since 2019) |
Director, Pacific Pension Institute from 2014 to 2018; Advisory Board Member, Center for Private Equity and Entrepreneurship at Tuck School of Business since 1997; Senior Advisor, Commonfund Capital, Inc. (“CCI”) (investment adviser) in 2015; Chief Executive Officer, CCI from 2013 to 2014; President & Chief Executive Officer, CCI from 1997 to 2013; Advisory Board Member, Girls Who Invest from 2015 to 2018 and Board Member thereof since 2018; Advisory Board Member, Bridges Fund Management since 2016; Trustee, Financial Accounting Foundation since 2017; Practitioner Advisory Board Member, Private Capital Research Institute (“PCRI”) since 2017; Lecturer in the Practice of Management, Yale School of Management since 2019; Advisor to Finance Committee, Altman Foundation since 2020.
|
36 RICs consisting of 155 Portfolios | None | ||||
| Collette Chilton 1958 |
Trustee (Since 2019) |
Chief Investment Officer, Williams College since 2006; Chief Investment Officer, Lucent Asset Management Corporation from 1998 to 2006; Director, Boys and Girls Club of Boston since 2017; Director, B1 Capital since 2018; Director, David and Lucile Packard Foundation since 2020.
|
36 RICs consisting of 155 Portfolios | None | ||||
| Neil A. Cotty 1954 |
Trustee (Since 2019) |
Bank of America Corporation from 1996 to 2015, serving in various senior finance leadership roles, including Chief Accounting Officer, from 2009 to 2015, Chief Financial Officer of Global Banking, Markets and Wealth Management from 2008 to 2009, Chief Accounting Officer from 2004 to 2008, Chief Financial Officer of Consumer Bank from 2003 to 2004, Chief Financial Officer of Global Corporate Investment Bank from 1999 to 2002.
|
36 RICs consisting of 155 Portfolios | None | ||||
| 76 | 2 0 2 1 B L A C K R O C K A N N U A L R E P O R T T O S H A R E H O L D E R S |
| Trustee and Officer Information (continued) |
| Independent Trustees(a) (continued) | ||||||||
| Name
|
Position(s) Held
|
Principal Occupation(s) During Past Five Years
|
Number of BlackRock-Advised
|
Public Company and
| ||||
| Lena G. 1949 |
Trustee (Since 2019) |
Director, Charles Stark Draper Laboratory, Inc. since 2013; Senior Lecturer, Harvard Business School, from 2008 to 2021; FMR LLC/Fidelity Investments (financial services) from 1996 to 2008, serving in various senior roles including Executive Vice President – Strategic Corporate Initiatives and Executive Vice President and General Counsel; Partner, Sullivan & Worcester LLP from 1985 to 1996 and Associate thereof from 1979 to 1985. | 36 RICs consisting of 155 Portfolios | None | ||||
| Henry R. Keizer 1956 |
Trustee (Since 2019) |
Director, Park Indemnity Ltd. (captive insurer) since 2010; Director, MUFG Americas Holdings Corporation and MUFG Union Bank, N.A. (financial and bank holding company) from 2014 to 2016; Director, American Institute of Certified Public Accountants from 2009 to 2011; Director, KPMG LLP (audit, tax and advisory services) from 2004 to 2005 and 2010 to 2012; Director, KPMG International in 2012, Deputy Chairman and Chief Operating Officer thereof from 2010 to 2012 and U.S. Vice Chairman of Audit thereof from 2005 to 2010; Global Head of Audit, KPMGI (consortium of KPMG firms) from 2006 to 2010; Director, YMCA of Greater New York from 2006 to 2010. | 36 RICs consisting of 155 Portfolios | Hertz Global Holdings (car rental); Sealed Air Corp. (packaging); Montpelier Re Holdings, Ltd. (publicly held property and casualty reinsurance) from 2013 to 2015; WABCO (commercial vehicle safety systems) from 2015 to 2020. | ||||
| Cynthia A. Montgomery 1952 |
Trustee (Since 2019) |
Professor, Harvard Business School since 1989. | 36 RICs consisting of 155 Portfolios | Newell Rubbermaid, Inc. (manufacturing) from 1995 to 2016. | ||||
| Donald C. Opatrny 1952 |
Trustee (Since 2019) |
Trustee, Vice Chair, Member of the Executive Committee and Chair of the Investment Committee, Cornell University from 2004 to 2019; President, Trustee and Member of the Investment Committee, The Aldrich Contemporary Art Museum from 2007 to 2014; Member of the Board and Investment Committee, University School from 2007 to 2018; Member of the Investment Committee, Mellon Foundation from 2009 to 2015; Trustee, Artstor (a Mellon Foundation affiliate) from 2010 to 2015; President and Trustee, the Center for the Arts, Jackson Hole from 2011 to 2018; Director, Athena Capital Advisors LLC (investment management firm) since 2013; Trustee and Chair of the Investment Committee, Community Foundation of Jackson Hole since 2014; Member of Affordable Housing Supply Board of Jackson, Wyoming since 2017; Member, Investment Funds Committee, State of Wyoming since 2017; Trustee, Phoenix Art Museum since 2018; Trustee, Arizona Community Foundation and Member of Investment Committee since 2020. | 36 RICs consisting of 155 Portfolios | None | ||||
| Joseph P. Platt 1947 |
Trustee (Since 2019) |
General Partner, Thorn Partners, LP (private investments) since 1998; Director, WQED Multi-Media (public broadcasting not-for-profit) since 2001; Chair, Basic Health International (non-profit) since 2015. | 36 RICs consisting of 155 Portfolios | Greenlight Capital Re, Ltd. (reinsurance company); Consol Energy Inc. | ||||
| T R U S T E E A N D O F F I C E R I N F O R M A T I O N |
77 |
| Trustee and Officer Information (continued) |
| Independent Trustees(a) (continued) | ||||||||
| Name Year of Birth(b)
|
Position(s) Held (Length of Service)
|
Principal Occupation(s) During Past Five Years
|
Number of BlackRock-Advised Registered Investment Companies (“RICs”) Consisting of Investment
|
Public Company and Investment Company Past Five Years
| ||||
| Kenneth L. Urish 1951 |
Trustee (Since 2019) |
Managing Partner, Urish Popeck & Co., LLC (certified public accountants and consultants) since 1976; Past-Chairman of the Professional Ethics Committee of the Pennsylvania Institute of Certified Public Accountants and Committee Member thereof since 2007; Member of External Advisory Board, The Pennsylvania State University Accounting Department since founding in 2001; Principal, UP Strategic Wealth Investment Advisors, LLC since 2013; Trustee, The Holy Family Institute from 2001 to 2010; President and Trustee, Pittsburgh Catholic Publishing Associates from 2003 to 2008; Director, Inter-Tel from 2006 to 2007; Member, Advisory Board, ESG Competent Boards since 2020. | 36 RICs consisting of 155 Portfolios | None | ||||
| Claire A. Walton 1957 |
Trustee (Since 2019) |
Chief Operating Officer and Chief Financial Officer of Liberty Square Asset Management, LP from 1998 to 2015; General Partner of Neon Liberty Capital Management, LLC since 2003; Director, Boston Hedge Fund Group from 2009 to 2018; Director, Woodstock Ski Runners since 2013; Director, Massachusetts Council on Economic Education from 2013 to 2015. | 36 RICs consisting of 155 Portfolios | None | ||||
|
(a) The address of each Trustee is c/o BlackRock, Inc., 55 East 52nd Street, New York, New York 10055. (b) Independent Trustees serve until their resignation, retirement, removal or death, or until December 31 of the year in which they turn 75. The Board may determine to extend the terms of Independent Trustees on a case-by-case basis, as appropriate.
| ||||||||
| Interested Trustees(a)(b) | ||||||||
| Name Year of Birth
|
Position(s) Held (Length of Service)
|
Principal Occupation(s) During Past Five Years
|
Number of BlackRock-Advised Registered Investment Companies (“RICs”) Consisting of Investment Portfolios (“Portfolios”) Overseen
|
Public Company and Investment Company Past Five Years
| ||||
| Robert Fairbairn 1965 |
Trustee (since 2019) | Vice Chairman of BlackRock, Inc. since 2019; Member of BlackRock’s Global Executive and Global Operating Committees; Co-Chair of BlackRock’s Human Capital Committee; Senior Managing Director of BlackRock, Inc. from 2010 to 2019; oversaw BlackRock’s Strategic Partner Program and Strategic Product Management Group from 2012 to 2019; Member of the Board of Managers of BlackRock Investments, LLC from 2011 to 2018; Global Head of BlackRock’s Retail and iShares® businesses from 2012 to 2016. | 103 RICs consisting of 252 Portfolios | None | ||||
| John M. Perlowski(c) 1964 |
Trustee and President and Chief Executive Officer (since 2019) | Managing Director of BlackRock, Inc. since 2009; Head of BlackRock Global Accounting and Product Services since 2009; Advisory Director of Family Resource Network (charitable foundation) since 2009. | 105 RICs consisting of 254 Portfolios | None | ||||
|
(a) The address of each Trustee is c/o BlackRock, Inc., 55 East 52nd Street, New York, New York 10055. (b) Mr. Fairbairn and Mr. Perlowski are both “interested persons,” as defined in the 1940 Act, of the Trust based on their positions with BlackRock, Inc. and its affiliates. Mr. Fairbairn and Mr. Perlowski are also board members of the BlackRock Fixed-Income Complex. (c) Mr. Perlowski is also a trustee of the BlackRock Credit Strategies Fund and BlackRock Private Investments Fund. | ||||||||
| 78 | 2 0 2 1 B L A C K R O C K A N N U A L R E P O R T T O S H A R E H O L D E R S |
Trustee and Officer Information (continued)
| Officers Who Are Not Trustees(a) | ||||
| Name Year of Birth(b)
|
Position(s) Held (Length of Service)
|
Principal Occupation(s) During Past Five Years
| ||
| Jennifer McGovern 1977
|
Vice President (since 2019) |
Managing Director of BlackRock, Inc. since 2016; Director of BlackRock, Inc. from 2011 to 2015; Head of Americas Product Development and Governance for BlackRock’s Global Product Group since 2019; Head of Product Structure and Oversight for BlackRock’s U.S. Wealth Advisory Group from 2013 to 2019.
| ||
| Trent Walker 1974 |
Chief Financial Officer (since 2021) |
Managing Director of BlackRock, Inc. since September 2019; Executive Vice President of PIMCO from 2016 to 2019; Senior Vice President of PIMCO from 2008 to 2015; Treasurer from 2013 to 2019 and Assistant Treasurer from 2007 to 2017 of PIMCO Funds, PIMCO Variable Insurance Trust, PIMCO ETF Trust, PIMCO Equity Series, PIMCO Equity Series VIT, PIMCO Managed Accounts Trust, 2 PIMCO-sponsored interval funds and 21 PIMCO-sponsored closed-end funds.
| ||
| Jay M. Fife 1970
|
Treasurer (since 2019) |
Managing Director of BlackRock, Inc. since 2007. | ||
| Charles Park 1967 |
Chief Compliance Officer (since 2019) |
Anti-Money Laundering Compliance Officer for certain BlackRock-advised Funds from 2014 to 2015; Chief Compliance Officer of BlackRock Advisors, LLC and the BlackRock-advised Funds in the BlackRock Multi-Asset Complex and the BlackRock Fixed-Income Complex since 2014; Principal of and Chief Compliance Officer for iShares® Delaware Trust Sponsor LLC since 2012 and BlackRock Fund Advisors (“BFA”) since 2006; Chief Compliance Officer for the BFA-advised iShares® exchange traded funds since 2006; Chief Compliance Officer for BlackRock Asset Management International Inc. since 2012.
| ||
| Lisa Belle 1968 |
Anti-Money Laundering Compliance Officer (since 2019)
|
Managing Director of BlackRock, Inc. since 2019; Global Financial Crime Head for Asset and Wealth Management of JP Morgan from 2013 to 2019; Managing Director of RBS Securities from 2012 to 2013; Head of Financial Crimes for Barclays Wealth Americas from 2010 to 2012.
| ||
| Janey Ahn 1975
|
Secretary (since 2019)
|
Managing Director of BlackRock, Inc. since 2018; Director of BlackRock, Inc. from 2009 to 2017. | ||
| (a) The | address of each Officer is c/o BlackRock, Inc., 55 East 52nd Street, New York, New York 10055. |
| (b) Officers | of the Trust serve at the pleasure of the Board. |
Further information about the Trust’s Trustees and Officers is available in the Trust’s Statement of Additional Information, which can be obtained without charge by calling (800) 441-7762.
| T R U S T E E A N D O F F I C E R I N F O R M A T I O N |
79 |
| Additional Information |
General Information
Quarterly performance, semi-annual and annual reports, current net asset value and other information regarding the Funds may be found on BlackRock’s website, which can be accessed at blackrock.com. Any reference to BlackRock’s website in this report is intended to allow investors public access to information regarding the Funds and does not, and is not intended to, incorporate BlackRock’s website in this report.
Householding
The Funds will mail only one copy of shareholder documents, including prospectuses, annual and semi-annual reports, Rule 30e-3 notices and proxy statements, to shareholders with multiple accounts at the same address. This practice is commonly called “householding” and is intended to reduce expenses and eliminate duplicate mailings of shareholder documents. Mailings of your shareholder documents may be householded indefinitely unless you instruct us otherwise. If you do not want the mailing of these documents to be combined with those for other members of your household, please call the Funds at (800) 441-7762.
Availability of Quarterly Schedule of Investments
The Funds file their complete schedules of portfolio holdings with the SEC for the first and third quarters of each fiscal year as an exhibit to their reports on Form N-PORT. The Funds’ Forms N-PORT are available on the SEC’s website at sec.gov. Additionally, each Fund makes its portfolio holdings for the first and third quarters of each fiscal year available at ishares.com/fundreports and blackrock.com/fundreports.
Availability of Proxy Voting Policies, Procedures and Voting Records
A description of the policies and procedures that the Funds use to determine how to vote proxies relating to portfolio securities and information about how the Funds voted proxies relating to securities held in the Funds’ portfolios during the most recent 12-month period ended June 30 is available upon request and without charge (1) by calling (800) 441-7762; (2) on the BlackRock website at blackrock.com; and (3) on the SEC’s website at sec.gov.
A description of the Company’s policies and procedures with respect to the disclosure of the Fund’s portfolio securities is available in the Fund Prospectus. The Fund discloses its portfolio holdings daily and provides information regarding its top holdings in Fund fact sheets at iShares.com.
BlackRock Privacy Principles
BlackRock is committed to maintaining the privacy of its current and former fund investors and individual clients (collectively, “Clients”) and to safeguarding their non-public personal information. The following information is provided to help you understand what personal information BlackRock collects, how we protect that information and why in certain cases we share such information with select parties.
If you are located in a jurisdiction where specific laws, rules or regulations require BlackRock to provide you with additional or different privacy-related rights beyond what is set forth below, then BlackRock will comply with those specific laws, rules or regulations.
BlackRock obtains or verifies personal non-public information from and about you from different sources, including the following: (i) information we receive from you or, if applicable, your financial intermediary, on applications, forms or other documents; (ii) information about your transactions with us, our affiliates, or others; (iii) information we receive from a consumer reporting agency; and (iv) from visits to our websites.
BlackRock does not sell or disclose to non-affiliated third parties any non-public personal information about its Clients, except as permitted by law or as is necessary to respond to regulatory requests or to service Client accounts. These non-affiliated third parties are required to protect the confidentiality and security of this information and to use it only for its intended purpose.
We may share information with our affiliates to service your account or to provide you with information about other BlackRock products or services that may be of interest to you. In addition, BlackRock restricts access to non-public personal information about its Clients to those BlackRock employees with a legitimate business need for the information. BlackRock maintains physical, electronic and procedural safeguards that are designed to protect the non-public personal information of its Clients, including procedures relating to the proper storage and disposal of such information.
| 80 | 2 0 2 1 B L A C K R O C K A N N U A L R E P O R T T O S H A R E H O L D E R S |
| Additional Information (continued) |
Fund and Service Providers
| Investment Adviser BlackRock Fund Advisors San Francisco, CA 94105 |
Independent Registered Public Accounting Firm PricewaterhouseCoopers LLP Philadelphia, Pennsylvania 19103 | |
| Administrator, Custodian and Transfer Agent State Street Bank and Trust Company Boston, MA, 02111 |
Legal Counsel Sidley Austin LLP New York, NY 10019 | |
| Distributor BlackRock Investments, LLC New York, NY 10022 |
Address of the Trust 100 Bellevue Parkway Wilmington, DE 19809 | |
| A D D I T I O N A L I N F O R M A T I O N |
81 |
| Glossary of Terms Used in this Report |
Portfolio Abbreviations - Equity
| ADR | American Depositary Receipt | |
| NVS | Non-Voting Shares | |
| REIT | Real Estate Investment Trust | |
| 82 | 2 0 2 1 B L A C K R O C K A N N U A L R E P O R T T O S H A R E H O L D E R S |
Want to know more?
blackrock.com | (800) 441-7762
This report is intended for current holders. It is not authorized for use as an offer of sale or a solicitation of an offer to buy shares of the Funds unless preceded or accompanied by the Funds’ current prospectus. Past performance results shown in this report should not be considered a representation of future performance. Investment returns and principal value of shares will fluctuate so that shares, when redeemed, may be worth more or less than their original cost. Statements and other information herein are as dated and are subject to change.
USEFR-7/21-AR
|
|
|


(b) Not Applicable
| Item 3 – | Audit Committee Financial Expert – The registrant’s board of directors (the “board of directors”), has determined that (i) the registrant has the following audit committee financial experts serving on its audit committee and (ii) each audit committee financial expert is independent: |
Neil A. Cotty
Henry R. Keizer
Kenneth L. Urish
Under applicable securities laws, a person determined to be an audit committee financial expert will not be deemed an “expert” for any purpose, including without limitation for the purposes of Section 11 of the Securities Act of 1933, as a result of being designated or identified as an audit committee financial expert. The designation or identification of a person as an audit committee financial expert does not impose on such person any duties, obligations, or liabilities greater than the duties, obligations, and liabilities imposed on such person as a member of the audit committee and board of directors in the absence of such designation or identification. The designation or identification of a person as an audit committee financial expert does not affect the duties, obligations, or liability of any other member of the audit committee or board of directors.
| Item 4 – | Principal Accountant Fees and Services |
The following table presents fees billed by Pricewaterhouse Coopers (“PwC”) in each of the last two fiscal years for the services rendered to the Fund:
| (a) Audit Fees |
(b) Audit-Related Fees1 |
(c) Tax Fees2 | (d) All Other Fees | |||||||||||||
| Entity Name | Current Fiscal Year End |
Previous Fiscal Year End |
Current Fiscal Year End |
Previous Fiscal Year End |
Current Fiscal Year End |
Previous Fiscal Year End |
Current Fiscal Year End |
Previous Fiscal Year End | ||||||||
| BlackRock Future Health ETF |
$11,400 | N/A | $0 | $0 | $6,028 | N/A | $0 | $0 | ||||||||
| BlackRock Future Innovators ETF |
$11,400 | N/A | $0 | $0 | $6,028 | N/A | $0 | $0 | ||||||||
| BlackRock Future Tech ETF |
$11,400 | N/A | $0 | $0 | $6,028 | N/A | $0 | $0 | ||||||||
| BlackRock U.S. Carbon Transition Readiness ETF |
$11,400 | N/A | $0 | $0 | $6,028 | N/A | $0 | $0 | ||||||||
| BlackRock U.S. Equity Factor Rotation ETF |
$12,000 | $12,000 | $0 | $0 | $6,028 | $6,028 | $0 | $0 | ||||||||
| BlackRock World ex U.S. Carbon Transition Readiness ETF |
$13,900 | N/A | $0 | $0 | $6,028 | N/A | $0 | $0 | ||||||||
2
The following table presents fees billed by PwC that were required to be approved by the registrant’s audit committee (the “Committee”) for services that relate directly to the operations or financial reporting of the Fund and that are rendered on behalf of BlackRock Advisors, LLC (the “Investment Adviser” or “BlackRock”) and entities controlling, controlled by, or under common control with BlackRock (not including any sub-adviser whose role is primarily portfolio management and is subcontracted with or overseen by another investment adviser) that provide ongoing services to the Fund (“Affiliated Service Providers”):
| Current Fiscal Year End | Previous Fiscal Year End | |||
| (b) Audit-Related Fees1 |
$0 | $0 | ||
| (c) Tax Fees2 |
$0 | $0 | ||
| (d) All Other Fees3 |
$0 | $0 |
1 The nature of the services includes assurance and related services reasonably related to the performance of the audit or review of financial statements not included in Audit Fees, including accounting consultations, agreed-upon procedure reports, attestation reports, comfort letters, out-of-pocket expenses and internal control reviews not required by regulators.
2 The nature of the services includes tax compliance and/or tax preparation, including services relating to the filing or amendment of federal, state or local income tax returns, regulated investment company qualification reviews, taxable income and tax distribution calculations.
3 Aggregate fees borne by BlackRock in connection with the review of compliance procedures and attestation thereto performed by PwC with respect to all of the registered closed-end funds and some of the registered open-end funds advised by BlackRock.
(e)(1) Audit Committee Pre-Approval Policies and Procedures:
The Committee has adopted policies and procedures with regard to the pre-approval of services. Audit, audit-related and tax compliance services provided to the registrant on an annual basis require specific pre-approval by the Committee. The Committee also must approve other non-audit services provided to the registrant and those non-audit services provided to the Investment Adviser and Affiliated Service Providers that relate directly to the operations and the financial reporting of the registrant. Certain of these non-audit services that the Committee believes are (a) consistent with the SEC’s auditor independence rules and (b) routine and recurring services that will not impair the independence of the independent accountants may be approved by the Committee without consideration on a specific case-by-case basis (“general pre-approval”). The term of any general pre-approval is 12 months from the date of the pre-approval, unless the Committee provides for a different period. Tax or other non-audit services provided to the registrant which have a direct impact on the operations or financial reporting of the registrant will only be deemed pre-approved provided that any individual project does not exceed $10,000 attributable to the registrant or $50,000 per project. For this purpose, multiple projects will be aggregated to determine if they exceed the previously mentioned cost levels.
Any proposed services exceeding the pre-approved cost levels will require specific pre-approval by the Committee, as will any other services not subject to general pre-approval (e.g., unanticipated but permissible services). The Committee is informed of each service approved subject to general pre-approval at the next regularly scheduled in-person board meeting. At this meeting, an analysis of such services is presented to the Committee for ratification. The Committee may delegate to the Committee Chairman the authority to approve the provision of and fees for any specific engagement of permitted non-audit services, including services exceeding pre-approved cost levels.
(e)(2) None of the services described in each of Items 4(b) through (d) were approved by the Committee pursuant to the de minimis exception in paragraph (c)(7)(i)(C) of Rule 2-01 of Regulation S-X.
(f) Not Applicable
3
(g) The aggregate non-audit fees, defined as the sum of the fees shown under “Audit-Related Fees,” “Tax Fees” and “All Other Fees,” paid to the accountant for services rendered by the accountant to the registrant, the Investment Adviser and the Affiliated Service Providers were:
| Entity Name | Current Fiscal Year End |
Previous Fiscal Year End | ||||
| BlackRock Future Health ETF | $6,028 | N/A | ||||
| BlackRock Future Innovators ETF | $6,028 | N/A | ||||
| BlackRock Future Tech ETF | $6,028 | N/A! | ||||
| BlackRock U.S. Carbon Transition Readiness ETF | $6,028 | N/A | ||||
| BlackRock U.S. Equity Factor Rotation ETF | $6,028 | $6,028 | ||||
| BlackRock World ex U.S. Carbon Transition Readiness ETF | $6,028 | N/A |
(h) The Committee has considered and determined that the provision of non-audit services that were rendered to the Investment Adviser and the Affiliated Service Providers that were not pre-approved pursuant to paragraph (c)(7)(ii) of Rule 2-01 of Regulation S-X is compatible with maintaining the principal accountant’s independence.
| Item 5 – | Audit Committee of Listed Registrant |
| (a) | The following individuals are members of the registrant’s separately designated standing audit committee established in accordance with Section 3(a)(58)(A) of the Securities Exchange Act of 1934 (15 U.S.C. 78c(a)(58)(A)): |
Michael Castellano
Frank J. Fabozzi
J. Phillip Holloman
Catherine A. Lynch Karen P. Robards
| (b) | Not Applicable |
| Item 6 – | Investments (a) |
(a) The registrant’s Schedule of Investments is included as part of the Report to Stockholders filed under Item 1(a) of this Form.
(b) Not Applicable due to no such divestments during the semi-annual period covered since the previous Form N-CSR filing.
| Item 7 – | Disclosure of Proxy Voting Policies and Procedures for Closed-End Management Investment Companies – Not Applicable |
| Item 8 – | Portfolio Managers of Closed-End Management Investment Companies – Not Applicable |
4
| Item 9 – | Purchases of Equity Securities by Closed-End Management Investment Company and Affiliated Purchasers – Not Applicable |
| Item 10 – | Submission of Matters to a Vote of Security Holders – There have been no material changes to these procedures. |
| Item 11 – | Controls and Procedures |
(a) The registrant’s principal executive and principal financial officers, or persons performing similar functions, have concluded that the registrant’s disclosure controls and procedures (as defined in Rule 30a-3(c) under the Investment Company Act of 1940, as amended (the “1940 Act”)) are effective as of a date within 90 days of the filing of this report based on the evaluation of these controls and procedures required by Rule 30a-3(b) under the 1940 Act and Rule 15d-15(b) under the Securities Exchange Act of 1934, as amended.
(b) There were no changes in the registrant’s internal control over financial reporting (as defined in Rule 30a-3(d) under the 1940 Act) that occurred during the period covered by this report that have materially affected, or are reasonably likely to materially affect, the registrant’s internal control over financial reporting.
| Item 12 – | Disclosure of Securities Lending Activities for Closed-End Management Investment Companies –Not Applicable |
| Item 13 – | Exhibits attached hereto |
(a)(1) Code of Ethics – See Item 2
(a)(2) Section 302 Certifications are attached
(a)(3) Not Applicable
(a)(4) Not Applicable
(b) Section 906 Certifications are attached
5
Pursuant to the requirements of the Securities Exchange Act of 1934 and the Investment Company Act of 1940, the registrant has duly caused this report to be signed on its behalf by the undersigned, thereunto duly authorized.
BlackRock ETF Trust
| By: | /s/ John M. Perlowski | |||
| John M. Perlowski | ||||
| Chief Executive Officer (principal executive officer) of | ||||
| BlackRock ETF Trust |
Date: October 4, 2021
Pursuant to the requirements of the Securities Exchange Act of 1934 and the Investment Company Act of 1940, this report has been signed below by the following persons on behalf of the registrant and in the capacities and on the dates indicated.
| By: | /s/ John M. Perlowski | |||
| John M. Perlowski | ||||
| Chief Executive Officer (principal executive officer) of | ||||
| BlackRock ETF Trust |
Date: October 4, 2021
| By: | /s/ Trent Walker | |||
| Trent Walker | ||||
| Chief Financial Officer (principal financial officer) of | ||||
| BlackRock ETF Trust |
Date: October 4, 2021
6