Filed pursuant to Rule 424(b)(3)
1933 Act File No. 333-272168
PROSPECTUS SUPPLEMENT dated August 22, 2023
(to Prospectus dated June 29, 2023, as supplemented from time to time)
(to Prospectus dated June 29, 2023, as supplemented from time to time)
$75,000,000 of Common Stock
Up to 1,000,000 Shares of 5.00% Series A Term Preferred Stock due 2026
Liquidation Preference $25 per share
Up to 1,000,000 Shares of 7.75% Series B Term Preferred Stock due 2028
Liquidation Preference $25 per share
Up to 1,000,000 Shares of 5.00% Series A Term Preferred Stock due 2026
Liquidation Preference $25 per share
Up to 1,000,000 Shares of 7.75% Series B Term Preferred Stock due 2028
Liquidation Preference $25 per share
We are an externally managed, diversified closed-end management investment company that has registered as an investment company under the Investment Company Act of 1940, as amended, or the “1940 Act.” Our primary investment objective is to generate high current income, with a secondary objective to generate capital appreciation. We seek to achieve our investment objectives by investing primarily in junior debt tranches of collateralized loan obligations, or “CLOs,” that are collateralized by a portfolio consisting primarily of below investment grade U.S. senior secured loans with a large number of distinct underlying borrowers across various industry sectors. We focus on CLO debt tranches rated “BB” (e.g., BB+, BB or BB-, or their equivalent) by Moody’s Investors Service, Inc., or “Moody’s,” S&P Global Ratings, or “S&P,” or Fitch Ratings, Inc., or “Fitch,” and/or other applicable nationally recognized statistical rating organizations. We refer to such debt tranches in this prospectus supplement as “BB-Rated CLO Debt.” We may also invest in other junior debt tranches of CLOs, senior debt tranches of CLOs, loan accumulation facilities (“LAF”) and other related securities and instruments, including synthetic investments, such as significant risk transfer securities and credit risk transfer securities issued by banks or other financial institutions. In addition, we may invest up to 35% of our total assets (at the time of investment) in CLO equity securities. We expect our investments in CLO equity securities to primarily reflect minority ownership positions. CLO junior debt and equity securities are highly leveraged, and therefore the CLO securities in which we intend to invest are subject to a higher degree of loss since the use of leverage magnifies losses. See “Risk Factors — Risks Related to Our Investments — We may leverage our portfolio, which would magnify the potential for gain or loss on amounts invested and will increase the risk of investing in us” in the accompanying prospectus. We may also invest in other securities and instruments that our investment adviser believes are consistent with our investment objectives. The CLO securities in which we primarily seek to invest are rated below investment grade or, in the case of CLO equity securities, are unrated and are considered speculative with respect to timely payment of interest and repayment of principal. Below investment grade and unrated securities are also sometimes referred to as “junk” securities.
Eagle Point Income Management LLC, or “Eagle Point Income Management” or the “Adviser,” our investment adviser, manages our investments subject to the supervision of our board of directors. An affiliate of the Adviser, Eagle Point Credit Management LLC, or “Eagle Point Credit Management,” provides investment professionals and other resources to the Adviser as the Adviser may determine to be reasonably necessary to conduct its operations. As of June 30, 2023, the Adviser, collectively with Eagle Point Credit Management, had approximately $7.8 billion in total assets under management, including capital commitments that were undrawn as of such date. Eagle Point Administration LLC, an affiliate of the Adviser, or the “Administrator,” serves as our administrator.
We are offering up to $75,000,000 aggregate offering price of our common stock, up to 1,000,000 shares of our 5.00% Series A Term Preferred Stock due 2026, or the “Series A Term Preferred Stock,” with an aggregate liquidation preference of $25,000,000, and up to 1,000,000 shares of our Series B Term Preferred Stock due 2028, or the “Series B Term Preferred Stock,” and, together with the Series A Term Preferred Stock, the “Preferred Stock,” with an aggregate liquidation preference of $25,000,000 pursuant to this prospectus supplement and the accompanying prospectus. We have entered into the Third Amended and Restated At Market Issuance Sales Agreement, dated August 21, 2023, or the “Sales Agreement,” with B. Riley Securities, Inc. (“B. Riley”), which we refer to as the placement agent, relating to the sale of shares of common stock, Series A Term Preferred Stock, and Series B Term Preferred Stock offered by this prospectus supplement and the accompanying prospectus.
The Sales Agreement provides that we may offer and sell shares of our common stock, Series A Term Preferred Stock, and Series B Term Preferred Stock from time to time through the placement agent, as placement agent or principal. Sales of our common stock, Series A Term Preferred Stock, and Series B Term Preferred Stock, if any, under this prospectus supplement and the accompanying prospectus may be made by any method that is deemed to be an “at the market offering” as defined in Rule 415 under the Securities Act of 1933, as amended. There is no arrangement for funds to be received in an escrow, trust or similar arrangement.
We are required to redeem all outstanding shares of the Series A Term Preferred Stock on October 30, 2026, at a redemption price of $25 per share, or the “Series A Liquidation Preference,” plus accumulated but unpaid dividends, if any, to, but excluding, the Series A Redemption Date (as defined below). At any time after October 31, 2023, we may, at our sole option, redeem the outstanding shares of the Series A Term Preferred Stock at a redemption price per share equal to the Series A Liquidation Preference plus accumulated but unpaid dividends, if any, to, but excluding, the Series A Redemption Date.
We are required to redeem all outstanding shares of the Series B Term Preferred Stock on July 31, 2028, at a redemption price of $25 per share, or the “Series B Liquidation Preference,” plus accumulated but unpaid dividends, if any, to, but excluding, the Series B Mandatory Redemption Date (as defined below). At any time on or after July 31, 2025, we may, at our sole option, redeem the outstanding shares of the Series B Term Preferred Stock at a redemption price per share equal to the Series B Liquidation Preference plus accumulated but unpaid dividends, if any, to, but excluding, the Series B Redemption Date (as defined below).
In addition, if we fail to maintain asset coverage (as defined in Section 18(h) of the 1940 Act) of at least 200%, we will be required to redeem the number of shares of our preferred stock (which at our discretion may include any number or portion of the Preferred Stock) that, when combined with any debt securities redeemed for failure to maintain the asset coverage required by the indenture governing such securities (if applicable), (1) results in us having asset coverage of at least 200%, or (2) if fewer, the maximum number of shares of preferred stock that can be redeemed out of funds legally available for such redemption. In connection with any redemption for failure to maintain such asset coverage, we may, in our sole option, redeem such additional number of shares of preferred stock that will result in asset coverage up to and including 285%. We intend to pay monthly dividends on the Series A Term Preferred Stock at an annual rate of 5.00% of the Liquidation Preference, or $1.25 per share per year. We intend to pay monthly dividends on the Series B Term Preferred Stock at an annual rate of 7.75% of the Liquidation Preference, or $1.9375 per share per year, beginning on August 31, 2023. The Preferred Stock ranks senior in right of payment to our common stock, ranks equally in right of payment with any shares of preferred stock we have issued or may issue in the future. Each holder of the Preferred Stock is entitled to one vote on each matter submitted to a vote of our stockholders, and the holders of all of our outstanding preferred stock and common stock generally vote together as a single class. The holders of shares of the Preferred Stock (together with any additional series of preferred stock we may issue in the future) are entitled as a class to elect two of our directors and, if dividends on any outstanding shares of our preferred stock are in arrears by two years or more, to elect a majority of our directors (and to continue to be so represented until all dividends in arrears have been paid or otherwise provided for).
The placement agent will receive a commission from us equal to up to 2.0% of the gross sales price of any shares of our common stock or Preferred Stock sold through it under the Sales Agreement. The placement agent is not required to sell any specific number or dollar amount of common stock or Preferred Stock but will use its commercially reasonable efforts consistent with its sales and trading practices to sell the shares of our common stock and Preferred Stock offered by this prospectus supplement and the accompanying prospectus. For all fees and expenses paid to the placement agent, see “Plan of Distribution” beginning on page S-14 of this prospectus supplement. The sales price per share of our common stock offered by this prospectus supplement and the accompanying prospectus, less commissions payable under the Sales Agreement and discounts, if any, will not be less than the net asset value, or, “NAV,” per share of our common stock at the time of such sale.
Our common stock, Series A Term Preferred Stock, and Series B Term Preferred Stock trade on the New York Stock Exchange under the symbols “EIC,” “EICA,” and “EICB,” respectively. The last reported closing sales price for our common stock on August 18, 2023 was $13.93 per share. We determine the NAV per share of our common stock on a quarterly basis. As of June 30, 2023, the NAV per share of our common stock was $13.00 (the last date prior to the date of this prospectus supplement as of which we determined our NAV). Management’s unaudited estimate of the range of our NAV per share of our common stock as of July 31, 2023 was between $13.39 and $13.49 .
Even though shares of the common stock and Preferred Stock are listed on an exchange, such shares may be thinly traded and you may face a greater risk of loss if you sell on the secondary market under these conditions. Investors who purchase shares of the common stock at a premium may also be subject to a heighted risk of loss under certain circumstances. Shares of common stock of closed-end management investment companies that are listed on an exchange frequently trade at a discount to their NAV. If our shares of common stock trade at a discount to our NAV, it will likely increase the risk of loss for purchasers of our securities.
We generally borrow funds to make investments. As a result, we are exposed to the risk of borrowing (also known as leverage) which may be considered a speculative investment technique. Leverage increases the volatility of investments and magnifies the potential for loss on amounts invested thereby increasing the risk associated with investing in our common stock or Preferred Stock.
Investing in our securities involves a high degree of risk, including the risk of a substantial loss of investment. Before purchasing any shares of our common stock or Preferred Stock, you should read the discussion of the principal risks of investing in our securities, which are summarized in “Risk Factors” beginning on page S-15 of this prospectus supplement and on page 13 of the accompanying prospectus.
This prospectus supplement, the accompanying prospectus, any free writing prospectus, and the documents incorporated by reference in this prospectus supplement and the accompanying prospectus contain important information you should know before investing in our securities. Please read these documents before you invest and retain them for future reference. We file annual and semi-annual stockholder reports, proxy statements and other information with the U.S. Securities and Exchange Commission, or the “SEC.” To obtain this information free of charge or make other inquiries pertaining to us, please visit our website (www.eaglepointincome.com) or call (844) 810-6501 (toll-free). Information on our website is not incorporated by reference into or a part of this prospectus supplement or the accompanying prospectus. See “Additional Information” on page S-38 of this prospectus supplement. You may also obtain a copy of any information regarding us filed with the SEC from the SEC’s website (www.sec.gov).
Neither the SEC nor any state securities commission has approved or disapproved of these securities or determined that this prospectus supplement or the accompanying prospectus is truthful or complete. Any representation to the contrary is a criminal offense.
B. Riley Securities
The date of this prospectus supplement is August 22, 2023.
TABLE OF CONTENTS
PROSPECTUS SUPPLEMENT
| | | |
Page
|
| |||
| | | | | S-1 | | | |
| | | | | S-2 | | | |
| | | | | S-6 | | | |
| | | | | S-15 | | | |
| | | | | S-16 | | | |
| | | | | S-17 | | | |
| | | | | S-18 | | | |
| | | | | S-27 | | | |
| | | | | S-36 | | | |
| | | | | S-38 | | | |
| | | | | S-38 | | | |
| | | | | S-38 | | | |
| | | | | S-38 | | | |
| | | | | SA-1 | | | |
| | | | | SB-1 | | | |
PROSPECTUS
| | | |
Page
|
| |||
| | | | | 1 | | | |
| | | | | 12 | | | |
| | | | | 13 | | | |
| | | | | 51 | | | |
| | | | | 51 | | | |
| | | | | 51 | | | |
| | | | | 52 | | | |
| | | | | 55 | | | |
| | | | | 61 | | | |
| | | | | 65 | | | |
| | | | | 65 | | | |
| | | | | 65 | | | |
| | | | | 71 | | | |
| | | | | 82 | | | |
| | | | | 83 | | | |
| | | | | 89 | | | |
| | | | | 90 | | | |
| | | | | 92 | | | |
| | | | | 101 | | | |
| | | | | 103 | | | |
| | | | | 105 | | | |
S-i
ABOUT THIS PROSPECTUS SUPPLEMENT
This document is in two parts. The first part is this prospectus supplement, which describes the specific details regarding this offering and also adds to and updates information contained in the accompanying prospectus and the documents incorporated by reference into this prospectus supplement and the accompanying prospectus. The second part is the accompanying prospectus, which provides general information about us and the securities we may offer from time to time, some of which may not apply to this offering. To the extent the information contained in this prospectus supplement differs from the information contained in the accompanying prospectus or the information included in any document filed prior to the date of this prospectus supplement and incorporated by reference in this prospectus supplement and the accompanying prospectus, the information in this prospectus supplement shall control. Generally, when we refer to this “prospectus,” we are referring to both this prospectus supplement and the accompanying prospectus combined, together with any free writing prospectus that we have authorized for use in connection with this offering.
YOU SHOULD RELY ONLY ON THE INFORMATION CONTAINED IN THIS PROSPECTUS SUPPLEMENT AND THE ACCOMPANYING PROSPECTUS, INCLUDING THE DOCUMENTS INCORPORATED BY REFERENCE HEREIN AND THEREIN, AND ANY FREE WRITING PROSPECTUS PREPARED BY, OR ON BEHALF OF, US THAT RELATES TO THIS OFFERING. WE HAVE NOT, AND THE PLACEMENT AGENT HAS NOT, AUTHORIZED ANY OTHER PERSON TO PROVIDE YOU WITH DIFFERENT OR ADDITIONAL INFORMATION. IF ANYONE PROVIDES YOU WITH DIFFERENT OR ADDITIONAL INFORMATION, YOU SHOULD NOT RELY ON IT. WE ARE NOT, AND THE PLACEMENT AGENT IS NOT, MAKING AN OFFER TO SELL THE COMMON STOCK AND THE PREFERRED STOCK IN ANY JURISDICTION WHERE THE OFFER OR SALE IS NOT PERMITTED. YOU SHOULD ASSUME THAT THE INFORMATION APPEARING IN THIS PROSPECTUS SUPPLEMENT AND THE ACCOMPANYING PROSPECTUS, INCLUDING THE DOCUMENTS INCORPORATED BY REFERENCE HEREIN AND THEREIN, AND ANY FREE WRITING PROSPECTUS PREPARED BY OR ON BEHALF OF US THAT RELATES TO THIS OFFERING IS ACCURATE ONLY AS OF ITS RESPECTIVE DATE, REGARDLESS OF THE TIME OF DELIVERY OF THIS PROSPECTUS SUPPLEMENT, THE ACCOMPANYING PROSPECTUS, ANY FREE WRITING PROSPECTUS OR ANY SALES OF THE COMMON STOCK OR PREFERRED STOCK. OUR BUSINESS, FINANCIAL CONDITION, RESULTS OF OPERATIONS AND PROSPECTS MAY HAVE CHANGED SINCE THOSE DATES.
S-1
PROSPECTUS SUPPLEMENT SUMMARY
The following summary highlights some of the information included elsewhere, or incorporated by reference, in this prospectus supplement or the accompanying prospectus. It is not complete and may not contain all the information that you may want to consider before making any investment decision regarding the securities offered hereby. To understand the terms of the securities offered hereby before making any investment decision, you should carefully read this entire prospectus supplement and the accompanying prospectus, including the documents incorporated by reference herein or therein, and any free writing prospectus related to the offering, including “Risk Factors,” “Additional Information,” “Incorporation by Reference,” and “Use of Proceeds” and the financial statements contained elsewhere or incorporated by reference in this prospectus supplement and the accompanying prospectus. Together, these documents describe the specific terms of the securities we are offering.
Except wherethe context suggests otherwise, the terms:
•
The “Company,” “we,” “us” and “our” refer to Eagle Point Income Company Inc., a Delaware corporation or, for periods prior to our conversion to a corporation on October 16, 2018, EP Income Company LLC, a Delaware limited liability company;
•
“Eagle Point Income Management” and “Adviser” refer to Eagle Point Income Management LLC, a Delaware limited liability company;
•
“Eagle Point Administration” and “Administrator” refer to Eagle Point Administration LLC, a Delaware limited liability company; and
•
“Risk-adjusted returns” refers to the profile of expected asset returns across a range of potential macroeconomic scenarios, and does not imply that a particular strategy or investment should be considered low-risk.
Eagle Point Income Company Inc.
We are an externally managed, diversified closed-end management investment company that has registered as an investment company under the 1940 Act. We have elected to be treated, and intend to qualify annually, as a regulated investment company, or “RIC,” under Subchapter M of the Internal Revenue Code of 1986, as amended, or the “Code,” beginning with our tax year ended December 31, 2018.
Our primary investment objective is to generate high current income, with a secondary objective to generate capital appreciation. We seek to achieve our investment objectives by investing primarily in junior debt tranches of CLOs, that are collateralized by a portfolio consisting primarily of below investment grade U.S. senior secured loans with a large number of distinct underlying borrowers across various industry sectors. We focus on CLO debt tranches rated “BB” (e.g., BB+, BB or BB-, or their equivalent) by Moody’s, S&P, or Fitch, and/or other applicable nationally recognized statistical rating organizations. We refer to such debt tranches in this prospectus supplement as “BB-Rated CLO Debt.” We may also invest in other junior debt tranches of CLOs, senior debt tranches of CLOs, LAFs and other related securities and instruments, including synthetic investments, such as significant risk transfer securities and credit risk transfer securities issued by banks or other financial institutions. In addition, we may invest up to 35% of our total assets (at the time of investment) in CLO equity securities. We expect our investments in CLO equity securities to primarily reflect minority ownership positions. CLO junior debt and equity securities are highly leveraged, and therefore the CLO securities in which we intend to invest are subject to a higher degree of loss since the use of leverage magnifies losses. See “Risk Factors — Risks Related to Our Investments — We may leverage our portfolio, which would magnify the potential for gain or loss on amounts invested and will increase the risk of investing in us” in the accompanying prospectus. We may also invest in other securities and instruments that the Adviser believes are consistent with our investment objectives such as securities issued by other securitization vehicles, such as collateralized bond obligations or “CBOs”. The amount that we will invest in other securities and instruments, which may include investments in debt and other securities issued by CLOs collateralized by non-U.S. loans or securities of other collective investment vehicles, will vary from time to time and, as such, may constitute a material part of our portfolio on any given date, all as based on the Adviser’s assessment of prevailing market conditions. The CLO securities in which we primarily seek to invest are rated below investment grade or, in the case of CLO equity securities, are unrated and are considered speculative with respect to timely payment of interest and repayment of principal. Below investment grade and unrated securities are also sometimes referred to as “junk” securities.
S-2
These investment objectives and strategies are not fundamental policies of ours and may be changed by our board of directors without prior approval of our stockholders. See “Business” in the accompanying prospectus.
Eagle Point Income Management
Eagle Point Income Management, our investment adviser, manages our investments subject to the supervision of our board of directors pursuant to an investment advisory agreement, or the “Investment Advisory Agreement.” An affiliate of the Adviser, Eagle Point Credit Management, provides investment professionals and other resources under a personnel and resources agreement, or the “Personnel and Resources Agreement,” to Eagle Point Income Management as Eagle Point Income Management may determine to be reasonably necessary to the conduct of its operations. An affiliate of the Adviser, Eagle Point Administration, performs, or arranges for the performance of, our required administrative services. For a description of the fees and expenses that we pay to the Adviser and the Administrator, see “The Adviser and the Administrator — Investment Advisory Agreement — Management Fee” and “The Adviser and the Administrator — The Administrator and the Administration Agreement” in the accompanying prospectus.
The Adviser was established in September 2018 and is registered as an investment adviser with the SEC. As of June 30, 2023, the Adviser, collectively with Eagle Point Credit Management had approximately $8.2 billion of total assets under management (including capital commitments that were undrawn as of such date). The Adviser is primarily owned by the Trident Funds (as defined below) through intermediary holding companies. Additionally, the Senior Investment Team, certain other employees of Eagle Point Credit Management, and an affiliate of Enstar Group Limited, or “Enstar,” hold indirect ownership interests in the Adviser. The Adviser is ultimately governed through intermediary holding companies by a board of managers, or the “Adviser’s Board of Managers,” which includes Mr. Majewski and certain principals of Stone Point Capital LLC, or “Stone Point,” as investment manager of the Trident Funds and related investment vehicles, which we refer to collectively as the “Trident Funds.” Stone Point, an investment adviser registered with the SEC, is a specialized private equity firm focused on the financial services industry.
The “Senior Investment Team” is led by Mr. Majewski, Managing Partner of the Adviser, and is also comprised of Daniel W. Ko, Senior Principal and Portfolio Manager, and Daniel M. Spinner, Senior Principal and Portfolio Manager. The Senior Investment Team is primarily responsible for our day-to-day investment management and the implementation of our investment strategy and process. See “The Adviser and the Administrator — Portfolio Managers” in the accompanying prospectus.
Financing and Hedging Strategy
Leverage by the Company. We may use leverage as and to the extent permitted by the 1940 Act. We are permitted to obtain leverage using any form of financial leverage instruments, including funds borrowed from banks or other financial institutions, margin facilities, notes or preferred stock and leverage attributable to reverse repurchase agreements or similar transactions. Over the long term, management expects us to operate under normal market conditions generally with leverage within a range of 25% to 35% of total assets through borrowings under the BNP Credit Facility described below, or through the issuance of preferred stock or debt securities, although the actual amount of our leverage will vary over time. Certain instruments that create leverage are considered to be senior securities under the 1940 Act.
With respect to senior securities representing indebtedness (i.e., borrowing or deemed borrowing), other than temporary borrowings as defined under the 1940 Act, we are required under current law to have an asset coverage of at least 300%, as measured at the time of borrowing and calculated as the ratio of our total assets (less all liabilities and indebtedness not represented by senior securities) over the aggregate amount of our outstanding senior securities representing indebtedness. With respect to senior securities that are stocks (i.e., shares of our preferred stock, including the Series A Term Preferred Stock and the Series B Term Preferred Stock), we are required under current law to have an asset coverage of at least 200%, as measured at the time of the issuance of any such shares of preferred stock and calculated as the ratio of our total assets (less all liabilities and indebtedness not represented by senior securities) over the aggregate amount of our outstanding senior securities representing indebtedness plus the aggregate liquidation preference of any outstanding shares of preferred stock.
S-3
As of August 18, 2023, we had two series of preferred stock outstanding, the 5.00% Series A Term Preferred Stock due 2026, or the “Series A Term Preferred Stock” and Series B Term Preferred Stock due 2028, or the “Series B Term Preferred Stock”.
On September 24, 2021, the Company entered into a credit agreement, which was amended on September 6, 2022, with BNP Paribas, as lender, that established a revolving credit facility or the “BNP Credit Facility”. Pursuant to the terms of the BNP Credit Facility, the Company can borrow up to an aggregate principal balance of $25,000,000 (the “Commitment Amount”). Such borrowings under the BNP Credit Facility bear interest at Term SOFR plus a spread under the amended credit agreement. The Company is required to pay a commitment fee on the unused amount.
The BNP Credit Facility will mature on the earlier of (i) the termination of the Commitment, as defined by the terms of the BNP Credit Facility or (ii) the scheduled maturity date of September 23, 2023. The Company has the option to extend the maturity from time to time in accordance with the BNP Credit Facility agreement.
As of June 30, 2023, our leverage, which includes the Series A Term Preferred Stock, represented approximately 24.9% of our total assets (less current liabilities). On a pro forma basis, after giving effect to the $31.2 million in aggregate net proceeds received from the sale of Series B Term Preferred Stock in an underwritten offering, which closed on July 26, 2023 (including amounts sold pursuant to the subsequent exercise of the underwriters’ overallotment option), $3.2 million in net proceeds received from sales of our common stock from June 30, 2023 through August 17, 2023 in connection with our prior “at-the-market” offering, our leverage, including all Preferred Stock outstanding as of the date hereof, represented approximately 37.7% of our total assets (less current liabilities, excluding distributions paid after June 30, 2023) and approximately 37.5% of our total assets (less current liabilities) as of July 31, 2023 (based on the midpoint of management’s unaudited estimate of the range of our NAV as of such date). As of June 30, 2023, our asset coverage ratio in respect of our outstanding preferred stock, as calculated pursuant to Section 18 of the 1940 Act, was 401%. We had no borrowings under the BNP Credit Facility or any other senior securities representing indebtedness as of June 30, 2023. In the event we fail to meet our applicable asset coverage ratio requirements, we may not be able to incur additional debt and/or issue additional preferred stock, and could be required by law or otherwise to sell a portion of our investments to repay some debt or redeem shares of preferred stock (if any) when it is disadvantageous to do so, which could have a material adverse effect on our operations, and we may not be able to make certain distributions or pay dividends of an amount necessary to continue to qualify as a RIC for U.S. federal income tax purposes. In addition, we may borrow for temporary or other purposes as permitted under the 1940 Act, which indebtedness would be in addition to the asset coverage requirements described above.
We expect that we will, or that we may need to, raise additional capital in the future to fund our continued growth, and we may do so by issuing additional shares of preferred stock or debt securities or through other leveraging instruments. Subject to the limitations under the 1940 Act, we may incur additional leverage opportunistically and may choose to increase or decrease our leverage. In addition, we may borrow for temporary, emergency or other purposes as permitted under the 1940 Act, which indebtedness would be in addition to the asset coverage requirements described above. By leveraging our investment portfolio, we may create an opportunity for increased net income and capital appreciation. However, the use of leverage also involves significant risks and expenses, which will be borne entirely by our stockholders, and our leverage strategy may not be successful. For example, the more leverage is employed, the more likely a substantial change will occur in our NAV. See “Risk Factors — Risks Related to Our Investments — We may leverage our portfolio, which would magnify the potential for gain or loss on amounts invested and will increase the risk of investing in us” in the accompanying prospectus.
Derivative Transactions. We may engage in “Derivative Transactions,” as described below, from time to time. To the extent we engage in Derivative Transactions, we expect to do so to hedge against interest rate, credit, currency and/or other risks, or for other investment or risk management purposes. We may use Derivative Transactions for investment purposes to the extent consistent with our investment objectives if the Adviser deems it appropriate to do so. We may purchase and sell a variety of derivative instruments, including exchange-listed and over-the-counter, or “OTC,” options, futures, options on futures, swaps and similar instruments, various interest rate transactions, such as swaps, caps, floors or collars, and credit transactions and credit default swaps. We also may purchase and sell derivative instruments that combine features of these
S-4
instruments. Collectively, we refer to these financial management techniques as “Derivative Transactions.” Our use of Derivative Transactions, if any, will generally be deemed to create leverage for us and involves significant risks. No assurance can be given that our strategy and use of derivatives will be successful, and our investment performance could diminish compared with what it would have been if Derivative Transactions were not used. See “Risk Factors — Risks Related to Our Investments — We are subject to risks associated with any hedging or Derivative Transactions in which we participate” in the accompanying prospectus.
Operating and Regulatory Structure
We are an externally managed, diversified closed-end management investment company that has registered as an investment company under the 1940 Act. As a registered closed-end management investment company, we are required to meet certain regulatory tests. See “Regulation as a Closed-End Management Investment Company” in the accompanying prospectus. In addition, we have elected to be treated, and intend to qualify annually, as a RIC under Subchapter M of the Code, beginning with our tax year ended December 31, 2018.
Our investment activities are managed by the Adviser and supervised by our board of directors. Under the Investment Advisory Agreement, we have agreed to pay the Adviser a management fee based on our “Managed Assets.” “Managed Assets” means our total assets (including assets attributable to our use of leverage) minus the sum of our accrued liabilities (other than liabilities incurred for the purpose of creating leverage). The management fee is calculated monthly based on our Managed Assets at the end of each calendar month and is payable quarterly in arrears. The management fee for any partial month will be pro-rated (based on the number of days actually elapsed at the end of such partial month relative to the total number of days in such calendar month). See “The Adviser and the Administrator — Investment Advisory Agreement — Management Fee” in the accompanying prospectus.
We have also entered into an administration agreement, which we refer to as the “Administration Agreement,” under which we have agreed to reimburse the Administrator for our allocable portion of overhead and other expenses incurred by the Administrator in performing its obligations under the Administration Agreement. See “The Adviser and the Administrator — The Administrator and the Administration Agreement” in the accompanying prospectus.
Our Corporate Information
Our offices are located at 600 Steamboat Road, Suite 202, Greenwich, CT 06830, and our telephone number is (844) 810-6501.
S-5
THE OFFERING
The Offering
Issuer
Eagle Point Income Company Inc.
Securities Offered by Us
Up to $75,000,000 aggregate amount of our common stock.
Up to 1,000,000 shares of Series A Term Preferred Stock.
Up to 1,000,000 shares of Series B Term Preferred Stock.
Manner of Offering
“At the market offering” that may be made from time to time through B. Riley, as the placement agent or as principal, using commercially reasonable efforts consistent with its sales and trading practices. See “Plan of Distribution” in this prospectus supplement.
Use of Proceeds
We intend to use the net proceeds from the sale of our securities to acquire investments in accordance with our investment objectives and strategies described in this prospectus supplement and in the accompanying prospectus, to make distributions to our stockholders and for general working capital purposes. In addition, we may also use a portion of the net proceeds from the sale of our securities to repay any outstanding indebtedness or preferred stock at the time of the offering. See “Use of Proceeds” in this prospectus supplement.
Custodian and Transfer Agent
Wells Fargo Bank, National Association serves as our custodian, and Equiniti Trust Company, LLC (formerly, American Stock Transfer & Trust Company, LLC) serves as our transfer agent, registrar, dividend disbursement agent and stockholder servicing agent. See “Custodian and Transfer Agent” in the accompanying prospectus.
Risk Factors
An investment in our securities is subject to risks and involves a heightened risk of total loss of investment. In addition, the companies in which we invest are subject to special risks. See “Risk Factors” in this prospectus supplement and the accompanying prospectus to read about factors you should consider, including the risks of leverage, before investing in our securities.
Additional Information
We have filed with the SEC a registration statement on Form N-2 under the Securities Act, which contains additional information about us and the securities being offered by this prospectus supplement and the accompanying prospectus. We file annual and semi-annual reports, proxy statements, and other information with the SEC. Our SEC filings are also available to the public on the SEC’s website at www.sec.gov. This information is also available free of charge by contacting us at Eagle Point Income Company, Inc., Attention: Investor Relations, by telephone at (844) 810-6501, or on our website at www.eaglepointincome.com.
Common Stock
Listing
Our common stock is traded on the NYSE under the symbol “EIC.”
Trading at a Discount
Shares of closed-end investment companies that are listed on an exchange frequently trade at a discount to their NAV. If our shares trade at a discount to our NAV, it will likely increase the risk of loss for purchasers in this offering. Investing in our common stock involves a high degree of risk. Before buying any securities, you should read the discussion of the material risks of investing in our securities under “Risk Factors” in the accompanying prospectus.
S-6
Distributions
We intend to make regular monthly distributions of all or a portion of our “investment company taxable income” (which generally consists of ordinary income and realized net short-term capital gains in excess of realized net long-term capital losses, if any, and excluding any deduction for distributions paid to stockholders) to common stockholders. We also intend to make at least annual distributions of all or a portion of our “net capital gains” (which is the excess of net long-term capital gains over net short-term capital losses). At times, in order to maintain a stable level of distributions, we may distribute less than all of our net investment income or distribute accumulated undistributed income in addition to current net investment income.
If a record date for a particular distribution occurs before an investor’s date of settlement, such investor who purchases shares in this offering will not be entitled to receive such distribution.
Dividend Reinvestment Plan
Under the dividend reinvestment plan, or the “DRIP”, each holder of at least one full share of our common stock will be automatically enrolled in the DRIP and distributions on shares of our common stock are automatically reinvested in additional shares of our common stock by Equiniti Trust Company, LLC (formerly, American Stock Transfer & Trust Company, LLC), or the “DRIP agent”, unless the holder “opts-out” of the DRIP. Holders of our common stock who receive distributions in the form of additional shares of our common stock are nonetheless subject to the applicable federal, state or local taxes on the reinvested distribution but will not receive a corresponding cash distribution with which to pay any applicable tax. The DRIP agent (acting on our behalf) will primarily use newly-issued, authorized shares of common stock to implement reinvestment of distributions under the DRIP. Distributions that are reinvested through the issuance of new shares increase our stockholders’ equity on which a management fee is payable to the Adviser. If we declare a distribution payable in cash, holders of shares of our common stock who opt-out of participation in the DRIP (including those holders whose shares are held through a broker or other nominee who has opted out of participation in the DRIP) generally will receive such distributions in cash. See “Dividend Reinvestment Plan” in our Annual Report filed on Form N-CSR for the fiscal year ended December 31, 2022.
Series A Term Preferred Stock
Listing
Our Series A Term Preferred Stock is traded on the NYSE under the symbol “EICA.”
Liquidation Preference
In the event of a liquidation, dissolution or winding up of our affairs, holders of Series A Term Preferred Stock will be entitled to receive a liquidation distribution equal to the Series A Liquidation Preference of $25 per share, plus an amount equal to accumulated but unpaid dividends, if any, on such shares (whether or not earned or declared, but excluding interest on such dividends) to, but excluding, the payment date.
Series A Term Preferred Stock Dividends
We intend to pay monthly dividends on the Series A Term Preferred Stock at a fixed annual rate of 5.00% of the Series A Liquidation Preference ($1.25 per share per year), or the “Series A Dividend Rate.” Our board of directors may determine not to pay, or may be
S-7
precluded from paying, such dividends if our board of directors believes it is not in the best interest of our stockholders or if we fail to maintain the asset coverage required by the 1940 Act. If we fail to redeem the Series A Term Preferred Stock as required on the Series A Mandatory Redemption Date (as defined below) or fail to pay any dividend on the payment date for such dividend, the Series A Dividend Rate will increase by 2% per annum until we redeem the Series A Term Preferred Stock or pay the dividend, as applicable. See “Description of the Series A Term Preferred Stock — Dividends — Adjustment to Fixed Dividend Rate — Default Period.” The Series A Dividend Rate will be computed on the basis of a 360-day year consisting of twelve 30-day months.
Cumulative cash dividends on each share of Series A Term Preferred Stock will be payable monthly, when, as and if declared, or under authority granted, by our board of directors out of funds legally available for such payment. Only holders of Series A Term Preferred Stock on the record date for a dividend period, or a “Series A Dividend Period,” will be entitled to receive dividends and distributions payable with respect to such Series A Dividend Period, and holders of Series A Term Preferred Stock who sell shares before such a record date and purchasers of Series A Term Preferred Stock who purchase shares after such a record date should take the effect of the foregoing provisions into account in evaluating the price to be received or paid for such Series A Term Preferred Stock. See “Description of the Series A Term Preferred Stock — Dividends — Dividend Periods” in this prospectus supplement.
Ranking of Series A Term Preferred Stock
The shares of Series A Term Preferred Stock are senior securities that constitute capital stock. The Series A Term Preferred Stock ranks:
•
senior to shares of our common stock in priority of payment of dividends and as to the distribution of assets upon dissolution, liquidation or the winding-up of our affairs;
•
equal in priority with all other series of preferred stock we have issued (including Series B Term Preferred Stock) and may issue in the future as to priority of payment of dividends and as to distributions of assets upon dissolution, liquidation or the winding-up of our affairs; and
•
subordinate in right of payment to the holders of our existing and future indebtedness (including indebtedness under the BNP Credit Facility).
Subject to the asset coverage requirements of the 1940 Act, we may issue additional series of preferred stock (or additional shares of the Series A Term Preferred Stock), but we may not issue additional classes of capital stock that rank senior or junior to the Series A Term Preferred Stock as to priority of payment of dividends or as to the distribution of assets upon dissolution, liquidation or winding-up of our affairs.
Series A Term Preferred Stock Mandatory Term Redemption
We are required to redeem all outstanding shares of the Series A Term Preferred Stock on October 30, 2026, or the “Series A Mandatory Redemption Date,” at a redemption price equal to the Series A
S-8
Liquidation Preference plus an amount equal to accumulated but unpaid dividends, if any, on such shares (whether or not earned or declared, but excluding interest on such dividends) to, but excluding, the Series A Mandatory Redemption Date. See “Description of the Series A Term Preferred Stock — Redemption.”
We cannot effect any modification of or repeal our obligation to redeem the Series A Term Preferred Stock on the Series A Mandatory Redemption Date without the prior unanimous approval of the holders of the Series A Term Preferred Stock.
Leverage
We may use leverage as and to the extent permitted by the 1940 Act. We are permitted to obtain leverage using any form of financial leverage instruments, including funds borrowed from banks or other financial institutions, margin facilities, notes or preferred stock and leverage attributable to reverse repurchase agreements or similar transactions. We expect that we will, or that we may need to, raise additional capital in the future to fund our continued growth and may do so by further increasing our leverage through entry into a credit facility, issuance of additional shares of preferred stock or debt securities or other leveraging instruments.
Certain instruments that create leverage are considered to be senior securities under the 1940 Act. With respect to senior securities that are stocks (i.e., shares of preferred stock, including the Preferred Stock), we are required to have an asset coverage of at least 200%, as measured at the time of the issuance of any such shares of preferred stock and calculated as the ratio of our total assets (less all liabilities and indebtedness not represented by senior securities) over the aggregate amount of our outstanding senior securities representing indebtedness plus the aggregate liquidation preference of any outstanding shares of preferred stock.
With respect to senior securities representing indebtedness (i.e., borrowing or deemed borrowing, including borrowings under the BNP Credit Facility), other than temporary borrowings as defined under the 1940 Act, we are required to have an asset coverage of at least 300%, as measured at the time of borrowing and calculated as the ratio of our total assets (less all liabilities and indebtedness not represented by senior securities) over the aggregate amount of our outstanding senior securities representing indebtedness.
Mandatory Redemption for Series A Term Preferred Stock Asset Coverage
If we fail to maintain asset coverage (as defined in Section 18(h) of the 1940 Act) of at least 200% as of the close of business on the last business day of any calendar quarter and such failure is not cured by the close of business on the date that is 30 calendar days following the filing date of our Annual Report on Form N-CSR, Semiannual Report on Form N-CSRS or Reports on Form N-PORT, as applicable, for that quarter, or the “Series A Asset Coverage Cure Date,” then we will be required to redeem, within 90 calendar days of the Series A Asset Coverage Cure Date, the number of shares of our preferred stock (which at our discretion may include any number or portion of the Series A Term Preferred Stock), that, when combined with any debt securities redeemed for failure to maintain the asset coverage required by the indenture governing such securities (if applicable), (1) results in us having asset coverage of at least 200%, or
S-9
(2) if fewer, the maximum number of shares of preferred stock that can be redeemed out of funds legally available for such redemption. In connection with any redemption for failure to maintain such asset coverage, we may, in our sole option, redeem such additional number of shares of preferred stock that will result in asset coverage up to and including 285%.
If shares of Series A Term Preferred Stock are to be redeemed for failure to maintain asset coverage of at least 200%, such shares will be redeemed at a redemption price equal to the Series A Liquidation Preference plus accumulated but unpaid dividends, if any, on such shares (whether or not declared, but excluding interest on accumulated but unpaid dividends, if any) to, but excluding, the date fixed for such redemption. See “Description of the Series A Term Preferred Stock — Redemption — Redemption for Failure to Maintain Asset Coverage” in this prospectus supplement.
Optional Redemption of Series A Term Preferred Stock
At any time after October 31, 2023, we may, in our sole option, redeem the outstanding shares of Series A Term Preferred Stock in whole or, from time to time, in part, out of funds legally available for such redemption, at the Series A Liquidation Preference plus an amount equal to accumulated but unpaid dividends, if any, on such shares (whether or not earned or declared, but excluding interest on such dividends) to, but excluding, the date fixed for such redemption. See “Description of the Series A Term Preferred Stock — Redemption — Optional Redemption” in this prospectus supplement.
Voting Rights
Except as otherwise provided in our certificate of incorporation or as otherwise required by law, (1) each holder of Series A Term Preferred Stock is entitled to one vote for each share of Series A Term Preferred Stock held on each matter submitted to a vote of our stockholders and (2) the holders of all outstanding preferred stock, including the Series A Term Preferred Stock and Series B Term Preferred Stock, and common stock vote together as a single class; provided that holders of preferred stock (including the Series A Term Preferred Stock and Series B Term Preferred Stock) voting separately as a class, are entitled to elect two (2) of our directors, or the “Preferred Directors,” and, if we fail to pay dividends on any outstanding shares of preferred stock, including the Series A Term Preferred Stock and Series B Term Preferred Stock, in an amount equal to two (2) full years of dividends, and continuing until such failure is cured, will be entitled to elect a majority of our directors. One of the Preferred Directors will be up for election in 2025, and the other Preferred Director will be up for election in 2026.
Holders of shares of the Series A Term Preferred Stock also vote separately as a class on any matter that materially and adversely affects any preference, right or power of holders of the Series A Term Preferred Stock. See “Description of the Series A Term Preferred Stock — Voting Rights.”
Conversion Rights
The shares of Series A Term Preferred Stock have no conversion rights.
Redemption and Paying Agent
Equiniti Trust Company, LLC (formerly, American Stock Transfer & Trust Company, LLC), or the “Redemption and Paying Agent” serves as our transfer agent and registrar, dividend disbursing agent and
S-10
redemption and paying agent with respect to the Series A Term Preferred Stock.
U.S. Federal Income Taxes
We have elected to be treated, and intend to qualify annually, as a RIC under Subchapter M of the Code. Prospective investors are urged to consult their own tax advisors regarding the tax implications associated with acquiring holding and disposing of an investment in the Series A Term Preferred Stock in light of their personal investment circumstances.
Series B Term Preferred Stock
Listing
Our Series B Term Preferred Stock is traded on the NYSE under the symbol “EICB”.
Liquidation Preference
In the event of a liquidation, dissolution or winding up of our affairs, holders of Series B Term Preferred Stock will be entitled to receive a liquidation distribution equal to the Series B Liquidation Preference of $25 per share, plus an amount equal to accumulated but unpaid dividends, if any, on such shares (whether or not earned or declared, but excluding interest on such dividends) to, but excluding, the payment date.
Series B Term Preferred Stock Dividends
We intend to pay monthly dividends on the Series B Term Preferred Stock at a fixed annual rate of 7.75% of the Series B Liquidation Preference ($1.9375 per share per year), or the “Series B Dividend Rate.” Our board of directors may determine not to pay, or may be precluded from paying, such dividends if our board of directors believes it is not in the best interest of our stockholders or if we fail to maintain the asset coverage required by the 1940 Act. If we fail to redeem the Series B Term Preferred Stock as required on the Series B Mandatory Redemption Date (as defined below) or fail to pay any dividend on the payment date for such dividend, the Series B Dividend Rate will increase by 2% per annum until we redeem the Series B Term Preferred Stock or pay the dividend, as applicable. See “Description of the Series B Term Preferred Stock — Dividends — Adjustment to Fixed Dividend Rate — Default Period.” The Series B Dividend Rate will be computed on the basis of a 360-day year consisting of twelve 30-day months.
Ranking of Series B Term Preferred Stock
The shares of Series B Term Preferred Stock are senior securities that constitute capital stock. The Series B Term Preferred Stock ranks:
•
senior to shares of our common stock in priority of payment of dividends and as to the distribution of assets upon dissolution, liquidation or the winding-up of our affairs;
•
equal in priority with all other series of preferred stock we have issued (including Series A Term Preferred Stock) or may issue in the future as to priority of payment of dividends and as to distributions of assets upon dissolution, liquidation or the winding-up of our affairs; and
•
subordinate in right of payment to the holders of our existing and future indebtedness (including indebtedness under the BNP Credit Facility).
Subject to the asset coverage requirements of the 1940 Act, we may issue additional series of preferred stock (or additional shares of the
S-11
Series B Term Preferred Stock), but we may not issue additional classes of capital stock that rank senior or junior to the Series B Term Preferred Stock as to priority of payment of dividends or as to the distribution of assets upon dissolution, liquidation or winding-up of our affairs.
Series B Term Preferred Stock Mandatory Term Redemption
We are required to redeem all outstanding shares of the Series B Term Preferred Stock on July 31, 2028, or the “Series B Mandatory Redemption Date,” at a redemption price equal to the Series B Liquidation Preference plus an amount equal to accumulated but unpaid dividends, if any, on such shares (whether or not earned or declared, but excluding interest on such dividends) to, but excluding, the Series B Mandatory Redemption Date. See “Description of the Series B Term Preferred Stock — Redemption.”
We cannot effect any modification of or repeal our obligation to redeem the Series B Term Preferred Stock on the Series B Mandatory Redemption Date without the prior unanimous approval of the holders of the Series B Term Preferred Stock.
Leverage
We may use leverage as and to the extent permitted by the 1940 Act. We are permitted to obtain leverage using any form of financial leverage instruments, including funds borrowed from banks or other financial institutions, margin facilities, notes or preferred stock and leverage attributable to reverse repurchase agreements or similar transactions. We expect that we will, or that we may need to, raise additional capital in the future to fund our continued growth and may do so by further increasing our leverage through entry into a credit facility, issuance of additional shares of preferred stock or debt securities or other leveraging instruments.
Certain instruments that create leverage are considered to be senior securities under the 1940 Act. With respect to senior securities that are stocks (i.e., shares of preferred stock, including the Series A Term Preferred Stock and Series B Term Preferred Stock), we are required to have an asset coverage of at least 200%, as measured at the time of the issuance of any such shares of preferred stock and calculated as the ratio of our total assets (less all liabilities and indebtedness not represented by senior securities) over the aggregate amount of our outstanding senior securities representing indebtedness plus the aggregate liquidation preference of any outstanding shares of preferred stock.
With respect to senior securities representing indebtedness (i.e., borrowing or deemed borrowing, including borrowings under the BNP Credit Facility), other than temporary borrowings as defined under the 1940 Act, we are required to have an asset coverage of at least 300%, as measured at the time of borrowing and calculated as the ratio of our total assets (less all liabilities and indebtedness not represented by senior securities) over the aggregate amount of our outstanding senior securities representing indebtedness.
Mandatory Redemption for Series B Term Preferred Stock Asset Coverage
If we fail to maintain asset coverage (as defined in Section 18(h) of the 1940 Act) of at least 200% as of the close of business on the last business day of any calendar quarter and such failure is not cured by
S-12
the close of business on the date that is 30 calendar days following the filing date of our Annual Report on Form N-CSR, Semiannual Report on Form N-CSRS or Reports on Form N-PORT, as applicable, for that quarter, or the “Series B Asset Coverage Cure Date,” then we will be required to redeem, within 90 calendar days of the Series B Asset Coverage Cure Date, the number of shares of our preferred stock (which at our discretion may include any number or portion of the Series B Term Preferred Stock), that, when combined with any debt securities redeemed for failure to maintain the asset coverage required by the indenture governing such securities (if applicable), (1) results in us having asset coverage of at least 200%, or (2) if fewer, the maximum number of shares of preferred stock that can be redeemed out of funds legally available for such redemption. In connection with any redemption for failure to maintain such asset coverage, we may, in our sole option, redeem such additional number of shares of preferred stock that will result in asset coverage up to and including 285%.
If shares of Series B Term Preferred Stock are to be redeemed for failure to maintain asset coverage of at least 200%, such shares will be redeemed at a redemption price equal to the Series B Liquidation Preference plus accumulated but unpaid dividends, if any, on such shares (whether or not declared, but excluding interest on accumulated but unpaid dividends, if any) to, but excluding, the date fixed for such redemption. See “Description of the Series B Term Preferred Stock — Redemption — Redemption for Failure to Maintain Asset Coverage” in this prospectus supplement.
Optional Redemption of Series B Term Preferred Stock
At any time on or after July 31, 2025, we may, in our sole option, redeem the outstanding shares of Series B Term Preferred Stock in whole or, from time to time, in part, out of funds legally available for such redemption, at the Series B Liquidation Preference plus an amount equal to accumulated but unpaid dividends, if any, on such shares (whether or not earned or declared, but excluding interest on such dividends) to, but excluding, the date fixed for such redemption. See “Description of the Series B Term Preferred Stock — Redemption — Optional Redemption” in this prospectus supplement.
Voting Rights
Except as otherwise provided in our certificate of incorporation or as otherwise required by law, (1) each holder of Series B Term Preferred Stock is entitled to one vote for each share of Series B Term Preferred Stock held on each matter submitted to a vote of our stockholders and (2) the holders of all outstanding preferred stock, including the Series A Term Preferred Stock, Series B Term Preferred Stock, and common stock will vote together as a single class; provided that holders of preferred stock (including the Series A Term Preferred Stock and Series B Term Preferred Stock) voting separately as a class, are entitled to elect two (2) of our directors, or the “Preferred Directors,” and, if we fail to pay dividends on any outstanding shares of preferred stock, including the Series A Term Preferred Stock and Series B Term Preferred Stock, in an amount equal to two (2) full years of dividends, and continuing until such failure is cured, will be entitled to elect a majority of our directors. One of the Preferred Directors will be up for election in 2025, and the other Preferred Director will be up for election in 2026.
S-13
Holders of shares of the Series B Term Preferred Stock also vote separately as a class on any matter that materially and adversely affects any preference, right or power of holders of the Series B Term Preferred Stock. See “Description of the Series B Term Preferred Stock — Voting Rights.”
Conversion Rights
The shares of Series B Term Preferred Stock have no conversion rights.
Redemption and Paying Agent
Equiniti Trust Company, LLC (formerly, American Stock Transfer & Trust Company, LLC), or the “Redemption and Paying Agent,” serves as transfer agent and registrar, dividend disbursing agent and redemption and paying agent with respect to the Series B Term Preferred Stock.
S-14
RISK FACTORS
Investing in our securities involves a number of significant risks. In addition to the risks described below and in “Risk Factors” in the accompanying prospectus, you should carefully consider all other information contained in this prospectus supplement, the accompanying prospectus, any free writing prospectus and the documents incorporated by reference in this prospectus supplement and the accompanying prospectus before making a decision to purchase our securities. The risks and uncertainties described below and in the accompanying prospectus are not the only ones facing us. Additional risks and uncertainties not presently known to us, or not presently deemed material by us, may also impair our operations and performance and the value of our securities.
If any of the following risks actually occur, our business, financial condition or results of operations could be materially adversely affected and the value of our securities may be impaired. If that happens, the price of our securities could decline and you may lose all or part of your investment.
The risks described below specifically relate to this offering. Please see the “Risk Factors” section of the accompanying prospectus, in our Annual Report on Form N-CSR for the fiscal year ended December 31, 2022, as amended, filed with the SEC on February 22, 2023 and incorporated by reference herein, and in our Semi-Annual Report on Form N-CSRS for the six months ended June 30, 2023, filed with the SEC on August 15, 2023 and incorporated by reference herein.
Risks Relating to an Investment in the Preferred Stock
A downgrade, suspension or withdrawal of the credit rating assigned by a rating agency to us or the Preferred Stock, if any, or change in the debt markets could cause the liquidity or market value of the Preferred Stock to decline significantly.
Any credit rating is an assessment by rating agencies of our ability to pay our debts when due. Consequently, real or anticipated changes in any credit ratings will generally affect the market value of the Preferred Stock. These credit ratings may not reflect the potential impact of risks relating to the structure or marketing of the Preferred Stock. Credit ratings are not a recommendation to buy, sell or hold any security, and may be revised or withdrawn at any time by the issuing organization in its sole discretion. Neither we nor any underwriter undertakes any obligation to obtain or maintain any credit ratings or to advise holders of Preferred Stock of any changes in any credit ratings. There can be no assurance that any credit ratings will remain for any given period of time or that such credit ratings will not be lowered or withdrawn entirely by the rating agencies if in their judgment future circumstances relating to the basis of the credit ratings, such as adverse changes in our Company, so warrant. The conditions of the financial markets and prevailing interest rates have fluctuated in the past and are likely to fluctuate in the future, which could have an adverse effect on the market prices of the Preferred Stock.
Risks Related to the Offering
Management will have broad discretion as to the use of the proceeds, if any, from this offering and may not use the proceeds effectively.
We cannot specify with certainty all of the particular uses of the net proceeds, if any, of this offering. Our management will have significant flexibility in applying the net proceeds from this offering, and you will not have the opportunity as part of your investment decision to assess whether the net proceeds are being used appropriately. Investors may not agree with our decisions, and our use of the proceeds may not yield any return on your investment. Because of the number and variability of factors that will determine our use of the net proceeds from this offering, their ultimate use may vary substantially from their currently intended use. Our management may use the net proceeds for purposes that may not improve our financial condition or market value. Our failure to apply the net proceeds of this offering effectively could impair our ability to pursue our growth strategy or could require us to raise additional capital. Pending their use, we intend to invest the net proceeds from the offering in temporary investments, such as cash, cash equivalents, U.S. government securities and other high-quality debt investments that mature in one year or less. These investments may not yield a favorable return to our stockholders.
S-15
SPECIAL NOTE REGARDING FORWARD-LOOKING STATEMENTS
All statements contained in or incorporated by reference into this prospectus supplement or the accompanying prospectus, other than historical facts, may constitute “forward-looking statements.” These statements may relate to, among other things, future events or our future operating results, actual and potential conflicts of interest with the Adviser, the Administrator and their affiliates, and the adequacy of our financing sources and working capital, among other factors. In some cases, you can identify forward-looking statements by terminology such as “estimate,” “may,” “might,” “believe,” “will,” “provided,” “anticipate,” “future,” “could,” “growth,” “plan,” “project,” “intend,” “expect,” “should,” “would,” “if,” “seek,” “possible,” “potential,” “likely” or the negative or other variations of such terms or comparable terminology. These forward-looking statements involve known and unknown risks, uncertainties and other factors that may cause our actual results, levels of activity, performance or achievements to be materially different from any future results, levels of activity, performance or achievements expressed or implied by such forward-looking statements. Such factors include:
•
changes in the economy and the capital markets;
•
risks associated with negotiation and consummation of pending and future transactions;
•
changes in our investment objectives and strategy;
•
availability, terms (including the possibility of interest rate volatility) and deployment of capital;
•
changes in interest rates, exchange rates, regulation or the general economy;
•
changes in governmental regulations, tax rates and similar matters;
•
our ability to exit investments in a timely manner;
•
our ability to maintain our qualification as a RIC;
•
use of the proceeds of this offering;
•
our ability to sell our securities in this offering in the amounts and on the terms contemplated, or at all; and
•
those factors described in the “Risk Factors” section of this prospectus supplement and the accompanying prospectus and in similar sections in the documents incorporated by reference into this prospectus supplement and the accompanying prospectus.
We caution readers not to place undue reliance on any such forward-looking statements, which speak only as of the date made. Actual results could differ materially from those anticipated in our forward-looking statements and future results could differ materially from historical performance. We have based forward-looking statements on information available to us on the date of this prospectus supplement. We undertake no obligation to publicly update or revise any forward-looking statements, whether as a result of new information, future events or otherwise, after the date of this prospectus supplement or the accompanying prospectus, except as otherwise required by applicable law. The forward-looking statements contained in or incorporated by reference into this prospectus supplement and the accompanying prospectus are excluded from the safe harbor protection provided by the Private Securities Litigation Reform Act of 1995 and Section 27A of the Securities Act.
S-16
USE OF PROCEEDS
Sales of our common stock, Series A Term Preferred Stock, and Series B Term Preferred Stock, if any, under this prospectus supplement and the accompanying prospectus may be made by any method that is deemed to be an “at the market offering,” as defined in Rule 415 under the Securities Act. There is no guarantee that there will be any sales of our common stock, Series A Term Preferred Stock, or Series B Term Preferred Stock pursuant to this prospectus supplement and the accompanying prospectus. Actual sales, if any, of our common stock, Series A Term Preferred Stock, or Series B Term Preferred Stock under this prospectus supplement and the accompanying prospectus may be less than as set forth on the cover page of this prospectus supplement depending on, among other things, the market price of our common stock, Series A Term Preferred Stock, or Series B Term Preferred Stock, as applicable, at the time of any such sale. As a result, the actual net proceeds we receive may be more or less than the amount of net proceeds estimated in this prospectus supplement. However, the sales price per share of our common stock offered by this prospectus supplement and the accompanying prospectus, less commissions payable under the Sales Agreement, will not be less than the net asset value per share of our common stock at the time of such sale.
Assuming the sale of $75,000,000 of common stock, 1,000,000 shares of Series A Term Preferred Stock, at an assumed offering price equal to the $25 per share liquidation preference, and 1,000,000 shares of Series B Term Preferred Stock, at an assumed offering price equal to the $25 per share liquidation preference, offered by this prospectus supplement, we anticipate that our net proceeds from this offering will be approximately $122.2 million, after deducting the placement agent’s commissions and estimated offering expenses payable by us.
We intend to use the net proceeds from the sale of our common stock, Series A Term Preferred Stock, and Series B Term Preferred Stock pursuant to this prospectus supplement to acquire investments in accordance with our investment objectives and strategies described in this prospectus supplement and the accompanying prospectus, to make distributions to our stockholders and for general working capital purposes. In addition, we may also use a portion of the net proceeds from the sale of our securities to repay any outstanding indebtedness at the time of the offering, including any borrowings from the BNP Credit Facility or the Preferred Stock.
We currently anticipate that it will take approximately three to six months after completion of any sale pursuant to this offering to invest substantially all of the net proceeds in our targeted investments or otherwise utilize such proceeds, although such period may vary and depends on the availability of appropriate investment opportunities consistent with our investment objectives and market conditions. We cannot assure you we will achieve our targeted investment pace, which may negatively impact our returns. Until appropriate investments or other uses can be found, we may invest in temporary investments, such as cash, cash equivalents, U.S. government securities and other high-quality debt investments that mature in one year or less, which we expect will have returns substantially lower than the returns that we anticipate earning from investments in CLO securities and related investments. Investors should expect, therefore, that before we have fully invested the proceeds of the offering in accordance with our investment objectives and strategies, assets invested in these instruments would earn interest income at a modest rate, which may not exceed our expenses during this period. To the extent that the net proceeds from this offering have not been fully invested in accordance with our investment objectives and strategies prior to the next payment of a distribution to our stockholders, a portion of the proceeds may be used to pay such distribution and may represent a return of capital.
S-17
For a description of the particular terms of our common stock, see “Description of our Capital Stock — Common Stock” in the accompanying prospectus.
The following description of the particular terms of the Series A Term Preferred Stock supplements and, to the extent inconsistent with, replaces the description of the general terms and provisions of our preferred stock set forth in the accompanying prospectus. This is not a complete description and is subject to, and entirely qualified by reference to, our certificate of incorporation and the certificate of designation setting forth the terms of the Series A Term Preferred Stock. The certificate of designation is attached as Appendix A to this prospectus supplement. You may obtain copies of these documents using the methods described in “Additional Information” in this prospectus supplement.
General
We are authorized to issue 20,000,000 shares of preferred stock and we have designated 2,400,000 shares as Series A Term Preferred Stock . At the time of issuance, the Series A Term Preferred Stock offered pursuant to this prospectus supplement will be fully paid and non-assessable and have no preemptive, conversion or exchange rights or rights to cumulative voting.
Ranking
The shares of Series A Term Preferred Stock rank equally in right with all other preferred stock (including Series B Term Preferred Stock) that we may issue from time to time in accordance with the 1940 Act, if any, as to payment of dividends and the distribution of our assets upon dissolution, liquidation or winding up of our affairs. The shares of Series A Term Preferred Stock, together with the Series B Term Preferred Stock and all other preferred stock that we may issue from time to time in accordance with the 1940 Act, if any, rank senior to our common stock as to payment of dividends and the distribution of our assets upon dissolution, liquidation or winding up of our affairs and subordinate to the rights of holders of our existing and future indebtedness (including indebtedness under the BNP Credit Facility).
Dividends
General. Holders of the Series A Term Preferred Stock are entitled to receive cumulative cash dividends and distributions at the Series A Dividend Rate of 5.00% of the Series A Liquidation Preference, or $1.25 per share per year (subject to adjustment in certain circumstances as described below), when, as and if declared by, or under authority granted by, our board of directors out of funds legally available for payment in parity with dividends and distributions to holders of the Series B Term Preferred Stock and in preference to dividends and distributions on shares of our common stock. Dividends will be payable monthly in arrears on the last business day of each calendar month, or the “Series A Dividend Payment Date.” Dividends on the Series A Term Preferred Stock are computed on the basis of a 360-day year consisting of twelve 30-day months. The amount of dividends payable on the Series A Term Preferred Stock on any date prior to the end of a dividend period, and for the initial dividend period, will be computed on the basis of a 360-day year consisting of twelve 30-day months, and actual days elapsed over a 30-day month.
Dividend Periods. Each Series A Dividend Period will be the period beginning on and including the last Series A Dividend Payment Date and ending on, but excluding, the next Series A Dividend Payment Date or stated maturity date, as the case may be. Dividends will be payable monthly in arrears on the Series A Dividend Payment Date and upon redemption of the Series A Term Preferred Stock. Except for the first Series A Dividend Period, dividends with respect to any monthly Series A Dividend Period will be declared and paid to holders of record of Series A Term Preferred Stock as their names shall appear on our registration books at the close of business on the applicable record date, which shall be a date designated by the board of directors that is not more than 20 nor less than 7 calendar days prior to the applicable Series A Dividend Payment Date.
Only holders of Series A Term Preferred Stock on the record date for a Series A Dividend Period will be entitled to receive dividends and distributions payable with respect to such Series A Dividend Period, and holders of Series A Term Preferred Stock who sell shares before such a record date and purchasers of Series A
S-18
Term Preferred Stock who purchase shares after such a record date should take the effect of the foregoing provisions into account in evaluating the price to be received or paid for such Series A Term Preferred Stock.
Mechanics of Payment of Dividends. Not later than 12:00 noon, New York City time, on a Series A Dividend Payment Date, we are required to deposit with the Redemption and Paying Agent sufficient funds for the payment of dividends in the form of Deposit Securities. Deposit Securities will generally consist of (1) cash or cash equivalents; (2) direct obligations of the United States or its agencies or instrumentalities that are entitled to the full faith and credit of the United States, which we refer to as the U.S. Government Obligations; (3) investments in money market funds registered under the 1940 Act that qualify under Rule 2a-7 under the 1940 Act and certain similar investment vehicles that invest in U.S. Government Obligations or any combination thereof; or (4) any letter of credit from a bank or other financial institution that has a credit rating from at least one ratings agency that is the highest applicable rating generally ascribed by such ratings agency to bank deposits or short-term debt of similar banks or other financial institutions, in each case either that is a demand obligation payable to the holder on any business day or that has a maturity date, mandatory redemption date or mandatory payment date, preceding the relevant Series A Redemption Date (as defined below), Series A Dividend Payment Date or other payment date. We do not intend to establish any reserves for the payment of dividends.
All Deposit Securities paid to the Redemption and Payment Agent for the payment of dividends will be held in trust for the payment of such dividends to the holders of Series A Term Preferred Stock. Dividends will be paid by the Redemption and Payment Agent to the holders of Series A Term Preferred Stock as their names appear on our registration books on the applicable record date. Dividends that are in arrears for any past Series A Dividend Period may be declared and paid at any time, without reference to any regular Series A Dividend Payment Date. Such payments are made to holders of Series A Term Preferred Stock as their names appear on our registration books on such date, not exceeding 20 nor less than 7 calendar days preceding the payment date thereof, as may be fixed by our board of directors. Any payment of dividends in arrears will first be credited against the earliest accumulated but unpaid dividends. No interest or sum of money in lieu of interest will be payable in respect of any dividend payment or payments on any Series A Term Preferred Stock which may be in arrears. See “— Adjustment to Fixed Dividend Rate — Default Period.”
Upon our failure to pay dividends for at least two years, the holders of Series A Term Preferred Stock will acquire certain additional voting rights. See “— Voting Rights” below. Such rights shall be the exclusive remedy of the holders of Series A Term Preferred Stock upon any failure to pay dividends on Series A Term Preferred Stock.
Adjustment to Fixed Dividend Rate — Default Period. Subject to the cure provisions below, a Series A Default Period with respect to Series A Term Preferred Stock will commence on a date we fail to deposit the Deposit Securities as required in connection with a Series A Dividend Payment Date or a Series A Redemption Date. A Series A Default Period will end on the business day on which, by 12:00 noon, New York City time, an amount equal to all unpaid dividends and any unpaid redemption price shall have been deposited irrevocably in trust in same-day funds with the Redemption and Paying Agent. The applicable dividend rate for each day during the Series A Default Period will be equal to the Series A Dividend Rate in effect on such day plus two percent (2%) per annum, or the “Series A Default Rate.”
No Series A Default Period will be deemed to commence if the amount of any dividend or any redemption price due (if such default is not solely due to our willful failure) is deposited irrevocably in trust, in same-day funds with the Redemption and Paying Agent by 12:00 noon, New York City time, on a business day that is not later than three business days after the applicable Series A Dividend Payment Date or Series A Redemption Date, together with an amount equal to the Series A Default Rate applied to the amount and period of such non-payment based on the actual number of calendar days comprising such period divided by 360.
Restrictions on Dividend, Redemption, Other Payments and Issuance of Debt. No full dividends and distributions will be declared or paid on shares of the Series A Term Preferred Stock for any Series A Dividend Period, or a part of a Series A Dividend Period, unless the full cumulative dividends and distributions due through the most recent dividend payment dates for all outstanding shares of preferred stock of any series have been, or contemporaneously are, declared and paid through the most recent dividend payment dates for each share of preferred stock. If full cumulative dividends and distributions due have not been paid on all outstanding shares of preferred stock of any series, any dividends and distributions being declared and paid
S-19
on Series A Term Preferred Stock will be declared and paid as nearly pro rata as possible in proportion to the respective amounts of dividends and distributions accumulated but unpaid on the shares of each such series of preferred stock on the relevant dividend payment date. No holders of Series A Term Preferred Stock will be entitled to any dividends and distributions in excess of full cumulative dividends and distributions as provided in the certificate of designation.
For so long as any shares of Series A Term Preferred Stock are outstanding, we will not: (x) declare any dividend or other distribution (other than a dividend or distribution paid in common stock) in respect of the common stock, (y) call for redemption, redeem, purchase or otherwise acquire for consideration any such common stock, or (z) pay any proceeds of our liquidation in respect of such common stock, unless, in each case, (A) immediately thereafter, we will be in compliance with the 200% asset coverage limitations set forth under the 1940 Act with respect to a class of senior security which is stock, after deducting the amount of such dividend or distribution or redemption or purchasing price or liquidation proceeds, as described below, (B) all cumulative dividends and distributions of shares of all series of preferred stock ranking on parity with the Series A Term Preferred Stock (including the Series B Term Preferred Stock) due on or prior to the date of the applicable dividend, distribution, redemption, purchase or acquisition shall have been declared and paid (or shall have been declared and sufficient funds or Deposit Securities as permitted by the terms of such preferred stock for the payment thereof shall have been deposited irrevocably with the applicable paying agent) and (C) we have deposited Deposit Securities with the Redemption and Paying Agent in accordance with the requirements described herein with respect to outstanding Series A Term Preferred Stock to be redeemed pursuant to a mandatory term redemption or mandatory redemption resulting from the failure to comply with the asset coverage requirements as described below for which a Series A Notice of Redemption shall have been given or shall have been required to be given in accordance with the terms described herein on or prior to the date of the applicable dividend, distribution, redemption, purchase or acquisition.
Except as required by law, we will not redeem any shares of Series A Term Preferred Stock unless all accumulated and unpaid dividends and distributions on all outstanding shares of preferred stock of any series ranking on parity with the Series A Term Preferred Stock (including the Series B Term Preferred Stock) with respect to dividends and distributions for all applicable past dividend periods (whether or not earned or declared by us) (x) will have been or are contemporaneously paid or (y) will have been or are contemporaneously declared and Deposit Securities or sufficient funds (in accordance with the terms of such preferred stock) for the payment of such dividends and distributions will have been or are contemporaneously deposited with the applicable paying agent, provided, however, that the foregoing will not prevent the purchase or acquisition of outstanding shares of Series A Term Preferred Stock pursuant to an otherwise lawful purchase or exchange offer made on the same terms to holders of all outstanding shares of any other series of preferred stock (such as the Series B Term Preferred Stock) for which all accumulated and unpaid dividends and distributions have not been paid.
1940 Act Asset Coverage. Under the 1940 Act, we may not (1) declare any dividend with respect to any preferred stock if, at the time of such declaration (and after giving effect thereto), our asset coverage with respect to any of our borrowings that are senior securities representing indebtedness (as determined in accordance with Section 18(h) under the 1940 Act), would be less than 200% or (2) declare any other distribution on the preferred stock or purchase or redeem preferred stock if at the time of the declaration or redemption (and after giving effect thereto), asset coverage with respect to such borrowings that are senior securities representing indebtedness would be less than 200%. “Senior securities representing indebtedness” generally means any bond, debenture, note or similar obligation or instrument constituting a security (other than shares of capital stock) and evidencing indebtedness and could include our obligations under any borrowings. For purposes of determining our asset coverage for senior securities representing indebtedness in connection with the payment of dividends or other distributions on or purchases or redemptions of stock, the term senior security does not include any promissory note or other evidence of indebtedness issued in consideration of any loan, extension or renewal thereof, made by a bank or other person and privately arranged, and not intended to be publicly distributed. The term senior security also does not include any such promissory note or other evidence of indebtedness in any case where such a loan is for temporary purposes only and in an amount not exceeding 5% of the value of our total assets at the time when the loan is made; a loan is presumed under the 1940 Act to be for temporary purposes if it is repaid within 60 calendar days and is not extended or renewed; otherwise such loan is presumed not to be for temporary purposes.
S-20
Liquidation Rights
In the event of any liquidation, dissolution or winding up of our affairs, whether voluntary or involuntary, the holders of Series A Term Preferred Stock will be entitled to receive out of our assets available for distribution to stockholders, after satisfying claims of creditors but before any distribution or payment will be made in respect of the common stock, a liquidation distribution equal to the Series A Liquidation Preference plus an amount equal to all unpaid dividends and distributions accumulated to, but excluding, the date fixed for such distribution or payment (whether or not earned or declared by us, but excluding interest thereon), and such holders will be entitled to no further participation in any distribution or payment in connection with any such liquidation, dissolution or winding up.
If, upon any liquidation, dissolution or winding up of our affairs, whether voluntary or involuntary, our assets available for distribution among the holders of all Series A Term Preferred Stock, and any other outstanding shares of preferred stock, if any, will be insufficient to permit the payment in full to such holders of Series A Term Preferred Stock of the Series A Liquidation Preference plus accumulated and unpaid dividends and distributions and the amounts due upon liquidation with respect to such other shares of preferred stock, then the available assets will be distributed among the holders of such Series A Term Preferred Stock and such other series of preferred stock ratably in proportion to the respective preferential liquidation amounts to which they are entitled. In connection with any liquidation, dissolution or winding up of our affairs whether voluntary or involuntary, unless and until the Series A Liquidation Preference on each outstanding share of Series A Term Preferred Stock plus accumulated and unpaid dividends and distributions has been paid in full to the holders of Series A Term Preferred Stock, no dividends, distributions or other payments will be made on, and no redemption, repurchase or other acquisition by us will be made by us in respect of, our common stock.
Neither the sale of all or substantially all of the property or business of the Company, nor the merger, consolidation or our reorganization into or with any other business or corporation, statutory trust or other entity, nor the merger, consolidation or reorganization of any other business or corporation, statutory trust or other entity into or with us will be a dissolution, liquidation or winding up, whether voluntary or involuntary, for purposes of the provisions relating to liquidation set forth in the certificate of designation.
Redemption
Mandatory Term Redemption. We are required to redeem all outstanding shares of the Series A Term Preferred Stock on the Series A Mandatory Redemption Date, at a redemption price equal to the Series A Liquidation Preference plus an amount equal to accumulated but unpaid dividends thereon (whether or not earned or declared, but excluding interest on such dividends) to, but excluding, the Series A Mandatory Redemption Date. If the Series A Mandatory Redemption Date occurs after the applicable record date for a dividend but on or prior to the related Series A Dividend Payment Date, the dividend payable on such Series A Dividend Payment Date in respect of such shares of Series A Term Preferred Stock will be payable on such Series A Dividend Payment Date to the holders of record of such shares of Series A Term Preferred Stock at the close of business on the applicable Series A Dividend Record Date, and will not be payable as part of the redemption price for such shares of Series A Term Preferred Stock. We cannot effect any modification of or repeal our obligation to redeem the Series A Term Preferred Stock on the Series A Mandatory Redemption Date without the prior unanimous approval of the holders of the Series A Term Preferred Stock.
Redemption for Failure to Maintain Asset Coverage. If we fail to maintain asset coverage (as defined in the 1940 Act) of at least 200% as provided in the certificate of designation for the Series A Term Preferred Stock and such failure is not cured as of the close of business on the Series A Asset Coverage Cure Date, we will fix a redemption date and proceed to redeem the number of shares of preferred stock, including the Series A Term Preferred Stock and/or the Series B Term Preferred Stock, as described below at a price per share equal to the applicable liquidation preference plus accumulated but unpaid dividends and distributions thereon (whether or not earned or declared but excluding interest thereon) to, but excluding, the date fixed for redemption by our board of directors. We will redeem out of funds legally available the number of shares of outstanding preferred stock (which at our discretion may include any number or portion of the Series A Term Preferred Stock) equal to the lesser of (i) the minimum number of shares of preferred stock, the redemption of which, if deemed to have occurred immediately prior to the opening of business on the Series A Asset Coverage Cure Date, would result in us having asset coverage of at least 200% and (ii) the maximum number of shares
S-21
of preferred stock that can be redeemed out of funds expected to be legally available in accordance with our Certificate of Incorporation and applicable law, provided further, that in connection with any such redemption for failure to maintain the asset coverage required by the 1940 Act, we may, at our sole option, redeem such additional number of shares of preferred stock that will result in our having asset coverage of up to and including 285%. We will effect a redemption on the date fixed by us, which date will not be later than 90 calendar days after the Series A Asset Coverage Cure Date, except that if we do not have funds legally available for the redemption of all of the required number of shares of preferred stock which have been designated to be redeemed or we otherwise are unable to effect such redemption on or prior to 90 calendar days after the Series A Asset Coverage Cure Date, we will redeem those shares of preferred stock which we were unable to redeem on the earliest practicable date on which we are able to effect such redemption.
Optional Redemption. Upon giving notice of redemption, the Series A Term Preferred Stock may, at our sole option, be redeemed, in whole or in part, at any time after October 31, 2023, out of funds legally available for such redemption at a redemption price per share equal to the Series A Liquidation Preference plus an amount equal to accumulated but unpaid dividends, if any, on such shares (whether or not earned or declared, but excluding interest on such dividends) to, but excluding, the date fixed for such redemption.
Subject to the provisions of the certificate of designation for the Series A Term Preferred Stock and applicable law, our board of directors will have the full power and authority to prescribe the terms and conditions upon which shares of Series A Term Preferred Stock will be redeemed from time to time.
We may not on any date deliver a notice of redemption to redeem any shares of Series A Term Preferred Stock pursuant to the optional redemption provisions described above unless on such date we have available Deposit Securities for the redemption contemplated by such notice having a value not less than the amount due to holders of shares of Series A Term Preferred Stock by reason of the redemption of such shares of Series A Term Preferred Stock on such redemption date.
Redemption Procedures. We will file a notice of our intention to redeem with the SEC so as to provide the 30 calendar day notice period contemplated by Rule 23c-2 under the 1940 Act, or such shorter notice period as may be permitted by the SEC or its staff.
If we shall determine or be required to redeem, in whole or in part, shares of Series A Term Preferred Stock, we will deliver a notice of redemption, or a “Series A Notice of Redemption,” by overnight delivery, by first class mail, postage prepaid or by electronic means to the holders of record of such shares of Series A Term Preferred Stock to be redeemed, or request the Redemption and Paying Agent, on our behalf, to promptly do so by overnight delivery, by first class mail or by electronic means. A Series A Notice of Redemption will be provided not more than 45 calendar days prior to the date fixed for redemption in such Series A Notice of Redemption, or the “Series A Redemption Date.” If fewer than all of the outstanding shares of Series A Term Preferred Stock are to be redeemed pursuant to either the mandatory redemption provisions triggered by our failure to maintain the required asset coverage or the optional redemption provisions, the shares of Series A Term Preferred Stock to be redeemed will be selected either (1) pro rata among Series A Term Preferred Stock, (2) by lot or (3) in such other manner as our board of directors may determine to be fair and equitable. If fewer than all shares of Series A Term Preferred Stock held by any holder are to be redeemed, the Series A Notice of Redemption mailed to such holder shall also specify the number of shares of Series A Term Preferred Stock to be redeemed from such holder or the method of determining such number. We may provide in any Series A Notice of Redemption relating to a redemption contemplated to be effected pursuant to the certificate of designation for the Series A Term Preferred Stock that such redemption is subject to one or more conditions precedent and that we will not be required to effect such redemption unless each such condition has been satisfied. No defect in any Series A Notice of Redemption or delivery thereof will affect the validity of redemption proceedings except as required by applicable law.
If we give a Series A Notice of Redemption, then at any time from and after the giving of such Series A Notice of Redemption and prior to 12:00 noon, New York City time, on the Series A Redemption Date (so long as any conditions precedent to such redemption have been met or waived by us), we will (i) deposit with the Redemption and Paying Agent Deposit Securities having an aggregate market value at the time of deposit not less than the redemption price of the shares of Series A Term Preferred Stock to be redeemed on the Series A Redemption Date and (ii) give the Redemption and Paying Agent irrevocable instructions and
S-22
authority to pay the applicable redemption price to the holders of shares of Series A Term Preferred Stock called for redemption on the Series A Redemption Date. Notwithstanding the foregoing, if the Series A Redemption Date is the Series A Mandatory Redemption Date, then such deposit of Deposit Securities will be made no later than 15 calendar days prior to the Series A Mandatory Redemption Date.
Upon the date of the deposit of Deposit Securities by us for purposes of redemption of shares of Series A Term Preferred Stock, all rights of the holders of Series A Term Preferred Stock so called for redemption shall cease and terminate except the right of the holders thereof to receive the applicable redemption price and such shares of Series A Term Preferred Stock will no longer be deemed outstanding for any purpose whatsoever (other than the transfer thereof prior to the applicable Series A Redemption Date and other than the accumulation of dividends on such stock in accordance with the terms of the Series A Term Preferred Stock up to, but excluding, the applicable Series A Redemption Date). We will be entitled to receive, promptly after the Series A Redemption Date, any Deposit Securities in excess of the aggregate redemption price of shares of Series A Term Preferred Stock called for redemption on the Series A Redemption Date. Any Deposit Securities so deposited that are unclaimed at the end of 90 calendar days from the Series A Redemption Date will, to the extent permitted by law, be repaid to us, after which the holders of shares of Series A Term Preferred Stock so called for redemption shall look only to us for payment of the Series A Redemption Price. We will be entitled to receive, from time to time after the Series A Redemption Date, any interest on the Deposit Securities so deposited.
If any redemption for which a Series A Notice of Redemption has been provided is not made by reason of the absence of our legally available funds in accordance with the certificate of designation and applicable law, such redemption shall be made as soon as practicable to the extent such funds become available. No default will be deemed to have occurred if we have failed to deposit in trust with the Redemption and Paying Agent the applicable redemption price with respect to any shares where (1) the Series A Notice of Redemption relating to such redemption provided that such redemption was subject to one or more conditions precedent and (2) any such condition precedent has not been satisfied at the time or times and in the manner specified in such Series A Notice of Redemption. Notwithstanding the fact that a Series A Notice of Redemption has been provided with respect to any shares of Series A Term Preferred Stock, dividends may be declared and paid on such shares of Series A Term Preferred Stock in accordance with their terms if Deposit Securities for the payment of the redemption price of such shares of Series A Term Preferred Stock shall not have been deposited in trust with the Redemption and Paying Agent for that purpose.
We may, in our sole discretion and without a stockholder vote, modify the redemption procedures with respect to notification of redemption for the Series A Term Preferred Stock, provided that such modification does not materially and adversely affect the holders of Series A Term Preferred Stock or cause us to violate any applicable law, rule or regulation.
Voting Rights
Except for matters that do not require the vote of holders of the Series A Term Preferred Stock under the 1940 Act and except as otherwise provided in our certificate of incorporation or bylaws, in the certificate of designation or as otherwise required by applicable law, each holder of shares of the Series A Term Preferred Stock will be entitled to one vote for each share of Series A Term Preferred Stock held on each matter submitted to a vote of our stockholders and the holders of outstanding shares of our preferred stock, including the Series A Term Preferred Stock and the Series B Term Preferred Stock, and shares of our common stock shall vote together as a single class on all matters submitted to stockholders.
In addition, the holders of our preferred stock, including the Series A Term Preferred Stock and the Series B Term Preferred Stock, voting as a separate class, will have the right to elect two members of the board of directors at all times (regardless of the number of directors serving on the board of directors), such directors are referred to as our “Preferred Directors.” The holders of outstanding shares of our common stock together with the holders of outstanding shares of our preferred stock, voting together as a single class, will elect the remaining members of the board of directors. Under our certificate of incorporation, our directors are divided into three classes, with the term of one class expiring at each annual meeting of our stockholders. One of our Preferred Directors will be up for election at the annual meeting of our stockholders held in 2025 and the other Preferred Director will be up for election at the annual meeting of our stockholders held in 2026.
S-23
Notwithstanding the foregoing, if (1) at the close of business on any Series A Dividend Payment Date for dividends on any outstanding share of any preferred stock, including any outstanding shares of the Series A Term Preferred Stock, accumulated dividends (whether or not earned or declared) on the shares of preferred stock, including the Series A Term Preferred Stock, equal to at least two full years’ dividends shall be due and unpaid and sufficient cash or specified securities shall not have been deposited with the Redemption and Paying Agent or other applicable paying agent for the payment of such accumulated dividends; or (2) at any time holders of any shares of preferred stock, including any outstanding shares of the of Series A Term Preferred Stock, are entitled under the 1940 Act to elect a majority of our directors (a period when either of the foregoing conditions exists, a “Voting Period”), then the number of members constituting our board of directors will automatically be increased by the smallest number of directors (each, a “New Preferred Director”) that, when added to the two Preferred Directors, would constitute a majority of our board of directors as so increased by such smallest number. The terms of office of the persons who are directors at the time of that election will not be affected by the election of the New Preferred Directors. If we thereafter shall pay, or declare and set apart for payment, in full all dividends payable on all outstanding shares of preferred stock, including the Series A Term Preferred Stock, for all past dividend periods, or the Voting Period is otherwise terminated, (1) the voting rights stated above shall cease, subject always, however, to the re-vesting of such voting rights in the holders of shares of Preferred Stock upon the further occurrence of any of the events described herein, and (2) the terms of office of all of the New Preferred Directors will terminate automatically. Any preferred stock issued after the date hereof will vote with the Series A Term Preferred Stock as a single class on the matters described above, and the issuance of any other preferred stock by us may reduce the voting power of the holders of the Series A Term Preferred Stock.
As soon as practicable after the accrual of any right of the holders of shares of preferred stock to elect New Preferred Directors, we will call a special meeting of such holders and notify the Redemption and Paying Agent and/or such other person as is specified in the terms of such preferred stock to receive notice, (i) by mailing or delivery by electronic means or (ii) in such other manner and by such other means as are specified in the terms of such preferred stock, a notice of such special meeting to such holders, such meeting to be held not less than 10 nor more than 30 calendar days after the date of the delivery by electronic means or mailing of such notice. If we fail to call such a special meeting, it may be called at our expense by any such holder on like notice. The record date for determining the holders of shares of preferred stock entitled to notice of and to vote at such special meeting shall be the close of business on the business day preceding the calendar day on which such notice is mailed. At any such special meeting and at each meeting of holders of shares of preferred stock held during a Voting Period at which directors are to be elected, such holders, voting together as a class (to the exclusion of the holders of all our other securities and classes of capital stock), will be entitled to elect the number of New Preferred Directors prescribed above on a one-vote-per-share basis.
Except as otherwise permitted by the terms of the certificate of designation, (1) so long as any shares of preferred stock are outstanding, we will not, without the affirmative vote or consent of the holders of at least two-thirds of all outstanding shares of preferred stock, voting as a separate class, amend, alter or repeal the provisions of our certificate of incorporation or any applicable certificates of designation (or any other document governing the rights of our preferred stock or the holders thereof as may be required by the rules of any applicable securities exchange), whether by merger, consolidation or otherwise, so as to materially and adversely affect any preference, right or power of our preferred stock or the holders thereof and (2) so long as any shares of the Series A Term Preferred Stock are outstanding, we will not, without the affirmative vote or consent of the holders of at least two-thirds of all outstanding shares of the Series A Term Preferred Stock, voting as a separate class, amend, alter or repeal the provisions of our certificate of incorporation or the applicable certificate of designation (or any other document governing the rights of the Series A Term Preferred Stock or the holders thereof as may be required by the rules of any applicable securities exchange), whether by merger, consolidation or otherwise, so as to materially and adversely affect any preference, right or power of the Series A Term Preferred Stock or the holders thereof differently from shares of any other outstanding series of our preferred stock; provided, however, that (i) a change in our capitalization as described under the heading “— Issuance of Additional Preferred Stock” will not be considered to materially and adversely affect the rights and preferences of any holder of our preferred stock, and (ii) a division of a share of preferred stock will be deemed to affect such preferences, rights or powers only if the terms of such division materially and adversely affect the holders of such preferred stock. For purposes of the foregoing, no matter shall be deemed to adversely affect any preference, right or power of a share of preferred stock, including the Series A Term Preferred Stock or the holders of Series A Term Preferred Stock, unless such matter (i) alters or
S-24
abolishes any preferential right of such share of preferred stock, or (ii) creates, alters or abolishes any right in respect of redemption of the preferred stock or the applicable series thereof (other than as a result of a division of a share of preferred stock). So long as any shares of preferred stock are outstanding, we will not, without the affirmative vote or consent of the holders of at least two-thirds of the shares of the preferred stock outstanding at the time, voting as a separate class, file a voluntary application for relief under federal bankruptcy law or any similar application under state law for so long as we are solvent and does not foresee becoming insolvent.
The affirmative vote of the holders of at least a “majority of the shares of our preferred stock,” including the shares of the Series A Term Preferred Stock and the Series B Term Preferred Stock outstanding at the time, voting as a separate class, will be required (i) to approve any action requiring a vote of our security holders pursuant to Section 13(a) of the 1940 Act, or (ii) to approve any plan of “reorganization” (as such term is defined in Section 2(a)(33) of the 1940 Act) adversely affecting such shares of preferred stock. For purposes of the foregoing, the vote of a “majority of the outstanding shares of preferred stock” means the vote at an annual or special meeting duly called (a) of 67% or more of such shares present at a meeting, if the holders of more than 50% of such outstanding shares are present or represented by proxy at such meeting, or (b) of more than 50% of such outstanding shares, whichever is less.
For purposes of determining any rights of the holders of Series A Term Preferred Stock to vote on any matter, whether such right is created by our certificate of incorporation, by the provisions of the certificate of designation for the Series A Term Preferred Stock, by statute or otherwise, no holder of the Series A Term Preferred Stock will be entitled to vote any shares of the Series A Term Preferred Stock and no share of the Series A Term Preferred Stock will be deemed to be “outstanding” for the purpose of voting or determining the number of shares required to constitute a quorum if, prior to or concurrently with the time of determination of shares entitled to vote or the time of the actual vote on the matter, as the case may be, the requisite Notice of Redemption with respect to such share of Series A Term Preferred Stock will have been given in accordance with the certificate of designation, and the price for the redemption of such shares of Series A Term Preferred Stock will have been irrevocably deposited with the Redemption and Paying Agent for that purpose. No shares of Series A Term Preferred Stock held by us will have any voting rights or be deemed to be outstanding for voting or for calculating the voting percentage required on any other matter or other purposes.
Unless otherwise required by law or our certificate of incorporation, holders of the Series A Term Preferred Stock will not have any relative rights or preferences or other special rights with respect to voting other than those specifically set forth in the certificate of designation for the Series A Term Preferred Stock. The holders of shares of Series A Term Preferred Stock will have no rights to cumulative voting. In the event that we fail to declare or pay any dividends on shares of the Series A Term Preferred Stock, the exclusive remedy of the holders will be the right to vote for additional directors as discussed above; provided that the foregoing does not affect our obligation to accumulate and, if permitted by applicable law and the certificate of designation for the Series A Term Preferred Stock, pay dividends at the Series A Default Rate as discussed above.
Issuance of Additional Preferred Stock
So long as any shares of Series A Term Preferred Stock are outstanding, we may, without the vote or consent of the holders thereof, authorize, establish and create and issue and sell shares of one or more series of a class of our senior securities representing stock under Section 18 of the 1940 Act, ranking on parity with the Series A Term Preferred Stock as to payment of dividends and distribution of assets upon dissolution, liquidation or the winding up of our affairs, including additional series of preferred stock, and authorize, issue and sell additional shares of any such series of preferred stock then outstanding (including the Series B Term Preferred Stock) or so established and created, in each case in accordance with applicable law, provided that we will, immediately after giving effect to the issuance of such additional preferred stock and to its receipt and application of the proceeds thereof, including to the redemption of preferred stock with such proceeds, have asset coverage of at least 200%.
Actions on Other than Business Days
Unless otherwise provided in the certificate of designation for the Series A Term Preferred Stock, if the date for making any payment, performing any act or exercising any right is not a business day (i.e., a calendar
S-25
day on which the NYSE is open for trading), such payment will be made, act performed or right exercised on the next succeeding business day, with the same force and effect as if made or done on the nominal date provided therefor, and, with respect to any payment so made, no dividends, interest or other amount will accrue for the period between such nominal date and the date of payment.
Modification
Without the consent of any holders of the Series A Term Preferred Stock, our board of directors may amend or modify these terms of the Series A Term Preferred Stock to cure any ambiguity, correct or supplement any provision herein which may be inconsistent with any other provision in our certificate of incorporation or make any other provisions with respect to matters or questions arising under these terms of the Series A Term Preferred Stock that are not inconsistent with the provisions in our certificate of incorporation.
S-26
The following description of the particular terms of the Series B Term Preferred Stock supplements and, to the extent inconsistent with, replaces the description of the general terms and provisions of our preferred stock set forth in the accompanying prospectus. This is not a complete description and is subject to, and entirely qualified by reference to, our certificate of incorporation and the certificate of designation setting forth the terms of the Series B Term Preferred Stock. The certificate of designation is attached as Appendix B to this prospectus supplement. You may obtain copies of these documents using the methods described in “Additional Information” in this prospectus supplement.
General
We are authorized to issue 20,000,000 shares of preferred stock and we have designated 2,400,000 shares as Series B Term Preferred Stock . At the time of issuance, the Series B Term Preferred Stock will be fully paid and non-assessable and have no preemptive, conversion or exchange rights or rights to cumulative voting.
Ranking
The shares of Series B Term Preferred Stock will rank equally in right with the Series A Term Preferred Stock and all other preferred stock that we may issue from time to time in accordance with the 1940 Act, if any, as to payment of dividends and the distribution of our assets upon dissolution, liquidation or winding up of our affairs. The shares of Series B Term Preferred Stock, together with the Series A Term Preferred Stock and all other preferred stock that we may issue from time to time in accordance with the 1940 Act, if any, will rank senior to our common stock as to payment of dividends and the distribution of our assets upon dissolution, liquidation or winding up of our affairs and subordinate to the rights of holders of our existing and future indebtedness (including indebtedness under the BNP Credit Facility).
Dividends
General. Holders of the Series B Term Preferred Stock are entitled to receive cumulative cash dividends and distributions at the Series B Dividend Rate of 7.75% of the Series B Liquidation Preference, or $1.9375 per share per year (subject to adjustment in certain circumstances as described below), when, as and if declared by, or under authority granted by, our board of directors out of funds legally available for payment, in parity with dividends and distributions to holders of the Series A Term Preferred Stock and in preference to dividends and distributions on shares of our common stock. Dividends on the shares of Series B Term Preferred Stock offered pursuant to this prospectus supplement will be payable monthly in arrears on the last business day of every calendar month, or the “Series B Dividend Payment Date,” commencing on August 31, 2023. Dividends on the Series B Term Preferred Stock will be computed on the basis of a 360-day year consisting of twelve 30- day months. The amount of dividends payable on the shares of Series B Term Preferred Stock on any date prior to the end of a Series B Dividend Period, and for the initial Series B Dividend Period, will be computed on the basis of a 360-day year consisting of twelve 30-day months, and actual days elapsed over a 30-day month.
Dividend Periods. Each Series B Dividend Period will be the period beginning on and including the last Series B Dividend Payment Date and ending on, but excluding, the next Series B Dividend Payment Date or stated maturity date, as the case may be. Dividends will be payable monthly in arrears on the Series B Dividend Payment Date and upon redemption of the Series B Term Preferred Stock. Except for the first Series B Dividend Period, dividends with respect to any monthly Series B Dividend Period will be declared and paid to holders of record of Series B Term Preferred Stock as their names appear on our registration books at the close of business on the applicable record date, which will be a date designated by the board of directors that is not more than 20 nor less than 7 calendar days prior to the applicable Series B Dividend Payment Date.
Only holders of Series B Term Preferred Stock on the record date for a Series B Dividend Period will be entitled to receive dividends and distributions payable with respect to such Series B Dividend Period, and holders of Series B Term Preferred Stock who sell shares before such a record date and purchasers of Series B Term Preferred Stock who purchase shares after such a record date should take the effect of the foregoing provisions into account in evaluating the price to be received or paid for such Series B Term Preferred Stock.
S-27
Mechanics of Payment of Dividends. Not later than 12:00 noon, New York City time, on a Series B Dividend Payment Date, we are required to deposit with the Redemption and Paying Agent sufficient funds for the payment of dividends in the form of Deposit Securities. Deposit Securities will generally consist of (1) cash or cash equivalents; (2) direct obligations of the United States or its agencies or instrumentalities that are entitled to the full faith and credit of the United States, which we refer to as the U.S. Government Obligations; (3) investments in money market funds registered under the 1940 Act that qualify under Rule 2a-7 under the 1940 Act and certain similar investment vehicles that invest in U.S. Government Obligations or any combination thereof; or (4) any letter of credit from a bank or other financial institution that has a credit rating from at least one ratings agency that is the highest applicable rating generally ascribed by such ratings agency to bank deposits or short-term debt of similar banks or other financial institutions, in each case either that is a demand obligation payable to the holder on any business day or that has a maturity date, mandatory redemption date or mandatory payment date, preceding the relevant Series B Redemption Date (as defined below), Series B Dividend Payment Date or other payment date. We do not intend to establish any reserves for the payment of dividends.
All Deposit Securities paid to the Redemption and Payment Agent for the payment of dividends will be held in trust for the payment of such dividends to the holders of Series B Term Preferred Stock. Dividends will be paid by the Redemption and Payment Agent to the holders of Series B Term Preferred Stock as their names appear on our registration books on the applicable record date. Dividends that are in arrears for any past Series B Dividend Period may be declared and paid at any time, without reference to any regular Series B Dividend Payment Date. Such payments are made to holders of Series B Term Preferred Stock as their names appear on our registration books on such date, not exceeding 20 nor less than 7 calendar days preceding the payment date thereof, as may be fixed by our board of directors. Any payment of dividends in arrears will first be credited against the earliest accumulated but unpaid dividends. No interest or sum of money in lieu of interest will be payable in respect of any dividend payment or payments on any Series B Term Preferred Stock which may be in arrears. See “— Adjustment to Fixed Dividend Rate — Default Period.”
Upon our failure to pay dividends for at least two years, the holders of Series B Term Preferred Stock will acquire certain additional voting rights. See “— Voting Rights” below. Such rights shall be the exclusive remedy of the holders of Series B Term Preferred Stock upon any failure to pay dividends on Series B Term Preferred Stock.
Adjustment to Fixed Dividend Rate — Default Period. Subject to the cure provisions below, a Series B Default Period with respect to Series B Term Preferred Stock will commence on a date we fail to deposit the Deposit Securities as required in connection with a Series B Dividend Payment Date or a Series B Redemption Date. A Series B Default Period will end on the business day on which, by 12:00 noon, New York City time, an amount equal to all unpaid dividends and any unpaid redemption price shall have been deposited irrevocably in trust in same-day funds with the Redemption and Paying Agent. The applicable dividend rate for each day during the Series B Default Period will be equal to the Series B Dividend Rate in effect on such day plus two percent (2%) per annum, or the “Series B Default Rate.”
No Series B Default Period will be deemed to commence if the amount of any dividend or any redemption price due (if such default is not solely due to our willful failure) is deposited irrevocably in trust, in same-day funds with the Redemption and Paying Agent by 12:00 noon, New York City time, on a business day that is not later than three business days after the applicable Series B Dividend Payment Date or Series B Redemption Date, together with an amount equal to the Series B Default Rate applied to the amount and period of such non-payment based on the actual number of calendar days comprising such period divided by 360.
Restrictions on Dividend, Redemption, Other Payments and Issuance of Debt. No full dividends and distributions will be declared or paid on shares of the Series B Term Preferred Stock for any Series B Dividend Period, or a part of a Series B Dividend Period, unless the full cumulative dividends and distributions due through the most recent dividend payment dates for all outstanding shares of preferred stock of any series have been, or contemporaneously are, declared and paid through the most recent dividend payment dates for each share of preferred stock. If full cumulative dividends and distributions due have not been paid on all outstanding shares of preferred stock of any series, any dividends and distributions being declared and paid on Series B Term Preferred Stock will be declared and paid as nearly pro rata as possible in proportion to the respective amounts of dividends and distributions accumulated but unpaid on the shares of each such series
S-28
of preferred stock on the relevant dividend payment date. No holders of Series B Term Preferred Stock will be entitled to any dividends and distributions in excess of full cumulative dividends and distributions as provided in the certificate of designation.
For so long as any shares of Series B Term Preferred Stock are outstanding, we will not: (x) declare any dividend or other distribution (other than a dividend or distribution paid in common stock) in respect of the common stock, (y) call for redemption, redeem, purchase or otherwise acquire for consideration any such common stock, or (z) pay any proceeds of our liquidation in respect of such common stock, unless, in each case, (A) immediately thereafter, we will be in compliance with the 200% asset coverage limitations set forth under the 1940 Act with respect to a class of senior security which is stock, after deducting the amount of such dividend or distribution or redemption or purchasing price or liquidation proceeds, as described below, (B) all cumulative dividends and distributions of shares of all series of preferred stock ranking on parity with the Series B Term Preferred Stock (including the Series A Term Preferred Stock) due on or prior to the date of the applicable dividend, distribution, redemption, purchase or acquisition shall have been declared and paid (or shall have been declared and sufficient funds or Deposit Securities as permitted by the terms of such preferred stock for the payment thereof shall have been deposited irrevocably with the applicable paying agent) and (C) we have deposited Deposit Securities with the Redemption and Paying Agent in accordance with the requirements described herein with respect to outstanding Series B Term Preferred Stock to be redeemed pursuant to a mandatory term redemption or mandatory redemption resulting from the failure to comply with the asset coverage requirements as described below for which a Series B Notice of Redemption shall have been given or shall have been required to be given in accordance with the terms described herein on or prior to the date of the applicable dividend, distribution, redemption, purchase or acquisition.
Except as required by law, we will not redeem any shares of Series B Term Preferred Stock unless all accumulated and unpaid dividends and distributions on all outstanding shares of preferred stock of any series ranking on parity with the Series B Term Preferred Stock (including the Series A Term Preferred Stock) with respect to dividends and distributions for all applicable past Series B Dividend Periods (whether or not earned or declared by us) (x) will have been or are contemporaneously paid or (y) will have been or are contemporaneously declared and Deposit Securities or sufficient funds (in accordance with the terms of such preferred stock) for the payment of such dividends and distributions will have been or are contemporaneously deposited with the applicable paying agent, provided, however, that the foregoing will not prevent the purchase or acquisition of outstanding shares of Series B Term Preferred Stock pursuant to an otherwise lawful purchase or exchange offer made on the same terms to holders of all outstanding shares of any other series of preferred stock (including the Series A Term Preferred Stock) for which all accumulated and unpaid dividends and distributions have not been paid.
1940 Act Asset Coverage. Under the 1940 Act, we may not (1) declare any dividend with respect to any preferred stock if, at the time of such declaration (and after giving effect thereto), our asset coverage with respect to any of our borrowings that are senior securities representing indebtedness (as determined in accordance with Section 18(h) under the 1940 Act), would be less than 200% or (2) declare any other distribution on the preferred stock or purchase or redeem preferred stock if at the time of the declaration or redemption (and after giving effect thereto), asset coverage with respect to such borrowings that are senior securities representing indebtedness would be less than 200%. “Senior securities representing indebtedness” generally means any bond, debenture, note or similar obligation or instrument constituting a security (other than shares of capital stock) and evidencing indebtedness and could include our obligations under any borrowings. For purposes of determining our asset coverage for senior securities representing indebtedness in connection with the payment of dividends or other distributions on or purchases or redemptions of stock, the term senior security does not include any promissory note or other evidence of indebtedness issued in consideration of any loan, extension or renewal thereof, made by a bank or other person and privately arranged, and not intended to be publicly distributed. The term senior security also does not include any such promissory note or other evidence of indebtedness in any case where such a loan is for temporary purposes only and in an amount not exceeding 5% of the value of our total assets at the time when the loan is made; a loan is presumed under the 1940 Act to be for temporary purposes if it is repaid within 60 calendar days and is not extended or renewed; otherwise such loan is presumed not to be for temporary purposes.
Liquidation Rights
In the event of any liquidation, dissolution or winding up of our affairs, whether voluntary or involuntary, the holders of Series B Term Preferred Stock will be entitled to receive out of our assets available for
S-29
distribution to stockholders, after satisfying claims of creditors but before any distribution or payment will be made in respect of the common stock, a liquidation distribution equal to the Series B Liquidation Preference plus an amount equal to all unpaid dividends and distributions accumulated to, but excluding, the date fixed for such distribution or payment (whether or not earned or declared by us, but excluding interest thereon), and such holders will be entitled to no further participation in any distribution or payment in connection with any such liquidation, dissolution or winding up.
If, upon any liquidation, dissolution or winding up of our affairs, whether voluntary or involuntary, our assets available for distribution among the holders of all Series B Term Preferred Stock, and any other outstanding shares of preferred stock, if any, will be insufficient to permit the payment in full to such holders of Series B Term Preferred Stock of the Series B Liquidation Preference plus accumulated and unpaid dividends and distributions and the amounts due upon liquidation with respect to such other shares of preferred stock, then the available assets will be distributed among the holders of such Series B Term Preferred Stock and such other series of preferred stock ratably in proportion to the respective preferential liquidation amounts to which they are entitled. In connection with any liquidation, dissolution or winding up of our affairs whether voluntary or involuntary, unless and until the Series B Liquidation Preference on each outstanding share of Series B Term Preferred Stock plus accumulated and unpaid dividends and distributions has been paid in full to the holders of Series B Term Preferred Stock, no dividends, distributions or other payments will be made on, and no redemption, repurchase or other acquisition by us will be made by us in respect of, our common stock.
Neither the sale of all or substantially all of the property or business of the Company, nor the merger, consolidation or our reorganization into or with any other business or corporation, statutory trust or other entity, nor the merger, consolidation or reorganization of any other business or corporation, statutory trust or other entity into or with us will be a dissolution, liquidation or winding up, whether voluntary or involuntary, for purposes of the provisions relating to liquidation set forth in the certificate of designation.
Redemption
Mandatory Term Redemption. We are required to redeem all outstanding shares of the Series B Term Preferred Stock on the Series B Mandatory Redemption Date, at a redemption price equal to the Series B Liquidation Preference plus an amount equal to accumulated but unpaid dividends thereon (whether or not earned or declared, but excluding interest on such dividends) to, but excluding, the Series B Mandatory Redemption Date. If the Series B Mandatory Redemption Date occurs after the applicable record date for a dividend but on or prior to the related Series B Dividend Payment Date, the dividend payable on such Series B Dividend Payment Date in respect of such shares of Series B Term Preferred Stock will be payable on such Series B Dividend Payment Date to the holders of record of such shares of Series B Term Preferred Stock at the close of business on the applicable Series B Dividend Record Date, and will not be payable as part of the redemption price for such shares of Series B Term Preferred Stock. We cannot effect any modification of or repeal our obligation to redeem the Series B Term Preferred Stock on the Series B Mandatory Redemption Date without the prior unanimous approval of the holders of the Series B Term Preferred Stock.
Redemption for Failure to Maintain Asset Coverage. If we fail to maintain asset coverage (as defined in the 1940 Act) of at least 200% as provided in the certificate of designation for the Series B Term Preferred Stock and such failure is not cured as of the close of business on the Series B Asset Coverage Cure Date, we will fix a redemption date and proceed to redeem the number of shares of preferred stock, including the Series A Term Preferred Stock and/or the Series B Term Preferred Stock, as described below at a price per share equal to the applicable liquidation preference plus accumulated but unpaid dividends and distributions thereon (whether or not earned or declared but excluding interest thereon) to, but excluding, the date fixed for redemption by our board of directors. We will redeem out of funds legally available the number of shares of outstanding preferred stock (which at our discretion may include any number or portion of the Series B Term Preferred Stock) equal to the lesser of (i) the minimum number of shares of preferred stock, the redemption of which, if deemed to have occurred immediately prior to the opening of business on the Series B Asset Coverage Cure Date, would result in us having asset coverage of at least 200% and (ii) the maximum number of shares of preferred stock that can be redeemed out of funds expected to be legally available in accordance with our certificate of incorporation and applicable law, provided further, that in connection with any such redemption for failure to maintain the asset coverage required by the 1940 Act, we may, at our sole option, redeem such
S-30
Optional Redemption. Upon giving notice of redemption, or a “Series B Notice of Redemption”, the Series B Term Preferred Stock may, at our sole option, be redeemed, in whole or in part, at any time on or after July 31, 2025, out of funds legally available for such redemption at a redemption price per share equal to the Series B Liquidation Preference plus an amount equal to accumulated but unpaid dividends, if any, on such shares (whether or not earned or declared, but excluding interest on such dividends) to, but excluding, the date fixed for such redemption.
Subject to the provisions of the certificate of designation for the Series B Term Preferred Stock and applicable law, our board of directors will have the full power and authority to prescribe the terms and conditions upon which shares of Series B Term Preferred Stock will be redeemed from time to time.
We may not on any date deliver a Series B Notice of Redemption to redeem any shares of Series B Term Preferred Stock pursuant to the optional redemption provisions described above unless on such date we have available Deposit Securities for the redemption contemplated by such notice having a value not less than the amount due to holders of shares of Series B Term Preferred Stock by reason of the redemption of such shares of Series B Term Preferred Stock on such redemption date.
Redemption Procedures. We will file a notice of our intention to redeem with the SEC so as to provide the 30 calendar day notice period contemplated by Rule 23c-2 under the 1940 Act, or such shorter notice period as may be permitted by the SEC or its staff.
If we shall determine or be required to redeem, in whole or in part, shares of Series B Term Preferred Stock, we will deliver a Series B Notice of Redemption by overnight delivery, by first class mail, postage prepaid or by electronic means to the holders of record of such shares of Series B Term Preferred Stock to be redeemed, or request the Redemption and Paying Agent, on our behalf, to promptly do so by overnight delivery, by first class mail or by electronic means. A Series B Notice of Redemption will be provided not less than thirty (30) nor more than sixty (60) calendar days prior to the date fixed for redemption in such Series B Notice of Redemption, or the “Series B Redemption Date.” If fewer than all of the outstanding shares of Series B Term Preferred Stock are to be redeemed pursuant to either the mandatory redemption provisions triggered by our failure to maintain the required asset coverage or the optional redemption provisions, the shares of Series B Term Preferred Stock to be redeemed will be selected either (1) pro rata among Series B Term Preferred Stock, (2) by lot or (3) in such other manner as our board of directors may determine to be fair and equitable. If fewer than all shares of Series B Term Preferred Stock held by any holder are to be redeemed, the Series B Notice of Redemption mailed to such holder shall also specify the number of shares of Series B Term Preferred Stock to be redeemed from such holder or the method of determining such number. We may provide in any Series B Notice of Redemption relating to a redemption contemplated to be effected pursuant to the certificate of designation for the Series B Term Preferred Stock that such redemption is subject to one or more conditions precedent and that we will not be required to effect such redemption unless each such condition has been satisfied. No defect in any Series B Notice of Redemption or delivery thereof will affect the validity of redemption proceedings except as required by applicable law.
If we give a Series B Notice of Redemption, then at any time from and after the giving of such Series B Notice of Redemption and prior to 12:00 noon, New York City time, on the Series B Redemption Date (so long as any conditions precedent to such redemption have been met or waived by us), we will (i) deposit with the Redemption and Paying Agent Deposit Securities having an aggregate market value at the time of deposit not less than the redemption price of the shares of Series B Term Preferred Stock to be redeemed on the Series B Redemption Date and (ii) give the Redemption and Paying Agent irrevocable instructions and authority to pay the applicable redemption price to the holders of shares of Series B Term Preferred Stock called for redemption on the Series B Redemption Date. Notwithstanding the foregoing, if the Series B
S-31
Redemption Date is the Series B Mandatory Redemption Date, then such deposit of Deposit Securities will be made no later than 15 calendar days prior to the Series B Mandatory Redemption Date.
Upon the date of the deposit of Deposit Securities by us for purposes of redemption of shares of Series B Term Preferred Stock, all rights of the holders of Series B Term Preferred Stock so called for redemption shall cease and terminate except the right of the holders thereof to receive the applicable redemption price and such shares of Series B Term Preferred Stock will no longer be deemed outstanding for any purpose whatsoever (other than the transfer thereof prior to the applicable Series B Redemption Date and other than the accumulation of dividends on such stock in accordance with the terms of the Series B Term Preferred Stock up to, but excluding, the applicable Series B Redemption Date). We will be entitled to receive, promptly after the Series B Redemption Date, any Deposit Securities in excess of the aggregate redemption price of shares of Series B Term Preferred Stock called for redemption on the Series B Redemption Date. Any Deposit Securities so deposited that are unclaimed at the end of 90 calendar days from the Series B Redemption Date will, to the extent permitted by law, be repaid to us, after which the holders of shares of Series B Term Preferred Stock so called for redemption shall look only to us for payment of the Series B Redemption Price. We will be entitled to receive, from time to time after the Series B Redemption Date, any interest on the Deposit Securities so deposited.
If any redemption for which a Series B Notice of Redemption has been provided is not made by reason of the absence of our legally available funds in accordance with the certificate of designation and applicable law, such redemption shall be made as soon as practicable to the extent such funds become available. No default will be deemed to have occurred if we have failed to deposit in trust with the Redemption and Paying Agent the applicable redemption price with respect to any shares where (1) the Series B Notice of Redemption relating to such redemption provided that such redemption was subject to one or more conditions precedent and (2) any such condition precedent has not been satisfied at the time or times and in the manner specified in such Series B Notice of Redemption. Notwithstanding the fact that a Series B Notice of Redemption has been provided with respect to any shares of Series B Term Preferred Stock, dividends may be declared and paid on such shares of Series B Term Preferred Stock in accordance with their terms if Deposit Securities for the payment of the redemption price of such shares of Series B Term Preferred Stock shall not have been deposited in trust with the Redemption and Paying Agent for that purpose.
We may, in our sole discretion and without a stockholder vote, modify the redemption procedures with respect to notification of redemption for the Series B Term Preferred Stock, provided that such modification does not materially and adversely affect the holders of Series B Term Preferred Stock or cause us to violate any applicable law, rule or regulation.
Voting Rights
Except for matters that do not require the vote of holders of the Series B Term Preferred Stock under the 1940 Act and except as otherwise provided in our certificate of incorporation or bylaws, in the certificate of designation or as otherwise required by applicable law, each holder of shares of the Series B Term Preferred Stock will be entitled to one vote for each share of Series B Term Preferred Stock held on each matter submitted to a vote of our stockholders and the holders of outstanding shares of our preferred stock, including the Series A Term Preferred Stock and the Series B Term Preferred Stock, and shares of our common stock shall vote together as a single class on all matters submitted to stockholders.
In addition, the holders of our preferred stock, including the Series A Term Preferred Stock and the Series B Term Preferred Stock, voting as a separate class, will have the right to elect two members of the board of directors at all times (regardless of the number of directors serving on the board of directors), such directors are referred to as our “Preferred Directors.” The holders of outstanding shares of our common stock together with the holders of outstanding shares of our preferred stock, voting together as a single class, will elect the remaining members of the board of directors. Under our certificate of incorporation, our directors are divided into three classes, with the term of one class expiring at each annual meeting of our stockholders. One of our Preferred Directors will be up for election at the annual meeting of our stockholders held in 2025 and the other Preferred Director will be up for election at the annual meeting of our stockholders held in 2026.
Notwithstanding the foregoing, if (1) at the close of business on any Series B Dividend Payment Date for dividends on any outstanding share of any preferred stock, including any outstanding shares of the Series B
S-32
Term Preferred Stock, accumulated dividends (whether or not earned or declared) on such shares of preferred stock equal to at least two full years’ dividends shall be due and unpaid and sufficient cash or specified securities shall not have been deposited with the Redemption and Paying Agent or other applicable paying agent for the payment of such accumulated dividends; or (2) at any time holders of any shares of preferred stock are entitled under the 1940 Act to elect a majority of our directors (a period when either of the foregoing conditions exists, a “Voting Period”), then the number of members constituting our board of directors will automatically be increased by the smallest number of directors (each, a “New Preferred Director”) that, when added to the two Preferred Directors, would constitute a majority of our board of directors as so increased by such smallest number. The terms of office of the persons who are directors at the time of that election will not be affected by the election of the New Preferred Directors. If we thereafter shall pay, or declare and set apart for payment, in full all dividends payable on all outstanding shares of preferred stock, including the Series B Term Preferred Stock, for all past Series B Dividend Periods, or the Voting Period is otherwise terminated, (1) the voting rights stated above shall cease, subject always, however, to the re-vesting of such voting rights in the holders of shares of Preferred Stock upon the further occurrence of any of the events described herein, and (2) the terms of office of all of the New Preferred Directors will terminate automatically. Any preferred stock issued after the date hereof will vote with the Series B Term Preferred Stock as a single class on the matters described above, and the issuance of any other preferred stock by us may reduce the voting power of the holders of the Series B Term Preferred Stock.
As soon as practicable after the accrual of any right of the holders of shares of preferred stock to elect New Preferred Directors, we will call a special meeting of such holders and notify the Redemption and Paying Agent and/or such other person as is specified in the terms of such preferred stock to receive notice, (i) by mailing or delivery by electronic means or (ii) in such other manner and by such other means as are specified in the terms of such preferred stock, a notice of such special meeting to such holders, such meeting to be held not less than 10 nor more than 30 calendar days after the date of the delivery by electronic means or mailing of such notice. If we fail to call such a special meeting, it may be called at our expense by any such holder on like notice. The record date for determining the holders of shares of preferred stock entitled to notice of and to vote at such special meeting shall be the close of business on the business day preceding the calendar day on which such notice is mailed. At any such special meeting and at each meeting of holders of shares of preferred stock held during a Voting Period at which directors are to be elected, such holders, voting together as a class (to the exclusion of the holders of all our other securities and classes of capital stock), will be entitled to elect the number of New Preferred Directors prescribed above on a one-vote-per-share basis.
Except as otherwise permitted by the terms of the certificate of designation, (1) so long as any shares of preferred stock are outstanding, we will not, without the affirmative vote or consent of the holders of at least two-thirds of all outstanding shares of preferred stock, voting as a separate class, amend, alter or repeal the provisions of our certificate of incorporation or any applicable certificates of designation (or any other document governing the rights of our preferred stock or the holders thereof as may be required by the rules of any applicable securities exchange), whether by merger, consolidation or otherwise, so as to materially and adversely affect any preference, right or power of our preferred stock or the holders thereof and (2) so long as any shares of the Series B Term Preferred Stock are outstanding, we will not, without the affirmative vote or consent of the holders of at least two-thirds of all outstanding shares of the Series B Term Preferred Stock, voting as a separate class, amend, alter or repeal the provisions of our certificate of incorporation or the applicable certificate of designation (or any other document governing the rights of the Series B Term Preferred Stock or the holders thereof as may be required by the rules of any applicable securities exchange), whether by merger, consolidation or otherwise, so as to materially and adversely affect any preference, right or power of the Series B Term Preferred Stock or the holders thereof differently from shares of any other outstanding series of our preferred stock; provided, however, that (i) a change in our capitalization as described under the heading “— Issuance of Additional Preferred Stock” below will not be considered to materially and adversely affect the rights and preferences of any holder of our preferred stock, and (ii) a division of a share of preferred stock will be deemed to affect such preferences, rights or powers only if the terms of such division materially and adversely affect the holders of such preferred stock. No matter will be deemed to adversely affect any preference, right or power of a share of preferred stock, including the Series B Term Preferred Stock or the holders of Series B Term Preferred Stock, unless such matter (i) alters or abolishes any preferential right of such share of preferred stock, or (ii) creates, alters or abolishes any right in respect of redemption of the preferred stock or the applicable series thereof (other than as a result of a division of a share of preferred stock). So long as any shares of preferred stock are outstanding, we will not, without the affirmative vote or
S-33
consent of the holders of at least two-thirds of the shares of the preferred stock outstanding at the time, voting as a separate class, file a voluntary application for relief under federal bankruptcy law or any similar application under state law for so long as we are solvent and does not foresee becoming insolvent.
The affirmative vote of the holders of at least a “majority of the shares of our preferred stock,” including the shares of the Series A Term Preferred Stock and Series B Term Preferred Stock outstanding at the time, voting as a separate class, will be required (i) to approve any action requiring a vote of our security holders pursuant to Section 13(a) of the 1940 Act, or (ii) to approve any plan of “reorganization” (as such term is defined in Section 2(a)(33) of the 1940 Act) adversely affecting such shares of preferred stock. For purposes of the foregoing, the vote of a “majority of the outstanding shares of preferred stock” means the vote at an annual or special meeting duly called (a) of 67% or more of such shares present at a meeting, if the holders of more than 50% of such outstanding shares are present or represented by proxy at such meeting, or (b) of more than 50% of such outstanding shares, whichever is less.
For purposes of determining any rights of the holders of Series B Term Preferred Stock to vote on any matter, whether such right is created by our certificate of incorporation, by the provisions of the certificate of designation for the Series B Term Preferred Stock, by statute or otherwise, no holder of the Series B Term Preferred Stock will be entitled to vote any shares of the Series B Term Preferred Stock and no share of the Series B Term Preferred Stock will be deemed to be “outstanding” for the purpose of voting or determining the number of shares required to constitute a quorum if, prior to or concurrently with the time of determination of shares entitled to vote or the time of the actual vote on the matter, as the case may be, the requisite Notice of Redemption with respect to such share of Series B Term Preferred Stock will have been given in accordance with the certificate of designation, and the price for the redemption of such shares of Series B Term Preferred Stock will have been irrevocably deposited with the Redemption and Paying Agent for that purpose. No shares of Series B Term Preferred Stock held by us will have any voting rights or be deemed to be outstanding for voting or for calculating the voting percentage required on any other matter or other purposes.
Unless otherwise required by law or our certificate of incorporation, holders of the Series B Term Preferred Stock will not have any relative rights or preferences or other special rights with respect to voting other than those specifically set forth in the certificate of designation for the Series B Term Preferred Stock. The holders of shares of Series B Term Preferred Stock will have no rights to cumulative voting. In the event that we fail to declare or pay any dividends on shares of the Series B Term Preferred Stock, the exclusive remedy of the holders will be the right to vote for additional directors as discussed above; provided that the foregoing does not affect our obligation to accumulate and, if permitted by applicable law and the certificate of designation for the Series B Term Preferred Stock, pay dividends at the Series B Default Rate as discussed above.
Issuance of Additional Preferred Stock
So long as any shares of Series B Term Preferred Stock are outstanding, we may, without the vote or consent of the holders thereof, authorize, establish and create and issue and sell shares of one or more series of a class of our senior securities representing stock under Section 18 of the 1940 Act, ranking on parity with the Series B Term Preferred Stock as to payment of dividends and distribution of assets upon dissolution, liquidation or the winding up of our affairs, including additional series of preferred stock, and authorize, issue and sell additional shares of any such series of preferred stock then outstanding or so established and created, in each case in accordance with applicable law, provided that we will, immediately after giving effect to the issuance of such additional preferred stock and to its receipt and application of the proceeds thereof, including to the redemption of preferred stock with such proceeds, have asset coverage of at least 200%.
Actions on Other than Business Days
Unless otherwise provided in the certificate of designation for the Series B Term Preferred Stock, if the date for making any payment, performing any act or exercising any right is not a business day (i.e., a calendar day on which the NYSE is open for trading), such payment will be made, act performed or right exercised on the next succeeding business day, with the same force and effect as if made or done on the nominal date provided therefor, and, with respect to any payment so made, no dividends, interest or other amount will accrue for the period between such nominal date and the date of payment.
S-34
Modification
Without the consent of any holders of the Series B Term Preferred Stock, our board of directors may amend or modify these terms of the Series B Term Preferred Stock to cure any ambiguity, correct or supplement any provision herein which may be inconsistent with any other provision in our certificate of incorporation or make any other provisions with respect to matters or questions arising under these terms of the Series B Term Preferred Stock that are not inconsistent with the provisions in our certificate of incorporation.
S-35
PLAN OF DISTRIBUTION
We have entered into the Sales Agreement with B. Riley, acting as our placement agent. Pursuant to the Sales Agreement, we may at any time and from time to time offer and sell shares of our common stock, Series A Term Preferred Stock, and Series B Term Preferred Stock.
Upon written instructions from us, the placement agent will use its commercially reasonable efforts consistent with its normal sales and trading practices to sell, as our placement agent, our common stock, Series A Term Preferred Stock, and Series B Term Preferred Stock under the terms and subject to the conditions set forth in the Sales Agreement and our instructions. We will instruct the placement agent as to the amount of common stock, Series A Term Preferred Stock, or Series B Term Preferred Stock to be sold by it and the minimum price below which sales of common stock, Series A Term Preferred Stock, or Series B Term Preferred Stock may not be made. We may instruct the placement agent not to sell common stock, Series A Term Preferred Stock, or Series B Term Preferred Stock if the sales cannot be effected at or above the price designated by us in any instruction, or for any other reason. The sales price per share of our common stock offered by this prospectus supplement and the accompanying prospectus, less commissions payable under the Sales Agreement and discounts, if any, will not be less than the net asset value per share of our common stock at the time of such sale. We or the placement agent may suspend the offering of shares of our common stock, Series A Term Preferred Stock, or Series B Term Preferred Stock upon proper notice and subject to other conditions.
Sales of our common stock, Series A Term Preferred Stock, and Series B Term Preferred Stock, if any, under this prospectus supplement and the accompanying prospectus may be made by any method that is deemed to be an “at the market offering,” as defined in Rule 415 under the Securities Act. The placement agent will provide written confirmation of a sale to us no later than the opening of the trading day on the NYSE following each trading day in which shares of our common stock, Series A Term Preferred Stock, or Series B Term Preferred Stock are sold under the Sales Agreement. Each confirmation will include the number of shares of common stock, Series A Term Preferred Stock, or Series B Term Preferred Stock sold on the preceding day, the net proceeds to us and the commission payable by us to the placement agent, in connection with the sales.
The placement agent will receive a commission from us equal to up to 2.0% of the gross sales price of any shares of our common stock, Series A Term Preferred Stock, or Series B Term Preferred Stock sold through it under the Sales Agreement. We have agreed to reimburse fees and expenses of counsel of the placement agent up to $75,000 for entering into the Sales Agreement (inclusive of expenses paid in connection with entering into the Third Amended and Restated At Market Issuance Sales Agreement, dated as of August 21, 2023, by and among the Company, the Adviser, the Administrator, and B. Riley, and the At Market Issuance Sales Agreement, dated as of November 22, 2019 and amended on June 1, 2020 and June 29, 2023, by and among the Company, the Adviser, the Administrator, B. Riley, and National Securities Corporation) and up to $3,750 per calendar quarter during the term of the Sales Agreement for fees and expense of counsel to the placement agent incurred in connection with quarterly updates for this offering. We estimate that the total expenses for the offering, excluding commission and reimbursements payable to the placement agent under the terms of the Sales Agreement, will be approximately $245,750.
Unless otherwise specified in our instructions, settlement for sales of shares of common stock, Series A Term Preferred Stock, and Series B Term Preferred Stock will occur on the second trading day (or such shorter settlement cycle as may be in effect under Rule 15c6-1 under the Securities Exchange Act of 1934, as amended (the “Exchange Act”) from time to time) following the date on which such sales are made, in return for payment of the net proceeds to us. There is no arrangement for funds to be received in an escrow, trust or similar arrangement. We will disclose, through our annual report, semi-annual report and quarterly report, as applicable, at least quarterly, the number of shares of our common stock, Series A Term Preferred Stock, and Series B Term Preferred Stock sold through the placement agent under the Sales Agreement and the net proceeds to us.
In connection with the sale of the common stock, Series A Term Preferred Stock, and Series B Term Preferred Stock on our behalf, the placement agent will be deemed to be an “underwriter” within the meaning of the Securities Act, and the commission of the placement agent will be deemed to be underwriting
S-36
commissions or discounts. We have agreed to provide indemnification and contribution to the placement agent against certain civil liabilities, including liabilities under the Securities Act.
The offering of our shares of common stock, Series A Term Preferred Stock, and Series B Term Preferred Stock pursuant to the Sales Agreement will terminate upon the earlier of (i) the sale of all the shares of common stock, Series A Term Preferred Stock, and Series B Term Preferred Stock registered under the registration statement of which this prospectus supplement forms a part or (ii) the termination of the Sales Agreement as permitted therein.
The placement agent and its affiliates have provided and may in the future provide various investment banking and advisory services to us from time to time for which they have received, and are expected to receive, customary fees and expenses.
The principal business address of the placement agent is: B. Riley Securities, Inc., 299 Park Avenue, 21st Floor, New York, NY 10171.
S-37
LEGAL MATTERS
Certain legal matters in connection with the common stock, Series A Term Preferred Stock, and Series B Term Preferred Stock will be passed upon for us by Dechert LLP, One International Place, 40th Floor, 100 Oliver Street, Boston, Massachusetts, and for the placement agent by Duane Morris LLP, 1540 Broadway, New York, NY 10036.
INDEPENDENT REGISTERED PUBLIC ACCOUNTING FIRM
KPMG LLP, an independent registered public accounting firm located at 345 Park Avenue, New York, New York 10154, provides audit services, tax return preparation, and assistance and consultation with respect to the preparation of filings with the SEC.
ADDITIONAL INFORMATION
This prospectus supplement and the accompanying prospectus constitute part of a registration statement on Form N-2 that we have filed with the SEC, together with any and all amendments and related exhibits under the Securities Act. This prospectus supplement and the accompanying prospectus do not contain all of the information set forth in the registration statement, some of which is contained in exhibits filed as part of, or incorporated by reference into, the registration statement as permitted by the rules and regulations of the SEC. For further information with respect to us and the securities we are offering under this prospectus supplement and the accompanying prospectus, we refer you to the registration statement, including the exhibits filed as a part of, or incorporated by reference into, the registration statement. Statements contained in this prospectus supplement and the accompanying prospectus concerning the contents of any contract or any other document are not necessarily complete. If a contract or other document has been filed as an exhibit to the registration statement or otherwise incorporated by reference as an exhibit thereto, please see the copy of the contract or document that has been filed or incorporated by reference. Each statement in this prospectus supplement and the accompanying prospectus relating to a contract or document filed or incorporated by reference as an exhibit is qualified in all respects by such exhibit.
We file with or submit to the SEC annual and semi-annual reports, proxy statements and other information meeting the informational requirements of the Exchange Act. The SEC maintains a website that contains reports, proxy and information statements and other information we file with the SEC at www.sec.gov. Information contained on our website is not incorporated into this prospectus supplement or the accompanying prospectus and you should not consider such information to be part of this prospectus supplement or the accompanying prospectus. This information is available free of charge by writing us at Eagle Point Income Company Inc., 600 Steamboat Road, Suite 202, Greenwich, CT 06830, Attention: Investor Relations, by telephone at (844) 810-6501, or on our website at www.eaglepointincome.com. Information on our website is not incorporated by reference into or a part of this prospectus supplement or the accompanying prospectus.
INCORPORATION BY REFERENCE
We incorporate by reference in this prospectus supplement the documents listed below and any future reports and other documents we file with the SEC pursuant to Sections 13(a), 13(c), 14 or 15(d) of the Exchange Act or pursuant to Rule 30b2-1 under the 1940 Act, until all of the securities offered by this prospectus supplement have been sold or we otherwise terminate the offering of these securities (such reports and other documents deemed to be incorporated by reference into this prospectus supplement and to be part hereof from the date of filing of such reports and other documents). To obtain copies of these filings, see “Additional Information.”
•
our Annual Report on Form N-CSR for the fiscal year ended December 31, 2023, as amended, filed with the SEC on February 22, 2023;
•
our Definitive Proxy Statement on Schedule 14A for the annual meeting of the stockholders, filed with the SEC on April 12, 2023;
•
our Interim Report filed pursuant to Rule 30b2-1 under the 1940 Act, for the quarter ended March 31, 2023, filed with the SEC on May 23, 2023;
•
our Current Report on Form 8-K filed with the SEC on July 26, 2023; and
•
our Semi-Annual Report on Form N-CSRS filed with the SEC on August 15, 2023.
S-38
APPENDIX A
CERTIFICATE OF DESIGNATION
OF
5.00% SERIES A TERM PREFERRED STOCK DUE 2026
OF
EAGLE POINT INCOME COMPANY INC.
OF
5.00% SERIES A TERM PREFERRED STOCK DUE 2026
OF
EAGLE POINT INCOME COMPANY INC.
Pursuant to Section 151 of the
General Corporation Law of the State of Delaware
General Corporation Law of the State of Delaware
Eagle Point Income Company Inc., a corporation organized and existing under the laws of the State of Delaware (the “Corporation”), certifies that pursuant to the authority contained in its certificate of incorporation (the “Certificate of Incorporation”), and in accordance with the provisions of Section 151 of the General Corporation Law of the State of Delaware (the “DGCL”), the Board of Directors of the Corporation (the “Board of Directors,” which term as used herein shall include any duly authorized committee of the Board of Directors) has duly approved and adopted the following resolution on August 10, 2021:
RESOLVED, that pursuant to the authority vested in the Board of Directors by the Certificate of Incorporation and as set forth in Section 151 of the DGCL, the Board of Directors does hereby approve the designation of 1,600,000 authorized but unissued shares of preferred stock, par value $0.001 per share, without designation as to series as 5.00% Series A Term Preferred Stock due 2026 (the “Series A Term Preferred Stock”), having the designations, preferences, relative, participating, optional and other special rights and the qualifications, limitations and restrictions thereof that are set forth in the Certificate of Incorporation and in this resolution as follows:
ARTICLE I
NUMBER OF SHARES; RANKING
NUMBER OF SHARES; RANKING
1.1. A series of 1,600,000 shares of the preferred stock, par value $0.001 per share, authorized by the Certificate of Incorporation are hereby designated as the Series A Term Preferred Stock. Each share of Series A Term Preferred Stock shall have such preferences, voting powers, restrictions, limitations as to dividends and distributions, qualifications and terms and conditions of redemption, in addition to those required by applicable law and those that are expressly set forth in the Certificate of Incorporation, as are set forth in this Certificate of Designation. The Series A Term Preferred Stock shall constitute a separate series of Capital Stock (as defined below) and each share of Series A Term Preferred Stock shall be identical. No fractional shares of Series A Term Preferred Stock shall be issued.
1.2. The Series A Term Preferred Stock shall rank on parity with any other shares of Capital Stock hereafter authorized and issued by the Corporation of a class having priority over any other class as to distribution of assets or payments of dividends (the “Preferred Stock”) as to the payment of dividends and as to the distribution of assets upon dissolution, liquidation or winding up of the affairs of the Corporation. The Series A Term Preferred Stock shall have preference with respect to the payment of dividends and as to distribution of assets upon dissolution, liquidation or winding up of the affairs of the Corporation over the shares of common stock, par value $0.001 per share (the “Common Stock” and, together with the Preferred Stock, the “Capital Stock”), of the Corporation as set forth herein.
1.3. No individual, partnership, trust, corporation, limited liability company, unincorporated association, joint venture or other entity, or government or any agency or political subdivision thereof (each, a “Person”) in whose name the Series A Term Preferred Stock or any other security issued by the Corporation is registered in the registration books of the Corporation maintained by American Stock Transfer & Trust Company, LLC and its successors, or any other redemption and paying agent appointed by the Corporation with respect to the Series A Term Preferred Stock (the “Redemption and Paying Agent”) or otherwise (such Person, a “Holder”), shall have, solely by reason of being such a Holder, any preemptive or other right to acquire, purchase or subscribe for any shares of Series A Term Preferred Stock, shares of other Preferred Stock, shares of Common Stock or other securities of the Corporation that it may hereafter issue or sell.
SA-1
ARTICLE II
DIVIDENDS AND DISTRIBUTIONS
DIVIDENDS AND DISTRIBUTIONS
2.1. The Holders of shares of Series A Term Preferred Stock shall be entitled to receive, when, as and if declared by, or under authority granted by, the Board of Directors, out of funds legally available therefor and in preference to dividends and distributions on the Common Stock, cumulative cash dividends and distributions on each share of Series A Term Preferred Stock, calculated separately for each Dividend Period (as defined below) at, as of any date, 5.00% per annum (the “Fixed Dividend Rate”) as adjusted, if a Default Period (as defined below) shall be in existence on such date, in accordance with the provisions of Section 2.8 (the “Dividend Rate”) in effect from time to time for the Series A Term Preferred Stock during such Dividend Period, computed on the basis of a 360-day year consisting of twelve 30-day months, on an amount equal to $25.00 (the “Liquidation Preference”) for each share of the Series A Term Preferred Stock, and no more. In the case of each share of Series A Term Preferred Stock issued on October 22, 2021 (the “Date of Original Issue”), dividends and distributions on such shares of Series A Term Preferred Stock shall accumulate from the Date of Original Issue. In the case of a share of Series A Term Preferred Stock issued on a date subsequent to the Date of Original Issue, (a) if such share is issued before the Record Date (as defined below) for the Dividend Period in which such share is issued, dividends and distributions on such share of Series A Term Preferred Stock shall accumulate from the first day of such Dividend Period and (b) if such share is issued after the Record Date for the Dividend Period in which such share is issued, dividends and distributions on such share of Series A Term Preferred Stock shall accumulate from the first day of the Dividend Period immediately following the issuance of such share. Dividends and distributions on all shares of Series A Term Preferred Stock shall be payable monthly in arrears as provided in Section 2.2. The amount of dividends payable on shares of the Series A Term Preferred Stock on any date prior to the end of a Dividend Period, and for the initial Dividend Period, will be computed on the basis of actual days elapsed over a 30-day month.
“Dividend Period” means, with respect to each share of Series A Term Preferred Stock then Outstanding (as defined below), in the case of the first Dividend Period, the period beginning on and including the Date of Original Issue and ending on, but excluding November 30, 2021 and, for each subsequent Dividend Period, the period beginning on and including the last Dividend Payment Date (as defined below) and ending on, but excluding, the next Dividend Payment Date or the stated maturity date, as the case may be.
2.2. Declaration and Payment; Dividends in Arrears.
(a) Dividends on shares of the Series A Term Preferred Stock with respect to any Dividend Period shall be declared to the Holders of record of such shares as their names shall appear on the registration books of the Corporation at the close of business on the applicable record date, which shall be such date designated by the Board of Directors that is not more than twenty (20) nor less than seven (7) calendar days prior to the Dividend Payment Date with respect to such Dividend Period (each, a “Record Date”).
(b) Dividends declared pursuant to Section 2.1 shall be paid on the last day of every calendar month, beginning November 30, 2021 (each, a “Dividend Payment Date”) to the Holders of shares of Series A Term Preferred Stock as their names appear on the registration books of the Corporation at the close of business on the applicable Record Date for such dividend; provided, however, that dividends with respect to the first Dividend Period of the Series A Term Preferred Stock will be paid on November 30, 2021 to Holders of record of such Series A Term Preferred Stock as their names appear on the registration books of the Corporation at the close of business on November 10, 2021. If a Dividend Payment Date falls on a non-Business Day (as defined below), the applicable dividend payment will be made on the next Business Day and no additional dividend payment will accrue as a result of such delayed payment.
(c) Dividends in arrears on shares of Series A Term Preferred Stock for any past Dividend Period may be declared and paid at any time, without reference to any regular Dividend Payment Date, to the Holders of such shares as their names appear on the registration books of the Corporation on the applicable Record Date. No interest or sum of money in lieu of interest will be payable in respect of any dividend payment or payments on shares of Series A Term Preferred Stock which may be in arrears.
2.3. No full dividends and distributions shall be declared or paid on shares of the Series A Term Preferred Stock for any Dividend Period or part thereof unless full cumulative dividends and distributions
SA-2
due through the most recent Dividend Payment Dates therefor for all Outstanding shares of Preferred Stock have been or contemporaneously are declared and paid through the most recent Dividend Payment Dates therefor. If full cumulative dividends and distributions due have not been declared and paid on all Outstanding shares of Preferred Stock, any dividends and distributions being declared and paid on the Series A Term Preferred Stock will be declared and paid as nearly pro rata as possible in proportion to the respective amounts of dividends and distributions accumulated but unpaid on each such series of Preferred Stock on the relevant dividend payment date for such series. No Holders of shares of Series A Term Preferred Stock shall be entitled to any dividends and distributions, whether payable in cash, property or shares, in excess of full cumulative dividends and distributions as provided in this Section 2.3 on the Series A Term Preferred Stock.
2.4. For so long as any shares of Series A Term Preferred Stock are Outstanding, the Corporation shall not: (x) declare any dividend or other distribution (other than a dividend or distribution paid in shares of Common Stock) in respect of the Common Stock, (y) call for redemption, redeem, purchase or otherwise acquire for consideration any Common Stock, or (z) pay any proceeds of the liquidation of the Corporation in respect of the Common Stock, unless, in each case,
(a) immediately thereafter, the Corporation shall have “asset coverage,” as defined for purposes of Section 18(h) of the Investment Company Act of 1940, as amended, or any successor statute (the “1940 Act”), of at least 200% with respect to all Outstanding senior securities which are stock of the Corporation, including all Outstanding shares of Series A Term Preferred Stock (or such other percentage as may in the future be specified in the 1940 Act or by rule, regulation or order of the Securities and Exchange Commission (the “SEC”) as the minimum asset coverage for senior securities which are stock of a closed-end registered investment company), after deducting the amount of such dividend or distribution or redemption or purchase price or liquidation proceeds;
(b) all cumulative dividends and distributions on all shares of Preferred Stock due on or prior to the date of the applicable dividend, distribution, redemption, purchase or acquisition shall have been either (i) declared and paid or (ii) declared and Deposit Securities (as defined below) or sufficient funds (in accordance with the terms of such Preferred Stock) for the payment thereof shall have been deposited irrevocably with the paying agent for such Preferred Stock; and
(c) the Corporation shall have deposited Deposit Securities pursuant to and in accordance with the requirements of Section 5.4 hereof with respect to Outstanding shares of Series A Term Preferred Stock to be redeemed pursuant to Section 5.1 or Section 5.2 hereof for which a Notice of Redemption (as defined below) shall have been given or shall have been required to be given in accordance with the terms hereof on or prior to the date of the applicable dividend, distribution, redemption, purchase or acquisition.
“Outstanding” means, as of any date with respect to a series of Preferred Stock, the number of shares of such series of Preferred Stock theretofore issued by the Corporation except (without duplication): (A) any shares of the applicable series of Preferred Stock theretofore cancelled or redeemed or delivered to the Redemption and Paying Agent for cancellation or redemption in accordance with the terms hereof; (B) any shares of the applicable series of Preferred Stock as to which the Corporation shall have given a Notice of Redemption and irrevocably deposited with the Redemption and Paying Agent sufficient Deposit Securities to redeem such shares in accordance with ARTICLE V hereof; and (C) any shares of the applicable series of Preferred Stock as to which the Corporation shall be the Holder or the beneficial owner.
“Deposit Securities” means, as of any date, any U.S. dollar-denominated security or other investment of a type described below that either (i) is a demand obligation payable to the holder thereof on any Business Day or (ii) has a maturity date, mandatory redemption date or mandatory payment date, on its face or at the option of the holder, preceding the relevant Redemption Date (as defined below), Dividend Payment Date or other payment date in respect of which such security or other investment has been deposited or set aside as a Deposit Security: (A) cash or any cash equivalent; (B) any U.S. Government Obligation (as defined below); (C) any Short-Term Money Market Instrument (as defined below); (D) any investment in any money market fund registered under the 1940 Act that qualifies under Rule 2a-7 under the 1940 Act, or similar investment vehicle described in Rule 12d1-1(b)(2) under the 1940 Act, that invests principally in Short-Term Money Market Instruments or U.S. Government Obligations or any combination thereof; or (E) any letter of credit from a bank or other financial institution that has a credit rating from at least one nationally recognized
SA-3
statistical rating organization that is the highest applicable rating generally ascribed by such rating agency to bank deposits or short-term debt of similar banks or other financial institutions as of the date of this Certificate of Designation (or such rating’s future equivalent).
“Short-Term Money Market Instruments” means the following types of instruments if, on the date of purchase or other acquisition thereof by the Corporation, the remaining term to maturity thereof is not in excess of 180 days: (i) commercial paper rated A-1, if such commercial paper matures within 30 days, or A-1+, if such commercial paper matures in over 30 days; (ii) demand or time deposits in, and bankers’ acceptances and certificates of deposit of (A) a depository institution or trust company incorporated under the laws of the United States of America or any state thereof or the District of Columbia or (B) a U.S. branch office or agency of a foreign depository institution (provided that such branch office or agency is subject to banking regulation under the laws of the United States, any state thereof or the District of Columbia); and (iii) overnight funds.
“U.S. Government Obligations” means direct obligations of the United States or of its agencies or instrumentalities that are entitled to the full faith and credit of the United States and that, other than U.S. treasury bills, provide for the periodic payment of interest and the full payment of principal at maturity or call for redemption.
2.5. Any dividend payment made on shares of Series A Term Preferred Stock shall first be credited against the dividends and distributions accumulated with respect to the earliest Dividend Period for which dividends and distributions have not been paid.
2.6. Not later than 12:00 noon, New York City time, on a Dividend Payment Date, the Corporation shall deposit with the Redemption and Paying Agent Deposit Securities having an aggregate Market Value (as defined below) on such date sufficient to pay the dividends and distributions that are payable on such Dividend Payment Date. The Corporation may direct the Redemption and Paying Agent with respect to the investment or reinvestment of any such Deposit Securities prior to the Dividend Payment Date, provided, that such investment consists exclusively of Deposit Securities and provided, further, that the proceeds of any such investment will be available as same day funds at the opening of business on such Dividend Payment Date.
“Market Value” of any asset means, for securities for which market quotations are readily available, the market value thereof determined by an independent third-party pricing service designated from time to time by the Board of Directors. Market Value of any asset shall include any interest accrued thereon. The pricing service values portfolio securities at the mean between the quoted bid and asked price or the yield equivalent when quotations are readily available. Securities for which quotations are not readily available are valued at fair value as determined by the pricing service using methods that include consideration of: yields or prices of securities of comparable quality, type of issue, coupon, maturity and rating, indications as to value from dealers and general market conditions. The pricing service may employ electronic data processing techniques or a matrix system, or both, to determine recommended valuations.
2.7. All Deposit Securities paid to the Redemption and Paying Agent for the payment of dividends payable on the Series A Term Preferred Stock shall be held in trust for the payment of such dividends by the Redemption and Paying Agent for the benefit of the Holders entitled to the payment of such dividends pursuant to Section 2.2. Any moneys paid to the Redemption and Paying Agent in accordance with the foregoing but not applied by the Redemption and Paying Agent to the payment of dividends, including interest earned on such moneys while so held, will, to the extent permitted by law, be repaid to the Corporation as soon as possible after the date on which such moneys were to have been so applied, upon request of the Corporation.
2.8. Dividend Default.
(a) The Dividend Rate on the Series A Term Preferred Stock shall be adjusted, for any calendar day, to the Fixed Dividend Rate plus two percent (2%) per annum (the “Default Rate”) in the following circumstances. Subject to the cure provisions below, a “Default Period” with respect to the Series A Term Preferred Stock shall commence on any date the Corporation fails to deposit with the Redemption and Paying Agent by 12:00 noon, New York City time, on (A) a Dividend Payment Date, Deposit Securities that will provide funds available to the Redemption and Paying Agent on such Dividend Payment Date sufficient to pay the full amount of any dividend payable on such Dividend Payment Date (a “Dividend
SA-4
Default”) or (B) an applicable Redemption Date, Deposit Securities that will provide funds available to the Redemption and Paying Agent on such Redemption Date sufficient to pay the full amount of the Liquidation Preference for the shares of the Series A Term Preferred Stock, plus an amount equal to all unpaid dividends and distributions on such shares accumulated to (but excluding) the date fixed for such distribution or payment on such shares (whether or not earned or declared by the Corporation, but excluding interest thereon) (such amount, the “Redemption Price”), payable in respect of such series on such Redemption Date (a “Redemption Default” and together with a Dividend Default, hereinafter referred to as “Default”). Subject to the cure provisions of Section 2.8(b) below, a Default Period with respect to a Default on the Series A Term Preferred Stock shall end on the calendar day on which the New York Stock Exchange is open for trading (each such day, a “Business Day”) on which, by 12:00 noon, New York City time, an amount equal to all unpaid dividends and any unpaid Redemption Price shall have been deposited irrevocably in trust in same day funds with the Redemption and Paying Agent. The Dividend Rate on the Series A Term Preferred Stock for each calendar day during the Default Period will be equal to the Default Rate.
(b) No Default Period for the Series A Term Preferred Stock with respect to any Default on the Series A Term Preferred Stock shall be deemed to commence if the amount of any dividend or any Redemption Price due in respect of the Series A Term Preferred Stock (if such Default is not solely due to the willful failure of the Corporation) is deposited irrevocably in trust, in same-day funds, with the Redemption and Paying Agent by 12:00 noon, New York City time, on a Business Day that is not later than three (3) Business Days after the applicable Dividend Payment Date or Redemption Date with respect to which such Default occurred, together with an amount equal to the Default Rate applied to the amount and period of such non-payment based on the actual number of calendar days comprising such period divided by three hundred and sixty (360).
ARTICLE III
LIQUIDATION RIGHTS
LIQUIDATION RIGHTS
3.1. In the event of any liquidation, dissolution or winding up of the affairs of the Corporation, whether voluntary or involuntary, the Holders of shares of Series A Term Preferred Stock shall be entitled to receive out of the assets of the Corporation available for distribution to stockholders, after satisfying claims of creditors but before any distribution or payment shall be made in respect of the Common Stock, a liquidation distribution of the Redemption Price, and such Holders shall be entitled to no further participation in any distribution or payment in connection with any such liquidation, dissolution or winding up.
3.2. If, upon any liquidation, dissolution or winding up of the affairs of the Corporation, whether voluntary or involuntary, the assets of the Corporation available for distribution among the Holders of all Outstanding shares of Series A Term Preferred Stock and any other Outstanding shares of Preferred Stock shall be insufficient to permit the payment in full to such Holders of the Redemption Price as provided in Section 3.1 above and the amounts due upon liquidation with respect to such other Preferred Stock, then such available assets shall be distributed among the Holders of such shares of Series A Term Preferred Stock and such other Preferred Stock ratably in proportion to the respective preferential liquidation amounts to which they are entitled. In connection with any liquidation, dissolution or winding up of the affairs of the Corporation, whether voluntary or involuntary, unless and until the Redemption Price, as provided in Section 3.1 above has been paid in full to the Holders of such shares, no dividends, distributions or other payments will be made on, and no redemption, purchase or other acquisition by the Corporation will be made by the Corporation in respect of, shares of the Common Stock.
3.3. Neither the sale of all or substantially all of the property or business of the Corporation, nor the merger, consolidation or reorganization of the Corporation into or with any other business or statutory trust, corporation or other entity, nor the merger, consolidation or reorganization of any other business or statutory trust, corporation or other entity into or with the Corporation shall be a dissolution, liquidation or winding up, whether voluntary or involuntary, for the purpose of this ARTICLE III.
ARTICLE IV
ASSET COVERAGE TEST
ASSET COVERAGE TEST
4.1. Asset Coverage Requirement. For so long as any shares of Series A Term Preferred Stock are Outstanding, the Corporation shall have “asset coverage” of a class of senior security which is stock, as
SA-5
defined for purposes of Section 18(h) of the 1940 Act as in effect on the date hereof (“Asset Coverage”), of at least 200% as of the close of business on the last Business Day of any of the three month periods ending March 31, June 30, September 30 or December 31 of each year (each, a “Calendar Quarter”). If the Corporation shall fail to maintain such Asset Coverage as of any time as of which such compliance is required to be determined as aforesaid, the provisions of Section 5.2(a) shall be applicable, which provisions shall constitute the sole remedy for the Corporation’s failure to comply with the provisions of this Section 4.1.
4.2. Calculation of Asset Coverage. For purposes of determining whether the requirements of Section 4.1 are satisfied, (i) no shares of Series A Term Preferred Stock or other Preferred Stock shall be deemed to be Outstanding for purposes of any computation required by Section 4.1 if, prior to or concurrently with such determination, either (x) sufficient Deposit Securities or other sufficient funds (in accordance with the terms of the Series A Term Preferred Stock or other Preferred Stock) to pay the full Redemption Price for the Series A Term Preferred Stock or other Preferred Stock (or the portion thereof to be redeemed) shall have been deposited in trust with the paying agent for the Series A Term Preferred Stock or other Preferred Stock and the requisite notice of redemption for the Series A Term Preferred Stock or other Preferred Stock (or the portion thereof to be redeemed) shall have been given or (y) sufficient Deposit Securities or other sufficient funds (in accordance with the terms of the Series A Term Preferred Stock or other Preferred Stock) to pay the full Redemption Price for the Series A Term Preferred Stock or other Preferred Stock (or the portion thereof to be redeemed) shall have been segregated by a bank, as defined in Section 2(a)(5) of the 1940 Act, that has the qualifications prescribed in Section 26(a)(1) of the 1940 Act, or such other entity as shall be then providing custodian services to the Corporation as permitted by the 1940 Act or any rule, regulation, or order thereunder (the “Custodian,” which shall include any similarly qualified sub-custodian duly appointed by the Custodian) and the Corporation from the assets of the Corporation, by means of appropriate identification on the Custodian’s books and records or otherwise in accordance with the Custodian’s normal procedures, and (ii) the Deposit Securities or other sufficient funds that shall have been deposited with the applicable paying agent and/or segregated by the Custodian, as applicable, as provided in clause (i) of this sentence shall not be included as assets of the Corporation for purposes of such computation.
ARTICLE V
REDEMPTION
REDEMPTION
Shares of Series A Term Preferred Stock shall be subject to redemption by the Corporation as provided below:
5.1. Term Redemption. The Corporation shall redeem all shares of Series A Term Preferred Stock on October 30, 2026 (the “Term Redemption Date”) at a price per share equal to the Redemption Price.
5.2. Asset Coverage Mandatory Redemption.
(a) If the Corporation fails to comply with the Asset Coverage requirement as provided in Section 4.1 as of the last Business Day of any Calendar Quarter and such failure is not cured as of the date that is thirty (30) calendar days following the date of filing of the Corporation’s Annual Report on Form N-CSR, Semiannual Report on Form N-CSRS or Reports on Form N-PORT, as applicable (each, an “SEC Report”) with the SEC with respect to such Calendar Quarter (such Business Day, the “Asset Coverage Cure Date”), the Corporation shall, to the extent permitted by the 1940 Act and Delaware law, by the close of business on such Asset Coverage Cure Date, fix a redemption date and proceed to redeem in accordance with the terms of such Preferred Stock, a sufficient number of shares of Preferred Stock, which at the Corporation’s sole option (to the extent permitted by the 1940 Act and Delaware law) may include any number or proportion of the shares of Series A Term Preferred Stock, to enable it to meet the requirements of Section 5.2(b). In the event that any shares of Series A Term Preferred Stock then Outstanding are to be redeemed pursuant to this Section 5.2(a), the Corporation shall redeem such shares at a price per share equal to the Redemption Price.
(b) On the redemption date for a redemption contemplated by Section 5.2(a), the Corporation shall redeem, out of funds legally available therefor, (x) such number of shares of Preferred Stock (which may include at the sole option of the Corporation any number or proportion of the shares of Series A Term Preferred Stock) that, when combined with any debt securities redeemed for failure to maintain the asset coverage required by the indenture governing such securities, the redemption of which, if deemed to
SA-6
have occurred immediately prior to the opening of business on the Asset Coverage Cure Date, would result in the Corporation having Asset Coverage on such Asset Coverage Cure Date of at least 200% (provided, however, that if there is no such minimum number of shares of Series A Term Preferred Stock and other shares of Preferred Stock the redemption or retirement of which would have such result, all shares of Series A Term Preferred Stock and other shares of Preferred Stock then Outstanding shall be redeemed), or (y) if fewer, the maximum number of shares of Preferred Stock that can be redeemed out of funds expected to be legally available therefor in accordance with the Certificate of Incorporation and applicable law, provided, further, that in connection with redemption for failure to maintain such Asset Coverage requirement, the Corporation may at its sole option, but is not required to, redeem a sufficient number of shares of Series A Term Preferred Stock pursuant to this Section 5.2 that, when aggregated with other shares of Preferred Stock redeemed by the Corporation, would result, if deemed to have occurred immediately prior to the opening of business on the Asset Coverage Cure Date, in the Corporation having Asset Coverage on such Asset Coverage Cure Date of up to and including 285%. The Corporation shall effect such redemption on the date fixed by the Corporation therefor, which date shall not be later than ninety (90) calendar days after such Asset Coverage Cure Date, except that if the Corporation does not have funds legally available for the redemption of all of the required number of shares of Series A Term Preferred Stock and other shares of Preferred Stock which have been designated to be redeemed or the Corporation otherwise is unable to effect such redemption on or prior to ninety (90) calendar days after such Asset Coverage Cure Date, the Corporation shall redeem those shares of Series A Term Preferred Stock and other shares of Preferred Stock which it was unable to redeem on the earliest practicable date on which it is able to effect such redemption. If fewer than all of the Outstanding shares of Series A Term Preferred Stock are to be redeemed pursuant to this Section 5.2, the number of shares of Series A Term Preferred Stock to be redeemed shall be redeemed (A) pro rata among the Outstanding shares of Series A Term Preferred Stock or (B) by lot.
5.3. Optional Redemption.
(a) Subject to the provisions of Section 5.3(b), on any Business Day following the expiration of the “No-Call Period,” which is the period beginning on the Date of Original Issue and ending at the close of business on October 31, 2023, the Corporation may redeem in whole or in part from time to time the Outstanding shares of Series A Term Preferred Stock at a price per share equal to the Redemption Price (any such Business Day referred to in this sentence, an “Optional Redemption Date”).
(b) If fewer than all of the Outstanding shares of Series A Term Preferred Stock are to be redeemed pursuant to Section 5.3(a), the shares of Series A Term Preferred Stock to be redeemed shall be selected either (A) pro rata or (B) by lot. Subject to the provisions of this Certificate of Designation and applicable law, the Board of Directors will have the full power and authority to prescribe the terms and conditions upon which shares of Series A Term Preferred Stock will be redeemed pursuant to this Section 5.3 from time to time.
(c) The Corporation may not on any date deliver a Notice of Redemption pursuant to Section 5.4 in respect of a redemption contemplated to be effected pursuant to this Section 5.3 unless on such date the Corporation has available Deposit Securities for the Optional Redemption Date contemplated by such Notice of Redemption having a Market Value not less than the amount due to Holders of shares of Series A Term Preferred Stock by reason of the redemption of such shares of Series A Term Preferred Stock on such Optional Redemption Date.
5.4. Procedures for Redemption.
(a) If the Corporation shall determine or be required to redeem, in whole or in part, shares of Series A Term Preferred Stock pursuant to Section 5.1, Section 5.2, or Section 5.3, the Corporation shall deliver a notice of redemption (the “Notice of Redemption”), by overnight delivery, by first class mail, postage prepaid, or by Electronic Means (as defined below) to Holders thereof, or request the Redemption and Paying Agent, on behalf of the Corporation, to promptly do so by overnight delivery, by first class mail, postage prepaid, or by Electronic Means. A Notice of Redemption shall be provided not more than forty-five (45) calendar days prior to the date fixed for redemption in such Notice of Redemption (the “Redemption Date”). Each such Notice of Redemption shall state: (A) the Redemption Date; (B) the number of shares of Series A Term Preferred Stock to be redeemed; (C) the CUSIP number for shares of
SA-7
Series A Term Preferred Stock; (D) the applicable Redemption Price on a per share basis; (E) that dividends on the shares of Series A Term Preferred Stock to be redeemed will cease to accumulate from and after such Redemption Date; and (F) the provision(s) of this Certificate of Designation under which such redemption is made. If fewer than all shares of Series A Term Preferred Stock held by any Holder are to be redeemed, the Notice of Redemption delivered to such Holder shall also specify the number of shares of Series A Term Preferred Stock to be redeemed from such Holder or the method of determining such number. The Corporation may provide in any Notice of Redemption relating to a redemption contemplated to be effected pursuant to this Certificate of Designation that such redemption is subject to one or more conditions precedent and that the Corporation shall not be required to effect such redemption unless each such condition has been satisfied at the time or times and in the manner specified in such Notice of Redemption. No defect in the Notice of Redemption or delivery thereof shall affect the validity of redemption proceedings, except as required by applicable law.
“Electronic Means” means e-mail transmission, facsimile transmission or other similar electronic means of communication providing evidence of transmission (but excluding online communications systems covered by a separate agreement) acceptable to the sending party and the receiving party, in any case if operative as between any two parties, or, if not operative, by telephone (promptly confirmed by any other method set forth in this definition), which, in the case of notices to the Redemption and Paying Agent and the Custodian, shall be sent by such means to each of its representatives set forth in (i) the Redemption and Paying Agent Agreement, or other similarly titled agreement, by and among the Redemption and Paying Agent for the Series A Term Preferred Stock and the Corporation and (ii) the Custodian Agreement by and among the Custodian and the Corporation with respect to the Series A Term Preferred Stock, respectively.
(b) If the Corporation shall give a Notice of Redemption, then at any time from and after the giving of such Notice of Redemption and prior to 12:00 noon, New York City time, on the Redemption Date (so long as any conditions precedent to such redemption have been met or waived by the Corporation), the Corporation shall (A) deposit with the Redemption and Paying Agent Deposit Securities having an aggregate Market Value on the date thereof no less than the Redemption Price of the shares of Series A Term Preferred Stock to be redeemed on the Redemption Date and (B) give the Redemption and Paying Agent irrevocable instructions and authority to pay the applicable Redemption Price to the Holders of the shares of Series A Term Preferred Stock called for redemption on the Redemption Date. The Corporation may direct the Redemption and Paying Agent with respect to the investment of any Deposit Securities consisting of cash so deposited prior to the Redemption Date, provided, that the proceeds of any such investment shall be available at the opening of business on the Redemption Date as same day funds.
(c) Upon the date of the deposit of such Deposit Securities, which in the case of term redemption pursuant to Section 5.1, shall be no later than fifteen (15) calendar days prior to the Term Redemption Date, all rights of the Holders of the shares of Series A Term Preferred Stock so called for redemption shall cease and terminate except the right of the Holders thereof to receive the Redemption Price thereof and such shares of Series A Term Preferred Stock shall no longer be deemed Outstanding for any purpose whatsoever (other than (A) the transfer thereof prior to the applicable Redemption Date and (B) the accumulation of dividends thereon in accordance with the terms hereof up to (but excluding) the applicable Redemption Date, which accumulated dividends, unless previously or contemporaneously declared and paid as contemplated by Section 5.4(d) below, shall be payable only as part of the applicable Redemption Price on the Redemption Date). The Corporation shall be entitled to receive, promptly after the Redemption Date, any Deposit Securities in excess of the aggregate Redemption Price of the shares of Series A Term Preferred Stock called for redemption on the Redemption Date. Any Deposit Securities so deposited that are unclaimed at the end of ninety (90) calendar days from the Redemption Date shall, to the extent permitted by law, be repaid to the Corporation, after which the Holders of the shares of Series A Term Preferred Stock so called for redemption shall look only to the Corporation for payment of the Redemption Price thereof. The Corporation shall be entitled to receive, from time to time after the Term Redemption Date, any interest on the Deposit Securities so deposited.
(d) Notwithstanding the other provisions of this ARTICLE V, except as otherwise required by law, the Corporation shall not redeem any shares of Series A Term Preferred Stock unless all accumulated and
SA-8
unpaid dividends and distributions on all Outstanding shares of Series A Term Preferred Stock and other series of Preferred Stock ranking on a parity with the Series A Term Preferred Stock with respect to dividends and distributions for all applicable past Dividend Periods (whether or not earned or declared by the Corporation) (x) shall have been or are contemporaneously paid or (y) shall have been or are contemporaneously declared and Deposit Securities or sufficient funds (in accordance with the terms of such Preferred Stock) for the payment of such dividends and distributions shall have been or are contemporaneously deposited with the Redemption and Paying Agent or other applicable paying agent for such Preferred Stock in accordance with the terms of such Preferred Stock, provided, however, that the foregoing shall not prevent the purchase or acquisition of Outstanding shares of Series A Term Preferred Stock pursuant to an otherwise lawful purchase or exchange offer made on the same terms to Holders of all Outstanding shares of Series A Term Preferred Stock and any other series of Preferred Stock for which all accumulated and unpaid dividends and distributions have not been paid.
(e) To the extent that any redemption for which Notice of Redemption has been provided is not made by reason of the absence of legally available funds therefor in accordance with the Certificate of Incorporation and applicable law, such redemption shall be made as soon as practicable to the extent such funds become available. No Redemption Default shall be deemed to have occurred if the Corporation shall fail to deposit in trust with the Redemption and Paying Agent the Redemption Price with respect to any shares where (1) the Notice of Redemption relating to such redemption provided that such redemption was subject to one or more conditions precedent and (2) any such condition precedent shall not have been satisfied at the time or times and in the manner specified in such Notice of Redemption. Notwithstanding the fact that a Notice of Redemption has been provided with respect to any shares of Series A Term Preferred Stock, dividends may be declared and paid on the shares of Series A Term Preferred Stock in accordance with their terms if Deposit Securities for the payment of the Redemption Price of such shares of Series A Term Preferred Stock shall not have been deposited in trust with the Redemption and Paying Agent for that purpose.
5.5. Redemption Date After Record Date and Before Dividend Payment Date. Notwithstanding Section 5.1, Section 5.2, and Section 5.3, if any Redemption Date occurs after the applicable Record Date for a dividend, but on or prior to the related Dividend Payment Date, the dividend payable on such Dividend Payment Date in respect of such Series A Term Preferred Stock shall be payable on such Dividend Payment Date to the Holders of record of such shares of Series A Term Preferred Stock at the close of business on the applicable Record Date, and shall not be payable as part of the Redemption Price for such shares of Series A Term Preferred Stock.
5.6. Redemption and Paying Agent as Trustee of Redemption Payments by Corporation. All Deposit Securities transferred to the Redemption and Paying Agent for payment of the Redemption Price of the shares of Series A Term Preferred Stock called for redemption shall be held in trust by the Redemption and Paying Agent for the benefit of Holders of shares of Series A Term Preferred Stock so to be redeemed until paid to such Holders in accordance with the terms hereof or returned to the Corporation in accordance with the provisions of Section 5.4(c) above.
5.7. Compliance with Applicable Law. In effecting any redemption pursuant to this ARTICLE V, the Corporation shall use its best efforts to comply with all applicable conditions precedent to effecting such redemption under the 1940 Act and any applicable Delaware law, but shall effect no redemption except in accordance with the 1940 Act and any applicable Delaware law.
5.8. Modification of Redemption Procedures. Notwithstanding the foregoing provisions of this ARTICLE V, the Corporation may, in its sole discretion and without a stockholder vote, modify the procedures set forth above with respect to notification of redemption for the shares of Series A Term Preferred Stock, provided, that such modification does not materially and adversely affect the Holders of the shares of Series A Term Preferred Stock or cause the Corporation to violate any applicable law, rule or regulation; and provided, further, that no such modification shall in any way alter the rights or obligations of the Redemption and Paying Agent without its prior consent.
ARTICLE VI
VOTING RIGHTS
VOTING RIGHTS
6.1. One Vote Per Share of Series A Term Preferred Stock. Except as otherwise provided in the Certificate of Incorporation or as otherwise required by applicable law, (i) each Holder of shares of Series A
SA-9
Term Preferred Stock shall be entitled to one vote for each share of Series A Term Preferred Stock held by such Holder on each matter submitted to a vote of stockholders of the Corporation, and (ii) the Holders of Outstanding shares of Preferred Stock, including Outstanding shares of Series A Term Preferred Stock, and holders of outstanding shares of Common Stock shall vote together as a single class; provided, however, that the Holders of Outstanding shares of Preferred Stock, including Outstanding shares of Series A Term Preferred Stock, shall be entitled, as a class, to the exclusion of the Holders of all other securities and classes of Capital Stock of the Corporation, to elect two Directors of the Corporation at all times. Subject to Section 6.2, the Holders of outstanding shares of Common Stock and Preferred Stock, including shares of Series A Term Preferred Stock, voting together as a single class, shall elect the balance of the Directors.
6.2. Voting For Additional Directors.
(a) Voting Period. During any period in which any one or more of the conditions described in clauses (i) or (ii) of this Section 6.2(a) shall exist (such period being referred to herein as a “Voting Period”), the number of Directors constituting the Board of Directors shall be automatically increased by the smallest number that, when added to the two Directors elected exclusively by the Holders of Preferred Stock, including shares of Series A Term Preferred Stock, would constitute a majority of the Board of Directors as so increased by such smallest number; and the Holders of Preferred Stock, including Series A Term Preferred Stock, shall be entitled, voting as a class on a one-vote-per-share basis (to the exclusion of the Holders of all other securities and classes of Capital Stock of the Corporation), to elect such smallest number of additional Directors, together with the two Directors that such Holders are in any event entitled to elect. A Voting Period shall commence:
(i)
if, at the close of business on any dividend payment date for any Outstanding shares of Preferred Stock including any Outstanding shares of Series A Term Preferred Stock, accumulated dividends (whether or not earned or declared) on such Outstanding shares of Preferred Stock equal to at least two (2) full years’ dividends shall be due and unpaid and sufficient cash or specified securities shall not have been deposited with the Redemption and Paying Agent or other applicable paying agent for the payment of such accumulated dividends; or
(ii)
if at any time Holders of shares of Preferred Stock are otherwise entitled under the applicable provisions of the 1940 Act to elect a majority of the Board of Directors.
Upon the termination of a Voting Period, the voting rights described in this Section 6.2(a) shall cease, subject always, however, to the revesting of such voting rights in the Holders of shares of Preferred Stock upon the further occurrence of any of the events described in this Section 6.2(a).
(b) Notice of Special Meeting. As soon as practicable after the accrual of any right of the Holders of shares of Preferred Stock to elect additional Directors as described in Section 6.2(a), the Corporation shall call a special meeting of such Holders and notify the Redemption and Paying Agent and/or such other Person as is specified in the terms of such Preferred Stock to receive notice (i) by mailing or delivery by Electronic Means or (ii) in such other manner and by such other means as are specified in the terms of such Preferred Stock, a notice of such special meeting to such Holders, such meeting to be held not less than ten (10) nor more than thirty (30) calendar days after the date of the delivery by Electronic Means or mailing of such notice. If the Corporation fails to call such a special meeting, it may be called at the expense of the Corporation by any such Holder on like notice. The record date for determining the Holders of shares of Preferred Stock entitled to notice of and to vote at such special meeting shall be the close of business on the Business Day preceding the calendar day on which such notice is mailed. At any such special meeting and at each meeting of Holders of shares of Preferred Stock held during a Voting Period at which Directors are to be elected, such Holders, voting together as a class (to the exclusion of the Holders of all other securities and classes of Capital Stock of the Corporation), shall be entitled to elect the number of Directors prescribed in Section 6.2(a) on a one-vote-per-share basis.
(c) Terms of Office of Existing Directors. The terms of office of the incumbent Directors of the Corporation at the time of a special meeting of Holders of the shares of Preferred Stock to elect additional Directors in accordance with Section 6.2(a) shall not be affected by the election at such meeting by the Holders of shares of Series A Term Preferred Stock and such other Holders of shares of Preferred Stock of the number of Directors that they are entitled to elect, and the Directors so elected by the
SA-10
Holders of shares of Series A Term Preferred Stock and such other Holders of shares of Preferred Stock, together with the two (2) Directors elected by the Holders of shares of Preferred Stock in accordance with Section 6.1 hereof and the remaining Directors elected by the Holders of the shares of Common Stock and Preferred Stock, shall constitute the duly elected Directors of the Corporation.
(d) Terms of Office of Certain Directors to Terminate Upon Termination of Voting Period. Simultaneously with the termination of a Voting Period, the terms of office of the additional Directors elected by the Holders of the shares of Preferred Stock pursuant to Section 6.2(a) shall terminate, the remaining Directors shall constitute the Directors of the Corporation and the voting rights of the Holders of shares of Preferred Stock to elect additional Directors pursuant to Section 6.2(a) shall cease, subject to the provisions of the last sentence of Section 6.2(a).
6.3. Holders of Shares of Series A Term Preferred Stock to Vote on Certain Matters.
(a) Certain Amendments Requiring Approval of Preferred Stock. Except as otherwise permitted by the terms of this Certificate of Designation, (1) so long as any shares of Preferred Stock are Outstanding, the Corporation shall not, without the affirmative vote or consent of the Holders of at least two-thirds of the shares of Preferred Stock Outstanding at the time, voting together as a separate class, amend, alter or repeal the provisions of the Certificate of Incorporation or this Certificate of Designation (or any other document governing the rights of the Preferred Stock or the Holders thereof as may be required by the rules of any applicable securities exchange), whether by merger, consolidation or otherwise, so as to materially and adversely affect any preference, right or power of such shares of the Preferred Stock or the Holders thereof and (2) so long as any shares of Series A Term Preferred Stock are Outstanding, the Corporation shall not, without the affirmative vote or consent of the Holders of at least two-thirds of the shares of Series A Term Preferred Stock Outstanding at the time, voting together as a separate class, amend, alter or repeal the provisions of the Certificate of Incorporation or this Certificate of Designation (or any other document governing the rights of the Series A Term Preferred Stock or the Holders thereof as may be required by the rules of any applicable securities exchange), whether by merger, consolidation or otherwise, so as to materially and adversely affect any preference, right or power of such shares of the Series A Term Preferred Stock or the Holders thereof differently than shares of any other series of Preferred Stock; provided, however, that for purposes of this Section 6.3(a), (i) a change in the capitalization of the Corporation in accordance with Section 7.1 hereof shall not be considered to materially and adversely affect the rights and preferences of the Preferred Stock, including the Series A Term Preferred Stock, and (ii) a division of a share of the Preferred Stock, including the Series A Term Preferred Stock, shall be deemed to affect such preferences, rights or powers only if the terms of such division materially and adversely affect the Holders of the shares. For purposes of the foregoing, no matter shall be deemed to adversely affect any preference, right or power of a share of Preferred Stock or any series thereof, or the Holder of any such share unless such matter (x) alters or abolishes any preferential right of such share of Preferred Stock, or (y) creates, alters or abolishes any right in respect of redemption of such share (other than as a result of a division of a share of Preferred Stock). So long as any shares of Preferred Stock are Outstanding, the Corporation shall not, without the affirmative vote or consent of at least two-thirds of the Holders of the shares of Preferred Stock Outstanding at the time, voting as a separate class, file a voluntary application for relief under federal bankruptcy law or any similar application under state law for so long as the Corporation is solvent and does not foresee becoming insolvent.
(b) Certain Amendments Requiring Approval of Series A Term Preferred Stock. The Corporation cannot effect any amendment, alteration or repeal of the obligation to redeem all of the Series A Term Preferred Stock on October 30, 2026 without the prior unanimous consent of the Holders of Series A Term Preferred Stock.
(c) 1940 Act Matters. Unless a higher percentage is provided for in the Certificate of Incorporation, the affirmative vote of the Holders of at least “a majority of the outstanding shares of Preferred Stock,” including shares of Series A Term Preferred Stock Outstanding at the time, voting as a separate class, shall be required (A) to approve any plan of reorganization (as such term is used in the 1940 Act) adversely affecting such shares or (B) any action requiring a vote of Holders of the Corporation’s securities pursuant to Section 13(a) of the 1940 Act. For purposes of the foregoing, the vote of a “majority of the outstanding shares of Preferred Stock” means the vote at an annual or special
SA-11
meeting duly called of (i) sixty-seven percent (67%) or more of such shares present at a meeting, if the Holders of more than fifty percent (50%) of such shares are present or represented by proxy at such meeting, or (ii) more than fifty percent (50%) of such shares, whichever is less.
6.4. Voting Rights Set Forth Herein Are Sole Voting Rights. Unless otherwise required by law or the Certificate of Incorporation, the Holders of shares of Series A Term Preferred Stock shall not have any relative rights or preferences or other special rights with respect to voting other than those specifically set forth in this ARTICLE VI.
6.5. No Cumulative Voting. The Holders of shares of Series A Term Preferred Stock shall have no rights to cumulative voting.
6.6. Voting for Directors Sole Remedy for Corporation’s Failure to Declare or Pay Dividends. In the event that the Corporation fails to declare or pay any dividends on shares of Series A Term Preferred Stock on the Dividend Payment Date therefor, the exclusive remedy of the Holders of the shares of Series A Term Preferred Stock shall be the right to vote for Directors pursuant to the provisions of this ARTICLE VI. Nothing in this Section 6.6 shall be deemed to affect the obligation of the Corporation to accumulate and, if permitted by applicable law, the Certificate of Incorporation and this Certificate of Designation, pay dividends at the Default Rate in the circumstances contemplated by Section 2.8 hereof.
6.7. Holders Entitled to Vote. For purposes of determining any rights of the Holders of shares of Series A Term Preferred Stock to vote on any matter, whether such right is created by this Certificate of Designation, by the Certificate of Incorporation, by statute or otherwise, no Holder of shares of Series A Term Preferred Stock shall be entitled to vote any share of Series A Term Preferred Stock and no share of Series A Term Preferred Stock shall be deemed to be “Outstanding” for the purpose of voting or determining the number of shares required to constitute a quorum if, prior to or concurrently with the time of determination of shares entitled to vote or the time of the actual vote on the matter, as the case may be, the requisite Notice of Redemption with respect to such share of Series A Term Preferred Stock shall have been given in accordance with this Certificate of Designation and Deposit Securities for the payment of the Redemption Price of such share of Series A Term Preferred Stock shall have been deposited in trust with the Redemption and Paying Agent for that purpose. No share of Series A Term Preferred Stock held by the Corporation shall have any voting rights or be deemed to be Outstanding for voting or for calculating the voting percentage required on any other matter or other purposes.
ARTICLE VII
MISCELLANEOUS
MISCELLANEOUS
7.1. Issuance of Additional Preferred Stock. So long as any shares of Series A Term Preferred Stock are Outstanding, the Corporation may, without the vote or consent of the Holders thereof, (a) authorize, establish and create and issue and sell shares of one or more series of a class of senior securities of the Corporation representing stock under Section 18 of the 1940 Act, ranking on a parity with the Series A Term Preferred Stock as to the payment of dividends and the distribution of assets upon dissolution, liquidation or the winding up of the affairs of the Corporation, in addition to then Outstanding shares of Series A Term Preferred Stock, and (b) authorize, issue and sell additional shares of any such series then Outstanding or so established and created, including additional shares of Series A Term Preferred Stock, in each case in accordance with applicable law, provided that the Corporation shall, immediately after giving effect to the issuance of such additional shares of Preferred Stock and to its receipt and application of the proceeds thereof, including to the redemption of shares of Preferred Stock with such proceeds, have Asset Coverage (calculated in the same manner as is contemplated by Section 4.2 hereof) of at least 200%.
7.2. Status of Redeemed or Repurchased Series A Term Preferred Stock. Shares of Series A Term Preferred Stock that at any time have been redeemed or purchased by the Corporation shall, after such redemption or purchase, have the status of authorized but unissued shares of Capital Stock.
7.3. Registered Name. Prior to the commencement of a Voting Period, (i) all shares of Series A Term Preferred Stock Outstanding from time to time shall be registered in the name of the Depository Trust Company and its successors and assigns, or any other securities depository selected by the Corporation that agrees to follow the procedures required to be followed by such securities depository as set forth in this
SA-12
Certificate of Designation with respect to the Series A Term Preferred Stock (the “Securities Depository”) or its nominee and (ii) no registration of transfer of shares of such Series A Term Preferred Stock shall be made on the books of the Corporation to any Person other than the Securities Depository or its nominee.
7.4. Notice. All notices or communications hereunder, unless otherwise specified in this Certificate of Designation, shall be sufficiently given if in writing and delivered in person, by Electronic Means or by overnight mail or delivery or mailed by first-class mail, postage prepaid. Notices delivered pursuant to this Section 7.4 shall be deemed given on the date received or, if mailed by first class mail, on the date five (5) calendar days after which such notice is mailed.
7.5. Termination. In the event that no shares of Series A Term Preferred Stock are Outstanding, all rights and preferences of the shares of Series A Term Preferred Stock established and designated hereunder shall cease and terminate, and all obligations of the Corporation under this Certificate of Designation with respect to such Series A Term Preferred Stock shall terminate.
7.6. Amendment. The Board of Directors may, by resolution duly adopted, without stockholder approval (except as otherwise provided by this Certificate of Designation or required by applicable law) amend this Certificate of Designation so as to reflect any amendments to the terms applicable to the Series A Term Preferred Stock, including an increase in the number of authorized shares of the Series A Term Preferred Stock.
7.7. Actions on Other than Business Days. Unless otherwise provided herein, if the date for making any payment, performing any act or exercising any right, in each case as provided for in this Certificate of Designation, is not a Business Day, such payment shall be made, act performed or right exercised on the next succeeding Business Day, with the same force and effect as if made or done on the nominal date provided therefor, and, with respect to any payment so made, no dividends, interest or other amount shall accrue for the period between such nominal date and the date of payment.
7.8. Modification. The Board of Directors, without the vote of the Holders of Series A Term Preferred Stock, may interpret, supplement or amend the provisions of this Certificate of Designation to supply any omission, resolve any inconsistency or ambiguity or to cure, correct or supplement any defective or inconsistent provision, including any provision that becomes defective after the date hereof because of impossibility of performance or any provision that is inconsistent with any provision of any other Capital Stock of the Corporation.
7.9. Information Rights. During any period in which the Corporation is not subject to the reporting requirements of Section 13 or 15(d) of the Securities Exchange Act of 1934, as amended (the “Exchange Act”), and any shares of Series A Term Preferred Stock are Outstanding, the Corporation will provide Holders of Series A Term Preferred Stock, without cost, copies of SEC Reports that the Corporation would have been required to file pursuant to Section 13 or 15(d) of the Exchange Act if the Corporation was subject to such provisions or, alternatively, the Corporation will voluntarily file SEC Reports as if the Corporation was subject to Section 13 or 15(d) of the Exchange Act.
7.10. No Additional Rights. Unless otherwise required by law or the Certificate of Incorporation, the Holders of shares of Series A Term Preferred Stock shall not have any relative rights or preferences or other special rights other than those specifically set forth in this Certificate of Designation.
7.11. Interpretation.
(a) The headings preceding the text of the Articles and Sections included in this Certificate of Designation are for convenience only and shall not be deemed part of this Certificate of Designation or be given any effect in interpreting this Certificate of Designation. The use of the masculine, feminine or neuter gender or the singular or plural form of words herein shall not limit any provision of this Certificate of Designation. The use of the terms “including” or “include” shall in all cases herein mean “including, without limitation” or “include, without limitation,” respectively. Reference to any Person includes such Person’s successors and assigns to the extent such successors and assigns are permitted by the terms of any applicable agreement, and reference to a Person in a particular capacity excludes such Person in any other capacity or individually.
SA-13
(b) Reference to any agreement (including this Certificate of Designation), document or instrument means such agreement, document or instrument as amended or modified and in effect from time to time in accordance with the terms thereof and, if applicable, the terms hereof. Except as otherwise expressly set forth herein, reference to any law means such law as amended, modified, codified, replaced or re-enacted, in whole or in part, including rules, regulations, enforcement procedures and any interpretations promulgated thereunder. Underscored references to Articles and Sections shall refer to those portions of this Certificate of Designation. The use of the terms “hereunder,” “hereof,” “hereto” and words of similar import shall refer to this Certificate of Designation as a whole and not to any particular Article, Section or clause of this Certificate of Designation.
[Signature Page Follows]
SA-14
IN WITNESS WHEREOF, the Corporation has caused this Certificate of Designation to be duly executed by its duly authorized officer as of this 21st day of October 2021.
EAGLE POINT INCOME COMPANY INC.
By:
/s/ Thomas P. Majewski
Name:
Thomas P. Majewski
Title:
Chief Executive Officer
CERTIFICATE OF INCREASE OF SHARES DESIGNATED AS 5.00% SERIES A TERM
PREFERRED STOCK DUE 2026 OF EAGLE POINT INCOME COMPANY INC.
PREFERRED STOCK DUE 2026 OF EAGLE POINT INCOME COMPANY INC.
Eagle Point Income Company Inc., a corporation organized and existing under the laws of the State of Delaware (the “Corporation”), certifies:
1. That a Certificate of Designation of 5.00% Series A Term Preferred Stock due 2026 of the Corporation was filed with the office of the Secretary of State of the State of Delaware on October 21, 2021.
2. That the Board of Directors of the Corporation (the “Board of Directors,” which term as used herein shall include any duly authorized committee of the Board of Directors) at a meeting held on December 8, 2021 duly adopted a resolution authorizing and directing an increase in the number of shares of preferred stock, par value $0.001 per share, of the Corporation designated as 5.00% Series A Term Preferred Stock due 2026 from 1,600,000 shares to 2,400,000 shares in accordance with the provisions of section 151 of the General Corporation Law of the State of Delaware.
[Signature Page Follows]
SA-15
IN WITNESS WHEREOF, the Corporation has caused this Certificate of Increase to be duly executed by its duly authorized officer as of this 17th day of December 2021.
EAGLE POINT INCOME COMPANY INC.
By:
/s/ Thomas P. Majewski
Name:
Thomas P. Majewski
Title:
Chief Executive Officer
SA-16
APPENDIX B
CERTIFICATE OF DESIGNATION
OF
7.75% SERIES B TERM PREFERRED STOCK DUE 2028
OF
EAGLE POINT INCOME COMPANY INC.
OF
7.75% SERIES B TERM PREFERRED STOCK DUE 2028
OF
EAGLE POINT INCOME COMPANY INC.
Pursuant to Section 151 of the
General Corporation Law of the State of Delaware
General Corporation Law of the State of Delaware
Eagle Point Income Company Inc., a corporation organized and existing under the laws of the State of Delaware (the “Corporation”), certifies that pursuant to the authority contained in its certificate of incorporation (the “Certificate of Incorporation”), and in accordance with the provisions of Section 151 of the General Corporation Law of the State of Delaware (the “DGCL”), the Board of Directors of the Corporation (the “Board of Directors,” which term as used herein shall include any duly authorized committee of the Board of Directors) has duly approved and adopted the following resolution on July 18, 2023:
RESOLVED, that pursuant to the authority vested in the Board of Directors by the Certificate of Incorporation and as set forth in Section 151 of the DGCL, the Board of Directors does hereby approve the designation of 2,400,000 authorized but unissued shares of preferred stock, par value $0.001 per share, without designation as to series as 7.75% Series B Term Preferred Stock due 2028 (the “Series B Term Preferred Stock”), having the designations, preferences, relative, participating, optional and other special rights and the qualifications, limitations and restrictions thereof that are set forth in the Certificate of Incorporation and in this resolution as follows:
ARTICLE I
NUMBER OF SHARES; RANKING
NUMBER OF SHARES; RANKING
1.1. A series of 2,400,000 shares of the preferred stock, par value $0.001 per share, authorized by the Certificate of Incorporation are hereby designated as the Series B Term Preferred Stock. Each share of Series B Term Preferred Stock shall have such preferences, voting powers, restrictions, limitations as to dividends and distributions, qualifications and terms and conditions of redemption, in addition to those required by applicable law and those that are expressly set forth in the Certificate of Incorporation, as are set forth in this Certificate of Designation. The Series B Term Preferred Stock shall constitute a separate series of Capital Stock (as defined below) and each share of Series B Term Preferred Stock shall be identical. No fractional shares of Series B Term Preferred Stock shall be issued.
1.2. The Series B Term Preferred Stock shall rank on parity with (i) shares of the Corporation’s 5.00% Series A Term Preferred Stock due 2026, (ii) any other shares of Capital Stock hereafter authorized and issued by the Corporation of a class having priority over any other class as to distribution of assets or payments of dividends (collectively with the Series A Term Preferred Stock, the “Preferred Stock”) as to the payment of dividends and as to the distribution of assets upon dissolution, liquidation or winding up of the affairs of the Corporation. The Series B Term Preferred Stock shall have preference with respect to the payment of dividends and as to distribution of assets upon dissolution, liquidation or winding up of the affairs of the Corporation over the shares of common stock, par value $0.001 per share (the “Common Stock” and, together with the Preferred Stock, the “Capital Stock”), of the Corporation as set forth herein.
1.3. No individual, partnership, trust, corporation, limited liability company, unincorporated association, joint venture or other entity, or government or any agency or political subdivision thereof (each, a “Person”) in whose name the Series B Term Preferred Stock or any other security issued by the Corporation is registered in the registration books of the Corporation maintained by Equiniti Trust Company, LLC and its successors, or any other redemption and paying agent appointed by the Corporation with respect to the Series B Term Preferred Stock (the “Redemption and Paying Agent”) or otherwise (such Person, a “Holder”), shall have, solely by reason of being such a Holder, any preemptive or other right to acquire, purchase or subscribe for any shares of Series B Term Preferred Stock, shares of other Preferred Stock, shares of Common Stock or other securities of the Corporation that it may hereafter issue or sell.
SB-1
ARTICLE II
DIVIDENDS AND DISTRIBUTIONS
DIVIDENDS AND DISTRIBUTIONS
2.1. The Holders of shares of Series B Term Preferred Stock shall be entitled to receive, when, as and if declared by, or under authority granted by, the Board of Directors, out of funds legally available therefor and in preference to dividends and distributions on the Common Stock, cumulative cash dividends and distributions on each share of Series B Term Preferred Stock, calculated separately for each Dividend Period (as defined below) at, as of any date, 7.75% per annum (the “Fixed Dividend Rate”) as adjusted, if a Default Period (as defined below) shall be in existence on such date, in accordance with the provisions of Section 2.8 (the “Dividend Rate”) in effect from time to time for the Series B Term Preferred Stock during such Dividend Period, computed on the basis of a 360- day year consisting of twelve 30-day months, on an amount equal to $25.00 (the “Liquidation Preference”) for each share of the Series B Term Preferred Stock, and no more. In the case of each share of Series B Term Preferred Stock issued on July 26, 2023 (the “Date of Original Issue”), dividends and distributions on such shares of Series B Term Preferred Stock shall accumulate from the Date of Original Issue. In the case of a share of Series B Term Preferred Stock issued on a date subsequent to the Date of Original Issue, (a) if such share is issued before the Record Date (as defined below) for the Dividend Period in which such share is issued, dividends and distributions on such share of Series B Term Preferred Stock shall accumulate from the first day of such Dividend Period and (b) if such share is issued after the Record Date for the Dividend Period in which such share is issued, dividends and distributions on such share of Series B Term Preferred Stock shall accumulate from the first day of the Dividend Period immediately following the issuance of such share. Dividends and distributions on all shares of Series B Term Preferred Stock shall be payable monthly in arrears as provided in Section 2.2. The amount of dividends payable on shares of the Series B Term Preferred Stock on any date prior to the end of a Dividend Period, and for the initial Dividend Period, will be computed on the basis of actual days elapsed over a 30-day month.
“Dividend Period” means, with respect to each share of Series B Term Preferred Stock then Outstanding (as defined below), in the case of the first Dividend Period, the period beginning on and including the Date of Original Issue and ending on, but excluding August 31, 2023 and, for each subsequent Dividend Period, the period beginning on and including the last Dividend Payment Date (as defined below) and ending on, but excluding, the next Dividend Payment Date or the stated maturity date, as the case may be.
2.2. Declaration and Payment; Dividends in Arrears.
(a) Dividends on shares of the Series B Term Preferred Stock with respect to any Dividend Period shall be declared to the Holders of record of such shares as their names shall appear on the registration books of the Corporation at the close of business on the applicable record date, which shall be such date designated by the Board of Directors that is not more than twenty (20) nor less than seven (7) calendar days prior to the Dividend Payment Date with respect to such Dividend Period (each, a “Record Date”).
(b) Dividends declared pursuant to Section 2.1 shall be paid on the last day of every calendar month, beginning August 31, 2023 (each, a “Dividend Payment Date”) to the Holders of shares of Series B Term Preferred Stock as their names appear on the registration books of the Corporation at the close of business on the applicable Record Date for such dividend; provided, however, that dividends with respect to the first Dividend Period of the Series B Term Preferred Stock will be paid on August 31, 2023 to Holders of record of such Series B Term Preferred Stock as their names appear on the registration books of the Corporation at the close of business on August 11, 2023. If a Dividend Payment Date falls on a non-Business Day (as defined below), the applicable dividend payment will be made on the next Business Day and no additional dividend payment will accrue as a result of such delayed payment.
(c) Dividends in arrears on shares of Series B Term Preferred Stock for any past Dividend Period may be declared and paid at any time, without reference to any regular Dividend Payment Date, to the Holders of such shares as their names appear on the registration books of the Corporation on the applicable Record Date. No interest or sum of money in lieu of interest will be payable in respect of any dividend payment or payments on shares of Series B Term Preferred Stock which may be in arrears.
2.3. No full dividends and distributions shall be declared or paid on shares of the Series B Term Preferred Stock for any Dividend Period or part thereof unless full cumulative dividends and distributions due through the most recent Dividend Payment Dates therefor for all Outstanding shares of Preferred Stock
SB-2
have been or contemporaneously are declared and paid through the most recent Dividend Payment Dates therefor. If full cumulative dividends and distributions due have not been declared and paid on all Outstanding shares of Preferred Stock, any dividends and distributions being declared and paid on the Series B Term Preferred Stock will be declared and paid as nearly pro rata as possible in proportion to the respective amounts of dividends and distributions accumulated but unpaid on each such series of Preferred Stock on the relevant dividend payment date for such series. No Holders of shares of Series B Term Preferred Stock shall be entitled to any dividends and distributions, whether payable in cash, property or shares, in excess of full cumulative dividends and distributions as provided in this Section 2.3 on the Series B Term Preferred Stock.
2.4. For so long as any shares of Series B Term Preferred Stock are Outstanding, the Corporation shall not: (x) declare any dividend or other distribution (other than a dividend or distribution paid in shares of Common Stock) in respect of the Common Stock, (y) call for redemption, redeem, purchase or otherwise acquire for consideration any Common Stock, or (z) pay any proceeds of the liquidation of the Corporation in respect of the Common Stock, unless, in each case,
(a) immediately thereafter, the Corporation shall have “asset coverage,” as defined for purposes of Section 18(h) of the Investment Company Act of 1940, as amended, or any successor statute (the “1940 Act”), of at least 200% with respect to all Outstanding senior securities which are stock of the Corporation, including all Outstanding shares of Series B Term Preferred Stock (or such other percentage as may in the future be specified in the 1940 Act or by rule, regulation or order of the Securities and Exchange Commission (the “SEC”) as the minimum asset coverage for senior securities which are stock of a closed-end registered investment company), after deducting the amount of such dividend or distribution or redemption or purchase price or liquidation proceeds;
(b) all cumulative dividends and distributions on all shares of Preferred Stock due on or prior to the date of the applicable dividend, distribution, redemption, purchase or acquisition shall have been either (i) declared and paid or (ii) declared and Deposit Securities (as defined below) or sufficient funds (in accordance with the terms of such Preferred Stock) for the payment thereof shall have been deposited irrevocably with the paying agent for such Preferred Stock; and
(c) the Corporation shall have deposited Deposit Securities pursuant to and in accordance with the requirements of Section 5.4 hereof with respect to Outstanding shares of Series B Term Preferred Stock to be redeemed pursuant to Section 5.1 or Section 5.2 hereof for which a Notice of Redemption (as defined below) shall have been given or shall have been required to be given in accordance with the terms hereof on or prior to the date of the applicable dividend, distribution, redemption, purchase or acquisition.
“Outstanding” means, as of any date with respect to a series of Preferred Stock, the number of shares of such series of Preferred Stock theretofore issued by the Corporation except (without duplication): (A) any shares of the applicable series of Preferred Stock theretofore cancelled or redeemed or delivered to the Redemption and Paying Agent for cancellation or redemption in accordance with the terms hereof; (B) any shares of the applicable series of Preferred Stock as to which the Corporation shall have given a Notice of Redemption and irrevocably deposited with the Redemption and Paying Agent sufficient Deposit Securities to redeem such shares in accordance with ARTICLE V hereof; and (C) any shares of the applicable series of Preferred Stock as to which the Corporation shall be the Holder or the beneficial owner.
“Deposit Securities” means, as of any date, any U.S. dollar-denominated security or other investment of a type described below that either (i) is a demand obligation payable to the holder thereof on any Business Day or (ii) has a maturity date, mandatory redemption date or mandatory payment date, on its face or at the option of the holder, preceding the relevant Redemption Date (as defined below), Dividend Payment Date or other payment date in respect of which such security or other investment has been deposited or set aside as a Deposit Security: (A) cash or any cash equivalent; (B) any U.S. Government Obligation (as defined below); (C) any Short-Term Money Market Instrument (as defined below); (D) any investment in any money market fund registered under the 1940 Act that qualifies under Rule 2a-7 under the 1940 Act, or similar investment vehicle described in Rule 12d1-1(b)(2) under the 1940 Act, that invests principally in Short-Term Money Market Instruments or U.S. Government Obligations or any combination thereof; or (E) any letter of credit from a bank or other financial institution that has a credit rating from at least one nationally recognized statistical rating organization that is the highest applicable rating generally ascribed by such rating agency to
SB-3
bank deposits or short-term debt of similar banks or other financial institutions as of the date of this Certificate of Designation (or such rating’s future equivalent).
“Short-Term Money Market Instruments” means the following types of instruments if, on the date of purchase or other acquisition thereof by the Corporation, the remaining term to maturity thereof is not in excess of 180 days: (i) commercial paper rated A-1, if such commercial paper matures within 30 days, or A-1+, if such commercial paper matures in over 30 days; (ii) demand or time deposits in, and bankers’ acceptances and certificates of deposit of (A) a depository institution or trust company incorporated under the laws of the United States of America or any state thereof or the District of Columbia or (B) a U.S. branch office or agency of a foreign depository institution (provided that such branch office or agency is subject to banking regulation under the laws of the United States, any state thereof or the District of Columbia); and (iii) overnight funds.
“U.S. Government Obligations” means direct obligations of the United States or of its agencies or instrumentalities that are entitled to the full faith and credit of the United States and that, other than U.S. treasury bills, provide for the periodic payment of interest and the full payment of principal at maturity or call for redemption.
2.5. Any dividend payment made on shares of Series B Term Preferred Stock shall first be credited against the dividends and distributions accumulated with respect to the earliest Dividend Period for which dividends and distributions have not been paid.
2.6. Not later than 12:00 noon, New York City time, on a Dividend Payment Date, the Corporation shall deposit with the Redemption and Paying Agent Deposit Securities having an aggregate Market Value (as defined below) on such date sufficient to pay the dividends and distributions that are payable on such Dividend Payment Date. The Corporation may direct the Redemption and Paying Agent with respect to the investment or reinvestment of any such Deposit Securities prior to the Dividend Payment Date, provided, that such investment consists exclusively of Deposit Securities and provided, further, that the proceeds of any such investment will be available as same day funds at the opening of business on such Dividend Payment Date.
“Market Value” of any asset means, for securities for which market quotations are readily available, the market value thereof determined by an independent third-party pricing service designated from time to time by the Board of Directors. Market Value of any asset shall include any interest accrued thereon. The pricing service values portfolio securities at the mean between the quoted bid and asked price or the yield equivalent when quotations are readily available. Securities for which quotations are not readily available are valued at fair value as determined by the pricing service using methods that include consideration of: yields or prices of securities of comparable quality, type of issue, coupon, maturity and rating, indications as to value from dealers and general market conditions. The pricing service may employ electronic data processing techniques or a matrix system, or both, to determine recommended valuations.
2.7. All Deposit Securities paid to the Redemption and Paying Agent for the payment of dividends payable on the Series B Term Preferred Stock shall be held in trust for the payment of such dividends by the Redemption and Paying Agent for the benefit of the Holders entitled to the payment of such dividends pursuant to Section 2.2. Any moneys paid to the Redemption and Paying Agent in accordance with the foregoing but not applied by the Redemption and Paying Agent to the payment of dividends, including interest earned on such moneys while so held, will, to the extent permitted by law, be repaid to the Corporation as soon as possible after the date on which such moneys were to have been so applied, upon request of the Corporation.
2.8. Dividend Default.
(a) The Dividend Rate on the Series B Term Preferred Stock shall be adjusted, for any calendar day, to the Fixed Dividend Rate plus two percent (2%) per annum (the “Default Rate”) in the following circumstances. Subject to the cure provisions below, a “Default Period” with respect to the Series B Term Preferred Stock shall commence on any date the Corporation fails to deposit with the Redemption and Paying Agent by 12:00 noon, New York City time, on (A) a Dividend Payment Date, Deposit Securities that will provide funds available to the Redemption and Paying Agent on such Dividend Payment Date sufficient to pay the full amount of any dividend payable on such Dividend Payment Date (a “Dividend Default”) or (B) an applicable Redemption Date, Deposit Securities that will provide funds available to
SB-4
the Redemption and Paying Agent on such Redemption Date sufficient to pay the full amount of the Liquidation Preference for the shares of the Series B Term Preferred Stock, plus an amount equal to all unpaid dividends and distributions on such shares accumulated to (but excluding) the date fixed for such distribution or payment on such shares (whether or not earned or declared by the Corporation, but excluding interest thereon) (such amount, the “Redemption Price”), payable in respect of such series on such Redemption Date (a “Redemption Default” and together with a Dividend Default, hereinafter referred to as “Default”). Subject to the cure provisions of Section 2.8(b) below, a Default Period with respect to a Default on the Series B Term Preferred Stock shall end on the calendar day on which the New York Stock Exchange is open for trading (each such day, a “Business Day”) on which, by 12:00 noon, New York City time, an amount equal to all unpaid dividends and any unpaid Redemption Price shall have been deposited irrevocably in trust in same day funds with the Redemption and Paying Agent. The Dividend Rate on the Series B Term Preferred Stock for each calendar day during the Default Period will be equal to the Default Rate.
(b) No Default Period for the Series B Term Preferred Stock with respect to any Default on the Series B Term Preferred Stock shall be deemed to commence if the amount of any dividend or any Redemption Price due in respect of the Series B Term Preferred Stock (if such Default is not solely due to the willful failure of the Corporation) is deposited irrevocably in trust, in same-day funds, with the Redemption and Paying Agent by 12:00 noon, New York City time, on a Business Day that is not later than three (3) Business Days after the applicable Dividend Payment Date or Redemption Date with respect to which such Default occurred, together with an amount equal to the Default Rate applied to the amount and period of such non-payment based on the actual number of calendar days comprising such period divided by three hundred and sixty (360).
ARTICLE III
LIQUIDATION RIGHTS
LIQUIDATION RIGHTS
3.1. In the event of any liquidation, dissolution or winding up of the affairs of the Corporation, whether voluntary or involuntary, the Holders of shares of Series B Term Preferred Stock shall be entitled to receive out of the assets of the Corporation available for distribution to stockholders, after satisfying claims of creditors but before any distribution or payment shall be made in respect of the Common Stock, a liquidation distribution of the Redemption Price, and such Holders shall be entitled to no further participation in any distribution or payment in connection with any such liquidation, dissolution or winding up.
3.2. If, upon any liquidation, dissolution or winding up of the affairs of the Corporation, whether voluntary or involuntary, the assets of the Corporation available for distribution among the Holders of all Outstanding shares of Series B Term Preferred Stock and any other Outstanding shares of Preferred Stock shall be insufficient to permit the payment in full to such Holders of the Redemption Price as provided in Section 3.1 above and the amounts due upon liquidation with respect to such other Preferred Stock, then such available assets shall be distributed among the Holders of such shares of Series B Term Preferred Stock and such other Preferred Stock ratably in proportion to the respective preferential liquidation amounts to which they are entitled. In connection with any liquidation, dissolution or winding up of the affairs of the Corporation, whether voluntary or involuntary, unless and until the Redemption Price, as provided in Section 3.1 above has been paid in full to the Holders of such shares, no dividends, distributions or other payments will be made on, and no redemption, purchase or other acquisition by the Corporation will be made by the Corporation in respect of, shares of the Common Stock.
3.3. Neither the sale of all or substantially all of the property or business of the Corporation, nor the merger, consolidation or reorganization of the Corporation into or with any other business or statutory trust, corporation or other entity, nor the merger, consolidation or reorganization of any other business or statutory trust, corporation or other entity into or with the Corporation shall be a dissolution, liquidation or winding up, whether voluntary or involuntary, for the purpose of this ARTICLE III.
ARTICLE IV
ASSET COVERAGE TEST
ASSET COVERAGE TEST
4.1. Asset Coverage Requirement. For so long as any shares of Series B Term Preferred Stock are Outstanding, the Corporation shall have “asset coverage” of a class of senior security which is stock, as
SB-5
defined for purposes of Section 18(h) of the 1940 Act as in effect on the date hereof (“Asset Coverage”), of at least 200% as of the close of business on the last Business Day of any of the three month periods ending March 31, June 30, September 30 or December 31 of each year (each, a “Calendar Quarter”). If the Corporation shall fail to maintain such Asset Coverage as of any time as of which such compliance is required to be determined as aforesaid, the provisions of Section 5.2(a) shall be applicable, which provisions shall constitute the sole remedy for the Corporation’s failure to comply with the provisions of this Section 4.1.
4.2. Calculation of Asset Coverage. For purposes of determining whether the requirements of Section 4.1 are satisfied, (i) no shares of Series B Term Preferred Stock or other Preferred Stock shall be deemed to be Outstanding for purposes of any computation required by Section 4.1 if, prior to or concurrently with such determination, either (x) sufficient Deposit Securities or other sufficient funds (in accordance with the terms of the Series B Term Preferred Stock or other Preferred Stock) to pay the full Redemption Price for the Series B Term Preferred Stock or other Preferred Stock (or the portion thereof to be redeemed) shall have been deposited in trust with the paying agent for the Series B Term Preferred Stock or other Preferred Stock and the requisite notice of redemption for the Series B Term Preferred Stock or other Preferred Stock (or the portion thereof to be redeemed) shall have been given or (y) sufficient Deposit Securities or other sufficient funds (in accordance with the terms of the Series B Term Preferred Stock or other Preferred Stock) to pay the full Redemption Price for the Series B Term Preferred Stock or other Preferred Stock (or the portion thereof to be redeemed) shall have been segregated by a bank, as defined in Section 2(a)(5) of the 1940 Act, that has the qualifications prescribed in Section 26(a)(1) of the 1940 Act, or such other entity as shall be then providing custodian services to the Corporation as permitted by the 1940 Act or any rule, regulation, or order thereunder (the “Custodian,” which shall include any similarly qualified sub-custodian duly appointed by the Custodian) and the Corporation from the assets of the Corporation, by means of appropriate identification on the Custodian’s books and records or otherwise in accordance with the Custodian’s normal procedures, and (ii) the Deposit Securities or other sufficient funds that shall have been deposited with the applicable paying agent and/or segregated by the Custodian, as applicable, as provided in clause (i) of this sentence shall not be included as assets of the Corporation for purposes of such computation.
ARTICLE V
REDEMPTION
REDEMPTION
Shares of Series B Term Preferred Stock shall be subject to redemption by the Corporation as provided below:
5.1. Term Redemption. The Corporation shall redeem all shares of Series B Term Preferred Stock on July 31, 2028 (the “Term Redemption Date”) at a price per share equal to the Redemption Price.
5.2. Asset Coverage Mandatory Redemption.
(a) If the Corporation fails to comply with the Asset Coverage requirement as provided in Section 4.1 as of the last Business Day of any Calendar Quarter and such failure is not cured as of the date that is thirty (30) calendar days following the date of filing of the Corporation’s Annual Report on Form N-CSR, Semiannual Report on Form N-CSRS or Reports on Form N-PORT, as applicable (each, an “SEC Report”) with the SEC with respect to such Calendar Quarter (such Business Day, the “Asset Coverage Cure Date”), the Corporation shall, to the extent permitted by the 1940 Act and Delaware law, by the close of business on such Asset Coverage Cure Date, fix a redemption date and proceed to redeem in accordance with the terms of such Preferred Stock, a sufficient number of shares of Preferred Stock, which at the Corporation’s sole option (to the extent permitted by the 1940 Act and Delaware law) may include any number or proportion of the shares of Series B Term Preferred Stock, to enable it to meet the requirements of Section 5.2(b). In the event that any shares of Series B Term Preferred Stock then Outstanding are to be redeemed pursuant to this Section 5.2(a), the Corporation shall redeem such shares at a price per share equal to the Redemption Price.
(b) On the redemption date for a redemption contemplated by Section 5.2(a), the Corporation shall redeem, out of funds legally available therefor, (x) such number of shares of Preferred Stock (which may include at the sole option of the Corporation any number or proportion of the shares of Series B Term Preferred Stock) that, when combined with any debt securities redeemed for failure to maintain the asset coverage required by the indenture governing such securities, the redemption of which, if deemed to
SB-6
have occurred immediately prior to the opening of business on the Asset Coverage Cure Date, would result in the Corporation having Asset Coverage on such Asset Coverage Cure Date of at least 200% (provided, however, that if there is no such minimum number of shares of Series B Term Preferred Stock and other shares of Preferred Stock the redemption or retirement of which would have such result, all shares of Series B Term Preferred Stock and other shares of Preferred Stock then Outstanding shall be redeemed), or (y) if fewer, the maximum number of shares of Preferred Stock that can be redeemed out of funds expected to be legally available therefor in accordance with the Certificate of Incorporation and applicable law, provided, further, that in connection with redemption for failure to maintain such Asset Coverage requirement, the Corporation may at its sole option, but is not required to, redeem a sufficient number of shares of Series B Term Preferred Stock pursuant to this Section 5.2 that, when aggregated with other shares of Preferred Stock redeemed by the Corporation, would result, if deemed to have occurred immediately prior to the opening of business on the Asset Coverage Cure Date, in the Corporation having Asset Coverage on such Asset Coverage Cure Date of up to and including 285%. The Corporation shall effect such redemption on the date fixed by the Corporation therefor, which date shall not be later than ninety (90) calendar days after such Asset Coverage Cure Date, except that if the Corporation does not have funds legally available for the redemption of all of the required number of shares of Series B Term Preferred Stock and other shares of Preferred Stock which have been designated to be redeemed or the Corporation otherwise is unable to effect such redemption on or prior to ninety (90) calendar days after such Asset Coverage Cure Date, the Corporation shall redeem those shares of Series B Term Preferred Stock and other shares of Preferred Stock which it was unable to redeem on the earliest practicable date on which it is able to effect such redemption. If fewer than all of the Outstanding shares of Series B Term Preferred Stock are to be redeemed pursuant to this Section 5.2, the number of shares of Series B Term Preferred Stock to be redeemed shall be redeemed (A) pro rata among the Outstanding shares of Series B Term Preferred Stock or (B) by lot.
5.3. Optional Redemption.
(a) Subject to the provisions of Section 5.3(b), on any Business Day following the expiration of the “No-Call Period,” which is the period beginning on the Date of Original Issue and ending at the close of business on July 31, 2025, the Corporation may redeem in whole or in part from time to time the Outstanding shares of Series B Term Preferred Stock at a price per share equal to the Redemption Price (any such Business Day referred to in this sentence, an “Optional Redemption Date”).
(b) If fewer than all of the Outstanding shares of Series B Term Preferred Stock are to be redeemed pursuant to Section 5.3(a), the shares of Series B Term Preferred Stock to be redeemed shall be selected either (A) pro rata or (B) by lot. Subject to the provisions of this Certificate of Designation and applicable law, the Board of Directors will have the full power and authority to prescribe the terms and conditions upon which shares of Series B Term Preferred Stock will be redeemed pursuant to this Section 5.3 from time to time.
(c) The Corporation may not on any date deliver a Notice of Redemption pursuant to Section 5.4 in respect of a redemption contemplated to be effected pursuant to this Section 5.3 unless on such date the Corporation has available Deposit Securities for the Optional Redemption Date contemplated by such Notice of Redemption having a Market Value not less than the amount due to Holders of shares of Series B Term Preferred Stock by reason of the redemption of such shares of Series B Term Preferred Stock on such Optional Redemption Date.
5.4. Procedures for Redemption.
(a) If the Corporation shall determine or be required to redeem, in whole or in part, shares of Series B Term Preferred Stock pursuant to Section 5.1, Section 5.2, or Section 5.3, the Corporation shall deliver a notice of redemption (the “Notice of Redemption”), by overnight delivery, by first class mail, postage prepaid, or by Electronic Means (as defined below) to Holders thereof, or request the Redemption and Paying Agent, on behalf of the Corporation, to promptly do so by overnight delivery, by first class mail, postage prepaid, or by Electronic Means. A Notice of Redemption shall be provided not less than thirty (30) nor more than sixty (60) calendar days prior to the date fixed for redemption in such Notice of Redemption (the “Redemption Date”). Each such Notice of Redemption shall state: (A) the Redemption Date; (B) the number of shares of Series B Term Preferred Stock to be redeemed; (C) the CUSIP number
SB-7
for shares of Series B Term Preferred Stock; (D) the applicable Redemption Price on a per share basis; (E) that dividends on the shares of Series B Term Preferred Stock to be redeemed will cease to accumulate from and after such Redemption Date; and (F) the provision(s) of this Certificate of Designation under which such redemption is made. If fewer than all shares of Series B Term Preferred Stock held by any Holder are to be redeemed, the Notice of Redemption delivered to such Holder shall also specify the number of shares of Series B Term Preferred Stock to be redeemed from such Holder or the method of determining such number. The Corporation may provide in any Notice of Redemption relating to a redemption contemplated to be effected pursuant to this Certificate of Designation that such redemption is subject to one or more conditions precedent and that the Corporation shall not be required to effect such redemption unless each such condition has been satisfied at the time or times and in the manner specified in such Notice of Redemption. No defect in the Notice of Redemption or delivery thereof shall affect the validity of redemption proceedings, except as required by applicable law.
“Electronic Means” means e-mail transmission, facsimile transmission or other similar electronic means of communication providing evidence of transmission (but excluding online communications systems covered by a separate agreement) acceptable to the sending party and the receiving party, in any case if operative as between any two parties, or, if not operative, by telephone (promptly confirmed by any other method set forth in this definition), which, in the case of notices to the Redemption and Paying Agent and the Custodian, shall be sent by such means to each of its representatives set forth in (i) the Redemption and Paying Agent Agreement, or other similarly titled agreement, by and among the Redemption and Paying Agent for the Series B Term Preferred Stock and the Corporation and (ii) the Custodian Agreement by and among the Custodian and the Corporation with respect to the Series B Term Preferred Stock, respectively.
(b) If the Corporation shall give a Notice of Redemption, then at any time from and after the giving of such Notice of Redemption and prior to 12:00 noon, New York City time, on the Redemption Date (so long as any conditions precedent to such redemption have been met or waived by the Corporation), the Corporation shall (A) deposit with the Redemption and Paying Agent Deposit Securities having an aggregate Market Value on the date thereof no less than the Redemption Price of the shares of Series B Term Preferred Stock to be redeemed on the Redemption Date and (B) give the Redemption and Paying Agent irrevocable instructions and authority to pay the applicable Redemption Price to the Holders of the shares of Series B Term Preferred Stock called for redemption on the Redemption Date. The Corporation may direct the Redemption and Paying Agent with respect to the investment of any Deposit Securities consisting of cash so deposited prior to the Redemption Date, provided, that the proceeds of any such investment shall be available at the opening of business on the Redemption Date as same day funds.
(c) Upon the date of the deposit of such Deposit Securities, which in the case of term redemption pursuant to Section 5.1, shall be no later than fifteen (15) calendar days prior to the Term Redemption Date, all rights of the Holders of the shares of Series B Term Preferred Stock so called for redemption shall cease and terminate except the right of the Holders thereof to receive the Redemption Price thereof and such shares of Series B Term Preferred Stock shall no longer be deemed Outstanding for any purpose whatsoever (other than (A) the transfer thereof prior to the applicable Redemption Date and (B) the accumulation of dividends thereon in accordance with the terms hereof up to (but excluding) the applicable Redemption Date, which accumulated dividends, unless previously or contemporaneously declared and paid as contemplated by Section 5.4(d) below, shall be payable only as part of the applicable Redemption Price on the Redemption Date). The Corporation shall be entitled to receive, promptly after the Redemption Date, any Deposit Securities in excess of the aggregate Redemption Price of the shares of Series B Term Preferred Stock called for redemption on the Redemption Date. Any Deposit Securities so deposited that are unclaimed at the end of ninety (90) calendar days from the Redemption Date shall, to the extent permitted by law, be repaid to the Corporation, after which the Holders of the shares of Series B Term Preferred Stock so called for redemption shall look only to the Corporation for payment of the Redemption Price thereof. The Corporation shall be entitled to receive, from time to time after the Term Redemption Date, any interest on the Deposit Securities so deposited.
(d) Notwithstanding the other provisions of this ARTICLE V, except as otherwise required by law, the Corporation shall not redeem any shares of Series B Term Preferred Stock unless all accumulated and
SB-8
unpaid dividends and distributions on all Outstanding shares of Series B Term Preferred Stock and other series of Preferred Stock ranking on a parity with the Series B Term Preferred Stock with respect to dividends and distributions for all applicable past Dividend Periods (whether or not earned or declared by the Corporation) (x) shall have been or are contemporaneously paid or (y) shall have been or are contemporaneously declared and Deposit Securities or sufficient funds (in accordance with the terms of such Preferred Stock) for the payment of such dividends and distributions shall have been or are contemporaneously deposited with the Redemption and Paying Agent or other applicable paying agent for such Preferred Stock in accordance with the terms of such Preferred Stock, provided, however, that the foregoing shall not prevent the purchase or acquisition of Outstanding shares of Series B Term Preferred Stock pursuant to an otherwise lawful purchase or exchange offer made on the same terms to Holders of all Outstanding shares of Series B Term Preferred Stock and any other series of Preferred Stock for which all accumulated and unpaid dividends and distributions have not been paid.
(e) To the extent that any redemption for which Notice of Redemption has been provided is not made by reason of the absence of legally available funds therefor in accordance with the Certificate of Incorporation and applicable law, such redemption shall be made as soon as practicable to the extent such funds become available. No Redemption Default shall be deemed to have occurred if the Corporation shall fail to deposit in trust with the Redemption and Paying Agent the Redemption Price with respect to any shares where (1) the Notice of Redemption relating to such redemption provided that such redemption was subject to one or more conditions precedent and (2) any such condition precedent shall not have been satisfied at the time or times and in the manner specified in such Notice of Redemption. Notwithstanding the fact that a Notice of Redemption has been provided with respect to any shares of Series B Term Preferred Stock, dividends may be declared and paid on the shares of Series B Term Preferred Stock in accordance with their terms if Deposit Securities for the payment of the Redemption Price of such shares of Series B Term Preferred Stock shall not have been deposited in trust with the Redemption and Paying Agent for that purpose.
5.5. Redemption Date After Record Date and Before Dividend Payment Date. Notwithstanding Section 5.1, Section 5.2, and Section 5.3, if any Redemption Date occurs after the applicable Record Date for a dividend, but on or prior to the related Dividend Payment Date, the dividend payable on such Dividend Payment Date in respect of such Series B Term Preferred Stock shall be payable on such Dividend Payment Date to the Holders of record of such shares of Series B Term Preferred Stock at the close of business on the applicable Record Date, and shall not be payable as part of the Redemption Price for such shares of Series B Term Preferred Stock.
5.6. Redemption and Paying Agent as Trustee of Redemption Payments by Corporation. All Deposit Securities transferred to the Redemption and Paying Agent for payment of the Redemption Price of the shares of Series B Term Preferred Stock called for redemption shall be held in trust by the Redemption and Paying Agent for the benefit of Holders of shares of Series B Term Preferred Stock so to be redeemed until paid to such Holders in accordance with the terms hereof or returned to the Corporation in accordance with the provisions of Section 5.4(c) above.
5.7. Compliance with Applicable Law. In effecting any redemption pursuant to this ARTICLE V, the Corporation shall use its best efforts to comply with all applicable conditions precedent to effecting such redemption under the 1940 Act and any applicable Delaware law, but shall effect no redemption except in accordance with the 1940 Act and any applicable Delaware law.
5.8. Modification of Redemption Procedures. Notwithstanding the foregoing provisions of this ARTICLE V, the Corporation may, in its sole discretion and without a stockholder vote, modify the procedures set forth above with respect to notification of redemption for the shares of Series B Term Preferred Stock, provided, that such modification does not materially and adversely affect the Holders of the shares of Series B Term Preferred Stock or cause the Corporation to violate any applicable law, rule or regulation; and provided, further, that no such modification shall in any way alter the rights or obligations of the Redemption and Paying Agent without its prior consent.
ARTICLE VI
VOTING RIGHTS
VOTING RIGHTS
6.1. One Vote Per Share of Series B Term Preferred Stock. Except as otherwise provided in the Certificate of Incorporation or as otherwise required by applicable law, (i) each Holder of shares of Series B
SB-9
Term Preferred Stock shall be entitled to one vote for each share of Series B Term Preferred Stock held by such Holder on each matter submitted to a vote of stockholders of the Corporation, and (ii) the Holders of Outstanding shares of Preferred Stock, including Outstanding shares of Series B Term Preferred Stock, and holders of outstanding shares of Common Stock shall vote together as a single class; provided, however, that the Holders of Outstanding shares of Preferred Stock, including Outstanding shares of Series B Term Preferred Stock, shall be entitled, as a class, to the exclusion of the Holders of all other securities and classes of Capital Stock of the Corporation, to elect two Directors of the Corporation at all times. Subject to Section 6.2, the Holders of outstanding shares of Common Stock and Preferred Stock, including shares of Series B Term Preferred Stock, voting together as a single class, shall elect the balance of the Directors.
6.2. Voting For Additional Directors.
(a) Voting Period. During any period in which any one or more of the conditions described in clauses (i) or (ii) of this Section 6.2(a) shall exist (such period being referred to herein as a “Voting Period”), the number of Directors constituting the Board of Directors shall be automatically increased by the smallest number that, when added to the two Directors elected exclusively by the Holders of Preferred Stock, including shares of Series B Term Preferred Stock, would constitute a majority of the Board of Directors as so increased by such smallest number; and the Holders of Preferred Stock, including Series B Term Preferred Stock, shall be entitled, voting as a class on a one-vote-per-share basis (to the exclusion of the Holders of all other securities and classes of Capital Stock of the Corporation), to elect such smallest number of additional Directors, together with the two Directors that such Holders are in any event entitled to elect. A Voting Period shall commence:
(i)
if, at the close of business on any dividend payment date for any Outstanding shares of Preferred Stock including any Outstanding shares of Series B Term Preferred Stock, accumulated dividends (whether or not earned or declared) on such Outstanding shares of Preferred Stock equal to at least two (2) full years’ dividends shall be due and unpaid and sufficient cash or specified securities shall not have been deposited with the Redemption and Paying Agent or other applicable paying agent for the payment of such accumulated dividends; or
(ii)
if at any time Holders of shares of Preferred Stock are otherwise entitled under the applicable provisions of the 1940 Act to elect a majority of the Board of Directors.
Upon the termination of a Voting Period, the voting rights described in this Section 6.2(a) shall cease, subject always, however, to the revesting of such voting rights in the Holders of shares of Preferred Stock upon the further occurrence of any of the events described in this Section 6.2(a).
(b) Notice of Special Meeting. As soon as practicable after the accrual of any right of the Holders of shares of Preferred Stock to elect additional Directors as described in Section 6.2(a), the Corporation shall call a special meeting of such Holders and notify the Redemption and Paying Agent and/or such other Person as is specified in the terms of such Preferred Stock to receive notice (i) by mailing or delivery by Electronic Means or (ii) in such other manner and by such other means as are specified in the terms of such Preferred Stock, a notice of such special meeting to such Holders, such meeting to be held not less than ten (10) nor more than thirty (30) calendar days after the date of the delivery by Electronic Means or mailing of such notice. If the Corporation fails to call such a special meeting, it may be called at the expense of the Corporation by any such Holder on like notice. The record date for determining the Holders of shares of Preferred Stock entitled to notice of and to vote at such special meeting shall be the close of business on the Business Day preceding the calendar day on which such notice is mailed. At any such special meeting and at each meeting of Holders of shares of Preferred Stock held during a Voting Period at which Directors are to be elected, such Holders, voting together as a class (to the exclusion of the Holders of all other securities and classes of Capital Stock of the Corporation), shall be entitled to elect the number of Directors prescribed in Section 6.2(a) on a one-vote-per-share basis.
(c) Terms of Office of Existing Directors. The terms of office of the incumbent Directors of the Corporation at the time of a special meeting of Holders of the shares of Preferred Stock to elect additional Directors in accordance with Section 6.2(a) shall not be affected by the election at such meeting by the Holders of shares of Series B Term Preferred Stock and such other Holders of shares of Preferred Stock of the number of Directors that they are entitled to elect, and the Directors so elected by the
SB-10
Holders of shares of Series B Term Preferred Stock and such other Holders of shares of Preferred Stock, together with the two (2) Directors elected by the Holders of shares of Preferred Stock in accordance with Section 6.1 hereof and the remaining Directors elected by the Holders of the shares of Common Stock and Preferred Stock, shall constitute the duly elected Directors of the Corporation.
(d) Terms of Office of Certain Directors to Terminate Upon Termination of Voting Period. Simultaneously with the termination of a Voting Period, the terms of office of the additional Directors elected by the Holders of the shares of Preferred Stock pursuant to Section 6.2(a) shall terminate, the remaining Directors shall constitute the Directors of the Corporation and the voting rights of the Holders of shares of Preferred Stock to elect additional Directors pursuant to Section 6.2(a) shall cease, subject to the provisions of the last sentence of Section 6.2(a).
6.3. Holders of Shares of Series B Term Preferred Stock to Vote on Certain Matters.
(a) Certain Amendments Requiring Approval of Preferred Stock. Except as otherwise permitted by the terms of this Certificate of Designation, (1) so long as any shares of Preferred Stock are Outstanding, the Corporation shall not, without the affirmative vote or consent of the Holders of at least two-thirds of the shares of Preferred Stock Outstanding at the time, voting together as a separate class, amend, alter or repeal the provisions of the Certificate of Incorporation or this Certificate of Designation (or any other document governing the rights of the Preferred Stock or the Holders thereof as may be required by the rules of any applicable securities exchange), whether by merger, consolidation or otherwise, so as to materially and adversely affect any preference, right or power of such shares of the Preferred Stock or the Holders thereof and (2) so long as any shares of Series B Term Preferred Stock are Outstanding, the Corporation shall not, without the affirmative vote or consent of the Holders of at least two-thirds of the shares of Series B Term Preferred Stock Outstanding at the time, voting together as a separate class, amend, alter or repeal the provisions of the Certificate of Incorporation or this Certificate of Designation (or any other document governing the rights of the Series B Term Preferred Stock or the Holders thereof as may be required by the rules of any applicable securities exchange), whether by merger, consolidation or otherwise, so as to materially and adversely affect any preference, right or power of such shares of the Series B Term Preferred Stock or the Holders thereof differently than shares of any other series of Preferred Stock; provided, however, that for purposes of this Section 6.3(a), (i) a change in the capitalization of the Corporation in accordance with Section 7.1 hereof shall not be considered to materially and adversely affect the rights and preferences of the Preferred Stock, including the Series B Term Preferred Stock, and (ii) a division of a share of the Preferred Stock, including the Series B Term Preferred Stock, shall be deemed to affect such preferences, rights or powers only if the terms of such division materially and adversely affect the Holders of the shares. For purposes of the foregoing, no matter shall be deemed to adversely affect any preference, right or power of a share of Preferred Stock or any series thereof, or the Holder of any such share unless such matter (x) alters or abolishes any preferential right of such share of Preferred Stock, or (y) creates, alters or abolishes any right in respect of redemption of such share (other than as a result of a division of a share of Preferred Stock). So long as any shares of Preferred Stock are Outstanding, the Corporation shall not, without the affirmative vote or consent of at least two-thirds of the Holders of the shares of Preferred Stock Outstanding at the time, voting as a separate class, file a voluntary application for relief under federal bankruptcy law or any similar application under state law for so long as the Corporation is solvent and does not foresee becoming insolvent.
(b) Certain Amendments Requiring Approval of Series B Term Preferred Stock. The Corporation cannot effect any amendment, alteration or repeal of the obligation to redeem all of the Series B Term Preferred Stock on July 31, 2028 without the prior unanimous consent of the Holders of Series B Term Preferred Stock.
(c) 1940 Act Matters. Unless a higher percentage is provided for in the Certificate of Incorporation, the affirmative vote of the Holders of at least “a majority of the outstanding shares of Preferred Stock,” including shares of Series B Term Preferred Stock Outstanding at the time, voting as a separate class, shall be required (A) to approve any plan of reorganization (as such term is used in the 1940 Act) adversely affecting such shares or (B) any action requiring a vote of Holders of the Corporation’s securities pursuant to Section 13(a) of the 1940 Act. For purposes of the foregoing, the vote of a “majority of the outstanding shares of Preferred Stock” means the vote at an annual or special
SB-11
meeting duly called of (i) sixty-seven percent (67%) or more of such shares present at a meeting, if the Holders of more than fifty percent (50%) of such shares are present or represented by proxy at such meeting, or (ii) more than fifty percent (50%) of such shares, whichever is less.
6.4. Voting Rights Set Forth Herein Are Sole Voting Rights. Unless otherwise required by law or the Certificate of Incorporation, the Holders of shares of Series B Term Preferred Stock shall not have any relative rights or preferences or other special rights with respect to voting other than those specifically set forth in this ARTICLE VI.
6.5. No Cumulative Voting. The Holders of shares of Series B Term Preferred Stock shall have no rights to cumulative voting.
6.6. Voting for Directors Sole Remedy for Corporation’s Failure to Declare or Pay Dividends. In the event that the Corporation fails to declare or pay any dividends on shares of Series B Term Preferred Stock on the Dividend Payment Date therefor, the exclusive remedy of the Holders of the shares of Series B Term Preferred Stock shall be the right to vote for Directors pursuant to the provisions of this ARTICLE VI. Nothing in this Section 6.6 shall be deemed to affect the obligation of the Corporation to accumulate and, if permitted by applicable law, the Certificate of Incorporation and this Certificate of Designation, pay dividends at the Default Rate in the circumstances contemplated by Section 2.8 hereof.
6.7. Holders Entitled to Vote. For purposes of determining any rights of the Holders of shares of Series B Term Preferred Stock to vote on any matter, whether such right is created by this Certificate of Designation, by the Certificate of Incorporation, by statute or otherwise, no Holder of shares of Series B Term Preferred Stock shall be entitled to vote any share of Series B Term Preferred Stock and no share of Series B Term Preferred Stock shall be deemed to be “Outstanding” for the purpose of voting or determining the number of shares required to constitute a quorum if, prior to or concurrently with the time of determination of shares entitled to vote or the time of the actual vote on the matter, as the case may be, the requisite Notice of Redemption with respect to such share of Series B Term Preferred Stock shall have been given in accordance with this Certificate of Designation and Deposit Securities for the payment of the Redemption Price of such share of Series B Term Preferred Stock shall have been deposited in trust with the Redemption and Paying Agent for that purpose. No share of Series B Term Preferred Stock held by the Corporation shall have any voting rights or be deemed to be Outstanding for voting or for calculating the voting percentage required on any other matter or other purposes.
ARTICLE VII
MISCELLANEOUS
MISCELLANEOUS
7.1. Issuance of Additional Preferred Stock. So long as any shares of Series B Term Preferred Stock are Outstanding, the Corporation may, without the vote or consent of the Holders thereof, (a) authorize, establish and create and issue and sell shares of one or more series of a class of senior securities of the Corporation representing stock under Section 18 of the 1940 Act, ranking on a parity with the Series B Term Preferred Stock as to the payment of dividends and the distribution of assets upon dissolution, liquidation or the winding up of the affairs of the Corporation, in addition to then Outstanding shares of Series B Term Preferred Stock, and (b) authorize, issue and sell additional shares of any such series then Outstanding or so established and created, including additional shares of Series B Term Preferred Stock, in each case in accordance with applicable law, provided that the Corporation shall, immediately after giving effect to the issuance of such additional shares of Preferred Stock and to its receipt and application of the proceeds thereof, including to the redemption of shares of Preferred Stock with such proceeds, have Asset Coverage (calculated in the same manner as is contemplated by Section 4.2 hereof) of at least 200%.
7.2. Status of Redeemed or Repurchased Series B Term Preferred Stock. Shares of Series B Term Preferred Stock that at any time have been redeemed or purchased by the Corporation shall, after such redemption or purchase, have the status of authorized but unissued shares of Capital Stock.
7.3. Registered Name. Prior to the commencement of a Voting Period, (i) all shares of Series B Term Preferred Stock Outstanding from time to time shall be registered in the name of the Depository Trust Company and its successors and assigns, or any other securities depository selected by the Corporation that agrees to follow the procedures required to be followed by such securities depository as set forth in this
SB-12
Certificate of Designation with respect to the Series B Term Preferred Stock (the “Securities Depository”) or its nominee and (ii) no registration of transfer of shares of such Series B Term Preferred Stock shall be made on the books of the Corporation to any Person other than the Securities Depository or its nominee.
7.4. Notice. All notices or communications hereunder, unless otherwise specified in this Certificate of Designation, shall be sufficiently given if in writing and delivered in person, by Electronic Means or by overnight mail or delivery or mailed by first-class mail, postage prepaid. Notices delivered pursuant to this Section 7.4 shall be deemed given on the date received or, if mailed by first class mail, on the date five (5) calendar days after which such notice is mailed.
7.5. Termination. In the event that no shares of Series B Term Preferred Stock are Outstanding, all rights and preferences of the shares of Series B Term Preferred Stock established and designated hereunder shall cease and terminate, and all obligations of the Corporation under this Certificate of Designation with respect to such Series B Term Preferred Stock shall terminate.
7.6. Amendment. The Board of Directors may, by resolution duly adopted, without stockholder approval (except as otherwise provided by this Certificate of Designation or required by applicable law) amend this Certificate of Designation so as to reflect any amendments to the terms applicable to the Series B Term Preferred Stock, including an increase in the number of authorized shares of the Series B Term Preferred Stock.
7.7. Actions on Other than Business Days. Unless otherwise provided herein, if the date for making any payment, performing any act or exercising any right, in each case as provided for in this Certificate of Designation, is not a Business Day, such payment shall be made, act performed or right exercised on the next succeeding Business Day, with the same force and effect as if made or done on the nominal date provided therefor, and, with respect to any payment so made, no dividends, interest or other amount shall accrue for the period between such nominal date and the date of payment.
7.8. Modification. The Board of Directors, without the vote of the Holders of Series B Term Preferred Stock, may interpret, supplement or amend the provisions of this Certificate of Designation to supply any omission, resolve any inconsistency or ambiguity or to cure, correct or supplement any defective or inconsistent provision, including any provision that becomes defective after the date hereof because of impossibility of performance or any provision that is inconsistent with any provision of any other Capital Stock of the Corporation.
7.9. Information Rights. During any period in which the Corporation is not subject to the reporting requirements of Section 13 or 15(d) of the Securities Exchange Act of 1934, as amended (the “Exchange Act”), and any shares of Series B Term Preferred Stock are Outstanding, the Corporation will provide Holders of Series B Term Preferred Stock, without cost, copies of SEC Reports that the Corporation would have been required to file pursuant to Section 13 or 15(d) of the Exchange Act if the Corporation was subject to such provisions or, alternatively, the Corporation will voluntarily file SEC Reports as if the Corporation was subject to Section 13 or 15(d) of the Exchange Act.
7.10. No Additional Rights. Unless otherwise required by law or the Certificate of Incorporation, the Holders of shares of Series B Term Preferred Stock shall not have any relative rights or preferences or other special rights other than those specifically set forth in this Certificate of Designation.
7.11. Interpretation.
(a) The headings preceding the text of the Articles and Sections included in this Certificate of Designation are for convenience only and shall not be deemed part of this Certificate of Designation or be given any effect in interpreting this Certificate of Designation. The use of the masculine, feminine or neuter gender or the singular or plural form of words herein shall not limit any provision of this Certificate of Designation. The use of the terms “including” or “include” shall in all cases herein mean “including, without limitation” or “include, without limitation,” respectively. Reference to any Person includes such Person’s successors and assigns to the extent such successors and assigns are permitted by the terms of any applicable agreement, and reference to a Person in a particular capacity excludes such Person in any other capacity or individually.
SB-13
(b) Reference to any agreement (including this Certificate of Designation), document or instrument means such agreement, document or instrument as amended or modified and in effect from time to time in accordance with the terms thereof and, if applicable, the terms hereof. Except as otherwise expressly set forth herein, reference to any law means such law as amended, modified, codified, replaced or re-enacted, in whole or in part, including rules, regulations, enforcement procedures and any interpretations promulgated thereunder. Underscored references to Articles and Sections shall refer to those portions of this Certificate of Designation. The use of the terms “hereunder,” “hereof,” “hereto” and words of similar import shall refer to this Certificate of Designation as a whole and not to any particular Article, Section or clause of this Certificate of Designation.
[Signature Page Follows]
SB-14
IN WITNESS WHEREOF, the Corporation has caused this Certificate of Designation to be duly executed by its duly authorized officer as of this 25th day of July 2023.
EAGLE POINT INCOME COMPANY INC.
By:
/s/ Thomas P. Majewski
Name:
Thomas P. Majewski
Title:
Chief Executive Officer
SB-15
$250,000,000
Eagle Point Income Company Inc.
Common Stock
Preferred Stock
Subscription Rights
Debt Securities
Preferred Stock
Subscription Rights
Debt Securities
We are an externally managed, diversified closed-end management investment company that has registered as an investment company under the Investment Company Act of 1940, as amended, or the “1940 Act.” Our primary investment objective is to generate high current income, with a secondary objective to generate capital appreciation. We seek to achieve our investment objectives by investing primarily in junior debt tranches of collateralized loan obligations, or “CLOs,” that are collateralized by a portfolio consisting primarily of below investment grade U.S. senior secured loans with a large number of distinct underlying borrowers across various industry sectors. We focus on CLO debt tranches rated “BB” (e.g., BB+, BB or BB-, or their equivalent) by Moody’s Investors Service, Inc., or “Moody’s,” S&P Global Ratings, or “S&P,” or Fitch Ratings, Inc., or “Fitch,” and/or other applicable nationally recognized statistical rating organizations. We refer to such debt tranches in this prospectus as “BB-Rated CLO Debt.” We may also invest in other junior debt tranches of CLOs, senior debt tranches of CLOs, loan accumulation facilities (“LAF”) and other related securities and instruments, including synthetic investments, such as significant risk transfer securities and credit risk transfer securities issued by banks or other financial institutions. In addition, we may invest up to 35% of our total assets (at the time of investment) in CLO equity securities and related securities and instruments. We expect our investments in CLO equity securities to primarily reflect minority ownership positions. CLO junior debt and equity securities are highly leveraged, and therefore the CLO securities in which we intend to invest are subject to a higher degree of loss since the use of leverage magnifies losses. See “Risk Factors — Risks Related to Our Investments — We may leverage our portfolio, which would magnify the potential for gain or loss on amounts invested and will increase the risk of investing in us.” We may also invest in other securities and instruments that our investment adviser believes are consistent with our investment objectives. The CLO securities in which we primarily seek to invest are rated below investment grade or, in the case of CLO equity securities, are unrated and are considered speculative with respect to timely payment of interest and repayment of principal. Below investment grade and unrated securities are also sometimes referred to as “junk” securities.
Eagle Point Income Management LLC, or “Eagle Point Income Management” or the “Adviser,” our investment adviser, manages our investments subject to the supervision of our board of directors. An affiliate of the Adviser, Eagle Point Credit Management LLC, or “Eagle Point Credit Management,” provides investment professionals and other resources to the Adviser as the Adviser may determine to be reasonably necessary to conduct its operations. As of March 31, 2023, the Adviser, collectively with Eagle Point Credit Management, had approximately $7.8 billion in total assets under management, including capital commitments that were undrawn as of such date. Eagle Point Administration LLC, an affiliate of the Adviser, or the “Administrator,” serves as our administrator.
We may offer, from time to time, in one or more offerings or series, together or separately, up to $250,000,000 of our common stock, preferred stock, subscription rights or debt securities, which we refer to, collectively, as the “securities.” We may sell our securities through underwriters or dealers, “at-the-market” to or through a market maker into an existing trading market or otherwise directly to one or more purchasers or through agents or through a combination of methods of sale. The identities of such underwriters, dealers, market makers or agents, as the case may be, will be described in one or more supplements to this prospectus. The securities may be offered at prices and on terms to be described in one or more supplements to this prospectus. In the event we offer common stock, the offering price per share of our common stock exclusive of any underwriting commissions or discounts will not be less than the net asset value, or “NAV,” per share of our common stock at the time we make the offering except (1) in connection with a rights offering to our existing stockholders, (2) with the consent of the majority of our common stockholders, (3) upon the conversion of a convertible security in accordance with its terms or (4) under such circumstances as the Securities and Exchange Commission, or the “SEC,” may permit.
Our common stock and Series A Term Preferred Stock due 2026 trade on the New York Stock Exchange under the symbols “EIC” and “EICA,” respectively. The last reported closing sales price for our common stock on June 26, 2023 was $13.07 per share. We determine the NAV per share of our common stock on a quarterly basis. As of March 31, 2023, the NAV per share of our common stock was $13.20 (the last date prior to the date of this prospectus as of which we determined our NAV). Management’s unaudited estimate of the range of our NAV per share of our common stock as of May 31, 2023 was between $12.67 and $12.77 .
Shares of common stock of closed-end management investment companies that are listed on an exchange frequently trade at a discount to their NAV. If our shares of common stock trade at a discount to our NAV, it will likely increase the risk of loss for purchasers of our securities.
Investing in our securities involves a high degree of risk, including the risk of a substantial loss of investment. Before purchasing any securities, you should read the discussion of the principal risks of investing in our securities, which are summarized in “Risk Factors” beginning on page 13 of this prospectus.
This prospectus contains important information you should know before investing in our securities. Please read this prospectus and retain it for future reference. We file annual and semi-annual stockholder reports, proxy statements and other information with the Securities and Exchange Commission, or the “SEC.” To obtain this information free of charge or make other inquiries pertaining to us, please visit our website (www.eaglepointincome.com) or call (844) 810-6501 (toll-free). You may also obtain a copy of any information regarding us filed with the SEC from the SEC’s website (www.sec.gov).
As of June 26, 2023, the aggregate market value of our outstanding common stock held by non-affiliates, or the “public float,” is approximately $75.5 million, which is calculated based on 5,075,003 shares of outstanding common stock held by non-affiliates and on a price per share of $14.88, the closing price of our common stock on May 9, 2023. As of June 26, 2023, our public float reflected approximately 68% of our NAV as of March 31, 2023. Pursuant to certain SEC rules, to the extent applicable, in no event will we sell our securities in a public primary offering with a value exceeding more than one-third of our public float in any 12-month period so long as our public float is below $75.0 million. We have sold 1,764,933 shares of our common stock pursuant to the SEC rules noted above during the 12 calendar months prior to and including the date of this prospectus.
Neither the SEC nor any state securities commission has approved or disapproved of these securities or determined that this prospectus is truthful or complete. Any representation to the contrary is a criminal offense.
This prospectus may not be used to consummate sales of securities unless accompanied by a prospectus supplement.
The date of this prospectus is June 28, 2023
TABLE OF CONTENTS
| | | |
Page
|
| |||
| | | | | 1 | | | |
| | | | | 12 | | | |
| | | | | 13 | | | |
| | | | | 51 | | | |
| | | | | 51 | | | |
| | | | | 51 | | | |
| | | | | 52 | | | |
| | | | | 55 | | | |
| | | | | 61 | | | |
| | | | | 65 | | | |
| | | | | 65 | | | |
| | | | | 65 | | | |
| | | | | 71 | | | |
| | | | | 82 | | | |
| | | | | 83 | | | |
| | | | | 89 | | | |
| | | | | 90 | | | |
| | | | | 92 | | | |
| | | | | 101 | | | |
| | | | | 103 | | | |
| | | | | 105 | | | |
| | | | | 109 | | | |
| | | | | 113 | | | |
| | | | | 114 | | | |
| | | | | 114 | | | |
| | | | | 114 | | | |
| | | | | 114 | | | |
| | | | | 114 | | | |
| | | | | 114 | | | |
******
You should rely only on the information contained or incorporated by reference in this prospectus. We have not authorized any other person to provide you with different information. If anyone provides you with different or inconsistent information, you should not rely on it. We are not making an offer to sell these securities in any jurisdiction where the offer or sale is not permitted. You should assume that the information appearing in this prospectus is accurate only as of the date on the front cover of this prospectus. Our business, financial condition and results of operations may have changed since that date. We will notify securityholders promptly of any material change to this prospectus during the period in which we are required to deliver the prospectus.
i
ABOUT THIS PROSPECTUS
This prospectus is part of a registration statement that we have filed with the SEC using the “shelf” registration process. Under the shelf registration process, we may offer from time to time up to $250,000,000 of our securities on the terms to be determined at the time of the offering. We may sell our securities through underwriters or dealers, “at-the-market” to or through a market maker, into an existing trading market or otherwise directly to one or more purchasers or through agents or through a combination of methods of sale. The identities of such underwriters, dealers, market makers or agents, as the case may be, will be described in one or more supplements to this prospectus. The securities may be offered at prices and on terms described in one or more supplements to this prospectus. This prospectus provides you with a general description of the securities that we may offer. Each time we use this prospectus to offer securities, we will provide a prospectus supplement that will contain specific information about the terms of that offering. The prospectus supplement may also add, update or change information contained in this prospectus, and the prospectus and prospectus supplement will together serve as the prospectus. Please carefully read this prospectus and any prospectus supplement, together with any exhibits, before you make an investment decision.
ii
PROSPECTUS SUMMARY
The following summary highlights some of the information contained in this prospectus. It is not complete and may not contain all the information that is important to a decision to invest in our securities. You should read carefully the more detailed information set forth under “Risk Factors” and the other information included in this prospectus and any applicable prospectus supplement. Except where the context suggests otherwise, the terms:
•
The “Company,” “we,” “us,” and “our” refer to Eagle Point Income Company Inc., a Delaware corporation, or, for periods prior to our conversion to a corporation on October 16, 2018, EP Income Company LLC, a Delaware limited liability company;
•
The “Adviser” refers to Eagle Point Income Management LLC, a Delaware limited liability company;
•
The “Administrator” refers to Eagle Point Administration LLC, a Delaware limited liability company; and
•
“Risk-adjusted returns” refers to the profile of expected asset returns across a range of potential macroeconomic scenarios, and does not imply that a particular strategy or investment should be considered low-risk.
Eagle Point Income Company Inc.
We are an externally managed, diversified closed-end management investment company that has registered as an investment company under the 1940 Act. We have elected to be treated, and intend to qualify annually, as a regulated investment company, or “RIC,” under Subchapter M of the Internal Revenue Code of 1986, as amended, or the “Code,” beginning with our tax year ended December 31, 2018.
Our primary investment objective is to generate high current income, with a secondary objective to generate capital appreciation. We seek to achieve our investment objectives by investing primarily in junior debt tranches of CLOs that are collateralized by a portfolio consisting primarily of below investment grade U.S. senior secured loans with a large number of distinct underlying borrowers across various industry sectors. We focus on CLO debt tranches rated “BB” (e.g., BB+, BB or BB-, or their equivalent) by Moody’s, S&P or Fitch, and/or other applicable nationally recognized statistical rating organizations. We refer to such debt tranches in this prospectus as “BB-Rated CLO Debt.” We may also invest in other junior debt tranches of CLOs, senior debt tranches of CLOs, LAFs and other related securities and instruments, including synthetic investments, such as significant risk transfer securities and credit risk transfer securities issued by banks or other financial institutions. In addition, we may invest up to 35% of our total assets (at the time of investment) in CLO equity securities and related securities and instruments. We expect our investments in CLO equity securities to primarily reflect minority ownership positions. CLO junior debt and equity securities are highly leveraged, and therefore the CLO securities in which we intend to invest are subject to a higher degree of loss since the use of leverage magnifies losses. See “Risk Factors — Risks Related to Our Investments — We may leverage our portfolio, which would magnify the potential for gain or loss on amounts invested and will increase the risk of investing in us.” We may also invest in other securities and instruments that the Adviser believes are consistent with our investment objectives such as securities issued by other securitization vehicles, such as collateralized bond obligations, or “CBOs.” The amount that we will invest in other securities and instruments, which may include investments in debt and other securities issued by CLOs collateralized by non-U.S. loans or securities of other collective investment vehicles, will vary from time to time and, as such, may constitute a material part of our portfolio on any given date, all as based on the Adviser’s assessment of prevailing market conditions. The CLO securities in which we primarily seek to invest are rated below investment grade or, in the case of CLO equity securities, are unrated, and are considered speculative with respect to timely payment of interest and repayment of principal. Unrated and below investment grade securities are also sometimes referred to as “junk” securities.
These investment objectives and strategies are not fundamental policies of ours and may be changed by our board of directors without prior approval of our stockholders. See “Business.”
We pursue a differentiated strategy within the CLO debt market premised upon our Adviser’s strong emphasis on assessing the skill of CLO collateral managers and analyzing the structure of a CLO.
1
We seek to construct a portfolio of CLO securities that provides varied exposure across several key categories, including number and investment style of CLO collateral managers and CLO vintage period.
We believe that we are structured as an efficient vehicle for investors to gain exposure to the types of CLO securities and related investments historically accessed by primarily institutional investors. We believe that our closed-end fund structure allows the Adviser to take a long-term view from a portfolio management perspective without the uncertainty posed by redemptions in an open-end fund structure. As such, the Adviser can focus principally on maximizing long-term risk-adjusted returns for the benefit of stockholders.
We believe that the Senior Investment Team’s (as defined below) direct and often longstanding relationships with CLO collateral managers and its CLO structural expertise and the relative scale of the Adviser and its affiliates in the CLO market are competitive advantages as we seek to achieve our investment objectives.
Eagle Point Income Management
The Adviser manages our investments subject to the supervision of our board of directors pursuant to an investment advisory agreement, or the “Investment Advisory Agreement.” An affiliate of the Adviser, Eagle Point Credit Management, provides investment professionals and other resources under a personnel and resources agreement, or the “Personnel and Resources Agreement,” to the Adviser as the Adviser may determine to be reasonably necessary to the conduct of its operations. An affiliate of the Adviser, Eagle Point Administration, performs, or arranges for the performance of, our required administrative services. For a description of the fees and expenses that we pay to the Adviser and the Administrator, see “The Adviser and the Administrator — Investment Advisory Agreement — Management Fee” and “The Adviser and the Administrator — The Administrator and the Administration Agreement.”
The Adviser was established in September 2018 and is registered as an investment adviser with the SEC. As of March 31, 2023, the Adviser, collectively with Eagle Point Credit Management, had approximately $7.8 billion of total assets under management (including capital commitments that were undrawn as of such date). Based on Eagle Point Credit Management’s CLO equity assets under management, the Adviser believes that, collectively with Eagle Point Credit Management, it is among the largest CLO equity investors in the market. The Adviser is primarily owned by certain of the Trident Funds (as defined below) through intermediary holding companies. Additionally, the Senior Investment Team, certain other employees of Eagle Point Credit Management, and an affiliate of Enstar Group Limited, or “Enstar,” hold indirect ownership interests in the Adviser. The Adviser is ultimately governed through intermediary holding companies by a board of managers, or the “Adviser’s Board of Managers,” which includes Mr. Majewski and certain principals of Stone Point. See “The Adviser and the Administrator.”
Eagle Point Credit Management was established in 2012 by Thomas P. Majewski and Stone Point Capital LLC, or “Stone Point,” as investment manager of the Trident Funds and related investment vehicles, which we refer to collectively as the “Trident Funds.” Stone Point, an investment adviser registered with the SEC, is a specialized private equity firm focused on the financial services industry.
The “Senior Investment Team” is led by Mr. Majewski, Managing Partner of the Adviser, and is also comprised of Daniel W. Ko, Senior Principal and Portfolio Manager, and Daniel M. Spinner, Senior Principal and Portfolio Manager. The Senior Investment Team is primarily responsible for our day-to-day investment management and the implementation of our investment strategy and process.
Each member of the Senior Investment Team is a CLO industry specialist who has been directly involved in the CLO market for the majority of his career and has built relationships with key market participants, including CLO collateral managers, investment banks and investors. Members of the Senior Investment Team have been involved in the CLO market as:
•
the head of the CLO business at various investment banks;
•
a lead CLO structurer and collateralized debt obligation (“CDO”) workout specialist at an investment bank;
•
a CLO equity and debt investor;
2
•
principal investors in CLO collateral management firms; and
•
a lender and mergers and acquisitions adviser to CLO collateral management firms.
We believe that the complementary, yet highly specialized, skill set of each member of the Senior Investment Team provides the Adviser with a competitive advantage in its CLO-focused investment strategy. See “The Adviser and the Administrator — Portfolio Managers.”
In addition to managing our investments, the Adviser and its affiliates and the members of the Senior Investment Team manage investment accounts for other clients, including Eagle Point Credit Company Inc., or “Eagle Point Credit Company” or “ECC,” a publicly traded closed-end management investment company that is registered under the 1940 Act and for which Eagle Point Credit Management serves as investment adviser and Eagle Point Institutional Income Fund, or “Eagle Point Institutional Income” or “EPIIF,” a non-listed, closed-end management investment company that is registered under the 1940 Act and for which Eagle Point Credit Management serves as investment adviser, privately offered pooled investment vehicles and institutional separate accounts. Many of these accounts pursue an investment strategy that substantially or partially overlaps with the strategy that we pursue. See “Risk Factors — Risks Related to Our Business and Structure — There are significant actual and potential conflicts of interest which could impact our investment returns.”
CLO Overview
The CLOs that we primarily target are securitization vehicles that pool portfolios of primarily below investment grade U.S. senior secured loans. Such pools of underlying assets are often referred to as a CLO’s “collateral.” While the vast majority of the portfolio of most CLOs consists of senior secured loans, many CLOs enable the CLO collateral manager to invest up to 10% of the portfolio in assets that are not first lien senior secured loans, including second lien loans, unsecured loans, senior secured bonds and senior unsecured bonds.
CLOs are generally required to hold a portfolio of assets that is highly diversified by underlying borrower and industry and that is subject to a variety of asset concentration limitations. Most CLOs are non-static, revolving structures that generally allow for reinvestment over a specific period of time (the “reinvestment period”), which is typically up to five years. The terms and covenants of a typical CLO structure are, with certain exceptions, based primarily on the cash flow generated by, and the par value (as opposed to the market price or fair value) of, the collateral. These covenants include collateral coverage tests, interest coverage tests and collateral quality tests.
A CLO funds the purchase of a portfolio of primarily senior secured loans via the issuance of CLO equity and debt securities in the form of multiple, primarily floating rate, debt tranches. The CLO debt tranches typically are rated “AAA” (or its equivalent) at the most senior level down to “BB” or “B” (or its equivalent), which is below investment grade, at the junior level by Moody’s Investors Service, Inc., or “Moody’s,” S&P Global Ratings, or “S&P,” and/or Fitch Ratings, Inc., or “Fitch.” The interest rate on the CLO debt tranches is the lowest at the AAA-level and generally increases at each level down the rating scale. The CLO equity tranche is unrated and typically represents approximately 8% to 11% of a CLO’s capital structure. Below investment grade and unrated securities are sometimes referred to as “junk” securities. The diagram below is for illustrative purposes only and highlights a hypothetical structure intended to depict a typical CLO. A minority of CLOs also include a B-rated debt tranche (in which we may invest), and the structure of CLOs in which we invest may otherwise vary from this example. The left column represents the CLO’s assets, which support the liabilities and equity in the right column. The right column shows the various classes of debt and equity issued by the hypothetical CLO in order of seniority as to rights in payments from the assets. The percentage ranges appearing below the rating of each class represents the percent such class comprises of the overall “capital stack” (i.e., total debt and equity issued by the CLO).
3
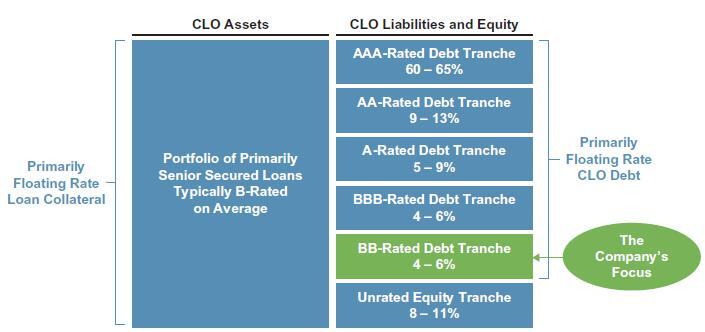
CLOs have two priority-of-payment schedules (commonly called “waterfalls”), which are detailed in a CLO’s indenture and govern how cash generated from a CLO’s underlying collateral is distributed to the CLO’s debt and equity investors. The interest waterfall applies to interest payments received on a CLO’s underlying collateral. The principal waterfall applies to cash generated from principal on the underlying collateral, primarily through loan repayments and the proceeds from loan sales. Through the interest waterfall, any excess interest-related cash flow available after the required quarterly interest payments to CLO debt investors are made and certain CLO expenses (such as administration and collateral management fees) are paid is then distributed to the CLO’s equity investors each quarter, subject to compliance with certain tests.
A CLO’s indenture typically requires that the maturity dates of a CLO’s assets, typically five to eight years from the date of issuance of a senior secured loan, be shorter than the maturity date of the CLO’s liabilities, typically 12 to 13 years from the date of issuance. However, CLO investors do face reinvestment risk with respect to a CLO’s underlying portfolio. In addition, in most CLO transactions, CLO debt investors are subject to prepayment risk in that the holders of a majority of the equity tranche can direct a call or refinancing of a CLO, which would cause the CLO’s outstanding CLO debt securities to be repaid at par. See “Risk Factors — Risks Related to Our Investments — We and our investments are subject to reinvestment risk.”
Our Structure
The following chart reflects our organizational structure and our relationship with the Adviser and the Administrator as of the date of this prospectus:
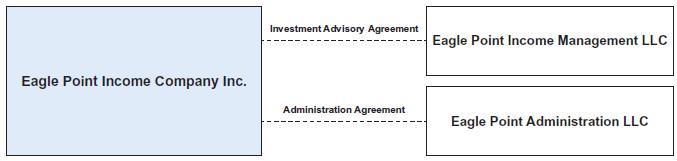
Financing and Hedging Strategy
Leverage by the Company. We may use leverage as and to the extent permitted by the 1940 Act. We are permitted to obtain leverage using any form of financial leverage instruments, including funds borrowed from banks or other financial institutions, margin facilities, notes or preferred stock and leverage attributable to reverse repurchase agreements or similar transactions. Over the long term, management expects us to operate under normal market conditions generally with leverage within a range of 25% to 35% of total assets through
4
borrowings under the BNP Credit Facility described below, or through the issuance of preferred stock or debt securities, although the actual amount of our leverage will vary over time. Certain instruments that create leverage are considered to be senior securities under the 1940 Act.
With respect to senior securities representing indebtedness (i.e., borrowing or deemed borrowing), other than temporary borrowings as defined under the 1940 Act, we are required under current law to have an asset coverage of at least 300%, as measured at the time of borrowing and calculated as the ratio of our total assets (less all liabilities and indebtedness not represented by senior securities) over the aggregate amount of our outstanding senior securities representing indebtedness. With respect to senior securities that are stocks (i.e., shares of our preferred stock, including the Series A Term Preferred Stock) , we are required under current law to have an asset coverage of at least 200%, as measured at the time of the issuance of any such shares of preferred stock and calculated as the ratio of our total assets (less all liabilities and indebtedness not represented by senior securities) over the aggregate amount of our outstanding senior securities representing indebtedness plus the aggregate liquidation preference of any outstanding shares of preferred stock.
As of March 31, 2023, we had one series of preferred stock outstanding, the 5.00% Series A Term Preferred Stock due 2026, or the “Series A Term Preferred Stock.”
On September 24, 2021 the Company entered into a credit agreement, which was amended on September 6, 2022, with BNP Paribas, as lender, that established a revolving credit facility or the “BNP Credit Facility”. Pursuant to the terms of the BNP Credit Facility, the Company can borrow up to an aggregate principal balance of $25,000,000 (the “Commitment Amount”). Such borrowings under the BNP Credit Facility bear interest at Term SOFR plus a spread under the amended credit agreement. The Company is required to pay a commitment fee on the unused amount.
The BNP Credit Facility will mature on the earlier of (i) the termination of the Commitment, as defined by the terms of the BNP Credit Facility or (ii) the scheduled maturity date of September 23, 2023. The Company has the option to extend the maturity from time to time in accordance with the BNP Credit Facility agreement.
As of March 31, 2023, our leverage, which includes the Series A Term Preferred Stock and borrowings under the BNP Credit Facility, represented approximately 27.3% of our total assets (less current liabilities). As of March 31, 2023, our asset coverage ratios in respect of (i) senior securities representing indebtedness and (ii) our outstanding preferred stock, each as calculated pursuant to Section 18 of the 1940 Act, were 5155% and 366%, respectively. In the event we fail to meet our applicable asset coverage ratio requirements, we may not be able to incur additional debt and/or issue additional preferred stock, and could be required by law or otherwise to sell a portion of our investments to repay some debt or redeem shares of preferred stock (if any) when it is disadvantageous to do so, which could have a material adverse effect on our operations, and we may not be able to make certain distributions or pay dividends of an amount necessary to continue to qualify as a RIC for U.S. federal income tax purposes. In addition, we may borrow for temporary or other purposes as permitted under the 1940 Act, which indebtedness would be in addition to the asset coverage requirements described above.
We expect that we will, or that we may need to, raise additional capital in the future to fund our continued growth, and we may do so by issuing additional shares of preferred stock or debt securities or through other leveraging instruments. Subject to the limitations under the 1940 Act, we may incur additional leverage opportunistically and may choose to increase or decrease our leverage. In addition, we may borrow for temporary, emergency or other purposes as permitted under the 1940 Act, which indebtedness would be in addition to the asset coverage requirements described above. By leveraging our investment portfolio, we may create an opportunity for increased net income and capital appreciation. However, the use of leverage also involves significant risks and expenses, which will be borne entirely by our stockholders, and our leverage strategy may not be successful. For example, the more leverage is employed, the more likely a substantial change will occur in our NAV. See “Risk Factors — Risks Related to Our Investments — We may leverage our portfolio, which would magnify the potential for gain or loss on amounts invested and will increase the risk of investing in us.”
Derivative Transactions. We may engage in “Derivative Transactions,” as described below, from time to time. To the extent we engage in Derivative Transactions, we expect to do so to hedge against interest rate,
5
credit, currency and/or other risks, or for other investment or risk management purposes. We may use Derivative Transactions for investment purposes to the extent consistent with our investment objectives if the Adviser deems it appropriate to do so. We may purchase and sell a variety of derivative instruments, including exchange-listed and over-the-counter, or “OTC,” options, futures, options on futures, swaps and similar instruments, various interest rate transactions, such as swaps, caps, floors or collars, and credit transactions and credit default swaps. We also may purchase and sell derivative instruments that combine features of these instruments. Collectively, we refer to these financial management techniques as “Derivative Transactions.” Our use of Derivative Transactions, if any, will generally be deemed to create leverage for us and involves significant risks. No assurance can be given that our strategy and use of derivatives will be successful, and our investment performance could diminish compared with what it would have been if Derivative Transactions were not used. See “Risk Factors — Risks Related to Our Investments — We are subject to risks associated with any hedging or Derivative Transactions in which we participate.”
Temporary Defensive Position. We may take a temporary defensive position and invest all or a substantial portion of our total assets in cash or cash equivalents, government securities or short-term fixed income securities during periods in which we believe that adverse market, economic, political or other conditions make it advisable to maintain a temporary defensive position. As the CLOs and LAFs in which we invest are generally illiquid in nature, we may not be able to dispose of such investments and take a defensive position. To the extent that we invest defensively, we likely will not achieve our investment objectives.
Operating and Regulatory Structure
We are an externally managed, diversified closed-end management investment company that has registered as an investment company under the 1940 Act. As a registered closed-end management investment company, we are required to meet certain regulatory tests. See “Regulation as a Closed-End Management Investment Company.” In addition, we have elected to be treated, and intend to qualify annually, as a RIC under Subchapter M of the Code, beginning with our tax year ended December 31, 2018.
Our investment activities are managed by the Adviser and supervised by our board of directors. Under the Investment Advisory Agreement, we have agreed to pay the Adviser a management fee based on our “Managed Assets.” “Managed Assets” means our total assets (including assets attributable to our use of leverage) minus the sum of our accrued liabilities (other than liabilities incurred for the purpose of creating leverage). The management fee is calculated monthly based on our Managed Assets at the end of each calendar month and is payable quarterly in arrears. The management fee for any partial month will be pro-rated (based on the number of days actually elapsed at the end of such partial month relative to the total number of days in such calendar month). See “The Adviser and the Administrator — Investment Advisory Agreement — Management Fee.”
We have also entered into an administration agreement, which we refer to as the “Administration Agreement,” under which we have agreed to reimburse the Administrator for our allocable portion of overhead and other expenses incurred by the Administrator in performing its obligations under the Administration Agreement. See “The Adviser and the Administrator — The Administrator and the Administration Agreement.”
Conflicts of Interest
Our executive officers and directors, and the Adviser and certain of its affiliates and their officers and employees, including the Senior Investment Team, have several conflicts of interest as a result of the other activities in which they engage. The Adviser and the Administrator are affiliated with other entities engaged in the financial services business. In particular, the Adviser and the Administrator are affiliated with Eagle Point Credit Management and Stone Point, and certain members of the Adviser’s Board of Managers are principals of Stone Point. Pursuant to certain management agreements, Stone Point has received delegated authority to act as the investment manager of the Trident Funds. The Adviser and the Administrator are primarily owned by certain of the Trident Funds through intermediary holding companies. The Trident Funds and other private equity funds managed by Stone Point invest in financial services companies. Additionally, an affiliate of Enstar and its other affiliates that are our stockholders indirectly own a portion of the limited liability company interests in the Adviser. Also, under the Personnel and Resources Agreement, Eagle Point Credit Management makes available the personnel and resources, including portfolio managers and investment personnel, to the Adviser as the Adviser may determine to be reasonably necessary to the conduct of its operations. These
6
relationships may cause the Adviser’s, the Administrator’s and certain of their affiliates’ interests, and the interests of their officers and employees, including the Senior Investment Team, to diverge from our interests and may result in conflicts of interest that may not be foreseen or resolved in a manner that is always or exclusively in our best interest.
Our executive officers and directors, as well as other current and potential future affiliated persons, officers and employees of the Adviser and certain of its affiliates, may serve as officers, directors or principals of, or manage the accounts for, other entities, including ECC and EPIIF, with investment strategies that substantially or partially overlap with the strategy that we pursue. Accordingly, they may have obligations to investors in those entities, the fulfillment of which obligations may not be in the best interests of us or our stockholders. The Adviser has entered into, and may in the future enter into additional, business arrangements with certain of our stockholders, including granting indirect ownership in limited liability company interests in the Adviser. In such cases, such stockholders may have an incentive to vote shares held by them in a manner that takes such arrangements into account. As a result of these relationships and separate business activities, the Adviser has conflicts of interest in allocating management time, services and functions among us, other advisory clients and other business activities. See “Conflicts of Interest.”
Pursuant to the investment allocation policies and procedures of the Adviser and Eagle Point Credit Management, they seek to allocate investment opportunities among accounts in a manner that is fair and equitable over time. In addition, an account managed by the Adviser, such as us, is expected to be considered for the allocation of investment opportunities together with other accounts managed by certain affiliates of the Adviser, including Eagle Point Credit Management. There is no assurance that such opportunities will be allocated to any particular account equitably in the short-term or that any such account, including us, will be able to participate in all investment opportunities that are suitable for it. See “Conflicts of Interest — Code of Ethics and Compliance Procedures.”
Co-Investment with Affiliates. In certain instances, we co-invest on a concurrent basis with other accounts managed by certain of the Adviser’s affiliates, subject to compliance with applicable regulations and regulatory guidance and the Adviser’s written allocation procedures. See “Conflicts of Interest — Co-Investments and Related Party Transactions.”
Summary Risk Factors
The value of our assets, as well as the market price of our securities, will fluctuate. Our investments should be considered risky, and you may lose all or part of your investment in us. Investors should consider their financial situation and needs, other investments, investment goals, investment experience, time horizons, liquidity needs and risk tolerance before investing in our securities. An investment in our securities may be speculative in that it involves a high degree of risk and should not be considered a complete investment program. We are designed primarily as a long-term investment vehicle, and our securities are not an appropriate investment for a short-term trading strategy. We can offer no assurance that returns, if any, on our investments will be commensurate with the risk of investment in us, nor can we provide any assurance that enough appropriate investments that meet our investment criteria will be available.
The following is a summary of certain principal risks of an investment in us. See “Risk Factors” for a more complete discussion of the risks of investing in our securities, including certain risks not summarized below.
•
Key Personnel Risk. We are dependent upon the key personnel of the Adviser and certain of our Adviser’s affiliates for our future success.
•
Conflicts of Interest Risk. Our executive officers and directors, and the Adviser and certain of its affiliates and their officers and employees, including the Senior Investment Team, have several conflicts of interest as a result of the other activities in which they engage. See “Conflicts of Interest.”
•
Interest Rate Risk. The price of certain of our investments may be significantly affected by changes in interest rates, including recent increases in interest rates.
•
Prepayment Risk. The assets underlying the CLO securities in which we invest are subject to prepayment by the underlying corporate borrowers. In addition, the CLO securities and related investments in which we invest are subject to prepayment risk. If we or a CLO collateral manager are
7
unable to reinvest prepaid amounts in a new investment with an expected rate of return at least equal to that of the investment repaid, our investment performance will be adversely impacted.
•
LIBOR Risk. Certain CLO securities in which we invest continue to earn interest at (or, from the perspective of the Company as CLO equity investor, obtain financing at) a floating rate based on LIBOR. After the global financial crisis, regulators globally determined that existing interest rate benchmarks should be reformed based on concerns that LIBOR was susceptible to manipulation. Replacement rates that have been identified include the Secured Overnight Financing Rate (SOFR, which is intended to replace U.S. dollar LIBOR and measures the cost of overnight borrowings through repurchase agreement transactions collateralized with U.S. Treasury securities) and the Sterling Overnight Index Average Rate (SONIA, which is intended to replace pound sterling LIBOR and measures the overnight interest rate paid by banks for unsecured transactions in the sterling market). Each of LIBOR, SONIA and SOFR is referred to herein as a “Benchmark.” With respect to our investments in CLO equity securities, to the extent that any LIBOR replacement rate (or the relevant credit spread adjustment) utilized for senior secured loans differs from that utilized for debt of a CLO that holds those loans, for the duration of such mismatch, the CLO would experience an interest rate mismatch between its assets and liabilities, which could have an adverse impact on the cash flows distributed to CLO equity investors as well as our net investment income and portfolio returns until such mismatch is corrected or minimized. As of the date hereof, certain senior secured loans have transitioned to utilizing SOFR based interest rates and certain CLO debt securities have also transitioned to SOFR.
Certain underlying loans held by CLOs do not include a “fall back” provision that addresses how interest rates will be determined once LIBOR stops being published, or otherwise leave certain aspects of the replacement rate to be negotiated between the loan issuer and the lender group. For example, certain loans held by CLOs in which we invest provide for a negotiated “ credit spread adjustment” (i.e., a marginal increase in the applicable replacement rate to compensate lenders for the tendency of SOFR and other alternative rates to price lower than LIBOR). If a CLO’s collateral manager and other members of the lending group agree to (or fail to reject) an amendment to an underlying loan that provides for a below-market spread adjustment, then the equity investors in such CLO (such as the Company in certain cases) would be disadvantaged if the debt securities issued by the CLO have a larger spread adjustment.
•
Liquidity Risk. Generally, there is no public market for the CLO investments we target. As such, we may not be able to sell such investments quickly, or at all. If we are able to sell such investments, the prices we receive may not reflect the Adviser’s assessment of their fair value or the amount paid for such investments by us.
•
Management Fee Risk. Our management fee structure may incentivize the Adviser to use leverage in a manner that adversely impacts our performance.
•
Subordinated Securities. CLO junior debt and equity securities that we may acquire are subordinated to more senior tranches of CLO debt. CLO junior debt and equity securities are subject to increased risks of default relative to the holders of superior priority interests in the same CLO. In addition, at the time of issuance, CLO equity securities are under-collateralized in that the face amount of the CLO debt and CLO equity of a CLO at inception exceed its total assets. We will typically be in a subordinated or first loss position with respect to realized losses on the underlying assets held by the CLOs in which we are invested.
•
High-Yield Investment Risk. The CLO junior debt and equity securities that we acquire are typically rated below investment grade or, in the case of equity securities, unrated and are therefore considered “higher-yield” or “junk” securities and are considered speculative with respect to timely payment of interest and repayment of principal. The senior secured loans and other credit-related assets underlying CLOs are also typically higher-yield investments. Investing in CLO junior debt and equity securities and other high-yield investments involves greater credit and liquidity risk than investment grade obligations, which may adversely impact our performance.
•
Risks of Investing in CLOs and Other Structured Debt Securities. CLOs and other structured finance securities are generally backed by a pool of credit-related assets that serve as collateral. Accordingly,
8
CLO and structured finance securities present risks similar to those of other types of credit investments, including default (credit), interest rate and prepayment risks. In addition, CLOs and other structured finance securities are often governed by a complex series of legal documents and contracts, which increases the risk of dispute over the interpretation and enforceability of such documents relative to other types of investments.
•
Leverage Risk. The use of leverage, whether directly or indirectly through investments such as CLO junior debt and equity securities that inherently involve leverage, may magnify our risk of loss. CLO junior debt and equity securities are very highly leveraged (with CLO equity securities typically being leveraged ten times), and therefore the CLO securities in which we invest are subject to a higher degree of loss since the use of leverage magnifies losses.
•
Credit Risk. If (1) a CLO in which we invest, (2) an underlying asset of any such CLO or (3) any other type of credit investment in our portfolio declines in price or fails to pay interest or principal when due because the issuer or debtor, as the case may be, experiences a decline in its financial status, our income, NAV and/or market price would be adversely impacted.
•
Fair Valuation of Our Portfolio Investments. Generally, there is no public market for the CLO investments we target. As a result, the Adviser values these securities at least quarterly, or more frequently as may be required from time to time, at fair value. The Adviser’s determinations of the fair value of our investments have a material impact on our net earnings through the recording of unrealized appreciation or depreciation of investments and may cause our NAV on a given date to understate or overstate, possibly materially, the value that we ultimately realize on one or more of our investments.
•
Limited Investment Opportunities Risk. The market for CLO securities is more limited than the market for other credit related investments. We can offer no assurances that sufficient investment opportunities for our capital will be available.
•
Market Risk. Political, regulatory, economic and social developments, and developments that impact specific economic sectors, industries or segments of the market, can affect the value of our investments. A disruption or downturn in the capital markets and the credit markets could impair our ability to raise capital, reduce the availability of suitable investment opportunities for us, or adversely and materially affect the value of our investments, any of which would negatively affect our business. These risks may be magnified if certain events or developments adversely interrupt the global supply chain, and could affect companies worldwide.
•
LAFs Risk. We may invest in LAFs, which are short to medium term facilities often provided by the bank that will serve as placement agent or arranger on a CLO transaction and which acquire loans on an interim basis which are expected to form part of the portfolio of a future CLO. Investments in LAFs have risks similar to those applicable to investments in CLOs. Leverage is typically utilized in such a facility and as such the potential risk of loss will be increased for such facilities employing leverage. In the event a planned CLO is not consummated, or the loans are not eligible for purchase by the CLO, the Company may be responsible for either holding or disposing of the loans. This could expose the Company primarily to credit and/or mark-to-market losses, and other risks.
•
Synthetic Investments Risk. We may invest in synthetic investments, such as significant risk transfer securities and credit risk transfer securities issued by banks or other financial institutions, or acquire interests in lease agreements that have the general characteristics of loans and are treated as loans for withholding tax purposes. In addition to the credit risks associated with directly or indirectly holding senior secured loans and high-yield debt securities, with respect to synthetic strategy, we will usually have a contractual relationship only with the counterparty of such synthetic investment, and not with the reference obligor of the reference asset. We generally will have no right to directly enforce compliance by the reference obligor with the terms of the reference asset nor will we have any rights of setoff against the reference obligor or rights with respect to the reference asset. We will not directly benefit from the collateral supporting the reference asset and will not have the benefit of the remedies that would normally be available to a holder of such reference asset. In addition, in the event of the insolvency of the counterparty, we may be treated as a general creditor of such counterparty, and will not have any claim with respect to the reference asset. Consequently, we will be subject to the credit risk of the counterparty as well as that of the reference obligor. As a result, concentrations of synthetic
9
securities in any one counterparty subject us to an additional degree of risk with respect to defaults by such counterparty as well as by the reference obligor.
•
Currency Risk. Although we primarily make investments denominated in U.S. dollars, we may make investments denominated in other currencies. Our investments denominated in currencies other than U.S. dollars will be subject to the risk that the value of such currency will decrease in relation to the U.S. dollar. We may or may not hedge currency risk.
•
Hedging Risk. Hedging transactions seeking to reduce risks may result in poorer overall performance than if we had not engaged in such hedging transactions. Additionally, such transactions may not fully hedge the relevant risks.
•
Reinvestment Risk. CLOs will typically generate cash from asset repayments and sales that may be reinvested in substitute assets, subject to compliance with applicable investment tests. If the CLO collateral manager causes the CLO to purchase substitute assets at a lower yield than those initially acquired or sale proceeds are maintained temporarily in cash, it would reduce the excess interest-related cash flow, thereby having a negative effect on the fair value of our assets and the market value of our securities. In addition, the reinvestment period for a CLO may terminate early, which would cause the holders of the CLO’s securities to receive principal payments earlier than anticipated. There can be no assurance that we will be able to reinvest such amounts in an alternative investment that provides a comparable return relative to the credit risk assumed.
•
Refinancing Risk. If we incur debt financing and subsequently refinance such debt, the replacement debt may be at a higher cost and on less favorable terms and conditions. If we fail to extend, refinance or replace such debt financings prior to their maturity on commercially reasonable terms, our liquidity will be lower than it would have been with the benefit of such financings, which would limit our ability to grow, and holders of our common stock would not benefit from the potential for increased returns on equity that incurring leverage creates.
•
Tax Risk. If we fail to qualify for tax treatment as a RIC under Subchapter M of the Code for any reason, or otherwise become subject to corporate income tax, the resulting corporate taxes could substantially reduce our net assets, the amount of income available for distributions to Stockholders, and the amount of income available for payment of our other liabilities.
•
Derivatives Risk. Derivative instruments in which we may invest may be volatile and involve various risks different from, and in certain cases greater than, the risks presented by other instruments. The primary risks related to Derivative Transactions include counterparty, correlation, liquidity, leverage, volatility, and OTC trading, operational and legal risks. In addition, a small investment in derivatives could have a large potential impact on our performance, effecting a form of investment leverage on our portfolio. In certain types of Derivative Transactions, we could lose the entire amount of our investment; in other types of Derivative Transactions the potential loss is theoretically unlimited.
•
Counterparty Risk. We may be exposed to counterparty risk, which could make it difficult for us or the CLOs in which we invest to collect on obligations, thereby resulting in potentially significant losses.
•
Global Economy Risk. Global economies and financial markets are highly interconnected, and conditions and events in one country, region or financial market may adversely impact issuers in a different country, region or financial market.
•
Banking Risk. The possibility of future bank failures poses risks of reduced financial market liquidity at clearing, cash management and other custodial financial institutions. The failure of banks which hold cash on behalf of the Company, the Company’s underlying obligors, the collateral managers of the CLOs in which the Company invests, or the Company’s service providers could adversely affect the Company’s ability to pursue its investment strategies and objectives. For example, if an underlying obligor has a commercial relationship with a bank that has failed or is otherwise distressed, such company may experience delays or other disruptions in meeting its obligations and consummating business transactions. Additionally, if a collateral manager has a commercial relationship with a distressed bank, the manager may experience issues conducting its operations or consummating transactions on behalf of the CLOs it manages, which could negatively affect the performance of such CLOs (and, therefore, the performance of the Company).
10
•
Issuance of Additional Shares Risk. The sale of the shares of common stock issued pursuant to other offerings, or the perception that such sales may occur, could cause the price of our common stock to fall. Shares of our common stock sold pursuant to other offerings will share voting power with our existing shares of common stock. Accordingly, such sales will result in dilution of our current stockholders’ voting power with respect to matters on which our stockholders are entitled to vote.
•
Price Risk. Investors who buy shares at different times will likely pay different prices.
•
Russia Risk. Russia’s military incursion into Ukraine, the response of the United States and other countries, and the potential for wider conflict, has increased volatility and uncertainty in the financial markets and may adversely affect the Company.
Our Corporate Information
Our offices are located at 600 Steamboat Road, Suite 202, Greenwich, CT 06830, and our telephone number is (844) 810-6501.
11
FEES AND EXPENSES
Information about the Company’s fees and expenses may be found in the “Fees and Expenses” section of the Company’s most recent Annual Report on Form N-CSR, as amended, for the fiscal year ended December 31, 2022, filed with the SEC on February 24, 2023, which is incorporated by reference herein.
12
RISK FACTORS
Investing in our securities involves a number of significant risks. In addition to the other information contained in this prospectus, you should consider carefully the following information before making an investment in our securities. The risks set out below are not the only risks we face. Additional risks and uncertainties not presently known to us or not presently deemed material by us might also impair our operations and performance and the value of our securities. If any of the following events occur, our business, financial condition and results of operations could be materially adversely affected and the value of our securities may be impaired. In such case, the price of our securities could decline, and you may lose all or part of your investment.
Risks Related to Our Investments
Investing in senior secured loans indirectly through CLO securities involves particular risks.
We obtain exposure to underlying senior secured loans through our investments in CLOs, but may obtain such exposure directly or indirectly through other means from time to time. Such loans may become nonperforming or impaired for a variety of reasons. Nonperforming or impaired loans may require substantial workout negotiations or restructuring that may entail a substantial reduction in the interest rate and/or a substantial write-down of the principal of the loan. In addition, because of the unique and customized nature of a loan agreement and the private syndication of a loan, certain loans may not be purchased or sold as easily as publicly traded securities, and, historically, the trading volume in the loan market has been small relative to other markets. Loans may encounter trading delays due to their unique and customized nature, and transfers may require the consent of an agent bank and/or borrower. Risks associated with senior secured loans include the fact that prepayments generally may occur at any time without premium or penalty.
In addition, the portfolios of certain CLOs in which we invest may contain middle market loans. Loans to middle market companies may carry more inherent risks than loans to larger, publicly traded entities. These companies generally have more limited access to capital and higher funding costs, may be in a weaker financial position, may need more capital to expand or compete, and may be unable to obtain financing from public capital markets or from traditional sources, such as commercial banks. Middle market companies typically have narrower product lines and smaller market shares than large companies. Therefore, they tend to be more vulnerable to competitors’ actions and market conditions, as well as general economic downturns. These companies may also experience substantial variations in operating results. The success of a middle market business may also depend on the management talents and efforts of one or two persons or a small group of persons. The death, disability or resignation of one or more of these persons could have a material adverse impact on the obligor. Accordingly, loans made to middle market companies may involve higher risks than loans made to companies that have greater financial resources or are otherwise able to access traditional credit sources. Middle market loans are less liquid and have a smaller trading market than the market for broadly syndicated loans and may have default rates or recovery rates that differ (and may be better or worse) than has been the case for broadly syndicated loans or investment grade securities. There can be no assurance as to the levels of defaults and/or recoveries that may be experienced with respect to middle market loans in any CLO in which we may invest. As a consequence of the forgoing factors, the securities issued by CLOs that primarily invest in middle market loans (or hold significant portions thereof) are generally considered to be a riskier investment than securities issued by CLOs that primarily invest in broadly syndicated loans.
Covenant-lite loans may comprise a significant portion of the senior secured loans underlying the CLOs in which we invest. Over the past decade, the senior secured loan market has evolved from one in which covenant-lite loans represented a minority of the market to one in which such loans represent a significant majority of the market. Generally, covenant-lite loans provide borrower companies more freedom to negatively impact lenders because their covenants are incurrence-based, which means they are only tested and can only be breached following an affirmative action of the borrower, rather than by a deterioration in the borrower’s financial condition. Accordingly, to the extent that the CLOs that we invest in hold covenant-lite loans, our CLOs may have fewer rights against a borrower and may have a greater risk of loss on such investments as compared to investments in or exposure to loans with financial maintenance covenants.
Our investments in CLO securities and other structured finance securities involve certain risks.
Our investments consist primarily of CLO securities, and we may invest in other related structured finance securities. CLOs and structured finance securities are generally backed by an asset or a pool of assets (typically
13
senior secured loans and other credit-related assets in the case of a CLO) that serve as collateral. We and other investors in CLO and related structured finance securities ultimately bear the credit risk of the underlying collateral. In most CLOs, the structured finance securities are issued in multiple tranches, offering investors various maturity and credit risk characteristics, often categorized as senior, mezzanine and subordinated/equity according to their degree of risk. If there are defaults or the relevant collateral otherwise underperforms, scheduled payments to senior tranches of such securities take precedence over those of junior tranches which are the focus of our investment strategy, and scheduled payments to junior tranches have a priority in right of payment to subordinated/equity tranches.
CLO and other structured finance securities may present risks similar to those of the other types of debt obligations and, in fact, such risks may be of greater significance in the case of CLO and other structured finance securities. For example, investments in structured vehicles, including CBOs, junior debt and equity securities issued by CLOs, involve risks, including credit risk and market risk. Changes in interest rates and credit quality may cause significant price fluctuations. A CBO is a trust which is often backed by a diversified pool of high risk, below investment grade fixed income securities. The collateral can be from many different types of fixed income securities, such as high yield debt, residential privately issued mortgage-related securities, commercial privately issued mortgage related securities, trust preferred securities and emerging market debt. The pool of high yield securities underlying CBOs is typically separated into tranches representing different degrees of credit quality. The higher quality tranches have greater degrees of protection and pay lower interest rates, whereas the lower tranches, with greater risk, pay higher interest rates.
In addition to the general risks associated with investing in debt securities, CLO securities carry additional risks, including: (1) the possibility that distributions from collateral assets will not be adequate to make interest or other payments; (2) the quality of the collateral may decline in value or default; (3) our investments in CLO junior debt and equity tranches will likely be subordinate in right of payment to other senior classes of CLO debt; and (4) the complex structure of a particular security may not be fully understood at the time of investment and may produce disputes with the issuer or unexpected investment results. Changes in the collateral held by a CLO may cause payments on the instruments we hold to be reduced, either temporarily or permanently. Structured investments, particularly the subordinated interests in which we invest, are less liquid than many other types of securities and may be more volatile than the assets underlying the CLOs we may target. In addition, CLO and other structured finance securities may be subject to prepayment risk. Further, the performance of a CLO or other structured finance security may be adversely affected by a variety of factors, including the security’s priority in the capital structure of the issuer thereof, the availability of any credit enhancement, the level and timing of payments and recoveries on and the characteristics of the underlying receivables, loans or other assets that are being securitized, remoteness of those assets from the originator or transferor, the adequacy of and ability to realize upon any related collateral and the capability of the servicer of the securitized assets. There are also the risks that the trustee of a CLO does not properly carry out its duties to the CLO, potentially resulting in loss to the CLO. In addition, the complex structure of the security may produce unexpected investment results, especially during times of market stress or volatility. Investments in structured finance securities may also be subject to liquidity risk.
Our investments in the primary CLO market involve certain additional risks.
Between the pricing date and the effective date of a CLO, the CLO collateral manager will generally expect to purchase additional collateral obligations for the CLO. During this period, the price and availability of these collateral obligations may be adversely affected by a number of market factors, including price volatility and availability of investments suitable for the CLO, which could hamper the ability of the collateral manager to acquire a portfolio of collateral obligations that will satisfy specified concentration limitations and allow the CLO to reach the target initial par amount of collateral prior to the effective date. An inability or delay in reaching the target initial par amount of collateral may adversely affect the timing and amount of interest or principal payments received by the holders of the CLO debt securities and distributions on the CLO equity securities and could result in early redemptions which may cause CLO debt and equity investors to receive less than face value of their investment.
Our portfolio of investments may lack broad diversification among CLO securities, which may subject us to a risk of significant loss if one or more of these CLO securities experience a high level of defaults on collateral.
Our portfolio may hold investments in a limited number of CLO securities. Beyond the asset diversification requirements associated with our qualification as a RIC under the Code and the requirements
14
of the 1940 Act, we do not have fixed guidelines for diversification and we do not have any limitations on the ability to invest in any one CLO. As our portfolio may be less diversified than the portfolios of some larger funds, we are more susceptible to risk of loss if one or more of the CLOs in which we are invested experiences a high level of defaults on its collateral. Similarly, the aggregate returns we realize may be significantly adversely affected if a small number of investments perform poorly or if we need to write down the value of any one investment. We may also invest in multiple CLOs managed by the same CLO collateral manager, thereby increasing our risk of loss in the event the CLO collateral manager were to fail, experience the loss of key portfolio management employees or sell its business.
Failure to maintain a broad range of underlying obligors across the CLOs in which we invest would make us more vulnerable to defaults.
We may be subject to concentration risk since CLO portfolios tend to have a certain amount of overlap across underlying obligors. This trend is generally exacerbated when demand for bank loans by CLO issuers outpaces supply. Market analysts have noted that the overlap of obligor names among CLO issuers has increased recently and is particularly evident across CLOs of the same year of origination, as well as with CLOs managed by the same asset manager. To the extent we invest in CLOs which have a high percentage of overlap, this may increase the likelihood of defaults on our CLO investments occurring together.
Our portfolio is focused on CLO securities, and the CLO securities in which we invest may hold loans that are concentrated in a limited number of industries.
Our portfolio is focused on securities issued by CLOs and related investments, and the CLOs in which we invest may hold loans that are concentrated in a limited number of industries. As a result, a downturn in the CLO industry or in any particular industry that the CLOs in which we invest are concentrated could significantly impact the aggregate returns we realize.
Failure by a CLO in which we are invested to satisfy certain tests will harm our operating results.
The failure by a CLO in which we invest to satisfy financial covenants, including with respect to adequate collateralization and/or interest coverage tests, would lead to a reduction in its payments to us. In the event that a CLO fails certain tests, holders of CLO senior debt would be entitled to additional payments that would, in turn, reduce the payments we, as holder of junior debt or equity tranches, would otherwise be entitled to receive. Separately, we may incur expenses to the extent necessary to seek recovery upon default or to negotiate new terms, which may include the waiver of certain financial covenants, with a defaulting CLO or any other investment we may make. If any of these occur, it could materially and adversely affect our operating results and cash flows.
Negative loan ratings migration may also place pressure on the performance of certain of our investments.
Per the terms of a CLO’s indenture, assets rated “CCC+” or lower or their equivalent in excess of applicable limits typically do not receive full par credit for purposes of calculation of the CLO’s overcollateralization tests. As a result, negative rating migration could cause a CLO to be out of compliance with its overcollateralization tests. This could cause a diversion of cash flows away from the CLO junior debt and equity tranches in favor of the more senior CLO debt tranches until the relevant overcollateralization test breaches are cured. This could have a negative impact on our NAV and cash flows.
Our investments in CLOs and other investment vehicles result in additional expenses to us.
We invest in CLO securities and may invest, to the extent permitted by law, in the securities and other instruments of other investment companies, including private funds, and, to the extent we so invest, will bear our ratable share of a CLO’s or any such investment vehicle’s expenses, including management and performance fees. In addition to the management and performance fees borne by our investments in CLOs, we also remain obligated to pay management fees to the Adviser with respect to the assets invested in the securities and other instruments of other investment vehicles, including CLOs. With respect to each of these investments, each holder of our common stock bears his or her share of the management fee of the Adviser as well as indirectly bearing the management and performance fees charged by the underlying advisor and other expenses of any investment vehicles in which we invest.
15
Our investments in CLO securities may be less transparent to us and our stockholders than direct investments in the collateral.
We invest primarily in junior debt tranches of CLOs and other related investments. Generally, there may be less information available to us regarding the collateral held by such CLOs than if we had invested directly in the debt of the underlying obligors. As a result, our stockholders do not know the details of the collateral of the CLOs in which we invest or receive the reports issued with respect to such CLO. In addition, none of the information contained in certain monthly reports nor any other financial information furnished to us as a noteholder in a CLO is audited and reported upon, nor is an opinion expressed, by an independent public accountant. Our CLO investments are also subject to the risk of leverage associated with the debt issued by such CLOs and the repayment priority of senior debt holders in such CLOs.
CLO investments involve complex documentation and accounting considerations.
CLOs and other structured finance securities in which we invest are often governed by a complex series of legal documents and contracts. As a result, the risk of dispute over interpretation or enforceability of the documentation may be higher relative to other types of investments.
The accounting and tax implications of the CLO investments that we make are complicated. In particular, reported earnings from CLO equity securities are recorded under U.S. generally accepted accounting principles, or “GAAP,” based upon an effective yield calculation. Current taxable earnings on certain of these investments, however, will generally not be determinable until after the end of the fiscal year of each individual CLO that ends within our fiscal year, even though the investments are generating cash flow throughout the fiscal year. The tax treatment of certain of these investments may result in higher distributable earnings in the early years and a capital loss at maturity, while for reporting purposes the totality of cash flows are reflected in a constant yield to maturity.
We are dependent on the collateral managers of the CLOs in which we invest, and those CLOs are generally not registered under the 1940 Act.
We rely on CLO collateral managers to administer and review the portfolios of collateral they manage. The actions of the CLO collateral managers may significantly affect the return on our investments; however, we, as investors of the CLO, typically do not have any direct contractual relationship with the collateral managers of the CLOs in which we invest. The ability of each CLO collateral manager to identify and report on issues affecting its securitization portfolio on a timely basis could also affect the return on our investments, as we may not be provided with information on a timely basis in order to take appropriate measures to manage our risks. We will also rely on CLO collateral managers to act in the best interests of a CLO it manages; however, such CLO collateral managers are subject to fiduciary duties owed to other classes of notes besides those in which we invest; therefore, there can be no assurance that the collateral managers will always act in the best interest of the class or classes of notes in which we are invested. If any CLO collateral manager were to act in a manner that was not in the best interest of the CLOs (e.g., gross negligence, with reckless disregard or in bad faith), this could adversely impact the overall performance of our investments. Furthermore, since the underlying CLO issuer often provides an indemnity to its CLO collateral manager, we may not be incentivized to pursue actions against the collateral manager since any such action, if successful, may ultimately be borne by the underlying CLO issuer and payable from its assets, which could create losses to us as investors in the CLO. In addition, to the extent we invest in CLO equity, liabilities incurred by the CLO manger to third parties may be borne by us to the extent the CLO is required to indemnify its collateral manager for such liabilities.
In addition, the CLOs in which we invest are generally not registered as investment companies under the 1940 Act. As investors in these CLOs, we are not afforded the protections that stockholders in an investment company registered under the 1940 Act would have.
The collateral managers of the CLOs in which we invest may not continue to manage such CLOs.
Given that we invest in CLO securities issued by CLOs which are managed by unaffiliated collateral managers, we are dependent on the skill and expertise of such managers. We believe our Adviser’s ability to analyze and diligence potential CLO managers differentiates our approach to investing in CLO securities.
16
However, we cannot assure you that, for any CLO we invest in, the collateral manager in place when we invest in such CLO securities will continue to manage such CLO through the life of our investment. Collateral managers are subject to removal or replacement by other holders of CLO securities without our consent, and may also voluntarily resign as collateral manager or assign their role as collateral manager to another entity. There can be no assurance that any removal, replacement, resignation or assignment of any particular CLO manager’s role will not adversely affect the returns on the CLO securities in which we invest.
Our investments in CLO securities may be subject to special anti-deferral provisions that could result in us incurring tax or recognizing income prior to receiving cash distributions related to such income.
Some of the CLOs in which we invest may constitute “passive foreign investment companies,” or “PFICs.” If we acquire interests treated as equity for U.S. federal income tax purposes in PFICs (including equity tranche investments and certain debt tranche investments in CLOs that are PFICs), we may be subject to federal income tax on a portion of any “excess distribution” or gain from the disposition of such shares even if such income is distributed as a taxable dividend by us to our stockholders. Certain elections may be available to mitigate or eliminate such tax on excess distributions, but such elections (if available) will generally require us to recognize our share of the PFIC’s income for each tax year regardless of whether we receive any distributions from such PFIC. We must nonetheless distribute such income to maintain our status as a RIC. Treasury Regulations generally treat our income inclusion with respect to a PFIC with respect to which we have made a qualified electing fund, or “QEF,” election, as qualifying income for purposes of determining our ability to be subject to tax as a RIC if (i) there is a current distribution out of the earnings and profits of the PFIC that are attributable to such income inclusion or (ii) such inclusion is derived with respect to our business of investing in stock, securities, or currencies. As such, we may be restricted in our ability to make QEF elections with respect to our holdings in issuers that could be treated as PFICs in order to ensure our continued qualification as a RIC and/or maximize our after-tax return from these investments.
If we hold 10% or more of the interests treated as equity (by vote or value) for U.S. federal income tax purposes in a foreign corporation that is treated as a controlled foreign corporation, or “CFC” (including equity tranche investments and certain debt tranche investments in a CLO treated as a CFC), we may be treated as receiving a deemed distribution (taxable as ordinary income) each tax year from such foreign corporation in an amount equal to our pro rata share of the corporation’s income for the tax year (including both ordinary earnings and capital gains). If we are required to include such deemed distributions from a CFC in our income, we will be required to distribute such income to maintain our RIC status regardless of whether or not the CFC makes an actual distribution during such tax year. Treasury Regulations generally treat our income inclusion with respect to a CFC as qualifying income for purposes of determining our ability to be subject to tax as a RIC either if (i) there is a current distribution out of the earnings and profits of the CFC that are attributable to such income inclusion or (ii) such inclusion is derived with respect to our business of investing in stock, securities, or currencies. As such, we may limit and/or manage our holdings in issuers that could be treated as CFCs in order to ensure our continued qualification as a RIC and/ or maximize our after-tax return from these investments.
If we are required to include amounts from CLO securities in income prior to receiving the cash distributions representing such income, we may have to sell some of our investments at times and/or at prices we would not consider advantageous, raise additional debt or equity capital or forgo new investment opportunities for this purpose. If we are not able to obtain cash from other sources, we may fail to qualify for RIC tax treatment and thus become subject to corporate-level income tax.
If a CLO in which we invest is treated as engaged in a U.S. trade or business for U.S. federal income tax purposes, such CLO could be subject to U.S. federal income tax on a net basis, which could affect our operating results and cash flows.
Each CLO in which we invest will generally operate pursuant to investment guidelines intended to ensure the CLO is not treated as engaged in a U.S. trade or business for U.S. federal income tax purposes. Each CLO will generally receive an opinion of counsel, subject to certain assumptions (including compliance with the investment guidelines) and limitations, that the CLO will not be engaged in a U.S. trade or business for U.S. federal income tax purposes. If a CLO fails to comply with the investment guidelines or the IRS otherwise successfully asserts that the CLO should be treated as engaged in a U.S. trade or business for U.S. federal
17
income tax purposes, such CLO could be subject to U.S. federal income tax on a net basis, which could reduce the amount available to distribute to junior debt and equity holders in such CLO, including the Company.
If a CLO in which we invest fails to comply with certain U.S. tax disclosure requirements, such CLO may be subject to withholding requirements that could materially and adversely affect our operating results and cash flows.
The U.S. Foreign Account Tax Compliance Act provisions of the Code, or “FATCA,” imposes a withholding tax of 30% on U.S. source periodic payments, including interest and dividends to certain non-U.S. entities, including certain non-U.S. financial institutions and investment funds, unless such non-U.S. entity complies with certain reporting requirements regarding its U.S. account holders and its U.S. owners. Most CLOs in which we invest will be treated as non-U.S. financial entities for this purpose, and therefore will be required to comply with these reporting requirements to avoid the 30% withholding. If a CLO in which we invest fails to properly comply with these reporting requirements, it could reduce the amount available to distribute to junior debt and equity holders in such CLO, which could materially and adversely affect the fair value of the CLO’s securities, our operating results and cash flows.
Increased competition in the market or a decrease in new CLO issuances may result in increased price volatility or a shortage of investment opportunities.
In recent years there has been a marked increase in the number of, and flow of capital into, investment vehicles established to pursue investments in CLO securities whereas the size of this market is relatively limited. While we cannot determine the precise effect of such competition, such increase may result in greater competition for investment opportunities, which may result in an increase in the price of such investments relative to the risk taken on by holders of such investments. Such competition may also result under certain circumstances in increased price volatility or decreased liquidity with respect to certain positions.
In addition, the volume of new CLO issuances and CLO refinancings varies over time as a result of a variety of factors including new regulations, changes in interest rates, and other market forces. As a result of increased competition and uncertainty regarding the volume of new CLO issuances and CLO refinancings, we can offer no assurances that we will deploy all of our capital in a timely manner or at all. Prospective investors should understand that we may compete with other investment vehicles, as well as investment and commercial banking firms, which have substantially greater resources, in terms of financial wherewithal and research staffs, than may be available to us.
We will be subject to risks associated with any wholly-owned subsidiaries.
We may in the future invest indirectly through one or more wholly-owned subsidiaries. Such wholly-owned subsidiaries are not separately registered under the 1940 Act and are not subject to all the investor protections of the 1940 Act. In addition, changes in the laws of the jurisdiction of formation of any future wholly-owned subsidiary could result in the inability of such subsidiary to operate as anticipated.
We and our investments are subject to interest rate risk.
Since we borrow money under the BNP Credit Facility and have issued Series A Term Preferred Stock, and since we may incur additional leverage (including through issuing additional preferred stock and/or debt securities) to make investments, our net investment income depends, in part, upon the difference between the rate at which we borrow funds and the rate at which we invest those funds.
Because of inflationary pressure, the U.S. government has recently increased interest rates. Interest rates are currently expected to continue to rise rather than fall, in the future. In a rising interest rate environment, any additional leverage that we incur may bear a higher interest rate than our current leverage. There may not, however, be a corresponding increase in our investment income. Any reduction in the level of rate of return on new investments relative to the rate of return on our current investments, and any reduction in the rate of return on our current investments, could adversely impact our net investment income, reducing our ability to service the interest obligations on, and to repay the principal of, our indebtedness, as well as our capacity to pay distributions to our stockholders. See “— Benchmark Floor Risk.”
18
The fair value of certain of our investments may be significantly affected by changes in interest rates. Although senior secured loans are generally floating rate instruments, our investments in senior secured loans through investments in junior debt and equity tranches of CLOs are sensitive to interest rate levels and volatility. For example, because CLO debt securities are floating rate securities, a reduction in interest rates would generally result in a reduction in the coupon payment and cash flow we receive on our CLO debt investments. Further, there may be some difference between the timing of interest rate resets on the assets and liabilities of a CLO. Such a mismatch in timing could have a negative effect on the amount of funds distributed to CLO equity investors. In addition, CLOs may not be able to enter into hedge agreements, even if it may otherwise be in the best interests of the CLO to hedge such interest rate risk. Furthermore, in the event of a significant rising interest rate environment and/or economic downturn, loan defaults may increase and result in credit losses that may adversely affect our cash flow, fair value of our assets and operating results. In the event that our interest expense were to increase relative to income, or sufficient financing became unavailable, our return on investments and cash available for distribution to stockholders or to make other payments on our securities would be reduced. In addition, future investments in different types of instruments may carry a greater exposure to interest rate risk.
Benchmark Floor Risk. Because CLOs generally issue debt on a floating rate basis, an increase in the relevant Benchmark will increase the financing costs of CLOs. Many of the senior secured loans held by these CLOs have Benchmark floors such that, when the relevant Benchmark is below the stated Benchmark floor, the stated Benchmark floor (rather than the Benchmark itself) is used to determine the interest payable under the loans. Therefore, if the relevant Benchmark increases but stays below the average Benchmark floor rate of the senior secured loans held by a CLO, there would not be a corresponding increase in the investment income of such CLOs. The combination of increased financing costs without a corresponding increase in investment income in such a scenario could result in the CLO not having adequate cash to make interest or other payments on the securities which we hold.
LIBOR Risk. Certain CLO securities in which we invest continue to earn interest at (or, from the perspective of the Company as CLO equity investor, obtain financing at) a floating rate based on LIBOR. After the global financial crisis, regulators globally determined that existing interest rate benchmarks should be reformed based on concerns that LIBOR was susceptible to manipulation. In a speech on July 27, 2017, the then-Chief Executive of the Financial Conduct Authority of the UK (the “FCA”) announced the FCA’s intention to cease sustaining LIBOR. On March 5, 2021, the FCA announced that all LIBOR settings will either cease to be provided by any administrator, or no longer be representative immediately after December 31, 2021, for all GBP, EUR, CHF and JPY LIBOR settings and one-week and two-month US dollar LIBOR settings, and immediately after June 30, 2023 for the remaining US dollar LIBOR settings, including three-month US dollar LIBOR. In addition, based on supervisory guidance from regulators, many banks have ceased issuance of new LIBOR-based instruments as of January 1, 2022.
Replacement rates that have been identified include the Secured Overnight Financing Rate (SOFR, which is intended to replace U.S. dollar LIBOR and measures the cost of overnight borrowings through repurchase agreement transactions collateralized with U.S. Treasury securities) and the Sterling Overnight Index Average Rate (SONIA, which is intended to replace GBP LIBOR and measures the overnight interest rate paid by banks for unsecured transactions in the sterling market), although other replacement rates could be adopted by market participants. On April 3, 2018, the New York Federal Reserve Bank began publishing its alternative rate, the Secured Overnight Financing Rate (“SOFR”). The Bank of England followed suit on April 23, 2018 by publishing its proposed alternative rate, the Sterling Overnight Index Average (“SONIA”). Each of SOFR and SONIA significantly differ from LIBOR, both in the actual rate and how it is calculated, and therefore it is unclear whether and when markets will adopt either of these rates as a widely accepted replacement for LIBOR. On July 29, 2021, the Alternative Reference Rates Committee (“ARRC”) announced that it recommended “Term SOFR,” a similar forward-looking term rate which will be based on SOFR, for business loans. CME Group currently publishes the Term SOFR Rate in one-month, three-month and six-month tenors. As of the date of this prospectus, it is unclear how the market will respond to ARRC’s formal recommendation. If no widely accepted conventions develop, it is uncertain what effect broadly divergent interest rate calculation methodologies in the markets will have on the price and liquidity of leverage loans or CLO securities and the ability for CLOs to effectively mitigate interest rate risks. Many CLOs, as well as underlying loans held by CLOs, which have moved to a SOFR-based rate (such as Term SOFR) have included a credit spread adjustment to account for the fact that USD LIBOR has historically tracked lower than Term
19
SOFR. However, the credit spread adjustment utilized for CLO liabilities may differ from the credit spread adjustments utilized for the underlying loans. To the extent CLO liabilities implement a credit spread adjustment that exceeds the average credit spread adjustment of the loans which they hold, this could negatively impact the returns on the CLO equity investments which we hold. In general, varying market approaches on what benchmark replacement to adopt, as well as what credit spread adjustment to utilize, may create significant uncertainty for CLO managers (and the CLO market generally) and negatively affect returns on CLO investments.
Potential Effects of Alternative Reference Rates. For CLOs which issue debt based on Term SOFR, investors should be aware that such CLO debt may fluctuate from one interest accrual period to another in response to changes in Term SOFR. Term SOFR has a limited history of use as a benchmark rate and, as a risk-free rate, differs in material respects from LIBOR. Neither the historical performance of LIBOR nor Term SOFR should be taken as an indication of future performance of Term SOFR during the term of any CLO. Changes in the levels of Term SOFR will affect the amount of interest payable on the CLO debt securities, the distributions on the CLO equity and the trading price of the CLO securities, but it is impossible to predict whether such levels will rise or fall.
As LIBOR is currently being reformed, investors should be aware that: (a) any changes to LIBOR could affect the level of the published rate, including to cause it to be lower and/or more volatile than it would otherwise be; (b) if the applicable rate of interest on any CLO security is calculated with reference to a tenor which is discontinued, such rate of interest will then be determined by the provisions of the affected CLO security, which may include determination by the relevant calculation agent in its discretion; (c) the administrator of LIBOR will not have any involvement in the CLOs or loans and may take any actions in respect of LIBOR without regard to the effect of such actions on the CLOs or loans; and (d) any uncertainty in the value of LIBOR or, the development of a widespread market view that LIBOR has been manipulated or any uncertainty in the prominence of LIBOR as a benchmark interest rate due to the recent regulatory reform may adversely affect the liquidity of the securities in the secondary market and their market value. Any of the above or any other significant change to the setting of LIBOR could have a material adverse effect on the value of, and the amount payable under, (i) any underlying asset of the CLO which pay interest linked to a LIBOR rate and (ii) the CLO securities in which we invest.
Once LIBOR is eliminated as a benchmark rate, it is uncertain whether broad replacement conventions in the CLO markets will develop and, if conventions develop, what those conventions will be and whether they will create adverse consequences for the issuer or the holders of CLO securities. Currently, the CLOs we are invested in generally contemplate a scenario where LIBOR is no longer available by requiring the CLO administrator to calculate a replacement rate primarily through dealer polling on the applicable measurement date. However, there is uncertainty regarding the effectiveness of the dealer polling processes, including the willingness of banks to provide such quotations, which could adversely impact our net investment income. Some of the CLOs we are invested in have included, or have been amended to include, language permitting the CLO investment manager to implement a market replacement rate (like those proposed by the ARRC) upon the occurrence of certain material disruption events. However, we cannot ensure that all CLOs in which we are invested will have such provisions, nor can we ensure the CLO investment managers will undertake the suggested amendments when able, nor can we ensure that the credit spread adjustments utilized will be favorable to CLO equity investors.
If no replacement conventions develop, it is uncertain what effect broadly divergent interest rate calculation methodologies in the markets will have on the price and liquidity of CLO securities and the ability of the collateral manager to effectively mitigate interest rate risks. While the issuers and the trustee of a CLO may enter into a reference rate amendment or the collateral manager may designate a designated reference rate, in each case, subject to the conditions described in a CLO indenture, there can be no assurance that a change to any alternative benchmark rate (a) will be adopted, (b) will effectively mitigate interest rate risks or result in an equivalent methodology for determining the interest rates on the floating rate instrument, (c) will be adopted prior to any date on which the issuer suffers adverse consequences from the elimination or modification or potential elimination or modification of LIBOR or (d) will not have a material adverse effect on the holders of the CLO securities.
In addition, the effect of a phase out of LIBOR on U.S. senior secured loans, the underlying assets of the CLOs in which we invest, is currently unclear. As discussed above, to the extent that any replacement rate or
20
credit spread adjustment utilized for senior secured loans differs from that utilized for a CLO that holds those loans, the CLO would experience an interest rate mismatch between its assets and liabilities, which could have an adverse impact on our net investment income and portfolio returns.
Base Rate Mismatch. Many underlying corporate borrowers can elect to pay interest based on a 1-month, 3-month and/or other term base rates in respect of the loans held by CLOs in which we are invested, in each case plus an applicable spread, whereas CLOs generally pay interest to holders of the CLO’s debt tranches based today on 3-month term plus a spread. The 3-month term rate may fluctuate in excess of other potential term rates, which may result in many underlying corporate borrowers electing to pay interest based on a shorter, but in any event lower, base rate. This mismatch in the rate at which CLOs earn interest and the rate at which they pay interest on their debt tranches negatively impacts the cash flows on a CLO’s equity tranche, which may in turn adversely affect our cash flows and results of operations. Unless spreads are adjusted to account for such increases, these negative impacts may worsen as the amount by which the 3-month term rate exceeds such other chosen term base rate.
To the extent that any LIBOR replacement rate utilized for senior secured loans differs from that utilized for debt of a CLO that holds those loans (including instances where the replacement rate is utilized for such loans prior to it being utilized by the CLO), for the duration of such mismatch, the CLO would experience an interest rate mismatch between its assets and liabilities, which could have an adverse impact on the cash flows distributed to CLO equity investors as well as our net investment income and portfolio returns until such mismatch is corrected or minimized, which would be expected to occur when both the underlying senior secured loans and the CLO debt securities utilize the same LIBOR replacement rate. As of the date hereof, certain senior secured loans have transitioned to utilizing SOFR based interest rates and certain CLO debt securities have also transitioned to SOFR.
Interest Rate Environment. The senior secured loans underlying the CLOs in which we invest typically have floating interest rates. A rising interest rate environment may increase loan defaults, resulting in losses for the CLOs in which we invest. In addition, increasing interest rates may lead to higher prepayment rates, as corporate borrowers look to avoid escalating interest payments or refinance floating rate loans. See “— Risks Related to Our Investments — Our investments are subject to prepayment risk.” Further, a general rise in interest rates will increase the financing costs of the CLOs. However, since many of the senior secured loans within these CLOs have Benchmark floors, if the Benchmark is below the applicable Benchmark floor, there may not be corresponding increases in investment income which could result in the CLO not having adequate cash to make interest or other payments on the securities which we hold.
For detailed discussions of the risks associated with a rising interest rate environment, see “— Risks Related to Our Investments — We and our investments are subject to interest rate risk” and “— Risks Related to Our Investments — We and our investments are subject to risks associated with investing in high-yield and unrated, or “junk,” securities.”
Our investments are subject to credit risk.
If a CLO in which we invest, an underlying asset of any such CLO or any other type of credit investment in our portfolio declines in price or fails to pay interest or principal when due because the issuer or debtor, as the case may be, experiences a decline in its financial status either or both our income and NAV may be adversely impacted. Non-payment would result in a reduction of our income, a reduction in the value of the applicable CLO security or other credit investment experiencing non-payment and, potentially, a decrease in our NAV. With respect to our investments in CLO securities and credit investments that are secured, there can be no assurance that liquidation of collateral would satisfy the issuer’s obligation in the event of non-payment of scheduled dividend, interest or principal or that such collateral could be readily liquidated. In the event of bankruptcy of an issuer, we could experience delays or limitations with respect to its ability to realize the benefits of any collateral securing a CLO security or credit investment. To the extent that the credit rating assigned to a security in our portfolio is downgraded, the market price and liquidity of such security may be adversely affected. In addition, if a CLO in which we invest triggers an event of default as a result of failing to make payments when due or for other reasons, the CLO would be subject to the possibility of liquidation, which could result in full loss of value to the CLO junior debt and equity investors. CLO equity tranches are the most likely tranche to suffer a loss of all of their value in these circumstances. Heightened inflationary pressures could increase the risk of default by the Company’s underlying obligors.
21
Our investments are subject to prepayment risk.
Although the Adviser’s valuations and projections take into account certain expected levels of prepayments, the collateral of a CLO may be prepaid more quickly than expected. Prepayment rates are influenced by changes in interest rates and a variety of factors beyond our control and consequently cannot be accurately predicted. Early prepayments give rise to increased reinvestment risk, as a CLO collateral manager might realize excess cash from prepayments earlier than expected. If a CLO collateral manager is unable to reinvest such cash in a new investment with an expected rate of return at least equal to that of the investment repaid, this may reduce our net income and the fair value of that asset.
In addition, in most CLO transactions, CLO debt investors, such as us, are subject to prepayment risk in that the holders of a majority of the equity tranche can direct a call or refinancing of a CLO, which would cause such CLO’s outstanding CLO debt securities to be repaid at par. Such prepayments of CLO debt securities held by us also give rise to reinvestment risk if we are unable to reinvest such cash in a new investment with an expected rate of return at least equal to that of the investment repaid.
We may leverage our portfolio, which would magnify the potential for gain or loss on amounts invested and will increase the risk of investing in us.
We have incurred leverage through indebtedness for borrowed money and the issuance of the Series A Term Preferred Stock. We may incur additional leverage, directly or indirectly, through one or more special purpose vehicles, indebtedness for borrowed money, as well as leverage in the form of Derivative Transactions, additional shares of preferred stock, debt securities and other structures and instruments, in significant amounts and on terms that the Adviser and our board of directors deem appropriate, subject to applicable limitations under the 1940 Act. Such leverage may be used for the acquisition and financing of our investments, to pay fees and expenses and for other purposes. Such leverage may be secured and/or unsecured. Any such leverage does not include leverage embedded or inherent in the CLO structures in which we invest or in derivative instruments in which we may invest. Accordingly, there is a layering of leverage in our overall structure.
The more leverage we employ, the more likely a substantial change will occur in our NAV. Accordingly, any event that adversely affects the value of an investment would be magnified to the extent leverage is utilized. For instance, any decrease in our income would cause net income to decline more sharply than it would have had we not borrowed. Such a decline could also negatively affect our ability to make distributions and other payments to our securityholders. Leverage is generally considered a speculative investment technique. Our ability to service any debt that we incur will depend largely on our financial performance and will be subject to prevailing economic conditions and competitive pressures. The cumulative effect of the use of leverage with respect to any investments in a market that moves adversely to such investments could result in a substantial loss that would be greater than if our investments were not leveraged.
As a registered closed-end management investment company, we are required to meet certain asset coverage requirements, as defined under the 1940 Act, with respect to any senior securities. With respect to senior securities representing indebtedness (i.e., borrowings or deemed borrowings), other than temporary borrowings as defined under the 1940 Act, we are required under current law to have an asset coverage of at least 300%, as measured at the time of borrowing and calculated as the ratio of our total assets (less all liabilities and indebtedness not represented by senior securities) over the aggregate amount of our outstanding senior securities representing indebtedness. With respect to senior securities that are stocks (i.e., shares of our preferred stock, including the Series A Term Preferred Stock), we are required under current law to have an asset coverage of at least 200%, as measured at the time of the issuance of any such shares of preferred stock and calculated as the ratio of our total assets (less all liabilities and indebtedness not represented by senior securities) over the aggregate amount of our outstanding senior securities representing indebtedness plus the aggregate liquidation preference of any outstanding shares of preferred stock. If legislation were passed that modifies this section of the 1940 Act and increases the amount of senior securities that we may incur, we may increase our leverage to the extent then permitted by the 1940 Act and the risks associated with an investment in us may increase.
If our asset coverage declines below 300% (or 200%, as applicable), we would not be able to incur additional debt or issue additional preferred stock, and could be required by law to sell a portion of our
22
investments to repay some debt or redeem shares of preferred stock when it is disadvantageous to do so, which could have a material adverse effect on our operations, and we may not be able to make certain distributions or pay dividends of an amount necessary to continue to be subject to tax as a RIC. The amount of leverage that we employ will depend on the Adviser’s and our board of directors’ assessment of market and other factors at the time of any proposed borrowing. We cannot assure you that we will be able to obtain credit at all or on terms acceptable to us.
In addition, our BNP Credit Facility imposes and any debt facility into which we may enter would likely impose financial and operating covenants that restrict our business activities, including limitations that could hinder our ability to finance additional loans and investments or to make the distributions required to maintain our ability to be subject to tax as a RIC under Subchapter M of the Code.
The following table is furnished in response to the requirements of the SEC and illustrates the effect of leverage on returns from an investment in our common stock assuming various annual returns, net of expenses. The calculations in the table below are hypothetical and actual returns may be higher or lower than those appearing in the table below.
|
Assumed Return on Our Portfolio (Net of Expenses)
|
| |
-10%
|
| |
-5%
|
| |
0%
|
| |
5%
|
| |
10%
|
| |||||||||||||||
|
Corresponding net Return to Common Stockholder(1)
|
| | | | -18.86 | | | | | | -11.05 | | | | | | -3.25 | | | | | | 4.55 | | | | | | 12.36 | | |
(1)
Assumes (i) $177.4 million in pro forma total assets as of March 31, 2023 (adjusted to reflect (a) the issuance in the Company’s “at-the-market” offering and committed equity financing program of 169,508 shares of our common stock from April 1, 2023 through May 31, 2023, yielding net proceeds to the Company of approximately $2.3 million; and (b) the hypothetical borrowings of the full $25,000,000 available under the BNP Credit Facility); (ii) $113.7 million in pro forma net assets as of March 31, 2023 (adjusted to reflect the issuances and borrowings described above); and (iii) an annualized average interest rate on the Company’s indebtedness and preferred equity of 5.9%.
Based on our assumed leverage described above, our investment portfolio would have been required to experience an annual return of at least 2.1% to cover annual dividend and interest payments on our outstanding preferred stock and assumed indebtedness.
Our investments may be highly subordinated and subject to leveraged securities risk.
Our portfolio includes junior debt and equity investments in CLOs, which involve a number of significant risks. CLOs are typically very highly levered (with CLO equity securities being leveraged ten times), and therefore the junior debt and equity tranches in which we are currently invested and in which we seek to invest will be subject to a higher degree of risk of total loss. In particular, investors in CLO securities indirectly bear risks of the collateral held by such CLOs. We generally have the right to receive payments only from the CLOs, and generally not have direct rights against the underlying borrowers or the entity that sponsored the CLO. While the CLOs we target generally enable an equity investor therein to acquire interests in a pool of senior secured loans without the expenses associated with directly holding the same investments, we generally pay a proportionate share of the CLOs’ administrative, management and other expenses if we make a CLO equity investment. In addition, we may have the option in certain CLOs to contribute additional amounts to the CLO issuer for purposes of acquiring additional assets or curing coverage tests, thereby increasing our overall exposure and capital at risk to such CLO. Although it is difficult to predict whether the prices of assets underlying CLOs will rise or fall, these prices (and, therefore, the prices of the CLOs’ securities) are influenced by the same types of political and economic events that affect issuers of securities and capital markets generally. The interests we acquire in CLOs generally are thinly traded or have only a limited trading market. CLO securities are typically privately offered and sold, even in the secondary market. As a result, investments in CLO securities are illiquid.
We and our investments are subject to risks associated with investing in high-yield and unrated, or “junk,” securities.
We invest primarily in securities that are rated below investment grade or, in the case of CLO equity securities, are not rated by a nationally recognized statistical rating organization. The primary assets underlying
23
our CLO security investments are senior secured loans, although these transactions may allow for limited exposure to other asset classes including unsecured loans, high yield bonds, emerging market loans or bonds and structured finance securities with underlying exposure to CBO and CDO tranches, residential mortgage-backed securities, commercial mortgage-backed securities, trust preferred securities and other types of securitizations. CLOs generally invest in lower-rated debt securities that are typically rated below Baa/BBB by Moody’s, S&P or Fitch. In addition, we may obtain direct exposure to such financial assets/instruments. Securities that are not rated or are rated lower than Baa by Moody’s or lower than BBB by S&P or Fitch are sometimes referred to as “high yield” or “junk.” High-yield debt securities have greater credit and liquidity risk than investment grade obligations. High-yield debt securities are generally unsecured and may be subordinated to certain other obligations of the issuer thereof. The lower rating of high-yield debt securities and below investment grade loans reflects a greater possibility that adverse changes in the financial condition of an issuer or in general economic conditions or both may impair the ability of the issuer thereof to make payments of principal or interest.
Risks of high-yield debt securities may include:
(1)
limited liquidity and secondary market support;
(2)
substantial marketplace volatility resulting from changes in prevailing interest rates;
(3)
subordination to the prior claims of banks and other senior lenders;
(4)
the operation of mandatory sinking fund or call/redemption provisions during periods of declining interest rates that could cause the CLO issuer to reinvest premature redemption proceeds in lower-yielding debt obligations;
(5)
the possibility that earnings of the high-yield debt security issuer may be insufficient to meet its debt service;
(6)
the declining creditworthiness and potential for insolvency of the issuer of such high-yield debt securities during periods of rising interest rates and/or economic downturn; and
(7)
greater susceptibility to losses and real or perceived adverse economic and competitive industry conditions than higher grade securities.
An economic downturn or an increase in interest rates could severely disrupt the market for high-yield debt securities and adversely affect the value of outstanding high-yield debt securities and the ability of the issuers thereof to repay principal and interest.
Issuers of high-yield debt securities may be highly leveraged and may not have available to them more traditional methods of financing. The risk associated with acquiring (directly or indirectly) the securities of such issuers generally is greater than is the case with highly rated securities. For example, during an economic downturn or a sustained period of rising interest rates, issuers of high-yield debt securities may be more likely to experience financial stress, especially if such issuers are highly leveraged. During such periods, timely service of debt obligations also may be adversely affected by specific issuer developments, or the issuer’s inability to meet specific projected business forecasts or the unavailability of additional financing. The risk of loss due to default by the issuer is significantly greater for the holders of high-yield debt securities because such securities may be unsecured and may be subordinated to obligations owed to other creditors of the issuer of such securities. In addition, the CLO issuer may incur additional expenses to the extent it (or any investment manager) is required to seek recovery upon a default on a high yield bond (or any other debt obligation) or participate in the restructuring of such obligation.
A portion of the loans held by CLOs in which we invest may consist of second lien loans. Second lien loans are secured by liens on the collateral securing the loan that are subordinated to the liens of at least one other class of obligations of the related obligor, and thus, the ability of the CLO issuer to exercise remedies after a second lien loan becomes a defaulted obligation is subordinated to, and limited by, the rights of the senior creditors holding such other classes of obligations. In many circumstances, the CLO issuer may be prevented from foreclosing on the collateral securing a second lien loan until the related first lien loan is paid in full. Moreover, any amounts that might be realized as a result of collection efforts or in connection with a bankruptcy or insolvency proceeding involving a second lien loan must generally be turned over to the first
24
lien secured lender until the first lien secured lender has realized the full value of its own claims. In addition, certain of the second lien loans contain provisions requiring the CLO issuer’s interest in the collateral to be released in certain circumstances. These lien and payment obligation subordination provisions may materially and adversely affect the ability of the CLO issuer to realize value from second lien loans and adversely affect the fair value of and income from our investment in the CLO’s securities.
We are subject to risks associated with loan assignments and participations.
We, or the CLOs in which we invest, may acquire interests in loans either directly (by way of assignment, or “Assignments”) or indirectly (by way of participation, or “Participations”). The purchaser by an Assignment of a loan obligation typically succeeds to all the rights and obligations of the selling institution and becomes a lender under the loan or credit agreement with respect to the debt obligation. In contrast, Participations acquired by us or the CLOs in which we invest in a portion of a debt obligation held by a selling institution, or the “Selling Institution,” typically result in a contractual relationship only with such Selling Institution, not with the obligor. We or the CLOs in which we invest would have the right to receive payments of principal, interest and any fees to which we (or the CLOs in which we invest) are entitled under the Participation only from the Selling Institution and only upon receipt by the Selling Institution of such payments from the obligor. In purchasing a Participation, we or the CLOs in which we invest generally will have no right to enforce compliance by the obligor with the terms of the loan or credit agreement or other instrument evidencing such debt obligation, nor any rights of setoff against the obligor, and we or the CLOs in which we invest may not directly benefit from the collateral supporting the debt obligation in which it has purchased the Participation. As a result, we or the CLOs in which we invest would assume the credit risk of both the obligor and the Selling Institution. In the event of the insolvency of the Selling Institution, we or the CLOs in which we invest will be treated as a general creditor of the Selling Institution in respect of the Participation and may not benefit from any setoff between the Selling Institution and the obligor.
The holder of a Participation in a debt obligation may not have the right to vote to waive enforcement of any default by an obligor. Selling Institutions commonly reserve the right to administer the debt obligations sold by them as they see fit and to amend the documentation evidencing such debt obligations in all respects. However, most participation agreements with respect to senior secured loans provide that the Selling Institution may not vote in favor of any amendment, modification or waiver that (1) forgives principal, interest or fees, (2) reduces principal, interest or fees that are payable, (3) postpones any payment of principal (whether a scheduled payment or a mandatory prepayment), interest or fees or (4) releases any material guarantee or security without the consent of the participant (at least to the extent the participant would be affected by any such amendment, modification or waiver).
A Selling Institution voting in connection with a potential waiver of a default by an obligor may have interests different from ours, and the Selling Institution might not consider our interests in connection with its vote. In addition, many participation agreements with respect to senior secured loans that provide voting rights to the participant further provide that, if the participant does not vote in favor of amendments, modifications or waivers, the Selling Institution may repurchase such Participation at par. An investment by us in a synthetic security related to a loan involves many of the same considerations relevant to Participations.
The lack of liquidity in our investments may adversely affect our business.
High-yield investments, including subordinated CLO securities and collateral held by CLOs in which we invest, generally have limited liquidity. As a result, prices of high-yield investments have at times experienced significant and rapid decline when a substantial number of holders (or a few holders of a significantly large “block” of the securities) decided to sell. In addition, we (or the CLOs in which we invest) may have difficulty disposing of certain high-yield investments because there may be a thin trading market for such securities. To the extent that a secondary trading market for non-investment grade high-yield investments does exist, it would not be as liquid as the secondary market for highly rated investments. Reduced secondary market liquidity would have an adverse impact on the fair value of the securities and on our direct or indirect ability to dispose of particular securities in response to a specific economic event such as deterioration in the creditworthiness of the issuer of such securities.
As secondary market trading volumes increase, new loans frequently contain standardized documentation to facilitate loan trading that may improve market liquidity. There can be no assurance,
25
however, that future levels of supply and demand in loan trading will provide an adequate degree of liquidity or that the current level of liquidity will continue. Because holders of such loans are offered confidential information relating to the borrower, the unique and customized nature of the loan agreement, and the private syndication of the loan, loans are not purchased or sold as easily as publicly traded securities are purchased or sold. Although a secondary market may exist, risks similar to those described above in connection with an investment in high-yield debt investments are also applicable to investments in lower rated loans.
The securities issued by CLOs generally offer less liquidity than other investment grade or high-yield corporate debt, and are subject to certain transfer restrictions that impose certain financial and other eligibility requirements on prospective transferees. Other investments that we may purchase in privately negotiated transactions may also be illiquid or subject to legal restrictions on their transfer. As a result of this illiquidity, our ability to sell certain investments quickly, or at all, in response to changes in economic and other conditions and to receive a fair price when selling such investments may be limited, which could prevent us from making sales to mitigate losses on such investments. In addition, CLOs are subject to the possibility of liquidation upon an event of default, which could result in full loss of value to the CLO equity and junior debt investors. CLO equity tranches are the most likely tranche to suffer a loss of all of their value in these circumstances.
We may be exposed to counterparty risk.
We may be exposed to counterparty risk, which could make it difficult for us or the CLOs in which we invest to collect on the obligations represented by investments and result in significant losses.
We may hold investments (including synthetic securities) that would expose us to the credit risk of our counterparties or the counterparties of the CLOs in which it invests. In the event of a bankruptcy or insolvency of such a counterparty, we or a CLO in which such an investment is held could suffer significant losses, including the loss of that part of our or the CLO’s portfolio financed through such a transaction, declines in the value of our investment, including declines that may occur during an applicable stay period, the inability to realize any gains on our investment during such period and fees and expenses incurred in enforcing our rights. If the CLO enters into or owns synthetic securities, the CLO may fall within the definition of “commodity pool” under CFTC rules, and the collateral manager of the CLO may be required to register as a commodity pool operator with the CFTC, which could increase costs for the CLO and reduce amounts available to pay to the residual tranche.
In addition, with respect to certain swaps and synthetic securities, neither a CLO nor we usually has a contractual relationship with the entities, referred to as “Reference Entities” whose payment obligations are the subject of the relevant swap agreement or security. Therefore, neither the CLOs nor we generally have a right to directly enforce compliance by the Reference Entity with the terms of this kind of underlying obligation, any rights of set-off against the Reference Entity or any voting rights with respect to the underlying obligation. Neither the CLOs nor we will directly benefit from the collateral supporting the underlying obligation and will not have the benefit of the remedies that would normally be available to a holder of such underlying obligation.
Furthermore, we may invest in unsecured notes which are linked to loans or other assets held by a bank or other financial institution on its balance sheet (so called “credit-linked notes”). Although the credit-linked notes are tied to the underlying performance of the assets held by the bank, such credit-linked notes are not secured by such assets and we have no direct or indirect ownership of the underlying assets. Thus, as a holder of such credit-linked notes, we would be subject to counterparty risk of the bank which issues the credit-linked notes (in addition to the risk associated with the assets themselves). To the extent the relevant bank experiences an insolvency event or goes into receivership, we may not receive payments on the credit-linked notes, or such payments may be delayed.
We are subject to risks associated with defaults on an underlying asset held by a CLO.
A default and any resulting loss as well as other losses on an underlying asset held by a CLO may reduce the fair value of our corresponding CLO investment. A wide range of factors could adversely affect the ability of the borrower of an underlying asset to make interest or other payments on that asset. To the extent that actual defaults and losses on the collateral of an investment exceed the level of defaults and losses factored into its purchase price, the value of the anticipated return from the investment will be reduced. The more
26
deeply subordinated the tranche of securities in which we invest, the greater the risk of loss upon a default. For example, CLO equity is the most subordinated tranche within a CLO and is therefore subject to the greatest risk of loss resulting from defaults on the CLO’s collateral, whether due to bankruptcy or otherwise. Any defaults and losses in excess of expected default rates and loss model inputs will have a negative impact on the fair value of our investments, will reduce the cash flows that we receive from our investments, adversely affect the fair value of our assets and could adversely impact our ability to pay dividends. Furthermore, the holders of the junior debt and equity tranches typically have limited rights with respect to decisions made with respect to collateral following an event of default on a CLO. In some cases, the senior most class of notes can elect to liquidate the collateral even if the expected proceeds are not expected to be able to pay in full all classes of notes. We could experience a complete loss of our investment in such a scenario.
In addition, the collateral of CLOs may require substantial workout negotiations or restructuring in the event of a default or liquidation. Any such workout or restructuring is likely to lead to a substantial reduction in the interest rate of such asset and/or a substantial write-down or write-off of all or a portion the principal of such asset. Any such reduction in interest rates or principal will negatively affect the fair value of our portfolio.
We are subject to risks associated with LAFs.
We may invest capital in LAFs, which are short- to medium-term facilities often provided by the bank that will serve as placement agent or arranger on a CLO transaction and which acquire loans on an interim basis which are expected to form part of the portfolio of a future CLO. Investments in LAFs have risks similar to those applicable to investments in CLOs. There typically will be no assurance that the future CLO will be consummated or that the loans held in such a loan accumulation facility are eligible for purchase by the CLO. In the event a planned CLO is not consummated, or the loans are not eligible for purchase by the CLO, the Company may be responsible for either holding or disposing of the loans. This could expose the Company primarily to credit and/or mark-to-market losses, and other risks. Leverage is typically utilized in such a facility and as such the potential risk of loss will be increased for such facilities employing leverage.
Furthermore, we likely will have no consent rights in respect of the loans to be acquired in such a facility and in the event we do have any consent rights, they will be limited. In the event a planned CLO is not consummated, or the loans are not eligible for purchase by the CLO, we may be responsible for either holding or disposing of the loans. This could expose us primarily to credit and/or mark-to-market losses, and other risks. LAFs typically incur leverage from four to six times prior to a CLO’s closing and as such the potential risk of loss will be increased for such facilities that employ leverage.
Our synthetic strategy involves certain additional risks.
We may invest in synthetic investments, such as significant risk transfer securities and credit risk transfer securities issued by banks or other financial institutions, or acquire interests in lease agreements that have the general characteristics of loans and are treated as loans for withholding tax purposes. In addition to the credit risks associated with the applicable reference assets, we will usually have a contractual relationship only with the counterparty of such synthetic investment, and not with the reference obligor of the reference asset. Accordingly, we generally will have no right to directly enforce compliance by the reference obligor with the terms of the reference asset nor will it have any rights of setoff against the reference obligor or rights with respect to the reference asset. We will not directly benefit from the collateral supporting the reference asset and will not have the benefit of the remedies that would normally be available to a holder of such reference asset. In addition, in the event of the insolvency of the counterparty, we may be treated as a general creditor of such counterparty, and will not have any claim with respect to the reference asset. Consequently, we will be subject to the credit risk of the counterparty as well as that of the reference obligor. As a result, concentrations of synthetic securities in any one counterparty subject us to an additional degree of risk with respect to defaults by such counterparty as well as by the reference obligor.
We are subject to risks associated with the bankruptcy or insolvency of an issuer or borrower of a loan that we hold or of an underlying asset held by a CLO in which we invest.
In the event of a bankruptcy or insolvency of an issuer or borrower of a loan that we hold or of an underlying asset held by a CLO or other vehicle in which we invest, a court or other governmental entity may
27
determine that our claims or those of the relevant CLO are not valid or not entitled to the treatment we expected when making our initial investment decision.
Various laws enacted for the protection of debtors may apply to the underlying assets in our investment portfolio. The information in this and the following paragraph represents a brief summary of certain points only, is not intended to be an extensive summary of the relevant issues and is applicable with respect to U.S. issuers and borrowers only. The following is not intended to be a summary of all relevant risks. Similar avoidance provisions to those described below are sometimes available with respect to non-U.S. issuers or borrowers, and there is no assurance that this will be the case which may result in a much greater risk of partial or total loss of value in that underlying asset.
If a court in a lawsuit brought by an unpaid creditor or representative of creditors of an issuer or borrower of underlying assets, such as a trustee in bankruptcy, were to find that such issuer or borrower did not receive fair consideration or reasonably equivalent value for incurring the indebtedness constituting such underlying assets and, after giving effect to such indebtedness, the issuer or borrower (1) was insolvent; (2) was engaged in a business for which the remaining assets of such issuer or borrower constituted unreasonably small capital; or (3) intended to incur, or believed that it would incur, debts beyond our ability to pay such debts as they mature, such court could decide to invalidate, in whole or in part, the indebtedness constituting the underlying assets as a fraudulent conveyance, to subordinate such indebtedness to existing or future creditors of the issuer or borrower or to recover amounts previously paid by the issuer or borrower in satisfaction of such indebtedness. In addition, in the event of the insolvency of an issuer or borrower of underlying assets, payments made on such underlying assets could be subject to avoidance as a “preference” if made within a certain period of time (which may be as long as one year under U.S. Federal bankruptcy law or even longer under state laws) before insolvency.
Our underlying assets may be subject to various laws for the protection of debtors in other jurisdictions, including the jurisdiction of incorporation of the issuer or borrower of such underlying assets and, if different, the jurisdiction from which it conducts business and in which it holds assets, any of which may adversely affect such issuer’s or borrower’s ability to make, or a creditor’s ability to enforce, payment in full, on a timely basis or at all. These insolvency considerations will differ depending on the jurisdiction in which an issuer or borrower or the related underlying assets are located and may differ depending on the legal status of the issuer or borrower.
We are subject to risks associated with any hedging or Derivative Transactions in which we participate.
We may in the future purchase and sell a variety of derivative instruments. To the extent we engage in Derivative Transactions, we expect to do so to hedge against interest rate, credit, currency and/or other risks or for other investment or risk management purposes. We may use Derivative Transactions for investment purposes to the extent consistent with our investment objectives if the Adviser deems it appropriate to do so. Derivative Transactions may be volatile and involve various risks different from, and in certain cases, greater than the risks presented by other instruments. The primary risks related to Derivative Transactions include counterparty, correlation, illiquidity, leverage, volatility, and OTC trading, operational and legal risks. A small investment in derivatives could have a large potential impact on our performance, effecting a form of investment leverage on our portfolio. In certain types of Derivative Transactions, we could lose the entire amount of our investment. In other types of Derivative Transactions, the potential loss is theoretically unlimited.
The following is a more detailed discussion of primary risk considerations related to the use of Derivative Transactions that investors should understand before investing in our securities.
Counterparty risk. Counterparty risk is the risk that a counterparty in a Derivative Transaction will be unable to honor its financial obligation to us, or the risk that the reference entity in a credit default swap or similar derivative will not be able to honor its financial obligations. Certain participants in the derivatives market, including larger financial institutions, have experienced significant financial hardship and deteriorating credit conditions. If our counterparty to a Derivative Transaction experiences a loss of capital, or is perceived to lack adequate capital or access to capital, it may experience margin calls or other regulatory requirements to increase equity. Under such circumstances, the risk that a counterparty will be unable to honor its obligations may increase substantially. If a counterparty becomes bankrupt, we may experience
28
significant delays in obtaining recovery (if at all) under the derivative contract in bankruptcy or other reorganization proceeding; if our claim is unsecured, we will be treated as a general creditor of such prime broker or counterparty and will not have any claim with respect to the underlying security. We may obtain only a limited recovery or may obtain no recovery in such circumstances. The counterparty risk for cleared derivatives is generally lower than for uncleared OTC derivatives since generally a clearing organization becomes substituted for each counterparty to a cleared derivative and, in effect, guarantees the parties’ performance under the contract as each party to a trade looks only to the clearing house for performance of financial obligations. However, there can be no assurance that the clearing house, or its members, will satisfy its obligations to us.
Correlation risk. When used for hedging purposes, an imperfect or variable degree of correlation between price movements of the derivative instrument and the underlying investment sought to be hedged may prevent us from achieving the intended hedging effect or expose us to the risk of loss. The imperfect correlation between the value of a derivative and our underlying assets may result in losses on the Derivative Transaction that are greater than the gain in the value of the underlying assets in our portfolio. The Adviser may not hedge against a particular risk because it does not regard the probability of the risk occurring to be sufficiently high as to justify the cost of the hedge, or because it does not foresee the occurrence of the risk. These factors may have a significant negative effect on the fair value of our assets and the market value of our securities.
Liquidity risk. Derivative Transactions, especially when traded in large amounts, may not be liquid in all circumstances, so that in volatile markets we would not be able to close out a position without incurring a loss. Although both OTC and exchange-traded derivatives markets may experience a lack of liquidity, OTC non-standardized derivative transactions are generally less liquid than exchange-traded instruments. The illiquidity of the derivatives markets may be due to various factors, including congestion, disorderly markets, limitations on deliverable supplies, the participation of speculators, government regulation and intervention, and technical and operational or system failures. In addition, daily limits on price fluctuations and speculative position limits on exchanges on which we may conduct transactions in derivative instruments may prevent prompt liquidation of positions, subjecting us to the potential of greater losses. As a result, we may need to liquidate other investments to meet margin and settlement payment obligations.
Leverage risk. Trading in Derivative Transactions can result in significant leverage and risk of loss. Thus, the leverage offered by trading in derivative instruments will magnify the gains and losses we experience and could cause our NAV to be subject to wider fluctuations than would be the case if we did not use the leverage feature in derivative instruments.
Volatility risk. The prices of many derivative instruments, including many options and swaps, are highly volatile. Price movements of options contracts and payments pursuant to swap agreements are influenced by, among other things, interest rates, changing supply and demand relationships, trade, fiscal, monetary and exchange control programs and policies of governments, and national and international political and economic events and policies. The value of options and swap agreements also depends upon the price of the securities or currencies underlying them.
OTC trading. Derivative Transactions that may be purchased or sold may include instruments not traded on an organized market. The risk of non-performance by the counterparty to such Derivative Transaction may be greater and the ease with which we can dispose of or enter into closing transactions with respect to such an instrument may be less than in the case of an exchange traded instrument. In addition, significant disparities may exist between “bid” and “ask” prices for certain derivative instruments that are not traded on an exchange. Such instruments are often valued subjectively and may result in mispricings or improper valuations. Improper valuations can result in increased cash payment requirements to counterparties or a loss of value, or both. In contrast, cleared derivative transactions benefit from daily mark-to-market pricing and settlement, and segregation and minimum capital requirements applicable to intermediaries. Derivatives are also subject to operational and legal risks. Operational risk generally refers to risk related to potential operational issues, including documentation issues, settlement issues, system failures, inadequate controls, and human errors. Legal risk generally refers to insufficient documentation, insufficient capacity or authority of counterparty, or legality or enforceability of a contract. Transactions entered into directly between two counterparties generally do not benefit from such protections; however, certain uncleared derivative transactions are subject to minimum margin requirements which may require us and our counterparties to
29
exchange collateral based on daily marked-to-market pricing. OTC trading generally exposes us to the risk that a counterparty will not settle a transaction in accordance with its terms and conditions because of a dispute over the terms of the contract (whether or not bona fide) or because of a credit or liquidity problem, thus causing us to suffer a loss. Such “counterparty risk” is accentuated for contracts with longer maturities where events may intervene to prevent settlement, or where we have concentrated our transactions with a single or small group of counterparties.
We may be subject to risks associated with investments in other investment companies.
We may invest in securities of other investment companies, including closed-end funds, BDCs, mutual funds, and ETFs, and may otherwise invest indirectly in securities consistent with our investment objectives, subject to statutory limitations prescribed by the 1940 Act. These limitations include in certain circumstances a prohibition on us acquiring more than 3% of the voting shares of any other investment company, and a prohibition on investing more than 5% of our total assets in securities of any one investment company or more than 10% of our total assets in securities of all investment companies. Subject to applicable law and/or pursuant to an exemptive order obtained from the SEC or under an exemptive rule adopted by the SEC, we may invest in certain other investment companies (including ETFs and money market funds) and business development companies beyond these statutory limits or otherwise provided that certain conditions are met. We will indirectly bear our proportionate share of any management fees and other expenses paid by such other investment companies, in addition to the fees and expenses that we regularly bear. We may only invest in other investment companies to the extent that the asset class exposure in such investment companies is consistent with the permissible asset class exposure for us had we invested directly in securities, and the portfolios of such investment companies are subject to similar risks as we are.
Investors will bear indirectly the fees and expenses of the CLO equity securities in which we invest.
Investors will bear indirectly the fees and expenses (including management fees and other operating expenses) of the CLO equity securities in which we invest. CLO collateral manager fees are charged on the total assets of a CLO but are assumed to be paid from the residual cash flows after interest payments to the CLO senior debt tranches. Therefore, these CLO collateral manager fees (which generally range from 0.35% to 0.50% of a CLO’s total assets) are effectively much higher when allocated only to the CLO equity tranche. The calculation does not include any other operating expense ratios of the CLOs, as these amounts are not routinely reported to shareholders on a basis consistent with this methodology; however, it is estimated that additional operating expenses of 0.30% to 0.70% could be incurred. In addition, CLO collateral managers may earn fees based on a percentage of the CLO’s equity cash flows after the CLO equity has earned a cash-on-cash return of its capital and achieved a specified “hurdle” rate.
We and our investments are subject to reinvestment risk.
As part of the ordinary management of its portfolio, a CLO will typically generate cash from asset repayments and sales and reinvest those proceeds in substitute assets, subject to compliance with its investment tests and certain other conditions. The earnings with respect to such substitute assets will depend on the quality of reinvestment opportunities available at the time. If the CLO collateral manager causes the CLO to purchase substitute assets at a lower yield than those initially acquired (for example, during periods of loan compression or need to satisfy the CLO’s covenants) or sale proceeds are maintained temporarily in cash, it would reduce the excess interest-related cash flow that the CLO collateral manager is able to achieve. The investment tests may incentivize a CLO collateral manager to cause the CLO to buy riskier assets than it otherwise would, which could result in additional losses. These factors could reduce our return on investment and may have a negative effect on the fair value of our assets and the market value of our securities. In addition, the reinvestment period for a CLO may terminate early, which would cause the holders of the CLO’s securities to receive principal payments earlier than anticipated. In addition, in most CLO transactions, CLO debt investors are subject to the risk that the holders of a majority of the equity tranche, who can direct a call or refinancing of a CLO, causing such CLO’s outstanding CLO debt securities to be repaid at par earlier than expected. There can be no assurance that we will be able to reinvest such amounts in an alternative investment that provides a comparable return relative to the credit risk assumed.
30
We and our investments are subject to risks associated with non-U.S. investing.
While we invest primarily in CLOs that hold underlying U.S. assets, these CLOs may be organized outside the United States. We may also invest in CLOs that hold collateral that are non-U.S. assets, or otherwise invest in securities of non-U.S. issuers to the extent consistent with our investment strategies and objectives. Investing in foreign entities may expose us to additional risks not typically associated with investing in U.S. issuers. These risks include changes in exchange control regulations, political and social instability, restrictions on the types or amounts of investment, expropriation, imposition of foreign taxes, less liquid markets and less available information than is generally the case in the U.S., higher transaction costs, less government supervision of exchanges, brokers and issuers, less developed bankruptcy laws, difficulty in enforcing contractual obligations, lack of uniform accounting and auditing standards, currency fluctuations and greater price volatility. Further, we, and the CLOs in which we invest, may have difficulty enforcing creditor’s rights in foreign jurisdictions.
In addition, international trade tensions may arise from time to time which could result in trade tariffs, embargoes or other restrictions or limitations on trade. The imposition of any actions on trade could trigger a significant reduction in international trade, supply chain disruptions, an oversupply of certain manufactured goods, substantial price reductions of goods and possible failure of individual companies or industries, which could have a negative impact on the value of the CLO securities that we hold.
Foreign markets also have different clearance and settlement procedures, and in certain markets there have been times when settlements have failed to keep pace with the volume of securities transactions, making it difficult to conduct such transactions. Delays in settlement could result in periods when our assets are uninvested. Our inability to make intended investments due to settlement problems or the risk of intermediary counterparty failures could cause it to miss investment opportunities. The inability to dispose of an investment due to settlement problems could result either in losses to the funds due to subsequent declines in the value of such investment or, if we have entered into a contract to sell the security, could result in possible liability to the purchaser. Transaction costs of buying and selling foreign securities also are generally higher than those involved in domestic transactions. Furthermore, foreign financial markets have, for the most part, substantially less volume than U.S. markets, and securities of many foreign companies are less liquid and their prices more volatile than securities of comparable domestic companies.
The economies of individual non-U.S. countries may also differ favorably or unfavorably from the U.S. economy in such respects as growth of gross domestic product, rate of inflation, volatility of currency exchange rates, depreciation, capital reinvestment, resources self-sufficiency and balance of payments position.
Russia Risk. Russia’s military incursion into Ukraine, the response of the United States and other countries, and the potential for wider conflict, has increased volatility and uncertainty in the financial markets and may adversely affect the Company. Immediately following Russia’s invasion, the United States and other countries imposed wide-ranging economic sanctions on Russia, individual Russian citizens, and Russian banking entities and other businesses, including those in the energy sector. These unprecedented sanctions have been highly disruptive to the Russian economy and, given the interconnectedness of today’s global economy, could have broad and unforeseen macroeconomic implications. The ultimate nature, extent and duration of Russia’s military actions (including the potential for cyberattacks and espionage), and the response of state governments and businesses, cannot be predicted at this time. However, further escalation of the conflict could result in significant market disruptions, and negatively affect global supply chains, inflation and global growth. These and any related events could negatively impact the performance of the Company’s underlying obligors and/or the market value of the Company’s common shares or preferred stock.
Currency Risk. Any of our investments that are denominated in currencies other than U.S. dollars will be subject to the risk that the value of such currency will decrease in relation to the U.S. dollar. Although we will consider hedging any non-U.S. dollar exposures back to U.S. dollars, an increase in the value of the U.S. dollar compared to other currencies in which we make investments would otherwise reduce the effect of increases and magnify the effect of decreases in the prices of our non-U.S. dollar denominated investments in their local markets. Fluctuations in currency exchange rates will similarly affect the U.S. dollar equivalent of any interest, dividends or other payments made that are denominated in a currency other than U.S. dollars.
31
Any unrealized losses we experience on our portfolio may be an indication of future realized losses, which could reduce our income available for distribution or to make payments on our other obligations.
As a registered closed-end management investment company, we are required to carry our investments at market value or, if no market value is ascertainable, at the fair value as determined in good faith by the Adviser. Decreases in the market values or fair values of our investments are recorded as unrealized depreciation. Any unrealized losses in our portfolio could be an indication of an issuer’s inability to meet its repayment obligations to us with respect to the affected investments. This could result in realized losses in the future and ultimately in reductions of our income available for distribution or to make payments on our other obligations in future periods.
If our distributions exceed our taxable income and capital gains realized during a taxable year, all or a portion of the distributions made in the same taxable year may be recharacterized as a return of capital to our common stockholders. A return of capital distribution will generally not be taxable to our stockholders.
However, a return of capital distribution will reduce a stockholder’s cost basis in shares of our common stock on which the distribution was received, thereby potentially resulting in a higher reported capital gain or lower reported capital loss when those shares of our common stock are sold or otherwise disposed of.
A portion of our income and fees may not be qualifying income for purposes of the income source requirement.
Some of the income and fees that we may recognize will not satisfy the qualifying income requirement applicable to RICs. In order to ensure that such income and fees do not disqualify us as a RIC for a failure to satisfy such requirement, we may need to recognize such income and fees indirectly through one or more entities classified as corporations for U.S. federal income tax purposes. Such corporations will be subject to U.S. corporate income tax on their earnings, which ultimately will reduce our return on such income and fees.
Risks Relating to an Investment in Our Securities
Common stock of closed-end management investment companies frequently trades at discounts to their respective NAVs, and we cannot assure you that the market price of our common stock will not decline below our NAV per share.
Common stock of closed-end management investment companies frequently trades at discounts to their respective NAVs and our common stock may also be discounted in the market. This characteristic of closed-end management investment companies is separate and distinct from the risk that our NAV per share may decline. We cannot predict whether shares of our common stock will trade above, at or below our NAV per share. The risk of loss associated with this characteristic of closed-end management investment companies may be greater for investors expecting to sell common stock purchased in an offering soon after such offering. In addition, if our common stock trades below our NAV per share, we will generally not be able to sell additional common stock to the public at market price except (1) in connection with a rights offering to our existing stockholders, (2) with the consent of the majority of the holders of our common stock, (3) upon the conversion of a convertible security in accordance with its terms or (4) under such circumstances as the SEC may permit. See “Description of Our Capital Stock — Repurchase of Shares and Other Discount Measures.”
Our common stock price may be volatile and may decrease substantially.
The trading price of our common stock may fluctuate substantially. The price of our common stock that will prevail in the market may be higher or lower than the price you paid to purchase shares of our common stock, depending on many factors, some of which are beyond our control and may not be directly related to our operating performance. These factors include the following:
•
price and volume fluctuations in the overall stock market from time to time;
•
investor demand for shares of our common stock;
•
significant volatility in the market price and trading volume of securities of registered closed-end management investment companies or other companies in our sector, which are not necessarily related to the operating performance of these companies;
32
•
changes in regulatory policies or tax guidelines with respect to RICs or registered closed-end management investment companies;
•
failure to qualify as a RIC, or the loss of RIC status;
•
any shortfall in revenue or net income or any increase in losses from levels expected by investors or securities analysts;
•
changes, or perceived changes, in the value of our portfolio investments;
•
departures of any members of the Senior Investment Team;
•
operating performance of companies comparable to us; or
•
general economic conditions and trends and other external factors.
We and the Adviser could be the target of litigation.
We or the Adviser could become the target of securities class action litigation or other similar claims if our stock price fluctuates significantly or for other reasons. The outcome of any such proceedings could materially adversely affect our business, financial condition, and/or operating results and could continue without resolution for long periods of time. Any litigation or other similar claims could consume substantial amounts of our management’s time and attention, and that time and attention and the devotion of associated resources could, at times, be disproportionate to the amounts at stake. Litigation and other claims are subject to inherent uncertainties, and a material adverse impact on our financial statements could occur for the period in which the effect of an unfavorable final outcome in litigation or other similar claims becomes probable and reasonably estimable. In addition, we could incur expenses associated with defending ourselves against litigation and other similar claims, and these expenses could be material to our earnings in future periods.
Sales in the public market of substantial amounts of our common stock may have an adverse effect on the market price of our common stock.
Sales of substantial amounts of our common stock, including by selling stockholders, or the availability of such common stock for sale, whether or not actually sold, could adversely affect the prevailing market price of our common stock. If this occurs and continues, it could impair our ability to raise additional capital through the sale of equity securities should we desire to do so. For a discussion of the adverse effect that the concentration of beneficial ownership may have on the market price of our common stock, see “— Risks Related to Our Business and Structure — Significant stockholders may control the outcome of matters submitted to our stockholders or adversely impact the market price of our securities.”
Our stockholders will experience dilution in their ownership percentage if they do not participate in our dividend reinvestment plan.
All distributions declared in cash payable to stockholders that are participants in our dividend reinvestment plan are automatically reinvested in shares of our common stock. As a result, our stockholders that do not participate in our dividend reinvestment plan will experience dilution in their ownership percentage of our common stock over time.
Your interest in us may be diluted if you do not fully exercise your subscription rights in any rights offering.
In the event we issue subscription rights to purchase shares of our common stock to existing stockholders, stockholders who do not fully exercise their rights should expect that they will, at the completion of the offer, own a smaller proportional interest in us than would otherwise be the case if they fully exercised their rights. We cannot state precisely the amount of any such dilution in share ownership because we do not know at this time what proportion of the shares will be purchased as a result of the offer.
In addition, if the subscription price is less than our net asset value per share, then our stockholders would experience an immediate dilution of the aggregate net asset value of their shares as a result of the offer. The amount of any decrease in net asset value is not predictable because it is not known at this time what the subscription price and net asset value per share will be on the expiration date of the rights offering or what proportion of the shares will be purchased as a result of the offer. Such dilution could be substantial.
33
The impact of tax legislation on us, our stockholders and our investments is uncertain.
Changes in tax laws, regulations or administrative interpretations or any amendments thereto could adversely affect us, the entities in which we invest, or our stockholders. You are urged to consult with your tax advisor with respect to the impact of any such legislation or other regulatory or administrative developments and proposals and their potential effect on your investment in us.
Our preferred stock and/ the indebtedness incurred in connection with borrowings under our BNP Credit Facility may cause the NAV and market value of our common stock to be more volatile.
Any indebtedness incurred in connection with our BNP Credit Facility, Series A Term Preferred Stock, and any future issuances of additional series of preferred stock or debt securities or other indebtedness, may cause the NAV and market value of our common stock to become more volatile. If the dividend rate on the preferred stock or interest rate payable on our indebtedness were to approach the net rate of return on our investment portfolio, the benefit of leverage to the common stockholders would be reduced. If the dividend rate on the preferred stock or interest rate payable on our indebtedness were to exceed the net rate of return on our portfolio, the leverage would result in a lower rate of return to the common stockholders than if we had not issued preferred stock or incurred any indebtedness. Any decline in the NAV of our investments would be borne entirely by the common stockholders. Therefore, if the market value of our portfolio were to decline, the leverage would result in a greater decrease in NAV to the common stockholders than if we were not leveraged through the issuance of preferred stock and the borrowings under our BNP Credit Facility or the future issuance of any debt securities. This greater NAV decrease would also tend to cause a greater decline in the market price for common stock. We might be in danger of failing to maintain the required asset coverage of the preferred stock or indebtedness or, in an extreme case, our current investment income might not be sufficient to meet the dividend requirements on the preferred stock or interest payments on our indebtedness. In order to counteract such an event, we might need to liquidate investments in order to make payments under our BNP Credit Facility or other future indebtedness or in order to fund a redemption of some or all of the preferred stock. In addition, we would pay (and the common stockholders would bear) all costs and expenses relating to the issuance and ongoing maintenance of the preferred stock or our BNP Credit Facility, including higher advisory fees if our total return exceeds the dividend rate on the preferred stock or the interest rate payable on our indebtedness.
Market yields may increase, which would result in a decline in the price of our Preferred Stock.
The prices of fixed income investments, such as our Preferred Stock, vary inversely with changes in market yields. The market yields on securities comparable to our Preferred Stock may increase, which would result in a decline in the secondary market price of shares of our Preferred Stock prior to the redemption date of such Preferred Stock. Our future debt securities, if any, would be expected to be subject to similar risks.
Our Preferred Stock is subject to a risk of early redemption, and holders may not be able to reinvest their funds.
We may voluntarily redeem some or all of the outstanding shares of our Preferred Stock on or after the dates stated in the applicable governing documents. We also may be forced to redeem some or all of the outstanding shares of our Preferred Stock to meet regulatory requirements and the asset coverage requirements of such shares. Any such redemption may occur at a time that is unfavorable to holders of our Preferred Stock. We may have an incentive to redeem any of our outstanding Preferred Stock if market conditions allow us to issue other preferred stock or debt securities at a rate that is lower than the dividend rate on the outstanding Preferred Stock. If we redeem shares of Preferred Stock, the holders of such redeemed shares face the risk that the return on an investment purchased with proceeds from such redemption may be lower than the return previously obtained from the investment in the Preferred Stock.
An active trading market for the Preferred Stock may not exist, which could adversely affect the market price of our Preferred Stock or a holder’s ability to sell their shares.
Our outstanding Preferred Stock is currently listed on the NYSE and future preferred stock also may be listed on the NYSE. However, we cannot provide any assurances that an active trading market for the Preferred Stock will exist in the future or that you will be able to sell your shares of the Preferred Stock. Even if an active trading market does exist, shares of the Preferred Stock may trade at a discount from the liquidation preference
34
for such shares depending on prevailing interest rates, the market for similar securities, our credit ratings, if any, general economic conditions, our financial condition, performance and prospects and other factors. To the extent an active trading market does not exist, the liquidity and trading price for shares of the Preferred Stock may be harmed. Accordingly, holders may be required to bear the financial risk of an investment in the Preferred Stock for an indefinite period of time.
Our Preferred Stock will be subordinate to the rights of holders of senior indebtedness.
While the holders of Preferred Stock will have equal liquidation and distribution rights to any other series of preferred stock that may be issued in the future, they will be subordinated to the rights of holders of our other senior indebtedness, including indebtedness under our BNP Credit Facility. Therefore, dividends, distributions and other payments to holders of the Preferred Stock in liquidation or otherwise may be subject to prior payments due to the holders of senior indebtedness. In addition, the 1940 Act may provide debt holders with voting rights that are superior to the voting rights of the Preferred Stock.
Holders of our Preferred Stock will bear dividend risk.
We may be unable to pay dividends on our Preferred Stock under some circumstances. The terms of any future indebtedness we may incur could preclude the payment of dividends in respect of equity securities, including our Preferred Stock, under certain conditions.
To the extent that our distributions represent a return of capital for U.S. federal income tax purposes, holders of our Preferred Stock may recognize an increased gain or a reduced loss upon subsequent sales (including cash redemptions) of their shares of Preferred Stock.
The dividends payable by us on our Preferred Stock may exceed our current and accumulated earnings and profits as determined for U.S. federal income tax purposes. If that were to occur, it would result in the amount of distributions that exceed our earnings and profits being treated first as a return of capital to the extent of a holder’s adjusted tax basis in the holder’s Preferred Stock and then, to the extent of any excess over the holder’s adjusted tax basis in the holder’s Preferred Stock, as capital gain. Any distribution that is treated as a return of capital will reduce the holder’s adjusted tax basis in the holder’s Preferred Stock, and subsequent sales (including cash redemptions) of such holder’s Preferred Stock will result in recognition of an increased taxable gain or reduced taxable loss due to the reduction in such adjusted tax basis. See “U.S. Federal Income Tax Matters — Taxation of Stockholders — Taxation of U.S. resident holders of our stock.”
There is a risk of delay in our redemption of our Preferred Stock, and we may fail to redeem such securities as required by their terms.
We generally make investments in CLO vehicles whose securities are not traded in any public market. Substantially all of the investments we presently hold and the investments we expect to acquire in the future are, and will be, subject to legal and other restrictions on resale and will otherwise be less liquid than publicly traded securities. The illiquidity of our investments may make it difficult for us to obtain cash equal to the value at which we record our investments quickly if a need arises. If we are unable to obtain sufficient liquidity prior to the mandatory redemption date, we may be forced to engage in a partial redemption or to delay a required redemption. If such a partial redemption or delay were to occur, the market price of shares of our Preferred Stock might be adversely affected.
Our future debt securities, if any, may be unsecured and therefore effectively subordinated to any secured indebtedness we may incur in the future.
Our future debt securities, if any, may not be secured by any of our assets or any of the assets of our subsidiaries. In such cases, our future debt securities, if any, would be subordinated to any secured indebtedness we or our subsidiaries may incur in the future (or any indebtedness that is initially unsecured to which we subsequently grant security) to the extent of the value of the assets securing such indebtedness. In any liquidation, dissolution, bankruptcy or other similar proceeding, the holders of any of our future secured indebtedness and the secured indebtedness of our subsidiaries may assert rights against the assets pledged to
35
secure that indebtedness in order to receive full payment of their indebtedness before the assets may be used to pay other creditors, including the holders of our future debt securities to the extent such debt securities are unsecured.
Our future debt securities, if any, may be structurally subordinated to the indebtedness and other liabilities of our subsidiaries.
Our future debt securities, if any, may be obligations exclusively of Eagle Point Income Company Inc. and not of any of our subsidiaries. In such cases, none of our subsidiaries would act as a guarantor of our future debt securities, if any, and our future debt securities, if any, would not be required to be guaranteed by any subsidiaries we may acquire or create in the future. The assets of any such subsidiary would not be directly available to satisfy the claims of our creditors, including holders of our future debt securities, if any.
Except to the extent we are a creditor with recognized claims against our subsidiaries, all claims of creditors (including holders of Preferred Stock or debt, if any) of our subsidiaries will have priority over our equity interests in such subsidiaries (and therefore the claims of our creditors, including holders of our future debt securities, if any) with respect to the assets of such subsidiaries. Even if we were recognized as a creditor of one or more of our subsidiaries, our claims would still be effectively subordinated to any security interests in the assets of any such subsidiary and to any indebtedness or other liabilities of any such subsidiary senior to our claims. Consequently, our future debt securities, if any, would be structurally subordinated to all indebtedness and other liabilities (including trade payables) of our subsidiaries and any subsidiaries that we may in the future acquire or establish as financing vehicles or otherwise.
An active trading market for our future debt securities, if any, may not exist, which could adversely affect the market price of our future debt securities, if any, or a holder’s ability to sell them.
Future debt securities, if any, may be listed on the NYSE. However, we cannot provide any assurances that an active trading market for our future debt securities, if any, will exist in the future or that you will be able to sell our future debt securities, if any. Even if an active trading market does exist, our future debt securities, if any, may trade at a discount from their initial offering price depending on prevailing interest rates, the market for similar securities, our credit ratings, if any, general economic conditions, our financial condition, performance and prospects and other factors. To the extent an active trading market does not exist, the liquidity and trading price for our future debt securities, if any, may be harmed. Accordingly, holders may be required to bear the financial risk of an investment in our future debt securities, if any, for an indefinite period of time.
Any optional redemption provision may materially adversely affect the return on our future debt securities, if any.
Our future debt securities, if any, may be redeemable in whole or in part at any time or from time to time at our sole option as set forth in the applicable indenture or otherwise. We may choose to redeem any of our future debt securities, if any, at times when prevailing interest rates are lower than the interest rate paid on the applicable future debt securities, if any. In this circumstance, holders may not be able to reinvest the redemption proceeds in a comparable security at an effective interest rate as high as that of the future debt securities, if any, being redeemed.
If we default on our obligations to pay our other indebtedness, we may not be able to make payments on our future debt securities, if any.
Any default under any agreements that may govern our future debt securities, if any, our future indebtedness or under other indebtedness to which we may be a party that is not waived by the required lenders or holders, and the remedies sought by the holders of such indebtedness could make us unable to pay principal, premium, if any, and interest on our future debt securities, if any, and substantially decrease the market value of our future debt securities, if any. If we are unable to generate sufficient cash flow and are otherwise unable to obtain funds necessary to meet required payments of principal, premium, if any, and interest on our indebtedness, or if we otherwise fail to comply with the various covenants, including financial and operating covenants, in the instruments governing any future indebtedness, we could be in default under the terms of the agreements governing such indebtedness. In the event of such default, the holders of such indebtedness could elect to declare all the funds borrowed thereunder to be due and payable, together with
36
accrued and unpaid interest, the lenders of the debt we may incur in the future could elect to terminate their commitments, cease making further loans and institute foreclosure proceedings against our assets, and we could be forced into bankruptcy or liquidation. If our operating performance declines, we may in the future need to seek to obtain waivers from the required lenders or holders of any debt that we may incur in the future to avoid being in default. If we breach our covenants under our debt and seek a waiver, we may not be able to obtain a waiver from the required lenders or holders of the debt. If this occurs, we would be in default and our lenders or debt holders could exercise their rights as described above, and we could be forced into bankruptcy or liquidation. If we are unable to repay debt, lenders having secured obligations could proceed against the collateral securing the debt. Because any future debt will likely have customary cross-default provisions, if the indebtedness thereunder or under any future credit facility is accelerated, we may be unable to repay or finance the amounts due. See “Description of Our Debt Securities.”
FATCA withholding may apply to payments to certain foreign entities.
Payments made under our future debt securities, if any, to a foreign financial institution, or “FFI,” or non-financial foreign entity, or “NFFE” (including such an institution or entity acting as an intermediary), may be subject to a U.S. withholding tax of 30% under U.S. Foreign Account Tax Compliance Act provisions of the Code (commonly referred to as “FATCA”). This withholding tax may apply to certain payments of interest on our future debt securities, if any, unless the FFI or NFFE complies with certain information reporting, withholding, identification, certification and related requirements imposed by FATCA. Depending upon the status of a holder and the status of an intermediary through which any of our future debt securities, if any, may be held, the holder could be subject to this 30% withholding tax in respect of any interest paid on our future debt securities, if any, as well as any proceeds from the sale or other disposition of our future debt securities, if any. See “U.S. Federal Income Tax Matters — Taxation of Stockholders — FATCA Withholding on Payments to Certain Foreign Entities” in this prospectus for more information.
Risks Relating to Our Business and Structure
Our investment portfolio is recorded at fair value in accordance with the 1940 Act. As a result, there will be uncertainty as to the value of our portfolio investments.
Under the 1940 Act, we are required to carry our portfolio investments at market value or, if there is no readily available market value, at fair value as determined by the Adviser in accordance with written valuation policies and procedures, subject to oversight by our board of directors, in accordance with Rule 2a-5 under the 1940 Act. Typically, there is no public market for the type of investments we target. As a result, the Adviser values these securities at least quarterly based on relevant information compiled by itself and third-party pricing services (when available) and with the oversight of our board of directors.
The determination of fair value and, consequently, the amount of unrealized gains and losses in our portfolio, are to a certain degree subjective and dependent on a valuation process approved and overseen by our board of directors. Certain factors that may be considered in determining the fair value of our investments include non-binding indicative bids and the number of trades (and the size and timing of each trade) in an investment. Valuation of certain investments is also based, in part, upon third party valuation models which take into account various market inputs. Investors should be aware that the models, information and/or underlying assumptions utilized by the Adviser or such models will not always correctly capture the fair value of an asset. Because such valuations, and particularly valuations of securities that are not publicly traded like those we hold, are inherently uncertain, they may fluctuate over short periods of time and may be based on estimates. The Adviser’s determinations of fair value may differ materially from the values that would have been used if an active public market for these securities existed. The Adviser’s determinations of the fair value of our investments have a material impact on our net earnings through the recording of unrealized appreciation or depreciation of investments and may cause our NAV on a given date to understate or overstate, possibly materially, the value that we may ultimately realize on one or more of our investments. See “Conflicts of Interest — Valuation.”
Our financial condition and results of operations depend on the Adviser’s ability to effectively manage and deploy capital.
Our ability to achieve our investment objectives depends on the Adviser’s ability to effectively manage and deploy capital, which depends, in turn, on the Adviser’s ability to identify, evaluate and monitor, and our ability to acquire, investments that meet our investment criteria.
37
Accomplishing our investment objectives on a cost-effective basis is largely a function of the Adviser’s handling of the investment process, its ability to provide competent, attentive and efficient services and our access to investments offering acceptable terms, either in the primary or secondary markets. Even if we are able to grow and build upon our investment operations, any failure to manage our growth effectively could have a material adverse effect on our business, financial condition, results of operations and prospects. The results of our operations will depend on many factors, including the availability of opportunities for investment, readily accessible short and long-term funding alternatives in the financial markets and economic conditions. Furthermore, if we cannot successfully operate our business or implement our investment policies and strategies as described in this prospectus, it could adversely impact our ability to pay dividends or make distributions. In addition, because the trading methods employed by the Adviser on our behalf are proprietary, stockholders will not be able to determine details of such methods or whether they are being followed.
We are reliant on the Adviser continuing to serve as our investment adviser.
The Adviser manages our investments. Consequently, our success depends, in large part, upon the services of the Adviser and the skill and expertise of the Adviser’s professional personnel, in particular, Thomas P. Majewski. Incapacity of Mr. Majewski could have a material and adverse effect on our performance. There can be no assurance that the professional personnel of the Adviser will continue to serve in their current positions or continue to be employed by the Adviser. We can offer no assurance that their services will be available for any length of time or that the Adviser will continue indefinitely as our investment adviser.
Under the Personnel and Resources Agreement, Eagle Point Credit Management makes available the personnel and resources, including portfolio managers and investment personnel, to the Adviser as the Adviser may determine to be reasonably necessary to the conduct of its operations. The Adviser depends upon access to the investment professionals and other resources of Eagle Point Credit Management and its affiliates to fulfill its obligations to us under the Investment Advisory Agreement. We are not a party to the Personnel and Resources Agreement and cannot assure you that Eagle Point Credit Management will fulfill its obligations under the agreement. If Eagle Point Credit Management fails to perform, we cannot assure that Eagle Point Income Management will enforce the Personnel and Resources Agreement, that such agreement will not be terminated by either party or that we will continue to have access to the investment professionals of Eagle Point Credit Management and its affiliates or their information.
The Adviser and the Administrator each has the right to resign on 90 days’ notice, and we may not be able to find a suitable replacement within that time, resulting in a disruption in our operations that could adversely affect our financial condition, business and results of operations.
The Adviser has the right, under the Investment Advisory Agreement, and the Administrator has the right under the Administration Agreement, to resign at any time upon 90 days’ written notice, whether we have found a replacement or not. If the Adviser or the Administrator resigns, we may not be able to find a new investment adviser or hire internal management, or find a new administrator, as the case may be, with similar expertise and ability to provide the same or equivalent services on acceptable terms within 90 days, or at all. If we are unable to do so quickly, our operations are likely to experience a disruption, our financial condition, business and results of operations, as well as our ability to make distributions to our stockholders and other payments to securityholders, are likely to be adversely affected and the market price of our securities may decline. In addition, the coordination of our internal management and investment activities is likely to suffer if we are unable to identify and reach an agreement with a single institution or group of executives having the expertise possessed by the Adviser and the Administrator and their affiliates. Even if we are able to retain comparable management and administration, whether internal or external, the integration of such management and their lack of familiarity with our investment objectives and operations would likely result in additional costs and time delays that may adversely affect our financial condition, business and results of operations.
Our success will depend on the ability of the Adviser and certain of its affiliates to attract and retain qualified personnel in a competitive environment.
Our growth will require that the Adviser and certain of its affiliates attract and retain new investment and administrative personnel in a competitive market. The Adviser’s and such affiliates’ ability to attract and
38
retain personnel with the requisite credentials, experience and skills will depend on several factors including its ability to offer competitive compensation, benefits and professional growth opportunities. Many of the entities, including investment funds (such as private equity funds, mezzanine funds and business development companies) and traditional financial services companies, with which the Adviser will compete for experienced personnel have greater resources than the Adviser has.
There are significant actual and potential conflicts of interest which could impact our investment returns.
Our executive officers and directors, and the Adviser and certain of its affiliates and their officers and employees, including the Senior Investment Team, have several conflicts of interest as a result of the other activities in which they engage. For example, the members of the Adviser’s investment team are and may in the future become affiliated with entities engaged in business activities similar to ours, including ECC and EPIIF, and may have conflicts of interest in allocating their time. Moreover, each member of the Senior Investment Team is engaged in other business activities which divert their time and attention. The professional staff of the Adviser will devote as much time to us as such professionals deem appropriate to perform their duties in accordance with the Investment Advisory Agreement. However, such persons may be committed to providing investment advisory and other services for other clients, and engage in other business ventures in which we have no interest. As a result of these separate business activities, the Adviser has conflicts of interest in allocating management time, services and functions among us, other advisory clients and other business ventures.
Our management fee structure may create incentives for the Adviser that are not fully aligned with the interests of our stockholders.
In the course of our investing activities, we pay a management fee to the Adviser and reimburse the Adviser for certain expenses it incurs. As a result, investors in our securities receive distributions on a “net” basis after expenses, potentially resulting in a lower rate of return than an investor might achieve through direct investments.
Since the management fee is based on our Managed Assets, which includes assets purchased using leverage, the Adviser benefits when we incur debt or use leverage. The use of leverage increases the risk of investing in us.
The Adviser’s liability is limited under the Investment Advisory Agreement, and we have agreed to indemnify the Adviser against certain liabilities, which may lead the Adviser to act in a riskier manner on our behalf than it would when acting for its own account.
Under the Investment Advisory Agreement, the Adviser does not assume any responsibility to us other than to render the services called for under the agreement, and it is not responsible for any action of our board of directors in following or declining to follow the Adviser’s advice or recommendations. The Adviser maintains a contractual and fiduciary relationship with us. Under the terms of the Investment Advisory Agreement, the Adviser, its officers, managers, members, agents, employees and other affiliates are not liable to us for acts or omissions performed in accordance with and pursuant to the Investment Advisory Agreement, except those resulting from acts constituting willful misfeasance, bad faith, gross negligence or reckless disregard of the Adviser’s duties under the Investment Advisory Agreement. In addition, we have agreed to indemnify the Adviser and each of its officers, managers, members, agents, employees and other affiliates from and against all damages, liabilities, costs and expenses (including reasonable legal fees and other amounts reasonably paid in settlement) incurred by such persons arising out of or based on performance by the Adviser of its obligations under the Investment Advisory Agreement, except where attributable to willful misfeasance, bad faith, gross negligence or reckless disregard of the Adviser’s duties under the Investment Advisory Agreement. These protections may lead the Adviser to act in a riskier manner when acting on our behalf than it would when acting for its own account.
The Adviser may not be able to achieve the same or similar returns as those achieved by other portfolios managed by the Senior Investment Team.
Although the Senior Investment Team manages other investment portfolios, including accounts using investment objectives, investment strategies and investment policies similar to ours, we cannot assure you that we will be able to achieve the results realized by any other vehicles managed by the Senior Investment Team.
39
We may experience fluctuations in our NAV and quarterly operating results.
We could experience fluctuations in our NAV from month to month and in our quarterly operating results due to a number of factors, including the timing of distributions to our stockholders, fluctuations in the value of the CLO securities that we hold, our ability or inability to make investments that meet our investment criteria, the interest and other income earned on our investments, the level of our expenses (including the interest or dividend rate payable on the debt securities or preferred stock we issue), variations in and the timing of the recognition of realized and unrealized gains or losses, the degree to which we encounter competition in our markets and general economic conditions. As a result of these factors, our NAV and results for any period should not be relied upon as being indicative of our NAV and results in future periods.
Our board of directors may change our operating policies and strategies without stockholder approval, the effects of which may be adverse.
Our board of directors has the authority to modify or waive our current operating policies, investment criteria and strategies, other than those that we have deemed to be fundamental, without prior stockholder approval. We cannot predict the effect any changes to our current operating policies, investment criteria and strategies would have on our business, NAV, operating results and value of our securities. However, the effects of any such changes could adversely impact our ability to pay dividends and cause you to lose all or part of your investment.
Our management’s estimates of certain metrics relating to our financial performance for a period are subject to revision based on our actual results for such period.
Our management makes and publishes unaudited estimates of certain metrics indicative of our financial performance, including the NAV per share of our common stock and the range of NAV per share of our common stock on a monthly basis, and the range of the net investment income and realized gain/loss per share of our common stock on a quarterly basis. While any such estimate will be made in good faith based on our most recently available records as of the date of the estimate, such estimates are subject to financial closing procedures, the Adviser’s final determination of the fair value of our applicable investments as of the end of the applicable quarter and other developments arising between the time such estimate is made and the time that we finalize our quarterly financial results and may differ materially from the results reported in the audited financial statements and/or the unaudited financial statements included in filings we make with the SEC. As a result, investors are cautioned not to place undue reliance on any management estimates presented in this prospectus or any related amendment to this prospectus or related prospectus supplement and should view such information in the context of our full quarterly or annual results when such results are available.
We will be subject to corporate-level income tax if we are unable to maintain our RIC status for U.S. federal income tax purposes.
We can offer no assurance that we will be able to maintain RIC status. To obtain and maintain RIC tax treatment under the Code, we must meet certain annual distribution, income source and asset diversification requirements.
The annual distribution requirement for a RIC will be satisfied if we distribute dividends to our stockholders each tax year of an amount generally at least equal to 90% of the sum of our net ordinary income and realized net short-term capital gains in excess of realized net long-term capital losses, if any. Because we use debt financing, we are subject to certain asset coverage requirements under the 1940 Act and may be subject to financial covenants that could, under certain circumstances, restrict us from making distributions necessary to satisfy the distribution requirement. If we are unable to obtain cash from other sources, we could fail to qualify for RIC tax treatment and thus become subject to corporate-level income tax.
The income source requirement will be satisfied if we obtain at least 90% of our income for each tax year from dividends, interest, gains from the sale of our securities or similar sources.
The asset diversification requirement will be satisfied if we meet certain asset composition requirements at the end of each quarter of our tax year. Failure to meet those requirements may result in our having to dispose of certain investments quickly in order to prevent the loss of RIC status. Because most of our
40
investments are expected to be in CLO securities for which there will likely be no active public market, any such dispositions could be made at disadvantageous prices and could result in substantial losses.
If we fail to qualify for RIC tax treatment for any reason and remain or become subject to corporate income tax, the resulting corporate taxes could substantially reduce our net assets, the amount of income available for distribution and the amount of our distributions.
We may have difficulty paying our required distributions if we recognize income before or without receiving cash representing such income.
For federal income tax purposes, we will include in income certain amounts that we have not yet received in cash, such as original issue discount or market discount, which may arise if we acquire a debt security at a significant discount to par, or payment-in-kind interest, which represents contractual interest added to the principal amount of a debt security and due at the maturity of the debt security. We also may be required to include in income certain other amounts that we have not yet, and may not ever, receive in cash. Our investments in payment-in-kind interest may represent a higher credit risk than loans for which interest must be paid in full in cash on a regular basis. For example, even if the accounting conditions for income accrual are met, the issuer of the security could still default when our actual collection is scheduled to occur upon maturity of the obligation.
Since, in certain cases, we may recognize income before or without receiving cash representing such income, we may have difficulty meeting the annual distribution requirement necessary to maintain RIC tax treatment under the Code. Accordingly, we may have to sell some of our investments at times and/or at prices we would not consider advantageous, raise additional debt or equity capital or forgo new investment opportunities for this purpose. If we are not able to obtain cash from other sources, we may fail to qualify for RIC tax treatment and thus become subject to corporate-level income tax.
Our cash distributions to stockholders may change and a portion of our distributions to stockholders may be a return of capital.
The amount of our cash distributions may increase or decrease at the discretion of our board of directors, based upon its assessment of the amount of cash available to us for this purpose and other factors. Unless we are able to generate sufficient cash through the successful implementation of our investment strategy, we may not be able to sustain a given level of distributions and may need to reduce the level of our cash distributions in the future. Further, to the extent that the portion of the cash generated from our investments that is recorded as interest income for financial reporting purposes is less than the amount of our distributions, all or a portion of one or more of our future distributions, if declared, may comprise a return of capital. Accordingly, stockholders should not assume that the sole source of any of our distributions is net investment income. Any reduction in the amount of our distributions would reduce the amount of cash received by our stockholders and could have a material adverse effect on the market price of our shares. See “— Risks Related to Our Investments — Our investments are subject to prepayment risk” and “— Any unrealized losses we experience on our portfolio may be an indication of future realized losses, which could reduce our income available for distribution or to make payments on our other obligations.”
Our stockholders may receive shares of our common stock as distributions, which could result in adverse tax consequences to them.
In order to satisfy certain annual distribution requirements to maintain RIC tax treatment under Subchapter M of the Code, we may declare a large portion of a distribution in shares of our common stock instead of in cash even if a stockholder has opted out of participation in the dividend reinvestment plan. Historically, we have not declared any portion of our distributions in shares of our common stock. As long as at least 20% of such distribution is paid in cash and certain requirements are met, the entire distribution will be treated as a dividend for U.S. federal income tax purposes. As a result, a stockholder generally would be subject to tax on 100% of the fair market value of the distribution on the date the distribution is received by the stockholder in the same manner as a cash distribution, even though most of the distribution was paid in shares of our common stock.
41
Because we expect to distribute substantially all of our ordinary income and net realized capital gains to our stockholders, we may need additional capital to finance the acquisition of new investments and such capital may not be available on favorable terms, or at all.
In order to maintain our RIC status, we are required to distribute at least 90% of the sum of our net ordinary income and realized net short-term capital gains in excess of realized net long-term capital losses, if any. As a result, these earnings will not be available to fund new investments, and we will need additional capital to fund growth in our investment portfolio. If we fail to obtain additional capital, we could be forced to curtail or cease new investment activities, which could adversely affect our business, operations and results. Even if available, if we are not able to obtain such capital on favorable terms, it could adversely affect our net investment income.
A disruption or downturn in the capital markets and the credit markets could impair our ability to raise capital and negatively affect our business.
We may be materially affected by market, economic and political conditions globally and in the jurisdictions and sectors in which we invest or operate, including conditions affecting interest rates and the availability of credit. Unexpected volatility, illiquidity, governmental action, currency devaluation or other events in the global markets in which we directly or indirectly hold positions could impair our ability to carry out our business and could cause us to incur substantial losses. These factors are outside our control and could adversely affect the liquidity and value of our investments, and may reduce our ability to make attractive new investments.
In particular, economic and financial market conditions significantly deteriorated for a significant part of the past decade as compared to prior periods. Global financial markets experienced considerable declines in the valuations of debt and equity securities, an acute contraction in the availability of credit and the failure of a number of leading financial institutions. As a result, certain government bodies and central banks worldwide, including the U.S. Treasury Department and the U.S. Federal Reserve, undertook unprecedented intervention programs, the effects of which remain uncertain. Although certain financial markets have improved, to the extent economic conditions experienced during the past decade recur, they may adversely impact our investments. Signs of deteriorating sovereign debt conditions in Europe and elsewhere and uncertainty regarding the U.S. economy more generally could lead to further disruption in the global markets. Trends and historical events do not imply, forecast or predict future events, and past performance is not necessarily indicative of future results. There can be no assurance that the assumptions made or the beliefs and expectations currently held by the Adviser will prove correct, and actual events and circumstances may vary significantly.
We may be subject to risk arising from a default by one of several large institutions that are dependent on one another to meet their liquidity or operational needs, so that a default by one institution may cause a series of defaults by the other institutions. This is sometimes referred to as “systemic risk” and may adversely affect financial intermediaries with which we interact in the conduct of our business.
We also may be subject to risk arising from a broad sell off or other shift in the credit markets, which may adversely impact our income and NAV. In addition, if the value of our assets declines substantially, we may fail to maintain the minimum asset coverage imposed upon us by the 1940 Act. Any such failure would affect our ability to issue additional preferred stock, debt securities and other senior securities, including borrowings, and may affect our ability to pay distributions on our capital stock, which could materially impair our business operations. Our liquidity could be impaired further by an inability to access the capital markets or to obtain additional debt financing. For example, we cannot be certain that we would be able to obtain debt financing on commercially reasonable terms, if at all. In previous market cycles, many lenders and institutional investors have previously reduced or ceased lending to borrowers. In the event of such type of market turmoil and tightening of credit, increased market volatility and widespread reduction of business activity could occur, thereby limiting our investment opportunities.
Moreover, we are unable to predict when economic and market conditions may be favorable in future periods. Even if market conditions are broadly favorable over the long term, adverse conditions in particular sectors of the financial markets could adversely impact our business.
42
If we are unable to refinance and/or obtain additional debt capital, our business could be materially adversely affected.
We have obtained debt financing in order to obtain funds to make additional investments and grow our portfolio of investments. Such debt capital may take the form of a term credit facility with a fixed maturity date or other fixed term instruments, and we may be unable to extend, refinance or replace such debt financings prior to their maturity. If we are unable to refinance and/or obtain additional debt capital on commercially reasonable terms, our liquidity will be lower than it would have been with the benefit of such financings, which would limit our ability to grow our business. Any such limitations on our ability to grow and take advantage of leverage may decrease our earnings, if any, and distributions to stockholders, which in turn may lower the trading price of our securities. In addition, in such event, we may need to liquidate certain of our investments, which may be difficult to sell if required, meaning that we may realize significantly less than the value at which we have recorded our investments. Furthermore, to the extent we are not able to raise capital and are at or near our targeted leverage ratios, we may receive smaller allocations, if any, on new investment opportunities under the Adviser’s allocation policy.
Debt capital that is available to us in the future, if any, including upon the refinancing of then-existing debt prior to its maturity, may be at a higher cost and on less favorable terms and conditions than costs and other terms and conditions at which we can currently obtain debt capital. In addition, if we are unable to repay amounts outstanding under any such debt financings and are declared in default or are unable to renew or refinance these debt financings, we may not be able to make new investments or operate our business in the normal course. These situations may arise due to circumstances that we may be unable to control, such as lack of access to the credit markets, a severe decline in the value of the U.S. dollar, an economic downturn or an operational problem that affects third parties or us, and could materially damage our business.
Regulations governing our operation as a registered closed-end management investment company affect our ability to raise additional capital and the way in which we do so. The raising of debt capital may expose us to risks, including the typical risks associated with leverage.
Under the provisions of the 1940 Act, we are permitted, as a registered closed-end management investment company, to issue senior securities (including debt securities, preferred stock and/or borrowings from banks or other financial institutions); provided we meet certain asset coverage requirements (i.e., 300% for senior securities representing indebtedness and 200% in the case of the issuance of preferred stock under current law). If the value of our assets declines, we may be unable to satisfy this test. If that happens, we may be required to sell a portion of our investments and, depending on the nature of our leverage, repay a portion of our indebtedness (including by redeeming a portion of any series of preferred stock or notes that may be outstanding) at a time when such sales or redemptions may be disadvantageous. Also, any amounts that we use to service or repay our indebtedness would not be available for distributions to our stockholders.
We are not generally able to issue and sell shares of our common stock at a price below the then current NAV per share (exclusive of any distributing commission or discount). We may, however, sell shares of our common stock at a price below the then current NAV per share (1) in connection with a rights offering to our existing stockholders, (2) with the consent of the majority of our common stockholders, (3) upon the conversion of a convertible security in accordance with its terms or (4) under such circumstances as the SEC may permit.
Provisions of the General Corporation Law of the State of Delaware and our certificate of incorporation and bylaws could deter takeover attempts and have an adverse effect on the price of our securities.
The General Corporation Law of the State of Delaware, or the “DGCL,” contains provisions that may discourage, delay or make more difficult a change in control of us or the removal of our directors. Our certificate of incorporation and bylaws contain provisions that limit liability and provide for indemnification of our directors and officers. These provisions and others also may have the effect of deterring hostile takeovers or delaying changes in control or management. We are subject to Section 203 of the DGCL, the application of which is subject to any applicable requirements of the 1940 Act. This section generally prohibits us from engaging in mergers and other business combinations with stockholders that beneficially own 15% or more of our voting stock, or with their affiliates, unless our directors or stockholders approve the business combination
43
in the prescribed manner. If our board of directors does not approve a business combination, Section 203 of the DGCL may discourage third parties from trying to acquire control of us and increase the difficulty of consummating such an offer.
We have also adopted measures that may make it difficult for a third party to obtain control of us, including provisions of our certificate of incorporation classifying our board of directors in three classes serving staggered three-year terms, and provisions of our certificate of incorporation authorizing our board of directors to classify or reclassify shares of our preferred stock in one or more classes or series, to cause the issuance of additional shares of our capital stock, and to amend our certificate of incorporation, without stockholder approval, in certain instances. These provisions, as well as other provisions of our certificate of incorporation and bylaws, may delay, defer or prevent a transaction or a change in control that might otherwise be in the best interests of our securityholders.
Significant stockholders may control the outcome of matters submitted to our stockholders or adversely impact the market price or liquidity of our securities.
To the extent any stockholder, such as Cavello Bay Reinsurance Limited, or “Cavello Bay,” and Enstar’s other affiliates, individually or acting together with other stockholders, controls a significant number of our voting securities (as defined in the 1940 Act) or any class of voting securities, they may have the ability to control the outcome of matters submitted to our stockholders for approval, including the election of directors and any merger, consolidation or sale of all or substantially all of our assets, and may cause actions to be taken that you may not agree with or that are not in your interests or those of other securityholders.
This concentration of beneficial ownership also might harm the market price of our securities by:
•
delaying, deferring or preventing a change in corporate control;
•
impeding a merger, consolidation, takeover or other business combination involving us; or
•
discouraging a potential acquirer from making a tender offer or otherwise attempting to obtain control of us.
To the extent that any stockholder that holds a significant number of our securities is subject to temporary restrictions on resale of such securities, including certain lock-up restrictions, such restrictions could adversely affect the liquidity of trading in our securities, which may harm the market price of our securities.
We are subject to the risk of legislative and regulatory changes impacting our business or the markets in which we invest.
Legal and regulatory changes. Legal and regulatory changes could occur and may adversely affect us and our ability to pursue our investment strategies and/or increase the costs of implementing such strategies. New or revised laws or regulations may be imposed by the Commodity Futures Trading Commission, or the “CFTC,” the SEC, the U.S. Federal Reserve, other banking regulators, other governmental regulatory authorities or self-regulatory organizations that supervise the financial markets that could adversely affect us. In particular, these agencies are empowered to promulgate a variety of new rules pursuant to recently enacted financial reform legislation in the United States. We also may be adversely affected by changes in the enforcement or interpretation of existing statutes and rules by these governmental regulatory authorities or self-regulatory organizations. Such changes, or uncertainty regarding any such changes, could adversely affect the strategies and plans set forth in this prospectus and may result in our investment focus shifting from the areas of expertise of the Senior Investment Team to other types of investments in which the investment team may have less expertise or little or no experience. Thus, any such changes, if they occur, could have a material adverse effect on our results of operations and the value of your investment.
Derivative Investments. The derivative investments in which we may invest are subject to comprehensive statutes, regulations and margin requirements. In particular, certain provisions of the Dodd-Frank Wall Street Reform and Consumer Protection Act, or the “Dodd-Frank Act,” requires certain standardized derivatives to be executed on a regulated market and cleared through a central counterparty, which may result in increased margin requirements and costs for us. The Dodd-Frank Act also established minimum margin requirements on certain uncleared derivatives which may result in us and our counterparties posting higher margin amounts
44
for uncleared derivatives. In addition, we have claimed an exclusion from the definition of the term “commodity pool operator” pursuant to CFTC No-Action Letter 12-38 issued by the staff of the CFTC Division of Swap Dealer and Intermediary Oversight. For us to continue to qualify for this exclusion, (i) the aggregate initial margin and premiums required to establish our positions in derivative instruments subject to the jurisdiction of the U.S. Commodity Exchange Act, as amended, or the “CEA,” and (other than positions entered into for hedging purposes) may not exceed five percent of our liquidation value, (ii) the net notional value of our aggregate investments in CEA-regulated derivative instruments (other than positions entered into for hedging purposes) may not exceed 100% of our liquidation value, or (iii) we must meet an alternative test appropriate for a “fund of funds” as set forth in CFTC No-Action Letter 12-38. In the event we fail to qualify for the exclusion and the Adviser is required to register as a “commodity pool operator” in connection with serving as our investment adviser and becomes subject to additional disclosure, recordkeeping and reporting requirements, our expenses may increase. The Adviser has claimed an exclusion from the definition of the term “ commodity pool operator” under the CEA pursuant to CFTC Regulation 4.5 under the CEA promulgated by the CFTC with respect to us, and we currently operate in a manner that would permit the Adviser to continue to claim such exclusion.
Under SEC Rule 18f-4, related to the use of derivatives, short sales, reverse repurchase agreements and certain other transactions by registered investment companies, we are permitted to enter into derivatives and other transactions that create future payment or delivery obligations, including short sales, notwithstanding the senior security provisions of the 1940 Act if we comply with certain value-at-risk leverage limits and derivatives risk management program and board oversight and reporting requirements or comply with a “limited derivatives users” exception. We have elected to rely on the limited derivatives users exception. We may change this election and comply with the other provisions of Rule 18f-4 related to derivatives transactions at any time and without notice. To satisfy the limited derivatives users exception, we have adopted and implemented written policies and procedures reasonably designed to manage our derivatives risk and limit our derivatives exposure in accordance with Rule 18f-4. Rule 18f-4 also permits us to enter into reverse repurchase agreements or similar financing transactions notwithstanding the senior security provisions of the 1940 Act if we aggregate the amount of indebtedness associated with our reverse repurchase agreements or similar financing transactions with the aggregate amount of any other senior securities representing indebtedness when calculating our asset coverage ratios as discussed above or treat all such transactions as derivatives transactions for all purposes under Rule 18f-4. In addition, we are permitted to invest in a security on a when-issued or forward-settling basis, or with a non-standard settlement cycle, and the transaction will be deemed not to involve a senior security under the 1940 Act, provided that (i) we intend to physically settle the transaction and (ii) the transaction will settle within 35 days of its trade date (the “Delayed-Settlement Securities Provision”). We may otherwise engage in such transactions that do not meet the conditions of the Delayed-Settlement Securities Provision so long as we treat any such transaction as a “derivatives transaction” for purposes of compliance with the rule. Furthermore, we are permitted to enter into an unfunded commitment agreement, and such unfunded commitment agreement will not be subject to the asset coverage requirements under the 1940 Act, if we reasonably believe, at the time we enter into such agreement, that we will have sufficient cash and cash equivalents to meet our obligations with respect to all such agreements as they come due. We cannot predict the effects of these requirements. The Adviser intends to monitor developments and seek to manage our assets in a manner consistent with achieving our investment objective, but there can be no assurance that it will be successful in doing so.
Loan Securitizations. Section 619 of the Dodd-Frank Act, commonly referred to as the “Volcker Rule,” generally prohibits, subject to certain exemptions, covered banking entities from engaging in proprietary trading or sponsoring, or acquiring or retaining an ownership interest in, a hedge fund or private equity fund, or “covered funds,” (which have been broadly defined in a way which could include many CLOs). Given the limitations on banking entities investing in CLOs that are covered funds, the Volcker Rule may adversely affect the market value or liquidity of any or all of the investments held by us. Although the Volcker Rule and the implementing rules exempt “loan securitizations” from the definition of covered fund, not all CLOs will qualify for this exemption.
In June 2020, the five federal agencies responsible for implementing the Volcker Rule adopted amendments to the Volcker Rule’s implementing regulations, including changes relevant to the treatment of securitizations (the “Volcker Changes”). Among other things, the Volcker Changes ease certain aspects of the “loan securitization” exclusion, and create additional exclusions from the “covered fund” definition, and
45
narrow the definition of “ownership interest” to exclude certain “senior debt interests.” Also, under the Volcker Changes, a debt interest would no longer be considered an “ownership interest” solely because the holder has the right to remove or replace the manager following a cause-related default. The Volcker Changes were effective October 1, 2020. It is currently unclear how, or if, the Volcker Changes will affect the CLO securities in which the Company invests.
U.S. Risk Retention. In October 2014, six federal agencies (the Federal Deposit Insurance Corporation, or the “FDIC,” the Comptroller of the Currency, the Federal Reserve Board, the SEC, the Department of Housing and Urban Development and the Federal Housing Finance Agency) adopted joint final rules implementing certain credit risk retention requirements contemplated in Section 941 of the Dodd-Frank Act, or the “Final U.S. Risk Retention Rules.” These rules were published in the Federal Register on December 24, 2014. With respect to the regulation of CLOs, the Final U.S. Risk Retention Rules require that the “sponsor” or a “majority owned affiliate” thereof (in each case as defined in the rules), will retain an “eligible vertical interest” or an “eligible horizontal interest” (in each case as defined therein) or any combination thereof in the CLO in the manner required by the Final U.S. Risk Retention Rules.
The Final U.S. Risk Retention Rules became fully effective on December 24, 2016, or the “Final U.S. Risk Retention Effective Date,” and to the extent applicable to CLOs, the Final U.S. Risk Retention Rules contain provisions that may adversely affect the return of our investments. On February 9, 2018, a three judge panel of the United States Court of Appeals for the District of Columbia Circuit, or the “DC Circuit Court,” rendered a decision in The Loan Syndications and Trading Association v. Securities and Exchange Commission and Board of Governors of the Federal Reserve System, No. 1:16-cv-0065, in which the DC Circuit Court held that open market CLO collateral managers are not “securitizers” subject to the requirements of the Final U.S. Risk Retention Rules, or the “DC Circuit Ruling.” Thus, collateral managers of open market CLOs are no longer required to comply with the Final U.S. Risk Retention Rules at this time. As such, it is possible that some collateral managers of open market CLOs will decide to dispose of the notes (or cause their majority owned affiliates to dispose of the notes) constituting the “eligible vertical interest” or “eligible horizontal interest” they were previously required to retain, or decide to take other action with respect to such notes that is not otherwise prohibited by the Final U.S. Risk Retention Rules. To the extent either the underlying collateral manager or its majority-owned affiliate divests itself of such notes, this will reduce the degree to which the relevant collateral manager’s incentives are aligned with those of the noteholders of the CLO (which may include us as a CLO noteholder), and could influence the way in which the relevant collateral manager manages the CLO assets and/or makes other decisions under the transaction documents related to the CLO in a manner that is adverse to us.
There can be no assurance or representation that any of the transactions, structures or arrangements currently under consideration by or currently used by CLO market participants will comply with the Final U.S. Risk Retention Rules to the extent such rules are reinstated or otherwise become applicable to open market CLOs. The ultimate impact of the Final U.S. Risk Retention Rules on the loan securitization market and the leveraged loan market generally remains uncertain, and any negative impact on secondary market liquidity for securities comprising a CLO may be experienced due to the effects of the Final U.S. Risk Retention Rules on market expectations or uncertainty, the relative appeal of other investments not impacted by the Final U.S. Risk Retention Rules and other factors.
EU/UK Risk Retention. The securitization industry in both European Union (“EU”) and the United Kingdom (“UK”) has also undergone a number of significant changes in the past few years. Regulation (EU) 2017/2402 relating to a European framework for simple, transparent and standardized securitization (as amended by Regulation (EU) 2021/557 and as further amended from time to time, the “EU Securitization Regulation”) applies to certain specified EU investors, and Regulation (EU) 2017/2402 relating to a European framework for simple, transparent and standardised securitization in the form in effect on 31 December 2020 (which forms part of UK domestic law by virtue of the European Union (Withdrawal) Act 2018 (as amended, the “EUWA”)) (as amended by the Securitization (Amendment) (EU Exit) Regulations 2019 and as further amended from time to time, the “UK Securitization Regulation” and, together with the EU Securitization Regulation, the “Securitization Regulations”) applies to certain specified UK investors, in each case, who are investing in a “securitisation” (as such term is defined under each Securitization Regulation).
46
The due diligence requirements of Article 5 of the EU Securitization Regulation (the “EU Due Diligence Requirements”) apply to each investor that is an “institutional investor” (as such term is defined in the EU Securitization Regulation), being an investor which is one of the following: (a) an insurance undertaking as defined in Directive 2009/138/EC of the European Parliament and of the Council of 25 November 2009 on the taking-up and pursuit of the business of Insurance and Reinsurance (Solvency II) (recast) (“Solvency II”); (b) a reinsurance undertaking as defined in Solvency II; (c) subject to certain conditions and exceptions, an institution for occupational retirement provision falling within the scope of Directive (EU) 2016/2341 of the European Parliament and of the Council of 14 December 2016 on the activities and supervision of institutions for occupational retirement provision (IORPs) (the “IORP Directive”), or an investment manager or an authorised entity appointed by an institution for occupational retirement provision pursuant to the IORP Directive; (d) an alternative investment fund manager (“AIFM”) as defined in Directive 2011/61/EU of the European Parliament and of the Council of 8 June 2011 on Alternative Investment Fund Managers that manages and/or markets alternative investment funds in the EU; (e) an undertaking for the collective investment in transferable securities (“UCITS”) management company, as defined in Directive 2009/65/EC of the European Parliament and of the Council of 13 July 2009 on the coordination of laws, regulations and administrative provisions relating to undertakings for collective investment in transferable securities (UCITS) (the “UCITS Directive”); (f) an internally managed UCITS, which is an investment company authorised in accordance with the UCITS Directive and which has not designated a management company authorised under the UCITS Directive for its management; or (g) a credit institution as defined in Regulation (EU) No 575/2013 of the European Parliament and of the Council of 26 June 2013 on prudential requirements for credit institutions and investment firms (the “CRR”) for the purposes of the CRR, or an investment firm as defined in the CRR, in each case, such investor an “EU Institutional Investor.”
The due diligence requirements of Article 5 of the UK Securitization Regulation (the “UK Due Diligence Requirements” and, together with the EU Due Diligence Requirements, the “Due Diligence Requirements”) apply to each investor that is an “institutional investor” (as such term is defined in the UK Securitization Regulation), being an investor which is one of the following: (a) an insurance undertaking as defined in the Financial Services and Markets Act 2000 (as amended, the “FSMA”); (b) a reinsurance undertaking as defined in the FSMA; (c) an occupational pension scheme as defined in the Pension Schemes Act 1993 that has its main administration in the UK, or a fund manager of such a scheme appointed under the Pensions Act 1995 that, in respect of activity undertaken pursuant to that appointment, is authorised under the FSMA; (d) an AIFM (as defined in the Alternative Investment Fund Managers Regulations 2013 (the “AIFM Regulations”)) which markets or manages AIFs (as defined in the AIFM Regulations) in the UK; (e) a management company as defined in the FSMA; (f) a UCITS as defined by the FSMA, which is an authorised open ended investment company as defined in the FSMA; (g) a FCA investment firm as defined by the CRR as it forms part of UK domestic law by virtue of EUWA (the “UK CRR”); or (h) a CRR investment firm as defined in the UK CRR, in each case, such investor a “UK Institutional Investor” and, such investors together with EU Institutional Investors, “Institutional Investors.”
Among other things, the applicable Due Diligence Requirements require that prior to holding a “securitisation position” (as defined in each Securitization Regulation) an Institutional Investor (other than the originator, sponsor or original lender) has verified that:
(1)
the originator, sponsor or original lender will retain on an ongoing basis a material net economic interest which, in any event, shall be not less than five per cent. in the securitization, determined in accordance with Article 6 of the applicable Securitization Regulation, and has disclosed the risk retention to such Institutional Investor;
(2)
(in the case of each EU Institutional Investor only) the originator, sponsor or securitization special purpose entity (“SSPE”) has, where applicable, made available the information required by Article 7 of the EU Securitization Regulation in accordance with the frequency and modalities provided for thereunder;
(3)
(in the case of each UK Institutional Investor only) the originator, sponsor or SSPE:
(i)
if established in the UK has, where applicable, made available the information required by Article 7 of the UK Securitization Regulation (the “UK Transparency Requirements”) in accordance with the frequency and modalities provided for thereunder; or
47
(ii)
if established in a country other than the UK, where applicable, made available information which is substantially the same as that which it would have made available under the UK Transparency Requirements if it had been established in the UK, and has done so with such frequency and modalities as are substantially the same as those with which it would have made information available under the UK Transparency Requirements if it had been established in the UK; and
(4)
in the case of each Institutional Investor, where the originator or original lender either (i) is not a credit institution or an investment firm (each as defined in the applicable Securitization Regulation) or (ii) is established in a third country (being (x) in respect of the EU Securitization Regulation, a country other than an EU member state, or (y) in respect of the UK Securitization Regulation, a country other than the UK), the originator or original lender grants all the credits giving rise to the underlying exposures on the basis of sound and well-defined criteria and clearly established processes for approving, amending, renewing and financing those credits and has effective systems in place to apply those criteria and processes in order to ensure that credit-granting is based on a thorough assessment of the obligor’s creditworthiness.
The Due Diligence Requirements further require that prior to holding a securitisation position, an Institutional Investor, other than the originator, sponsor or original lender, carry out a due diligence assessment which enables it to assess the risks involved, including but not limited to (a) the risk characteristics of the individual securitisation position and the underlying exposures; and (b) all the structural features of the securitization that can materially impact the performance of the securitisation position, including the contractual priorities of payment and priority of payment-related triggers, credit enhancements, liquidity enhancements, market value triggers, and transaction-specific definitions of default.
In addition, pursuant to the applicable Due Diligence Requirements, while holding a securitization position, an Institutional Investor, other than the originator, sponsor or original lender, is subject to various ongoing monitoring obligations, including but not limited to: (a) establishing appropriate written procedures to monitor compliance with the Due Diligence Requirements and the performance of the securitisation position and of the underlying exposures; (b) performing stress tests on the cash flows and collateral values supporting the underlying exposures or, in the absence of sufficient data on cash flows and collateral values, stress tests on loss assumptions, having regard to the nature, scale and complexity of the risk of the securitisation position; (c) ensuring internal reporting to its management body so that the management body is aware of the material risks arising from the securitisation position and so that those risks are adequately managed; and (d) being able to demonstrate to its competent authorities, upon request, that it has a comprehensive and thorough understanding of the securitisation position and underlying exposures and that it has implemented written policies and procedures for the risk management of the securitisation position and for maintaining records of (i) the verifications and due diligence in accordance with the applicable Due Diligence Requirements and (ii) any other relevant information.
Any Institutional Investor that fails to comply with the applicable Due Diligence Requirements in respect of a securitization position which it holds may become subject to a range of regulatory sanctions including, in the case of a credit institution, investment firm, insurer or reinsurer, a punitive regulatory capital charge with respect to such securitization position, or, in certain other cases, a requirement to take corrective action.
CLOs issued in Europe are generally structured in compliance with the Securitization Regulations so that prospective investors subject to the Securitization Regulations can invest in compliance with such requirements. To the extent a CLO is structured in compliance with the Securitization Regulations, our ability to invest in the residual tranches of such CLOs could be limited, or we could be required to hold our investment for the life of the CLO. If a CLO has not been structured to comply with the Securitization Regulations, it will limit the ability of Institutional Investors to purchase CLO securities, which may adversely affect the price and liquidity of the securities (including the residual tranche) in the secondary market. Additionally, the Securitization Regulations and any regulatory uncertainty in relation thereto may reduce the issuance of new CLOs and reduce the liquidity provided by CLOs to the leveraged loan market generally. Reduced liquidity in the loan market could reduce investment opportunities for collateral managers, which could negatively affect the return of our investments. Any reduction in the volume and liquidity provided by CLOs to the leveraged loan market could also reduce opportunities to redeem or refinance the securities comprising a CLO in an
48
optional redemption or refinancing and could negatively affect the ability of obligors to refinance of their collateral obligations, either of which developments could increase defaulted obligations above historic levels.
Japanese Risk Retention. The Japanese Financial Services Agency (the “JFSA”) published a risk retention rule as part of the regulatory capital regulation of certain categories of Japanese investors seeking to invest in securitization transactions (the “JRR Rule”). The JRR Rule mandates an “indirect” compliance requirement, meaning that certain categories of Japanese investors will be required to apply higher risk weighting to securitization exposures they hold unless the relevant originator commits to hold a retention interest equal to at least 5% of the exposure of the total underlying assets in the transaction (the “Japanese Retention Requirement”) or such investors determine that the underlying assets were not “inappropriately originated.” The Japanese investors to which the JRR Rule applies include banks, bank holding companies, credit unions (shinyo kinko), credit cooperatives (shinyo kumiai), labor credit unions (rodo kinko), agricultural credit cooperatives (nogyo kyodo kumiai), ultimate parent companies of large securities companies and certain other financial institutions regulated in Japan (such investors, “Japanese Affected Investors”). Such Japanese Affected Investors may be subject to punitive capital requirements and/or other regulatory penalties with respect to investments in securitizations that fail to comply with the Japanese Retention Requirement.
The JRR Rule became effective on March 31, 2019. At this time, there are a number of unresolved questions and no established line of authority, precedent or market practice that provides definitive guidance with respect to the JRR Rule, and no assurances can be made as to the content, impact or interpretation of the JRR Rule. In particular, the basis for the determination of whether an asset is “inappropriately originated” remains unclear and, therefore, unless the JFSA provides further specific clarification, it is possible that CLO securities we have purchased may contain assets deemed to be “inappropriately originated” and, as a result, may not be exempt from the Japanese Retention Requirement. The JRR Rule or other similar requirements may deter Japanese Affected Investors from purchasing CLO securities, which may limit the liquidity of CLO securities and, in turn, adversely affect the price of such CLO securities in the secondary market. Whether and to what extent the JFSA may provide further clarification or interpretation as to the JRR Rule is unknown.
Private Funds Rule. On February 9, 2022, the SEC proposed certain rules and amendments under the Investment Advisers Act of 1940, as amended, to enhance the regulations applicable to private fund advisers (the “Proposed Private Fund Rules”) that, if adopted in their current form, would affect investment advisers such as the CLO collateral managers, by, among other things, (i) requiring such managers to comply with additional reporting and compliance obligations, (ii) prohibiting certain types of preferential treatment, including, among other things, the provision of information regarding portfolio holdings of the private fund, and (iii) prohibiting or imposing requirements on certain business practices, including prohibiting certain types of indemnification (which could include indemnification provided for in the CLO’s management agreement) and requiring fairness opinions for adviser-led secondary transactions. Because most CLOs in which we invest rely on Section 3(c)(7) of the 1940 Act, each such CLO will be considered a “ private fund” within the meaning of the Proposed Private Fund Rules. The costs in complying with certain of the reporting and compliance obligations under the Proposed Private Fund Rules could be substantial, and it is unclear if the costs of preparing such reports would be borne by the CLO or the CLO’s collateral manager. If the CLOs in which we invest are responsible for such expenses, it could affect the return on our investments in CLO securities. In addition, if any CLO collateral manager were prohibited from discussing the underlying portfolio of CLO assets with investors, entirely or absent highly specific disclosure, it could result in a reduction or elimination of any CLO collateral manager’s ability to provide information to us relating to such CLO’s assets other than the reporting required by the CLO’s transaction documents. In addition, the Proposed Private Fund Rules could adversely affect a CLO’s ability to consummate a refinancing or other optional redemption. As a result, adoption of the Proposed Private Fund Rules could have a material and adverse effect on the market value and/or liquidity of the CLO securities in which we invest.
The SEC staff could modify its position on certain non-traditional investments, including investments in CLO securities.
The staff of the SEC from time to time has undertaken a broad review of the potential risks associated with different asset management activities, focusing on, among other things, liquidity risk and leverage risk. The staff of the Division of Investment Management of the SEC has, in correspondence with registered management investment companies, previously raised questions about the level of, and special risks associated with, investments in CLO securities. While it is not possible to predict what conclusions, if any, the staff may
49
reach in these areas, or what recommendations, if any, the staff might make to the SEC, the imposition of limitations on investments by registered management investment companies in CLO securities could adversely impact our ability to implement our investment strategy and/or our ability to raise capital through public offerings, or could cause us to take certain actions that may result in an adverse impact on our stockholders, our financial condition and/or our results of operations. We are unable at this time to assess the likelihood or timing of any such regulatory development.
General Risk Factors
Terrorist actions, natural disasters, outbreaks or pandemics may disrupt the market and impact our operations.
Terrorist acts, acts of war, natural disasters, outbreaks or pandemics may disrupt our operations, as well as the operations of the businesses in which we invest. Such acts have created, and continue to create, economic and political uncertainties and have contributed to global economic instability. For example, many countries have experienced outbreaks of infectious illnesses in recent decades, including swine flu, avian influenza, SARS and COVID-19. Since December 2019, the spread of COVID-19 has caused social unrest and commercial disruption on a global scale.
Global economies and financial markets are highly interconnected, and conditions and events in one country, region or financial market may adversely impact issuers in a different country, region or financial market. The COVID-19 pandemic has magnified these risks and has had, and may continue to have, a material adverse impact on local economies in the affected jurisdictions and also on the global economy, as cross border commercial activity and market sentiment have been impacted by the outbreak and government and other measures seeking to contain its spread. The effects of the COVID-19 pandemic contributed to increased volatility in global financial markets and likely will affect countries, regions, companies, industries and market sectors more dramatically than others. The COVID-19 pandemic has had, and any other outbreak of an infectious disease or serious environmental or public health concern could have, a significant negative impact on economic and market conditions, could exacerbate pre-existing political, social and economic risks in certain countries or regions and could trigger a prolonged period of global economic slowdown, which may impact us and our underlying investments. Following the onset of the pandemic, certain CLOs we held experienced increased defaults by underlying borrowers. Obligor defaults and rating agency downgrades caused, and may in the future cause, payments that would have otherwise been made to the CLO equity or CLO debt securities that the Company holds to instead be diverted to buy additional loans within a given CLO or paid to senior CLO debt holders as an early amortization payment. In addition, defaults and downgrades of underlying obligors caused, and may in the future cause, a decline in the value of CLO securities generally. If CLO cash flows or income decrease as a result of the pandemic, the portion of our distribution comprised of a return of capital could increase or distributions could be reduced.
We are subject to risks related to cybersecurity and other disruptions to information systems.
We are highly dependent on the communications and information systems of the Adviser, the Administrator and their affiliates as well as certain other third-party service providers. We, and our service providers, are susceptible to operational and information security risks. While we, the Adviser and the Administrator have procedures in place with respect to information security, technologies may become the target of cyber-attacks or information security breaches that could result in the unauthorized gathering, monitoring, release, misuse, loss or destruction of our and/or our stockholders’ confidential and other information, or otherwise disrupt our operations or those of our service providers. Disruptions or failures in the physical infrastructure or operating systems and cyber-attacks or security breaches of the networks, systems or devices that we and our service providers use to service our operations, or disruption or failures in the movement of information between service providers could disrupt and impact the service providers’ and our operations, potentially resulting in financial losses, the inability of our stockholders to transact business and of us to process transactions, inability to calculate our NAV, misstated or unreliable financial data, violations of applicable privacy and other laws, regulatory fines, penalties, litigation costs, increased insurance premiums, reputational damage, reimbursement or other compensation costs, and/or additional compliance costs. Our service providers’ policies and procedures with respect to information security have been established to seek to identify and mitigate the types of risk to which we and our service providers are subject. As with any risk management system, there are inherent limitations to these policies and procedures as there may exist, or develop in the future, risks that have not been anticipated or identified. There can be no assurance that we or our service providers will not suffer losses relating to information security breaches (including cyber-attacks) or other disruptions to information systems in the future.
50
USE OF PROCEEDS
Unless otherwise specified in the applicable prospectus supplement, we intend to use the proceeds from the sale of our securities pursuant to this prospectus to acquire investments in accordance with our investment objectives and strategies described in this prospectus, to make distributions to our stockholders and for general working capital purposes. In addition, we may also use all or a portion of the net proceeds from the sale of our securities to repay any outstanding indebtedness or preferred stock at the time of the offering, including any borrowings from the BNP Credit Facility or Series A Term Preferred Stock. We currently anticipate that it will generally take approximately three to six months after the completion of any offering of securities to invest substantially all of the net proceeds of the offering in our targeted investments, although such period may vary and depends on the size of the offering and the availability of appropriate investment opportunities consistent with our investment objectives and market conditions. We cannot assure you we will achieve our targeted investment pace, which may negatively impact our returns. Until appropriate investments or other uses can be found, we will invest in temporary investments, such as cash, cash equivalents, U.S. government securities and other high-quality debt investments that mature in one year or less, which we expect will have returns substantially lower than the returns that we anticipate earning from investments in CLO securities and related investments. Investors should expect, therefore, that before we have fully invested the proceeds of the offering in accordance with our investment objectives and strategies, assets invested in these instruments would earn interest income at a modest rate, which may not exceed our expenses during this period. To the extent that the net proceeds from an offering have not been fully invested in accordance with our investment objectives and strategies prior to the next payment of a distribution to our stockholders, a portion of the proceeds may be used to pay such distribution and may represent a return of capital.
SENIOR SECURITIES
Information about the Company’s outstanding senior securities (i) as of the end of each fiscal year since its inception may be found in the “Supplemental Information — Senior Securities Table” section of the Company’s most recent Annual Report on Form N-CSR, as amended, for the fiscal year ended December 31, 2022, filed with the SEC on February 24, 2023, and (ii) as of March 31, 2023 may be found in the “Notes to the Financial Statements — Asset Coverage” section of the Company’s interim report filed pursuant to Rule 30b2-1 under the 1940 Act for the quarter ended March 31, 2023, filed with the SEC on May 23, 2023, each of which is incorporated by reference herein.
PRICE RANGE OF COMMON STOCK
Our common stock began trading on July 24, 2019 and is currently traded on the NYSE under the symbol “EIC.” The following table lists the high and low closing sale price for our common stock, the high and low closing sale price as a percentage of NAV and distributions declared per share each quarter since January 1, 2020.
Period | | | NAV(1) | | | Closing Sales Price | | | Premium (Discount) of High Sales Price to NAV(2) | | | Premium (Discount) of Low Sales Price to NAV(2) | | | Distributions Declared(3) | | |||||||||||||||||||||
| | High | | | Low | | ||||||||||||||||||||||||||||||||
| Fiscal year ending December 31, 2021(4) | | | | | | | | | | | | | | | | | | | | | | | | | | | | | | | | | | | | ||
First Quarter | | | | $ | 16.90 | | | | | $ | 15.48 | | | | | $ | 14.60 | | | | | | (8.4)% | | | | | (13.6)% | | | | $ | 0.26 | | | ||
Second Quarter | | | | $ | 17.38 | | | | | $ | 16.20 | | | | | $ | 15.29 | | | | | | (6.8)% | | | | | (12.0)% | | | | $ | 0.27 | | | ||
Third Quarter | | | | $ | 17.69 | | | | | $ | 17.65 | | | | | $ | 16.11 | | | | | | (0.2)% | | | | | (8.9)% | | | | $ | 0.36 | | | ||
Fourth Quarter | | | | $ | 16.76 | | | | | $ | 19.36 | | | | | $ | 16.79 | | | | | | 15.5% | | | | | 0.2% | | | | $ | 0.56 | | | ||
| Fiscal year ending December 31, 2022(5) | | | | | | | | | | | | | | | | | | | | | | | | | | | | | | | | | | | | ||
First Quarter | | | | $ | 16.52 | | | | | $ | 17.38 | | | | | $ | 15.85 | | | | | | 5.2% | | | | | (4.1)% | | | | $ | 0.38 | | | ||
Second Quarter | | | | $ | 13.66 | | | | | $ | 17.91 | | | | | $ | 14.75 | | | | | | 31.1% | | | | | 8.0% | | | | $ | 0.38 | | | ||
Third Quarter | | | | $ | 13.05 | | | | | $ | 17.29 | | | | | $ | 13.60 | | | | | | 32.5% | | | | | 4.2% | | | | $ | 0.42 | | | ||
Fourth Quarter | | | | $ | 12.91 | | | | | $ | 16.11 | | | | | $ | 13.57 | | | | | | 24.8% | | | | | 5.1% | | | | $ | 0.48 | | | ||
51
Period | | | NAV(1) | | | Closing Sales Price | | | Premium (Discount) of High Sales Price to NAV(2) | | | Premium (Discount) of Low Sales Price to NAV(2) | | | Distributions Declared(3) | | |||||||||||||||||||||
| | High | | | Low | | ||||||||||||||||||||||||||||||||
| Fiscal year ending December 31, 2023 | | | | | | | | | | | | | | | | | | | | | | | | | | | | | | | | | | | | ||
First Quarter | | | | $ | 13.20 | | | | | $ | 15.48 | | | | | $ | 13.85 | | | | | | 17.3% | | | | | 4.9% | | | | $ | 0.48 | | | ||
(1)
NAV per share is determined as of the last day in the relevant quarter and therefore may not reflect the NAV per share on the date of the high and low sales prices. The NAVs shown are based on outstanding shares at the end of each period.
(2)
Calculated as of the respective high or low closing sales price divided by the quarter end NAV.
(3)
Represents the cash distributions (including dividends, dividends reinvested and returns of capital, if any) per share that we have declared on our common stock in the specified quarter. Tax characteristics of distributions will vary.
(4)
For the fiscal year ending December 31, 2021, as reported on the Company’s 2021 Form 1099-DIV, distributions made by the Company were comprised of net investment income, as calculated on a per share basis, of 100% (or $1.33 per share of common stock).
(5)
For the fiscal year ending December 31, 2022, as reported on the Company’s 2022 Form 1099-DIV, distributions made by the Company were comprised of net investment income, as calculated on a per share basis, of 100% (or $1.53 per share of common stock).
Shares of closed-end management investment companies may trade at a market price that is less than the NAV that is attributable to those shares. The possibility that our shares of common stock will trade at a discount to NAV or at a premium that is unsustainable over the long term is separate and distinct from the risk that our NAV will decrease. It is not possible to predict whether our shares will trade at, above or below NAV in the future. Our NAV per share was $13.20 as of March 31, 2023. The closing sales price for shares of the Company’s common stock on the NYSE on March 31, 2023 was $14.11, which represented a 6.89% premium to NAV per share. On June 26, 2023, the last reported closing sales price of the Company’s common stock was $13.07 per share. As of June 26, 2023, there were 9 stockholders of record of the Company’s common stock (which does not reflect holders whose shares are held in street name by a broker, bank or other nominee).
ADDITIONAL BUSINESS INFORMATION
Additional Information on the Structural Advantages of CLOs
CLOs are generally required to hold a portfolio of assets that is highly diversified by underlying borrower and industry and that is subject to a variety of asset concentration limitations. Most CLOs are non-static, revolving structures that generally allow for reinvestment over a reinvestment period, which is typically up to five years. The terms and covenants of a typical CLO structure are, with certain exceptions, based primarily on the cash flow generated by, and the par value (as opposed to the market price or fair value) of, the collateral. These covenants include collateral coverage tests, interest coverage tests and collateral quality tests.
CLOs have two priority-of-payment schedules (commonly called “waterfalls”), which are detailed in a CLO’s indenture and govern how cash generated from a CLO’s underlying collateral is distributed to the CLO’s debt and equity investors. The interest waterfall applies to interest payments received on a CLO’s underlying collateral. The principal waterfall applies to cash generated from principal on the underlying collateral, primarily through loan repayments and the proceeds from loan sales. Through the interest waterfall, any excess interest-related cash flow available after the required quarterly interest payments to CLO debt investors are made and certain CLO expenses (such as administration and management fees) are paid is then distributed to the CLO’s equity investors each quarter, subject to compliance with certain tests.
The Adviser believes that excess interest-related cash flow is an important driver of CLO equity returns. In addition, relative to certain other high-yielding credit investments such as mezzanine or subordinated debt, CLO equity is expected to have a shorter payback period with higher front-end loaded quarterly cash flows
52
during the early years of a CLO’s life if there is no disruption in the interest waterfall due to a failure to remain in compliance with certain tests.
Most CLOs are non-static, revolving structures that generally allow for reinvestment over a reinvestment period. Specifically, a CLO’s collateral manager normally has broad latitude — within a specified set of asset eligibility and diversity criteria — to manage and modify a CLO’s portfolio over time. We believe that skilled CLO collateral managers can add significant value to both CLO debt and equity investors through a combination of their credit expertise and a strong understanding of how to manage effectively within the rules-based structure of a CLO.
After the CLO’s reinvestment period has ended, in accordance with the CLO’s principal waterfall, cash generated from principal payments or other proceeds are generally distributed to repay CLO debt investors in order of seniority. That is, the AAA tranche investors are repaid first, the AA tranche investors second and so on, with any remaining principal being distributed to the equity tranche investors. In certain instances, principal may be reinvested after the end of the reinvestment period.
CLOs contain a variety of structural features and covenants that are designed to enhance the credit protection of CLO debt investors, including overcollateralization tests and interest coverage tests. The overcollateralization tests and interest coverage tests require CLOs to maintain certain levels of overcollateralization (measured as par value of assets to liabilities subject to certain adjustments) and interest coverage, respectively. If a CLO breaches an overcollateralization test or interest coverage test, excess interest-related cash flow that would otherwise be available for distribution to the CLO equity tranche investors is diverted to prepay CLO debt investors in order of seniority until such time as the covenant breach is cured. If the covenant breach is not or cannot be cured, the CLO equity investors (and potentially other debt tranche investors) may experience a deferral of cash flow, a partial or total loss of their investment and/or the CLO may eventually experience an event of default. For this reason, CLO equity investors are often referred to as being in a first loss position. The Adviser will have no control over whether or not the CLO is able to satisfy its relevant interest coverage tests or overcollateralization tests.
CLOs also typically have interest diversion tests, which also act to ensure that CLOs maintain adequate overcollateralization. If a CLO breaches an interest diversion test, excess interest-related cash flow that would otherwise be available for distribution to the CLO equity tranche investors is diverted to acquire new loan collateral until the test is satisfied. Such diversion would lead to payments to the equity investors being delayed and/or reduced.
Cash flow CLOs do not have mark-to-market triggers and, with limited exceptions (such as the proportion of assets rated “CCC+” or lower (or their equivalent) by which such assets exceed a specified concentration limit, discounted purchases and defaulted assets), CLO covenants are generally calculated using the par value of collateral, not the market value or purchase price. As a result, a decrease in the market price of a CLO’s performing collateral portfolio does not generally result in a requirement for the CLO collateral manager to sell assets (i.e., no forced sales) or for CLO equity investors to contribute additional capital (i.e., no margin calls).
Overview of Senior Secured Loans
Senior secured loans have the most senior position in a borrower’s capital structure or share the senior position with other senior debt securities of the borrower. This capital structure position generally gives holders of senior secured loans a priority claim on some or all of the borrower’s assets in the event of default and therefore the lenders will be paid before certain other creditors of the borrower. Broadly syndicated senior secured loans are typically originated and structured by banks on behalf of corporate borrowers with proceeds often used for leveraged buyout transactions, mergers and acquisitions, stock repurchases, recapitalizations, refinancings, financing capital expenditures, and internal growth. Broadly syndicated senior secured loans are typically acquired through both primary bank syndications and in the secondary market, and distributed by the arranging bank to a diverse group of investors primarily consisting of CLOs, loan and high-yield bond registered funds, loan separate accounts, banks, insurance companies, finance companies and hedge funds. Senior secured loans are floating rate instruments, typically making quarterly interest payments based on a spread over LIBOR. We believe that senior secured loans represent an attractive and stable base of collateral for CLOs. In most cases, a senior secured loan will be secured by specific collateral of the issuer. Historically,
53
many of these investments have traded at or near par (i.e., 100% of face value), although they more recently have traded at greater discounts on the current market environment, the Adviser may also purchase stressed and distressed senior secured loans at a material discount to par, if the Adviser believes that there are attractive opportunities to generate capital appreciation by making such investments.
Senior secured loans generally are negotiated between a borrower and several financial institution lenders represented by one or more lenders acting as agent of all the lenders. The agent is responsible for negotiating the loan agreement that establishes the terms and conditions of the senior secured loan and the rights of the borrower and the lenders. The agent is responsible for negotiating the loan agreement that establishes the terms and conditions of the senior secured loan and the rights of the borrower and the lenders. Senior secured loans also have contractual terms designed to protect lenders. Senior secured loans also have contractual terms designed to protect lenders. These covenants may include mandatory prepayment out of excess cash flows, restrictions on dividend payments, the maintenance of minimum financial ratios, limits on indebtedness and financial tests. Breach of these covenants generally is an event of default and, if not waived by the lenders, may give lenders the right to accelerate principal and interest payments. Other senior secured loans may be issued with less restrictive covenants which are often referred to as “covenant-lite” transactions. In a “covenant-lite” loan, the covenants that require the borrower to “maintain” certain financial ratios are eliminated altogether, and the lenders are left to rely only on covenants that restrict a company from “incurring” or actively engaging certain action. But a covenant that only restricts a company from incurring new debt cannot be violated simply by a deteriorating financial condition, the company has to take affirmative action to breach it. The impact of these covenant-lite transactions may be to retard the speed with which lenders will be able to take control over troubled deals. We generally acquire senior secured loans of borrowers that, among other things, in the Adviser’s judgment, can make timely payments on their senior secured loans and that satisfy other credit standards established by the Adviser.
When we purchase first and second lien senior floating rate loans and other floating rate debt securities, coupon rates are floating, not fixed and are tied to a benchmark lending rate. The interest rates of these floating rate debt securities vary periodically based upon a benchmark indicator of prevailing interest rates.
When we purchase an Assignment, we succeed to all the rights and obligations under the loan agreement of the assigning lender and becomes a lender under the loan agreement with the same rights and obligations as the assigning lender. These rights include the ability to vote along with the other lenders on such matters as enforcing the terms of the loan agreement (e.g., declaring defaults, initiating collection action, etc.). Taking such actions typically requires a vote of the lenders holding at least a majority of the investment in the loan, and may require a vote by lenders holding two-thirds or more of the investment in the loan. Because we typically do not hold a majority of the investment in any loan, we will not be able by ourselves to control decisions that require a vote by the lenders.
While we believe that senior secured loans and CLO securities have certain attractive fundamental attributes, such securities are subject to a number of risks as discussed in the “Risk Factors” section of this prospectus. In addition, many of the statistics and data noted in this prospectus relate to historical periods when market conditions were, in some cases, materially different than they are as of the date of this prospectus. As with other asset classes, market conditions and dynamics for senior secured loans and CLO securities evolve over time. For example, over the past decade, the senior secured loan market has evolved from one in which covenant-lite loans represented a minority of the market to one in which such loans represent a significant majority of the market.
54
THE ADVISER AND THE ADMINISTRATOR
Our board of directors is responsible for the overall management and supervision of our business and affairs, including the appointment of advisers and sub-advisers. Pursuant to the Investment Advisory Agreement, our board of directors has appointed the Adviser as our investment adviser.
The Adviser
The Adviser was established in September 2018 and is registered as an investment adviser with the SEC. The Adviser, collectively with Eagle Point Credit Management, as of December 31, 2022, had approximately $7.5 billion of total assets under management, including capital commitments that were undrawn as of such date. Based on Eagle Point Credit Management’s CLO equity assets under management, the Adviser believes that, collectively with Eagle Point Credit Management, it is among the largest CLO equity investors in the market. The Adviser is primarily owned by certain of the Trident Funds through intermediary holding companies. Additionally, the Senior Investment Team, certain other employees of Eagle Point Credit Management, and an affiliate of Enstar hold an indirect ownership interest in the Adviser. The Adviser is ultimately governed through intermediary holding companies by the Adviser’s Board of Managers, which includes Mr. Majewski and certain principals of Stone Point. See “— Adviser’s Board of Managers.” The Adviser is located at 600 Steamboat Road, Suite 202, Greenwich, CT 06830.
In addition to managing our investments, the Adviser’s affiliates and members of the Senior Investment Team manage investment accounts for other clients, including ECC, a publicly traded, closed-end management investment company that is registered under the 1940 Act and for which Eagle Point Credit Management serves as investment adviser and EPIIF, a non-listed, closed-end management investment company that is registered under the 1940 Act and for which Eagle Point Credit Management serves as investment adviser, privately offered pooled investment vehicles and institutional separate accounts. Many of these accounts pursue an investment strategy that substantially or partially overlaps with the strategy that we pursue. The Adviser’s affiliation with Stone Point and the Trident Funds, and the management of ECC and EPIIF and such other vehicles and accounts by the Adviser’s affiliates and Senior Investment Team, give rise to certain conflicts of interest. See “Conflicts of Interest.”
Portfolio Managers
We are managed by members of the Senior Investment Team. The Senior Investment Team is led by Mr. Majewski, Managing Partner of the Adviser, and is also comprised of Daniel W. Ko, Senior Principal and Portfolio Manager, and Daniel M. Spinner, Senior Principal and Portfolio Manager. The Senior Investment Team is primarily responsible for our day-to-day investment management and the implementation of our investment strategy and process.
Each member of the Senior Investment Team is a CLO industry specialist who has been directly involved in the CLO market for the majority of his career and has built relationships with key market participants, including CLO collateral managers, investment banks and investors. Members of the Senior Investment Team have been involved in the CLO market as:
•
the head of the CLO business at various investment banks;
•
a lead CLO structurer and CDO workout specialist at an investment bank;
•
a CLO equity and debt investor;
•
principal investors in CLO collateral management firms; and
•
a lender and mergers and acquisitions adviser to CLO collateral management firms.
We believe that the complementary, yet highly specialized, skill set of each member of the Senior Investment Team provides the Adviser with a competitive advantage in its CLO-focused investment strategy.
Biographical information on the Senior Investment Team, each of whom has served as a portfolio manager since our inception, is set forth below:
55
Thomas P. Majewski, Managing Partner of the Adviser. Mr. Majewski is a Managing Partner of the Adviser and Managing Partner and a founder of Eagle Point Credit Management. He serves as a director and Chief Executive Officer of Eagle Point Credit Company and serves as a trustee, Chairman and Chief Executive Officer of Eagle Point Institutional Income Fund. Mr. Majewski has been involved in the formation and/or monetization of many CLO transactions across multiple market cycles. Mr. Majewski led the creation of some of the earliest refinancing CLOs, introducing techniques that are now commonplace in the market. Mr. Majewski’s experience in the CLO market dates back to the 1990s. He has spent his entire career in the structured finance and credit markets. Mr. Majewski is also a member of the Adviser’s Board of Managers and Eagle Point Credit Management’s investment committee.
Prior to joining Eagle Point Credit Management in September 2012, Mr. Majewski was a Managing Director and U.S. Head of CLO Banking at RBS Securities Inc., or “RBS,” from September 2011 through September 2012, where he was responsible for all aspects of RBS’s new-issue CLO platform. Prior to joining RBS, Mr. Majewski was the U.S. country head at AMP Capital Investors (US) Ltd. and AE Capital Advisers (US) LLC, where he was responsible for investing in credit, structured products and other private assets on behalf of several Australian investors. Prior to this, Mr. Majewski was a Managing Director and head of CLO banking at Merrill Lynch Pierce Fenner and Smith Inc. Mr. Majewski also has held leadership positions within the CLO groups at JPMorgan Securities Inc. and Bear, Stearns & Co. Inc. Mr. Majewski formerly served as a member of the board of managers and investment committee of Marble Point Credit Management LLC (“Marble Point”), and as a director of Marble Point Loan Financing Limited, an investment fund managed by Marble Point which is listed on the London Stock Exchange. Mr. Majewski has a B.S. from Binghamton University and has been a Certified Public Accountant (inactive).
Mr. Majewski also serves as a member of the board of directors of Eagle Point Credit Company and chairman of the board of trustees of Eagle Point Institutional Income Fund.
Daniel W. Ko, Portfolio Manager. Mr. Ko is a Senior Principal and Portfolio Manager of the Adviser and Eagle Point Credit Management. Mr. Ko is responsible for manager evaluation and structuring investment opportunities in the primary CLO market, analyzing secondary CLO market opportunities, executing trades and monitoring investments. Mr. Ko has specialized in structured finance throughout his entire career.
Prior to joining Eagle Point Credit Management in December 2012, Mr. Ko was with Bank of America Merrill Lynch, or “BAML,” for the previous six years, most recently as Vice President of the CLO structuring group, where he was responsible for modeling the projected deal cash flows, negotiating deal terms with both debt and equity investors and coordinating the rating process. In addition, he was responsible for exploring non-standard structuring initiatives such as financing trades with dynamic leverage, emerging market CBOs and European CLOs. Prior to joining the CLO structuring group, Mr. Ko managed BAML’s legacy CLO, trust-preferred securities CDO and asset-backed securities CDO portfolios. Prior to Bank of America’s merger with Merrill Lynch, Mr. Ko was an associate in Merrill Lynch’s CDO structuring group, Mr. Ko graduated magna cum laude from the University of Pennsylvania’s Wharton School with a B.S. in finance and accounting.
Daniel M. Spinner (CAIA), Portfolio Manager. Mr. Spinner is a Senior Principal and Portfolio Manager of the Adviser and Eagle Point Credit Management. Mr. Spinner is primarily responsible for manager evaluation and due diligence and for monitoring investments. Mr. Spinner is also actively involved in investor relations and communications. Mr. Spinner is an alternative asset management industry specialist with 20 years of experience advising, financing and investing in alternative asset management firms and funds. Mr. Spinner’s experience in the CLO market dates back to the late 1990s.
Prior to joining Eagle Point Credit Management in February 2013, Mr. Spinner was an Investment Analyst at the 1199SEIU Benefit and Pension Funds, from June 2009 to February 2013, where he oversaw the private equity, special opportunities credit and real estate allocations. The 1199SEIU Benefit and Pension Funds are collectively among the largest Taft-Hartley plans in the United States. Prior to this, Mr. Spinner was a Managing Director at Bear, Stearns & Co. Inc. focused on alternative asset managers. Prior to Bear Stearns, Mr. Spinner was the co-founder and president of Structured Capital Partners, Inc., a financial holding company formed to invest in structured credit managers. Mr. Spinner was credit trained at Chase Manhattan Bank where he began his career as an investment banker and spent seven years in the Financial Institutions Group (including at JPMorgan Securities Inc. post-merger), where he had coverage responsibility for asset
56
management firms including CLO collateral managers. Mr. Spinner formerly served as a member of the board of managers and investment committee of Marble Point. Mr. Spinner earned a B.A., summa cum laude, from Gettysburg College and an M.B.A. from Columbia University.
The following table sets forth accounts within each category listed for which members of the Senior Investment Team are jointly and primarily responsible for day-to-day portfolio management as of December 31, 2022. Among the accounts listed below, two of the “Registered Investment Companies” (with total assets of $774.6 million), seven of the “Other Pooled Investment Vehicles” (with total assets of $2,350.1 million) and 26 of the “Other Accounts” (with total assets of $1,710.6 million) are subject to a performance fee.
| | | | Registered Investment Companies | | | Other Pooled Investment Vehicles | | | Other Accounts | | |||||||||||||||||||||||||||
| | | | Number of Accounts | | | Total Assets (in millions) | | | Number of Accounts | | | Total Assets (in millions)(1) | | | Number of Accounts | | | Total Assets (in millions) | | ||||||||||||||||||
Thomas P. Majewski | | | | | 2 | | | | | $ | 774.6 | | | | | | 10 | | | | | $ | 2,652.4 | | | | | | 55 | | | | | $ | 4,617.9 | | |
Daniel W. Ko | | | | | 2 | | | | | $ | 774.6 | | | | | | 10 | | | | | $ | 2,652.4 | | | | | | 55 | | | | | $ | 4,617.9 | | |
Daniel M. Spinner | | | | | 2 | | | | | $ | 774.6 | | | | | | 10 | | | | | $ | 2,652.4 | | | | | | 55 | | | | | $ | 4,617.9 | | |
(1)
Total Assets are estimated and unaudited and may vary from final audited figures. Total assets exclude amounts invested in the equity of another investment vehicle managed by the portfolio manager so as to avoid double counting.
Compensation of Portfolio Managers. Investment professionals of the Adviser are paid out of the total revenues of the Adviser and certain of its affiliates, including Eagle Point Credit Management, including the advisory fees earned with respect to providing advisory services to us. Professional compensation is structured so that key professionals benefit from strong investment performance generated on accounts that the Adviser and such affiliates manage and from their longevity with the Adviser and its affiliates. Each member of the Senior Investment Team has indirect equity ownership interests in the Adviser and related long-term incentives. Members of the Senior Investment Team also receive a fixed base salary and an annual market and performance-based cash bonus. The bonus is determined by the Adviser’s ultimate Board of Managers, and is based on both quantitative and qualitative analysis of several factors, including the profitability of the Adviser and its affiliates, and the contribution of the individual employee. Many of the factors considered by management in reaching its compensation determinations will be impacted by our long-term performance and the value of our assets as well as the portfolios managed for the Adviser’s and such affiliates’ other clients.
Securities Owned in the Company by Portfolio Managers. The table below sets forth the dollar range of the value of the shares of our common stock that are owned beneficially by each portfolio manager as of December 31, 2022. For purposes of this table, beneficial ownership is defined to mean a direct or indirect pecuniary interest.
Name of Portfolio Manager | | | Dollar Range of Equity Securities in the Company(1) | | |||
Thomas P. Majewski | | | | $ | 100,001 – $500,000 | | |
Daniel W. Ko | | | | $ | 50,001 – $100,000 | | |
Daniel M. Spinner | | | | $ | 100,001 – $500,000 | | |
(1)
Dollar ranges are as follows: None, $1 – $10,000, $10,001 – $50,000, $50,001 – $100,000, $100,001 – $500,000, $500,001 – $1,000,000 and over $1,000,000.
Adviser’s Board of Managers
The Adviser is ultimately governed through intermediary holding companies by the Adviser’s Board of Managers, which governs and oversees the overall activities of the Adviser. The Adviser’s Board of Managers is comprised of Mr. Majewski, Mr. James Carey, Mr. Scott Bronner and Mr. James Matthews. The Adviser’s
57
Board of Managers is also responsible for governance and oversight of certain affiliates of the Adviser, including Eagle Point Credit Management. Mr. Majewski’s biographical information is included above under “— Portfolio Managers” and Mr. Matthews’ biographical information is included under “Management — Biographical Information about each Director” below. Biographical information regarding each other member of the Adviser’s Board of Managers is summarized below:
James D. Carey. Mr. Carey is a Senior Principal of Stone Point and a member of the investment committees of the Trident Funds. Mr. Carey is also a member of the Adviser’s Board of Managers. Mr. Carey joined Stone Point in 1997 from Merrill Lynch & Co. Prior to joining Merrill Lynch & Co., Mr. Carey was a corporate attorney with Kelley Drye & Warren LLP. Mr. Carey is a director of a number of portfolio companies of the Trident V Funds managed by Stone Point, including Alliant Insurance Services, Inc., the holding company of Amherst Pierpont Securities LLC, Enstar Group Limited, Privilege Underwriters, Inc., HireRight and Sedgwick Claims Management Services, Inc.
Mr. Carey holds a B.S. from Boston College, a J.D. from Boston College Law School and an M.B.A. from the Duke University Fuqua School of Business.
Scott Bronner. Mr. Bronner is a Managing Director at Stone Point. Mr. Bronner is also a member of the Adviser’s Board of Managers. Mr. Bronner joined Stone Point in 2009. He is a director of a number of portfolio companies of the Trident Funds managed by Stone Point. Prior to joining Stone Point, Mr. Bronner was an Analyst in the Private Equity Division at Lehman Brothers Inc.
Investment Advisory Agreement
Services. Subject to the overall supervision of our board of directors, the Adviser manages the day-to-day operations of, and provides investment advisory and management services to, us. Under the terms of our Investment Advisory Agreement, the Adviser:
•
determines the composition of our portfolio, the nature and timing of the changes to our portfolio and the manner of implementing such changes;
•
identifies, evaluates and negotiates the structure of the investments we make (including performing due diligence on our prospective investments);
•
executes, closes, services and monitors the investments we make;
•
determines the securities and other assets that we purchase, retain or sell; and
•
provides us with such other investment advisory, research and related services as we may from time to time reasonably require for the investment of our funds.
The Adviser’s services under the Investment Advisory Agreement are not exclusive, and both it and its members, officers and employees are free to furnish similar services to other persons and entities so long as its services to us are not impaired.
The Investment Advisory Agreement was most recently approved by the board of directors in May 2023. A discussion regarding the basis for the board of directors’ most recent approval of the Investment Advisory Agreement will be included in our semi-annual report for the period ending June 30, 2023.
Duration and Termination. Unless earlier terminated as described below, the Investment Advisory Agreement will remain in effect if approved annually by our board of directors or by the affirmative vote of the holders of a majority of our outstanding voting securities, including, in either case, approval by a majority of our directors who are not “interested persons” of any party to such agreement, as such term is defined in Section 2(a)(19) of the 1940 Act. The Investment Advisory Agreement will automatically terminate in the event of its assignment. The Investment Advisory Agreement may also be terminated by our board of directors or the affirmative vote of a majority of our outstanding voting securities without penalty upon not less than 60 days’ written notice to the Adviser and by the Adviser upon not less than 90 days’ written notice to us.
Indemnification. The Investment Advisory Agreement provides that, absent willful misfeasance, bad faith or gross negligence in the performance of its duties or by reason of the reckless disregard of its duties and obligations, the Adviser and its officers, managers, partners, agents, employees, controlling persons,
58
members and any other person or entity affiliated with it are entitled to indemnification from us for any damages, liabilities, costs and expenses (including reasonable attorneys’ fees and amounts reasonably paid in settlement) arising from the rendering of the Adviser’s services under the Investment Advisory Agreement or otherwise as our investment adviser.
Management Fee. We pay the Adviser a management fee for its services under the Investment Advisory Agreement. To the extent permitted by applicable law, the Adviser may elect to defer all or a portion of these management fee for a specified period of time. The management fee equals an annual rate of 1.25% of our Managed Assets and is calculated monthly based on our Managed Assets at the end of each calendar month and payable quarterly in arrears. “Managed Assets” means our total assets (including assets attributable to our use of leverage) minus the sum of our accrued liabilities (other than liabilities incurred for the purpose of creating leverage). The management fee for any partial month will be pro-rated (based on the number of days actually elapsed at the end of such partial month relative to the total number of days in such calendar month). For the fiscal year ended December 31, 2020, we incurred management fees of approximately $1.3 million payable to the Adviser. For the fiscal year ended December 31, 2021, we incurred management fees of approximately $1.7 million payable to the Adviser. For the fiscal year ended December 31, 2022, we incurred management fees of approximately $2.0 million payable to the Adviser.
Payment of Expenses. The Adviser’s investment team, when and to the extent engaged in providing investment advisory and management services, and the compensation and routine overhead expenses of such personnel allocable to such services, are provided and paid for by the Adviser. We bear all other costs and expenses of our operations and transactions, including (without limitation): (1) the cost of calculating our NAV (including the cost and expenses of any independent valuation firm or pricing service); (2) interest payable on debt, if any, incurred to finance our investments; (3) fees and expenses, including legal fees and expenses and travel expenses, incurred by the Adviser or payable to third parties relating to performing due diligence on prospective investments, monitoring our investments and, if necessary, enforcing our rights; (4) brokerage fees and commissions; (5) federal and state registration fees and exchange listing fees; (6) federal, state and local taxes; (7) costs of offerings or repurchases of our common stock and other securities; (8) the management fee; (9) distributions on our shares of our common stock and other securities; (10) administration fees payable to the Administrator under the Administration Agreement; (11) direct costs and expenses of administration and operation, including printing, mailing, long distance telephone and staff, including fees payable in connection with outsourced administrative functions; (12) transfer agent and custody fees and expenses; (13) independent director fees and expenses; (14) the costs of any reports, proxy statements or other notices to our stockholders, including printing costs; (15) costs of holding stockholder meetings; (16) litigation, indemnification and other non-recurring or extraordinary expenses; (17) fees and expenses associated with marketing and investor relations efforts; (18) dues, fees and charges of any trade association of which we are a member; (19) fees and expenses associated with independent audits and outside legal costs; (20) fidelity bond; (21) directors and officers/errors and omissions liability insurance, and any other insurance premiums; (22) costs associated with our reporting and compliance obligations under the 1940 Act and applicable U.S. federal and state securities laws; and (23) all other expenses reasonably incurred by us or the Administrator in connection with administering our business, such as the allocable portion of overhead and other expenses incurred by the Administrator in performing its obligations under the Administration Agreement, including rent, the fees and expenses associated with performing compliance functions, and our allocable portion of the costs of compensation and related expenses of our chief compliance officer, chief financial officer, chief operating officer and their respective support staff.
License Agreement
We have entered into a license agreement, or the “License Agreement,” with the Adviser pursuant to which the Adviser has granted us a non-exclusive, royalty-free license to use the “Eagle Point” name and logo. Under the License Agreement, we have a right to use the “Eagle Point” name and logo, for so long as the Adviser or one of its affiliates remains our investment adviser. The License Agreement is terminable by either party at any time in its sole discretion upon 60 days’ prior written notice and is also terminable by the Adviser in the case of certain events, including certain events of non-compliance. Other than with respect to this license, we have no legal right to the “Eagle Point” name and logo.
59
The Administrator and the Administration Agreement
We have entered into the Administration Agreement, pursuant to which the Administrator furnishes us with office facilities, equipment and clerical, bookkeeping and record-keeping services at such facilities. Under the Administration Agreement, the Administrator performs, or arranges for the performance of, our required administrative services, which include being responsible for the financial records which we are required to maintain and preparing reports to our stockholders. In addition, the Administrator provides us with accounting services; assists us in determining and publishing our NAV; oversees the preparation and filing of our tax returns; monitors our compliance with tax laws and regulations; and prepares, and assists us with any audits by an independent public accounting firm of, our financial statements. The Administrator is also responsible for the printing and dissemination of reports to our stockholders and the maintenance of our website; provides support for our investor relations; generally oversees the payment of our expenses and the performance of administrative and professional services rendered to us by others; and provides such other administrative services as we may from time to time designate. Payments under the Administration Agreement are equal to an amount based upon our allocable portion of the Administrator’s overhead in performing its obligations under the Administration Agreement, including rent, the fees and expenses associated with performing compliance functions and our allocable portion of the compensation of our chief financial officer and chief compliance officer and our allocable portion of the compensation of any administrative support staff. Our allocable portion of such total compensation is based on an allocation of the time spent on us relative to other matters. To the extent the Administrator outsources any of its functions, we pay the fees on a direct basis, without profit to the Administrator. Certain accounting and other administrative services have been delegated by the Administrator to SS&C Technologies, Inc., or “SS&C,” for which the fee is calculated based on our net assets (subject to a monthly minimum), and certain investor relations related services have been delegated to ICR, LLC, whose charges are payable monthly. The Administration Agreement may be terminated by us without penalty upon not less than 60 days’ written notice to the Administrator and by the Administrator upon not less than 90 days’ written notice to us. The Administration Agreement will remain in effect if approved by the board of directors, including by a majority of our independent directors, on an annual basis. For the fiscal year ended December 31, 2020, we incurred approximately $0.4 million in administration fees consisting of approximately $0.3 million and approximately $0.1 million relating to services provided by the Administrator and SS&C, respectively. For the fiscal year ended December 31, 2021, we incurred approximately $0.5 million in administration fees consisting of approximately $0.4 million and approximately $0.1 million relating to services provided by the Administrator and SS&C, respectively. For the fiscal year ended December 31, 2022, we incurred approximately $0.6 million in administration fees consisting of approximately $0.5 million and approximately $0.1 million relating to services provided by the Administrator and SS&C, respectively.
When considering the approval of the Administration Agreement, the board of directors considers, among other factors, (i) the reasonableness of the compensation paid by us to the Administrator and any third-party service providers in light of the services provided, the quality of such services, any cost savings to us as a result of the arrangements and any conflicts of interest, (ii) the methodology employed by the Administrator in determining how certain expenses are allocated to the Company, (iii) the breadth, depth and quality of such administrative services provided, (iv) certain comparative information on expenses borne by other companies for somewhat similar services known to be available and (v) the possibility of obtaining such services from a third party. The Administration Agreement was most recently reapproved by the board of directors in May 2023.
Limitation on Liability and Indemnification. The Administration Agreement provides that the Administrator and its officers, directors, employees agents, control persons and affiliates are not liable to us or any of our stockholders for any act or omission by it or its employees in the supervision or management of our investment activities or for any damages, liabilities, costs and expenses (including reasonable attorneys’ fees and amounts reasonably paid in settlement) or losses sustained by us or our stockholders, except that the foregoing exculpation does not extend to any act or omission constituting willful misfeasance, bad faith, gross negligence or reckless disregard of its obligations under the Administration Agreement. The Administration Agreement also provides for indemnification by us of the Administrator’s members, directors, officers, employees, agents, control persons and affiliates for liabilities incurred by them in connection with their services to us, subject to the same limitations and to certain conditions.
60
MANAGEMENT
Our board of directors is responsible for the overall management and supervision of our business and affairs, including the appointment of advisers and sub-advisers. Our directors may appoint officers who assist in managing our day-to-day affairs.
The Board of Directors
The board of directors currently consists of six members, four of whom are not “interested persons” (as defined in the 1940 Act) of us. We refer to these directors as our “independent directors.”
Under our certificate of incorporation and bylaws, our board of directors is divided into three classes with staggered three-year terms. The term of only one of the three classes expires at each annual meeting of our stockholders. The classification of our board of directors across staggered terms may prevent replacement of a majority of the directors for up to a two-year period.
Duties of Directors; Meetings and Committees
Under our certificate of incorporation, our board of directors is responsible for managing our affairs, including the appointment of advisers and sub-advisers. The board of directors appoints officers who assist in managing our day-to-day affairs.
The board of directors has appointed Mr. Majewski as Chairperson. The Chairperson presides at meetings of the board of directors and may call meetings of the board and any committee whenever he deems necessary. The Chairperson participates in the preparation of the agenda for meetings of the board of directors and the identification of information to be presented to the board of directors with respect to matters to be acted upon by the directors. The Chairperson also acts as a liaison with our management, officers and attorneys and the other directors generally between meetings. The Chairperson may perform such other functions as may be requested by the board of directors from time to time. Except for any duties specified in this prospectus or pursuant to our certificate of incorporation or bylaws, or as assigned by the board of directors, the designation of a director as Chairperson does not impose on that director any duties, obligations or liability that are greater than the duties, obligations or liability imposed on any other director, generally.
The board of directors has designated Mr. Weiss as Lead Independent Director. The Lead Independent Director generally acts as a liaison between the other independent directors and our management, officers and attorneys between meetings of the board of directors. The Lead Independent Director may perform such other functions as may be requested by the board of directors from time to time. Except for any duties specified in this prospectus or pursuant to our certificate of incorporation or bylaws, or as assigned by the board of directors, the designation of a director as Lead Independent Director does not impose on that director any duties, obligations or liability that are greater than the duties, obligations or liability imposed on any other director, generally.
The board of directors believes that this leadership structure is appropriate because it allows the board of directors to exercise informed judgment over matters under its purview, and it allocates areas of responsibility among committees or working groups of directors and the full board of directors in a manner that enhances effective oversight. The board of directors also believes that having a majority of independent directors is appropriate and in the best interest of our stockholders. Nevertheless, the board of directors also believes that having interested persons serve on the board of directors brings corporate and financial viewpoints that are, in the board of directors’ view, crucial elements in its decision-making process. In addition, the board of directors believes that Mr. Majewski, Managing Partner of the Adviser, provides the board of directors with the Adviser’s perspective in managing and sponsoring us. The leadership structure of the board of directors may be changed, at any time and in the discretion of the board of directors, including in response to changes in circumstances or our characteristics. During the fiscal year ended December 31, 2022, the board of directors held four regular meetings and one special meeting.
Committees of the Board of Directors
The board of directors has established two standing committees: the audit committee and the nominating committee. The current membership of each committee is set forth below. Interested directors are generally able to attend and participate in any committee meeting, as appropriate.
61
| |
Audit
|
| |
Nominating
|
|
| | Scott W. Appleby | | | Scott W. Appleby, Chair | |
| | Kevin F. McDonald | | | Kevin F. McDonald | |
| | Paul E. Tramontano | | | Paul E. Tramontano | |
| | Jeffrey L. Weiss, Chair | | | Jeffrey L. Weiss | |
Audit Committee
All of the members of the audit committee are independent directors, and each member is financially literate with at least one having accounting or financial management expertise. The board of directors has adopted a written charter for the audit committee. The audit committee recommends to the full board of directors the independent registered public accounting firm for us, oversees the work of the independent registered public accounting firm in connection with our audit, communicates with the independent registered public accounting firm on a regular basis and provides a forum for the independent registered public accounting firm to report and discuss any matters it deems appropriate at any time. Mr. Weiss serves as Chairperson of the audit committee. The audit committee also functions as our qualified legal compliance committee and is responsible for the confidential receipt, retention and consideration of any report of evidence of (1) a material violation of applicable federal or state securities law, (2) a material breach of fiduciary duty arising under federal or state law or (3) a similar material violation of any federal or state law by us or any of our officers, directors, employees or agents that has occurred, is ongoing or is about to occur. The audit committee met four times during the fiscal year ended December 31, 2022.
Nominating Committee
The nominating committee is comprised of all of the independent directors. The nominating committee periodically reviews the committee structure, conducts an annual self-assessment of the board of directors and makes the final selection and nomination of candidates to serve as independent directors. In addition, the nominating committee makes recommendations regarding the compensation of the Company’s independent directors for approval by the board of directors as there is no separate compensation committee of the Company. The board of directors nominates and selects our interested directors and the officers. Mr. Appleby serves as Chairperson of the nominating committee. The nominating committee met three times during the fiscal year ended December 31, 2022.
In reviewing a potential nominee and in evaluating the re-nomination of current independent directors, the nominating committee will generally apply the following criteria: (1) the nominee’s reputation for integrity, honesty and adherence to high ethical standards; (2) the nominee’s business acumen, experience and ability to exercise sound judgment; (3) a commitment to understand the Company and the responsibilities of a director of an investment company; (4) a commitment to regularly attend and participate in meetings of the board of directors and its committees; (5) the ability to understand potential conflicts of interest involving management of the Company and to act in the interests of all stockholders; and (6) the absence of a real or apparent conflict of interest that would impair the nominee’s ability to represent the interests of all the stockholders and to fulfill the responsibilities of an independent director. The nominating committee does not necessarily place the same emphasis on each criteria and each nominee may not have each of these qualities.
As long as an existing independent director continues, in the opinion of the nominating committee, to satisfy these criteria, we anticipate that the nominating committee would favor the re-nomination of an existing independent director rather than nominate a new candidate. Consequently, while the nominating committee will consider nominees recommended by stockholders to serve as independent directors, the nominating committee may only act upon such recommendations if there is a vacancy on the board of directors or a committee and it determines that the selection of a new or additional independent director is in our best interests. In the event that a vacancy arises or a change in membership is determined to be advisable, the nominating committee will, in addition to any stockholder recommendations, consider candidates identified by other means, including candidates proposed by members of the nominating committee. The nominating committee may retain a consultant to assist it in a search for a qualified candidate. The nominating committee has adopted procedures for the selection of independent directors.
62
The nominating committee has not adopted a formal policy with regard to the consideration of diversity in identifying individuals for election as independent directors, but the nominating committee will consider such factors as it may deem are in the best interests of the Company and the stockholders. Such factors may include the individual’s professional experience, education, skills and other individual qualities or attributes, including gender, race or national origin.
For any stockholder recommendation for independent director to be included in our proxy statement, it must be submitted in compliance with all of the pertinent provisions of Rule 14a-8 under the Exchange Act to be considered by the nominating committee. In evaluating a nominee recommended by a stockholder, the nominating committee, in addition to the criteria discussed above, may consider the objectives of the stockholder in submitting that nomination and whether such objectives are consistent with the interests of all stockholders. If the board of directors determines to include a stockholder’s candidate among the slate of nominees, the candidate’s name will be placed on our proxy card. If the nominating committee or the board of directors determines not to include such candidate among the board of directors’ designated nominees and the stockholder has satisfied the requirements of Rule 14a-8, the stockholder’s candidate will be treated as a nominee of the stockholder who originally nominated the candidate. In that case, the candidate will not be named on the proxy card distributed with our proxy statement.
A stockholder who is entitled to vote at the applicable annual meeting and who intends to nominate a director must comply with the advance notice procedures in our bylaws. To be timely, a stockholder’s notice must be delivered by a nationally recognized courier service or mailed by first class United States mail, postage or delivery charges prepaid, and received at our principal executive offices addressed to the attention of the Secretary not less than ninety (90) days nor more than one hundred twenty (120) days in advance of the anniversary of the date our proxy statement was released to the stockholders in connection with the previous year’s annual meeting of stockholders; provided, however, that in the event that no annual meeting was held in the previous year or the date of the annual meeting has been changed by more than thirty (30) days from the date contemplated at the time of the previous year’s proxy statement, notice by the stockholder must be received by the Secretary no later than the close of business on the later of (x) the ninetieth (90th) day prior to such annual meeting and (y) the seventh (7th) day following the day on which public announcement of the date of such meeting is first made. Such stockholder’s notice to the Secretary shall set forth (i) as to each person whom the stockholder proposes to nominate for election or reelection as a director, (a) the name, age, business address and residence address of the person, (b) the principal occupation or employment of the person, (c) the class and number of shares of our capital stock that are beneficially owned by the person and (d) any other information relating to the person that is required to be disclosed in solicitations for proxies for election of directors pursuant to the rules and regulations of the SEC under Section 14 of the Exchange Act, and (ii) as to the stockholder giving the notice (a) the name and record address of the stockholder and (b) the class and number of shares of our capital stock that are beneficially owned by the stockholder. We may require any proposed nominee to furnish such other information as may reasonably be required to determine the eligibility of such proposed nominee to serve as a director.
Stockholders may communicate with the directors as a group or individually. Any such communication should be sent to the board of directors or an individual director c/o the Secretary of the Company at the following address: 600 Steamboat Road, Suite 202, Greenwich, CT 06830. The Secretary may determine not to forward any letter to directors that does not relate to the business of the Company.
Risk Oversight
As a registered investment company, we are subject to a variety of risks, including investment risks, financial risks, compliance risks and operational risks. As part of its overall activities, the board of directors oversees the management of our risk management structure by various departments of the Adviser and the Administrator, as well as by our chief compliance officer. The responsibility to manage our risk management structure on a day-to-day basis is subsumed within the Adviser’s overall investment management responsibilities. The Adviser has its own, independent interest in risk management.
The board of directors recognizes that it is not possible to identify all of the risks that may affect us or to develop processes and controls to eliminate or mitigate their occurrence or effects. The board of directors discharges risk oversight as part of its overall activities. In addressing issues regarding our risk management between meetings, appropriate representatives of the Adviser communicate with the Chairperson of the board
63
of directors, the relevant committee chair or our chief compliance officer, who is directly accountable to the board of directors. As appropriate, the Chairperson of the board of directors and the committee chairs confer among themselves, with our chief compliance officer, the Adviser, other service providers and external fund counsel to identify and review risk management issues that may be placed on the board of director’s agenda and/or that of an appropriate committee for review and discussion with management.
Compliance Policies and Procedures
We have adopted and implemented written policies and procedures reasonably designed to detect and prevent violation of the federal securities laws and are required to review these compliance policies and procedures annually for their adequacy and the effectiveness of their implementation. The chief compliance officer is responsible for administering the policies and procedures.
Biographical Information about each Director
Please refer to the section of the Company’s April 12, 2023 definitive proxy statement on Schedule 14A for the annual meeting of the Company’s stockholders entitled “Information about the Directors and Nominees,” which is incorporated by reference herein, for a discussion of the Company’s Directors, their principal occupations during the past five years and other information about them. Effective April 2023, the current principal occupation of Paul E. Tramontano (Independent Director) is Executive Managing Director at Cresset Asset Management, LLC.
Executive Officers
Please refer to the section of the Company’s April 12, 2023 definitive proxy statement on Schedule 14A for the annual meeting of the Company’s stockholders entitled “Information about the Officers who are Not Directors,” which is incorporated by reference herein, for certain biographical and other information relating to the officers of the Company who are not Directors.
Director Compensation
Please refer to the section of the Company’s April 12, 2023 definitive proxy statement on Schedule 14A for the annual meeting of the Company’s stockholders entitled “Information about the Directors and Nominees — Compensation,” which is incorporated by reference herein, for certain information relating to the compensation paid to our independent directors.
Director Ownership of Company Shares
The table below sets forth the dollar range of the value of our common stock and the Preferred Stock that is owned beneficially by each director as of December 31, 2022. For purposes of this table, beneficial ownership is defined to mean a direct or indirect pecuniary interest.
|
Name of Director
|
| |
Dollar Range of Equity
Securities in the Company(1) |
| |
Aggregate Dollar
Range of Equity Securities in the Fund Complex(1) |
|
| Interested Directors | | | | | | | |
|
Thomas P. Majewski
|
| |
Over $100,000
|
| |
Over $100,000
|
|
|
James R. Matthews
|
| |
None
|
| |
None
|
|
| Independent Directors | | | | | | | |
|
Scott W. Appleby
|
| |
$50,001 – $100,000
|
| |
Over $100,000
|
|
|
Kevin F. McDonald
|
| |
$10,001 – $50,000
|
| |
Over $100,000
|
|
|
Paul E. Tramontano
|
| |
$50,001 – $100,000
|
| |
Over $100,000
|
|
|
Jeffrey L. Weiss
|
| |
$10,001 – $50,000
|
| |
Over $100,000
|
|
(1)
Dollar ranges are as follows: None, $1 – $10,000, $10,001 – $50,000, $50,001 – $100,000 and over $100,000.
64
DETERMINATION OF NET ASSET VALUE
We determine the NAV per share of our common stock by dividing the value of our portfolio investments, cash and other assets (including interest accrued but not collected) less all of our liabilities (including accrued expenses, the aggregate liquidation preference of our preferred stock, borrowings, including the BNP Credit Facility, and interest payables) by the total number of outstanding shares of our common stock on a quarterly basis (or more frequently, as appropriate). The most significant estimate inherent in the preparation of our financial statements is the valuation of investments and the related amounts of unrealized appreciation and depreciation of investments recorded. There is no single method for determining fair value in good faith. As a result, determining fair value requires that judgment be applied to the specific facts and circumstances of each portfolio investment while employing a consistently applied valuation process for the types of investments we make. Rule 2a-5 under the 1940 Act establishes requirements for determining fair value in good faith for purposes of the 1940 Act. Pursuant to Rule 2a-5, our board has elected to designate the Adviser as “valuation designee” to perform fair value determinations in respect of our portfolio investments that do not have readily available market quotations.
We account for our investments in accordance with GAAP, and fair value our investment portfolio in accordance with the provisions of the FASB ASC Topic 820 Fair Value Measurements and Disclosures of the Financial Accounting Standards Board’s Accounting Standards Codification, as amended, which defines fair value, establishes a framework for measuring fair value and requires enhanced disclosures about fair value measurements. Fair value is the estimated amount that would be received to sell an asset, or paid to transfer a liability, in an orderly transaction between market participants at the measurement date (i.e., the exit price).
In valuing our investments in CLO debt, CLO equity and LAFs, the Adviser considers a variety of relevant factors, including price indications from a third-party pricing service, recent trading prices for specific investments, recent purchases and sales known to the Adviser in similar securities and output from a third-party financial model. The third-party financial model contains detailed information on the characteristics of CLOs, including recent information about assets and liabilities, and is used to project future cash flows. Key inputs to the model, including assumptions for future loan default rates, recovery rates, prepayment rates, reinvestment rates and discount rates are determined by considering both observable and third-party market data and prevailing general market assumptions and conventions as well as those of the Adviser.
Specifically, the Adviser utilizes a third-party pricing service in connection with the valuation of our investments in CLO debt. However, if pricing from such third-party pricing service is determined to be stale or otherwise not reflective of current market conditions, the Adviser may use an average of independent broker quotes to determine fair value. The Adviser engages a third-party independent valuation firm as an input to the valuation of the fair value of the Company’s investments in CLO equity. The valuation firm’s advice is only one factor considered in the valuation of such investments, and the Adviser does not rely on such advice in determining the fair value of our investments in accordance with the 1940 Act.
Our investment portfolio is valued at least each quarter in accordance with the Adviser’s valuation policies and procedures. Fair valuations are ultimately determined by the Adviser’s valuation committee, which is comprised of a majority of non-investment personnel. Our board of directors oversees the valuation designee and the process that it uses to determine the fair value of our assets. In this regard, the board receives periodic and, as applicable, prompt reporting regarding certain material valuation matters, as required by Rule 2a-5 under the 1940 Act.
DIVIDEND REINVESTMENT PLAN
Information about the Company’s dividend reinvestment plan may be found in the “Supplemental Information — Dividend Reinvestment Plan” section of the Company’s most recent Annual Report on Form N-CSR, as amended, for the fiscal year ended December 31, 2022, filed with the SEC on February 24, 2023, which is incorporated by reference herein.
CONFLICTS OF INTEREST
Affiliations of the Adviser and the Administrator
Our executive officers and directors, and the Adviser and certain of its affiliates and their officers and employees, including the Senior Investment Team, have several conflicts of interest as a result of the other
65
activities in which they engage. The Adviser and the Administrator are affiliated with other entities engaged in the financial services business. In particular, the Adviser and the Administrator are affiliated with Eagle Point Credit Management and Stone Point, and certain members of the Adviser’s Board of Managers are principals of Stone Point. Pursuant to certain management agreements, Stone Point has received delegated authority to act as the investment manager of the Trident V Funds. The Adviser and the Administrator are primarily owned by certain of the Trident Funds through intermediary holding companies. The Trident Funds and other private equity funds managed by Stone Point invest in financial services companies. Further, the Adviser and its affiliates engage and may in the future engage in a variety of business activities, including investment management, financing, and software analytics. As such, the Adviser and its affiliates may have multiple business relationships with CLO collateral managers that encompass a range of activities, such as investing in CLOs managed by a CLO collateral manager on behalf of the Company, financing, or investing in other securities issued by, other vehicles managed by such CLO collateral manager or an affiliate thereof, or otherwise providing advisory, research or data services to such CLO collateral manager for compensation. Additionally, an affiliate of Enstar indirectly owns a portion of the limited liability interests in the Adviser. Also, under the Personnel and Resources Agreement, Eagle Point Credit Management makes available the personnel and resources, including portfolio managers and investment personnel, to the Adviser as the Adviser may determine to be reasonably necessary to the conduct of its operations. These relationships may cause the Adviser’s, the Administrator’s and certain of their affiliates’ interests, and the interests of their officers and employees, including the Senior Investment Team, to diverge from our interests and may result in conflicts of interest that may not be foreseen, which conflicts may not be resolved in a manner that is always or exclusively in our best interest. The Adviser has entered into, and may in the future enter into additional, business arrangements with certain of our stockholders, including granting indirect ownership in limited liability company interests in the Adviser. In such cases, such stockholders may have an incentive to vote shares held by them in a manner that takes such arrangements into account.
Other Accounts
The Adviser is responsible for the investment decisions made on our behalf. There are no restrictions on the ability of the Adviser and certain of its affiliates (including Eagle Point Credit Management and Stone Point) to manage accounts for multiple clients, including accounts for affiliates of the Adviser or their directors, officers or employees, following the same, similar or different investment objectives, philosophies and strategies as those used by the Adviser for our account. In those situations, the Adviser and its affiliates may have conflicts of interest in allocating investment opportunities between us and any other account managed by such person. See “— Allocation of Opportunities” below. Such conflicts of interest would be expected to be heightened where the Adviser manages an account for an affiliate or its directors, officers or employees. In addition, certain of these accounts may provide for higher management fees or have incentive fees or may allow for higher expense reimbursements, all of which may contribute to a conflict of interest and create an incentive for the Adviser to favor such other accounts. Further, accounts managed by the Adviser or certain of its affiliates hold, and may in the future be allocated, certain investments in CLOs, such as equity tranches, which conflict with the positions held by other accounts in such CLOs, such as us. In these cases, when exercising the rights of each account with respect to such investments, the Adviser and/or its affiliates will have a conflict of interest as actions on behalf of one account may have an adverse effect on another account managed by the Adviser or such affiliate, including us. In such cases, such conflicts may not be resolved in a manner that is always or exclusively in our best interests.
In addition, Eagle Point Credit Management, Stone Point and their affiliates, and the investment funds managed by Eagle Point Credit Management, Stone Point and such affiliates, may also invest in companies that compete with the Adviser and that therefore manage other accounts and funds that compete for investment opportunities with us.
Our executive officers and directors, as well as other current and potential future affiliated persons, officers and employees of the Adviser and certain of its affiliates, may serve as officers, directors or principals of, or manage the accounts for, other entities, including ECC and EPIIF, with investment strategies that substantially or partially overlap with the strategy that we pursue. Accordingly, they may have obligations to investors in those entities, the fulfillment of which obligations may not be in the best interests of us or our stockholders.
66
Further, the professional staff of the Adviser and Administrator will devote as much time to us as such professionals deem appropriate to perform their duties in accordance with the Investment Advisory Agreement and Administration Agreement, respectively. However, such persons are also committed to providing investment advisory and other services for other clients, including Eagle Point Income Company, unregistered pooled investment vehicles, and separately managed accounts, and engage in other business ventures in which we have no interest.
Certain of the Adviser’s, the Administrator’s and their affiliates’ senior personnel and ultimate managers serve and may serve as officers, directors, managers or principals of other entities that operate in the same or a related line of business as the Adviser, the Administrator, and their affiliates, or that are service providers to firms or entities such as the Adviser, the Administrator, the Company, CLOs or other similar entities. Accordingly, such persons may have obligations to investors in those entities the fulfillment of which may not be in our best interest. In addition, certain of such persons hold direct and indirect personal investments in various companies, including certain investment advisers and other operating companies, some of which do or may provide services to the Adviser, the Administrator, us, or other accounts serviced by the Adviser, the Administrator, or their affiliates, or to any issuer in which the Company may invest. The Company may pay fees or other compensation to any such operating company or financial institution for services received. Further, these relationships may result in conflicts of interest that may not be foreseen or may not be resolved in a manner that is always or exclusively in our best interest.
In addition, payments under the Administration Agreement are equal to an amount based upon our allocable portion of the Administrator’s overhead. See “The Adviser and the Administrator — The Administrator and the Administration Agreement” above.
As a result of these separate business activities and payment structure, the Adviser and Administrator have conflicts of interest in allocating management and administrative time, services and functions among the Company, other accounts that they provide services to, their affiliates and other business ventures or clients.
Allocation of Opportunities
As a fiduciary, the Adviser owes a duty of loyalty to its clients and must treat each client fairly. When the Adviser purchases or sells securities for more than one account, the trades must be allocated in a manner consistent with its fiduciary duties. To this end, the Adviser and Eagle Point Credit Management have adopted and reviewed policies and procedures pursuant to which they allocate investment opportunities appropriate for more than one client account in a manner deemed appropriate in their sole discretion to achieve a fair and equitable result over time. Pursuant to these policies and procedures, when allocating investment opportunities, the Adviser and Eagle Point Credit Management may take into account regulatory, tax or legal requirements applicable to an account. In allocating investment opportunities, the Adviser and Eagle Point Credit Management may use rotational, percentage or other allocation methods provided that doing so is consistent with the Adviser’s and Eagle Point Credit Management’s internal conflict of interest and allocation policies and the requirements of the Investment Advisers Act of 1940, or the “Advisers Act,” the 1940 Act and other applicable laws. In addition, an account managed by the Adviser, such as us, is expected to be considered for the allocation of investment opportunities together with other accounts managed by affiliates of the Adviser, including Eagle Point Credit Management. There is no assurance that such opportunities will be allocated to any particular account equitably in the short-term or that any such account, including us, will be able to participate in all investment opportunities that are suitable for it.
Leverage
We have incurred leverage through the issuance of the Series A Term Preferred stock and indebtedness for borrowed money. We may incur additional leverage, directly or indirectly, through one or more special purpose vehicles, indebtedness for borrowed money, as well as leverage in the form of Derivative Transactions, additional shares of preferred stock, debt securities and other structures and instruments, in significant amounts and on terms that the Adviser and our board of directors deem appropriate, subject to applicable limitations under the 1940 Act. Such leverage may be used for the acquisition and financing of our investments, to pay fees and expenses and for other purposes. Such leverage may be secured and/or unsecured. Any such leverage does not include leverage embedded or inherent in the CLO structures in which we invest or in derivative instruments in which we may invest. The more leverage we employ, the more likely a substantial
67
change will occur in our NAV. Accordingly, any event that adversely affects the value of an investment would be magnified to the extent leverage is utilized. In addition, our BNP Credit Facility imposes (and any other debt facility into which we may enter in the future would likely impose) financial and operating covenants that restrict our business activities, including limitations that could hinder our ability to finance additional loans and investments or to make the distributions required to maintain our ability to be subject to tax as a RIC under Subchapter M of the Code. In addition, because our management fee is based on total assets, we may have an incentive to incur leverage when it is not appropriate to do so. Under certain circumstances, the use of leverage may increase the likelihood of default, which would impair the value of our securities.
Allocation of Expenses and Selection of Service Providers
From time to time, the Adviser and the Administrator will be required to determine how certain costs and expenses are to be allocated among the Company and certain other accounts. Often, an expense is relevant only to the Company and would be borne only by us. However, it is sometimes the case that costs and expenses are relevant to more than one account. To the extent the Company, on the one hand, and Adviser, Administrator and/or one or more accounts, on the other hand, incur costs or expenses that are applicable to more than one of them, the Adviser and the Administrator will allocate such costs and expenses in a manner that they determine to be fair and reasonable, notwithstanding their potential interest in the outcome, and may make corrective allocations should they determine that such corrections are necessary or advisable. Further, the Adviser and the Administrator and their affiliates, and their respective personnel and the investment funds serviced by such persons, have interests in companies that provide services to asset management firms such as the Adviser, and to other businesses. Because of these relationships, such persons have a conflict of interest when considering service providers with respect to the Company and have an incentive to select those service providers in which such persons have an interest. The selection of such a service provider may result in the Company bearing fees and expenses paid to a service provider that is affiliated with, or otherwise has a relationship with, the Adviser, the Administrator or their affiliates.
In addition, the Adviser and the Administrator have a conflict of interest where a service provider provides services directly to the Adviser and/or the Administrator or an affiliate thereof, and separately provides services to the Company, in that the Adviser, the Administrator and/or an affiliate thereof may potentially obtain services at a lower cost than it otherwise could have as a result of the service provider’s work performed on behalf of, and the compensation paid to the service provider by, the Company. In addition, the Adviser and the Administrator and their affiliates may use some of the same service providers as are retained on behalf of the Company and, in some cases, fee rates, amounts or discounts may be offered to the Adviser, the Administrator and/or their affiliates by a third party service provider which differ from those offered to the Company as a result of scheduled or ad hoc rate changes, differences in the scope, type or nature of the service or transaction, alternative fee arrangements and negotiation.
Valuation
Generally, there is not a public market for the CLO investments we target. As a result, the Adviser reviews and determines, in good faith, in accordance with the 1940 Act, the value of, these securities based on relevant information compiled by itself and third-party pricing services (when available) as described under “Determination of Net Asset Value.” Our interested directors are associated with the Adviser and have an interest in the Adviser’s economic success. The participation of the Adviser’s investment professionals in our valuation process, and the interest of our interested directors in the Adviser, could result in a conflict of interest as the management fee paid to the Adviser is based, in part, on the value of our assets.
Co-Investments and Related Party Transactions
In the ordinary course of business, we may enter into transactions with persons who are affiliated with us by reason of being under common control of the Adviser or its affiliates, including Eagle Point Credit Management and Stone Point. In order to ensure that we do not engage in any prohibited transactions with any persons affiliated with us, we have implemented certain policies and procedures whereby our executive officers screen each of our transactions for any possible affiliations between us, the Adviser and its affiliates and our employees, officers and directors. We will not enter into any such transactions unless and until we are satisfied that doing so is consistent with the 1940 Act, applicable SEC exemptive rules, interpretations or
68
guidance, or the terms of our exemptive order (as discussed below), as applicable. Our affiliations may require us to forgo attractive investment opportunities. For example, we may be limited in our ability to invest in CLOs managed by certain affiliates of the Adviser.
In certain instances, we co-invest on a concurrent basis with other accounts managed by the Adviser and may do so with other accounts managed by certain of the Adviser’s affiliates, subject to compliance with applicable regulations and regulatory guidance and the Adviser’s written allocation procedures. We are able to rely on the exemptive relief granted by the SEC to Eagle Point Credit Management and certain of its affiliates to participate in certain negotiated co-investments alongside other accounts, including ECC and EPIIF, managed by Eagle Point Credit Management, or certain of its affiliates, subject to certain conditions, including that (i) a majority of our directors who have no financial interest in the transaction and a majority of our directors who are not interested persons, as defined in the 1940 Act, of ours approve the co-investment and (ii) the price, terms and conditions of the co-investment are the same for each participant. The Adviser may determine not to allocate certain potential co-investment opportunities to the Company after taking into account regulatory requirements or other considerations. See “— Allocation of Opportunities” above. A copy of our application for exemptive relief, including all of the conditions, and the related order are available on the SEC’s website at www.sec.gov.
Stone Point-Related Investments
Portfolio companies of investment funds managed by Stone Point and other affiliates of Stone Point may engage in lending activities, which could result in us investing in CLOs that include loans underwritten by such a portfolio company or affiliate. In addition, the CLOs in which we expect to invest consist principally of senior secured loans, which in many cases may be issued to operating companies that are primarily owned by private equity funds, including funds that may be managed by Stone Point or its affiliates. In addition to the above, because portfolio companies of such investment funds engage in a wide range of businesses, such entities may engage in other activities now or in the future that create a conflict of interest for the Adviser with respect to its management of us. Any of these potential transactions and activities may result in the Adviser having a conflict of interest that may not be resolved in a manner that is always or exclusively in our best interest or in the best interest of our stockholders.
Material Non-Public Information
By reason of the advisory and/or other activities of the Adviser and its affiliates, the Adviser and its affiliates may acquire confidential or material non-public information or be restricted from initiating transactions in certain securities. The Adviser will not be free to divulge, or to act upon, any such confidential or material non-public information and, due to these restrictions, it may not be able to initiate a transaction for our account that it otherwise might have initiated. As a result, we may be frozen in an investment position that we otherwise might have liquidated or closed out or may not be able to acquire a position that we might otherwise have acquired.
Enstar’s Indirect Ownership Interest in the Adviser
The Adviser has entered into an arrangement with Enstar in connection with Cavello Bay’s, an affiliate of Enstar’s, contribution of BB-Rated CLO Debt securities to us. See “Business — Our Structure and Formation Transactions.” This arrangement provides that the Enstar affiliate will indirectly hold a portion of the limited liability company interests in the Adviser until such time as either (i) the Enstar affiliate exercises a put right to sell its interest under the agreement to the Adviser or (ii) the Adviser exercises a call right to buy the interest of the Enstar affiliate under the agreement (which call right is subject to certain conditions). This arrangement may cause Enstar or its affiliates to have interests that diverge from the interests of other stockholders on certain matters (e.g., on material amendments to the Investment Advisory Agreement).
Code of Ethics and Compliance Procedures
In order to address the conflicts of interest described above, we have adopted a code of ethics under Rule 17j-l of the 1940 Act. Similarly, the Adviser has separately adopted the “Adviser Code of Ethics.” The Adviser Code of Ethics requires the officers and employees of the Adviser to act in the best interests of the Adviser and its client accounts (including us), act in good faith and in an ethical manner, avoid conflicts of
69
interests with the client accounts to the extent reasonably possible and identify and manage conflicts of interest to the extent that they arise. Personnel subject to each code of ethics may invest in securities for their personal investment accounts, including securities that may be purchased or held by us, so long as such investments are made in accordance with the code’s requirements. In addition, our code of ethics and the Adviser’s Code of Ethics are incorporated by reference as exhibits to the registration statement of which this prospectus is a part, and are available on the EDGAR Database on the SEC’s website at www.sec.gov.
Our directors and officers, and the officers and employees of the Adviser, are also required to comply with applicable provisions of the U.S. federal securities laws and make prompt reports to supervisory personnel of any actual or suspected violations of law.
In addition, the Adviser has built a professional working environment, firm-wide compliance culture and compliance procedures and systems designed to protect against potential incentives that may favor one account over another. The Adviser has adopted policies and procedures that address the allocation of investment opportunities, execution of portfolio transactions, personal trading by employees and other potential conflicts of interest that are designed to ensure that all client accounts are treated equitably over time.
70
U.S. FEDERAL INCOME TAX MATTERS
The following is a summary of certain U.S. federal income tax consequences generally applicable to the purchase, ownership and disposition of our securities, including our common stock and preferred stock (including Series A Term Preferred Stock), which collectively will be referred to as “stock,” issued as of the date of this prospectus. Unless otherwise stated, this summary deals only with our securities held as capital assets for U.S. federal tax purposes (generally, property held for investment).
As used herein, a “U.S. holder” means a beneficial owner of the securities that is for U.S. federal income tax purposes any of the following:
•
an individual citizen or resident of the United States;
•
a corporation (or any other entity treated as a corporation for U.S. federal income tax purposes) created or organized in or under the laws of the United States, any state or other political subdivision thereof (including the District of Columbia);
•
a trust if it (a) is subject to the primary supervision of a court within the United States and one or more United States persons have the authority to control all substantial decisions of the trust or (b) has a valid election in effect under applicable United States Treasury regulations, or “Treasury Regulations,” to be treated as a United States person; or
•
an estate, the income of which is subject to U.S. federal income taxation regardless of its source.
The term “non-U.S. holder” means a beneficial owner of the securities (other than a partnership or any other entity or other arrangement treated as a partnership for U.S. federal income tax purposes) that is not a U.S. holder.
An individual may, subject to exceptions, be deemed to be a resident of the United States for U.S. federal income tax purposes, as opposed to a non-resident alien, by, among other ways, being present in the United States (i) on at least 31 days in the calendar year, and (ii) for an aggregate of at least 183 days during a three-year period ending in the current calendar year, counting for such purposes all of the days present in the current year, one-third of the days present in the immediately preceding calendar year, and one-sixth of the days present in the second preceding calendar year. Individuals who are residents for such purposes are subject to U.S. federal income tax as if they were United States citizens.
This summary does not represent a detailed description of the U.S. federal income tax consequences applicable to you, as a holder of our securities, if you are a person subject to special tax treatment under the U.S. federal income tax laws, including, without limitation:
•
a dealer in securities or currencies;
•
a financial institution;
•
a RIC;
•
a real estate investment trust;
•
a tax-exempt organization;
•
an insurance company;
•
a person holding the securities as part of a hedging, integrated, conversion or constructive sale transaction or a straddle;
•
a trader in securities that has elected the mark-to-market method of accounting for their securities;
•
a person subject to alternative minimum tax;
•
a partnership or other pass-through entity for U.S. federal income tax purposes;
•
a U.S. holder whose “functional currency” (as defined in Section 985 of the Code) is not the U.S. dollar;
•
a CFC;
71
•
a PFIC;
•
A United States expatriate or foreign persons or entities (except to the extent set forth below); or
•
A holder that is subject to special tax accounting rules under Section 451(b) of the Code.
If a partnership (including any entity classified or arrangement treated as a partnership for U.S. federal income tax purposes) holds the securities, the tax treatment of a partner will generally depend upon the status of the partner and the activities of the partnership. If you are a partnership or a partner in a partnership holding our securities, you should consult your own tax advisors regarding the tax consequences of an investment in our securities.
This summary is based on the Code, Treasury Regulations, rulings and judicial decisions as of the date hereof. Those authorities may be changed, possibly on a retroactive basis, so as to result in U.S. federal income tax consequences different from those summarized below. This summary does not represent a detailed description of the U.S. federal income tax consequences that may be applicable to you in light of your particular circumstances and does not address the effects of any aspects of U.S. estate or gift, or state, local or non-U.S. income, estate, or gift tax laws. It is not intended to be, and should not be construed to be, legal or tax advice to any particular purchaser of our securities. We have not sought and will not seek any ruling from the Internal Revenue Service, or the “IRS.” No assurance can be given that the IRS would not assert, or that a court would not sustain, a position contrary to any of the tax aspects set forth below. You should consult your own tax advisors concerning the particular U.S. federal income tax consequences to you of the ownership of our securities, as well as the consequences to you arising under the laws or other guidance of any other taxing jurisdiction.
Important U.S. Federal Income Tax Considerations Affecting Us
We have elected to be treated, and intend to qualify each tax year thereafter, as a RIC under the Code. Accordingly, we must satisfy certain requirements relating to sources of our income and diversification of our total assets and certain distribution requirements to maintain our RIC status and to avoid being subject to U.S. federal income or excise tax on any undistributed taxable income. To the extent we qualify for treatment as a RIC and satisfy the applicable distribution requirements, we will not be subject to U.S. federal income tax on income paid to our stockholders in the form of dividends or capital gain dividends.
To qualify as a RIC for U.S. federal income tax purposes, we must derive at least 90% of our gross income each tax year from dividends, interest, payments with respect to securities loans, gains from the sale or other disposition of stock, securities or foreign currencies, net income derived from an interest in a qualified publicly traded partnership, or other income (including, but not limited to, gains from options, futures or forward contracts) derived with respect to our business of investing in stock, securities and currencies, or the “90% Gross Income Test.” A “qualified publicly traded partnership” is a publicly traded partnership that meets certain requirements with respect to the nature of its income. To qualify as a RIC, we must also satisfy certain requirements with respect to the diversification of our assets. We must have, at the close of each quarter of the tax year, at least 50% of the value of our total assets represented by cash, cash items, U.S. government securities, securities of other RICs and other securities that, in respect of any one issuer, do not represent more than 5% of the value of our assets nor more than 10% of the voting securities of that issuer. In addition, at those times, not more than 25% of the value of our assets may be invested in securities (other than U.S. government securities or the securities of other RICs) of any one issuer, or of two or more issuers, which we control and which are engaged in the same or similar trades or businesses or related trades or businesses, or of one or more qualified publicly traded partnerships, or the “Asset Diversification Tests.” If we fail to satisfy the 90% Gross Income Test, we will nevertheless be considered to have satisfied the test if (i) (a) such failure is due to reasonable cause and not due to willful neglect and (b) we report the failure pursuant to Treasury Regulations to be adopted, and (ii) we pay a tax equal to the excess non-qualifying income. If we fail to meet any of the Asset Diversification Tests with respect to any quarter of any tax year, we will nevertheless be considered to have satisfied the requirements for such quarter if we cure such failure within six months and either (i) such failure is de minimis or (ii) (a) such failure is due to reasonable cause and not due to willful neglect and (b) we report the failure under Treasury Regulations to be adopted and pay an excise tax. If we fail to qualify as a RIC for more than two consecutive taxable years and then seek to re-qualify as a RIC, we
72
generally would be required to recognize gain to the extent of any unrealized appreciation in our assets unless we elect to pay U.S. corporate income tax on any such unrealized appreciation during the succeeding 5-year period.
As a RIC, we generally will not be subject to federal income tax on our investment company taxable income (as that term is defined in the Code) and net capital gains (the excess of net long-term capital gains over net short-term capital loss), if any, that we distribute in each tax year as dividends to stockholders, provided that we distribute dividends of an amount at least equal to the sum of 90% of our investment company taxable income, determined without regard to any deduction for dividends paid, plus 90% of our net tax-exempt interest income for such tax year, or the “90% Distribution Requirement.” We intend to distribute to our stockholders, at least annually, substantially all of our investment company taxable income, net tax-exempt income and net capital gains. In order to avoid incurring a nondeductible 4% federal excise tax obligation, the Code requires that we distribute (or be deemed to have distributed) by December 31 of each calendar year dividends of an amount generally at least equal to the sum of (i) 98% of our ordinary income (taking into account certain deferrals and elections) for such calendar year, (ii) 98.2% of our capital gain net income, adjusted for certain ordinary losses and generally computed on the basis of the one-year period ending on October 31 of such calendar year (unless we have made an election under Section 4982(e)(4) of the Code to have our required distribution from net income measured using the one-year period ending on November 30 of such calendar year) and (iii) 100% of any ordinary income and capital gain net income from prior calendar years (as previously computed) that were not paid out during such calendar years and on which we incurred no U.S. federal income tax, or the “Excise Tax Distribution Requirement.”
Any dividends declared by us during October, November or December of any calendar year, payable to stockholders of record on a specified date in such a month and actually paid during January of the following calendar year, will be treated for federal income tax purposes as if it had been paid by us, as well as received by our stockholders, on December 31 of the calendar year in which the distribution was declared.
We may incur in the future the 4% federal excise tax on a portion of our income and capital gains. While we intend to distribute income and capital gains to minimize our exposure to the 4% federal excise tax, we may not be able to, or may choose not to, distribute amounts sufficient to avoid the imposition of the tax entirely. In that event, we generally will be liable for the 4% federal excise tax only on the amount by which we do not meet the excise tax avoidance requirement. If we do not qualify as a RIC or fail to satisfy the 90% Distribution Requirement for any tax year, we would be subject to corporate income tax on our taxable income, and all distributions from earnings and profits, including distributions of net capital gains (if any), will be taxable to the stockholder as ordinary income. Such distributions generally would be eligible (i) to be treated as qualified dividend income in the case of individual and other non-corporate stockholders and (ii) for the dividends received deduction, or the “DRD,” in the case of certain corporate stockholders. In addition, in order to requalify for taxation as a RIC, we may be required to recognize unrealized gains, pay substantial taxes and interest, and make certain distributions.
For purposes of the 90% Gross Income Test, income that we earn from equity interests in certain entities that are not treated as corporations or as qualified publicly traded partnerships for U.S. federal income tax purposes (e.g., certain CLOs that are treated as partnerships) will generally have the same character for us as in the hands of such an entity; consequently, we may be required to limit our equity investments in any such entities that earn fee income, rental income, or other nonqualifying income.
Because we expect to use debt financing, we may be prevented by covenants contained in our debt financing agreements from making distributions to our stockholders in certain circumstances. In addition, under the 1940 Act, we are generally not permitted to make distributions to our stockholders while our debt obligations and other senior securities are outstanding unless certain “asset coverage” tests are met. Restrictions on our ability to make distributions to our stockholders may prevent us from satisfying the 90% Distribution Requirement or the Excise Tax Distribution Requirement and, therefore, may jeopardize our qualification for taxation as a RIC, or subject us to the 4% U.S. federal excise tax.
Some of the income and fees that we may recognize will not satisfy the 90% Gross Income Test. In order to ensure that such income and fees do not disqualify us as a RIC for a failure to satisfy such test, we may be required to recognize such income and fees indirectly through one or more entities treated as corporations for
73
U.S. federal income tax purposes. Such corporations will be subject to U.S. corporate income tax on their earnings, which ultimately will reduce our return on such income and fees.
We may be required to recognize taxable income in circumstances in which we do not receive cash. For example, if we hold debt instruments that are treated under applicable tax rules as having original issue discount (which may arise if we receive warrants in connection with the origination of a loan or possibly in other circumstances), we must include in income each tax year a portion of the original issue discount that accrues over the life of the obligation, regardless of whether cash representing such income is received by us in the same tax year. We may also have to include in income other amounts that we have not yet received in cash, such as contractual payment-in-kind interest (which represents contractual interest added to the loan balance and due at the end of the loan term) and deferred loan origination fees that are paid after origination of the loan or are paid in non-cash compensation such as warrants or stock. Because any original issue discount or other amounts accrued will be included in our investment company taxable income for the tax year of accrual, we may be required to make a distribution to our stockholders in order to satisfy the 90% Distribution Requirement or the Excise Tax Distribution Requirement, even though we will not have received any corresponding cash amount.
We may invest (directly or indirectly through an investment in an equity interest in a CLO treated as a partnership for U.S. federal income tax purposes) a portion of our net assets in below investment grade instruments. Investments in these types of instruments may present special tax issues for us. U.S. federal income tax rules are not entirely clear about issues such as when we may cease to accrue interest, original issue discount or market discount, when and to what extent deductions may be taken for bad debts or worthless instruments, how payments received on obligations in default should be allocated between principal and income and whether exchanges of debt obligations in a bankruptcy or workout context are taxable. These and other issues will be addressed by us to the extent necessary in order to seek to ensure that we distribute sufficient income that we do not become subject to U.S. federal income or excise tax.
Some of the CLOs in which we invest may constitute PFICs for U.S. federal income tax purposes. Because we acquire interests treated as equity for U.S. federal income tax purposes in PFICs (including equity tranche investments and certain debt tranche investments in CLOs that are PFICs), we may be subject to federal income tax on a portion of any “excess distribution” or gain from the disposition of such shares even if such income is distributed as a taxable dividend by us to our stockholders. Additional charges in the nature of interest may be imposed on us in respect of deferred taxes arising from any such excess distributions or gains. If we invest in a PFIC and elect to treat the PFIC as a QEF in lieu of the foregoing requirements, we will be required to include in income each tax year our proportionate share of the ordinary earnings and net capital gain of the QEF, even if such income is not distributed to us. Alternatively, we can elect to mark-to-market at the end of each tax year (as well as on certain other dates described in the Code) our shares in a PFIC; in this case, we will recognize as ordinary income any increase in the value of such shares, and as an ordinary loss any decrease in such value to the extent it does not exceed prior increases included in our ordinary income. Under either election, we may be required to recognize in a tax year taxable income in excess of our distributions from PFICs and our proceeds from dispositions of PFIC stock during that tax year, and we may be required to distribute such taxable income in order to satisfy the 90% Gross Income Test, the Excise Tax Distribution Requirement or the 90% Distribution Requirement. Our ability to make either election will depend on factors beyond our control, and is subject to restrictions which may limit the availability of the benefit of these elections. Treasury Regulations generally treat our income inclusion with respect to a PFIC with respect to which we have made a QEF election, as qualifying income for purposes of determining our ability to be subject to tax as a RIC if (i) there is a current distribution out of the earnings and profits of the PFIC that are attributable to such income inclusion or (ii) such inclusion is derived with respect to our business of investing in stock, securities, or currencies. As such, we may be restricted in our ability to make QEF elections with respect to our holdings in issuers that could be treated as PFICs in order to limit our tax liability or maximize our after-tax return from these investments.
If we hold 10% or more of the interests treated as equity (by vote or value) for U.S. federal income tax purposes in a foreign corporation that is treated as a CFC (including equity tranche investments and certain debt tranche investments in a CLO treated as CFC), we may be treated as receiving a deemed distribution (taxable as ordinary income) each tax year from such foreign corporation in an amount equal to our pro rata share of the corporation’s income for the tax year (including both ordinary earnings and capital gains), whether
74
or not the corporation makes an actual distribution during such tax year. In general, a foreign corporation will be classified as a CFC if more than 50% of the shares of the corporation, measured by reference to combined voting power or value, is owned (directly, indirectly or by attribution) by U.S. Shareholders. A “U.S. Shareholder,” for this purpose, is any U.S. person that possesses (actually or constructively) (a) 10% or more of the combined voting power of all classes of shares of a foreign corporation entitled to vote, or (b) 10% or more of the total value of all classes of stock of a foreign corporation. If we are treated as receiving a deemed distribution from a CFC, we will be required to include such deemed distribution in our investment company taxable income regardless of whether we receive any actual distributions from such CFC, and we must distribute such income in order to satisfy the Excise Tax Distribution Requirement or the 90% Distribution Requirement. Treasury Regulations generally treat our income inclusion with respect to a CFC as qualifying income for purposes of determining our ability to be subject to tax as a RIC either if (i) there is a current distribution out of the earnings and profits of the CFC that are attributable to such income inclusion or (ii) such inclusion is derived with respect to our business of investing in stock, securities, or currencies. As such, we may limit and/or manage our holdings in issuers that could be treated as CFCs in order to limit our tax liability or maximize our after-tax return from these investments.
FATCA generally imposes a U.S. federal withholding tax of 30% on U.S. source periodic payments, including interest and dividends to certain non-U.S. entities, including certain non-U.S. financial institutions and investment funds, unless such non-U.S. entity complies with certain reporting requirements regarding its United States account holders and its United States owners. Most CLOs in which we invest will be treated as non-U.S. financial entities for this purpose, and therefore will be required to comply with these reporting requirements to avoid the 30% withholding. If a CLO in which we invest fails to properly comply with these reporting requirements, it could reduce the amounts available to distribute to equity and junior debt holders in such CLO, which could materially and adversely affect our operating results and cash flows.
Under Section 988 of the Code, gains or losses attributable to fluctuations in exchange rates between the time we accrue income, expenses or other liabilities denominated in a foreign currency and the time we actually collect such income or pay such expenses or liabilities are generally treated as ordinary income or loss. Similarly, gains or losses on foreign currency forward, futures and options contracts, similar financial instruments as well as upon the disposition of debt securities denominated in a foreign currency, to the extent attributable to fluctuations in exchange rates between the acquisition and disposition dates, are also treated as ordinary income or loss. Any such transactions that are not directly related to our investment in securities (possibly including speculative currency positions or currency derivatives not used for hedging purposes) also could, under future Treasury Regulations, produce income not among the types of “qualifying income” for purposes of the 90% Gross Income Test.
Gain or loss realized by us from the sale or exchange of warrants acquired by us as well as any loss attributable to the lapse of such warrants generally will be treated as capital gain or loss. The treatment of such gain or loss as long-term or short-term will depend on how long we held a particular warrant. Upon the exercise of a warrant acquired by us, our tax basis in the stock purchased under the warrant will equal the sum of the amount paid for the warrant plus the strike price paid on the exercise of the warrant.
Our transactions in futures contracts and options will be subject to special provisions of the Code that, among other things, may affect the character of our realized gains and losses realized (i.e., may affect whether gains or losses are ordinary or capital, or short-term or long-term), may accelerate recognition of income to us and may defer our losses. These rules could, therefore, affect the character, amount and timing of distributions to stockholders. These provisions also (a) will require us to mark-to-market certain types of the positions in our portfolio (i.e., treat them as if they were closed out), and (b) may cause us to recognize income without receiving cash with which to make distributions in amounts necessary to satisfy the 90% Distribution Requirement for qualifying to be taxed as a RIC or the Excise Tax Distribution Requirement. We will monitor our transactions, will make the appropriate tax elections and will make the appropriate entries in our books and records when we acquire any futures contract, option or hedged investment in order to mitigate the effect of these rules and prevent our disqualification from being taxed as a RIC.
Generally, our hedging transactions (including certain covered call options) may result in “straddles” for U.S. federal income tax purposes. The straddle rules may affect the character of our realized gains (or losses). In addition, our realized losses on positions that are part of a straddle may be deferred under the straddle rules, rather than being taken into account in calculating the taxable income for the taxable year in which the
75
losses are realized. Because only a few regulations implementing the straddle rules have been promulgated, the tax consequences to us of engaging in hedging transactions are not entirely clear. Hedging transactions may increase the amount of our realized short-term capital gain which is taxed as ordinary income when distributed to stockholders.
We may make one or more of the elections available under the Code which are applicable to straddles. If we make any of the elections, the amount, character and timing of the recognition of gains or losses from the affected straddle positions will be determined under rules that vary according to the election(s) made. The rules applicable under certain of the elections may operate to accelerate the recognition of gains or losses from the affected straddle positions.
Because the straddle rules may affect the character of gains or losses, defer losses and/or accelerate the recognition of gains or losses from the affected straddle positions, the amount which may be distributed to stockholders, and which will be taxed to them as ordinary income or long-term capital gain, may be increased or decreased as compared to a fund that did not engage in such hedging transactions.
Certain of our investment practices are subject to special and complex U.S. federal income tax provisions that may, among other things, (i) convert dividends that would otherwise constitute qualified dividend income into ordinary income, (ii) treat dividends that would otherwise be eligible for deductions available to certain U.S. corporations under the Code as ineligible for such treatment, (iii) disallow, suspend or otherwise limit the allowance of certain losses or deductions, (iv) convert long-term capital gains into short-term capital gains or ordinary income, (v) convert an ordinary loss or deduction into a capital loss (the deductibility of which is more limited), (vi) cause us to recognize income or gain without a corresponding receipt of cash, (vii) adversely alter the characterization of certain complex financial transactions, and (viii) produce income that will not qualify as good income for purposes of the 90% Gross Income Test. While we may not always be successful in doing so, we will seek to avoid or minimize the adverse tax consequences of our investment practices.
We may recognize gain (but not loss) from a constructive sale of certain “appreciated financial positions” if we enter into a short sale, offsetting notional principal contract, or forward contract transaction with respect to the appreciated position or substantially identical property. Appreciated financial positions subject to this constructive sale treatment include interests (including options and forward contracts and short sales) in stock and certain other instruments. Constructive sale treatment does not apply if the transaction is closed out no later than thirty days after the end of the tax year in which the transaction was initiated, and the underlying appreciated securities position is held unhedged for at least the next sixty days after the hedging transaction is closed.
Gain or loss from a short sale of property is generally considered as capital gains or loss to the extent the property used to close the short sale constitutes a capital asset in our hands. Except with respect to certain situations where the property used to close a short sale has a long-term holding period on the date the short sale is entered into, gains on short sales generally are short-term capital gains. A loss on a short sale will be treated as a long-term capital loss if, on the date of the short sale, “substantially identical property” has been held by us for more than one year. In addition, entering into a short sale may result in suspension of the holding period of “substantially identical property” held by us.
Gain or loss on a short sale will generally not be realized until such time as the short sale is closed. However, as described above in the discussion of constructive sales, if we hold a short sale position with respect to securities that have appreciated in value, and we then acquire property that is the same as or substantially identical to the property sold short, we generally will recognize gain on the date we acquire such property as if the short sale were closed on such date with such property. Similarly, if we hold an appreciated financial position with respect to securities and then enter into a short sale with respect to the same or substantially identical property, we generally will recognize gain as if the appreciated financial position were sold at its fair market value on the date we enter into the short sale. The subsequent holding period for any appreciated financial position that is subject to these constructive sale rules will be determined as if such position were acquired on the date of the constructive sale.
Taxation of Stockholders
Taxation of U.S. Resident Holders of Our Stock. Dividends and distributions on our shares are generally subject to federal income tax as described herein, even though such dividends and distributions may
76
economically represent a return of a particular stockholder’s investment. Such distributions are likely to occur in respect of shares purchased at a time when our NAV reflects gains that are either unrealized, or realized but not distributed. Such realized gains may be required to be distributed even when our NAV also reflects unrealized losses. Certain dividends and distributions declared by us in October, November, or December to stockholders of record of such month of a calendar year and paid by us in January of the following calendar year will be treated by stockholders as if received on December 31 of the calendar year in which they were declared. In addition, certain other distributions made after the close of our tax year may be “spilled back” and treated as paid by us (except for purposes of the nondeductible 4% federal excise tax) during such tax year. In such case, stockholders will be treated as having received such dividends in the tax year in which the distributions were actually made.
Stockholders receiving any distribution from us in the form of additional shares pursuant to the dividend reinvestment plan will be treated as receiving a taxable distribution in an amount generally equal to the cash that would have been received if they had elected to receive the distribution in cash, unless we issue new shares that are trading at or above NAV, in which case such stockholders will be treated as receiving a distribution equal to the fair market value of the shares received, determined as of the reinvestment date.
We inform stockholders of the source and tax status of all distributions promptly after the close of each calendar year.
For federal income tax purposes, distributions paid out of our current or accumulated earnings and profits will, except in the case of distributions of qualified dividend income and capital gain dividends described below, be taxable as ordinary dividend income. Certain income distributions paid by us (whether paid in cash or reinvested in additional shares of our stock) to individual taxpayers are taxed at rates applicable to net long-term capital gains. This tax treatment applies only if certain holding period requirements and other requirements are satisfied by the stockholder and the dividends are attributable to qualified dividend income received by us, and there can be no assurance as to what portion of our dividend distributions will qualify for favorable treatment. For this purpose, “qualified dividend income” means dividends received from United States corporations and “qualified foreign corporations,” provided that we satisfy certain holding period and other requirements in respect of the stock of such corporations. The maximum individual rate applicable to qualified dividend income is either 15% or 20%, depending on whether the individual’s income exceeds certain threshold amounts. Given our investment strategies, it is not anticipated that a significant portion of our dividends will be eligible to be treated as qualified dividend income.
Dividends distributed from our investment company taxable income which have been reported by us and received by certain of our corporate stockholders will qualify for the DRD to the extent of the amount of qualifying dividends received by us from certain domestic corporations for the tax year. A dividend received by us will not be treated as a qualifying dividend (i) to the extent the stock on which the dividend is paid is considered to be “debt-financed” (generally, acquired with borrowed funds), (ii) if we fail to meet certain holding period requirements for the stock on which the dividend is paid or (iii) to the extent we are under an obligation (pursuant to a short sale or otherwise) to make related payments with respect to positions in substantially similar or related property. Moreover, the DRD may be disallowed or reduced if an otherwise eligible corporate stockholder fails to satisfy the foregoing requirements with respect to shares of our stock or by application of the Code. Given our investment strategies, it is not anticipated that a significant portion of our dividends will be eligible for the DRD.
Capital gain dividends distributed to a stockholder are characterized as long-term capital gains, regardless of how long the stockholder has held our shares. A distribution of an amount in excess of our current and accumulated earnings and profits will be treated by a stockholder as a return of capital which is applied against and reduces the stockholder’s tax basis in our shares. To the extent that the amount of any such distribution exceeds a stockholder’s tax basis in our shares, the excess will be treated by the stockholder as gain from a sale or exchange of the shares. Distributions of gains from the sale or other disposition of our investments that we owned for one year or less are characterized as ordinary income.
Certain distributions reported by us as Section 163(j) interest dividends may be treated as interest income by stockholders for purposes of the tax rules applicable to interest expense limitations under Section 163(j) of the Code. Such treatment by stockholders is generally subject to holding period requirements and other potential limitations, although the holding period requirements are generally not applicable to dividends
77
declared by money market funds and certain other funds that declare dividends daily and pay such dividends on a monthly or more frequent basis. The amount that we are eligible to report as a Section 163(j) dividend for a tax year is generally limited to the excess of our business interest income over the sum of our (i) business interest expense and (ii) other deductions properly allocable to our business interest income.
We may elect to retain our net capital gains or a portion thereof for investment and be subject to tax at corporate rates on the amount retained. In such case, we may designate the retained amount as undistributed net capital gains in a notice to our stockholders who will be treated as if each received a distribution of the pro rata share of such net capital gain, with the result that each stockholder will: (i) be required to report the pro rata share of such net capital gain on the applicable tax return as long-term capital gains; (ii) receive a refundable tax credit for the pro rata share of tax paid by us on the net capital gain; and (iii) increase the tax basis for the shares of our stock held by an amount equal to the deemed distribution less the tax credit.
The IRS currently requires that a RIC that has two or more classes of stock allocate to each such class proportionate amounts of each type of its income (such as ordinary income and capital gains) based upon the percentage of total dividends paid to each class for the tax year. Accordingly, we intend each year to allocate capital gain dividends, if any, between our shares of common stock and shares of preferred stock (including Series A Term Preferred Stock) in proportion to the total dividends paid to each class with respect to such tax year.
The benefits of the reduced tax rates applicable to long-term capital gains and qualified dividend income may be impacted by the application of the alternative minimum tax to noncorporate stockholders.
Although we currently do not intend to do so, we have the ability to declare a large portion of a distribution in shares of our stock. Generally, were we to declare such a distribution, we would allow stockholders to elect payment in cash and/or shares of equivalent value. Under published IRS guidance, the entire distribution by a publicly offered RIC will generally be treated as a taxable distribution for U.S. federal income tax purposes, and count towards RIC distribution requirements under the Code, if certain conditions are satisfied. Among other things, the aggregate amount of cash available to be distributed to all stockholders is required to be at least 20% of the aggregate declared distribution. If too many stockholders elect to receive cash, the cash available for distribution is required to be allocated among the stockholders electing to receive cash (with the balance of the distribution paid in stock) under a formula provided in the applicable IRS guidance. Each stockholder electing to receive cash would be entitled to receive cash in an amount equal to at least the lesser of (i) the portion of the distribution such stockholder elected to receive in cash and (ii) such stockholder’s entire distribution multiplied by the percentage limitation on cash available for distribution. The number of shares of our stock distributed would thus depend on the applicable percentage limitation on cash available for distribution, the stockholders’ individual elections to receive cash or stock, and the value of the shares of stock. Each stockholder generally would be treated as having received a taxable distribution on the date the distribution is received in an amount equal to the cash that such stockholder would have received if the entire distribution had been paid in cash, even if such stockholder received all or most of the distribution in shares of our stock. This may result in a stockholder having to pay tax on such distribution, even if no cash is received.
Selling stockholders will generally recognize gain or loss in an amount equal to the difference between the amount realized on the sale and the stockholder’s adjusted tax basis in the shares sold. The gain or loss will generally be a capital gain or loss. The current maximum tax rate applicable to net capital gains recognized by individuals and other non-corporate taxpayers is: (i) the same as the maximum ordinary income tax rate for gain recognized on the sale of capital assets held for one year or less; or (ii) generally 15% or 20% (depending on whether the stockholder’s income exceeds certain threshold amounts) for gains recognized on the sale of capital assets held for more than one year (as well as certain capital gain dividends).
Gain or loss, if any, recognized by a holder in connection with our redemption of shares of the Preferred Stock generally will be characterized as gain or loss from a sale or exchange of Preferred Stock if the redemption (a) is “not essentially equivalent to a dividend” with respect to the stockholder, (b) results in a “complete termination” of holder’s ownership of our stock, or (c) is “substantially disproportionate” with respect to the holder, in each case, within the meaning of Section 302(b) of the Code. In determining whether any of these alternative tests has been met, stock considered to be owned by a holder of Preferred Stock by reason of certain constructive ownership rules under the Code and the related administrative guidance
78
promulgated thereunder as well as judicial interpretations thereof, as well as stock actually owned by the holder, generally must be taken into account. The determination as to whether any of the alternative tests described above will be satisfied with respect to a holder of Preferred Stock depends upon the facts and circumstances at the time that the determination must be made.
Holders of Preferred Stock are advised to consult their tax advisors to determine their own tax treatment in the event of a redemption of such stock.
Even if a redemption of Series A Term Preferred Stock is treated as a sale or exchange, a portion of the amount received by a holder on the redemption may be characterized as dividend income for federal income tax purposes to the extent such portion is attributable to declared but unpaid dividends. If a redemption of Series A Term Preferred Stock from a holder is not treated as a sale or exchange for federal income tax purposes, the proceeds of such distribution generally will be characterized for federal income tax purposes as a dividend.
Any loss realized upon the sale or exchange of shares of our stock with a holding period of six months or less will be treated as a long-term capital loss to the extent of any capital gain dividends received (or amounts designated as undistributed capital gains) with respect to such shares. In addition, all or a portion of a loss realized by a stockholder on a sale or other disposition of shares of our stock may be disallowed under “wash sale” rules to the extent the stockholder acquires other shares of our stock (whether through the reinvestment of distributions or otherwise) within a period of 61 days beginning 30 days before and ending 30 days after the date of disposition of our shares. Any disallowed loss will result in an adjustment to the stockholder’s tax basis in some or all of the other shares of our stock acquired.
Certain commissions or other sales charges paid upon a purchase of our shares cannot be taken into account for purposes of determining gain or loss on a sale of the shares before the 91st day after their purchase to the extent a sales charge is reduced or eliminated in a subsequent acquisition of our shares, during the period beginning on the date of such sale and ending on January 31 of the calendar year following the calendar year in which the sale is made, pursuant to a reinvestment right. Any disregarded amounts will result in an adjustment to a stockholder’s tax basis in some or all of any other shares of our stock acquired.
We or your financial intermediary is also generally required by law to report to each stockholder and to the IRS cost basis information for shares of our stock sold by or redeemed from the stockholder. This information includes the adjusted cost basis of the shares, the gross proceeds from disposition and whether the gain or loss is long-term or short-term. The adjusted cost basis of shares will be based on the default cost basis reporting method selected by us, unless a stockholder, before the sale or redemption, informs us that it has selected a different IRS-accepted method offered by us. These requirements, however, will not apply for investments through a tax-advantaged account. Stockholders should consult their financial intermediaries and tax advisers to determine the best cost basis method for their tax situation, and to obtain more information about how these cost basis reporting requirements apply to them.
Medicare Tax on Net Investment Income. A 3.8% tax is imposed under Section 1411 of the Code on the “net investment income” of certain U.S. citizens and residents and on the undistributed net investment income of certain estates and trusts. Among other items, net investment income generally includes payments of interest or dividends on, and net gains recognized from the sale, exchange, redemption, retirement or other taxable disposition of our securities (unless the securities are held in connection with certain trades or businesses), less certain deductions. Prospective investors in our securities should consult their own tax advisors regarding the effect, if any, of this tax on their ownership and disposition of our securities.
Taxation of Non-U.S. Holders of Our Stock. Whether an investment in the shares of our stock is appropriate for a non-U.S. holder will depend upon that person’s particular circumstances. An investment in the shares by a non-U.S. holder may have adverse tax consequences. Non-U.S. holders should consult their tax advisors before investing in our stock.
Subject to the discussions below, distributions of our “investment company taxable income” to non-U.S. holders (including interest income and net short-term capital gain) are generally expected to be subject to withholding of U.S. federal taxes at a 30% rate (or lower rate provided by an applicable treaty) to the extent of our current and accumulated earnings and profits. If the distributions are effectively connected with a U.S. trade or business of the non-U.S. holder, we will not be required to withhold U.S. federal tax if the non-U.S.
79
holder complies with applicable certification and disclosure requirements, although the distributions will be subject to U.S. federal income tax at the rates applicable to U.S. persons. Special certification requirements apply to a non-U.S. holder that is a foreign partnership or a foreign trust, and such entities are urged to consult their own tax advisors. Backup withholding will not be applied to payments that have been subject to the 30% (or lower applicable treaty rate) withholding tax described in this paragraph.
In addition, with respect to certain distributions made by RICs to non-U.S. holders, no withholding is required and the distributions generally are not subject to U.S. federal income tax if (i) the distributions are properly reported in a notice timely delivered to our stockholders as “interest-related dividends” or “short-term capital gain dividends,” (ii) the distributions are derived from sources specified in the Code for such dividends and (iii) certain other requirements are satisfied. Depending on the circumstances, we may report all, some or none of our potentially eligible dividends as derived from such qualified net interest income or as qualified short-term capital gain, and a portion of our distributions, which may be significant (e.g., interest from non-U.S. sources or non-U.S. CLOs or any foreign currency gains) would be ineligible for this potential exemption from withholding. Moreover, in the case of shares of our stock held through an intermediary, the intermediary may have withheld U.S. federal income tax even if we reported the payment as derived from such qualified net interest income or qualified short-term capital gain. Hence, no assurance can be provided as to whether any amount of our dividends or distributions will be eligible for this exemption from withholding or if eligible, will be reported as such by us.
Actual or deemed distributions of our net long-term capital gains to a non-U.S. holder, and gains realized by a non-U.S. holder upon the sale of our stock, will not be subject to federal withholding tax and generally will not be subject to U.S. federal income tax unless, (i) the distributions or gains, as the case may be, are effectively connected with a U.S. trade or business of the Non-U.S. holder and, if an income tax treaty applies, are attributable to a permanent establishment maintained by the non-U.S. holder in the United States or (ii) in the case of an individual stockholder, the stockholder is present in the United States for a period or periods aggregating 183 days or more during the year of the sale or the receipt of the distributions or gains and certain other conditions are met.
If we distribute our net capital gains in the form of deemed rather than actual distributions (which we may do in the future), a non-U.S. holder will be entitled to a U.S. federal income tax credit or tax refund equal to the stockholder’s allocable share of the tax we pay on the capital gains deemed to have been distributed. In order to obtain the refund, the non-U.S. holder would be required to obtain a U.S. taxpayer identification number and file a U.S. federal income tax return even if the non-U.S. holder would not otherwise be required to obtain a U.S. taxpayer identification number or file a U.S. federal income tax return. For a corporate non-U.S. holder, distributions (both actual and deemed), and gains realized upon the sale of our stock that are effectively connected with a U.S. trade or business may, under certain circumstances, be subject to an additional “branch profits tax” at a 30% rate (or at a lower rate if provided for by an applicable treaty).
A non-U.S. holder who is a non-resident alien individual, and who is otherwise subject to withholding of U.S. federal income tax, may be subject to information reporting and backup withholding of U.S. federal income tax on distributions unless the non-U.S. holder provides us or the distribution paying agent with an IRS Form W-8BEN, IRS Form W-8BEN-E, or an acceptable substitute form, or otherwise meets documentary evidence requirements for establishing that it is a non-U.S. holder or otherwise establishes an exemption from backup withholding.
Non-U.S. holders may also be subject to U.S. estate tax with respect to their investment in our shares. Non-U.S. persons should consult their own tax advisors with respect to the U.S. federal income tax and withholding tax, and state, local and foreign tax consequences of an investment in the shares.
Tax Shelter Reporting Regulations. Under applicable Treasury Regulations, if a U.S. holder recognizes a loss with respect to our securities of $2 million or more for a non-corporate U.S. holder or $10 million or more for a corporate U.S. holder in any single tax year (or a greater loss over a combination of tax years), the U.S. holder may be required to file with the IRS a disclosure statement on IRS Form 8886.
Direct U.S. holders of portfolio securities are in many cases excepted from this reporting requirement, but, under current guidance, U.S. holders of a RIC are not excepted. Future guidance may extend the current exception from this reporting requirement to U.S. holders of most or all RICs. The fact that a loss is reportable
80
under these regulations does not affect the legal determination of whether the taxpayer’s treatment of the loss is proper. Significant monetary penalties apply to a failure to comply with this reporting requirement. States may also have a similar reporting requirement. U.S. holders of our securities should consult their own tax advisors to determine the applicability of these Treasury Regulations in light of their individual circumstances.
Information Reporting and Backup Withholding. A U.S. holder (other than an “exempt recipient,” including a “C” corporation and certain other persons who, when required, demonstrate their exempt status) may be subject to backup withholding at a rate of 24% on, and will be subject to information reporting requirements with respect to, payments of principal or interest (including original issue discount, if any) on, and proceeds from the sale, exchange, redemption or retirement of, our securities. In general, if a non-corporate U.S. holder subject to information reporting fails to furnish a correct taxpayer identification number or otherwise fails to comply with applicable backup withholding requirements, backup withholding at the applicable rate may apply.
You should consult your own tax advisor regarding the application of information reporting and backup withholding in your particular circumstance and the availability of and procedure for obtaining an exemption from backup withholding. Backup withholding is not an additional tax, and any amounts withheld under the backup withholding rules may be allowed as a refund or a credit against your U.S. federal income tax liability, provided the required information is timely furnished to the IRS.
FATCA Withholding on Payments to Certain Foreign Entities. FATCA generally imposes a U.S. federal withholding tax of 30% on payments of dividends made with respect to shares of our stock to certain non-U.S. entities (including, in some circumstances, where such an entity is acting as an intermediary) that fail to comply (or be deemed compliant) with certain certification and information reporting requirements. FATCA withholding taxes apply to all withholdable payments without regard to whether the beneficial owner of the payment would otherwise be entitled to an exemption from withholding taxes pursuant to an applicable tax treaty with the United States or under U.S. domestic law. Stockholders may be requested to provide additional information to enable the applicable withholding agent to determine whether withholding is required.
Proposed Treasury Regulations eliminate the application of withholding imposed under FATCA with respect to payments of gross proceeds. Pursuant to these proposed Treasury Regulations, the Company and any other applicable withholding agent may (but is not required to) rely on this proposed change to FATCA withholding until final regulations are issued or until such proposed Treasury Regulations are rescinded. Prospective holders of in our securities should consult their own tax advisors regarding the effect, if any, of the FATCA rules for them based on their particular circumstances.
The preceding discussion of material U.S. federal income tax considerations is for general information only and is not tax advice. We urge you to consult your own tax advisor with respect to the particular tax consequences to you of an investment in our securities, including the possible effect of any pending legislation or proposed regulations.
81
DESCRIPTION OF OUR SECURITIES
This prospectus contains a summary of our common stock, preferred stock, subscription rights and debt securities. These summaries are not meant to be a complete description of each security. However, this prospectus and the accompanying prospectus supplement will contain the material terms and conditions for each security being offered thereby.
The following are our authorized classes of securities as of June 26, 2023:
| |
(1)
Title of Class |
| |
(2)
Amount Authorized |
| |
(3)
Amount Held by Us or for Our Account |
| |
(4)
Amount Outstanding Exclusive of Amounts Shown Under (3) |
|
| |
Common stock, par value $0.001 per share
|
| |
150,000,000 shares
|
| |
—
|
| |
8,908,108 shares
|
|
| |
Series A Term Preferred Stock, par value $0.001 per share
|
| |
20,000,000 shares
|
| |
—
|
| |
1,521,649 shares
|
|
82
DESCRIPTION OF OUR CAPITAL STOCK
The following description is based on relevant portions of the DGCL and on our certificate of incorporation and bylaws. This summary is not necessarily complete, and we refer you to the DGCL, our certificate of incorporation and our bylaws for a more detailed description of the provisions summarized below.
Capital Stock
Our authorized stock consists of 150,000,000 shares of common stock, par value $0.001 per share, and 20,000,000 shares of preferred stock, par value $0.001 per share. There are no outstanding options or warrants to purchase our stock. No stock has been authorized for issuance under any equity compensation plans. Under Delaware law, our stockholders generally are not personally liable for our debts or obligations.
Common Stock
All shares of our common stock have equal rights as to earnings, assets, dividends and voting and, when they are issued, will be duly authorized, validly issued, fully paid and nonassessable. Distributions may be paid to holders of our common stock if, as and when authorized by the board of directors and declared by us out of funds legally available therefrom. Such distributions may be payable in cash, shares of our common stock or a combination thereof. Shares of our common stock have no preemptive, exchange, conversion or redemption rights and are freely transferable, except when their transfer is restricted by U.S. federal and state securities laws or by contract. In the event of our liquidation, dissolution or winding up, each share of our common stock would be entitled to share ratably in all of our assets that are legally available for distribution after we pay all debts and other liabilities and subject to any preferential rights of holders of our preferred stock, if any preferred stock is outstanding at such time. Each share of common stock is entitled to one vote on all matters submitted to a vote of stockholders, including the election of directors. Except as provided with respect to any other class or series of stock, holders of our common stock will possess exclusive voting power. There is no cumulative voting in the election of directors.
Preferred Stock
We are authorized to issue 20,000,000 shares of preferred stock. As of June 26, 2023, we had 1,521,649 shares of Preferred Stock outstanding. Our certificate of incorporation authorizes our board of directors to classify and reclassify any unissued shares of preferred stock into other classes or series of preferred stock without stockholder approval. If we issue preferred stock, costs of the offering will be borne immediately at such time by the holders of our common stock and result in a reduction of the NAV per share of our common stock at that time. We may issue preferred stock at any time. Prior to issuance of shares of each class or series, our board of directors is required by the DGCL and by our certificate of incorporation to set the terms, preferences, conversion or other rights, voting powers, restrictions, limitations as to dividends or other distributions, qualifications and terms or conditions of redemption for each class or series. Thus, our board of directors could authorize the issuance of shares of preferred stock with terms and conditions that could have the effect of delaying, deferring or preventing a transaction or a change in control that might involve a premium price for holders of our common stock or otherwise be in their best interest.
Series A Term Preferred Stock. As of June 26, 2023, we had 1,521,649 shares of Series A Term Preferred Stock outstanding.
Redemption. We are required to redeem all outstanding shares of the Series A Term Preferred Stock on October 30, 2026. In addition, if we fail to maintain asset coverage (as defined in Section 18(h) of the 1940 Act) of at least 200% as of the close of business on the last business day of any calendar quarter and such failure is not cured by the close of business on the date that is 30 calendar days following the filing date of our Annual Report on Form N-CSR, Semiannual Report on Form N-CSRS or Quarterly Report on Form N-PORT, as applicable, for that quarter, we will be required to redeem the number of shares of our preferred stock (which at our discretion may include any number or portion of the Series A Term Preferred Stock), that, when combined with any debt securities redeemed for failure to maintain the asset coverage required by the indenture governing such securities, (1) result in us having asset coverage of at least 200% and (2) if fewer, the maximum number of shares of preferred stock that can be redeemed out of funds legally available for such redemption. In connection with any redemption for failure to maintain such asset coverage, we may, in our
83
sole option, redeem such additional number of shares of preferred stock that will result in asset coverage up to and including 285%. At any time after October 31, 2023, we may, in our sole option, redeem the outstanding shares of Series A Term Preferred Stock in whole or, from time to time, in part, out of funds legally available for such redemption. The price that we will pay to redeem shares of the Series A Term Preferred Stock pursuant to any redemption will equal $25 per share plus an amount equal to accumulated but unpaid dividends, if any, on such shares (whether or not earned or declared, but excluding interest on such dividends) to, but excluding, the redemption date.
Ranking and Liquidation. The shares of Series A Term Preferred Stock are senior securities that constitute capital stock. The Series A Term Preferred Stock rank (i) senior to shares of our common stock in priority of payment of dividends and as to the distribution of assets upon dissolution, liquidation or the winding-up of our affairs; (ii) equal in priority with all other future series of preferred stock we may issue as to payment of dividends and as to distributions of assets upon dissolution, liquidation or the winding-up of our affairs; and (iii) subordinate in right of payment to any future senior indebtedness. In the event of liquidation, dissolution or winding up of our affairs, holders of Series A Term Preferred Stock will be entitled to receive a liquidation distribution equal to $25 per share, plus an amount equal to accumulated but unpaid dividends, if any, on such shares (whether or not earned or declared, but excluding interest on such dividends) to, but excluding, the payment date.
Dividends. We intend to pay monthly dividends on the Series A Term Preferred Stock at a fixed annual rate of 5.00% of the liquidation preference ($1.25 per share per year), or the “Series A Dividend Rate.” If we fail to redeem the Series A Term Preferred Stock as required on October 30, 2026, or fail to pay any dividend on the payment date for such dividend, the Series A Dividend Rate will increase by 2% per annum until we redeem the Series A Term Preferred Stock or pay the dividend, as applicable. The Series A Dividend Rate will be computed on the basis of a 360-day year consisting of twelve 30-day months.
Voting Rights. Except as otherwise provided in our certificate of incorporation or as otherwise required by law, (1) each holder of Series A Term Preferred Stock is entitled to one vote for each share of Series A Term Preferred Stock held on each matter submitted to a vote of our stockholders and (2) the holders of all outstanding preferred stock, including the Series A Term Preferred Stock, and common stock vote together as a single class; provided that holders of preferred stock, including the Series A Term Preferred Stock, voting separately as a class, are entitled to elect at least two (2) of our directors and, if we fail to pay dividends on any outstanding shares of our preferred stock, including the Series A Term Preferred Stock, in an amount equal to two (2) full years of dividends, and continuing until such failure is cured, will be entitled to elect a majority of our directors.
Provisions of the DGCL and Our Certificate of Incorporation and Bylaws
Limitation on Liability of Directors and Officers; Indemnification and Advance of Expenses. The indemnification of our officers and directors is governed by Section 145 of the DGCL, our certificate of incorporation and bylaws. Subsection (a) of DGCL Section 145 empowers a corporation to indemnify any person who was or is a party or is threatened to be made a party to any threatened, pending or completed action, suit or proceeding, whether civil, criminal, administrative or investigative (other than an action by or in the right of the corporation) by reason of the fact that the person is or was a director, officer, employee or agent of the corporation, or is or was serving at the request of the corporation as a director, officer, employee or agent of another corporation, partnership, joint venture, trust or other enterprise, against expenses (including attorneys’ fees), judgments, fines and amounts paid in settlement actually and reasonably incurred by the person in connection with such action, suit or proceeding if (1) such person acted in good faith, (2) in a manner such person reasonably believed to be in or not opposed to the best interests of the corporation and (3) with respect to any criminal action or proceeding, such person had no reasonable cause to believe the person’s conduct was unlawful.
Subsection (b) of DGCL Section 145 empowers a corporation to indemnify any person who was or is a party or is threatened to be made a party to any threatened, pending or completed action or suit by or in the right of the corporation to procure a judgment in its favor by reason of the fact that the person is or was a director, officer, employee or agent of the corporation, or is or was serving at the request of the corporation as a director, officer, employee or agent of another corporation, partnership, joint venture, trust or other enterprise against expenses (including attorneys’ fees) actually and reasonably incurred by such person in
84
connection with the defense or settlement of such action or suit if such person acted in good faith and in a manner the person reasonably believed to be in, or not opposed to, the best interests of the corporation, and except that no indemnification may be made in respect of any claim, issue or matter as to which such person has been adjudged to be liable to the corporation unless and only to the extent that the Delaware Court of Chancery or the court in which such action or suit was brought determines upon application that, despite the adjudication of liability but in view of all the circumstances of the case, such person is fairly and reasonably entitled to indemnity for such expenses which the Delaware Court of Chancery or such other court deems proper.
DGCL Section 145 further provides that to the extent that a present or former director or officer is successful, on the merits or otherwise, in the defense of any action, suit or proceeding referred to in subsections (a) and (b) of Section 145, or in defense of any claim, issue or matter therein, such person will be indemnified against expenses (including attorneys’ fees) actually and reasonably incurred by such person in connection with such action, suit or proceeding. In all cases in which indemnification is permitted under subsections (a) and (b) of Section 145 (unless ordered by a court), it will be made by the corporation only as authorized in the specific case upon a determination that indemnification of the present or former director, officer, employee or agent is proper in the circumstances because the applicable standard of conduct has been met by the party to be indemnified. Such determination must be made, with respect to a person who is a director or officer at the time of such determination, (1) by a majority vote of the directors who are not parties to such action, suit or proceeding, even though less than a quorum, (2) by a committee of such directors designated by majority vote of such directors, even though less than a quorum, (3) if there are no such directors, or if such directors so direct, by independent legal counsel in a written opinion or (4) by the stockholders. The statute authorizes the corporation to pay expenses incurred by an officer or director in advance of the final disposition of a proceeding upon receipt of an undertaking by or on behalf of the person to whom the advance will be made, to repay the advances if it is ultimately determined that he or she was not entitled to indemnification. DGCL Section 145 also provides that indemnification and advancement of expenses permitted under such Section are not to be exclusive of any other rights to which those seeking indemnification or advancement of expenses may be entitled under any bylaw, agreement, vote of stockholders or disinterested directors or otherwise. DGCL Section 145 also authorizes the corporation to purchase and maintain liability insurance on behalf of its directors, officers, employees and agents regardless of whether the corporation would have the statutory power to indemnify such persons against the liabilities insured.
Our certificate of incorporation provides that our directors will not be liable to us or our stockholders for monetary damages for breach of fiduciary duty as a director to the fullest extent permitted by the current DGCL or as the DGCL may hereafter be amended. DGCL Section 102(b)(7) provides that the personal liability of a director to a corporation or its stockholders for breach of fiduciary duty as a director may be eliminated except for liability (1) for any breach of the director’s duty of loyalty to the corporation or its stockholders, (2) for acts or omissions not in good faith or which involve intentional misconduct or a knowing violation of law, (3) under Section 174 of the DGCL, relating to unlawful payment of dividends or unlawful stock purchases or redemption of stock or (4) for any transaction from which the director derives an improper personal benefit.
Our certificate of incorporation provides for the indemnification of any person to the full extent permitted, and in the manner provided, by the current DGCL or as the DGCL may hereafter be amended. In addition, we have entered into indemnification agreements with each of our directors and officers in order to effect the foregoing.
Delaware Anti-Takeover Law. The DGCL and our certificate of incorporation and bylaws contain provisions that could make it more difficult for a potential acquirer to acquire us by means of a tender offer, proxy contest or otherwise. These provisions are expected to discourage certain coercive takeover practices and inadequate takeover bids and to encourage persons seeking to acquire control of us to negotiate first with our board of directors. These measures may delay, defer or prevent a transaction or a change in control that might otherwise be in the best interests of our stockholders. These provisions could have the effect of depriving stockholders of an opportunity to sell their shares at a premium over prevailing market prices by discouraging a third party from seeking to obtain control over us. Such attempts could have the effect of increasing our expenses and disrupting our normal operations. We believe that the benefits of these provisions outweigh the potential disadvantages of discouraging any such acquisition proposals because the negotiation of such
85
proposals may improve their terms. Our board of directors has considered these provisions and has determined that the provisions are in the best interests of us and our stockholders generally.
We are subject to the provisions of Section 203 of the DGCL regulating corporate takeovers. In general, these provisions prohibit a Delaware corporation from engaging in any business combination with any interested stockholder for a period of three years following the date that the stockholder became an interested stockholder, unless:
•
prior to such time, the board of directors approved either the business combination or the transaction which resulted in the stockholder becoming an interested stockholder;
•
upon consummation of the transaction that resulted in the stockholder becoming an interested stockholder, the interested stockholder owned at least 85% of the voting stock of the corporation outstanding at the time the transaction commenced; or
•
on or after the date the business combination is approved by the board of directors and authorized at a meeting of stockholders, by at least two-thirds of the outstanding voting stock that is not owned by the interested stockholder.
•
Section 203 defines “business combination” to include the following:
•
any merger or consolidation involving the corporation and the interested stockholder;
•
any sale, transfer, pledge or other disposition (in one transaction or a series of transactions) of 10% or more of either the aggregate market value of all the assets of the corporation or the aggregate market value of all the outstanding stock of the corporation involving the interested stockholder;
•
subject to certain exceptions, any transaction that results in the issuance or transfer by the corporation of any stock of the corporation to the interested stockholder;
•
any transaction involving the corporation that has the effect of increasing the proportionate share of the stock of any class or series of the corporation owned by the interested stockholder; or
•
the receipt by the interested stockholder of the benefit of any loans, advances, guarantees, pledges or other financial benefits provided by or through the corporation.
In general, Section 203 defines an interested stockholder as any entity or person beneficially owning 15% or more of the outstanding voting stock of the corporation and any entity or person affiliated with or controlling or controlled by any of these entities or persons.
The statute could prohibit or delay mergers or other takeover or change in control attempts and, accordingly, may discourage attempts to acquire us.
Election of Directors. Our bylaws provide that the affirmative vote of a plurality of all votes cast by stockholders present in person or by proxy at an annual or special meeting of the stockholders and entitled to vote thereat will be sufficient to elect a director. Under our certificate of incorporation, our board of directors may amend the bylaws to alter the vote required to elect directors.
For so long as any series of our preferred stock are outstanding, the holders of our preferred stock, voting as a class, will be entitled to elect two of our directors.
Classified Board of Directors. Our board of directors is divided into three classes of directors serving staggered three-year terms, with the term of office of only one of the three classes expiring each year. A classified board may render a change in control of us or removal of our incumbent management more difficult. We believe, however, that the longer time required to elect a majority of a classified board of directors helps to ensure the continuity and stability of our management and policies.
Number of Directors; Removal; Vacancies. Our certificate of incorporation provides that the number of directors will be set only by the board of directors in accordance with our bylaws. Our bylaws provide that a majority of our entire board of directors may at any time increase or decrease the number of directors.
However, unless our bylaws are amended, the number of directors may never be less than four nor more than eight. Under the DGCL, unless the certificate of incorporation provides otherwise (which our certificate
86
of incorporation does not), directors on a classified board such as our board of directors may be removed only for cause, by the affirmative vote of stockholders. Under our certificate of incorporation and bylaws and subject to applicable stockholder election requirements of the 1940 Act, any vacancy on the board of directors, including a vacancy resulting from an enlargement of the board of directors, may be filled only by vote of a majority of the directors then in office. The limitations on the ability of our stockholders to remove directors and fill vacancies could make it more difficult for a third-party to acquire, or discourage a third-party from seeking to acquire, control of us.
Action by Stockholders. Under our certificate of incorporation, stockholder action can be taken only at an annual or special meeting of stockholders or by unanimous written consent in lieu of a meeting. This may have the effect of delaying consideration of a stockholder proposal until the next annual meeting.
Advance Notice Provisions for Stockholder Nominations and Stockholder Proposals. Our bylaws provide that with respect to an annual meeting of stockholders, nominations of persons for election to the board of directors and the proposal of business to be considered by stockholders may be made only (1) by or at the direction of the board of directors, (2) pursuant to our notice of meeting or (3) by a stockholder who is entitled to vote at the meeting and who has complied with the advance notice procedures of the bylaws. Nominations of persons for election to the board of directors at a special meeting may be made only (1) by or at the direction of the board of directors or (2) provided that the board of directors has determined that directors will be elected at the meeting, by a stockholder who is entitled to vote at the meeting and who has complied with the advance notice provisions of the bylaws.
The purpose of requiring stockholders to give us advance notice of nominations and other business is to afford our board of directors a meaningful opportunity to consider the qualifications of the proposed nominees and the advisability of any other proposed business and, to the extent deemed necessary or desirable by our board of directors, to inform stockholders and make recommendations about such qualifications or business, as well as to provide a more orderly procedure for conducting meetings of stockholders. Although our bylaws do not give our board of directors any power to disapprove stockholder nominations for the election of directors or proposals recommending certain action, they may have the effect of precluding a contest for the election of directors or the consideration of stockholder proposals if proper procedures are not followed and of discouraging or deterring a third party from conducting a solicitation of proxies to elect its own slate of directors or to approve its own proposal without regard to whether consideration of such nominees or proposals might be harmful or beneficial to us and our stockholders.
Stockholder Meetings. Our bylaws provide that any action required or permitted to be taken by stockholders at an annual meeting or special meeting of stockholders may only be taken if it is properly brought before such meeting. In addition, our certificate of incorporation provides that, in lieu of a meeting, any such action may be taken by unanimous written consent of our stockholders. In addition, our bylaws establish an advance notice procedure for stockholder proposals to be brought before an annual meeting of stockholders, including proposed nominations of candidates for election to the board of directors. Stockholders at an annual meeting may only consider proposals or nominations specified in the notice of meeting or brought before the meeting by or at the direction of the board of directors, or by a stockholder of record on the record date for the meeting who is entitled to vote at the meeting and who has delivered timely written notice in proper form to the secretary of the stockholder’s intention to bring such business before the meeting. These provisions could have the effect of delaying until the next stockholder meeting stockholder actions that are favored by the holders of a majority of our outstanding voting securities.
Calling of Special Meetings of Stockholders. Our bylaws provide that, except as required by law, special meetings of stockholders may be called by the secretary at the request of the Chairman of the Board of Directors, the Chief Executive Officer or by a resolution duly adopted by the affirmative vote of a majority of the Directors.
Conflict with the 1940 Act. Our bylaws provide that, if and to the extent that any provision of the DGCL or bylaws conflicts with any provision of the 1940 Act, the applicable provision of the 1940 Act will control.
Exclusive Forum. Our bylaws provide that, unless the Company consents to the selection of an alternative forum in writing, the Court of Chancery, or if that court does not have jurisdiction, the United States District Court for the District of Delaware shall be the sole and exclusive forum for (a) any derivative action or proceeding brought on behalf of the Company, (b) any action asserting a claim of breach of any
87
duty owed by any director or officer or other agent of the Company to the Company or to the stockholders of the Company, (c) any action asserting a claim against the Company or any Director or officer or other agent of the Company arising pursuant to any provision of the DGCL or our certificate of incorporation or our Bylaws, or (d) any action asserting a claim against the Company or any Director or officer or other agent of the Company that is governed by the internal affairs doctrine.
This choice of forum provision may limit a stockholder’s ability to bring a claim in a judicial forum that it finds favorable for disputes with us or any of our directors, officers, other employees or stockholders, which may discourage lawsuits with respect to such claims. Alternatively, if a court were to find the choice of forum provision contained in our bylaws to be inapplicable or unenforceable in an action, we may incur additional costs associated with resolving such action in other jurisdictions, which could harm our business, operating results and financial condition.
Potential Conversion to Open-End Fund
We may be converted to an open-end management investment company at any time if approved by each of the following: (i) a majority of our directors then in office, (ii) the holders of not less than 75% of our outstanding shares entitled to vote thereon and (iii) such vote or votes of the holders of any class or classes or series of shares as may be required by the 1940 Act. In considering whether to vote on any proposal to convert us to an open-end management investment company, our board of directors may consider any potential benefits to stockholders that may potentially be achieved based on the circumstances and related risks, and whether it would be in the long-term best interests of stockholders to do so in light of any necessary changes in our investment policies and other factors. The composition of our portfolio likely could prohibit us from complying with regulations of the SEC applicable to open-end management investment companies. Accordingly, conversion likely would require significant changes in our investment policies and may require liquidation of a substantial portion of relatively illiquid portions of its portfolio, to the extent such positions are held. In the event of conversion, the shares of our common stock would cease to be listed on the NYSE or other national securities exchange or market system. Any outstanding shares of our preferred stock would be redeemed by us prior to such conversion. Our board of directors believes, however, that the closed-end structure is desirable, given our investment objectives and policies. Investors should assume, therefore, that it is unlikely that the board of directors would vote to convert us to an open-end management investment company. Stockholders of an open-end management investment company may require the open-end management investment company to redeem their shares at any time (except in certain circumstances as authorized by or under the 1940 Act) at their NAV, less such redemption charge, if any, as might be in effect at the time of a redemption. We would expect to pay all such redemption requests in cash, but intends to reserve the right to pay redemption requests in a combination of cash or securities. If such partial payment in securities were made, investors may incur brokerage costs in converting such securities to cash. If we were converted to an open-end fund, it is likely that new shares of our common stock would be sold at NAV plus a sales load.
Repurchase of Shares and Other Discount Measures
Because shares of common stock of closed-end management investment companies that are listed on an exchange frequently trade at a discount to their NAVs, the board of directors may from time to time determine that it may be in the interest of the holders of our common stock to take certain actions intended to reduce such discount. The board of directors, in consultation with the Adviser, will review at least annually the possibility of open market repurchases and/or tender offers for shares of our common stock and will consider such factors as the market price of shares of our common stock, the NAV per share of our common stock, the liquidity of our assets, the effect on our expenses, whether such transactions would impair our status as a RIC or result in a failure to comply with applicable asset coverage requirements, general economic conditions and such other events or conditions, which may have a material effect on our ability to consummate such transactions. There are no assurances that the board of directors will, in fact, decide to undertake either of these actions or, if undertaken, that such actions will result in shares of our common stock trading at a price which is equal to or approximates their NAV.
In recognition of the possibility that shares of our common stock might trade at a discount to the NAV of such shares and that any such discount may not be in the interest of the holders of our common stock, the board of directors, in consultation with the Adviser, from time to time may review the possible actions to reduce any such discount.
88
DESCRIPTION OF OUR PREFERRED STOCK
We are authorized to issue up to 20,000,000 shares of preferred stock. As of June 26, 2023, we had 1,521,649 shares of Series A Term Preferred Stock outstanding. See “Description of our Capital Stock — Preferred Stock — Series A Term Preferred Stock” for a description of our outstanding preferred stock. We may issue additional preferred stock from time to time in one or more series without stockholder approval. Prior to issuance of shares of each series, our board of directors is required by Delaware law and by our certificate of incorporation to set the terms, preferences, conversion or other rights, voting powers, restrictions, limitations as to dividends or other distributions, qualifications and terms or conditions of redemption for each series. Thus, the board of directors could authorize the issuance of shares of preferred stock with terms and conditions that could have the effect of delaying, deferring or preventing a transaction or a change in control that might involve a premium price for holders of our common stock or otherwise be in their best interest. You should note, however, that any such an issuance must adhere to the requirements of the 1940 Act, Delaware law and any other limitations imposed by law.
With respect to senior securities that are stocks (i.e., shares of our preferred stock, including the Series A Term Preferred Stock), we are required under current law to have an asset coverage of at least 200%, as measured at the time of the issuance of any such shares of preferred stock and calculated as the ratio of our total assets (less all liabilities and indebtedness not represented by senior securities) over the aggregate amount of our outstanding senior securities representing indebtedness plus the aggregate liquidation preference of any outstanding shares of preferred stock. In addition the 1940 Act requires that (i) the holders of shares of preferred stock must be entitled as a class to elect two directors at all times and to elect a majority of the directors if dividends or other distribution on the preferred stock are in arrears by two years or more and (ii) such class of stock have complete priority over any other class of stock as to distribution of assets and payment of dividends or other distributions, which shall be cumulative. Some matters under the 1940 Act require the separate vote of the holders of any issued and outstanding preferred stock. We believe that the availability for issuance of preferred stock will provide us with increased flexibility in structuring future financings and acquisitions.
For any series of preferred stock that we may issue, our board of directors will determine and the certificate of designation and the prospectus supplement relating to such series will describe:
•
the designation and number of shares of such series;
•
the rate and time at which, and the preferences and conditions under which, any dividends or other distributions will be paid on shares of such series, as well as whether such dividends or other distributions are participating or non-participating;
•
any provisions relating to convertibility or exchangeability of the shares of such series, including adjustments to the conversion price of such series;
•
the rights and preferences, if any, of holders of shares of such series upon our liquidation, dissolution or winding up of our affairs;
•
the voting powers, if any, of the holders of shares of such series;
•
any provisions relating to the redemption of the shares of such series;
•
any limitations on our ability to pay dividends or make distributions on, or acquire or redeem, other securities while shares of such series are outstanding;
•
any conditions or restrictions on our ability to issue additional shares of such series or other securities;
•
if applicable, a discussion of certain U.S. federal income tax considerations; and
•
any other relative powers, preferences and participating, optional or special rights of shares of such series, and the qualifications, limitations or restrictions thereof.
All shares of preferred stock that we may issue will be of equal rank and identical except as to the particular terms thereof that may be fixed by our board of directors, and all shares of each series of preferred stock will be identical except as to the dates from which dividends or other distributions, if any, thereon will be cumulative.
89
DESCRIPTION OF OUR SUBSCRIPTION RIGHTS
The following is a general description of the terms of the subscription rights we may issue from time to time. Particular terms of any subscription rights we offer will be described in the prospectus supplement relating to such subscription rights.
We may issue subscription rights to our stockholders to purchase common stock. Subscription rights may be issued independently or together with any other offered security and may or may not be transferable by the person purchasing or receiving the subscription rights. We will not offer transferable subscription rights to our stockholders at a price equivalent to less than the then current NAV per share of common stock, taking into account underwriting commissions, unless we first file a post-effective amendment that is declared effective by the SEC with respect to such issuance and the common stock to be purchased in connection with the rights represents no more than one-third of our outstanding common stock at the time such rights are issued. In connection with any subscription rights offering to our stockholders, we may enter into a standby underwriting, backstop or other arrangement with one or more persons pursuant to which such persons would purchase any offered securities remaining unsubscribed for after such subscription rights offering. In connection with a subscription rights offering to our stockholders, we would distribute certificates evidencing the subscription rights and a prospectus supplement to our stockholders on the record date that we set for receiving subscription rights in such subscription rights offering. Our common stockholders will indirectly bear all of the expenses incurred by us in connection with any subscription rights offerings, regardless of whether any common stockholder exercises any subscription rights.
A prospectus supplement will describe the particular terms of any subscription rights we may issue, including the following:
•
the period of time the offering would remain open (which shall be open a minimum number of days such that all record holders would be eligible to participate in the offering and shall not be open longer than 120 days);
•
the title and aggregate number of such subscription rights;
•
the exercise price for such subscription rights (or method of calculation thereof);
•
the currency or currencies, including composite currencies, in which the price of such subscription rights may be payable;
•
if applicable, the designation and terms of the securities with which the subscription rights are issued and the number of subscription rights issued with each such security or each principal amount of such security;
•
the ratio of the offering (which, in the case of transferable rights, will require a minimum of three shares to be held of record before a person is entitled to purchase an additional share);
•
the number of such subscription rights issued to each stockholder;
•
the extent to which such subscription rights are transferable and the market on which they may be traded if they are transferable;
•
the date on which the right to exercise such subscription rights shall commence, and the date on which such right shall expire (subject to any extension);
•
if applicable, the minimum or maximum number of subscription rights that may be exercised at one time;
•
the extent to which such subscription rights include an over-subscription privilege with respect to unsubscribed securities and the terms of such over-subscription privilege;
•
any termination right we may have in connection with such subscription rights offering;
•
the terms of any rights to redeem, or call such subscription rights;
•
information with respect to book-entry procedures, if any;
•
the terms of the securities issuable upon exercise of the subscription rights;
90
•
the material terms of any standby underwriting, backstop or other purchase arrangement that we may enter into in connection with the subscription rights offering;
•
if applicable, a discussion of certain U.S. federal income tax considerations applicable to the issuance or exercise of such subscription rights; and
•
any other terms of such subscription rights, including exercise, settlement and other procedures and limitations relating to the transfer and exercise of such subscription rights.
Each subscription right will entitle the holder of the subscription right to purchase for cash or other consideration such amount of shares of common stock at such subscription price as shall in each case be set forth in, or be determinable as set forth in, the prospectus supplement relating to the subscription rights offered thereby. Subscription rights may be exercised as set forth in the prospectus supplement beginning on the date specified therein and continuing until the close of business on the expiration date for such subscription rights set forth in the prospectus supplement. After the close of business on the expiration date, all unexercised subscription rights will become void.
Upon receipt of payment and the subscription rights certificate properly completed and duly executed at the corporate trust office of the subscription rights agent or any other office indicated in the prospectus supplement we will forward, as soon as practicable, the shares of common stock purchasable upon such exercise. If less than all of the rights represented by such subscription rights certificate are exercised, a new subscription certificate will be issued for the remaining rights. Prior to exercising their subscription rights, holders of subscription rights will not have any of the rights of holders of the securities purchasable upon such exercise. To the extent permissible under applicable law, we may determine to offer any unsubscribed offered securities directly to persons other than stockholders, to or through agents, underwriters or dealers or through a combination of such methods, as set forth in the applicable prospectus supplement.
91
DESCRIPTION OF OUR DEBT SECURITIES
We may issue debt securities in one or more series. The specific terms of each series of debt securities will be described in the particular prospectus supplement relating to that series. The prospectus supplement may or may not modify the general terms found in this prospectus and will be filed with the SEC. For a complete description of the terms of a particular series of debt securities, you should read both this prospectus and the prospectus supplement relating to that series.
As required by federal law for all bonds and notes of companies that are publicly offered, any future debt securities we may issue, are governed by a document called an “indenture.” An indenture is a contract between us and a financial institution acting as trustee on your behalf, and is subject to and governed by the Trust Indenture Act of 1939, as amended. The trustee has two main roles. First, the trustee can enforce your rights against us if we default. There are some limitations on the extent to which the trustee acts on your behalf, described in the second paragraph under “— Events of Default — Remedies if an Event of Default Occurs.” Second, the trustee performs certain administrative duties for us with respect to our debt securities.
Because this section is a summary, it does not describe every aspect of the debt securities and the indenture. We urge you to read the indenture because it, and not this description, defines your rights as a holder of debt securities. We have filed the indenture with the SEC. See “Additional Information” for information on how to obtain a copy of the indenture.
A prospectus supplement, which will accompany this prospectus, will describe the particular terms of any series of debt securities being offered, including, as applicable, the following:
•
the designation or title of the series of debt securities;
•
the total principal amount of the series of debt securities;
•
the percentage of the principal amount at which the series of debt securities will be offered;
•
the date or dates on which principal will be payable;
•
the rate or rates (which may be either fixed or variable) and/or the method of determining such rate or rates of interest, if any;
•
the date or dates from which any interest will accrue, or the method of determining such date or dates, and the date or dates on which any interest will be payable;
•
the terms for redemption, extension or early repayment, if any;
•
the currencies in which the series of debt securities are issued and payable;
•
whether the amount of payments of principal, premium or interest, if any, on a series of debt securities will be determined with reference to an index, formula or other method (which could be based on one or more currencies, commodities, equity indices or other indices) and how these amounts will be determined;
•
the place or places, if any, other than or in addition to the City of New York, of payment, transfer, conversion and/or exchange of the debt securities;
•
the denominations in which the offered debt securities will be issued;
•
the provision for any sinking fund;
•
any restrictive covenants;
•
any Events of Default;
•
whether the series of debt securities are issuable in certificated form;
•
any provisions for defeasance or covenant defeasance;
•
if applicable, a discussion of U.S. federal income tax considerations;
•
whether and under what circumstances we will pay additional amounts in respect of any tax, assessment or governmental charge and, if so, whether we will have the option to redeem the debt securities rather than pay the additional amounts (and the terms of this option);
92
•
any provisions for convertibility or exchangeability of the debt securities into or for any other securities;
•
whether the debt securities are subject to subordination and the terms of such subordination;
•
the listing, if any, on a securities exchange; and
•
any other terms.
Unless the prospectus supplement states otherwise, principal (and premium, if any) and interest, if any, will be paid by us in immediately available funds.
For purposes of this prospectus, any reference to the payment of principal of or premium or interest, if any, on debt securities will include additional amounts if required by the terms of the debt securities.
While any indebtedness and other senior securities remain outstanding, we must make provisions to prohibit any distribution to our stockholders or the repurchase of such securities or shares unless we meet the applicable asset coverage ratios at the time of the distribution or repurchase. We may also borrow amounts up to 5% of the value of our total assets for temporary or emergency purposes without regard to asset coverage. For a discussion of the risks associated with leverage, see “Risk Factors — Risks Relating to Our Business and Structure — Regulations governing our operation as a registered closed-end management investment company affect our ability to raise additional capital and the way in which we do so. The raising of debt capital may expose us to risks, including the typical risks associated with leverage.”
General
The indenture provides that any debt securities proposed to be sold under this prospectus and an attached prospectus supplement, or “offered debt securities,” and any debt securities issuable upon the upon conversion or exchange of other offered securities, or “underlying debt securities,” may be issued under the indenture in one or more series.
The indenture does not limit the amount of debt securities that may be issued thereunder from time to time. Debt securities issued under the indenture, when a single trustee is acting for all debt securities issued under the indenture, are called the “indenture securities.” The indenture also provides that there may be more than one trustee thereunder, each with respect to one or more different series of indenture securities. See “— Resignation of Trustee” section below. At a time when two or more trustees are acting under the indenture, each with respect to only certain series, the term “indenture securities” means the one or more series of debt securities with respect to which each respective trustee is acting. In the event that there is more than one trustee under the indenture, the powers and trust obligations of each trustee described in this prospectus will extend only to the one or more series of indenture securities for which it is trustee. If two or more trustees are acting under the indenture, then the indenture securities for which each trustee is acting would be treated as if issued under separate indentures.
We refer you to the applicable prospectus supplement for information with respect to any deletions from, modifications of or additions to the Events of Default or our covenants that are described below, including any addition of a covenant or other provision providing event risk or similar protection.
We expect that we will usually issue debt securities in book-entry only form represented by global securities.
Additional Debt Securities
Under the 1940 Act and pursuant to the indenture, we may only issue senior securities representing indebtedness that rank in parity with each other with respect to the payment of interest and as to the distribution of assets upon dissolution, liquidation or the winding-up of our affairs. We may also issue additional series of debt securities under the indenture and other debt securities in accordance with the limitations of the 1940 Act. Under the 1940 Act, so long as any debt securities are outstanding, additional debt securities must rank in parity with such securities with respect to the payment of interest and as to the distribution of assets upon dissolution, liquidation or the winding-up of our affairs. In addition, we may also enter certain other evidences of indebtedness (including bank borrowings and commercial paper) representing
93
senior securities. We may also borrow in amounts up to 5% of our total assets if the borrowing is for temporary purposes only (i.e., if it is to be repaid within 60 days and not extended or renewed).
Conversion and Exchange
If any debt securities are convertible into or exchangeable for other securities, the prospectus supplement will explain the terms and conditions of the conversion or exchange, including the conversion price or exchange ratio (or the calculation method), the conversion or exchange period (or how the period will be determined), if conversion or exchange will be mandatory or at the option of the holder or us, provisions for adjusting the conversion price or the exchange ratio and provisions affecting conversion or exchange in the event of the redemption of the underlying debt securities. These terms may also include provisions under which the number or amount of other securities to be received by the holders of the debt securities upon conversion or exchange would be calculated according to the market price of the other securities as of a time stated in the prospectus supplement.
Payment and Paying Agents
Unless the prospectus supplement relating to such debt security states otherwise, we will pay interest to the person listed in the applicable trustee’s records as the owner of the debt security at the close of business on a particular day in advance of each due date for interest, even if that person no longer owns the security on the interest due date. That day, usually about two weeks in advance of the interest due date, is called the “record date.” Because we will pay all the interest for an interest period to the holders on the record date, holders buying and selling the debt security must work out between themselves the appropriate purchase price. The most common manner is to adjust the sales price of the security to prorate interest fairly between buyer and seller based on their respective ownership periods within the particular interest period. This prorated interest amount is called “accrued interest.”
Payments on Global Securities
We will make payments on debt securities so long as they are represented by a global security in accordance with the applicable policies of the depositary as in effect from time to time. Under those policies, we will make payments directly to the depositary, or its nominee, and not to any indirect holders who own beneficial interests in the global security. An indirect holder’s right to those payments will be governed by the rules and practices of the depositary and its participants, as described under “Book-Entry Issuance.”
Payments on Certificated Securities
In the event our debt securities become represented by certificates, unless the prospectus supplement relating to such debt security states otherwise, we will make payments on our debt securities as follows. We will pay interest that is due on an interest payment date by a check mailed on the interest payment date to the securityholder at his or her address shown on the trustee’s records as of the close of business on the record date. We will make all payments of principal and premium, if any, by check at the office of the trustee in New York, New York and/or at other offices that may be specified in the Indenture or a notice to holders against surrender of the security.
Alternatively, if the holder asks us to do so, we will pay any amount that becomes due on a debt security by wire transfer of immediately available funds to an account at a bank in the United States, on the due date. To request payment by wire, the holder must give the trustee appropriate transfer instructions at least 15 business days before the requested wire payment is due. In the case of any interest payment due on an interest payment date, the instructions must be given by the person who is the holder on the relevant regular record date. Any wire instructions, once properly given, will remain in effect unless and until new instructions are given in the manner described above.
Payment When Offices Are Closed
If any payment is due on a debt security on a day that is not a business day, we will make the payment on the next day that is a business day. Payments made on the next business day in this situation will be treated under the indenture as if they were made on the original due date. Such payment will not result in a default
94
under any debt security or the indenture, and no interest will accrue on the payment amount from the original due date to the next day that is a business day.
Book-entry and other indirect holders should consult their banks or brokers for information on how they will receive payments.
Events of Default
You will have rights if an Event of Default occurs in respect of debt securities of your series and is not cured, as described later in this subsection. The term “Event of Default” in respect of the debt securities of your series means any of the following (unless the prospectus supplement relating to such debt security states otherwise):
•
We do not pay the principal of, or any premium on, a debt security of the series when due and payable, and such default is not cured within five days.
•
We do not pay interest on a debt security of the series when due, and such default is not cured within 30 days.
•
We do not deposit any sinking fund payment in respect of debt securities of the series on its due date, and do not cure this default within five days.
•
We remain in breach of any other covenant with respect to debt securities of the series for 60 days after we receive a written notice of default stating we are in breach. The notice must be sent by either the trustee or holders of at least 25% of the principal amount of debt securities of the series.
•
We file for bankruptcy or certain other events of bankruptcy, insolvency or reorganization occur and in the case of certain orders or decrees entered against us under any bankruptcy law, such order or decree remains undischarged or unstayed for a period of 90 days.
•
On the last business day of each of twenty-four consecutive calendar months, all series of our debt securities issued under the indenture together have an asset coverage, as defined in the 1940 Act, of less than 100% after giving effect to exemptive relief, if any, granted to us by the SEC.
•
Any other Event of Default in respect of debt securities of the series described in the applicable prospectus supplement occurs.
An Event of Default for a particular series of debt securities does not necessarily constitute an Event of Default for any other series of debt securities issued under the same or any other indenture. The trustee may withhold notice to the holders of the debt securities of any default, except in the payment of principal or interest, if it in good faith considers the withholding of notice to be in the best interests of the holders.
Remedies if an Event of Default Occurs
If an Event of Default has occurred and is continuing (unless the prospectus supplement relating to such debt security states otherwise), the following remedies are available. The trustee or the holders of not less than 25% in principal amount of the debt securities of the affected series may declare the entire principal amount of all of the debt securities of that series to be due and immediately payable. This is called a declaration of acceleration of maturity. In certain circumstances, a declaration of acceleration of maturity may be canceled by the holders of a majority in principal amount of the debt securities of the affected series if (1) we have deposited with the trustee all amounts due and owing with respect to the debt securities of that series (other than principal that has become due solely by reason of such acceleration) and certain other amounts, and (2) any other Events of Default with respect to that series have been cured or waived.
The trustee is not required to take any action under the indenture at the request of any holders unless the holders offer the trustee protection from expenses and liability reasonably satisfactory to it (called an “indemnity”). If indemnity reasonably satisfactory to the trustee is provided, the holders of a majority in principal amount of the outstanding debt of the relevant series may direct the time, method and place of conducting any lawsuit or other formal legal action seeking any remedy available to the trustee. The trustee may refuse to follow those directions in certain circumstances. No delay or omission in exercising any right or remedy will be treated as a waiver of that right, remedy or Event of Default.
95
Before you are allowed to bypass the trustee and bring your own lawsuit or other formal legal action or take other steps to enforce your rights or protect your interests relating to the debt securities, the following must occur:
•
you must give the applicable trustee written notice that an Event of Default has occurred and remains uncured;
•
the holders of at least 25% in principal amount of all outstanding debt securities of the relevant series must make a written request that the trustee take action because of the default and must offer the trustee reasonable indemnity, security or both against the cost and other liabilities of taking that action;
•
the trustee must not have taken action for 60 days after receipt of the above notice and offer of indemnity and/or security; and
•
the holders of a majority in principal amount of debt securities of the relevant series must not have given the trustee a direction inconsistent with the above notice during that 60-day period.
However, you are entitled at any time to bring a lawsuit for the payment of money due on your debt securities on or after the due date.
Book-entry and other indirect holders should consult their banks or brokers for information on how to give notice or direction to or make a request of the trustee and how to declare or cancel an acceleration of maturity.
Each year, we will furnish to the trustee a written statement of certain of our officers certifying that to their knowledge we are in compliance with the Indenture and the debt securities, or else specifying any default.
Waiver of Default
The holders of a majority in principal amount of the debt securities of the affected series may waive any past defaults other than a default:
•
in the payment of principal or interest; or
•
in respect of a covenant that cannot be modified or amended without the consent of each holder.
Merger or Consolidation
Under the terms of the indenture, we are generally permitted to consolidate or merge with another entity. We are also permitted to sell all or substantially all of our assets to another entity. However, we may not take any of these actions unless all the following conditions are met:
•
where we merge out of existence or convey or transfer all of our assets, the resulting entity must agree to be legally responsible for our obligations under the debt securities;
•
immediately after the transaction, no default or Event of Default will have happened and be continuing;
•
we must deliver certain certificates and documents to the trustee; and
•
we must satisfy any other requirements specified in the prospectus supplement relating to a particular series of debt securities.
Modification or Waiver
There are three types of changes we can make to the indenture and the debt securities issued thereunder.
Changes Requiring Your Approval
First, there are changes that we cannot make to debt securities without specific approval of all of the holders. The following is a list of those types of changes:
•
change the stated maturity of the principal of or interest on a debt security;
•
change the terms of any sinking fund with respect to any debt security;
•
reduce any amounts due on a debt security;
96
•
reduce the amount of principal payable upon acceleration of the maturity of a debt security following a default;
•
change the place or currency of payment on a debt security;
•
impair your right to sue for payment following the date on which such amount is due and payable;
•
reduce the percentage in principal amount of holders of debt securities whose consent is needed to modify or amend the indenture; and
•
reduce the percentage in principal amount of holders of debt securities whose consent is needed to waive compliance with certain provisions of the indenture or to waive certain defaults.
Changes Not Requiring Approval
The second type of change does not require any vote by the securityholders. This type is limited to clarifications and certain other changes that would not materially adversely affect holders of outstanding debt securities in any material respect. We also do not need any approval to make any change that affects only debt securities to be issued under the indenture after the change takes effect.
Changes Requiring Majority Approval
Any other change to the indenture and debt securities would require the following approval:
•
if the change affects only one series of debt securities, it must be approved by the holders of a majority in principal amount of that series; and
•
if the change affects more than one series of debt securities issued under the same indenture, it must be approved by the holders of a majority in principal amount of all of the series affected by the change, with all affected series voting together as one class for this purpose.
In each case, the required approval must be given by written consent.
The holders of a majority in principal amount of all of the series of debt securities issued under the indenture, voting together as one class for this purpose, may waive our compliance with some of our covenants in the indenture. However, we cannot obtain a waiver of a payment default or of any of the matters covered by the bullet points included above under “— Changes Requiring Your Approval.”
Further Details Concerning Voting
When taking a vote, we will use the following rules to decide how much principal to attribute to any notes and any future indebtedness:
•
for original issue discount securities, we will use the principal amount that would be due and payable on the voting date if the maturity of these debt securities were accelerated to that date because of a default;
•
for debt securities whose principal amount is not known (for example, because it is based on an index), we will use a special rule for that debt security described in the prospectus supplement; and
•
for debt securities denominated in one or more foreign currencies, we will use the U.S. dollar equivalent.
Debt securities will not be considered outstanding, and therefore not eligible to vote, if we have deposited or set aside in trust money for their payment or redemption. Debt securities will also not be eligible to vote if they have been fully defeased as described later under “— Defeasance — Full Defeasance.”
We will generally be entitled to set any day as a record date for the purpose of determining the holders of outstanding indenture securities that are entitled to vote or take other action under the indenture. However, the record date may not be more than 30 days before the date of the first solicitation of holders to vote on or take such action. If we set a record date for a vote or other action to be taken by holders of one or more series, that vote or action may be taken only by persons who are holders of outstanding indenture securities on the record date and must be taken within eleven months following the record date.
97
Book-entry and other indirect holders should consult their banks or brokers for information on how approval may be granted or denied if we seek to change the indenture or debt securities or request a waiver.
Satisfaction and Discharge; Defeasance
We may satisfy and discharge our obligations under the indenture by delivering to the trustee for cancellation all outstanding debt securities and by depositing with the trustee after the debt securities have become due and payable, or otherwise, moneys sufficient to pay all of the outstanding debt securities and paying all other sums payable under the indenture by us. Such discharge is subject to terms contained in the Indenture.
Defeasance
The following defeasance provisions will be applicable to each series of debt securities (unless the prospectus supplement relating to such debt security states otherwise). “Defeasance” means that, by depositing with the trustee an amount of cash and/or government securities sufficient to pay all principal and interest, if any, on the debt securities when due and satisfying any additional conditions noted below, we will be deemed to have been discharged from our obligations under the debt securities. In the event of a “covenant defeasance,” upon depositing such funds and satisfying similar conditions discussed below we would be released from certain covenants under the indenture relating to the applicable debt securities. The consequences to the holders of such securities would be that, while they would no longer benefit from certain covenants under the indenture, and while such securities could not be accelerated for any reason, the holders of applicable debt securities nonetheless would be guaranteed to receive the principal and interest owed to them.
Covenant Defeasance
Under current U.S. federal income tax law and the indenture, we can make the deposit described below and be released from some of the restrictive covenants in the indenture under which the particular series was issued. This is called “covenant defeasance.” In that event, you would lose the protection of those restrictive covenants but would gain the protection of having money and government securities set aside in trust to repay your debt securities. In order to achieve covenant defeasance, the following must occur:
•
if the debt securities of a particular series are denominated in U.S. dollars, we must deposit in trust for the benefit of all holders of such securities a combination of cash and U.S. government or U.S. government agency notes or bonds that will generate enough cash to make interest, principal and any other payments on the debt securities on their various due dates;
•
we must deliver to the trustee a legal opinion of our counsel confirming that, under current U.S. federal income tax law, we may make the above deposit without causing you to be taxed on the debt securities any differently than if we did not make the deposit;
•
we must deliver to the trustee a legal opinion and officers’ certificate stating that all conditions precedent to covenant defeasance have been complied with;
•
defeasance must not result in a breach or violation of, or result in a default under, of the indenture or any of our other material agreements or instruments; and
•
no default or Event of Default with respect to the applicable series shall have occurred and be continuing and no defaults or Events of Default related to bankruptcy, insolvency or reorganization shall occur during the next 90 days.
If we accomplish covenant defeasance, you can still look to us for repayment of the debt securities if there were a shortfall in the trust deposit or the trustee is prevented from making payment. In fact, if one of the remaining Events of Default occurred (such as our bankruptcy) and the debt securities became immediately due and payable, there might be a shortfall. Depending on the event causing the default, you may not be able to obtain payment of the shortfall.
Full Defeasance
If there is a change in U.S. federal income tax law, as described below, we can legally release ourselves from all payment and other obligations on the debt securities of a particular series (called “full defeasance”) if we put in place the following other arrangements for you to be repaid:
98
•
if the debt securities of a particular series are denominated in U.S. dollars, we must deposit in trust for the benefit of all holders of such securities a combination of money and U.S. government or U.S. government agency notes or bonds that will generate enough cash to make interest, principal and any other payments on such securities on their various due dates;
•
we must deliver to the trustee a legal opinion confirming that there has been a change in current U.S. federal income tax law or an IRS ruling that allows us to make the above deposit without causing you to be taxed on the debt securities any differently than if we did not make the deposit. Under current U.S. federal income tax law the deposit and our legal release from the debt securities would be treated as though we paid you your share of the cash and notes or bonds at the time the cash and notes or bonds were deposited in trust in exchange for your debt securities and you would recognize gain or loss on the debt securities at the time of the deposit;
•
we must deliver to the trustee a legal opinion and officers’ certificate stating that all conditions precedent to defeasance have been complied with;
•
defeasance must not result in a breach or violation of, or constitute a default under, of the Indenture or any of our other material agreements or instruments; and
•
no default or Event of Default with respect to the applicable series shall have occurred and be continuing and no defaults or Events of Default related to bankruptcy, insolvency or reorganization shall occur during the next 90 days.
If we ever did accomplish full defeasance, as described above, you would have to rely solely on the trust deposit for repayment of the debt securities. You could not look to us for repayment in the unlikely event of any shortfall. Conversely, the trust deposit would most likely be protected from claims of our lenders and other creditors if we ever became bankrupt or insolvent. If your debt securities were effectively subordinated, such subordination would not prevent the trustee under the indenture from applying the funds available to it from the deposit referred to in the first bullet of the preceding paragraph to the payment of amounts due in respect of any notes for the benefit of the subordinated debtholders.
Form, Exchange and Transfer of Certificated Registered Securities
Holders may exchange their certificated securities, if any, for debt securities of smaller denominations or combined into fewer debt securities of larger denominations, as long as the total principal amount is not changed.
Holders may exchange or transfer their certificated securities at the office of the trustee. We have appointed the trustee to act as our agent for registering debt securities in the names of holders transferring debt securities. We may appoint another entity to perform these functions or perform them ourselves.
Holders will not be required to pay a service charge to transfer or exchange their certificated securities, but they may be required to pay any tax or other governmental charge associated with the transfer or exchange. The transfer or exchange will be made only if our transfer agent is satisfied with the holder’s proof of legal ownership.
If we have designated additional transfer agents for your debt security, they will be named in your prospectus supplement. We may appoint additional transfer agents or cancel the appointment of any particular transfer agent. We may also approve a change in the office through which any transfer agent acts.
If we redeem any securities of a particular series, we may block the transfer or exchange of those securities selected for redemption during the period beginning 15 days before the day we mail the notice of redemption and ending on the day of that mailing, in order to determine and fix the list of holders to prepare the mailing. We may also refuse to register transfers or exchanges of any certificated security selected for redemption, except that we will continue to permit transfers and exchanges of the unredeemed portion of any security that will be partially redeemed.
Resignation of Trustee
Each trustee may resign or be removed with respect to one or more series of indenture securities provided that a successor trustee is appointed to act with respect to these series. In the event that two or more persons
99
are acting as trustee with respect to different series of indenture securities under the indenture, each of the trustees will be a trustee of a trust separate and apart from the trust administered by any other trustee.
Concerning the Trustee
The trustee serves as transfer agent for our common stock and the Preferred Stock and agent for our DRIP. We will appoint the trustee as registrar and paying agent under the indenture.
Governing Law
The indenture and our debt securities will be governed by, and construed in accordance with, the laws of the State of New York.
100
BOOK-ENTRY ISSUANCE
Unless otherwise indicated in the applicable prospectus supplement, securities will be issued in the form of one or more global certificates, or “global securities,” registered in the name of a depositary or its nominee. Unless otherwise indicated in the applicable prospectus supplement, the depositary will be The Depository Trust Company, or “DTC.” DTC has informed us that its nominee will be Cede & Co. Accordingly, we expect Cede & Co. to be the initial registered holder of all securities that are issued in global form. No person that acquires a beneficial interest in those securities will be entitled to receive a certificate representing that person’s interest in the securities except as described herein or in the applicable prospectus supplement. Unless and until definitive securities are issued under the limited circumstances described below, all references to actions by holders of securities issued in global form will refer to actions taken by DTC upon instructions from its participants, and all references to payments and notices to holders will refer to payments and notices to DTC or Cede & Co., as the registered holder of these securities.
DTC has informed us that it is a limited-purpose trust company organized under the New York Banking Law, a “banking organization” within the meaning of the New York Banking Law, a member of the Federal Reserve System, a “clearing corporation” within the meaning of the New York Uniform Commercial Code, and a “clearing agency” registered pursuant to the provisions of Section 17A of the Exchange Act. DTC holds and provides asset servicing for over 3.5 million issues of U.S. and non-U.S. equity issues, corporate and municipal debt issues, and money market instruments from over 100 countries that DTC’s participants, or “Direct Participants,” deposit with DTC. DTC also facilitates the post-trade settlement among Direct Participants of sales and other securities transactions in deposited securities through electronic computerized book-entry transfers and pledges between Direct Participants’ accounts. This eliminates the need for physical movement of securities certificates. Direct Participants include both U.S. and non-U.S. securities brokers and dealers, banks, trust companies, clearing corporations and certain other organizations. DTC is a wholly-owned subsidiary of The Depository Trust & Clearing Corporation, or “DTCC.”
DTCC is the holding company for DTC, National Securities Clearing Corporation and Fixed Income Clearing Corporation, all of which are registered clearing agencies. DTCC is owned by the users of its regulated subsidiaries. Access to the DTC system is also available to others such as both U.S. and non-U.S. securities brokers and dealers, banks, trust companies and clearing corporations that clear through or maintain a custodial relationship with a Direct Participant, either directly or indirectly, or “Indirect Participants.” DTC has a S&P rating of AA+. The DTC Rules applicable to its participants are on file with the SEC. More information about DTC can be found at www.dtcc.com.
Purchases of securities under the DTC system must be made by or through Direct Participants, which will receive a credit for the securities on DTC’s records. The ownership interest of each actual purchaser of each security, or the “Beneficial Owner,” is in turn to be recorded on the Direct and Indirect Participants’ records. Beneficial Owners will not receive written confirmation from DTC of their purchase. Beneficial Owners are, however, expected to receive written confirmations providing details of the transaction, as well as periodic statements of their holdings, from the Direct or Indirect Participant through which the Beneficial Owner entered into the transaction. Transfers of ownership interests in the securities are to be accomplished by entries made on the books of Direct and Indirect Participants acting on behalf of Beneficial Owners. Beneficial Owners will not receive certificates representing their ownership interests in the securities, except in the event that use of the book-entry system for the securities is discontinued.
To facilitate subsequent transfers, all securities deposited by Direct Participants with DTC are registered in the name of DTC’s partnership nominee, Cede & Co., or such other name as may be requested by an authorized representative of DTC. The deposit of the securities with DTC and their registration in the name of Cede & Co. or such other DTC nominee do not effect any change in beneficial ownership. DTC has no knowledge of the actual Beneficial Owners of the securities; DTC’s records reflect only the identity of the Direct Participants to whose accounts the securities are credited, which may or may not be the Beneficial Owners. The Direct and Indirect Participants will remain responsible for keeping account of their holdings on behalf of their customers.
Conveyance of notices and other communications by DTC to Direct Participants, by Direct Participants to Indirect Participants, and by Direct Participants and Indirect Participants to Beneficial Owners will be
101
governed by arrangements among them, subject to any statutory or regulatory requirements as may be in effect from time to time.
Redemption notices will be sent to DTC. If less than all of the securities within an issue are being redeemed, DTC’s practice is to determine by lot the amount of the interest of each Direct Participant in such issue to be redeemed.
Neither DTC nor Cede & Co. (nor any other DTC nominee) will consent or vote with respect to securities unless authorized by a Direct Participant in accordance with DTC’s Procedures. Under its usual procedures, DTC mails an Omnibus Proxy to us as soon as possible after the record date. The Omnibus Proxy assigns Cede & Co.’s consenting or voting rights to those Direct Participants to whose accounts securities are credited on the record date (identified in a listing attached to the Omnibus Proxy).
Redemption proceeds, distributions and interest payments on the securities will be made to Cede & Co., or such other nominee as may be requested by an authorized representative of DTC. DTC’s practice is to credit Direct Participants’ accounts upon DTC’s receipt of funds and corresponding detail information from us or the applicable trustee or depositary on the payment date in accordance with their respective holdings shown on DTC’s records. Payments by Participants to Beneficial Owners will be governed by standing instructions and customary practices, as is the case with securities held for the accounts of customers in bearer form or registered in “street name,” and will be the responsibility of such Participant and not of DTC nor its nominee, the applicable trustee or depositary, or us, subject to any statutory or regulatory requirements as may be in effect from time to time. Payment of redemption proceeds, distributions and interest payments to Cede & Co. (or such other nominee as may be requested by an authorized representative of DTC) is the responsibility of us or the applicable trustee or depositary. Disbursement of such payments to Direct Participants will be the responsibility of DTC, and disbursement of such payments to the Beneficial Owners will be the responsibility of Direct and Indirect Participants.
DTC may discontinue providing its services as securities depository with respect to the securities at any time by giving reasonable notice to us or to the applicable trustee or depositary. Under such circumstances, in the event that a successor securities depository is not obtained, certificates are required to be printed and delivered. We may decide to discontinue use of the system of book-entry-only transfers through DTC (or a successor securities depository). In that event, certificates will be printed and delivered to DTC.
The information in this section concerning DTC and DTC’s book-entry system has been obtained from sources that we believe to be reliable, but we take no responsibility for the accuracy thereof.
None of the Company, the Adviser, any registrar and transfer agent, trustee, any depositary, or any agent of any of them, will have any responsibility or liability for any aspect of DTC’s or any participant’s records relating to, or for payments made on account of, beneficial interests in a global security, or for maintaining, supervising or reviewing any records relating to such beneficial interests.
Secondary trading in notes and debentures of corporate issuers is generally settled in clearing-house or next-day funds. In contrast, beneficial interests in a global security, in some cases, may trade in the DTC’s same-day funds settlement system, in which case secondary market trading activity in those beneficial interests would be required by DTC to settle in immediately available funds. There is no assurance as to the effect, if any, that settlement in immediately available funds would have on trading activity in such beneficial interests. Also, settlement for purchases of beneficial interests in a global security upon the original issuance of this security may be required to be made in immediately available funds.
102
PLAN OF DISTRIBUTION
We may offer, from time to time, up to $250,000,000 of our common stock, preferred stock, subscription rights to purchase shares of our common stock, or debt securities in one or more underwritten public offerings, at-the-market offerings, negotiated transactions, block trades, best efforts or a combination of these methods. We may sell securities directly or through agents we designate from time to time. Any underwriter or agent involved in the offer and sale of the securities will be named in the applicable prospectus supplement. A prospectus supplement or supplements will also describe the terms of the offering of the securities, including: the purchase price of the securities and the proceeds, if any, we will receive from the sale; any overallotment options under which underwriters may purchase additional securities from us; any agency fees or underwriting discounts and other items constituting agents’ or underwriters’ compensation; the public offering price; any discounts or concessions allowed or re-allowed or paid to dealers; and any securities exchange or market on which the securities may be listed. Only underwriters named in the prospectus supplement will be underwriters of the securities offered by such prospectus supplement.
The distribution of the securities may be effected from time to time in one or more transactions at a fixed price or prices, which may be changed, at prevailing market prices at the time of sale, at prices related to such prevailing market prices, or at negotiated prices, provided, however, that the offering price per share of our common stock, less any underwriting commissions or discounts, must equal or exceed the NAV per share of our common stock at the time of the offering except (1) in connection with a rights offering to our existing stockholders, (2) with the consent of the majority of our common stockholders, (3) the conversion of a convertible security in accordance with its terms or (4) under such circumstances as the SEC may permit. The price at which securities may be distributed may represent a discount from prevailing market prices.
In connection with the sale of the securities, underwriters or agents may receive compensation from us or from purchasers of the securities, for whom they may act as agents, in the form of discounts, concessions or commissions. Our common stockholders will indirectly bear such fees and expenses as well as any other fees and expenses incurred by us in connection with any sale of securities. Underwriters may sell the securities to or through dealers and such dealers may receive compensation in the form of discounts, concessions or commissions from the underwriters and/or commissions from the purchasers for whom they may act as agents. Underwriters, dealers and agents that participate in the distribution of the securities may be deemed to be underwriters under the Securities Act, and any discounts and commissions they receive from us and any profit realized by them on the resale of the securities may be deemed to be underwriting discounts and commissions under the Securities Act. Any such underwriter or agent will be identified and any such compensation received from us will be described in the applicable prospectus supplement. The maximum aggregate commission or discount to be received by any member of the Financial Industry Regulatory Authority or independent broker-dealer will not be greater than 8% of the gross proceeds of the sale of securities offered pursuant to this prospectus and any applicable prospectus supplement. We may also reimburse the underwriter or agent for certain fees and legal expenses incurred by it.
Any underwriter may engage in overallotment, stabilizing transactions, short-covering transactions and penalty bids in accordance with Regulation M under the Exchange Act. Overallotment involves sales in excess of the offering size, which create a short position. Stabilizing transactions permit bids to purchase the underlying security so long as the stabilizing bids do not exceed a specified maximum price. Syndicate-covering or other short-covering transactions involve purchases of the securities, either through exercise of the overallotment option or in the open market after the distribution is completed, to cover short positions. Penalty bids permit the underwriters to reclaim a selling concession from a dealer when the securities originally sold by the dealer are purchased in a stabilizing or covering transaction to cover short positions. Those activities may cause the price of the securities to be higher than it would otherwise be. If commenced, the underwriters may discontinue any of the activities at any time.
Any underwriters that are qualified market makers on the NYSE may engage in passive market making transactions in our common stock on NYSE in accordance with Regulation M under the Exchange Act, during the business day prior to the pricing of the offering, before the commencement of offers or sales of our common stock. Passive market makers must comply with applicable volume and price limitations and must be identified as passive market makers. In general, a passive market maker must display its bid at a price not in excess of the highest independent bid for such security; if all independent bids are lowered below the passive market maker’s bid, however, the passive market maker’s bid must then be lowered when certain purchase
103
limits are exceeded. Passive market making may stabilize the market price of the securities at a level above that which might otherwise prevail in the open market and, if commenced, may be discontinued at any time.
We may sell securities directly or through agents we designate from time to time. We will name any agent involved in the offering and sale of securities and we will describe any commissions we will pay the agent in the applicable prospectus supplement. Unless the prospectus supplement states otherwise, our agent will act on a best-efforts basis for the period of its appointment.
Unless otherwise specified in the applicable prospectus supplement, each series of securities will be a new issue with no trading market, other than our common stock, which is traded on the NYSE. We may elect to list any other series of securities on any exchanges, but we are not obligated to do so. We cannot guarantee the liquidity of the trading markets for any securities.
Under agreements that we may enter, underwriters, dealers and agents who participate in the distribution of shares of our securities may be entitled to indemnification by us against certain liabilities, including liabilities under the Securities Act, or contribution with respect to payments that the agents or underwriters may make with respect to these liabilities. Underwriters, dealers and agents may engage in transactions with, or perform services for, us in the ordinary course of business.
If so indicated in the applicable prospectus supplement, we will authorize underwriters or other persons acting as our agents to solicit offers by certain institutions to purchase our securities from us pursuant to contracts providing for payment and delivery on a future date. Institutions with which such contracts may be made include commercial and savings banks, insurance companies, pension funds, investment companies, educational and charitable institutions and others, but in all cases such institutions must be approved by us. The obligations of any purchaser under any such contract will be subject to the condition that the purchase of our securities shall not at the time of delivery be prohibited under the laws of the jurisdiction to which such purchaser is subject. The underwriters and such other agents will not have any responsibility in respect of the validity or performance of such contracts. Such contracts will be subject only to those conditions set forth in the prospectus supplement, and the prospectus supplement will set forth the commission payable for solicitation of such contracts.
We may enter into Derivative Transactions with third parties, or sell securities not covered by this prospectus to third parties in privately negotiated transactions. If the applicable prospectus supplement indicates, in connection with those derivatives, the third parties may sell securities covered by this prospectus and the applicable prospectus supplement, including in short sale transactions. If so, the third party may use securities pledged by us or borrowed from us or others to settle those sales or to close out any related open borrowings of stock, and may use securities received from us in settlement of those derivatives to close out any related open borrowings of stock. The third parties in such sale transactions will be underwriters and, if not identified in this prospectus, will be identified in the applicable prospectus supplement.
In order to comply with the securities laws of certain states, if applicable, our securities offered hereby will be sold in such jurisdictions only through registered or licensed brokers or dealers.
104
REGULATION AS A CLOSED-END MANAGEMENT INVESTMENT COMPANY
General
As a registered closed-end management investment company, we are subject to regulation under the 1940 Act. Under the 1940 Act, unless authorized by vote of a majority of our outstanding voting securities, we may not:
•
change our classification to an open-end management investment company;
•
alter any of our fundamental policies, which are set forth below in “— Investment Restrictions”; or
•
change the nature of our business so as to cease to be an investment company.
A majority of the outstanding voting securities of a company is defined under the 1940 Act as the lesser of: (a) 67% or more of such company’s voting securities present at a meeting if more than 50% of the outstanding voting securities of such company are present or represented by proxy, or (b) more than 50% of the outstanding voting securities of such company.
As with other companies regulated by the 1940 Act, a registered closed-end management investment company must adhere to certain substantive regulatory requirements. A majority of our directors must be persons who are not “interested persons” of us, as that term is defined in the 1940 Act. We are required to provide and maintain a bond issued by a reputable fidelity insurance company to protect the closed-end management investment company. Furthermore, as a registered closed-end management investment company, we are prohibited from protecting any director or officer against any liability to us or our stockholders arising from willful misfeasance, bad faith, gross negligence or reckless disregard of the duties involved in the conduct of such person’s office. We may also be prohibited under the 1940 Act from knowingly participating in certain transactions with our affiliates absent exemptive relief or other prior approval by the SEC.
We will generally not be able to issue and sell shares of our common stock at a price below the then current NAV per share (exclusive of any distributing commission or discount). See “Risk Factors — Risks Relating to Our Business and Structure — Regulations governing our operation as a registered closed-end management investment company affect our ability to raise additional capital and the way in which we do so. The raising of debt capital may expose us to risks, including the typical risks associated with leverage.” We may, however, sell shares of our common stock at a price below the then current NAV per share if our board of directors determines that such sale is in our best interests and the best interests of our stockholders, and the holders of a majority of the shares of our common stock, approves such sale. In addition, we may generally issue new shares of our common stock at a price below NAV in rights offerings to existing stockholders, in payment of dividends and in certain other limited circumstances.
Investment Restrictions
Our investment objectives and our investment policies and strategies described in this prospectus, except for the eight investment restrictions designated as fundamental policies under this caption, are not fundamental and may be changed by the board of directors without stockholder approval.
As referred to above, the following eight investment restrictions are designated as fundamental policies and, as such, cannot be changed without the approval of the holders of a majority of our outstanding voting securities:
(1)
We may not borrow money, except as permitted by (i) the 1940 Act, or interpretations or modifications by the SEC, SEC staff or other authority with appropriate jurisdiction, or (ii) exemptive or other relief or permission from the SEC, SEC staff or other authority with appropriate jurisdiction;
(2)
We may not engage in the business of underwriting securities issued by others, except to the extent that we may be deemed to be an underwriter in connection with the disposition of portfolio securities;
105
(3)
We may not purchase or sell physical commodities or contracts for the purchase or sale of physical commodities. Physical commodities do not include futures contracts with respect to securities, securities indices, currency or other financial instruments;
(4)
We may not purchase or sell real estate, which term does not include securities of companies which deal in real estate or mortgages or investments secured by real estate or interests therein, except that we reserve freedom of action to hold and to sell real estate acquired as a result of our ownership of securities;
(5)
We may not make loans, except to the extent permitted by (i) the 1940 Act, or interpretations or modifications by the SEC, SEC staff or other authority with appropriate jurisdiction, or (ii) exemptive or other relief or permission from the SEC, SEC staff or other authority with appropriate jurisdiction. For purposes of this investment restriction, the purchase of debt obligations (including acquisitions of loans, loan participations or other forms of debt instruments) shall not constitute loans by us;
(6)
We may not issue senior securities, except to the extent permitted by (i) the 1940 Act, or interpretations or modifications by the SEC, the SEC staff or other authority with appropriate jurisdiction, or (ii) exemptive or other relief or permission from the SEC, SEC staff or other authority with appropriate jurisdiction;
(7)
We may not invest in any security if as a result of such investment, 25% or more of the value of our total assets, taken at market value at the time of each investment, are in the securities of issuers in any particular industry or group of industries except (a) securities issued or guaranteed by the U.S. government and its agencies and instrumentalities or tax-exempt securities of state and municipal governments or their political subdivisions (however, not including private purpose industrial development bonds issued on behalf of non-government issuers), or (b) as otherwise provided by the 1940 Act, as amended from time to time, and as modified or supplemented from time to time by (i) the rules and regulations promulgated by the SEC under the 1940 Act, as amended from time to time, and (ii) any exemption or other relief applicable to us from the provisions of the 1940 Act, as amended from time to time. For purposes of this restriction, in the case of investments in loan participations between us and a bank or other lending institution participating out the loan, we will treat both the lending bank or other lending institution and the borrower as “issuers.” For purposes of this restriction, an investment in a CLO, CBO, CDO or a swap or other derivative will be considered to be an investment in the industry or group of industries (if any) of the underlying or reference security, instrument or asset; and
(8)
We may not engage in short sales, purchases on margin, or the writing of put or call options, except as permitted by (i) the 1940 Act, or interpretations or modifications by the SEC, SEC staff or other authority with appropriate jurisdiction or (ii) exemptive or other relief or permission from the SEC, SEC staff or other authority with appropriate jurisdiction.
The latter part of certain of our fundamental investment restrictions (i.e., the references to “except to the extent permitted by (i) the 1940 Act, or interpretations or modifications by the SEC, the SEC staff or other authority with appropriate jurisdiction, or (ii) exemptive or other relief or permission from the SEC, SEC staff or other authority with appropriate jurisdiction”) provides us with flexibility to change our limitations in connection with changes in applicable law, rules, regulations or exemptive relief. The language used in these restrictions provides the necessary flexibility to allow our board of directors to respond efficiently to these kinds of developments without the delay and expense of a stockholder meeting.
Whenever an investment policy or investment restriction set forth in this prospectus states a maximum percentage of assets that may be invested in any security or other asset or describes a policy regarding quality standards, such percentage limitation or standard shall be determined immediately after and as a result of our acquisition of such security or asset. Accordingly, any later increase or decrease resulting from a change in values, assets or other circumstances or any subsequent rating change made by a rating agency (or as determined by the Adviser if the security is not rated by a rating agency) will not compel us to dispose of such security or other asset. Notwithstanding the foregoing, we must always be in compliance with the borrowing policies set forth above.
106
Proxy Voting Policies and Procedures
We have delegated our proxy voting responsibility to the Adviser. The Proxy Voting Policies and Procedures of the Adviser are set forth below. The guidelines will be reviewed periodically by the Adviser and our independent directors, and, accordingly, are subject to change. For purposes of these Proxy Voting Policies and Procedures described below, “we,” “our” and “us” refers to the Adviser.
Introduction
An investment adviser registered under the Advisers Act has a fiduciary duty to act solely in the best interests of its clients. As part of this duty, we recognize that we must vote client securities in a timely manner free of conflicts of interest and in the best interests of our clients.
These policies and procedures for voting proxies for our investment advisory clients are intended to comply with Section 206 of, and Rule 206(4)-6 under, the Advisers Act.
Proxy Policies
Based on the nature of our investment strategy, we do not expect to receive proxy proposals but may from time to time receive amendments, consents or resolutions applicable to investments held by us. It is our general policy to exercise our voting or consent authority in a manner that serves the interests of the Company’s stockholders. We may occasionally be subject to material conflicts of interest in voting proxies due to business or personal relationships we maintain with persons having an interest in the outcome of certain votes. If at any time we become aware of a material conflict of interest relating to a particular proxy proposal, our chief compliance officer will review the proposal and determine how to vote the proxy in a manner consistent with interests of the Company’s stockholders.
Proxy Voting Records
Information regarding how we voted proxies relating to portfolio securities during the most recent 12-month period ended June 30 is available, without charge: (1) upon request, by calling toll free (844) 810-6501; and (2) on the SEC’s website at http://www.sec.gov. You may also obtain information about how we voted proxies by making a written request for proxy voting information to: Eagle Point Income Management LLC, 600 Steamboat Road, Suite 202, Greenwich, CT 06830.
Privacy Policy
We are committed to protecting your privacy. This privacy notice explains our privacy policies and those of our affiliated companies. The terms of this notice apply to both current and former stockholders. We safeguard, according to strict standards of security and confidentiality, all information we receive about you. With regard to this information, we maintain procedural safeguards that are reasonably designed to comply with federal standards. We have implemented procedures that are designed to restrict access to your personal information to authorized employees of the Adviser, the Administrator and their affiliates who need to know your personal information to perform their jobs, and in connection with servicing your account. Our goal is to limit the collection and use of information about you. While we may share your personal information with our affiliates in connection with servicing your account, our affiliates are not permitted to share your information with non-affiliated entities, except as permitted or required by law.
When you purchase shares of our common stock and in the course of providing you with products and services, we and certain of our service providers, such as a transfer agent, may collect personal information about you, such as your name, address, social security number or tax identification number. This information may come from sources such as account applications and other forms, from other written, electronic or verbal correspondence, from your transactions, from your brokerage or financial advisory firm, financial adviser or consultant, and/or information captured on applicable websites.
We do not disclose any personal information provided by you or gathered by us to non-affiliated third parties, except as permitted or required by law or for our everyday business purposes, such as to process transactions or service your account. For example, we may share your personal information in order to send you annual and semiannual reports, proxy statements and other information required by law, and to send you
107
information we believe may be of interest to you. We may disclose your personal information to unaffiliated third party financial service providers (which may include a custodian, transfer agent, accountant or financial printer) who need to know that information in order to provide services to you or to us. These companies are required to protect your information and use it solely for the purpose for which they received it or as otherwise permitted by law. We may also provide your personal information to your brokerage or financial advisory firm and/or to your financial adviser or consultant, as well as to professional advisors, such as accountants, lawyers and consultants.
We reserve the right to disclose or report personal or account information to non-affiliated third parties in limited circumstances where we believe in good faith that disclosure is required by law, such as in accordance with a court order or at the request of government regulators or law enforcement authorities or to protect our rights or property. We may also disclose your personal information to a non-affiliated third party at your request or if you consent in writing to the disclosure.
108
ADDITIONAL INVESTMENTS AND TECHNIQUES
Our primary investment strategies are described elsewhere in this prospectus. The following is a description of the various investment policies that may be engaged in as a secondary strategy, and a summary of certain attendant risks.
Investment in Debt Securities, Other Types of Credit Instruments and Other Credit Investments
Debt Securities. We may invest in debt securities, including debt securities rated below investment grade, or “junk” securities. Debt securities of corporate and governmental issuers in which we may invest are subject to the risk of an issuer’s inability to meet principal and interest payments on the obligations (credit risk) and also may be subject to price volatility due to such factors as interest rate sensitivity, market perception of the creditworthiness of the issuer and general market liquidity (market risk).
Defaulted Securities. We may invest in defaulted securities. The risk of loss due to default may be considerably greater with lower-quality securities because they are generally unsecured and are often subordinated to other debt of the issuer. Investing in defaulted debt securities involves risks such as the possibility of complete loss of the investment where the issuer does not restructure to enable it to resume principal and interest payments. If the issuer of a security in our portfolio defaults, we may have unrealized losses on the security, which may lower our NAV. Defaulted securities tend to lose much of their value before they default. Thus, our NAV may be adversely affected before an issuer defaults. In addition, we may incur additional expenses if it must try to recover principal or interest payments on a defaulted security.
Certificates of Deposit, Bankers’ Acceptances and Time Deposits. We may acquire certificates of deposit, bankers’ acceptances and time deposits. Certificates of deposit are negotiable certificates issued against funds deposited in a commercial bank for a definite period of time and earning a specified return. Bankers’ acceptances are negotiable drafts or bills of exchange, normally drawn by an importer or exporter to pay for specific merchandise, which are “accepted” by a bank, meaning in effect that the bank unconditionally agrees to pay the face value of the instrument on maturity. Certificates of deposit and bankers’ acceptances acquired by us will be dollar-denominated obligations of domestic banks, savings and loan associations or financial institutions at the time of purchase, have capital, surplus and undivided profits in excess of $100 million (including assets of both domestic and foreign branches), based on latest published reports, or less than $100 million if the principal amount of such bank obligations are fully insured by the U.S. government. In addition to purchasing certificates of deposit and bankers’ acceptances, to the extent permitted under our investment objectives and policies stated in this prospectus, we may make interest-bearing time or other interest-bearing deposits in commercial or savings banks. Time deposits are non-negotiable deposits maintained at a banking institution for a specified period of time at a specified interest rate.
Commercial Paper and Short-Term Notes. We may invest a portion of our assets in commercial paper and short-term notes. Commercial paper consists of unsecured promissory notes issued by corporations. Issues of commercial paper and short-term notes will normally have maturities of less than nine months and fixed rates of return, although such instruments may have maturities of up to one year. Commercial paper and short-term notes will consist of issues rated at the time of purchase “A-2” or higher by S&P, “Prime-1” or “Prime-2” by Moody’s, or similarly rated by another nationally recognized statistical rating organization or, if unrated, will be determined by the Adviser to be of comparable quality.
CLO Class M Notes, Fee Notes and Participation Agreements. We may acquire CLO Class M notes, fee notes and participation agreements with CLO collateral managers. There is not an active secondary market for CLO Class M notes, fee notes and participation agreements. Further, CLO Class M notes, fee notes and participation agreements may have significant restrictions on transfer and require continued ownership of certain amounts of CLO equity in the related CLO for the instrument to be valid. CLO Class M notes, fee notes and participation agreements are also subject to the risk of early call of the CLO, and may have no make-whole or other yield protection provisions.
Zero Coupon Securities. Among the debt securities in which we may invest are zero coupon securities. Zero coupon securities are debt obligations that do not entitle the holder to any periodic payment of interest prior to maturity or a specified date when the securities begin paying current interest. They are issued and traded at a discount from their face amount or par value, which discount varies depending on the time
109
remaining until cash payments begin, prevailing interest rates, liquidity of the security and the perceived credit quality of the issuer. The market prices of zero coupon securities generally are more volatile than the prices of securities that pay interest periodically and in cash and are likely to respond to changes in interest rates to a greater degree than do other types of debt securities having similar maturities and credit quality. Original issue discount earned on zero coupon securities must be included in our income. Thus, to quality for tax treatment as a RIC and to avoid a certain excise tax on undistributed income, we may be required to distribute as a dividend an amount that is greater than the total amount of cash we actually receive. These distributions must be made from our cash assets or, if necessary, from the proceeds of sales of portfolio securities. We will not be able to purchase additional income-producing securities with cash used to make such distributions, and our current income ultimately could be reduced as a result.
U.S. Government Securities. We may invest in debt securities issued or guaranteed by agencies, instrumentalities and sponsored enterprises of the U.S. Government. Some U.S. government securities, such as U.S. Treasury bills, notes and bonds, and mortgage-related securities guaranteed by the Government National Mortgage Association, are supported by the full faith and credit of the U.S.; others, such as those of the Federal Home Loan Banks, or “FHLBs,” or the Federal Home Loan Mortgage Corporation, or “FHLMC,” are supported by the right of the issuer to borrow from the U.S. Treasury; others, such as those of the Federal National Mortgage Association, or “FNMA,” are supported by the discretionary authority of the U.S. Government to purchase the agency’s obligations; and still others, such as those of the Student Loan Marketing Association, are supported only by the credit of the issuing agency, instrumentality or enterprise. Although U.S. Government-sponsored enterprises, such as the FHLBs, FHLMC, FNMA and the Student Loan Marketing Association, may be chartered or sponsored by Congress, they are not funded by Congressional appropriations, and their securities are not issued by the U.S. Treasury or supported by the full faith and credit of the U.S. Government and involve increased credit risks. Although legislation has been enacted to support certain government sponsored entities, including the FHLBs, FHLMC and FNMA, there is no assurance that the obligations of such entities will be satisfied in full, or that such obligations will not decrease in value or default. It is difficult, if not impossible, to predict the future political, regulatory or economic changes that could impact the government sponsored entities and the values of their related securities or obligations. In addition, certain governmental entities, including FNMA and FHLMC, have been subject to regulatory scrutiny regarding their accounting policies and practices and other concerns that may result in legislation, changes in regulatory oversight and/or other consequences that could adversely affect the credit quality, availability or investment character of securities issued by these entities. U.S. Government debt securities generally involve lower levels of credit risk than other types of debt securities of similar maturities, although, as a result, the yields available from U.S. Government debt securities are generally lower than the yields available from such other securities. Like other debt securities, the values of U.S. government securities change as interest rates fluctuate. Fluctuations in the value of portfolio securities will not affect interest income on existing portfolio securities but will be reflected in our NAV.
Distressed Securities
We may invest in distressed investments including loans, loan participations, or bonds, many of which are not publicly traded and which may involve a substantial degree of risk. In certain periods, there may be little or no liquidity in the markets for these securities or instruments. In addition, the prices of such securities or instruments may be subject to periods of abrupt and erratic market movements and above-average price volatility. It may be more difficult to value such securities and the spread between the bid and asked prices of such securities may be greater than normally expected. If the Adviser’s evaluation of the risks and anticipated outcome of an investment in a distressed security should prove incorrect, we may lose a substantial portion or all of our investment or we may be required to accept cash or securities with a value less than our original investment.
Equity Securities
We may hold long and short positions in common stock, preferred stock and convertible securities of U.S. and non-U.S. issuers. We also may invest in depositary receipts or shares relating to non-U.S. securities. Equity securities fluctuate in value, often based on factors unrelated to the fundamental economic condition of the issuer of the securities, including general economic and market conditions, and these fluctuations can be pronounced. We may purchase securities in all available securities trading markets and may invest in equity
110
securities without restriction as to market capitalization, such as those issued by smaller capitalization companies, including micro-cap companies.
Exchange-Traded Notes (“ETNs”)
We may invest in ETNs. ETNs are a type of senior, unsecured, unsubordinated debt security issued by financial institutions that combines both aspects of bonds and Exchange-Traded Funds, or “ETFs.” An ETN’s returns are based on the performance of a market index minus fees and expenses. Similar to ETFs, ETNs are listed on an exchange and traded in the secondary market. However, unlike an ETF, an ETN can be held until the ETN’s maturity, at which time the issuer will pay a return linked to the performance of the market index to which the ETN is linked minus certain fees. Unlike regular bonds, ETNs do not make periodic interest payments and principal is not protected. ETNs are subject to credit risk and the value of an ETN may drop due to a downgrade in the issuer’s credit rating, despite the underlying market benchmark or strategy remaining unchanged. The value of an ETN may also be influenced by time to maturity, level of supply and demand for the ETN, volatility and lack of liquidity in underlying assets, changes in the applicable interest rates, changes in the issuer’s credit rating, and economic, legal, political, or geographic events that affect the referenced underlying asset. When we invest in ETNs we will bear our proportionate share of any fees and expenses borne by the ETN. Our decision to sell our ETN holdings may be limited by the availability of a secondary market. In addition, although an ETN may be listed on an exchange, the issuer may not be required to maintain the listing and there can be no assurance that a secondary market will exist for an ETN.
Preferred Securities
Preferred securities in which we may invest include trust preferred securities, monthly income preferred securities, quarterly income bond securities, quarterly income debt securities, quarterly income preferred securities, corporate trust securities, traditional preferred stock, contingent-capital securities, hybrid securities (which have characteristics of both equity and fixed-income instruments) and public income notes. Preferred securities are typically issued by corporations, generally in the form of interest-bearing notes or preferred securities, or by an affiliated business trust of a corporation, generally in the form of beneficial interests in subordinated debentures or similarly structured securities. The preferred securities market consists of both fixed and adjustable coupon rate securities that are either perpetual in nature in that they have no maturity dates or have stated maturity dates.
Investment in Relatively New Issuers
We may invest in the securities of new issuers. Investments in relatively new issuers, i.e., those having continuous operating histories of less than three years, may carry special risks and may be more speculative because such issuers are relatively unseasoned. Such issuers may also lack sufficient resources, may be unable to generate internally the funds necessary for growth and may find external financing to be unavailable on favorable terms or even totally unavailable. Certain issuers may be involved in the development or marketing of a new product with no established market, which could lead to significant losses. Securities of such issuers may have a limited trading market which may adversely affect their disposition and can result in their being priced lower than might otherwise be the case. If other investors who invest in such issuers seek to sell the same securities when we attempt to dispose of our holdings, we may receive lower prices than might otherwise be the case.
Demand Deposit Accounts
We may hold a significant portion of our cash assets in interest-bearing or non-interest-bearing demand deposit accounts at our custodian or another depository institution insured by the FDIC. The FDIC is an independent agency of the U.S. government, and FDIC deposit insurance is backed by the full faith and credit of the U.S. government. We expect to hold cash that exceeds the amounts insured by the FDIC for such accounts. As a result, in the event of a failure of a depository institution where we hold such cash, our cash is subject to the risk of loss.
Simultaneous Investments
Investment decisions, made by the Adviser on our behalf, are made independently from those of the other funds and accounts advised by the Adviser and its affiliates. If, however, such other accounts wish to
111
invest in, or dispose of, the same securities as us, available investments will be allocated equitably between us and other accounts. This procedure may adversely affect the size of the position we obtain or dispose of or the price we pay.
Short Sales
When we engage in a short sale of a security, we must, to the extent required by law, borrow the security sold short and deliver it to the counterparty. We may have to pay a fee to borrow particular securities and would often be obligated to pay over any payments received on such borrowed securities.
If the price of the security sold short increases between the time of the short sale and the time that we replace the borrowed security, we will incur a loss; conversely, if the price declines, we will realize a capital gain. Any gain will be decreased, and any loss increased, by the transaction costs described above.
To the extent we engage in short sales, we will comply with the applicable provisions of Rule 18f-4 with respect to such transactions.
112
CONTROL PERSONS AND PRINCIPAL STOCKHOLDERS
A control person is a person who beneficially owns more than 25% of the voting securities of a company. The following table sets forth certain ownership information with respect to shares of our common stock held by (1) those persons who directly or indirectly own, control or hold with the power to vote, 5% or more of the outstanding shares of our common stock, and (2) all of our officers and directors, as a group. The table shows such ownership as of May 31, 2023.
| | | | Common Stock Beneficially Owned(1) Immediately Prior to Offering | | | Preferred Stock Beneficially Owned(1) Immediately Prior to Offering | | ||||||||||||||||||
Name and Address | | | Number | | | % | | | Number | | | % | | ||||||||||||
| 5% Owners | | | | | | | | | | | | | | | | | | | | | | | | | |
Enstar Group Limited(2) | | | | | 3,764,580 | | | | | | 43.8% | | | | | | — | | | | | | — | | |
Karpus Management, Inc.(3) | | | | | — | | | | | | — | | | | | | 183,386 | | | | | | 12.1% | | |
(1)
Beneficial ownership is determined in accordance with the rules of the SEC and includes voting or investment power with respect to the securities.
(2)
The number of shares beneficially owned is based on a Schedule 13G filed on February 14, 2023. Enstar Group Limited has shared voting power and shared dispositive power over 3,764,580 shares of our Common Stock. Enstar Holdings (US) LLC, a wholly-owned subsidiary of Enstar Group Limited, has shared voting power and shared dispositive power over 1,143,982 shares of our Common Stock. Clarendon National Insurance Company, a wholly-owned subsidiary of Enstar Group Limited, has shared voting power and shared dispositive power over 1,731,290 shares of our Common Stock. Cavello Bay Reinsurance Limited, a wholly-owned subsidiary of Enstar Group Limited, has shared voting power and shared dispositive power over 235,286 shares of our Common Stock. Yosemite Insurance Company, a wholly-owned subsidiary of Enstar Group Limited, has shared voting power and shared dispositive power over 654,022 shares of our Common Stock. The address of Enstar Group Limited is P.O. Box HM 2267, Windsor Place, 3rd Floor, 22 Queen Street, Hamilton, Bermuda HM JX.
(3)
The number of shares beneficially owned is based on a Schedule 13G filed on February 14, 2023, reflecting sole voting and dispositive power with respect to 183,386 shares. The address of Karpus Management, Inc. is 183 Sully’s Trail, Pittsford, NY 14534.
All directors and officers of the Company as a group own less than 1.0% of each of our outstanding Common Stock and our outstanding Preferred Stock.
113
BROKERAGE ALLOCATION
Since we acquire and dispose of most of our investments in privately negotiated transactions or in the over-the-counter markets, we are generally not required to pay a stated brokerage commission. However, to the extent a broker-dealer is involved in a transaction, the price paid or received by us, as applicable, may reflect a mark-up or mark-down. Subject to policies established by our board of directors, the Adviser will be primarily responsible for selecting brokers and dealers to execute transactions with respect to the publicly traded securities portion of our portfolio transactions and the allocation of brokerage commissions. The Adviser does not expect to execute transactions through any particular broker or dealer but will seek to obtain the best net results for us under the circumstances, taking into account such factors as price (including the applicable brokerage commission or dealer spread), size of order, difficulty of execution and operational facilities of the firm and the firm’s risk and skill in positioning blocks of securities. The Adviser generally will seek reasonably competitive trade execution costs but will not necessarily pay the lowest spread or commission available. Subject to applicable legal requirements and consistent with Section 28(e) of the Exchange Act, the Adviser may select a broker based upon brokerage or research services provided. In return for such services, we may pay a higher commission than other brokers would charge if the Adviser determines in good faith that such commission is reasonable in relation to the services provided.
LEGAL MATTERS
Certain legal matters in connection with the securities offered by this prospectus will be passed upon for us by Dechert LLP, Boston, Massachusetts. Dechert LLP also represents the Adviser.
CUSTODIAN AND TRANSFER AGENT
Our portfolio securities are held pursuant to a custodian agreement between us and Wells Fargo Bank, National Association. The principal business address of Wells Fargo Bank, National Association is 9062 Old Annapolis Road, Columbia, MD 21045.
American Stock Transfer & Trust Company, LLC serves as our transfer agent, registrar, dividend disbursement agent and stockholder servicing agent, as well as agent for our DRIP. The principal business address of American Stock & Transfer Company, LLC is 6201 15th Avenue, Brooklyn, NY 11219.
INDEPENDENT REGISTERED PUBLIC ACCOUNTING FIRM
KPMG LLP, an independent registered public accounting firm located at 345 Park Avenue, New York, NY 10154, provides audit services, tax return preparation, and assistance and consultation with respect to the preparation of filings with the SEC.
ADDITIONAL INFORMATION
We file with or submit to the SEC annual and semi-annual reports, proxy statements and other information meeting the informational requirements of the Exchange Act. The SEC maintains a website that contains reports, proxy and information statements and other information we file with the SEC at www.sec.gov.This information is also available free of charge by writing us at Eagle Point Income Company Inc., 600 Steamboat Road, Suite 202, Greenwich, CT 06830, Attention: Investor Relations, by telephone at (844) 810-6501, or on our website at www.eaglepointincome.com. Information on our website is not incorporated by reference into or a part of this prospectus.
Unresolved Staff Comments: Not Applicable.
INCORPORATION BY REFERENCE
As noted above, this prospectus is part of a registration statement that we have filed with the SEC. We are allowed to “incorporate by reference” the information that we file with the SEC, which means that we can disclose important information to you by referring you to those documents. The information incorporated by reference is considered to be part of this prospectus, and later information that we file with the SEC will automatically update and supersede this information.
114
We incorporate by reference any future filings (including those made after the date of the filing of the registration statement of which this prospectus is a part) we will make with the SEC under Sections 13(a), 13(c), 14, or 15(d) of the Exchange Act or pursuant to Rule 30b2-1 under the 1940 Act including any filings on or after the date of this prospectus from the date of filing (excluding any information furnished, rather than filed), until we have sold all of the offered securities to which this prospectus and any accompanying prospectus supplement relates or the offering is otherwise terminated. The information incorporated by reference is an important part of this prospectus. Any statement in a document incorporated by reference into this prospectus will be deemed to be automatically modified or superseded to the extent a statement contained in (1) this prospectus or (2) any other subsequently filed document that is incorporated by reference into this prospectus modifies or supersedes such statement. The documents incorporated by reference herein include:
•
our Annual Report on Form N-CSR, as amended, for the fiscal year ended December 31, 2022, filed with the SEC on February 24, 2023;
•
our Definitive Proxy Statement on Schedule 14A for the annual meeting of the stockholders, filed with the SEC on April 12, 2023;
•
our interim report filed pursuant to Rule 30b2-1 under the 1940 Act for the quarter ended March 31, 2023, filed with the SEC on May 23, 2023; and
•
our Current Report on Form 8-K filed on June 12, 2023.
The Company will provide without charge to each person, including any beneficial owner, to whom this prospectus is delivered, upon written or oral request, a copy of any and all of the documents that have been or may be incorporated by reference in this prospectus or the accompanying prospectus supplement.
All filings filed by the Company pursuant to the Exchange Act or pursuant to Rule 30b2-1 under the 1940 Act after the date of filing of the registration statement and prior to effectiveness of the registration statement shall be deemed to be incorporated by reference into this prospectus.
115

Eagle Point Income Company Inc.
$75,000,000 of Common Stock
Up to 1,000,000 Shares of 5.00% Series A Term Preferred Stock due 2026
Up to 1,000,000 Shares of 7.75% Series B Term Preferred Stock due 2028
Liquidation Preference $25 per share
Up to 1,000,000 Shares of 7.75% Series B Term Preferred Stock due 2028
Liquidation Preference $25 per share
PROSPECTUS SUPPLEMENT
August 22, 2023
B. Riley Securities