Exhibit 99.1

Atlas Technical Consultants Reports First Quarter 2022 Results
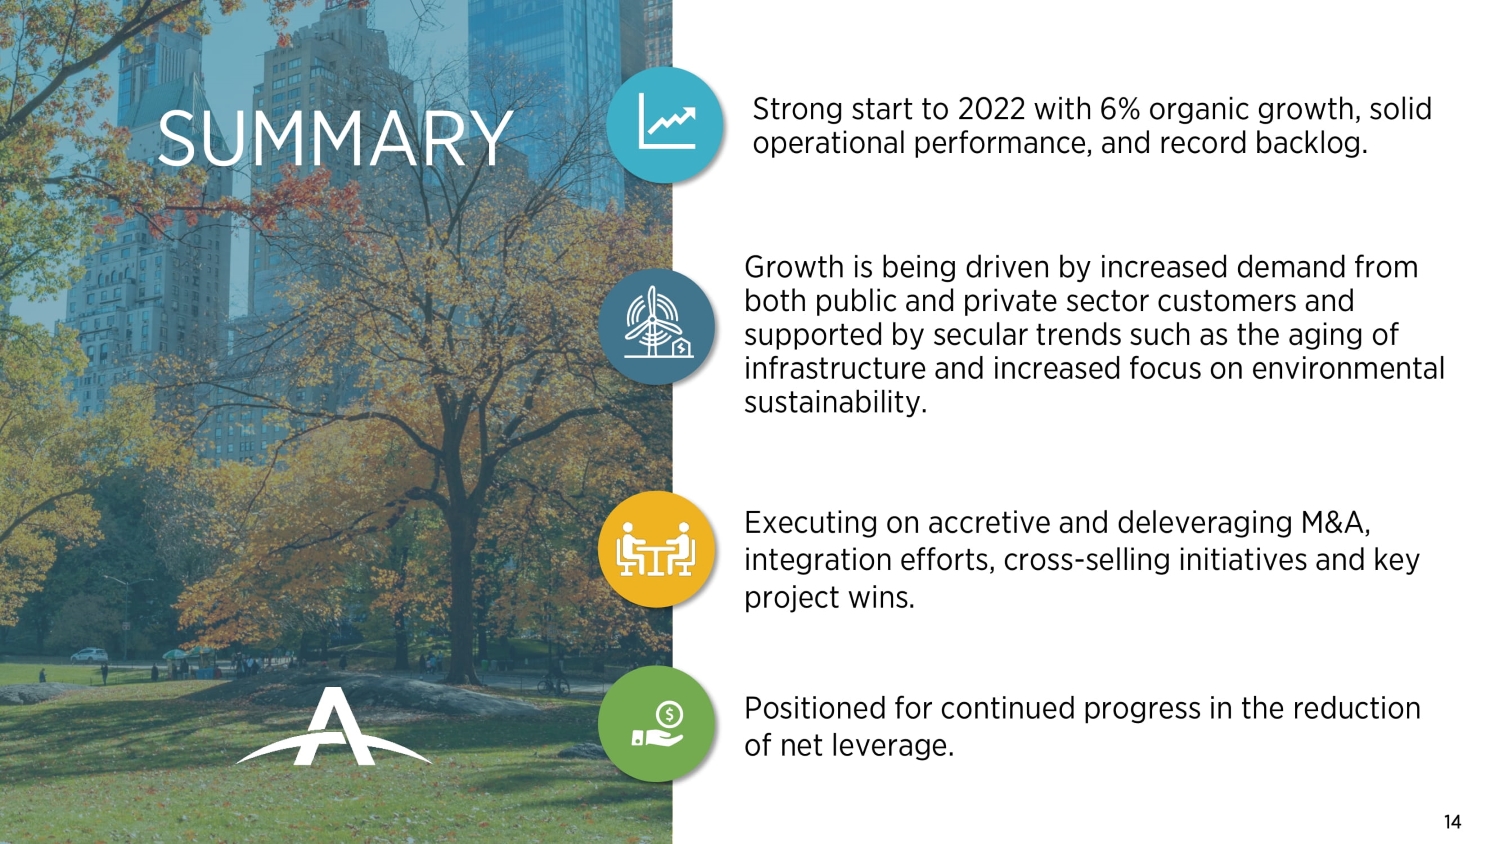
- Strong Start to 2022 with 10% Revenue Growth, 13% Adjusted EBITDA Growth, and Record Backlog -
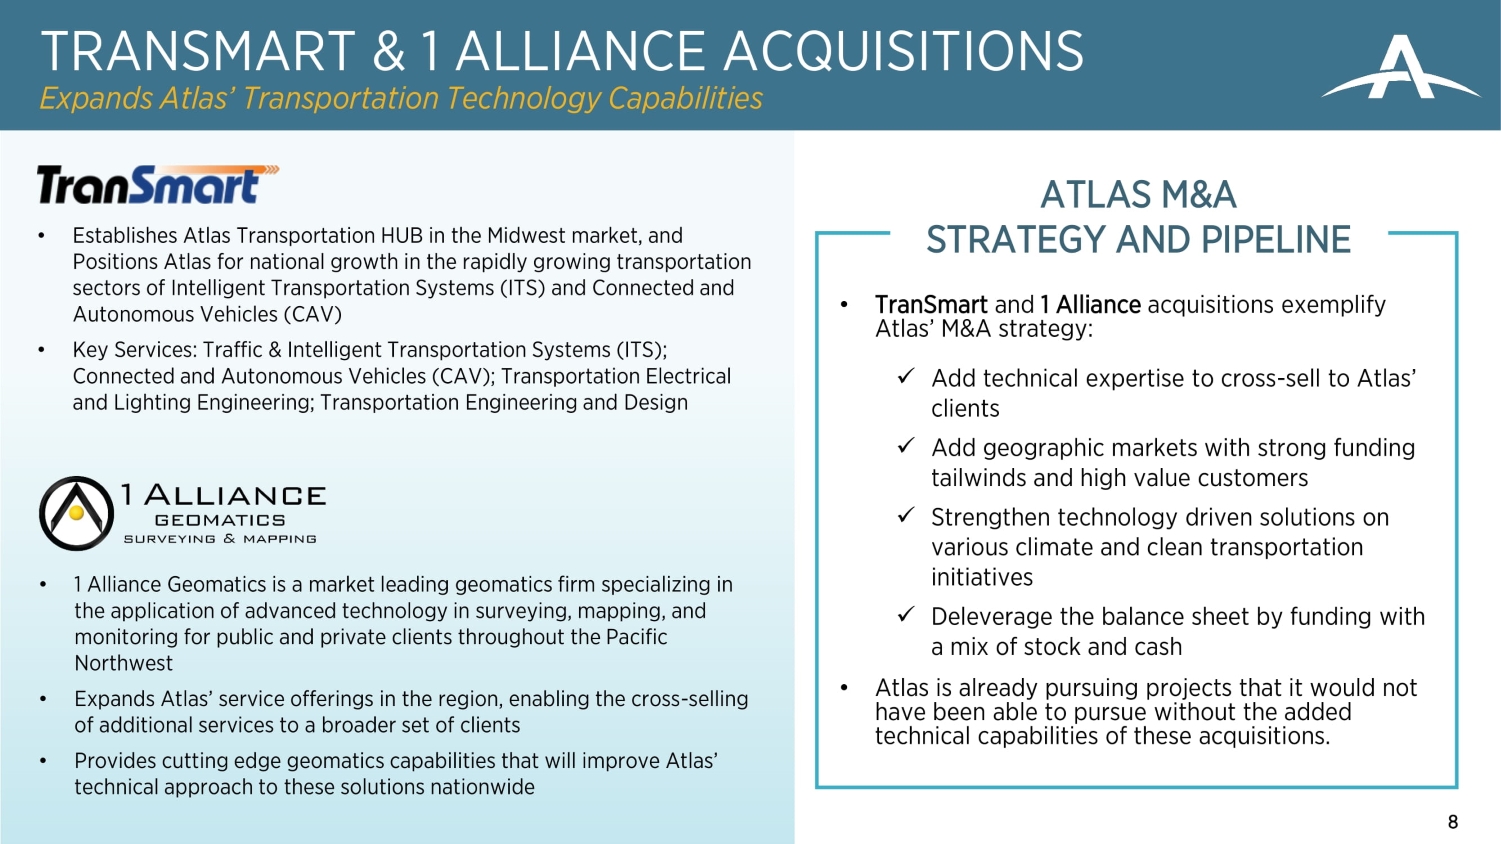
- Completed Strategic Acquisitions of TranSmart Technologies and 1 Alliance Geomatics -
- Reaffirms 2022 Outlook for Revenue and Adjusted EBITDA -
Austin, TX (May 10, 2022) – Atlas Technical Consultants, Inc. (Nasdaq: ATCX) (“Atlas” or the “Company”), a leading infrastructure and environmental services provider, announced today results for the first quarter ended April 1, 2022.
First Quarter 2022 Highlights:
(all comparisons versus the prior-year period unless otherwise noted)
| ● | Gross revenue grew 9.7% to $135.2 million, driven by 6% organic growth and the contribution from acquisitions. |
| ● | Net loss was $4.4 million. Adjusted net income (2) was $0.9 million, or $0.02 per share, which excludes $4.6 million of amortization of intangible assets and other non-recurring expenses. |
| ● | Adjusted EBITDA(3) increased 13.4% to $16.5 million, and represented 12.2% of gross revenue, driven by higher revenues, benefits of scale, improved pricing, and strong operational execution. Excluding subcontractor costs, Adjusted EBITDA margin was 15.1%. |
| ● | Backlog reached another record level at $851 million, up 5% from fourth quarter 2021, and up 24% compared to last year. Awards continue to be driven by infrastructure and environmental markets. |
| ● | Completed the acquisitions of TranSmart Technologies, Inc. and 1 Alliance Geomatics, LLC adding to and enhancing our portfolio of highly-technical services that we can offer our national customer base. |
“We had strong organic growth in the first quarter, achieved another record level of backlog, and are on track for another record year in 2022,” said L. Joe Boyer, Atlas’ Chief Executive Officer. “The benefits of growing Atlas’ scale and our disciplined strategy over the last year were evident as we were able to generate strong operating leverage in the quarter, with nearly 10% top-line growth driving 13% EBITDA growth.”
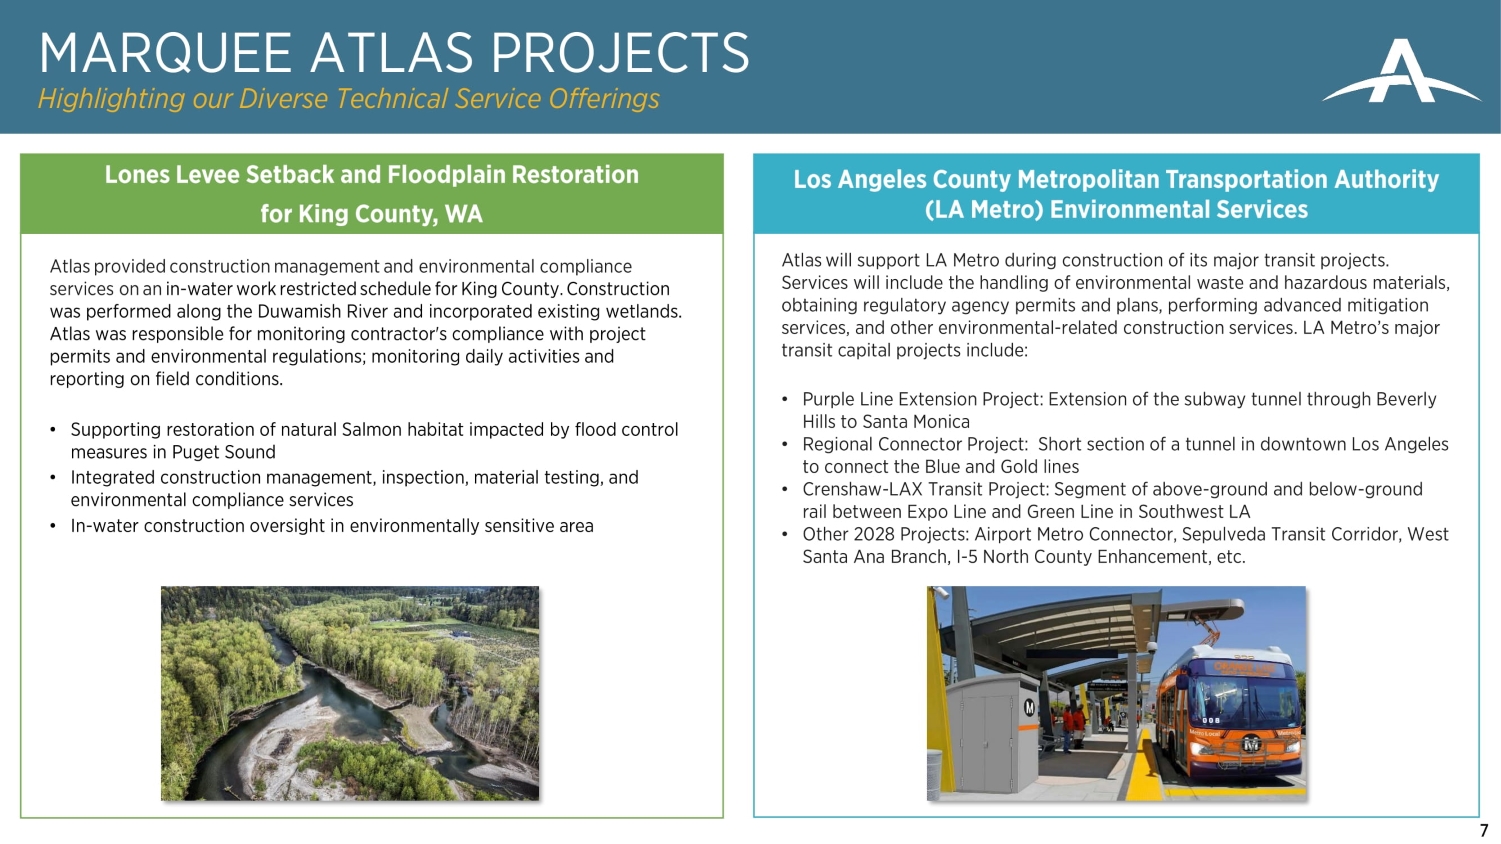
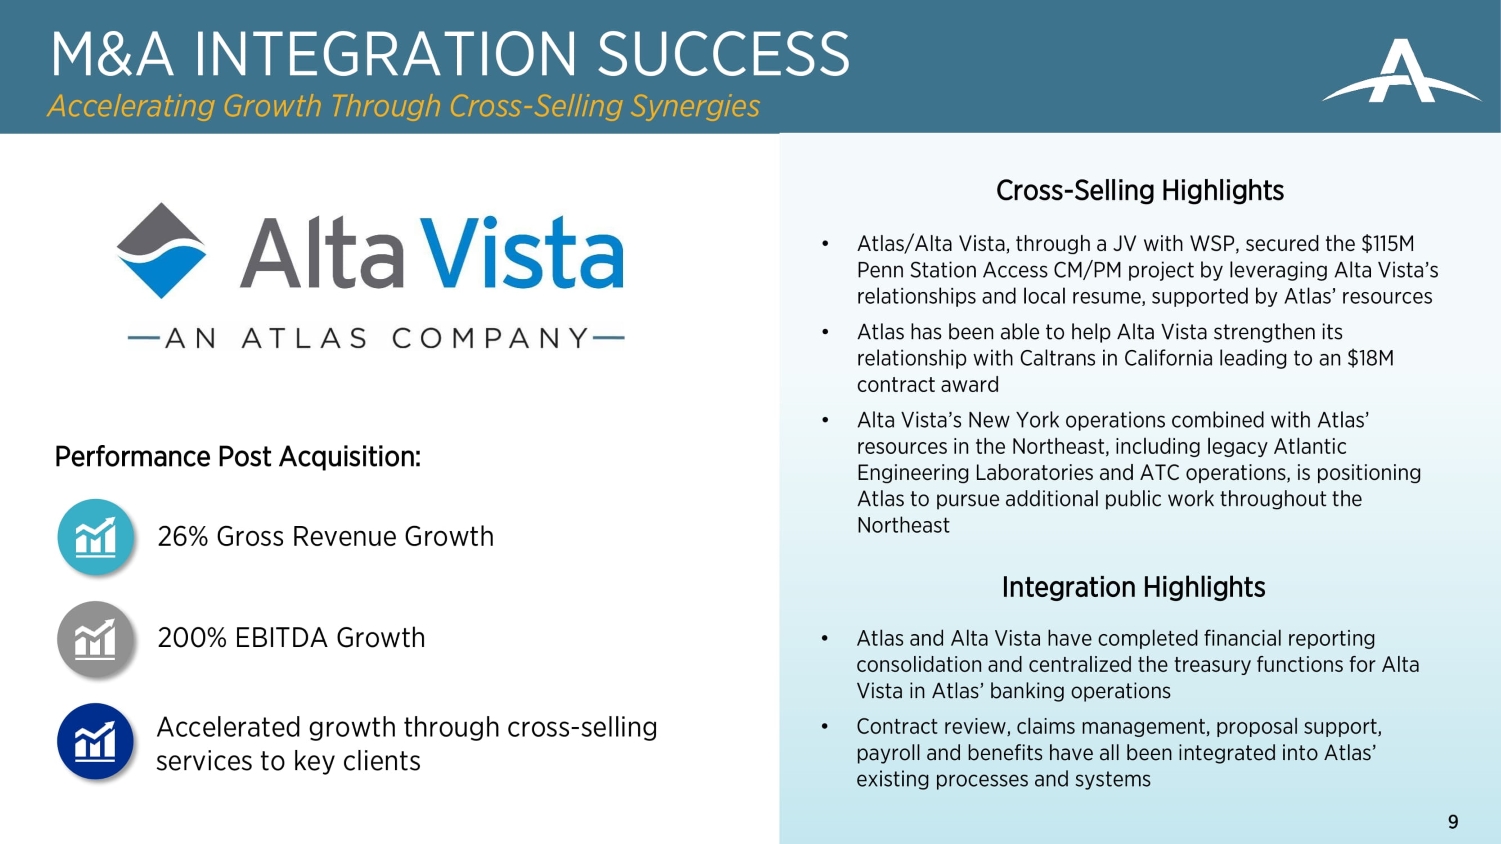
“Organic revenue growth was 6% in the quarter, driven by a combination of our robust backlog growth in 2021 and increased revenue synergies from acquisitions,” continued Boyer. “As we grow our scale and offer clients a broader portfolio of highly technical services, we are gaining traction on larger infrastructure programs such as the Los Angles Metro Environmental Capital Construction Support program we recently announced. We were successful on this highly visible project because we have integrated four complimentary acquisitions that had a presence in Southern California and leveraged their combined capabilities and relationships to win the contract. This strategy continues to be a key growth driver for Atlas as we benefit from our client’s increased spending on roads, bridges, parks and environmental projects that clean up contaminates and restore fragile ecosystems.”
“Looking to the remainder of 2022, we remain confident in our ability to drive double-digit revenue and EBITDA growth and reaffirm our 2022 financial outlook which implies 11% revenue growth and 19% EBITDA growth at the mid-point.”
First Quarter 2022 Financial Performance
Gross revenue in first quarter 2022 was $135.2 million, an increase of $11.9 million, or 9.7% compared to the prior year period. Gross revenue growth was driven by continued progress driving the cross-selling of services in our core businesses, solid end-market fundamentals, improved pricing, and contribution from acquisitions. Organic gross revenue growth was 6.0%.
Gross profit increased to $63.3 million, compared to $58.6 million in the prior year quarter. Gross margin on gross revenue was 46.8%, compared to 47.6% in the prior year-quarter, mainly due to a higher mix of subcontracted work in the quarter. Gross margin, excluding subcontractor costs, was 57.9%, compared to 57.7% in the prior year quarter due to pricing increases and improved utilization of our workforce.
Operating income was $6.8 million, compared to $8.3 million in the prior year quarter. Operating margin on gross revenue was 5.1%, compared to 6.7% in the prior year quarter due to lower gross margin, and an increase in operating expenses primarily due to higher general and administrative costs because of acquisitions completed since first quarter 2021 and related amortization expense, which were partially offset by improved Personnel and Benefits costs.
Net loss was $4.4 million, compared to a net loss of $14.8 million in the prior year quarter. Adjusted net income (2) was $0.9 million or $0.02 per share, compared to $4.8 million, or $0.14 per share, in the prior year quarter, mainly due to the conversion of our preferred equity into our unitranche structure in first quarter 2021. Adjusted net income excludes $4.6 million of amortization of intangible assets, $0.7 million of expenses related to real estate footprint optimization, M&A activity, and non-operational charges.
Adjusted EBITDA was $16.5 million, an increase of $2.0 million, or 13.4% compared to the prior year period.
Backlog was $851 million, up 5.3% from fourth quarter 2021, and up 23.5% compared to the prior year period, driven by key infrastructure and environmental contract awards. Notification of pending contract awards remained robust at approximately $110 million.
Operating cash flow was a use of $16 million in the quarter due to normal seasonality of working capital.
Balance Sheet Update
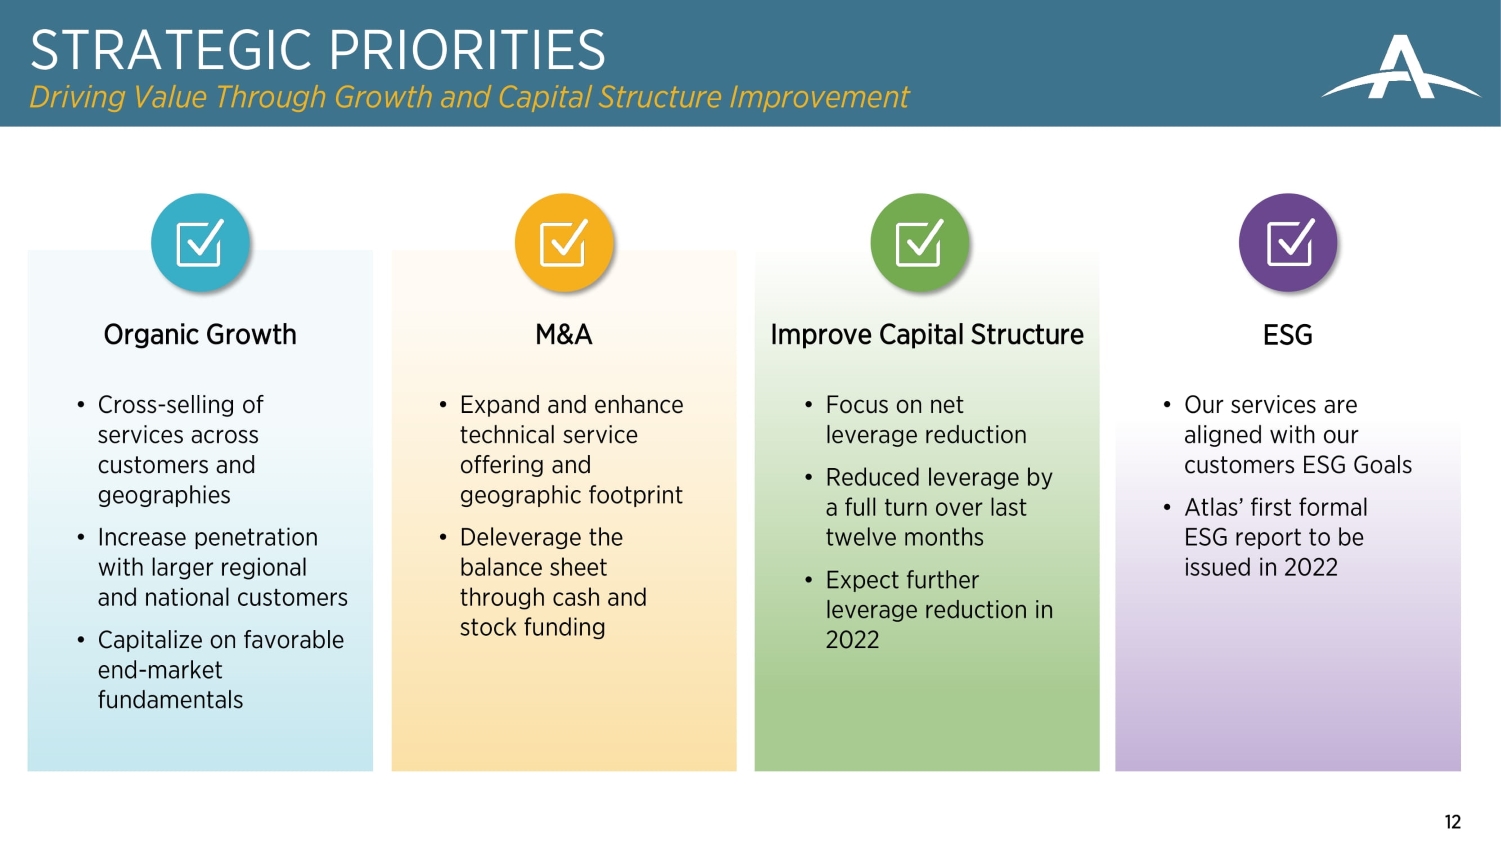
Net leverage (4) at April 1, 2022 was 5.7x, up from 5.4x at December 31, 2021, and down a full turn from 6.7x at the end of first quarter 2021, in-line with our expectations due to the normal seasonality of operating cash flow in the first quarter. The company remains committed to optimizing our capital structure by generating cash flow from operations, deleveraging M&A transactions, and other options to strengthen our balance sheet.
“The modest increase in net leverage in the quarter was in-line with our expectations,” said David Quinn, Chief Financial Officer. “The normal seasonality in our business results in a front-loaded cash use in the first half of the year followed by a strong build in the second half of the year as we convert working capital following our busiest quarters. We remain committed to reducing our leverage and based on the opportunities we see ahead and timing of our work that is already in our backlog, we expect cash flow to improve over the next several quarters.”
2
Reaffirming Full Year 2022 Outlook
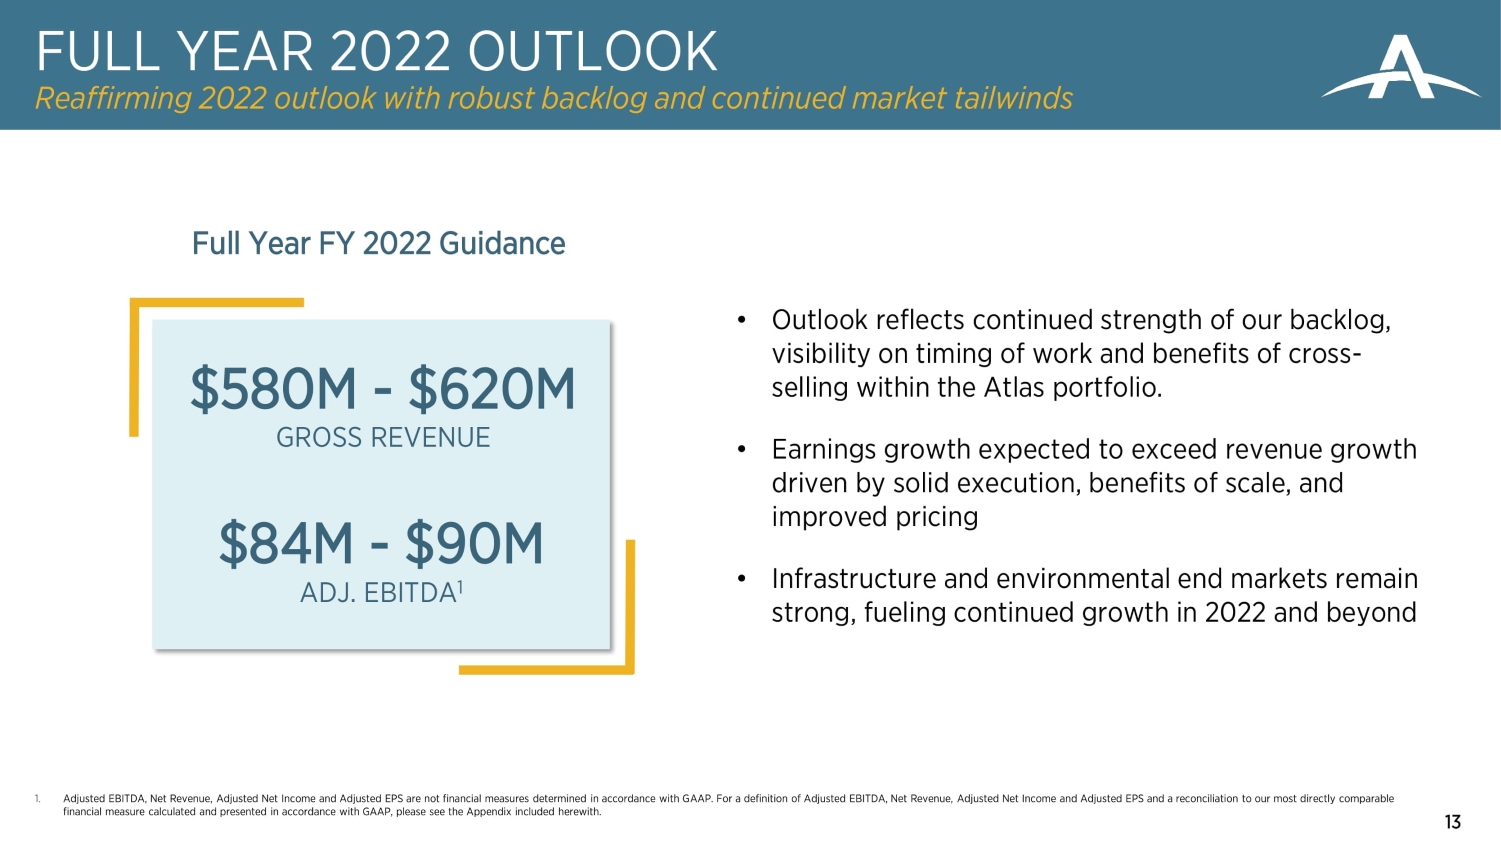
| ● | Gross revenue is anticipated to be in a range of $580 million to $620 million, compared to $538.8 million in 2021. |
| ● | Adjusted 2022 EBITDA is expected to be in a range of $84 million to $90 million, compared to $73.2 million in 2021. |
| ● | Revenue and Adjusted EBITDA outlook reflects the continued strength of our backlog and current visibility on the timing of work. |
(1) Net revenue is a Non-GAAP financial measure. Please see “Reconciliation of Non-GAAP Financial Measures” for a reconciliation of net revenue to the most comparable financial measure calculated in accordance with GAAP.
(2) Adjusted net income is a Non-GAAP financial measure. Please see “Reconciliation of Non-GAAP Financial Measures” for a reconciliation of Adjusted Net Income to the most comparable financial measure calculated in accordance with GAAP.
(3) Adjusted EBITDA is a Non-GAAP financial measure. Please see “Reconciliation of Non-GAAP Financial Measures” for a reconciliation of Adjusted EBITDA to the most comparable financial measure calculated in accordance with GAAP.
(4) Net leverage is bank covenant net leverage calculated as (debt –cash) / LTM Adj. EBITDA including the pro forma impact from acquisitions and cost efficiencies.
Webcast and Conference Call
The Company will host a webcast and conference call on Wednesday, May 11, 2022, at 9:00 a.m. Eastern time (8:00 a.m. Central time) to review first quarter 2022 results, discuss recent events and conduct a question-and-answer session. The live webcast will be available at www.oneatlas.com in the Investors section. The conference call will also be accessible by dialing 1-877-407-9716 (Domestic) and 1-201-493-6779 (International). A replay of the webcast will be available on the Company’s website.
About Atlas Technical Consultants
Headquartered in Austin, Texas, Atlas is a leading provider of Infrastructure and Environmental Solutions. We partner with our clients to improve performance and extend lifecycle of built and natural infrastructure assets stressed by climate, health, and economic impacts. With 3,600+ employees nationwide, Atlas brings deep technical expertise to public- and private-sector clients, integrating services across four primary disciplines: Environmental; Testing, Inspection and Certification; Engineering & Design; and Program, Construction, and Quality Management. To learn more about Atlas innovations for transportation, commercial, water, government, education, and industrial markets, visit https://www.oneatlas.com.
3
Forward-Looking Statements
The statements contained in this press release that are not purely historical are forward-looking statements and involve a number of risks and uncertainties. Our forward-looking statements include, but are not limited to, statements regarding our or our management team’s expectations, hopes, beliefs, intentions, or strategies regarding the future. In addition, any statements that refer to projections, forecasts, or other characterizations of future events or circumstances, including any underlying assumptions and estimates, are forward-looking statements. The words “anticipate,” “believe,” “continue,” “could,” “estimate,” “expect,” “intend,” “may,” “might,” “plan,” “possible,” “potential,” “predict,” “project,” “should,” “would” and variations of such words and similar expressions may identify forward-looking statements, but the absence of these words does not mean that a statement is not forward-looking. The forward-looking statements contained in this press release are based on our expectations and beliefs as of the date of this filing concerning future developments and their potential effects on us. There can be no assurance that future developments affecting us will be those that we have anticipated. These forward-looking statements involve a number of risks, uncertainties (some of which are beyond our control) or other assumptions or estimates that may cause actual results or performance to be materially different from those expressed or implied by these forward-looking statements. These risks and uncertainties include, but are not limited to, those described throughout our annual report on Form 10-K for the year ended December 31, 2021 filed with the U.S. Securities and Exchange Commission (“SEC”) on March 16, 2022, particularly the “Risk Factors” section of such report and the factors described below: (1) the ability to maintain the listing of the Company’s shares of Class A common stock on Nasdaq; (2) the ability to recognize the anticipated benefits of acquisitions, which may be affected by, among other things, competition, the ability of the Company to grow and manage growth profitably, maintain relationships with customers and suppliers and retain management and key employees; (3) costs related to acquisitions; (4) changes in applicable laws or regulations; (5) the possibility that the Company may be adversely affected by other economic, business, and/or competitive factors (including as a result of COVID-19); and (6) other risks and uncertainties indicated from time to time in the Company’s filings with the SEC, including those under “Risk Factors” therein. Given these risks and uncertainties, readers are cautioned not to place undue reliance on such forward-looking statements. Readers are urged to carefully review and consider the various disclosures made in this press release and in documents we file from time to time with the SEC that disclose risks and uncertainties that may affect our business. Unless specifically indicated otherwise, the forward-looking statements in this press release do not reflect the potential impact of any divestitures, mergers, acquisitions, or other business combinations that have not been completed as of the date of this filing. In addition, the forward-looking statements in this press release are made as of the date of its release, including expectations based on third-party information and projections that management believes to be reputable, and the Company does not undertake, and expressly disclaims any duty, to update such statements, whether as a result of new information, new developments, or otherwise, except to the extent that disclosure may be required by law.
Reconciliation of Non-GAAP Financial Measures
To supplement its consolidated financial statements, which are prepared and presented in accordance with GAAP, Atlas discloses Adjusted EBITDA, net revenue, adjusted net income and adjusted earnings per Class A share (“Adjusted EPS”), which are non-GAAP financial measures, in this press release. Atlas believes these financial measures are useful indicators to evaluate performance because they allow for an effective evaluation of Atlas’ operating performance when compared to its peers, without regard to its financing methods or capital structure. Atlas believes Adjusted EBITDA and net revenue are useful for investors and others in understanding and evaluating Atlas’ operations results in the same manner as its management. However, Adjusted EBITDA and net revenue are not financial measures calculated in accordance with GAAP and should not be considered as substitutes for, or in isolation from, net income (loss), revenue, operating profit, or any other operating performance measures calculated in accordance with GAAP.
4
Atlas defines Adjusted EBITDA as net income before interest expense, income taxes, depreciation and amortization, adjustments for certain one-time or non-recurring items and other adjustments. Atlas excludes these items from net income in arriving at Adjusted EBITDA because these amounts are either non-recurring or can vary substantially within the industry depending upon accounting methods and book values of assets, capital structures and the method by which the assets were acquired. Certain items excluded from Adjusted EBITDA are significant components in understanding and assessing a company’s financial performance, such as a company’s cost of capital and tax structure, as well as the historic costs of depreciable assets, none of which are reflected in Adjusted EBITDA. Atlas’ presentation of Adjusted EBITDA should not be construed as an indication that results will be unaffected by the items excluded from Adjusted EBITDA. Atlas’ computation of Adjusted EBITDA may not be identical to other similarly titled measures of other companies. For a reconciliation of Adjusted EBITDA to its most comparable measure under GAAP, please see the table entitled “Reconciliation of Non-GAAP Financial Measures” at the end of this press release. Because GAAP financial measures on a forward-looking basis are not accessible, and reconciling information is not available without unreasonable effort, we have not provided reconciliations for forward-looking non-GAAP measures. For the same reasons, we are unable to address the probable significance of the unavailable information, which could be material to future results.
Atlas defines net revenue as gross revenue before reimbursable expenses and other adjustments. Atlas excludes these items from gross revenue in arriving at net revenue because net revenue is an important measure of the underlying production and performance of the business. Certain items excluded from net revenue are significant components in understanding and assessing a company’s financial performance, such as subcontractor and other “pass-through” related costs. Atlas’ presentation of net revenue should not be construed as an indication that results will be unaffected by the items excluded from net revenue. Atlas’ computation of net revenue may not be identical to other similarly titled measures of other companies. For a reconciliation of net revenue to its most comparable measure under GAAP, please see the table entitled “Reconciliation of Non-GAAP Financial Measures” at the end of this press release.
Atlas defines adjusted net income as net income excluding the after-tax impact of transaction costs, certain other non-recurring expenses, and the amortization of intangible assets. Atlas excludes these items from net income in arriving at adjusted net income because adjusted net income is an important measure of the underlying production and performance of the business. Certain items excluded from adjusted net income are significant components in understanding and assessing a company’s financial performance. Atlas’ presentation of adjusted net income should not be construed as an indication that results will be unaffected by the items excluded from adjusted net income. Atlas’ computation of adjusted net income may not be identical to other similarly titled measures of other companies. For a reconciliation of adjusted net income to its most comparable measure under GAAP, please see the table entitled “Reconciliation of Non-GAAP Financial Measures” at the end of this press release.
Atlas defines Adjusted EPS as adjusted net income divided by the weighted average of Class A shares outstanding for the period. Adjusted EPS reflects adjustments to reported diluted earnings per share (“GAAP EPS”) to eliminate amortization expense of intangible assets from acquisitions, net of tax benefits, and acquisition-related costs. As we continue our acquisition strategy, the growth in Adjusted EPS may increase at a greater rate than GAAP EPS. Our definition of Adjusted EPS may differ from other companies reporting similarly named measures. This measure should be considered in addition to, and not as a substitute for, or superior to, other measures of financial performance prepared in accordance with GAAP, such as Net Income and Diluted Earnings per Share. For a reconciliation of Adjusted EPS to its most comparable measure under GAAP, please see the table entitled “Reconciliation of Non-GAAP Financial Measures” at the end of this press release.
5
ATLAS TECHNICAL CONSULTANTS, INC.
AND SUBSIDIARIES UNAUDITED
CONSOLIDATED BALANCE SHEETS
Amounts in thousands, except per share data
| April 1, 2022 | December 31, 2021 | |||||||
| ASSETS | ||||||||
| Current assets: | ||||||||
| Cash and equivalents | $ | 9,088 | $ | 10,697 | ||||
| Accounts receivable, net | 104,933 | 105,362 | ||||||
| Unbilled receivables, net | 55,028 | 45,924 | ||||||
| Prepaid expenses | 5,778 | 5,061 | ||||||
| Other current assets | 4,207 | 4,039 | ||||||
| Total current assets | 179,034 | 171,083 | ||||||
| Property and equipment, net | 15,697 | 13,757 | ||||||
| Intangible assets, net | 142,578 | 107,314 | ||||||
| Goodwill | 132,854 | 124,348 | ||||||
| Other long-term assets | 40,274 | 4,015 | ||||||
| TOTAL ASSETS | $ | 510,437 | $ | 420,517 | ||||
| LIABILITIES AND SHAREHOLDERS’ DEFICIT | ||||||||
| Current liabilities: | ||||||||
| Trade accounts payable | $ | 39,204 | $ | 42,521 | ||||
| Accrued liabilities | 11,438 | 17,124 | ||||||
| Current maturities of long-term debt | 4,930 | 3,606 | ||||||
| Other current liabilities | 40,036 | 26,489 | ||||||
| Total current liabilities | 95,608 | 89,740 | ||||||
| Long-term debt, net of current maturities and loan costs | 504,431 | 462,193 | ||||||
| Other long-term liabilities | 49,069 | 20,074 | ||||||
| Total liabilities | 649,108 | 572,007 | ||||||
| COMMITMENTS AND CONTINGENCIES (NOTE 13) | ||||||||
| Class A common stock, $.0001 par value, 400,000,000 shares authorized, 35,115,892 and 33,645,212 shares issued and outstanding at April 1, 2022 and December 31, 2021, respectively | 4 | 3 | ||||||
| Class B common stock, $.0001 par value, 100,000,000 shares authorized, 3,333,893 and 3,328,101 shares issued and outstanding at April 1, 2022 and December 31, 2021, respectively | - | - | ||||||
| Additional paid in capital | (85,456 | ) | (102,692 | ) | ||||
| Non-controlling interest | (20,606 | ) | (20,210 | ) | ||||
| Retained deficit | (32,613 | ) | (28,591 | ) | ||||
| Total shareholders’ equity | (138,671 | ) | (151,490 | ) | ||||
| TOTAL LIABILITIES AND SHAREHOLDERS’ DEFICIT | $ | 510,437 | $ | 420,517 | ||||
6
ATLAS TECHNICAL CONSULTANTS, INC.
AND SUBSIDIARIES UNAUDITED
STATEMENTS OF OPERATIONS
Amounts in thousands, except per share data
| For the quarters ended | ||||||||
| April 1, 2022 | April 2, 2021 | |||||||
| Revenues | $ | 135,187 | $ | 123,269 | ||||
| Subcontractor costs | (25,831 | ) | (21,676 | ) | ||||
| Other costs of revenues | (46,036 | ) | (42,952 | ) | ||||
| Gross Profit | 63,320 | 58,641 | ||||||
| Operating expenses: | ||||||||
| Personnel costs and benefits | (34,470 | ) | (33,910 | ) | ||||
| Selling general and administrative | (15,036 | ) | (11,875 | ) | ||||
| Depreciation and amortization | (6,968 | ) | (4,560 | ) | ||||
| Total Operating expenses | (56,474 | ) | (50,345 | ) | ||||
| Operating income/(loss) | 6,846 | 8,296 | ||||||
| Interest expense | (11,119 | ) | (23,042 | ) | ||||
| (Loss) income before income taxes | (4,273 | ) | (14,746 | ) | ||||
| Income tax expense | (145 | ) | (44 | ) | ||||
| Net (loss) income | (4,418 | ) | (14,790 | ) | ||||
| Provision for non-controlling interest | 396 | 12,169 | ||||||
| Redeemable preferred stock dividends | - | (5,899 | ) | |||||
| Net (loss) attributable to Class A common stock shareholders/members | $ | (4,022 | ) | $ | (8,520 | ) | ||
| (Loss) Per Class A Common Share | $ | (0.12 | ) | $ | (0.60 | ) | ||
| Weighted average of shares outstanding: | ||||||||
| Class A common shares (basic and diluted) | 34,039,775 | 14,256,484 | ||||||
7
ATLAS TECHNICAL CONSULTANTS, INC.
AND SUBSIDIARIES UNAUDITED
STATEMENTS OF CASH FLOWS
Amounts in thousands
| For the quarters ended | ||||||||
| April 1, 2022 | April 2, 2021 | |||||||
| Cash flows from operating activities: | ||||||||
| Net (loss) income | $ | (4,418 | ) | $ | (14,790 | ) | ||
| Adjustments to reconcile net (loss) income to net cash (used in) provided by operating activities: | ||||||||
| Depreciation and amortization | 6,968 | 4,560 | ||||||
| Equity-based compensation expense | 1,052 | 446 | ||||||
| Interest expense, paid in kind | - | 864 | ||||||
| (Gain) loss on sale of property and equipment | - | 11 | ||||||
| Write-off of deferred financing costs related to debt extinguishment | - | 15,197 | ||||||
| Amortization of deferred financing costs | 279 | 631 | ||||||
| Provision for bad debts | - | (189 | ) | |||||
| Changes in assets & liabilities: | ||||||||
| (Increase) decrease in accounts receivable and unbilled receivable | 4,003 | 9,536 | ||||||
| (Increase) decrease in prepaid expenses | (343 | ) | (2,691 | ) | ||||
| (Increase) decrease in other current assets | (160 | ) | 1,752 | |||||
| (Decrease) in trade accounts payable | (10,267 | ) | (5,409 | ) | ||||
| (Decrease) in accrued liabilities | (7,355 | ) | (5,629 | ) | ||||
| (Decrease) increase in other current and long-term liabilities | (5,524 | ) | (3,205 | ) | ||||
| (Increase) decresae in other long-term assets | (298 | ) | (391 | ) | ||||
| Net cash provided by (used in) operating activities | (16,063 | ) | 693 | |||||
| Cash flows from investing activities: | ||||||||
| Purchases of property and equipment | (2,432 | ) | (691 | ) | ||||
| Purchase of business, net of cash acquired | (24,757 | ) | (97 | ) | ||||
| Net cash (used in) investing activities | (27,189 | ) | (788 | ) | ||||
| Cash flows from financing activities: | ||||||||
| Proceeds from issuance of debt | 44,607 | 461,754 | ||||||
| Payment of loan acquisition costs | - | (7,560 | ) | |||||
| Repayments of debt | (1,324 | ) | (294,463 | ) | ||||
| Payment of contingent earnout | (1,640 | ) | - | |||||
| Payment of redeemable preferred stock dividends | - | (1,185 | ) | |||||
| Repayment of redeemabel preferred stock | - | (156,186 | ) | |||||
| Net cash provided by (used in) financing activities | 41,643 | 2,360 | ||||||
| Net change in cash and equivalents | (1,609 | ) | 2,265 | |||||
| Cash and equivalents - beginning of period | 10,697 | 14,062 | ||||||
| Cash and equivalents - end of period | $ | 9,088 | $ | 16,327 | ||||
8
ATLAS TECHNICAL CONSULTANTS, INC.
AND SUBSIDIARIES UNAUDITED
RECONCILIATION OF GROSS REVENUES TO NET REVENUES
Amounts in thousands
| For the quarters ended | ||||||||
| April 1, 2022 | April 2, 2021 | |||||||
| (Unaudited) | ||||||||
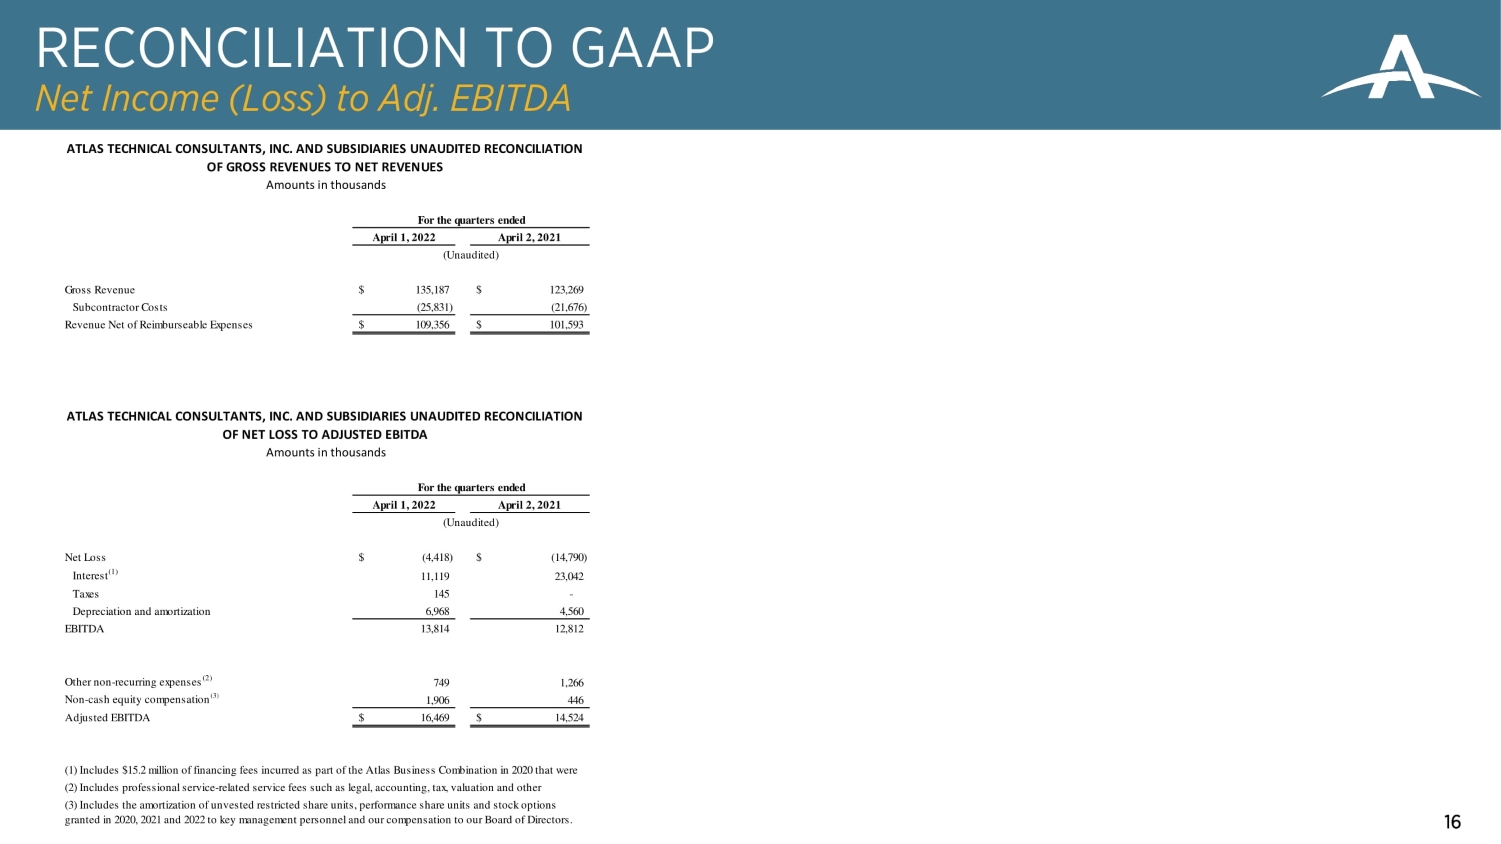
| Gross Revenue | $ | 135,187 | $ | 123,269 | ||||
| Subcontractor Costs | (25,831 | ) | (21,676 | ) | ||||
| Revenue Net of Reimbursable Expenses | $ | 109,356 | $ | 101,593 | ||||
ATLAS TECHNICAL CONSULTANTS, INC. AND SUBSIDIARIES UNAUDITED
RECONCILIATION OF NET LOSS TO ADJUSTED EBITDA
Amounts in thousands
| For the quarters ended | ||||||||
| April 1, 2022 | April 2, 2021 | |||||||
| (Unaudited) | ||||||||
| Net Loss | $ | (4,418 | ) | $ | (14,790 | ) | ||
| Interest(1) | 11,119 | 23,042 | ||||||
| Taxes | 145 | - | ||||||
| Depreciation and amortization | 6,968 | 4,560 | ||||||
| EBITDA | 13,814 | 12,812 | ||||||
| Other non-recurring expenses(2) | 749 | 1,266 | ||||||
| Non-cash equity compensation(3) | 1,906 | 446 | ||||||
| Adjusted EBITDA | $ | 16,469 | $ | 14,524 | ||||
| (1) | Includes $15.2 million of financing fees incurred as part of the Atlas Business Combination in 2020 that were written off as part of our refinancing that occurred in the first quarter of 2021. |
| (2) | Includes professional service-related service fees such as legal, accounting, tax, valuation and other consulting relating to acquisitions along with employee separation charges. |
| (3) | Includes the amortization of unvested restricted share units, performance share units and stock options granted in 2020, 2021 and 2022 to key management personnel and our compensation to our Board of Directors. |
9
ATLAS TECHNICAL CONSULTANTS, INC.
AND SUBSIDIARIES UNAUDITED
RECONCILIATION OF NET LOSS TO ADJUSTED NET INCOME
Amounts in thousands
| For the quarters ended | ||||||||
| April 1, 2022 | April 2, 2021 | |||||||
| (Unaudited) | ||||||||
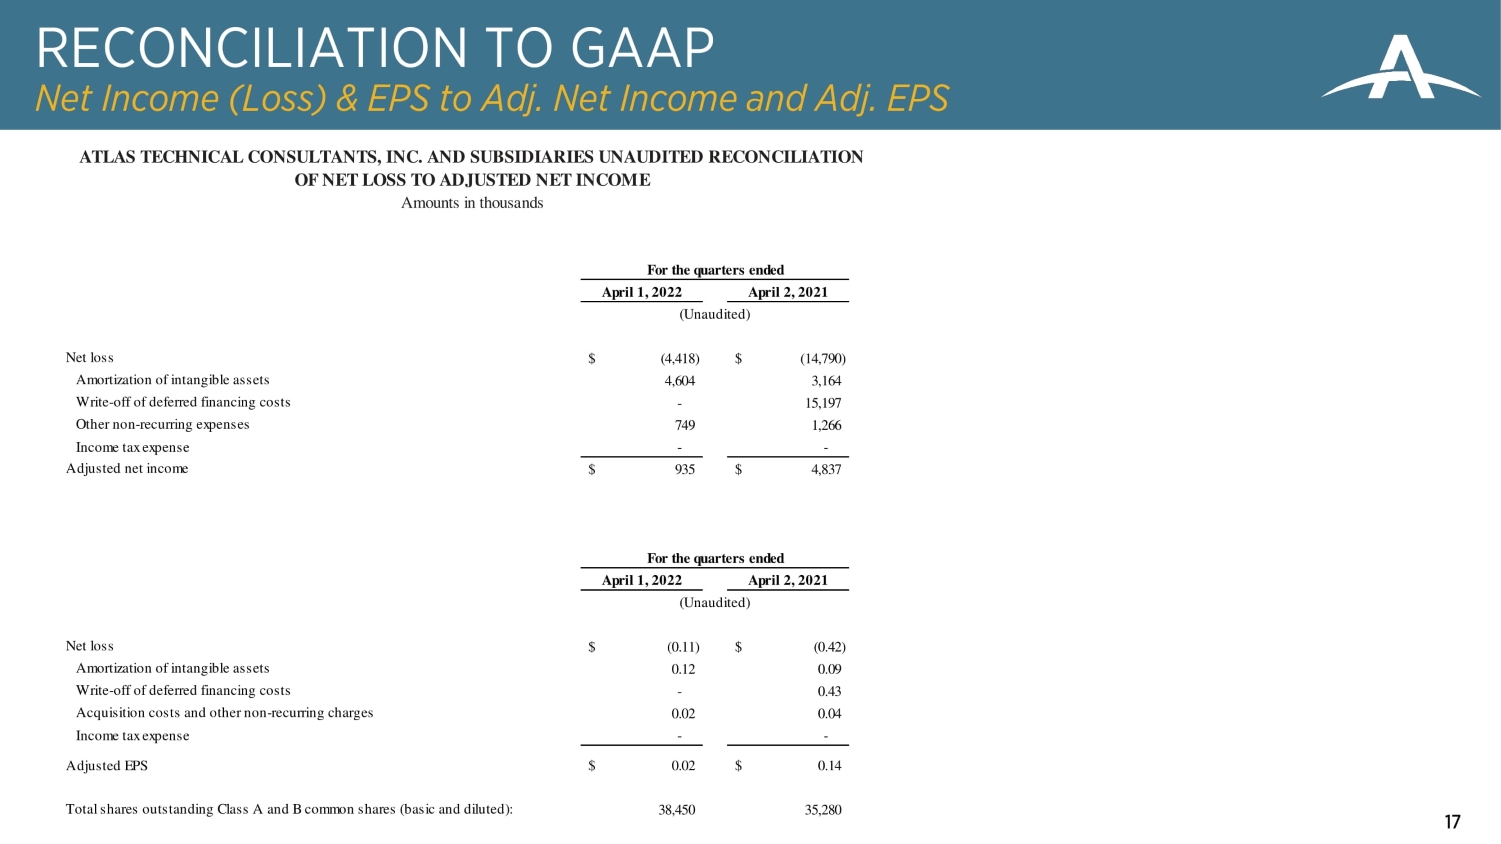
| Net loss | $ | (4,418 | ) | $ | (14,790 | ) | ||
| Amortization of intangible assets | 4,604 | 3,164 | ||||||
| Write-off of deferred financing costs | - | 15,197 | ||||||
| Other non-recurring expenses | 749 | 1,266 | ||||||
| Income tax expense | - | - | ||||||
| Adjusted net income | $ | 935 | $ | 4,837 | ||||
| For the quarters ended | ||||||||
| April 1, 2022 | April 2, 2021 | |||||||
| (Unaudited) | ||||||||
| Net loss | $ | (0.11 | ) | $ | (0.42 | ) | ||
| Amortization of intangible assets | 0.12 | 0.09 | ||||||
| Write-off of deferred financing costs | - | 0.43 | ||||||
| Acquisition costs and other non-recurring charges | 0.02 | 0.04 | ||||||
| Income tax expense | - | - | ||||||
| Adjusted EPS | $ | 0.02 | $ | 0.14 | ||||
| Total shares outstanding - Class A and B (basic and diluted): | 38,450 | 35,280 | ||||||
Contacts:
Media
Karlene Barron
770-314-5270
karlene.barron@oneatlas.com
Investor Relations
Chase Jacobson, Vallum Advisors
512-851-1507
ir@oneatlas.com
10