UNITED STATES
SECURITIES AND EXCHANGE COMMISSION
Washington, D.C. 20549
FORM
(Mark One)
OR
For the fiscal year ended
OR
For the transition period from __________ to __________
Date of event requiring this shell company report
Commission File Number
(Exact name of Registrant as specified in its charter)
Not Applicable
(Translation of Registrant’s name into English)
(Jurisdiction of incorporation or organization)
(Address of principal executive offices)
Chief Legal Officer & General Counsel
(Name, E-mail and Address of Company Contact Person)
Securities registered or to be registered, pursuant to Section 12(b) of the Act
Title of each class |
Trading Symbol(s) |
|
Name of each exchange on which registered |
|
Securities registered or to be registered pursuant to Section 12(g) of the Act: None
Securities for which there is a reporting obligation pursuant to Section 15(d) of the Act: None
Indicate the number of outstanding shares of each of the issuer’s classes of capital stock or common stock as of the close of the period covered by the annual report.
Indicate by check mark if the registrant is a well-known seasoned issuer, as defined in Rule 405 of the Securities Act.
If this report is an annual or transition report, indicate by check mark if the registrant is not required to file reports pursuant to Section 13 or 15(d) of the Securities Exchange Act of 1934. Yes ☐
Note — Checking the box above will not relieve any registrant required to file reports pursuant to Section 13 or 15(d) of the Securities Exchange Act of 1934 from their obligations under those Sections.
Indicate by check mark whether the registrant (1) has filed all reports required to be filed by Section 13 or 15(d) of the Securities Exchange Act of 1934 during the preceding 12 months (or for such shorter period that the registrant was required to file such reports), and (2) has been subject to such filing requirements for the past 90 days.
Indicate by check mark whether the registrant has submitted electronically every Interactive Data File required to be submitted pursuant to Rule 405 of Regulation S-T (§ 232.405 of this chapter) during the preceding 12 months (or for such shorter period that the registrant was required to submit such files).
Indicate by check mark whether the registrant is a large accelerated filer, an accelerated filer, a non-accelerated filer, or an emerging growth company. See definition of “large accelerated filer,” “accelerated filer,” and “emerging growth company” in Rule 12b-2 of the Exchange Act.
☒ |
Accelerated filer |
☐ |
Non-accelerated filer |
☐ |
Emerging growth company |
☐ |
If an emerging growth company that prepares its financial statements in accordance with U.S. GAAP, indicate by check mark if the registrant has elected not to use the extended transition period for complying with any new or revised financial accounting standards † provided pursuant to Section 13(a) of the Exchange Act.
† The term “new or revised financial accounting standard” refers to any update issued by the Financial Accounting Standards Board to its Accounting Standards Codification after April 5, 2012.
Indicate by check mark whether the registrant has filed a report on and attestation to its management’s assessment of the effectiveness of its internal control over financial reporting under Section 404(b) of the Sarbanes-Oxley Act (15 U.S.C. 7262(b)) by the registered public accounting firm that prepared or issued its audit report.
Indicate by check mark which basis of accounting the registrant has used to prepare the financial statements included in this filing:
U.S. GAAP ☐ |
|
by the International Accounting Standards Board ☒ |
|
Other ☐ |
If “Other” has been checked in response to the previous question indicate by check mark which financial statement item the registrant has elected to follow. Item 17 ☐ Item 18 ☐
If this is an annual report, indicate by check mark whether the registrant is a shell company (as defined in Rule 12b-2 of the Exchange Act). Yes
TABLE OF CONTENTS
|
|
Page |
|
|
|
3 |
||
8 |
||
9 |
||
|
|
|
|
|
|
|
|
|
Item 1. |
11 |
|
|
|
|
Item 2. |
11 |
|
|
|
|
Item 3. |
11 |
|
|
11 |
|
|
11 |
|
|
11 |
|
|
11 |
|
|
|
|
Item 4. |
67 |
|
|
67 |
|
|
68 |
|
|
81 |
|
|
81 |
|
|
|
|
Item 4A. |
82 |
|
|
|
|
Item 5. |
83 |
|
|
91 |
|
|
99 |
|
|
102 |
|
|
102 |
|
|
102 |
|
|
|
|
Item 6. |
107 |
|
|
107 |
|
|
110 |
|
|
112 |
|
|
116 |
|
|
117 |
|
|
|
|
Item 7. |
117 |
|
|
117 |
|
|
119 |
|
|
120 |
|
|
|
|
Item 8. |
121 |
|
|
121 |
|
|
122 |
|
|
|
|
Item 9. |
122 |
|
|
122 |
|
|
122 |
|
|
122 |
|
|
122 |
|
|
122 |
|
1
|
122 |
|
|
|
|
Item 10. |
122 |
|
|
122 |
|
|
122 |
|
|
122 |
|
|
122 |
|
|
123 |
|
|
130 |
|
|
130 |
|
|
130 |
|
|
130 |
|
|
130 |
|
|
|
|
Item 11. |
131 |
|
|
|
|
Item 12. |
132 |
|
|
|
|
|
|
|
|
|
|
Item 13. |
133 |
|
|
|
|
Item 14. |
Material Modifications to the Rights of Security Holders and Use of Proceeds |
133 |
|
|
|
Item 15. |
133 |
|
|
|
|
Item 16. |
134 |
|
|
|
|
Item 16A. |
134 |
|
|
|
|
Item 16B. |
134 |
|
|
|
|
Item 16C. |
135 |
|
|
|
|
Item 16D. |
135 |
|
|
|
|
Item 16E. |
Purchases of Equity Securities by the Issuer and Affiliated Purchasers |
135 |
|
|
|
Item 16F. |
135 |
|
|
|
|
Item 16G. |
136 |
|
|
|
|
Item 16H. |
136 |
|
|
|
|
Item 16I. |
Disclosure Regarding Foreign Jurisdictions that Prevent Inspections |
136 |
|
|
|
|
|
|
|
|
|
Item 17. |
137 |
|
|
|
|
Item 18. |
137 |
|
|
|
|
Item 19. |
138 |
|
|
|
|
140 |
||
|
|
|
F-1 |
||
2
PRESENTATION OF FINANCIAL AND OTHER INFORMATION
We report under International Financial Reporting Standards (“IFRS”) as issued by the International Accounting Standards Board (the “IASB”).
General Information
Our Consolidated financial statements are reported in U.S. dollars, which are denoted “dollars,” “USD” or “$” throughout this Annual Report on Form 20-F (“Annual Report”). Also, throughout this Annual Report:
Certain figures in this Annual Report may not recalculate exactly due to rounding. This is because percentages and/or figures contained herein are calculated based on actual numbers and not the rounded numbers presented.
Defined Terms in this Annual Report
Throughout this Annual Report, we use a number of defined terms and provide information about a number of key performance indicators used by management. Definitions are as follows, and additional information about our key performance indicators is provided in Item 5. “Operating and Financial Review and Prospects — Key Operating and Financial Metrics.”
3
Non-IFRS and Other Financial and Operating Metrics
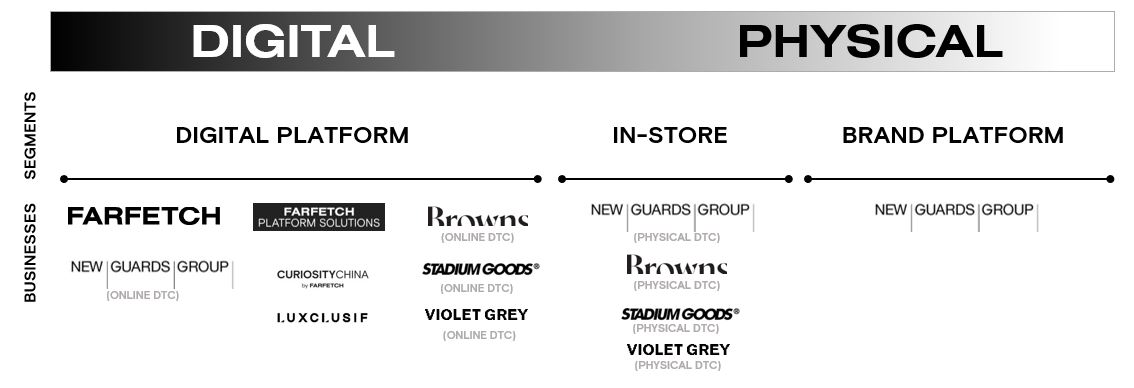
We have included in this Annual Report certain financial measures not based on IFRS, including Adjusted EBITDA, Adjusted EBITDA Margin, Adjusted EPS, Adjusted Revenue, Digital Platform Order Contribution, Digital Platform Order Contribution Margin and constant currency information (together, the “Non-IFRS Measures”), as well as operating metrics, including GMV, Digital Platform GMV, Brand Platform GMV, In-Store GMV, Active Consumers and Average Order Value. Refer to Item 5. “Operating and Financial Review and Prospects – Reconciliations of Non-IFRS and Other Financial and Operating Metrics” for additional information on the use of these Non-IFRS Measures and reconciliations to the most directly comparable IFRS measures.
4
We define our Non-IFRS Measures and other financial and operating metrics as follows:
“Active Consumers” means active consumers on our directly owned and operated sites and related apps or on third-party websites or platforms on which we operate. A consumer is deemed to be active if they made a purchase within the last twelve-month period, irrespective of cancellations or returns. Active Consumers includes the Farfetch Marketplace, BrownsFashion.com, Stadium Goods, and the New Guards-owned sites operated by Farfetch Platform Solutions plus third-party websites or platforms on which we operate, including Amazon.com and Tmall Luxury Pavilion. Due to limitations in the data we are provided by certain third-party websites or platforms on which we operate, a limited number of consumers who transact on such websites or platforms and on our directly owned and operated sites and related apps, may be duplicated in the number of Active Consumers we report. The number of Active Consumers is an indicator of our ability to attract and retain our consumer base to our platform and of our ability to convert platform visits into sale orders.
“Adjusted EBITDA” means net profit/(loss) after taxes before net finance expense/(income), income tax expense/(benefit) and depreciation and amortization, further adjusted for share-based compensation expense, share of results of associates and items outside the normal scope of our ordinary activities (including other items, within selling, general and administrative expenses, losses/(gains) on items held at fair value and remeasurements through profit and loss, impairment losses on tangible assets, and impairment losses on intangible assets). Adjusted EBITDA provides a basis for comparison of our business operations between current, past and future periods by excluding items that we do not believe are indicative of our core operating performance. Adjusted EBITDA may not be comparable to other similarly titled metrics of other companies.
“Adjusted EBITDA Margin” means Adjusted EBITDA calculated as a percentage of Adjusted Revenue.
“Adjusted EPS” means earnings per share further adjusted for share-based payments, amortization of acquired intangible assets, items outside the normal scope of our ordinary activities (including other items, within selling, general and administrative expenses, losses/(gains) on items held at fair value and remeasurements through profit and loss, impairment losses on tangible assets, and impairment losses on intangible assets) and the related tax effects of these adjustments. Adjusted EPS provides a basis for comparison of our business operations between current, past and future periods by excluding items that we do not believe are indicative of our core operating performance. Adjusted EPS may not be comparable to other similarly titled metrics of other companies.
“Adjusted Revenue” means revenue less Digital Platform Fulfilment Revenue.
“Average Order Value” (“AOV”) means the average value of all orders excluding value added taxes placed on either the Farfetch Marketplace or the Stadium Goods Marketplace, as indicated.
“Brand Platform Gross Profit” means Brand Platform Revenue less the direct cost of goods sold relating to Brand Platform Revenue.
“Brand Platform GMV” and “Brand Platform Revenue” mean revenue relating to the New Guards operations less revenue from New Guards’: (i) owned e-commerce websites, (ii) direct to consumer channel via our Marketplaces and (iii) directly operated stores. Revenue realized from Brand Platform is generally equal to GMV as such sales are not commission based. However, revenue relating to royalties, commission and other fees arising on commercial arrangements may be recognized within Brand Platform Revenue and not Brand Platform GMV.
"Constant currency" means translating current period financial data at the prior year average exchange rates applicable to the local currency in which the transactions are denominated.
“Digital Platform Fulfilment Revenue” means revenue from shipping and customs clearing services that we provide to our digital consumers, net of centrally Farfetch-funded consumer promotional incentives, such as free shipping and promotional codes. Digital Platform Fulfilment Revenue was referred to as Platform Fulfilment Revenue in previous filings with the U.S. Securities and Exchange Commission (“SEC”).
“Digital Platform GMV” means GMV excluding In-Store GMV and Brand Platform GMV. Digital Platform GMV was referred to as Platform GMV in previous filings with the SEC.
5
“Digital Platform Gross Profit” means gross profit excluding In-Store Gross Profit and Brand Platform Gross Profit.
“Digital Platform Gross Profit Margin” means Digital Platform Gross Profit calculated as a percentage of Digital Platform Services Revenue. We provide fulfilment services to Marketplace consumers and receive revenue from the provision of these services, which is primarily a pass-through cost with no economic benefit to us. Therefore, we calculate our Digital Platform Gross Profit Margin, including Digital Platform third-party and first-party gross profit margin, excluding Digital Platform Fulfilment Revenue.
“Digital Platform Order Contribution” means Digital Platform Gross Profit after deducting demand generation expense, which includes fees that we pay for our various marketing channels. Digital Platform Order Contribution provides an indicator of our ability to extract digital consumer value from our demand generation expense, including the costs of retaining existing consumers and our ability to acquire new consumers.
“Digital Platform Order Contribution Margin” means Digital Platform Order Contribution calculated as a percentage of Digital Platform Services Revenue.
“Digital Platform Revenue” means the sum of Digital Platform Services Revenue and Digital Platform Fulfilment Revenue.
“Digital Platform Services Revenue” means Revenue less Digital Platform Fulfilment Revenue, In-Store Revenue and Brand Platform Revenue. Digital Platform Services Revenue is driven by our Digital Platform GMV, including commissions from third-party sales and revenue from first-party sales.
“Digital Platform Services third-party revenues” represents commissions and other income generated from the provision of services to sellers in their transactions with consumers conducted on our technology platforms, as well as fees for services provided to brands and retailers.
“Digital Platform Services first-party revenues” represents sales of owned-product, including first-party original through our digital platform. The revenue realized from first-party sales is equal to the GMV of such sales because we act as principal in these transactions and, therefore, related sales are not commission based. Digital Platform Services first-party revenues represent sales net of promotional incentives, such as free shipping and promotional codes, where these incentives are not designated as Farfetch-funded.
“Digital Platform Services third-party cost of revenues” and “Digital Platform Services first-party cost of revenues" include packaging costs, credit card fees, and incremental shipping costs provided in relation to the provision of these services. Digital Platform Services first-party cost of revenues also includes the cost of goods sold of the owned products.
“First-Party Original” refers to brands developed by New Guards and sold direct to consumers on the digital platform.
“Gross Merchandise Value” (“GMV”) means the total dollar value of orders processed. GMV is inclusive of product value, shipping and duty. It is net of returns, value added taxes and cancellations. First-party GMV is also net of promotions. GMV does not represent revenue earned by us, although GMV and revenue are correlated.
“In-Store Gross Profit” means In-Store Revenue less the direct cost of goods sold relating to In-Store Revenue.
“In-Store GMV” and “In-Store Revenue” mean revenue generated in our retail stores which include Browns, Stadium Goods and New Guards’ directly operated stores. Revenue realized from In-Store sales for Browns and New Guards’ directly operated stores is equal to GMV of such sales because such sales are not commission based. Revenue realized from In-store sales for Stadium Goods does not equal GMV of such sales as a certain portion of those sales are third-party and are commission based.
6
"Media solutions revenue" is revenue derived from advertising products and solutions provided to luxury sellers to enable them to leverage our luxury audience and first-party data in pursuing their respective marketing opportunities on the Farfetch Marketplace.
“Order Contribution” means gross profit after deducting demand generation expense, which includes fees that we pay for our various marketing channels to support the Digital Platform. Order Contribution provides an indicator of our ability to extract consumer value from our demand generation expense, including the costs of retaining existing consumers and our ability to acquire new consumers.
“Third-Party Take Rate” means Digital Platform Services Revenue excluding revenue from first-party sales, as a percentage of Digital Platform GMV excluding GMV from first-party sales and Digital Platform Fulfilment Revenue. Revenue from first-party sales, which is equal to GMV from first-party sales, means revenue derived from sales on our platform of inventory purchased by us.
Refer to Item 5. “Operating and Financial Review and Prospects – Reconciliations of Non-IFRS and Other Financial and Operating Metrics” for reconciliations of our Non-IFRS measures to the most directly comparable IFRS financial measures.
Market and Industry Data
We obtained industry, market and competitive position data in this Annual Report from our own internal estimates, surveys and research as well as from publicly available information, industry and general publications and research, surveys and studies conducted by third parties, such as public reports by Bain & Company (“Bain”). Information contained in this Annual Report attributable to Bain is from the “Bain-Altagamma Luxury Goods Worldwide Market Study, Fall 2022” (November 15, 2022).
7
CAUTIONARY STATEMENT REGARDING FORWARD-LOOKING STATEMENTS
This Annual Report contains statements that constitute “forward-looking statements” within the meaning of the U.S. Private Securities Litigation Reform Act of 1995. We intend such forward-looking statements to be covered by the safe harbor provisions for forward-looking statements contained in Section 27A of the Securities Act of 1933, as amended, and Section 21E of the Securities Exchange Act of 1934, as amended. These statements are neither promises nor guarantees, but involve known and unknown risks, uncertainties, and other important factors that may cause our actual results, performance or achievements to be materially different from any future results, performance or achievements expressed or implied by the forward-looking statements.
In some cases, these forward-looking statements can be identified by words or phrases such as “believe,” “may,” “will,” “expect,” “estimate,” “project,” “forecast,” “could,” “should,” “anticipate,” “aim,” “intend,” “plan,” “potential,” “continue,” “is/are likely to,” “might,” “target,” “seek” or the negative of these terms and other similar expressions. All statements contained in this Annual Report other than statements of historical fact, including without limitation, statements about the following are forward-looking statements:
These forward-looking statements reflect our current views with respect to future events and are not a guarantee of future performance. Actual outcomes may differ materially from the information contained in the forward-looking statements as a result of a number of factors, including, without limitation, the risk factors described under “Risk Factor Summary” below and the risk factors described in Item 3. “Key Information — D. Risk Factors” of this Annual Report.
The forward-looking statements contained in this Annual Report speak only as of the date of this Annual Report. Except as required by law, we do not undertake to update any forward-looking statement to reflect events or circumstances after that date or to reflect the occurrence of unanticipated events. You should read this Annual Report and the documents that we reference herein and file as exhibits hereto completely and with the understanding that our actual future results may be materially different from what we expect.
8
RISK FACTOR SUMMARY
Our business is subject to numerous risks and uncertainties, including those described in Item 3. “Key Information — D. Risk Factors.” You should carefully consider these risks and uncertainties when investing in our Class A ordinary shares. Principal risks and uncertainties affecting our business include the following:
9
10
PART I
Item 1. Identity of Directors, Senior Management and Advisers
Not applicable.
Item 2. Offer Statistics and Expected Timetable
Not applicable.
Item 3. Key Information
A. [Reserved]
B. Capitalization and Indebtedness
Not applicable.
C. Reasons for the Offer and Use of Proceeds
Not applicable.
D. Risk Factors
An investment in our Class A ordinary shares involves a high degree of risk. You should carefully consider the risks and uncertainties described below, together with all of the other information contained in this Annual Report, including our audited Consolidated financial statements and related notes, before deciding to invest in our Class A ordinary shares. Additional risks not presently known to us or that we currently deem immaterial may also impair our business and operations. Our business, financial condition or results of operations could be materially and adversely affected by any of these risks. In addition to the effects of the COVID-19 pandemic, current geopolitical unrest and the global disruptions discussed in Item 5. “Operating and Financial Review and Prospects,” and the important factors below, additional or unforeseen effects from the COVID-19 pandemic and the global economic climate may give rise to or amplify many of the risks discussed below. The trading price of our Class A ordinary shares could decline due to any of these risks and you could lose all or part of your investment.
Risks Relating to our Business and Industry
General economic factors, pandemics, geopolitical events or other unexpected events may adversely affect our business, financial performance and results of operations.
Our business, financial performance and results of operations depend significantly on worldwide macroeconomic conditions and their impact on consumer spending. Luxury products are discretionary purchases for consumers. Recessionary economic cycles, higher interest rates, volatile fuel and energy costs, inflation, levels of unemployment, conditions in the residential real estate and mortgage markets, access to credit, consumer debt levels, unsettled financial markets and other economic factors that may affect consumer spending or buying habits could materially and adversely affect demand for our products. In addition, volatility in the financial markets has had and may continue to have a negative impact on consumer spending patterns. A reduction in consumer spending or disposable income may affect us more significantly than companies in other industries and companies with a more diversified product offering. Negative national or global economic conditions may also materially and adversely affect our luxury sellers’ financial performance, liquidity and access to capital. This may affect their ability to maintain their inventories, production levels or product quality and could cause them to raise prices, lower production levels or cease operations.
11
Economic factors such as rising interest rates, increased commodity prices, shipping costs, fluctuations in foreign exchange rates, inflation, higher costs of labor, insurance and healthcare and changes in interpretations of laws, regulations or tax regulations have impacted our operations and may also increase our cost of sales and our selling, general and administrative expenses and otherwise adversely affect our financial condition and results of operations. Changes in trade policies, increases in tariffs, the imposition of retaliatory tariffs, including those implemented by the United States, China and Europe, and legislation requiring greater oversight of supply chains may have a material adverse effect on global economic conditions and the stability of global financial markets and may reduce international trade. Moreover, government policies or objectives pursued by countries in which we do business could potentially impact the demand for our goods and services in certain countries.
Geopolitical crises, such as terrorist attacks, war and political instability, including, for example, in connection with the conflict between Russia and Ukraine, labor or trade disputes or other unexpected events, could disrupt our operations, internet or mobile networks or the operations of one or more of our third-party service providers. For example, in Russia we have suspended trade since March 2022 following the imposition of international sanctions. Russia accounted for 6% of GMV in the year ended December 31, 2021 and 0% of GMV since we suspended trade. Sanctions on Russia and the wider conflict are expected to continue to significantly impact our operations in the wider CIS region.
The COVID-19 global pandemic has had and may continue to have an adverse effect on our business and results of operations. In 2022 regional COVID-19 restrictions impacted our operations in mainland China. For example, the COVID-19 related preventative measures established by local government authorities in certain Chinese cities in 2022 in relation to overseas parcels had a direct impact on our operations, including order cancellations, returns and a temporary closure of our Shanghai warehouse and closures of certain partners’ stock points in Hong Kong. These measures also impacted consumer sentiment toward cross-border e-commerce in China, which affected our financial results from the region.
The global supply chain has also been impacted by the COVID-19 pandemic, which could interfere with the ability of the luxury sellers who sell items through the Farfetch Marketplace to deliver products to consumers. While much of our business is conducted online, the COVID-19 pandemic has caused and may continue to cause disruptions or delays in our supply chain, fulfilment network and shipments. For example, since the start of the COVID-19 pandemic, demand for carrier capacity has increased which has resulted in increased costs for carrier services and operational difficulties that could decrease the quality of service provided to our consumers, including delays and lost packages.
We are unable to accurately predict the ultimate impact on our operations that the COVID-19 pandemic will continue to have going forward, due to uncertainties that will be dictated by the length of time that such disruptions continue, which will, in turn, depend on the currently unknowable duration of the COVID-19 pandemic, the impact of government regulations that may be imposed in response to the pandemic, the efficiency and efficacy of vaccination programs and overall changes in consumer behavior.
In addition, rising global average temperatures due to the increased concentrations of carbon dioxide and other greenhouse gases in the atmosphere are causing significant changes in weather patterns around the globe and an increase in the frequency and severity of certain natural disasters. If any such event were to impact our facility in Guimarães, Portugal, where the vast majority of our production processes take place, our operations may be disrupted. Changes in weather patterns and the increased frequency, intensity and duration of extreme weather events (e.g., floods, droughts and severe storms) could, among other things, disrupt our logistics operations and our ability to source and distribute products in a timely manner, impact the operation of our New Guards business’ supply chain, disrupt our brick-and-mortar retail operations, increase our product costs and impact the types of fashion products that consumers purchase. As a result, the effects of climate change could have short and long-term impacts on our business and operations.
12
Purchasers of luxury products may not choose to shop online, which would prevent us from growing our business.
Our success depends, in part, on our ability to attract additional consumers who have historically purchased luxury products through traditional offline retailers rather than online. The online market for luxury products is less developed than the online market for other goods and services such as books, music, travel and other consumer products. If the online market for personal luxury goods does not gain widespread acceptance, our business may suffer. Furthermore, we may have to incur higher and more sustained advertising and promotional expenditures or offer more incentives than we currently anticipate in order to attract additional online consumers and convert them into purchasing consumers. Specific factors that could prevent consumers from purchasing luxury products from us online include:
We have seen the increased adoption of online channels by luxury consumers since the onset of the COVID-19 pandemic. However, we cannot guarantee that this trend will continue or accelerate, particularly if traditional brick-and-mortar stores become more attractive to consumers as COVID-19-related restrictions are lifted. Further, if this change in consumer behavior represents a secular trend toward online purchases for luxury products by consumers, we cannot guarantee that we will continue to capitalize on this trend, including through FPS, or that our competitors will not capitalize on this trend more successfully.
If the online market for luxury products does not continue to develop and grow, or should we not succeed in leveraging such growth, our business will not grow and our results of operations, financial condition and prospects could be materially adversely affected.
We may be unable to generate sufficient revenue to be profitable or to generate positive cash flow on a sustained basis, and our revenue growth rate may decline.
We cannot assure you that we will generate sufficient revenue to offset the cost of maintaining and growing our platform and business. Our revenue increased from $2,256.6 million for the fiscal year ended December 31, 2021 to $2,316.7 million for the fiscal year ended December 31, 2022. Our revenue growth rate has declined in the past and may decline in the future because of a variety of factors, including increased competition and the maturation of our business. We cannot guarantee that our revenue will continue to grow. You should not consider our historical revenue growth or operating expenses as indicative of our future performance. If our revenue declines or our operating expenses exceed our expectations, our financial performance will be adversely affected.
13
Additionally, we also expect our costs to increase in future periods. As we undertake initiatives to rationalize our cost base, we are also allocating investment to deliver on strategic initiatives, which could negatively affect our future operating results and ability to achieve and sustain profitability. We expect to continue to expend financial and other resources on acquiring and retaining consumers, our technology infrastructure, research and development, including investments in our research and development team and the development of new features, sales and marketing, international expansion, and general administration, including expenses related to being a public company. These investments may not result in increased revenue or growth in our business. If we are unable to earn revenue at a rate that exceeds the costs associated with our business, we will not be profitable or generate positive cash flow on a sustained basis. If we fail to continue to grow our revenue and overall business, our business, results of operations, financial condition and prospects could be materially adversely affected.
We have experienced losses in the past, and we may experience losses in the future.
We have experienced losses after tax in the past, including without limitation $3,315.6 million and $393.5 million in the years ended December 31, 2020 and 2019, respectively. Our ability to generate and sustain significant additional revenues and maintain after tax profitability will depend on, among other things, our ability to increase our levels of sales and attract consumers cost effectively, and the impact of the factors discussed elsewhere in this “Risk Factors” section, including macroeconomic and geopolitical factors. In addition, our after tax profitability can be significantly impacted by fair value remeasurements on our borrowings and related embedded derivatives recorded for accounting purposes. Refer to Note 20, Borrowings and embedded derivatives, within our Consolidated financial statements included elsewhere in this Annual Report. We may experience significant losses after tax in the future, and we cannot assure you that we will sustain profitability in future periods. In addition, our level of profitability cannot be predicted and may vary significantly from period to period.
Luxury sellers set their own prices for the products they make available on our Marketplaces, which could affect our ability to respond to consumer preferences and trends.
We do not control the pricing strategies of our luxury sellers on our Marketplaces (other than for our Group entities, i.e., Browns, Stadium Goods first-party sales, Violet Grey and the New Guards portfolio of brands when sold direct-to-consumer via our Marketplaces), which could affect our revenue and our ability to effectively compete with other distribution channels used by our luxury sellers, including e-commerce retailers and brick-and-mortar stores. Furthermore, luxury sellers’ pricing on our Marketplaces, including certain region-specific pricing, may adversely affect a consumer’s shopping experience, which may encourage them to shop through other online or offline retailers. In addition, luxury sellers may determine that they can more competitively price their products through other distribution channels and may choose such other channels instead of listing products on our Marketplaces.
The global catalogue and competitive pricing of our partners are key features of the Farfetch Marketplace. However, when brands adopt models that restrict the distribution of goods in certain geographies and/or the ability of their distributors to sell products via marketplaces (including the Farfetch Marketplace) such distribution models may reduce the Farfetch Marketplace catalogue available to consumers in particular geographies. For example, during 2022, a limited number of brands sought to limit their distributors from selling their products on the Farfetch Marketplace, which impacted the supply and pricing of their products on the Marketplace. The adoption by brands of certain distribution models, including “selective distribution” models, may therefore lead to reduced supply and lost sales in key geographies, and could negatively affect our business, results of operation, financial condition and prospects.
14
Additionally, where permitted by law, luxury sellers often employ different pricing strategies based on the geographical location of consumers, which is accomplished online through blocking a consumer’s ability to access certain websites based on geography. EU legislation, which took effect in December 2018, prohibits such “geo-blocking” in the European Economic Area (“EEA”), which could cause brands to change their distribution strategies, including with respect to the Farfetch Marketplace. In addition, the EU Platform-to-Business Regulation (Regulation (EU) 2019/1150) on promoting fairness and transparency for business users of online intermediation services entered into force on July 12, 2020. This regulation introduced a number of new obligations on marketplaces, including disclosing the main parameters they use to rank goods and services on their sites, any advantage they may give to their own products over others, access that marketplace users may have to data generated through their use of the service and dispute remedies. These rules could adversely affect our business, results of operations, financial condition and prospects.
The luxury fashion industry can be volatile and difficult to predict.
As a global platform for luxury fashion, we are subject to variable industry conditions. Consumer demand can quickly change depending on many factors, including the behavior of both online and brick-and-mortar competitors, promotional activities of competitors, rapidly changing tastes and preferences, frequent introductions of new and innovative products and services, advances in technology and the internet, macroeconomic conditions impacting discretionary spending, especially in light of the COVID-19 pandemic, fluctuations in foreign exchange rates, the conflict between Russia and Ukraine, rising interest rates and geopolitical factors, many of which are beyond our control. In the year ended December 31, 2022, for example, we saw consumers on balance shift purchases toward items in lower price point categories. Average Order Value decreased 6.3% for the year ended December 31, 2022, as compared to the year ended December 31, 2021.
As another example, over the last few years the industry experienced a trend toward promotional activity. While we believe promotional activity by luxury retailers may decrease in 2023 as brands continue to become more disciplined and increasingly move towards an e-concession model, macroeconomic factors that impact retailers’ buying and consumers’ purchasing decisions may delay such a shift as omni-channel retailers seek to optimize their inventory positions.
Promotional activity can have a material adverse effect on our results of operations, in particular on our gross margins and order contribution metrics, our prospects and our relationships with our luxury sellers. Alternatively, if we do not engage in promotional activity, in particular if we do not match competitors’ promotional activity, which is the approach we took in 2022, it may adversely impact consumer demand across our platform, which in turn may impact our overall market share capture and have a material adverse impact on our business, results of operations and prospects. We also may decide not to incentivize promotional activity by our retailers by not funding, by reducing our funding for, or by requiring our luxury sellers to fund in whole or part, promotional events on the Farfetch Marketplace, which could adversely impact our relationships with our luxury sellers. When the luxury retail market experiences increased promotional activity, we may not be successful in responding in a manner that does not also adversely impact our results of operations.
Changes in consumer demand or tastes may also impact our ability to deliver expected margins on inventory within our first-party and first-party original businesses. As a result of this constantly changing environment, our future business strategies, practices and results may not meet expectations or respond quickly enough to consumer demand and we may face operational difficulties in adjusting to any changes in consumer demand. Any of these developments could harm our business, results of operations, financial condition and prospects.
15
We rely on a limited number of luxury sellers for the supply of products that we make available to consumers on the Farfetch Marketplace.
We rely on a limited number of luxury sellers for the supply of products available on the Farfetch Marketplace. In the year ended December 31, 2022, 12.5% of our Marketplace GMV was from our top ten multi-brand boutiques, excluding Browns, and 12.2% of our Marketplace GMV was from our top ten brand partners, excluding brands in the New Guards portfolio. We cannot guarantee that these luxury sellers will always choose to use the Farfetch Marketplace to sell their products. We have in the past been, and may in the future be, unsuccessful in our efforts to retain certain top brand partners. We also typically enter into one-year contracts with our luxury sellers, and there is no guarantee our luxury sellers will renew these contracts upon expiration, which currently automatically renew every year unless either party serves ninety days’ notice of termination for partners operating under our standard template. Other than Browns, Stadium Goods, Violet Grey and the brands in the New Guards portfolio, we cannot control whether a luxury seller chooses to make any of its supply available on the Farfetch Marketplace, and brands may not appreciate our value proposition. Further, other entities may, on their own, take actions that adversely affect our business such as creating their own marketplace that could directly compete with us. In addition, our luxury sellers may choose to increase supply and range of supply available on our competitors’ sites instead of ours. Our business also may be adversely affected if our access to products is limited or delayed because of a deterioration in our relationships with one or more of our luxury sellers, delays in deliveries of merchandise, including due to production slowdowns or other distribution disruptions, changes to their supply cycles, reductions in new seasonal products, or if they choose to not sell their products with us for any other reason. Supply chain disruptions resulting from the COVID-19 pandemic and the United Kingdom’s withdrawal from the European Union, for example, also negatively affected our luxury sellers in the past and if such delays were to re-appear, including as a result of macroeconomic or geopolitical events, they could have an adverse effect on our results of operations. Moreover, if we fail to successfully retain current, as well as acquire new, luxury sellers on our platform, our business, results of operations, financial condition and prospects could be materially adversely affected.
Our efforts to acquire or retain consumers may not be successful, which could prevent us from maintaining or increasing our sales.
If we do not promote and sustain our brand and platform through marketing and other tools, we may fail to build and maintain the critical mass of consumers required to increase our sales. Promoting and positioning our brand and platform, as well as the Browns, Stadium Goods and Violet Grey brands and the New Guards portfolio of brands, will depend largely on the success of our marketing efforts (including how we allocate resources among brand and direct marketing), our ability to understand and attract consumers cost effectively and our ability to consistently provide a high-quality product and user experience. In order to acquire and retain consumers, we have incurred and will continue to incur substantial expenses related to advertising and other marketing efforts, including investments in our ACCESS loyalty program. To the extent we are successful in retaining our existing customers, they may choose to purchase products with lower AOVs. Similarly, to the extent we are successful in acquiring new consumers, they may not be our most valuable consumers. We also may not be able to predict the behavior of new consumers as well as we do for existing consumers. We may use promotions to drive sales, which may not be effective and may adversely affect our gross margins. Our investments in marketing may not effectively reach potential consumers and the spend of consumers that purchase from us may not yield the intended return on investment. Our ability to measure the effectiveness of our brand marketing remains relatively limited. Updates implemented by Apple in relation to the Identifier for Advertisers (“IDFA”) have adversely impacted our ability to target and measure the effectiveness of our new and existing consumer and retention marketing; and similar privacy measures by search engine and other companies could impact our ability to do so in the future. For example, in February 2022, Google announced plans to adopt new privacy restrictions to curtail tracking across apps on Android smartphones. In addition, the United States or other governments may take administrative, legislative, or regulatory action that could interfere with certain marketing efforts in particular jurisdictions. A failure of our marketing activities could also adversely affect our ability to attract new and maintain existing relationships with our consumers and our luxury sellers, which may have a material adverse effect on our business, results of operations, financial condition and prospects.
16
If our luxury sellers fail to anticipate, identify and respond quickly to new and changing luxury trends in consumer preferences, our business could be harmed.
The luxury apparel, footwear and accessories available on our Marketplaces are subject to rapidly changing luxury trends and constantly evolving consumer tastes and demands. Our success is dependent on the ability of our luxury sellers, including Browns, Stadium Goods, Violet Grey and the New Guards portfolio of brands, to anticipate, identify and respond to the latest luxury trends and consumer demands and to translate such trends and demands into product offerings in a timely manner. The failure of our luxury sellers to anticipate, identify or react swiftly and appropriately to new and changing styles, trends or desired consumer preferences, to accurately anticipate and forecast demand for certain product offerings or to provide relevant and timely product offerings to list on our Marketplaces may lead to lower demand for merchandise on our Marketplaces, which could cause, among other things, declines in GMV sold through our Marketplaces. If our FPS clients or our luxury sellers, including Browns, Stadium Goods, Violet Grey and the New Guards portfolio of brands are not able to accurately anticipate, identify, forecast, analyze or respond to changing luxury trends and consumer preferences, we may lose consumers and market share, which could have a material adverse effect on our business, results of operations, financial condition and prospects.
In addition, New Guards’ success depends in large part on the brands in its portfolio being able to originate and define luxury product trends, as well as to anticipate, gauge, and react to changing consumer demands in a timely manner. Their products must appeal to consumers worldwide whose preferences cannot be predicted with certainty and are subject to rapid change and influenced by luxury trends and current economic conditions, among other factors. This challenge is further compounded by the increasing use of digital and social media by consumers and the speed by which information and opinions are shared across the globe. We cannot assure that the brands in New Guards’ current or future portfolio will be able to continue to develop appealing styles or successfully meet constantly changing consumer demands in the future. In addition, we cannot assure that any new products or brands that we introduce will be successfully received by consumers. In particular, the majority of New Guards’ existing brands, including its largest brands, Off-White and Palm Angels, are currently focused on luxury streetwear and should consumer preferences for streetwear decline that could have a significant impact on our business. Failures of brands in the New Guards portfolio to anticipate, identify, and respond effectively to changing consumer demands and trends could adversely affect retail and consumer acceptance of their products and leave us with a substantial amount of unsold inventory or missed opportunities. Conversely, if we underestimate consumer demand for these brands’ products or if manufacturers fail to supply quality products in a timely manner, we may experience inventory shortages. Any of these outcomes could have a material adverse effect on our business, results of operations and financial condition.
Our software is highly complex and may contain undetected errors.
The software underlying our sites is highly complex and may contain undetected errors or vulnerabilities, some of which may only be discovered after the code has been released. We have in place a software engineering practice known as “continuous deployment,” meaning that we typically release software code multiple times per day. This practice may result in more frequent introduction of errors or vulnerabilities into the software underlying our sites. Any errors or vulnerabilities discovered in our code after release could result in damage to our reputation, loss of consumers, disruption to our operations, decline of net sales or liability for damages, any of which could adversely affect our business, financial condition, result of operations and prospects.
Our failure or the failure of third parties to protect our or their sites, networks and systems against security breaches, or otherwise to protect our or consumers’ and luxury sellers’ confidential information, could damage our reputation and brand and substantially harm our business and operating results.
We collect, maintain, transmit and store data about our consumers, luxury sellers and others, including credit card information (and other payment information) and other personal information, as well as other confidential and proprietary information about our business plans and activities.
17
We also engage third-parties that store, process and transmit these types of information on our behalf. We rely on encryption and authentication technology licensed from third parties in an effort to securely transmit confidential and sensitive information, including credit card numbers. Advances in computer capabilities, new technological discoveries or other developments may result in the whole or partial failure of this technology to protect transaction data or other confidential and sensitive information from being breached or compromised. In addition, e-commerce websites are often attacked through compromised credentials, including those obtained through phishing and credential stuffing. Our security measures, and those of our third-party service providers, may not detect or prevent all attempts to breach our or their systems, denial-of-service attacks, viruses, malicious software, break-ins, phishing attacks, ransomware attacks, social engineering, security breaches or other attacks and similar disruptions that may jeopardize the security of information stored in or transmitted by our or their websites, networks and systems or that we or such third parties otherwise maintain, including payment card systems, which may subject us to fines or higher transaction fees or limit or terminate our access to certain payment methods. We and such third parties may not anticipate or prevent all types of attacks until after they have already been launched. We may not be able to adjust our security measures fast enough to keep pace with the evolving nature of cybersecurity risks, which could negatively impact our operations. Techniques used to obtain unauthorized access to or sabotage systems change frequently and may not be known until launched against us or our third-party service providers. In addition, security breaches can also occur as a result of non-technical issues, including intentional or inadvertent breaches by our employees or by third parties. These risks may increase over time as we grow our business, including as a result of acquisitions, and as the complexity and number of technical systems and applications we use increases.
Breaches of our security measures or those of our third-party service providers or cyber security incidents could result in unauthorized access to our sites, networks and systems; unauthorized access to and misappropriation of consumer information, including consumers’ personal data, or other confidential or proprietary information; viruses, worms, spyware or other malware being served from our sites, networks or systems; deletion or modification of content or the display of unauthorized content on our sites; interruption, disruption or malfunction of operations; costs relating to breach remediation, deployment of additional personnel and protection technologies; governmental investigations and media inquiries and coverage; engagement of third-party experts and consultants; litigation, regulatory action and other potential liabilities. In the past, we have been the target of social engineering, phishing, malware and similar attacks and threats of denial-of-service attacks; and further attacks of this type in the future could have a material adverse effect on our operations. If any of these breaches of security should occur, our reputation and brand could be damaged, our business may suffer, we could be required to expend significant capital and other resources to alleviate problems caused by such breaches, and we could be exposed to a risk of loss, litigation or regulatory action and possible liability. In addition, with a subset of our employees, and employees of our third-party service providers, working from home as a result of flexible work policies, our data and information technology infrastructure is subject to greater exposure than in an office environment, which carries an increased risk that our security measures or those of our third-party service providers could be compromised. We cannot guarantee that recovery protocols and backup systems will be sufficient to prevent data loss. Actual or anticipated attacks may cause us to incur costs, including costs to deploy additional personnel and protection technologies, train employees and engage third-party experts and consultants. In addition, any party who is able to illicitly obtain a consumer’s password could access the consumer’s transaction data or personal data, resulting in the perception that our systems are insecure.
Any compromise or breach of our security measures, or those of our third-party service providers, could violate applicable privacy, data protection, data security, network and information systems security and other laws and cause significant legal and financial exposure, adverse publicity and a loss of confidence in our security measures, which could have a material adverse effect on our business, results of operations, financial condition and prospects. We continue to devote significant resources to protect against security breaches and in the future we may need to address problems caused by breaches, including notifying affected subscribers and responding to any resulting litigation, which in turn, would divert resources from the growth and expansion of our business. Our insurance policies have coverage limits and may not be adequate to reimburse us for all losses caused by security or personal data breaches.
18
We may not succeed in promoting and sustaining our brand, which could have an adverse effect on our future growth, reputation, business and sales.
A critical component of our future growth is our ability to promote and sustain our brand, which we believe can be achieved by providing a high-quality user experience. An important element of our brand promotion strategy is establishing a relationship of trust with our consumers. In order to provide a high-quality user experience, we have invested and intend to continue to invest substantial amounts of resources in the development and functionality of our platform, website, technology infrastructure, fulfilment and customer service operations. Our ability to provide a high-quality user experience is also highly dependent on external factors over which we may have little or no control, including, without limitation, the reliability and environmental, social, governance, operational, and commercial performance of our luxury sellers, suppliers, third-party warehousing providers and third-party carriers. If our consumers are dissatisfied with the quality of the products sold on our platform or the customer service they receive and their overall customer experience, or if we or our service providers cannot deliver products to our consumers in a timely manner or at all, or if our consumers are dissatisfied with the environmental, social or governance performance of our luxury sellers, suppliers, third-party warehousing providers and third-party carriers, our consumers may stop purchasing products from us. In addition, failures by any of New Guards’ brands to provide consumers with high-quality products and high-quality customer experiences for any reason (including environmental, social and governance ("ESG") reasons) could substantially harm the reputation of that brand and the New Guards portfolio of brands more generally, which could have a material adverse effect on its business, results of operations, financial condition and prospects. We also rely on third parties for information, including product characteristics and availability shown on the Farfetch Marketplace, that may be inaccurate.
Our failure to provide our consumers with high-quality products and high-quality user experiences for any reason (including ESG reasons) could substantially harm our reputation and adversely impact our efforts to develop Farfetch as a trusted brand, which could have a material adverse effect on our business, results of operations, financial condition and prospects.
Our growth depends in part on the success of our FPS business.
We anticipate that our FPS business, our modular business-to-business e-commerce solution for brands and retailers, will represent a significant driver of our future growth. FPS builds and operates modular e-commerce and technology solutions for luxury brands and retailers, utilizing the proprietary Farfetch platform; and offers luxury sellers ancillary services, including digital marketing, production, and customer service. The growth of our FPS business is dependent on our ability to sign new clients and sell additional or new modules to our existing clients. The success of FPS is also dependent on our ability to meet the launch deadlines agreed with our FPS partners and the ongoing requirements included in agreements with our FPS partners. Our ability to successfully meet deadlines and execute on our contractual commitments may be impacted by risks or uncertainties associated with our FPS partners that are out of our control, including: if our FPS partners change the features of their offerings in a manner that is adverse to us; the ability of our FPS partners to successfully integrate our modular enterprise offering into their ecosystem; if our FPS partners do not perform as expected under our agreements or under their agreements with their merchants; if we have disagreements or disputes with such providers; or if our FPS partners decide to not continue their agreements with us at the end of their term or choose to enter into agreements with our competitors instead, any of which could negatively impact our growth and results of operations. In addition, if we fail to integrate our modular enterprise solution with new offerings that our third-party partners want or need, our FPS business could be adversely affected.
19
Fluctuations in exchange rates may adversely affect our results of operations.
Our financial information is presented in U.S. dollars, which differs from the underlying functional currencies of certain of our subsidiaries (including New Guards whose functional currency is the euro), exposing us to foreign exchange translation risk on consolidation. This risk is currently not hedged and therefore our results of operations have in the past, and will in the future, fluctuate due to movements in exchange rates when currencies are translated into U.S. dollars. For example, these fluctuations are reflected in our reported Group revenue growth; for the year ended December 31, 2022 our reported Group revenue growth was 2.7% year-over-year, while on a constant currency basis reported Group revenue growth would have been 11.9% year-over year. In addition, macroeconomic factors, including geopolitical uncertainty could lead to increased volatility in the currency markets, which would exacerbate such fluctuations. At a subsidiary level we are exposed to transactional foreign exchange risk because we earn revenues and incur expenses in a number of different foreign currencies relative to the relevant subsidiary’s functional currency, mainly the pound sterling and the euro. Movements in exchange rates therefore impact our subsidiaries and thus, our consolidated results and cash flows. We hedge a portion of our core transactional exposures using forward foreign exchange contracts and foreign exchange option contracts; however, we are exposed to fluctuations in exchange rates on the unhedged portion of the exposures that could harm our business, results of operations, financial condition and prospects. In addition, as our operational and financial forecasts drive our hedging program, should our results of operations differ materially from those forecasts, our hedging program may not be sufficient to adequately mitigate the exposure to currency risk across a given period.
We rely on information technologies and systems to operate our business and maintain our competitiveness, and any failure to invest in and adapt to technological developments and industry trends could harm our business.
We depend on the use of sophisticated information technologies and systems, including technology and systems used for websites and apps, data analytics, customer service, supplier connectivity, communications, fraud detection, enterprise resource planning, inventory management, warehouse management and administration. As our operations grow in size, scope and complexity, we will need to continuously improve and upgrade our systems and infrastructure to offer an increasing number of consumer-enhanced services, features and functionalities, while maintaining and improving the reliability and integrity of our systems and infrastructure. In addition, with a subset of our employees continuing to work from home as a result of the flexible work policies, our information technologies and systems may become strained.
Our future success also depends on our ability to adapt our services and infrastructure to meet rapidly evolving consumer trends and demands while continuing to improve our platform’s performance, features and reliability. The emergence of alternative platforms and niche competitors who may be able to optimize such services or strategies, may require us to continue to invest in new and costly technology. We may not be successful in developing and adopting new technologies that operate effectively across multiple devices and platforms and that are appealing to consumers, which would negatively impact our business and financial performance. New developments in other areas, such as cloud computing providers, could also make it easier for competitors to enter our markets due to lower up-front technology costs. In addition, we may not be able to maintain our existing systems or replace our current systems or introduce new technologies and systems as quickly or cost effectively as we desire. Failure to invest in and adapt to technological developments and industry trends may have a material adverse effect on our business, results of operations, financial condition and prospects.
20
Any significant disruption in service on our websites or apps or in our computer systems, some of which are currently hosted by third-party providers, could damage our reputation and result in a loss of consumers, which would harm our business and results of operations.
Our brand, reputation and ability to attract and retain consumers depend upon the reliable performance of our network infrastructure and content delivery processes. We have experienced interruptions in these systems in the past, including server failures that temporarily slowed down or interfered with the performance of our websites and apps, or particular features of our websites and apps, and we may experience interruptions in the future, including in light of the COVID-19 pandemic. For example, in 2022 there were a total of fourteen interruptions and outages on our website that ranged in time from one to approximately ninety-nine minutes, resulting in platform availability of 99.96%, in which our customers experienced difficulties involving, among others, the inability to use our payment systems, the unavailability of thousands of products and our product catalogue and the inability to complete their checkout process. Interruptions in these systems, whether due to system failures, human input errors, computer viruses or physical or electronic break-ins and denial-of-service attacks on us, third-party vendors or communications infrastructure, could affect the availability of our services on our platform and prevent or inhibit the ability of consumers to access our websites and apps or complete purchases on our websites and apps. Volume of traffic and activity on our Marketplaces and our FPS clients’ sites spikes on certain days, such as during a “Black Friday” promotion, and any interruption would be particularly problematic if it were to occur at such a high-volume time. Problems with the reliability of our systems could prevent us from earning revenue or commissions and could harm our reputation. Damage to our reputation, any resulting loss of consumer, retailer or brand confidence and the cost of remedying such problems could negatively affect our business, results of operations, financial condition and prospects.
Substantially all of the communications, network and computer hardware used to operate our website are strategically located, for convenience and regulatory reasons, at facilities in Portugal, Netherlands, China, the United States, Ireland and Brazil. Our ability to maintain communications, network, and computer hardware in these countries is, or may in the future be, subject to regulatory review and licensing, and the failure to obtain any required licenses could negatively affect our business. We either lease or own our servers and have service agreements with data center providers. Our systems and operations are vulnerable to damage or interruption from fire, flood, power loss, telecommunications failure, terrorist attacks, acts of war, electronic and physical break-ins, computer viruses, earthquakes and similar events. The occurrence of any of the foregoing events could result in damage to our systems and hardware or could cause them to fail completely, and our insurance may not cover such events or may be insufficient to compensate us for losses that may occur. Our systems are not completely redundant, so a system failure at one site could result in reduced platform functionality for our consumers, and a total failure of our systems could cause our websites or apps to be inaccessible by some or all of our consumers.
We depend on third parties to provide services in support of our website and fulfillment operations technology, and any failure on their part could lead to a disruption of our business. Problems faced by our third-party service providers with the telecommunications network providers with whom they contract or with the systems by which they allocate capacity among their users, including us, could adversely affect the experience of our consumers. Our third-party service providers could decide to close their facilities without adequate notice, including in response to government-mandated restrictions or for health and safety reasons. Any financial difficulties, such as bankruptcy or reorganization, faced by our third-party service providers or any of the service providers with whom they contract, may have negative effects on our business, the nature and extent of which are difficult to predict. If our third-party service providers are unable to keep up with our needs for capacity, particularly in light of increased usage during the COVID-19 pandemic, it could have an adverse effect on our business. Any errors, defects, disruptions or other performance problems with our services could harm our reputation and may have a material adverse effect on our business, results of operations, financial condition and prospects.
21
The growth of our business may adversely impact our ability to successfully utilize our data and impact our sustained growth.
We employ a comprehensive approach to data analytics and data-led insights that helps guide our business strategy and operations. We utilize data collected through our digital platform, brand platform and in-store operations, including consumer data, to inform our approach to marketing, consumer targeting and expanding our reach. For example, we apply data science and machine learning technologies to facilitate the personalization of the consumer experience, use data insights to drive consumer acquisition, leverage data in support of our Luxury New Retail strategy (including in relation to FPS and connected retail) and our Farfetch Media Solutions business, and use proprietary data logistic insights in our fulfillment services. However, the growth of our business may negatively impact data design, organization and accessibility across our operations. If we are unable to adequately utilize our data in support of our operations due to growth-driven fragmentation or technical limitations, our ability to attract new consumers to our Marketplaces, retain existing consumers, and continue the advancement of online and offline integrations could be impaired. We will also need to adapt our approach to the design, organization and accessibility of data across our business to keep pace with our growth and technological developments and regulatory requirements. Any failure by us to adequately integrate such advancements in our approach to data management could harm our ability to leverage data, including consumer data, collected through our technology and our systems, which could have a negative effect on our business.
We may not be able to manage our growth or cost rationalization initiatives effectively, which may adversely affect our corporate culture.
Over the past several years we have expanded our operations, including through the New Guards acquisition, Stadium Goods acquisition and our strategic partnership with Alibaba and Richemont; and may expand further as we pursue our growth strategies. Such expansion increases our complexity and places a significant burden on our management, operations, technical systems, financial resources and internal control over financial reporting functions. Our current and planned personnel, systems, procedures and controls may not be adequate to support and effectively manage our future operations. We continue to transition our business, financial systems and operating model to a scale and organization that reflects the size, scope and complexity of our operations, and the process of migrating our legacy systems could disrupt our ways of working and ability to timely and accurately process information, which could adversely affect our results of operations and cause harm to our reputation.
In 2022, we launched a number of cost rationalization initiatives for the purpose of optimizing our cost base. These initiatives have focused on fundamentally restructuring our fixed cost base, re-allocating headcount to deliver on strategic projects such as our partnerships with Reebok, Neiman Marcus Group and Ferragamo, and reducing headcount in other areas. Our cost rationalization initiatives are subject to known and unknown risks and uncertainties, including whether we have targeted the appropriate areas and at the appropriate scale, and whether, if required in the future, we will be able to target any additional areas for cost savings. Implementation of our cost rationalization initiatives may be disruptive to our business, the expected costs and charges may be greater than we have forecasted, and the estimated cost savings may be lower than we have forecasted. As such, the actions we are taking and that we may decide to take in the future may not be successful in yielding our intended results.
In addition, certain aspects of our cost rationalization initiatives, such as severance costs in connection with reducing headcount in certain areas of our business, could negatively impact our cash flows. Our initiatives could result in personnel attrition beyond our planned reduction in headcount or reduced employee morale, which could in turn adversely impact productivity, including through a loss of continuity, loss of accumulated knowledge and/or inefficiency during transitional periods, or impact our ability to attract highly skilled employees. Unfavorable publicity about us or any of our cost rationalization initiatives could result in reputational harm and could diminish confidence in, and the use of, our products and services. As a result, we may not be able to manage our cost rationalization effectively.
22
Our culture is important to us, and we believe it has been a major competitive advantage and contributor to our success. We may have challenges maintaining our culture or adapting it sufficiently to meet the needs of our future operations. This is heightened as we adapt to longer-term hybrid ways of working across all of our global offices. In addition, our ability to maintain our culture as a public company, and in a remote environment, with the attendant changes in policies, practices, corporate governance and management requirements may be challenging. Failure to maintain our culture could have a material adverse effect on our business, results of operations, financial condition and prospects.
We face significant competition in the global retail industry and may be unsuccessful in competing against current and future competitors.
The global retail industry is intensely competitive. Online retail is rapidly evolving and is subject to changing technology, shifting consumer preferences and tastes, increased convergence with offline retail and frequent introductions of new products and services. We face competition from technology enablement companies, marketplaces, platforms, luxury sellers and enterprise solutions providers. Technology enablement companies are those that enable commerce, such as Shopify or Square, and white-label service providers that offer end-to-end solutions. Luxury sellers are typically either larger more established companies, such as luxury department stores, luxury brand stores or online retailers, or multichannel players that are luxury brand or independent retailers operating brick-and-mortar and/or online stores (most notably those with an online presence), and these luxury sellers may have longer operating histories, greater brand recognition, existing consumer and supplier relationships and significantly greater financial, marketing and other resources. Additionally, larger competitors seeking to establish an online presence in luxury fashion may be able to devote substantially more resources to website systems development and exert greater leverage over the supply chain for luxury products than we can. For example, in 2020 Amazon.com, Inc. launched “Amazon Luxury Stores.” Larger competitors may also be better capitalized to opportunistically acquire, invest in or partner with other domestic and international businesses. Such opportunistic acquisitions and investments may accelerate in an economic downturn. We believe that companies with a combination of technical expertise, brand recognition, financial resources and e-commerce experience also pose a significant threat of developing competing luxury fashion distribution technologies. In particular, if known incumbents in the e-commerce space choose to offer competing services, they may devote greater resources than we have available, have a more accelerated timeframe for deployment and leverage their existing user base and proprietary technologies to provide services or a user experience that our consumers may view as superior. We also compete with regionally focused luxury e-commerce companies who may have a competitive advantage because of their greater understanding of, and focus on, the local customer, as well as their established local brands.
The trend toward the online adoption of e-commerce platforms by consumers, including in the luxury sector, could increase competition as retailers and brands that have not typically participated in e-commerce may establish an online presence. For example, we have recently seen a number of luxury players shift, or announce plans to shift, from a wholesale model to a hybrid wholesale and marketplace model; and have seen brands increasingly focus on prioritizing their own online channels. This may create new competitors or increase pressure from our existing competitors.
Online retail companies and marketplaces, including emerging startups, and other new entrants, may be able to innovate and provide products and services faster than we can, and they may be willing to price their products and services more aggressively in order to gain market share. Additionally, competitors may rely on markdowns or promotional sales to dispose of excess inventory, which could put pressure on us to follow suit, which could have an adverse effect on our gross margins and results of operations. As luxury products are often discretionary purchases for consumers, a reduction in consumer spending or disposable income or an increase in cost of living resulting from an inflationary environment may affect us more significantly than competitors with a more diversified product offering.
23
We also may choose to expand into additional categories, as we have in the past, which may not be successful. For example, our Farfetch Media Solutions business, which provides luxury sellers advertising products and solutions to drive awareness and engagement, is a growing business and may not be able to compete successfully as it increases its scale due to a number of factors including global macroeconomic conditions. If our competitors are more successful in offering compelling products or categories or in attracting and retaining consumers than we are, our revenue and growth rates could decline. If we are unable to compete successfully, or if competing successfully requires us to expend significant resources in response to our competitors’ actions, our business, results of operations, financial condition and prospects could be materially adversely affected.
We are subject to governmental regulation and other legal obligations related to privacy, data protection and information security. If we are unable to comply with these, we may be subject to governmental enforcement actions, litigation, fines and penalties or adverse publicity.
We collect personal data and other data from our consumers and prospective consumers for a number of purposes. We use this information to provide services and relevant products to our consumers, to support, expand and improve our business, and to tailor our marketing and advertising efforts. We store, handle, and process personal data on our own information systems, as well as through arrangements with third parties and service providers. As a result, we are subject to governmental regulation and other legal obligations related to the protection of personal data, privacy and information security in certain countries where we do business and there has been, and will continue to be, a significant increase globally in such laws that govern, restrict or affect the collection, storage, sharing or use of data collected from or about individuals and their devices. Existing and future laws and regulations, or the inconsistent enforcement of such laws and regulations, including with regard to data localization requirements, could impede the growth of e-commerce or online marketplaces and negatively impact our business and operations. Moreover, any noncompliance with privacy, data protection or information security laws could result in proceedings against us by one or more data protection authorities, other public authorities, third parties, or individuals.
In Europe, where we have significant business operations, we are subject to the EU General Data Protection Regulation 2016/679 and applicable national supplementing laws (collectively, the “EU GDPR”) and the UK General Data Protection Regulation and Data Protection Act 2018 (collectively, the “UK GDPR”) (the EU GDPR and UK GDPR together referred to as the “GDPR”). The GDPR imposes comprehensive data privacy compliance obligations in relation to our collection, processing, sharing, disclosure and other use of data relating to an identifiable living individual, including a principle of accountability and the obligation to demonstrate compliance through policies, procedures, training and audit. We are also subject to onerous restrictions and evolving regulatory guidance on cross-border transfers of such data. Failure to comply with the GDPR could result in penalties for noncompliance. Since we are subject to the supervision of relevant data protection authorities under both the EU GDPR and the UK GDPR, we could be fined under each of those regimes independently in respect of the same breach. Penalties for certain breaches are up to the greater of €20 million / £17.5 million or 4% of our global annual turnover. In addition to fines, a breach of the GDPR may result in regulatory investigations, reputational damage, orders to cease or change our data processing activities, enforcement notices, assessment notices (for a compulsory audit) or civil claims (including class actions). We are subject to other laws around the world, including the Brazil General Data Protection Law and the UAE Data Protection Law, with substantially similar requirements to the GDPR and similar penalties for noncompliance.
The UK 2018 Network and Information Systems Regulations apply to us as an online marketplace and place additional network and information systems security obligations on us, as well as mandatory security incident notifications in certain circumstances with penalties of up to £17 million. Additionally, the EU Directive on Network and Information Systems also applies to us and requires us, as a digital service provider offering services in the EEA but with headquarters outside of the EEA, to appoint a representative in one of the EEA member states where services are offered. This regulation could lead to additional regulatory exposure and compliance costs.
24
In recent years, U.S. and EU lawmakers and regulators have expressed concern over the use of third-party cookies and similar technologies for online behavioral advertising, and laws and regulations in this area are also under reform. In the European Union and United Kingdom, informed consent (a high standard under the GDPR) is required for the placement of a cookie or other tracking technology on a user’s device or for direct electronic marketing. Furthermore, recent European court decisions and regulatory guidance are driving increased attention to cookies and tracking technologies and we are beginning to see regulatory enforcement actions. Evolving legal requirements and changes to how we use cookies and related technologies could lead to substantial costs, require significant systems changes, limit the effectiveness of our marketing activities, divert the attention of our technology personnel, adversely affect our margins, increase costs and subject us to additional liabilities. In addition, uncertainties about the legality of cookies and other tracking technologies may lead to regulatory scrutiny and increase potential civil liability under data protection or consumer protection laws. In response to this, providers of major browsers have included features that allow users to limit the collection of certain data generally or from specified websites, such as Apple’s app tracking transparency feature. These developments may impair our ability to collect user information, including personal data and usage information, which helps us provide more targeted advertising to our current and prospective consumers, and could adversely affect our business.
In the United States, which is also a significant market for our goods and services, federal and state governments have adopted or are considering, laws, guidelines or rules for the collection, distribution, use and storage of information collected from or about consumers or their devices. For example, California has enacted the California Consumer Privacy Act (“CCPA”) which went into effect in 2020. This law imposes new requirements on companies doing business in California and meeting other size or scale criteria for collecting or using information collected from or about California residents, affords California residents the ability to opt out of certain disclosures of personal information, and grants non-absolute rights to access or request deletion of personal information, subject to verification and certain exceptions. In response to the CCPA, we have reviewed and amended our information practices involving California consumers, as well as our use of service providers or interactions with other parties to whom we disclose personal information. We have updated our privacy disclosures to comply with the law, including as these requirements pertain to our California-based workforce. Additionally, the California Privacy Rights Act (“CPRA”), imposes additional data protection obligations on companies doing business in California, including additional consumer rights processes and opt-outs for certain uses of sensitive data and sharing of personal data which have applied since January 1, 2023. The CPRA could have an adverse effect on our business, results of operations, and financial condition.
The effects of the CCPA and CPRA are potentially significant and may require us to modify our data collection or processing practices and policies, incur substantial costs and expenses in an effort to comply and increase our potential exposure to regulatory enforcement or litigation. In addition, Colorado, Utah and Connecticut recently passed comprehensive privacy laws that take effect in 2023 and will impose some obligations similar to or more stringent than those we may face under other data protection laws. Similar laws have been proposed in other states and at the federal level, reflecting a trend toward more stringent privacy legislation in the United States. The enactment of such laws could have potentially conflicting requirements that could make compliance with such laws challenging.
In the People’s Republic of China (the “PRC,” for the purposes hereof excluding Hong Kong, Macau and Taiwan), data security, personal information and privacy have become fast-growing areas for new legislation, reflecting the evolving e-commerce industry. For example, under the PRC’s Cybersecurity Law, any collection, use, transfer and storage of personal information of a PRC citizen through a network by the network operator should be based on the three principles of legitimacy, justification and necessity and requires the consent of the data subject. The rules, purposes, methods and ranges of such collection should also be disclosed to the data subject. PRC’s data localization requirements are becoming increasingly common in sector-specific regulations. For example, the Cybersecurity Law requires operators of critical information infrastructure (“CIIOs”) to store personal information and important data collected and generated from the critical information infrastructure within China. Noncompliance with the Cybersecurity Law can result in fines of up to 100,000 renminbi (“RMB”) for the relevant entity as well as for the personnel directly responsible. On September 14, 2022, the Cyberspace Administration of China (“CAC”), the PRC’s top cybersecurity regulator, released new amendments to the Cybersecurity Law for public consultation and if the amendments are passed the amended law will increase the penalties for violations of cybersecurity obligations under the Cybersecurity Law to up to 50 million RMB, in line with those under the PRC's Data Security Law and Personal Information Protection Law (“PIPL”).
25
With respect to data security, the Standing Committee of the National People’s Congress (“SCNPC”) of the PRC promulgated the Data Security Law, which became effective on September 1, 2021. The primary purpose of the Data Security Law is to regulate data activities, safeguard data security, promote data development and usage, protect individuals' and entities’ legitimate rights and interests, and safeguard state sovereignty, state security and development interests. The Data Security Law applies extraterritorially, and to a broad range of activities that involve “data” (not only personal or sensitive data). Under the Data Security Law, entities and individuals carrying out data activities must abide by various data security obligations, including data classification standards and correlated protective measures for each respective class of data. The Data Security Law also echoes the data localization requirement in the Cybersecurity Law and requires important data to be stored locally in the PRC. Such important data may only be transferred outside of the PRC subject to compliance with certain data transfer restrictions, such as passing a security assessment organized by the relevant authorities.
The PRC's Cybersecurity Review Measures, which took effect on February 15, 2022 in the PRC, clarify when entities must apply for a mandatory cybersecurity review from the PRC government authorities. These circumstances include when (i) CIIOs purchase network products that may affect national security, (ii) when a network platform operator’s data processing activities may affect national security, or (iii) when a network platform operator holds personal information of more than one million individuals and plans on listing publicly abroad (outside of the PRC). "Network platform operators" is not defined but is understood to be broadly interpreted to include all internet platform operators or service providers, thus providing for a broad application. A mandatory cybersecurity review is likely to prolong the timeline of any contemplated listing timeline abroad and increase the regulatory compliance burden on entities that are subject to this requirement.
With respect to personal information and privacy, on August 20, 2021 the SCNPC promulgated the PIPL, which became effective on November 1, 2021. The PIPL applies extraterritorially and clarifies the scope and application of the definitions of personal information and sensitive personal information, the legality of personal information processing and the basic requirements of notice and consent, among other things. The PIPL establishes local data storage requirements for CIIOs and personal information processors who process personal information above a certain threshold prescribed by the relevant authorities. The PIPL also includes a list of onerous rules which must be complied with prior to the transfer of personal information outside of the PRC. Failure to comply with the PIPL can result in fines of up to 50 million RMB or 5% of the prior year’s total annual revenue and/or a suspension of services or data processing activities. Other potential penalties include a fine of up to 1 million RMB imposed on the person in charge or directly responsible personnel and, in serious cases, individuals and entities may be exposed to criminal liabilities under other local Chinese law, such as the Criminal Law of the PRC. The PIPL also prohibits personnel responsible for violations of the PIPL from holding high level management or data protection officer positions in relevant enterprises. Pursuant to the PIPL and regulatory landscape, we have updated the privacy policies and user interaction experiences on our China website, app and mini program as well as our use of service providers in respect of personal information transfer and processing.
On July 7, 2022, the CAC issued the Measures for the Security Assessment of Outbound Data Transfers, which became effective on September 1, 2022. These measures require a data processor to apply for a security assessment of cross-border data transfer with the PRC government if certain thresholds are met. We believe we are subject to the required security assessment due to our processing of personal information of more than 1,000,000 individuals in the PRC. As of December 31, 2022, we have conducted an impact self-assessment associated with cross-border data transfers and made the necessary application with the Cyberspace Administration of Shanghai. Such assessment is pending security assessment and approval by the CAC. We will continue to conduct compliance self-review, upgrade our security capabilities, and implement robust privacy protection mechanisms to reflect the Chinese regulatory authorities’ guidance and the latest regulatory requirements under the applicable laws.
The evolving data security landscape and potential for heightened government enforcement actions could lead to compliance risks and increased costs in our operation of Farfetch China in the PRC region. Failure to comply with such requirements may adversely affect our business and operations in the PRC region.
26
Beyond the aforementioned data protection laws, individual jurisdictions continue to pass laws related to data protection, such as data privacy and data breach notification laws, resulting in a diverse set of requirements across states, countries and regions. The complexity of navigating these varying data protection laws is particularly acute for our business due to our global reach; the Farfetch Marketplace connects consumers in over 190 countries and territories with items from more than fifty countries. In addition, the legal landscape relating to the transfer of personal data continues to evolve and remains uncertain in many jurisdictions. Many data protection regimes apply based on where the consumer is located, and as we expand and new laws are enacted or existing laws change, we may be subject to new laws, regulations or standards or new interpretations of existing laws, regulations or standards, including those in the areas of data security, data privacy and regulation of email providers and those that require localization of certain data (such as in China, where we have already undertaken localization), which could require us to incur additional costs and restrict our business operations.
Failures or perceived failures by us (including our acquired businesses which must be integrated into our privacy framework) to comply with rapidly evolving privacy or security laws, such as those in the PRC, policies (including our own stated privacy policies), legal obligations or industry standards or any security incident that results in the unauthorized release or transfer of personal information or other personal or consumer data may result in governmental enforcement actions, litigation (including consumer class actions), fines and penalties or adverse publicity and could cause our consumers to lose trust in us, which could have a material adverse effect on our business, results of operations, financial condition and prospects.
We rely on our luxury sellers, suppliers, third-party warehousing providers, third-party carriers and transportation providers as part of our fulfilment process, and these third parties may fail to adequately serve our consumers.
We rely significantly on our luxury sellers to properly and promptly prepare products ordered by our consumers for shipment. These suppliers may have a reduced ability to prepare and ship products, including due to government mandates, heightened restrictions or reduced capacity to protect the health and safety of their workers. Failures by these suppliers to timely prepare such products for shipment to our consumers would have an adverse effect on the fulfilment of consumer orders, which could negatively affect the customer experience and harm our business and results of operations.
We rely on third-party warehousing providers to receive, store, pack and ship merchandise. We also rely upon third-party carriers and transportation providers for substantially all of our merchandise shipments, including shipments of items from our luxury sellers and warehouses to our production facilities for processing, shipments returning these items to our luxury sellers and shipments to our consumers after purchase. Failures of our third-party providers to meet the service levels expected by our consumers, including as a result of any closures, shutdowns, bankruptcies, disruptions and/or delays related to the COVID-19 pandemic, or to deliver merchandise in optimal condition, could negatively impact the customer experience, our brand and our business. For example, we could face challenges in workforce availability or labor shortages at our warehouses as a result of increasing labor costs, strikes, or if workers fall ill due to the COVID-19 pandemic. In addition, we have a finite amount of space in our warehouses which is agreed up-front with our third-party warehouse providers. Although we use analytical tools to forecast the amount of warehouse space needed, if actual volumes differ substantially from such estimates, our logistics costs and flexibility of operations could be negatively affected. For example, during the year ended December 31, 2022 we experienced increased warehouse costs in connection with our investment to deliver on our New Guards Group strategic initiatives.
Our shipments are subject to additional risks that could increase our distribution costs, including without limitation cost inflation, rising fuel costs, supply chain delays, labor shortages at transportation providers and warehouses, the impact of the COVID-19 pandemic, the United Kingdom’s withdrawal from the European Union, delays or additional costs in relation to customs clearance, events such as employee strikes and inclement weather, events related to political instability, or threatened or actual acts of terrorism and security concerns, any of which may impact a third party’s ability to provide delivery services that adequately meet our needs.
27
If we needed to change transportation providers, we could face logistical difficulties that could adversely impact deliveries and require us to incur costs and expend resources in connection with such change, and such change could divert the time and attention of management and technology personnel to implement. Moreover, we may not be able to obtain terms as favorable as those received from the independent third-party transportation providers we currently use, which would increase our costs. Our third-party carriers and transportation providers may face increased volumes as a result of increased online adoption or a secular shift from offline to online consumer activity across industries, which, in turn, could cause a decrease in their service levels or result in an increase in their prices. If we are unable to negotiate acceptable pricing and other terms with these entities, if they significantly increase their shipping charges or if they experience performance problems, including as a result of the COVID-19 pandemic, or other difficulties, it could negatively impact our results of operations and our customer experience. Increases in shipping costs or other significant shipping difficulties or disruptions or any failure by our retailers, brands or third-party carriers to deliver high-quality products to our consumers in a timely manner or to otherwise adequately serve our consumers could damage our reputation and brand and may substantially harm our business. In addition, if our merchandise is not delivered in a timely fashion or is damaged or lost during the delivery process as a result of a deterioration of such third-party services, it could result in our consumers becoming dissatisfied and choosing not to shop on our sites and our relationships with our payment providers and other third-party providers could be negatively impacted, which could have a material adverse effect on our financial condition, results of operations and prospects.
We rely on third parties to drive traffic to our website, and these providers may change their search engine algorithms or pricing in ways that could negatively affect our business, results of operations, financial condition and prospects.
Our success depends on our ability to attract consumers cost effectively. With respect to our marketing channels, we rely heavily on relationships with providers of online services, search engines, social media, directories and other websites and e-commerce businesses to provide content, advertising banners and other links that direct consumers to our websites. We rely on these relationships to provide significant sources of traffic to our websites. In particular, we rely on search engines, such as Google, Bing and Yahoo! and the major mobile app stores and social platforms as important marketing channels. Search engine companies change their natural search engine algorithms periodically, and our ranking in natural searches may be adversely affected by those changes, as has occurred from time to time. Search engine companies may also determine that we are not in compliance with their guidelines and consequently penalize us in their algorithms as a result. If search engines change or penalize us with their algorithms, terms of service, display and featuring of search results, or if competition increases for advertisements, as it did in 2022, we may incur increased costs to drive consumers to our websites and apps.
Our relationships with our marketing providers are not long-term in nature and do not require any specific performance commitments. In addition, many of the parties with whom we have online advertising arrangements provide advertising services to other companies, including retailers with whom we compete. As competition for online advertising continues to increase, the cost for some of these services may also continue to do so. A significant increase in the cost of the marketing providers upon which we rely could adversely impact our ability to attract consumers cost effectively and harm our business, results of operations, financial condition and prospects. Changes to privacy regulations, and actions by providers with regard to privacy (including GDPR, CCPA and changes to Apple’s application tracking transparency framework and IDFA) may impact our ability to attract customers cost effectively and grow transaction volume from existing customers.
28
Our failure to address the operational, compliance and regulatory risks associated with our payment methods or practices could damage our reputation and brand and may cause our business and results of operations to suffer.
Under current credit, debit and payment card practices, we are liable for fraudulent activity on the majority of our transactions because we do not obtain a cardholder’s signature nor use strong authentication (such as Verified by Visa) on all transactions. We are also exposed to financial crime risk and employ certain measures to identify and mitigate this risk, including utilizing third-party tools and services. We do not currently carry insurance against this risk. We face the risk of significant losses from this type of fraudulent activity or financial crime as our sales increase and as we continue to expand globally. Our failure to adequately mitigate this risk could damage our reputation and brand and substantially harm our business, results of operations, financial condition, prospects and our ability to accept payments.
We also accept payment for many of our sales through credit, debit and payment card transactions, which are handled through third-party payment processors. As a result, we are subject to a number of risks related to card payments, including that we pay interchange and other fees, which may increase over time and could require us to either increase the prices we charge for our products or absorb an increase in our costs and expenses. For example, in 2021 a fee introduced by Visa that applies specifically to marketplaces was applied to us, and other payment processors may do the same in the future. Our utilization of such payment processing tools may be impacted by factors outside of our control, including disruptions in the payment processing industry generally.
Global laws and regulations that govern payment methods and processing are complex and subject to change; and we may be required to expend considerable time and effort to determine if such laws and regulations apply to our business. There can be no assurance that we will be able to meet all compliance obligations, including obtaining any such licenses in all of the jurisdictions we service, and, even if we were able to do so, there could be substantial costs and potential product changes involved in complying with such laws, which could have a material and adverse effect on our business. Any noncompliance by us in relation to existing or new laws and regulations, or any alleged noncompliance, could result in reputational damage, litigation, increased costs or liabilities, damages, or require us to stop offering payment services in certain markets. Failure to predict how a U.S. law or regulation or a law or regulation from another jurisdiction in which we operate with respect to money transmission or similar requirements will be applied to us could result in licensure or registration requirements, administrative enforcement actions, and/or could materially interfere with our ability to offer certain payment methods or to conduct our business in particular jurisdictions. We cannot predict what actions the United States or other governments, including China, may take, or what restrictions these governments may impose, that will affect our ability to process payments or to conduct our business in particular jurisdictions. Further, we may become subject to changing payment regulations and requirements that could potentially affect the compliance of our current payment processes and increase the operational costs we incur to support payments. The factors identified here could impose substantial additional costs, involve considerable delay to the development or provision of our solutions, require significant and costly operational changes, or prevent us from providing our solutions in any given market.
In addition, as part of the payment processing process, our consumers’ credit, debit and payment card information is transmitted to our third-party payment processors. We may also be subject to lawsuits or other proceedings for purportedly fraudulent transactions arising out of the actual or alleged theft of our consumers’ credit, debit or payment card information if the security of our third-party card payment processors is breached. We and our third-party card payment processors are also subject to payment card association operating rules, certification and classification requirements and rules governing electronic funds transfers, which could change or be reinterpreted to make it difficult or impossible for us to comply without incurring higher fees, diverting resources to regulatory compliance or making changes to our business model. If we or our third-party card payment processors fail to comply with these rules or requirements, we may be subject to fines and higher transaction fees and lose our ability to accept credit, debit and payment card payments from our consumers in addition to the consequences that could arise from such action or inaction for violating applicable privacy, data protection, data security and other laws as outlined above, which could have an adverse impact on our business, results of operations, financial condition and prospects.
29
We depend on highly skilled personnel, including senior management and our technology professionals, and if we are unable to retain or motivate key personnel or hire, retain and motivate qualified personnel, our business could be harmed.
We believe our success has depended, and our future success depends, on the efforts and talents of our senior leadership, particularly José Neves, our founder and Chief Executive Officer, and all of our highly skilled team members, including our executive team and business unit leaders. Our future success depends on our continuing ability to attract, develop, motivate and retain highly qualified and skilled employees. Our ability to do so could be impacted by a number of factors. For example, our ways of working in an increasingly remote and mobile landscape, our compensation benchmarks relative to our competitors and the impact of the volatility of our share price on our equity compensation offering may impact the attractiveness of joining our team. In particular, our data specialists, software engineers and technology professionals are key to designing, maintaining and improving the code and algorithms necessary to our business. In addition, members of our Private Client team have a niche skill set and cater to some of our most important and highest spending consumers. If members of our Private Client team were to leave the Company, they could be difficult to replace, and such departures could impact our ability to retain consumers associated with such team member.
The New Guards management team is responsible for discovering and developing the brands in the New Guards portfolio and we will continue to rely on their expertise to drive the expansion of the portfolio. Certain designers and creators are critical to the success of the brands within the New Guards portfolio and their departure could have a significant impact on the creative direction of the relevant brand which could have a significant impact on such brand and New Guards’ business.
Competition for well-qualified employees in all aspects of our business, including software engineers, data scientists and other technology professionals, is intense globally. Our continued ability to compete effectively depends on our ability to attract new employees and to retain and motivate existing employees. If we do not succeed in attracting well-qualified employees or retaining and motivating existing employees and key senior management, our business, results of operations, financial condition and prospects may be adversely affected.
A failure to comply with current laws, rules and regulations or changes to such laws, rules and regulations and other legal uncertainties may adversely affect our business, financial performance, results of operations or business growth.
Our business and financial performance could be adversely affected by unfavorable changes in, or interpretations of, existing laws, rules and regulations or the promulgation of new laws, rules and regulations applicable to us and our businesses, including those relating to online intermediation services providers, internet and e-commerce, including those against geo-blocking and other geographically based restrictions, internet advertising and price display, digital assets and Web3 (including non-fungible tokens (“NFTs”)/blockchain), consumer protection, anti-corruption, antitrust and competition, foreign investment, economic and trade sanctions, tax, banking, data security, network and information systems security, data protection and privacy, platform regulation, including the regulation of providing goods online, marketplace liability for counterfeit or damaged goods, and any litigation resulting therefrom. As a result, regulatory authorities or state and supranational bodies with relevant powers, including courts, could prevent or temporarily suspend us from carrying on some or all of our activities or otherwise penalize us if our practices were found not to comply with applicable regulatory or licensing requirements or any binding interpretation of such requirements. Regulatory reform of the wider digital sector (including online marketplaces) is increasing the compliance burden on how online marketplaces can operate and provide services to their business users and customers in the European Union, United Kingdom, United States, China and beyond. These various laws, regulations and rules, depending on their final scope when passed, could adversely affect our business, results of operations, financial condition and prospects. Unfavorable new requirements and regulatory burdens as well as changes or new interpretations of existing laws could decrease demand for our products and services, limit our ability to expand our product and service offerings, limit marketing methods and capabilities, affect our margins, increase costs or subject us to additional liabilities or affect our ability to deliver our growth strategy.
There are, and will likely continue to be, an increasing number of laws and regulations pertaining to the internet, e-commerce and the regulation of online platforms that may relate to liability for information retrieved
30
from or transmitted over the internet, display of certain taxes and fees, rankings of products shown, online editorial and consumer-generated content, user privacy, data security, network and information systems security, behavioral targeting and online advertising, taxation, liability for third-party activities and the quality of services. The growth and development of e-commerce has prompted calls for more stringent consumer protection laws and more aggressive enforcement efforts, which are starting to impose additional burdens on online businesses generally. As we expand our offering, including in respect of highly regulated product categories such as kidswear and beauty, we expect the compliance burden to increase, and the risk of claims, lawsuits, government investigations, and other proceedings in respect of product compliance or safety, or consumer protection, may do the same. Additionally, changes in government trade policy, including the imposition of tariffs, export restrictions, or other limitations on commerce may adversely and materially affect our ability to offer certain payment methods or to conduct our business in particular jurisdictions.
Likewise, the United States, European Union, United Kingdom along with other jurisdictions and their competent regulatory authorities, including in the case of the United States, the SEC, the U.S. Department of Justice, the U.S. Treasury Department’s Office of Foreign Assets Control and the U.S. Department of State continue to enforce economic and trade regulations and anti-corruption laws, as applicable, across industries. U.S. economic and trade sanctions relate to transactions with designated countries and territories, which currently include Cuba, Iran, North Korea, Syria, the so-called Donetsk People’s Republic and Luhansk People’s Republic regions of Ukraine and the Crimea region of Ukraine, as well as specially targeted individuals and entities that are identified on U.S. and other government blacklists, and those 50% or more owned, individually or in the aggregate, by them or those acting on their behalf. EU and UK sanctions prohibit the export of luxury goods (including apparel over stated values) to certain countries, including Syria, North Korea and Russia, and transactions with designated persons and entities identified on the EU and UK lists of asset freeze targets and entities majority-owned or controlled by any such designated persons. The United States also prohibits the export of luxury goods to Russia, including, for example, certain apparel, accessories, handbags and footwear, and prohibits U.S. persons from participating in the sale or supply of such items. Anti-corruption laws, including the U.S. Foreign Corrupt Practices Act (“FCPA”) and the UK Bribery Act (“Bribery Act”), generally prohibit direct or indirect corrupt payments to government officials (and, under certain laws, to private persons) to obtain or retain business or an improper business advantage. Some of our international operations are conducted in parts of the world where it is more common to engage in business practices that may be prohibited by these laws. Moreover, in the future additional U.S., EU, UK and other trade and economic sanctions or regulations, enacted due to geopolitics or otherwise, and any counter-sanctions enacted by such sanctioned countries, could restrict our ability to operate or to generate or collect revenue in certain other countries, such as Russia, where trade has been ceased since the imposition of international sanctions in 2022, which could adversely affect our business.
The policies and procedures we have in place which are designed to promote compliance with laws and regulations and which we review and update as we expand our operations in existing and new jurisdictions, as well as new product categories, may not prevent our employees, partners, or agents from taking actions in contravention of our policies and procedures and may result in a violation of applicable laws or regulations. As regulations continue to develop and evolve, and, as we expand into new jurisdictions, we may be subject to multiple overlapping legal or regulatory regimes, the scope of which are regularly changing, subject to uncertain and differing interpretations and may impose conflicting requirements, which our internal compliance program will need to keep pace with. We cannot guarantee that our policies and procedures will ensure compliance at all times with all applicable laws or regulations. In the event our controls should fail, or we are found to be not in compliance for other reasons, we could be subject to monetary damages, substantial civil and criminal monetary penalties, withdrawal of business licenses or permits, litigation, requirements to make costly changes to business practices, requirements to develop non-infringing or otherwise altered products or technologies, investigation costs and expenses and damage to our reputation and the value of our brand.
As we grow our business, expand into new product and service offerings, and expand our operations in existing and new jurisdictions internationally, we will need to update the scope of our compliance programs to adequately address risks relating to applicable economic and trade sanctions, the FCPA, the Bribery Act and other anti-bribery and anti-corruption laws, antitrust laws, and consumer protection and product safety laws. Further, the promulgation of new laws, rules and regulations, or the new interpretation of existing laws, rules and regulations, in each case that restrict or otherwise unfavorably impact the ability or manner in which we or our luxury sellers conduct business, could require us to change certain aspects of our business, operations and commercial
31
relationships to ensure compliance, which could decrease demand for services, reduce revenue, increase costs or subject us to additional liabilities.
The increasing impact of and focus on ESG matters could increase our costs, harm our reputation and adversely affect our financial results.
There has been an increased focus, including by consumers, investors, employees and other stakeholders, as well as by governmental and non-governmental organizations, on ESG matters generally (including on climate change, diversity and inclusion, responsible sourcing, corporate reporting and green claims) and with regard to the luxury fashion industry specifically. From time to time we announce certain initiatives, including updates to our stated goals regarding our ESG focus areas, which include matters such as responsible sourcing and marketing, social investments and diversity and inclusion. We have in the past and may in the future abandon or modify all or part of certain of these initiatives due to the availability of resources, a change in strategy, or similar reasons and we may also cease using ESG-related measures in setting objectives and targets for compensation payout for the same reasons. Any failure or perceived failure by us to meet our commitments with regard to ESG matters, perception that our targets are insufficient, may not be achieved or may change, or belief that our decisions, conduct or investments do not align with expectations of our publicly announced ESG-related goals and ambitions could negatively affect our brand, the demand for our products and, therefore, our financial condition and prospects. Our reputation could be damaged if we, our suppliers, and other parties in our supply chain do not (or are perceived not to) act responsibly regarding ESG standards or if we fail to appropriately respond to concerns raised by our consumers, investors and other stakeholders, or to ESG-related government guidelines or legislation which could have a material adverse effect on our business, financial condition, access to capital and results of operations. For example, if our competitors’ or peers’ ESG performance is perceived to be better than ours or we fail to demonstrate adequate ESG performance (such as failure to meet certain independent ESG ratings benchmarks), potential or current investors, including those with specific investment mandates that concern ESG-related factors, might choose not to include us, or may be restricted from including us, within their pool of investment considerations, or may elect to invest elsewhere, which could negatively affect the market price for our Class A ordinary shares, business and financial condition.
The costs to achieve our ESG goals, such as potential increased costs in our supply chain in relation to ensuring the ESG performance of our suppliers, and the costs or potential impact from business decisions informed by ESG matters could have a material adverse effect on our business and financial condition. For example, we may decide to pursue less cost-efficient production, packaging or other operational elements of our business to ensure we are meeting our sustainability objectives. In addition, we and our suppliers may face increased costs arising from the physical effects of climate change, diminishing energy and water resources or various forms of social unrest. Further, standards regarding ESG matters could develop and become more onerous both for us and the parties in our supply chain, which could result in additional costs that have a material adverse effect on our business and financial condition.
Specifically, regulatory and consumer attention on more sustainable and ethical sourcing and production has placed an increased focus on supply chain integrity and transparency. We expect our suppliers to meet our standards, including those outlined in our Modern Slavery Statement, Vendor Code of Conduct and Ethical Sourcing Policy; however, we cannot guarantee their compliance. Increased global scrutiny and regulatory action may result in additional diligence and other requirements related to the integrity of our supply chain and the supply chains of our luxury sellers. Such requirements may be burdensome or costly to comply with and may impact the production strategy for our first-party original merchandise. The dispersed nature of our marketplace model will make monitoring supplier compliance with regulatory obligations or Farfetch standards more complex. As regulations (such as the proposed EU Corporate Sustainability Due Diligence Directive) continue to develop and evolve in this area, and as we expand into new jurisdictions or product categories, we may be subject to new or revised regulatory regimes related to supply chain integrity and transparency, the scope of which are regularly changing, subject to uncertain and differing interpretations and may impose conflicting requirements. Challenges in complying with such regulations and the failure to implement robust diligence processes may result in reputational damage, business interruption, loss of trust in our brand or other ESG efforts, litigation, increased costs or liabilities, fines or requests to amend business practices in costly ways or requiring development of non-infringing or otherwise altered products or technologies and have a material adverse impact on our business and financial condition.
32
There has also been increased government and consumer attention given to ensuring any claims made in relation to a company’s or product’s sustainability bona fides are legitimate. For example, The Green Claims Code in the United Kingdom and the European Commission's initiative on substantiating green claims in the European Union both outline criteria for what constitutes a legitimate environmental-related claim in relation to products, and similar legally binding or voluntary frameworks continue to be proposed and developed globally. We rely on suppliers to substantiate and check information in relation to the independent certifications or standards on which these claims can legitimately be made, and undertake these checks ourselves for our first-party original merchandise. Such requirements may be burdensome or costly to comply with and the dispersed nature of our marketplace model makes assurance of supplier compliance with regulatory or Farfetch standards more complex. Any litigation or public challenges to the claims of our suppliers in this area could have a material adverse impact on our business, reputation and financial condition.
The adoption of new ESG-related regulations applicable to our business, or pressure from key stakeholders to comply with additional voluntary ESG-related initiatives or frameworks, could require us to make substantial investments in ESG matters, which could negatively impact our results of operations. Decisions or a perceived lack of investment in relation to ESG matters could negatively affect consumer and partner perceptions regarding our brand.
We are subject to customs and international trade laws that could require us to modify our current business practices and incur increased costs or could result in a delay in getting products through customs and port operations, which may limit our growth and cause us to suffer reputational damage.
Our business is conducted worldwide, with goods imported from and exported to a substantial number of countries. The vast majority of products sold on our Marketplaces are shipped internationally. We are subject to numerous regulations, including customs and international trade laws, which govern the importation and sale of luxury goods. Our ability to grow our operations globally may be adversely affected by any circumstances that reduce or hinder cross-border trade. For example, the shipping of goods cross-border typically involves complex customs and duty inspections and is dependent on national carrier systems. If jurisdictions become increasingly fragmented by tariffs and customs that increase the cost or complexity of cross-border trade, our business could be adversely impacted.
We are subject to risks generally associated with having a global supply chain, including certain laws and regulations related to forced labor and human rights. In June 2022, the U.S. Uyghur Forced Labor Prevention Act (“UFLPA”) went into effect, which imposes a rebuttable presumption that goods produced in the Xinjiang Uyghur Autonomous Region of China or involving certain Chinese entities were produced using forced labor and prohibits importation of such goods into the United States absent clear and convincing evidence proving otherwise. UFLPA specifically targets the cotton and apparel industry as high-priority sectors for enforcement. UFLPA or other U.S. human rights trade restrictions could affect the sourcing and availability of products, lead to our products being held for inspection, delayed or rejected for entry into the United States, result in other supply chain disruptions, or cause us to be subject to penalties, fines or sanctions. In the future, these human rights-related trade restrictions may expand in the United States or extend beyond the United States. In September 2022, the European Union announced a similar proposal targeting goods within Europe created with forced labor, without specifying particular countries or sectors. The EU proposal, if passed and implemented, could similarly impact our supply chain. Even if we were not subject to penalties, fines or sanctions or supply chain disruption under these restrictions, if products we source are linked in any way to forced labor, our reputation could be harmed.
33
Our consumers in certain countries, such as China, are also subject to limitations and regulations governing the import of luxury goods. In addition, we face risks associated with trade protection laws, policies and measures and other regulatory requirements affecting trade and investment, including the loss or modification of exemptions for taxes and tariffs, the imposition of new tariffs and duties and import and export licensing requirements in the countries in which we operate. For example, the United Kingdom’s exit from the European Union has resulted in, and may result in additional, restrictions, regulations or other non-tariff barriers to trade as a result, in part, of a divergence in the UK and the EU’s respective regulatory regimes, in each case concerning our cross-border operations between the United Kingdom and European Union. In addition, any imposition of tariffs by the United States or European Union could result in the adoption of tariffs or trade restrictions by other countries, which could affect the movement of our goods, or potentially lead to a global trade war. Our failure to comply with import or export rules and restrictions or to properly classify items under tariff regulations and pay the appropriate duties could expose us to fines and penalties. If these laws or regulations were to change or were violated by our management, employees, or our luxury sellers, we could experience delays in the shipments of our goods, be subject to fines or penalties, or suffer reputational harm, which could reduce demand for our services and negatively impact our results of operations.
Legal requirements are frequently changed and subject to interpretation, and we are unable to predict the ultimate cost of compliance with these requirements or their effects on our operations. We may be required to make significant expenditures or modify our business practices to comply with existing or future laws and regulations, which may increase our costs and materially limit our ability to operate our business.
Our business depends on our ability to source and distribute products in a timely manner. As a result, we rely on the free flow of goods through open and operational ports worldwide. Labor disputes or other disruptions at ports, including potentially as a result from changes in tariff structures in relation to the United Kingdom’s withdrawal from the European Union, for example, create significant risks for our business, particularly if work slowdowns, lockouts, strikes or other disruptions occur. Any of these factors could result in reduced sales or canceled orders, which may limit our growth and damage our reputation and may have a material adverse effect on our business, results of operations, financial condition and prospects.
Our global operations involve additional risks, and our exposure to these risks will increase as our business continues to expand.
We operate in a number of jurisdictions and intend to continue to evolve our global presence, including in emerging markets. We face complex, dynamic and varied risk landscapes in the markets in which we operate. As we enter countries and markets that are new to us, we must tailor our services and business model to the unique circumstances of such countries and markets, which can be complex, difficult, costly and divert management and personnel resources. In addition, we may face competition in other countries from companies that may have more experience with operations in such countries or with global operations in general. Laws and business practices that favor local competitors or prohibit or limit foreign ownership of certain businesses, or our failure to adapt our practices, systems, processes and business models effectively to the consumer and supplier preferences of each country into which we expand, could slow our growth. Certain markets in which we operate have, or certain new markets in which we may operate in the future may have, lower margins than our more mature markets, which could have a negative impact on our overall margins if our revenue from these markets grows over time. Additionally, our operations in certain countries may be adversely affected by the COVID-19 pandemic, which has in the past and may in the future trigger various complex government-mandated restrictions and other measures to minimize the spread of COVID-19 at the country, state and local level. Even when government mandated restrictions and other measures are lifted, for example as we have recently seen in China, the speed and extent to which we would benefit from the changed regulatory environment is uncertain.
In addition to the risks outlined elsewhere in this section, our global operations are subject to a number of other risks, including:
34
We are subject to regulatory and antitrust laws.
We are subject to scrutiny by various government agencies, including consumer competition authorities. Some jurisdictions also provide private rights of action for competitors, consumers, suppliers or business users to assert claims of anticompetitive conduct or breach of law. Other companies or government agencies have in the past and may in the future allege that our actions violate antitrust or competition laws or otherwise constitute unfair competition.
We do not control the pricing strategies of luxury sellers on our Marketplaces (other than for our Group entities, i.e., Browns, Stadium Goods’ first-party sales, Violet Grey and the New Guards portfolio of brands when sold direct-to-consumer via our Marketplaces), whose pricing strategies may be subject to challenges from various government agencies including consumer and competition authorities. Our business partnerships or agreements or arrangements with customers or other third parties could therefore give rise to regulatory action or private antitrust litigation.
An increasing number of authorities are engaging in increased scrutiny of e-commerce including the way in which digital marketplaces operate and provide services to their business users and end customers. Regulators may perceive our business differently such that otherwise uncontroversial business practices could be deemed anticompetitive. Certain competition authorities have conducted market studies of industries in which we are active. Such studies, investigations or potential claims, even if without foundation, may be very expensive to defend, involve negative publicity and substantial diversion of management time and effort and could result in significant judgments against us or require us to change our business practices.
Our consumer concentration may materially adversely affect our financial condition and results of operations.
For the year ended December 31, 2022, the top 1% of our consumers accounted for 27.6% of our Marketplace GMV. Accordingly, our revenue, financial condition or results of operations may be unduly affected by fluctuations in the buying patterns of these consumers. If we were to lose the business of some or all of these consumers, it could materially adversely affect our business, results of operations, financial condition and prospects.
35
We may not accurately forecast income and appropriately plan our expenses.
We base our current and future expense levels on our operating forecasts and estimates of future income. Income and operating results are difficult to forecast because they generally depend on the volume and timing of the orders we receive, which are uncertain, especially in light of the COVID-19 pandemic and other macroeconomic and geopolitical factors. A softening in income, whether caused by changes in consumer preferences or a weakening in the global economy, may result in decreased revenue levels, and we may be unable to adjust our spending in a timely manner to compensate for any unexpected shortfall in income. Similarly, our expense levels may be impacted by external factors which are uncertain, including the cost of carriers, duty costs or cost inflation related to global shipping which may lead to variations in our planned levels of expenditure. This inability could cause our (loss)/income after tax in a given quarter to be (higher)/lower than expected. Further, our operating results may be impacted by changes in (losses)/gains on items held at fair value and by fluctuations in our share price, which we are unable to forecast. We also make certain assumptions when forecasting the amount of expense we expect related to our share-based payments, which includes the expected volatility of our share price, the expected life of share options granted and the expected rate of share option forfeitures. These assumptions are partly based on historical results. If actual results differ from our estimates, our net income in a given quarter may be lower than expected.
Our operating results are subject to seasonal and quarterly variations in our revenue and operating income, and as a result, our quarterly results may fluctuate and could be below expectations.
Our business is seasonal and historically we have realized a disproportionate amount of our revenue and earnings for the year in the fourth quarter as a result of the holiday season and seasonal promotions, and we expect this to continue in the future, while our Brand Platform operates to a wholesale cycle with a different seasonal cadence. If we experience lower than expected revenue during any fourth quarter, it may have a disproportionately large impact on our operating results, cash flow and financial condition for that year. Any factors that harm our fourth quarter operating results, including disruptions in our brands’ or retailers’ supply chains or unfavorable economic conditions, including as a result of the COVID-19 pandemic or other macroeconomic or geopolitical conditions, could have a disproportionate effect on our results of operations for our entire fiscal year.
In anticipation of increased sales activity during the fourth quarter, we may incur significant additional expenses, including additional marketing expenses and additional staffing in our customer support operations. We also may experience an increase in our shipping costs due to complimentary upgrades, split shipments, and additional long-zone shipments necessary to ensure timely delivery for the holiday season. At peak periods, there could also be further delays by our luxury sellers in processing orders, which could leave us unable to fulfill consumer orders due to “no stock,” or in packaging a consumer’s order once received, which could lead to lower consumer satisfaction. In the future, our seasonal sales patterns may become more pronounced, may strain our personnel and production activities and may cause a shortfall in sales as compared with expenses in a given period, which could substantially harm our business, results of operations, financial condition and prospects.
Our quarterly results of operations may fluctuate significantly as a result of a variety of factors, including those described above. As a result, historical period-to-period comparisons of our sales and operating results are not necessarily indicative of future period-to-period results. You should not rely on the results of a single fiscal quarter as an indication of our annual results or our future performance.
36
We are involved in and may pursue additional strategic relationships. We may have limited control over such relationships, and these relationships may not provide the anticipated benefits.
We are involved in various strategic relationships, including with Alibaba and Richemont (which are also involved in the sale of luxury goods) to enable or enhance access to geographic markets such as Europe and China. For example, under our strategic partnership with Alibaba and Richemont, our shopping channel is available on Alibaba’s e-commerce platform, which is intended to provide us with access to Alibaba’s consumers, increase our potential addressable market and give us enhanced access to the China region market. Following the completion of their combined strategic investments of $500 million ($250 million each) in Farfetch China in August 2021, Alibaba and Richemont hold an initial combined 25% equity stake in the joint venture, Farfetch China. In addition, during 2023 as a result of our collaboration agreement with Chalhoub Group reaching the end of its term on December 31, 2022, we expect to acquire the remaining shareholding in Farfetch International Limited from the Chalhoub Group (pursuant to either put or call options which we expect will be exercised). We also may pursue and enter into strategic relationships in the future. Such relationships involve risks, including, but not limited to: new or changing local regulations, maintaining good working relationships with the other party; any economic or business interests of the other party that are inconsistent with ours; the other party’s failure to fund its share of capital for operations or to fulfill its other commitments, including providing accurate and timely accounting and financial information to us, which could negatively impact our operating results; loss of key personnel; actions taken by our strategic partners that may not be compliant with applicable rules, regulations and laws; reputational concerns regarding our partners or our leadership; bankruptcy, requiring us to assume all risks and capital requirements related to the relationship, and the related bankruptcy proceedings could have an adverse impact on the relationship; and any actions arising out of the relationship that may result in reputational harm or legal exposure to us. Further, certain of these relationships in the past have not delivered, and current and future such relationships may not deliver, the benefits that were originally anticipated. In addition, when strategic relationships end we may have to pivot our operating strategy in a given market or category, which may or may not be successful. Any of these factors may have a material adverse effect on our business, results of operations, financial condition and prospects.
We have acquired, and may continue to acquire, other companies or technologies, which could divert management’s attention and otherwise disrupt our operations and harm our operating results. We may fail to acquire companies whose market power or technology could be important to the future success of our business.
We have acquired and may in the future seek to acquire, collaborate with or invest in other companies or technologies that we believe could complement or expand our brand and products, enhance our technical capabilities, or otherwise offer strategic opportunities. As part of our business, we consider potential strategic transactions, any of which could impact our near-term profitability. Pursuit of future potential acquisitions or investments may divert the attention of management and cause us to incur various expenses in identifying, investigating, pursuing and seeking to obtain regulatory approval for suitable acquisitions or investments, whether or not they are consummated. In addition, we may fail to acquire companies whose market power or technology could be important to the future success of our business, or we may be unsuccessful in integrating our acquired businesses or any additional business we may acquire in the future. For example, we acquired the assets of Opening Ceremony and a majority interest in Ambush in 2020, Luxclusif, Onport (formerly JBUX Limited), Allure and a majority interest in Palm Angels in 2021 and Wanna and Violet Grey in 2022.
37
On August 24, 2022, we and Symphony Global LLC ("Alabbar") agreed, pursuant to a share purchase agreement, to acquire 47.5% and 3.2%, respectively, of YOOX Net-a-Porter Group (“YNAP”) from Richemont. The 47.5% to be acquired by Farfetch will be acquired in return for Farfetch Class A ordinary shares. As part of the partnership (i) most of Richemont’s Maisons will join the Farfetch Marketplace, and (ii) YNAP and most of Richemont’s Maisons will re-platform using FPS. As at February 2023, a Marketplace framework agreement with Richemont and certain FPS contracts that cover this transition have been entered into for Richemont and YNAP. Statements of work have been agreed for Cartier and all of the YNAP businesses. In addition (i) statements of work for the re-platforming services and (ii) Marketplace partner contracts for the Marketplace services will be entered into on a phased basis for the remaining in-scope Richemont Maisons. Completion of the transaction is conditional upon, among other factors, receipt of regulatory approvals. While there is a contractual commitment from Richemont to enter into those further contracts (in addition to broader commercial incentives for Richemont to do so), the commitment is subject to certain conditions which could result in some of those contracts not ultimately being entered into. Similarly, there is no guarantee as to the timeframe by which each webstore will transition to FPS (i.e., the point at which these arrangements will start to generate significant profit for Farfetch) and there are various termination rights in the contracts including linked to a failure to obtain regulatory approval (i.e., it remains possible that arrangements could be terminated early). The initial duration of the agreements is up to a maximum of five years from (i) the launch of Cartier, for all Richemont Maisons; and (ii) the launch of Net-A-Porter, for all YNAP businesses, and there is no guarantee that the arrangements will be renewed beyond those dates. Moreover, if the anticipated benefits from these transactions do not materialize, including as a result of failure to receive certain required regulatory approvals, this may have a material adverse effect on our business, results of operations, financial condition and prospects, including with respect to projected future year earnings and financial estimates related to these transactions and could result in volatility in the market price for our Class A ordinary shares.
We also may not achieve the anticipated benefits from any acquired business, investment, joint venture or collaboration due to a number of factors, including:
38
In addition, a significant portion of the purchase price of companies we acquire may be allocated to acquired goodwill, which must be assessed for impairment at least annually. In the future, if our acquisitions do not yield expected returns, we may be required to incur charges to our operating results based on this impairment assessment process. For example, in the year ended December 31, 2022 we incurred an impairment charge of $136.7 million comprised of $116.8 million relating to intangible assets, including goodwill relating to Browns as well as impairments allocated to three smaller cash generating units within the Group, and $19.9 million relating to tangible assets, primarily relating to Browns.
Acquisitions could also result in dilutive issuances of equity securities or the incurrence of debt, which could adversely affect our operating results. For example, half of the consideration we paid in 2019 in connection with the New Guards acquisition was paid in the form of shares, resulting in our issuance of 27.5 million Class A ordinary shares or 9% of the Class A ordinary shares outstanding immediately prior to the acquisition. In addition, if an acquired business fails to meet our expectations, this may have a material adverse effect on our business, results of operations, financial condition and prospects.
If we are unable to successfully launch and monetize new and innovative technology, our growth and profitability could be adversely affected.
We are constantly developing new and innovative strategies, initiatives and technologies, such as our connected retail solutions which form a part of our LNR initiative. Our ability to bring a product to market in a timely manner or at all, our ability to monetize these technologies and other new business lines in a timely manner and operate them profitably and our ability to leverage these technologies to drive customer engagement depends on a number of factors, many of which are beyond our control, including:
39
We may not be able to grow our new technologies or business lines or operate them profitability, and these new and innovative technology initiatives may never generate material revenue. In addition, the substantial management time and resources that our technology development requires may result in disruption to our existing business operations and adversely affect our financial condition, which may decrease our profitability and growth.
Use of social media, emails and text messages may adversely impact our reputation or subject us to fines or other penalties.
We use social media, emails and text messages as part of our approach to marketing. As laws and regulations rapidly evolve to govern the use of these channels, a failure by us, our employees or third parties acting at our direction to abide by applicable laws and regulations in the use of these channels could adversely affect our reputation or subject us to fines or other penalties. In addition, our employees, including employees of brands within the New Guards portfolio, or third parties acting at our direction (including influencers) may knowingly or inadvertently make use of social media in ways that could lead to the loss or infringement of intellectual property, subject us to liability for illegal content as well as the public disclosure of proprietary, confidential or sensitive personal data about our business, employees, consumers or others. Any such inappropriate use of social media, emails and text messages could also cause damage to our reputation, the reputation of our businesses, including Browns, Stadium Goods, Violet Grey and any of the brands in the New Guards portfolio, or the reputation of the designers or creative directors of New Guards’ brands.
Consumers value readily available information concerning retailers and their goods and services and often act on such information without further investigation and without regard to its accuracy. Our consumers may engage with us online through social media platforms, including Facebook, Instagram, Pinterest, TikTok and Twitter, by providing feedback and public commentary about all aspects of our business. Information concerning us or our luxury sellers, whether accurate or not, may be posted on social media platforms at any time and may have a disproportionately adverse impact on our brand, reputation or business; and the third-party services we use to monitor such postings that may be inaccurate or harmful to the reputation and perception of our brand may fail to sufficiently identify such posts. Such harm could be immediate without affording us an opportunity for redress or correction and have a material adverse effect on our business, results of operations, financial condition and prospects.
We may become subject to risks related to accepting cryptocurrencies as a form of payment, building or exchanging non-fungible tokens, or collaborating in the metaverse.
As part of our business strategy and LNR vision we plan to continue to innovate to meet the changing and future needs of consumers. For example, in 2022 we enabled our customers to transact in cryptocurrencies (in-store and online). Similar innovation in the future could include building or exchanging NFTs or collaborating in the metaverse through new and emerging digital environments. We may incur significant costs in pursuing such innovation initiatives, they may not develop in accordance with our expectations, and market acceptance of features, products, or services we build for use with cryptocurrencies, NFTs or the metaverse is uncertain.
Cryptocurrencies have experienced technological glitches and various law enforcement and regulatory interventions including fraud actions. The use of cryptocurrency, such as Bitcoin, may be regulated by certain jurisdictions and in others has been prohibited or effectively prohibited. If we fail to comply with any such regulations or prohibitions that may be applicable to us, we could face regulatory or other enforcement actions and potential fines or other consequences.
40
Cryptocurrencies have in the past and may in the future experience periods of extreme price volatility. Fluctuations in the value of any cryptocurrencies or other digital assets that we, or third-party intermediaries, might hold could also lead to volatility in our financial results and could have an adverse impact on our business. In addition, there is substantial uncertainty regarding the future legal and regulatory requirements relating to cryptocurrency, transactions utilizing cryptocurrency, NFTs, digital assets and metaverse-related products and features. Compliance with any such regulations may be complex and costly. For example, currently there are no specific standards under IFRS regarding the accounting for cryptocurrencies, NFTs and similar instruments. In the event that the IASB issues new standards or amendments to existing standards in respect of these instruments, the accounting treatment may differ from the market practice applied by companies under existing accounting standards and guidance. In addition, governments could choose to regulate or further regulate, curtail or outlaw the acquisition, use or redemption of cryptocurrency. In such a case, ownership of, holding or trading in cryptocurrency may require additional compliance requirements, licensure or may be considered illegal and subject to sanction. These uncertainties, as well as future accounting, tax or digital privacy developments, regulatory requirements in relation to fraud, money laundering and sanctions, or other requirements relating to cryptocurrency, NFTs and the metaverse could expose us to litigation, regulatory action or possible liability, and have an adverse effect on our business.
In addition, we note that in the United States and certain other jurisdictions certain cryptocurrencies and NFTs may be considered securities and subject to the securities laws of the relevant jurisdictions. The legal and regulatory environment with respect to cryptocurrencies, NFTs and the metaverse is complex and fast-moving and our failure to comply with emerging law and regulation could expose us to litigation, regulatory action or possible liability, and have an adverse effect on our business.
Further, we note that in the United States and certain other jurisdictions cryptocurrencies and certain NFTs may be considered currency, money or convertible virtual currency and the exchange, remittance or transfer of currency, cryptocurrencies or certain NFTs may be considered money transmission, in each case subject to money transmission laws of relevant jurisdictions. Failure to predict how a U.S. law or regulation or a law or regulation from another jurisdiction in which we operate with respect to money transmission or similar requirements will be applied to us could result in licensure or registration requirements, administrative enforcement actions, and/or could materially interfere with our ability to offer certain payment methods or to conduct our business in particular jurisdictions. We could also be required to cease operations in some or all of the U.S. jurisdictions we service. The legal and regulatory environment with respect to cryptocurrencies, NFTs and the metaverse is complex and fast-moving and our failure to comply with law and regulation could expose us to litigation, regulatory action or possible liability, and have an adverse effect on our business.
Governmental control of currency conversion may limit our ability to utilize our cash balances effectively in the future.
We are subject to governmental regulation of currency conversion and transfers, which may particularly affect our subsidiaries in certain jurisdictions. For example, the Chinese government imposes controls on the convertibility of the RMB into other currencies and, in certain cases, the remittance of currency out of China. Earnings from our Chinese subsidiaries could therefore be impacted. Shortages in the availability of foreign currency may restrict the ability of our Chinese operations to remit sufficient foreign currency to pay dividends or to make other payments to us, or otherwise to satisfy their foreign currency-denominated obligations. Under existing Chinese foreign exchange regulations, payments of current account items, including dividend payments, interest payments, payments under service agreements or sales of goods and purchase agreements, as well as expenditures from trade-related transactions, can be made in foreign currencies without prior approval from China’s State Administration of Foreign Exchange (“SAFE”) by complying with certain procedural requirements. However, for any Chinese company, dividends can be declared and paid only out of the retained earnings of that company. Under Chinese laws, rules and regulations, each of our subsidiaries incorporated in China is required to set aside at least 10% of its net income each year to fund certain statutory reserves until the cumulative amount of such reserves reaches 50% of its registered capital. These reserves, together with the registered capital, are not distributable as cash dividends. As a result of these laws, rules and regulations, our subsidiaries incorporated in China are restricted in their ability to transfer a portion of their respective net assets to their shareholders as dividends, loans or advances.
41
Furthermore, approval from SAFE or its local branch is required for conversion of RMB into other currencies and remittance out of China to pay capital expenses, such as for repayment of loans denominated in other currencies. Without a prior approval from SAFE, cash generated from our operations in China may not be used to pay off debt in a currency other than the RMB owed by entities within China to entities outside China, or to make other capital expenditures outside of China in a currency other than the RMB.
Application of existing tax laws, rules or regulations are subject to interpretation by tax authorities.
The application of the tax laws of various jurisdictions to our international business activities is subject to interpretation. The tax authorities of the jurisdictions in which we operate have challenged and may continue to challenge our methodologies for valuing developed technology or intercompany arrangements, including our transfer pricing, or determine that the manner in which we operate our business does not result in the expected tax consequences, which could increase our worldwide effective tax rate and adversely affect our financial position and results of operations.
Significant judgment and estimation is required in determining our worldwide tax liabilities. In the ordinary course of our business, there are transactions and calculations, including intercompany transactions, royalty payments and cross-jurisdictional transfer pricing, for which the ultimate tax determination is uncertain or otherwise subject to interpretation. Tax authorities in the countries in which we operate have disagreed and may in the future disagree with our intercompany charges, including the amount of, or basis for, such charges, withholding taxes, cross-jurisdictional transfer pricing, indirect tax liabilities and reclaims or other matters such as the allocation of certain interest expenses and other tax items, and may assess additional taxes.
As we operate in numerous tax jurisdictions, the application of tax laws have in the past and may in the future be subject to diverging and sometimes conflicting interpretations by the tax authorities of these jurisdictions and result in payments in connection with the resolution, the amounts of which could be material. It is not uncommon for tax authorities in different countries to have conflicting views, for instance, with respect to, among other things, whether a permanent establishment exists in a particular jurisdiction, the manner in which the arm’s length standard is applied for transfer pricing purposes, or with respect to the valuation of intellectual property. If a tax authority in one country where we operate were to reallocate income from another country where we operate, and the tax authority in the second country did not agree with the reallocation asserted by the first country, we could become subject to tax on the same income in both countries, resulting in double taxation. If tax authorities were to allocate income to a higher tax jurisdiction, subject our income to double taxation, or assess interest and penalties, it could increase our tax liability which could adversely affect our financial position and results of operations.
Although we believe our tax estimates and methodologies are reasonable, a tax authority’s final determination in the event of a tax audit could materially differ from our historical corporate income tax provisions and accruals and/or indirect tax and customs duty liabilities and claims, in which case we may be subject to additional tax liabilities, possibly including interest and penalties, which could have a material adverse effect on our cash flows, results of operations, financial condition and prospects. Furthermore, tax authorities have become more aggressive in their interpretation and enforcement of such laws, rules and regulations over time, as governments are increasingly focused on ways to increase revenues. This has contributed to an increase in audit activity and more stringent approaches by tax authorities. Even where we believe our historical tax position to be consistent with applicable law, we have in the past and may in the future enter into agreements with tax authorities or resolve claims regarding tax matters where we determine that it is in our best interest to do so given the costs and uncertainties inherent in any litigation or administrative proceeding, including potential proceedings to challenge a tax assessment with which we disagree. As such, additional taxes or other assessments may be in excess of our current tax reserves or may require us to modify our business practices to reduce our exposure to additional taxes going forward, any of which may have a material adverse effect on our business, results of operations, financial condition and prospects.
This risk and the likelihood of a more aggressive approach by tax authorities may be exacerbated by the COVID-19 pandemic. Across the globe, governments have responded to the COVID-19 pandemic with large public expenditures; and governments may be considering plans to increase their collection of revenues through a more stringent approach to the taxation of digital businesses.
42
The enactment of legislation implementing changes in tax legislation or policies in different geographic jurisdictions, including the United Kingdom and the United States, may impact our business, financial condition and results of operations.
We conduct business globally and file income tax returns in multiple jurisdictions. Our consolidated effective income tax rate could be materially adversely affected by several factors, including: changing tax laws, regulations and treaties, or the interpretation thereof (such as the U.S. Inflation Reduction Act which, among other changes, introduced a 15% corporate minimum tax on certain U.S. corporations, which the U.S. Treasury indicated may also apply to certain stock redemptions by a foreign corporation funded by certain U.S. affiliates and a 1% excise tax on certain stock redemptions by U.S. corporations); tax policy initiatives and reforms under consideration (such as those related to the OECD/G20 Inclusive Framework on Base Erosion and Profit Sharing (“BEPS”) or other projects); the practices of tax authorities in jurisdictions in which we operate; the resolution of issues arising from tax audits or examinations and any related interest or penalties.
We are unable to predict what tax reforms may be proposed or enacted in the future or what effect such changes would have on our business, but such changes, to the extent they are brought into tax legislation, regulations, policies or practices in jurisdictions in which we operate, could increase the estimated tax liability that we have paid or accrued on our Consolidated financial statements, and otherwise affect our future results of operations, cash flows in a particular period and overall or effective tax rates in the future in countries where we have operations, reduce post-tax returns to our shareholders and increase the complexity, burden and cost of tax compliance.
Amendments to existing tax laws, rules or regulations or enactment of new targeted tax laws, rules or regulations could have an adverse effect on our business and financial performance.
Many of the underlying laws, rules or regulations imposing taxes and other obligations were established before the growth of the internet and e-commerce. Tax authorities in non-U.S. jurisdictions and at the U.S. federal, state and local levels are currently reviewing the appropriate treatment of companies engaged in digital activity and are considering changes to existing tax or other laws that could result in income, consumption, use or other taxes relating to our activities, and/or impose obligations on us to collect such taxes.
The OECD/G20 BEPS adopted a Programme of Work to Develop a Consensus Solution to the Tax Challenges Arising from the Digitalization of the Economy (the “Programme of Work”). The purpose of the Programme of Work is to develop international corporate tax reform proposals, building on two pillars: Pillar One involves revised profit allocation and nexus rules to reallocate taxing rights to market jurisdictions; and Pillar Two involves rules to ensure a minimum level of effective taxation to address remaining BEPS concerns. Finally, other reporting obligations have been enacted that may impact the Group’s processes, such as new mandatory automatic exchange of information rules for digital platforms, country-by-country reporting and mandatory disclosure rules.
OECD Pillar One and Pillar Two and Digital Services Taxes
On October 8, 2021, most OECD members reached a political agreement regarding a Statement on a Two-Pillar Solution to Address the Tax Challenges Arising from the Digitalization of the Economy. The Pillar One and Pillar Two proposals would introduce significant changes to the international tax rules, affecting the allocation of tax rights across countries and impacting Multinational Groups of Entities (“MNE”).
Pillar One, which is aimed to address solutions for the taxation of certain businesses on revenue streams where there is a market presence including an online presence, involves the creation of a new tax right and the reallocation to market jurisdictions of a share of residual profit determined at the MNE group level, based on a formulaic approach. Various draft model rules for Pillar One were published in 2022 and these remain subject to revision. Pillar One is not expected to impact our business in the medium-term, since the threshold for the application of Pillar One is annual revenue in excess of twenty billion euros. Pillar Two addresses remaining BEPS challenges and is designed to ensure that large international businesses pay a minimum level of tax regardless of where they are headquartered or the jurisdictions in which they operate.
43
At the end of 2021 the OECD published Pillar Two model rules for the implementation of a global minimum tax rate and commentary on such rules were published in March 2022, however, a number of details remain to be addressed and a detailed implementation framework is still to be published.
While Pillar One and Pillar Two discussions were ongoing, a number of jurisdictions enacted or maintained unilateral digital services taxes (“DST”) or similar measures applying to online marketplaces, including the United Kingdom, Italy, France, Spain, Austria, India and Turkey.
Each DST is calculated differently, although they are generally charged on marketplace revenues without relief for input costs or expenses. Based on the current law and information released by the local tax authorities, we were subject to the Italian and Spanish DSTs and the Indian equalization levy in the year ended December 31, 2022. These unilateral measures are likely to be abandoned once the OECD agreement is implemented, which is expected to occur in 2023. Whilst we accrued the full cost of the new DSTs in the year ended December 31, 2022, the costs arising from DSTs for the year ended December 31, 2022 were partially shared with the brands and boutiques for which we have intermediated operations in those countries. This is fully reflected in the audited Consolidated financial statements included elsewhere in this Annual Report.
In 2020, the U.S. Trade Representative launched a “Section 301” investigation into whether certain DSTs are unreasonable or discriminatory; and whether they burden or restrict commerce in the United States. Included in the political agreement to implement the OECD’s two-pillar solution to tax the digitalized economy was a confirmation that unilateral DSTs would be abolished, following which the United Kingdom, Italy, France, Spain, Austria, India and Turkey have agreed to a transitional approach with the United States, whereby their DST measures will remain in effect until Pillar One takes effect. To the extent that taxes from the unilateral measures accruing to one of these countries in the period before Pillar One takes effect exceeds an amount equivalent to the tax due under Amount A of Pillar One, the excess will be creditable against the Amount A liability in that country. In return, the United States has committed to terminate proposed trade actions (and not to impose further trade actions) against these countries with respect to their existing DST regimes.
In light of the changing regulatory environment, there could be different interpretations of these unilateral laws that currently remain in effect. We routinely consult with specialist external advisors in interpreting the relevant tax laws and take into account their impact on our operations. We cannot, however, anticipate the likelihood, timing or impact of any new regulations, guidance, laws or interpretations of such regulations, guidance or laws. If such tax or other laws, rules or regulations were amended, or if new unfavorable laws, rules or regulations were enacted, the new legislation could increase our tax payments or other obligations, prospectively or retrospectively, subject us to interest and penalties, decrease the demand for our services if we passed on such additional costs to the consumer, result in increased costs to update or expand our technical or administrative infrastructure, or effectively limit the scope of our business activities if we decided not to conduct business in particular jurisdictions. As a result, these changes may have a material adverse effect on our business, results of operations, financial condition and prospects.
New Mandatory Automatic Exchange of Information Rules for Digital Platforms
The Directive on Administrative Cooperation in the Field of Taxation (the “DAC7”) allows member states’ tax authorities to collect and automatically exchange information on income earned by sellers on digital platforms.
Operators falling within the scope of DAC7 will be required to collect and verify in-line with prescribed due diligence procedures information from sellers/providers on their online platform. Subsequently, certain information will be reported to the sellers/providers and to the relevant tax authority. Such information includes, inter alia, an overview of amounts paid to sellers from the reportable activities and platform fees and commissions incurred.
DAC7 was formally adopted on March 22, 2021. Member states of the European Union were required to publish any domestic law, regulation, and administrative provisions necessary to comply with the directive by January 31, 2022, and such rules have applied since January 1, 2023.
44
We are taking the necessary steps to comply with the rules. Any penalty for noncompliance will be determined by the member state and is difficult to anticipate and estimate at this time; but any such penalty and costs of DAC7 implementation could negatively impact our profitability.
Others
In addition, various governments and intergovernmental organizations could introduce additional proposals for tax legislation, or adopt tax laws, particularly with regard to online marketplaces, which may have a significant adverse effect on our worldwide effective tax rate, or increase our tax liabilities, the carrying value of deferred tax assets, or our deferred tax liabilities. The OECD continuously monitors key areas of action and publishes reports and guidance on implementation of the BEPS recommendations. Multiple jurisdictions, including some of the countries in which we operate, have implemented recommended changes aimed at addressing perceived issues within their respective tax systems that may lead to reduced tax liabilities among multinational companies. However, other jurisdictions in which we operate or do business could react to the BEPS initiative or their own concerns by enacting additional tax legislation that could adversely affect us through increasing our tax liabilities.
The application of a value-added tax (or similar taxes) and the impact of managing our business model transition to a commissionaire structure could adversely affect our business and results of operations.
The application of a value-added tax (or similar taxes such as a sales and use tax, provincial tax, or goods and services tax), business tax and gross receipt tax to our business and to our luxury sellers is a complex and evolving issue. Significant judgment is required to evaluate applicable tax obligations. As a result, amounts recorded may be subject to adjustments by the relevant tax authorities. In many cases, the ultimate tax determination is uncertain because it is not clear how new and existing statutes might apply to our business or to the businesses of our luxury sellers. A number of jurisdictions globally have introduced (or are considering the introduction of) additional reporting, record-keeping or value-added tax (or similar taxes) calculation, collection and remittance obligations on businesses like ours that facilitate or perform e-commerce. Such obligations could require us or our luxury sellers to incur substantial costs in order to comply, including costs associated with legal advice, local compliance, tax calculation, collection, remittance and audit requirements, which could make selling in such markets less attractive and could adversely affect our business.
For example, in certain jurisdictions, rules have already been introduced to hold the online facilitator of sales of goods and services jointly and severally liable for any under or non-accounted value added tax (or similar taxes) by the sellers. Such joint and several liability provisions may significantly impact our business where our luxury sellers have not complied with the local provisions. In addition, new rules for retail and e-commerce sales are being introduced. For example, across the European Union since July 2021, online marketplaces have been, in certain situations (where certain thresholds are met), deemed to be the supplier of goods for value-added tax purposes, which requires them to collect and pay a value-added tax on sales via their platform. Further, in the United States, states are able to tax their residents on remote sales. Following the U.S. Supreme Court’s decision in 2018 in South Dakota v. Wayfair, a U.S. state may require by way of economic nexus laws an online retailer to collect sales taxes imposed by that state, even if the retailer has no physical presence in that state, thus permitting a wider enforcement of such sales tax collection requirements against non-U.S. companies that have historically not been responsible for state or local tax collection unless they had physical presence in the U.S. customer’s state.
Given the current complexities for online marketplaces, inconsistencies in interpretation and implementation of local tax rules, we have transitioned our key business model to one in which we act as an “undisclosed agent” or “commissionaire” of our luxury sellers. Under this model, for the purposes of calculating value-added tax, our end consumers will contract with and be invoiced by us and there will be a supply for value-added tax purposes by us to the end consumer of goods and other related services, although the legal sale of goods will continue to be between our luxury sellers and the end consumer. Our transition is intended to simplify and provide greater certainty to our value added tax accounting position without materially increasing our overall value-added tax liabilities.
Our ability to achieve our business and financial objectives is subject to risks and uncertainties. Implementing our business model requires a considerable investment of technical, financial and legal resources. If we are unable to successfully establish our business model, our business, results of operations, financial condition and prospects could be negatively impacted.
45
We may be subject to general litigation, regulatory disputes and government inquiries.
As a company with evolving operations, including in the highly regulated product categories of beauty and kidswear, as well as in relation to cryptocurrencies and digital assets, we have in the past faced and may in the future increasingly face the risk of claims, lawsuits, government investigations, and other proceedings involving competition and antitrust, intellectual and other proprietary rights and property, cybersecurity and privacy, product safety, consumer protection, accessibility claims (including those relating to our compliance with the Americans with Disabilities Act of 1990), securities, tax, labor and employment, commercial disputes, services and other matters. The number and significance of these disputes and inquiries have increased as the political and regulatory landscape changes, and as we have grown larger and expanded in scope and geographic reach, and as our services have increased in complexity. Refer to Item 8. “Financial Information — A. Consolidated Statements and Other Financial Information — Legal and Arbitration Proceedings.”
We cannot predict the outcome of such disputes and inquiries with certainty. Regardless of the outcome, these matters can have an adverse impact on us because of legal and other external advisor costs, diversion of management resources, and other factors. Determining reserves for any litigation is a complex and fact-intensive process that is subject to judgment calls. It is possible that a resolution of one or more such proceedings could require us to make substantial payments to satisfy judgments, fines or penalties or to settle claims or proceedings, any of which could harm our business. These proceedings could also result in reputational harm, criminal sanctions, consent decrees, undertakings or orders preventing us from offering certain products, or services, or requiring a change in our business practices in costly ways or requiring development of non-infringing or otherwise altered products or technologies. Litigation and other claims and regulatory proceedings against us could result in unexpected expenses and liabilities, which could have a material adverse effect on our business, results of operations, financial condition and prospects.
The profitability of our Browns, Stadium Goods, Violet Grey and New Guards businesses depends on our ability to manage inventory levels and, if not managed successfully, our business and results of operations could be adversely affected.
Browns, Stadium Goods and Violet Grey purchase merchandise wholesale which they then sell via our Marketplaces or in-store. In addition, New Guards produces merchandise which it then sells via our Marketplaces, its brands’ websites or to retailers. As a result, our profitability depends on our ability to manage these businesses’ inventory levels and respond to shifts in consumer demand patterns. Overestimating consumer demand for merchandise may result in Browns, Stadium Goods, Violet Grey or New Guards holding unsold inventory, which would likely result in the need to rely on markdowns or promotional sales to dispose of excess inventory, which could have an adverse effect on our gross margins and results of operations. Conversely, if Browns, Stadium Goods, Violet Grey or New Guards underestimate consumer demand for merchandise that could lead to inventory shortages, lost sales opportunities or negative consumer experiences that could adversely affect consumer relationships and our ability to grow in the future. In the event that New Guards’ business, which was primarily wholesale-focused prior to our acquisition, significantly grows its e-concession and direct-to-consumer business, this has in the past and may in the future result in increasing its exposure to such inventory risks having only had limited prior experience managing such risks. The COVID-19 pandemic, or the effects of other geopolitical or macroeconomic factors may increase the complexity of forecasting consumer demand and/or impact our ability to source inventory to meet demand, both of which could adversely affect our operations. Any delays in deliveries of merchandise due to production slowdowns or other distribution disruptions caused by the pandemic could impact our inventory levels.
Browns, Stadium Goods, Violet Grey and New Guards rely on various processes and systems for forecasting, merchandise planning, inventory management, procurement, allocation and fulfilment capabilities. Our ability to continue to successfully execute our strategies for these businesses or evolve such strategies with changes in the retail environment could be adversely affected if such processes and systems are not effectively adopted, managed and maintained.
46
If any of our inventory management systems were to fail, or if our physical inventory is inaccurate for any reason, we may not derive the expected sales and profitability of our Browns, Stadium Goods, Violet Grey or New Guards businesses, or we may incur increased costs relative to our current expectations which could adversely affect our business, financial condition, results of operations and prospects.
The continuing impact of "Brexit" may have a negative effect on our business.
We are a multinational company headquartered in the United Kingdom with worldwide operations, including significant business operations in the European Union. Following a national referendum and subsequent legislation, the United Kingdom formally withdrew from the European Union, commonly referred to as “Brexit,” and ratified a trade and cooperation agreement governing its future relationship with the European Union (“TCA”). Among other things, the TCA, which became effective in 2021, addresses trade, economic arrangements, law enforcement, judicial cooperation and governance. Because the TCA merely sets forth a framework in many respects that requires complex additional bilateral negotiations between the United Kingdom and the European Union, significant uncertainty remains about how the precise terms of the relationship between the parties will differ from the terms before withdrawal.
While agreement on the terms of the TCA provided in principle for quota and tariff-free trading of goods, the TCA has created non-tariff barriers (such as increased shipping and regulatory costs and complexities) to the trade in goods between the United Kingdom and the European Union, which may affect our operations. Further, the TCA does not provide for the continued free movement of services between the United Kingdom and the European Union. The full impact of such arrangements, on both our existing processes and our ability to adjust our business and operations to operate successfully in the United Kingdom and the European Union, as well as more broadly on UK-EU cross-border trade, are expected to become clearer over the course of 2023. In particular, it remains to be seen whether the implementation of, and adjustment of UK-EU trading processes for, the TCA could disrupt or otherwise negatively impact our business and operations.
Any resulting restrictions on the movement of goods or services could have a material adverse effect on our operations. For example, in 2021 we saw production delays from the ongoing effects of the United Kingdom’s withdrawal from the European Union and in 2022 we saw delays in relation to customs clearance; if such delays were to re-occur they could have an adverse effect on our results of operations. In addition, we have altered the geographic locations of, or jurisdiction of entities responsible for, certain fulfilment, delivery and warehouse services to adjust to the new legal and regulatory landscape resulting from the implementation of the TCA, which required time and resources, and in the future we may need to continue to refine our approach in this respect. To meet these potential increased regulatory complexities, since early 2021 we have migrated most Fulfilment by Farfetch volumes from the United Kingdom to a third-party operated fulfilment warehouse in continental Europe, but such migration may not adequately address future regulatory developments. These increased regulatory complexities related to the import and export of products or changes in item pricing may impact the consumer experience, result in increased costs and have a material adverse effect on our business and results of operations.
The TCA also grants each of the United Kingdom and the European Union the ability, in certain circumstances, to unilaterally impose tariffs on one another. In the event of such an imposition, any additional tariffs may have a material adverse impact on us as well as the stability of UK-EU trade more generally. Any uncertainty as to UK or EU government policy and, in particular, whether any such policy may result in the imposition of reciprocal tariffs, may depress economic activity or have an adverse impact on our business and operations. Consumer activity may be further depressed should the costs of purchasing goods increase for consumers in the United Kingdom or European Union as a result of Brexit, for example, due to higher interchange or other fees levied by payment processors.
In addition, the TCA has imposed additional restrictions on the free movement of people between the United Kingdom and the European Union, which could have a material adverse effect on us, since we compete in these jurisdictions for well-qualified employees in all aspects of our business, including software engineers and other technology professionals. Any impact on our ability to attract new employees and to retain existing employees in their current jurisdictions could decrease our competitiveness and have a material adverse effect on our business and results of operations. We cannot yet predict the full implications of Brexit, including whether it will have further impacts on our business or results of operations.
47
We sell certain merchandise via third-party platforms, and our inability to access consumers via these platforms could adversely affect our business.
We sell certain merchandise via third-party platforms, including, for example, on Tmall Luxury Pavilion in China. We are subject to, and must comply with, such platforms’ respective terms and conditions for merchants and their terms of service for consumer rights protection. Such third-party platforms retain the right to remove our merchandise from their platform or halt our sales on their platform if they believe we have violated their terms and conditions, the law or the intellectual property rights of other parties, including, but not limited to, allegations that any goods we offer for sale are counterfeit. Such platforms can halt sales or remove our merchandise at their complete discretion irrespective of the validity of any claims made against us. Should such third-party platforms exercise such discretion in a market where we are substantially reliant on the relevant platform it could negatively impact our business and results of operations in that market, which could have a material adverse effect on our business, results of operations, financial condition and prospects. Further, should such third-party platforms’ actions become public it could impact our business and could substantially harm our reputation and adversely impact our efforts to develop our brands, irrespective of the validity of the claims.
We may be subject to claims that items listed on our website, or the sites we support via FPS (in each case), and their descriptions are counterfeit, infringing or illegal.
We occasionally receive communications alleging that items listed on our Marketplaces infringe third-party copyrights, trademarks or other proprietary rights. We have intellectual property complaint and take down procedures in place to address these communications. We follow these procedures to review complaints and relevant facts to determine the appropriate action, which may include removal of the item from our websites and, in certain cases, discontinuing our relationship with a retailer, brand or other seller who repeatedly violates our policies. However, such procedures may be subject to error or enforcement failures, may not be adequately staffed and may not be enough for us to avoid liability under applicable laws and regulations. We also may be subject to erroneous or fraudulent demands to remove content, and actions we take based on such demands could negatively impact our relationships with our luxury sellers who were affected. Our success as an online luxury retailer depends on our ability to accurately and cost-effectively determine whether an item offered for sale or submitted for a return is an authentic product. While we would delist any merchandise we believe to be counterfeit, we cannot be certain that we will identify every counterfeit item. As the sophistication of counterfeiters increases, it may be increasingly difficult to identify counterfeit products. The sale or return of any counterfeit goods may damage our reputation as a trusted online luxury retailer, which may adversely affect our reputation, customer acceptance and relationships with brand partners.
The legal framework in this area is developing and is increasingly moving towards imposing direct obligations on online platforms, including solutions such as FPS and e-commerce marketplaces such as ours. These developments include, for example, the introduction of the Digital Services Act in the European Union in November 2022 which will start to impact us from 2023. In particular, we may be subject to substantial civil or criminal liability for activities carried out, such as products listed, by our luxury sellers on our platform. While we aim to remain informed of the latest legal developments and review our procedures accordingly, those procedures may not effectively reduce or eliminate our liability.
48
Regardless of the validity of any claims made against us, we may incur significant costs and efforts to defend against or settle them and such claims could lead to negative publicity and damage to our reputation. If a governmental authority determines that we have aided and abetted, or otherwise failed to meet legal obligations in relation to preventing or addressing, the infringement on or sale of counterfeit goods, we could face regulatory, civil or criminal penalties. For example, in China, listing an untrue or inconsistent product description or information, including the listing of counterfeit goods, could be considered “false advertising” under the PRC Advertising Law, subject to an administrative fine of up to one million RMB, and if there are three or more illegal advertisements from the company, an administrative fine of up to two million RMB, along with other administrative punishments such as the potential revocation of a business license and the advertisement review approval document, and the regulator may also decline to accept the advertisement review approval document's renewal within one year. Furthermore, consumers in China who purchase items on our Marketplaces may bring a “fraud” claim against us, and if successful they would be entitled to three times the price of the item as penalty compensation pursuant to PRC law; and for those who purchase items on our Tmall Luxury Pavilion flagship store and successfully claim with sufficient evidence that a product is counterfeit, such consumers could be entitled to nine times the price of the item as liquidated damages, pursuant to the more onerous Tmall Luxury Pavilion rules that apply to our sales through this channel.
Successful claims by third-party rights owners could require us to pay substantial damages or refrain from permitting any further listing of the relevant items (or similar items from the same source). These types of claims could force us to modify our business practices, which could affect our revenue, increase our costs or make our Marketplaces less user friendly. Moreover, public perception that counterfeit or other unauthorized items are common on our Marketplaces, even if factually incorrect, could result in negative publicity and damage to our reputation.
If our luxury sellers experience any recalls, product liability claims, or government, customer or consumer concerns about product safety with respect to products sold on our Marketplaces, our reputation and sales could be harmed.
Our luxury sellers, including Browns, Violet Grey, the brands in the New Guards portfolio and the brands selling kidswear, eyewear and beauty products, are subject to regulation by the U.S. Consumer Product Safety Commission and similar state and international regulatory authorities, and their products sold on our platform could be subject to involuntary recalls and other actions by these authorities. Concerns about product safety, including concerns about the safety of products manufactured in developing countries, and those that are part of highly regulated product categories such as kidswear, eyewear and beauty (including wellness-related ingestibles), could lead our luxury sellers to recall selected products sold on our Marketplaces. Recalls and government, customer or consumer concerns about product safety could harm our reputation and reduce sales, either of which could have a material adverse effect on our business, results of operations, financial condition and prospects. If any New Guards Group regulated product, or regulated product sold by Browns or Violet Grey, becomes subject to a recall or government, customer or consumer safety concerns, we could experience significant adverse effects or reputational harm, face product liability litigation and governmental investigations and incur costs associated with any remediation actions. As New Guards Group brands are also manufacturers of regulated products, such as beauty products, brands within the New Guards portfolio are subject to more stringent regulation and therefore have increased exposure to potential enforcement risk in respect of product compliance, consumer protection, product liability and product labeling (including in relation to ESG matters). Any noncompliance, or alleged noncompliance, in relation to such regulation could damage our reputation and brand identity and substantially harm our business and results of operations.
49
Risks Relating to our Intellectual Property
Assertions by third parties of infringement or misappropriation by us of their intellectual property rights or confidential know how could result in significant costs and substantially harm our business and results of operations.
Third parties have asserted, and may in the future assert, that we (including New Guards and the brands in its portfolio) have infringed or misappropriated their trademarks, copyrights, confidential know how, trade secrets, patents or other intellectual property or proprietary rights. Intellectual property disputes can be costly to defend and may cause our business, operating results and financial condition to suffer. As the global digital luxury market expands, the risk increases that there may be patents granted to third parties that relate to our products and technology of which we are not aware or that we must challenge to continue our operations as currently contemplated. From time to time, we face allegations, whether merited or not, that we or our partners have infringed or otherwise violated the patents, trademarks, copyrights or other intellectual property rights of third parties. Such claims have been, and in the future may be, made by competitors seeking to obtain a competitive advantage or by other parties, including, most recently, third parties seeking to use their registered intellectual property rights aggressively as a form of income stream. We may also face allegations that our employees have misappropriated the intellectual property or proprietary rights of their former employers or other third parties. When such claims and allegations arise, it may be necessary for us to initiate litigation to defend ourselves in order to determine the scope, enforceability and validity of third-party intellectual property or proprietary rights, or to establish our respective rights. Regardless of whether claims that we are infringing patents or other intellectual property rights have merit, such claims can be time-consuming, divert management’s attention and financial resources and can be costly to evaluate and defend. Results of any such claims or litigation are difficult to predict and may require us to stop using our products or technology, obtain licenses, modify our services and technology while we develop non-infringing substitutes or incur substantial damages, settlement costs or face a temporary or permanent injunction prohibiting us from marketing or providing the affected products and services. We may also have to redesign our products or services so they do not infringe third-party intellectual property or proprietary rights, which may not be possible or may require substantial monetary expenditures and time, during which our technology and products may not be available for commercialization or use.
We cannot predict whether any such assertions or claims arising from such assertions will substantially harm our business and results of operations, whether or not they are successful. If we are forced to defend against any infringement or other claims relating to the trademarks, copyright, confidential know how, trade secrets, patents or other intellectual property or proprietary rights of third parties, whether they are with or without merit or are determined in our favor, we may face costly litigation or the diversion of technical and management personnel. Furthermore, the outcome of a dispute might require us to cease use of some portion of our technology, develop non-infringing technology, recall or modify infringing merchandise, pay damages, costs or monetary settlements or enter into co-existence, royalty or licensing agreements. Co-existence, royalty or licensing agreements, if required, may be unavailable on terms acceptable to us, or at all. Co-existence agreements in particular would restrict the use of our owned intellectual property rights to certain uses as set out in the co-existence agreement, while the third party would be permitted to use similar, or identical, intellectual property rights that it owns for its own business use as set out in the co-existence agreement, which could dilute the distinctiveness, and therefore the value, of the relevant intellectual property. Any such assertions or litigation could materially adversely affect our business, results of operations, financial condition and prospects.
50
In 2008 and 2009, a party related to Farfetch founder José Neves (the “Related Party”) executed two agreements (the “KH Licenses”) purporting to license certain know how (the “Know How”) from the Related Party to two third-party LLPs (the “LLPs”). The Know How was a high level explanation of the Farfetch platform and business model. The 2008 KH License expired in April 2018, and the 2009 KH License expired in April 2019. The KH Licenses did not include a license of any software code. The LLPs granted intra-group sub-licenses of the collective Know How under the KH Licenses, which was then further sub-licensed under two direct “Product and Development and Marketing Support Agreements” with Farfetch in 2008 and 2009, respectively (the “Direct Agreements”), in order for Farfetch to, among other services, develop the code, website architecture and brand that comprised the original Farfetch offering (the “Developed IP”). Under the terms of the Direct Agreements, the third party, rather than Farfetch, owned the Developed IP. In 2011, the licensing structure was amended and the intra-group sub-licenses from the LLPs were superseded by licenses of the Know How granted by each of the LLPs to Mr. Neves, who licensed such Know How (by way of a sub-sub-license) to Farfetch. Finally, in 2011, the Direct Agreements were terminated, and the Developed IP was assigned from the third-party group to Farfetch. In 2013, the Related Party executed a “Declaration regarding copyrights and intellectual property rights” (the “Declaration”), which declared that, among other things, between the period November 16, 1996 to February 27, 2010, the Related Party had not created any works or done anything which could originate intellectual property rights (defined to include know how) in connection with any of the entities in the original license chain (including Farfetch); any unknown intellectual property generated by the Related Party and used, licensed or in any other way exploited by those entities (including Farfetch) was transferred in full to Mr. Neves; and the Related Party agreed that any intellectual property in use by the above entities that were to be recognized by a court as belonging to the Related Party would be transferred to Mr. Neves for €500. On April 29, 2014, Mr. Neves assigned all of his intellectual property rights and know how (including that obtained under the Declaration) to Farfetch.com. While seemingly conclusive, it is possible that the Declaration could be challenged. Although we do not expect our right to use the Know How to be successfully challenged, any such challenge could give rise to: (1) temporary injunctive relief which could restrict the use of such Know How by Farfetch and therefore operations of our business; (2) reputational damage; and/or (3) damages payable by Farfetch to the Related Party for any period of unauthorized use of the Know How following the expiration of the KH Licenses, any of which could have a material adverse effect on our business, results of operations, financial condition and prospects.
Our use of open source software may pose particular risks to our proprietary software and systems.
We use open source software in our proprietary software and systems and will use open source software in the future. The licenses applicable to our use of open source software may require that source code that is developed using open source software be made available to the public and that any modifications or derivative works to certain open source software continue to be licensed under open source licenses. From time to time, we may face claims from third parties claiming infringement of their intellectual property rights, or demanding the release or license of the open source software or derivative works that we developed using such software (which could include our proprietary source code) or otherwise seeking to enforce the terms of the applicable open source license. These claims could result in litigation and could require us to purchase a costly license, publicly release the affected portions of our source code, limit the use of, or cease using, the implicated software unless and until we can re-engineer such software to avoid infringement or change the use of, or remove, the implicated open source software. In addition to risks related to license requirements, use of certain open source software can lead to greater risks than use of third-party commercial software, as open source licensors generally do not provide warranties, indemnities or other contractual protections with respect to the software (for example, non-infringement or functionality). Our use of open source software may also present additional security risks because the source code for open source software is publicly available, which may make it easier for hackers and other third parties to determine how to breach our website and systems (including FPS) that rely on open source software. Any of these risks could be difficult to eliminate or manage, and, if not addressed, could have a material adverse effect on our business, results of operations, financial condition and prospects.
51
Failure to adequately protect, maintain or enforce our intellectual property rights could substantially harm our business and results of operations.
We rely on a combination of trademark, copyright, confidential information, trade secrets and patent law, and contractual restrictions to protect our intellectual property and other proprietary information. The protection offered by these has its limitations. Despite our efforts to protect and enforce our proprietary rights and information, unauthorized parties have used, and may in the future use, our trademarks or similar trademarks, including those of the brands in the New Guards portfolio (including in the form of counterfeit goods), copy aspects of our website images, features, compilation and functionality or obtain and use information that we consider as proprietary, such as the technology used to operate our website, FPS or our content.
We do not have comprehensive registered protection for all of our brands, including the brands in the New Guards portfolio, in all jurisdictions around the world. There is no guarantee that we will be the first to submit trademark applications in all territories and/or classes for our brands and we have in the past experienced professional “trademark squatters” actively registering our brands’ marks before we are able to in certain markets, including China. We cannot guarantee that we will be able to preempt or successfully challenge such bad faith actors in the future, and we may incur costs in challenging their marks or putting in place preventative measures. In addition, there is no guarantee that our pending trademark applications for any brand will proceed to registration, and even those trademarks that are registered could be challenged by a third party, including by way of revocation or invalidity actions. Our competitors have adopted, and other competitors may adopt, service, business or trading names or brands similar to ours, thereby impeding our ability to build brand identity and possibly diluting our brand or leading to consumer confusion. In addition, there could be potential trade name or trademark ownership or infringement claims brought by owners of other rights, including registered trademarks, in our marks or marks similar to ours, including FARFETCH, BROWNS, STADIUM GOODS, VIOLET GREY and marks relating to brands in the New Guards portfolio and certain intellectual property in China, Macau, Hong Kong and Taiwan relating to the Farfetch word mark. In addition, we license-in, rather than own, certain intellectual property related to certain brands within the New Guards portfolio. Any claims of infringement, brand dilution or consumer confusion related to our brands (including our trademarks) or any failure to renew key license agreements on acceptable terms could damage our reputation and brand identity and substantially harm our business and results of operations.
In addition to our registered trademark protection we have several granted patents in the United Kingdom, Europe and the United States. We also have several pending patent applications in the United Kingdom, Europe and internationally, for aspects of our proprietary technology, and we may file further patent applications in the future. There is no guarantee that these will result in issued patents, and even if these proceed to grant, they and our granted patents could be vulnerable to challenge by third parties, or their claims could be narrowed in scope by the issuing patent office such that they no longer adequately protect our proprietary technology. Further, we may decide not to pursue a patent application for an innovation due to the high costs, diversion of management time, and publication of the underlying innovation that arises from an application. The loss of our material intellectual property as a result of any claims or challenges, or the natural expiration of our intellectual property registrations, could have a material adverse effect on our business, results of operations, financial condition and prospects.
Domain names generally are regulated by internet regulatory bodies, and the regulation of domain names is subject to change. Regulatory bodies have and may continue to establish additional top-level domains, appoint additional domain name registrars or modify the requirements for holding domain names. We may not be able to, or it may not be cost effective to, acquire or maintain all domain names that utilize the name “Farfetch” or other business brands in all of the countries in which we currently conduct or intend to conduct business. If we lose the ability to use a domain name, we could incur significant additional expenses to market our products within that country, including the development of new branding. This could substantially harm our business, results of operations, financial condition and prospects.
52
We rely on multiple software programmers (as employees or independent consultants and third parties) to design our proprietary technologies, designers (as employees or independent consultants) to create the products sold by the New Guards portfolio of brands and photographers (as employees or independent consultants) to capture the products sold on our platform. Although we make every effort to ensure appropriate and comprehensive assignment or license terms are included in the contracts with such third parties, we cannot guarantee that we own or are properly licensed to use all of the intellectual property in such software, products or images. If we do not have, or lose our ability to use, such software, products or images, we could incur significant additional expense to remove such assets from our platform or re-engineer a portion of our technologies.
Litigation or similar proceedings have been necessary in the past and may be necessary in the future to protect, register and enforce our intellectual property rights, to protect our trade secrets and domain names and to determine the validity and scope of the proprietary rights of others. Any litigation or adverse priority proceeding could result in substantial costs and diversion of resources and could substantially harm our business, results of operations, financial condition and prospects.
We may be required to protect our intellectual property in an increasing number of jurisdictions, a process that is expensive and may not be successful, or which we may not pursue in every location. In addition, effective intellectual property protection may not be available to us in every country, and the laws of some jurisdictions may not adequately protect our intellectual property rights. Additional uncertainty may result from changes to intellectual property legislation, and from interpretations of intellectual property laws by applicable courts and agencies. Accordingly, despite our efforts, we may be unable to obtain and maintain the intellectual property rights necessary to provide us with a competitive advantage. Our failure to obtain, maintain and enforce our intellectual property rights could therefore have a material adverse effect on our business, financial condition and results of operations.
Risks Relating to our New Guards Business
Our New Guards business is dependent on its production, inventory management and fulfilment processes and systems, which could adversely affect its business if not successfully executed.
New Guards relies on various processes and systems for merchandise planning, inventory management, procurement, allocation and fulfilment capabilities. If any such systems were to fail or experience disruptions, including as a result of the COVID-19 pandemic, we may not derive the expected benefits to New Guards’ sales and profitability, or may incur increased costs relative to our current expectations, which could adversely affect our business, financial condition, results of operations and prospects. Refer to “Risks Relating to our Business and Industry — The profitability of our Browns, Stadium Goods, Violet Grey and New Guards businesses depends on our ability to manage inventory levels and, if not managed successfully, our business and results of operations could be adversely affected.”
Our New Guards business relies on contract manufacturing of its products. Our inability to secure production sources meeting our quality, cost, working conditions and other requirements, or failures by our contract manufacturers to perform, could harm our business and reputation.
In the year ended December 31, 2022, New Guards sourced all of its products from independent contract manufacturers who purchase fabric and make products, and may also provide design and development services. As a result, New Guards must locate and secure production capacity. We depend on contract manufacturers to maintain adequate financial resources, including access to sufficient credit, secure a sufficient supply of raw materials, and maintain sufficient development and manufacturing capacity in line with our asset light production model and in an environment characterized by continuing cost pressure and demands for product innovation and speed-to-market. In addition, we currently do not have any material long-term contracts with any of New Guards’ contract manufacturers. Significant difficulties or failures to perform by our contract manufacturers, including as a result of the COVID-19 pandemic or the effects of geopolitical or macroeconomic events, could cause delays in product shipments or otherwise negatively affect our results of operations. As of December 31, 2022, New Guards had relationships with approximately 120 manufacturers in over ten countries. If we decide to consolidate our production in the future, we could incur additional costs and such consolidation could increase our reliance on a smaller number of contract manufacturers.
53
Using contract manufacturers means we incur certain costs. Depending on the particular contract manufacturer, we may be responsible for paying the customs duties when shipping merchandise from its location of manufacture. Further, the prices we pay our contract manufacturers for our products are dependent in part on the market price for raw materials used to produce them, primarily cotton. The price and availability of raw materials may fluctuate substantially depending on a variety of factors, including demand, acreage devoted to cotton crops and crop yields, weather, supply conditions, transportation costs, warehouse management, energy prices, work stoppages, due to the COVID-19 pandemic or otherwise, government regulation and policy, economic conditions, market speculation and other unpredictable factors. Any and all of these factors may be exacerbated by global climate change.
A contract manufacturer’s failure to ship products to us in a timely manner or to meet our quality standards, or interference with our ability to receive shipments due to factors such as port or transportation conditions, security incidents or as a result of the COVID-19 pandemic or the effects of geopolitical events, could cause us to miss the delivery date requirements of our consumers on the Farfetch Marketplace or of our retail and wholesale customers on our Brand Platform. Failing to make timely deliveries may cause our consumers or customers to cancel orders, refuse to accept deliveries, impose noncompliance charges, demand reduced prices, or reduce future orders, any of which could harm our sales and margins. If we need to replace a contract manufacturer, we may be unable to locate additional contract manufacturers on terms that are acceptable to us, or at all, or we may be unable to locate additional contract manufacturers with sufficient capacity to meet our requirements or to fill our orders in a timely manner.
We require contract manufacturers to meet our standards in terms of working conditions, environmental protection, raw materials, facility safety, security and other matters. As such, we may decide to pursue less cost-efficient production to ensure we are meeting our sustainability objectives. We may also encounter delays in production and added costs as a result of the time it takes to train our contract manufacturers in our methods, products and quality control standards. In addition, the labor and business practices of apparel manufacturers and their suppliers have received increased attention from the media, non-governmental organizations, consumers and governmental agencies in recent years. Failures by our contract manufacturers or their suppliers or subcontractors to adhere to labor or other laws, appropriate labor or business practices, safety, structural or environmental standards, and the potential litigation, negative publicity and political pressure relating to any of these events, could harm our business and reputation.
New Guards may not be successful in discovering, promoting and sustaining the reputation of its brands.
New Guards is known for the brands in its portfolio, and the reputation of such brands relies on the quality and exclusiveness of New Guards’ products, its distribution networks, as well as the promotional and marketing strategies applied. Products or marketing strategies not in line with brand objectives, inappropriate behavior by brand ambassadors, New Guards’ employees, distributors or suppliers, or detrimental information circulating in the media may endanger the reputation of such brands and may adversely impact sales.
The growth of our New Guards business depends in part on our ability to discover, attract and acquire new brands for its portfolio. Our ability to do so depends on our ability to identify the right designers, creators and brands with potential and offer them a compelling proposition, including attractive commercial terms when New Guards acquires existing brands or their intellectual property assets.
54
If New Guards grows its portfolio through brand collaborations, partnerships or acquisitions, we may not be successful in integrating new brands into the New Guards systems and strategy; such collaborations, partnerships or acquisitions may divert the time of New Guards management from developing or discovering new brands, and we may not achieve the anticipated benefits from any such collaboration or acquisition. To the extent such collaborations are with third-party licensors, New Guards may not control the distribution, design and development services, supply chain manufacturing capacity or timely shipments for any given licensed brand’s merchandise, and as a result may not have access to merchandise produced by those licensors at desired volumes or on a timely basis, which could have an adverse effect on our business and results of operations. For example, in February 2022 New Guards formed a long-term strategic partnership with Reebok which (i) named New Guards as the core operating partner for Reebok across Europe; and (ii) appointed New Guards as the exclusive partner to create, curate and bring-to-market luxury collaborations and distribute premium Reebok products in over fifty countries. New Guards does not have control of the supply chain lifecycle of the products it distributes as Reebok’s core operating partner in Europe. Furthermore, in support of launching the partnership New Guards will be bearing certain costs and expenses, including but not limited to those associated with logistics operations and holding inventory.
The majority of New Guards’ sales are from carefully selected third-party distributors. The reputation of New Guards’ brands’ products thus rests in part on compliance by all distributors with such brands’ requirements in terms of their approach to the handling and presentation of products, marketing and communications policies and with respect to brand image. New Guards’ or third-party distributors’ failure to provide consumers with high-quality products and high-quality consumer experiences for any reason could substantially harm the reputation of its brands, which could have a material adverse effect on our business, results of operations, financial condition and prospects.
New Guards’ brands or products could be counterfeited or copied, which could have a material adverse effect on its business.
New Guards’ brands, expertise and production methods have in the past and could in the future be counterfeited or copied. Its products may be distributed in parallel retail networks, including online sales networks, without our consent.
Counterfeiting and parallel distribution have an immediate adverse effect on revenue and profit. Activities in these or other illegitimate channels may damage the brand image of the relevant products over time and may also lower consumer confidence, which could have a material adverse effect on our business, results of operations, financial condition and prospects.
Although New Guards monitors websites, marketplaces and social media networks with the aim of detecting any unauthorized use of New Guard’s brands, and records its trademarks and designs with the appropriate authorities, New Guards may not be able to detect all unauthorized uses and may not be successful in challenging such uses.
New Guards licenses, rather than owns, certain intellectual property related to certain brands within its brand portfolio and it may not be successful in maintaining such intellectual property rights.
New Guards licenses, rather than owns, certain intellectual property related to certain brands within its brand portfolio, and such licenses generally include expiration dates and termination provisions. For example, New Guards’ license of the trademarks of the Off-White brand, which accounted for a majority of our Brand Platform GMV in the year ended December 31, 2022, expires in 2035 and includes a right for either party to opt out of the agreement effective as of January 1, 2026, subject to notice provisions. The agreement is also subject to standard termination rights related to unremedied material breaches of the license agreement and insolvency events.
Any failure to maintain or renew key license agreements on acceptable terms could damage our reputation and brand identity and could have a material adverse effect on our business, results of operations, financial condition and prospects.
55
Our New Guards business may be unable to maintain or increase sales through physical distribution channels.
Revenue attributable to our Brand Platform, which accounted for 20.6% of our total revenue in the year ended December 31, 2022, is primarily derived from the wholesale distribution of brands in the New Guards portfolio to carefully selected third-party distributors. We may be unable to maintain or increase sales of New Guards’ brands’ merchandise through these distribution channels for several reasons, including the following:
In addition, decisions we make with regard to our distribution strategy may impact our ability to retain or gain new distributors. For example, we intend to continue to reduce wholesale distribution of brands in the New Guards portfolio and restrict the geographic distribution by other online retailers to the extent permitted by applicable regulation, as we move to favor our own direct-to-consumer channels, which could impact our relationship with existing or future distributors.
If New Guards is unable to maintain or increase sales through its customary wholesale distribution channels, it could have a material adverse effect on our business, results of operations, financial condition and prospects.
Risks Relating to our Retail Stores
The operation of retail stores subjects us to numerous risks, some of which are beyond our control.
As of December 31, 2022, Browns operated one retail store, Stadium Goods operated two retail stores, Violet Grey operated one retail store and New Guards operated thirteen Off-White stores as well as three Ambush stores, three Palm Angels stores and four Off-White outlets. In addition, New Guards has over fifty franchised retail stores and one seasonal store across its various brands, and anticipates opening additional mono-brand stores in the short-to-medium term.
The operating costs of our retail stores could increase, or stores or facilities may be impacted by changes in the real estate market, demographic trends, site competition, dependence on third-party performance or the overall economic environment. In addition, if there is a resurgence of the COVID-19 pandemic and related government orders we may be required to, or determine it is necessary to, temporarily close our Browns, Stadium Goods, Violet Grey or New Guards' brands’ retail stores, as we did at certain points in 2020.
56
The success of New Guards’ business is dependent on its ability to develop and execute its growth strategies, which include the successful development, opening, franchising and operation of new retail stores for brands in the New Guards portfolio. Successful execution of this strategy, and the success of the retail store operations across our businesses more generally, depends upon a number of factors, including our ability (and in certain cases the ability of the New Guards’ franchisees) to identify suitable sites for new stores, negotiate and execute leases on acceptable terms, construct, furnish and supply a store in a timely and cost effective manner, accurately assess the demographic or retail environment at a given location, hire and train qualified personnel, obtain necessary permits and zoning approvals, integrate new store distribution networks and build consumer awareness and loyalty. Construction, development or refurbishment costs may exceed original estimates due to increases in the cost of materials, labor or other items, and we may experience permitting or construction delays, which may further increase project costs and delay projected sales. These risks may be exacerbated to the extent we engage third-party developers or contractors in connection with such projects or are subject to approvals from regulatory bodies to complete the projects. As each new store represents a significant investment of capital, time and other resources, delays or failures in opening new stores, or achieving lower than expected sales in new stores, could materially and adversely affect our growth and results of operations.
Furthermore, New Guards’, Stadium Goods’, Violet Grey’s and Browns’ respective growth strategies may involve expansion into additional geographic markets in the future. Additional geographic markets may have different competitive conditions, consumer trends and discretionary spending patterns than the markets in which New Guards, Stadium Goods, Violet Grey and Browns currently operate retail stores, which may cause their operations in these markets to be less successful than operations in existing markets.
Leasing real estate exposes us to possible liabilities and losses.
Our Browns, Stadium Goods, Violet Grey and New Guards businesses lease retail properties including for existing and under-development retail and consignment spaces. In connection with these properties, we are subject to all of the risks associated with leasing real estate. In particular, the value of the assets could decrease, operating costs could increase, or a store may not be opened as planned due to changes in the real estate market, demographic trends, site competition, dependence on third-party performance, the overall economic environment or may be closed again as a result of the COVID-19 pandemic. Additionally, we are subject to potential liability for environmental conditions, exit costs associated with the disposal of a store and commitments to pay base rent for the entire lease term or operate a store for the duration of an operating covenant.
In addition, we lease office space in eleven countries and territories, and at considerable cost, which we may be unable to fully utilize, as a result of the COVID-19 pandemic, flexible work policies or our cost rationalization initiatives. If we are unable to negotiate changes to the lease agreements on commercially acceptable terms, if at all, we will remain responsible for the lease obligations and incur costs with little benefit to us.
New Guards’ franchise business is subject to certain risks not directly within our control that could impair the value of our brands. New Guards enters into franchise agreements with unaffiliated franchisees to operate various brand stores in Asia, the Middle East, Australia, Canada, Italy and Greece. Under these agreements, third parties operate, or will operate, stores that sell apparel and related products under various brand names. New Guards may enter into similar agreements in other countries or with regard to other brands in its portfolio in the future. The effect of these arrangements on New Guards’ business and results of operations is uncertain and will depend on various factors, including the demand for these products in new markets internationally and New Guards’ ability to successfully identify appropriate third parties to act as franchisees, distributors, or in a similar capacity. In addition, certain aspects of these arrangements are not directly within New Guards’ control, such as franchisee financial stability and the ability of these third parties to meet their projections regarding store locations, store openings, and sales. Other risks that may affect these third parties include general economic conditions in specific countries or markets, foreign exchange rates, changes in diplomatic and trade relationships, restrictions on the transfer of funds, and political instability. Moreover, while the agreements we have entered into and plan to enter into in the future provide us with certain termination rights, the value of the brands in the New Guards portfolio could be impaired to the extent that these third parties do not operate their stores in a manner consistent with New Guards’ requirements regarding its brand identity and consumer experience standards. Failure to protect the value of New Guards’ brands, or any other harmful acts or omissions by a franchisee, could have an adverse effect on our results of operations and our reputation.
57
Risks Relating to Ownership of our Class A Ordinary Shares
Our Chief Executive Officer, José Neves, has considerable influence over important corporate matters due to his ownership of us. Our dual-class voting structure will limit your ability to influence corporate matters and could discourage others from pursuing any change of control transactions that holders of our Class A ordinary shares may view as beneficial.
Our Chief Executive Officer, Mr. Neves, has considerable influence over important corporate matters due to his ownership of us. Our ordinary shares are divided into Class A ordinary shares and Class B ordinary shares. Holders of Class A ordinary shares are entitled to one vote per share in respect of matters requiring the votes of shareholders, while holders of Class B ordinary shares are entitled to twenty votes per share, subject to certain exceptions. Each Class B ordinary share is convertible into one Class A ordinary share at any time by the holder thereof, while Class A ordinary shares are not convertible into Class B ordinary shares under any circumstances. Upon any transfer of Class B ordinary shares by a holder thereof to any person or other entity, other than an affiliate of Mr. Neves, such Class B ordinary shares will be automatically and immediately converted into the equal number of Class A ordinary shares. Due to the disparate voting powers associated with our two classes of ordinary shares, Mr. Neves holds approximately 71.1% of the aggregate voting power of our Company. As a result, Mr. Neves has considerable influence over matters such as electing or removing directors, approving any amendments to our Articles and approving material mergers, acquisitions or other business combination transactions. In addition, under our Articles, our Board of Directors will not be able to form a quorum without Mr. Neves for so long as Mr. Neves remains a Director. This concentrated control will limit your ability to influence corporate matters and could also discourage others from pursuing any potential merger, takeover or other change of control transactions, which could have the effect of depriving the holders of our Class A ordinary shares of the opportunity to sell their shares at a premium over the prevailing market price.
Moreover, in the event that Mr. Neves no longer controls a majority of our voting power, whether as a result of the disposition of some or all of his ordinary shares, the conversion of his Class B ordinary shares into Class A ordinary shares, or otherwise, his loss of influence over corporate matters could result in changes in the Company’s management, corporate culture, and/or operations, and our business and the trading price of our Class A ordinary shares may be adversely affected. Furthermore, if Mr. Neves were to lose voting control of the Company, this could have an adverse impact on our relationships with our strategic partners and could result in our inability to execute on our various business initiatives with Richemont and YNAP. This loss of control could also present an opportunity for a shareholder or group of shareholders to acquire ownership of our ordinary shares in an amount that results in their ability to exert influence or control over our management and affairs, and such shareholder’s interests may differ from or conflict with yours.
As a public company, we are required to report, among other things, control deficiencies that constitute a “material weakness” or changes in internal controls that, or that are reasonably likely to, materially affect internal control over financial reporting. A “material weakness” is a deficiency, or a combination of deficiencies, in internal control over financial reporting, such that there is a reasonable possibility that a material misstatement of our annual or interim Consolidated financial statements will not be prevented or detected on a timely basis.
In the course of preparing our financial statements for fiscal 2021 and 2022, we identified material weaknesses in the design and operation of our internal control over financial reporting. A material weakness is a deficiency, or combination of deficiencies, in internal control over financial reporting, such that there is a reasonable possibility that a material misstatement of the annual or interim financial statements will not be prevented or detected on a timely basis. Our management has determined that we had one material weakness as at December 31, 2022, relating to the operation of internal control over financial reporting at the New Guards business. To address this material weakness, we have made changes to our procedures and controls as further described under Item 15. “Controls and Procedures.” We will not be able to fully remediate this material weakness until these steps have been completed and have been operating effectively for a sufficient period of time.
If we are unable to remediate our material weakness, our remediation efforts will take longer to remedy, as we identify new material weaknesses or we are otherwise unable to implement and maintain effective internal
58
control over financial reporting and effective disclosure controls and procedures and satisfy other requirements as a public company, including the requirements of Section 404 of the Sarbanes-Oxley Act, we may be unable to accurately report our financial results, or report them within the timeframes required by the SEC.
As we continue to evaluate and work to improve our internal control over financial reporting, our management may determine whether to take additional measures, or modify the remediation plan described above or identify additional control deficiencies or material weaknesses. Because of the inherent limitations in all control systems, no evaluation of controls can provide absolute assurance that all control issues, if any, have been detected. These inherent limitations include the realities that judgments in decision-making can be faulty, and that breakdowns can occur because of a simple error or mistake. Due to these inherent limitations in control systems, misstatements due to error or fraud may occur and not be detected. We cannot assure you that our remediation plan will be sufficient to prevent future material weaknesses from occurring. There is no assurance that we will not identify additional material weaknesses or deficiencies in our internal control over financial reporting in the future.
As our senior management is unable to conclude that we have effective internal control over financial reporting or to certify the effectiveness of such controls, and as our independent registered public accounting firm cannot render an unqualified opinion on our internal control over financial reporting and, to the extent that additional material weaknesses or deficiencies in our internal controls are identified, we could be subject to sanctions or investigations by the New York Stock Exchange (“NYSE”), the SEC or other regulatory authorities, investors may lose confidence in the accuracy and completeness of our financial reports, we may face restricted access to the capital markets and our share price may be adversely affected.
We qualify as a foreign private issuer and, as a result, we are not subject to U.S. proxy rules and are subject to Exchange Act reporting obligations that, to some extent, are more lenient and less frequent than those of a U.S. domestic public company.
We report under the Securities Exchange Act of 1934, as amended (“Exchange Act”) as a non-U.S. company with foreign private issuer status. Because we qualify as a foreign private issuer under the Exchange Act and although we are subject to Cayman laws and regulations with regard to such matters and intend to furnish quarterly financial information to the SEC, we are exempt from certain provisions of the Exchange Act that are applicable to U.S. domestic public companies, including, among others: (1) the sections of the Exchange Act regulating the solicitation of proxies, consents or authorizations in respect of a security registered under the Exchange Act, (2) the sections of the Exchange Act requiring insiders to file public reports of their share ownership and trading activities and liability for insiders who profit from trades made in a short period of time, (3) the rules under the Exchange Act requiring the filing with the SEC of Quarterly Reports on Form 10-Q containing unaudited financial and other specified information, although we intend to provide selected quarterly information on Form 6-K, and (4) the rules under the Exchange Act requiring filing with the SEC of Current Reports on Form 8-K information upon the occurrence of specified events. In addition, foreign private issuers are required to file their annual report on Form 20-F within four months after the end of each fiscal year, while U.S. domestic issuers that are accelerated filers are required to file their Annual Report on Form 10-K within seventy-five days after the end of each fiscal year and U.S. domestic issuers that are large accelerated filers are required to file their Annual Report on Form 10-K within sixty days after the end of each fiscal year. As a result of all of the above, you may not have the same protections afforded to shareholders of a company that is not a foreign private issuer.
59
We may lose our foreign private issuer status in the future, which could result in significant additional costs and expenses.
As discussed above, we are a foreign private issuer, and therefore, we are not required to comply with all of the periodic disclosure and current reporting requirements of the Exchange Act that are applicable to U.S. domestic public companies. The determination of foreign private issuer status is made annually on the last business day of an issuer’s most recently completed second fiscal quarter, and, accordingly, the next determination will be made with respect to us on June 30, 2023. In the future, we would lose our foreign private issuer status if (1) more than 50% of our outstanding voting securities are owned by U.S. residents and (2) a majority of our Directors or executive officers are U.S. citizens or residents, or we fail to meet additional requirements necessary to avoid loss of foreign private issuer status. If we lose our foreign private issuer status, we would be required to file with the SEC periodic reports and registration statements on U.S. domestic issuer forms, which are more detailed and extensive than the forms available to a foreign private issuer. We would also have to mandatorily comply with U.S. federal proxy requirements, and our officers, Directors and principal shareholders would become subject to the short‑swing profit disclosure and recovery provisions of Section 16 of the Exchange Act. In addition, we would lose our ability to rely upon exemptions from certain corporate governance requirements under the NYSE listing rules. As a U.S. listed public company that is not a foreign private issuer, we would incur significant additional legal, accounting, reporting and other expenses that we will not incur as a foreign private issuer. These expenses would relate to, among other things, the obligation to present our financial information in accordance with U.S. generally accepted accounting principles (“GAAP”) in the future.
As we are a foreign private issuer and intend to follow certain home country corporate governance practices, our shareholders may not have the same protections afforded to shareholders of companies that are subject to all NYSE corporate governance requirements.
As a foreign private issuer, we have the option to follow certain home country corporate governance practices rather than those of the NYSE, provided that we disclose the requirements we are not following and describe the home country practices we are following, and we intend to rely on this “foreign private issuer exemption” with regard to certain matters. Specifically, the NYSE rules require, in certain circumstances, shareholder approval for equity compensation plans, material revisions to those plans and equity issuances above specified amounts and/or to specified persons, which is not required under Cayman Islands law. We intend to follow home country law in determining whether shareholder approval is required. We currently voluntarily follow the remaining governance practices applicable to a U.S. non-controlled domestic issuer and do not avail ourselves of the exemptions afforded to foreign private issuers or controlled companies under the NYSE rules. We may in the future, however, decide to use other foreign private issuer exemptions with respect to some or all of the other NYSE listing requirements. As a result, our shareholders do not have the same protections afforded to shareholders of companies that are subject to all NYSE corporate governance standards and shareholder approval requirements. Refer to Item 16G. “Corporate Governance.”
Our shareholders may face difficulties in protecting their interests because we are a Cayman Islands exempted company.
Our corporate affairs are governed by our Articles, the Companies Act and the common law of the Cayman Islands. The rights of shareholders to take legal action against our Directors and us, actions by minority shareholders and the fiduciary responsibilities of our Directors to us under Cayman Islands law are to a large extent governed by the common law of the Cayman Islands. The common law of the Cayman Islands is derived in part from judicial precedent in the Cayman Islands as well as from English common law, which has persuasive, but not binding, authority on a court in the Cayman Islands. The rights of our shareholders and the fiduciary responsibilities of our Directors under the laws of the Cayman Islands are not as clearly defined as under statutes or judicial precedent in existence in jurisdictions in the United States. Therefore, you may have more difficulty protecting your interests than would shareholders of a corporation incorporated in a jurisdiction in the United States, due to the comparatively less well-developed Cayman Islands law in this area.
60
A merger or consolidation may proceed under Cayman Islands law in one of two ways: by a court‑sanctioned scheme of arrangement or by a statutory merger. If a merger is effected by way of a Cayman Islands scheme of arrangement, shareholders who voted at the scheme meeting(s) (convened by way of an order of the Grand Court of the Cayman Islands (the “Grand Court”)) may attend and raise objections at the sanction hearing in respect of the scheme of arrangement, where the Grand Court will consider, amongst other things, whether to sanction the scheme of arrangement including whether the terms and conditions of the proposed scheme of arrangement are fair to all affected shareholders. While shareholders may file an objection to the scheme of arrangement with the Grand Court against the sanctioning of the scheme of arrangement at the sanction hearing, no appraisal or dissenting rights are available to such holders relating to the value of their shares or payment for them in connection with the scheme of arrangement.
If a merger or consolidation is effected under the statutory merger regime, shareholders who dissent from the merger or consolidation will have limited appraisal rights, namely the right to receive payment of the “fair value” of their shares as determined by the Grand Court in accordance with Section 238 of the Companies Act if the merger or consolidation is completed, but only if they deliver, before the vote to authorize and approve the merger or consolidation is taken at a general meeting, a written objection to the merger and subsequently comply with all procedures and requirements of Section 238 of the Companies Act for the exercise of dissenters’ rights. The fair value of each of their shares as determined by the Grand Court under the Companies Act could be more than, the same as, or less than, the per share merger consideration they would receive pursuant to the merger agreement if they do not exercise dissenters’ rights with respect to their shares. Appraisal rights are ordinarily available where the consideration offered under the merger is payable in cash or, in some instances, the unlisted securities of a third party. Shareholders of Cayman Islands exempted companies, such as ours, have no general rights under Cayman Islands law to inspect corporate records and accounts or to obtain copies of lists of shareholders. Our Directors have discretion under our Articles to determine whether or not, and under what conditions, our corporate records may be inspected by our shareholders, but are not obliged to make them available to our shareholders. This may make it more difficult for you to obtain information needed to establish any facts necessary for a shareholder motion or to solicit proxies from other shareholders in connection with a proxy contest.
It should be noted that the Cayman Islands law has no legislation specifically dedicated to the rights of investors in securities, and thus no statutorily defined private causes of action to investors in securities such as those found under the Securities Act of 1933, as amended (the “Securities Act”) or the Exchange Act in the United States. Subject to limited exceptions, under Cayman Islands law, a shareholder may not bring a derivative action against the Board of Directors. Class actions are not recognized in the Cayman Islands, but groups of shareholders with identical interests may bring representative proceedings, which are similar.
As a result of all of the above, our public shareholders may have more difficulty in protecting their interests in the face of actions taken by our management or members of our Board than they would as public shareholders of a company incorporated in the United States.
Anti‑takeover provisions in our organizational documents may discourage or prevent a change of control, even if an acquisition would be beneficial to our shareholders, which could depress the price of our Class A ordinary shares and prevent attempts by our shareholders to replace or remove our current management.
Our Articles contain provisions that may discourage unsolicited takeover proposals that shareholders may consider to be in their best interests. Our Board may be removed by an ordinary resolution of our shareholders. In addition, Board vacancies may be filled by an affirmative vote of the remaining Board members. In the event of a conversion of the Class B ordinary shares, the Board of Directors would be divided into three classes designated as Class I, Class II and Class III, respectively, as determined by the Chairman of our Board at the relevant time, and Directors will generally be elected to serve staggered three-year terms. These provisions may make it more difficult to remove management.
Our Board has the ability to designate the terms of and issue preferred shares without shareholder approval.
61
Our Articles contain a prohibition on business combinations with any “interested” shareholder for a period of three years after such person becomes an interested shareholder unless: (1) there is advance approval of our Board of the proposed business combination prior to the shareholder becoming an interested shareholder; (2) the interested shareholder owns at least 85% of our voting shares at the time the business combination commences; or (3) the combination is approved by shareholders holding at least two‑thirds of the votes attaching to the ordinary shares that are not held by the interested shareholder.
Taken together, these provisions may discourage transactions that otherwise could involve payment of a premium over prevailing market prices for our Class A ordinary shares.
There may be difficulties in enforcing foreign judgments against us, our Directors or our management.
Certain of our Directors and management and certain of the other parties named in this Annual Report reside outside of the United States. Most of our assets and such persons’ assets are located outside the United States. As a result, it may be difficult or impossible for investors to effect service of process upon us within the United States or other jurisdictions, including judgments predicated upon the civil liability provisions of the U.S. federal securities laws.
In particular, investors should be aware that there is uncertainty as to whether the courts of the Cayman Islands or any other applicable jurisdictions would recognize and enforce judgments of U.S. courts obtained against us or our Directors or our management predicated upon the civil liability provisions of the securities laws of the United States, or any state in the United States or entertain original actions brought in the Cayman Islands or any other applicable jurisdictions against us, our Directors or our management that are predicated upon the securities laws of the United States or any state in the United States.
Farfetch Limited is a holding company with no operations of its own and, as such, it depends on its subsidiaries for cash to fund its operations and expenses, including future dividend payments, if any.
As a holding company, our principal source of cash flow is distributions or payments from our operating subsidiaries. Therefore, our ability to fund and conduct our business, service our debt and pay dividends, if any, in the future will depend on the ability of our subsidiaries and intermediate holding companies to make upstream cash distributions or payments to us, which may be impacted, for example, by their ability to generate sufficient cash flow or limitations on the ability to repatriate funds whether as a result of currency liquidity restrictions, monetary or exchange controls or otherwise. Our operating subsidiaries and intermediate holding companies are separate legal entities, and although they are directly or indirectly wholly owned and controlled by us, they have no obligation to make any funds available to us, whether in the form of loans, dividends or otherwise. To the extent the ability of any of our subsidiaries to distribute dividends or other payments to us is limited in any way, our ability to fund and conduct our business, service our debt and pay dividends, if any, could be harmed.
62
We may be treated as a passive foreign investment company ("PFIC"), which could result in material adverse tax consequences for investors in our Class A ordinary shares subject to U.S. federal income tax.
We would be classified as a PFIC for any taxable year if, after the application of certain look‑through rules, either: (1) 75% or more of our gross income for such year is “passive income” as defined in the relevant provisions of the Internal Revenue Code of 1986, as amended (the “Code”), or (2) 50% or more of the value of our assets, determined on the basis of a quarterly average, during such year is attributable to assets that produce or are held for the production of passive income. Based on our market capitalization, and composition of our income, assets and operations, we do not believe we were a PFIC for the taxable year that ended on December 31, 2022, and we do not expect to be treated as a PFIC in the foreseeable future. However, our status as a PFIC in any taxable year requires a factual determination that depends on, among other things, the composition of our income, assets, and activities in each year, and can only be made annually after the close of each taxable year. Therefore, there can be no assurance that we will not be classified as a PFIC for the current taxable year or for any future taxable year. If we are treated as a PFIC for any taxable year during which a U.S. Holder (as defined in Item 10. “Additional Information – E. Taxation – U.S. Federal Income Tax Considerations”) holds our Class A ordinary shares, the U.S. Holder may be subject to material adverse tax consequences upon a sale, exchange, or other disposition of our Class A ordinary shares, or upon the receipt of distributions in respect of our Class A ordinary shares. We cannot provide any assurances that we will assist investors in determining whether we or any of our non‑U.S. subsidiaries are a PFIC for any taxable year. U.S. Holders should consult their tax advisors about the potential application of the PFIC rules to their investment in our Class A ordinary shares. For further discussion, refer to Item 10. “Additional Information – E. Taxation – U.S. Federal Income Tax Considerations.”
If a U.S. person is treated as owning at least 10% of our shares, such holder may be subject to adverse U.S. federal income tax consequences.
Depending upon the aggregate value and voting power of our shares that U.S. persons are treated as owning (directly, indirectly, or constructively), we could be treated as a controlled foreign corporation (“CFC”). Additionally, because our Group includes one or more U.S. subsidiaries, certain of our non‑U.S. subsidiaries will be treated as CFCs, regardless of whether or not we are treated as a CFC. If a U.S. person is treated as owning (directly, indirectly or constructively) at least 10% of the value or voting power of our shares, such person may be treated as a “U.S. shareholder” with respect to each CFC in our Group (if any), which may subject such person to adverse U.S. federal income tax consequences. Specifically, a U.S. shareholder of a CFC may be required to annually report and include in its U.S. taxable income its pro rata share of each CFC’s “Subpart F income,” “global intangible low‑taxed income” and investments in U.S. property, whether or not we make any distributions of profits or income of a CFC to such U.S. shareholder. If you are treated as a U.S. shareholder of a CFC, failure to comply with these reporting obligations may subject you to significant monetary penalties and may prevent the statute of limitations with respect to your U.S. federal income tax return for the year for which reporting was due from starting. Additionally, a U.S. shareholder that is an individual would generally be denied certain tax deductions or indirect foreign tax credits that may otherwise be allowable to a U.S. shareholder that is a U.S. corporation. We cannot provide any assurances that we will assist investors in determining whether we or any of our non‑U.S. subsidiaries are treated as CFCs or whether any investor is treated as a U.S. shareholder with respect to any of such CFCs, nor do we expect to furnish to any U.S. shareholders information that may be necessary to comply with the aforementioned reporting and tax paying obligations. The IRS has provided limited guidance on situations in which investors may rely on publicly available alternative information to comply with their reporting and tax paying obligations with respect to foreign-controlled CFCs. U.S. investors should consult their advisors regarding the potential application of these rules to their investment in the Class A ordinary shares.
63
Risks Related to our Indebtedness
Our indebtedness could adversely affect our financial health and competitive position.
We have access to a $400 million senior secured term loan facility (the “Term Loan”), which was issued with a 6.50% original issue discount, pursuant to a credit agreement, dated as of October 20, 2022, among Farfetch US Holdings, Inc. (the “Borrower”), a Delaware corporation and wholly owned indirect subsidiary of Farfetch Limited, Farfetch Holdings plc, JPMorgan Chase Bank, N.A., as administrative agent, Wilmington Trust, National Association, as collateral agent, J.P. Morgan Securities LLC, as the lead arranger and sole physical bookrunner, and certain banks and financial institutions party thereto as lenders and issuing banks (the “Credit Agreement”). The Term Loan matures on October 20, 2027 (the “Maturity Date”) (unless payable earlier in accordance with the terms of the Credit Agreement). Repayment of the Term Loan is due in quarterly installments of 0.25%, payable on the last Business Day (as defined in the Credit Agreement) of each fiscal quarter and on the Maturity Date, beginning with the fiscal quarter ending on March 31, 2023. The Term Loan bears interest at a rate equal to, at the Borrower’s option, either the Base Rate (as defined in the Credit Agreement) plus 5.25% per annum or Term SOFR (as defined in the Credit Agreement) plus 6.25% per annum, which exposes the Group to interest rate risk. A Term Loan borrowed in Base Rate is subject to a 0% floor and a Term Loan borrowed in Term SOFR is subject to a 0.50% floor. The Borrower has initially elected to make quarterly interest payments at a rate equal to the Term SOFR plus 6.25% per annum.
The Credit Agreement contains customary negative covenants, including, but not limited to, restrictions on certain entities in the Group's ability to incur additional debt, make investments, make distributions, dispose of assets, repay junior debt and enter into certain types of related party transactions. These restrictions may restrict our current and future operations, particularly our ability to respond to certain changes in our business or industry, or take future actions. Pursuant to the Credit Agreement and related security agreements, we granted the lenders a security interest in a substantial portion of our assets. The obligations under the Credit Agreement are also guaranteed by Farfetch Holdings plc and certain of its subsidiaries.
Our ability to meet our obligations under the Credit Agreement can be impacted by events beyond our control and we may be unable to do so. The Credit Agreement provides that our breach or failure to satisfy certain covenants constitutes an event of default. Upon the occurrence of an event of default, our lenders could elect to declare all amounts outstanding under any Loan Document (as defined in the Credit Agreement) to be immediately due and payable. In addition, our lenders would have the right to enforce their security over the assets we provided as collateral pursuant to the Credit Agreement and the security agreements. If the debt under the Credit Agreement was to be accelerated, we may not have sufficient cash on hand or be able to sell sufficient collateral to repay it, which would have an immediate adverse effect on our business and operating results.
If our operating performance declines, we may in the future need to obtain waivers from the required lenders under the Credit Agreement to avoid being in default. If we breach our covenants under the Credit Agreement or we are in default thereunder and seek a waiver, we may not be able to obtain a waiver from the required lenders. If this occurs, we would be in default under the Credit Agreement; the lenders could exercise their rights, as described above; and we could be forced into bankruptcy or liquidation.
Our indebtedness increases the risk that we may be unable to generate cash sufficient to pay amounts due in respect of our indebtedness. It could also have effects on our business. For example, it could:
64
Any agreements evidencing or governing other future indebtedness may contain certain negative covenants that could limit our ability to engage in certain activities that are in our best interest.
To service our indebtedness, we require cash, and our ability to generate cash is subject to many factors beyond our control.
Our ability to make payments on and to refinance our existing and any future indebtedness, including our (i) 3.75% convertible senior notes due 2027 (the “April 2020 Notes”) and 0.00% convertible senior notes due 2030 (the “November 2020 Notes”) (collectively, the “Notes”) and (ii) the Credit Agreement, and to fund planned capital expenditures will depend on our ability to generate cash in the future. This is subject, to a certain extent, to general economic, financial, competitive, regulatory and other factors that are beyond our control.
We cannot assure you that our business will generate sufficient cash flow from operations or that future borrowings will be available to us in an amount sufficient to enable us to pay our indebtedness or to fund our other liquidity needs. We may need to refinance all or a portion of our indebtedness on or before maturity, and we cannot assure you that we will be able to refinance any of our indebtedness on commercially reasonable terms or at all. Failure to refinance our indebtedness on terms we believe to be acceptable could have a material adverse effect on our business, financial condition, results of operations and cash flow.
In addition, our Credit Agreement contains, and any future indebtedness that we may incur may contain, negative covenants that limit our ability to, at certain times, operate our business, raise capital or make payments on our other indebtedness. If we fail to comply with these covenants or to make payments on our indebtedness when due, then we would be in default under the documents constituting that indebtedness which could, in turn, result in that and our other indebtedness becoming immediately payable in full.
General Risk Factors
Our operating results and Class A ordinary share price may be volatile, and the market price of our Class A ordinary shares may drop below the price you pay.
Our quarterly operating results are likely to fluctuate in the future in response to numerous factors, many of which are beyond our control, including each of the factors set forth above. In addition, securities markets worldwide have experienced, and are likely to continue to experience, significant price and volume fluctuations. This market volatility, as well as general economic, market or geopolitical conditions, could subject the market price of our Class A ordinary shares to wide price fluctuations regardless of our operating performance.
These and other factors, many of which are beyond our control, may cause our operating results and the market price and demand for our Class A ordinary shares to fluctuate substantially. In addition, if any of the securities or industry analysts who cover us or may cover us in the future change their recommendation regarding our Class A ordinary shares adversely, or provide more favorable recommendations about our competitors, the price of our Class A ordinary shares would likely decline. Fluctuations in our quarterly operating results could limit or prevent investors from readily selling their Class A ordinary shares and may otherwise negatively affect the market price and liquidity of our Class A ordinary shares. In addition, in the past, when the market price of a stock has been volatile, holders of that stock have sometimes instituted securities class action litigation against the company that issued the shares. If any of our shareholders bring a lawsuit against us, we could incur substantial costs defending the lawsuit. Such a lawsuit could also divert the time and attention of our management from our business, which could significantly harm our profitability and reputation.
65
We have incurred and expect to continue to incur costs as a result of operating as a public company, and our management will be required to continue to devote substantial time to new compliance initiatives and corporate governance practices.
As a public company we incur significant legal, accounting, insurance and other expenses. The Sarbanes-Oxley Act, the Dodd-Frank Wall Street Reform and Consumer Protection Act, the listing requirements of the NYSE and other applicable rules and regulations impose various requirements on public companies, including establishment and maintenance of effective disclosure and financial controls and corporate governance practices. Our management and other personnel continue to devote a substantial amount of time to ensure that we comply with all of the applicable reporting requirements, rules and regulations, and such requirements, rules and regulations increase our legal and financial compliance costs and make certain activities more time consuming and costly. In addition, these laws, rules and regulations also make it difficult and more expensive for us to obtain certain types of insurance, including director and officer liability insurance, and we may be required to accept reduced policy limits and coverage or incur substantially higher costs to obtain the same or similar coverage. These factors could also make it more difficult for us to attract and retain qualified persons to serve on our Board of Directors, the committees of our Board of Directors or as our executive officers. Furthermore, if we are unable to satisfy our obligations as a public company, we could be subject to the delisting of our common stock, fines, sanctions and other regulatory action and potentially civil litigation.
Furthermore, as a publicly traded company, we are required to comply with the SEC’s rules implementing Sections 302 and 404 of the Sarbanes-Oxley Act, which require management to certify financial and other information in our annual reports and provide an annual management report on the effectiveness of control over financial reporting. We are required to disclose material changes in internal control over financial reporting on an annual basis and we are also required to complete an annual assessment of our internal control over financial reporting pursuant to Section 404, and management’s report related to such assessment must be included in our annual reports on Form 20-F. Additionally, we are required to include an attestation report on internal control over financial reporting issued by our independent registered public accounting firm.
Our efforts to achieve and maintain compliance with Section 404, and our efforts needed to remediate any identified material weaknesses has been and will continue to be both costly and challenging. In this regard, we have had to continue to dedicate internal resources and adopt a detailed work plan to assess and document the adequacy of our internal control over financial reporting, continue steps to improve control processes as appropriate, validate through testing that controls are functioning as documented and implement a continuous reporting and improvement process for internal control over financial reporting. If we are unable to remediate any existing material weakness and/or identify additional material weaknesses, it could result in an adverse reaction in the financial markets due to a loss of confidence in the reliability of our Consolidated financial statements. As a result, the market price of our Class A ordinary shares could be negatively affected and we could become subject to investigations by the NYSE, the SEC or other regulatory authorities, which could require additional financial and management resources.
We may not pay dividends on our Class A ordinary shares in the future and, consequently, your ability to achieve a return on your investment will depend on the appreciation in the price of our Class A ordinary shares.
We may not pay any cash dividends on our Class A ordinary shares in the future. Any decision to declare and pay dividends in the future will be made at the discretion of our Board of Directors and will depend on, among other things, our results of operations, financial condition, cash requirements, contractual restrictions and other factors that our Board of Directors may deem relevant. In addition, our existing indebtedness includes limitations impacting our ability to pay dividends, which also may be limited by covenants of any future outstanding indebtedness we or our subsidiaries incur. Therefore, any return on investment in our Class A ordinary shares is solely dependent upon the appreciation of the price of our Class A ordinary shares on the open market, which may not occur. Refer to Item 8. “Financial Information – A. Consolidated Statements and Other Financial Information – Dividend Policy.”
66
Item 4. Information on the Company
A. History and Development of the Company
Corporate Information
We were incorporated as Farfetch Limited in the Cayman Islands on May 15, 2018 as an exempted company with limited liability under the Companies Act. Exempted companies are Cayman Islands companies whose operations are conducted mainly outside of the Cayman Islands. Our legal name is Farfetch Limited, and our commercial name is Farfetch. Our principal executive offices are located at The Bower, 211 Old Street, London EC1V 9NR, United Kingdom. Our telephone number at this address is +44 (0) 20 7549 5400. Prior to our incorporation in the Cayman Islands, we conducted our business through Farfetch.com Limited, incorporated with limited liability under the laws of the Isle of Man with registered number 000657V, and its subsidiaries.
For a discussion of our principal capital expenditures, refer to Item 5. “Operating and Financial Review and Prospects — B. Liquidity and Capital Resources,” Item 4. “Information on the Company — D. Property, Plants and Equipment” and Note 12, Property, plant and equipment, within our Consolidated financial statements included elsewhere in this Annual Report.
Our agent for service of process in the United States is CT Corporation, whose address is 28 Liberty Street, New York, NY 10005, United States.
The SEC maintains an internet site that contains reports, proxy and information statements, and other information regarding issuers, such as us, that file electronically with the SEC at www.sec.gov. Our website address is www.farfetchinvestors.com. We use this investors section of our website as a means of disclosing material, non-public information. Accordingly, investors should monitor this section of our website, in addition to following our press releases, SEC filings and public conference calls and webcasts. Investors may also receive email alerts and other information about us by enrolling their email address under “Investor Resources” of our investors page.
We have included our website address in this Annual Report solely for informational purposes, and the information contained on our website is not incorporated by reference in this Annual Report.
Senior Secured Term Loan Facility
On October 20, 2022, the Term Loan was made available to us. The Term Loan was issued with a 6.50% original issue discount, pursuant to the Credit Agreement. The Term Loan matures on October 20, 2027, the Maturity Date (unless payable earlier in accordance with the terms of the Credit Agreement). Repayment of the Term Loan is due in quarterly installments of 0.25%, payable on the last Business Day (as defined in the Credit Agreement) of each fiscal quarter and on the Maturity Date, beginning with the fiscal quarter ending on March 31, 2023. The Term Loan bears interest at a rate equal to, at the Borrower’s option, either the Base Rate (as defined in the Credit Agreement) plus 5.25% per annum or Term SOFR (as defined in the Credit Agreement) plus 6.25% per annum, which exposes the Group to interest rate risk. A Term Loan borrowed in Base Rate is subject to a 0% floor and a Term Loan borrowed in Term SOFR is subject to a 0.50% floor. The Borrower has initially elected to make quarterly interest payments at a rate equal to the Term SOFR plus 6.25% per annum.
The Credit Agreement contains customary negative covenants, including, but not limited to, restrictions on certain entities in the Group's ability to incur additional debt, make investments, make distributions, dispose of assets, repay junior debt and enter into certain types of related party transactions. These restrictions may restrict our current and future operations, particularly our ability to respond to certain changes in our business or industry, or take future actions. Pursuant to the Credit Agreement and related security agreements, we granted the lenders a security interest in a substantial portion of our assets. The obligations under the Credit Agreement are also guaranteed by Farfetch Holdings plc and certain of its subsidiaries.
67
Partnership with Richemont and Alabbar
On August 24, 2022, we and Alabbar agreed, pursuant to a share purchase agreement, to acquire 47.5% and 3.2%, respectively, of YNAP from Richemont. The 47.5% to be acquired by Farfetch will be acquired in return for Farfetch Class A ordinary shares. As part of the partnership (i) most of Richemont’s Maisons will join the Farfetch Marketplace, and (ii) YNAP and most of Richemont’s Maisons will re-platform using FPS. As at February 2023, a Marketplace framework agreement with Richemont and certain FPS contracts that cover this transition have been entered into for Richemont and YNAP. Statements of work have been agreed for Cartier and all of the YNAP businesses. In addition (i) statements of work for the re-platforming services and (ii) Marketplace partner contracts for the Marketplace services will be entered into on a phased basis for the remaining in-scope Richemont Maisons. Completion of the transaction is conditional upon, among other factors, receipt of regulatory approvals. Following completion of this initial acquisition (the “Closing”), and subject to YNAP achieving certain financial performance metrics, Richemont shall, following the third anniversary of the Closing and prior to the fifth anniversary thereof, have the right to require Farfetch to acquire the remaining 52.5% of YNAP (including Alabbar’s 3.2%) in consideration for which Farfetch will issue Class A ordinary shares to Richemont and Alabbar. In addition, following the Closing and prior to the fifth anniversary thereof, Farfetch may exercise a call option in respect of the YNAP shares it does not own, in consideration for which Farfetch shall issue Class A ordinary shares to Richemont and Alabbar.
B. Business Overview
Our Mission
Farfetch exists for the love of fashion. We believe in empowering individuality. Our mission is to be the leading global platform for the luxury industry, connecting creators, curators and consumers.
Overview
Founded in 2007 by José Neves and launched in 2008, Farfetch is the leading global platform for the luxury fashion industry. Our businesses include:
68
We organize and report our business in three reportable operating segments: Digital Platform, Brand Platform and In-Store.
The Digital Platform segment activities include the Farfetch Marketplace, FPS, BrownsFashion.com, StadiumGoods.com, VioletGrey.com, Luxclusif, Farfetch Future Retail, and any other online sales channel operated by the Group, including the respective websites of the brands in the New Guards portfolio. It derives its revenues mostly from transactions between sellers and consumers conducted on our technology platforms, and primarily operates a revenue share model where we retain commissions and related income from these transactions. The Digital Platform segment also includes direct-to-consumer sales of owned product, referred to as “first-party sales,” which include “first-party original” product developed by brands in the New Guards portfolio, through the Farfetch Marketplace and New Guards brands’ owned e-commerce websites, for which we retain the full amount of the sale.
The Brand Platform segment is comprised of production and wholesale distribution of brands owned and licensed by New Guards, and includes franchised store operations.
The In-Store segment covers the activities of stores we operate, including Browns, Stadium Goods, Violet Grey and certain brands in the New Guards portfolio. Revenues are derived from sales made in these physical stores.
We are the leading global platform for the luxury fashion industry, and we take an integrated approach to operating our businesses across the digital, physical and virtual realms to serve our mission to connect the world's creators, curators and consumers. These businesses are reflected in our three reporting segments as follows:
Our reporting segments, Digital Platform, Brand Platform and In-Store, are organized and reported by channel, based on where consumers shop. In the future, we aim to transition our reporting framework to our business pillars: Marketplaces, Platform Solutions and Brand Platform; which we outlined at our Capital Markets Day on December 1, 2022. While this represents a potential future progression of our reporting segments, we do not expect to report, internally or externally, actual results for these pillars in the near term. Our business pillars are as follows:
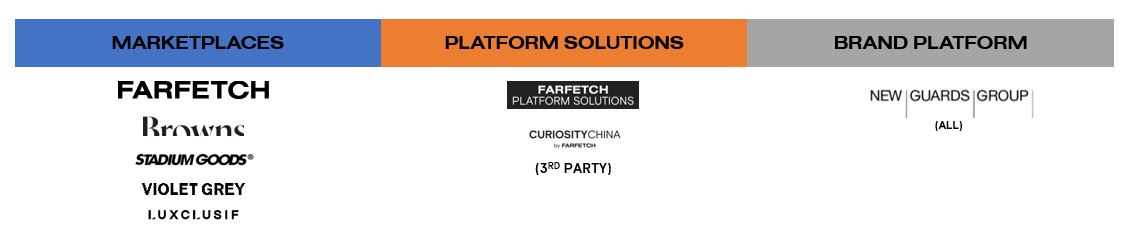
Our business has grown significantly, as evidenced by the following:
69
For geographical and segmental revenue, refer to Note 5, Segmental and geographical information within our Consolidated financial statements included elsewhere in this Annual Report.
Seasonality
Our business is seasonal in nature. Historically, our business has realized a disproportionate share of our revenue and earnings for the year in the fourth quarter, attributable primarily to the impact of the year-end holiday season and seasonal promotions. Our Brand Platform segment operates to a wholesale cycle which has traditionally seen higher levels of sales in the first and third quarters of the year as compared to the second and fourth quarters of the year. However in 2022, we saw a lower level of sales in the first quarter as a result of delays in order shipments arising from the migration to a new warehouse partner. We then saw a partial recovery from these delayed shipments and higher level of sales than expected in the second quarter of the year.
In 2022, our revenues in the first, second, third and fourth quarters represented 22%, 25%, 26% and 27%, respectively, of our total revenues for the year. This is compared to 22%, 23%, 26% and 29%, respectively, in 2021.
As a result of these factors, our financial results for any single quarter or for periods of less than one year are not necessarily indicative of the results that may be achieved for a full fiscal year.
Our Platform Approach and Luxury New Retail Vision
Our platform, initially built for the Farfetch Marketplace, based on deep knowledge of the luxury industry, technology and operations infrastructure, and is also utilized by Browns, Stadium Goods, Violet Grey and the New Guards portfolio of brands, as well as our FPS partners. We drive interactions between our business pillars to leverage our platform including optimizing our global logistics and operations capabilities, including our Fulfilment by Farfetch initiative, which offers fulfilment solutions for luxury partners. A key benefit of our platform approach is that new features developed for our direct-to-consumer channels, including the Farfetch Marketplace and existing FPS partners can be made available to existing and future platform clients. Further, the way in which we partner with other innovative companies is designed to further strengthening our platform ecosystem.
We believe the future of luxury fashion retail will be defined by the reinvention of the customer experience, through online and offline integrations. Originally, we coined the term "Augmented Retail" to describe our vision for bringing the online and offline luxury worlds together. We unveiled this vision of Augmented Retail, taking the magic of the physical store experience and bringing it together with the advantages of the online and digital experience, underpinned by use of data, in 2017. LNR represents the evolution of this vision. The LNR vision, announced in November 2020, is our overarching strategy aiming to redefine the future of luxury retail for Farfetch and the luxury industry at-large.
The LNR vision seeks to enable the digitization of the luxury industry and how customers will shop for luxury in the future by leveraging Farfetch’s platform elements including our Marketplaces, FPS, New Guards and our stores. This strategy is activated via FPS, which offers a full scale of enterprise solutions including our connected retail suite of products and other emerging technologies powered by the Farfetch platform.
With LNR, our aim is to position ourselves as a digital enabler of brand and retail partners to enable us to not only serve the online luxury market, but to also address the digital strategies of our enterprise partners’ physical, digital and virtual channels, and therefore, the wider global luxury industry.
70
In August 2022 we announced a landmark transaction with Richemont which, subject to the receipt of certain regulatory approvals, is intended to allow Richemont Maisons and YNAP to advance their technology capabilities by adopting FPS and joining the Farfetch Marketplace. The first stage of this transaction will also include a minority investment into YNAP and its transformation into a hybrid retail marketplace model through the adoption of our technology.
Our Marketplaces
The Farfetch Marketplace
The Farfetch Marketplace is the largest digital luxury marketplace in the world, connecting consumers from over 190 countries and territories and luxury sellers in over 50 countries.
For consumers, we provide access to, as of December 31, 2022, over 3,400 different brands from over 1,400 luxury sellers, including over 850 of the world’s leading luxury retailers and over 600 brands. Our marketplace model allows us to aggregate supply from a large number of globally distributed sources, offering consumers both breadth and depth of luxury merchandise while incurring minimal inventory risk and without capital intensive retail operations. Consumers are able to engage with us across our website and iOS and Android apps, including our apps developed specifically for our consumers in China, as well as on our Tmall Luxury Pavilion storefront.
For luxury sellers we facilitate the connection to nearly four million Active Consumers, as of December 31, 2022. The Farfetch Marketplace is a global multi-brand luxury platform that offers brands direct-to-consumer distribution via an e-concession model. The proposition for brands includes full control over merchandising and pricing together with competitive margins vis-à-vis wholesale distribution. As our new and existing brand partners have taken actions to tilt their distribution strategy away from wholesale towards direct-to-consumer, we have continued to evolve our value proposition and increased our focus on increasing the attractiveness of Farfetch’s multi-brand e-concession model. We expect this to result in more brands, boutiques and department stores and new types of retailers joining the Farfetch Marketplace, as well as expanding the breadth and depth of supply from our existing luxury seller base.
In our Marketplace model, more brands, boutiques and department stores on the Farfetch Marketplace increases the choices available to consumers. Additionally, New Guards enables us to offer the broadest selection of, and exclusive access to, merchandise from the New Guards portfolio of brands further enriching our offering to consumers.
We have also expanded into other luxury categories and offerings on our direct-to-consumer channels, which creates additional opportunities for luxury sellers on the Farfetch Marketplace. In April 2022, we launched beauty in a manner that enables beauty brands to launch their products on Farfetch via our e-concession model and benefit from the higher margins that entails, with additional first-party supply from indie brands through Browns and Violet Grey, which we acquired in January 2022. We have also expanded our pre-owned offering category as we amplify our Positively Farfetch sustainability proposition. In our aim to become the leading global platform for pre-owned luxury, we acquired Luxclusif in December 2021, a business-to-business service provider with a successful turnkey solution enabling the acquisition, authentication and sale of second-hand luxury goods, which we believe will allow us to significantly accelerate our pre-owned capabilities through the development of key technology and service features.
In the year ended December 31, 2022, GMV of more recently launched categories such as kidswear, and watches and jewelry outperformed the overall Farfetch Marketplace. As part of the announced transaction with Richemont, we plan to add most of the Richemont Maisons to the Farfetch Marketplace. We expect this to increase our watches and jewelry supply.
The Farfetch Marketplace also provides integrated, end-to-end services for luxury sellers, including content creation and end-to-end logistics and a localized luxury experience and customer care for Farfetch Marketplace consumers. In-house content creation allows us to achieve a luxury product presentation with a
71
consistent look and feel, with short lead times and low costs. Our content creation process includes styling, photographing, photo-editing, product description and content management. In addition, we continue to develop and adopt technology solutions to enhance the quality of our content at a lower cost. For example, in December 2021, we acquired Allure, which utilizes artificial intelligence to create high-quality on-model images via 360 degree renderings, allowing retailers and brands to scale quality imagery with automation.
We have invested significant resources in developing our fully integrated logistics network. We have developed smart supply chain capabilities which make our supply chain scalable, capital efficient and highly agile, including back-end integrations into multiple supply points and algorithms that are built around deep analytics. These capabilities are developed at a platform level and therefore can also be utilized by our FPS clients. In addition, through our Fulfilment by Farfetch proposition we offer logistics solutions tailored to the luxury industry with our third-party logistics warehouses.
The Farfetch Marketplace is built on our modular end-to-end digital platform, which is built on an API-enabled proprietary technology stack. Our digital platform is built for multi-tenancy and multi-client use. This allows the same infrastructure and services architecture to support our Marketplaces, FPS and Farfetch Future Retail, as well as the tools we offer to our luxury sellers.
Browns provides a good example of our omni-channel approach in practice. Ownership of Browns has enabled us to understand the luxury fashion ecosystem through the lens of a retailer. Browns leverages our digital platform applications by selling through the Farfetch Marketplace, the Browns website and iOS app, as well as operating a store with connected retail technology, all of which are powered and operated by FPS.
Consumer Acquisition and Retention
We are focused on leveraging what we believe is the sustained adoption of online channels by luxury consumers, to retain our consumers and attract new ones. This includes ensuring that through the breadth and depth of our supply, which is enhanced by supply from New Guards, Browns, Stadium Goods and Violet Grey, as well as our comprehensive approach to data and analytics, we are able to offer our consumers the merchandise that they want. By leveraging our data resources and refining our approach to data analytics, we have been able to optimize and improve our marketing approach and create a relevant, personalized consumer experience, which we believe will bring new consumers to our direct-to-consumer channels while also motivating existing consumers to visit our apps and sites more often, transact more efficiently and increase their order values.
We focus on building continuous dialogue with our consumers given their levels of engagement with luxury shopping. We do this by creating inspiring content and developing personalized and tailored product recommendations, which we distribute via email, push notifications, social media, display advertising and directly on the Farfetch Marketplace.
In 2022, we continued to build membership and awareness in our ACCESS loyalty program which provides consumers with benefits and rewards based on their annual spend on the Farfetch Marketplace. Based on the success of ACCESS, we have continued to invest in the program, including enhanced features to increase awareness of program benefits.
Performance and Brand Marketing
We are focused on continuing to build brand recognition and a demand generation engine that connects our consumers with our luxury sellers. Through driving high consumer demand, we aim to create a better proposition for our luxury sellers.
We principally acquire consumers through online channels, including paid and organic search, metasearch, affiliate partnerships, display advertising and social channels. We can also use promotions to drive consumer acquisition (or retention) and sales on the Farfetch Marketplace. In addition, we have invested significant resources to establish systems that optimize paid search, and our team is highly skilled at developing programs and algorithms to maximize our returns.
72
In 2022 we continued to invest in driving Farfetch app installations on new consumer mobile smartphones – via both the Apple iOS app store and the Android app store, which we believe drives efficient growth of our luxury consumer base. Consumers who purchase through the app have historically had a higher lifetime value, on average, than consumers who purchase through other mediums.
We see a significant opportunity ahead in building awareness of, and engagement with, our brand. During the year ended December 31, 2022 we continued to build on these efforts through brand campaigns mainly focused in the United States. The focus of these activations was the value of choice we offer to consumers and were launched across various channels, both online and offline, with the intention to build brand awareness, preference, and an emotional connection with our brand. We intend to continue implementing a “full-funnel” approach to marketing in 2023 for the purpose of continuing to build our brand and develop consumer intent, leveraging innovation, content, and social media, as well as our partnerships with luxury brands.
Farfetch Private Client
Farfetch Private Client caters to our most valuable and highest spending consumers. Our Private Client strategy is to become the only destination these valuable consumers want to shop for all of their luxury fashion needs.
We offer high-end services such as a dedicated personal shopper, priority access to a customer service line and Fashion Concierge services. Fashion Concierge allows Farfetch Private Client consumers to access exclusive merchandise and to source merchandise from sellers not on the Farfetch Marketplace via our stylists. We also provide Farfetch Private Client consumers with exclusive benefits, such as access to special items, events and experiences, early access to coveted items and sales, free shipping and a Farfetch Private Client app.
Farfetch Media Solutions and Partnerships
Farfetch Media Solutions and Partnerships operates at the intersection of luxury e-commerce and advertising. Through this service Farfetch provides luxury sellers advertising products and creative solutions to drive awareness and engagement while in an elevated, luxury e-commerce environment. These services enable partners to maintain competitive edge while luxury shoppers are in the digital aisle with the mindset to buy and create meaningful connections through unique owned and operated partnerships that align with brand values and drive transactions. In the year ended December 31, 2022, Farfetch Media Solutions served campaigns for a diverse mix of nearly 100 partners.
Farfetch China
Over the next eight years, Chinese consumers are expected to become the largest luxury market and represent more than $240 billion in annual luxury sales by 2030. This represents a significant opportunity, and we have invested in people and technology, centrally and locally, to support our continued growth. With mainland China as the second largest market by GMV for the Farfetch Marketplace for the year ended December 31, 2022, we are one of a limited number of Western e-commerce companies which has demonstrated success in penetrating China. We have achieved this in part by investing in localization, including a localized website and apps, our storefront on Tmall Luxury Pavilion, WeChat stores and WeChat Mini programs, presence in local social media channels, such as Red Book and Douyin, private client stylists, customer service teams, locally preferred payment methods, and a cross-border customs clearance solution.
Our Farfetch China joint venture, in partnership with Alibaba and Richemont, includes Farfetch Marketplace operations in the China region, as well as our operations on Tmall Luxury Pavilion. This channel is intended to drive awareness of the Farfetch brand in China and expand the reach of our global luxury platform to Alibaba’s Tmall Luxury Pavilion consumers, offering our luxury brand partners an opportunity to also elevate their brand awareness with Chinese consumers, while also significantly expanding their addressable market of luxury consumers through their participation on the Farfetch Marketplace.
Stadium Goods Marketplace
73
Stadium Goods is a premium sneaker and streetwear marketplace specializing in new, never worn, merchandise for resale. Farfetch acquired Stadium Goods in January 2019 and it continues to operate as a standalone brand, increasingly leveraging Farfetch’s digital platform and expertise in technology, logistics, data, brand, marketing and geographic reach.
Stadium Goods operates an online marketplace (stadiumgoods.com) and iOS and Android apps. Stadium Goods’ stock is also available through third-party platforms, including Amazon.com, and is fully integrated into and available on the Farfetch Marketplace in all geographies. Stadium Goods has brick-and-mortar locations for retail in the heart of New York City’s Soho neighborhood and in the Gold Coast neighborhood of Chicago.
Our Platform Solutions
Farfetch Platform Solutions
FPS is our enterprise offering to the luxury fashion industry, offering a modular suite of white-label technology solutions and services for luxury sellers. FPS delivers global, multi-channel e-commerce solutions that enable our brand and retailer partners to drive growth and innovation, seamlessly interact with their customers and build stronger and closer relationships, while allowing them to focus on the creative aspects of their businesses. In addition, FPS works as our implementation arm for products developed under Farfetch Future Retail, commercializing and bringing these solutions to luxury industry partners.
These solutions are built on our digital platform, providing the same capabilities and reach as the Farfetch Marketplace, and benefitting from innovations and product developments on our digital platform. FPS partners can choose from specific features or bundles of products and services or a full end-to-end e-commerce experience, tailored to their customer and business requirements. For our FPS enterprise offering, we have built a team of channel experts who work with dedicated analysts, data scientists and engineers to manage the full end-to-end e-commerce strategy for luxury fashion brands and retailers.
Because our FPS offering is built on our fully API-enabled digital platform, partnering with FPS allows for a flexible front-end suite of products, consisting of global websites, apps, WeChat stores and an in-store app, which helps in-store staff manage global inventory to enhance in-store engagements. Our back-end infrastructure allows our brand and retailer partners to synchronize their websites in real time with in-store and warehouse inventory, both from mono-brand stores and other suppliers in their distribution networks, and to facilitate customer-friendly services such as in-store pick-up and returns.
In China, our CuriosityChina business focuses on amplifying premium and luxury brands across digital platforms in China. CuriosityChina augments the FPS proposition to include plug-and-play access for luxury brands to expand rapidly in China via web, app, WeChat Store and WeChat Mini programs.
FPS currently works with a number of brands and retailers across the luxury fashion industry. In 2020, FPS launched a new global e-commerce platform for Harrods. Our strategic partnership allows Harrods to use and benefit from all of FPS’s core components, including e-commerce management, operations, international logistics and technical support.
In 2022, we further modularized our FPS offering, being able to offer standalone modules such as global payments and logistics and e-concessions as a service to luxury industry partners. We believe this will allow us to further broaden our enterprise clients base, as we continue to enable the digitization of the luxury industry. This is illustrated by our recent partnership with Neiman Marcus Group ("NMG"), which we announced in April 2022 and is expected to launch in the second half of 2023, where Bergdorf Goodman, an NMG brand, will adopt the full suite of FPS services, while Neiman Marcus will adopt select FPS modules.
In the year ended December 31 2022, FPS launched e-commerce sites for Jacob Cohen and Sacai, and we announced the expected launch of e-commerce sites for Ferragamo and Bergdorf Goodman in first quarter and second half 2023, respectively. Additionally, in August 2022, we announced a landmark deal with Richemont,
74
aspects of which are subject to regulatory approval, whereby Richemont Maisons and YNAP agreed to adopt FPS to power their digital and omni-channel strategy.
In addition, the e-commerce channels for Browns, Violet Grey, Stadium Goods and a number of brands in the New Guards portfolio are also powered and operated by FPS.
Farfetch Future Retail
We believe that consumers are channel agnostic, and will increasingly seek ultra-personalized experiences across physical, online and digital channels, expecting those worlds to be seamlessly connected. Our LNR vision reflects the retail experience of the future by giving retailers visibility to their customers’ preferences, both in-store and online, enabling them to enhance the services they can offer. Consistent with this vision, we have developed a range of services and technologies to progress innovation in the luxury industry. For example, during 2022 we continued to launch new products and services through our open innovation strategy, which uses a partnership model to deliver new commercially successful experiences. In 2022 these included the launch of a 3D bag viewer and virtual-try on for beauty products. With the aim of advancing and scaling our virtual try-on capabilities on the platform, we also acquired Wanna, a virtual try-on company, in April 2022.
Farfetch Future Retail is our retail innovation arm focused on creating the new customer experience of the future. We seek to conceptualize and initiate new technology solutions that support the transformation of the entire luxury industry. For example, Farfetch Future Retail has conceptualized technologies designed to merge online, offline and virtual experiences. In July 2022, we announced Dream Assembly Base Camp in partnership with Outlier ventures, with the aim of providing a cohort of the most promising Web3 startups in the luxury fashion and lifestyle sectors with a curated program of mentorship, networking, and support in order to help drive the future of Web3 luxury commerce.
Browns also serves as an incubation space for the Farfetch Future Retail, testing and showcasing innovative solutions to meet the needs of the multichannel, luxury consumer. Browns opened a new flagship store in London’s Mayfair in 2021. The new store, which replaced Browns’ previous store in Mayfair, will continue to pioneer innovations developed under our LNR initiative, including the connected retail solutions (previously referred to as "Farfetch Store of the Future").
Our Brand Platform - New Guards Group
In August 2019, we acquired New Guards. New Guards operates as a platform that uses a single common infrastructure model to incubate and grow emerging talent into highly sought-after brands. New Guards designs, manufactures and distributes luxury brands including Off-White, Palm Angels and Ambush, among others, through a shared services model. New Guards sources all of its merchandise from independent contract manufacturers, and, as a result, New Guards is inventory light relative to the scale of its business.
New Guards has the capability to bring creative visionaries’ and designers’ ideas to fruition by offering infrastructure, including strategy development, design studio, sourcing and production, industrial capabilities, global distribution channels, merchandising, licensing, marketing and growth planning. We seek to help existing and future portfolio brands maximize their potential by opening new e-concessions on the Farfetch Marketplace and powering portfolio brands’ own e-commerce sites and other digital channels through FPS.
New Guards gives us the opportunity to develop and introduce new and highly attractive brands to the Farfetch Marketplace, along with exclusive capsule collections and collaborations to further enrich the customer experience and boost consumer engagement with our brand, which we believe will continue to make Farfetch an even more attractive channel not just for consumers, but also for our brand partners.
We aim to continue our initiative to increase the mix of higher-margin direct-to-consumer revenue across New Guards’ brand portfolio by enabling multi-brand sales via the Farfetch Marketplace, and mono-brand sales via their direct-to-consumer channels hosted by FPS, in addition to leveraging our Fulfilment by Farfetch facilities. We have seen these efforts significantly increase the mix of online direct-to-consumer revenue from 2% of New Guards’
75
revenue for the twelve months prior to the acquisition in August 2019, to 15% for the year ended December 31, 2022. We see an opportunity to continue to increase this mix by further leveraging New Guards’ merchandising approach in combination with the digital capabilities of our platform. As part of this strategy, we also launched Tmall Luxury Pavilion stores for Off-White, Palm Angels and Ambush in January 2022.
In addition, we plan to continue to grow our Brand Platform segment, which remains profitable and helps expand the relevance of the New Guards brands, while continuing to implement a thoughtful approach to distribution, including proactively reducing or eliminating product allocations to non-strategic online wholesale partners in our effort to prioritize long-term brand value over short-term revenues. In February 2022, New Guards further expanded its portfolio of brands with the signing of agreements with Authentic Brands Group to become the exclusive partner to curate, create and bring to market Reebok’s luxury collaborations, as well as a core operating partner for the brand across Europe and distributor of premium Reebok products in the United States, Canada, Europe and certain other key markets. New Guards is expected to launch this partnership in second quarter 2023.
Other Services
Fulfilment by Farfetch
We offer a luxury logistics solution with our third-party logistics warehouses in Italy, the Netherlands, the United Kingdom, the United States and China, which handle our first-party stock and which luxury sellers can utilize to handle their fulfilment and allocate stock closer to consumers, including a new warehouse in Hong Kong which became operational in November 2022. We use proprietary data and predictive insights to optimize the storage location of supply at a regional level and within warehouses. This allows us to service consumers more efficiently, limits the distance our product travels in carrier networks, provides advantages for consumers, and removes friction from the growth of supply for our luxury sellers.
Our Stores
While the proportion of luxury sales through e-commerce continues to increase, physical retail remains a crucial part of the sales journey for the luxury customer. According to Bain, in 2021 and 2022 approximately 78% and 79%, respectively of personal luxury goods were bought in physical stores. Bain estimates that approximately 66% of personal luxury goods will be bought in physical stores in 2030.
We are leveraging the benefits of the physical realm, including brand-building and marketing opportunities afforded by a well-placed and well-presented store, with a number of our businesses, including Browns, Stadium Goods, Violet Grey, Off-White and Palm Angels, which operate physical retail locations.
Environmental, Social and Governance ("ESG") – Positively Farfetch
Farfetch aims to be the premier platform for good in luxury fashion, while empowering everyone we work with to think, act and choose positively. This mission drives our Environmental, Social and Governance initiatives. “Positively Farfetch” is the strategy that seeks to embed this mission within and across our business through initiatives focused on environmental impact reduction, diversity and inclusion, positive social impact and governance.
Our Positively Farfetch strategy includes four key pillars - Positively Cleaner, Positively Conscious, Positively Circular, and Positively Inclusive. Each pillar aligns with core business drivers and also has clear and ambitious goals for 2030 (the “2030 Goals”).
Positively Cleaner is focused on environmental impact reduction with a significant emphasis on driving supply chain efficiency to achieve this, which is expected to also help us become a more cost-efficient business. Farfetch continues to work together with other global businesses to help find solutions to tackle climate change, increase biodiversity and improve ocean health for example as a signatory of The Fashion Pact. In the year ended December 31, 2022, we continued to implement various packaging and logistics efficiency initiatives and increased
76
our use of sustainably sourced and fully recyclable packaging globally. Under our 2030 Goals, we are seeking to reduce our footprint in line with our newly SBTi-approved near-term science-based targets while also taking action beyond our direct value chain, financing carbon mitigation initiatives to offset our yearly emissions and supporting projects that sit outside our footprint to achieve additional carbon mitigation equivalent to at least 10% our yearly carbon footprint. We expect to achieve reductions in our scope 1 and 2 emissions by adopting 100% renewable energy across our operations, which we estimate would reduce emissions by 42% by 2030 against a 2020 baseline. We also aim to drive efficiency across our scope 3 emissions and work with our key suppliers to ensure that 70% of them have science-based targets by 2026.
Positively Conscious is focused on helping our consumers make positive choices that consider the impact on the environment, society and animal welfare, and helping us become the global destination for more conscious fashion consumers. We have outlined clear independently backed criteria for qualifying a product as “Conscious” on the Farfetch Marketplace and Browns. These are set out publicly on our websites and updated to reflect developments in the industry. As part of this we continue to work with Good on You, an independent agency that rates the sustainability of fashion brands, and as of December 2022, nearly 1,300 brands on our marketplace had been rated by Good on You. Both through the Farfetch Marketplace and Browns, we continue to market our Conscious collections for women, men and kids and place “Conscious” labels and information on merchandise. New Guards brands are working to increase the proportion of products produced with materials that meet our Group “Conscious” criteria. Under the 2030 Goals, we are seeking to sell 100% "Conscious" products (i.e. products that are independently recognized as being better for people, the planet or animals and from services that enable positive change). To help our brand partners expand their "Conscious” product offerings, in July 2022 we launched “Good Measures”, a tool developed with Good On You which enables brands to better understand their impacts on the environment, society and animal welfare, and identify priority areas of improvement. “Good Measures” also lists service providers that can support brands with their sustainability goals, and is expected to be made available to the industry in 2023.
Positively Circular is focused on introducing and growing services that help extend the life of clothes, which will also contribute to our overall business growth and consumer retention. For example, we launched Farfetch Second Life, a service that enables consumers to trade-in their pre-owned designer bags for Farfetch Marketplace credit in 2019, and it has since expanded to serve customers in over 30 countries across the United States, Europe and the Middle East. In addition, our Farfetch Refresh service (previously called Farfetch Donate), powered by our partners Thrift+ in the United Kingdom and ThredUp in the United States, allows consumers to clear their closets of used clothes that are then sold, with the option in the UK for some or all proceeds from the sale (after partner fees) to be donated to the consumer’s chosen charity. The consumer receives any remaining portion as Farfetch Marketplace credit. Browns offers a service with Thrift+ that operates in the same way, and both Browns and the Farfetch Marketplace partner with luxury aftercare provider, The Restory, to offer repairs and other refurbishment services. Browns has also partnered in a number of “Circular” collaborations with designers that specialize in upcycling and pre-owned products. Further, alongside our in-season selection on the Farfetch Marketplace, we have an extensive pre-owned selection. In December 2021, we acquired Luxclusif, a business-to-business service provider with a turnkey solution enabling the acquisition, authentication, and sale of second-hand luxury goods, which we believe will allow us to significantly accelerate our pre-owned capabilities through the development of key technology and service features. Under our 2030 Goals, we are seeking to sell more circular products and uses of circular services than those made in traditional, linear ways. We determine whether items we sell or service are circular if they are (i) pre-owned, (ii) made from recycled material, or (iii) re-sold, donated, repaired, or otherwise have their utilization increased through our services. In 2022 we continued to increase the number of circular items sold or serviced on the Farfetch Marketplace, Browns and Stadium Goods.
Positively Inclusive is focused on anticipating and meeting the needs of our diverse community of creators, curators and consumers that we work with, represent and champion. A critical part of delivering this is having a diverse and inclusive workplace. We have been driving a number of initiatives to help all Farfetchers to thrive in a culture of conscious inclusion. This includes supporting our global People Communities (Employee Resource Groups), such as our Black Employee Network, Disability Network, FarOut (LGBTQIA+ Network), FarSan (South Asian Network), Jewish Network, FarLAN (Latinx Network), Farfetch East Network, Parents Network, Representation on the Agenda at Browns and Women in Business Network. We have partnered with diversity and inclusion organizations and charities that work to increase diverse representation in the fashion and technology industry, as well as uplifting and empowering underrepresented communities. In September 2022, we launched the
77
APUS development program, a global initiative focused on elevating high potential members of our Black Employee Network by supporting those members in the development of their leadership skills and capabilities. Some elements of this program are facilitated by the Black British Business Awards organization. Under our 2030 Goals, we aim to be a leader in diversity and inclusion in our workplace and in the global fashion community.
Underpinning our Positively Farfetch pillars is our approach to governance and engagement. Our governance structure led by our Board of Directors, and supported by its four standing committees, plays an essential part in embedding our Positively Farfetch strategy into our plans as we aim to deliver long-term value. Business ethics, data privacy, cyber security, risk management, and tax strategy are core elements of our governance framework. Our policies and management systems set the base for addressing compliance and integrity, as we seek to address risks across our organization.
The Environmental, Social and Governance Committee of our Board of Directors (the “ESG Committee”) was formed in 2020. The ESG Committee oversees the development of our Positively Farfetch strategy, ensuring it takes into account the evolving priorities of our stakeholders. The ESG Committee’s mission is to assist the Board in leading on issues pertaining to the environment, health and safety, staff development and engagement, ethics, philanthropy, diversity, equity and inclusion and social justice, and governance amongst other public policy matters relevant to Farfetch. Our leadership team sets out the strategy and ambitious commitments, and implements best practices within the Group.
Through effective stakeholder engagement on ESG we seek to influence positive change in our value chains and across the fashion industry through clear standard setting and strategic partnerships. We expect our suppliers to meet our ethical standards, which are outlined in our Vendor Code of Conduct and Ethical Sourcing Policy. Our engagement strategy includes our public reporting on ESG matters. In 2022 we published our second ESG report, and continued the process of further developing our ESG program by introducing third-party assurance of certain metrics tracking our progress in relation to our 2030 Goals.
Security and Data Protection
We are committed to the security and privacy of our consumers’ experience with Farfetch. We undertake administrative and technical measures to protect our systems and the consumer data that those systems process and store. We have developed policies and procedures designed to manage data security risks. We monitor our servers and systems, and we employ technical security measures such as data encryption. We also use third parties to assist in our security practices and prevent and detect fraud. Our consumers’ privacy expectations are very important to us and we have a team tasked with responding to our consumer inquiries regarding their personal data.
As our business is global in nature and we operate in different countries, we are subject to complex and evolving laws and regulations around the world. In order to allow us to navigate through such a diverse landscape, which includes, but is not limited to, the GDPR, CCPA, the PRC Cybersecurity Law, Data Security Law and PIPL, we have adopted the GDPR as a baseline framework to govern our internal security and data protection practices and procedures, while complying with specific local law requirements, such as data localization, where applicable.
Competition
We operate in an intensely competitive industry in which consumers have the option to purchase both online and offline, mono-brand and multi-brand. We compete with other marketplaces and platforms, technology enablement companies and luxury sellers, including larger competitors with extensive resources that are seeking to establish an online presence in luxury fashion:
Business-to-Business - Technology enablement companies:
78
Business-to-Consumer - Luxury sellers:
In addition, the brands in the New Guards portfolio of brands face competition from many different luxury and streetwear brands.
Our Intellectual Property
Our intellectual property, including copyrights and trademarks, is an important component of our business. We have registered trademarks in various international jurisdictions for FARFETCH, BROWNS, STADIUM GOODS, VIOLET GREY, and the marks for the brands in the New Guards portfolio, among other brands. Our intellectual property portfolio includes numerous domain names for websites that we use in our business. We have several granted patents in the United Kingdom, Europe and the United States. We also have several pending patent applications in the United Kingdom, Europe and internationally, which, if granted, would cover aspects of our proprietary technology. The software code underlying our proprietary technology is also likely protected by copyright. When necessary, we license technology (including patented technology) from third parties.
New Guards owns, or is the exclusive licensee of, various intellectual property rights in the brands that form the New Guards brand portfolio. The existing license agreements, for those intellectual property rights that are licensed to New Guards, permit New Guards to, among other things, manufacture, distribute, advertise and sell merchandise of the relevant brand in exchange for the payment of royalties. These existing license agreements include exclusive, worldwide licenses granted to New Guards for the use of the Off-White, Palm Angels and Marcelo Burlon County of Milan trademarks. The license for the OFF-WHITE trademark expires in 2035 and includes a right for either party to opt out of the agreement effective as of January 1, 2026, subject to notice provisions.
As part of our arrangement with Alibaba, we have assigned certain PRC, Hong Kong, Taiwan and Macau-registered and unregistered intellectual property rights to Farfetch China, including the Farfetch trademarks, the Chinese transliterations of the Farfetch word mark, certain regional domain names and the stylized “F” logo. Farfetch China has granted to those members of the Group who are not part of the joint venture a license to continue to use such intellectual property rights in the relevant regions.
We control access to use and distribution of our intellectual property through license agreements, confidentiality procedures, non‑disclosure agreements with third parties and our employment and contractor agreements. We rely on contractual provisions with suppliers and luxury sellers to protect our proprietary technology, brands and creative assets. We use a third-party enforcement tool to monitor online copyright and trademark infringement across domains, social media and mobile applications, including for BROWNS, FARFETCH and STADIUM GOODS and the brands in the New Guards portfolio, as well as a trademark watch service, which notifies us of potentially conflicting trademark applications. We have also registered FARFETCH and BROWNSFASHIONSTORE with a global domain name watch service and various domain name protected lists to alert us to third-party domain name registrations that could potentially be infringing or cybersquatting.
79
Government Regulation
We use consumer data to perform the services available on our platform and conduct marketing activities, which may involve sharing consumer information with third parties, such as advertisers. Our activities involving the use of consumer data are subject to consumer protection, data protection and unfair and deceptive practices laws in jurisdictions in which we operate. In addition, as we accept credit card transactions, we must comply with the Payment Card Industry Data Security Standards. The United States, European Union and China, as well as other jurisdictions in which we operate, are increasingly regulating certain activities on the internet and e-commerce, including the use of information retrieved from or transmitted over the internet, and are increasingly focused on ensuring user privacy and information security, which will potentially limit behavioral targeting and online advertising; and are imposing new or additional rules regarding the taxation of internet products and services, the quality of products and services as well as the liability for third‑party activities. Moreover, the applicability to the internet of existing laws governing issues such as intellectual property ownership and infringement is uncertain and evolving.
In particular, we are subject to an evolving set of data privacy laws in the United States, European Union, United Kingdom, Brazil, China, the Middle East and other jurisdictions and regions where we operate. To this effect, GDPR provides for onerous requirements on companies that process personal data, including, for example, expanded disclosures about how personal information is used and increased rights for consumers to access, control the use of and delete their data and object to marketing and profiling. Certain breaches of GDPR may impose fines up to the greater of €20 million or 4% of global turnover on a Group basis. In addition, specific EU legislation regulating privacy online, including the use of cookies and similar technologies and online targeted advertising, is also under reform. We have seen regulatory scrutiny and fines increasing in this area, including with regard to advertising and the use of cookies in a manner that does not comply with the consent requirements of GDPR.
In the United States, the federal government and various state governments have adopted, or are considering adopting, laws, guidelines or rules for the collection, distribution, use and storage of information collected from our consumers or their devices. The, CCPA, for example, requires, among other things, new disclosures to California consumers, affords consumers new abilities to opt-out of certain disclosures of personal information and new rights of data access and deletions, and imposes significant fines and penalties for violations of privacy or data security provisions. The CPRA further expands the CCPA with additional data privacy compliance requirements for California consumers effective January 1, 2023, and establishes a regulatory agency dedicated to enforcing those requirements. Other U.S. states are considering enacting stricter data privacy laws, some modeled on the GDPR, some modeled on the CCPA, and others potentially imposing completely distinct requirements.
In Brazil, the Brazilian General Data Protection Law (Law No. 13,709/2018) (“LGPD”) became enforceable on August 1, 2021. LGPD increases the requirements on companies that process personal data in a manner similar to its European counterpart, the GDPR.
In China, the PIPL went into effect in November 2021. Although it aligns with several principles of the GDPR, including in relation to consent and data subject rights, the PIPL deviates substantially from the GDPR in several important areas, including on cross-border data transfers, which are subject to a security assessment organized by the CAC if certain prescribed thresholds are met, and legal requirements that differ from the GDPR.
As a result of Brexit, we are subject to different statutory regimes in Europe, including as applicable the UK GDPR and EU GDPR.
China
Our operation of the Farfetch.cn website and the Farfetch China app and mini program in the PRC is subject to a value-added telecommunication license, which was first obtained in December 2016 and last renewed in December 2022 for an additional three years. Our value-added telecommunication license is issued by the Shanghai Communications Administration, which has its approval power delegated from the Ministry of Industry and Information Technology. Farfetch does not operate in an industry that prohibits or restricts foreign investment under applicable Chinese laws and the equity interests in all our subsidiaries in the PRC are ultimately owned by Farfetch Limited without engaging in any variable interest entity (“VIE”) structure.
80
The SCNPC of the PRC promulgated the PIPL, which became effective in November 2021. On July 7, 2022, the CAC issued the Measures for the Security Assessment of Outbound Data Transfers ("Measures"), which became effective on September 1, 2022. The Measures require a data processor to apply for a security assessment of cross-border data transfer with the PRC government when certain thresholds are met. We believe we are subject to the required security assessment due to our processing of personal information of more than 1,000,000 individuals in the PRC. As of December 31, 2022, we have conducted the impact self-assessment associated with the security assessment for cross-border data transfers and made the necessary application with the Cyberspace Administration of Shanghai. Such assessment is under review and pending security assessment and approval by the CAC.
Pursuant to the PIPL and Measures, we have updated the relevant privacy policies and user interaction experiences on our China website, app and mini program, and completed the data security internal assessment and improvements to comply with the latest mandatory requirements on the collection, processing and sharing of personal information and business data.
We will continue to conduct compliance self-review, upgrade our security capabilities, and implement robust privacy protection mechanisms to reflect the Chinese regulatory authority’s guidance and the latest regulatory requirements under the applicable laws.
Many governmental authorities in the markets in which we operate are also considering alternative legislative and regulatory proposals that would increase the regulation of internet advertising. It is not possible to predict whether new taxes or regulations will be imposed on our business and whether or how we might be affected.
In many jurisdictions in which we operate, operational licenses are required. In certain jurisdictions, including China, filings in respect of such licenses must be made annually.
C. Organizational Structure
Refer to Note 32, Group Information, within our Consolidated financial statements included elsewhere in this Annual Report for a listing of our subsidiaries, including legal name, country of incorporation, and proportion of ownership interest.
D. Property, Plants and Equipment
Our Facilities
We have offices in Braga, Dubai, Hong Kong, Lisbon, London, Los Angeles, Milan, Moscow, New York, Gurugram, Porto, Paris, São Paulo, Shanghai, Beijing and Tokyo and production centers in Guimarães, Porto, Hong Kong and São Paulo. In addition, Browns leases a retail property in London, Stadium Goods leases retail properties in Chicago and New York, Violet Grey leases a retail property in Los Angeles and New Guards leases retail properties in Las Vegas, London (including its Bicester Outlet), Miami, New York (including its Woodbury Outlet), Paris, Milan, Tokyo, South Coast Plaza, Zurich, Rome, Serravalle and Ibiza.
Our London office is our corporate headquarters, housing central support functions, and is leased for a term of twelve years expiring in December 2027. The lease covers an aggregate of approximately 60,000 square feet, divided over six floors.
Our two Porto offices together house our largest employee population, including finance, customer and partner support, operations, technology, legal and people departments. The two offices cover an aggregate of approximately 235,000 square feet and are leased for periods of seven to eleven years, expiring in 2025.
81
On April 8, 2019, Farfetch Portugal – Unipessoal, Lda, one of our subsidiaries, acquired approximately 70,000 square meters of land in Matosinhos, Portugal from Medida Gabarito, Lda. We intend to use this land to build a campus for our employees based in Porto, to support our technology, operational and support functions. The total cost of the purchase was $18 million including taxes and fees. As of December 31, 2022, we capitalized approximately $6.9 million on the campus. Our efforts on this project are ongoing and we continue to make progress on the planning, project design and preparation of the construction plan, and continue to evaluate the most effective funding structure before proceeding with further significant expenditures.
Item 4A. Unresolved Staff Comments
None.
82
Item 5. Operating and Financial Review and Prospects
You should read the following discussion in conjunction with our Consolidated financial statements included elsewhere in this Annual Report. This discussion contains forward-looking statements and involves numerous risks and uncertainties, including, but not limited to, those described in Item 3. “Key Information — D. Risk Factors.” Actual results could differ materially from those contained in any forward-looking statements.
On May 15, 2018, Farfetch Limited was incorporated under the laws of the Cayman Islands to become the holding company of Farfetch.com Limited and its subsidiaries. When we refer to the “Consolidated Group” or “Group” we are referring to Farfetch Limited and its consolidated subsidiaries.
Business Overview
Our mission is to be the leading global platform for the luxury industry, connecting creators, curators and consumers. Refer to Item 4.B "Information on the Company - Business Overview” for additional information.
Our core business is focused on generating income from transactions between sellers and consumers or customers conducted on our technology platforms. These transactions generate GMV, which we collect and remit to sellers after deducting our commission, fulfilment and other related income, which is based on a revenue-share model. Through our New Guards business, a portion of our income is generated from business-to-business transactions with retailers. A smaller portion of our income is generated from sales made in physical stores that we operate. All these activities enable us to operate across the global luxury ecosystem.
Sources of Revenue
Our revenue is derived from four streams:
Refer to “Key Operating and Financial Metrics” below for a discussion of the key operating and financial metrics we use and “Operating Results by Segment” for a discussion of segmental performance and revenues by segment for the years ended December 31, 2022, 2021 and 2020.
83
For further information on our principal sources of revenue and how the different types of revenue are classified in our Consolidated statement of operations refer to Note 2.3(e), Summary of significant accounting policies - Revenue recognition, within our Consolidated financial statements included elsewhere in this Annual Report.
For further information on our revenues by geography, refer to Note 5, Segmental and geographical information, within our Consolidated financial statements included elsewhere in this Annual Report.
Business Highlights
In August 2022, we announced a transaction with Richemont which, subject to the receipt of certain regulatory approvals, will allow Richemont Maisons and YNAP to advance their LNR capabilities by adopting FPS and joining the Farfetch Marketplace. The first stage of this transaction also included a minority investment into YNAP and its transformation into a hybrid model through the adoption of our technology. Completion of the transaction is conditional upon, among other factors, receipt of regulatory approvals.
In February 2022, New Guards further expanded its portfolio of brands with the signing of agreements with Authentic Brands Group to become the exclusive partner to curate, create and bring to market Reebok’s luxury collaborations, as well as a core operating partner for the brand across Europe and distributor of premium Reebok products in the United States, Canada, Europe and certain other key markets.
On July 20, 2021, New Guards completed the acquisition of 60% of the equity interests of Palm Angels, the owner of the Palm Angels trademark. In addition, New Guards agreed to a put and call option with the remaining shareholders of Palm Angels, which would require New Guards to purchase the remaining 40% of outstanding equity interests of Palm Angels in 2026, to the extent either the put or call option was exercised. In conjunction with this transaction, New Guards also increased total ownership of Palm Angels’ operating company to 100% through the acquisition of the remaining 31% of the outstanding equity interests of Venice S.r.l.
Factors Affecting our Financial Condition and Results of Operations
Our financial condition and results of operations have been, and will continue to be, affected by a number of important factors, including the following:
Growth, Engagement and Retention of Our Consumer Base
Digital Platform
Digital Platform GMV and revenue from our Marketplaces primarily grow as a result of acquiring and retaining Active Consumers, increasing Third-Party Take Rate, increasing the AOV and increasing the volume of orders. During 2022, we continued to grow our customer base and as of December 31, 2022, we had 3,918,000 Active Consumers, up from 3,687,000 as of December 31, 2021. Third-Party Take Rate increased during 2022 to 32.1%, from 30.2% in 2021. AOV fell to $574 for the year ended December 31, 2022, from $612 for the year ended December 31, 2021.
GMV and revenue also generally grows when we acquire and retain new FPS partners, as we did in the year ended December 31, 2022, excluding the impact of foreign exchange rates. In 2023, we expect to continue investing in the acquisition of new FPS partners driven by our strategic partnerships such as with Bergdorf Goodman, an NMG brand, Ferragamo and YNAP.
We have invested and will continue to invest in our highest-value consumers by offering high-end services and exclusive benefits to Farfetch Private Client consumers. This resulted in a Private Client consumer retention rate of over 90% and an AOV of over $1,100 during 2022. In 2022, the top 1% of our consumers represented 27.6% of our Marketplace GMV. In 2023, we expect to further strengthen and expand on our Private Client business.
We have been able to grow Digital Platform GMV from both new and existing consumers since launching the Farfetch Marketplace in 2008. While we continue to acquire new consumers, the share of Digital Platform GMV
84
from existing consumers has also continued to increase over time, indicating that we have retained existing consumers.
In March 2022, as a result of the conflict between Russia and Ukraine, we suspended trade in Russia following the imposition of international sanctions. During the year ended December 31, 2022, Russia revenues on a demand basis decreased 83% compared to the year ended December 31, 2021. Sanctions on Russia and the wider conflict are expected to continue to significantly impact our operations in the wider CIS region.
At the onset of the COVID-19 pandemic in 2020, there was an acceleration in the shift of consumer demand to online, from which we partially benefited. However, the continued impacts of regional sanctions in China as a result of the COVID-19 global pandemic have impacted our operations in the country and have negatively impacted consumer sentiment toward cross-border e-commerce.
Brand Platform and New Guards
Brand Platform
Brand Platform Revenue growth occurs when there is an increase in popularity of the brands in the New Guards portfolio and an increase in retailers purchasing our products.
Seasonality of our Brand Platform Revenue is guided by timing of designer collections and shows. As described in Item 4. “ Information on the Company - B - Business Overview – Seasonality”, our business is seasonal in nature and our Brand Platform segment operates on a wholesale cycle.
New Guards
New Guards, the business behind our Brand Platform, operates as a platform that uses a single common infrastructure and model including strategy development, design studio, sourcing and production, industrial capabilities, global distribution channels, merchandising, licensing, marketing and growth planning for brands in its portfolio. The success of our Brand Platform segment and of New Guards' brands’ product on our direct-to-consumer channels is dependent on the popularity of the brands in the New Guards portfolio, and the incubation of new brands.
We have begun to take actions to reduce wholesale distribution of New Guards' brands and restrict the geographic distribution by other online retailers, as we move to favor our own direct-to-consumer channels, similar to the broader industry.
Additionally, we have continued to take actions to expand New Guards distribution channels and, in February 2022, New Guards entered into a significant commercial agreement with Authentic Brands Group LLC to operate Reebok’s branded retail stores and e-commerce operations and drive wholesale distribution for the brand across Europe. During 2022, this resulted in the recognition of a net economic benefit in Brand Platform Revenue which represents the net financial results of the Reebok business operated by Adidas during an interim transition period. We expect that by the second quarter of 2023, we will operate the Reebok distribution business in Europe and, as a result, will recognize these financial results as the principal.
Growth and Quality of our Luxury Supply
Our marketplace business model allows us to offer consumers a broad and deep selection of luxury, with a high stock value while incurring minimal inventory risk, by combining supply from a large number of globally distributed luxury sellers. This distributed network of sellers ensured Farfetch Marketplace experienced minimal disruption to our consumer offerings during the COVID-19 pandemic, because whilst individual stocking points were taken offline at the peak of the crisis, a significant majority of products on the Farfetch Marketplace were available from multiple sellers on the Farfetch platform and could be shipped from different locations, often from different countries. Our success depends on the participation of these luxury sellers on the Farfetch Marketplace, their highly curated range of products and our ability to sell these goods effectively.
85
The breadth and depth of inventory available through the Farfetch Marketplace is reflected in our stock value. Brands and designers typically have two primary seasonal collections per year, spring/summer and fall/winter. We aim to continue to grow the stock value and stock units on the Farfetch Marketplace from existing luxury sellers, adding luxury sellers from new geographies, large multi-brand retailers, new brands and new categories. We have continued to see increases in stock value year-on-year, with the 2022 fourth quarter stock value 49% above the 2021 fourth quarter value after a 12% increase over the same period to fourth quarter 2021.
The adoption of selective distribution by brands may reduce the Farfetch Marketplace catalog available to consumers in particular markets and may, therefore, lead to reduced supply and lost sales in key markets, and could negatively affect our business, results of operations, financial condition and prospects. However, we add value to our luxury sellers by providing our partners with fashion insight that comes from our analysis of browsing, sales and returns data trends across the Farfetch Marketplace, as well as the offline sales data points that come from our real-time integrations with our luxury sellers. This service helps us provide added value to our brand and boutique partners, enabling better retention.
During 2022, we have continued to see luxury brands increasingly move to reduce wholesale in favor of direct-to-consumer distribution strategies. We believe that our e-concession model has resulted in us being the multi-brand digital partner of choice. During the years ended December 31, 2022 and December 31, 2021, the number of luxury brands were 607 and 590, respectively.
As of December 31, 2022, we had over 1,400 luxury sellers on the Farfetch Marketplace, of which over 850 were retailers and over 600 were brands that sell directly on the Farfetch Marketplace. As of December 31, 2021, we had over 1,400 luxury sellers on the Farfetch Marketplace, of which just over 820 were retailers and 590 were brands that sell directly on the Farfetch Marketplace. Both the mix of sales from brands versus retailers and the mix of first-party sales versus third-party sales can impact our results of operations as each attracts different margins.
Cost of Consumer Acquisition and Engagement
Our Digital Platform financial performance also depends on the expenses we incur to attract and retain consumers.
Demand generation expense consists primarily of fees that we pay our various media and affiliate partners. We will continue to invest in consumer acquisition and retention while the underlying consumer unit economics and consumer lifetime value indicate the return on investment is strong. During 2022, we saw a decrease in these expenses reflecting initiatives to lower customer acquisition and engagement costs, including a reallocation of spend towards lower cost markets and more profitable transactions. We expect such expenses to decrease as a percentage of Adjusted Revenue as we increase our share of Digital Platform Revenue derived from FPS and we improve the efficiency of our demand generation activities and the percentage of our business related to existing consumers increases. We continue to maximize efficiencies in our performance marketing spend by leveraging the large volume of product performance data that we have available to enhance our media bidding decisions across paid search, meta-search and online display.
We are focusing on developing our brand to organically grow the traffic on our Marketplaces. We believe that with continued investment in brand marketing, data-led insights and effective consumer targeting, we can expand and strengthen our reach, and we intend to continue a “full-funnel” approach to marketing to continue to build our brand and capture consumer intent through multiple customer touchpoints.
Changes in our ability to access and process data in relation to our marketing activities have adversely impacted our ability to target and measure the effectiveness of our new consumer and retention marketing; and, privacy measures implemented by search engine companies could impact our ability to do so in the future, for example, the 2021 updates implemented by Apple in relation to IDFA caused an increase in demand generation costs driven by increased numbers of participants bidding for customers in certain ‘lower-funnel’ channels. To gain efficiencies in demand generation spend, we have implemented a full-funnel approach and focus on personalization and will continue to implement an underlying strategy of leveraging data insights to drive more targeted digital marketing, and visits from lower cost channels and from existing customers.
86
We also generate highly attractive consumer economics. While we are continuously focused on adding new Active Consumers to the Farfetch Marketplace, we are also focused on increasing their purchase frequency and AOV after their initial purchase, while lowering retention expenditure. In 2022, we continued to invest in acquiring consumers on our app, as existing app consumers typically generate a higher Digital Platform Order Contribution Margin over time.
Fulfilment
To facilitate and grow our Digital Platform, we provide fulfilment services to Marketplace consumers and receive revenue from the provision of these services, which is by and large a pass-through cost with no economic benefit to us, and therefore we calculate our Adjusted Revenue excluding Digital Platform Fulfilment Revenue. We offer our platform partners access to a fully integrated logistics network, which enables them to ship to consumers in over 190 countries and territories. This is an essential part of the consumer and luxury seller proposition and provides an unparalleled luxury experience.
We have developed a comprehensive cross-border network for delivery, provided by leading third-party partners globally, which also provides the Farfetch Marketplace consumers with a free, simple and efficient returns process. Changes in the operations of these third-party partners due to the ongoing impacts of the COVID-19 pandemic, including global supply chain disruption, Brexit in the United Kingdom and Europe and the impact on supply and demand for delivery services as online adoption accelerates across industries has impacted our service levels and cost of revenue. However, we adopted mitigating cost saving strategies to help offset the impact of these factors. While Digital Platform Fulfilment Revenue would be expected to grow in line with the cost of delivery and duties, which increase as Digital Platform GMV and order volumes grow, during 2022, our Digital Platform Fulfilment Revenue decreased at a lower rate than Digital Platform GMV as a result of an increased pass-through of these costs to the consumer. Refer to Item 3. “Key Information — D. Risk Factors”.
Scaling our Global Platform
We will continue to invest in our smart supply chain management and luxury customer care to provide our consumers with a differentiated global product offering but localized customer experience. Our end-to-end operations include in-house content creation to achieve a luxury product presentation, localized interfaces, multilingual customer service, secure payment methods and seamless customs clearance and tariffs navigation. We will also continue to evolve our Fulfilment by Farfetch proposition with global distribution facilities located to optimize our cross-border network. While we expect our operational expenses to increase as we continue to grow, we expect such expenses to decrease as a percentage of Adjusted Revenue over time as we continue to achieve economies of scale and deliver operating leverage. However, we may experience an increase in certain unit costs of operating a global e-commerce business in a global retail industry increasingly adopting e-commerce, creating an upward pressure on certain costs areas.
Investments in Technology
We will continue to invest in people, product and infrastructure to maintain and grow our platform. Our investment in our technology in the year ended December 31, 2022 was $254.4 million, up 1.7% from $250.1 million in the year ended December 31, 2021. Our technology expense has increased as we continue to recruit additional personnel and to develop our technology expertise across the full spectrum of engineering, architecture, infrastructure, data engineering, integrations, security, agile and project management, and information systems and planning. As of December 31, 2022, we had 2,175 full-time technology, data and product employees, representing 32% of our total headcount. We have adjusted the pace of our increase in technology headcount to focus on our key priorities and achieve operational efficiencies, including the use of outsourcing to create a flexible and adaptable workforce to meet fluctuations in development needs.
Promotional Activity
The luxury market is subject to promotional activity. Promotions can be company-funded, partner-funded or a mix of both. We use promotions to drive consumer acquisition, retention and sales. We may elect to engage in promotional activity at times and at price levels we deem appropriate, or we may engage in promotional activity
87
when we see market peers doing the same, and our performance may be impacted depending on the level of promotion and funding driven by Farfetch and the market conditions.
When competitors increase promotional activity, we can react to those promotions symmetrically by increasing our promotional activity. Alternatively, we can decide not to match competitors’ promotional activity, which we believe improves our relationships with brands and, in turn, supply on the Farfetch Marketplace, as well as promoting the luxury nature of our brand. Promotional activity also has the potential to impact supply; if we decide not to incentivize promotional activity by our retailers by not funding, by reducing our funding, by requiring our retailers to fund promotions in whole or part, or if we increase the mix of partner-funded promotions, it could adversely impact our relationships with our retailers.
For these reasons outlined above, the level of promotional activity in which the Group engages is considered a lever that we can use to achieve our strategy.
From time to time we also engage in markdown activity. For example, during 2022, we undertook inventory clearance activity by offering increased markdown sales on Browns’ products sold through the marketplace. This contributed to a decline in the Digital Platform Gross Profit Margin during 2022 which more than offset the improvements we saw in the first half of 2022 from our shift to full price.
Investment in Innovation and Profitable Growth
We invest in opportunities to advance our strategic objectives, including acquisitions, investments in our consumers, and investments to deliver technology and other resources. Whilst these investments present various levels of risk and may result in lower profitability for Farfetch, we believe they will allow us to widen and leverage our platform, expand our consumer base and offering and capitalize on other longer term opportunities.
In August 2022 we announced a landmark transaction with Richemont which, subject to the receipt of certain regulatory approvals, will allow Richemont Maisons and YNAP to advance their LNR capabilities by adopting FPS and joining the Farfetch Marketplace. The first stage of this transaction also includes a minority investment into YNAP and its transformation into a hybrid model through the adoption of our technology. Completion of the transaction is conditional upon, among other factors, receipt of regulatory approvals.
During the year ended December 31, 2022, we also made two strategic acquisitions, comprising:
Our strategic acquisitions may affect our business growth and the comparability of our financial results. The effects that these acquisitions had on our overall revenue and profitability during 2022 were relatively small. When we acquire new businesses, we are required to allocate the consideration payable to the assets acquired. Some of these assets, such as brand names and licenses, software and customer relationships, need to be amortized over their estimated useful lives and hence we record an expense to reflect this. This expense impacts our reported results and if we acquire more businesses, we would expect this expense to increase. Refer to Note 31, Business Combinations, within our Consolidated financial statements included in this Annual Report.
88
Cost Rationalization Initiatives
During 2022, we undertook various cost savings initiatives to focus resources on areas of the business delivering stronger near-term payback. These initiatives revolved around streamlining our cost base, including headcount reductions to our core business, and resulted in some savings across our operations platform, technology, marketing spend and people costs during the year ended December 31, 2022. We made decisions to exit 17% of our 2022 starting headcount, some of which has been completed in 2022 and the remainder will be completed in 2023. However, we will continue to hire specifically to support the growth planned for the FPS business and within New Guards. Our headcount also now reflects additional staff added as a result of the acquisitions we completed in 2022
We have also initiated actions to reduce or eliminate up to 15 operating locations worldwide as well as reduce our retail footprint at Browns and Stadium Goods. We intend to realize further cost saving opportunities as we embed a new leaner and simpler operating structure, which we expect to help us achieve operating cost leverage in 2023.
In implementing headcount reductions during 2022, we incurred restructuring costs of $4.8 million relating to severance payments and expect further restructuring costs to be recognized in 2023. These costs are recognized in the other costs line in Selling, general and administrative expenses and excluded from the computation of Adjusted EBITDA.
Other Factors Affecting Our Performance
Results of our operations are impacted by a number of other factors, including seasonality and foreign exchange fluctuations:
Seasonality. Our business is seasonal in nature, broadly reflecting traditional retail seasonality patterns through the calendar year. As such, GMV and revenue have been historically higher in the fourth calendar quarter of each year than in other quarters. We believe seasonality may continue to impact our quarterly results.
Foreign currency fluctuations. Our financial information is presented in U.S. dollars, which differs from the underlying functional currencies of certain of our subsidiaries (including New Guards whose functional currency is the euro), exposing us to foreign exchange translation risk on consolidation. This risk is currently not hedged and therefore our results of operations have in the past, and will in the future, fluctuate due to movements in exchange rates when currencies are translated into U.S. dollars.
At a subsidiary level, we are also exposed to transactional foreign exchange risk because we earn revenues and incur expenses in a number of different foreign currencies relative to the relevant subsidiary’s functional currency, mainly the pound sterling and the euro. Movements in exchange rates therefore impact our subsidiaries and thus, our consolidated results and cash flows. We hedge a portion of our core transactional exposures using forward foreign exchange contracts and foreign exchange option contracts; however, we are exposed to fluctuations in exchange rates on the unhedged portion of the exposures.
During 2022, the impact of foreign currency fluctuations had a significant impact on our reported results and this may continue into 2023 and beyond as exchange rates fluctuate. The impact of foreign currency fluctuations is outlined in Item 5 "Operating and Financial Review and Prospects - A. Operating Results". Refer to Item 5 "Operating and Financial Review and Prospects - E. Critical Accounting Estimates" for a reconciliation of the Group revenue to Group revenue on a constant currency basis.
Share price fluctuation. We hold multiple financial liabilities for which one of the valuation inputs is our share price value at period end. Fluctuations in our share price between period ends impact the valuation and as a result, our results of operations. Refer to Note 19, Financial instruments and financial risk management, within our Consolidated financial statements included elsewhere in this Annual Report.
89
Key Operating and Financial Metrics
The key operating and financial metrics we use are set forth below. The following table sets forth our key performance indicators for the years ended December 31, 2020, 2021 and 2022.
|
|
Year ended December 31, |
|
|||||||||
|
|
2020 |
|
|
2021 |
|
|
2022 |
|
|||
|
(in $ thousands, except per share data and AOV) |
|
||||||||||
Selected Other Data: |
|
|
|
|
|
|
|
|
|
|||
Consolidated Group: |
|
|
|
|
|
|
|
|
|
|||
GMV (1) |
|
$ |
3,187,014 |
|
|
$ |
4,229,874 |
|
|
$ |
4,058,501 |
|
Revenue |
|
|
1,673,922 |
|
|
|
2,256,608 |
|
|
$ |
2,316,680 |
|
Adjusted Revenue (1) |
|
|
1,460,694 |
|
|
|
1,924,104 |
|
|
|
1,995,027 |
|
Gross Profit |
|
|
770,928 |
|
|
|
1,016,511 |
|
|
|
1,023,175 |
|
Gross Profit Margin |
|
46.1% |
|
|
45.0% |
|
|
|
44.2 |
% |
||
(Loss)/Profit After Tax |
|
$ |
(3,315,623 |
) |
|
$ |
1,470,611 |
|
|
$ |
344,855 |
|
Adjusted EBITDA (1) |
|
|
(47,432 |
) |
|
|
1,638 |
|
|
|
(98,715 |
) |
Adjusted EBITDA Margin (1) |
|
(3.2%) |
|
|
|
0.1 |
% |
|
|
(4.9 |
%) |
|
Basic (Loss)/Earnings Per Share (“EPS”) |
|
$ |
(9.69 |
) |
|
$ |
4.02 |
|
|
$ |
0.93 |
|
Diluted EPS |
|
|
(9.69 |
) |
|
|
(1.07 |
) |
|
|
(1.85 |
) |
Adjusted EPS (1) |
|
|
(0.60 |
) |
|
|
(0.55 |
) |
|
|
(0.92 |
) |
Digital Platform: |
|
|
|
|
|
|
|
|
|
|||
Digital Platform GMV (1) |
|
$ |
2,759,476 |
|
|
$ |
3,677,988 |
|
|
$ |
3,492,515 |
|
Digital Platform Services Revenue |
|
|
1,033,156 |
|
|
|
1,385,678 |
|
|
|
1,419,721 |
|
Digital Platform Gross Profit |
|
|
560,206 |
|
|
|
730,253 |
|
|
|
726,589 |
|
Digital Platform Gross Profit Margin |
|
54.2% |
|
|
52.7% |
|
|
|
51.2 |
% |
||
Digital Platform Order Contribution (1) |
|
$ |
361,419 |
|
|
$ |
438,432 |
|
|
$ |
454,580 |
|
Digital Platform Order Contribution Margin (1) |
|
35.0% |
|
|
31.6% |
|
|
|
32.0 |
% |
||
Active Consumers (1) |
|
|
3,024 |
|
|
|
3,687 |
|
|
|
3,918 |
|
Average Order Value - Marketplace (1) |
|
$ |
568 |
|
|
$ |
612 |
|
|
$ |
574 |
|
Average Order Value - Stadium Goods (1) |
|
|
316 |
|
|
|
308 |
|
|
|
286 |
|
Brand Platform: |
|
|
|
|
|
|
|
|
|
|||
Brand Platform GMV (1) |
|
$ |
390,014 |
|
|
$ |
467,505 |
|
|
$ |
455,160 |
|
Brand Platform Revenue |
|
|
390,014 |
|
|
|
467,505 |
|
|
|
477,146 |
|
Brand Platform Gross Profit |
|
|
190,806 |
|
|
|
241,516 |
|
|
|
234,483 |
|
Brand Platform Gross Profit Margin |
|
48.9% |
|
|
51.7% |
|
|
|
49.1 |
% |
||
90
A. Operating Results
This section on operating results analyzes both the consolidated Group results and the results by segment.
Key Operating Results and Operating Metrics of the Group
Comparison of Years Ended December 31, 2021 and 2022
Revenue:
|
|
Year ended December 31, |
|
|
|
|
|
|
|
|||||||
|
|
2021 |
|
|
2022 |
|
|
$ Change |
|
|
% Change |
|
||||
|
|
(in thousands) |
|
|
|
|
|
|
|
|||||||
Revenue |
|
$ |
2,256,608 |
|
|
$ |
2,316,680 |
|
|
$ |
60,072 |
|
|
|
2.7 |
% |
Less: Digital Platform Fulfilment Revenue |
|
|
(332,504 |
) |
|
|
(321,653 |
) |
|
|
10,851 |
|
|
|
(3.3 |
%) |
Adjusted Revenue |
|
$ |
1,924,104 |
|
|
$ |
1,995,027 |
|
|
$ |
70,923 |
|
|
|
3.7 |
% |
Revenue by type of good or service consisted of the following components:
Revenue for the year ended December 31, 2022 increased by $60.1 million, or 2.7%, compared to the year ended December 31, 2021. This increase was primarily driven by 2.5% growth in Digital Platform Services Revenue to $1,419.7 million and 38.4% growth in In-Store Revenue to $98.2 million. Brand Platform Revenue also increased by 2.1% to $477.1 million. These increases were partially offset by a decline in Digital Platform Fulfilment Revenue of 3.3%, to $321.7 million. Excluding the impact of changes in foreign exchange rates, revenue would have increased 11.9% year-over-year.
The increase in Digital Platform Services Revenue of 2.5% was primarily driven by 9.8% growth in Digital Platform Services first-party revenue and growth in advertising revenue which relates to our media solutions business. This increase was partially offset by a decline in Digital Platform Services third-party revenue of 2.2%, reflecting headwinds from the suspension of trade in Russia, where trade has been ceased since March 2022, and mainland China, where regional COVID-19 restrictions impacted trade. The growth in Digital Platform Services first-party revenue was driven by strong performance of Browns’ products on the Platform supported by clearance activity. Digital Platform Third-Party Take Rate increased from 30.2% for the year ended December 31, 2021 to 32.1% for the year ended December 31, 2022, reflecting measures implemented to share incremental costs with our partners.
Digital Platform Fulfilment Revenue represents the pass-through to consumers of delivery and duties charges incurred by our global logistics solutions, net of any Farfetch-funded consumer promotions, subsidized shipping and incentives. Digital Platform Fulfilment Revenue accounted for 13.9% of revenue in 2022, a decrease from 14.7% in 2021. While Digital Platform Fulfilment Revenue would be expected to grow in line with the cost of delivery and duties, which increase as Digital Platform GMV and order volumes grow, or decrease as Digital Platform GMV and order volumes decline, variations in the level of Farfetch-funded promotions and incentives will impact Digital Platform Fulfilment Revenue, as Digital Platform Fulfilment Revenue is recorded net of such promotions. Digital Platform Fulfilment Revenue declined 3.3%, below the overall Digital Platform GMV decline of 5%, resulting from an increased pass-through of these costs to consumers in the year ended December 31, 2022.
Cost of Revenue, Gross Profit and Gross Profit Margin
|
|
Year ended December 31, |
|
|
|
|
|
|
|
|||||||
|
|
2021 |
|
|
2022 |
|
|
$ Change |
|
|
% Change |
|
||||
|
|
(in thousands) |
|
|
|
|
|
|
|
|||||||
Cost of revenue |
|
$ |
(1,240,097 |
) |
|
$ |
(1,293,505 |
) |
|
$ |
(53,408 |
) |
|
|
(4.3 |
%) |
Gross profit |
|
|
1,016,511 |
|
|
|
1,023,175 |
|
|
|
6,664 |
|
|
|
0.7 |
% |
Gross profit margin |
|
|
45.0 |
% |
|
|
44.2 |
% |
|
|
|
|
|
|
||
91
Cost of revenue for the year ended December 31, 2022 increased by $53.4 million, or 4.3%, compared to the year ended December 31, 2021, ahead of revenue growth. This increase was primarily driven by Digital Platform, with Brand Platform and In-Store also contributing to the increase in cost of revenue.
Our gross profit margin decreased from 45.0% for the year ended December 31, 2021 to 44.2% for the year ended December 31, 2022. This decrease was driven by a decrease in Digital Platform Gross Profit Margin from 52.7% to 51.2% and a decrease in Brand Platform gross profit margin from 51.7% to 49.1%.
Within Digital Platform, the year-over-year the slight increase in Digital Platform third-party gross profit margin was more than offset by a decrease in first-party Gross Profit Margin due to stock clearance and provisioning activity on Browns products.
Selling, general and administrative expenses
The following tables shows our selling, general and administrative expenses for the years ended December 31, 2020, 2021 and 2022 and as a percentage of adjusted revenue:
|
|
Year ended |
|
|
2020 vs. 2021 |
|
|
2021 vs. 2022 |
|
|||||||||||
|
|
2020 |
|
|
2021 |
|
|
2022 |
|
|
% Change |
|
|
% Change |
|
|||||
|
|
(in thousands) |
|
|
|
|
|
|
|
|||||||||||
Demand generation expense |
|
$ |
(198,787 |
) |
|
$ |
(291,821 |
) |
|
$ |
(272,009 |
) |
|
|
(46.8 |
%) |
|
|
6.8 |
% |
Technology expense |
|
|
(115,227 |
) |
|
|
(131,408 |
) |
|
|
(120,024 |
) |
|
|
(14.0 |
%) |
|
|
8.7 |
% |
Share-based payments |
|
|
(291,633 |
) |
|
|
(196,167 |
) |
|
|
(244,856 |
) |
|
|
32.7 |
% |
|
|
(24.8 |
%) |
Depreciation and amortization |
|
|
(217,223 |
) |
|
|
(251,198 |
) |
|
|
(332,775 |
) |
|
|
(15.6 |
%) |
|
|
(32.5 |
%) |
General and administrative |
|
|
(504,346 |
) |
|
|
(591,644 |
) |
|
|
(729,857 |
) |
|
|
(17.3 |
%) |
|
|
(23.4 |
%) |
Other items |
|
|
(24,267 |
) |
|
|
(18,730 |
) |
|
|
(34,082 |
) |
|
|
22.8 |
% |
|
|
(82.0 |
%) |
Selling, general and administrative expenses |
|
$ |
(1,351,483 |
) |
|
$ |
(1,480,968 |
) |
|
$ |
(1,733,603 |
) |
|
|
(9.6 |
%) |
|
|
(17.1 |
%) |
|
|
% of Adjusted Revenue |
|
|||||||||
|
|
2020 |
|
|
2021 |
|
|
2022 |
|
|||
|
|
|
|
|
|
|
|
|
|
|||
Demand generation expense |
|
|
(13.6 |
%) |
|
|
(15.2 |
%) |
|
|
(13.6 |
%) |
Technology expense |
|
|
(7.9 |
%) |
|
|
(6.8 |
%) |
|
|
(6.0 |
%) |
Share-based payments |
|
|
(20.0 |
%) |
|
|
(10.2 |
%) |
|
|
(12.3 |
%) |
Depreciation and amortization |
|
|
(14.9 |
%) |
|
|
(13.1 |
%) |
|
|
(16.7 |
%) |
General and administrative |
|
|
(34.5 |
%) |
|
|
(30.7 |
%) |
|
|
(36.6 |
%) |
Other items |
|
|
(1.7 |
%) |
|
|
(1.0 |
%) |
|
|
(1.7 |
%) |
Selling, general and administrative expenses |
|
|
(92.5 |
%) |
|
|
(77.0 |
%) |
|
|
(86.9 |
%) |
Demand generation expense
|
|
Year ended |
|
|
|
|
|
|
|
|||||||
|
|
2021 |
|
|
2022 |
|
|
$ Change |
|
|
% Change |
|
||||
|
|
(in thousands) |
|
|
|
|
|
|
|
|||||||
Demand generation expense |
|
$ |
(291,821 |
) |
|
$ |
(272,009 |
) |
|
$ |
19,812 |
|
|
|
6.8 |
% |
Demand generation expense consists primarily of fees that we pay to various media and affiliate partners. Demand generation expense for the year ended December 31, 2022 decreased by $19.8 million, or 6.8%, compared to the year ended December 31, 2021. Demand generation expense decreased as a percentage of Digital Platform Services Revenue from (21.1)% in the year ended December 31, 2021 to (19.2)% in the year ended December 31, 2022. This decrease was driven by increased marketing efficiencies, annualization of the impacts of the actions taken to address Apple's iOS privacy measures, and included a redistribution of spend between territories during the year ended December 31, 2022.
92
Investment in technology
|
|
Year ended |
|
|
|
|
|
|
|
|||||||
|
|
2021 |
|
|
2022 |
|
|
$ Change |
|
|
% Change |
|
||||
|
|
(in thousands) |
|
|
|
|
|
|
|
|||||||
Technology expense |
|
$ |
(131,408 |
) |
|
$ |
(120,024 |
) |
|
$ |
11,384 |
|
|
|
8.7 |
% |
Capitalized development costs |
|
|
(118,661 |
) |
|
|
(134,375 |
) |
|
|
(15,714 |
) |
|
|
(13.2 |
%) |
Total investment in technology |
|
$ |
(250,069 |
) |
|
$ |
(254,399 |
) |
|
$ |
(4,330 |
) |
|
|
(1.7 |
%) |
Technology expense consists of technology research and development, staffing costs and other IT costs, including software licensing and hosting. Technology expense for the year ended December 31, 2022 decreased by $11.4 million, or 8.7% compared to the year ended December 31, 2021. This decrease was primarily driven by an increase in the capitalization rate due to an increase in investments into capitalizable longer term development projects, partially offset by the annualization of headcount recruited in 2021, as we continued to develop new technologies and enhance our digital platform features and services. Technology staff headcount increased slightly from 2,086 in 2021 to 2,175 in 2022, as we leveraged existing resources to develop new technologies and enhance our digital platform features and services. We continue to operate three globally distributed data centers, which support the processing of our growing base of transactions, including one in Shanghai dedicated to serving our Chinese consumers. Technology expense as a percentage of Adjusted Revenue decreased from (6.8)% in 2021 to (6.0)% in 2022.
Total investment in technology amounted to $254.4 million during 2022, $134.4 million of which was capitalized as compared to a total of $250.1 million during 2021, $118.7 million of which was capitalized.
Depreciation and amortization
|
|
Year ended |
|
|
|
|
|
|
|
|||||||
|
|
2021 |
|
|
2022 |
|
|
$ Change |
|
|
% Change |
|
||||
|
|
(in thousands) |
|
|
|
|
|
|
|
|||||||
Depreciation and amortization |
|
$ |
(251,198 |
) |
|
$ |
(332,775 |
) |
|
$ |
(81,577 |
) |
|
|
(32.5 |
%) |
Depreciation and amortization expense for the year ended December 31, 2022, increased by $81.6 million, or 32.5%, compared to the year ended December 31, 2021, primarily driven by a $76.5 million increase in our amortization expenses from $201.6 million to $278.1 million year-over-year. Amortization expense increased principally due to continued technology investments, where qualifying technology development costs are capitalized and amortized over a three-year period, as well as amortization of the $364.1 million intangible asset recognized in relation to the Reebok partnership entered into in March 2022. Depreciation expense increased by $5.1 million, primarily driven by new leases entered into towards the end of 2021 and in 2022.
Share-based payments
|
|
Year ended |
|
|
|
|
||||||||||
|
|
2021 |
|
|
2022 |
|
|
$ Change |
|
|
% Change |
|
||||
|
|
(in thousands) |
|
|
|
|
|
|
|
|||||||
Share-based payments |
|
$ |
(196,167 |
) |
|
$ |
(244,856 |
) |
|
$ |
(48,689 |
) |
|
|
24.8 |
% |
Share-based payments for the year ended December 31, 2022 increased by $48.7 million, or 24.8%, compared to the year ended December 31, 2021, due to the decreased cost of employment-related taxes and cash-settled awards, primarily as a result of the share price movement and quarterly revaluation. This was partially offset by grants of equity-settled awards, including the performance-based restricted share unit ("PSU") award granted to our Founder, Chairman and CEO, José Neves in May 2021.
93
General and administrative expense
|
|
Year ended |
|
|
|
|
|
|
|
|||||||
|
|
2021 |
|
|
2022 |
|
|
$ Change |
|
|
% Change |
|
||||
|
|
(in thousands) |
|
|
|
|
|
|
|
|||||||
General and administrative |
|
$ |
(591,644 |
) |
|
$ |
(729,857 |
) |
|
$ |
(138,213 |
) |
|
|
(23.4 |
%) |
General and administrative expense for the year ended December 31, 2022 increased by $138.2 million, or 23.4%, compared to the year ended December 31, 2021, which was driven primarily by additional expenses to support the growth of our business, and an increase in headcount, excluding technology staff who are included in the technology expense above, from 4,378 to 4,553, an increase of 4.0%. This increase includes additional headcount from new acquisitions, and is below the 19.3% increase in the previous year, as we focused on initiatives to stream line our cost base in the second half of the year ended December 31, 2022. General and administrative expenses as a percentage of Adjusted Revenue increased from (30.7)% to (36.6)%.
Other items
|
|
Year ended |
|
|
|
|
|
|
|
|||||||
|
|
2021 |
|
|
2022 |
|
|
$ Change |
|
|
% Change |
|
||||
|
|
(in thousands) |
|
|
|
|
|
|
|
|||||||
Transaction-related legal and advisory expenses |
|
$ |
(18,596 |
) |
|
$ |
(29,171 |
) |
|
$ |
(10,575 |
) |
|
|
(56.9 |
%) |
Loss on impairment of investments carried at fair value |
|
|
(134 |
) |
|
|
(65 |
) |
|
|
69 |
|
|
|
51.5 |
% |
Restructuring |
|
|
- |
|
|
|
(4,846 |
) |
|
|
(4,846 |
) |
|
n/a |
|
|
Other items |
|
$ |
(18,730 |
) |
|
$ |
(34,082 |
) |
|
$ |
(15,352 |
) |
|
|
(82.0 |
%) |
Other items represent items outside the normal scope of our ordinary business activities and non-cash items. Other items totaled $34.1 million for the year ended December 31, 2022, primarily consisting of transaction-related legal and advisory expenses incurred in relation to the transaction with Richemont, where Richemont Maisons and YNAP will be adopting FPS to power their digital and omni-channel strategy, as well as restructuring costs in 2022.
Impairment losses on tangible and intangible assets
|
|
Year ended |
|
|
|
|
|
|
|
|||||||
|
|
2021 |
|
|
2022 |
|
|
$ Change |
|
|
% Change |
|
||||
|
|
(in thousands) |
|
|
|
|
|
|
|
|||||||
Impairment losses on right-of-use asset |
|
$ |
- |
|
|
$ |
(11,521 |
) |
|
$ |
(11,521 |
) |
|
n/a |
|
|
Impairment losses on property, plant and equipment |
|
|
- |
|
|
|
(8,424 |
) |
|
|
(8,424 |
) |
|
n/a |
|
|
Impairment losses on tangible assets |
|
$ |
- |
|
|
$ |
(19,945 |
) |
|
$ |
(19,945 |
) |
|
n/a |
|
|
|
|
|
|
|
|
|
|
|
|
|
|
|
||||
Impairment losses on intangible assets |
|
$ |
(11,779 |
) |
|
$ |
(116,787 |
) |
|
$ |
(105,008 |
) |
|
|
(891.5 |
%) |
Impairment losses on intangible assets |
|
$ |
(11,779 |
) |
|
$ |
(116,787 |
) |
|
$ |
(105,008 |
) |
|
|
(891.5 |
%) |
The impairment charge of $136.7 million on tangible and intangible assets for the year ended December 31, 2022, is comprised of $116.8 million relating to intangible assets, including goodwill relating to impairments on our Browns - Platform cash-generating unit ("CGU"), as well as impairments allocated to three of the smaller CGUs within the Group, and $19.9 million relating to tangible assets, primarily relating to impairments on our Browns - Platform CGU.
94
The impairment charge of $11.8 million on intangible assets for the year ended December 31, 2021, is comprised of a charge related to a reduction in the carrying value of one of the smaller intangible brand assets within the New Guards portfolio.
Gains/(losses) on items held at fair value and remeasurements
|
|
Year ended |
|
|
|
|
|
|
|
|||||||
|
|
2021 |
|
|
2022 |
|
|
$ Change |
|
|
% Change |
|
||||
|
|
(in thousands) |
|
|
|
|
|
|
|
|||||||
Remeasurement gains on put and call option and contingent consideration liabilities |
|
$ |
384,122 |
|
|
|
638,987 |
|
|
$ |
254,865 |
|
|
|
(66.4 |
%) |
Fair value gains of convertible note embedded derivatives |
|
|
1,638,837 |
|
|
|
667,028 |
|
|
|
(971,809 |
) |
|
|
59.3 |
% |
Loss on disposal of investment carried at FVTPL |
|
|
- |
|
|
|
(178 |
) |
|
|
(178 |
) |
|
|
100.0 |
% |
Fair value remeasurement of minority investment |
|
|
- |
|
|
|
(7,225 |
) |
|
|
(7,225 |
) |
|
|
100.0 |
% |
Fair value remeasurement of previously held equity interest |
|
|
784 |
|
|
|
- |
|
|
|
(784 |
) |
|
|
100.0 |
% |
Gains on items held at fair value and |
|
$ |
2,023,743 |
|
|
$ |
1,298,612 |
|
|
$ |
(725,131 |
) |
|
|
35.8 |
% |
Gains on items held at fair value and remeasurements decreased by $725.1 million from $2,023.7 million in the year ended December 31, 2021 to $1,298.6 million for the year ended December 31, 2022. This was primarily due to a $971.8 million decrease in gains on the remeasurement of the embedded derivatives relating to our February 2020 Notes, April 2020 Notes and November 2020 Notes driven by a smaller decrease in our share price during 2022 compared to the decrease in our share price during 2021. This was partially offset by an increase in remeasurement gains on the remeasurement of put and call option liabilities of $254.9 million primarily driven by the put-call option associated with the strategic agreement with Alibaba and Richemont and the Chalhoub Group’s put option over the non-controlling interest in Farfetch International Limited.
Finance income and cost
|
Year ended |
|
|
|
|
|||||||||||
|
|
2021 |
|
|
2022 |
|
|
$ Change |
|
|
% Change |
|
||||
|
(in thousands) |
|
|
|
|
|
|
|
||||||||
Unrealized exchange gains |
|
$ |
9,289 |
|
|
$ |
25,717 |
|
|
$ |
16,428 |
|
|
|
(176.9 |
%) |
Interest on cash and cash equivalents and short-term deposits |
|
|
3,310 |
|
|
|
12,652 |
|
|
|
9,342 |
|
|
|
(282.2 |
%) |
Finance income |
|
|
12,599 |
|
|
|
38,369 |
|
|
|
25,770 |
|
|
|
(204.5 |
%) |
Unrealized exchange losses |
|
|
(9,135 |
) |
|
|
(40,867 |
) |
|
|
(31,732 |
) |
|
|
(347.4 |
%) |
Lease interest |
|
|
(9,137 |
) |
|
|
(9,751 |
) |
|
|
(614 |
) |
|
|
(6.7 |
%) |
Convertible note interest |
|
|
(67,638 |
) |
|
|
(59,994 |
) |
|
|
7,644 |
|
|
|
11.3 |
% |
Interest on Term Loan |
|
|
- |
|
|
|
(9,464 |
) |
|
|
(9,464 |
) |
|
|
100.0 |
% |
Loss on derecognition of convertible loan notes |
|
|
- |
|
|
|
(27,251 |
) |
|
|
(27,251 |
) |
|
|
100.0 |
% |
Other interest expense |
|
|
(531 |
) |
|
|
(1,230 |
) |
|
|
(699 |
) |
|
|
(131.6 |
%) |
Finance costs |
|
|
(86,441 |
) |
|
|
(148,557 |
) |
|
|
(62,116 |
) |
|
|
(71.9 |
%) |
Net finance income costs |
|
$ |
(73,842 |
) |
|
$ |
(110,188 |
) |
|
$ |
(36,346 |
) |
|
|
(49.2 |
%) |
Unrealized exchange gains and losses fluctuate due to the global nature of our business, where we earn revenue and incur expenses in a number of different currencies. For our accounting policy for foreign currency translations and how these are classified in our consolidated statement of operations, refer to Note 2.3(h) Summary of significant accounting policies - Foreign currency translation, within our Consolidated financial statements included elsewhere in this Annual Report.
95
Net unrealized exchange losses for the year ended December 31, 2022 were $15.2 million comprising gains of $25.7 million and losses of $40.9 million. The net losses were primarily driven by movements in the exchange rates of GBP, USD, EUR and BRL verses functional currency on intercompany, trading and cash balances not in the functional currency of the main operating entities.
Convertible note interest for the year ended December 31, 2022 decreased by $7.6 million to $60.0 million, primarily due to lower effective interest on the February 2020 Notes as a result of early conversions during 2021 and 2022.
Loss on derecognition of convertible loan notes for the year ended December 31, 2022 was $27.3 million. This related to the derecognition of the $250.0 million February 2020 notes.
Interest on cash and cash equivalents and short-term deposits for the year ended December 31, 2022 increased by $9.3 million compared to the year ended December 31, 2021, primarily driven by higher interest rates on money market funds and bank deposits.
Interest on Term Loan for the year ended December 31, 2022 was $9.5 million. This related to interest accrued on the $400.0 million Term Loan during the year.
Profit after tax
|
|
|
|
|
|
|
|||||||||||
|
|
|
2021 |
|
|
2022 |
|
|
$ Change |
|
|
% Change (2) |
|
||||
|
|
|
(in thousands) |
|
|
|
|
|
|
|
|||||||
Profit after tax |
|
|
$ |
1,470,611 |
|
|
$ |
344,855 |
|
|
$ |
(1,125,756 |
) |
|
|
(76.6 |
%) |
% of Adjusted Revenue |
|
|
|
76.4 |
% |
|
|
17.3 |
% |
|
|
|
|
|
|
||
Profit after tax for the year ended December 31, 2022 was $344.9 million, down by $1,125.8 million, compared to the year ended December 31, 2021. This decrease was primarily driven by gains on items held at fair value and remeasurements, which decreased by $725.1 million year-over-year as well an increase in Selling, general and administrative expenses, as explained above, and the $105.0 million increase in impairment losses.
Adjusted EBITDA
|
|
Year ended |
|
|
|
|
|
|
|
|||||||
|
|
2021 |
|
|
2022 |
|
|
$ Change |
|
|
% Change |
|
||||
|
|
(in thousands) |
|
|
|
|
|
|
|
|||||||
Adjusted EBITDA |
|
$ |
1,638 |
|
|
$ |
(98,715 |
) |
|
$ |
(100,353 |
) |
|
|
6,126.6 |
% |
% of Adjusted Revenue |
|
|
0.1 |
% |
|
|
(4.9 |
%) |
|
|
|
|
|
|
||
Adjusted EBITDA for the year ended December 31, 2022 decreased by $100.4 million, compared to the year ended December 31, 2021. This decrease was primarily due to the increase in general and administrative expenses, as described above. Adjusted EBITDA as a percentage of Adjusted Revenue decreased from 0.1% to (4.9%), primarily due to the increase in general and administrative expenses as a percentage of Adjusted Revenue, as described above.
Comparison of Year Ended December 31, 2020 and 2021
For a comparison of our consolidated results of operations for the years ended December 31, 2020 and 2021, refer to pages 85 through 91 of our 2021 Annual Report filed with the SEC on March 4, 2022.
96
Operating Results by Segment
Digital Platform
The Digital Platform segment activities include the Farfetch Marketplace, FPS, StadiumGoods.com, Farfetch Future Retail, and any other online sales channel operated by the Group, including the respective websites of the smaller brands in the New Guards portfolio which are not yet operated through FPS. It derives its revenues mostly from transactions between sellers and consumers conducted on our technology platforms.
Brand Platform
The Brand Platform segment is comprised of business-to-business activities of the brands in the New Guards portfolio. It includes design, production, brand development and wholesale distribution of brands owned and licensed by New Guards, including the franchised store operations. Since March 2022, Brand Platform Revenue also includes the net economic benefit arising from the Reebok partnership.
In-Store
The In-Store segment covers the activities of Group-operated stores including Browns, Stadium Goods, newly acquired Violet Grey and stores for brands in the New Guards portfolio. Revenues are derived from sales made in the physical stores.
There are no intersegment transactions that require elimination. Order Contribution is used to assess the performance and allocate resources between the segments. The operating segment disclosures required under IFRS 8 are provided in Note 5, Segmental and geographical information, within our Consolidated financial statements included elsewhere in this Annual Report.
The tables and discussion below set forth financial information and analysis of our three reportable operating segments for the years ended December 31, 2020, 2021 and 2022:
Digital Platform:
|
|
Year ended December 31, |
|
|||||||||
|
|
2020 |
|
|
2021 |
|
|
2022 |
|
|||
Digital Platform: |
|
(in thousands) |
|
|||||||||
Services third-party revenue |
|
$ |
637,568 |
|
|
$ |
845,941 |
|
|
$ |
827,224 |
|
Services first-party revenue |
|
|
395,588 |
|
|
|
539,737 |
|
|
|
592,497 |
|
Services Revenue |
|
|
1,033,156 |
|
|
|
1,385,678 |
|
|
|
1,419,721 |
|
Fulfilment Revenue |
|
|
213,228 |
|
|
|
332,504 |
|
|
|
321,653 |
|
Revenue |
|
|
1,246,384 |
|
|
|
1,718,182 |
|
|
|
1,741,374 |
|
Less: Cost of revenue |
|
|
(686,178 |
) |
|
|
(987,929 |
) |
|
|
(1,014,785 |
) |
Gross profit |
|
|
560,206 |
|
|
|
730,253 |
|
|
|
726,589 |
|
Less: Demand generation expense |
|
|
(198,787 |
) |
|
|
(291,821 |
) |
|
|
(272,009 |
) |
Order contribution |
|
$ |
361,419 |
|
|
$ |
438,432 |
|
|
$ |
454,580 |
|
The increase in Digital Platform Services Revenue of 2.5% was primarily driven by growth in first-party Digital Platform GMV. Excluding the impact of changes in foreign exchange rates, Digital Platform Services Revenue would have increased 10.0% year-over-year.
97
The increase in Digital Platform Services Revenue was also driven by a 6.3% increase in Active Consumers, from 3,687,000 as of December 31, 2021, to 3,918,000 as of December 31, 2022, and increased markdown performance. In addition, we benefited from year-over-year growth in media solutions revenue and our FPS offering. Digital Platform Services Revenue was further augmented by growth in first-party Digital Platform Services, where we saw strong performance of Browns’ products on the Platform supported by clearance activity. Digital Platform Third-Party Take Rate has increased slightly from 30.2% for the year ended December 31, 2021 to 32.1% for the year ended December 31, 2022, reflecting measures implemented to share incremental costs with our partners.
Digital Platform Fulfilment Revenue represents the pass-through to consumers of delivery and duties charges incurred by our global logistics solutions, net of any Farfetch-funded consumer promotions, subsidized shipping and incentives. Digital Platform Fulfilment Revenue accounted for 13.9% of revenue in 2022, a decrease from 14.7% in 2021. While Digital Platform Fulfilment Revenue would be expected to grow in line with the cost of delivery and duties, which increase as Digital Platform GMV and order volumes grow, variations in the level of Farfetch-funded promotions and incentives will impact Digital Platform Fulfilment Revenue, as Digital Platform Fulfilment Revenue is recorded net of such promotions. Digital Platform Fulfilment Revenue decreased 3.3%, resulting from an increased pass-through of these costs to consumers in the year ended December 31, 2022 at a slower rate as compared to Digital Platform Services Revenue decline.
Cost of revenue for the year ended December 31, 2022 increased by $26.9 million, or 2.7%, compared to the year ended December 31, 2021, primarily driven by Digital Platform Revenue growth.
Our Digital Platform Gross Profit Margin decreased from 52.7% for the year ended December 31, 2021 to 51.2% for the year ended December 31, 2022. The decrease was driven by the increasing mix of Digital Platform Fulfilment Revenue, which is a flow through generating no gross profit margin, plus an increase in promotional activity.
Demand generation expense consists primarily of fees that we pay to various media and affiliate partners. Demand generation expense for the year ended December 31, 2022 decreased by $19.8 million, or 6.8%, compared to the year ended December 31, 2021. Demand generation expense decreased as a percentage of Digital Platform Services Revenue from (21.1)% in 2021 to (19.2)% in 2022, as we increased marketing efficiencies, annualization of the impacts of the actions taken to address Apple's iOS privacy measures, and included a redistribution of spend between territories during the year ended December 31, 2022.
Digital Platform Order Contribution Margin increased from 31.6% in the year ended December 31, 2021 to 32.0% in December 31, 2022, as a result of lower demand generation costs.
Brand Platform:
|
|
Year ended December 31, |
|
|||||||||
|
|
2020 |
|
|
2021 |
|
|
2022 |
|
|||
Brand Platform: |
|
(in thousands) |
|
|||||||||
Revenue |
|
$ |
390,014 |
|
|
$ |
467,505 |
|
|
$ |
477,146 |
|
Less: Cost of revenue |
|
|
(199,208 |
) |
|
|
(225,989 |
) |
|
|
(242,663 |
) |
Gross profit or order contribution |
|
$ |
190,806 |
|
|
$ |
241,516 |
|
|
$ |
234,483 |
|
Brand Platform contributed $477.2 million of revenue and $234.5 million of gross profit for the year ended December 31, 2022 compared to $467.5 of revenue and $241.5 million of Gross Profit for the year ended December 31, 2021. Excluding the impact of changes in foreign exchange rates, Brand Platform Revenue would have increased 16.8% year-over-year due to strong demand for New Guards' brands' collections. In 2022, Brand Platform revenue included $22.0 million relating to the net economic benefit from the Reebok partnership, which commenced in March 2022.
98
In-Store:
|
|
Year ended December 31, |
|
|||||||||
|
|
2020 |
|
|
2021 |
|
|
2022 |
|
|||
In-Store: |
|
(in thousands) |
|
|||||||||
Revenue |
|
$ |
37,524 |
|
|
$ |
70,921 |
|
|
$ |
98,160 |
|
Less: Cost of revenue |
|
|
(17,608 |
) |
|
|
(26,179 |
) |
|
|
(36,057 |
) |
Gross profit or order contribution |
|
$ |
19,916 |
|
|
$ |
44,742 |
|
|
$ |
62,103 |
|
In-Store revenue increased 38.4% to $98.2 million in the year ended December 31, 2022, primarily due to additional New Guards’ stores that opened in the last twelve months, as well as the growth from existing stores. Excluding the impact of changes in foreign exchange rates, In-Store revenue would have increased 54.6% year-over-year.
Operating Results By Segment for the Year Ended December 31, 2020 and 2021
For a comparison of our operating results by segment for the years ended December 31, 2020 and 2021, refer to pages 92 through 94 of our 2021 Annual Report filed with the SEC on March 4, 2022.
Changes in Accounting Policies and Disclosures
There have been no significant new accounting standards or amendments that have a material impact on the results in the current year. For further details, refer to Note 2.4, Changes in accounting policies and disclosures, within our Consolidated financial statements included elsewhere in this Annual Report.
B. Liquidity and Capital Resources
The following historical consolidated financial data as of and for the years ended December 31, 2020, 2021 and 2022 has been derived from our audited Consolidated financial statements and the notes thereto. Our historical results for any prior period are not necessarily indicative of results expected in any future period.
|
|
Year ended December 31, |
|
|||||||||
|
|
2020 |
|
|
2021 |
|
|
2022 |
|
|||
|
|
(in thousands) |
|
|||||||||
Consolidated Statement of Cash Flow Data: |
|
|
|
|
|
|
|
|
|
|||
Net cash inflow/(outflow) from operating activities |
|
$ |
116,315 |
|
|
$ |
(282,154 |
) |
|
$ |
(536,598 |
) |
Net cash outflow from investing activities |
|
|
(132,641 |
) |
|
|
(330,656 |
) |
|
|
(344,336 |
) |
Net cash inflow from financing activities |
|
|
1,261,040 |
|
|
|
405,142 |
|
|
|
256,984 |
|
|
|
As of December 31, |
|
|||||||||
|
|
2020 |
|
|
2021 |
|
|
2022 |
|
|||
|
|
(in thousands) |
|
|||||||||
Consolidated Statement of Financial Position Data: |
|
|
|
|
|
|
|
|
|
|||
Current assets |
|
$ |
1,961,000 |
|
|
$ |
2,111,680 |
|
|
$ |
1,589,420 |
|
Non-current assets |
|
|
1,629,871 |
|
|
|
1,714,834 |
|
|
|
2,086,496 |
|
Total assets |
|
|
3,590,871 |
|
|
|
3,826,514 |
|
|
|
3,675,916 |
|
Current liabilities |
|
|
778,747 |
|
|
|
907,257 |
|
|
|
882,878 |
|
Non-current liabilities |
|
|
4,470,766 |
|
|
|
2,648,641 |
|
|
|
1,887,417 |
|
Total liabilities |
|
|
5,249,513 |
|
|
|
3,555,898 |
|
|
|
2,770,295 |
|
Share capital and premium |
|
|
942,099 |
|
|
|
1,656,905 |
|
|
|
1,701,602 |
|
Total (deficit)/equity |
|
|
(1,658,642 |
) |
|
|
270,616 |
|
|
|
905,621 |
|
99
General
As of December 31, 2022, we had cash and cash equivalents of $734.2 million. Our cash and cash equivalents consist primarily of cash in bank accounts and short-term deposits in money market funds.
Since our inception, we have financed our operations primarily through equity and debt issuances, and cash generated from our operating activities. Our primary requirements for liquidity and capital are to finance working capital, capital expenditures, business combinations and general corporate purposes.
Our total equity increased from $270.6 million as of December 31, 2021 to $905.6 million as of December 31, 2022, primarily due to the gains on items held at fair value and remeasurements during 2022. The gains on items held at fair value and remeasurements during the year primarily relate to the revaluation of the embedded derivatives relating to the convertible senior notes and the remeasurement of the put and call option liabilities related to non-controlling interests arising from the strategic agreement with Alibaba and Richemont. Unless earlier converted, redeemed or repurchased in accordance with their terms, the convertible senior notes may be settled, at Farfetch’s election and subject to certain exceptions and conditions, in Class A ordinary shares of Farfetch, cash, or a combination of cash and Class A ordinary shares of Farfetch. Refer to Note 19, Financial instruments and financial risk management, within our Consolidated financial statements included elsewhere in this Annual Report.
On February 5, 2020, we completed the private placement of convertible senior notes to Tencent and Dragoneer, pursuant to which we received $250 million and issued the notes to the purchasers. On October 27, 2022, we early repaid the February 2020 Notes through the issuance of 4,611,848 Class A Ordinary shares and a cash payment of $32.5 million.
On April 30, 2020, we completed the private offering of $400 million in aggregate principal amount of convertible senior notes for net proceeds of $390 million. The notes will mature on May 1, 2027, unless earlier converted, redeemed or repurchased in accordance with their terms. The notes will bear interest at a rate of 3.75% per year payable semi-annually in arrears on May 1 and November 1 of each year, beginning on November 1, 2020. On November 15, 2020, we completed the offering of $600 million in aggregate principal amount of convertible senior notes. The notes will mature on November 15, 2030, unless earlier converted, redeemed or repurchased in accordance with their terms. The notes will not bear any interest.
On October 20, 2022, we entered into the Credit Agreement with certain banks and financial institutions for a syndicated $400.0 million Term Loan. The Term Loan was issued with a 6.50% original issue discount and fully drawn upon issuance, resulting in net cash proceeds to Farfetch of approximately $369.1 million after certain fees. The Term Loan is due and payable on October 20, 2027, with early repayment permitted. Repayment of the Term Loan is due in quarterly installments of 0.25%, payable on the last business day (as defined in the Credit Agreement) of each fiscal quarter, beginning with the fiscal quarter ending on March 31, 2023. We have initially elected to make quarterly interest payments at a rate equal to Term SOFR (as defined in the credit agreement) plus 6.25% per annum, subject to a 0.50% floor.
We believe that our sources of liquidity and capital will be sufficient to meet our business needs for at least the next twelve months. We also expect these sources of liquidity will be sufficient to fund our long-term contractual obligations and capital needs. However, this is subject, to a certain extent, to general economic, financial, competitive, regulatory and other factors that are beyond our control. If we are unable to generate sufficient cash flows from operations in the future, we may have to obtain additional financing, which may include equity or debt issuances and/or credit financing. If we obtain additional capital by issuing equity, the interests of our existing stockholders will be diluted and, if we incur additional indebtedness, that indebtedness may contain significant financial and other covenants that may significantly restrict our operations. We cannot assure you that we could obtain additional financing on favorable terms or at all.
Below is a summary of short-term and long-term anticipated cash requirements as of December 31, 2022:
100
|
Payments due by period |
|
||||||||||||||
Contractual Obligations |
|
Less than |
|
|
One to three years |
|
|
Three to five years |
|
|
More than |
|
||||
|
(in thousands) |
|
||||||||||||||
Long term debt |
|
$ |
4,000 |
|
|
$ |
8,000 |
|
|
$ |
788,000 |
|
|
$ |
600,000 |
|
Put and call option liabilities |
|
|
26,029 |
|
|
|
71,919 |
|
|
|
97,270 |
|
|
|
- |
|
Finance leases |
|
|
45,994 |
|
|
|
78,413 |
|
|
|
55,569 |
|
|
|
87,093 |
|
Purchase obligations |
|
|
174,929 |
|
|
|
- |
|
|
|
- |
|
|
|
- |
|
Total |
|
$ |
250,952 |
|
|
$ |
158,332 |
|
|
$ |
940,839 |
|
|
$ |
687,093 |
|
Purchase obligations relate primarily to marketing, consulting, maintenance, license agreements, cloud services and other third-party agreements.
Cash Flows
The following table shows summary consolidated cash flow information for the periods presented:
|
|
Year ended December 31, |
|
|||||
|
|
2021 |
|
|
2022 |
|
||
|
|
(in thousands) |
|
|||||
Net cash outflow from operating activities |
|
$ |
(282,154 |
) |
|
$ |
(536,598 |
) |
Net cash outflow from investing activities |
|
|
(330,656 |
) |
|
|
(344,336 |
) |
Net cash inflow from financing activities |
|
|
405,142 |
|
|
|
256,984 |
|
Net decrease in cash and cash equivalents |
|
$ |
(207,668 |
) |
|
$ |
(623,950 |
) |
Net cash outflow from operating activities
Net cash outflow from operating activities increased by $254.4 million to $536.6 million in the year ended December 31, 2022, primarily driven by an increase in working capital funding.
Net cash outflow from investing activities
Net cash outflow from investing activities increased by $13.7 million to $344.3 million in the year ended December 31, 2022. The increase was primarily due to the strategic minority common equity investment of $200.0 million in the Neiman Marcus Group in May 2022, offset by the $100.0 million settlement of a short term investment purchased in 2021, and an increase in payments for business combinations and intangible assets.
Net cash inflow from financing activities
Net cash inflow from financing activities decreased by $148.2 million to $257.0 million in the year ended December 31, 2022. During the year ended December 31, 2022, the net cash inflow primarily related to proceeds of $369.1 million from the Term Loan, net of transaction fees. During the year ended December 31, 2021, net cash inflow from financing activities primarily related to proceeds of $500.0 million from the investment in Farfetch China by Alibaba and Richemont.
Indebtedness
During the year ended December 31, 2020, we raised $1,250.0 million through the February 2020, April 2020 and November 2020 Notes. The February 2020 Notes were settled as of December 31, 2022.
During the year ended December 31, 2022 we raised $400.0 million through the Term Loan. For further details, refer to Note 20 – Borrowings and embedded derivatives, within our Consolidated financial statements included elsewhere in this Annual Report.
101
Share-Based Payments
Employees receive remuneration in the form of share-based payments in the form of either equity or cash settled depending on the scheme. For further details, refer to Note 2.3(p), Summary of significant accounting policies – Share-based payments, within our Consolidated financial statements included elsewhere in this Annual Report.
Liquidity and Capital Resources for the Year Ended December 31, 2020 and 2021
For information regarding our liquidity and capital resources for the years ended December 31, 2020 and 2021, refer to pages 95 through 99 of our 2021 Annual Report filed with the SEC on March 4, 2022.
C. Research and Development, Patents and Licenses, etc.
Refer to Note 9, Material gain or loss and Note 2, Significant accounting policies - Intangible assets within our Consolidated financial statements included elsewhere in this Annual Report.
D. Trend Information
Other than as disclosed elsewhere in this Annual Report, we are not aware of any trends, uncertainties, demands, commitments or events that are reasonably likely to have a material effect on our revenues, income, profitability, liquidity or capital resources, or that would cause our disclosed financial information to be not necessarily indicative of our future operating results or financial condition or of any material recent trends in production, sales and inventory, and costs and selling prices, in each case since December 31, 2022.
E. Critical Accounting Estimates
Our Consolidated financial statements are prepared in accordance with IFRS, as issued by the IASB. In preparing our Consolidated financial statements, we make assumptions, judgments and estimates that can have a significant impact on amounts reported in our Consolidated financial statements. We base our assumptions, judgments and estimates on historical experience and various other factors that we believe to be reasonable under the circumstances. Actual results could differ materially from these estimates under different assumptions or conditions. We regularly re-evaluate our assumptions, judgments and estimates. Our critical accounting estimates and judgments are described in Note 3, Critical accounting judgments and key sources of estimation uncertainty, within our Consolidated financial statements included elsewhere in this Annual Report.
Reconciliations of Non-IFRS and Other Financial and Operating Metrics
We have included in this Annual Report certain financial measures not based on IFRS, including Adjusted EBITDA, Adjusted EBITDA Margin, Adjusted EPS, Adjusted Revenue, Digital Platform Order Contribution, Digital Platform Order Contribution Margin and constant currency information (together, the “Non-IFRS Measures”), as well as operating metrics, including GMV, Digital Platform GMV, Brand Platform GMV, In-Store GMV, Active Consumers and AOV. See the definitions set forth below for a further explanation of these terms.
Management uses the Non-IFRS Measures:
102
The Non-IFRS Measures may not be comparable to similar measures disclosed by other companies because not all companies and analysts calculate these measures in the same manner. We present the Non-IFRS Measures because we consider them to be important supplemental measures of our performance, and we believe they are frequently used by securities analysts, investors and other interested parties in the evaluation of companies. Management believes that investors’ understanding of our performance is enhanced by including the Non-IFRS Measures as a reasonable basis for comparing our ongoing results of operations. Many investors are interested in understanding the performance of our business by comparing our results from ongoing operations period over period and would ordinarily add back non-cash expenses such as depreciation, amortization and items that are not part of normal day-to-day operations of our business. By providing the Non-IFRS Measures, together with reconciliations to IFRS, we believe we are enhancing investors’ understanding of our business and our results of operations, as well as assisting investors in evaluating how well we are executing our strategic initiatives.
Items excluded from the Non-IFRS Measures are significant components in understanding and assessing financial performance. The Non-IFRS Measures have limitations as analytical tools and should not be considered in isolation, or as an alternative to, or a substitute for profit/(loss) after tax, revenue or other financial statement data presented in our Consolidated financial statements as indicators of financial performance. Some of the limitations are:
Due to these limitations, Adjusted EBITDA, Adjusted EBITDA Margin and Adjusted Revenue should not be considered as measures of discretionary cash available to us to invest in the growth of our business and are in addition to, not a substitute for or superior to, measures of financial performance prepared in accordance with IFRS. In addition, the Non-IFRS Measures we use may differ from the non-IFRS financial measures used by other companies and are not intended to be considered in isolation or as a substitute for the financial information prepared and presented in accordance with IFRS. Furthermore, not all companies or analysts may calculate similarly titled measures in the same manner. We compensate for these limitations by relying primarily on our IFRS results and using the Non-IFRS Measures only as supplemental measures.
Digital Platform Order Contribution and Digital Platform Order Contribution Margin are not measurements of our financial performance under IFRS and do not purport to be alternatives to gross profit or profit/(loss) after tax derived in accordance with IFRS. We believe that Digital Platform Order Contribution and Digital Platform Order Contribution Margin are useful measures in evaluating our operating performance within our industry because they permit the evaluation of our digital platform productivity, efficiency and performance. We also believe that Digital Platform Order Contribution and Digital Platform Order Contribution Margin are useful measures in evaluating our operating performance because they take into account demand generation expense and are used by management to analyze the operating performance of our digital platform for the periods presented.
103
The following table reconciles Adjusted EBITDA and Adjusted EBITDA Margin to the most directly comparable IFRS financial measures, which are (loss)/profit after tax and (loss)/profit after tax margin:
|
|
Year Ended December 31, |
|
|||||||||
|
|
2020 |
|
|
2021 |
|
|
2022 |
|
|||
|
|
(in thousands) |
|
|||||||||
(Loss)/profit after tax |
|
$ |
(3,315,623 |
) |
|
$ |
1,470,611 |
|
|
$ |
344,855 |
|
Net finance expense |
|
|
66,595 |
|
|
|
73,842 |
|
|
|
110,188 |
|
Income tax expense/(benefit) |
|
|
(14,434 |
) |
|
|
3,002 |
|
|
|
(3,523 |
) |
Depreciation and amortization |
|
|
217,223 |
|
|
|
251,198 |
|
|
|
332,775 |
|
Share-based payments (1) |
|
|
291,633 |
|
|
|
196,167 |
|
|
|
244,856 |
|
Losses/(gains) on items held at fair value and remeasurements (2) |
|
|
2,643,573 |
|
|
|
(2,023,743 |
) |
|
|
(1,298,612 |
) |
Other items (3) |
|
|
24,267 |
|
|
|
18,730 |
|
|
|
34,082 |
|
Impairment losses on tangible assets |
|
|
2,991 |
|
|
|
- |
|
|
|
19,945 |
|
Impairment losses on intangible assets |
|
|
36,269 |
|
|
|
11,779 |
|
|
|
116,787 |
|
Share of results of associates |
|
|
74 |
|
|
|
52 |
|
|
|
(68 |
) |
Adjusted EBITDA |
|
$ |
(47,432 |
) |
|
$ |
1,638 |
|
|
$ |
(98,715 |
) |
Revenue |
|
$ |
1,673,922 |
|
|
$ |
2,256,608 |
|
|
$ |
2,316,680 |
|
(Loss)/profit after tax margin |
|
(198.1)% |
|
|
|
65.2 |
% |
|
14.9% |
|
||
Adjusted Revenue |
|
$ |
1,460,694 |
|
|
$ |
1,924,104 |
|
|
$ |
1,995,027 |
|
Adjusted EBITDA Margin |
|
(3.2)% |
|
|
|
0.1 |
% |
|
(4.9)% |
|
||
The following table reconciles Adjusted Revenue to the most directly comparable IFRS financial performance measure, which is revenue:
|
|
Year ended December 31, |
|
|||||||||
|
|
2020 |
|
|
2021 |
|
|
2022 |
|
|||
|
|
(in thousands) |
|
|||||||||
Revenue |
|
$ |
1,673,922 |
|
|
$ |
2,256,608 |
|
|
$ |
2,316,680 |
|
Less: Digital Platform Fulfilment Revenue |
|
|
(213,228 |
) |
|
|
(332,504 |
) |
|
|
(321,653 |
) |
Adjusted Revenue |
|
$ |
1,460,694 |
|
|
$ |
1,924,104 |
|
|
$ |
1,995,027 |
|
The following table reconciles Digital Platform Order Contribution and Digital Platform Order Contribution Margin to the most directly comparable IFRS financial performance measures, which are Digital Platform Gross Profit and Digital Platform Gross Profit Margin:
|
Year ended December 31, |
|
||||||||||
|
|
2020 |
|
|
2021 |
|
|
2022 |
|
|||
|
|
(in thousands) |
|
|||||||||
Digital Platform Gross Profit |
|
$ |
560,206 |
|
|
$ |
730,253 |
|
|
$ |
726,589 |
|
Less: Demand generation expense |
|
|
(198,787 |
) |
|
|
(291,821 |
) |
|
|
(272,009 |
) |
Digital Platform Order Contribution |
|
$ |
361,419 |
|
|
$ |
438,432 |
|
|
$ |
454,580 |
|
Digital Platform Services Revenue |
|
$ |
1,033,156 |
|
|
$ |
1,385,678 |
|
|
$ |
1,419,721 |
|
Digital Platform Gross Profit Margin |
|
54.2% |
|
|
|
52.7 |
% |
|
51.2% |
|
||
Digital Platform Order Contribution Margin |
|
35.0% |
|
|
|
31.6 |
% |
|
32.0% |
|
||
104
The following table reconciles Adjusted EPS to the most directly comparable IFRS financial performance measure, which is Earnings per share:
|
Year ended December 31, |
|
||||||||||
|
|
2020 |
|
|
2021 |
|
|
2022 |
|
|||
|
|
|
|
|||||||||
Basic (loss)/earnings per share |
|
$ |
(9.69 |
) |
|
$ |
4.02 |
|
|
$ |
0.93 |
|
Share-based payments (1) |
|
|
0.85 |
|
|
|
0.54 |
|
|
|
0.64 |
|
Amortization of acquired intangible assets |
|
|
0.36 |
|
|
|
0.36 |
|
|
|
0.44 |
|
Losses/(gains) on items held at fair value and remeasurements (2) |
|
|
7.69 |
|
|
|
(5.55 |
) |
|
|
(3.37 |
) |
Other items (3) |
|
|
0.07 |
|
|
|
0.05 |
|
|
|
0.09 |
|
Impairment losses on tangible assets |
|
|
0.01 |
|
|
|
- |
|
|
|
0.05 |
|
Impairment losses on intangible assets |
|
|
0.11 |
|
|
|
0.03 |
|
|
|
0.30 |
|
Adjusted loss per share |
|
$ |
(0.60 |
) |
|
$ |
(0.55 |
) |
|
$ |
(0.92 |
) |
The following table represents (losses)/gains on items held at fair value and remeasurements:
|
Year ended December 31, |
|
||||||||||
|
|
2020 |
|
|
2021 |
|
|
2022 |
|
|||
|
(in thousands) |
|
||||||||||
Fair value remeasurements: |
|
|
|
|
|
|
|
|
|
|||
$250 million 5.00% Notes due 2025 embedded derivative |
|
|
(978,254 |
) |
|
|
484,529 |
|
|
|
90,682 |
|
$400 million 3.75% Notes due 2027 embedded derivative |
|
|
(1,103,944 |
) |
|
|
724,690 |
|
|
|
482,505 |
|
$600 million 0.00% Notes due 2030 embedded derivative |
|
|
(272,522 |
) |
|
|
429,618 |
|
|
|
93,841 |
|
Fair value remeasurement of minority investment |
|
|
- |
|
|
|
- |
|
|
|
(7,225 |
) |
Loss on disposal of investment carried at FVTPL |
|
|
- |
|
|
|
- |
|
|
|
(178 |
) |
Fair value remeasurement of previously held equity interest |
|
|
- |
|
|
|
784 |
|
|
|
- |
|
|
|
|
|
|
|
|
|
|
|
|||
Present value remeasurements: |
|
|
|
|
|
|
|
|
|
|||
Chalhoub put option |
|
|
(287,927 |
) |
|
|
156,072 |
|
|
|
174,582 |
|
CuriosityChina call option |
|
|
(926 |
) |
|
|
- |
|
|
|
- |
|
Palm Angels put call option and earn-out |
|
|
- |
|
|
|
(14,190 |
) |
|
|
42,409 |
|
Alibaba and Richemont put option |
|
|
- |
|
|
|
246,105 |
|
|
|
426,140 |
|
Alanui put option |
|
|
- |
|
|
|
(3,865 |
) |
|
|
(4,144 |
) |
(Losses)/gains on items held at fair value and remeasurements |
|
$ |
(2,643,573 |
) |
|
$ |
2,023,743 |
|
|
$ |
1,298,612 |
|
|
|
|
|
|
|
|
|
|
|
|||
Farfetch share price (end of day) |
|
$ |
63.81 |
|
|
$ |
33.43 |
|
|
$ |
4.73 |
|
The following table represents other items:
|
Year ended December 31, |
|
||||||||||
|
|
2020 |
|
|
2021 |
|
|
2022 |
|
|||
|
|
(in thousands) |
|
|||||||||
Transaction-related legal and advisory expenses |
|
$ |
(24,598 |
) |
|
$ |
(18,596 |
) |
|
$ |
(29,171 |
) |
Loss on impairment of investments carried at fair value |
|
|
(235 |
) |
|
|
(134 |
) |
|
|
(65 |
) |
Restructuring |
|
|
- |
|
|
|
- |
|
|
|
(4,846 |
) |
Other |
|
|
566 |
|
|
|
- |
|
|
|
- |
|
Other items |
|
$ |
(24,267 |
) |
|
$ |
(18,730 |
) |
|
$ |
(34,082 |
) |
105
"Constant currency" means translating current period financial data at the prior year average exchange rates applicable to the local currency in which the transactions are denominated.
The following table reconciles revenue at constant currency to the most directly comparable IFRS financial performance measure, which is revenue:
(in $ thousands, except as otherwise noted) |
|
|
|
|
|
|
|
|
|
|
|
|
|
|
|
|||||
|
|
Year ended December 31, 2022 |
|
|||||||||||||||||
|
|
Digital Platform Services |
|
|
Digital Platform Fulfilment Revenue |
|
|
Brand Platform |
|
|
In-Store |
|
|
Total |
|
|||||
|
|
|
|
|
|
|
|
|
|
|
|
|
|
|
|
|||||
Revenue |
|
$ |
1,419,721 |
|
|
$ |
321,653 |
|
|
$ |
477,146 |
|
|
$ |
98,160 |
|
|
$ |
2,316,680 |
|
Foreign exchange impact |
|
|
104,754 |
|
|
|
23,242 |
|
|
|
69,000 |
|
|
|
11,485 |
|
|
|
208,482 |
|
Revenue at constant currency |
|
$ |
1,524,475 |
|
|
$ |
344,895 |
|
|
$ |
546,146 |
|
|
$ |
109,645 |
|
|
$ |
2,525,162 |
|
|
|
|
|
|
|
|
|
|
|
|
|
|
|
|
|
|||||
Revenue growth |
|
|
2.5 |
% |
|
|
(3.3 |
%) |
|
|
2.1 |
% |
|
|
38.4 |
% |
|
|
2.7 |
% |
Foreign exchange impact on revenue growth |
|
|
7.5 |
% |
|
|
7.0 |
% |
|
|
14.7 |
% |
|
|
16.2 |
% |
|
|
9.2 |
% |
Revenue growth at constant currency |
|
|
10.0 |
% |
|
|
3.7 |
% |
|
|
16.8 |
% |
|
|
54.6 |
% |
|
|
11.9 |
% |
Our financial information is presented in U.S. dollars, which differs from the underlying functional currencies of certain of our subsidiaries (including New Guards, whose functional currency is the euro), exposing us to foreign exchange translation risk on consolidation. This risk is currently not hedged and therefore our results of operations have in the past, and will in the future, fluctuate due to movements in exchange rates when currencies are translated into U.S. dollars.
At a subsidiary level we are also exposed to transactional foreign exchange risk because we earn revenues and incur expenses in a number of different foreign currencies relative to the relevant subsidiary’s functional currency, mainly the pound sterling and the euro. Movements in exchange rates therefore impact our subsidiaries and thus, our consolidated results and cash flows. We hedge a portion of our core transactional exposures using forward foreign exchange contracts and foreign exchange option contracts; however, we are exposed to fluctuations in exchange rates on the unhedged portion of the exposures.
106
Item 6. Directors, Senior Management and Employees
A. Directors and Senior Management
Executive Officers and Board Members
The following table presents information about our current executive officers and members of our Board of Directors, including their ages as of January 31, 2023:
Name |
|
Age |
|
Position |
Executive Officers |
|
|
|
|
José Neves (4) |
|
48 |
|
Chief Executive Officer and Chairman of the Board |
Elliot Jordan |
|
47 |
|
Chief Financial Officer |
Stephanie Phair |
|
44 |
|
Group President |
Board Members |
|
|
|
|
Dana Evan (1)(2)(4) |
|
63 |
|
Board Member |
J. Michael Evans |
|
65 |
|
Board Member |
Stephanie Horton (4) |
|
51 |
|
Board Member |
Diane Irvine (1)(3) |
|
64 |
|
Board Member |
Victor Luís (1)(3) |
|
56 |
|
Board Member |
David Rosenblatt (2)(3) |
|
54 |
|
Board Member |
Gillian Tans (1)(2) |
|
52 |
|
Board Member |
The current business address for our executive officers and members of our Board of Directors is c/o Farfetch Limited, The Bower, 211 Old Street, London EC1V 9NR, United Kingdom.
Executive Officers
José Neves is our founder and has served as our Chief Executive Officer since 2008. He is also Chairman of our Board. Mr. Neves has been involved in luxury fashion since the mid-1990s when he launched the footwear business SWEAR. Mr. Neves later founded SIX London, and in 2001, Mr. Neves opened the B-Store, which won the British Fashion Award for Retailer of the Year in 2006. Mr. Neves served as a non-executive director on the board of directors of the British Fashion Council from 2016 to 2018. Mr. Neves currently serves on the board of directors of several private companies. Mr. Neves studied Economics at the Universidade do Porto in Portugal.
Elliot Jordan has served as our Chief Financial Officer since 2015. Prior to joining us, Mr. Jordan was Director of Finance at ASOS.com, before which he held various senior finance roles at J Sainsbury plc. Mr. Jordan is a non-executive board member and chair of the audit committee at HM Land Registry. Mr. Jordan holds a degree from the University of Waikato and is a qualified chartered accountant with the Chartered Accountants of Australia and New Zealand. In February 2023 we announced that Mr. Jordan will step down from his role of Chief Financial Officer by the end of 2023.
Stephanie Phair has served as our Group President since August 2022, prior to which she served as our Chief Customer Officer from August 2019 to August 2022 and our Chief Strategy Officer from November 2016 to August 2019. Ms. Phair was previously founder and President of TheOutnet.com and was part of the executive team of the Net-a-Porter Group from 2009 to 2015. She has more than twenty years of luxury and e-commerce experience, having worked for Issey Miyake, American Vogue and at Portero in New York. She has consulted with a number of start-ups in the digital space and advised private equity firms on investments. She is also an advisor for venture capital firm Felix Capital and sits on the board of Hedosophia. Ms. Phair served on the board of Moncler S.p.A. from May 2016 until April 2022 and was Chairman of the British Fashion Council for over four years until September 2022. Ms. Phair holds an MA in Politics, Philosophy and Economics from Oxford University and speaks four languages. Ms. Phair was awarded an OBE in the 2022 Queen's Birthday Honours for her services to fashion and technology.
107
Board Members
Biographical information for José Neves, our Chief Executive Officer and Chairman of the Board of Directors, may be found above in the section entitled “Executive Officers”.
Dana Evan has served as a non-executive Director since April 2015. Ms. Evan has invested in and served on the board of companies in the internet, technology and media sectors since 2007. Between 1996 and 2007, Ms. Evan served as Chief Financial Officer of VeriSign, Inc. Between 2013 and 2020, Ms. Evan served as a venture partner at Icon Ventures. Ms. Evan brings over twenty-five years of executive leadership experience in global finance and operations management in the technology and media sectors. Ms. Evan currently serves on the board and audit committee of Momentive Inc. (formerly known as Survey Monkey Inc.) and the board, audit committee, and nominating and corporate governance committee of Box, Inc. Ms. Evan also served on the board, audit committee and compensation committee of Domo Inc. during 2023, but is due to step down from this board and its committees with effect from March 2023. Ms. Evan also previously served on the board of directors of Proofpoint, Inc. from 2008 until it was acquired by Thoma Bravo in September 2021, Criteo S.A. from 2013 to 2017, Fusion-IO, Inc. from 2011 until it was acquired by SanDisk in August 2014, Everyday Health Inc. until it was acquired by Ziff Davis, LLC in December 2016, and Omniture, Inc., until it was acquired by Adobe Systems Inc. in 2009. In 2019, Ms. Evan was selected as the Director of the Year by the National Association of Corporate Directors. Ms. Evan holds a B.S. degree in Commerce from the University of Santa Clara and is a Certified Public Accountant (inactive).
J. Michael Evans has served as a non-executive Director since December 2020. Mr. Evans has been the President of Alibaba since September 2015 and has served on its board of directors since September 2014. Prior to this, Mr. Evans served as Vice Chairman of The Goldman Sachs Group, Inc. from February 2008 until his retirement in December 2013. From 2004 to 2013, Mr. Evans served as Goldman Sachs's Chairman of Asia Operations and was its Global Head of Growth Markets from January 2011 to December 2013. He also Co-Chaired the business standards committee of Goldman Sachs from 2010 to 2013. Mr. Evans joined Goldman Sachs in 1993, became a Partner of the firm in 1994 and held various leadership positions within the firm’s securities business while based in New York and London, including Global Head of Equity Capital Markets, Global Co-Head of the Equities Division, and Global Co-Head of the securities business. He is a board member of City Harvest, a Trustee of the Asia Society, a member of the advisory council for the Bendheim Center for Finance at Princeton University, and in August 2014, he joined the board of Barrick Gold Corporation, where he currently serves on the audit & risk committee. Mr. Evans also previously served on the board of directors of Smartrac N.V. from November 2018 until March 2020. Mr. Evans received his bachelor’s degree in politics from Princeton University in 1981.
Stephanie Horton has served as a non-executive Director since August 2020. A twenty-five-year veteran of the luxury fashion and marketing communities, Ms. Horton brings extensive experience in delivering creative marketing solutions for global brands. Ms. Horton has served as the Director of Marketing for Google Shopping since August 2020. Previously, Ms. Horton served as a consultant Chief Executive Officer at Hemp Tailor, a designer of sustainable hemp clothing. From October 2017 to December 2019, Ms. Horton served as Chief Strategy Officer at Alexander Wang, where she was responsible for building international strategic partnerships for business growth opportunities as well as overseeing a range of strategic global functions. Prior to this, Ms. Horton served as Chief Marketing Officer at Farfetch Limited from 2013 to 2017. Ms. Horton also served as the Head of Global Communications and Brand Marketing at Shopbop.com from 2011 to 2013, as Executive Director of Creative Services at Vogue Magazine from 2006 to 2011 and as Director, Marketing Services at The New York Times Company, from 2001 to 2005. Ms. Horton also currently serves on the board of several private companies. Ms. Horton is also the joint co-founder of Fashion Tech Connects, an initiative created to increase the number of women of color in fashion and tech positions. Ms. Horton holds a degree from the University of Michigan and an MBA from DePaul University Kellstadt Graduate School of Business.
108
Diane M. Irvine has served as a non-executive Director since August 2020. Ms. Irvine previously served as Chief Executive Officer of Blue Nile, Inc., an online retailer of diamonds and fine jewelry, from 2008 to 2011, and as President from 2007 to 2008. Ms. Irvine also served as the Chief Financial Officer of Blue Nile, Inc. from 1999 to 2007. Between 1994 and 1999, Ms. Irvine served as Vice President and Chief Financial Officer of Plum Creek Timber Company, Inc. and, from 1981 to 1994, Ms. Irvine served in various capacities, most recently as a Partner, at Coopers & Lybrand LLP. Ms. Irvine has also previously served on the board of directors of the XO Group, Inc. until its merger with WeddingWire in 2018 and Casper Sleep Inc. until it was acquired by Durational Capital Management, LP in January 2022. Ms. Irvine currently serves on the board and audit committees of Funko, Inc. and Yelp Inc. Ms. Irvine also serves on the boards of several private companies. Ms. Irvine holds a B.S. in Accounting from Illinois State University and an M.S. in Taxation and a Doctor of Humane Letters from Golden Gate University.
Victor Luís has served as a non-executive Director since August 2020. Mr. Luís brings extensive luxury fashion experience to our Board, with prior roles in luxury companies in key regions, including Asia-Pacific, particularly China and Japan, and North America. From January 2014 to September 2019, Mr. Luís served as the Chief Executive Officer and on the board of directors of Tapestry, Inc. (formerly known as Coach, Inc.), a multinational luxury fashion company, where he led the transformation into Tapestry Inc., a New York-based house of modern luxury brands including Coach, Kate Spade and Stuart Weitzman. Previously, Mr. Luís served in a variety of leadership roles with increasing responsibility at Coach, Inc., beginning as President and Chief Executive Officer of Coach Japan in 2006, and rapidly assumed additional leadership responsibilities globally, progressing to President and Chief Commercial Officer of Coach, Inc. in 2013. Prior to joining Coach, Inc., from 2002 to 2006, Mr. Luís was President and Chief Executive Officer of Baccarat, Inc., where he ran the North American operation of the French luxury brand. Mr. Luís joined the Moët Hennessy Louis Vuitton Group in 1995, ultimately advancing to President and Chief Executive Officer of its subsidiary, Givenchy Japan Incorporated, before leaving in 2002. Mr. Luís currently serves on the board of directors and the talent & compensation committee of Deckers Outdoor Corporation and is an investor in and advisor to several private companies. Mr. Luís holds a B.A. degree from the College of the Holy Cross in Massachusetts and an M.A. in International Economics from Durham University.
David Rosenblatt has served as a non-executive Director since May 2017. Since 2011, Mr. Rosenblatt has served as the Chief Executive Officer of 1stdibs.com, Inc. and also serves on its board of directors. From 2004 to 2008, Mr. Rosenblatt served as the Chief Executive Officer of DoubleClick. Following the sale of DoubleClick to Google in 2007, Mr. Rosenblatt served as Google’s President of Display Advertising until 2009. Mr. Rosenblatt currently serves on the board of directors of 1stdibs.com, Inc. and IAC (formerly known as InterActiveCorp.), where he is the Chairman of the compensation committee. He has previously served on the board of Twitter, Inc. from December 2010 to October 2022. Mr. Rosenblatt has a degree from Yale University and an MBA from the Stanford University Graduate School of Business.
Gillian Tans has served as a non-executive Director since August 2020. Ms. Tans has served as President of VanMoof since May 2022. Previously, Ms. Tans served as Chairwoman of Booking.com, an online worldwide travel agency and the largest brand of Booking Holdings Inc., from June 2019 to July 2021. Prior to that, Ms. Tans served as the President and as the Chief Executive Officer of Booking.com, where she was responsible for overseeing all of Booking.com’s functional departments and operations, from January 2015 and April 2016, respectively, until June 2019. Ms. Tans served as Booking.com’s Chief Operating Officer from September 2011 to April 2016 and as Booking.com’s Director of Hotels & Content from 2002 to 2011. Before joining Booking.com, Ms. Tans served in a variety of roles with increasing responsibility at the Golden Tulip Worldwide hotel group, where she served as Product Manager, Marketing Manager and Director of Sales. Ms. Tans has also worked for the Intercontinental Hotel Group and with a number of independent hotels. Ms. Tans began her career at Hershey Entertainment and Resorts. Ms. Tans also currently serves on the boards of multiple private companies.
109
Director Nomination and Appointment Rights
In connection with Alibaba’s purchase of the November 2020 Notes, Alibaba nominated J. Michael Evans, Alibaba’s President, to serve on our Board, and Alibaba and José Neves, amongst others, entered into a commitment agreement, pursuant to which Mr. Neves agreed to exercise all voting rights held directly or indirectly by him in favor of any shareholder resolution proposing to appoint Mr. Evans, or another designated Alibaba senior executive as a Director on our Board. This obligation is conditional on Alibaba continuing to hold not less than 75% (based on its aggregate interest in us and Farfetch China) of its initial interest in us immediately following completion of the Farfetch China joint venture.
In August 2022, in connection with the previously announced transactions with Richemont, we, José Neves, TGF Participations Limited ("TGF") and Richemont entered into a voting commitment deed pursuant to which, among other things, subject to Farfetch having acquired 100% of YNAP and subject to Richemont continuing to hold at least 10% of the total issued share capital of the Company, we have granted Richemont the right to nominate, from time to time, an independent person for appointment to the Board of the Company.
B. Compensation
Compensation
We set out below the amount of compensation paid and benefits in kind provided by us or our subsidiaries to our executive officers and members of our Board of Directors for services in all capacities to us or our subsidiaries for the year ended December 31, 2022, as well as the amount contributed by us or our subsidiaries to retirement benefit plans for our executive officers and members of our Board of Directors.
Executive Officer and Board Member Compensation
The compensation for each of our executive officers is comprised of the following elements: base salary, an annual incentive tied to achievement of Company and individual performance, contractual benefits and pension contributions; except that our Chief Executive Officer does not receive a base salary. Total cash compensation paid and benefits in kind provided to our executive officers and members of our Board of Directors for the year ended December 31, 2022 was $4,212,329. In addition, our executive officers and members of our Board of Directors were granted an aggregate of 1,539,818 shares (equivalent to a value of $11,064,257, based on the accounting fair value as of the grant date), comprised of restricted stock units and shares subject to stock options, in the year ended December 31, 2022 pursuant to the 2018 Farfetch Employee Equity Plan (as defined below). The exercise price of the stock options granted to our executive officers and members of our Board of Directors during the year ended December 31, 2022 was $23.18-$30.13. These stock options are subject to varying vesting schedules over a multi-year period.
In addition, in May 2021 Mr. Neves was granted a long-term incentive grant of performance-based restricted stock units which vest over an eight-year period based on the achievement of certain stock price hurdles (the “CEO PSU Grant”). The grant was for 8,440,000 performance-based restricted stock units and had a fair value upon grant of $99 million. As of December 31, 2022, zero performance-based restricted stock units had vested based on the achievement of the specified stock price hurdle goals.
In connection with the CEO PSU Grant, Mr. Neves also entered into a letter agreement pursuant to which he agreed to waive any cash and equity incentive compensation (other than the CEO PSU Grant) from 2021 through December 31, 2028.
As of December 31, 2022, excluding the CEO PSU Grant, our executive officers and members of our Board of Directors held 11,591,168 stock options on the Group’s Class A ordinary shares; with exercise prices ranging from $3.60 to $61.27 and expiration dates ranging from May 2026 to February 2032. These options were granted by the Company pursuant to the 2015 LTIP and 2018 Plan (each defined below). We have not set aside or accrued any amounts to provide pension, retirement or similar benefits to our executive officers or members of our Board of Directors.
110
Long-Term Incentive Plans
Farfetch.com Limited Share Option Scheme
The Farfetch.com Limited Share Option Scheme (the “Share Option Plan”) allows for the grant of options to purchase Class A ordinary shares to eligible Directors or employees. The Share Option Plan is administered by our Board of Directors whose decisions on all disputes and matters concerning the interpretation of the rules are final. Options granted under the Share Option Plan are governed by the rules of the Share Option Plan and an option agreement entered into with each participant. The options generally vest over four years from the date of grant of the option, subject to the participant’s continued employment by us. The Share Option Plan is closed to any new grants.
Farfetch.com Limited 2015 Long-Term Incentive Plan
The Farfetch.com Limited 2015 Long-Term Incentive Plan (the “LTIP”) allows for the grant of options to purchase Class A ordinary shares, restricted shares and linked awards to eligible Directors or employees of Farfetch or its subsidiaries. The LTIP is administered by our Board of Directors whose decisions on all disputes and matters concerning the interpretation of the rules are final. No restricted shares have been granted under the LTIP. Options granted pursuant to the LTIP vest over four years subject to the participant’s continued employment by us. The LTIP is closed to any new grants.
Pursuant to the LTIP, we entered into linked award deeds (the “Linked Award Deeds”) with certain employees, which provide the employee with the simultaneous award of an option to purchase ordinary shares and the issuance of restricted linked Class A ordinary shares (together, a “Linked Award”). The restricted linked Class A ordinary shares are not transferable.
The restricted linked ordinary shares converted into restricted Class A ordinary shares immediately prior to our initial public offering (“IPO”) in September 2018. On each occasion that an employee proposes to realize the Linked Awards, a formula (as set out in the applicable Linked Award Deed) is applied to calculate how many linked shares will cease to be subject to restrictions on transfer to deliver to the employee the “in-the-money value” of the Linked Award (i.e., the market value of our Class A ordinary shares less the exercise price). If the in-the-money value of the vested Linked Award is delivered by the release of linked shares, the options purported to be exercised will lapse. To the extent an employee does not hold a sufficient number of linked shares to deliver the in-the-money value of the Linked Award being exercised, then the remaining option will be exercised over Class A ordinary shares.
Additional Individual Option Schemes
We previously entered into letter agreements with certain employees in connection with the acquisition of Fashion Concierge UK Limited (“the Fashion Concierge letter agreements”) on October 31, 2017, as subsequently amended in August 2019. Pursuant to such letter agreements, certain employees received a grant of our shares. No further shares will be issued pursuant to the Fashion Concierge letter agreements.
2018 Farfetch Employee Equity Plan
We adopted the 2018 Farfetch Employee Equity Plan (the “2018 Plan”), under which we may grant cash and equity-based incentive awards to our eligible employees, consultants and Directors. The 2018 Plan is administered by our Board of Directors with respect to awards to non-employee Directors and by the Compensation Committee with respect to other participants, each of which may delegate its duties and responsibilities to committees of our Directors and/or officers (referred to collectively as the “Plan Administrator,” below), subject to certain limitations that may be imposed under stock exchange rules.
The 2018 Plan provides for the grant of share options, including incentive share options (“ISOs”) and nonqualified share options (“NSOs”) restricted shares, dividend equivalents, share payments, restricted share units (“RSUs”), performance shares, other incentive awards, share appreciation rights (“SARs”) and cash awards. All awards under the 2018 Plan will be set forth in award agreements, which will detail all terms and conditions of the awards, including any applicable vesting and payment terms and post-termination exercise limitations. Awards other
111
than cash awards generally will be settled in Class A ordinary shares, but the Plan Administrator may provide for cash settlement of any award.
Individual award agreements may also provide for additional accelerated vesting and payment provisions. All awards will be subject to the provisions of any claw back policy implemented by us to the extent set forth in such claw back policy and/or in the applicable award agreement.
UK Sub-plan
The Farfetch Employee Equity Sub-plan for UK employees (the “UK Sub-plan”) is a sub-plan to the 2018 Plan for employees who are residents of the United Kingdom. The UK Sub-plan does not increase the share reserve under the 2018 Plan.
French Sub-plan
Our Compensation Committee approved the 2018 Farfetch Employee Equity Plan French Sub-plan for French employees on December 21, 2021 (the “French Sub-plan”). The French Sub-plan is a sub-plan to the 2018 Plan which allows for the grant of RSU awards in a tax-efficient manner to employees who are residents of France. The French Sub-plan does not increase the share reserve under the 2018 Plan.
Indemnification
Our executive officers and Board members have the benefit of indemnification provisions in our Articles. Our Articles provide that our Board and officers shall be indemnified from and against all liability which they incur in execution of their duties in their respective offices, except liability incurred by reason of such Director’s or officer’s dishonesty, willful default or fraud.
Insofar as indemnification of liabilities arising under the Securities Act may be permitted to executive officers and Board members or persons controlling us pursuant to the foregoing provisions, we have been informed that, in the opinion of the SEC, such indemnification is against public policy as expressed in the Securities Act and is therefore unenforceable.
C. Board Practices
Board of Directors
Our Board is currently composed of eight Directors, each of whom, other than Mr. Neves and Mr. Evans, has been determined by the Board to qualify as “independent” under the rules of the NYSE applicable to members of a board of directors. Mr. Neves serves as the Chairman of our Board. Directors can be appointed and removed and/or replaced by an ordinary resolution of the shareholders. In addition, Directors may be appointed either to fill a vacancy arising from the resignation of a former Director or as an addition to the existing Board by the affirmative vote of a simple majority of the Directors present and voting at a Board meeting, which shall include the affirmative vote of Mr. Neves for as long as he is a Director. Until all of our Class B ordinary shares are converted into Class A ordinary shares, each of our Directors holds office until his or her successor has been duly elected and qualified or until his or her earlier death, resignation or removal. Following such conversion, the Board of Directors will be divided into three classes, designated as Class I, Class II and Class III with the Directors of each class serving for terms expiring at the first, second and third annual general meetings following the conversion, respectively, and thereafter for three-year terms, in each case, until his or her successor has been duly elected and qualified or until his or her earlier death, resignation or removal.
Board Committee Composition
The Board has established an Audit Committee, a Compensation Committee, a Nominating and Corporate Governance Committee and an Environmental, Social and Governance Committee. Each of these committees is governed by a charter that is available on our website at www.farfetchinvestors.com. The information contained on our website is not incorporated by reference in this Annual Report.
112
Audit Committee
The Audit Committee currently consists of Ms. Evan, Ms. Irvine, Mr. Luís and Ms. Tans, with Ms. Irvine serving as Chair. Our Board has determined that each member of our Audit Committee is "financially literate," within the meaning of the NYSE rules and that each qualifies as independent under the NYSE rules applicable to audit committee members and under Rule 10A-3 of the Exchange Act applicable to audit committee members. Our Board has determined that each of Ms. Evan, Ms. Irvine and Mr. Luís qualifies as an “audit committee financial expert” as defined under Form 20-F and our Board has determined that the simultaneous service by Ms. Evan on the audit committees of three other public companies would not impair her ability to effectively serve on our Audit Committee.
The Audit Committee is responsible for, among other things:
The Audit Committee meets as often as one or more members of the Audit Committee deems necessary to carry out its duties, but in any event meets at least once during each fiscal quarter. The Audit Committee meets at least once per year with our independent registered public accounting firm, without our executive officers present.
Compensation Committee
The Compensation Committee currently consists of Ms. Evan, Mr. Rosenblatt and Ms. Tans, with Ms. Evan serving as Chair. Under applicable SEC and NYSE rules, there are heightened independence standards for members of the Compensation Committee. Our Board has determined that each of the members of our Compensation Committee qualifies as independent under the NYSE rules applicable to compensation committee members.
The Compensation Committee is responsible for, among other things:
113
The Compensation Committee meets as frequently as it deems necessary and advisable to carry out its duties.
Nominating and Corporate Governance Committee
The Nominating and Corporate Governance Committee currently consists of Ms. Irvine, Mr. Luís and Mr. Rosenblatt, with Mr. Luís serving as Chair.
The Nominating and Corporate Governance Committee is responsible for, among other things:
The Nominating and Corporate Governance Committee meets as frequently as it deems necessary and advisable to carry out its duties.
Environmental, Social and Governance Committee ("ESG")
The ESG Committee currently consists of Ms. Evan, Ms. Horton and Mr. Neves, with Ms. Horton serving as Chair.
The ESG Committee is responsible for, among other things:
114
The ESG Committee meets as frequently as it deems necessary and advisable to carry out its duties, but no fewer than three times each calendar year.
Duties of Board Members and Conflicts of Interest
Under Cayman Islands law, our Directors have a duty to act in good faith and in what they consider to be in our best interests. Our Directors are required to exhibit, in the performance of their duties, both the degree of skill that may reasonably be expected from a subjective perspective determined by reference to each such Director’s knowledge and experience, and the skill and care objectively to be expected from a person occupying office as a Director. In fulfilling their duty of care to Farfetch, our Directors must ensure compliance with our Articles. In certain limited circumstances, a shareholder has the right to seek damages if a duty owed by our Directors is breached.
Under our Articles, Directors who are in any way, whether directly or indirectly, interested in a contract or proposed contract with us must declare the nature of their interest at a meeting of the Board of Directors or by notice in writing to the members of the Board of Directors. If the majority of the Board of Directors determines that there is a conflict of any Director (or his or her affiliates) with our general business, then the Board of Directors may determine to exclude such Director from all further discussions of the Board of Directors and receipt of information, until such time as it is determined by the Board of Directors that the Director is no longer in such conflict. Subject to the foregoing, a Director may vote in respect of any contract or proposed contract notwithstanding his or her interest; provided that, in exercising any such vote, such Director’s duties remain as described above.
Executive Officer Employment Agreements and Board Member Service Agreements
Each of our executive officers currently has an employment agreement providing for employment for an indefinite period of time, subject to a six-month (in the case of Ms. Phair and Mr. Jordan) or twelve‑month (in the case of Mr. Neves) notice period upon termination of employment by either the executive or by us, other than terminations for gross misconduct.
We have entered into written service agreements with Ms. Evan and Mr. Rosenblatt, each of whom serves as a Director on our Board, providing for an indefinite period of service and the grant of equity awards. These agreements provide for a three-month notice period upon termination of service by either party (other than terminations for gross misconduct), but do not provide for any other benefits upon a termination of service. We have entered into written offer letters with Mr. Evans, Ms. Horton, Ms. Irvine, Mr. Luís and Ms. Tans, each of whom serves as a Director on our Board, providing for an indefinite period of service, and with the exception of Mr. Evans, cash and equity-based remuneration. These offer letters provide for termination of service in accordance with our Articles, but do not provide for any other benefits upon a termination of service.
Alternate Directors
Our Articles provide, as allowed by the Companies Act, that any Director may, with the prior consent of the Board of Directors, subject to the conditions set thereto, appoint a person as an alternate to act in his or her place. Unless the appointing Director limits the time or scope of the appointment of the Alternate Director, the appointment is effective for all purposes until the appointing Director ceases to be a Director or the appointing Director removes the Alternate Director.
115
D. Employees
Our People
As of December 31, 2022, we had a total of 6,728 employees, including 192 Browns, 246 Stadium Goods and 757 New Guards employees and excluding additional people working pursuant to freelance and consultancy contracts. The table below sets out the number of employees by geography.
Geography |
|
As of December 31, |
|
|
|
|
2022 |
|
|
Portugal |
|
|
3,342 |
|
United Kingdom |
|
|
1,179 |
|
Italy |
|
|
642 |
|
United States of America |
|
|
540 |
|
China |
|
|
487 |
|
Brazil |
|
|
136 |
|
United Arab Emirates |
|
|
99 |
|
Japan |
|
|
80 |
|
Hong Kong |
|
|
75 |
|
France |
|
|
38 |
|
Lithuania |
|
|
23 |
|
India |
|
|
22 |
|
Netherlands |
|
|
21 |
|
Mexico |
|
|
16 |
|
Russian Federation |
|
|
8 |
|
Switzerland |
|
|
7 |
|
Australia |
|
|
6 |
|
Canada |
|
|
4 |
|
Cyprus |
|
|
1 |
|
Israel |
|
|
1 |
|
Latvia |
|
|
1 |
|
Total |
|
|
6,728 |
|
116
As of December 31, 2022, approximately 31% of our workforce consisted of technology and product specialists. The remainder was focused on all other business areas, including marketing, operations, production and other commercial and support functions. The table below sets out the number of employees, by category, as of December 31, 2022, 2021 and 2020:
Department |
|
As of December 31, |
|
|
As of December 31, |
|
|
As of December 31, |
|
|||
|
|
2020 |
|
|
2021 |
|
|
2022 |
|
|||
Technology and Product |
|
|
1,629 |
|
|
|
1,912 |
|
|
|
2,062 |
|
Operations |
|
|
2,197 |
|
|
|
2,554 |
|
|
|
2,536 |
|
Marketing |
|
|
345 |
|
|
|
445 |
|
|
|
449 |
|
Commercial |
|
|
285 |
|
|
|
306 |
|
|
|
427 |
|
People |
|
|
197 |
|
|
|
245 |
|
|
|
252 |
|
Finance and Legal |
|
|
288 |
|
|
|
356 |
|
|
|
401 |
|
Data Department |
|
|
143 |
|
|
|
176 |
|
|
|
113 |
|
Other |
|
|
357 |
|
|
|
470 |
|
|
|
488 |
|
Total |
|
|
5,441 |
|
|
|
6,464 |
|
|
|
6,728 |
|
We believe that we maintain a good working relationship with our employees, and we have not experienced any significant labor disputes or any difficulty in recruiting staff for our operations. Our employees are not represented by any collective bargaining agreements or labor unions, other than our employees in Italy and France, where collective bargaining agreements are mandatory, and in Brazil who are represented by two state-level labor unions, as required by law.
For information regarding the share ownership of Directors and officers, refer to Item 7. “Major Shareholders and Related Party Transactions – A. Major Shareholders.” For information regarding our equity incentive plans, refer to Item 6. “Directors, Senior Management and Employees – B. Compensation – Long-Term Incentive Plans.”
Item 7. Major Shareholders and Related Party Transactions
The following table sets forth information relating to the beneficial ownership of our Class A ordinary shares and Class B ordinary shares as of February 14, 2023, for:
For further information regarding material transactions between us and our principal shareholders, see “Related Party Transactions” below.
The number of Class A ordinary shares and/or Class B ordinary shares beneficially owned by each entity, person, executive officer or Board member is determined in accordance with the rules of the SEC, and the information is not necessarily indicative of beneficial ownership for any other purpose. Under such rules, beneficial ownership includes any shares over which the individual has sole or shared voting power or investment power as well as any shares that the individual has the right to acquire within sixty days of February 14, 2023 through the exercise of any option, warrant or other right. Except as otherwise indicated, and subject to applicable community property laws, the persons named in the table have sole voting and investment power with respect to all Class A ordinary shares and/or Class B ordinary shares held by that person. As of February 14, 2023, there were 352,607,954 Class A ordinary shares outstanding and 42,858,080 Class B ordinary shares outstanding.
117
Unless otherwise indicated below, the address for each beneficial owner listed is c/o Farfetch Limited, The Bower, 211 Old Street, London EC1V 9NR, United Kingdom.
|
|
Class A ordinary shares |
|
|
Class B ordinary shares (1) |
|
|
|
|
|||||||||||
Name of beneficial owner |
|
Number |
|
|
Percent |
|
|
Number |
|
|
Percent |
|
|
Combined voting power (2) |
|
|||||
Holders of 5% or Greater |
|
|
|
|
|
|
|
|
|
|
|
|
|
|
|
|||||
Baillie Gifford (3) |
|
|
46,960,424 |
|
|
|
13.3 |
% |
|
- |
|
|
- |
|
|
|
3.9 |
% |
||
|
|
|
|
|
|
|
|
|
|
|
|
|
|
|
|
|||||
Executive Officers and Directors |
|
|
|
|
|
|
|
|
|
|
|
|
|
|
|
|||||
José Neves (4) |
|
|
7,033,606 |
|
|
|
2.0 |
% |
|
|
42,858,080 |
|
|
|
100 |
% |
|
|
71.1 |
% |
Elliot Jordan (5) |
|
|
1,512,824 |
|
|
* |
|
|
- |
|
|
- |
|
|
* |
|
||||
Stephanie Phair (6) |
|
|
1,223,783 |
|
|
* |
|
|
- |
|
|
- |
|
|
* |
|
||||
Dana Evan (7) |
|
|
614,885 |
|
|
* |
|
|
- |
|
|
- |
|
|
* |
|
||||
J. Michael Evans |
|
|
- |
|
|
* |
|
|
- |
|
|
- |
|
|
* |
|
||||
Stephanie Horton |
|
|
18,120 |
|
|
* |
|
|
- |
|
|
- |
|
|
* |
|
||||
Diane Irvine |
|
|
15,592 |
|
|
* |
|
|
- |
|
|
- |
|
|
* |
|
||||
Victor Luís |
|
|
15,369 |
|
|
* |
|
|
- |
|
|
- |
|
|
* |
|
||||
Gillian Tans |
|
|
15,418 |
|
|
* |
|
|
- |
|
|
- |
|
|
* |
|
||||
David Rosenblatt(8) |
|
|
905,160 |
|
|
* |
|
|
- |
|
|
- |
|
|
* |
|
||||
Officers and directors as a group (10 persons) (9) |
|
|
11,354,757 |
|
|
|
3.1 |
% |
|
|
42,858,080 |
|
|
|
100.0 |
% |
|
|
71.2 |
% |
* Indicates beneficial ownership of less than 1% of the total outstanding Class A ordinary shares.
Significant Changes
To our knowledge, other than as provided in the table above, our other filings with the SEC, public disclosure, including without limitation Schedule 13 filings, and this Annual Report, there has been no significant change in the percentage ownership held by any other major shareholder since January 1, 2020.
Registered Holders
As of February 14, 2023, there were 352,607,954 of Class A ordinary shares outstanding. To our knowledge, 344,238,866 Class A ordinary shares, representing 97.4% of our total outstanding Class A ordinary shares, were held by 11 record shareholders with a registered address in the United States.
Change of Control Arrangements
We are not aware of any arrangement that may at a subsequent date result in a change of control of Farfetch.
118
B. Related Party Transactions
The following includes, among other information, a description of related party transactions, as defined under Item 7.B of Form 20-F, since January 1, 2022.
Voting Commitment Deed with Richemont
José Neves, the founder, Chief Executive Officer and Chairman of our Board of Directors, also exercises voting and investment power over the securities held of record by TGF. In August 2022, in connection with the previously announced transactions with Richemont, we, Mr. Neves, TGF and Richemont entered into a voting commitment deed pursuant to which, amongst other things, (i) Mr. Neves has committed to the Company to vote in favor of certain matters relating to the transaction; (ii) Richemont has committed to the Company to vote in favor of certain matters, to the extent supported by Mr. Neves; and (iii) subject to Farfetch having acquired 100% of YNAP and subject to Richemont continuing to hold at least 10% of the total issued share capital of the Company, we have granted Richemont the right to nominate, from time to time, an independent person for appointment to the Board of the Company.
Relationship with Studio Clay
Ana Moura Neves, the daughter of Mr. Neves, the founder, Chief Executive Officer and Chairman of our Board of Directors, is the owner of Studio Clay. Mr. Neves does not hold any position at, or beneficial ownership interest in, Studio Clay.
E-Commerce Services Agreement and Browns Agreement
In March 2021, our subsidiary Farfetch UK Limited entered into an e-commerce services agreement with Studio Clay for the sale of baby clothing on the Farfetch Marketplace. Pursuant to the e-commerce services agreement, Studio Clay made sales on the Farfetch Marketplace of $11,266 during the year ended December 31, 2021 and $23,305 during the year ended December 31, 2022. Further, in February 2022 our subsidiary Browns (South Molton Street) LLC (“Browns”) entered into an agreement with Studio Clay for the purchase of baby clothing to be sold via Browns. Pursuant to the agreement, Browns purchased approximately £12,600 of product from Studio Clay in the year ended December 31, 2022.
Relationship with Platforme International Limited
Mr. Neves, the founder, Chief Executive Officer and Chairman of our Board of Directors, is also a Director of, and holds a beneficial ownership interest in, Platforme International Limited (“Platforme”).
E-Commerce Services Agreements
In October 2015, we entered into an FPS e-commerce services agreement with Platforme for the development and hosting of the “Swear” branded website. Further, in the second quarter of 2017, we entered into several standard e-commerce services agreements with Platforme, pursuant to which we make available for sale on the Farfetch Marketplace products from each of Platforme’s “Swear,” “MySwear” and “B Store” businesses. The agreements were entered into on our standard terms. As of December 31, 2022 there were no continuing obligations under the FPS e-commerce services agreement.
Agreements with Executive Officers and Directors
We have entered into service agreements or offer letters with our executive officers and Directors. Information about these agreements, including the CEO PSU Grant made to Mr. Neves in May 2021, may be found in this Annual Report under Item 6. “Directors, Senior Management and Employees — B. Compensation” and is incorporated herein by reference.
119
Indemnification Agreements
We have entered into indemnification agreements with our Directors and executive officers pursuant to which we have agreed to indemnify them against a number of liabilities and expenses incurred by such persons in connection with claims made by reason of their serving as a Director or executive officer of Farfetch. A copy of the Form of Indemnification Agreement is incorporated by reference as Exhibit 4.1 to this Annual Report. In addition to such indemnification, we provide our Board of Directors and executive officers with directors’ and officers’ liability insurance.
Related Parties Policy
Our Board of Directors has adopted a written Related Parties Policy to set forth the policies and procedures for the review and approval or ratification of related party transactions. This policy covers material transactions or loans reportable under this Item between Farfetch and a related party, including without limitation our Directors and senior management as well as their family members, and certain shareholders, and provides that such transactions be reviewed and approved or ratified by the Audit Committee. Such review shall assess if the transaction is on terms comparable to those that could be obtained in arm’s length dealings with an unrelated third party, whether the transaction is inconsistent with the interest of the Company and its shareholders, the extent of the related party’s interest in the transaction, and shall also take into account the conflicts of interest and corporate opportunity provisions of our organizational documents.
C. Interests of Experts and Counsel
Not applicable.
120
Item 8. Financial Information
A. Consolidated Statements and Other Financial Information
Consolidated financial statements
Refer to Item 18. “Financial statements”.
Legal and Arbitration Proceedings
From time to time, we may be involved in various claims and proceedings arising in the course of our business and operations. The outcome of any such claims or proceedings, regardless of the merits, is inherently uncertain. For example, in September 2019, following periods of volatility in the market price of our Class A ordinary shares, two putative class action lawsuits were filed in the U.S. District Court for the Southern District of New York against us and certain of our Directors and officers, among others, under the U.S. federal securities laws. On June 10, 2020, the court consolidated the two lawsuits and plaintiffs subsequently filed an amended complaint, which we and the other defendants moved to dismiss. On September 29, 2021, the court granted our motion and dismissed all of plaintiffs’ claims with prejudice, finding that our disclosures were thorough and extensive, that no reasonable investor could have been misled by our disclosures, that none of Farfetch’s officers’ stock sales were suspicious or unusual and that plaintiffs did not otherwise plead that any Farfetch officers knew that any of the challenged statements were false. Plaintiffs appealed that decision and the U.S. Court of Appeals for the Second Circuit held argument for that appeal on December 7, 2022.
In April 2020, a putative class action lawsuit, captioned Walter v. Farfetch.com US, LLC, was filed in the United States against Farfetch.com US, LLC alleging violations of Section 632.7 of the California Penal Code. The lawsuit was mediated on September 29, 2021 and the settlement agreement was fully executed as of January 4, 2022. The settlement remains subject to court approval, which the parties expect to obtain in 2023. Under the terms of the settlement, we continue to deny any liability or wrongdoing and the significant majority of the payment will be funded by certain of our insurance carriers. We do not expect the payment to be made under this settlement to have a material impact on our financial position or results of operations.
Dividend Policy
We have not previously paid dividends on our ordinary shares and do not anticipate paying dividends on our ordinary shares in the foreseeable future. We intend to retain all available funds and any future earnings to fund the development and expansion of our business. However, if we do pay a cash dividend on our ordinary shares in the future, we will pay such dividend out of our profits or share premium (subject to solvency requirements and as permitted under Cayman Islands law).
The amount of any future dividend payments we may make will depend on, among other factors, our strategy, future earnings, financial condition, cash flow, working capital requirements, capital expenditures applicable provisions of our Articles, and financial covenants related to our borrowings. Any profits or share premium we declare as dividends will not be available to be reinvested in our operations.
Moreover, Farfetch Limited is a holding company that does not conduct any business operations of its own. As a result, it is dependent upon cash dividends, distributions and other transfers from our subsidiaries to make dividend payments, which may be subject to withholding and other taxes.
Any dividends we declare on our Farfetch Limited shares will be in respect of both our Class A ordinary shares and Class B ordinary shares and will be distributed such that a holder of one of our Class B ordinary shares will receive the same amount of dividends as a holder of one of our Class A ordinary shares. We will not declare any dividend with respect to our Class A ordinary shares without declaring a dividend on our Class B ordinary shares, and vice versa.
We have not declared or paid dividends in the years ended December 31, 2022, 2021 and 2020.
121
B. Significant Changes
Please refer to Note 33, Subsequent Events, within our Consolidated financial statements included elsewhere in this Annual Report for details regarding events subsequent to the reporting period.
Item 9. The Offer and Listing
A. Offer and Listing Details
Our Class A ordinary shares commenced trading on the NYSE on September 21, 2018 under the symbol “FTCH.” Prior to this, no public market existed for our Class A ordinary shares. Our Class B ordinary shares are not listed to trade on any securities market.
B. Plan of Distribution
Not applicable.
C. Markets
Our Class A ordinary shares commenced trading on the NYSE on September 21, 2018 under the symbol “FTCH.”
Not applicable.
E. Dilution
Not applicable.
F. Expenses of the Issue
Not applicable.
Item 10. Additional Information
A. Share Capital
Not applicable.
B. Memorandum and Articles of Association
A copy of our Articles is incorporated by reference as Exhibit 1.1 to this Annual Report. The information called for by this Item is set forth in Exhibit 2.1 to this Annual Report and is incorporated by reference into this Annual Report.
C. Material Contracts
Except as otherwise disclosed in this Annual Report (including the Exhibits), we are not currently, nor have we been for the past two years, party to any material contract, other than contracts entered into in the ordinary course of business.
D. Exchange Controls
There are currently no Cayman Islands exchange control regulations that would affect the import or export of capital or the remittance of dividends, interest or other payments to non-resident holders of our shares.
122
E. Taxation
The following summary contains a description of certain Cayman Islands, UK and U.S. federal income tax consequences of the acquisition, ownership and disposition of our Class A ordinary shares. The summary is based upon the tax laws of the Cayman Islands and regulations thereunder, the tax laws of the United Kingdom and regulations thereunder, and the tax laws of the United States and regulations thereunder as of the date hereof, which are subject to change.
Cayman Islands Tax Considerations
The following discussion is a summary of the material Cayman Islands tax considerations relating to the purchase, ownership and disposition of our Class A ordinary shares. There is, at present, no direct taxation in the Cayman Islands and interest, dividends and gains payable to us will be received free of all Cayman Islands taxes. We have received an undertaking from the government of the Cayman Islands to the effect that, for a period of thirty years from the date of the undertaking, no law that thereafter is enacted in the Cayman Islands imposing any tax or duty to be levied on profits, income or on gains or appreciation, or any tax in the nature of estate duty or inheritance tax, will apply to any property comprised in or any income arising under Farfetch, or to our shareholders, in respect of any such property or income.
No stamp duty in the Cayman Islands is payable in respect of the issue of any Class A ordinary shares or an instrument of transfer in respect of any Class A ordinary shares.
United Kingdom Tax Considerations
The following discussion is a summary of the material UK tax considerations relating to the purchase, ownership and disposition of our Class A ordinary shares.
The following statements are of a general nature and do not purport to be a complete analysis of all potential UK tax consequences of acquiring, holding or disposing of our Class A ordinary shares. They are based on current UK tax law and on the current published practice of His Majesty’s Revenue and Customs (“HMRC”) (which may not be binding on HMRC), as of the date of this Annual Report, all of which are subject to change, possibly with retrospective effect. They are intended to address only certain UK tax consequences for holders of our Class A ordinary shares who are tax resident in (and only in) the United Kingdom, and in the case of individuals, domiciled in (and only in) the United Kingdom (except where expressly stated otherwise) who are the absolute beneficial owners of our Class A ordinary shares and any dividends paid on them and who hold our Class A ordinary shares as investments (other than in an individual savings account or a self-invested personal pension). They do not address the UK tax consequences which may be relevant to certain classes of holders of our Class A ordinary shares such as traders, brokers, dealers, banks, financial institutions, insurance companies, investment companies, collective investment schemes, tax-exempt organizations, trustees, persons connected with us, persons holding our Class A ordinary shares as part of hedging or conversion transactions, holders of Class A ordinary shares who have (or are deemed to have) acquired our Class A ordinary shares by virtue of an office or employment, and holders of Class A ordinary shares who are or have been our officers or employees or a company forming part of our Group. The statements do not apply to any holder of Class A ordinary shares who either directly or indirectly holds or controls 10% or more of our share capital (or class thereof), voting power or profits.
The following is intended only as a general guide and is not intended to be, nor should it be considered to be, legal or tax advice to any particular prospective subscriber for, or purchaser of, our Class A ordinary shares. Accordingly, prospective subscribers for, or purchasers of, our Class A ordinary shares who are in any doubt as to their tax position regarding the acquisition, ownership and disposition of our Class A ordinary shares or who are subject to tax in a jurisdiction other than the United Kingdom should consult their own tax advisers.
123
The Company
It is the intention of our Board of Directors to conduct our affairs so that our central management and control is exercised in the United Kingdom. As a result, we are expected to be treated as resident in the United Kingdom for UK tax purposes. Accordingly, we expect to be subject to UK taxation on our income and gains, except where an exemption applies.
Taxation of Dividends
Withholding Tax
We will not be required to withhold UK tax at its source when paying dividends. The amount of any liability to UK tax on dividends paid by us will depend on the individual circumstances of the holder of our Class A ordinary shares.
Income Tax
An individual holder of our Class A ordinary shares who is resident for tax purposes in the United Kingdom may, depending on his or her particular circumstances, be subject to UK tax on dividends received from us. Dividend income is treated as the top slice of the total income chargeable to UK income tax. An individual holder of our Class A ordinary shares who is not resident for tax purposes in the United Kingdom should not be chargeable to UK income tax on dividends received from us unless he or she carries on (whether solely or in partnership) any trade, profession or vocation in the United Kingdom through a branch or agency to which the Class A ordinary shares are attributable. There are certain exceptions for trading in the United Kingdom through independent agents, such as certain brokers and investment managers.
All dividends received by a UK resident individual holder of our Class A ordinary shares from us or from other sources will form part of the holder’s total income for income tax purposes and will constitute the top slice of that income. A nil rate of income tax will apply to the first £2,000 (expected to reduce to £1,000 from April 6, 2023 and to £500 from April 6, 2024) of taxable dividend income received by the holder of our Class A ordinary shares in a given tax year. Income within the nil rate band will be taken into account in determining whether income in excess of the nil rate band falls within the basic rate, higher rate or additional rate tax bands. Where the dividend income is above the £2,000 dividend allowance, the first £2,000 of the dividend income will be charged at the nil rate and any excess amount will be taxed at 8.75% to the extent that the excess amount falls within the basic rate tax band, 33.75% to the extent that the excess amount falls within the higher rate tax band and 39.35% to the extent that the excess amount falls within the additional rate tax band.
Corporation Tax
Corporate holders of our Class A ordinary shares who are resident for tax purposes in the United Kingdom should not be subject to UK corporation tax on any dividend received from us so long as the dividends qualify for an exemption (as is likely) and certain conditions are met (including anti-avoidance conditions). Corporate holders of our Class A ordinary shares who are not resident in the United Kingdom will not generally be subject to UK corporation tax on dividends unless they are carrying on a trade, profession or vocation in the United Kingdom through a permanent establishment in connection with which our Class A ordinary shares are used, held, or acquired.
A holder of our Class A ordinary shares who is resident outside the United Kingdom may be subject to non-UK taxation on dividend income under local law.
124
Taxation of Capital Gains
UK Resident Holders of our Class A Ordinary Shares
A disposal or deemed disposal of our Class A ordinary shares by an individual or corporate holder of our Class A ordinary shares who is tax resident in the United Kingdom may, depending on the holder’s circumstances and subject to any available exemptions or relief, give rise to a chargeable gain or allowable loss for the purposes of UK taxation of chargeable gains.
Any chargeable gain (or allowable loss) will generally be calculated by reference to the consideration received for the disposal of our Class A ordinary shares less the allowable cost to the holder of acquiring such Class A ordinary shares.
The applicable tax rates for individual holders of our Class A ordinary shares realizing a gain on the disposal of such Class A ordinary shares is, broadly, 10% for basic rate taxpayers and 20% for higher and additional rate taxpayers.
Non-UK Resident Holders of our Class A Ordinary Shares
Holders of our Class A ordinary shares who are not resident in the United Kingdom and, in the case of an individual holder, not temporarily non-resident, should not be liable for UK tax on capital gains realized on a sale or other disposal of our Class A ordinary shares unless (i) such shares are used, held or acquired for the purposes of a trade, profession or vocation carried on in the United Kingdom through a branch or agency or, in the case of a corporate holder, through a permanent establishment, or (ii) where certain other conditions are met, we derive 75% or more of our gross value from UK land. Holders of Class A ordinary shares who are not resident in the United Kingdom may be subject to non-UK taxation on any gain under local law.
Generally, an individual holder of our Class A ordinary shares who has ceased to be resident in the United Kingdom for tax purposes for a period of five years or less and who disposes of our Class A ordinary shares during that period may be liable on their return to the United Kingdom to UK taxation on any capital gain realized (subject to any available exemption or relief).
UK Stamp Duty (“Stamp Duty”) and UK Stamp Duty Reserve Tax (“SDRT”)
The following statements are intended as a general guide to the current position relating to Stamp Duty and SDRT and apply to any holder of our Class A ordinary shares irrespective of their place of tax residence.
No Stamp Duty will be payable on the issuance of our Class A ordinary shares.
Stamp Duty will in principle be payable on any instrument of transfer of our Class A ordinary shares that is executed in the United Kingdom or that relates to any property situated, or to any matter or thing done or to be done, in the United Kingdom. An exemption from Stamp Duty is available on an instrument transferring our Class A ordinary shares where the amount or value of the consideration is £1,000 or less and it is certified on the instrument that the transaction effected by the instrument does not form part of a larger transaction or series of transactions in respect of which the aggregate amount or value of the consideration exceeds £1,000. Holders of our Class A ordinary shares should be aware that, even where an instrument of transfer is in principle subject to Stamp Duty, Stamp Duty is not required to be paid unless it is necessary to rely on the instrument for legal purposes, for example to register a change of ownership or in litigation in a UK court.
Provided that our Class A ordinary shares are not registered in any register maintained in the United Kingdom by or on behalf of us and are not paired with any shares issued by a UK incorporated company, the issue or transfer of (or agreement to transfer) our Class A ordinary shares will not be subject to SDRT. We currently do not intend that any register of our Class A ordinary shares will be maintained in the United Kingdom.
U.S. Federal Income Tax Considerations
The following general summary describes the material U.S. federal income tax consequences to U.S. Holders (defined below) of owning and disposing of our Class A ordinary shares. It does not purport to be a comprehensive discussion of all the tax considerations relevant to U.S. Holders.
125
The discussion below applies only to U.S. Holders that hold our Class A ordinary shares as capital assets within the meaning of Section 1221 of the Code (generally, property held for investment). The discussion below is based on the Code, existing and, in some cases, proposed U.S. Treasury Regulations, as well as judicial and administrative interpretations thereof, all as of the date of this Annual Report. All of the foregoing authorities are subject to change or differing interpretation, which change or differing interpretation could apply retroactively and could affect the tax consequences described below. This summary does not address any alternative minimum tax considerations, any estate or gift tax consequences or any state, local or non-U.S. tax consequences, nor does it address the Medicare contribution tax on net investment income.
The following discussion does not address the tax consequences to any particular investor and does not describe all of the tax consequences to persons in special tax situations such as, but not limited to:
THE SUMMARY OF U.S. FEDERAL INCOME TAX CONSEQUENCES SET OUT BELOW IS FOR GENERAL INFORMATION ONLY. PROSPECTIVE PURCHASERS ARE URGED TO CONSULT THEIR TAX ADVISORS ABOUT THE APPLICATION OF THE U.S. FEDERAL TAX RULES TO THEIR PARTICULAR CIRCUMSTANCES, AS WELL AS THE STATE, LOCAL AND NON-U.S. TAX CONSEQUENCES TO THEM OF THE ACQUISITION, OWNERSHIP AND DISPOSITION OF OUR CLASS A ORDINARY SHARES.
126
The discussion below of the U.S. federal income tax consequences to “U.S. Holders” applies to a holder that is a beneficial owner of our Class A ordinary shares and is, for U.S. federal income tax purposes,
The tax treatment of an entity or arrangement taxable as a partnership for U.S. federal income tax purposes that holds our Class A ordinary shares generally will depend on such partner’s status and the activities of the partnership. Prospective purchasers that are entities or arrangements treated as partnerships for U.S. federal income tax purposes, or partners in such partnerships, should consult their tax advisers concerning the U.S. federal income tax consequences of the acquisition, ownership and disposition of our Class A ordinary shares by the partnership.
Dividends
Subject to the PFIC rules discussed below, the gross amount of distributions made by us with respect to our Class A ordinary shares generally will be includable in a U.S. Holder’s gross income as foreign-source dividend income in the year actually or constructively received by such U.S. Holder, but only to the extent that such distributions are paid out of our current or accumulated earnings and profits as determined under U.S. federal income tax principles. Distributions to a U.S. Holder in excess of current and accumulated earnings and profits will be treated as a non-taxable return of capital to the extent of the U.S. Holder’s basis in such Class A ordinary shares and thereafter as a capital gain. In the event we make distributions to U.S. Holders of ordinary shares, we may or may not calculate our earnings and profits under U.S. federal income tax principles. If we do not do so, any distribution may be required to be regarded as a dividend, even if that distribution would otherwise be treated as a non-taxable return of capital or as a capital gain. U.S. Holders should therefore assume that all cash distributions will be reported as ordinary dividend income. The amount of any distribution of property other than cash will be the fair market value of that property on the date of distribution. U.S. Holders should consult their tax advisors to determine whether and to what extent they will be entitled to foreign tax credits in respect of any dividend income received.
With respect to non-corporate U.S. Holders (including individuals, estates, and trusts), dividends received with respect to our Class A ordinary shares may be considered “qualified dividend income” subject to lower capital gains rates, provided that (1) the Class A ordinary shares are readily tradable on an established securities market in the United States, (2) we are not a PFIC (as discussed below) for either our taxable year in which the dividend was paid or the preceding taxable year and (3) certain holding period requirements are met. In this regard, our Class A ordinary shares will generally be considered to be readily tradable on an established securities market in the United States if they are listed on the NYSE, as our Class A ordinary shares currently are. U.S. Holders should consult their tax advisors regarding the availability of the lower rate for dividends paid with respect to our Class A ordinary shares.
Dividends paid by us with respect to our Class A ordinary shares will generally constitute foreign-source “passive category income” and will not be eligible for the dividends-received deduction generally allowed to corporate U.S. Holders in respect of dividends received from U.S. corporations.
127
Sale or Other Disposition of Shares
Subject to the PFIC rules discussed below, upon a sale or other disposition of our Class A ordinary shares, a U.S. Holder generally will recognize a capital gain or loss for U.S. federal income tax purposes in an amount equal to the difference between the amount realized and the U.S. Holder’s adjusted tax basis in such Class A ordinary shares. A U.S. Holder’s adjusted tax basis in shares generally will be such U.S. Holder’s purchase price for the shares, unless we make distributions in excess of its current and accumulated earnings and profits. Any such gain or loss generally will be a U.S.-source gain or loss and will be treated as a long-term capital gain or loss if the U.S. Holder’s holding period in such Class A ordinary shares exceeds one year. Non-corporate U.S. Holders (including individuals) generally will be subject to U.S. federal income tax on long-term capital gains at preferential rates. The deductibility of capital losses is subject to significant limitations.
Passive Foreign Investment Company
We will be classified as a PFIC within the meaning of Section 1297 of the Code, for any taxable year if either: (1) at least 75% of our gross income is “passive income” for purposes of the PFIC rules or (2) at least 50% of the value of our assets (determined on the basis of a quarterly average) produce or are held for the production of passive income. Passive income for this purpose generally includes dividends, interest, royalties, rents and gains from commodities and securities transactions. For this purpose, we will be treated as owning the proportionate share of the assets, and earning the proportionate share of the income, of any other corporation in which we own, directly or indirectly, 25% or more measured by the value of its stock. Under the PFIC rules, if we were considered a PFIC at any time that a U.S. Holder holds our Class A ordinary shares, we would continue to be treated as a PFIC with respect to such holder’s investment unless (1) we cease to be a PFIC and (2) the U.S. Holder has made a “deemed sale” election under the PFIC rules.
Based on the currently anticipated market capitalization and composition of our income, assets, and operations, we do not believe we were a PFIC for U.S. federal income tax purposes for the taxable year that ended on December 31, 2022, and do not expect to be treated as a PFIC in the foreseeable future. However, our market capitalization and the expected income, assets and operations in the future could be significantly different from what is currently anticipated. In addition, the PFIC determination must be made annually after the close of each taxable year. Therefore, there can be no assurance that we will not be classified as a PFIC for the current taxable year or for any future taxable year.
If we are considered a PFIC for any taxable year that a U.S. Holder holds our Class A ordinary shares, any gain recognized by the U.S. Holder on a sale or other disposition of our Class A ordinary shares, as well as the amount of any “excess distribution” (defined below) received by the U.S. Holder, would be allocated ratably over the U.S. Holder’s holding period for such Class A ordinary shares. The amounts allocated to the taxable year of the sale or other disposition (or the taxable year of receipt, in the case of an excess distribution) and to any year before we became a PFIC would be taxed as ordinary income. The amount allocated to each other taxable year would be subject to tax at the highest rate in effect for individuals or corporations, as appropriate, for that taxable year, and an interest charge would be imposed on the amount allocated to that taxable year. For the purposes of these rules, an excess distribution is the amount by which any distribution received by a U.S. Holder on our Class A ordinary shares exceeds 125% of the average of the annual distributions on our Class A ordinary shares received during the preceding three years or the U.S. Holder’s holding period, whichever is shorter. Additionally, dividends paid by us would not be eligible for the reduced rate of tax described above if we are a PFIC in the taxable year in which such dividends are paid or the immediately preceding taxable year.
If we are treated as a PFIC with respect to a U.S. Holder for any taxable year, certain elections may be available to the U.S. Holder that would result in alternative treatments, such as mark-to-market treatment or treatment as a qualified electing fund (“QEF”), of our Class A ordinary shares. However, we cannot provide any assurances that we will assist investors in determining whether we or any of our non-U.S. subsidiaries is a PFIC for any taxable year, nor do we expect that we will prepare or provide to U.S. Holders a “PFIC annual information statement,” which would enable a U.S. Holder to make a QEF election.
128
If we are treated as a PFIC with respect to a U.S. Holder for any taxable year, the U.S. Holder will be deemed to own shares in any of our subsidiaries that are also PFICs and generally be subject to the treatment described above with respect to any distribution on or disposition of such shares. An election for mark-to-market treatment, however, would likely not be available with respect to any such subsidiaries.
If we are considered a PFIC, a U.S. Holder will also be subject to information reporting requirements on an annual basis. U.S. Holders should consult their tax advisors about the potential application of the PFIC rules to an investment in our Class A ordinary shares.
U.S. Information Reporting and Backup Withholding
Dividend payments with respect to our Class A ordinary shares and proceeds from the sale or other disposition of our Class A ordinary shares may be subject to information reporting to the IRS. In addition, a U.S. Holder (other than exempt U.S. Holders who establish their exempt status, if required) may be subject to backup withholding, currently at a 24% rate, on dividend payments and proceeds from the sale or other taxable disposition of our Class A ordinary shares made within the United States or through certain U.S.-related financial intermediaries.
Backup withholding will not apply, however, to a U.S. Holder who furnishes a correct taxpayer identification number and makes any other required certification or who is otherwise exempt from backup withholding. U.S. Holders who are required to establish their exempt status may be required to provide such certification on IRS Form W-9. U.S. Holders should consult their tax advisors regarding the application of the U.S. information reporting and backup withholding rules.
Backup withholding is not an additional tax. Amounts withheld as backup withholding may be credited against a U.S. Holder’s U.S. federal income tax liability, and such holder may obtain a refund of any excess amounts withheld under the backup withholding rules by timely filing the appropriate claim for refund with the IRS and furnishing any required information.
Information Reporting by U.S. Holders
Certain U.S. Holders who are individuals and certain entities holding specified foreign financial assets, including our Class A ordinary shares, with an aggregate value in excess of the applicable dollar threshold, may be required to report information relating to our Class A ordinary shares, subject to certain exceptions (including an exception for Class A ordinary shares held in accounts maintained by certain U.S. financial institutions), for each year in which they hold such shares. U.S. Holders should consult their tax advisors regarding their reporting obligations with respect to their ownership and disposition of our Class A ordinary shares.
FATCA
Provisions under Sections 1471 through 1474 of the Code and applicable U.S. Treasury Regulations commonly referred to as “FATCA” generally impose 30% withholding on certain “withholdable payments” and, subject to the proposed regulations discussed below, may impose such withholding on “foreign passthru payments” made by a “foreign financial institution” (each as defined in the Code) that has entered into an agreement with the IRS to perform certain diligence and reporting obligations with respect to the foreign financial institution’s U.S.-owned accounts. Under recently proposed regulations, any withholding on foreign passthru payments would apply to passthru payments made on or after the date that is two years after the date of publication in the Federal Register of applicable final regulations defining foreign passthru payments. Although these recent regulations are not final, taxpayers generally may rely on them until final regulations are issued.
129
The United States has entered into an intergovernmental agreement (“IGA”) with the Cayman Islands, which modifies the FATCA withholding regime described above. It is not yet clear how foreign passthru payments will be addressed under FATCA. We could be subject to these diligence, reporting and withholding obligations if it were treated as a financial institution under FATCA or the IGA. Prospective investors should consult their tax advisors regarding the potential impact of FATCA, the IGA and any non-U.S. legislation implementing FATCA, on their investment in our Class A ordinary shares.
THE DISCUSSION ABOVE IS A GENERAL SUMMARY. IT DOES NOT COVER ALL TAX MATTERS THAT MAY BE IMPORTANT TO YOU. EACH PROSPECTIVE PURCHASER SHOULD CONSULT ITS TAX ADVISOR ABOUT THE TAX CONSEQUENCES OF AN INVESTMENT IN OUR CLASS A ORDINARY SHARES UNDER THE INVESTOR’S OWN CIRCUMSTANCES.
F. Dividends and Paying Agents
Not applicable.
G. Statement by Experts
Not applicable.
H. Documents on Display
We are required to make certain filings with the SEC. The SEC maintains an internet website that contains reports, proxy statements and other information about issuers, like us, that file electronically with the SEC. The address of that site is www.sec.gov.
We also make available on our website, free of charge, our annual reports on Form 20-F and the text of our reports on Form 6-K, including any amendments to these reports, as well as certain other SEC filings, as soon as reasonably practicable after they are electronically filed with or furnished to the SEC. Our website address is www.farfetchinvestors.com. The information contained on our website is not incorporated by reference into this Annual Report.
References made in this Annual Report to any contract or certain other documents are not necessarily complete and you should refer to the exhibits attached or incorporated by reference into this Annual Report for copies of the actual contract or documents.
I. Subsidiary Information
Not applicable.
J. Annual Report to Security Holders
Not applicable.
130
Item 11. Quantitative and Qualitative Disclosures About Market Risk
Our operations are exposed to a variety of financial risks, including foreign exchange, interest rate and liquidity risks. The Group has policies in place for managing these risks, which our finance department implements and periodically reviews. Refer to Note 19, Financial instruments and financial risk management, to our audited Consolidated financial statements included elsewhere in this Annual Report for a fuller quantitative and qualitative discussion on the financial risks to which we are subject and our policies with respect to managing those risks.
Market Risk
Foreign exchange risk
The Group’s activities expose it to the financial risk of changes in foreign currency exchange rates and in interest rates.
The Group enters into derivative financial instruments to manage its exposure to foreign currency risk.
Foreign currency risk is the risk that the fair value or future cash flows of an exposure will fluctuate because of changes in foreign exchange rates.
The Group uses forward foreign currency contracts to hedge its transactional foreign currency risks. Where the criteria for hedge accounting are not met, derivative financial instruments are initially recognized at fair value on the date on which a derivative contract is entered into and are subsequently remeasured at fair value with movements recorded to the statement of operations. Derivatives are carried as financial assets when the fair value is positive and as financial liabilities when the fair value is negative. Where all relevant criteria are met, hedge accounting is applied to minimize earnings volatility.
The fluctuation in foreign currency exchange rates exposes the Group to foreign exchange translation risk on consolidation. This risk is currently not hedged and therefore, our results of operations have in the past, and will in the future, fluctuate due to movements in exchange rates when the currencies are translated into U.S. dollars. At a subsidiary level, we are exposed to transactional foreign exchange risk because we earn revenues and incur expenses in a number of different foreign currencies relative to the relevant subsidiary’s functional currency, mainly the pound sterling and the euro. Movements in exchange rates therefore impact our subsidiaries and thus, our consolidated results and cash flows.
Interest rate risk
The Group enters into derivative financial instruments to manage its exposure to interest rate risk.
Interest rate risk is the risk that the fair value of future cash flows of a financial instrument will fluctuate because of changes in market interest rates. During the year ended December 31, 2022, the Group was exposed to interest rate risk as it borrowed funds at a floating interest rate. The Term Loan is based on a floating interest rate.
Where the criteria for hedge accounting are not met, derivative financial instruments are initially recognized at fair value on the date on which a derivative contract is entered into and are subsequently remeasured at fair value with movements recorded to the statement of operations. Where all relevant criteria are met, hedge accounting is applied to minimize earnings volatility, with any movements in the fair value of the related derivative financial instruments being recognized in other comprehensive income. Derivatives are carried as financial assets when the fair value is positive and as financial liabilities when the fair value is negative. Where all relevant criteria are met, hedge accounting is applied to minimize earnings volatility.
Liquidity risk
The Group monitors its liquidity risk to maintain a balance between continuity of funding and flexibility. This helps the Group achieve timely fulfilment of its obligations while sustaining the growth of the business.
131
We believe our sources of liquidity and capital will be sufficient to meet our operating financing needs for at least the next 12 months and will support debt repayments and our currently planned capital expenditure requirements over the near term and medium term.
Primarily as a result of the gains on items held at fair value and remeasurements during the year, the Group’s total equity increased from $270.6 million as of December 31, 2021 to $905.6 million as of December 31, 2022. The gains on items held at fair value and remeasurements during the year were mainly driven by the year end revaluation of the embedded derivatives relating to the convertible senior notes and put-call options discussed in Item 5. “Operating and Financial Review and Prospects — B. Liquidity and Capital Resources”. Unless earlier converted, redeemed or repurchased in accordance with their terms, the notes may be settled, at Farfetch’s election and subject to certain exceptions and conditions, in Class A ordinary shares of Farfetch, cash, or a combination of cash and Class A ordinary shares of Farfetch.
We continuously monitor funding options available in the capital markets and trends in the availability of funds, as well as the cost of such funding.
Item 12. Description of Securities Other than Equity Securities
132
PART II
Item 13. Defaults, Dividend Arrearages and Delinquencies
None.
Item 14. Material Modifications to the Rights of Security Holders and Use of Proceeds
None.
Item 15. Controls and Procedures
Evaluation of Disclosure Controls and Procedures
We maintain disclosure controls and procedures (as that term is defined in Rules 13a-15(e) and 15d-15(e) under the Exchange Act) that are designed to ensure that information required to be disclosed in our reports under the Exchange Act is recorded, processed, summarized and reported within the time periods specified in the SEC’s rules and forms and that such information is accumulated and communicated to our management, including our Chief Executive Officer and Chief Financial Officer, as appropriate, to allow for timely decisions regarding required disclosures. Any controls and procedures, no matter how well designed and operated, can provide only reasonable assurance of achieving the desired control objectives. Our management, with the participation of our Chief Executive Officer and Chief Financial Officer, has evaluated the effectiveness of the design and operation of our disclosure controls and procedures as of December 31, 2022. Based upon that evaluation, our Chief Executive Officer and Chief Financial Officer concluded that, as a result of the material weakness in our internal control over financial reporting described below, our disclosure controls and procedures were not effective as of December 31, 2022.
As permitted by related SEC staff interpretive guidance for newly acquired businesses, the internal control over financial reporting of each of Violet Grey Inc. (“Violet Grey”) and Wannaby Inc. and subsidiary Wannaby UAB (collectively, “Wannaby”) was excluded from management’s assessment of the effectiveness of our disclosure controls and procedures as of December 31, 2022 (to the extent subsumed within our assessment of internal control over financial reporting as of such date), as they were acquired in purchase business combinations in 2022. Collectively, these acquired businesses represented less than 1% of our Group total assets and 1% of our Group consolidated revenue as of and for the fiscal year ended December 31, 2022. Refer to Note 31, Business combinations, within our Consolidated financial statements included elsewhere in this Annual Report.
Management’s Report on Internal Control over Financial Reporting
Our management is responsible for establishing and maintaining adequate internal control over financial reporting, as such term is defined in Rule 13a-15(f) and 15d-15(f) under the Exchange Act. Our management conducted an assessment of the effectiveness of our internal control over financial reporting based on the criteria set forth in “Internal Control - Integrated Framework (2013)” issued by the Committee of Sponsoring Organizations of the Treadway Commission.
A material weakness is a deficiency, or a combination of deficiencies, in internal control over financial reporting, such that there is a reasonable possibility that a material misstatement of our annual or interim consolidated financial statements may not be prevented or detected on a timely basis.
As disclosed in our 2021 Annual Report, we identified one material weakness relating to the operation of effective internal control over financial reporting at the New Guards business.
The component material weakness relating to the New Guards business covered both operational and information technology controls. This material weakness could result in a misstatement of account balances and disclosures that would result in a material misstatement to the annual or interim consolidated financial statements that would not be prevented or detected.
133
During 2022, we believe we made significant progress towards the remediation of the material weakness. Specifically, we designed and implemented a framework of information technology controls at the New Guards business. These changes and updates to our controls included privileged user access restrictions, a methodology to validate changes across the in-scope systems and back-end infrastructure, as well as user recertification supported by verified data sources and a stricter segregation and allocation of duties. Our management has concluded that controls relating to information technology have been designed and are operating effectively.
During 2022, we also designed and made significant progress towards implementing several additional operational controls at the New Guards business. These additional controls included reviewing and verifying information related to revenue to receivables, inventory, and procure to pay processes. As a result of improvements within our systems and processes we were able to identify and confirm key reports used in the operation of key controls. However, the complex nature of the design and implementation of these additional controls resulted in insufficient time to fully embed them within all applicable aspects of our business processes as of December 31, 2022.
As permitted by related SEC staff interpretive guidance for newly acquired businesses, we have excluded from the scope of our assessment of internal control over financial reporting Violet Grey and Wannaby, which, collectively represented less than 1% of our Group total assets and 1% of our Group consolidated revenue as of and for the fiscal year ended December 31, 2022.
Based upon the above evaluation, our management, including our Chief Executive Officer and Chief Financial Officer, concluded that, as a result of the material weakness described above, our internal control over financial reporting was not effective as of December 31, 2022. Notwithstanding the identified material weakness, management believes that the Consolidated financial statements included in this Annual Report on Form 20-F present fairly, in all material respects, our financial position, results of operations, and cash flows as of and for the periods presented in accordance with IFRS.
Attestation Report of Independent Registered Public Accounting Firm
PricewaterhouseCoopers LLP, the independent registered public accounting firm that audited our consolidated financial statements included in this Annual Report, has audited our internal control over financial reporting as of December 31, 2022, as stated in its report on page F-2.
Changes in Internal Control over Financial Reporting
Except for the remediation efforts described above taken to address the material weakness, during the year ended December 31, 2022, there were no other changes in our internal control over financial reporting that occurred during the period covered by this Annual Report that have materially affected, or are reasonably likely to materially affect, our internal control over financial reporting.
Item 16. Reserved
Item 16A. Audit Committee Financial Expert
Our Board of Directors has determined that Ms. Evan, Ms. Irvine, Mr. Luís and Ms. Tans each satisfies the “independence” requirements set forth in Rule 10A‑3 under the Exchange Act. Our Board of Directors has also determined that each of Ms. Evan, Ms. Irvine and Mr. Luís is considered an “audit committee financial expert” as defined in Item 16A of Form 20‑F under the Exchange Act.
Item 16B. Code of Ethics
We have adopted a Code of Conduct that applies to all our employees, officers and Directors, including our principal executive, principal financial and principal accounting officers. Our Code of Conduct addresses, among other things, competition and fair dealing, conflicts of interest, financial matters and external reporting, our funds and assets, confidentiality, corporate opportunity requirements, the process for reporting violations of the Code of Conduct and employee misconduct. Our Code of Conduct is intended to meet the definition of “code of ethics” under Item 16B of Form 20-F under the Exchange Act.
134
We intend to disclose on our website any amendment to, or waiver from, a provision of our Code of Conduct that applies to our Directors or executive officers to the extent required under the rules of the SEC or the NYSE. Our Code of Conduct is available on our website at www.farfetchinvestors.com. The information contained on our website is not incorporated by reference in this Annual Report.
Item 16C. Principal Accountant Fees and Services
PricewaterhouseCoopers LLP (“PwC,” PCAOB ID
The table below sets out the total amount incurred by category of service:
|
|
2021 |
|
|
2022 |
|
||
|
|
(in thousands) |
|
|||||
Audit Fees |
|
$ |
4,003 |
|
|
$ |
4,257 |
|
Audit-Related Fees |
|
|
- |
|
|
|
- |
|
Tax Fees |
|
|
- |
|
|
|
- |
|
All Other Fees |
|
|
31 |
|
|
|
5 |
|
Total |
|
$ |
4,034 |
|
|
$ |
4,262 |
|
Audit Fees
Audit fees for the years ended December 31, 2022 and 2021 were related to the audit of our Consolidated financial statements and other audit or interim review services provided in connection with statutory and regulatory filings or engagements.
Audit-Related Fees
There were no audit related fees for the years ended December 31, 2022 and 2021.
Tax Fees
There were no tax fees for the years ended December 31, 2022 and 2021.
All Other Fees
All other fees in the years ended December 31, 2022 and 2021 were related to services in connection with subscriptions and non-audit compliance and review work.
Pre-Approval Policies and Procedures
The advance approval of the Audit Committee or members thereof, to whom approval authority has been delegated, is required for all audit and non-audit services provided by our auditors.
All services provided by our auditors are approved in advance by either the Audit Committee or members thereof, to whom authority has been delegated, in accordance with the Audit Committee's pre-approval policy.
Item 16D. Exemptions from the Listing Standards for Audit Committees
Not applicable.
Item 16E. Purchases of Equity Securities by the Issuer and Affiliated Purchasers
None.
Item 16F. Change in Registrant’s Certifying Accountant
None.
135
Item 16G. Corporate Governance
We are a “foreign private issuer” (as such term is defined in Rule 3b–4 under the Exchange Act), and our Class A ordinary shares are listed on the NYSE. We believe the following to be the significant differences between our corporate governance practices and those applicable to U.S. companies under the NYSE listing standards. Under the NYSE rules, NYSE-listed companies that are foreign private issuers are permitted to follow home country practice in lieu of the corporate governance provisions specified by the NYSE, with limited exceptions. Accordingly, we follow certain corporate governance practices of our home country, the Cayman Islands, in-lieu of certain of the corporate governance requirements of the NYSE. In addition, under the NYSE rules, listed companies of which more than 50% of the voting power for the election of Directors is held by an individual, group or other entity are not required to have a majority of independent Directors, as defined by NYSE rules, or to comply with certain other requirements. Because Mr. Neves beneficially owns more than 50% of our voting power, we are a “controlled company” within the meaning of the rules of the NYSE.
Under the NYSE rules, U.S. domestic listed, non-controlled companies are required to have a majority independent board, which is not required under the Companies Act (as amended) of the Cayman Islands, our home country. In addition, the NYSE rules require U.S. domestic-listed, non-controlled companies to have a Compensation Committee and a Nominating and Corporate Governance Committee, each composed entirely of independent Directors, which are not required under our home country laws.
We currently follow and intend to continue to follow the foregoing governance practices and not avail ourselves of the exemptions afforded to foreign private issuers or controlled companies under the NYSE rules. We may in the future, however, decide to use other foreign private issuer exemptions with respect to some or all of the other NYSE listing requirements. Following our home country governance practices may provide less protection than is accorded to investors under the NYSE listing requirements applicable to domestic issuers.
The NYSE also requires that a listed company obtain, in specified circumstances, (1) shareholder approval to adopt or materially revise equity compensation plans, as well as (2) shareholder approval prior to an issuance (a) of more than 1% of its common stock (including derivative securities thereof) in either number or voting power to related parties, (b) of more than 20% of its outstanding common stock (including derivative securities thereof) in either number or voting power or (c) that would result in a change of control, none of which require shareholder approval under Cayman Islands law. We intend to follow home country law in determining whether shareholder approval is required.
Due to our status as a foreign private issuer and our intent to follow certain home country corporate governance practices, our shareholders do not have the same protections afforded to shareholders of companies that are subject to all the NYSE corporate governance standards and shareholder approval requirements.
Item 16H. Mine Safety Disclosure
Not applicable.
Item 16I. Disclosure Regarding Foreign Jurisdictions that Prevent Inspections
Not applicable.
136
PART III
Item 17. Financial statements
We have provided Consolidated financial statements pursuant to Item 18.
Item 18. Financial statements
The audited Consolidated financial statements as required under Item 18 are attached hereto starting on page F-1 of this Annual Report. The audit report of PricewaterhouseCoopers LLP, independent registered public accounting firm, is included herein preceding the audited Consolidated financial statements.
137
Item 19. Exhibits
Exhibit No. |
|
Description |
Form |
File No. |
Exhibit No. |
Filing Date |
Filed/Furnished |
|
|
|
|
|
|
|
|
1.1 |
|
6-K |
001-38655 |
99.1 |
11/18/2021 |
|
|
|
|
|
|
|
|
|
|
2.1 |
|
|
|
|
|
* |
|
|
|
|
|
|
|
|
|
2.2 |
|
F-1 |
333-226929 |
4.3 |
8/20/2018 |
|
|
|
|
|
|
|
|
|
|
2.3 |
|
6-K |
001-38655 |
4.1 |
4/30/2020 |
|
|
|
|
|
|
|
|
|
|
2.4 |
|
20-F |
001-38655 |
2.6 |
3/4/2021 |
|
|
|
|
|
|
|
|
|
|
4.1† |
|
20-F |
001-38655 |
4.1 |
3/4/2021 |
|
|
|
|
|
|
|
|
|
|
4.2† |
|
F-1 |
333-226929 |
10.2 |
8/20/2018 |
|
|
|
|
|
|
|
|
|
|
4.3† |
|
Rules of the Farfetch.com Limited Share Option Scheme, adopted July 18, 2013. |
F-1 |
333-226929 |
10.3 |
8/20/2018 |
|
|
|
|
|
|
|
|
|
4.4† |
|
Farfetch.com Limited 2015 Long-Term Incentive Plan, adopted February 13, 2015. |
F-1 |
333-226929 |
10.4 |
8/20/2018 |
|
|
|
|
|
|
|
|
|
4.5† |
|
20-F |
001-38655 |
4.5 |
3/4/2022 |
|
|
|
|
|
|
|
|
|
|
4.6† |
|
6-K |
001-38655 |
99.1 |
5/28/2021 |
|
|
|
|
|
|
|
|
|
|
4.7 |
|
6-K |
001-38655 |
4.1 |
8/24/2022 |
|
|
|
|
|
|
|
|
|
|
4.8 |
|
|
|
|
|
* |
|
|
|
|
|
|
|
|
|
4.9 |
|
6-K |
001-38655 |
4.1 |
10/20/2022 |
|
|
|
|
|
|
|
|
|
|
8.1 |
|
|
|
|
|
* |
|
|
|
|
|
|
|
|
|
12.1 |
|
Principal Executive Officer Certification Pursuant to Section 302 of the Sarbanes-Oxley Act of 2002. |
|
|
|
|
* |
|
|
|
|
|
|
|
|
12.2 |
|
Principal Financial Officer Certification Pursuant to Section 302 of the Sarbanes-Oxley Act of 2002. |
|
|
|
|
* |
|
|
|
|
|
|
|
|
13.1 |
|
Principal Executive Officer Certification Pursuant to Section 906 of the Sarbanes-Oxley Act of 2002. |
|
|
|
|
** |
|
|
|
|
|
|
|
|
13.2 |
|
Principal Financial Officer Certification Pursuant to Section 906 of the Sarbanes-Oxley Act of 2002. |
|
|
|
|
** |
|
|
|
|
|
|
|
|
15.1 |
|
Consent of PricewaterhouseCoopers LLP, independent registered public accounting firm. |
|
|
|
|
* |
|
|
|
|
|
|
|
|
101.INS |
|
Inline XBRL Instance Document – the instance document does not appear in the Interactive Data File because XBRL tags are embedded within the Inline XBRL document. |
|
|
|
|
* |
|
|
|
|
|
|
|
|
101.SCH |
|
Inline XBRL Taxonomy Extension Schema Document. |
|
|
|
|
* |
|
|
|
|
|
|
|
|
138
Exhibit No. |
|
Description |
Form |
File No. |
Exhibit No. |
Filing Date |
Filed/Furnished |
|
|
|
|
|
|
|
|
101.CAL |
|
Inline XBRL Taxonomy Extension Calculation Linkbase Document. |
|
|
|
|
* |
|
|
|
|
|
|
|
|
101.DEF |
|
Inline XBRL Taxonomy Definition Linkbase Document. |
|
|
|
|
* |
|
|
|
|
|
|
|
|
101.LAB |
|
Inline XBRL Taxonomy Extension Label Linkbase Document. |
|
|
|
|
* |
101.PRE |
|
Inline XBRL Taxonomy Extension Presentation Linkbase Document. |
|
|
|
|
* |
104 |
|
Cover Page Interactive Data File (embedded within the Inline XBRL document). |
|
|
|
|
* |
|
|
|
|
|
|
|
|
* |
|
Filed herewith. |
|
|
|
|
|
** |
|
Furnished herewith. |
|
|
|
|
|
† |
|
This document has been identified as a management contract or compensatory plan or arrangement. |
|
|
|
|
|
Certain agreements filed as exhibits to this Annual Report contain representations and warranties that the parties thereto made to each other. These representations and warranties have been made solely for the benefit of the other parties to such agreements and may have been qualified by certain information that has been disclosed to the other parties to such agreements and that may not be reflected in such agreements. In addition, these representations and warranties may be intended as a way of allocating risks among parties if the statements contained therein prove to be incorrect, rather than as actual statements of fact. Accordingly, there can be no reliance on any such representations and warranties as characterizations of the actual state of facts. Moreover, information concerning the subject matter of any such representations and warranties may have changed since the date of such agreements.
139
SIGNATURES
The registrant hereby certifies that it meets all of the requirements for filing on Form 20-F and that it has duly caused and authorized the undersigned to sign this annual report on its behalf.
|
|
Farfetch Limited |
|
|
|
|
|
Date: March 8, 2023 |
|
By: |
/s/ José Neves |
|
|
|
José Neves |
|
|
|
Chief Executive Officer |
140
FARFETCH LIMITED AND SUBSIDIARIES
INDEX TO CONSOLIDATED FINANCIAL STATEMENTS
F-1
Report of Independent Registered Public Accounting Firm
To the Board of Directors and Shareholders of Farfetch Limited
Opinions on the Financial Statements and Internal Control over Financial Reporting
We have audited the accompanying consolidated statements of financial position of Farfetch Limited and its subsidiaries (the “Group”) as of December 31, 2022 and 2021, and the related consolidated statements of operations, comprehensive (loss)/income, changes in equity/(deficit) and cash flows for each of the three years in the period ended December 31, 2022, including the related notes (collectively referred to as the “consolidated financial statements”). We also have audited the Group’s internal control over financial reporting as of December 31, 2022, based on criteria established in Internal Control - Integrated Framework (2013) issued by the Committee of Sponsoring Organizations of the Treadway Commission (COSO).
In our opinion, the consolidated financial statements referred to above present fairly, in all material respects, the financial position of the Group as of December 31, 2022 and 2021, and the results of its operations and its cash flows for each of the three years in the period ended December 31, 2022, in conformity with International Financial Reporting Standards as issued by the International Accounting Standards Board. Also in our opinion, the Group did not maintain, in all material respects, effective internal control over financial reporting as of December 31, 2022, based on criteria established in Internal Control - Integrated Framework (2013) issued by the COSO because a material weakness in internal control over financial reporting existed as of that date related to the implementation and consistent operation of effective internal control over financial reporting at the New Guards business.
A material weakness is a deficiency, or a combination of deficiencies, in internal control over financial reporting, such that there is a reasonable possibility that a material misstatement of the annual or interim financial statements will not be prevented or detected on a timely basis. The material weakness referred to above is described in Management’s Report on Internal Control over Financial Reporting appearing under Item 15. We considered this material weakness in determining the nature, timing, and extent of audit tests applied in our audit of the 2022 consolidated financial statements, and our opinion regarding the effectiveness of the Group’s internal control over financial reporting does not affect our opinion on those consolidated financial statements.
Basis for Opinions
The Group's management is responsible for these consolidated financial statements, for maintaining effective internal control over financial reporting, and for its assessment of the effectiveness of internal control over financial reporting, included in management’s report referred to above. Our responsibility is to express opinions on the Group’s consolidated financial statements and on the Group's internal control over financial reporting based on our audits. We are a public accounting firm registered with the Public Company Accounting Oversight Board (United States) (PCAOB) and are required to be independent with respect to the Group in accordance with the U.S. federal securities laws and the applicable rules and regulations of the Securities and Exchange Commission and the PCAOB.
We conducted our audits in accordance with the standards of the PCAOB. Those standards require that we plan and perform the audits to obtain reasonable assurance about whether the consolidated financial statements are free of material misstatement, whether due to error or fraud, and whether effective internal control over financial reporting was maintained in all material respects.
Our audits of the consolidated financial statements included performing procedures to assess the risks of material misstatement of the consolidated financial statements, whether due to error or fraud, and performing procedures that respond to those risks. Such procedures included examining, on a test basis, evidence regarding the amounts and disclosures in the consolidated financial statements. Our audits also included evaluating the accounting principles used and significant estimates made by management, as well as evaluating the overall presentation of the consolidated financial statements. Our audit of internal control over financial reporting included obtaining an understanding of internal control over financial reporting, assessing the risk that a material weakness exists, and testing and evaluating the design and operating effectiveness of internal control based on the assessed risk. Our
F-2
audits also included performing such other procedures as we considered necessary in the circumstances. We believe that our audits provide a reasonable basis for our opinions.
As described in Management’s Report on Internal Control over Financial Reporting, management has excluded Violet Grey Inc. (“Violet Grey”) and Wannaby Inc. and subsidiary Wannaby UAB (“Wannaby”) from its assessment of internal control over financial reporting as of December 31, 2022 because they were acquired by the Group in purchase business combinations during 2022. We have also excluded Violet Grey and Wannaby from our audit of internal control over financial reporting. Violet Grey and Wannaby are wholly-owned subsidiaries whose total assets and total revenue excluded from management’s assessment and our audit of internal control over financial reporting collectively represent less than 1% and 1% respectively, of the related consolidated financial statement amounts as of and for the year ended December 31, 2022.
Definition and Limitations of Internal Control over Financial Reporting
A company’s internal control over financial reporting is a process designed to provide reasonable assurance regarding the reliability of financial reporting and the preparation of financial statements for external purposes in accordance with generally accepted accounting principles. A company’s internal control over financial reporting includes those policies and procedures that (i) pertain to the maintenance of records that, in reasonable detail, accurately and fairly reflect the transactions and dispositions of the assets of the company; (ii) provide reasonable assurance that transactions are recorded as necessary to permit preparation of financial statements in accordance with generally accepted accounting principles, and that receipts and expenditures of the company are being made only in accordance with authorizations of management and directors of the company; and (iii) provide reasonable assurance regarding prevention or timely detection of unauthorized acquisition, use, or disposition of the company’s assets that could have a material effect on the financial statements.
Because of its inherent limitations, internal control over financial reporting may not prevent or detect misstatements. Also, projections of any evaluation of effectiveness to future periods are subject to the risk that controls may become inadequate because of changes in conditions, or that the degree of compliance with the policies or procedures may deteriorate.
Critical Audit Matters
The critical audit matters communicated below are matters arising from the current period audit of the consolidated financial statements that were communicated or required to be communicated to the audit committee and that (i) relate to accounts or disclosures that are material to the consolidated financial statements and (ii) involved our especially challenging, subjective, or complex judgments. The communication of critical audit matters does not alter in any way our opinion on the consolidated financial statements, taken as a whole, and we are not, by communicating the critical audit matters below, providing separate opinions on the critical audit matters or on the accounts or disclosures to which they relate.
Valuation of Embedded Derivatives
As described in Notes 2.3, 3, 7, 19 and 20 to the consolidated financial statements, management applies judgment in estimating the fair value of financial instruments held by the Group which include embedded derivatives. During the year ended December 31, 2020, the Group issued convertible senior notes amounting to $400.0 million and $600.0 million, referred to as the April 2020 and November 2020 Notes, respectively. Each arrangement contains certain conversion options which are bifurcated from the contract and valued separately. The derivatives embedded within these convertible notes are accounted for as financial instruments at fair value through profit and loss (“FVTPL”). The total fair value of these two instruments as of December 31, 2022 was $205.4 million. The embedded derivatives relating to the convertible notes issued in 2020 are measured using Level 2 valuation inputs. The embedded derivative relating to the April 2020 Notes was valued using the Black Scholes option pricing model and the embedded derivative relating to the November 2020 Notes was valued using the Binomial option pricing model. For both of these models, the key inputs and assumptions are the Group’s closing share price at the end of the reporting period, share price volatility and the risk free rate.
F-3
The principal considerations for our determination that performing procedures related to the valuation of embedded derivatives is a critical audit matter are (i) the significant judgment and estimation by management in determining the estimated fair value of embedded derivatives; (ii) a high degree of auditor judgment, subjectivity and effort in performing procedures and evaluating management's significant assumptions related to the risk free rate and share price volatility; and (iii) the audit effort involved the use of professionals with specialized skill and knowledge.
Addressing the matter involved performing procedures and evaluating audit evidence in connection with forming our overall opinion on the consolidated financial statements. These procedures included testing the effectiveness of controls relating to the development of the estimated fair values for the embedded derivatives. These procedures also included, among others, (i) testing management’s process used to develop the fair value estimates for both instruments; (ii) the involvement of professionals with specialized skill and knowledge to assist in developing an independent range of values of the embedded derivative within the April 2020 Note; (iii) comparing the independent range of values for the embedded derivative within the April 2020 Note to management’s estimates to evaluate the reasonableness of management’s estimates; and (iv) testing the completeness and accuracy of underlying data used in the models. Professionals with specialized skill and knowledge were also used to assist in evaluating the appropriateness of the valuation models, testing the completeness and accuracy of underlying data used in the models, assessing the reasonableness of the risk free rate assumption for both models, assessing the reasonableness of the credit spread assumption for the embedded derivative relating to the November 2020 Note, and developing an independent range of share price volatility assumptions from a comparable set of peers for the embedded derivative within the April 2020 Note.
Valuation of Put and Call options related to the Palm Angels acquisition and strategic arrangement with Alibaba and Richemont
As described in Notes 2.3, 3, 7, 19 and 21 to the consolidated financial statements, management applies judgment in estimating the fair value of financial instruments held by the Group which include certain put and call options relating to the non-controlling interests arising from certain transactions, including that with Palm Angels as well as the strategic arrangement with Alibaba Group Holding Limited (“Alibaba”) and Compagnie Financière Richemont SA (“Richemont”). The Palm Angels and Alibaba and Richemont options make up the significant majority of the Group’s put and call option liability and were valued at $97.3 million and $71.9 million, respectively, as of December 31, 2022. The estimated value of the put and call option liability related to Palm Angels is measured using Level 3 inputs, and is calculated using the present value of future expected payments method, based on the present value of expected revenue for Palm Angels in financial year 2025 and probability-weighted future revenue growth for Palm Angels between financial years 2021 and 2025. The estimated value of the put and call option liability related to the strategic agreement with Alibaba and Richemont is measured using Level 2 inputs, and is based on the present value of future expected payments method, together with the Group’s closing share price at the end of the reporting period, risk free rate and credit spread assumptions.
The principal considerations for our determination that performing procedures related to the valuation of the put and call options related to the Palm Angels acquisition and strategic arrangement with Alibaba and Richemont is a critical audit matter are (i) the significant judgment and estimation by management in determining the estimated fair value of these put and call options; (ii) a high degree of auditor judgment, subjectivity, and effort in performing procedures and evaluating management's significant assumptions related to a) the risk free rate and credit spread used in the valuation of the put and call options related to the strategic investment with Alibaba and Richemont, and b) the future revenue growth for Palm Angels; and (iii) the audit effort involved the use of professionals with specialized skill and knowledge.
Addressing the matter involved performing procedures and evaluating audit evidence in connection with forming our overall opinion on the consolidated financial statements. These procedures included testing the effectiveness of controls relating to the development of the estimated fair values for the Palm Angels and Alibaba and Richemont put and call options. These procedures also included, among others, (i) testing management’s process used to develop the fair value estimates for the Alibaba and Richemont put and call options; (ii) the involvement of professionals with specialized skill and knowledge to assist in developing an independent range of values for each of the valuation models; (iii) comparing the independent range of values for these put and call options to management’s estimates to evaluate the reasonableness of management’s estimates; (iv) testing the completeness and accuracy of underlying data used in the models; and (v) evaluating the reasonableness of significant assumptions related to the future
F-4
revenue growth for Palm Angels considering historical growth rates and market data. Professionals with specialized skill and knowledge were also used to assist in evaluating the appropriateness of the valuation models, testing the completeness and accuracy of underlying data used in the models, and assessing the reasonableness of the risk free rate and credit spread assumptions used in the valuation of the put and call options related to the strategic investment with Alibaba and Richemont.
Capitalized Development Costs
As described in Notes 3 and 11 to the consolidated financial statements, the Group capitalizes costs relating to the development of internal software and technologies related to the enhancement of the Group's Digital Platform. Management applies judgment in assessing whether the internal software and technologies meet the required criteria for initial capitalization. This requires management to assess the expected future benefits from the projects to be capitalized, technical feasibility and commercial viability. In particular, internally generated intangible assets must be assessed during the development phase to identify whether the Group has the ability and the intention to complete the development successfully. Total development costs capitalized during the year ended December 31, 2022 were $141 million.
The principal considerations for our determination that the procedures performed related to capitalized development costs is a critical audit matter are (i) the significant judgment by management in assessing whether the internal software and technologies met the required criteria for initial capitalization; and (ii) a high degree of auditor judgment, subjectivity and effort in performing procedures to evaluate management’s judgment in assessing each of the capitalization criteria, and the ability and intent to complete the development.
Addressing the matter involved performing procedures and evaluating audit evidence in connection with forming our overall opinion on the consolidated financial statements. These procedures included testing the effectiveness of controls related to the capitalization of development costs. These procedures also included, among others, (i) assessing whether the capitalization criteria, including expected future benefits, technical feasibility and commercial viability, had been met; and (ii) testing directly attributable costs to bring the asset to the condition necessary for it to be capable of operating in the manner intended by management. Assessing whether the capitalization criteria had been met included (i) the review of management’s project plans and budgets; (ii) consideration of historic outcomes of projects; (iii) review of supporting documentation, such as employee timesheets; and (iv) discussions with project supervisors and development personnel.
Impairment of the Browns-Digital CGU and certain other smaller CGUs
As described in Notes 3 and 11 to the consolidated financial statements, impairment exists when the carrying value of a cash generating unit (CGU) or group of CGUs exceeds its recoverable amount, which is the higher of its fair value less costs of disposal and its value in use. During the year ended December 31, 2022, the Group recognized impairment expense of $38.1 million related to the Browns-Digital CGU and $95.9 million related to certain other smaller CGUs, which represents the full carrying value of the assets allocated to those CGUs. The recoverable amounts of the CGUs are determined from value in use calculations. The key assumptions for the value in use calculation include (i) expected future revenue growth rates, including the terminal growth rate; (ii) anticipated gross profit margins; (iii) anticipated operating margins, and (iv) the discount rates to be applied to the estimated future cash flows.
The principal consideration for our determination that performing procedures relating to the impairment of the Browns-Digital CGU and certain other smaller CGUs is a critical audit matter are (i) the significant judgment by management when developing the estimated recoverable amount; (ii) a high degree of auditor judgment, subjectivity, and effort in performing procedures and evaluating management’s significant assumptions related to expected future revenue growth rates, including the terminal growth rate, anticipated gross and operating profit margins, and applied discount rates; and (iii) the audit effort involved the use of professionals with specialized skill and knowledge.
Addressing the matter involved performing procedures and evaluating audit evidence in connection with forming our overall opinion on the consolidated financial statements. These procedures included testing the effectiveness of controls relating to the valuation of CGUs. These procedures also included, among others, (i) testing management’s
F-5
process for determining the estimated impairment expense; (ii) evaluating the appropriateness of the value in use model; (iii) testing the completeness and accuracy of underlying data used in the model; and (iv) evaluating the reasonableness of significant assumptions related to expected future revenue growth rates, including the terminal growth rate, anticipated gross and operating profit margins, and applied discount rates. Evaluating the reasonableness of the expected future revenue growth rates and anticipated profit margins involved evaluating whether the assumptions used by management were reasonable considering the current and past performance of the CGUs, consistency with external market and industry data, and whether these assumptions were consistent with evidence obtained in other areas of the audit. Professionals with specialized skill and knowledge were used to assist in performing procedures relating to assessing the reasonableness of the discount rate and terminal growth rate.
/s/
March 8, 2023
We have served as the Group’s auditor since 2015.
F-6
FARFETCH LIMITED AND SUBSIDIARIES
CONSOLIDATED STATEMENT OF OPERATIONS
for the year ended December 31,
(in $ thousands, except share and per share data)
|
|
Note |
|
2020 |
|
|
2021 |
|
|
2022 |
|
|||
Revenue |
|
4 |
|
$ |
|
|
$ |
|
|
$ |
|
|||
Cost of revenue |
|
|
|
|
( |
) |
|
|
( |
) |
|
|
( |
) |
Gross profit |
|
|
|
|
|
|
|
|
|
|
|
|||
Selling, general and administrative expenses |
|
6 |
|
|
( |
) |
|
|
( |
) |
|
|
( |
) |
Impairment losses on tangible assets |
|
12,13 |
|
|
( |
) |
|
|
|
|
|
( |
) |
|
Impairment losses on intangible assets |
|
11 |
|
|
( |
) |
|
|
( |
) |
|
|
( |
) |
Operating loss |
|
|
|
|
( |
) |
|
|
( |
) |
|
|
( |
) |
(Losses)/gains on items held at fair value and remeasurements |
|
7,19 |
|
|
( |
) |
|
|
|
|
|
|
||
Share of results of associates |
|
|
|
|
( |
) |
|
|
( |
) |
|
|
|
|
Finance income |
|
8 |
|
|
|
|
|
|
|
|
|
|||
Finance costs |
|
8 |
|
|
( |
) |
|
|
( |
) |
|
|
( |
) |
(Loss)/profit before tax |
|
|
|
|
( |
) |
|
|
|
|
|
|
||
Income tax benefit/(expense) |
|
10 |
|
|
|
|
|
( |
) |
|
|
|
||
(Loss)/profit after tax |
|
|
|
|
( |
) |
|
|
|
|
|
|
||
(Loss)/profit after tax attributable to: |
|
|
|
|
|
|
|
|
|
|
|
|||
Equity holders of the parent |
|
|
|
|
( |
) |
|
|
|
|
|
|
||
Non-controlling interests |
|
27 |
|
|
|
|
|
|
|
|
( |
) |
||
Net (loss)/profit |
|
|
|
$ |
( |
) |
|
$ |
|
|
$ |
|
||
(Loss)/earnings per share attributable to owners of the parent |
|
|
|
|
|
|
|
|
|
|
|
|||
Basic |
|
28 |
|
|
( |
) |
|
|
|
|
|
|
||
Diluted |
|
28 |
|
|
( |
) |
|
|
( |
) |
|
|
( |
) |
Weighted-average shares outstanding |
|
|
|
|
|
|
|
|
|
|
|
|||
Basic |
|
28 |
|
|
|
|
|
|
|
|
|
|||
Diluted |
|
28 |
|
|
|
|
|
|
|
|
|
|||
The accompanying notes are an integral part of these Consolidated financial statements
F-7
FARFETCH LIMITED AND SUBSIDIARIES
CONSOLIDATED STATEMENT OF COMPREHENSIVE (LOSS)/INCOME
for the year ended December 31,
(in $ thousands)
|
|
Note |
|
|
2020 |
|
|
2021 |
|
|
2022 |
|
||||
(Loss)/profit after tax for the year |
|
|
|
|
$ |
( |
) |
|
$ |
|
|
$ |
|
|||
Other comprehensive (loss)/income: |
|
|
|
|
|
|
|
|
|
|
|
|
||||
Items that may be subsequently reclassified to the consolidated statement of operations (net of tax): |
|
|
|
|
|
|
|
|
|
|
|
|
||||
Exchange gain/(loss) on translation of foreign operations |
|
|
|
|
|
|
|
|
( |
) |
|
|
( |
) |
||
Loss on cash flow hedges recognized in equity |
|
19 |
|
|
|
( |
) |
|
|
( |
) |
|
|
( |
) |
|
Loss/(gain) on cash flow hedges reclassified and reported in net (loss)/profit |
|
19 |
|
|
|
|
|
|
( |
) |
|
|
|
|||
Hedge discontinuation gains transferred to statement of operations |
|
19 |
|
|
|
|
|
|
|
|
|
( |
) |
|||
Gain/(loss) on cash flow hedges recognized in equity - time value |
|
|
|
|
|
|
|
|
( |
) |
|
|
|
|||
Items that will not be subsequently reclassified to the consolidated statement of operations (net of tax): |
|
|
|
|
|
|
|
|
|
|
|
|
||||
Remeasurement loss on severance plan |
|
|
|
|
|
( |
) |
|
|
( |
) |
|
|
( |
) |
|
Other comprehensive income/(loss), net of tax |
|
|
|
|
|
|
|
|
( |
) |
|
|
( |
) |
||
Total comprehensive (loss)/income for the year, net of tax |
|
|
|
|
$ |
( |
) |
|
$ |
|
|
$ |
|
|||
Total comprehensive (loss)/income attributable to: |
|
|
|
|
|
|
|
|
|
|
|
|
||||
Equity holders of the parent |
|
|
|
|
|
( |
) |
|
|
|
|
|
|
|||
Non-controlling interests |
|
|
27 |
|
|
|
|
|
|
|
|
|
( |
) |
||
|
|
|
|
|
$ |
( |
) |
|
$ |
|
|
$ |
|
|||
The accompanying notes are an integral part of these Consolidated financial statements
F-8
FARFETCH LIMITED AND SUBSIDIARIES
CONSOLIDATED STATEMENT OF FINANCIAL POSITION
(in $ thousands)
|
|
Note |
|
|
December 31, |
|
|
December 31, |
|
|||
Non-current assets |
|
|
|
|
|
|
|
|
|
|||
Other receivables |
|
|
17 |
|
|
$ |
|
|
$ |
|
||
Deferred tax assets |
|
|
10 |
|
|
|
|
|
|
|
||
Intangible assets |
|
|
11 |
|
|
|
|
|
|
|
||
Property, plant and equipment |
|
|
12 |
|
|
|
|
|
|
|
||
Right-of-use assets |
|
|
13 |
|
|
|
|
|
|
|
||
Investments |
|
|
14 |
|
|
|
|
|
|
|
||
Investments in associates |
|
|
14 |
|
|
|
|
|
|
|
||
Total non-current assets |
|
|
|
|
|
|
|
|
|
|||
Current assets |
|
|
|
|
|
|
|
|
|
|||
Inventories |
|
|
16 |
|
|
|
|
|
|
|
||
Trade and other receivables |
|
|
17 |
|
|
|
|
|
|
|
||
Current tax assets |
|
|
|
|
|
|
|
|
|
|||
Short-term investments |
|
|
15 |
|
|
|
|
|
|
- |
|
|
Derivative financial assets |
|
|
19 |
|
|
|
|
|
|
|
||
Cash and cash equivalents |
|
|
18 |
|
|
|
|
|
|
|
||
Total current assets |
|
|
|
|
|
|
|
|
|
|||
Total assets |
|
|
|
|
|
|
|
|
|
|||
Liabilities and equity |
|
|
|
|
|
|
|
|
|
|||
Non-current liabilities |
|
|
|
|
|
|
|
|
|
|||
Provisions |
|
|
22 |
|
|
|
|
|
|
|
||
Deferred tax liabilities |
|
|
10 |
|
|
|
|
|
|
|
||
Lease liabilities |
|
|
13 |
|
|
|
|
|
|
|
||
Employee benefit obligations |
|
|
23 |
|
|
|
|
|
|
|
||
Derivative financial liabilities |
|
19,20 |
|
|
|
|
|
|
|
|||
Borrowings |
|
|
20 |
|
|
|
|
|
|
|
||
Put and call option liabilities |
|
|
21 |
|
|
|
|
|
|
|
||
Other financial liabilities |
|
|
19 |
|
|
|
|
|
|
|
||
Total non-current liabilities |
|
|
|
|
|
|
|
|
|
|||
Current liabilities |
|
|
|
|
|
|
|
|
|
|||
Trade and other payables |
|
|
24 |
|
|
|
|
|
|
|
||
Provisions |
|
|
22 |
|
|
|
|
|
|
|
||
Current tax liability |
|
|
|
|
|
|
|
|
|
|||
Lease liabilities |
|
|
13 |
|
|
|
|
|
|
|
||
Employee benefit obligations |
|
|
23 |
|
|
|
|
|
|
|
||
Derivative financial liabilities |
|
19,20 |
|
|
|
|
|
|
|
|||
Put and call option liabilities |
|
|
21 |
|
|
|
|
|
|
|
||
Other financial liabilities |
|
|
19 |
|
|
|
|
|
|
|
||
Total current liabilities |
|
|
|
|
|
|
|
|
|
|||
Total liabilities |
|
|
|
|
|
|
|
|
|
|||
Equity |
|
|
|
|
|
|
|
|
|
|||
Equity attributable to owners of the parent |
|
|
|
|
|
|
|
|
|
|||
Non-controlling interests |
|
|
27 |
|
|
|
|
|
|
|
||
Total equity |
|
|
|
|
|
|
|
|
|
|||
Total equity and liabilities |
|
|
|
|
$ |
|
|
$ |
|
|||
The accompanying notes are an integral part of these Consolidated financial statements
F-9
FARFETCH LIMITED AND SUBSIDIARIES
CONSOLIDATED STATEMENT OF CHANGES IN EQUITY/(DEFICIT) (in $ thousands)
|
|
Share |
|
|
Share |
|
|
Merger |
|
|
Foreign |
|
|
Other |
|
|
Accumulated |
|
|
Equity/(deficit) attributable to owners of the parent |
|
|
Non-controlling |
|
|
Total equity/ (deficit) |
|
|||||||||
Balance at December 31, 2019 |
|
|
|
|
|
|
|
|
|
|
|
( |
) |
|
|
|
|
|
( |
) |
|
|
|
|
|
|
|
|
|
|||||||
Changes in equity/(deficit) |
|
|
|
|
|
|
|
|
|
|
|
|
|
|
|
|
|
|
|
|
|
|
|
|
|
|
|
|||||||||
(Loss)/profit after tax for the year |
|
|
|
|
|
|
|
|
|
|
|
|
( |
) |
|
|
( |
) |
|
|
|
|
|
( |
) |
|||||||||||
Other comprehensive income |
|
|
|
|
|
|
|
|
|
|
|
|
|
|
|
|
|
|
|
|
|
|
|
|
||||||||||||
Total comprehensive income/(loss) for the year, |
|
|
|
|
|
|
|
|
|
|
|
|
|
|
|
|
|
( |
) |
|
|
( |
) |
|
|
|
|
|
( |
) |
||||||
Gain on cashflow hedge transferred to inventory |
|
|
|
|
|
|
|
|
|
|
( |
) |
|
|
|
|
( |
) |
|
|
|
|
( |
) |
||||||||||||
Issue of share capital, net of transaction costs |
|
|
|
|
|
|
|
|
|
|
|
|
|
|
|
|
|
|
|
|
|
|
|
|
|
|||||||||||
Share-based payment – equity-settled |
|
|
|
|
|
|
|
|
|
|
|
|
|
|
|
|
|
|
|
|
|
|
|
|||||||||||||
Share-based payment- reverse vesting shares |
|
|
|
|
|
|
|
|
|
|
|
|
|
|
|
|
|
|
|
|
|
|
||||||||||||||
Acquisition of non-controlling interest |
|
|
|
|
|
|
|
|
|
|
|
|
|
|
|
|
|
|
|
|
|
|
||||||||||||||
Dividends to non-controlling interests |
|
|
|
|
|
|
|
|
|
|
|
|
|
|
|
|
|
|
( |
) |
|
|
( |
) |
||||||||||||
Balance at December 31, 2020 |
|
|
|
|
|
|
|
|
|
|
|
( |
) |
|
|
|
|
|
( |
) |
|
|
( |
) |
|
|
|
|
|
( |
) |
|||||
Changes in equity/(deficit) |
|
|
|
|
|
|
|
|
|
|
|
|
|
|
|
|
|
|
|
|
|
|
|
|
|
|
|
|||||||||
Profit after tax for the year |
|
|
|
|
|
|
|
|
|
|
|
|
|
|
|
|
|
|
|
|
|
|
|
|
|
|
|
|||||||||
Other comprehensive loss |
|
|
|
|
|
|
|
|
|
|
|
( |
) |
|
|
( |
) |
|
|
|
|
|
( |
) |
|
|
( |
) |
|
|
( |
) |
||||
Total comprehensive (loss)/income for the year, |
|
|
|
|
|
|
|
|
|
|
|
( |
) |
|
|
( |
) |
|
|
|
|
|
|
|
|
|
|
|
|
|||||||
Loss on cashflow hedge transferred to inventory |
|
|
|
|
|
|
|
|
|
|
|
|
|
|
|
|
|
|
|
|
|
|
||||||||||||||
Issue of share capital, net of transaction costs |
|
|
|
|
|
|
|
|
|
|
|
|
|
|
|
|
|
|
|
|
|
|
||||||||||||||
Early conversion of convertible loan notes |
|
|
|
|
|
|
|
|
|
|
|
|
|
|
|
|
|
|
|
|
|
|
|
|
|
|
|
|||||||||
Share-based payment – equity-settled |
|
|
|
|
|
|
|
|
|
|
|
|
|
|
|
|
|
|
|
|
|
|
|
|||||||||||||
Share-based payment- reverse vesting shares |
|
|
|
|
|
|
|
|
|
|
|
|
( |
) |
|
|
|
|
|
|
|
|
|
|
|
|||||||||||
Acquisition of non-controlling interest |
|
|
|
|
|
|
|
|
|
|
( |
) |
|
|
|
|
( |
) |
|
|
( |
) |
|
|
( |
) |
||||||||||
Dividends to non-controlling interests |
|
|
|
|
|
|
|
|
|
|
|
|
|
|
|
|
|
|
( |
) |
|
|
( |
) |
||||||||||||
Non-controlling interest arising on purchase of asset |
|
|
|
|
|
|
|
|
|
|
|
|
|
|
|
|
|
|
|
|
|
|
|
|
||||||||||||
Share issued on purchase of subsidiary |
|
|
|
|
|
|
|
|
|
|
|
|
|
|
|
|
|
|
|
|
|
|
|
|
|
|
|
|||||||||
Step acquisition |
|
|
|
|
|
|
|
|
|
|
|
|
|
|
|
|
|
|
|
|
|
|
||||||||||||||
Non-controlling interest |
|
|
|
|
|
|
|
|
|
|
( |
) |
|
|
|
|
( |
) |
|
|
|
|
|
( |
) |
|||||||||||
Farfetch China Holdings Ltd put call option |
|
|
|
|
|
|
|
|
|
|
( |
) |
|
|
|
|
( |
) |
|
|
|
|
|
( |
) |
|||||||||||
Capital contribution from non-controlling interests, net of transaction costs |
|
|
|
|
|
|
|
|
|
|
|
|
|
|
|
|
|
|
( |
) |
|
|
|
|||||||||||||
Other |
|
|
|
|
|
|
|
|
|
|
( |
) |
|
|
|
|
|
( |
) |
|
|
|
|
|
|
|||||||||||
Balance at December 31, 2021 |
|
$ |
|
|
$ |
|
|
$ |
|
|
$ |
( |
) |
|
$ |
|
|
$ |
( |
) |
|
$ |
|
|
$ |
|
|
$ |
|
|||||||
Changes in equity/(deficit) |
|
|
|
|
|
|
|
|
|
|
|
|
|
|
|
|
|
|
|
|
|
|
|
|
|
|
|
|||||||||
Profit after tax for the year |
|
|
|
|
|
|
|
|
|
|
|
|
|
|
|
|
|
|
|
|
|
|
|
( |
) |
|
|
|
||||||||
Other comprehensive loss |
|
|
|
|
|
|
|
|
|
|
|
( |
) |
|
|
( |
) |
|
|
|
|
|
( |
) |
|
|
( |
) |
|
|
( |
) |
||||
Total comprehensive (loss)/income for the year, |
|
|
|
|
|
|
|
|
|
|
|
( |
) |
|
|
( |
) |
|
|
|
|
|
|
|
|
( |
) |
|
|
|
||||||
Gain on cashflow hedge transferred to inventory |
|
|
|
|
|
|
|
|
|
|
|
|
|
|
( |
) |
|
|
|
|
|
( |
) |
|
|
|
|
|
( |
) |
||||||
Issue of share capital, net of transaction costs |
|
|
|
|
|
|
|
|
|
|
|
|
|
|
|
|
|
|
|
|
|
|
|
|
|
|
|
|||||||||
Share-based payment – equity-settled |
|
|
|
|
|
|
|
|
|
|
|
|
|
|
|
|
|
|
|
|
|
|
|
|
|
|
|
|||||||||
Share-based payment- reverse vesting shares |
|
|
|
|
|
|
|
|
|
|
|
|
|
|
|
|
|
|
|
|
|
|
|
|
|
|
|
|||||||||
Dividends to non-controlling interests |
|
|
|
|
|
|
|
|
|
|
|
|
|
|
|
|
|
|
|
|
|
|
|
( |
) |
|
|
( |
) |
|||||||
Non-controlling interest arising on purchase of asset |
|
|
|
|
|
|
|
|
|
|
|
|
|
|
|
|
|
|
|
|
|
|
|
|
|
|
|
|||||||||
Repayment of convertible loan note |
|
|
|
|
|
|
|
|
|
|
|
|
|
|
|
|
|
|
|
|
|
|
|
|
|
|
|
|||||||||
Other |
|
|
|
|
|
|
|
|
|
|
|
|
|
|
|
|
|
( |
) |
|
|
( |
) |
|
|
|
|
|
( |
) |
||||||
Balance at December 31, 2022 |
|
$ |
|
|
$ |
|
|
$ |
|
|
$ |
( |
) |
|
$ |
|
|
$ |
( |
) |
|
$ |
|
|
$ |
|
|
$ |
|
|||||||
The accompanying notes are an integral part of these Consolidated financial statements.
F-10
FARFETCH LIMITED AND SUBSIDIARIES
CONSOLIDATED STATEMENT OF CASH FLOWS
for the year ended December 31,
(in $ thousands)
|
|
Note |
|
|
2020 |
|
|
2021 |
|
|
2022 |
|
||||
Cash flows from operating activities |
|
|
|
|
|
|
|
|
|
|
|
|
||||
Operating loss |
|
|
|
|
$ |
( |
) |
|
$ |
( |
) |
|
$ |
( |
) |
|
Adjustments to reconcile operating loss to net cash inflow/(outflow) from operating activities: |
|
|
|
|
|
|
|
|
|
|
|
|
||||
Depreciation |
|
12,13 |
|
|
|
|
|
|
|
|
|
|
||||
Amortization |
|
|
11 |
|
|
|
|
|
|
|
|
|
|
|||
Non-cash employee benefits expense |
|
|
|
|
|
|
|
|
|
|
|
|
||||
Impairment losses on tangible assets |
|
12,13 |
|
|
|
|
|
|
|
|
|
|
||||
Impairment losses on intangible assets |
|
|
11 |
|
|
|
|
|
|
|
|
|
|
|||
Impairment of investments |
|
|
|
|
|
|
|
|
|
|
|
|
||||
Changes in working capital |
|
|
|
|
|
|
|
|
|
|
|
|
||||
Increase in receivables |
|
|
|
|
|
( |
) |
|
|
( |
) |
|
|
( |
) |
|
Increase in inventories |
|
|
|
|
|
( |
) |
|
|
( |
) |
|
|
( |
) |
|
Increase/(decrease) in payables |
|
|
|
|
|
|
|
|
|
|
|
( |
) |
|||
Changes in other assets and liabilities |
|
|
|
|
|
|
|
|
|
|
|
|
||||
(Increase)/decrease in non-current receivables |
|
|
|
|
|
( |
) |
|
|
|
|
|
|
|||
Increase/(decrease) in other liabilities |
|
|
|
|
|
|
|
|
( |
) |
|
|
( |
) |
||
Increase/(decrease) in provisions |
|
|
|
|
|
|
|
|
( |
) |
|
|
( |
) |
||
(Decrease)/increase in derivative financial instruments |
|
|
|
|
|
( |
) |
|
|
|
|
|
( |
) |
||
Income taxes paid |
|
|
|
|
|
( |
) |
|
|
( |
) |
|
|
( |
) |
|
Net cash inflow/(outflow) from operating activities |
|
|
|
|
|
|
|
|
( |
) |
|
|
( |
) |
||
Cash flows from investing activities |
|
|
|
|
|
|
|
|
|
|
|
|
||||
Acquisition of subsidiaries, net of cash acquired |
|
|
31 |
|
|
|
( |
) |
|
|
( |
) |
|
|
( |
) |
Payments for property, plant and equipment |
|
|
12 |
|
|
|
( |
) |
|
|
( |
) |
|
|
( |
) |
Payments for intangible assets |
|
|
11 |
|
|
|
( |
) |
|
|
( |
) |
|
|
( |
) |
Interest received |
|
|
|
|
|
|
|
|
|
|
|
|
||||
Increase in short-term investments |
|
|
15 |
|
|
|
|
|
|
( |
) |
|
|
|
||
Decrease in short-term investments |
|
|
15 |
|
|
|
|
|
|
|
|
|
|
|||
Dividends received from associate |
|
|
|
|
|
|
|
|
|
|
|
|
||||
Payments for investments |
|
|
14 |
|
|
|
( |
) |
|
|
( |
) |
|
|
( |
) |
Proceeds on disposal of investment |
|
|
|
|
|
|
|
|
|
|
|
|
||||
Net cash outflow from investing activities |
|
|
|
|
|
( |
) |
|
|
( |
) |
|
|
( |
) |
|
Cash flows from financing activities |
|
|
|
|
|
|
|
|
|
|
|
|
||||
Proceeds from issue of shares, net of issue costs |
|
|
|
|
|
|
|
|
|
|
|
|
||||
Proceeds from exercise of employee share-based awards |
|
|
|
|
|
|
|
|
|
|
|
|
||||
Transaction costs paid relating to capital contribution from non-controlling interest |
|
|
27 |
|
|
|
|
|
|
( |
) |
|
|
|
||
Repayment of the principal elements of lease payments |
|
|
|
|
|
( |
) |
|
|
( |
) |
|
|
( |
) |
|
Proceeds from borrowings, net of issue costs |
|
|
20 |
|
|
|
|
|
|
|
|
|
|
|||
Payment for the repurchase of convertible loan notes |
|
|
|
|
|
|
|
|
|
|
|
( |
) |
|||
Dividends paid to holders of non-controlling interests |
|
|
27 |
|
|
|
( |
) |
|
|
( |
) |
|
|
( |
) |
Interest and fees paid on loans |
|
|
|
|
|
( |
) |
|
|
( |
) |
|
|
( |
) |
|
Acquisition of non-controlling interests |
|
|
|
|
|
|
|
|
( |
) |
|
|
|
|||
Settlement of equity-based awards |
|
|
|
|
|
|
|
|
( |
) |
|
|
( |
) |
||
Capital contribution from non-controlling interest |
|
|
27 |
|
|
|
|
|
|
|
|
|
|
|||
Net cash inflow from financing activities |
|
|
|
|
|
|
|
|
|
|
|
|
||||
Net increase/(decrease) in cash and cash equivalents |
|
|
|
|
|
|
|
|
( |
) |
|
|
( |
) |
||
Cash and cash equivalents at the beginning of the year |
|
|
18 |
|
|
|
|
|
|
|
|
|
|
|||
Effects of exchange rate changes on cash and cash equivalents |
|
|
|
|
|
|
|
|
( |
) |
|
|
( |
) |
||
Cash and cash equivalents at end of year |
|
|
|
|
$ |
|
|
$ |
|
|
$ |
|
||||
The accompanying notes are an integral part of these Consolidated financial statements
F-11
Notes to the Consolidated financial statements
Farfetch Limited (the “Company”) is an exempted company incorporated with limited liability under the Companies Act (as amended) of the Cayman Islands, as amended and restated from time to time (the “Companies Act”). The principal place of business is The Bower, 211 Old Street, London, EC1V 9NR, United Kingdom. Farfetch Limited and its subsidiary undertakings (the “Group”) is principally engaged in the following:
These financial statements were authorized for issue by the Board on March 8, 2023.
Effects of the COVID-19 pandemic and Russia-Ukraine conflict
More than two years after the COVID-19 pandemic was declared, it is still impossible to predict all the effects and the ultimate impact of the COVID-19 pandemic, as the situation continues to evolve and cause uncertainties within the global economy. The extent of these impacts on our financial and operating results will be dictated by the length of time that the pandemic and the related counter-measures continue, in addition to individuals’ and companies’ risk tolerance regarding health matters going forward. Management will continue to closely monitor the effects of the pandemic, including its impact on inventories and other significant estimates. During March 2022, the Chinese government implemented new lockdowns in major cities such as Shanghai and Shenzhen, resulting in significant disruption to the China market. During October 2022, the Chinese government initiated a further series of lockdowns. During the year ended December 31, 2022, mainland China revenues on a demand basis decreased
During February 2022, Russia invaded Ukraine. Sanctions imposed by other nations in response, including the United States and United Kingdom, resulted in a pause of our Russian operations and deliveries to Russian customers. During the year ended December 31, 2022, Russia revenues on a demand basis decreased
Both mainland China and Russia revenues on a demand basis are included within Other within our segmental disclosure as these represent less than
The Consolidated financial statements of the Group have been prepared in accordance with International Financial Reporting Standards (“IFRS”) as issued by the International Accounting Standards Board (“IASB”). These Consolidated financial statements have been prepared under the historical cost convention, except as modified by the revaluation of certain financial assets and financial liabilities at fair value through profit and loss ("FVTPL") and fair value through other comprehensive income ("FVTOCI").
The Directors have made an assessment of the Group’s ability to continue in operational existence for the foreseeable future and are satisfied that it is appropriate to continue to adopt the going concern basis of accounting in preparing the Consolidated financial statements.
F-12
Notes to the Consolidated financial statements (continued)
The Consolidated financial statements are presented in U.S. dollars (“U.S. dollars” or “USD” or “$”). All values are rounded to the nearest 1,000 dollars, except where indicated. The tables in these notes are shown in USD thousands, except where indicated.
The Consolidated financial statements comprise the Consolidated financial statements of the Group and its subsidiaries. Control is achieved when the Group is exposed, or has rights, to variable returns from its involvement with the investee and has the ability to affect those returns through its power over the investee.
Generally, there is a presumption that a majority of voting rights results in control. To support this presumption and when the Group has less than a majority of the voting or similar rights of an investee, the Group considers all relevant facts and circumstances in assessing whether it has power over an investee, including:
The Group re-assesses whether or not it controls an investee if facts and circumstances indicate that there are changes to one or more of the three elements of control. Consolidation of a subsidiary begins when the Group obtains control over the subsidiary and ceases when the Group loses control of the subsidiary. Assets, liabilities, income and expenses of a subsidiary acquired or disposed of during the year are included in the Consolidated financial statements from the date the Group gains control until the date control ceases. Profit or loss and each component of other comprehensive income (“OCI”) are attributed to the equity holders of the parent of the Group and to the non-controlling interests. When necessary, adjustments are made to the consolidated financial statement of subsidiaries to bring their accounting policies into line with the Group’s accounting policies. All intra-group assets and liabilities, equity, income, expenses and cash flows relating to transactions between members of the Group are eliminated in full on consolidation. A change in the ownership interest of a subsidiary, without a loss of control, is accounted for as an equity transaction.
Business combinations are accounted for using the acquisition method. The cost of an acquisition is measured as the aggregate of the consideration transferred measured at acquisition date fair value and the amount of any non-controlling interests in the acquiree. For each business combination, the Group measures the non-controlling interests in the acquiree at the proportionate share of the acquiree’s identifiable net assets.
When the Group acquires a business, it assesses the financial assets and liabilities assumed for classification and designation in accordance with the contractual terms, economic circumstances and pertinent conditions as at the acquisition date.
Any contingent consideration to be transferred by the Group is recognized at fair value at the acquisition date and is subsequently measured at fair value with changes in fair value recognized in profit or loss.
Refer to Note 31, Business Combinations for additional information.
The Group recognizes an investment in an associate when the Group has a significant influence over that entity. Significant influence is the power to participate in the financial and operating policy decisions of the investee, but is not control or joint control over those policies. The Group’s investments in its associates, Farfetch Capital Limited (formerly Farfetch Finance Limited) and Alanui S.r.l ("Alanui") (up until March 1, 2021), are accounted for using the equity method.
F-13
Notes to the Consolidated financial statements (continued)
Under the equity method of accounting, the investments are initially recognized at cost and adjusted thereafter to recognize the Group’s share of the post-acquisition profits or losses of the investee in profit or loss, and the Group’s share of movements in other comprehensive income of the investee in OCI.
The Group presents assets and liabilities in the Consolidated statement of financial position based on current/non-current classification.
An asset is current when it is:
All other assets are classified as non-current.
A liability is current when:
The Group classifies all other liabilities as non-current.
This section outlines the Group's policies applicable to financial instruments that are recognized and measured at fair value in the Consolidated financial statements.
Fair value is the price that would be received to sell an asset or paid to transfer a liability in an orderly transaction between market participants at the measurement date. The fair value measurement is based on the presumption that the transaction to sell the asset or transfer the liability takes place either:
The principal or the most advantageous market must be accessible by the Group.
The fair value of an asset or a liability is measured using the assumptions that market participants would use when pricing the asset or liability, assuming that market participants act in their economic best interest.
The Group uses valuation techniques that are applicable in the circumstances and for which sufficient data is available to measure fair value, maximizing the use of relevant observable inputs and minimizing the use of unobservable inputs.
F-14
Notes to the Consolidated financial statements (continued)
All assets and liabilities for which fair value is measured or disclosed in the Consolidated financial statements are categorized within the fair value hierarchy, described as follows, based on the lowest level input that is significant to the fair value measurement as a whole:
For assets and liabilities that are recognized in the Consolidated financial statements on a recurring basis, the Group determines whether transfers have occurred between levels in the hierarchy by re-assessing categorization (based on the lowest level input that is significant to the fair value measurement as a whole) as at the end of each reporting year.
Revenue is recognized in accordance with the five-step model under IFRS 15:
Retailing of goods
Revenue, where the Group acts as a principal, is recognized when the performance obligation is satisfied which is when the goods are received by the consumer. Included within sales of goods is a provision for expected returns, discounts and rebates. Where these are not known, the Group uses historical data and patterns to calculate an estimate.
Rendering of services
The Group primarily acts as a commercial intermediary between sellers, being the brands and retailers, and end consumers and earns a commission for this service.
For these arrangements, the sellers determine the transaction price of the goods sold on the website, being the purchase price paid by the consumer, with the Group acting as an agent for the sellers and the related revenue is recognized on a net basis. The Group also charges fees to sellers for activities related to providing this service, such as packaging, credit card processing, settlement of duties, and other transaction processing activities. These activities are not considered separate promises to the consumer, and the related fees are therefore recognized concurrently with commissions at the time the performance obligation to facilitate the transaction between the seller and end consumer is satisfied, which is when the goods are dispatched to the end consumer by the seller. A provision is made for commissions that would be refunded if the end consumer returns the goods, and the Group uses historical data and patterns to estimate its return provision. There are no significant payment terms, with the Group taking payment in full from the consumer’s chosen payment method at the time the goods are ready for dispatch by the seller.
F-15
Notes to the Consolidated financial statements (continued)
The Group also provides delivery services to end consumers, with the Group setting the transaction price, being the price paid by the consumer for goods purchased on its platform. For these services, the Group acts as the principal and recognizes as revenue amounts charged to end consumers net of any promotional incentives and discounts. Revenue for these services is recognized on delivery of goods to the end consumer, which represents the point in time at which the Group’s performance obligation is satisfied. No provision for returns is made as delivery revenue is not subject to refund. Promotional incentives, which include basket promo-code discounts, may periodically be offered to end consumers. These are treated as a deduction to revenue. Cash is collected by the Group from the end consumer using payment service providers. Within
Current tax is the expected tax payable based on the taxable profit for the period, and the tax laws that have been enacted or substantively enacted by the reporting date. Management periodically evaluates positions taken in tax returns with respect to situations in which applicable tax regulation is subject to interpretation. It establishes provisions where required on the basis of amounts expected to be paid to the tax authorities.
Deferred tax is recognized on differences between the carrying amounts of assets and liabilities in the Consolidated financial statements and the corresponding tax bases used in the computation of taxable profit, and is accounted for using the balance sheet liability method. Deferred tax liabilities are generally recognized for all taxable temporary differences and deferred tax assets are recognized to the extent that it is probable that there are sufficient suitable deferred tax liabilities or future taxable profits will be available against which deductible temporary differences can be utilized. Such assets and liabilities are not recognized if the temporary difference arises from goodwill or from the initial recognition (other than in a business combination) of other assets and liabilities in a transaction that affects neither the tax profit nor the accounting profit. Current and deferred tax is charged or credited in the Consolidated statement of operations, except when it relates to items charged or credited directly to equity, in which case the current or deferred tax is also recognized directly in equity.
The carrying amount of deferred tax assets is reviewed at each reporting date and reduced to the extent that it is no longer probable that sufficient taxable profits will be available to allow all or part of the asset to be recovered. Deferred tax is calculated at the tax rates and in accordance with laws that are expected to apply in the period/jurisdiction when/where the liability is settled, or the asset is realized.
Deferred tax assets and liabilities are offset where there is a legally enforceable right to offset current tax assets against current tax liabilities and when the deferred tax assets and liabilities relate to income taxes levied by the same taxation authority on either the taxable entity or different taxable entities and where there is an intention to settle the balances on a net basis.
Uncertainty over Income Tax Treatment
The Group operates across a large number of jurisdictions and could be subject to periodic audit by local tax authorities on a range of tax matters during the normal course of business, including transfer pricing, indirect taxes and transaction related issues. Where the amount of tax payable or recoverable is uncertain, the Group establishes provisions based on either: the Group’s judgment of the most likely amount of the liability or recovery; or, when there is a wide range of possible outcomes, a probability weighted average approach.
The Group’s Consolidated financial statements are presented in U.S. dollars. For each entity the Group determines the functional currency and items included in the Consolidated financial statements of each entity are measured using that functional currency. The functional currency of the Group is U.S. dollars.
F-16
Notes to the Consolidated financial statements (continued)
Transactions in foreign currencies are initially recorded by the Group’s entities at their respective functional currency spot rates at the date the transaction first qualifies for recognition. Monetary assets and liabilities denominated in foreign currencies are translated at the functional currency spot rates of exchange at the reporting date. Differences arising on settlement or translation of monetary items are recognized in profit or loss.
Non-monetary items that are measured in terms of historical cost in a foreign currency are translated using the exchange rates at the dates of the initial transactions. Non-monetary items measured at fair value in a foreign currency are translated using the exchange rates at the date when the fair value is determined. The gain or loss arising on translation of non-monetary items measured at fair value is treated in line with the recognition of the gain or loss on the change in fair value of the item (i.e., translation differences on items whose fair value gain or loss is recognized in OCI or profit or loss are also recognized in OCI or profit or loss, respectively).
On consolidation, the assets and liabilities of foreign operations are translated into U.S. dollars at the rate of exchange prevailing at the reporting date and their statements of profit or loss are translated at average exchange rates. The exchange differences arising on translation for consolidation are recognized in OCI.
Property, plant and equipment is stated at cost, net of accumulated depreciation and accumulated impairment losses, if any. All repair and maintenance costs are recognized in profit or loss as incurred.
Items of property, plant and equipment are depreciated with an expense recognized in depreciation and amortization expense on a straight-line basis over their useful life.
The useful lives of these items are assessed as follows:
Leasehold improvements |
|
|
Fixtures and fittings |
|
to |
Motor vehicles |
|
to |
Plant, machinery and equipment |
|
to |
The residual values, useful lives and methods of depreciation of property, plant and equipment are reviewed at each financial year end and adjusted prospectively, if necessary.
The determination of whether an arrangement is (or contains) a lease is based on the substance of the arrangement at the inception of the lease. The arrangement is (or contains) a lease if fulfilment of the arrangement is dependent on the use of a specific asset or assets and the arrangement conveys a right to use the asset or assets, even if that right is not explicitly specified in an arrangement.
Intangible assets acquired separately are measured on initial recognition at cost. The cost of intangible assets acquired in a business combination is their fair value at the date of acquisition. Following initial recognition, intangible assets are carried at cost less any accumulated amortization and accumulated impairment losses. Internally generated intangibles, excluding capitalized development costs, are not capitalized and the related expenditure is reflected in profit or loss in the period in which the expenditure is incurred. The useful lives of intangible assets are assessed as either finite or indefinite.
F-17
Notes to the Consolidated financial statements (continued)
Intangible assets with finite lives are amortized over the useful economic life and assessed for impairment whenever there is an indication that the intangible asset may be impaired. The amortization period and the amortization method for an intangible asset with a finite useful life are reviewed at least at the end of each reporting period. Changes in the expected useful life or the expected pattern of consumption of future economic benefits embodied in the asset are considered to modify the amortization period or method, as appropriate, and are treated as changes in accounting estimates. The amortization expense on intangible assets with finite lives is recognized in the Consolidated statement of operations in the expense category that is consistent with the function of the intangible assets. Other than goodwill, there are
Goodwill is not amortized but is reviewed for impairment at least annually. For the purpose of impairment testing, goodwill is allocated to the relevant Cash Generating Units (“CGUs”) which are tested for impairment annually. If the recoverable amount of the CGU is less than the carrying amount of the unit, the impairment loss is allocated first to reduce the carrying amount of any goodwill allocated to the unit and then to the other assets of the unit pro-rata on the basis of the carrying amount of each asset in the unit. On disposal of a CGU, the attributable amount of goodwill is included in the determination of the profit or loss on disposal. Refer to Note 2.3 (n), Summary of significant accounting policies – Impairment of non-financial assets for the Group’s policy on the impairment of non-financial assets.
Research and development costs
Research costs are expensed as incurred. Development expenditures on an individual project are recognized as an intangible asset when the Group can demonstrate:
Following initial recognition of the development expenditure as an asset, the asset is carried at cost less any accumulated amortization and accumulated impairment losses. Amortization of the asset begins when development is complete and the asset is available for use. It is amortized over the period of expected future benefit. Amortization is recorded in administrative expenses. Development intangible assets under the course of construction are tested for impairment annually or more frequently if events or changes in circumstance indicate that they might be impaired. Once placed into service the asset is tested for impairment whenever events or changes in circumstance indicate that the carrying amount may not be recoverable.
Subsequent costs
Subsequent costs are only capitalized when there is an increase in the anticipated future economic benefit attributable to the assets in question. All other subsequent costs are recorded in the Consolidated statement of operations for the year in which they are incurred.
F-18
Notes to the Consolidated financial statements (continued)
Acquisition of Palm Angels S.r.l (Palm Angels)
During the year ended December 31, 2021, the Group completed the acquisition of
Capitalization of minimum contractual royalty payments
During the year ended December 31, 2022, the Group entered into a commercial agreement with Authentic Brands Group LLC for the exclusive distribution rights of Reebok-branded footwear and apparel ranges within certain countries in the European region. As part of this transaction the Group was contractually obligated to pay minimum contractual royalty payments over an
Amortization
Amortization is charged to depreciation and amortization expense on a straight-line basis over the estimated useful life of the intangible assets, from the time that the assets are available for use. The useful lives of these items are assessed as follows:
Development costs |
|
|
Brand, trademarks & domain names |
|
to |
Customer relationships |
|
to |
Acquired software |
|
to |
At the inception date of the lease (i.e., the date when the underlying asset is available for use), a lessee recognizes a liability for the present value of the lease payments payable over the lease term and a right of use asset that represents the right to use the underlying asset over the term of the lease. Right of use assets are measured at cost less accumulated depreciation and impairment losses, and are adjusted for any remeasurement of lease liabilities. The cost of right of use assets includes the amount of initial direct costs incurred and lease payments made before the commencement date less incentives received. Right-of-use assets are depreciated on a straight-line basis over the shorter of the estimated useful life of the underlying asset and the lease term.
The Group does not recognize non-lease components separately from lease components for those classes of assets in which non-lease components are not significant with respect to the total value of the arrangement.
F-19
Notes to the Consolidated financial statements (continued)
Lease payments include fixed payments (including in-substance fixed payments) less any lease incentive receivable, variable lease payments that depend on an index or rate and amounts expected to be paid as residual value guarantees. Similarly, the measurement of the lease liability includes the exercise price of a purchase option, if the lessee is reasonably certain to exercise that option, and payments of penalties for early termination, if the lease term reflects the lessee exercising such cancellation option. For the calculation of the present value of the lease payments, the Group uses the incremental borrowing rate at the start date of the lease if the interest rate implicit in the lease is not available. After the commencement date, the amount of the lease liabilities is increased to reflect the accrual of interest and reduced for payments made. In addition to this, the carrying amount of the lease liability is remeasured in certain cases, such as changes in the lease term, or changes in future lease payments resulting from a change in an index or rate used to determine those payments. The amount of such remeasurements is generally recognized against an adjustment to the right of use asset.
The Group determines the lease term as the non-cancellable term of the contract, together with any period covered by an extension (or termination) option whose exercise is discretionary for the Group, if there is reasonable certainty that it will be exercised (or it will not be exercised). In its assessment, the Group considers all available information by asset class in the industry and evaluates all relevant factors (technology, regulation, competition, business model, etc.) that create an economic incentive to exercise or not a renewal/cancellation option. In particular, the Group takes into consideration the time horizon of the strategic planning of its operations. After the commencement date, the Group reassesses the lease term if there is a significant event or change in circumstances that is within its control that may affect its ability to exercise (or not to exercise) an option to extend or terminate (for example, a change in business strategy).
Lessors classify all leases using the classification principles in IFRS 16 – Leases and distinguish between operating and finance leases. Leases in which the lessor retains a significant portion of the risks and rewards of ownership of the leased asset are treated as operating leases. Otherwise, the lease is a finance lease.
Inventories are carried at the lower of cost and the net realizable value based on market performance, including the relative ancillary selling costs. The cost of inventories is calculated according to the First In, First Out (“FIFO”) method for each category of goods and includes purchase costs and costs incurred to bring the inventories to their present location and condition. In order to represent the value of inventories in the Consolidated statement of financial position, and to take into account impairment losses due to obsolete materials and slow inventory movement, obsolescence provisions have been directly deducted from the carrying amount of the inventories.
A financial instrument is any contract that gives rise to a financial asset of one entity and a financial liability or equity instrument of another entity.
Financial assets
The Group's financial assets comprise cash and cash equivalents, receivables, minority investments and derivative financial instruments. Derivative financial instruments are comprised of forward exchange contracts, foreign exchange option contracts and interest rate swaps, which are measured at FVTPL, unless they are formally designated and measured as cash flow hedges. Where derivative financial instruments are formally designated and measured as cash flow hedges, any changes in fair value are recognized in OCI if effective.
F-20
Notes to the Consolidated financial statements (continued)
Trade receivables are accounted for at amortized cost. The Group assesses on a forward-looking basis the expected credit losses associated with its trade receivables carried at amortized cost.
Financial assets measured at fair value through profit or loss are measured initially at fair value with transaction costs recognized directly in the Consolidated statement of operations. Subsequently, the financial assets are remeasured, and gains and losses are recognized in the Consolidated statement of operations.
Financial assets measured at FVTOCI are measured initially at fair value. Subsequently, the financial assets are remeasured, and gains and losses are recognized in OCI.
Financial liabilities
The Group’s financial liabilities comprise trade and other payables, interest bearing loans and borrowings, contingent consideration, derivative instruments on convertible notes (embedded derivatives), put and call option liabilities, foreign exchange contracts and interest rate swaps.
Trade and other payables are held at amortized cost.
All interest-bearing loans and borrowings are initially recognized at fair value net of issue costs associated with the borrowing. After initial recognition, interest bearing loans and borrowings are subsequently measured at amortized cost using the effective interest rate method.
Foreign exchange contracts are measured initially at fair value through profit or loss with transaction costs taken directly to the Consolidated statement of operations, unless they are formally designated and measured as cash flow hedges. Subsequently, the fair values are remeasured and gains and losses from changes therein are recognized in the Consolidated statement of operations.
Interest rate swap contracts designated in a formal effective cash flow hedge are initially measured at fair value with subsequent changes in the fair value of these instruments recognized in OCI.
Derivatives and hedging activities
Derivatives are initially recognized at fair value on the date a derivative contract is entered into and are subsequently remeasured to their fair value at the end of each reporting period.
Where the derivative is not designated as a cash-flow hedge, subsequent changes in the fair value are recognized in profit or loss.
The Group designates certain derivatives as cash flow hedges to hedge particular risks associated with the cash flows of highly probable forecast transactions.
At inception of the hedge relationship, the Group documents the relationship between hedging instruments and hedged items including whether changes in the cash flows of the hedging instruments are expected to offset changes in the cash flows of hedged items. The Group documents its risk management objective and strategy for undertaking its hedge transactions.
The effective portion of changes in the fair value of derivatives that are designated and qualify as cash flow hedges is recognized in the cash flow hedge reserve or time value reserve within equity. The gain or loss relating to the ineffective portion is recognized immediately in profit or loss.
Any gains or losses held in the cash flow hedge reserve are recycled to the Consolidated statement of operations or inventory in the Consolidated statement of financial position when the related hedged item is recognized.
If a hedge no longer meets the criteria for hedge accounting, or the forecast transaction is no longer highly probable, the cumulative gain or loss reported in equity is immediately reclassified to profit or loss.
F-21
Notes to the Consolidated financial statements (continued)
Embedded derivatives
Derivatives embedded in other financial instruments or other host contracts are treated as separate derivatives when their risks and characteristics are not closely related to those of the host contracts and the host contracts are not carried at fair value, with unrealized gains or losses reported in the Consolidated statement of operations. Embedded derivatives are carried on the Consolidated statement of financial position at fair value from the inception of the host contract. Changes in fair value are recognized in the Consolidated statement of operations during the period in which they arise.
The Group’s convertible notes embedded derivatives are accounted as financial instruments at FVTPL. The embedded derivatives were recorded at fair value on the date of debt issuance. They are subsequently remeasured at fair value at each reporting date, and the changes in the fair value are recorded in the Consolidated statement of operations within gain/(loss) on items at held at fair value and remeasurements. The fair values of the embedded derivatives are determined using an option pricing model, using assumptions based on market conditions at the reporting date.
Put and call option liabilities
The Group has put and call option liabilities relating to the non-controlling interests arising from the transactions with Alanui, Palm Angels and Chalhoub Group (“Chalhoub”) as well as the strategic arrangement with Alibaba Group Holding Limited (“Alibaba”) and Compagnie Financière Richemont SA (“Richemont”).
Put and call option liabilities are initially recognized at present value in other reserves within equity at inception of the option deed. Subsequently, at the end of the reporting period, the liabilities are revalued to present value with remeasurement gains and losses recognized in the Consolidated statement of operations.
Conversion of convertible notes
When the conversion of the Group’s convertible notes are settled through the issuance of shares in the Group, the carrying amount of the non-current borrowings and the fair value of the related embedded derivative at the conversion date are derecognized and reclassified to equity. Where the terms of a financial liability are renegotiated and the entity issues equity instruments to a note holder to extinguish all or part of the liability (debt for equity swap), a gain or loss is recognized in profit or loss, which is measured as the difference between the carrying amount of the financial liability and the fair value of the equity instruments issued.
The Group assesses, at each reporting date, whether there is an indication that an asset may be impaired. If any indication exists, or when annual impairment testing for an asset is required, the Group estimates the asset’s recoverable amount. An asset’s recoverable amount is the higher of an asset’s, CGU’s or group of CGU’s fair value less costs of disposal and its value in use. The recoverable amount is determined for an individual asset, unless the asset does not generate cash inflows that are largely independent of those from other assets or groups of assets. When the carrying amount of an asset or CGU exceeds its recoverable amount, the asset is considered impaired and is written down to its recoverable amount.
In assessing value in use, the estimated future cash flows are discounted to their present value using a pre-tax discount rate that reflects current market assessments of the time value of money and the risks specific to the asset. In determining fair value less costs of disposal, recent market transactions are taken into account.
The Group bases its impairment calculation on detailed budgets which are prepared separately for each of the Group’s CGUs to which the individual assets are allocated. These budgets and forecast calculations cover a period of to
F-22
Notes to the Consolidated financial statements (continued)
For assets excluding goodwill, an assessment is made at each reporting date to determine whether there is an indication that previously recognized impairment losses no longer exist or have decreased. If such indication exists, the Group estimates the asset’s or CGU’s recoverable amount, and reverses the previously recognized impairment loss to the extent the recoverable amount equals the carrying amount. If the recoverable amount of the CGU is less than the carrying amount of the unit, the impairment loss is allocated first to reduce the carrying amount of any goodwill allocated to the unit and then to the other assets of the unit pro-rata on the basis of the carrying amount of each asset in the unit. On disposal of a CGU, the attributable amount of goodwill is included in the determination of the profit or loss on disposal.
Goodwill and intangible assets are tested for impairment annually as of December 31 and when circumstances indicate that the carrying value may be impaired. Impairment is determined for goodwill by assessing the recoverable amount of each CGU (or group of CGUs) to which the goodwill relates. If the recoverable amount of the CGU is less than its carrying amount, an impairment loss is recognized. Impairment losses relating to goodwill cannot be reversed in future periods.
Provisions are recognized when the Group has a present obligation (legal or constructive) as a result of a past event, it is probable that an outflow of resources embodying economic benefits will be required to settle the obligation and a reliable estimate can be made of the amount of the obligation.
Employees (including senior executives) of the Group receive remuneration in the form of share-based payments, whereby employees render services as consideration. The consideration is either equity or cash settled, depending on the scheme.
Equity-settled transactions
The cost of equity-settled transactions is determined by the fair value at the date when the grant is made using a valuation model. That cost is recognized, together with a corresponding increase in other capital reserves in equity, over the period in which the performance and/or service conditions are fulfilled in employee benefits expense. The cumulative expense recognized for equity-settled transactions at each reporting date until the vesting date reflects the extent to which the vesting period has expired and the Group’s best estimate of the number of equity instruments that will ultimately vest. Where an award has market-based performance conditions, the fair value of the award is adjusted for the probability of achieving these via an appropriate valuation model. The Consolidated statement of operations expense or credit for a period represents the movement in cumulative expense recognized as of the beginning and end of that period.
The total amount recognized in the Consolidated statement of operations as an expense is adjusted to reflect the number of actual awards that vest, except where forfeiture is due to the failure to meet market based performance conditions.
Cash-settled transactions
For cash-settled share-based payments, a liability is recognized for the goods or services acquired, measured initially at the fair value of the liability. At each balance sheet date until the liability is settled, and at the date of settlement, the fair value of the liability is remeasured, with any changes in fair value recognized in profit or loss for the year.
Employment related taxes
Where the Group has an obligation to pay employment related taxes on share-based payments received by employees, these are provided for based on the intrinsic value of the vested and un-vested share options at the end of the reporting period.
F-23
Notes to the Consolidated financial statements (continued)
For the purpose of presentation in the Consolidated statement of cash flows, cash and cash equivalents includes cash on hand, deposits held at call with financial institutions, other short-term, highly liquid investments with original maturities of three months or less that are readily convertible to known amounts of cash and which are subject to an insignificant risk of changes in value, bank overdrafts and cash amounts held by payment service providers.
The Group has classified amounts held in money market funds as cash equivalents because those funds are short term in nature, highly liquid, readily convertible to known amounts of cash, and subject to an insignificant risk of changes in value. The Group has concluded on this classification because each of these EU-regulated funds have the highest credit rating available.
From time to time, the Group holds amounts of restricted cash. Restricted cash amounting to $
|
|
The accounting policies applied by the Group in these Consolidated financial statements are the same as those applied by the Group in its Consolidated financial statements for the year ended December 31, 2021, except for the adoption of new and amended standards as set out below.
Amendments to IFRSs that are mandatorily effective for the current year
The Group applied the following new and revised IFRS standards from January 1, 2022:
The changes in Onerous Contracts - Cost of Fulfilling a Contract (Amendments to IAS 37) specify that the “cost of fulfilling” a contract comprises the “costs that relate directly to the contract”. Costs that relate directly to a contract can either be incremental costs of fulfilling that contract (examples would be direct labor, materials) or an allocation of other costs that relate directly to fulfilling contracts (an example would be the allocation of the depreciation charge for an item of Property, Plant and Equipment used in fulfilling the contract). The adoption of these amendments did not have a material impact on the Consolidated financial statements.
This amendment to the standard serves to prohibit deducting from the cost of an item of property, plant and equipment any proceeds from selling items produced while bringing that asset to the location and condition necessary for it to be capable of operating in the manner intended by management. Instead, an entity recognizes the proceeds from selling such items, and the cost of producing those items, in profit or loss. The adoption of these amendments did not have a material impact on the Consolidated financial statements.
The amendment to IFRS 1 simplifies the application of IFRS 1 by a subsidiary that becomes a first-time adopter after its parent in relation to the measurement of cumulative translation differences. The adoption of these amendments did not have a material impact on the Consolidated financial statements.
The amendments to the standard relate to the following:
F-24
Notes to the Consolidated financial statements (continued)
- The amendments update references in IFRS 3 to the revised 2018 Conceptual Framework.
- An acquirer applies the definition of a liability in IAS 37 or IFRIC 21 – not the definition in
the Conceptual Framework – to determine whether a present obligation exists at the date as
a result of past events.
- In addition, the amendments clarify that the acquirer does not recognize a contingent asset at
the acquisition date.
The adoption of these amendments did not have a material impact on the Consolidated Financial Statements.
The proposed amendment to paragraph B3.3.6 of IFRS 9 clarifies that a borrower includes in the 10 per cent test only fees paid or received between the borrower and the lender, including fees paid or received by either the borrower or lender on the other's behalf. The adoption of these amendments did not have a material impact on the Interim Condensed Consolidated Financial Statements.
New and revised IFRSs in issue but not yet effective
• Deferred Tax related to Assets and Liabilities arising from a Single Transactions (Amendments to IAS 12) |
In May 2021, the IASB issued an amendment to IAS 12, Income Taxes, requiring companies to recognize deferred tax on transactions that, on initial recognition, give rise to equal amounts of taxable and deductible temporary differences. The amendment is effective for annual reporting periods beginning on or after January 1, 2023, with early adoption permitted. Management has evaluated the impact of this amendment on the financial statements and believe it to be not material. We are not planning to early adopt any new and revised IFRSs for the current year.
In February 2021, the IASB issued an amendment to IAS 8, Accounting Polices, Changes in Accounting Estimates and Errors, in order to clarify the difference between accounting policies and accounting estimates. The changes to IAS 8 focus entirely on accounting estimates and clarify the following:
F-25
Notes to the Consolidated financial statements (continued)
The amendments are effective for annual reporting periods beginning on or after January 1, 2023, with early adoption permitted. Management has evaluated the impact of these amendments on the financial statements and believe it to be not material. We are not planning to early adopt any new and revised IFRSs for the current year.
On October 31, 2022 the IASB issued amendments "Non-current liabilities with covenants" to IAS 1, Presentation of financial statements. The amendments in Non-current Liabilities with Covenants (Amendments to IAS 1):
The new amendments are effective for annual reporting periods beginning on or after January 1, 2024. Earlier application is permitted.
Disclosure of Accounting Policies (Amendments to IAS 1 and IFRS Practice Statement 2) amends IAS 1 in the following ways:
In addition, IFRS Practice Statement 2 has been amended by adding guidance and examples to explain and demonstrate the application of the ‘four-step materiality process’ to accounting policy information in order to support the amendments to IAS 1.
Management is currently evaluating the impact of the adoption of these standards, amendments and interpretations in future periods and currently does not believe them to be material. We are not planning to early adopt any new and revised IFRSs for the current year.
Non-current Liabilities with Covenants (Amendments to IAS 1)
F-26
Notes to the Consolidated financial statements (continued)
Certain accounting policies are considered to be critical to the Group. An accounting policy is considered to be critical if, in the Directors’ judgement, its selection or application materially affects the Group’s financial position or results. The application of the Group’s accounting policies also requires the use of estimates and assumptions that affect the Group’s financial position or results.
Below is a summary of areas in which estimation is applied primarily in the context of applying critical accounting judgements.
Critical judgements in applying Group accounting policies
Intangible assets – development costs capitalization
Assessing whether assets meet the required criteria for initial capitalization requires judgement. This requires an assessment of the expected future benefits from the projects to be capitalized, technical feasibility and commercial viability. In particular, internally generated intangible assets must be assessed during the development phase to identify whether the Group has the ability and intention to complete the development successfully.
Determining the costs of assets to be capitalized also requires judgement. Specifically, judgement and estimation is required to determine the directly attributable costs to be allocated to the asset to enable the asset to be capable of operating in the manner intended by management.
Recognition of a deferred tax asset
The Group has accumulated significant unutilized trading tax losses (refer to Note 10, Taxation). Deferred tax assets are recognized to the extent that it is probable that there are sufficient suitable deferred tax liabilities or future taxable profits that will be available against which deductible temporary differences can be utilized. The key area of judgement in respect of deferred tax accounting is the assessment of the expected timing and manner of realization or settlement of the carrying amounts of assets and liabilities held at the reporting date. In particular, assessment of whether it is probable that there will be suitable future taxable profits against which any deferred tax assets can be utilized is required. The Group reviews this assessment on an annual basis.
Non-controlling interest – Strategic arrangement with Alibaba and Richemont
During the year ended December 31, 2021, the Group formally signed an agreement to enter into a strategic arrangement with Alibaba and Richemont. As part of the agreement, Alibaba and Richemont invested $
Acquisition of Palm Angels S.r.l (“Palm Angels”)
During the year ended December 31, 2021, the Group completed the acquisition of
F-27
Notes to the Consolidated financial statements (continued)
Identification of embedded derivative in borrowing arrangements
During the year ended December 31, 2020, the Group issued senior convertible notes for $
Key sources of estimation uncertainty
Business combinations
We use our best estimates and assumptions to accurately assign fair value to the intangible assets acquired at the acquisition date. The estimation is primarily due to the judgmental nature of the inputs to the valuation models used to measure the fair value of these intangible assets, as well as the sensitivity of the respective fair values to the underlying significant assumptions. Where material, we use a discounted cash flow method of the income approach to measure the fair value of these intangible assets, and use specialists to assist us to develop certain estimates and assumptions. The significant estimates and assumptions used are in respect of (i) expected future revenue growth rates; (ii) anticipated operating margins; (iii) the useful lives of the acquired brand names; (iv) the discount rates to be applied to the estimated future cash flows; and (v) royalty rates used in estimating income savings.
We also use our best estimates and assumptions to accurately account for the value of put options over non-controlling interests, when applicable.
For details of business combinations refer to Note 31, Business combinations.
Impairment of non-financial assets
Impairment exists when the carrying value of an asset, CGU or group of CGU's exceeds its recoverable amount, which is the higher of its fair value less costs of disposal and its value in use. The fair value less costs of disposal calculation is based on available data from binding sales transactions, conducted at arm’s length, for similar assets or observable market prices less incremental costs for disposing of the asset. The value in use calculation is based on a discounted cash flow (“DCF”) model. The cash flows are derived from the budget and projections for the next to
Refer to Note 11, Intangible assets for further details on the assumptions and associated sensitivities.
Fair value of financial instruments, including embedded derivatives and put and call liabilities
Where the fair value of financial assets and liabilities recorded in the financial statements cannot be derived from active markets, their fair value is determined using valuation techniques including the Black Scholes option pricing model. The inputs to these models are taken from observable markets where possible, but where this is not feasible, a degree of judgement is required to establish fair values. The judgements include considerations of inputs such as the risk-free rate and volatility. Changes in assumptions about these factors could affect the reported fair value of financial instruments.
When measuring the fair value of an asset or liability, the Group uses observable market data to the greatest extent possible. Fair values are categorized into different levels in a fair value hierarchy based on the inputs used in
F-28
Notes to the Consolidated financial statements (continued)
the valuation techniques. For more information, including further details on assumptions and associated sensitivities, please refer to Note 19, Financial instruments and financial risk management.
2021 CEO Performance-Based Restricted Stock Unit (“PSU”) Award
On May 24, 2021, the Board of Directors of the Company (the "Board") unanimously approved the recommendation of the Compensation Committee of the Board to grant a long-term PSU under the Group’s 2018 Farfetch Employee Equity Plan (the “2018 Plan”) to José Neves, the Group’s Founder, Chief Executive Officer and Chairman of the Board (the “CEO”). The grant is
Management has valued the related employers tax liability for these awards using the intrinsic value method based on the current and expected performance of the Group's share price over the performance period. The number of shares expected to vest is determined by analyzing the Group's share price movements during the performance period and extrapolating them into the future in order to determine whether the relevant share price hurdles have been met. If it is concluded that the share price hurdles have been achieved and therefore those awards are expected to vest in a future period, a corresponding provision is recognized based on the number of shares expected to vest and the expected future share price.
Minority investment in Neiman Marcus Group
On May 31, 2022, Farfetch UK Limited invested $
Revenue by type of good or service (in thousands)
|
|
2020 |
|
|
2021 |
|
|
2022 |
|
|||
Digital Platform Services third-party revenue |
|
$ |
|
|
$ |
|
|
$ |
|
|||
Digital Platform Services first-party revenue |
|
|
|
|
|
|
|
|
|
|||
Digital Platform Services Revenue |
|
|
|
|
|
|
|
|
|
|||
Digital Platform Fulfilment Revenue |
|
|
|
|
|
|
|
|
|
|||
Brand Platform Revenue |
|
|
|
|
|
|
|
|
|
|||
In-Store Revenue |
|
|
|
|
|
|
|
|
|
|||
Total Revenue |
|
$ |
|
|
$ |
|
|
$ |
|
|||
Digital Platform services
Digital Platform Services Revenue includes commissions on third-party sales and revenue from first-party sales.
Commission revenue is recognized on a net basis in the Consolidated statement of operations because the Group acts as an agent in these arrangements. The Group primarily acts as a commercial intermediary between sellers and end consumers and earns a commission for this service. Commission revenue is recognized when the goods are dispatched by the seller.
F-29
Notes to the Consolidated financial statements (continued)
In first-party sales arrangements, the Group sells inventory directly purchased or created by the Group on the Digital Platform where the Group is the principal, and therefore related revenues are recognized on a gross basis. Revenue on the sale of these goods is recognized when the goods are received by the end consumer. For finished goods that have been ordered on the Digital Platform but not yet delivered to the end consumer at the end of the reporting period, revenue is deferred until delivery. These deferred amounts are expected to be recognized within
Digital Platform Service Revenue also includes fees charged to sellers for other activities, such as packaging, credit card processing and other transaction processing activities.
At checkout, end consumers are charged for delivery, if applicable, in addition to the price of goods in their basket (refer to Digital Platform Fulfilment Revenue below for a discussion of delivery services). The Group is responsible for the collection of cash from end consumers with payment typically taken in advance of completing its performance obligations.
In arrangements where the Group acts as an agent, cash collections are remitted net to the sellers generally within two months of collection.
Digital Platform Fulfilment Revenue
The Group provides delivery services for goods sold on the Digital Platform, for which revenues are recognized when the goods are delivered to the end consumers. Revenues for delivery services are stated net of promotional incentives and discounts. Digital Platform Fulfilment Revenue also includes fees charged to sellers for the settlement of duties which are recognized concurrently with commissions.
As discussed above, the promise with respect to delivery services is satisfied only when the goods are delivered to the end consumer. Within Digital Platform Fulfilment Revenue, where the delivery services performance obligation has not been satisfied by December 31, 2022, revenue is deferred and is expected to be recognized within
Further detail can be found in Note 2.3 (e), Summary of significant accounting policies – Revenue recognition.
Brand Platform Revenue
Brand Platform Revenue includes revenue generated by New Guards operations less revenue from New Guards’: (i) owned e-commerce websites, (ii) direct-to-consumer channel via our Marketplaces and (iii) directly operated stores. Sales are made in the form of first-party sales arrangements to retailers, and therefore related revenues are recognized on a gross basis. Brand Platform revenue is recognized when the goods are delivered to the retailer. For finished goods that have been ordered and produced, but not yet delivered to the retailer at the end of the reporting period, revenue is deferred until delivery.
In-store
The Group has a single performance obligation in respect to In-Store Revenue, which is the sale of finished goods.
Group deferred revenue
At December 31, 2022, the Group recognized deferred revenue of $
F-30
Notes to the Consolidated financial statements (continued)
respectively) and $
Segmental information
The Group’s Chief Operating Decision Maker ("CODM"), which is deemed to be the Chief Executive Officer, examines segmental performance and resource allocation from an omni-channel service and product offering perspective, across the digital and physical realms. The CODM does not evaluate the segments using asset and liability information.
The Group has identified
(A) Digital Platform - comprised of the Farfetch Marketplace, FPS, Violet Grey, BrownsFashion.com, respective websites of the brands in the New Guards portfolio and StadiumGoods.com, Farfetch Connected Retail, and any other online sales channel operated by the Group. Revenues are derived mostly from transactions between sellers and consumers conducted on our technology platforms.
(B) Brand Platform - comprised of business-to-business activities of the brands in the New Guards portfolio and includes design, production, brand development and wholesale distribution of brands owned and licensed by New Guards, including the franchised store operations. Revenues are generally derived from wholesale sales of goods.
(C) In-Store - comprised of Group-operated stores including Browns, Stadium Goods, Violet Grey and certain brands in the New Guards portfolio. Revenues are derived from sales made in the physical stores.
There are no intersegment transactions that require elimination and all revenues are revenues from external consumers.
The results of our three reportable operating segments are as follows (in thousands):
|
|
Year ended December 31, |
|
|||||||||
|
|
2020 |
|
|
2021 |
|
|
2022 |
|
|||
Digital Platform: |
|
(in thousands) |
|
|||||||||
Services third-party revenue |
|
$ |
|
|
$ |
|
|
$ |
|
|||
Services first-party revenue |
|
|
|
|
|
|
|
|
|
|||
Services Revenue |
|
|
|
|
|
|
|
|
|
|||
Fulfilment Revenue |
|
|
|
|
|
|
|
|
|
|||
Revenue |
|
|
|
|
|
|
|
|
|
|||
Less: Cost of revenue |
|
|
( |
) |
|
|
( |
) |
|
|
( |
) |
Gross profit |
|
|
|
|
|
|
|
|
|
|||
Less: Demand generation expense |
|
|
( |
) |
|
|
( |
) |
|
|
( |
) |
Order contribution |
|
$ |
|
|
$ |
|
|
$ |
|
|||
F-31
Notes to the Consolidated financial statements (continued)
|
|
Year ended December 31, |
|
|||||||||
|
|
2020 |
|
|
2021 |
|
|
2022 |
|
|||
Brand Platform: |
|
(in thousands) |
|
|||||||||
Revenue |
|
$ |
|
|
$ |
|
|
$ |
|
|||
Less: Cost of revenue |
|
|
( |
) |
|
|
( |
) |
|
|
( |
) |
Gross profit or order contribution |
|
$ |
|
|
$ |
|
|
$ |
|
|||
|
|
Year ended December 31, |
|
|||||||||
|
|
2020 |
|
|
2021 |
|
|
2022 |
|
|||
In-Store: |
|
(in thousands) |
|
|||||||||
Revenue |
|
$ |
|
|
$ |
|
|
$ |
|
|||
Less: Cost of revenue |
|
|
( |
) |
|
|
( |
) |
|
|
( |
) |
Gross profit or order contribution |
|
$ |
|
|
$ |
|
|
$ |
|
|||
|
|
2020 |
|
|
2021 |
|
|
2022 |
|
|||
Group: |
|
|
|
|
|
|
|
|
|
|||
Revenue |
|
$ |
|
|
$ |
|
|
$ |
|
|||
Less: Cost of revenue |
|
|
( |
) |
|
|
( |
) |
|
|
( |
) |
Gross profit |
|
|
|
|
|
|
|
|
|
|||
Less: Demand generation expense |
|
|
( |
) |
|
|
( |
) |
|
|
( |
) |
Order contribution |
|
|
|
|
|
|
|
|
|
|||
Selling, general and administrative expenses (excluding demand generation expense) |
|
|
( |
) |
|
|
( |
) |
|
|
( |
) |
Impairment losses on tangible assets |
|
|
( |
) |
|
|
|
|
|
( |
) |
|
Impairment losses on intangible assets |
|
|
( |
) |
|
|
( |
) |
|
|
( |
) |
Operating loss |
|
|
( |
) |
|
|
( |
) |
|
|
( |
) |
(Losses)/gains on items held at fair value and remeasurements |
|
|
( |
) |
|
|
|
|
|
|
||
Share of results of associates |
|
|
( |
) |
|
|
( |
) |
|
|
|
|
Finance income |
|
|
|
|
|
|
|
|
|
|||
Finance costs |
|
|
( |
) |
|
|
( |
) |
|
|
( |
) |
(Loss)/profit before tax |
|
$ |
( |
) |
|
$ |
|
|
$ |
|
||
Geographical information
The Group believes it is relevant to disclose geographical revenue information on both a demand basis, determined by the billing location of the consumer, and on a supply basis, determined by location of the Farfetch legal entity which earned the revenue.
The Group is domiciled in the Cayman Islands. For the year ended December 31, 2022, the Cayman Islands generated revenue from external consumers of $
The Group’s revenue from external consumers on a demand basis, based on the billing location of the consumer, is detailed below (in thousands):
|
|
2020 |
|
|
2021 |
|
|
2022 |
|
|||
Revenue from external consumers (demand basis) |
|
|
|
|
|
|
|
|
|
|||
United States |
|
$ |
|
|
$ |
|
|
$ |
|
|||
United Kingdom |
|
|
|
|
|
|
|
|
|
|||
Other Countries |
|
|
|
|
|
|
|
|
|
|||
Revenue |
|
$ |
|
|
$ |
|
|
$ |
|
|||
F-32
Notes to the Consolidated financial statements (continued)
The Group’s revenue from external consumers on a supply basis, based on the location of the Farfetch legal entity which earned the revenue, is detailed below (in thousands):
|
|
2020 |
|
|
2021 |
|
|
2022 |
|
|||
Revenue from external consumers (supply basis) |
|
|
|
|
|
|
|
|
|
|||
United Kingdom |
|
$ |
|
|
$ |
|
|
$ |
|
|||
Italy |
|
|
|
|
|
|
|
|
|
|||
Other Countries |
|
|
|
|
|
|
|
|
|
|||
Revenue |
|
$ |
|
|
$ |
|
|
$ |
|
|||
The Group’s non-current assets other than deferred tax assets and investments by geographic location are detailed below (in thousands):
|
|
2021 |
|
|
2022 |
|
||
Non-current assets excluding deferred tax assets and investments |
|
|
|
|
|
|
||
Italy |
|
$ |
|
|
$ |
|
||
United Kingdom (1) |
|
|
|
|
|
|
||
United States |
|
|
|
|
|
|
||
Other Countries |
|
|
|
|
|
|
||
Total |
|
$ |
|
|
$ |
|
||
(1) Amounts previously disclosed for the United Kingdom for the year ended December 31, 2021 have been re-presented to exclude investments.
Included within Selling, general and administrative expenses are (in thousands):
|
|
2020 |
|
|
2021 |
|
|
2022 |
|
|||
Demand generation expenses |
|
$ |
|
|
$ |
|
|
$ |
|
|||
Technology expenses |
|
|
|
|
|
|
|
|
|
|||
Depreciation and amortization |
|
|
|
|
|
|
|
|
|
|||
Share-based payments |
|
|
|
|
|
|
|
|
|
|||
General and administrative |
|
|
|
|
|
|
|
|
|
|||
Other items |
|
|
|
|
|
|
|
|
|
|||
Selling, general and administrative expenses |
|
$ |
|
|
$ |
|
|
$ |
|
|||
Demand generation expense is primarily comprised of fees that the Group pays its various media and affiliate partners. Technology expense primarily relates to maintenance and operations of Farfetch platform features and services, as well as hosting and infrastructure expenses. General and administrative expenses consist primarily of office and warehousing costs, non-technology headcount, marketing and other Digital Platform operations costs. Other items primarily consist of transaction-related legal and advisory costs.
Included within General and administrative expense for the year ended December 31, 2022 is a $
F-33
Notes to the Consolidated financial statements (continued)
Employees and directors expenses/(credits) are as follows (in thousands):
|
|
2020 |
|
|
2021 |
|
|
2022 |
|
|||
Wages and salaries |
|
$ |
|
|
$ |
|
|
$ |
|
|||
Social security costs |
|
|
|
|
|
|
|
|
|
|||
Other pension costs |
|
|
|
|
|
|
|
|
|
|||
Share-based payments (equity-settled) |
|
|
|
|
|
|
|
|
|
|||
Share-based payments (cash-settled) |
|
|
|
|
|
( |
) |
|
|
( |
) |
|
Share-based payments (employment related taxes) |
|
|
|
|
|
( |
) |
|
|
( |
) |
|
Total employees and directors expenses |
|
$ |
|
|
$ |
|
|
$ |
|
|||
These amounts are included within Selling, general and administrative expenses in the Consolidated statement of operations.
Included within (losses)/gains on items held at fair value and remeasurements are (in thousands):
|
|
2020 |
|
|
2021 |
|
|
2022 |
|
|||
Change on remeasurement of put and call option and contingent consideration liabilities |
|
$ |
( |
) |
|
$ |
|
|
$ |
|
||
Change in fair value of convertible note embedded derivatives |
|
|
( |
) |
|
|
|
|
|
|
||
Loss on disposal of investment carried at FVTPL |
|
|
|
|
|
|
|
|
( |
) |
||
Fair value remeasurement of previously held equity interest |
|
|
|
|
|
|
|
|
|
|||
Fair value remeasurement of minority investment |
|
|
|
|
|
|
|
|
( |
) |
||
(Losses)/gains on items held at fair value and remeasurements |
|
$ |
( |
) |
|
$ |
|
|
$ |
|
||
Fair value remeasurement of previously held equity interest
The fair value remeasurement of previously held equity interest relates to New Guards step-acquisition of Alanui (refer to Note 31, Business combinations for further detail).
For further information regarding the valuation of these instruments, refer to Note 19, Financial instruments and financial risk management, Note 20, Borrowings and embedded derivatives and Note 21, Put and call option liabilities.
Included within Finance income and Finance costs are (in thousands):
|
|
2020 |
|
|
2021 |
|
|
2022 |
|
|||
Unrealized exchange gains |
|
$ |
|
|
$ |
|
|
$ |
|
|||
Interest on cash and cash equivalents |
|
|
|
|
|
|
|
|
|
|||
Finance income |
|
|
|
|
|
|
|
|
|
|||
|
|
|
|
|
|
|
|
|
|
|||
Unrealized exchange losses |
|
|
( |
) |
|
|
( |
) |
|
|
( |
) |
Interest on leases |
|
|
( |
) |
|
|
( |
) |
|
|
( |
) |
Convertible note interest |
|
|
( |
) |
|
|
( |
) |
|
|
( |
) |
Interest on Term Loan |
|
|
|
|
|
|
|
|
( |
) |
||
Loss on derecognition of convertible loan notes |
|
|
|
|
|
|
|
|
( |
) |
||
Other interest expense |
|
|
( |
) |
|
|
( |
) |
|
|
( |
) |
Finance costs |
|
|
( |
) |
|
|
( |
) |
|
|
( |
) |
|
|
|
|
|
|
|
|
|
|
|||
Net finance income/(costs) |
|
$ |
( |
) |
|
$ |
( |
) |
|
$ |
( |
) |
F-34
Notes to the Consolidated financial statements (continued)
The Group has identified a number of items which are material due to the significance of their nature and/or amount.
|
|
Note |
|
|
2020 |
|
|
2021 |
|
|
2022 |
|
||||
Research and development costs expensed |
|
|
|
|
|
( |
) |
|
|
( |
) |
|
|
( |
) |
|
Amortization - Intangible assets |
|
|
11 |
|
|
|
( |
) |
|
|
( |
) |
|
|
( |
) |
Depreciation - Property, plant and equipment |
|
|
12 |
|
|
|
( |
) |
|
|
( |
) |
|
|
( |
) |
Depreciation - Right-of-use assets |
|
|
13 |
|
|
|
( |
) |
|
|
( |
) |
|
|
( |
) |
Impairment losses on intangible assets |
|
|
11 |
|
|
|
( |
) |
|
|
( |
) |
|
|
( |
) |
Impairment losses on property, plant and equipment |
|
|
12 |
|
|
|
( |
) |
|
|
|
|
|
( |
) |
|
Impairment losses on right-of-use assets |
|
|
13 |
|
|
|
( |
) |
|
|
|
|
|
( |
) |
|
Transaction related legal and advisory expenses |
|
|
|
|
|
( |
) |
|
|
( |
) |
|
|
( |
) |
|
Gains on items at present value remeasurements |
|
|
7 |
|
|
|
|
|
|
|
|
|
|
|||
Gains related to conversion of convertible notes |
|
|
|
|
|
|
|
|
|
|
|
|
||||
(Losses)/gains from fair value remeasurements of convertible note embedded derivatives |
|
|
7 |
|
|
|
( |
) |
|
|
|
|
|
|
||
Loss on derecognition of convertible notes |
|
|
8 |
|
|
|
|
|
|
|
|
|
( |
) |
||
|
|
2020 |
|
|
2021 |
|
|
2022 |
|
|||
Current tax: |
|
|
|
|
|
|
|
|
|
|||
Corporate tax |
|
$ |
|
|
$ |
|
|
$ |
|
|||
Prior year adjustments |
|
|
( |
) |
|
|
|
|
|
|
||
Total current tax |
|
|
|
|
|
|
|
|
|
|||
Total deferred tax benefit, net |
|
|
( |
) |
|
|
( |
) |
|
|
( |
) |
Income tax (benefit)/expense |
|
$ |
( |
) |
|
$ |
|
|
$ |
( |
) |
|
The Group's current income tax expense of $
Tax is recognized based on the weighted average annual tax rate expected for the full financial year in these taxable profit-making jurisdictions. The estimated average annual tax rate for the year ended December 31, 2022, in these jurisdictions is
F-35
Notes to the Consolidated financial statements (continued)
The tax on the Group’s (loss)/profit before tax differs from the theoretical amount that would arise using the weighted average tax rate applicable to profit of the consolidated entities as follows (in thousands):
|
|
2020 |
|
|
2021 |
|
|
2022 |
|
|||
(Loss)/profit before tax |
|
$ |
( |
) |
|
$ |
|
|
$ |
|
||
Tax at the UK tax rate of |
|
|
( |
) |
|
|
|
|
|
|
||
Tax effects of: |
|
|
|
|
|
|
|
|
|
|||
Sundry non-taxable income |
|
|
( |
) |
|
|
( |
) |
|
|
( |
) |
Sundry non-taxable expense |
|
|
|
|
|
|
|
|
|
|||
Non-taxable items evaluated at fair value |
|
|
|
|
|
( |
) |
|
|
( |
) |
|
Taxes paid overseas and rate difference |
|
|
|
|
|
( |
) |
|
|
( |
) |
|
Adjustments in respect of change in tax rates |
|
|
|
|
|
( |
) |
|
|
|
||
Adjustments in respect of prior year |
|
|
( |
) |
|
|
|
|
|
|
||
Unrecognized deferred tax assets |
|
|
|
|
|
|
|
|
|
|||
Difference in tax rate on unrecognized deferred tax assets |
|
|
|
|
|
|
|
|
( |
) |
||
Income tax (benefit)/expense |
|
$ |
( |
) |
|
$ |
|
|
$ |
( |
) |
|
The UK corporation tax rate applicable from April 1, 2020 is
The tax on items presented within other comprehensive (loss)/income is $
Deferred tax
As result of the acquisitions of New Guards and CuriosityChina, the Group recognized a deferred tax liability of $
As a result of the purchase price allocation exercise arising from 2021 acquisitions, a deferred tax liability of $
As a result of the purchase price allocation exercise arising from 2022 acquisitions, a deferred tax liability of $
Deferred tax assets of $
Deferred tax assets of $
F-36
Notes to the Consolidated financial statements (continued)
Deferred tax assets and liabilities consist of the following at December 31 (in thousands):
|
|
Note |
|
|
Deferred tax assets |
|
|
Deferred tax liabilities |
|
|||
At January 1, 2021 |
|
|
|
|
$ |
|
|
$ |
|
|||
Deferred tax recognized to profit or loss |
|
|
|
|
|
|
|
|
|
|||
Deferred tax released to profit or loss |
|
|
|
|
|
|
|
|
( |
) |
||
Foreign exchange |
|
|
|
|
|
( |
) |
|
|
( |
) |
|
Reclassifications to balance sheet |
|
|
|
|
|
|
|
|
|
|||
Deferred tax recognized on acquisitions to balance sheet |
|
|
31 |
|
|
|
|
|
|
|||
At December 31, 2021 |
|
|
|
|
$ |
|
|
$ |
|
|||
Deferred tax recognized to profit or loss |
|
|
|
|
|
|
|
|
|
|||
Deferred tax released to profit or loss |
|
|
|
|
|
( |
) |
|
|
( |
) |
|
Foreign exchange |
|
|
|
|
|
( |
) |
|
|
( |
) |
|
Reclassifications to balance sheet |
|
|
|
|
|
( |
) |
|
|
( |
) |
|
Deferred tax recognized on acquisitions to balance sheet |
|
|
31 |
|
|
|
|
|
|
|
||
At December 31, 2022 |
|
|
|
|
$ |
|
|
$ |
|
|||
|
|
|
|
|
|
|
|
|
|
|||
Deferred tax, net liability at December 31, 2022 |
|
|
|
|
|
|
|
$ |
|
|||
Unrecognized deferred tax assets
Unutilized trading tax losses
The Group had accumulated unutilized tax losses carried forward as of December 31, 2022 of $
|
|
Local |
|
2021 |
|
|
2021 |
|
|
2022 |
|
|
2022 |
|
||||
|
|
|
|
Local '000 |
|
|
$’000 |
|
|
Local '000 |
|
|
$’000 |
|
||||
UK trading losses |
|
GBP |
|
|
|
|
|
|
|
|
|
|
|
|
||||
US Net Operating Losses (“NOL”) |
|
USD |
|
|
|
|
|
|
|
|
|
|
|
|
||||
Brazil trading losses |
|
BRL |
|
|
|
|
|
|
|
|
|
|
|
|
||||
Japan trading losses |
|
JPY |
|
|
|
|
|
|
|
|
|
|
|
|
||||
Hong Kong trading losses |
|
HKD |
|
|
|
|
|
|
|
|
|
|
|
|
||||
|
|
|
|
|
|
|
|
|
|
|
|
|
|
|
||||
UK trading losses are available to be carried forward indefinitely. Legislation has been introduced with effect from April 1, 2017, whereby losses arising after April 1, 2017 can be set against total profits of the Group. The amount of total profits that can be offset by brought-forward losses is restricted to the first £
US NOL as of December 31, 2022 of $(
F-37
Notes to the Consolidated financial statements (continued)
Brazilian and Hong Kong trading losses as of December 31, 2022 are available to be carried forward indefinitely but utilization of losses in respect of Brazil is restricted to
Japanese NOL carry forwards incurred before April 1, 2018 can be carried forward for
Unutilized future tax deductions on employee share option gains
The Group has an unrecognized gross deferred tax asset of approximately $
Unutilized future tax deductions on goodwill
The Group has an unrecognized deferred tax asset of approximately $
Unutilized future tax deductions for reactivated interest expense
The Group has an unrecognized gross deferred tax asset of approximately $
F-38
Notes to the Consolidated financial statements (continued)
|
|
Goodwill |
|
|
Brand, |
|
|
Customer |
|
|
Development |
|
|
Total |
|
|||||
Cost |
|
|
|
|
|
|
|
|
|
|
|
|
|
|
|
|||||
At January 1, 2021 |
|
$ |
|
|
$ |
|
|
$ |
|
|
$ |
|
|
$ |
|
|||||
Additions |
|
|
|
|
|
|
|
|
|
|
|
|
|
|
|
|||||
Additions acquired through business combinations (1) |
|
|
|
|
|
|
|
|
|
|
|
|
|
|
|
|||||
Disposals |
|
|
|
|
|
( |
) |
|
|
|
|
|
( |
) |
|
|
( |
) |
||
Foreign exchange movements |
|
|
( |
) |
|
|
( |
) |
|
|
( |
) |
|
|
( |
) |
|
|
( |
) |
At December 31, 2021 |
|
|
|
|
|
|
|
|
|
|
|
|
|
|
|
|||||
Additions |
|
|
|
|
|
|
|
|
|
|
|
|
|
|
|
|||||
Additions acquired through business combinations (1) |
|
|
|
|
|
|
|
|
|
|
|
|
|
|
|
|||||
Transfers |
|
|
|
|
|
( |
) |
|
|
|
|
|
|
|
|
|
||||
Foreign exchange movements |
|
|
( |
) |
|
|
( |
) |
|
|
( |
) |
|
|
( |
) |
|
|
( |
) |
At December 31, 2022 |
|
$ |
|
|
$ |
|
|
$ |
|
|
$ |
|
|
$ |
|
|||||
Accumulated amortization and impairment |
|
|
|
|
|
|
|
|
|
|
|
|
|
|
|
|||||
At January 1, 2021 |
|
$ |
|
|
$ |
( |
) |
|
$ |
( |
) |
|
$ |
( |
) |
|
$ |
( |
) |
|
Amortization for year |
|
|
|
|
|
( |
) |
|
|
( |
) |
|
|
( |
) |
|
|
( |
) |
|
Impairment for year |
|
|
|
|
|
( |
) |
|
|
|
|
|
|
|
( |
) |
||||
Disposals |
|
|
|
|
|
|
|
|
|
|
|
( |
) |
|
|
( |
) |
|||
Foreign exchange movements |
|
|
|
|
|
|
|
|
( |
) |
|
|
|
|
|
|
||||
At December 31, 2021 |
|
|
|
|
|
( |
) |
|
|
( |
) |
|
|
( |
) |
|
|
( |
) |
|
Amortization for year |
|
|
|
|
|
( |
) |
|
|
( |
) |
|
|
( |
) |
|
|
( |
) |
|
Impairment for year |
|
|
( |
) |
|
|
( |
) |
|
|
|
|
|
( |
) |
|
|
( |
) |
|
Transfers |
|
|
|
|
|
|
|
|
|
|
|
( |
) |
|
|
|
||||
Foreign exchange movements |
|
|
|
|
|
|
|
|
( |
) |
|
|
( |
) |
|
|
|
|||
At December 31, 2022 |
|
$ |
( |
) |
|
$ |
( |
) |
|
$ |
( |
) |
|
$ |
( |
) |
|
$ |
( |
) |
Net book value |
|
|
|
|
|
|
|
|
|
|
|
|
|
|
|
|||||
At December 31, 2021 |
|
$ |
|
|
$ |
|
|
$ |
|
|
$ |
|
|
$ |
|
|||||
At December 31, 2022 |
|
$ |
|
|
$ |
|
|
$ |
|
|
$ |
|
|
$ |
|
|||||
Intangible assets with definite useful lives
Included within Development costs is $
As of December 31, 2022, Brands, Trademarks and domain names primarily includes: the Off-White licensed brand with a net carrying amount of $
F-39
Notes to the Consolidated financial statements (continued)
Brand, trademarks and domain names include non-cash additions of $
Intangible asset additions of $
During the year ended December 31, 2021, the Group completed the acquisition of
Development costs relates to development expenses that meet the capitalization criteria under IAS 38 - Intangible Assets, acquired software in business combinations, and includes the development of internal software and technologies related to the enhancement of the Group's Digital Platform.
Amortization for all intangible assets is recognized in Selling, general and administrative expenses within the Consolidated statement of operations.
During the year ended December 31, 2022, total impairment expense of $
During the year ended December 31, 2021 impairment expense of $
Intangible assets with indefinite useful lives
Goodwill reflects the amount of consideration in excess of the fair value of net assets acquired in business combinations. The Group tests goodwill annually for impairment, or more frequently if there are indications that goodwill might be impaired. Goodwill has been allocated to the following CGUs or groups of CGUs. New acquisitions Wannaby and Violet Grey have been allocated to the Marketplace CGU. For details regarding additions to goodwill refer to Note 31, Business combinations.
The goodwill amounts for each CGU or groups of CGUs consists of the following at December 31 (in thousands):
|
|
2021 |
|
|
2022 |
|
||
CGU |
|
|
|
|
|
|
||
Marketplace (FF.com) |
|
$ |
|
|
$ |
|
||
Browns - Platform |
|
|
|
|
|
|
||
CuriosityChina |
|
|
|
|
|
|
||
Brand Platform - New Guards |
|
|
|
|
|
|
||
Farfetch Platform Solutions |
|
|
|
|
|
|
||
Total Goodwill |
|
$ |
|
|
$ |
|
||
F-40
Notes to the Consolidated financial statements (continued)
In finalizing the purchase price allocation of the New Guards acquisition, we determined that a portion of the goodwill ($
Impairment testing
As of March 31, 2022, the Group reviewed its business and operations to take into consideration the estimated impact of the macroeconomic environment, the market outlook and the Group’s operations arising from COVID-19 and the Russia-Ukraine conflict and related sanctions. As a result of this assessment, certain CGUs, Marketplace (FF.com) and Browns - Platform, were identified as being more sensitive to these factors and were subject to impairment testing.
As of September 30, 2022, the Group's quarterly impairment trigger assessment also identified potential impairment indicators with the performance of the Browns - Platform CGU as a result of the continued macroeconomic environment and the devaluation of the pound sterling against the U.S. dollar and the CGU was subject to further impairment testing.
As of December 31, 2022, the Group completed annual impairment testing on all CGUs.
For all of the impairment testing performed during 2022, the recoverable amounts of the CGUs are determined from value in use calculations. The key assumptions for the value in use calculation include (i) expected future revenue growth rates, including the terminal growth rate; (ii) anticipated gross profit margins; (iii) anticipated operating margins; and (iv) the discount rates to be applied to the estimated future cash flows. Management estimates discount rates using pre-tax rates that reflect current market assessments of the time value of money and the risks specific to the CGUs and the group of units. The growth rates and anticipated gross profit margins are based on historic revenue growth rates, cost of revenue forecasts and current market assessments.
The Group prepares cash flow forecasts derived from the most recent financial budgets approved by management for the next
March 31, 2022 impairment testing: FF.com and Browns - Platform
The key assumptions for the value in use calculations are the revenue growth rates and the pre-tax discount rates, plus gross profit and operating margin for selected CGUs, as explained above. The Group extrapolates the cash flows from the fifth year based on an estimated growth rate of
As a result of the impairment testing performed, the value in use exceeded the carrying amount of the assets allocated to each CGU for both the Marketplace (FF.com) and Browns - Platform CGUs and no impairment was recognized.
Management performed sensitivities on key assumptions and, based upon these, believed that there were no indicators of impairment on other CGUs.
F-41
Notes to the Consolidated financial statements (continued)
September 30, 2022 impairment testing: Browns - Platform
The key assumptions for the value in use calculations are the revenue growth rates and the pre-tax discount rates, plus gross profit and operating margin for selected CGUs, as explained above. The Group extrapolates the cash flows from the fifth year based on an estimated growth rate of
As a result of the impairment testing performed, the carrying amount of the assets allocated to the Browns - Platform CGU, our internal Marketplace supply partner, exceeded its value in use and impairment losses totaling $
At September 30, 2022, the Group performed an impairment trigger assessment of goodwill and other intangible assets allocated to the Group's other CGUs and no additional impairment indicators were noted.
December 31, 2022 impairment testing: all CGUs
The recoverable amounts of the CGUs are determined from value in use calculations. The key assumptions for the value in use include (i) expected future revenue growth rates, including the terminal growth rate; (ii) anticipated gross profit margins; (iii) anticipated operating margins; and (iv) the discount rates to be applied to the estimated future cash flows. Management estimates discount rates using pre-tax rates that reflect current market assessments of the time value of money and the risks specific to the CGUs and the group of units. The growth rates and anticipated gross profit margins are based on historic revenue growth rates, cost of revenue forecasts and current market assessments.
The Group prepares cash flow forecasts derived from the most recent financial budgets approved by management for the next
The key assumptions for the value in use calculations are the revenue growth rates and the pre-tax discount rates, plus gross profit margin for selected CGUs. The Group extrapolates the cash flows in the fifth or seventh year based on an estimated growth rate of
The assumptions used in the calculation of the Group’s weighted average cost of capital are benchmarked to externally available data.
F-42
Notes to the Consolidated financial statements (continued)
As a result of the impairment testing performed, the full carrying amount of the assets allocated to three of the smaller intangible brand assets within the Group, exceeded their value in use and impairment losses totaling $
In addition to the results of the annual impairment testing, other impairments totaling $
Management has performed sensitivities on key assumptions and based upon these believe that there are no further indicators of impairment. Management consider that there are no reasonably possible changes to the key assumptions in the value in use calculation that would result in any further impairment of the assets allocated to the CGUs.
The recoverable amount of each CGU would equal its carrying amount if the key assumptions were to change as follows:
|
|
Marketplace (FF.com) |
|
|
FPS |
|
|
CuriosityChina |
|
|
Brand Platform – New Guards |
|
||||
Budgeted annual revenue growth (change in pp) |
|
|
( |
) |
|
|
( |
) |
|
|
( |
) |
|
|
( |
) |
Post-tax discount rate (change in pp) |
|
|
|
|
|
|
|
|
|
|
|
|
||||
Budgeted gross profit margin (change in pp) |
|
|
( |
) |
|
|
( |
) |
|
|
( |
) |
|
|
( |
) |
Long term growth rate (change in pp) |
|
|
( |
) |
|
|
( |
) |
|
|
( |
) |
|
|
( |
) |
F-43
Notes to the Consolidated financial statements (continued)
|
|
Freehold land |
|
|
Leasehold |
|
|
Fixtures and |
|
|
Motor |
|
|
Plant, machinery and equipment |
|
|
Totals |
|
||||||
Cost |
|
|
|
|
|
|
|
|
|
|
|
|
|
|
|
|
|
|
||||||
At January 1, 2021 |
|
$ |
|
|
$ |
|
|
$ |
|
|
$ |
|
|
$ |
|
|
$ |
|
||||||
Additions |
|
|
|
|
|
|
|
|
|
|
|
|
|
|
|
|
|
|
||||||
Additions acquired through business combinations (1) |
|
|
|
|
|
|
|
|
|
|
|
|
|
|
|
|
|
|
||||||
Disposals |
|
|
|
|
|
( |
) |
|
|
( |
) |
|
|
|
|
|
( |
) |
|
|
( |
) |
||
Transfers |
|
|
|
|
|
( |
) |
|
|
|
|
|
|
|
|
|
|
|
|
|||||
Foreign exchange movements |
|
|
( |
) |
|
|
( |
) |
|
|
( |
) |
|
|
( |
) |
|
|
( |
) |
|
|
( |
) |
At December 31, 2021 |
|
|
|
|
|
|
|
|
|
|
|
|
|
|
|
|
|
|
||||||
Additions |
|
|
|
|
|
|
|
|
|
|
|
|
|
|
|
|
|
|
||||||
Additions acquired through business combinations (1) |
|
|
|
|
|
|
|
|
|
|
|
|
|
|
|
|
|
|
||||||
Disposals |
|
|
|
|
|
|
|
|
( |
) |
|
|
( |
) |
|
|
( |
) |
|
|
( |
) |
||
Transfers |
|
|
|
|
|
( |
) |
|
|
|
|
|
|
|
|
|
|
|
|
|||||
Foreign exchange movements |
|
|
( |
) |
|
|
( |
) |
|
|
( |
) |
|
|
( |
) |
|
|
( |
) |
|
|
( |
) |
At December 31, 2022 |
|
$ |
|
|
$ |
|
|
$ |
|
|
$ |
|
|
$ |
|
|
$ |
|
||||||
Accumulated depreciation and impairment |
|
|
|
|
|
|
|
|
|
|
|
|
|
|
|
|
|
|
||||||
At January 1, 2021 |
|
$ |
|
|
$ |
( |
) |
|
$ |
( |
) |
|
$ |
( |
) |
|
$ |
( |
) |
|
$ |
( |
) |
|
Depreciation for year |
|
|
|
|
|
( |
) |
|
|
( |
) |
|
|
( |
) |
|
|
( |
) |
|
|
( |
) |
|
Disposals |
|
|
|
|
|
|
|
|
|
|
|
|
|
|
|
|
|
|
||||||
Foreign exchange movements |
|
|
|
|
|
|
|
|
|
|
|
|
|
|
|
|
|
|
||||||
At December 31, 2021 |
|
|
|
|
|
( |
) |
|
|
( |
) |
|
|
( |
) |
|
|
( |
) |
|
|
( |
) |
|
Depreciation for year |
|
|
|
|
|
( |
) |
|
|
( |
) |
|
|
( |
) |
|
|
( |
) |
|
|
( |
) |
|
Impairment for year |
|
|
|
|
|
( |
) |
|
|
( |
) |
|
|
|
|
|
( |
) |
|
|
( |
) |
||
Disposals |
|
|
|
|
|
|
|
|
|
|
|
|
|
|
|
|
|
|
||||||
Foreign exchange movements |
|
|
|
|
|
|
|
|
|
|
|
|
|
|
|
|
|
|
||||||
At December 31, 2022 |
|
$ |
|
|
$ |
( |
) |
|
$ |
( |
) |
|
$ |
( |
) |
|
$ |
( |
) |
|
$ |
( |
) |
|
Net book value |
|
|
|
|
|
|
|
|
|
|
|
|
|
|
|
|
|
|
||||||
At December 31, 2021 |
|
$ |
|
|
$ |
|
|
$ |
|
|
$ |
|
|
$ |
|
|
$ |
|
||||||
At December 31, 2022 |
|
$ |
|
|
$ |
|
|
$ |
|
|
$ |
|
|
$ |
|
|
$ |
|
||||||
(1) Refer to
Included within Leasehold improvements is $
Depreciation for all property, plant and equipment is recorded in Selling, general and administrative expenses within the Consolidated statement of operations.
F-44
Notes to the Consolidated financial statements (continued)
There were
The Group's leasing activities:
The Group leases various offices, retail stores and cars. Lease contracts are typically made for fixed periods of to
Low-value assets comprise IT-equipment and small items of office furniture.
Right-of-use assets comprised the following (in thousands):
|
|
Property |
|
|
Vehicles |
|
|
Totals |
|
|||
2021 |
|
|
|
|
|
|
|
|
|
|||
At January 1, 2021 |
|
$ |
|
|
$ |
|
|
$ |
|
|||
Additions |
|
|
|
|
|
|
|
|
|
|||
Remeasurements |
|
|
|
|
|
|
|
|
|
|||
Depreciation charge for the year |
|
|
( |
) |
|
|
( |
) |
|
|
( |
) |
Impairment charge for the year |
|
|
|
|
|
|
|
|
|
|||
Foreign exchange |
|
|
( |
) |
|
|
( |
) |
|
|
( |
) |
At December 31, 2021 |
|
$ |
|
|
$ |
|
|
$ |
|
|||
2022 |
|
|
|
|
|
|
|
|
|
|||
At January 1, 2022 |
|
$ |
|
|
$ |
|
|
$ |
|
|||
Additions |
|
|
|
|
|
|
|
|
|
|||
Remeasurements |
|
|
|
|
|
|
|
|
|
|||
Depreciation charge for the year |
|
|
( |
) |
|
|
( |
) |
|
|
( |
) |
Impairment charge for the year |
|
|
( |
) |
|
|
|
|
|
( |
) |
|
Foreign exchange |
|
|
( |
) |
|
|
( |
) |
|
|
( |
) |
Transfers |
|
|
|
|
|
|
|
|
|
|||
At December 31, 2022 |
|
$ |
|
|
$ |
|
|
$ |
|
|||
During the year ended December 31, 2022, total impairment charges of $
Lease liabilities comprised the following as of December 31 (in thousands):
|
|
2021 |
|
|
2022 |
|
||
Current lease liabilities |
|
$ |
|
|
$ |
|
||
Non-current lease liabilities |
|
|
|
|
|
|
||
Total lease liabilities |
|
$ |
|
|
$ |
|
||
Some leases contain break clauses or extension options to provide operational flexibility. Potential future undiscounted lease payments not included in the reasonably certain lease term, and hence not included in the lease liabilities, total $
During the year ended December 31, 2022, the Group paid $
F-45
Notes to the Consolidated financial statements (continued)
During the year ended December 31, 2022, a charge of $
In the year ended December 31, 2022, the investments of the Group were comprised of minority equity interests and convertible loan notes. In the year ended December 31, 2021, the investments of the Group were comprised of minority equity interests, convertible loan notes and senior secured promissory loan notes.
|
|
Investments - held at fair value through other comprehensive income (FVTOCI) |
|
|
Investments - held |
|
Total |
|
||||||
|
|
NMG Parent LLC |
|
Other investments |
|
|
|
|
|
|
||||
At January 1, 2021 |
|
$ |
|
$ |
|
|
|
|
|
|
||||
Additions |
|
|
|
|
|
|
|
|
|
|
||||
Impairment |
|
|
|
|
( |
) |
|
|
|
|
( |
) |
||
At December 31, 2021 |
|
|
|
|
|
|
|
|
|
|
||||
Additions |
|
|
|
|
|
|
|
|
|
|
||||
Disposal |
|
|
|
|
|
|
|
( |
) |
|
( |
) |
||
Impairment |
|
|
|
|
( |
) |
|
|
|
|
( |
) |
||
Fair value remeasurement |
|
|
|
|
|
|
|
( |
) |
|
( |
) |
||
At December 31, 2022 |
|
$ |
|
$ |
|
|
|
|
|
|
||||
F-46
Notes to the Consolidated financial statements (continued)
During the year ended December 31, 2022, Silvergate Capital Corp ("Silvergate") purchased the technology and other assets of the Diem Association ("Diem"), in which the Group had previously made investments totaling $
On May 31, 2022, Farfetch UK Limited, a wholly-owned subsidiary of Farfetch Limited, acquired a minority investment in the share capital of NMG Parent LLC ("NMG"), the ultimate parent company of the Neiman Marcus Group LLC, the largest omni-channel luxury retailer in the United States, for consideration of $
Investments in associates
The table below (in thousands) illustrates the summarized financial information of the Group’s investments in Farfetch Capital Limited (formerly
|
|
|
|
|
At January 1, 2021 |
|
$ |
|
|
Step acquisition |
|
|
( |
) |
Share of loss after tax |
|
|
( |
) |
At December 31, 2021 |
|
|
|
|
Share of profit after tax |
|
|
|
|
Other |
|
|
|
|
At December 31, 2022 |
|
$ |
|
|
As of December 31, 2022,
Short-term investments consist of the following as of December 31 (in thousands):
|
|
2021 |
|
|
2022 |
|
||
Short-term investments |
|
$ |
|
|
$ |
|
||
Short-term investments |
|
$ |
|
|
$ |
|
||
The short-term investment entered into during the year ended December 31, 2021 related to variable Net Asset Value (“NAV”) investments, representing cash investments in variable money market instruments on the basis of a mark-to-market valuation of an underlying portfolio of money market instruments. These did not meet the definition of cash and cash equivalents as they were not readily convertible into known amounts of cash and were subject to significant risk of changes in value. All changes in fair value of these investments were recognized in the Consolidated statement of operations.
The short-term investment was disposed of during the year ended December 31, 2022 for proceeds of $
F-47
Notes to the Consolidated financial statements (continued)
Inventories as at December 31 comprised the following (in thousands):
|
|
2021 |
|
|
2022 |
|
||
Finished goods |
|
$ |
|
|
$ |
|
||
Obsolete stock provision |
|
|
( |
) |
|
|
( |
) |
Total inventories |
|
$ |
|
|
$ |
|
||
The total cost of inventory recognized as an expense in the consolidated statement of operations was $
Trade and other receivables comprised the following at December 31 (in thousands):
|
|
2021 |
|
|
2022 |
|
||
Non-current |
|
|
|
|
|
|
||
Other receivables |
|
$ |
|
|
$ |
|
||
Non-current other receivables |
|
$ |
|
|
$ |
|
||
Current |
|
|
|
|
|
|
||
Trade receivables |
|
$ |
|
|
$ |
|
||
Other current receivables |
|
|
|
|
|
|
||
Sales taxes |
|
|
|
|
|
|
||
Allowance for expected credit losses |
|
|
( |
) |
|
|
( |
) |
Prepayments and accrued income |
|
|
|
|
|
|
||
Current trade and other receivables |
|
$ |
|
|
$ |
|
||
Non-current other receivables is primarily comprised of withholding tax relating to share-based compensation, deposits for office leases and services and operations-related deposits, which the Group is not expecting to recover within the next twelve months.
Other current receivables primarily relate to advances to boutique partners, first-party product suppliers and other suppliers. Included within Other current receivables is $
Sales tax receivables relate to recoverable value-added tax arising on indirect exports, including between United Kingdom and Europe, where we have adapted our transactional flows in response to the formal withdrawal of the United Kingdom from the European Union on January 31, 2020.
The Group has assessed its expected credit loss (“ECL”) estimate in line with the requirements of IFRS 9 – Financial instruments (“IFRS 9”). As part of this assessment, the Group has performed a recoverability assessment of its outstanding Trade and other receivables at the reporting date and, where appropriate, made suitable adjustments to allowances and provisions. In the year ended December 31, 2022, the charge relating to expected credit losses included within the sales, general and administration in the Consolidated statement of operations is $
F-48
Notes to the Consolidated financial statements (continued)
For the purpose of presentation in the Consolidated statement of cash flows and Consolidated statement of financial position, cash and cash equivalents includes cash held in banks, money market funds such as call deposits held with financial institutions, short-term deposits including highly liquid investments with original maturities of three months or less that are readily convertible to known amounts of cash and which are subject to an insignificant risk of changes in value, and cash amounts held by payment service providers.
Cash and cash equivalents consist of the following at December 31 (in thousands):
|
|
2021 |
|
|
2022 |
|
||
Cash held in banks |
|
$ |
|
|
$ |
|
||
Money market funds |
|
|
|
|
|
|
||
Short-term deposits |
|
|
|
|
|
|
||
Amounts held by payment service providers |
|
|
|
|
|
|
||
Cash and cash equivalents |
|
$ |
|
|
$ |
|
||
19. Financial instruments and financial risk management
Financial risk management objectives
The Group’s Corporate Treasury function provides services to the business, co-ordinates access to domestic and international financial markets and monitors and manages the financial risks relating to the operations of the Group through internal risk reports which analyze exposures by degree and magnitude of risks. These risks include market risk (including currency risk, interest rate risk and price risk), credit risk and liquidity risk.
The Group seeks to minimize the effects of these risks, where appropriate, by using derivative financial instruments to hedge these risk exposures. The use of financial derivatives is governed by the Group’s policies approved by the Board, which provide written principles on foreign exchange risk, interest rate risk, credit risk and the use of derivatives. The Group does not enter into or trade financial instruments, including derivative financial instruments, for speculative purposes.
Interest rate risk
The Group enters into derivative financial instruments to manage its exposure to interest rate risk.
During the year ended December 31, 2022, the Group was exposed to interest rate risk as it borrowed funds at a floating interest rate. The $
Where the criteria for hedge accounting are not met, derivative financial instruments are initially recognized at fair value on the date on which a derivative contract is entered into and are subsequently remeasured at fair value with movements recorded to the statement of operations. Derivatives are carried as financial assets when the fair value is positive and as financial liabilities when the fair value is negative. Where all relevant criteria are met, hedge accounting is applied to minimize earnings volatility.
Market risk
The Group’s activities expose it primarily to the financial risk of changes in foreign currency exchange rates. The Group enters into derivative financial instruments to manage its exposure to foreign currency risk.
Foreign currency risk is the risk that the fair value or future cash flows of an exposure will fluctuate because of changes in foreign exchange rates.
F-49
Notes to the Consolidated financial statements (continued)
The Group uses forward currency contracts and foreign exchange option contracts to hedge its foreign currency risks. Where the criteria for hedge accounting are not met, derivative financial instruments are initially recognized at fair value on the date on which a derivative contract is entered into and are subsequently remeasured at fair value with movements recorded in the Consolidated statement of operations. Derivatives are carried as financial assets when the fair value is positive and as financial liabilities when the fair value is negative. Where all relevant criteria are met, hedge accounting is applied to minimize earnings volatility.
Liquidity risk
The Group monitors its liquidity risk to maintain a balance between continuity of funding and flexibility. This helps the Group achieve timely fulfilment of its obligations while sustaining the growth of the business. We have policies in place for managing liquidity risk, which our finance department implements and periodically reviews.
The table below (in thousands) analyses the Group’s financial liabilities into relevant groupings based on the remaining period from the reporting date to the contractual maturity date. Amounts due within twelve months equal their carrying balances, as the impact of discounting is not significant.
|
|
Less than |
|
|
Less than |
|
||
|
|
2021 |
|
|
2022 |
|
||
Trade and other payables |
|
$ |
|
|
$ |
|
||
Put and call option liabilities |
|
|
|
|
|
|
||
Current borrowings |
|
|
|
|
|
|
||
Total current |
|
$ |
|
|
$ |
|
||
|
|
More than |
|
|
More than |
|
||
|
|
2021 |
|
|
2022 |
|
||
Put and call option liabilities |
|
$ |
|
|
$ |
|
||
Borrowings |
|
|
|
|
|
|
||
Total non-current |
|
$ |
|
|
$ |
|
||
The following table analyses the Group’s non-derivative financial liabilities and gross and net settled derivative financial instruments into relevant maturity groupings, based on the remaining period at the balance sheet to the contractual maturity date. The amounts disclosed in the table are the contracted cash flows and may therefore not reconcile to the amounts disclosed in the Consolidated statement of financial position for borrowings and derivative financial instruments.
|
|
Less than twelve months |
|
|
Between one and three years |
|
|
Between three and five years |
|
|
More than five years |
|
||||
At December 31, 2022 |
|
|
|
|
|
|
|
|
|
|
|
|
||||
Non derivative financial liabilities |
|
|
|
|
|
|
|
|
|
|
|
|
||||
Convertible bonds - $400.0 million |
|
|
|
|
|
|
|
|
|
|
|
|
||||
Convertible bonds - $600.0 million |
|
|
|
|
|
|
|
|
|
|
|
|
||||
Put and call option liabilities |
|
|
|
|
|
|
|
|
|
|
|
|
||||
Guaranteed minimum royalty payments |
|
|
|
|
|
|
|
|
|
|
|
|
||||
Contingent Consideration |
|
|
|
|
|
|
|
|
|
|
|
|
||||
Obligations under leases |
|
|
|
|
|
|
|
|
|
|
|
|
||||
$400.0 million term loan |
|
|
|
|
|
|
|
|
|
|
|
|
||||
Trade and other payables |
|
|
|
|
|
|
|
|
|
|
|
|
||||
Net settled derivatives |
|
|
|
|
|
|
|
|
|
|
|
|
||||
Outflow |
|
|
|
|
|
|
|
|
|
|
|
|
||||
Gross settled derivatives |
|
|
|
|
|
|
|
|
|
|
|
|
||||
Inflow |
|
|
( |
) |
|
|
|
|
|
|
|
|
|
|||
Outflow |
|
|
|
|
|
|
|
|
|
|
|
|
||||
F-50
Notes to the Consolidated financial statements (continued)
|
|
Less than twelve months |
|
|
Between one and three years |
|
|
Between three and five years |
|
|
More than five years |
|
||||
At December 31, 2021 |
|
|
|
|
|
|
|
|
|
|
|
|
||||
Non derivative financial liabilities |
|
|
|
|
|
|
|
|
|
|
|
|
||||
Convertible bonds - $250.0 million |
|
$ |
|
|
$ |
|
|
$ |
|
|
$ |
|
||||
Convertible bonds - $400.0 million |
|
|
|
|
|
|
|
|
|
|
|
|
||||
Convertible bonds - $600.0 million |
|
|
|
|
|
|
|
|
|
|
|
|
||||
Put and call option liabilities |
|
|
|
|
|
|
|
|
|
|
|
|
||||
Contingent consideration |
|
|
|
|
|
|
|
|
|
|
|
|
||||
Obligations under leases |
|
|
|
|
|
|
|
|
|
|
|
|
||||
Trade and other payables |
|
|
|
|
|
|
|
|
|
|
|
|
||||
Net settled derivatives |
|
|
|
|
|
|
|
|
|
|
|
|
||||
Outflow |
|
|
|
|
|
|
|
|
|
|
|
|
||||
Gross settled derivatives |
|
|
|
|
|
|
|
|
|
|
|
|
||||
Inflow |
|
|
( |
) |
|
|
|
|
|
|
|
|
|
|||
Outflow |
|
|
|
|
|
|
|
|
|
|
|
|
||||
In the tables above, trade and other payables are comprised of trade payables amounting to $
The put and call option liabilities relate to non-controlling interests arising from the transactions with Palm Angels and Chalhoub, as well as the strategic agreement with Alibaba and Richemont. The non-current liabilities are comprised of $
Credit risk
Credit risk is the risk that financial loss arises from the failure of a consumer to meet its obligations under a contract. Due to the nature of our operations the Group does not have significant exposure to credit risk. The trade receivables balance is spread across a large number of different customers. The Group has policies in place to ensure that wholesale sales are made to customers with an appropriate credit history. Sales to retail customers are made in cash or via credit cards. In addition, receivables balances are monitored on an ongoing basis with the result that the Group’s exposure to bad debts is not significant and default rates have been historically low. A customer is deemed to have defaulted when the Group considers that it will not be able to make contractual payments when due.
The Group applies the IFRS 9 simplified approach to measuring expected credit losses which uses a lifetime expected loss allowance for all trade receivables. The Group applies a loss allowance to trade and other receivables. As of December 31, 2022 all trade and other receivables are current as they are due within thirty days. The expected loss rate the Group applies for trade and other receivables is
F-51
Notes to the Consolidated financial statements (continued)
The expected loss rates are based on the payment profiles of sales up to a period of thirty-six months before December 31, 2022 or January 1, 2022, respectively, and the corresponding historical credit losses experienced within this period which were not significant. The historical loss rates are adjusted to reflect current and forward looking information on macroeconomic factors affecting the ability of the consumers to settle the receivables. In addition, certain individual customers (where there is objective evidence of credit impairment) have been identified as having a significantly elevated credit risk and have been provided for on a specific basis.
The majority of the Group’s cash and cash equivalents balance is held in money market funds which are regulated by securities and market authorities. These consist of highly rated mutual investment funds which are permitted to diversify portfolio investments through high quality debt securities meeting regulatory mandated requirements. As such, the Group is not exposed to any material credit risk in relation to the cash and cash equivalents balance.
Capital risk management
The Group’s objective when managing capital is to safeguard the Group’s ability to provide returns for members and benefits for other stakeholders and to maintain an optimal capital structure to reduce the cost of capital. The Group manages its capital structure and makes adjustments to it, in light of changes to economic conditions and to the strategic objectives of the Group. The Group has raised finance through the issuance of equity, a term loan facility and convertible senior notes to private and public investors.
At December 31, 2022, the Group holds restricted cash of $
The Group is not subject to any externally imposed capital requirements. Refer to Note 20, Borrowings and embedded derivatives where we assess the new term loan and the incurrence covenants. The capital structure is as follows (in thousands):
|
|
2021 |
|
|
2022 |
|
||
|
|
|
|
|
|
|
||
Total borrowings |
|
$ |
|
|
$ |
|
||
Less: cash and cash equivalents |
|
|
( |
) |
|
|
( |
) |
Net debt |
|
|
|
|
|
|
||
Total equity |
|
|
|
|
|
|
||
Total |
|
$ |
|
|
$ |
|
||
F-52
Notes to the Consolidated financial statements (continued)
The table below reconciles the movements in our financing liabilities during the year:
|
|
|
|
|
|
|
|
Non-cash movements |
|
|||||||||||||||||||||||||||
|
|
As at December 31, 2021 |
|
|
Cash movement |
|
|
Additions |
|
|
Disposals |
|
|
Reclassification from non-current to current |
|
|
Foreign exchange movement |
|
|
Finance costs |
|
|
Fair value changes & other |
|
|
As at December 31, 2022 |
|
|||||||||
Borrowings - leases |
|
$ |
|
|
$ |
( |
) |
|
$ |
|
|
$ |
|
|
$ |
|
|
$ |
( |
) |
|
$ |
|
|
$ |
|
|
$ |
|
|||||||
Non-current borrowings - convertible notes |
|
|
|
|
|
( |
) |
|
|
|
|
|
( |
) |
|
|
|
|
|
|
|
|
|
|
|
|
|
|
|
|||||||
Borrowings-related derivative financial instruments |
|
|
|
|
|
|
|
|
|
|
|
|
|
|
|
|
|
( |
) |
|
|
|
|
|
( |
) |
|
|
|
|||||||
Non-current borrowings - term loan |
|
|
|
|
|
|
|
|
|
|
|
|
|
|
( |
) |
|
|
|
|
|
|
|
|
( |
) |
|
|
|
|||||||
Current borrowings - term loan |
|
|
|
|
|
|
|
|
|
|
|
|
|
|
|
|
|
|
|
|
|
|
|
|
|
|
|
|||||||||
Financing liabilities |
|
$ |
|
|
|
|
|
|
|
|
|
( |
) |
|
|
|
|
|
( |
) |
|
|
|
|
|
( |
) |
|
$ |
|
||||||
|
|
|
|
|
|
|
|
Non-cash movements |
|
|||||||||||||||||||||||
|
|
As at December 31, 2020 |
|
|
Cash movement |
|
|
Additions |
|
|
Early conversion of February 2020 Notes |
|
|
Foreign exchange movement |
|
|
Finance costs |
|
|
Fair value changes & other |
|
|
As at December 31, 2021 |
|
||||||||
Borrowings - leases |
|
$ |
|
|
$ |
( |
) |
|
$ |
|
|
$ |
|
|
$ |
( |
) |
|
$ |
|
|
$ |
|
|
$ |
|
||||||
Non-current borrowings - convertible notes |
|
|
|
|
|
( |
) |
|
|
|
|
|
( |
) |
|
|
|
|
|
|
|
|
|
|
|
|
||||||
Borrowings-related derivative financial instruments |
|
|
|
|
|
|
|
|
|
|
|
( |
) |
|
|
|
|
|
|
|
|
( |
) |
|
|
|
||||||
Financing liabilities |
|
$ |
|
|
|
( |
) |
|
|
|
|
|
( |
) |
|
|
( |
) |
|
$ |
|
|
|
( |
) |
|
$ |
|
||||
Mainly as a result of the gains on items held at fair value and remeasurements during the year, the Group’s total equity increased from $
The main purpose of the Group’s financial instruments is to finance the Group’s operations.
The main risks from the Group’s financial instruments are interest rate risk, currency risk and liquidity risk. The Board reviews and approves policies, which have remained substantially unchanged for the year under review, for managing these risks.
F-53
Notes to the Consolidated financial statements (continued)
Hedge accounting classification and impact forecast
The Group designates certain forward foreign exchange contracts and foreign exchange option contracts as cash flow hedges of forecast foreign currency revenue and costs. During the current year, net losses of $
The amount taken to selling, general and administrative expenses included a $
The Group designates certain interest rate swap contracts as cash flow hedges of forecast interest costs on borrowings. During the current year, net losses of $
The Group uses a qualitative method for assessing hedge effectiveness for exchange rate risk. The hedge is assessed at inception and throughout the life of the hedge. Effectiveness between the hedged item and hedging instrument is tested by comparing the critical terms of both items and concluding that they are offsetting.
The Group uses a qualitative method for assessing hedge effectiveness for interest rate risk. The hedge is assessed at inception and throughout the life of the hedge. Effectiveness between the hedged item and hedging instrument is tested by comparing the critical terms of both items and concluding that they are offsetting.
Financial instruments sensitivity analysis
In managing currency risk the Group aims to reduce the impact of short term fluctuations on its earnings. At the end of each reporting year, the effects of hypothetical changes in currency are as follows:
F-54
Notes to the Consolidated financial statements (continued)
Foreign exchange rate sensitivity analysis
The tables below (in thousands) shows the Group’s sensitivity to U.S. dollars, pounds sterling and euro strengthening/weakening by 10%:
|
|
Increase/ |
|
|
Increase/ |
|
||
|
|
2021 |
|
|
2022 |
|
||
10% appreciation of U.S. dollars |
|
$ |
( |
) |
|
$ |
( |
) |
10% depreciation of U.S. dollars |
|
|
|
|
|
|
||
|
|
Increase/ |
|
|
Increase/ |
|
||
|
|
2021 |
|
|
2022 |
|
||
10% appreciation of U.S. dollars |
|
$ |
( |
) |
|
$ |
( |
) |
10% depreciation of U.S. dollars |
|
|
|
|
|
|
||
|
|
Increase/ |
|
|
Increase/ |
|
||
|
|
2021 |
|
|
2022 |
|
||
10% appreciation of GBP |
|
$ |
|
|
$ |
|
||
10% depreciation of GBP |
|
|
( |
) |
|
|
( |
) |
|
|
Increase/ |
|
|
Increase/ |
|
||
|
|
2021 |
|
|
2022 |
|
||
10% appreciation of GBP |
|
$ |
|
|
$ |
|
||
10% depreciation of GBP |
|
|
( |
) |
|
|
( |
) |
|
|
Increase/ |
|
|
Increase/ |
|
||
|
|
2021 |
|
|
2022 |
|
||
10% appreciation of EUR |
|
$ |
|
|
$ |
|
||
10% depreciation of EUR |
|
|
( |
) |
|
|
( |
) |
|
|
Increase/ |
|
|
Increase/ |
|
||
|
|
2021 |
|
|
2022 |
|
||
10% appreciation of EUR |
|
$ |
|
|
$ |
|
||
10% depreciation of EUR |
|
|
( |
) |
|
|
( |
) |
This analysis reflects the impact on the Consolidated statement of operations due to changes in the value of financial assets and liabilities held at the balance sheet date, based on foreign currency exchange rate variances that the Group considers to be reasonably possible at the end of the reporting year. The analysis assumes that all other variables, in particular interest rates, remain constant.
F-55
Notes to the Consolidated financial statements (continued)
Interest rate sensitivity analysis
The table below shows the Group’s sensitivity to interest rates strengthening/weakening by 100 basis points:
|
|
Increase/ |
|
|
Increase/ |
|
||
|
|
2021 |
|
|
2022 |
|
||
100 basis points increase |
|
$ |
|
|
$ |
( |
) |
|
100 basis points decrease |
|
|
|
|
|
|
||
|
|
Increase/ |
|
|
Increase/ |
|
||
|
|
2021 |
|
|
2022 |
|
||
100 basis points increase |
|
$ |
|
|
$ |
|
||
100 basis points decrease |
|
|
|
|
|
( |
) |
|
F-56
Notes to the Consolidated financial statements (continued)
This analysis reflects the impact on the Consolidated statement of operations due to financial assets and liabilities held at the balance sheet date and is based on interest rate variances that the Group considers to be reasonably possible at the end of the reporting year. The analysis assumes that all other variables, in particular foreign exchange rates, remain constant.
Assets and liabilities measured at fair value and present value on a recurring basis:
|
|
December 31, 2021 |
|
|
December 31, 2022 |
|
||||||||||||||||||||
|
|
Level 1 |
|
Level 2 |
|
Level 3 |
|
Total |
|
|
Level 1 |
|
Level 2 |
|
Level 3 |
|
Total |
|
||||||||
Short-term investments |
|
$ |
|
$ |
|
$ |
|
$ |
|
|
$ |
|
$ |
|
$ |
|
$ |
|
||||||||
Investments |
|
|
|
|
|
|
|
|
|
|
|
|
|
|
|
|
|
|
||||||||
Derivative financial instruments |
|
|
|
|
|
|
|
|
|
|
|
|
|
|
|
|
|
|
||||||||
Assets |
|
$ |
|
$ |
|
$ |
|
$ |
|
|
$ |
|
$ |
|
$ |
|
$ |
|
||||||||
|
|
|
|
|
|
|
|
|
|
|
|
|
|
|
|
|
|
|
||||||||
|
|
December 31, 2021 |
|
|
December 31, 2022 |
|
||||||||||||||||||||
|
|
Level 1 |
|
Level 2 |
|
Level 3 |
|
Total |
|
|
Level 1 |
|
Level 2 |
|
Level 3 |
|
Total |
|
||||||||
Derivative financial instruments (non-current and current) |
|
$ |
|
$ |
|
$ |
|
$ |
|
|
$ |
|
$ |
|
$ |
|
$ |
|
||||||||
Embedded derivatives (non-current) – February 2020 notes |
|
|
|
|
|
|
|
|
|
|
|
|
|
|
|
|
|
|
||||||||
Embedded derivatives (non-current) – April 2020 notes |
|
|
|
|
|
|
|
|
|
|
|
|
|
|
|
|
|
|
||||||||
Embedded derivatives (non-current) – November 2020 notes |
|
|
|
|
|
|
|
|
|
|
|
|
|
|
|
|
|
|
||||||||
Put and call option liability (current) – Chalhoub |
|
|
|
|
|
|
|
|
|
|
|
|
|
|
|
|
|
|
||||||||
Put and call option liability (non-current) – Alibaba and Richemont |
|
|
|
|
|
|
|
|
|
|
|
|
|
|
|
|
|
|
||||||||
Put and call option liability (current) – Alanui |
|
|
|
|
|
|
|
|
|
|
|
|
|
|
|
|
|
|
||||||||
Put and call option liability (non-current) – Palm Angels |
|
|
|
|
|
|
|
|
|
|
|
|
|
|
|
|
|
|
||||||||
Liabilities |
|
$ |
|
$ |
|
$ |
|
$ |
|
|
$ |
|
$ |
|
$ |
|
$ |
|
||||||||
|
|
|
|
|
|
|
|
|
|
|
|
|
|
|
|
|
|
|
||||||||
Fair value and present value measurement of financial instruments is presented through the use of a three-level fair value hierarchy that prioritizes the inputs used in each of the valuation techniques for fair value and present value calculations.
The Group maintains policies and procedures to value instruments using the most relevant data available.
The Group recognizes the following financial instruments at fair value:
F-57
Notes to the Consolidated financial statements (continued)
The Group recognizes the following financial liabilities at present value:
During the year ended December 31, 2022, there were no transfers between levels in the fair value hierarchy or significant changes in the measurement and valuation techniques used.
F-58
Notes to the Consolidated financial statements (continued)
Reconciliation of recurring fair value measurements categorized within Level 3 of the fair value hierarchy:
|
|
Put and call option liability |
|
|||||||
|
|
Alanui |
|
|
|
Palm Angels |
|
|||
At January 1, 2021 |
|
$ |
|
|
|
$ |
|
|||
Initial recognition |
|
$ |
|
|
|
$ |
|
|||
Losses recognized in consolidated statement of operations |
|
|
|
|
|
|
|
|||
Foreign exchange movement |
|
|
( |
) |
|
|
|
( |
) |
|
At December 31, 2021 |
|
$ |
|
|
|
$ |
|
|||
|
|
|
|
|
|
|
|
|||
At January 1, 2022 |
|
$ |
|
|
|
$ |
|
|||
Losses/(gains) recognized in consolidated statement of operations |
|
|
|
|
- |
|
|
( |
) |
|
Foreign exchange movement |
|
|
( |
) |
|
|
|
( |
) |
|
At December 31, 2022 |
|
$ |
|
|
|
$ |
|
|||
|
|
|
|
|
|
|
|
|||
With the exception of the items below, the carrying amount of the Group's financial assets and financial liabilities approximate their fair value.
Assets and liabilities not measured at fair value on a recurring basis:
|
|
December 31, 2021 |
|
|
December 31, 2022 |
|
||||||||||
|
|
Carrying value |
|
|
Fair value |
|
|
Carrying value |
|
|
Fair value |
|
||||
Non-current borrowings |
|
$ |
|
|
$ |
|
|
$ |
|
|
$ |
|
||||
Other financial liabilities (Non-current) |
|
|
|
|
|
|
|
|
|
|
|
|
||||
Other financial liabilities (Current) |
|
|
|
|
|
|
|
|
|
|
|
|
||||
The Group manages its capital to ensure that entities in the Group will be able to continue as going concerns. As of December 31, 2022, the capital structure consisted of equity and debt, and the Group was not subject to any externally imposed capital requirements.
The Group has identified
Details of the significant accounting policies and methods adopted (including the criteria for recognition, the basis of measurement and the bases for recognition of income and expenses) for each class of financial asset, financial liability and equity instrument are disclosed in Note 2, Significant accounting policies.
Categories of financial instruments
Financial assets (in thousands)
|
|
Amortized |
|
|
Amortized |
|
||
|
|
2021 |
|
|
2022 |
|
||
Current |
|
|
|
|
|
|
||
Trade receivables |
|
$ |
|
|
$ |
|
||
Other receivables |
|
|
|
|
|
|
||
Cash and cash equivalents |
|
|
|
|
|
|
||
Non-current |
|
|
|
|
|
|
||
Other receivables |
|
|
|
|
|
|
||
Total |
|
$ |
|
|
$ |
|
||
F-59
Notes to the Consolidated financial statements (continued)
|
|
Fair value |
|
|
Fair value |
|
||
|
|
2021 |
|
|
2022 |
|
||
Foreign currency derivatives - held at FVTPL |
|
$ |
|
|
$ |
|
||
Foreign currency derivatives - held as cash flow hedges |
|
|
|
|
|
|
||
Derivative financial assets |
|
$ |
|
|
$ |
|
||
Financial liabilities (in thousands)
|
|
Fair value |
|
|
Fair value |
|
||
|
|
2021 |
|
|
2022 |
|
||
Foreign currency derivatives - held at FVTPL |
|
$ |
|
|
$ |
|
||
Foreign currency derivatives - held as cash flow hedges |
|
|
|
|
|
|
||
Interest rate swap - held as cash flow hedge - non-current |
|
|
|
|
|
|
||
Interest rate swap - held as cash flow hedge - current |
|
|
|
|
|
|
||
Total non-current and current derivative financial liabilities |
|
$ |
|
|
$ |
|
||
|
|
Present value |
|
|
Present value |
|
||
|
|
2021 |
|
|
2022 |
|
||
Put and call option liabilities - non-current |
|
$ |
|
|
$ |
|
||
Put and call option liabilities - current |
|
|
|
|
|
|
||
Total Put and call option liabilities |
|
$ |
|
|
$ |
|
||
With the exception of the Group’s non-current borrowings, the carrying amount of the Group’s financial assets and financial liabilities approximate their fair value.
The notional amounts of the Group’s outstanding foreign currency derivatives at year end are:
|
|
Notional |
|
|
Notional |
|
||
|
|
2021 |
|
|
2022 |
|
||
Foreign currency derivatives |
|
$ |
|
|
$ |
|
||
Interest rate swaps |
|
|
|
|
|
|
||
Total |
|
$ |
|
|
$ |
|
||
The average exchange rate for GBP:USD forward exchange contracts is
|
|
2021 |
|
|
2022 |
|
||
$ |
|
$ |
|
|
$ |
|
||
$ |
|
|
|
|
|
|
||
$ |
|
|
|
|
|
|
||
$ |
|
|
|
|
|
|||
Total |
|
$ |
|
|
$ |
|
||
The values of the three conversion options discussed above are subsequently remeasured at fair value at each reporting date, and the changes in the fair values are recorded in the Consolidated statement of operations within the (losses)/gains on items held at fair value and remeasurements line. The fair values of the embedded derivatives are determined using an option pricing model, using assumptions based on market conditions at the reporting date. For further details refer to Note 19, Financial instruments and financial risk management. For the year ended December 31, 2022, the Group recorded a fair value gain on remeasurement of $
F-60
Notes to the Consolidated financial statements (continued)
of $
Borrowings
The convertible/non-convertible borrowings are presented in the Consolidated statement of financial position as follows (in thousands):
|
|
2021 |
|
|
2022 |
|
||
|
|
|
|
|
|
|
||
At January 1 |
|
$ |
|
|
$ |
|
||
Transaction costs |
|
|
|
|
|
|
||
Interest expense |
|
|
|
|
|
|
||
Interest paid |
|
|
( |
) |
|
|
( |
) |
New Term Loan |
|
|
|
|
|
|
||
Current portion of term loan |
|
|
|
|
|
( |
) |
|
Conversion of February 2020 Notes |
|
|
( |
) |
|
|
|
|
Derecognition of February 2020 Notes |
|
|
|
|
|
( |
) |
|
Total non-current borrowings |
|
$ |
|
|
$ |
|
||
Term Loan Facility
On October 20, 2022 the Group entered into a Credit Agreement (the "Credit Agreement") with Farfetch US Holdings, Inc. (the “Borrower”), a Delaware corporation and wholly-owned indirect subsidiary of Farfetch Limited, Farfetch Holdings plc, JPMorgan Chase Bank, N.A., as administrative agent, Wilmington Trust, National Association, as collateral agent, J.P. Morgan Securities LLC, as the lead arranger and sole physical bookrunner, and certain banks and financial institutions party thereto as lenders and issuing banks.
The Credit Agreement provides for a $
The Credit Agreement contains customary affirmative covenants as well as customary negative covenants, including, but not limited to, restrictions on certain entities in the Group's ability to incur additional debt, make investments, make distributions to our stockholders, dispose of assets, repay junior debt or enter into certain types of related party transactions. The Term Loan is secured against specified assets of the Farfetch group and guaranteed by certain material subsidiaries. The Term Loan does not include maintenance covenants.
During the year ended December 31, 2022, the Group incurred transaction costs of $
As of December 31, 2022, we had approximately $
Convertible Notes
On February 5, 2020, the Group issued $
F-61
Notes to the Consolidated financial statements (continued)
investors. On April 30, 2020, the Group issued $
The February 2020, April 2020 and November 2020 Notes represent senior unsecured obligations of the Group. With respect to the February 2020 Notes, the interest rate is fixed at
February 2020 Notes - Early Repayment
On October 20, 2022, the Group signed an agreement with the holders of the February 2020 Notes to early repay these notes.
On October 27, 2022, the Group early repaid the February 2020 Notes through the issuance of
The impact of the early repayment on the Consolidated statement of operations within the (losses)/gains on items held at fair value and remeasurements line was a $
The issuance of
On May 17, 2021, a total of
On August 6, 2021, a total of
On October 1, 2021, a total of
Each $
F-62
Notes to the Consolidated financial statements (continued)
Upon conversion of these notes, the Group would have had to pay or deliver, as the case may be, cash, shares of its common stock or a combination of cash and shares of its common stock, at the Group’s election. If the Group satisfied its conversion obligation solely in cash or through payment and delivery, as the case may be, of a combination of cash and shares of its common stock, the amount of cash and shares of common stock, if any, due upon conversion of the February 2020 Notes, as applicable, would be based on a daily conversion value (as defined in the indenture governing the applicable series of Convertible Notes) calculated on a proportionate basis for each trading day in the applicable observation period.
If a change of control (as defined in the indenture) had occurred prior to the applicable maturity date, holders of the February 2020 Notes, as applicable, may have required the Group to repurchase all of their notes for cash at a
The original terms (as defined in the indenture) stated that the Group may redeem the February 2020 Notes, in whole, at any time on or after February 5, 2024 at a price equal to
In accordance with the accounting guidance in IFRS 9 on embedded conversion features, the Group valued and bifurcated the conversion option associated with the February 2020 Notes from the respective host debt instrument, which is referred to as a debt discount, and initially recorded the conversion option at $
F-63
Notes to the Consolidated financial statements (continued)
February 2020 Notes assumptions
|
2021 |
|
|
2022 |
|
||
Embedded derivative |
|
|
|
|
|
||
Closing share price |
$ |
|
|
$ |
|
||
Risk free rate |
|
% |
|
|
|
||
Expected volatility |
|
% |
|
|
|
||
Remaining life (years) |
|
|
|
|
|
||
February 2020 Notes – sensitivity analysis
Assumption |
|
Increase/(decrease) in profit or loss |
|
|
Increase/(decrease) in profit or loss |
|
||
|
|
2021 |
|
|
2022 |
|
||
Share Price increases by $ |
|
$ |
( |
) |
|
$ |
|
|
Risk free rate increases by |
|
|
( |
) |
|
|
|
|
Expected volatility increases by |
|
|
( |
) |
|
|
|
|
April 2020 Notes
Each $
Upon conversion of these notes, the Group will pay or deliver, as the case may be, cash, shares of its common stock or a combination of cash and shares of its common stock, at the Group’s election. If the Group satisfies its conversion obligation solely in cash or through payment and delivery, as the case may be, of a combination of cash and shares of its common stock, the amount of cash and shares of common stock, if any, due upon conversion of the April 2020 Notes, as applicable, will be based on a daily conversion value (as defined in the indenture governing the applicable series of Convertible Notes).
If a fundamental change (as defined in the indenture governing these Convertible Notes) occurs prior to the applicable maturity date, holders of these notes, as applicable, may require the Group to repurchase all of the April 2020 Notes for cash at a repurchase price equal to the principal amount of the April 2020 Notes to be repurchased, plus accrued and unpaid interest, if any, up to, but excluding, the fundamental change repurchase date. In addition, if specific corporate events occur prior to the applicable maturity date of the April 2020 Notes, the Group may redeem the April 2020 Notes in whole, at a cash redemption price equal to the principal amount of the notes to be redeemed, plus accrued and unpaid interest, if any, up to but excluding, the redemption date. Further, calling any April 2020 Notes for redemption will be subject to a “make-whole” premium and therefore the conversion rate applicable to the conversion of that note will be increased in certain circumstances if it is converted during a specified period after it is called for redemption.
In accordance with the accounting guidance in IFRS 9 on embedded conversion features, the Group valued and bifurcated the conversion option associated with the April 2020 Notes from the host debt instrument, which is referred to as a debt discount, and initially recorded the conversion option of $
F-64
Notes to the Consolidated financial statements (continued)
The Group may redeem the April 2020 Notes, in whole, at any time on or after May 6, 2024, only if the share price is
April 2020 Notes assumptions
|
2021 |
|
|
2022 |
|
||
Embedded derivative |
|
|
|
|
|
||
Closing share price |
$ |
|
|
$ |
|
||
Risk free rate |
|
% |
|
|
% |
||
Expected volatility |
|
% |
|
|
% |
||
Remaining life (years) |
|
|
|
|
|
||
April 2020 Notes – sensitivity analysis
Assumption |
|
Increase/(decrease) in profit or loss |
|
|
Increase/(decrease) in profit or loss |
|
||
|
|
2021 |
|
|
2022 |
|
||
Share Price increases by $ |
|
$ |
( |
) |
|
$ |
( |
) |
Risk free rate increases by |
|
|
( |
) |
|
|
( |
) |
Expected volatility increases by |
|
|
( |
) |
|
|
( |
) |
November 2020 Notes
Each $
Upon conversion of these shares, depending on the identity of the holder, the Group will pay or deliver, as the case may be, cash, shares of its common stock or a combination of cash and shares of its common stock, at the Group’s election. If the Group satisfies its conversion obligation solely in cash or through payment and delivery, as the case may be, of a combination of cash and shares of its common stock, the amount of cash and shares of common stock, if any, due upon conversion of the notes, as applicable, will be based on a daily conversion value (as defined in the indenture governing the applicable series of Convertible Notes).
If certain events occur that constitute a “fundamental change” (as defined in the indenture governing the terms of the November 2020 Notes), holders of the November 2020 Notes will have the right to require the Group to repurchase all or some of their November 2020 Notes for cash at a repurchase price equal to
Alibaba and Richemont may require the Group to repurchase all or part of their respective November 2020 Notes on June 30, 2026 at a repurchase price equal to
F-65
Notes to the Consolidated financial statements (continued)
The Group will not be able to redeem the November 2020 Notes prior to November 15, 2023, except in the event of certain tax law changes. On or after November 15, 2023, the Group may redeem, for cash, all or part of the relevant November 2020 Notes if the last reported sale price of its Class A ordinary shares has been at least
In accordance with the accounting guidance in IFRS 9 on embedded conversion features, the Group valued and bifurcated the conversion option associated with the November 2020 Notes from the host debt instrument, which is referred to as a debt discount, and initially recorded the conversion option of $
November 2020 Notes assumptions
|
2021 |
|
|
2022 |
|
||
Embedded derivative |
|
|
|
|
|
||
Closing share price |
$ |
|
|
$ |
|
||
Risk free rate |
|
% |
|
|
% |
||
Expected volatility |
|
% |
|
|
% |
||
Credit spread (basis points) |
|
|
|
|
|
||
November 2020 Notes – sensitivity analysis
Assumption |
|
Increase/(decrease) in profit or loss |
|
|
Increase/(decrease) in profit or loss |
|
||
|
|
2021 |
|
|
2022 |
|
||
Share Price increases by $ |
|
$ |
( |
) |
|
$ |
( |
) |
Credit spread increases by |
|
|
( |
) |
|
|
( |
) |
Expected volatility increases by |
|
|
( |
) |
|
|
( |
) |
Change in fair value of convertible note embedded derivatives
|
|
|
|
|
Non-cash movements |
|
||||||||||||||
|
|
As at December 31, 2021 |
|
|
Early conversion of February 2020 Notes |
|
|
Fair value (gain)/loss |
|
|
Foreign exchange movement |
|
|
As at December 31, 2022 |
|
|||||
February 2020 Notes embedded derivative |
|
$ |
|
|
$ |
|
|
$ |
( |
) |
|
$ |
|
|
$ |
|
||||
April 2020 Notes embedded derivative |
|
|
|
|
|
|
|
|
( |
) |
|
|
( |
) |
|
|
|
|||
November 2020 Notes embedded derivative |
|
|
|
|
|
|
|
|
( |
) |
|
|
|
|
|
|
||||
Total |
|
$ |
|
|
$ |
|
|
$ |
( |
) |
|
$ |
( |
) |
|
$ |
|
|||
F-66
Notes to the Consolidated financial statements (continued)
The change in fair value of convertible note embedded derivatives during the year ended December 31, 2022 includes a $
|
|
|
|
|
Non-cash movements |
|
||||||||||||||
|
|
As at December 31, 2020 |
|
|
Early conversion of February 2020 Notes |
|
|
Fair value (gain)/loss |
|
|
Foreign exchange movement |
|
|
As at December 31, 2021 |
|
|||||
February 2020 Notes embedded derivative |
|
$ |
|
|
$ |
( |
) |
|
$ |
( |
) |
|
$ |
|
|
$ |
|
|||
April 2020 Notes embedded derivative |
|
|
|
|
|
|
|
|
( |
) |
|
|
|
|
|
|
||||
November 2020 Notes embedded derivative |
|
|
|
|
|
|
|
|
( |
) |
|
|
|
|
|
|
||||
Total |
|
$ |
|
|
$ |
( |
) |
|
$ |
( |
) |
|
$ |
|
|
$ |
|
|||
The change in fair value of convertible note embedded derivatives during the year ended December 31, 2021 includes a $
On May 17, 2021, one of the private investors in the February 2020 Notes converted $
On August 6, 2021, the same private investor converted the remaining $
F-67
Notes to the Consolidated financial statements (continued)
On October 1, 2021, the other private investor of the February 2020 Notes converted $
|
|
|
|
|
Non-cash movements |
|
||||||||||
|
|
As at December 31, 2019 |
|
|
Initial Recognition |
|
|
Fair value (gain)/loss |
|
|
As at December 31, 2020 |
|
||||
February 2020 Notes embedded derivative |
|
$ |
|
|
$ |
|
|
$ |
|
|
$ |
|
||||
April 2020 Notes embedded derivative |
|
|
|
|
|
|
|
|
|
|
|
|
||||
November 2020 Notes embedded derivative |
|
|
|
|
|
|
|
|
|
|
|
|
||||
Total |
|
$ |
|
|
$ |
|
|
$ |
|
|
$ |
|
||||
The change in fair value of convertible note embedded derivatives during the year ended December 31, 2020 includes a $
|
|
2021 |
|
|
2022 |
|
||
Chalhoub put option |
|
$ |
|
|
$ |
|
||
Palm Angels put call option and earn-out |
|
|
|
|
|
|
||
Alibaba and Richemont put option |
|
|
|
|
|
|
||
Alanui put option |
|
|
|
|
|
|
||
Total |
|
$ |
|
|
$ |
|
||
Put and call option liabilities
There have been no significant changes in the measurement and valuation techniques used to value instruments in existence as of December 31, 2022.
The Group records the value of put and call option liabilities at the present value of probability-weighted future cash flows related to certain performance criteria and the fair value of our common stock at each reporting date. Further details of the Group’s put and call option liabilities are detailed below:
F-68
Notes to the Consolidated financial statements (continued)
Chalhoub
The put and call option relating to Chalhoub is over the
Assumption |
|
Increase/(decrease) in profit or loss |
|
|
Increase/(decrease) in profit or loss |
|
||
|
|
2021 |
|
|
2022 |
|
||
Share Price increases by $ |
|
$ |
( |
) |
|
$ |
|
|
Expected volatility increases by |
|
|
( |
) |
|
|
|
|
Credit spread increases by |
|
|
|
|
|
|
||
(1) The Chalhoub valuation figure is no longer calculated under the Monte Carlo simulation, as it is now calculated as what management expect to pay as at the settlement date.
Palm Angels
The put and call option relating to Palm Angels is over the
Palm Angels – Sensitivity analysis
If expected revenue in fiscal year 2025 increased by
F-69
Notes to the Consolidated financial statements (continued)
Strategic arrangement with Alibaba and Richemont
The put-call option related to the strategic arrangement with Alibaba and Richemont
The estimated value of the put and call option liability related to the strategic agreement with Alibaba and Richemont that represents the option to potentially convert or require the conversion of the investment in Farfetch China to shares in Farfetch Limited is based on the present value of future cash flows related to the fair value of our common stock at each reporting date. Changes in the value of the put and call option liability subsequent to the acquisition date, such as changes in the fair value of our common stock, are recognized in earnings in the period when the change in the estimated present value occurs. During the year ended December 31, 2021, we initially recognized put and call option liabilities of $
Strategic arrangement with Alibaba and Richemont – Sensitivity analysis
Assumption |
|
Increase/(decrease) in profit or loss |
|
|
Increase/(decrease) in profit or loss |
|
||
|
|
2021 |
|
|
2022 |
|
||
Share Price increases by $ |
|
$ |
( |
) |
|
$ |
( |
) |
Risk free rate increases by |
|
|
( |
) |
|
|
( |
) |
Credit spread increases by |
|
|
|
|
|
|
||
Change on remeasurement of put and call option and contingent consideration liabilities
The change on remeasurement of put and call option and contingent consideration liabilities during the year ended December 31, 2022 includes a $
The change on remeasurement of put and call option and contingent consideration liabilities during the year ended December 31, 2021 includes a $
In addition, during the year ended December 31, 2021, as a result of the acquisition of
F-70
Notes to the Consolidated financial statements (continued)
The change on remeasurement of put and call option and contingent consideration liabilities during the year ended December 31, 2020 includes a $
In 2021, the valuation of the Chalhoub liability is based on the Monte Carlo simulation, in which the share price of Farfetch is the significant input. In 2022, given that the valuation of the future settlement of this liability is based on the group's share price at December 31, 2022 of $
|
|
Dilapidations |
|
|
Share-based |
|
|
Provision for withholding taxes |
|
|
Other provisions |
|
|
Total |
|
|||||
Current liabilities |
|
|
|
|
|
|
|
|
|
|
|
|
|
|
|
|||||
At January 1, 2021 |
|
$ |
|
|
$ |
|
|
$ |
|
|
$ |
|
|
$ |
|
|||||
Additional provision in the year |
|
|
|
|
|
|
|
|
|
|
|
|
|
|
|
|||||
Release of provision in the year |
|
|
|
|
|
( |
) |
|
|
|
|
|
( |
) |
|
|
( |
) |
||
Utilized provision in the year |
|
|
( |
) |
|
|
|
|
|
( |
) |
|
|
( |
) |
|
|
( |
) |
|
Transfer from non-current provisions |
|
|
|
|
|
|
|
|
|
|
|
|
|
|
|
|||||
Foreign exchange |
|
|
( |
) |
|
|
|
|
|
|
|
|
( |
) |
|
|
( |
) |
||
At December 31, 2021 |
|
|
|
|
|
|
|
|
|
|
|
|
|
|
|
|||||
Additional provision in the year |
|
|
|
|
|
|
|
|
|
|
|
|
|
|
|
|||||
Release of provision in the year |
|
|
|
|
|
|
|
|
( |
) |
|
|
( |
) |
|
|
( |
) |
||
Utilized provision in the year |
|
|
( |
) |
|
|
|
|
|
|
|
|
( |
) |
|
|
( |
) |
||
Transfer from non-current provisions |
|
|
|
|
|
( |
) |
|
|
|
|
|
|
|
|
( |
) |
|||
Foreign exchange |
|
|
( |
) |
|
|
|
|
|
|
|
|
( |
) |
|
|
( |
) |
||
At December 31, 2022 |
|
$ |
|
|
$ |
|
|
$ |
|
|
$ |
|
|
$ |
|
|||||
|
|
|
|
|
|
|
|
|
|
|
|
|
|
|
|
|||||
Non-current liabilities |
|
|
|
|
|
|
|
|
|
|
|
|
|
|
|
|||||
At January 1, 2021 |
|
$ |
|
|
$ |
|
|
$ |
|
|
$ |
|
|
$ |
|
|||||
Additional provision in the year |
|
|
|
|
|
|
|
|
|
|
|
|
|
|
|
|||||
Transfer to current provisions |
|
|
( |
) |
|
|
|
|
|
( |
) |
|
|
|
|
|
( |
) |
||
Release of provision in the year |
|
|
( |
) |
|
|
( |
) |
|
|
( |
) |
|
|
( |
) |
|
|
( |
) |
Utilized provision in the year |
|
|
( |
) |
|
|
( |
) |
|
|
|
|
|
( |
) |
|
|
( |
) |
|
Foreign exchange |
|
|
( |
) |
|
|
( |
) |
|
|
|
|
|
|
|
|
( |
) |
||
At December 31, 2021 |
|
|
|
|
|
|
|
|
|
|
|
|
|
|
|
|||||
Additional provision in the year |
|
|
|
|
|
|
|
|
|
|
|
|
|
|
|
|||||
Transfer to current provisions |
|
|
( |
) |
|
|
|
|
|
|
|
|
|
|
|
|
||||
Release of provision in the year |
|
|
( |
) |
|
|
( |
) |
|
|
|
|
|
( |
) |
|
|
( |
) |
|
Utilized provision in the year |
|
|
( |
) |
|
|
( |
) |
|
|
|
|
|
|
|
|
( |
) |
||
Foreign exchange |
|
|
( |
) |
|
|
( |
) |
|
|
|
|
|
|
|
|
( |
) |
||
At December 31, 2022 |
|
$ |
|
|
$ |
|
|
$ |
|
|
$ |
|
|
$ |
|
|||||
F-71
Notes to the Consolidated financial statements (continued)
The dilapidations provision reflects the best estimate of the cost to restore leasehold property in line with the Group’s contractual obligations. Based on a detailed analysis the Group has estimated a liability of $
The share-based payments employment taxes provision reflects the best estimate of the cost to settle employment related taxes in connection with the Group's share-based payments. This is based on the most recent share price and the number of share options vested and un-exercised, or expected to vest where the Group has a future obligation to settle employment related taxes. The Group had estimated a liability of $
F-72
Notes to the Consolidated financial statements (continued)
Other non-current liabilities consist of the following at December 31 (in thousands):
|
|
2021 |
|
|
2022 |
|
||
Cash-settled awards liability |
|
$ |
|
|
$ |
|
||
Employee severance liability |
|
|
|
|
|
|
||
Total non-current liabilities |
|
$ |
|
|
$ |
|
||
The employee severance liability relates to a severance indemnity obligation under Italian law in respect of employees of the Group’s Italian subsidiaries.
Current employee benefit obligations of $
The Group has
a. Equity-settled
During the year ended December 31, 2022, the Group's
Type of arrangement |
|
EMI approved share |
|
|
Unapproved share |
|
|
LTIP 2015 plan |
|
|
LTIP 2018 plan |
|
||||
Date of first grant |
|
|
|
|
|
|
|
|
||||||||
Number granted |
|
|
|
|
|
|
|
|
|
|
|
|
||||
Contractual life |
|
|
|
|
|
|
|
|
||||||||
Vesting conditions |
|
|
|
|
|
|
|
|
||||||||
F-73
Notes to the Consolidated financial statements (continued)
The movement in share options and RSUs outstanding is summarized in the following table:
|
|
Share Options (1) |
|
|
RSUs (1) |
|
||||||||||
|
|
Number |
|
|
Weighted average exercise price |
|
|
Number |
|
|
Weighted average exercise price |
|
||||
Outstanding at January 1, 2020 |
|
|
|
|
$ |
|
|
|
|
|
$ |
|
||||
Granted during the year |
|
|
|
|
|
|
|
|
|
|
|
|
||||
Exercised during the year |
|
|
( |
) |
|
|
|
|
|
( |
) |
|
|
|
||
Forfeited during the year |
|
|
( |
) |
|
|
|
|
|
( |
) |
|
|
|
||
Expired during the year |
|
|
( |
) |
|
|
|
|
|
|
|
|
|
|||
Outstanding at December 31, 2020 |
|
|
|
|
|
|
|
|
|
|
|
|
||||
Granted during the year |
|
|
|
|
|
|
|
|
|
|
|
|
||||
Exercised during the year |
|
|
( |
) |
|
|
|
|
|
( |
) |
|
|
|
||
Forfeited during the year |
|
|
( |
) |
|
|
|
|
|
( |
) |
|
|
|
||
Expired during the year |
|
|
|
|
|
|
|
|
|
|
|
|||||
Outstanding at December 31, 2021 |
|
|
|
|
|
|
|
|
|
|
|
|
||||
Granted during the year |
|
|
|
|
|
|
|
|
|
|
|
|
||||
Exercised during the year |
|
|
( |
) |
|
|
|
|
|
( |
) |
|
|
|
||
Forfeited during the year |
|
|
( |
) |
|
|
|
|
|
( |
) |
|
|
|
||
Expired during the year |
|
|
( |
) |
|
|
|
|
|
|
|
|
|
|||
Outstanding at December 31, 2022 |
|
|
|
|
$ |
|
|
|
|
|
$ |
|
||||
(1) Amounts for the years ended December 31, 2021 and 2020 have been re-presented to separately disclose share options and RSUs.
Weighted average exercise prices and remaining contractual life years were as follows:
The following table summarizes information about share options and RSUs outstanding at December 31, 2022:
|
|
Share Options (1) |
|
|
RSUs (1) |
|
||||||||||
|
|
Number |
|
|
Weighted |
|
|
Number |
|
|
Weighted |
|
||||
Range of exercise prices |
|
|
|
|
|
|
|
|
|
|
|
|
||||
$ |
|
|
|
|
|
|
|
|
|
|
|
|
||||
$ |
|
|
|
|
|
|
|
|
|
|
|
|
||||
$ |
|
|
|
|
|
|
|
|
|
|
|
|
||||
$ |
|
|
|
|
|
|
|
|
|
|
|
|
||||
$ |
|
|
|
|
|
|
|
|
|
|
|
|
||||
(1) Amounts for the years ended December 31, 2021 and 2020 have been re-presented to separately disclose share options and RSUs.
F-74
Notes to the Consolidated financial statements (continued)
The following table summarizes information about share options and RSUs outstanding at December 31, 2021:
|
|
Share Options (1) |
|
|
RSUs (1) |
|
||||||||||
|
|
Number |
|
|
Weighted |
|
|
Number |
|
|
Weighted |
|
||||
Range of exercise prices |
|
|
|
|
|
|
|
|
|
|
|
|
||||
$ |
|
|
|
|
|
|
|
|
|
|
|
|
||||
$ |
|
|
|
|
|
|
|
|
|
|
|
|
||||
$ |
|
|
|
|
|
|
|
|
|
|
|
|
||||
$ |
|
|
|
|
|
|
|
|
|
|
|
|
||||
$ |
|
|
|
|
|
|
|
|
|
|
|
|
||||
(1) Amounts for the years ended December 31, 2021 and 2020 have been re-presented to separately disclose share options and RSUs.
The following table summarizes information about share options and RSUs outstanding at December 31, 2020:
|
|
Share Options (1) |
|
|
RSUs (1) |
|
||||||||||
|
|
Number |
|
|
Weighted |
|
|
Number |
|
|
Weighted |
|
||||
Range of exercise prices |
|
|
|
|
|
|
|
|
|
|
|
|
||||
$ |
|
|
|
|
|
|
|
|
|
|
|
|
||||
$ |
|
|
|
|
|
|
|
|
|
|
|
|
||||
$ |
|
|
|
|
|
|
|
|
|
|
|
|
||||
$ |
|
|
|
|
|
|
|
|
|
|
|
|
||||
$ |
|
|
|
|
|
|
|
|
|
|
|
|
||||
(1) Amounts for the years ended December 31, 2021 and 2020 have been re-presented to separately disclose share options and RSUs.
Weighted average fair value of options granted during the year ended December 31, 2022 was $
Weighted average fair value of RSUs granted during the year ended December 31, 2022 was $
Weighted average share price at the date of exercise for options exercised during the year ended December 31, 2022 was $
The number of options exercisable during the year ended December 31, 2022 was
RSUs and PSUs whose vesting is subject to internal performance conditions are measured based on the fair market value of the underlying ordinary shares on the date of grant.
F-75
Notes to the Consolidated financial statements (continued)
Inputs in the Black Scholes model used for fair valuing share options granted during the year and prior year were as follows:
|
|
2020 |
|
|
2021 |
|
|
2022 |
|
|||
Black Scholes model |
|
|
|
|
|
|
|
|
|
|||
Weighted average share price |
|
$ |
|
|
$ |
|
|
$ |
|
|||
Weighted average exercise price |
|
$ |
|
|
$ |
|
|
$ |
|
|||
Average expected volatility |
|
|
|
|
|
|
||||||
Expected life |
|
|
|
|
|
|
||||||
Risk free rate |
|
|
|
|
|
|
||||||
Expected dividends |
|
$ |
|
|
$ |
|
|
$ |
|
|||
Expected volatility was determined with reference to historical volatility of publicly traded peer companies.
The expected life in the model has been adjusted, based on management’s best estimate, for the effects of non-transferability, exercise restrictions and behavioral considerations.
The Group does not anticipate paying any cash dividends in the near future and therefore uses an expected dividend yield of zero in the option valuation model.
The Group recognized total expenses of $
2021 CEO Performance Based Restricted Stock Unit (“PSU”) Award
On May 24, 2021, the Board unanimously approved the recommendation of the Compensation Committee of the Board to grant a long-term PSU under the Group’s 2018 Farfetch Employee Equity Plan (the “2018 Plan”) to José Neves, the Company’s Founder, Chief Executive Officer and Chairman of the Board (the “CEO”). The grant is
The PSUs are divided into
Tranche |
|
Performance Period |
|
Number of PSUs Eligible To be Earned |
|
Stock Price Hurdle |
|
|
|
|
|
$ |
|
||||
|
|
|
$ |
|
||||
|
|
|
$ |
|
||||
|
|
|
$ |
|
||||
|
|
|
$ |
|
||||
|
|
|
$ |
|
||||
|
|
|
$ |
|
||||
|
|
|
$ |
|
||||
Share-based compensation under the 2021 CEO PSU Award represents a non-cash expense and is recognized as a selling, general and administrative expense in our Consolidated statement of operations. In each quarter since the grant of the 2021 CEO PSU Award, we have recognized expense, generally on a pro-rata basis, for only the number of tranches that corresponds to the number of share price milestones that have been determined probable of being achieved in the future, in accordance with the following principles.
In order to calculate the equity-settled share based payments expense for this award, on the grant date, a Monte Carlo simulation was used to determine for each tranche (i) a fixed amount of expense for such tranche and
F-76
Notes to the Consolidated financial statements (continued)
(ii) the expected vesting period for each tranche based on the expected time taken to achieve the share price milestone. The grant date fair value of this award amounted to $
b. Cash-settled
Since 2016, the Group has issued to certain employees share appreciation rights (“SARs”) that require the Group to pay the intrinsic value of the SAR to the employee at the date of exercise. The Group has recorded liabilities of $
The fair value of the SARs is determined by using the Black Scholes model using the same assumptions noted in the above table for the Group’s equity-settled share-based payments. The fair value of the liability is then reassessed at each reporting date. Included in the 2022 credit of $
Trade and other payables consisted of the following as of December 31 (in thousands):
|
|
2021 |
|
|
2022 |
|
||
Trade payables |
|
$ |
|
|
$ |
|
||
Other payables |
|
|
|
|
|
|
||
Social security and other taxes |
|
|
|
|
|
|
||
Deferred revenue |
|
|
|
|
|
|
||
Accruals |
|
|
|
|
|
|
||
Trade and other payables |
|
$ |
|
|
$ |
|
||
Trade payables primarily relates to supplier invoices for marketing, shipping, inventory, software and hosting related expenses.
F-77
Notes to the Consolidated financial statements (continued)
Ordinary shares issued and fully paid as of December 31, 2022 (in thousands, except number of shares):
Number of shares |
|
|
Class |
|
Par value |
|
|
Share capital |
|
|
Share premium |
|
|
Merger reserve |
|
|
Total |
|
||||||
|
|
|
Class A ordinary shares |
|
|
|
|
$ |
|
|
$ |
|
|
$ |
|
|
$ |
|
||||||
|
|
|
Class B ordinary shares |
|
|
|
|
|
|
|
|
|
|
|
|
|
|
|
||||||
|
|
|
|
|
|
|
|
$ |
|
|
$ |
|
|
$ |
|
|
$ |
|
||||||
Holders of Class A ordinary shares are entitled to
During 2022,
On June 16, 2022, a total of
On October 27, 2022, a total of
During the year ended December 31, 2022,
Ordinary shares issued and fully paid as of December 31, 2021 (in thousands, except number of shares):
Number of shares |
|
|
Class |
|
Par value |
|
|
Share capital |
|
|
Share premium |
|
|
Merger reserve |
|
|
Total |
|
||||||
|
|
|
Class A ordinary shares |
|
|
|
|
|
|
|
$ |
|
|
$ |
|
|
$ |
|
||||||
|
|
|
Class B ordinary shares |
|
|
|
|
|
|
|
|
|
|
|
|
|
|
|
||||||
|
|
|
|
|
|
|
|
|
|
|
$ |
|
|
$ |
|
|
$ |
|
||||||
During 2021,
On May 17, 2021, a total of
On August 6, 2021, a total of
On October 1, 2021, a total of
F-78
Notes to the Consolidated financial statements (continued)
During the year ended December 31, 2022,
Other reserves consists of the following (in thousands):
|
|
|
|
|
|
|||||||||||||||||||||||
|
|
Changes |
|
|
Share |
|
|
Cashflow hedge reserve |
|
|
Merger |
|
|
Time value reserve |
|
|
Other |
|
|
Total other reserves |
|
|||||||
At January 1, 2020 |
|
$ |
( |
) |
|
$ |
|
|
$ |
( |
) |
|
$ |
|
|
$ |
|
|
$ |
( |
) |
|
$ |
|
||||
Movement in cash flow hedge reserve |
|
|
|
|
|
|
|
|
|
|
|
|
|
|
|
|
|
|
|
|
|
|||||||
Gain transferred to the cost of inventory |
|
|
|
|
|
|
|
|
( |
) |
|
|
|
|
|
|
|
|
|
|
|
( |
) |
|||||
Shares issued - acquisition of a subsidiary |
|
|
|
|
|
|
|
|
|
|
|
|
|
|
|
|
|
|
|
|
|
|||||||
Remeasurement loss on severance plan |
|
|
|
|
|
|
|
|
|
|
|
|
|
|
|
|
|
( |
) |
|
|
( |
) |
|||||
Share-based payment - reverse vesting shares |
|
|
|
|
|
|
|
|
|
|
|
|
|
|
|
|
|
|
|
|
|
|||||||
Share-based payment - equity-settled |
|
|
|
|
|
|
|
|
|
|
|
|
|
|
|
|
|
|
|
|
|
|||||||
At December 31, 2020 |
|
|
( |
) |
|
|
|
|
|
|
|
|
|
|
|
|
|
|
( |
) |
|
|
|
|||||
Movement in cash flow hedge reserve |
|
|
|
|
|
|
|
|
( |
) |
|
|
|
|
|
( |
) |
|
|
|
|
|
( |
) |
||||
Loss transferred to the cost of inventory |
|
|
|
|
|
|
|
|
|
|
|
|
|
|
|
|
|
|
|
|
|
|||||||
Share-based payment - reverse vesting shares |
|
|
|
|
|
( |
) |
|
|
|
|
|
|
|
|
|
|
|
|
|
|
( |
) |
|||||
Share-based payment - equity-settled |
|
|
|
|
|
|
|
|
|
|
|
|
|
|
|
|
|
|
|
|
|
|||||||
Non-controlling interest put option |
|
|
|
|
|
|
|
|
|
|
|
|
|
|
|
|
|
( |
) |
|
|
( |
) |
|||||
Farfetch China Holdings Ltd put call option |
|
|
|
|
|
|
|
|
|
|
|
|
|
|
|
|
|
( |
) |
|
|
( |
) |
|||||
Capital contribution from non-controlling interests |
|
|
|
|
|
|
|
|
|
|
|
|
|
|
|
|
|
|
|
|
|
|||||||
Acquisition of non-controlling interest |
|
|
|
|
|
|
|
|
|
|
|
|
|
|
|
|
|
( |
) |
|
|
( |
) |
|||||
Other |
|
|
|
|
|
|
|
|
|
|
|
|
|
|
|
|
|
( |
) |
|
|
( |
) |
|||||
At December 31, 2021 |
|
|
( |
) |
|
|
|
|
|
( |
) |
|
|
|
|
|
|
|
|
( |
) |
|
|
|
||||
Movement in cash flow hedge reserve |
|
|
|
|
|
|
|
|
( |
) |
|
|
|
|
|
|
|
|
|
|
|
( |
) |
|||||
Gain transferred to the cost of inventory |
|
|
|
|
|
|
|
|
( |
) |
|
|
|
|
|
|
|
|
|
|
|
( |
) |
|||||
Share-based payment - reverse vesting shares |
|
|
|
|
|
|
|
|
|
|
|
|
|
|
|
|
|
|
|
|
|
|||||||
Share-based payment - equity-settled |
|
|
|
|
|
|
|
|
|
|
|
|
|
|
|
|
|
|
|
|
|
|||||||
Other |
|
|
|
|
|
|
|
|
|
|
|
|
|
|
|
|
|
( |
) |
|
|
( |
) |
|||||
At December 31, 2022 |
|
$ |
( |
) |
|
$ |
|
|
$ |
( |
) |
|
$ |
|
|
$ |
|
|
$ |
( |
) |
|
$ |
|
||||
The changes in ownership reserve represent transactions with former non-controlling interests of the Group.
The share-based payments reserve represents the Group’s cumulative equity-settled share option expense. On exercise, the cumulative share option expense is reclassified to accumulated losses.
The cash flow hedge reserve and time value reserve are used to recognize the effective portion of gains or losses on derivatives that are designated as and qualify as cash flow hedges.
The merger relief reserve represents the excess over nominal share capital where there has been share consideration as part of a business combination.
Included in other reserves as of December 31, 2021, the transaction with non-controlling interests represents the initial recognition of the Chalhoub partnership, the non-controlling put option relates to the initial recognition of the gross liability relating to the put and call options entered into as part of the acquisition of Palm Angels for the purchase of the remaining
F-79
Notes to the Consolidated financial statements (continued)
The effect of changes in the ownership interest of the Group on the equity attributable to owners of the Group is summarized as follows (in thousands):
|
|
|
|
|
|
|
|
|
|
|
|
|
|
|
|
|||||
|
|
|
|
|
|
|
|
|
|
|
|
|
|
|
|
|||||
|
|
CuriosityChina |
|
|
Farfetch International Limited (IOM) |
|
|
New Guards |
|
|
Farfetch China Holdings Ltd |
|
|
Total |
|
|||||
Balance at January 1, 2021 |
|
$ |
|
|
$ |
( |
) |
|
$ |
|
|
$ |
|
|
$ |
|
||||
Total comprehensive (loss)/income attributable to non-controlling interests |
|
|
( |
) |
|
|
( |
) |
|
|
|
|
|
( |
) |
|
$ |
|
||
Step acquisition |
|
|
|
|
|
|
|
|
|
|
|
|
|
|
|
|||||
Capital contribution from non-controlling interest |
|
|
|
|
|
|
|
|
|
|
|
( |
) |
|
|
( |
) |
|||
Non-controlling interest arising on purchase of asset |
|
|
|
|
|
|
|
|
|
|
|
|
|
|
|
|||||
Acquisition of non-controlling interest |
|
|
|
|
|
|
|
|
( |
) |
|
|
|
|
|
( |
) |
|||
Dividends to non-controlling interests |
|
|
|
|
|
|
|
|
( |
) |
|
|
|
|
|
( |
) |
|||
Other |
|
|
|
|
|
|
|
|
|
|
|
|
|
|
|
|||||
Balance at December 31, 2021 |
|
|
( |
) |
|
|
( |
) |
|
|
|
|
|
( |
) |
|
|
|
||
Total comprehensive (loss)/income attributable to non-controlling interests |
|
|
( |
) |
|
|
( |
) |
|
|
|
|
|
( |
) |
|
|
( |
) |
|
Non-controlling interest arising on purchase of asset |
|
|
|
|
|
|
|
|
|
|
|
|
|
|
|
|||||
Dividends to non-controlling interests |
|
|
|
|
|
|
|
|
( |
) |
|
|
|
|
|
( |
) |
|||
Other |
|
|
|
|
|
|
|
|
|
|
|
|
|
|
|
|||||
Balance at December 31, 2022 |
|
$ |
( |
) |
|
$ |
( |
) |
|
$ |
|
|
$ |
( |
) |
|
$ |
|
||
% of non-controlling interests |
|
|
% |
|
|
% |
|
|
% |
|
|
% |
|
|
|
|||||
The step acquisition during the year ended December 31, 2021 relates to New Guards’ acquisition of Alanui (refer to Note 31, Business combinations for further details).
The capital contribution from non-controlling interest arising on purchase of asset during the year ended December 31, 2021 related to the acquisition on August 1, 2021, by Alibaba and Richemont of a
The non-controlling interest arising on purchase of asset of $
During the year ended December 31, 2022, a further $
The acquisition of non-controlling interest of $
F-80
Notes to the Consolidated financial statements (continued)
Dividends to non-controlling interests reflects dividends paid by New Guards group legal entities to non-controlling interests representing the co-founders of the individual fashion brands. During the year ended December 31, 2022, New Guards had paid dividends of $
Basic (loss)/earnings per share is computed using the weighted-average number of outstanding shares during the year. Diluted loss per share is computed using the weighted-average number of outstanding shares and excludes all potential shares outstanding during the year, as their inclusion would be anti-dilutive. The Group’s potential shares consist of incremental shares issuable upon the assumed exercise of share options and warrants, the incremental shares issuable upon the assumed vesting of unvested share awards, potential shares issuable on the conversion of the convertible loan notes and potential shares issuable on the conversion of certain put-call options.
The calculation of basic (loss)/earnings per share and diluted loss per share is as follows:
|
|
2020 |
|
|
2021 |
|
|
2022 |
|
|||
In $ thousands, except share and per share data |
|
|
|
|
|
|
|
|
|
|||
Diluted (loss)/income |
|
|
|
|
|
|
|
|
|
|||
(Loss)/profit after tax attributable to equity holders of the parent: |
|
|
|
|
|
|
|
|
|
|||
Used in calculating basic (loss)/earnings per share |
|
$ |
( |
) |
|
$ |
|
|
$ |
|
||
Adjustments: |
|
|
|
|
|
|
|
|
|
|||
Convertible note interest |
|
|
|
|
|
|
|
|
|
|||
Loss on derecognition of convertible loan notes |
|
|
|
|
|
|
|
|
|
|||
Gains on items held at fair value and remeasurements |
|
|
|
|
|
( |
) |
|
|
( |
) |
|
Loss after tax attributable to equity holders of the parent used in calculating diluted loss per share |
|
$ |
( |
) |
|
$ |
( |
) |
|
$ |
( |
) |
|
|
|
|
|
|
|
|
|
|
|||
Weighted average number of basic shares |
|
|
|
|
|
|
|
|
|
|||
Dilutive securities: |
|
|
|
|
|
|
|
|
|
|||
Options |
|
|
|
|
|
|
|
|
|
|||
Restricted Stock Units (RSUs) |
|
|
|
|
|
|
|
|
|
|||
Other awards |
|
|
|
|
|
|
|
|
|
|||
Acquisition related deferred shares |
|
|
|
|
|
|
|
|
|
|||
February 2020 notes |
|
|
|
|
|
|
|
|
|
|||
April 2020 notes |
|
|
|
|
|
|
|
|
|
|||
November 2020 notes |
|
|
|
|
|
|
|
|
|
|||
Palm Angels liability |
|
|
|
|
|
|
|
|
|
|||
Chalhoub liability |
|
|
|
|
|
|
|
|
|
|||
Farfetch China Holdings Ltd liability |
|
|
|
|
|
|
|
|
|
|||
Weighted average number of dilutive shares |
|
|
|
|
|
|
|
|
|
|||
|
|
|
|
|
|
|
|
|
|
|||
(Loss)/earnings per share attributable to equity holders of the parent: |
|
|
|
|
|
|
|
|
|
|||
Basic |
|
$ |
( |
) |
|
$ |
|
|
$ |
|
||
Diluted |
|
$ |
( |
) |
|
$ |
( |
) |
|
$ |
( |
) |
Potential ordinary shares excluded from Diluted earnings per share because their conversion would have an antidilutive effect are as follows (in thousands):
|
|
2020 |
|
|
2021 |
|
|
2022 |
|
|||
Convertible Notes |
|
|
|
|
|
|
|
|
|
|||
Employee options & RSU's |
|
|
|
|
|
|
|
|
|
|||
Contingent consideration |
|
|
|
|
|
|
|
|
|
|||
Put Call options |
|
|
|
|
|
|
|
|
|
|||
F-81
Notes to the Consolidated financial statements (continued)
Refer to Note 7, Items held at fair value and remeasurements, Note 20, Borrowings and embedded derivatives and Note 21, Put and call option liabilities for further detail on the put call options and convertible notes included above.
Platforme International Limited is a related party of J M F Neves. The Group generated commission of $
José Neves, the founder, Chief Executive Office and a director of Group, is also a director of Six London Limited. The Group had a $
In prior periods, Alanui S.r.L. (“Alanui”) was a related party of New Guards Group Holding S.p.A, due to it being an associate of the Group. New Guards still owns a stake of
|
|
2020 |
|
|
2021 |
|
|
2022 |
|
|||
Short-term employee benefits |
|
$ |
|
|
$ |
|
|
$ |
|
|||
Termination benefits |
|
|
|
|
|
|
|
|
|
|||
Share-based compensation |
|
|
|
|
|
|
|
|
|
|||
|
|
$ |
|
|
$ |
|
|
$ |
|
|||
Other than disclosed above, there were no other transactions or outstanding balances, including commitments, with related parties.
The Group’s ultimate controlling party is J M F Neves by virtue of holding the majority of voting rights in the Group.
Contingent liabilities
Litigation
From time to time we are engaged in disputes and claims. We believe that the ultimate outcome of these proceedings will not have a material adverse impact on our consolidated financial position or results of operations, but the outcome of these proceedings is inherently difficult to predict. There can be no assurance that we will prevail in any such litigation. Liabilities for material claims against us are recognized as a provision when an outflow of economic resources is considered probable and can be reasonably estimated. Legal costs associated with claims are expensed as incurred.
Italian tax proceedings
F-82
Notes to the Consolidated financial statements (continued)
During 2020, Italian tax authorities commenced reviewing the activities of one of our subsidiaries for the years 2015 through 2020, including whether that subsidiary had a permanent establishment in Italy and our transfer pricing policies.
At December 31, 2021, the Group was cooperating with the investigation but intended to contest any allegation that we have a permanent establishment in Italy or that our transfer pricing policies were inappropriate. During March 2022, the Group recognized a related Italian corporate tax payable of €
Acquisitions in 2022
Wannaby Inc.
On April 5, 2022, Farfetch US Holdings., Inc, a wholly-owned subsidiary of Farfetch Limited, acquired
The transaction was accounted for as a business combination under IFRS 3 Business Combinations and the purchase price allocation is finalized.
The consideration payable was comprised of $
Goodwill consists of expected synergies to be achieved by combining the operations of Wanna with the Group, as well as other intangible assets that do not qualify for separate recognition under IFRS 3. Goodwill is not deductible for tax purposes. The acquired software, brand and customer relationships will be amortized over five years, three years and nine years, respectively.
Acquisition-related costs of $
Details of the purchase consideration, the assets acquired and goodwill recognized are as follows (in thousands):
|
|
2022 |
|
|
Cash consideration |
|
$ |
|
|
Purchase consideration |
|
$ |
|
|
F-83
Notes to the Consolidated financial statements (continued)
|
|
2022 |
|
|
Acquired software |
|
$ |
|
|
Customer Relationships |
|
|
|
|
Brand |
|
|
|
|
Tangible assets |
|
|
|
|
Net working capital |
|
|
( |
) |
Net debt |
|
|
( |
) |
Deferred tax liability |
|
|
( |
) |
Total net identified assets acquired |
|
|
|
|
Goodwill |
|
|
|
|
Total net identified assets acquired and goodwill |
|
$ |
|
|
|
|
2022 |
|
|
Net cash outflow arising on acquisition |
|
|
|
|
Cash and cash equivalent balances acquired |
|
$ |
|
|
Cash consideration |
|
|
( |
) |
Net cash outflow |
|
$ |
( |
) |
Violet Grey Inc.
On February 1, 2022, Farfetch US Holdings., Inc, a wholly-owned subsidiary of Farfetch Limited, acquired
The transaction was accounted for as a business combination under IFRS 3 Business Combinations and the purchase price allocation is finalized.
The consideration payable was comprised of $
Goodwill consists of expected synergies to be achieved by combining the operations of Violet Grey with the Group, as well as other intangible assets that do not qualify for separate recognition under IFRS 3. Goodwill is not deductible for tax purposes. The acquired software and Brand will be amortized over
Acquisition-related costs of $
Details of the purchase consideration, the assets acquired and goodwill recognized are as follows (in thousands):
|
|
2022 |
|
|
Cash consideration |
|
$ |
|
|
Purchase consideration |
|
$ |
|
|
F-84
Notes to the Consolidated financial statements (continued)
|
|
2022 |
|
|
Acquired software |
|
$ |
|
|
Brand |
|
|
|
|
Tangible assets |
|
|
|
|
Net working capital |
|
|
( |
) |
Net debt |
|
|
( |
) |
Deferred tax liability |
|
|
( |
) |
Total net identified assets acquired |
|
|
|
|
Goodwill |
|
|
|
|
Total net identified assets acquired and goodwill |
|
$ |
|
|
|
|
2022 |
|
|
Net cash outflow arising on acquisition |
|
|
|
|
Cash and cash equivalent balances acquired |
|
$ |
|
|
Cash consideration |
|
|
( |
) |
Net cash outflow |
|
$ |
( |
) |
Revenue and profit contribution of the acquisitions made in 2022
The results of operations of both Wanna and Violet Grey have been included in the Group’s Consolidated Statement of operations since the date of acquisition. Actual and pro-forma revenue and results of operations of both Wanna and Violet Grey have not been presented as these do not have a material impact on the consolidated revenue and results of operations.
Acquisitions in 2021
Luxclusif
On December 6, 2021, Farfetch UK Limited, an indirect wholly owned subsidiary of Farfetch Limited, acquired
Purchase consideration of $
The transaction is being treated as a business combination under IFRS 3 and the purchase price is subject to the finalization of completion accounts. This investment is part of the Group’s strategy of expanding into new categories and offerings. The primary reason for the acquisition was for the Group to further enhance the Farfetch Marketplace by continuing to invest in expanding the pre-owned offering.
Details of the purchase consideration, the assets acquired and goodwill are as follows (in thousands):
|
|
2021 |
|
|
Cash |
|
$ |
|
|
Deferred payments |
|
|
|
|
Total cash consideration |
|
$ |
|
|
F-85
Notes to the Consolidated financial statements (continued)
|
|
2021 |
|
|
Net cash outflow arising on acquisition |
|
|
|
|
Cash and cash equivalent balances acquired |
|
$ |
|
|
Cash consideration |
|
|
( |
) |
Net cash outflow |
|
$ |
( |
) |
|
|
2021 |
|
|
Development Costs |
|
$ |
|
|
Customer relationships |
|
|
|
|
Tangible assets |
|
|
|
|
Net working capital |
|
|
|
|
Net debt |
|
|
( |
) |
Deferred tax liability |
|
|
( |
) |
Total net identified assets acquired |
|
|
|
|
Goodwill |
|
|
|
|
Total net identified assets acquired and goodwill |
|
$ |
|
|
Goodwill consists of expected synergies to be achieved by combining the operations of Luxclusif with the Group, as well as other intangible assets that do not qualify for separate recognition under IFRS 3. Goodwill is expected to be fully deductible for tax purposes. The Development costs and Customer relationships are amortized over
Acquisition-related costs totaled $
Allure
On 20 December 2021, Farfetch US Holdings, Inc. acquired
Purchase consideration of $
This investment is part of the Group’s strategy of accelerating the digitization of the global luxury industry. The primary reason for the acquisition was to provide an enhanced customer experience on Farfetch Marketplace and drive efficiency in our operational processes. The transaction has been accounted for as a business combination under IFRS 3 and the purchase price allocation is subject to finalization of completion accounts adjustments.
Details of the purchase consideration, the assets acquired and goodwill are as follows (in thousands):
|
|
2021 |
|
|
Cash |
|
$ |
|
|
Ordinary shares issued |
|
$ |
|
|
Deferred payments |
|
|
|
|
Total purchase consideration |
|
$ |
|
|
F-86
Notes to the Consolidated financial statements (continued)
|
|
2021 |
|
|
Net cash outflow arising on acquisition |
|
|
|
|
Cash and cash equivalent balances acquired |
|
$ |
|
|
Cash consideration |
|
|
( |
) |
Net cash outflow |
|
$ |
( |
) |
|
|
2021 |
|
|
Development costs |
|
$ |
|
|
Tangible assets |
|
|
|
|
Net working capital |
|
|
|
|
Net debt |
|
|
( |
) |
Deferred tax liability |
|
|
( |
) |
Total net identified assets acquired |
|
|
|
|
Goodwill |
|
|
|
|
Total net identified assets acquired and goodwill |
|
$ |
|
|
Goodwill consists of expected synergies to be achieved by combining the operations of Allure with the Group, as well as other intangible assets that do not qualify for separate recognition under IFRS 3. Goodwill is expected to be deductible for tax purposes. Development costs are amortized over
Acquisition-related costs totaled $
JBUX
On September 14, 2021, Farfetch UK Limited, an indirect wholly owned subsidiary of Farfetch Limited, acquired
The transaction was accounted for as a business combination under IFRS 3 and the purchase price allocation has been finalized. Farfetch UK Limited acquired a
Details of the cash paid, the assets acquired and goodwill are as follows (in thousands):
|
|
2021 |
|
|
Cash |
|
$ |
|
|
Total cash consideration |
|
$ |
|
|
|
|
2021 |
|
|
Net cash outflow arising on acquisition |
|
|
|
|
Cash and cash equivalent balances acquired |
|
$ |
|
|
Cash consideration |
|
|
( |
) |
Net cash outflow |
|
$ |
( |
) |
F-87
Notes to the Consolidated financial statements (continued)
|
|
2021 |
|
|
Development costs |
|
$ |
|
|
Tangible assets |
|
|
|
|
Net working capital |
|
|
( |
) |
Net debt |
|
|
( |
) |
Deferred tax liability |
|
|
( |
) |
Total net identified assets acquired |
|
|
|
|
Goodwill |
|
|
|
|
Total net identified assets acquired and goodwill |
|
$ |
|
|
Goodwill consists of expected synergies to be achieved by combining the operations of Jetti with the Group, as well as other intangible assets that do not qualify for separate recognition under IFRS 3. The full goodwill is expected to be deductible for tax purposes.
Acquisition-related expenses of $
Alanui
On March 16, 2021, New Guards Group Holding, a subsidiary of Farfetch Limited, completed the acquisition of Alanui, for $nil consideration. The acquisition and control was achieved through the removal of a shareholder veto from the agreement between New Guards and Alanui’s other shareholders that had previously prevented the Group from obtaining control of Alanui. New Guards owns
The Group expects continue to benefit from the Alanui brand bringing with them knowledge and creativity of original solutions for apparel and accessories collections. The transaction was accounted for as a business combination under IFRS 3 and the purchase price allocation has been finalized.
Details of the purchase consideration and the net assets acquired are as follows (in thousands):
|
|
2021 |
|
|
Intangible assets |
|
$ |
|
|
Brand name |
|
|
|
|
Tangible assets |
|
|
|
|
Other non-current assets |
|
|
|
|
Inventory |
|
|
|
|
Net working capital (excluding inventory) |
|
|
( |
) |
Non-current liabilities |
|
|
( |
) |
Deferred tax liability |
|
|
( |
) |
Total net identified assets acquired |
|
$ |
|
|
Fair value of previously held equity interest |
|
|
( |
) |
Non-controlling interest |
|
|
( |
) |
Purchase consideration |
|
$ |
- |
|
The non-controlling interest acquired is measured at a value equal to the non-controlling interests’ share of the identifiable net assets acquired. Refer to Note 29, Related party disclosure, for further information on the control of Alanui.
F-88
Notes to the Consolidated financial statements (continued)
Revenue and profit contribution of the acquisition made in 2021
The results of operations of Luxclusif, Allure, Jetti and Alanui have been included in the Group’s consolidated Statement of operations since the date of acquisition. Actual and pro forma revenue and results of operations for the acquisition have not been presented because they do not have a material impact to the consolidated revenue and results of operations.
Acquisitions in 2020
Ambush
On February 5, 2020, New Guards, a subsidiary of Farfetch Limited, completed the acquisition of
Details of the purchase consideration, the assets acquired, and goodwill are as follows (in thousands):
|
|
2020 |
|
|
Cash consideration |
|
$ |
|
|
Purchase consideration |
|
$ |
|
|
|
|
2020 |
|
|
Net cash outflow arising on acquisition |
|
|
|
|
Cash and cash equivalent balances acquired |
|
$ |
|
|
Cash consideration |
|
|
( |
) |
Net cash outflow |
|
$ |
( |
) |
|
|
2020 |
|
|
Intangible assets |
|
$ |
|
|
Brand name |
|
|
|
|
Tangible assets |
|
|
|
|
Right-of-use assets |
|
|
|
|
Other non-current assets |
|
|
|
|
Inventory |
|
|
|
|
Net working capital (excluding inventory) |
|
|
( |
) |
Non-current liabilities |
|
|
( |
) |
Deferred tax liability |
|
|
( |
) |
Total net identified assets acquired |
|
|
|
|
Goodwill |
|
|
|
|
Total net identified assets acquired and goodwill |
|
|
|
|
Non-controlling interest |
|
|
( |
) |
Net assets acquired |
|
$ |
|
|
Goodwill consists of expected synergies to be achieved by combining the operations of Ambush with the Group, as well as other intangible assets that do not qualify for separate recognition under IFRS 3 (amended). Goodwill is expected to be deductible for tax purposes.
The non-controlling interest acquired is measured at a value equal to the non-controlling interests’ share of the identifiable net assets acquired.
Acquisition-related expenses of $
F-89
Notes to the Consolidated financial statements (continued)
Revenue and profit contribution of the acquisition made in 2020
The results of operations of Ambush have been included in the Group’s consolidated statement of operations since the date of acquisition. Actual and pro forma revenue and results of operations for the acquisition have not been presented because they do not have a material impact to the consolidated revenue and results of operations.
Direct Holdings |
|
|
|
|
|
|
|
|
|
|
||
Legal name of subsidiary |
|
Country of |
|
% equity |
|
|
Principal activities |
|||||
|
|
|
|
2021 |
|
|
2022 |
|
|
|
||
Farfetch Holdings plc (previously Hulk Finco plc) |
|
|
|
|
|
|
|
|
||||
F-90
Notes to the Consolidated financial statements (continued)
Indirect Holdings |
|
|
|
|
|
|
|
|
|
|
||
Legal name of subsidiary |
|
Country of |
|
% equity |
|
|
Principal activities |
|||||
|
|
|
|
2021 |
|
|
2022 |
|
|
|
||
Alanui S.r.l. |
|
|
|
|
|
|
|
|
||||
Allure Systems Corp. |
|
|
|
|
|
|
|
|
||||
Allure Systems Research France S.A.S. |
|
|
|
|
|
|
|
|
||||
Ambush (Shanghai) Trading Co., Ltd |
|
|
|
|
|
|
|
|
||||
Ambush Inc. |
|
|
|
|
|
|
|
|
||||
Ambush Italy S.r.l. |
|
|
|
|
|
|
|
|
||||
APA S.r.l. |
|
|
|
|
|
|
|
|
||||
Beijing Qizhi Ruisi Information Consulting Co., Ltd |
|
|
|
|
|
|
|
|
||||
Browns (South Molton Street) Limited |
|
|
|
|
|
|
|
|
||||
Browns (South Molton Street) LLC |
|
|
|
|
|
|
|
|
||||
County S.r.l. |
|
|
|
|
|
|
|
|
||||
F Concierge France S.A.S. |
|
|
|
|
|
|
|
|
||||
Fafaqi (Shanghai) Network Technology Development Co. Ltd |
|
|
|
|
|
|
|
|
||||
Farfetch (Shanghai) E-Commerce Co. Ltd |
|
|
|
|
|
|
|
|
||||
Farfetch Australia Pty Ltd |
|
|
|
|
|
|
|
|
||||
Farfetch Brasil China Exportacao Ltda |
|
|
|
|
|
|
|
|
||||
Farfetch Canada Limited |
|
|
|
|
|
|
|
|
||||
Farfetch China (HK Holdings) Limited |
|
|
|
|
|
|
|
|
||||
Farfetch China Holdings Ltd |
|
|
|
|
|
|
|
|
||||
Farfetch China Ltd |
|
|
|
|
|
|
|
|
||||
Farfetch China US LLC |
|
|
|
|
|
|
|
|
||||
Farfetch Europe Trading B.V. |
|
|
|
|
|
|
|
|
||||
Farfetch HK Holdings Limited |
|
|
|
|
|
|
|
|
||||
Farfetch HK Production Limited |
|
|
|
|
|
|
|
|
||||
Farfetch India Private Limited**** |
|
|
|
|
|
|
|
|
||||
Farfetch International Limited |
|
|
|
|
|
|
|
|
||||
Farfetch Italia S.r.l. |
|
|
|
|
|
|
|
|
||||
Farfetch Japan Co Ltd |
|
|
|
|
|
|
|
|
||||
Farfetch Mexico, S.A. de C.V.*** |
|
|
|
|
|
|
|
|
||||
Farfetch Middle East FZE |
|
|
|
|
|
|
|
|
||||
Farfetch Osprey Limited |
|
|
|
|
|
|
|
|
||||
Farfetch Platform Solutions Limited |
|
|
|
|
|
|
|
|
||||
Farfetch Portugal-Unipessoal Lda |
|
|
|
|
|
|
|
|
||||
Farfetch RU LLC |
|
|
|
|
|
|
|
|
||||
Farfetch Store of the Future Limited |
|
|
|
|
|
|
|
|
||||
Farfetch UK FINCO Limited |
|
|
|
|
|
|
|
|
||||
Farfetch UK Limited |
|
|
|
|
|
|
|
|
||||
Farfetch US Holdings, Inc. |
|
|
|
|
|
|
|
|
||||
F-91
Notes to the Consolidated financial statements (continued)
Farfetch W3 FZE |
|
|
|
|
|
|
|
|||||
Farfetch.com Brasil Serviços Ltda** |
|
|
|
|
|
|
|
|
||||
Farfetch.com Limited |
|
|
|
|
|
|
|
|
||||
Farfetch.com US, LLC |
|
|
|
|
|
|
|
|
||||
Fashion Concierge HK Limited |
|
|
|
|
|
|
|
|
||||
Fashion Concierge Powered By Farfetch LLC |
|
|
|
|
|
|
|
|
||||
Fashion Concierge UK Limited |
|
|
|
|
|
|
|
|
||||
F.F.B.R. Importacao e Exportação LTDA* |
|
|
|
|
|
|
|
|
||||
Heron Preston S.r.l. |
|
|
|
|
|
|
|
|
||||
Heron Preston Trademark S.r.l. |
|
|
|
|
|
|
|
|
||||
JBUX Limited |
|
|
|
|
|
|
|
|
||||
Kicks Lite, LLC |
|
|
|
|
|
|
|
|
||||
KPG S.r.l. |
|
|
|
|
|
|
|
|
||||
Laso. Co. Ltd |
|
|
|
|
|
|
|
|
||||
Luxclusif, Unipessoal Lda. |
|
|
|
|
|
|
|
|
||||
Luxi (Shanghai) Trading Co., Ltd |
|
|
|
|
|
|
|
|
||||
Luxis Baltic OÜ |
|
|
|
|
|
|
|
|
||||
M.A. Alliance Ltd. |
|
|
|
|
|
|
|
|
||||
New Guards Group Holding S.p.A. |
|
|
|
|
|
|
|
|
||||
NGG Beauty S.r.l. |
|
|
|
|
|
|
|
|
||||
NGG Beta S.r.l. |
|
|
|
|
|
|
|
|
||||
NGGH++ S.r.l. |
|
|
|
|
|
|
|
|
||||
OC Italy S.r.l. |
|
|
|
|
|
|
|
|
||||
Off White (Shanghai) Trading Co., Ltd |
|
|
|
|
|
|
|
|
||||
Off White Operating Holding, Corp. |
|
|
|
|
|
|
|
|
||||
Off White Operating London Limited |
|
|
|
|
|
|
|
|
||||
Off White Operating Los Angeles, LLC |
|
|
|
|
|
|
|
|
||||
Off White Operating Miami, LLC |
|
|
|
|
|
|
|
|
||||
Off-White Operating Milano S.r.l. |
|
|
|
|
|
|
|
|
||||
Off-White Operating Paris S.a.r.l. |
|
|
|
|
|
|
|
|
||||
Off White Operating Soho, LLC |
|
|
|
|
|
|
|
|
||||
Off White Operating Spain SL |
|
|
|
|
|
|
|
|
||||
Off-White Operating S.r.l. |
|
|
|
|
|
|
|
|
||||
Off-White Operating Switzerland GmbH |
|
|
|
|
|
|
|
|
||||
Off-White Operating The Netherlands B.V |
|
|
|
|
|
|
|
|
||||
Off White Operating Vegas, LLC |
|
|
|
|
|
|
|
|||||
Palm Angels (Shanghai) Trading Co., Ltd |
|
|
|
|
|
|
|
|
||||
Palm Angels S.r.l. |
|
|
|
|
|
|
|
|
||||
SG Enterprises Europe B.V. |
|
|
|
|
|
|
|
|
||||
SGNY1 LLC |
|
|
|
|
|
|
|
|
||||
Stadium Enterprises LLC |
|
|
|
|
|
|
|
|
||||
There Was One S.r.l. |
|
|
|
|
|
|
|
|
||||
Unravel Project S.r.l. |
|
|
|
|
|
|
|
|
||||
Upteam Corporation Limited |
|
|
|
|
|
|
|
|
||||
F-92
Notes to the Consolidated financial statements (continued)
Venice Holding Corp. |
|
|
|
|
|
|
|
|
||||
Venice Miami LLC |
|
|
|
|
|
|
|
|
||||
Venice Retail France SASU |
|
|
|
|
|
|
|
|
||||
Venice Retail Italy S.r.l. |
|
|
|
|
|
|
|
|
||||
Venice Retail UK Ltd |
|
|
|
|
|
|
|
|
||||
Venice S.r.l. |
|
|
|
|
|
|
|
|
||||
Venice Vegas LLC |
|
|
|
|
|
|
|
|
||||
Violet Grey, Inc. |
|
|
|
|
|
|
|
|
||||
Wannaby Inc. |
|
|
|
|
|
|
|
|
||||
Wannaby UAB |
|
|
|
|
|
|
|
|
* Owned by Farfetch.com Limited (
** Owned by Farfetch.com Limited (
*** Owned by Farfetch.com Limited (
**** Owned by Farfetch.com Limited (
We have not identified any reportable subsequent events.
F-93