UNITED STATES
SECURITIES AND EXCHANGE COMMISSION
Washington D.C. 20549
FORM 10-K
(Mark One) | |
ANNUAL REPORT PURSUANT TO SECTION 13 OR 15(d) OF THE SECURITIES EXCHANGE ACT OF 1934 | |
For the fiscal year ended December 31, 2019
or
TRANSITION REPORT PURSUANT TO SECTION 13 OR 15(d) OF THE SECURITIES EXCHANGE ACT OF 1934 | |
For the transition period from to
Commission File Number: 001-38711
(Exact name of registrant as specified in its charter)
(State or other jurisdiction of incorporation or organization) | (I.R.S. Employer Identification No.) | |
(address of principal executive offices) | (Zip Code) | ||
Registrant's telephone number, including area code: (512 ) 682.9300
Securities registered pursuant to section 12(b) of the Act: | ||
Title of Each Class | Trading Symbol | Name of Each Exchange on Which Registered |
Securities registered pursuant to section 12(g) of the Act: None | ||
Indicate by check mark if the registrant is a well-known seasoned issuer, as defined in Rule 405 of the Securities Act. þ Yes ¨ No
Indicate by check mark if the registrant is not required to file reports pursuant to Section 13 or Section 15(d) of the Act. ¨ Yes þ No
Indicate by check mark whether the registrant: (1) has filed all reports required to be filed by Section 13 or 15(d) of the Securities Exchange Act of 1934 during the preceding 12 months (or for such shorter period that the registrant was required to file such reports), and (2) has been subject to such filing requirements for the past 90 days. þ Yes ¨ No
Indicate by check mark whether the registrant has submitted electronically every Interactive Data File required to be submitted pursuant to Rule 405 of Regulation S-T (§232.405 of this chapter) during the preceding 12 months (or for such shorter period that the registrant was required to submit such files). þ Yes ¨ No
Indicate by check mark whether the registrant is a large accelerated filer, an accelerated filer, a non-accelerated filer, a smaller reporting company, or an emerging growth company. See the definitions of “large accelerated filer,” “accelerated filer,” “smaller reporting company,” and “emerging growth company” in Rule 12b-2 of the Exchange Act.
☑ | Accelerated filer | ☐ | |
Non-accelerated filer | ☐ | Smaller reporting company | |
Emerging growth company | |||
If an emerging growth company, indicate by check mark if the registrant has elected not to use the extended transition period for complying with any new or revised financial accounting standards provided pursuant to Section 13(a) of the Exchange Act. ☐
Indicate by check mark whether the registrant is a shell company (as defined in Rule 12b-2 of the Exchange Act). ☐ Yes þ No
As of June 28, 2019, the last business day of the registrant’s most recently completed second fiscal quarter, the registrant’s aggregate market value of its shares held by non-affiliates was approximately $825.1 million.
On February 14, 2020, 311,363,356 shares of common stock, par value $0.001 per share, were outstanding.
DOCUMENTS INCORPORATED BY REFERENCE
Part III of this Annual Report on Form 10-K incorporates certain information by reference from the definitive proxy statement for the registrant’s 2020 Annual Meeting of Stockholders to be filed within 120 days of the registrant’s fiscal year ended December 31, 2019 (the “Proxy Statement”). Except with respect to information specifically incorporated by reference in this Form 10-K, the Proxy Statement is not deemed to be filed as part of this Form 10-K.
SOLARWINDS CORPORATION
Table of Contents
PART I | |||
Page | |||
Item 1. | |||
Item 1A. | |||
Item 1B. | |||
Item 2. | |||
Item 3. | |||
Item 4. | |||
PART II | |||
Item 5. | |||
Item 6. | |||
Item 7. | |||
Item 7A. | |||
Item 8. | |||
Item 9. | |||
Item 9A. | |||
Item 9B. | |||
PART III | |||
Item 10. | |||
Item 11. | |||
Item 12. | |||
Item 13. | |||
Item 14. | |||
PART IV | |||
Item 15. | |||
Item 16. | |||
1
SPECIAL NOTE REGARDING FORWARD-LOOKING STATEMENTS
This annual report on Form 10-K contains forward-looking statements within the meaning of Section 21E of the Securities Exchange Act of 1934, as amended (the “Exchange Act”), and the Private Securities Litigation Reform Act of 1995. Such statements may be signified by terms such as “aim,” “anticipate,” “believe,” “continue,” “expect,” “feel,” “intend,” “estimate,” “seek,” “plan,” “may,” “can,” “could,” “should,” “will,” “would” or similar expressions and the negatives of those terms. In this report, forward-looking statements include statements regarding our financial projections, future financial performance and plans and objectives for future operations including, without limitation, the following:
• | expectations regarding our financial condition and results of operations, including revenue, revenue growth, cost of revenue, operating expenses, operating income, non-GAAP revenue, non-GAAP operating income, non-GAAP operating margin, adjusted EBITDA and adjusted EBITDA margin, cash flows and effective income tax rate; |
• | expectations regarding the impact of our adoption of the new revenue recognition standard on our financial results; |
• | expectations regarding investment in product development and our expectations about the results of those efforts; |
• | expectations concerning acquisitions and opportunities resulting from our acquisitions; |
• | expectations regarding hiring additional personnel globally in the areas of sales and marketing and research and development; |
• | expectations regarding our international earnings and investment of those earnings in international operations; |
• | expectations regarding our capital expenditures; and |
• | our beliefs regarding the sufficiency of our cash and cash equivalents, cash flows from operating activities and borrowing capacity. |
Forward-looking statements involve known and unknown risks, uncertainties and other factors that may cause our actual results, performance or achievements to be materially and adversely different from any future results, performance or achievements expressed or implied by the forward-looking statements. Factors that could cause or contribute to such differences include, but are not limited to, the following: (a) the inability to generate significant volumes of high quality sales leads from our digital marketing initiatives and convert such leads into new business at acceptable conversion rates; (b) the inability to sell products to new customers or to sell additional products or upgrades to our existing customers; (c) any decline in our renewal or net retention rates; (d) our inability to successfully identify, complete, and integrate acquisitions and manage our growth effectively; (e) risks associated with our international operations; (f) our status as a controlled company; (g) the possibility that general economic conditions or uncertainty cause information technology spending to be reduced or purchasing decisions to be delayed; (h) the timing and success of new product introductions and product upgrades by SolarWinds or its competitors; (i) the possibility that our operating income could fluctuate and may decline as percentage of revenue as we make further expenditures to expand our operations in order to support additional growth in our business; (j) potential foreign exchange gains and losses related to expenses and sales denominated in currencies other than the functional currency of an associated entity; and (k) such other risks and uncertainties described in the section titled “Risk Factors” and elsewhere in this Annual Report on Form 10-K. Given these risks and uncertainties, you should not place undue reliance on these forward-looking statements. Also, forward-looking statements represent our management’s beliefs and assumptions only as of the date of this annual report on Form 10-K. Except as required by law, we assume no obligation to update these forward-looking statements publicly, or to update the reasons actual results could differ materially and adversely from those anticipated in these forward-looking statements, even if new information becomes available in the future.
In this report “SolarWinds,” “Company,” “we,” “us” and “our” refer to SolarWinds Corporation and its consolidated subsidiaries. The term “Silver Lake Funds” refers to Silver Lake Partners IV, L.P., Silver Lake Technology Investors IV, L.P., and SLP Aurora Co-Invest, L.P., and the term “Silver Lake” refers to Silver Lake Group, L.L.C., the ultimate general partner of the Silver Lake Funds. The term “Thoma Bravo Funds” refers to Thoma Bravo Fund XI, L.P., Thoma Bravo Fund XI-A, L.P., Thoma Bravo Fund XII, L.P., Thoma Bravo Fund XII-A, L.P., Thoma Bravo Executive Fund XI, L.P., Thoma Bravo Executive Fund XII, L.P., Thoma Bravo Executive Fund XII-a, L.P., Thoma Bravo Special Opportunities Fund II, L.P. and Thoma Bravo Special Opportunities Fund II-A, L.P. and the term “Thoma Bravo” refers to Thoma Bravo, LLC, the ultimate general partner of the Thoma Bravo Funds. The term “Sponsors” refers collectively to Silver Lake and Thoma Bravo, together with the Silver Lake Funds and the Thoma Bravo Funds and, as applicable, their co-investors. The term “Lead Sponsors” refers collectively to the Silver Lake Funds, the Thoma Bravo Funds and their respective affiliates.
2
PART I
ITEM 1. BUSINESS
Overview
SolarWinds is a leading provider of information technology, or IT, infrastructure management software. Our products give organizations worldwide, regardless of type, size or IT infrastructure complexity, the power to monitor and manage the performance of their IT environments, whether on-premise, in the cloud, or in hybrid models. We combine powerful, scalable, affordable, easy to use products with a high-velocity, low-touch sales model to grow our business while also generating significant cash flow.
Our business is focused on building products that enable technology professionals to manage “all things IT.” We continuously engage with technology professionals to understand the challenges they face maintaining high-performing and highly available on-premise, public and private cloud and hybrid IT infrastructures. The insights we gain from engaging with technology professionals allow us to build products that solve well-understood IT management challenges in ways that technology professionals want them solved.
Our approach, which we call the “SolarWinds Model,” enables us to market and sell our products directly to network and systems engineers, database administrators, storage administrators, DevOps and service desk professionals and managed service providers, or MSPs. These technology professionals have become empowered to influence the selection, and often the purchase, of products needed to rapidly solve the problems they confront.
We serve the entire IT market uniquely and efficiently with our SolarWinds Model. Technology professionals use our products in organizations ranging in size from very small businesses to large enterprises. Our products are designed to do the complex work of monitoring and managing networks, systems and applications across on-premise, cloud and hybrid IT environments without the need for customization or professional services. Many of our products are built on common technology platforms that enable our customers to easily purchase and deploy our products individually or as integrated suites as their needs evolve. We utilize a cost-efficient, integrated global product development model and have expanded our offerings over time through both organic development and strategic acquisitions.
We market and sell our products directly to technology professionals with a high-velocity, low-touch, digital marketing and direct inside sales approach that we call “selling from the inside.” We have built a highly flexible and analytics-driven marketing model designed to efficiently drive website traffic and high-quality leads. We also engage using our online community, THWACK. This community is designed to train and inform technology professionals about our products, keep us connected to them and provide network effects to amplify word-of-mouth marketing for our products. Our sales team uses a prescriptive approach designed to manage these leads and quickly sell our products pursuant to our standard pricing and contract terms. We do not utilize an outside sales force or provide professional services.
Technology professionals often find our products when they are online searching for a solution to address a specific need and use our full-featured trials to experience our purpose-built, powerful and easy to use products in their own environments. These experiences often lead to initial purchases of one or more products and, over time, purchases of additional products and advocacy within both their organizations and their networks of technology professionals.
We extend our sales reach through our MSP customers, who provide IT management as a service and rely on our products to manage and monitor the IT environments of their end customers. Our MSP customer base enables us to reach across a fragmented end market opportunity of millions of organizations and access a broader universe of customers. We benefit from the addition of end customers served by our MSP customers, the proliferation of devices managed by those MSPs and the expansion of products used by those MSPs to manage end customers’ IT infrastructures.
We have grown while maintaining high levels of operating efficiency. We derive our revenue from a combination of subscription revenue from the sale of our MSP, application performance management and IT service management, or ITSM products, and license and maintenance revenue from the sale of our on-premise network and IT operations management perpetual license products. Over time, we have significantly increased our subscription and maintenance revenue and intend to grow our revenue and cash flow by gaining new customers, increasing penetration within our existing customer base, expanding our international footprint, bringing new products to market and expanding into new markets through organic development and targeted acquisitions.
SolarWinds Corporation was incorporated in the State of Delaware in 2015 under the name Project Aurora Parent, Inc. It changed its name to SolarWinds Parent, Inc. in May 2016, and in May 2018 changed its name to SolarWinds Corporation.
The SolarWinds Model
At SolarWinds, we do things differently. The focus and discipline that we bring to our business distinguish us in a highly competitive landscape.
We believe that growth and profitability are not conflicting priorities. We designed our business to allow us to grow and generate significant positive cash flow at the same time.
3
At the heart of everything we do as a company is the SolarWinds Model, which consists of five principles that guide our business and help explain why technology professionals choose our products:
Focus on the Technology Professional
We are committed to understanding technology professionals and the daily challenges that they face managing the complex, ever-changing demands of business-critical IT environments. We have a substantial customer base and community of technology professionals. We engage with them on a daily basis through digital marketing and online communications. These include THWACK, our online community that provides forums to registered members, tools and valuable resources; several company-sponsored blogs in which we provide perspectives and information relevant to the IT management market; and web-based events designed to train and inform participants about deeper aspects of our products. We don’t have to guess about what they need, we just ask.
Build Great Products for the Entire Market
Organizations of all sizes have complex IT environments that make managing IT challenging. Our commitment to technology professionals allows us to deliver products that solve well-understood IT problems simply, quickly and affordably for the entire market, from very small businesses to the largest of global enterprises, regardless of whether their IT is managed internally or through an MSP.
We design our products to be easy to access, try, buy, deploy and use. Many of our products are built on common technology platforms that enable our customers to purchase and implement our products individually, and then add additional product or products as needed. Or they can buy multiple products as integrated suites. This allows customers to buy what they need, when they need it, and grow as their needs evolve.
Capture Demand Using Cost-Efficient, Mass-Reach Digital Marketing
We utilize digital marketing to directly reach technology professionals of all levels of sophistication managing IT environments of all levels of complexity and size. They are online every day interacting with their peers, learning about new technologies and searching for solutions to their problems.
Over the past decade, we have honed our use of online tools to find, communicate with and sell to our potential customers of all levels of sophistication with environments of all levels of complexity and size. We believe we build credibility and confidence in our products by being present and active in the communities and on the sites that technology professionals trust.
Sell from the Inside
We are committed to selling from the inside. We adhere to a prescriptive process and metrics-based approach that drives predictability and consistency and has helped us add new customers and grow our relationships with existing customers.
The size and organization of our sales force enables us to reach thousands of technology professionals each day. We close the smallest and most simple transactions to our largest and most complex deals efficiently without the need for a traditional outside sales force, product customization or professional services. Our sales team uses a prescriptive approach designed to manage these leads and quickly sell our products pursuant to our standardized pricing and contract terms. We believe our selling motion reflects how our customers prefer to do business.
Focus on the Long-Term Value of the Relationship with Our Customers
When our customers experience the value of our products, our investment in our product portfolio and our responsiveness to their changing needs, they often grow their relationship with us and become our advocates within both their organizations and their networks of technology professionals. The power of our approach is evidenced by the long-term relationships we have with our customers which is reflected in our strong customer retention rates.
Growth Strategies
We intend to extend our leadership in IT infrastructure management and grow our market share in adjacent areas of IT operations with powerful yet easy to use software products designed to manage “all things IT” across hybrid IT environments. The following are key elements of our growth strategy:
Win New Customers Using the SolarWinds Model
The SolarWinds Model allows us to win new customers in existing markets where our products and our model give us a competitive advantage. Our efficient marketing and sales model and powerful brand recognition and trust among technology professionals have enabled us to increase our customer base. We intend to leverage our ability to efficiently attract new customers to continue to increase our overall customer base.
4
Increase Penetration Within Our Existing Customer Base
Many of our customers make an initial purchase to meet an immediate need, such as network or application performance monitoring in a small portion of their IT infrastructure, and then subsequently purchase additional products for other use cases or expansion across their organization. Once our customers have used our products within their IT environment, we are well positioned to help identify additional products that offer further value to those customers. We continue to refine our sales effort to better target our marketing and sales efforts and expand the sales of our products within organizations, particularly those that have multiple purchasers of our IT management products.
Increase Our International Footprint
We believe a substantial market opportunity exists to increase our international footprint across all of our product lines. In particular, our application performance management and ITSM products, which are currently sold primarily in North America, have strong international expansion potential. We have made significant investments in recent years to increase our sales and marketing operations internationally, and expect to continue to invest to grow our international sales and global brand awareness.
Continue to Innovate
We intend to continue focusing on innovation and bringing new products and tools to market that address problems that technology professionals are asking us to solve. We also intend to continue providing frequent feature releases to our existing products. We are focused on enhancing the overall integration of our products to improve our value proposition and allow our customers to further benefit from expanding their usage of our products as their needs evolve.
Expand into New Markets Aligned with the SolarWinds Model
We have successfully entered new markets and expanded our product offerings to solve a broader set of challenges for customers. For example, in recent years we broadened our product offerings to address the database, storage, cloud, MSP and ITSM markets. We intend to further expand into markets where our SolarWinds Model provides us with competitive advantages.
Pursue Targeted Acquisitions of Products and Technologies
We have successfully acquired and integrated businesses and technologies in the past that provided us with new product offerings and capabilities and helped us to establish positions in new segments and markets. We intend to continue making targeted acquisitions that complement and strengthen our product portfolio and capabilities or provide access to new markets. We evaluate acquisition opportunities to assess whether they will be successful within the SolarWinds Model. We believe our ability to effectively transition acquired companies and products to the SolarWinds Model represents a unique opportunity for our business.
Our Customers and Market
We designed the SolarWinds Model to reach all sizes of businesses. Our customers represent organizations ranging in size from very small businesses to large enterprises. Customers often initially purchase one of our products to solve a known problem and then expand their purchases over time.
As of December 31, 2019, we had over 320,000 customers. We define customers as individuals or entities that have purchased one or more of our products under a unique customer identification number since our inception for our perpetual license products and individuals or entities that have an active subscription for at least one of our subscription products. Each unique customer identification number constitutes a separate customer regardless of the amount purchased. We may have multiple purchasers of our products within a single organization, each of which may be assigned a unique customer identification number and deemed a separate customer.
The SolarWinds Model allows us to both sell to a broad group of potential customers and close large transactions with significant customers. At the same time, we designed the SolarWinds Model to reach businesses that outsource the management of some or all of their IT infrastructure to MSPs. We reach SMBs through MSPs and directly, including those SMBs that may purchase a single product to solve a known problem.
Organizations across industries are using technology and software to drive business success and competitive differentiation. As the landscape for IT infrastructure and software deployment worldwide rapidly changes to meet businesses’ evolving needs, the performance, speed, availability and security of IT has become critical to business strategy. The job of the technology professionals who deploy and manage these environments is more challenging than ever.
Growing IT Complexity Creates Significant Challenges for Organizations
As organizations deploy and rely on a mix of on-premise, public and private cloud and hybrid IT environments, they require performance monitoring and management solutions that work across their increasingly complex environments and provide full visibility into performance.
5
Empowerment of the Technology Professional
The technology professionals charged with managing these infrastructures are increasingly responsible for making technology choices to help ensure performance of IT infrastructure meets the needs of the business. Additionally, the democratization of IT spend has shifted influence in software purchase decisions from the highest levels of an organization’s IT department to technology professionals, who can have different perspectives from CIOs or other IT decision-makers. We have found that technology professionals prefer to trial software products in real time to determine if the products meet their needs. They also want the flexibility to select from a range of IT management products to find those best suited to address their specific challenges. In this environment, technology professionals are among the biggest influencers of software-purchasing decisions within their organizations.
Organizations Have Choices in Allocating Resources to Manage IT
Efficiently managing IT and quickly resolving problems are paramount for organizations of all sizes. However, as IT complexity grows, organizations must determine how to allocate their resources to best manage their IT needs. Organizations can choose to manage their own IT infrastructure or buy IT management as a service through MSPs. MSPs maintain and operate an organization’s IT environment and can deliver the full range of IT solutions, including network monitoring, server and desktop management, backup and recovery and IT security. For many smaller organizations that lack the time, resources and technical expertise to manage complex IT environments, MSPs can improve the efficacy of their IT strategy without significant capital investment. For larger organizations, MSPs can replace or supplement in-house capabilities.
Limitations of Alternative Solutions
Alternative IT management solutions have limitations that impair their ability to efficiently serve the unique needs of technology professionals. These solutions can be expensive, complicated and inflexible and may require significant professional services to customize, implement, operate and maintain.
Given the challenges associated with operating across a complex range of dynamic, hybrid IT environments and the limited ability of existing solutions to address these challenges in the ways that technology professionals want them addressed, we believe there is a significant market opportunity for broad hybrid IT management solutions purpose-built to serve the needs of technology professionals.
Product Portfolio and Technology Platforms
We offer over 50 infrastructure-location agnostic products to monitor and manage network, systems, desktop, application, storage, database, website infrastructures and IT service desks. We intend to continue to innovate and invest in areas of product development that bring new products to market and enhance the functionality, ease of use and integration of our current products. We may also introduce new technology through relationships with other technology companies. We believe this will strengthen the overall value proposition of our products in any IT environment.
Our product development is guided by principles that provide a development framework that allows us to respond quickly to the market and deliver a broad suite of products designed to solve problems that are commonly understood and shared by our customers. Our core product development principles are:
1. | We purpose-build products for technology professionals. |
2. | Our roadmaps are guided by a large community of users rather than by a select few large customers. |
3. | We develop products that are intended to sell themselves and be easy to use, powerful and immediately valuable to users. |
4. | We design and develop our products to integrate and complement each other while providing a consistent user experience. |
We believe we have one of the broadest product portfolios of IT monitoring and management software across the industry, providing deep visibility into web, application, database, virtual resources, storage, and network performance. Our products monitor applications and their supporting infrastructure, while remaining infrastructure-location agnostic. Our products monitor applications in the cloud via an agent, agentlessly, or by using information from cloud providers’ APIs.
6
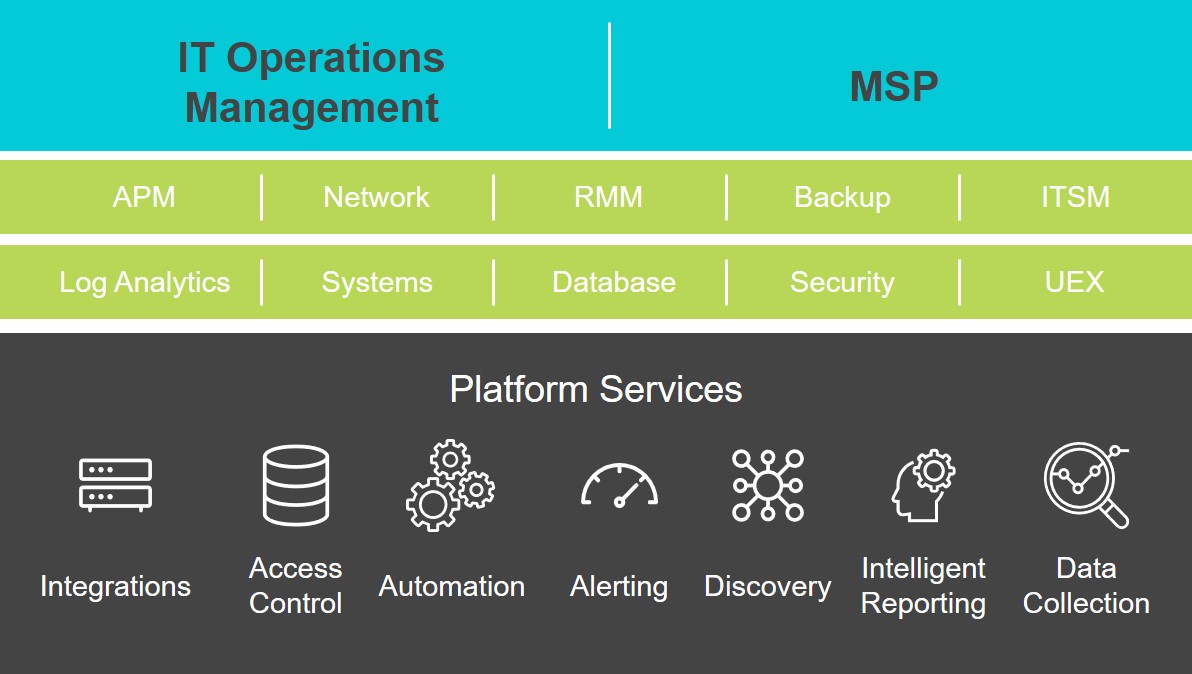
IT Operations Management Products
Targeted for ITOps, DevOps, and IT security Professionals, our IT Operations Management (ITOM) products provide hybrid IT performance management with a deep visibility into applications, IT infrastructures, and the full IT stack, while remaining infrastructure-location agnostic. Our comprehensive ITOM portfolio covers the needs of all IT professionals and their hybrid IT environments. A one-stop shop for IT management, our product capabilities include, network management, infrastructure management, and application performance management to service management and IT security. Our ITOM products include the products we categorized as core IT, cloud management and ITSM products in previous filings. Our decision to combine these products into this new group reflects the desire to align with how our customers think about and use our products to solve the interconnected problems of hybrid IT management.
Our suite of network management software provides real-time visibility into network utilization and bandwidth as well as the ability to quickly detect, diagnose and resolve network performance problems. Our suite of infrastructure management products monitors and analyzes the performance of applications and their supporting infrastructure, including websites, servers, physical, virtual and cloud infrastructure, storage and databases. We also help our customers strengthen their security and compliance posture with our automated network configuration, backup and log and event management products.
Our suite of application performance management software enables visibility into log data, cloud infrastructure metrics, applications, tracing, and web performance management. We sell individual products that address each of these areas, or we also offer AppOptics, which integrates application performance, server infrastructure monitoring, and customer metrics into one unified, cloud-based solution.
Our service management software provides a robust and easy-to use comprehensive, ITIL-compliant service desk solution for companies of all sizes. We help our customers manage their employee service challenge needs whether through simple ticketing or a powerful ITSM solution, removing the manual burden of managing incoming tickets and tracking technology assets with the products cutting-edge automation, artificial intelligence and machine learning capabilities.
Our hybrid IT offerings are highly scalable and can be added alongside existing products in a modular fashion. The integration of our products combines data from multiple parts of the IT stack to provide a single, unified application centric view and customer experience. Our IT operations management products also enable a single dashboard to view real-time application metrics regardless of whether the applications are deployed across multiple data centers or cloud vendors globally.
MSP Products
Our portfolio targeted for MSPs delivers broad, scalable IT service management solutions to enable MSPs to deliver outsourced IT services for their SMB end-customers and more efficiently manage their own businesses. Our core remote monitoring and management software, which remotely monitors desktops, laptops, servers, network and mobile devices across operating systems and platforms, integrates with a broad offering of MSP-focused products on a common platform including endpoint detection and response, patch management, backup, anti-virus, web protection, risk assessment, help desk/service ticketing, password
7
management and application management. We also offer an email protection and archiving platform on a standalone basis that protects businesses from phishing, malware and other email-borne threats.
Marketing and Sales
We market and sell our products directly to technology professionals with a low-touch, high-velocity digital marketing and “selling from the inside” motion that we believe is unique and hard to replicate in the software industry. Our marketing and sales process allows us to effectively capture demand and maintain high levels of sales productivity at low customer acquisition costs.
We target our marketing efforts and selling motion directly at network, systems, DevOps and MSP professionals within organizations versus the organizations themselves. We believe this approach provides us with a significant advantage in today’s environment in which purchasing influence and power is shifting from traditional procurement to the technology professionals themselves.
Marketing
We have built a highly flexible and analytics-driven direct marketing model designed to efficiently drive website traffic and high-quality leads that are typically trials of full-featured products from our websites. By providing trials of full-featured products we enable prospective customers to easily explore the capabilities of our products and easily transition from trial to sale. We also have a marketing motion directed at current customers designed to educate them about features of products they own, products they do not own and how to trial new products.
We make broad use of digital marketing tools including search engines, targeted email campaigns, localized websites, free IT management tools, display advertising, affiliate marketing, social media, e-book distribution, video content, blogging and webinars.
We also engage using our online community, THWACK. Within THWACK, we provide forums, solutions, tools, webinars, content and other valuable resources relevant to the IT management market. This community is designed to train and inform technology professionals about our products, keep us connected to them and provide network effects to amplify word-of-mouth marketing for our products.
Sales
We refer to our selling motion as “selling from the inside.” This approach is rooted in having our sales organization physically located in our offices, selling online or over the phone, using a prescriptive approach to managing leads and adhering to standardized pricing and contract terms. We close transactions of all sizes and locations through our selling from the inside approach. We do not employ any outside sales personnel.
Our sales organization is divided into our dedicated sales team and our retention and maintenance renewal team. Our dedicated sales team focuses exclusively on sales of new products to new and existing customers. Our dedicated sales team receives high-quality leads from our marketing motion and engages with the prospect to close the sale. We adhere to a disciplined, data-driven approach to converting leads quickly and efficiently based on our understanding of the prospect’s specific product demands and the inflection points in the selling process.
Our retention and maintenance renewal team focuses exclusively on renewing our subscription and maintenance agreements with our customers. Our conversations with these customers begin months before the renewal date to support our customers, and we work with them through the renewal process.
We also sell our software through distributors and resellers to supplement our direct sales force, expand our global presence, reach various market segments and help us to initiate and fulfill sales orders from state, local and federal governments and those commercial customers that prefer to make purchases through a particular reseller. We contract directly with end customers when we sell our products through channel partners. We have a number of resellers who are proactively creating demand for our products and bring new opportunities and customers to us. In addition to selling to SMBs directly, we also deliver our technology to SMBs through our MSP customers, who use our products to provide outsourced IT management services to these SMBs.
Research and Development
Our research and development organization is primarily responsible for the design, development, testing and deployment of new products and improvements to existing products, with a focus on ensuring that our products integrate and complement one another.
We have designed our software development process to be responsive to customer needs, cost efficient and agile. In our process, we work closely with our user community throughout the development process, to build what is needed for the problems technology professionals face every day. This includes regularly having a subset of our customers participate in validating that our product use cases and features will solve their problems.
8
Over more than a decade, we have honed our approach to building a development organization that allows us to build products and enhance existing products quickly, efficiently, and cost-effectively. Our low-cost global development model allows us to source from a large pool of talented resources by participating in multiple labor markets to match the best person to each role, at the most efficient cost. We utilize small scrum teams, each dedicated to specific product modules that follow a standard set of practices to build and test their code continuously. We share our development values across our offices and aim to assign meaningful design and development work to our international locations.
We believe that we have developed a differentiated process that allows us to release new software rapidly, cost effectively and with a high level of quality.
Competition
We operate in a highly competitive industry that is characterized by constant change and innovation. Changes in networks, applications, devices, operating systems and deployment environments result in evolving customer requirements. Our competitors and potential competitors include:
• | large network management and IT vendors such as Cisco Systems, MicroFocus, CA Technologies, IBM and BMC Software; and |
• | smaller companies in the cloud and application monitoring and the MSP IT tools markets, where we do not believe that a single or small group of companies has achieved market leadership. |
We believe the principal competitive factors in our market are:
• | brand awareness and reputation among technology professionals, including IT professionals, DevOps professionals and MSPs; |
• | product capabilities, including scalability, performance and reliability; |
• | ability to solve problems for companies of all sizes and infrastructure complexities; |
• | ease of use; |
• | total cost of ownership; |
• | flexible deployment models, including on-premise, in the cloud or in a hybrid environment; |
• | strength of sales and marketing efforts; and |
• | focus on customer success. |
We believe that we compete effectively across these factors as our products and marketing efforts have been designed with these criteria as guideposts.
Intellectual Property
We rely on a combination of patent, copyright, trademark, trade dress and trade secret laws, as well as confidentiality procedures and contractual restrictions, to establish and protect our proprietary rights. These laws, procedures and restrictions provide only limited protection. As of December 31, 2019, we owned approximately 33 issued U.S. patents and 172 issued foreign patents, with expiration dates ranging from December 2026 to November 2037. We have also filed approximately 58 currently pending patent applications, but we cannot guarantee that patents will be issued with respect to our current patent applications in a manner that gives us the protection that we seek or at all. Our patents and any future patents issued to us may be challenged, invalidated or circumvented and may not provide sufficiently broad protection or may not prove to be enforceable in actions against alleged infringers.
We endeavor to enter into confidentiality and invention assignment agreements with our employees and contractors and with parties with which we do business in order to limit access to and disclosure of, and safeguard our ownership of, our proprietary information. We cannot be certain that the steps we have taken will prevent unauthorized use or reverse engineering of our technology. Moreover, others may independently develop technologies that are competitive with ours or that infringe our intellectual property, and policing unauthorized use of our technology and intellectual property rights can be difficult. The enforcement of our intellectual property rights also depends on any legal actions against these infringers being successful, but these actions may not be successful, even when our rights have been infringed.
Furthermore, effective patent, trademark, trade dress, copyright and trade secret protection may not be available in every country in which our products are available or where we have operations. In addition, the legal standards relating to the validity, enforceability and scope of protection of intellectual property rights are uncertain and still evolving.
9
Employees
As of December 31, 2019, we had 3,251 employees, of which 1,161 were employed in the United States and 2,090 were employed outside of the United States. We consider our current relationship with our employees to be good. We are not party to any collective bargaining agreement.
Additional Information
Our website address is www.solarwinds.com. Our website and the contents therein or connected thereto are not intended to be incorporated into this Annual Report on Form 10-K. Through a link on the Investor Relations section of our website, we make available the following filings as soon as reasonably practicable after they are electronically filed with or furnished to the SEC: our Annual Reports on Form 10-K, Quarterly Reports on Form 10-Q, Current Reports on Form 8-K, and any amendments to those reports filed or furnished pursuant to Section 13(a) or 15(d) of the Exchange Act. All such filings are available free of charge. In addition, the SEC maintains an Internet site (http://www.sec.gov) that contains reports, proxy and information statements, and other information regarding issuers that file electronically with the SEC.
10
ITEM 1A. RISK FACTORS
Risks Related to Our Business and Industry
Our quarterly revenue and operating results may fluctuate in the future because of a number of factors, which makes our future results difficult to predict and could cause our operating results to fall below expectations or the guidance we may provide in the future.
We believe our quarterly revenue and operating results may vary significantly in the future. As a result, you should not rely on the results of any one quarter as an indication of future performance and period-to-period comparisons of our revenue and operating results may not be meaningful.
Our quarterly results of operations may fluctuate as a result of a variety of factors, including, but not limited to, those listed below, many of which are outside of our control:
• | our ability to maintain and increase sales to existing customers and to attract new customers; |
• | decline in maintenance or subscription renewals; |
• | our ability to capture a significant volume of qualified sales leads; |
• | our ability to convert qualified sales leads into new business sales at acceptable conversion rates; |
• | the amount and timing of operating expenses and capital expenditures related to the expansion of our operations and infrastructure and customer acquisition; |
• | our failure to achieve the growth rate that was anticipated by us in setting our operating and capital expense budgets; |
• | potential foreign exchange gains and losses related to expenses and sales denominated in currencies other than the functional currency of an associated entity; |
• | fluctuations in foreign currency exchange rates that may negatively impact our reported results of operations; |
• | the timing of revenue and expenses related to the development or acquisition of technologies, products or businesses; |
• | potential goodwill and intangible asset impairment charges and amortization associated with acquired businesses; |
• | the timing and success of new product, enhancements or functionalities introduced by us or our competitors; |
• | our ability to obtain, maintain, protect and enforce our intellectual property rights; |
• | changes in our pricing or licensing model or those of our competitors; |
• | the impact of new accounting pronouncements; |
• | occasional large customer orders, including in particular those placed by the U.S. federal government; |
• | unpredictability and timing of buying decisions by the U.S. federal government; |
• | general economic, industry and market conditions that impact expenditures for enterprise IT management software in the United States and other countries where we sell our software; |
• | significant security breaches, technical difficulties or interruptions to our products; and |
• | changes in tax rates in jurisdictions in which we operate. |
Fluctuations in our quarterly operating results might lead analysts to change their models for valuing our common stock. As a result, our stock price could decline rapidly and we could face costly securities class action suits or other unanticipated issues.
If we are unable to capture significant volumes of high quality sales leads from our digital marketing initiatives, it could adversely affect our revenue growth and operating results.
Our digital marketing program is designed to efficiently and cost-effectively drive a high volume of website traffic and deliver high quality leads, which are generally trials of our products, to our sales teams. We drive website traffic and capture leads through various digital marketing initiatives, including search engine optimization, or SEO, targeted email campaigns, localized websites, social media, e-book distribution, video content, blogging and webinars. If we fail to drive a sufficient amount of website traffic or capture a sufficient volume of high quality sales leads from these activities, our revenue may not grow as expected or could decrease. If these activities are unsuccessful, we may be required to increase our sales and marketing expenses, which may not be offset by additional revenue, and could adversely affect our operating results.
Our digital marketing initiatives may be unsuccessful in driving high volumes of website traffic and generating trials of our products, resulting in fewer high quality sales leads, for a number of reasons. For example, technology professionals often find our products when they are online searching for a solution to address a specific need. Search engines typically provide two types of search results, algorithmic and purchased listings, and we rely on both. The display, including rankings, of unpaid search results can be affected by a number of factors, many of which are not in our direct control, and may change frequently. Our SEO techniques have been developed to work with existing search algorithms used by the major search engines. However, major search engines
11
frequently modify their search algorithms and such modifications could cause our websites to receive less favorable placements, which could reduce the number of technology professionals who visit our websites. In addition, websites must comply with search engine guidelines and policies that are complex and may change at any time. If we fail to follow such guidelines and policies properly, search engines may rank our content lower in search results or could remove our content altogether from their indexes. If our websites are displayed less prominently, or fail to appear in search result listings in response to search inquiries regarding IT management problems through Internet search engines for any reason, our website traffic could significantly decline, requiring us to incur increased marketing expenses to replace this traffic. Any failure to replace this traffic could reduce our revenue.
In addition, the success of our digital marketing initiatives depends in part on our ability to collect customer data and communicate with existing and potential customers online and through phone calls. As part of the product evaluation trial process and during our sales process, most of our customers agree to receive emails and other communications from us. We also use tracking technologies, including cookies and related technologies, to help us track the activities of the visitors to our websites. However, as discussed in greater detail below, we are subject to a wide variety of data privacy and security laws and regulations in the U.S. and internationally that affect our ability to collect and use customer data and communicate with customers through email and phone calls. Several jurisdictions have proposed or adopted laws that restrict or prohibit unsolicited email or “spam” or regulate the use of cookies, including the European Union’s General Data Protection Regulation. These new laws and regulations may impose significant monetary penalties for violations and complex and often burdensome requirements in connection with sending commercial email or other data-driven marketing practices. As a result of such regulation, we may be required to modify or discontinue our existing marketing practices, which could increase our marketing costs.
If we are unable to sell products to new customers or to sell additional products or upgrades to our existing customers, it could adversely affect our revenue growth and operating results.
To increase our revenue, we must regularly add new customers, including new customers within existing client organizations, and sell additional products or upgrades to existing customers. Even if we capture a significant volume of leads from our digital marketing activities, we must be able to convert those leads into sales of our products in order to achieve revenue growth.
We primarily rely on our direct sales force to sell our products to new and existing customers and convert qualified leads into sales using our low-touch, high-velocity sales model. Accordingly, our ability to achieve significant growth in revenue in the future will depend on our ability to recruit, train and retain sufficient numbers of sales personnel, and on the productivity of those personnel. We plan to continue to expand our sales force both domestically and internationally. Our recent and planned personnel additions may not become as productive as we would like or in a timely manner, and we may be unable to hire or retain sufficient numbers of qualified individuals in the future in the markets where we do or plan to do business. If we are unable to sell products to new customers and additional products or upgrades to our existing customers through our direct sales force or through our channel partners, which supplement our direct sales force by distributing our products and generating sales opportunities, we may be unable to grow our revenue and our operating results could be adversely affected.
We offer and sell our products to two main groups of customers: technology professionals, who use our ITOM products to manage their organization’s own IT infrastructure, and managed service providers, or MSPs, who use our MSP products to manage their end clients’ IT infrastructure. In addition to the growth in our ITOM offerings since our inception, since 2013, we have also devoted significant resources to expanding our MSP offerings. If we fail to continue to add MSP customers, our business and operating results may be harmed.
Our business depends on customers renewing their maintenance or subscription agreements. Any decline in renewal or net retention rates could harm our future operating results.
The significant majority of our revenue is recurring and consists of maintenance revenue and subscription revenue. Our perpetual license products typically include the first year of maintenance as part of the initial price. Our subscription products generally have recurring monthly or annual subscription periods. Our customers have no obligation to renew their maintenance or subscription agreements after the expiration of the initial period. Additionally, customers could cancel their subscription agreements prior to the expiration of the subscription period, which could result in us recognizing less subscription revenue than expected over the term of the agreement.
It is difficult to accurately predict long-term customer retention. Our customers’ maintenance renewal rates and subscription net retention rates may decline or fluctuate as a result of a number of factors, including their level of satisfaction with our products, the prices of our products, the prices of products and services offered by our competitors or reductions in our customers’ spending levels. If our customers do not renew their maintenance or subscription arrangements or if they renew them on less favorable terms, our revenue may decline and our business will suffer. A substantial portion of our quarterly maintenance and subscription revenue is attributable to agreements entered into during previous quarters. As a result, if there is a decline in renewed maintenance or subscription agreements in any one quarter, only a small portion of the decline will be reflected in our revenue recognized in that quarter and the rest will be reflected in our revenue recognized in the following four quarters or more.
12
We have experienced substantial growth in recent years, and if we fail to manage our growth effectively, we may be unable to execute our business plan, maintain high levels of customer satisfaction or adequately address competitive challenges, and our financial performance may be adversely affected.
Our business has rapidly grown, which has resulted in large increases in our number of employees, expansion of our infrastructure, new internal systems and other significant changes and additional complexities. We increased our total number of employees to 3,251 as of December 31, 2019 from 2,738 as of December 31, 2018. While we intend to further expand our overall business, customer base, and number of employees, our historical growth rate is not necessarily indicative of the growth that we may achieve in the future. The growth in our business generally and our management of a growing workforce and customer base geographically dispersed across the U.S. and internationally will require substantial management effort, infrastructure and operational capabilities. To support our growth, we must continue to improve our management resources and our operational and financial controls and systems, and these improvements may increase our expenses more than anticipated and result in a more complex business. We will also have to anticipate the necessary expansion of our relationship management, implementation, customer service and other personnel to support our growth and achieve high levels of customer service and satisfaction. Our success will depend on our ability to plan for and manage this growth effectively. If we fail to anticipate and manage our growth or are unable to provide high levels of customer service, our reputation, as well as our business, results of operations and financial condition, could be harmed.
Because our long-term success depends on our ability to operate our business internationally and increase sales of our products to customers located outside of the United States, our business is susceptible to risks associated with international operations.
We have international operations in the Republic of Ireland, the United Kingdom, Canada, the Czech Republic, Poland, Belarus, Romania, Austria, Germany, Portugal, the Netherlands, Sweden, Switzerland, Israel, Australia, Japan, Singapore and the Philippines and we market and sell our products worldwide. We expect to continue to expand our international operations for the foreseeable future. The continued international expansion of our operations requires significant management attention and financial resources and results in increased administrative and compliance costs. Our limited experience in operating our business in certain regions outside the United States increases the risk that our expansion efforts into those regions may not be successful. In particular, our business model may not be successful in particular countries or regions outside the United States for reasons that we currently are unable to anticipate. We are subject to risks associated with international sales and operations including, but not limited to:
• | fluctuations in currency exchange rates (which we hedge only to a limited extent at this time); |
• | the complexity of, or changes in, foreign regulatory requirements; |
• | difficulties in managing the staffing of international operations, including compliance with local labor and employment laws and regulations; |
• | potentially adverse tax consequences, including the complexities of foreign value added tax systems, overlapping tax regimes, restrictions on the repatriation of earnings and changes in tax rates; |
• | dependence on resellers and distributors to increase customer acquisition or drive localization efforts; |
• | the burdens of complying with a wide variety of foreign laws and different legal standards; |
• | increased financial accounting and reporting burdens and complexities; |
• | longer payment cycles and difficulties in collecting accounts receivable; |
• | longer sales cycles; |
• | political, social and economic instability; |
• | war, terrorist attacks and security concerns in general; |
• | reduced or varied protection for intellectual property rights in some countries and the risk of potential theft or compromise of our technology, data or intellectual property in connection with our international operations, whether by state-sponsored malfeasance or other foreign entities or individuals; |
• | laws and policies of the U.S. and other jurisdictions affecting international trade (including import and export control laws, tariffs and trade barriers); |
• | the risk of U.S. regulation of foreign operations; and |
• | other factors beyond our control such as natural disasters and pandemics. |
The occurrence of any one of these risks could negatively affect our international business and, consequently, our operating results. We cannot be certain that the investment and additional resources required to establish, acquire or integrate operations in other countries will produce desired levels of revenue or profitability. If we are unable to effectively manage our expansion into additional geographic markets, our financial condition and results of operations could be harmed.
In particular, we operate much of our research and development activities internationally and outsource a portion of the coding and testing of our products and product enhancements to contract development vendors. We believe that performing research and
13
development in our international facilities and supplementing these activities with our contract development vendors enhances the efficiency and cost-effectiveness of our product development. If we experience problems with our workforce or facilities internationally, we may not be able to develop new products or enhance existing products in an alternate manner that may be equally or less efficient and cost-effective.
In June 2016, the United Kingdom’s electorate voted in a referendum to voluntarily depart from the European Union, commonly referred to as “Brexit.” The United Kingdom approved the Withdrawal Agreement and left the European Union on January 31, 2020. We are monitoring developments related to Brexit during the transition period and the potential effects of Brexit on our business remain unclear. Since we have operations in the UK and Europe, Brexit could potentially have corporate structural consequences, adversely change tax benefits or liabilities and disrupt some of the markets and jurisdictions in which we operate. In addition, Brexit could lead to legal uncertainty and potentially divergent national laws and regulations as the United Kingdom determines which European Union laws to replace or replicate.
We operate in highly competitive markets, which could make it difficult for us to acquire and retain customers at historic rates.
We operate in a highly competitive industry. Competition in our market is based primarily on brand awareness and reputation; product capabilities, including scalability, performance and reliability; ability to solve problems for companies of all sizes and infrastructure complexities; ease of use; total cost of ownership; flexible deployment models, including on-premise, in the cloud or in a hybrid environment; strength of sales and marketing efforts; and focus on customer service. We often compete to sell our products against existing products or systems that our potential customers have already made significant expenditures to install. Many of our current and potential competitors enjoy substantial competitive advantages over us, such as greater brand awareness and substantially greater financial, technical and other resources. In addition, many of our competitors have established marketing relationships and access to larger customer bases, and have major distribution agreements with consultants, system integrators and resellers. Given their larger size, greater resources and existing customer relationships, our competitors may be able to compete and respond more effectively than we can to new or changing opportunities, technologies, standards or customer requirements.
We face competition from both large network management and IT vendors offering enterprise-wide software frameworks and services and smaller companies in the cloud and application monitoring and the MSP IT tools markets. We also compete with network equipment vendors and IT operations management product providers, as well as infrastructure providers and their native applications, whose products and services also address network and IT management requirements. Our principal competitors vary depending on the product we offer and include large network management and IT vendors such as Cisco Systems, Inc., Micro Focus International plc, CA, Inc., International Business Machines Corporation and BMC Software, Inc., and smaller companies in the cloud and application monitoring and the MSP IT tools markets, where we do not believe that a single or small group of companies has achieved market leadership.
Some of our competitors have made acquisitions or entered into strategic relationships with one another to offer more comprehensive or bundled or integrated product offerings. We expect this trend to continue as companies attempt to strengthen or maintain their market positions in an evolving industry and as companies enter into partnerships or are acquired. Companies and alliances resulting from these possible consolidations and partnerships may create more compelling product offerings and be able to offer more attractive pricing, making it more difficult for us to compete effectively.
Our actual operating results may differ significantly from information we may provide in the future regarding our financial outlook.
From time to time, we may provide information regarding our financial outlook in our quarterly earnings releases, quarterly earnings conference calls, or otherwise, that represents our management’s estimates as of the date of release. This information regarding our financial outlook, which includes forward-looking statements, will be based on projections, including those related to certain of the factors listed above, prepared by our management. Neither our independent registered public accounting firm nor any other independent expert or outside party will compile or examine the projections nor, accordingly, will any such person express any opinion or any other form of assurance with respect thereto.
These projections will be based upon a number of assumptions and estimates that, while presented with numerical specificity, will be inherently subject to significant business, economic and competitive uncertainties and contingencies, many of which will be beyond our control, and will also be based upon specific assumptions with respect to future business decisions, some of which will change. We intend to state possible outcomes as high and low ranges, which will be intended to provide a sensitivity analysis as variables are changed, but will not be intended to represent that actual results could not fall outside of the suggested ranges. The principal reason that we may in the future release such information is to provide a basis for our management to discuss our business outlook with analysts and investors. We do not accept any responsibility for any projections or reports published by analysts.
Information regarding our financial outlook would be necessarily speculative in nature, and it can be expected that some or all of the assumptions underlying such information furnished by us will not materialize or will vary significantly from actual results. Accordingly, information that we may provide regarding our financial outlook will only be an estimate of what management
14
believes is realizable as of the date of release. Actual results will vary from our financial outlook, and the variations may be material and adverse. In light of the foregoing, investors are urged to consider these factors, not to rely exclusively upon information we may provide regarding our financial outlook in making an investment decision regarding our common stock, and to take such information into consideration only in connection with other information included in our filings filed with or furnished to the SEC, including the “Risk Factors” sections in such filings.
Any failure to implement our operating strategy successfully or the occurrence of any of the events or circumstances set forth under “Risk Factors” in this Annual Report on Form 10-K could result in our actual operating results being different from information we provide regarding our financial outlook, and those differences might be adverse and material.
If we sustain system failures, cyberattacks against our systems or against our products, or other data security incidents or breaches, we could suffer a loss of revenue and increased costs, exposure to significant liability, reputational harm and other serious negative consequences.
We are heavily dependent on our technology infrastructure to sell our products and operate our business, and our customers rely on our technology to help manage their own IT infrastructure. Our systems and those of our third-party service providers are vulnerable to damage or interruption from natural disasters, fire, power loss, telecommunication failures, traditional computer “hackers,” malicious code (such as viruses and worms), employee or contractor theft or misuse, and denial-of-service attacks, as well as sophisticated nation-state and nation-state-supported actors (including advanced persistent threat intrusions). The risk of a security breach or disruption, particularly through cyberattacks or cyber intrusion, including by computer hacks, foreign governments, and cyber terrorists, has generally increased the number, intensity and sophistication of attempted attacks, and intrusions from around the world have increased. In addition, sophisticated hardware and operating system software and applications that we procure from third parties may contain defects in design or manufacture, including “bugs” and other problems that could unexpectedly interfere with the operation of our systems.
Because the techniques used to obtain unauthorized access or to sabotage systems change frequently and generally are not identified until they are launched against a target, we may be unable to anticipate these techniques or to implement adequate preventative measures. We may also experience security breaches that may remain undetected for an extended period and, therefore, have a greater impact on the products we offer, the proprietary data contained therein, and ultimately on our business.
The foregoing security problems could result in, among other consequences, damage to our own systems or our customers’ IT infrastructure or the loss or theft of our or our customers’ proprietary or other sensitive information. The costs to us to eliminate or address the foregoing security problems and security vulnerabilities before or after a cyber incident could be significant. Our remediation efforts may not be successful and could result in interruptions, delays or cessation of service and loss of existing or potential customers that may impede sales of our products or other critical functions. We could lose existing or potential customers in connection with any actual or perceived security vulnerabilities in our websites or our products.
During the purchasing process and in connection with evaluations of our software, either we or third-party providers collect and use customer information, including personally identifiable information, such as credit card numbers, email addresses, phone numbers and IP addresses. We have legal and contractual obligations to protect the confidentiality and appropriate use of customer data. Despite our security measures, unauthorized access to, or security breaches of, our software or systems could result in the loss, compromise or corruption of data, loss of business, severe reputational damage adversely affecting customer or investor confidence, regulatory investigations and orders, litigation, indemnity obligations, damages for contract breach, penalties for violation of applicable laws or regulations, significant costs for remediation and other liabilities. We have incurred and expect to incur significant expenses to prevent security breaches, including deploying additional personnel and protection technologies, training employees, and engaging third-party experts and consultants. Our errors and omissions insurance coverage covering certain security and privacy damages and claim expenses may not be sufficient to compensate for all liabilities we incur.
Acquisitions present many risks that could have a material adverse effect on our business and results of operations.
In order to expand our business, we have made several acquisitions and expect to continue making similar acquisitions and possibly larger acquisitions as part of our growth strategy. The success of our future growth strategy will depend on our ability to identify, negotiate, complete and integrate acquisitions and, if necessary, to obtain satisfactory debt or equity financing to fund those acquisitions. Acquisitions are inherently risky, and any acquisitions we complete may not be successful. Our past acquisitions and any mergers and acquisitions that we may undertake in the future involve numerous risks, including, but not limited to, the following:
• | difficulties in integrating and managing the operations, personnel, systems, technologies and products of the companies we acquire; |
• | diversion of our management’s attention from normal daily operations of our business; |
• | our inability to maintain the key business relationships and the reputations of the businesses we acquire; |
15
• | uncertainty of entry into markets in which we have limited or no prior experience and in which competitors have stronger market positions; |
• | our dependence on unfamiliar affiliates, resellers, distributors and partners of the companies we acquire; |
• | our inability to increase revenue from an acquisition for a number of reasons, including our failure to drive demand in our existing customer base for acquired products and our failure to obtain maintenance renewals or upgrades and new product sales from customers of the acquired businesses; |
• | increased costs related to acquired operations and continuing support and development of acquired products; |
• | our responsibility for the liabilities of the businesses we acquire; |
• | potential goodwill and intangible asset impairment charges and amortization associated with acquired businesses; |
• | adverse tax consequences associated with acquisitions; |
• | changes in how we are required to account for our acquisitions under U.S. generally accepted accounting principles, including arrangements that we assume from an acquisition; |
• | potential negative perceptions of our acquisitions by customers, financial markets or investors; |
• | failure to obtain required approvals from governmental authorities under competition and antitrust laws on a timely basis, if at all, which could, among other things, delay or prevent us from completing a transaction, or otherwise restrict our ability to realize the expected financial or strategic goals of an acquisition; |
• | potential increases in our interest expense, leverage and debt service requirements if we incur additional debt to pay for an acquisition; |
• | our inability to apply and maintain our internal standards, controls, procedures and policies to acquired businesses; and |
• | potential loss of key employees of the companies we acquire. |
Additionally, acquisitions or asset purchases made entirely or partially for cash may reduce our cash reserves or require us to incur additional debt under our credit agreements or otherwise. We may seek to obtain additional cash to fund an acquisition by selling equity or debt securities. We may be unable to secure the equity or debt funding necessary to finance future acquisitions on terms that are acceptable to us. If we finance acquisitions by issuing equity or convertible debt securities, our existing stockholders will experience ownership dilution.
The occurrence of any of these risks could have a material adverse effect on our business, results of operations, financial condition or cash flows, particularly in the case of a larger acquisition or substantially concurrent acquisitions.
Businesses that we acquire may have greater than expected liabilities for which we become responsible.
Businesses that we acquire may have liabilities or adverse operating issues, or both, that we fail to discover through due diligence or the extent of which we underestimate prior to the acquisition. For example, to the extent that any business that we acquire or any prior owners, employees or agents of any acquired businesses or properties (i) failed to comply with or otherwise violated applicable laws, rules or regulations; (ii) failed to fulfill or disclose their obligations, contractual or otherwise, to applicable government authorities, their customers, suppliers or others; or (iii) incurred tax or other liabilities, we, as the successor owner, may be financially responsible for these violations and failures and may suffer harm to our reputation and otherwise be adversely affected. An acquired business may have problems with internal control over financial reporting, which could be difficult for us to discover during our due diligence process and could in turn lead us to have significant deficiencies or material weaknesses in our own internal control over financial reporting. These and any other costs, liabilities and disruptions associated with any of our past acquisitions and any future acquisitions could harm our operating results.
Charges to earnings resulting from acquisitions may adversely affect our operating results.
When we acquire businesses, we allocate the purchase price to tangible assets and liabilities and identifiable intangible assets acquired at their acquisition date fair values. Any residual purchase price is recorded as goodwill, which is also generally measured at fair value. We also estimate the fair value of any contingent consideration. Our estimates of fair value are based upon assumptions believed to be reasonable, but which are uncertain and involve significant judgments by management. After we complete an acquisition, the following factors could result in material charges and adversely affect our operating results and may adversely affect our cash flows:
• | costs incurred to combine the operations of companies we acquire, such as transitional employee expenses and employee retention or relocation expenses; |
• | impairment of goodwill or intangible assets; |
• | a reduction in the useful lives of intangible assets acquired; |
• | impairment of long-lived assets; |
• | identification of, or changes to, assumed contingent liabilities; |
16
• | changes in the fair value of any contingent consideration; |
• | charges to our operating results due to duplicative pre-merger activities; |
• | charges to our operating results from expenses incurred to effect the acquisition; and |
• | charges to our operating results due to the expensing of certain stock awards assumed in an acquisition. |
Substantially all of these costs will be accounted for as expenses that will decrease our net income and earnings per share for the periods in which those costs are incurred. Charges to our operating results in any given period could differ substantially from other periods based on the timing and size of our acquisitions and the extent of integration activities.
Our operating margins and cash flows from operations could fluctuate as we make further expenditures to expand our operations in order to support additional growth in our business.
We have made significant investments in our operations to support additional growth, such as hiring substantial numbers of new personnel, investing in new facilities, acquiring other companies or their assets and establishing and broadening our international operations in order to expand our business. We have made substantial investments in recent years to increase our sales and marketing operations in the EMEA and APAC regions and expect to continue to invest to grow our international sales and global brand awareness. We also expect to continue to invest to grow our research and development organization, particularly internationally. We have made multiple acquisitions in recent years and expect these acquisitions will continue to increase our operating expenses in future periods. These investments may not yield increased revenue, and even if they do, the increased revenue may not offset the amount of the investments. We also expect to continue to pursue acquisitions in order to expand our presence in current markets or new markets, many or all of which may increase our operating costs more than our revenue. As a result of any of these factors, our operating income could fluctuate and may continue to decline as a percentage of revenue relative to our prior annual periods.
The ability to recruit, retain and develop key employees and management personnel is critical to our success and growth, and our inability to attract and retain qualified personnel could harm our business.
Our business requires certain expertise and intellectual capital, particularly within our management team. We rely on our management team in the areas of operations, security, marketing, sales, support and general and administrative functions. The loss of one or more of our management team could have a material adverse effect on our business.
For us to compete successfully and grow, we must retain, recruit and develop key personnel who can provide the needed expertise for our industry and products. As we move into new geographic areas, we will need to attract, recruit and retain qualified personnel in those locations. In addition, acquisitions could cause us to lose key personnel of the acquired businesses. The market for qualified personnel is competitive and we may not succeed in recruiting additional key personnel or may fail to effectively replace current key personnel who depart with qualified or effective successors. We believe that replacing our key personnel with qualified successors is particularly challenging as we feel that our business model and approach to marketing and selling our products are unique. Any successors that we hire from outside of the Company would likely be unfamiliar with our business model and may therefore require significant time to understand and appreciate the important aspects of our business or fail to do so altogether. Our effort to retain and develop personnel may also result in significant additional expenses, including stock-based compensation expenses, which could adversely affect our profitability. New regulations and volatility or lack of performance in our stock price could also affect the value of our equity awards, which could affect our ability to attract and retain our key employees. We have made significant changes, and may make additional changes in the future, to our senior management team and other key personnel. We cannot provide assurances that key personnel, including our executive officers, will continue to be employed by us or that we will be able to attract and retain qualified personnel in the future. Failure to retain or attract key personnel could have a material adverse effect on our business.
Our success depends on our ability to maintain a product portfolio that responds to the needs of technology professionals and the evolving IT management market.
Our product portfolio has grown from on-premise network management products to broad-based on-premise systems monitoring and management and products for the growing but still emerging cloud and MSP markets. We offer over 50 products designed to solve the day-to-day problems encountered by technology professionals managing complex IT infrastructure, spanning on-premise, cloud and hybrid IT environments. Our long-term growth depends on our ability to continually enhance and improve our existing products and develop or acquire new products that address the common problems encountered by technology professionals on a day-to-day basis in an evolving IT management market. The success of any enhancement or new product depends on a number of factors, including its relevance to our existing and potential customers, timely completion and introduction and market acceptance. New products and enhancements that we develop or acquire may not sufficiently address the evolving needs of our existing and potential customers, may not be introduced in a timely or cost-effective manner and may not achieve the broad market acceptance necessary to generate the amount of revenue necessary to realize returns on our investments in developing or
17
acquiring such products or enhancements. If our new products and enhancements are not successful for any reason, certain products in our portfolio may become obsolete, less marketable and less competitive, and our business will be harmed.
If we are unable to develop and maintain successful relationships with channel partners, our business, results of operations and financial condition could be harmed.
We have established relationships with certain channel partners to distribute our products and generate sales opportunities, particularly internationally. We believe that continued growth in our business is dependent upon identifying, developing and maintaining strategic relationships with our existing and potential channel partners that can drive substantial revenue and provide additional valued-added services to our customers. Our agreements with our existing channel partners are non-exclusive, meaning our channel partners may offer customers the products of several different companies, including products that compete with ours. They may also cease marketing our products with limited or no notice and with little or no penalty. We expect that any additional channel partners we identify and develop will be similarly non-exclusive and not bound by any requirement to continue to market our products. If we fail to identify additional channel partners in a timely and cost-effective manner, or at all, or are unable to assist our current and future channel partners in independently distributing and deploying our products, our business, results of operations and financial condition could be harmed. If our channel partners do not effectively market and sell our products, or fail to meet the needs of our customers, our reputation and ability to grow our business may also be harmed.
We depend on the U.S. federal government in certain calendar quarters for a meaningful portion of our on-premise license sales, including maintenance renewals associated with such products, and orders from the U.S. federal government are unpredictable. The delay or loss of these sales may harm our operating results.
A portion of our on-premise license sales, including maintenance renewals associated with such products, are to a number of different departments of the U.S. federal government. In certain calendar quarters, particularly the third calendar quarter, this portion may be meaningful. Any factors that cause a decline in government expenditures generally or government IT expenditures in particular could cause our revenue to grow less rapidly or even to decline. These factors include, but are not limited to, constraints on the budgetary process, including changes in the policies and priorities of the U.S. federal government, deficit-reduction legislation, and any shutdown of the U.S. federal government. Furthermore, sales orders from the U.S. federal government tend to be dependent on many factors and therefore unpredictable in timing. Any sales we expect to make in a quarter may not be made in that quarter or at all, and our operating results for that quarter may therefore be adversely affected.
We are subject to various global data privacy and security regulations, which could result in additional costs and liabilities to us.
Our business is subject to a wide variety of local, state, national and international laws, directives and regulations that apply to the collection, use, retention, protection, disclosure, transfer and other processing of personal data. These data protection and privacy-related laws and regulations continue to evolve and may result in ever-increasing regulatory and public scrutiny and escalating levels of enforcement and sanctions and increased costs of compliance. In the United States, these include rules and regulations promulgated under the authority of the Federal Trade Commission, and state breach notification laws. If we experience a security incident with personal data issue, we may be required to inform the representative state attorney general or federal or country regulator, media and credit reporting agencies, and any customers whose information was stolen, which could harm our reputation and business. Other states and countries have enacted different requirements for protecting personal information collected and maintained electronically. We expect that there will continue to be new proposed laws, regulations and industry standards concerning privacy, data protection and information security in the United States, the European Union and other jurisdictions, and we cannot yet determine the impact such future laws, regulations and standards will have on our business or the businesses of our customers, including, but not limited to, the European Union’s recently enacted General Data Protection Regulation, which came into force in May 2018 and created a range of new compliance obligations, and significantly increased financial penalties for noncompliance.
Failure to comply with laws concerning privacy, data protection and information security could result in enforcement action against us, including fines, imprisonment of company officials and public censure, claims for damages by end customers and other affected individuals, damage to our reputation and loss of goodwill (both in relation to existing end customers and prospective end customers), any of which could have a material adverse effect on our operations, financial performance and business. In addition, we could suffer adverse publicity and loss of customer confidence were it known that we did not take adequate measures to assure the confidentiality of the personally identifiable information that our customers had given to us. This could result in a loss of customers and revenue that could jeopardize our success. We may not be successful in avoiding potential liability or disruption of business resulting from the failure to comply with these laws and, even if we comply with laws, may be subject to liability because of a security incident. If we were required to pay any significant amount of money in satisfaction of claims under these laws, or any similar laws enacted by other jurisdictions, or if we were forced to cease our business operations for any length of time as a result of our inability to comply fully with any of these laws, our business, operating results and financial condition
18
could be adversely affected. Further, complying with the applicable notice requirements in the event of a security breach could result in significant costs.
Additionally, our business efficiencies and economies of scale depend on generally uniform product offerings and uniform treatment of customers across all jurisdictions in which we operate. Compliance requirements that vary significantly from jurisdiction to jurisdiction impose added costs on our business and can increase liability for compliance deficiencies.
If we fail to develop and maintain our brands cost-effectively, our financial condition and operating results might suffer.
We believe that developing and maintaining awareness and integrity of our brands in a cost-effective manner are important to achieving widespread acceptance of our existing and future products and are important elements in attracting new customers. We believe that the importance of brand recognition will increase as we enter new markets and as competition in our existing markets further intensifies. Successful promotion of our brands will depend on the effectiveness of our marketing efforts and on our ability to provide reliable and useful products at competitive prices. We intend to increase our expenditures on brand promotion. Brand promotion activities may not yield increased revenue, and even if they do, the increased revenue may not offset the expenses we incur in building our brands. We rely on resellers and distributors to some extent in the distribution of our products. We have limited control over these third parties, and actions by these third parties could negatively impact our brand. We also rely on our customer base and community of end-users in a variety of ways, including to give us feedback on our products and to provide user-based support to our other customers through THWACK, our online community. If poor advice or misinformation regarding our products is spread among users of THWACK, it could adversely affect our reputation, our financial results and our ability to promote and maintain our brands. If we fail to promote and maintain our brands successfully, fail to maintain loyalty among our customers and our end-user community, or incur substantial expenses in an unsuccessful attempt to promote and maintain our brands, we may fail to attract new customers or retain our existing customers and our financial condition and results of operations could be harmed. Additionally, if our MSP customers do not use or ineffectively use our products to serve their end clients, our reputation and ability to grow our business may be harmed.
Adverse economic conditions may negatively affect our business.
Our business depends on the overall demand for information technology and on the economic health of our current and prospective customers. Any significant weakening of the economy in the United States, EMEA, APAC and of the global economy, more limited availability of credit, a reduction in business confidence and activity, decreased government spending, economic uncertainty, and other difficulties may affect one or more of the sectors or countries in which we sell our products. Global economic and political uncertainty may cause some of our customers or potential customers to curtail spending generally or IT management spending specifically, and may ultimately result in new regulatory and cost challenges to our international operations. In addition, a strong dollar could reduce demand for our products in countries with relatively weaker currencies. These adverse conditions could result in reductions in sales of our products, longer sales cycles, slower adoption of new technologies and increased price competition. Any of these events could have an adverse effect on our business, operating results and financial position.
Interruptions or performance problems associated with our internal infrastructure, and its reliance on technologies from third parties, may adversely affect our ability to manage our business and meet reporting obligations.
Currently, we use NetSuite to manage our order management and financial processes, salesforce.com to track our sales and marketing efforts and other third-party vendors to manage online marketing and web services. We believe the availability of these services is essential to the management of our high-volume, transaction-oriented business model. We also use third-party vendors to manage our equity compensation plans and certain aspects of our financial reporting processes. As we expand our operations, we expect to utilize additional systems and service providers that may also be essential to managing our business. Although the systems and services that we require are typically available from a number of providers, it is time-consuming and costly to qualify and implement these relationships. Therefore, if one or more of our providers suffer an interruption in their business, or experience delays, disruptions or quality-control problems in their operations, or we have to change or add additional systems and services, our ability to manage our business and produce timely and accurate financial statements would suffer.
Interruptions or performance problems associated with our products, including disruptions at any third-party data centers upon which we rely, may impair our ability to support our customers.
Our continued growth depends in part on the ability of our existing and potential customers to access our websites, software or cloud-based products within an acceptable amount of time. We have experienced, and may in the future experience, service disruptions, outages and other performance problems due to a variety of factors, including infrastructure changes, human or software errors, capacity constraints due to an overwhelming number of users accessing our website simultaneously and denial of service or fraud or security attacks. In some instances, we may not be able to identify the cause or causes of these website performance problems within an acceptable period of time. It may become increasingly difficult to maintain and improve our website performance, especially during peak usage times and as our user traffic increases. If our websites are unavailable or if our customers are unable to access our software or cloud-based products within a reasonable amount of time or at all, our business would be
19
negatively affected. Additionally, our data centers and networks and third-party data centers and networks may experience technical failures and downtime, may fail to distribute appropriate updates, or may fail to meet the increased requirements of a growing customer base.
We provide certain of our application performance management, MSP and ITSM products through third-party data center hosting facilities located in the United States and other countries. While we control and have access to our servers and all of the components of our network that are located in such third-party data centers, we do not control the operation of these facilities. Following expiration of the current agreement terms, the owners of the data center facilities have no obligation to renew their agreements with us on commercially reasonable terms, or at all. If we are unable to renew these agreements on commercially reasonable terms, or if one of our data center operators is acquired, we may be required to transfer our servers and other infrastructure to new data center facilities, and we may incur significant costs and possible service interruptions in connection with doing so.
If we fail to integrate our products with a variety of operating systems, software applications, platforms and hardware that are developed by others or ourselves, our products may become less competitive or obsolete and our results of operations would be harmed.
Our products must integrate with a variety of network, hardware and software platforms, and we need to continuously modify and enhance our products to adapt to changes in hardware, software, networking, browser and database technologies. We believe a significant component of our value proposition to customers is the ability to optimize and configure our products to integrate with our systems and those of third parties. If we are not able to integrate our products in a meaningful and efficient manner, demand for our products could decrease and our business and results of operations would be harmed.
In addition, we have a large number of products, and maintaining and integrating them effectively requires extensive resources. Our continuing efforts to make our products more interoperative may not be successful. Failure of our products to operate effectively with future infrastructure platforms and technologies could reduce the demand for our products, resulting in customer dissatisfaction and harm to our business. If we are unable to respond to changes in a cost-effective manner, our products may become less marketable, less competitive or obsolete and our business and results of operations may be harmed.
Material defects or errors in our products could harm our reputation, result in significant costs to us and impair our ability to sell our products.
Software products are inherently complex and often contain defects and errors when first introduced or when new versions are released. Any defects or errors in our products could result in:
• | lost or delayed market acceptance and sales of our products; |
• | a reduction in subscription or maintenance renewals; |
• | diversion of development resources; |
• | legal claims; and |
• | injury to our reputation and our brand. |
The costs incurred in correcting or remediating the impact of defects or errors in our products may be substantial and could adversely affect our operating results.
The success of our business depends on our ability to obtain, maintain, protect and enforce our intellectual property rights.
Our success depends, in part, on our ability to protect proprietary methods and technologies that we develop or license so that we can prevent others from using our inventions and proprietary information. If we fail to protect our intellectual property rights adequately, our competitors might gain access to our technology, and our business might be adversely affected. However, protecting and enforcing our intellectual property rights might entail significant expenses. Any of our intellectual property rights may be challenged by others, weakened or invalidated through administrative process or litigation. We rely primarily on a combination of patent, copyright, trademark, trade dress, unfair competition and trade secret laws, as well as confidentiality procedures and contractual restrictions, to establish and protect our proprietary rights. These laws, procedures and restrictions provide only limited protection.
As of December 31, 2019, we had approximately 33 issued U.S. patents and have also filed patent applications, but patents may not be issued with respect to these applications. The process of obtaining patent protection is expensive and time-consuming, and we may not be able to prosecute all necessary or desirable patent applications at a reasonable cost or in a timely manner. Even if issued, there can be no assurance that these patents, or our existing patents, will adequately protect our intellectual property, as the legal standards relating to the validity, enforceability and scope of protection of patent and other intellectual property rights are uncertain. Our patents and any future patents issued to us may be challenged, invalidated or circumvented, and may not provide sufficiently broad protection or may not prove to be enforceable in actions against alleged infringers. Any patents that are issued may subsequently be invalidated or otherwise limited, allowing other companies to develop offerings that compete with ours, which could adversely affect our competitive business position, business prospects and financial condition. In addition, issuance
20
of a patent does not guarantee that we have a right to practice the patented invention. Patent applications in the United States are typically not published until 18 months after filing or, in some cases, not at all, and publications of discoveries in industry-related literature lag behind actual discoveries. We cannot be certain that third parties do not have blocking patents that could be used to prevent us from marketing or practicing our patented software or technology.
We endeavor to enter into agreements with our employees and contractors and with parties with which we do business in order to limit access to and disclosure of our trade secrets and other proprietary information. We cannot be certain that the steps we have taken will prevent unauthorized use, misappropriation or reverse engineering of our technology. Moreover, others may independently develop technologies that are competitive to ours and may infringe our intellectual property. The enforcement of our intellectual property rights also depends on our legal actions against these infringers being successful, but these actions may not be successful, even when our rights have been infringed. Further, any litigation, whether or not resolved in our favor, could be costly and time-consuming.
Our exposure to risks related to the protection of intellectual property may be increased in the context of acquired technologies as we have a lower level of visibility into the development process and the actions taken to establish and protect proprietary rights in the acquired technology. In connection with past acquisitions, we have found that some associated intellectual property rights, such as domain names and trademarks in certain jurisdictions, are owned by resellers, distributors or other third parties. In the past, we have experienced difficulties in obtaining assignments of these associated intellectual property rights from third parties.
Furthermore, effective patent, trademark, trade dress, copyright and trade secret protection may not be available in every country in which our products are available. The laws of some foreign countries may not be as protective of intellectual property rights as those in the United States (in particular, some foreign jurisdictions do not permit patent protection for software), and mechanisms for enforcement of intellectual property rights may be inadequate. In addition, the legal standards, both in the United States and in foreign countries, relating to the validity, enforceability and scope of protection of intellectual property rights are uncertain and still evolving. Accordingly, despite our efforts, we may be unable to prevent third parties from infringing upon or misappropriating our intellectual property.
We might be required to spend significant resources to monitor and protect our intellectual property rights. We may initiate claims or litigation against third parties for infringement of our proprietary rights or to establish the validity of our proprietary rights. Litigation also puts our patents at risk of being invalidated or interpreted narrowly and our patent applications at risk of not issuing. Additionally, we may provoke third parties to assert counterclaims against us. We may not prevail in any lawsuits that we initiate, and the damages or other remedies awarded, if any, may not be commercially viable. Any litigation, whether or not resolved in our favor, could result in significant expense to us and divert the efforts of our technical and management personnel, which may adversely affect our business, results of operations, financial condition and cash flows.
Exposure related to any future litigation could adversely affect our results of operations, profitability and cash flows.
From time to time, we have been and may be involved in various legal proceedings and claims arising in our ordinary course of business. At this time, neither we nor any of our subsidiaries is a party to, and none of our respective property is the subject of, any material legal proceeding. However, the outcomes of legal proceedings and claims brought against us are subject to significant uncertainty. Future litigation may result in a diversion of management’s attention and resources, significant costs, including monetary damages and legal fees, and injunctive relief, and may contribute to current and future stock price volatility. No assurance can be made that future litigation will not result in material financial exposure or reputational harm, which could have a material adverse effect upon our results of operations, profitability or cash flows.
In particular, the software and technology industries are characterized by the existence of a large number of patents, copyrights, trademarks and trade secrets and by frequent litigation based on allegations of infringement or other violations of intellectual property rights. We have received, and from time to time may receive, letters claiming that our products infringe or may infringe the patents or other intellectual property rights of others. As we face increasing competition and as our brand awareness increases, the possibility of additional intellectual property rights claims against us grows. Our technologies may not be able to withstand any third-party claims or rights against their use. Additionally, we have licensed from other parties proprietary technology covered by patents and other intellectual property rights, and these patents or other intellectual property rights may be challenged, invalidated or circumvented. These types of claims could harm our relationships with our customers, might deter future customers from acquiring our products or could expose us to litigation with respect to these claims. Even if we are not a party to any litigation between a customer and a third party, an adverse outcome in that litigation could make it more difficult for us to defend our intellectual property in any subsequent litigation in which we are named as a party. Any of these results would have a negative effect on our business and operating results.
Any intellectual property rights claim against us or our customers, with or without merit, could be time-consuming and expensive to litigate or settle and could divert management resources and attention. As a result of any successful intellectual property rights claim against us or our customers, we might have to pay damages or stop using technology found to be in violation of a third party’s rights, which could prevent us from offering our products to our customers. We could also have to seek a license for the technology, which might not be available on reasonable terms, might significantly increase our cost of revenue or might
21
require us to restrict our business activities in one or more respects. The technology also might not be available for license to us at all. As a result, we could also be required to develop alternative non-infringing technology or cease to offer a particular product, which could require significant effort and expense and/or hurt our revenue and financial results of operations.
Our exposure to risks associated with the use of intellectual property may be increased as a result of our past and any future acquisitions as we have a lower level of visibility into the development process with respect to acquired technology or the care taken to safeguard against infringement risks. Third parties may make infringement and similar or related claims after we have acquired technology that had not been asserted prior to our acquisition.
Our use of open source software could negatively affect our ability to sell our products and subject us to possible litigation.
Some of our products incorporate open source software, and we intend to continue to use open source software in the future. Some terms of certain open source licenses to which we are subject have not been interpreted by U.S. or foreign courts, and there is a risk that open source software licenses could be construed in a manner that imposes unanticipated conditions or restrictions on our ability to monetize our products. Additionally, we may from time to time face claims from third parties claiming ownership of, or demanding release of, the open source software or derivative works that we developed using such software, which could include our proprietary source code, or otherwise seeking to enforce the terms of the applicable open source software license. These claims could result in litigation and could require us to make our software source code freely available, purchase a costly license to continue offering the software or cease offering the implicated services unless and until we can re-engineer them to avoid infringement or violation. This re-engineering process could require significant additional research and development resources, and we may not be willing to entertain the cost associated with updating the software or be able to complete it successfully. In addition to risks related to license requirements, use of certain open source software can lead to greater risks than use of third-party commercial software, as open source licensors generally do not provide warranties or controls on the origin of software and, thus, may contain security vulnerabilities or infringing or broken code. Additionally, if we utilize open source licenses that require us to contribute to open source projects, this software code is publicly available; and our ability to protect our intellectual property rights with respect to such software source code may be limited or lost entirely. We may be unable to prevent our competitors or others from using such contributed software source code. Any of these risks could be difficult to eliminate or manage, and if not addressed, could have a negative effect on our business, operating results and financial condition.
Our products use third-party software that may be difficult to replace or cause errors or failures of our products that could lead to a loss of customers or harm to our reputation and our operating results.
We license third-party software from various third parties for use in our products. In the future, this software may not be available to us on commercially reasonable terms, or at all. Any loss of the right to use any of the software could result in decreased functionality of our products until equivalent technology is either developed by us or, if available from another provider, is identified, obtained and integrated, which could harm our business. In addition, any errors or defects in or failures of the third-party software could result in errors or defects in our products or cause our products to fail, which could harm our business and be costly to correct. Many of these providers attempt to impose limitations on their liability for such errors, defects or failures, and if enforceable, we may have additional liability to our customers or third-party providers that could harm our reputation and increase our operating costs.
We have substantial indebtedness, which could adversely affect our financial health and our ability to obtain financing in the future, react to changes in our business and meet our obligations with respect to our indebtedness.
We entered into credit agreements in 2016 and 2018. Although we used a portion of the proceeds from our initial public offering to repay $315.0 million in borrowings outstanding, plus accrued interest, under our second lien term loan, as of December 31, 2019, our total indebtedness was $2.0 billion and we had $125.0 million available for additional borrowing under our credit facilities. Our net interest expense during the years ended December 31, 2019, 2018 and 2017 was approximately $108.1 million, $142.0 million and $169.8 million, respectively.
Our substantial indebtedness incurred under the credit agreements could have important consequences, including:
• | requiring us to dedicate a substantial portion of our cash flows from operations to payments on our indebtedness, thereby reducing the funds available for operations; |
• | increasing our vulnerability to adverse economic and industry conditions, which could place us at a competitive disadvantage compared to our competitors that have relatively less indebtedness; |
• | limiting our flexibility in planning for, or reacting to, changes in our business and the industries in which we operate; |
• | restricting us from making strategic acquisitions or causing us to make non-strategic divestitures; |
• | requiring us under certain circumstances to repatriate earnings from our international operations in order to make payments on our indebtedness, which could subject us to local country income and withholding taxes and/or state income taxes that are not currently accrued in our financial statements; |
22
• | requiring us to liquidate short-term or long-term investments in order to make payments on our indebtedness, which could generate losses; |
• | exposing us to the risk of increased interest rates as borrowings under the credit agreements are subject to variable rates of interest; and |
• | limiting our ability to borrow additional funds, or to dispose of assets to raise funds, if needed, for working capital, capital expenditures, acquisitions, product development and other corporate purposes. |
Despite our current indebtedness level, we and our restricted subsidiaries may be able to incur substantially more indebtedness, which could further exacerbate the risks associated with our substantial indebtedness.
Although the terms of the agreements governing our outstanding indebtedness contain restrictions on the incurrence of additional indebtedness, such restrictions are subject to a number of important exceptions and indebtedness incurred in compliance with such restrictions could be substantial. If we and our restricted subsidiaries incur significant additional indebtedness, the related risks that we face could increase. If new debt is added to our or our subsidiaries’ current debt levels, the related risks that we now face would increase, and we may not be able to meet all our debt obligations. See “Management’s Discussion and Analysis of Financial Condition and Results of Operations—Liquidity and Capital Resources.”
The agreements governing our indebtedness contain restrictions and limitations that may restrict our business and financing activities and expose us to risks that could adversely affect our liquidity and financial condition.
The credit agreements governing our credit facilities contain various covenants that are operative so long as our credit facilities remain outstanding. The covenants, among other things, limit our and certain of our subsidiaries’ abilities to:
• | incur additional indebtedness; |
• | incur liens; |
• | engage in mergers, consolidations, liquidations or dissolutions; |
• | pay dividends and distributions on, or redeem, repurchase or retire our capital stock; |
• | make investments, acquisitions, loans or advances; |
• | create negative pledges or restrictions on the payment of dividends or payment of other amounts owed from subsidiaries; |
• | sell, transfer or otherwise dispose of assets, including capital stock of subsidiaries; |
• | make prepayments of material debt that is subordinated with respect to right of payment; |
• | engage in certain transactions with affiliates; |
• | modify certain documents governing material debt that is subordinated with respect to right of payment; |
• | change our fiscal year; and |
• | change our lines of business. |
Our credit agreements also contain numerous affirmative covenants, including a financial covenant which requires that, at the end of each fiscal quarter, for so long as the aggregate principal amount of borrowings under our revolving credit facility exceeds 35% of the aggregate commitments under the revolving credit facility, our first lien net leverage ratio cannot exceed 7.40 to 1.00. A breach of this financial covenant will not result in a default or event of default under the term loan facility under our first lien credit agreement unless and until the lenders under our revolving credit facility have terminated the commitments under the revolving credit facility and declared the borrowings under the revolving credit facility due and payable.
Our ability to comply with the covenants and restrictions contained in the credit agreements governing our credit facilities may be affected by economic, financial and industry conditions beyond our control. The restrictions in the credit agreements governing our credit facilities may prevent us from taking actions that we believe would be in the best interests of our business and may make it difficult for us to execute our business strategy successfully or effectively compete with companies that are not similarly restricted. Even if any of our credit agreements are terminated, any additional debt that we incur in the future could subject us to similar or additional covenants.
The credit agreements include customary events of default, including, among others, failure to pay principal, interest or other amounts; material inaccuracy of representations and warranties; violation of covenants; specified cross-default and cross-acceleration to other material indebtedness; certain bankruptcy and insolvency events; certain ERISA events; certain undischarged judgments; material invalidity of guarantees or grant of security interest; and change of control. Any default that is not cured or waived could result in the termination of our credit agreements or an acceleration of the obligations under the credit agreements. Any such default would permit the applicable lenders to declare all amounts outstanding thereunder to be due and payable, together with accrued and unpaid interest. In addition, such a default or acceleration may result in the acceleration of any other debt to which a cross-acceleration or cross-default provision applies. If we are unable to repay our indebtedness, lenders having secured obligations, such as the lenders under our credit facilities, could proceed against the collateral securing the indebtedness. In any
23
such case, we may be unable to borrow under our credit facilities and may not be able to repay the amounts due under our credit facilities. This could have serious consequences to our financial condition and results of operations and could cause us to become bankrupt or insolvent.
Certain of our indebtedness may be denominated in foreign currencies, which subjects us to foreign exchange risk, which could cause our debt service obligations to increase significantly.
Our credit facilities include a senior secured revolving credit facility, which permits borrowings denominated in Euros and other alternative currencies that may be approved by the applicable lenders. See “Management’s Discussion and Analysis of Financial Condition and Results of Operations-Liquidity and Capital Resources.” Such non-U.S. dollar-denominated debt may not necessarily correspond to the cash flow we generate in such currencies. Sharp changes in the exchange rates between the currencies in which we borrow and the currencies in which we generate cash flow could adversely affect us. In the future, we may enter into contractual arrangements designed to hedge a portion of the foreign currency exchange risk associated with any non-U.S. dollar-denominated debt. If these hedging arrangements are unsuccessful, we may experience an adverse effect on our business and results of operations.
We are subject to fluctuations in interest rates.
Borrowings under our credit facilities are subject to variable rates of interest and expose us to interest rate risk. Borrowings outstanding under our various credit agreements currently bear interest at variable rates equal to applicable margins plus specified base rates or London Interbank Offered Rate, or LIBOR, with a 1% floor. LIBOR will likely be phased out as a benchmark interest rate by the end of 2021. The transition to a new reference rate will require broad acceptance by the financial markets. Currently, there is no agreed upon replacement rate; however, our credit agreement allows for our LIBOR tenor elections to be replaced at that time by the accepted market rate. The Company may also elect to convert our borrowings at a specified base rate.
At present, we do not have any existing interest rate swap agreements, which involve the exchange of floating for fixed rate interest payments to reduce interest rate volatility. However, we may decide to enter into such swaps in the future. If we do, we may not maintain interest rate swaps with respect to all of our variable rate indebtedness and any swaps we enter into may not fully mitigate our interest rate risk, may prove disadvantageous or may create additional risks.
See Quantitative and Qualitative Disclosures About Market Risk in Item 7A of Part II of this Annual Report on Form 10-K for additional information regarding our interest rate risk.
Failure to maintain proper and effective internal controls could have a material adverse effect on our business, operating results and stock price.
As a public company, we are required to maintain internal control over financial reporting and to report any material weaknesses in such internal controls. Section 404 of the Sarbanes-Oxley Act requires that we evaluate and determine the effectiveness of our internal control over financial reporting and, beginning with our second annual report following our initial public offering, provide a management report on internal control over financial reporting. Having transitioned out of emerging growth company in 2019, we also are required to include an attestation report on internal control over financial reporting issued by our independent registered public accounting firm.
Any failure to develop or maintain effective controls, or any difficulties encountered in their implementation or improvement, could harm our operating results, cause us to fail to meet our reporting obligations, result in a restatement of our financial statements for prior periods or adversely affect the results of management evaluations and independent registered public accounting firm audits of our internal control over financial reporting that we will eventually be required to include in our periodic reports that will be filed with the SEC. Ineffective disclosure controls and procedures and internal control over financial reporting could also cause investors to lose confidence in our reported financial and other information, which would likely have a negative effect on the trading price of our common stock.
If we are unable to assert that our internal control over financial reporting is effective, or when required in the future, if our independent registered public accounting firm is unable to express an opinion as to the effectiveness of our internal control over financial reporting, investors may lose confidence in the accuracy and completeness of our financial reports, the market price of our common stock could be adversely affected and we could become subject to investigations by the stock exchange on which our securities are listed, the SEC or other regulatory authorities, which could require additional financial and management resources.
Changes in financial accounting standards or practices may cause adverse, unexpected financial reporting fluctuations and affect our reported results of operations.
A change in accounting standards or practices can have a significant effect on our reported results and may even affect our reporting of transactions completed before the change is effective. New accounting pronouncements and varying interpretations of accounting pronouncements have occurred and may occur in the future. Changes to existing rules or the questioning of current practices may adversely affect our reported financial results or the way in which we conduct our business.
24
Our business and financial performance could be negatively impacted by other changes in tax laws or regulations.
New income, sales, use or other tax laws, statutes, rules, regulations or ordinances could be enacted at any time. Further, existing tax laws, statutes, rules, regulations or ordinances could be interpreted, changed, modified or applied adversely to us. Any changes to these existing tax laws could adversely affect our domestic and international business operations, and our business and financial performance. Additionally, these events could require us or our customers to pay additional tax amounts on a prospective or retroactive basis, as well as require us or our customers to pay fines and/or penalties and interest for past amounts deemed to be due. If we raise our product and maintenance prices to offset the costs of these changes, existing customers may elect not to renew their maintenance arrangements and potential customers may elect not to purchase our products. Additionally, new, changed, modified or newly interpreted or applied tax laws could increase our customers’ and our compliance, operating and other costs, as well as the costs of our products. Further, these events could decrease the capital we have available to operate our business. Any or all of these events could adversely impact our business and financial performance.
Additionally, the U.S. Tax Cuts and Jobs Act of 2017 (the “U.S. Tax Act”) which was enacted on December 22, 2017, requires complex computations to be performed, significant judgments to be made in the interpretation of the provisions of the U.S. Tax Act, significant estimates in calculations, and the preparation and analysis of information not previously relevant or regularly produced. The U.S. Treasury Department continues to interpret or issue guidance on how provisions of the U.S. Tax Act will be applied or otherwise administered. As additional guidance is issued, we may make adjustments to amounts that we have previously recorded that may materially impact our financial statements in the period in which the adjustments are made.
Additional liabilities related to taxes or potential tax adjustments could adversely impact our business and financial performance.
We are subject to tax and related obligations in various federal, state, local and foreign jurisdictions in which we operate or do business. The taxing rules of the various jurisdictions in which we operate or do business are often complex and subject to differing interpretations. Tax authorities could challenge our tax positions we historically have taken, or intend to take in the future, or may audit the tax filings we have made and assess additional taxes. Tax authorities may also assess taxes in jurisdictions where we have not made tax filings. Any assessments incurred could be material, and may also involve the imposition of substantial penalties and interest. Significant judgment is required in evaluating our tax positions and in establishing appropriate reserves, and the resolutions of our tax positions are unpredictable. The payment of additional taxes, penalties or interest resulting from any assessments could adversely impact our business and financial performance.
Our corporate structure and intercompany arrangements are subject to the tax laws of various jurisdictions, and we could be obligated to pay additional taxes, which would harm our operating results.
Based on our current corporate structure, we may be subject to taxation in several jurisdictions around the world with increasingly complex tax laws, the application of which can be uncertain. The amount of taxes we pay in these jurisdictions could increase substantially as a result of changes in the applicable tax rules, including increased tax rates, new tax laws or revised interpretations of existing tax laws and precedents. In addition, the authorities in these jurisdictions could challenge our methodologies for valuing developed technology or intercompany arrangements, including our transfer pricing. The relevant taxing authorities may determine that the manner in which we operate our business does not achieve the intended tax consequences. If such a disagreement were to occur, and our position were not sustained, we could be required to pay additional taxes, interest and penalties. Such authorities could claim that various withholding requirements apply to us or our subsidiaries or assert that benefits of tax treaties are not available to us or our subsidiaries. Any increase in the amount of taxes we pay or that are imposed on us could increase our worldwide effective tax rate and adversely affect our business and operating results.
We are subject to governmental export controls and economic sanctions laws that could impair our ability to compete in international markets and subject us to liability if we are not in full compliance with applicable laws.
Certain of our products are subject to U.S. export controls, including the U.S. Department of Commerce’s Export Administration Regulations and economic and trade sanctions regulations administered by the U.S. Treasury Department’s Office of Foreign Assets Control. These regulations may limit the export of our products and provision of our services outside of the United States, or may require export authorizations, including by license, a license exception or other appropriate government authorizations, including annual or semi-annual reporting and the filing of an encryption registration. Export control and economic sanctions laws may also include prohibitions on the sale or supply of certain of our products to embargoed or sanctioned countries, regions, governments, persons and entities. In addition, various countries regulate the importation of certain products, through import permitting and licensing requirements, and have enacted laws that could limit our ability to distribute our products. The exportation, re-exportation and importation of our products and the provision of services, including by our partners, must comply with these laws or else we may be adversely affected, through reputational harm, government investigations, penalties, and a denial or curtailment of our ability to export our products or provide services. Complying with export control and sanctions laws may be time consuming and may result in the delay or loss of sales opportunities. If we are found to be in violation of U.S. sanctions or export control laws, it could result in substantial fines and penalties for us and for the individuals working for us. Changes in export
25
or import laws or corresponding sanctions may delay the introduction and sale of our products in international markets, or, in some cases, prevent the export or import of our products to certain countries, regions, governments, persons or entities altogether, which could adversely affect our business, financial condition and results of operations.
We are also subject to various domestic and international anti-corruption laws, such as the U.S. Foreign Corrupt Practices Act and the U.K. Bribery Act, as well as other similar anti-bribery and anti-kickback laws and regulations. These laws and regulations generally prohibit companies and their employees and intermediaries from authorizing, offering or providing improper payments or benefits to officials and other recipients for improper purposes. Although we take precautions to prevent violations of these laws, our exposure for violating these laws increases as our international presence expands and as we increase sales and operations in foreign jurisdictions.
Government regulation of the Internet and e-commerce is evolving, and unfavorable changes or our failure to comply with regulations could harm our operating results.
As Internet commerce continues to evolve, increasing regulation by federal, state or foreign agencies becomes more likely. In addition to data privacy and security laws and regulations, taxation of products and services provided over the Internet or other charges imposed by government agencies or by private organizations for accessing the Internet may also be imposed. Any regulation imposing greater fees for Internet use or restricting information exchange over the Internet could result in a decline in the use of the Internet and the viability of Internet-based services and product offerings, which could harm our business and operating results.
Risks Related to Ownership of Our Common Stock
The requirements of being a public company, including compliance with the reporting requirements of the Exchange Act, the requirements of the Sarbanes-Oxley Act and the requirements of the NYSE, may strain our resources, increase our costs and distract management, and we may be unable to comply with these requirements in a timely or cost-effective manner.
As a public company, we are subject to laws, regulations and requirements, certain corporate governance provisions of the Sarbanes-Oxley Act, related regulations of the SEC and the requirements of the NYSE, with which we were not required to comply as a private company. As a newly public company, complying with these statutes, regulations and requirements occupies a significant amount of time of our board of directors and management and significantly increases our costs and expenses as compared to when we were a private company. For example, as a newly public company, we have had to institute a more comprehensive compliance function, comply with rules promulgated by the NYSE, prepare and distribute periodic public reports in compliance with our obligations under the federal securities laws, establish new internal policies, such as those relating to insider trading, and involve and retain to a greater degree outside counsel and accountants in the above activities. In addition, being a public company subject to these rules and regulations has made it more expensive for us to obtain director and officer liability insurance, and we may be required to accept reduced policy limits and coverage or incur substantially higher costs to obtain the same or similar coverage. As a result, it may be more difficult for us to attract and retain qualified individuals to serve on our board of directors or as executive officers as compared to when we were a private company.
Furthermore, because we have ceased to be an emerging growth company as of December 31, 2019, we are now required to have our independent registered public accounting firm attest to the effectiveness of our internal controls. Ensuring that we have adequate internal financial and accounting controls and procedures in place so that we can produce accurate financial statements on a timely basis is a costly and time-consuming effort that needs to be re-evaluated frequently, including if we acquire additional businesses and integrate their operations. Our internal control over financial reporting is a process designed to provide reasonable assurance regarding the reliability of financial reporting and preparation of financial statements in accordance with GAAP. We continue to evaluate opportunities to further strengthen the effectiveness and efficiency of our internal controls and procedures for compliance with Section 404 of the Sarbanes-Oxley Act. If we make additional acquisitions, we will need to similarly assess and ensure the adequacy of the internal financial and accounting controls and procedures of such acquisitions. If we fail to maintain proper and effective internal controls, including with respect to acquired businesses, our ability to produce accurate and timely financial statements could be impaired, which could harm our operating results, harm our ability to operate our business and reduce the trading price of our common stock.
The trading price of our common stock could be volatile, which could cause the value of your investment to decline.
Technology stocks have historically experienced high levels of volatility. The trading price of our common stock may fluctuate significantly. Since shares of our common stock were sold in our initial public offering in October 2018 at a price of $15.00 per share, our stock price has fluctuated significantly. Factors that could cause fluctuations in the trading price of our common stock include the following:
• | announcements of new products or technologies, commercial relationships, acquisitions or other events by us or our competitors; |
• | changes in how customers perceive the benefits of our products; |
26
• | shifts in the mix of revenue attributable to perpetual licenses and to subscriptions from quarter to quarter; |
• | departures of key personnel; |
• | price and volume fluctuations in the overall stock market from time to time; |
• | fluctuations in the trading volume of our shares or the size of our public float; |
• | sales of large blocks of our common stock, including sales by our Sponsors; |
• | actual or anticipated changes or fluctuations in our operating results; |
• | whether our operating results meet the expectations of securities analysts or investors; |
• | changes in actual or future expectations of investors or securities analysts; |
• | litigation involving us, our industry or both; |
• | regulatory developments in the United States, foreign countries or both; |
• | general economic conditions and trends; |
• | major catastrophic events in our domestic and foreign markets; and |
• | “flash crashes,” “freeze flashes” or other glitches that disrupt trading on the securities exchange on which we are listed. |
In addition, if the market for technology stocks or the stock market in general experiences a loss of investor confidence, the trading price of our common stock could decline for reasons unrelated to our business, operating results or financial condition. The trading price of our common stock might also decline in reaction to events that affect other companies in our industry even if these events do not directly affect us. In the past, following periods of volatility in the trading price of a company’s securities, securities class-action litigation has often been brought against that company. If our stock price is volatile, we may become the target of securities litigation. Securities litigation could result in substantial costs and divert our management’s attention and resources from our business. This could have an adverse effect on our business, operating results and financial condition.
If securities analysts or industry analysts were to downgrade our stock, publish negative research or reports or fail to publish reports about our business, our competitive position could suffer, and our stock price and trading volume could decline.
The trading market for our common stock, to some extent, depends on the research and reports that securities or industry analysts publish about us or our business. We do not have any control over these analysts. If our results fail to meet the expectations of one or more of the analysts who cover our stock, or if one or more of such analysts should downgrade our stock or publish negative research or reports, cease coverage of our company or fail to regularly publish reports about our business, our competitive position could suffer, and our stock price and trading volume could decline.
Sales of substantial amounts of our common stock in the public markets, or the perception that such sales could occur, could reduce the market price of our common stock.
Sales of a substantial number of shares of our common stock in the public market, or the perception that such sales could occur, could adversely affect the market price of our common stock. As of December 31, 2019, we had 311,306,535 shares of common stock outstanding.
In addition, as of December 31, 2019, there were 2,105,825 shares of common stock subject to outstanding options, 6,621,884 shares of common stock to be issued upon the vesting of outstanding restricted stock units and 1,004,026 shares of common stock to be issued upon the vesting of outstanding performance stock units. We have registered all of the shares of common stock issuable upon the exercise of outstanding options, upon the vesting of outstanding restricted stock units and performance stock units and upon exercise of settlement of any options or other equity incentives we may grant in the future, for public resale under the Securities Act. Accordingly, these shares may be freely sold in the public market upon issuance as permitted by any applicable vesting requirements, subject to compliance with applicable securities laws.
Furthermore, holders of approximately 260 million shares of our common stock have certain rights with respect to the registration of such shares (and any additional shares acquired by such holders in the future) under the Securities Act.
Our issuance of additional capital stock in connection with financings, acquisitions, investments, our stock incentive plans or otherwise will dilute all other stockholders.
We may issue additional capital stock in the future that will result in dilution to all other stockholders. We may also raise capital through equity financings in the future. As part of our business strategy, we may acquire or make investments in complementary companies, products or technologies and issue equity securities to pay for any such acquisition or investment. Any such issuances of additional capital stock may cause stockholders to experience significant dilution of their ownership interests and the per-share value of our common stock to decline.
27
We do not intend to pay dividends on our common stock.
We do not intend to pay dividends on our common stock. We intend to retain any earnings to finance the operation and expansion of our business, and we do not anticipate paying any cash dividends in the foreseeable future.
Our restated charter and restated bylaws contain anti-takeover provisions that could delay or discourage takeover attempts that stockholders may consider favorable.
Our restated charter and restated bylaws contain provisions that could delay or prevent a change in control of our company. These provisions could also make it difficult for stockholders to elect directors who are not nominated by the current members of our board of directors or take other corporate actions, including effecting changes in our management. These provisions include:
• | a classified board of directors with three-year staggered terms, which could delay the ability of stockholders to change the membership of a majority of our board of directors; |
• | after the Lead Sponsors cease to beneficially own, in the aggregate, at least 30% of the outstanding shares of our common stock, removal of directors only for cause; |
• | the ability of our board of directors to issue shares of preferred stock and to determine the price and other terms of those shares, including preferences and voting rights, without stockholder approval, which could be used to significantly dilute the ownership of a hostile acquirer; |
• | subject to the rights of the Sponsors under the stockholders’ agreement, allowing only our board of directors to fill vacancies on our board of directors, which prevents stockholders from being able to fill vacancies on our board of directors; |
• | after the Lead Sponsors cease to beneficially own, in the aggregate, at least 40% of the outstanding shares of our common stock, a prohibition on stockholder action by written consent, which forces stockholder action to be taken at an annual or special meeting of our stockholders; |
• | after the Lead Sponsors cease to beneficially own, in the aggregate, at least 40% of the outstanding shares of our common stock, our stockholders may not take action by written consent but may take action only at annual or special meetings of our stockholders. As a result, a holder controlling a majority of our capital stock would not be able to amend our bylaws or remove directors without holding a meeting of our stockholders called in accordance with our bylaws; |
• | after the Lead Sponsors cease to beneficially own, in the aggregate, at least 40% of the outstanding shares of our common stock, the requirement for the affirmative vote of holders of at least 66 2/3% of the voting power of all of the then-outstanding shares of the voting stock, voting together as a single class, to amend the provisions of our restated charter relating to the management of our business (including our classified board structure) or certain provisions of our bylaws, which may inhibit the ability of an acquirer to effect such amendments to facilitate an unsolicited takeover attempt; |
• | the ability of our board of directors to amend the bylaws, which may allow our board of directors to take additional actions to prevent an unsolicited takeover and inhibit the ability of an acquirer to amend the bylaws to facilitate an unsolicited takeover attempt; |
• | advance notice procedures with which stockholders must comply to nominate candidates to our board of directors or to propose matters to be acted upon at a stockholders’ meeting, which may discourage or deter a potential acquirer from conducting a solicitation of proxies to elect the acquirer’s own slate of directors or otherwise attempting to obtain control of us; and |
• | a prohibition of cumulative voting in the election of our board of directors, which would otherwise allow less than a majority of stockholders to elect director candidates. |
Our restated charter also contains a provision that provides us with protections similar to Section 203 of the Delaware General Corporation Law, or the DGCL, and prevents us from engaging in a business combination, such as a merger, with an interested stockholder (i.e., a person or group that acquires at least 15% of our voting stock) for a period of three years from the date such person became an interested stockholder, unless (with certain exceptions) the business combination or the transaction in which the person became an interested stockholder is approved in a prescribed manner. However, our restated charter also provides that the Sponsors, including the Silver Lake Funds and the Thoma Bravo Funds and any persons to whom any Silver Lake Fund or Thoma Bravo Fund or any of their respective affiliates sells its common stock, will not constitute “interested stockholders” for purposes of this provision.
The Lead Sponsors have a controlling influence over matters requiring stockholder approval, which could delay or prevent a change of control.
The Sponsors beneficially owned in the aggregate 83.6% of our common stock as of December 31, 2019. The Sponsors have entered into a stockholders’ agreement whereby they each agreed, among other things, to vote the shares each beneficially owns in favor of the director nominees designated by Silver Lake and Thoma Bravo, respectively. As a result, Silver Lake and Thoma
28
Bravo could exert significant influence over our operations and business strategy and would together have sufficient voting power to effectively control the outcome of matters requiring stockholder approval. These matters may include:
• | the composition of our board of directors, which has the authority to direct our business and to appoint and remove our officers; |
• | approving or rejecting a merger, consolidation or other business combination; |
• | raising future capital; and |
• | amending our restated charter and restated bylaws, which govern the rights attached to our common stock. |
Additionally, for so long as the Sponsors beneficially own, in the aggregate, 40% or more of our outstanding shares of common stock, the Sponsors will have the right to designate a majority of our board of directors. For so long as the Sponsors have the right to designate a majority of our board of directors, the directors designated by the Sponsors are expected to constitute a majority of each committee of our board of directors, other than the audit committee, and the chairman of each of the committees, other than the audit committee, is expected to be a director serving on such committee who is designated by the Sponsors. However, as soon as we are no longer a “controlled company” under the NYSE corporate governance standards, our committee membership will comply with all applicable requirements of those standards and a majority of our board of directors will be “independent directors,” as defined under the rules of the NYSE, subject to any phase-in provisions.
This concentration of ownership of our common stock could delay or prevent proxy contests, mergers, tender offers, open-market purchase programs or other purchases of our common stock that might otherwise give you the opportunity to realize a premium over the then-prevailing market price of our common stock. This concentration of ownership may also adversely affect our share price.
Certain of our directors have relationships with the Lead Sponsors, which may cause conflicts of interest with respect to our business.
Three of our ten directors are affiliated with Silver Lake and three are affiliated with Thoma Bravo. These directors have fiduciary duties to us and, in addition, have duties to the respective Sponsor and their affiliated funds, respectively. As a result, these directors may face real or apparent conflicts of interest with respect to matters affecting both us and the Sponsors, whose interests may be adverse to ours in some circumstances.
The Sponsors and their affiliated funds may pursue corporate opportunities independent of us that could present conflicts with our and our stockholders’ interests.
The Sponsors and their affiliated funds are in the business of making or advising on investments in companies and hold (and may from time to time in the future acquire) interests in or provide advice to businesses that directly or indirectly compete with certain portions of our business or are suppliers or customers of ours. The Sponsors and their affiliated funds may also pursue acquisitions that may be complementary to our business and, as a result, those acquisition opportunities may not be available to us.
Our restated charter provides that no officer or director of the Company who is also an officer, director, employee, partner, managing director, principal, independent contractor or other affiliate of either of the Sponsors will be liable to us or our stockholders for breach of any fiduciary duty by reason of the fact that any such individual pursues or acquires a corporate opportunity for its own account or the account of an affiliate, as applicable, instead of us, directs a corporate opportunity to any other person instead of us or does not communicate information regarding a corporate opportunity to us.
We may issue preferred stock whose terms could adversely affect the voting power or value of our common stock.
Our restated charter authorizes us to issue, without the approval of our stockholders, one or more classes or series of preferred stock having such designations, preferences, limitations and relative rights, including preferences over our common stock respecting dividends and distributions, as our board of directors may determine. The terms of one or more classes or series of preferred stock could adversely impact the voting power or value of our common stock. For example, we might grant holders of preferred stock the right to elect some number of our directors in all events or on the happening of specified events or the right to veto specified transactions. Similarly, the repurchase or redemption rights or liquidation preferences we might assign to holders of preferred stock could affect the residual value of our common stock.
Our restated charter designates the Court of Chancery of the State of Delaware as the sole and exclusive forum for certain types of actions and proceedings that may be initiated by our stockholders, which could limit our stockholders’ ability to obtain a favorable judicial forum for disputes with us or our directors, officers, employees or agents.
Our restated charter provides that, unless we consent in writing to the selection of an alternative forum, the Court of Chancery of the State of Delaware will, to the fullest extent permitted by applicable law, be the sole and exclusive forum for (i) any derivative action or proceeding brought on our behalf, (ii) any action asserting a claim of breach of a fiduciary duty owed by any of our
29
directors, officers, employees or agents to us or our stockholders, (iii) any action asserting a claim arising pursuant to any provision of the DGCL, our charter or bylaws, or (iv) any action asserting a claim against us that is governed by the internal affairs doctrine, in each such case subject to such Court of Chancery of the State of Delaware having personal jurisdiction over the indispensable parties named as defendants therein. Any person or entity purchasing or otherwise acquiring any interest in shares of our capital stock will be deemed to have notice of, and consented to, the provisions of our restated charter described in the preceding sentence. This choice-of-forum provision may limit a stockholder’s ability to bring a claim in a judicial forum that it finds favorable for disputes with us or our directors, officers, employees or agents, which may discourage such lawsuits against us and such persons. Alternatively, if a court were to find these provisions of our restated charter inapplicable to, or unenforceable in respect of, one or more of the specified types of actions or proceedings, we may incur additional costs associated with resolving such matters in other jurisdictions, which could adversely affect our business, financial condition or operating results.
We will be a controlled company within the meaning of the NYSE rules and, as a result, will qualify for and intend to rely on exemptions from certain corporate governance requirements.
The Sponsors beneficially own a majority of the combined voting power of all classes of our outstanding voting stock. As a result, we are a controlled company within the meaning of the NYSE corporate governance standards. Under the NYSE rules, a company of which more than 50% of the voting power is held by another person or group of persons acting together is a controlled company and may elect not to comply with certain NYSE corporate governance requirements, including the requirements that:
• | a majority of the board of directors consist of independent directors as defined under the rules of the NYSE; |
• | the nominating and governance committee be composed entirely of independent directors with a written charter addressing the committee’s purpose and responsibilities; and |
• | the compensation committee be composed entirely of independent directors with a written charter addressing the committee’s purpose and responsibilities. |
These requirements will not apply to us as long as we remain a controlled company. We have elected to take advantage of these exemptions. Accordingly, you may not have the same protections afforded to stockholders of companies that are subject to all of the corporate governance requirements of the NYSE.
ITEM 1B. UNRESOLVED STAFF COMMENTS
None.
ITEM 2. PROPERTIES
We lease our offices and do not own any real estate. Our corporate headquarters is located in Austin, Texas and currently consists of approximately 348,000 square feet. We also lease office space domestically and internationally in various locations for our operations, including facilities located in Cork, Ireland; Brno, Czech Republic; Durham, North Carolina; Manila, Philippines; Ottawa, Canada; Dundee, United Kingdom; Krakow, Poland; Lehi, Utah and Singapore.
We believe our current facilities will be adequate for the foreseeable future. If we require additional or substitute space, we believe that we will be able to obtain such space on acceptable, commercially reasonable terms.
ITEM 3. LEGAL PROCEEDINGS
From time to time, we have been and may be involved in various legal proceedings and claims arising in our ordinary course of business. At this time, neither we nor any of our subsidiaries is a party to, and none of our respective property is the subject of, any material legal proceeding. However, the outcome of legal proceedings and claims brought against us are subject to significant uncertainty. Therefore, if one or more of these legal matters were resolved against us in the same reporting period for amounts in excess of management’s expectations, our consolidated financial statements for a particular period could be materially adversely affected.
ITEM 4. MINE SAFETY DISCLOSURES
Not applicable.
30
PART II
ITEM 5. MARKET FOR REGISTRANT'S COMMON EQUITY, RELATED STOCKHOLDERS MATTERS AND ISSUER PURCHASES OF EQUITY SECURITIES
Market Information
Our common stock has been listed on the New York Stock Exchange, or NYSE, under the symbol "SWI" since October 19, 2018. Prior to that date, there was no public trading market for our common stock. Our initial public offering, or IPO, was priced at $15.00 per share on October 18, 2018.
On February 14, 2020, the last reported sales price of our common stock on the NYSE was $18.57 per share and, as of February 14, 2020 there were 102 holders of record of our common stock. Because many of our shares of common stock are held by brokers and other institutions on behalf of our stockholders, this number is not representative of the total number of stockholders represented by these stockholders of record.
Dividend Policy
We have never declared or paid any cash dividends on our common stock. Neither Delaware law nor our restated charter requires our board of directors to declare dividends on our common stock. We currently intend to retain all available funds and any future earnings for use in the operation of our business and do not expect to pay any dividends on our common stock in the foreseeable future. Any future determination to declare cash dividends on our common stock will be made at the discretion of our board of directors and will depend on a number of factors, including our financial condition, results of operations, capital requirements, contractual restrictions, general business conditions and other factors that our board of directors may deem relevant. In addition, our credit facilities place restrictions on our ability to pay cash dividends.
Performance Graph
The graph set forth below compares the cumulative total stockholder return on our common stock for the period between October 19, 2018 (the date of our IPO) and December 31, 2019, with the cumulative total return of (i) the Russell Midcap Index and (ii) the Nasdaq Computer Index, or the Industry Index. This graph assumes the investment of $100 at market close on October 19, 2018 in our common stock, the Russell Midcap Index and the Industry Index, and assumes the reinvestment of dividends, if any. The Industry Index consists of NASDAQ-listed computer hardware and software companies that provide products or services. Note that historic stock price performance is not necessarily indicative of future stock price performance.
The information contained in the Stock Performance Graph shall not be deemed to be soliciting material or to be filed with the SEC nor shall such information be incorporated by reference into any future filing under the Securities Act of 1933 or the Exchange Act, except to the extent we specifically incorporate it by reference into such filing.
31
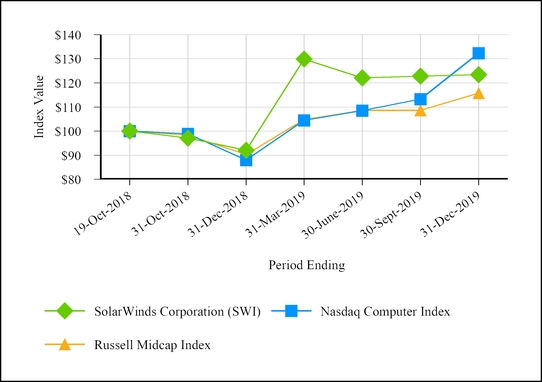
Issuer Purchases of Securities
During the fourth quarter of the fiscal year covered by this report, the Company repurchased shares of its common stock as follows.
Period | Number of Shares Purchased (1) | Average Price Paid Per Share | Total Number of Shares Purchased as Part of a Publicly Announced Plan or Program | Approximate Dollar Value of Shares That May Yet Be Purchased Under the Plan or Program (in thousands) | |||||||||
October 1-31, 2019 | — | $ | — | — | $ | — | |||||||
November 1-30, 2019 | 14,800 | 0.27 | — | — | |||||||||
December 1-31, 2019 | 42,500 | 1.56 | — | — | |||||||||
Total | 57,300 | — | |||||||||||
________________
(1) | All repurchases relate to employee held restricted stock that is subject to vesting. Unvested shares are subject to a right of repurchase by us in the event the employee stockholder ceases to be employed or engaged (as applicable) by us prior to vesting. All shares in the above table were shares repurchased as a result of us exercising this right and not pursuant to a publicly announced plan or program. |
32
ITEM 6. SELECTED CONSOLIDATED FINANCIAL DATA
The following selected consolidated financial data should be read in conjunction with the consolidated financial statements and related notes and “Management’s Discussion and Analysis of Financial Condition and Results of Operations” and other financial information included elsewhere in this Annual Report on Form 10-K. The following selected consolidated financial data is not intended to replace, and is qualified in its entirety by, the consolidated financial statements and related notes included elsewhere in this Annual Report on Form 10-K.
On February 5, 2016, we were acquired by the Sponsors in a take private transaction, or the Take Private. As a result of the Take Private, we applied purchase accounting on the date of the Take Private. We refer to the Company as Predecessor in the periods before the Take Private and Successor in the subsequent periods.
The selected consolidated statements of operations presented below from January 1, 2016 to February 4, 2016 relate to the Predecessor. The selected consolidated statements of operations presented below for the periods from February 5, 2016 to December 31, 2019 and the consolidated balance sheet data as of December 31, 2019, 2018, 2017 and 2016, relate to the Successor.
We have derived the following consolidated statement of operations for 2019, 2018 and 2017 and consolidated balance sheet data as of December 31, 2019 and 2018 from audited consolidated financial statements that are included in this Annual Report on Form 10-K. We have derived the following consolidated statement of operations for the Predecessor and Successor 2016 periods and consolidated balance sheet data as of December 31, 2017 and 2016 from audited consolidated financial statements included in our other SEC filings and not included in this Annual Report.
Although the period from January 1, 2016 to February 4, 2016 relates to the Predecessor and the period from February 5, 2016 to December 31, 2016 relates to the Successor, to assist with the period-to-period comparison we have combined these periods as a sum of the amounts without any other adjustments and refer to the combined period as the combined year ended December 31, 2016. This combination does not comply with GAAP or with the rules for pro forma presentation. Our historical results are not necessarily indicative of the results to be expected in any future period.
Adoption of the New Revenue Recognition Standard
Effective January 1, 2019, we adopted FASB Accounting Standards Codification, or ASC, No. 2014-09 “Revenue from Contracts with Customers,” or ASC 606, using the modified retrospective method. Results for reporting periods beginning after January 1, 2019 are presented in compliance with the new revenue recognition standard ASC 606. Historical financial results for reporting periods prior to 2019 are presented in conformity with amounts previously disclosed under the prior revenue recognition standard, ASC 605“Revenue Recognition,” or ASC 605.
Adoption of the New Lease Accounting Standard
Effective December 31, 2019, as we no longer qualify as an emerging growth company, we retroactively adopted the FASB ASC No. 2016-02 “Leases,” or ASC 842, as of January 1, 2019 using the optional transition method in which an entity can apply the new standard at the adoption date without adjusting comparative prior periods. Historical financial results for reporting periods prior to 2019 are presented in conformity with amounts previously disclosed under the prior lease accounting standard. The adoption of the new standard resulted in leases currently designated as operating leases being reported on our consolidated balance sheet at their net present value, which increased total assets and total liabilities.
See Note 2. Summary of Significant Accounting Policies in the Notes to Consolidated Financial Statements in Item 8 of Part II of this Annual Report on Form 10-K for a full description of implementation impacts of ASC 606 and ASC 842.
33
Consolidated Statement of Operations Data: | ||||||||||||||||||||||||
Successor | Combined(1) | Successor(1) | Predecessor | |||||||||||||||||||||
Year Ended December 31, | (Unaudited) Year Ended December 31, | Period From February 5 Through December 31, | Period From January 1 Through February 4, | |||||||||||||||||||||
2019 | 2018 | 2017 | 2016 | 2016 | 2016 | |||||||||||||||||||
(in thousands, except per share data) | ||||||||||||||||||||||||
Revenue: | ||||||||||||||||||||||||
Subscription | $ | 320,747 | $ | 265,591 | $ | 213,754 | $ | 133,511 | $ | 126,960 | $ | 6,551 | ||||||||||||
Maintenance | 446,450 | 402,938 | 357,630 | 174,734 | 145,234 | 29,500 | ||||||||||||||||||
Total recurring revenue | 767,197 | 668,529 | 571,384 | 308,245 | 272,194 | 36,051 | ||||||||||||||||||
License | 165,328 | 164,560 | 156,633 | 161,176 | 149,900 | 11,276 | ||||||||||||||||||
Total revenue | 932,525 | 833,089 | 728,017 | 469,421 | 422,094 | 47,327 | ||||||||||||||||||
Cost of revenue: | ||||||||||||||||||||||||
Cost of recurring revenue | 79,571 | 70,744 | 60,698 | 55,789 | 46,238 | 9,551 | ||||||||||||||||||
Amortization of acquired technologies | 175,883 | 175,991 | 171,033 | 149,703 | 147,517 | 2,186 | ||||||||||||||||||
Total cost of revenue | 255,454 | 246,735 | 231,731 | 205,492 | 193,755 | 11,737 | ||||||||||||||||||
Gross profit | 677,071 | 586,354 | 496,286 | 263,929 | 228,339 | 35,590 | ||||||||||||||||||
Operating expenses: | ||||||||||||||||||||||||
Sales and marketing | 264,199 | 227,468 | 205,631 | 212,419 | 165,355 | 47,064 | ||||||||||||||||||
Research and development | 110,362 | 96,272 | 86,618 | 97,989 | 65,806 | 32,183 | ||||||||||||||||||
General and administrative | 97,525 | 80,641 | 67,303 | 150,647 | 71,011 | 79,636 | ||||||||||||||||||
Amortization of acquired intangibles | 69,812 | 66,788 | 67,080 | 59,470 | 58,553 | 917 | ||||||||||||||||||
Total operating expenses | 541,898 | 471,169 | 426,632 | 520,525 | 360,725 | 159,800 | ||||||||||||||||||
Operating income (loss) | 135,173 | 115,185 | 69,654 | (256,596 | ) | (132,386 | ) | (124,210 | ) | |||||||||||||||
Other income (expense): | ||||||||||||||||||||||||
Interest expense, net | (108,071 | ) | (142,008 | ) | (169,786 | ) | (170,373 | ) | (169,900 | ) | (473 | ) | ||||||||||||
Other income (expense), net | 402 | (94,887 | ) | 38,664 | (57,243 | ) | (56,959 | ) | (284 | ) | ||||||||||||||
Total other income (expense) | (107,669 | ) | (236,895 | ) | (131,122 | ) | (227,616 | ) | (226,859 | ) | (757 | ) | ||||||||||||
Income (loss) before income taxes | 27,504 | (121,710 | ) | (61,468 | ) | (484,212 | ) | (359,245 | ) | (124,967 | ) | |||||||||||||
Income tax expense (benefit) | 8,862 | (19,644 | ) | 22,398 | (149,807 | ) | (96,651 | ) | (53,156 | ) | ||||||||||||||
Net income (loss) | $ | 18,642 | $ | (102,066 | ) | $ | (83,866 | ) | $ | (334,405 | ) | $ | (262,594 | ) | $ | (71,811 | ) | |||||||
Net income (loss) available to common stockholders | $ | 18,441 | $ | 364,635 | $ | (351,873 | ) | $ | (552,309 | ) | $ | (480,498 | ) | $ | (71,811 | ) | ||||||||
Net income (loss) available to common stockholders per share: | ||||||||||||||||||||||||
Basic earnings (loss) per share | $ | 0.06 | $ | 2.60 | $ | (3.50 | ) | $ | (4.98 | ) | $ | (1.00 | ) | |||||||||||
Diluted earnings (loss) per share | $ | 0.06 | $ | 2.56 | $ | (3.50 | ) | $ | (4.98 | ) | $ | (1.00 | ) | |||||||||||
Weighted-average shares used to compute net income (loss) available to common stockholders per share: | ||||||||||||||||||||||||
Shares used in computation of basic earnings (loss) per share | 306,768 | 140,301 | 100,433 | 96,465 | 71,989 | |||||||||||||||||||
Shares used in computation of diluted earnings (loss) per share | 311,168 | 142,541 | 100,433 | 96,465 | 71,989 | |||||||||||||||||||
34
Consolidated Balance Sheet Data: | |||||||||||||||
As of December 31, | |||||||||||||||
2019 | 2018 | 2017 | 2016 | ||||||||||||
(in thousands) | |||||||||||||||
Cash and cash equivalents | $ | 173,372 | $ | 382,620 | $ | 277,716 | $ | 101,643 | |||||||
Working capital, excluding deferred revenue | 209,113 | 402,639 | 302,012 | 158,637 | |||||||||||
Total assets | 5,310,742 | 5,194,649 | 5,327,064 | 5,202,689 | |||||||||||
Deferred revenue, current and non-current portion (2) | 343,400 | 296,132 | 261,791 | 217,722 | |||||||||||
Long-term debt, net of current portion | 1,893,406 | 1,904,072 | 2,245,622 | 2,242,892 | |||||||||||
Total liabilities | 2,661,220 | 2,578,549 | 2,909,938 | 2,842,828 | |||||||||||
Redeemable convertible Class A common stock (3) | — | — | 3,146,887 | 2,879,504 | |||||||||||
Total stockholders’ equity (deficit) (3) | 2,649,522 | 2,616,100 | (729,761 | ) | (519,643 | ) | |||||||||
(1) | The operating results of LOGICnow are included in our consolidated financial statements from the acquisition date of May 27, 2016 to December 31, 2016. |
(2) | At December 31, 2019, 2017 and 2016, deferred revenue reflects a write-down of $2.7 million, $3.0 million and $14.8 million, respectively, associated with purchase accounting adjustments. These cumulative purchase price adjustments did not have an impact on the December 31, 2018 deferred revenue balances. |
(3) | At the completion of our IPO in October 2018, we converted each outstanding share of our Class A common stock into 140,053,370 shares of common stock equal to the result of the liquidation value of such share of Class A common stock, divided by $19.00 per share. At the time of the conversion of the Class A common stock, we also converted $717.4 million of accrued and unpaid dividends on the Class A common stock into 37,758,109 shares of common stock equal to the result of the accrued and unpaid dividends on each share of Class A common stock, divided by $19.00 per share. See Note 10. Redeemable Convertible Class A Common Stock in the Notes to Consolidated Financial Statements included in Item 8 of Part II of this Annual Report on Form 10-K for additional information regarding the conversion of the Class A common stock. |
35
ITEM 7. MANAGEMENT'S DISCUSSION AND ANALYSIS OF FINANCIAL CONDITION AND RESULTS OF OPERATIONS
The following discussion and analysis of our financial condition and results of operations should be read in conjunction with the 'Selected Consolidated Financial Data' and our consolidated financial statements and related notes thereto included elsewhere in this report. In addition to historical consolidated financial information, the following discussion contains forward-looking statements that reflect our plans, estimates and beliefs. Our actual results could differ materially and adversely from those anticipated in the forward-looking statements. Please see the sections entitled “Special Note Regarding Forward-Looking Statements” and "Risk Factors" above for a discussion of the uncertainties, risks and assumptions associated with these statements.
Overview
SolarWinds is a leading provider of information technology, or IT, infrastructure management software. Our products give organizations worldwide, regardless of type, size or IT infrastructure complexity, the power to monitor and manage the performance of their IT environments, whether on-premise, in the cloud, or in hybrid models. We combine powerful, scalable, affordable, easy to use products with a high-velocity, low-touch sales model to grow our business while also generating significant cash flow.
We offer over 50 infrastructure-location agnostic products to monitor and manage network, systems, desktop, application, storage, database, website infrastructures and IT service desks. We intend to continue to innovate and invest in areas of product development that bring new products to market and enhance the functionality, ease of use and integration of our current products. We believe this will strengthen the overall value proposition of our products in any IT environment.
Financial Highlights
Our approach, which we call the “SolarWinds Model,” is based on our commitment to building a business that is focused on growth and profitability. Below are our key financial highlights for the year ended December 31, 2019 as compared to the year ended December 31, 2018.
Revenue
Our total revenue was $932.5 million and $833.1 million for the years ended December 31, 2019 and 2018, respectively. Our non-GAAP total revenue, which excludes the impact of purchase accounting, was $938.5 million and $836.8 million for the years ended December 31, 2019 and 2018, respectively. Recurring revenue, which consists of subscription and maintenance revenue, represented approximately 82% of our total revenue for the year ended December 31, 2019 compared to 80% for the year ended December 31, 2018. We have increased our recurring revenue as a result of the growth in our subscription sales and the continued growth of our maintenance revenue.
We use Subscription Annual Recurring Revenue, or Subscription ARR, and Total Annual Recurring Revenue, or Total ARR, to evaluate the results of our recurring revenue model. Subscription ARR represents the annualized recurring value of all active subscription contracts at the end of a reporting period. As of December 31, 2019, Subscription ARR was $370.3 million, up from $283.5 million as of December 31, 2018. Total ARR represents the sum of Subscription ARR and the annualized value of all maintenance contracts related to perpetual licenses active at the end of a reporting period. As of December 31, 2019, Total ARR was $845.1 million, up from $709.7 million as of December 31, 2018.
As of December 31, 2019, we had over 320,000 customers. The SolarWinds Model allows us to both sell to a broad group of potential customers and close large transactions with significant customers. We increased our customer base by over 25,000 new customers in 2019 organically and through acquisitions. While some customers may spend as little as $100 with us over a twelve-month period, we had 897 customers who had spent more than $100,000 with us for the year ended December 31, 2019.
We expect that the continued growth in the use of public and private clouds, increased outsourcing of IT management services to MSPs and cross-selling of subscription products into our existing customer base could result in an increase in our subscription revenue. We believe this increase, coupled with continued growth in maintenance revenue, could cause our recurring revenue to increase as a percentage of total revenue over time.
Our license revenue has declined as a percentage of total revenue primarily due to the higher growth of our recurring revenue and represented approximately 18% of our total revenue in 2019. We believe we have the potential to grow license revenue over time as we continue to invest in international sales growth, new product development and enhancements and increased productivity and efficiency of our sales and marketing operations.
Profitability
We have grown while maintaining high levels of operating efficiency. Our net income for the year ended December 31, 2019 was $18.6 million compared to a net loss of $102.1 million for the year ended December 31, 2018. Our Adjusted EBITDA was $453.6 million and $407.5 million for the years ended December 31, 2019 and 2018, respectively.
36
Cash Flow
We are building our business to generate strong cash flow over the long term. For the years ended December 31, 2019 and 2018, cash flows from operations were $299.9 million and $254.1 million, respectively. During those periods, our cash flows from operations were reduced by cash payments for interest on our long-term debt of $100.5 million and $142.9 million, respectively and cash payments for income taxes of $48.0 million and $9.0 million, respectively.
Acquisitions
Samanage
On April 30, 2019, we acquired SAManage Ltd., or Samanage, an IT service desk solution company, for approximately $342.1 million. By acquiring Samanage, we entered the IT service management, or ITSM, market and based on the acquired technology introduced the SaaS-based service desk solution, SolarWinds Service Desk, into our product portfolio.
VividCortex
On December 10, 2019, we acquired VividCortex, Inc., or VividCortex, a SaaS-based database performance management solution company, for approximately $117.6 million.
See Note 3. Acquisitions in the Notes to Consolidated Financial Statements included in Item 8 of Part II of this Annual Report on Form 10-K for additional discussion of our acquisitions.
Initial Public Offering and Follow-On Offering by Selling Stockholders
In October 2018, we completed our IPO, in which we sold and issued 25,000,000 shares of our common stock at an issue price of $15.00 per share. We raised a total of $375.0 million in gross proceeds from the offering, or approximately $353.0 million in net proceeds after deducting underwriting discounts and commissions of $17.8 million and offering-related expenses of approximately $4.2 million. A portion of the net proceeds from the offering were used to repay the $315.0 million in borrowings outstanding under our second lien term loan.
In May 2019, we completed a follow-on offering for 15,000,000 shares of our common stock sold by certain selling stockholders at an offering price of $18.00 per share. The selling stockholders received all of the proceeds from the offering. We continue to be a controlled company within the meaning of the NYSE corporate governance standards.
Components of Our Results of Operations
Revenue
Our revenue consists of recurring revenue and perpetual license revenue.
• | Recurring Revenue. The significant majority of our revenue is recurring and consists of subscription and maintenance revenue. |
▪ | Subscription Revenue. We primarily derive subscription revenue from fees received for subscriptions to our SaaS offerings, and to a lesser extent, our time-based license arrangements. Subscription revenue includes sales of our MSP, application performance management and ITSM products. We generally recognize revenue ratably over the subscription term once the service is made available to the customer or when we have the right to invoice for services performed. We generally invoice subscription agreements monthly based on usage or in advance over the subscription period on either a monthly or annual basis. Our subscription revenue grows as customers add new subscription products, upgrade the capacity level of their existing subscription products or increase the usage of their subscription products. Our revenue from MSP products increases with the addition of end customers served by our MSP customers, the proliferation of devices managed by those MSPs and the expansion of products used by those MSPs to manage end customers’ IT infrastructures. |
• | Maintenance Revenue. We derive maintenance revenue from the sale of maintenance services associated with our perpetual license products. Perpetual license customers pay for maintenance services based on the products they have purchased. We recognize maintenance revenue ratably on a daily basis over the contract period. Our maintenance revenue grows when we renew existing maintenance contracts and add new perpetual license customers, and as existing customers add new products. Customers typically renew their maintenance contracts at our standard list maintenance renewal pricing for their applicable products. We generally invoice maintenance contracts annually in advance. |
• | License Revenue. We derive license revenue from sales of perpetual licenses of our products to new and existing customers. We include one year of maintenance services as part of our customers’ initial license purchase. License revenue is |
37
recognized at a point in time upon delivery of the electronic license key. We allocate revenue to the license component based upon our estimated standalone selling prices, which is derived by evaluating our historical pricing and discounting practices in observable bundled transactions.
Cost of Revenue
• | Cost of Recurring Revenue. Cost of recurring revenue consists of technical support personnel costs, royalty fees, public cloud infrastructure and hosting fees and an allocation of overhead costs for our subscription revenue and maintenance services. Allocated costs consist of certain facilities, depreciation, benefits and IT costs allocated based on headcount. |
• | Amortization of Acquired Technologies. We amortize to cost of revenue the capitalized costs of technologies acquired in connection with the Take Private and our other acquisitions. |
Operating Expenses
Operating expenses consists of sales and marketing, research and development and general and administrative expenses as well as amortization of acquired intangibles. Personnel costs are the most significant component of operating expenses and consist of salaries, benefits, bonuses, sales commissions, stock-based compensation and an allocation of overhead costs based on headcount. The total number of employees as of December 31, 2019 was 3,251, as compared to 2,738 as of December 31, 2018. Our stock-based compensation expense has increased in periods subsequent to our initial public offering due to equity awards granted to our employees and directors.
• | Sales and Marketing. Sales and marketing expenses primarily consist of related personnel costs, including our sales, marketing and maintenance renewal and subscription retention teams. Sales and marketing expenses also includes the cost of digital marketing programs such as paid search, search engine optimization and management, website maintenance and design. We expect to continue to hire personnel globally to drive new sales and maintenance renewals. |
• | Research and Development. Research and development expenses primarily consist of related personnel costs. We expect to continue to grow our research and development organization, particularly internationally. |
• | General and Administrative. General and administrative expenses primarily consist of personnel costs for our executive, finance, legal, human resources and other administrative personnel, general restructuring charges and other acquisition-related costs, professional fees and other general corporate expenses. In the periods after the Take Private and prior to our initial public offering, these expenses also included management fees payable to our Sponsors, which were eliminated upon the completion of our initial public offering. |
• | Amortization of Acquired Intangibles. We amortize to operating expenses the capitalized costs of intangible assets acquired in connection with the Take Private and our other acquisitions. |
Other Income (Expense)
Other income (expense) primarily consists of interest expense, gains (losses) resulting from changes in exchange rates on foreign currency denominated intercompany loans and accounts, and losses on extinguishment of debt. We expect interest expense to decrease as we repay indebtedness.
We established a foreign currency denominated intercompany loan as part of the Take Private to provide a conduit to utilize foreign earnings effectively. The gains (losses) associated with the changes in exchange rates on amounts borrowed were unrealized non-cash events. As of July 1, 2018, this foreign currency denominated intercompany loan was designated as long-term due to a change in our investment strategy and the new Tax Act. Therefore, beginning on July 1, 2018, the foreign currency transaction gains and losses resulting from remeasurement are recognized as a component of accumulated other comprehensive income (loss). As of December 31, 2019, we determined that the intercompany loan will not be repaid and it was reclassified as a capital contribution.
Foreign Currency
As a global company, we face exposure to adverse movements in foreign currency exchange rates. Fluctuations in foreign currencies impact the amount of total assets, liabilities, revenue, operating expenses and cash flows that we report for our foreign subsidiaries upon the translation of these amounts into U.S. dollars. See “Item 7A: Quantitative and Qualitative Disclosures About Market Risk” for additional information on how foreign currency impacts our financial results.
Income Tax Expense
Income tax expense consists of domestic and foreign corporate income taxes related to the sale of products. The tax rate on income earned by our North American entities is higher than the tax rate on income earned by our international entities other than Canada and Sweden. We expect the income earned by our international entities to grow over time as a percentage of total income, which may result in a decline in our effective income tax rate. However, our effective tax rate will be affected by many other
38
factors including changes in tax laws, regulations or rates, new interpretations of existing laws or regulations, shifts in the allocation of income earned throughout the world and changes in overall levels of income before tax.
Comparison of the Years Ended December 31, 2019 and 2018
Revenue
Year Ended December 31, | |||||||||||||||||
2019 | 2018 | ||||||||||||||||
Amount | Percentage of Revenue | Amount | Percentage of Revenue | Change | |||||||||||||
(in thousands, except percentages) | |||||||||||||||||
Subscription | $ | 320,747 | 34.4 | % | $ | 265,591 | 31.9 | % | $ | 55,156 | |||||||
Maintenance | 446,450 | 47.9 | 402,938 | 48.4 | 43,512 | ||||||||||||
Total recurring revenue | 767,197 | 82.3 | 668,529 | 80.2 | 98,668 | ||||||||||||
License | 165,328 | 17.7 | 164,560 | 19.8 | 768 | ||||||||||||
Total revenue | $ | 932,525 | 100.0 | % | $ | 833,089 | 100.0 | % | $ | 99,436 | |||||||
In the first quarter of 2019, we adopted ASC 606 “Revenue from Contracts with Customers,” which replaced all existing revenue guidance under ASC 605 “Revenue Recognition,” including prescriptive industry-specific guidance. We adopted ASC 606 using the modified-retrospective method therefore, results for the year ended December 31, 2019 are presented in compliance with ASC 606 and historical financial results for reporting periods prior to 2019 are presented in conformity with amounts previously disclosed under ASC 605. The impact of the adoption of ASC 606 on our total revenue for the year ended December 31, 2019 was insignificant. See Note 2. Summary of Significant Accounting Policies in the Notes to Consolidated Financial Statements in Item 8 of Part II of this Annual Report on Form 10-K for a full description of implementation impact of ASC 606 including the presentation of financial results for the year ended December 31, 2019 under ASC 605 for comparison to the prior year period.
Total revenue increased $99.4 million, or 11.9%, for the year ended December 31, 2019 compared to the year ended December 31, 2018. Revenue from North America was approximately 66% and 65% of total revenue for the years ended December 31, 2019 and 2018, respectively. Other than the United States, no single country accounted for 10% or more of our total revenue during these periods. We expect our international total revenue to increase slightly as a percentage of total revenue as we expand our international sales and marketing efforts across our product lines.
Recurring Revenue
Subscription Revenue. Subscription revenue increased $55.2 million, or 20.8%, for the year ended December 31, 2019 compared to the year ended December 31, 2018, primarily due to sales of additional MSP products, with additional contribution from our acquired SolarWinds Service Desk product. These increases were partially offset by the effect of the weakening of most foreign currencies relative to the U.S. dollar. Our subscription revenue increased as a percentage of our total revenue for the year ended December 31, 2019 compared to the year ended December 31, 2018.
Our net retention rate for our subscription products was approximately 105% for each of the trailing twelve-month periods ended December 31, 2019 and 2018 and was driven primarily by strong customer retention in our MSP products. We define our net retention rate for subscription products as the implied monthly subscription revenue at the end of a period for the base set of customers from which we generated subscription revenue in the year prior to the calculation, divided by the implied monthly subscription revenue one year prior to the date of calculation for that same customer base.
Maintenance Revenue. Maintenance revenue increased $43.5 million, or 10.8%, for the year ended December 31, 2019 compared to the year ended December 31, 2018 primarily due to a growing maintenance renewal customer base from sales of our perpetual license products, strong maintenance renewal rates and to a lesser extent, a maintenance price increase.
Our maintenance renewal rate for our perpetual license products was approximately 94% and 95%, respectively, for the trailing twelve-month periods ended December 31, 2019 and 2018. We define our maintenance renewal rate as the sales of maintenance services for all existing maintenance contracts expiring in a period, divided by the sum previous sales of maintenance services corresponding to those services expiring in the current period. Sales of maintenance services includes sales of maintenance renewals for a previously purchased product and the amount allocated to maintenance revenue from a license purchase.
License Revenue
License revenue increased $0.8 million, or 0.5%, due to increased sales of our licensed products in our international locations, partially offset by the effect of the weakening of most foreign currencies relative to the U.S. dollar.
39
Cost of Revenue
Year Ended December 31, | |||||||||||||||||
2019 | 2018 | ||||||||||||||||
Amount | Percentage of Revenue | Amount | Percentage of Revenue | Change | |||||||||||||
(in thousands, except percentages) | |||||||||||||||||
Cost of recurring revenue | $ | 79,571 | 8.5 | % | $ | 70,744 | 8.5 | % | $ | 8,827 | |||||||
Amortization of acquired technologies | 175,883 | 18.9 | 175,991 | 21.1 | (108 | ) | |||||||||||
Total cost of revenue | $ | 255,454 | 27.4 | % | $ | 246,735 | 29.6 | % | $ | 8,719 | |||||||
Total cost of revenue increased in the year ended December 31, 2019 compared to the year ended December 31, 2018 primarily due to increases in personnel costs to support new customers and additional product offerings of $4.9 million, which includes a $1.5 million increase in stock-based compensation expense, public cloud infrastructure and hosting fees related to our subscription products of $1.6 million and depreciation and other amortization of $2.1 million. Amortization of acquired technologies includes $163.6 million and $165.6 million of amortization related to the Take Private for the years ended December 31, 2019 and 2018, respectively.
Operating Expenses
Year Ended December 31, | |||||||||||||||||
2019 | 2018 | ||||||||||||||||
Amount | Percentage of Revenue | Amount | Percentage of Revenue | Change | |||||||||||||
(in thousands, except percentages) | |||||||||||||||||
Sales and marketing | $ | 264,199 | 28.3 | % | $ | 227,468 | 27.3 | % | $ | 36,731 | |||||||
Research and development | 110,362 | 11.8 | 96,272 | 11.6 | 14,090 | ||||||||||||
General and administrative | 97,525 | 10.5 | 80,641 | 9.7 | 16,884 | ||||||||||||
Amortization of acquired intangibles | 69,812 | 7.5 | 66,788 | 8.0 | 3,024 | ||||||||||||
Total operating expenses | $ | 541,898 | 58.1 | % | $ | 471,169 | 56.6 | % | $ | 70,729 | |||||||
Sales and Marketing. Sales and marketing expenses increased $36.7 million, or 16.1%, primarily due to increases in personnel costs of $21.9 million, which includes an increase of $9.4 million in stock-based compensation expense and increases in marketing program costs of $12.5 million. We increased our sales and marketing employee headcount to support the sales of additional products and growth in the business and through the acquisition of Samanage. Sales and marketing expense for the year ended December 31, 2019 would have been approximately $5.3 million higher under ASC 605 due to the impact of the capitalization and amortization of commission expense under ASC 606. See Note 2. Summary of Significant Accounting Policies in the Notes to Consolidated Financial Statements in Item 8 of Part II of this Annual Report on Form 10-K for further discussion of the impact of the adoption of ASC 606.
Research and Development. Research and development expenses increased $14.1 million, or 14.6%, primarily due to an increase in personnel costs of $14.5 million, which includes an increase in stock-based compensation expense of $7.9 million, partially offset by a reduction in acquisition and Take Private related costs of $1.7 million. We increased our worldwide research and development employee headcount through the acquisition of Samanage and to expedite delivery of product enhancements and new product offerings to our customers.
General and Administrative. General and administrative expenses increased $16.9 million, or 20.9%, primarily due to a $15.0 million increase in personnel costs, which includes a $10.6 million increase in stock-based compensation expense, a $5.6 million increase in professional fees and other public company costs and a $4.8 million increase in acquisition and restructuring costs. These increases were partially offset by a decrease of $8.3 million related to management fees payable to our Sponsors that were eliminated upon the completion of our initial public offering in October 2018 and a $1.6 million decrease in offering costs.
Amortization of Acquired Intangibles. Amortization of acquired intangibles increased $3.0 million, or 4.5%, for the year ended December 31, 2019 compared to the year ended December 31, 2018 primarily due to amortization related to the Samanage acquisition. See Note 3. Acquisitions in the Notes to Consolidated Financial Statements in Item 8 of Part II of this Annual Report on Form 10-K for further discussion of our acquisitions including the intangible assets acquired. Amortization of intangible assets
40
includes $47.4 million and $48.2 million of amortization related to the Take Private for the years ended December 31, 2019 and 2018, respectively, with the remaining balance related primarily to the LOGICnow acquisition in May 2016.
Interest Expense, Net
Year Ended December 31, | |||||||||||||||||
2019 | 2018 | ||||||||||||||||
Amount | Percentage of Revenue | Amount | Percentage of Revenue | Change | |||||||||||||
(in thousands, except percentages) | |||||||||||||||||
Interest expense, net | $ | (108,071 | ) | (11.6 | )% | $ | (142,008 | ) | (17.0 | )% | $ | 33,937 | |||||
Interest expense, net decreased by $33.9 million, or 23.9%, in the year ended December 31, 2019 compared to the year ended December 31, 2018. The decrease in interest expense is primarily due to the repayment of $315.0 million in outstanding borrowings under our second lien term loan in October 2018 and the reduction in the interest rate spread under our credit facilities resulting from our IPO and the refinancing transaction we completed in March 2018. See Note 9. Debt in the Notes to Consolidated Financial Statements included in Item 8 of Part II of this Annual Report on Form 10-K for additional information regarding our debt.
Other Income (Expense), Net
Year Ended December 31, | |||||||||||||||||
2019 | 2018 | ||||||||||||||||
Amount | Percentage of Revenue | Amount | Percentage of Revenue | Change | |||||||||||||
(in thousands, except percentages) | |||||||||||||||||
Unrealized net transaction gains (losses) related to remeasurement of intercompany loans | $ | 301 | — | % | $ | (12,565 | ) | (1.5 | )% | $ | 12,866 | ||||||
Loss on extinguishment of debt | — | — | (80,137 | ) | (9.6 | ) | 80,137 | ||||||||||
Other income (expense) | 101 | — | (2,185 | ) | (0.3 | ) | 2,286 | ||||||||||
Total other income (expense), net | $ | 402 | — | % | $ | (94,887 | ) | (11.4 | )% | $ | 95,289 | ||||||
Other income (expense), net increased by $95.3 million in the year ended December 31, 2019 compared to the year ended December 31, 2018 primarily due to a loss of $80.1 million on extinguishment of debt related to the refinancing of our credit facilities in March 2018 and the impact of changes in foreign currency exchange rates related to various intercompany loans and accounts for the period.
Income Tax Expense (Benefit)
Year Ended December 31, | |||||||||||||||||
2019 | 2018 | ||||||||||||||||
Amount | Percentage of Revenue | Amount | Percentage of Revenue | Change | |||||||||||||
(in thousands, except percentages) | |||||||||||||||||
Income (loss) before income taxes | $ | 27,504 | 2.9 | % | $ | (121,710 | ) | (14.6 | )% | $ | 149,214 | ||||||
Income tax expense (benefit) | 8,862 | 1.0 | (19,644 | ) | (2.4 | ) | 28,506 | ||||||||||
Effective tax rate | 32.2 | % | 16.1 | % | 16.1 | % | |||||||||||
Our income tax expense for the year ended December 31, 2019 increased by $28.5 million as compared to the year ended December 31, 2018 primarily as a result of an increase in the income before income taxes for the period. The effective tax rate increased by 16.1% for the period primarily due to the impact of having a full valuation allowance against the deferred tax assets related to the current period losses from the recent Samanage acquisition, partially offset by the foreign-derived intangible income deduction. For additional discussion about our income taxes, see Note 15. Income Taxes in the Notes to Consolidated Financial Statements included in Item 8 of Part II of this Annual Report on Form 10-K.
41
Comparison of the Years Ended December 31, 2018 and 2017
For a comparison of our results of operations for the years ended December 31, 2018 and 2017, see “Part II, Item 7. Management's Discussion and Analysis of Financial Condition and Results of Operations” of our annual report on Form 10-K for the year ended December 31, 2018, filed with the SEC on February 25, 2019.
Non-GAAP Financial Measures
In addition to financial measures prepared in accordance with GAAP, we use certain non-GAAP financial measures to clarify and enhance our understanding, and aid in the period-to-period comparison, of our performance. We believe that these non-GAAP financial measures provide supplemental information that is meaningful when assessing our operating performance because they exclude the impact of certain amounts that our management and board of directors do not consider part of core operating results when assessing our operational performance, allocating resources, preparing annual budgets and determining compensation. Accordingly, these non-GAAP financial measures may provide insight to investors into the motivation and decision-making of management in operating the business. Investors are encouraged to review the reconciliation of each of these non-GAAP financial measures to its most comparable GAAP financial measure included below.
While we believe that these non-GAAP financial measures provide useful supplemental information, non-GAAP financial measures have limitations and should not be considered in isolation from, or as a substitute for, their most comparable GAAP measures. These non-GAAP financial measures are not prepared in accordance with GAAP, do not reflect a comprehensive system of accounting and may not be comparable to similarly titled measures of other companies due to potential differences in their financing and accounting methods, the book value of their assets, their capital structures, the method by which their assets were acquired and the manner in which they define non-GAAP measures. Items such as the amortization of intangible assets, stock-based compensation expense and related employer-paid payroll taxes, acquisition related adjustments and restructuring charges, as well as the related tax impacts of these items can have a material impact on our GAAP financial results.
Non-GAAP Revenue
We define non-GAAP subscription revenue, non-GAAP maintenance revenue, non-GAAP license revenue and non-GAAP total revenue, as subscription revenue, maintenance revenue, license revenue and total revenue, respectively, excluding the impact of purchase accounting from our Take Private transaction in early 2016 and acquisitions. We monitor these measures to assess our performance because we believe our revenue growth rates would be overstated without these adjustments. We believe presenting non-GAAP subscription revenue, non-GAAP maintenance revenue, non-GAAP license revenue and non-GAAP total revenue aids in the comparability between periods and in assessing our overall operating performance.
Year Ended December 31, | |||||||||||
2019 | 2018 | 2017 | |||||||||
(in thousands) | |||||||||||
Revenue: | |||||||||||
GAAP subscription revenue | $ | 320,747 | $ | 265,591 | $ | 213,754 | |||||
Impact of purchase accounting | 5,930 | 1,166 | 1,464 | ||||||||
Non-GAAP subscription revenue | 326,677 | 266,757 | 215,218 | ||||||||
GAAP maintenance revenue | 446,450 | 402,938 | 357,630 | ||||||||
Impact of purchase accounting | — | 2,550 | 11,514 | ||||||||
Non-GAAP maintenance revenue | 446,450 | 405,488 | 369,144 | ||||||||
GAAP total recurring revenue | 767,197 | 668,529 | 571,384 | ||||||||
Impact of purchase accounting | 5,930 | 3,716 | 12,978 | ||||||||
Non-GAAP total recurring revenue | 773,127 | 672,245 | 584,362 | ||||||||
GAAP license revenue | 165,328 | 164,560 | 156,633 | ||||||||
Impact of purchase accounting | — | — | 3 | ||||||||
Non-GAAP license revenue | 165,328 | 164,560 | 156,636 | ||||||||
Total GAAP revenue | $ | 932,525 | $ | 833,089 | $ | 728,017 | |||||
Impact of purchase accounting | $ | 5,930 | $ | 3,716 | $ | 12,981 | |||||
Total non-GAAP revenue | $ | 938,455 | $ | 836,805 | $ | 740,998 | |||||
42
Non-GAAP Operating Income and Non-GAAP Operating Margin
We provide non-GAAP operating income and related non-GAAP margin using non-GAAP revenue as discussed above and excluding such items as the write-down of deferred revenue related to purchase accounting, amortization of acquired intangible assets, stock-based compensation expense and related employer-paid payroll taxes, acquisition and Sponsor related costs and restructuring charges and other. Management believes these measures are useful for the following reasons:
• | Amortization of Acquired Intangible Assets. We provide non-GAAP information that excludes expenses related to purchased intangible assets associated with our acquisitions. We believe that eliminating this expense from our non-GAAP measures is useful to investors, because the amortization of acquired intangible assets can be inconsistent in amount and frequency and is significantly impacted by the timing and magnitude of our acquisition transactions, which also vary in frequency from period to period. Accordingly, we analyze the performance of our operations in each period without regard to such expenses. |
• | Stock-Based Compensation Expense and Related Employer-Paid Payroll Taxes. We provide non-GAAP information that excludes expenses related to stock-based compensation and related employer-paid payroll taxes. We believe that the exclusion of stock-based compensation expense provides for a better comparison of our operating results to prior periods and to our peer companies as the calculations of stock-based compensation vary from period to period and company to company due to different valuation methodologies, subjective assumptions and the variety of award types. Employer-paid payroll taxes on stock-based compensation is dependent on our stock price and the timing of the taxable events related to the equity awards, over which our management has little control, and does not correlate to the core operation of our business. Because of these unique characteristics of stock-based compensation and related employer-paid payroll taxes, management excludes these expenses when analyzing the organization’s business performance. |
• | Acquisition and Sponsor Related Costs. We exclude certain expense items resulting from the Take Private and other acquisitions, such as legal, accounting and advisory fees, changes in fair value of contingent consideration, costs related to integrating the acquired businesses, deferred compensation, severance and retention expense. We consider these adjustments, to some extent, to be unpredictable and dependent on a significant number of factors that are outside of our control. Furthermore, acquisitions result in operating expenses that would not otherwise have been incurred by us in the normal course of our organic business operations. We believe that providing these non-GAAP measures that exclude acquisition and Sponsor related costs, allows users of our financial statements to better review and understand the historical and current results of our continuing operations, and also facilitates comparisons to our historical results and results of less acquisitive peer companies, both with and without such adjustments. |
• | Restructuring Charges and Other. We provide non-GAAP information that excludes restructuring charges such as severance and the estimated costs of exiting and terminating facility lease commitments, as they relate to our corporate restructuring and exit activities and charges related to the separation of employment with executives of the Company. These charges are inconsistent in amount and are significantly impacted by the timing and nature of these events. Therefore, although we may incur these types of expenses in the future, we believe that eliminating these charges for purposes of calculating the non-GAAP financial measures facilitates a more meaningful evaluation of our operating performance and comparisons to our past operating performance. |
Year Ended December 31, | |||||||||||
2019 | 2018 | 2017 | |||||||||
(in thousands, except margin data) | |||||||||||
GAAP operating income | $ | 135,173 | $ | 115,185 | $ | 69,654 | |||||
Impact of purchase accounting | 5,930 | 3,716 | 12,981 | ||||||||
Stock-based compensation expense and related employer-paid payroll taxes | 35,270 | 5,833 | 80 | ||||||||
Amortization of acquired technologies | 175,883 | 175,991 | 171,033 | ||||||||
Amortization of acquired intangibles | 69,812 | 66,788 | 67,080 | ||||||||
Acquisition and Sponsor related costs | 8,544 | 20,401 | 23,580 | ||||||||
Restructuring costs and other | 5,598 | 2,999 | 2,858 | ||||||||
Non-GAAP operating income | $ | 436,210 | $ | 390,913 | $ | 347,266 | |||||
GAAP operating margin | 14.5 | % | 13.8 | % | 9.6 | % | |||||
Non-GAAP operating margin | 46.5 | % | 46.7 | % | 46.9 | % | |||||
43
Adjusted EBITDA and Adjusted EBITDA Margin
We regularly monitor adjusted EBITDA and adjusted EBITDA margin, as it is a measure we use to assess our operating performance. We define adjusted EBITDA as net income or loss, excluding the impact of purchase accounting on total revenue, amortization of acquired intangible assets and developed technology, depreciation expense, stock-based compensation expense and related employer-paid payroll taxes, restructuring and other charges, acquisition and Sponsor related costs, interest expense, net, debt extinguishment and refinancing costs, unrealized foreign currency (gains) losses, and income tax expense (benefit). We define adjusted EBITDA margin as adjusted EBITDA divided by non-GAAP revenue. Adjusted EBITDA has limitations as an analytical tool, and you should not consider it in isolation or as a substitute for analysis of our results as reported under GAAP. Some of these limitations are: although depreciation and amortization are non-cash charges, the assets being depreciated and amortized may have to be replaced in the future, and adjusted EBITDA does not reflect cash capital expenditure requirements for such replacements or for new capital expenditure requirements; adjusted EBITDA excludes the impact of the write-down of deferred revenue due to purchase accounting in connection with our acquisition, and therefore includes revenue that will never be recognized under GAAP; adjusted EBITDA does not reflect changes in, or cash requirements for, our working capital needs; adjusted EBITDA does not reflect the significant interest expense, or the cash requirements necessary to service interest or principal payments, on our debt; adjusted EBITDA does not reflect tax payments that may represent a reduction in cash available to us; and other companies, including companies in our industry, may calculate adjusted EBITDA differently, which reduces its usefulness as a comparative measure.
Because of these limitations, you should consider adjusted EBITDA alongside other financial performance measures, including net income (loss) and our other GAAP results. In evaluating adjusted EBITDA, you should be aware that in the future we may incur expenses that are the same as or similar to some of the adjustments in this presentation. Our presentation of adjusted EBITDA should not be construed as an inference that our future results will be unaffected by the types of items excluded from the calculation of adjusted EBITDA. Adjusted EBITDA is not a presentation made in accordance with GAAP and the use of the term varies from others in our industry.
Year Ended December 31, | |||||||||||
2019 | 2018 | 2017 | |||||||||
(in thousands, except margin data) | |||||||||||
Net income (loss) | $ | 18,642 | $ | (102,066 | ) | $ | (83,866 | ) | |||
Amortization and depreciation | 263,244 | 258,362 | 250,876 | ||||||||
Income tax expense (benefit) | 8,862 | (19,644 | ) | 22,398 | |||||||
Interest expense, net | 108,071 | 142,008 | 169,786 | ||||||||
Impact of purchase accounting on total revenue | 5,930 | 3,716 | 12,981 | ||||||||
Unrealized foreign currency (gains) losses(1) | (913 | ) | 14,367 | (56,368 | ) | ||||||
Acquisition and Sponsor related costs | 8,544 | 20,401 | 23,580 | ||||||||
Debt related costs(2) | 385 | 81,535 | 19,546 | ||||||||
Stock-based compensation expense and related employer-paid payroll taxes | 35,270 | 5,833 | 80 | ||||||||
Restructuring costs and other | 5,598 | 2,999 | 2,858 | ||||||||
Adjusted EBITDA | $ | 453,633 | $ | 407,511 | $ | 361,871 | |||||
Adjusted EBITDA margin | 48.3 | % | 48.7 | % | 48.8 | % | |||||
________________
(1) | Unrealized foreign currency (gains) losses primarily relate to the remeasurement of our intercompany loans and to a lesser extent, unrealized foreign currency (gains) losses on selected assets and liabilities. |
(2) | Debt related costs include fees related to our credit agreements, debt refinancing costs and the related write-off of debt issuance costs. See Note 9. Debt in the Notes to Consolidated Financial Statements in Item 8 of Part II of this Annual Report on Form 10-K for additional information regarding our debt. |
Liquidity and Capital Resources
Cash and cash equivalents were $173.4 million as of December 31, 2019. Our international subsidiaries held approximately $134.6 million of cash and cash equivalents, of which 71.9% were held in Euros. We intend either to invest our foreign earnings permanently in foreign operations or to remit these earnings to our U.S. entities in a tax-free manner with the exception for immaterial state income taxes. The Tax Act imposed a mandatory transition tax on accumulated foreign earnings and eliminates U.S. federal income taxes on foreign subsidiary distribution.
Our primary source of cash for funding operations and growth has been through cash provided by operating activities. We believe that our existing cash and cash equivalents, our cash flows from operating activities and our borrowing capacity under our credit facilities will be sufficient to fund our operations, fund required debt repayments and meet our commitments for capital expenditures for at least the next 12 months.
44
In October 2018, we completed our IPO, in which we sold and issued 25,000,000 shares of our common stock at an issue price of $15.00 per share. We raised a total of $375.0 million in gross proceeds from the offering, or approximately $353.0 million in net proceeds. A portion of the net proceeds from the offering were used to repay the $315.0 million in borrowings outstanding under our second lien term loan.
Although we are not currently a party to any material definitive agreement regarding potential investments in, or acquisitions of, complementary businesses, applications or technologies, we may enter into these types of arrangements, which could reduce our cash and cash equivalents, require us to seek additional equity or debt financing or repatriate cash generated by our international operations that could cause us to incur withholding taxes on any distributions. Additional funds from financing arrangements may not be available on terms favorable to us or at all.
Indebtedness
As of December 31, 2019, our total indebtedness was $2.0 billion, with up to $125.0 million of available borrowings under our revolving credit facility. See Note 9. Debt in the Notes to Consolidated Financial Statements included in Item 8 of Part II of this Annual Report on Form 10-K for additional information regarding our debt.
First Lien Credit Agreement
On March 15, 2018, or the Refinancing Date, we entered into Amendment No. 4 to First Lien Credit Agreement, originally dated as of February 5, 2016.
The First Lien Credit Agreement, as amended, provides for a senior secured revolving credit facility in an aggregate principal amount of $125.0 million, or the Revolving Credit Facility, consisting of a $25.0 million U.S. dollar revolving credit facility, or the U.S. Dollar Revolver, and a $100.0 million multicurrency revolving credit facility, or the Multicurrency Revolver. The Revolving Credit Facility includes a $35.0 million sublimit for the issuance of letters of credit. The First Lien Credit Agreement also contains a term loan facility (which we refer to as the First Lien Term Loan, and together with the Revolving Credit Facility, as the First Lien Credit Facilities) in an original aggregate principal amount of $1,990.0 million.
The First Lien Credit Agreement provides us the right to request additional commitments for new incremental term loans and revolving loans, in an aggregate principal amount not to exceed (a) the greater of (i) $400.0 million and (ii) 100% of our consolidated EBITDA, as defined in the First Lien Credit Agreement (calculated on a pro forma basis), for the most recent four fiscal quarter period, or the First Lien Fixed Basket, plus (b) the amount of certain voluntary prepayments of the First Lien Credit Facilities, plus (c) an unlimited amount subject to pro forma compliance with a first lien net leverage ratio not to exceed 4.75 to 1.00.
Under the U.S. Dollar Revolver, $7.5 million of commitments will mature on February 5, 2021, and $17.5 million along with all commitments under the Multicurrency Revolver will mature on February 5, 2022. The First Lien Term Loan will mature on February 5, 2024.
The First Lien Term Loan requires equal quarterly repayments equal to 0.25% of the original principal amount.
Second Lien Credit Facility
On the Refinancing Date, we entered into the Second Lien Credit Agreement with Wilmington Trust, National Association, or Wilmington Trust, as administrative agent and collateral agent, and the other parties thereto. The Second Lien Credit Agreement provided for a term loan facility, or the Second Lien Credit Facility, in an original aggregate principal amount of $315.0 million.
In October 2018, we completed our IPO and used a portion of our net proceeds from the offering to repay the outstanding borrowings and accrued interest under our Second Lien Credit Facility.
Summary of Cash Flows
Summarized cash flow information is as follows:
Year Ended December 31, | |||||||
2019 | 2018 | ||||||
(in thousands) | |||||||
Net cash provided by operating activities | $ | 299,907 | $ | 254,142 | |||
Net cash used in investing activities | (482,453 | ) | (67,993 | ) | |||
Net cash used in financing activities | (25,624 | ) | (75,724 | ) | |||
Effect of exchange rate changes on cash and cash equivalents | (1,078 | ) | (5,521 | ) | |||
Net increase (decrease) in cash and cash equivalents | (209,248 | ) | 104,904 | ||||
45
Operating Activities
Our primary source of cash from operating activities is cash collections from our customers. We expect cash inflows from operating activities to be affected by the timing of our sales. Our primary uses of cash from operating activities are for personnel-related expenditures, and other general operating expenses, as well as payments related to taxes, interest and facilities.
For 2019 compared to 2018, the increase in cash provided by operating activities was primarily due to an increase in net income adjusted for the net effect of non-cash items. The net cash inflow resulting from the changes in our operating assets and liabilities was $12.9 million for 2019 as compared to $3.0 million in 2018 and was primarily due to the timing of sales and cash payments and receipts. Cash flow from operations for the year ended December 31, 2019 was reduced by $48.0 million of cash paid for taxes which includes an $8.8 million cash payment related to the transition tax as a result of the Tax Act. Cash flow from operations for the year ended December 31, 2018 included losses on extinguishment of debt of $80.1 million and a reduction in accrued interest payable related to our March 2018 debt refinancing and October 2018 repayment of our Second Lien Credit Facility.
Investing Activities
Investing cash flows consist primarily of cash used for acquisitions, capital expenditures and intangible assets. Our capital expenditures primarily relate to purchases of leasehold improvements, computers, servers and equipment to support our domestic and international office locations. Purchases of intangible assets consist primarily of capitalized research and development costs.
Net cash used in investing activities increased in 2019 compared to 2018 due to an increase in cash used for acquisitions and a reduction in cash proceeds related to the sale of a cost-method investment and other. In 2019, we completed acquisitions for a combined purchase price of approximately $462.4 million, net of cash acquired. See Note 3. Acquisitions in the Notes to Consolidated Financial Statements included in Item 8 of Part II of this Annual Report on Form 10-K for additional information regarding our acquisitions.
Financing Activities
Excluding the proceeds from our IPO in 2018, financing cash flows consist primarily of issuance and repayments associated with our long-term debt, fees related to refinancing our long-term debt, proceeds from the issuance of shares of common stock through equity incentive plans and the repurchase of common stock.
Net cash used in financing activities decreased in 2019 compared to 2018 primarily due to activity in 2018 related to deemed gross repayments and borrowings made in connection with the refinancing of our debt agreements in March 2018 and the repayment of our Second Lien Credit Facility, offset by proceeds from the issuance of common stock from our IPO. Net cash used in financing activities in 2019 includes the proceeds and repayment of $35.0 million in borrowings under our Revolving Credit Facility and $19.9 million in quarterly principal payments under our First Lien Credit Agreement. In addition, we withheld and retired shares of common stock to satisfy $7.3 million of statutory withholding tax requirements that we pay in cash to the appropriate taxing authorities on behalf of our employees related to the settlement of restricted stock units during the period. These shares are treated as common stock repurchases in our consolidated financial statements.
Contractual Obligations and Commitments
The following table summarizes our outstanding contractual obligations as of December 31, 2019 that require us to make future cash payments:
Payments Due by Period | |||||||||||||||||||
Total | Less than 1 year | 1-3 years | 3-5 years | More than 5 years | |||||||||||||||
(in thousands) | |||||||||||||||||||
Long-term debt obligations(1) | $ | 1,950,200 | $ | 19,900 | $ | 39,800 | $ | 1,890,500 | $ | — | |||||||||
Cash interest expense(1) | 361,207 | 89,854 | 176,462 | 94,891 | — | ||||||||||||||
Operating leases(2) | 130,069 | 17,489 | 33,774 | 30,154 | 48,652 | ||||||||||||||
Purchase obligations(3) | 77,145 | 74,070 | 3,075 | — | — | ||||||||||||||
Transition tax payable(4) | 95,699 | 8,893 | 17,785 | 35,415 | 33,606 | ||||||||||||||
Total(5) | $ | 2,614,320 | $ | 210,206 | $ | 270,896 | $ | 2,050,960 | $ | 82,258 | |||||||||
________________
(1) | Represents principal maturities of our Senior Secured First Lien Credit Facility in effect at December 31, 2019. The estimated cash interest expense is based upon an interest rate of 4.55%. |
(2) | Represents maturities of operating lease liabilities, see Note 7. Leases in the Notes to Consolidated Financial Statements included in Item 8 of Part II of this Annual Report on Form 10-K for additional details. As of December 31, 2019, we had various lease agreements in which the lease did not commence prior |
46
to year-end and therefore the lease liabilities had not been recorded in our consolidated balance sheet. The future minimum lease payments under these leases is approximately $52.0 million over lease terms of two to eleven years.
(3) | Purchase obligations primarily represent outstanding purchase orders for purchases of software license and support fees, marketing activities, public cloud infrastructure and hosting fees, corporate health insurance costs, accounting, legal and contractor fees and computer hardware and software costs. |
(4) | Represents the provisional one–time transition tax as a result of the Tax Act which we have elected to pay over eight years. See Note 15. Income Taxes in the Notes to Consolidated Financial Statements included in Item 8 of Part II of this Annual Report on Form 10-K for additional details. |
(5) | Other long-term obligations on our balance sheet at December 31, 2019 included non-current income tax liabilities of $31.1 million, which are primarily related to unrecognized tax benefits. We have not included this amount in the table above because we cannot reasonably estimate the period during which this obligation may be incurred, if at all. |
Critical Accounting Policies and Estimates
Our consolidated financial statements are prepared in conformity with GAAP and require our management to make estimates and assumptions that affect the reported amounts of assets, liabilities, revenue, costs and expenses and related disclosures. We base our estimates on historical experience and on various other assumptions that we believe to be reasonable under the circumstances. Actual results may differ from these estimates, and such estimates may change if the underlying conditions or assumptions change. To the extent that there are differences between our estimates and actual results, our future financial statement presentation, financial condition, results of operations and cash flows will be affected, perhaps materially.
In many cases, the accounting treatment of a particular transaction is specifically dictated by GAAP and does not require management’s judgment in its application, while in other cases, management’s judgment is required in selecting among available alternative accounting standards that allow different accounting treatment for similar transactions. We believe that these accounting policies requiring significant management judgment and estimates are critical to understanding our historical and future performance, as these policies relate to the more significant areas of our financial results. These critical accounting policies are:
• | the valuation of goodwill, intangibles, long-lived assets and contingent consideration; |
• | revenue recognition; |
• | stock-based compensation; and |
• | income taxes. |
Acquisitions
The purchase price of our acquired businesses is allocated to the assets acquired and the liabilities assumed based on their estimated fair values, with the excess recorded as goodwill. The fair value of identifiable intangible assets is based on significant judgments made by management. We typically engage third-party valuation appraisal firms to assist us in determining the fair values and useful lives of the assets acquired. The valuation estimates and assumptions are based on historical experience and information obtained from management, and also include, but are not limited to, future expected cash flows earned from the intangible asset and discount rates applied in determining the present value of those cash flows. Unanticipated events and circumstances may occur that could affect the accuracy or validity of such assumptions, estimates or actual results.
Goodwill
An impairment of goodwill is recognized when the carrying amount of the assets exceeds their fair value. The process of evaluating the potential impairment is highly subjective and requires the application of significant judgment. For purposes of the annual impairment test, we assess qualitative factors to determine if it is more likely than not that goodwill might be impaired and whether it is necessary to perform the quantitative impairment test which considers the fair value of the reporting unit compared with the carrying value on the date of the test. If an event occurs that would cause us to revise our estimates and assumptions used in analyzing the value of our goodwill, the revision could result in a non-cash impairment charge that could have a material impact on our financial results. In the fourth quarter of 2019 and 2018, we performed our annual review of goodwill and concluded that no impairment existed for our reporting units during any of the periods presented. No impairment charges have been required to date.
Identifiable Intangible Assets
We evaluate long-lived assets, including finite-lived intangible assets and other assets, for impairment whenever events or changes in circumstances indicate that the carrying amount of the assets may not be recoverable. Events or changes in circumstances that could result in an impairment review include, but are not limited to, significant underperformance relative to historical or projected future operating results, significant changes in the manner of use of the acquired assets or the strategy for our overall business, and significant negative industry or economic trends. If an event occurs that would cause us to revise our estimates and assumptions used in analyzing the value of our property and equipment or our finite-lived intangibles and other assets, that revision could result in a non-cash impairment charge that could have a material impact on our financial results.
47
Revenue Recognition
We generate revenue from fees received for subscriptions, the sale of maintenance services associated with our perpetual license products and the sale of perpetual license products. We recognize revenue related to contracts from customers when we transfer promised goods or services to customers in an amount that reflects the consideration to which the entity expects to be entitled in exchange for those goods or services. This is determined by following a five-step process which includes (1) identifying the contract with a customer, (2) identifying the performance obligations in the contract, (3) determining the transaction price, (4) allocating the transaction price and (5) recognizing revenue when or as we satisfy a performance obligation.
We identify performance obligations in a contract based on the goods and services that will be transferred to the customer that are identifiable from other promises in the contract, or distinct. If not considered distinct, the promised goods or services are combined with other goods or services and accounted for as a combined performance obligation. Determining the distinct performance obligations in a contract requires judgment. Our performance obligations primarily include perpetual and time-based licenses, maintenance support including unspecified upgrades or enhancements to new versions of our software products and SaaS offerings.
We allocate the transaction price of the contract to each distinct performance obligation based on a relative standalone selling price basis. Determining standalone selling prices for our performance obligations requires judgment and are based on multiple factors including, but not limited to historical selling prices and discounting practices for products and services, internal pricing policies and pricing practices in different regions and through different sales channels. For our subscription products and maintenance services, our standalone selling prices are generally observable using standalone sales or renewals. For our perpetual and time-based license products, given there are no observable standalone sales, we estimate our standalone selling prices by evaluating our historical pricing and discounting practices in observable bundled transactions. We review the standalone selling price for our performance obligations periodically and update, if needed, to ensure that the methodology utilized reflects our current pricing practices.
Stock-Based Compensation
We have granted our employees, directors and certain contractors stock-based incentive awards. Our stock awards vest on service-based or performance-based vesting conditions. These awards are in the form of stock options, restricted stock and restricted stock units. We measure stock-based compensation expense for all share-based awards granted based on the estimated fair value of those awards on the date of grant. The fair values of stock option awards are estimated using a Black-Scholes valuation model. The fair value of restricted stock unit awards and restricted stock is determined using the fair market value of our common stock on the date of grant less any amount paid at the time of the grant, or intrinsic value.
We use various assumptions that can be subjective in estimating the fair value of options at the date of grant using the Black-Scholes option model including expected dividend yield, volatility, risk-free rate of return and expected life. In addition, we estimate the probability of the performance-based awards vesting upon the achievement of the specified performance targets at each reporting period. Based on the extent to which the performance targets are achieved, vested shares may range from 0% to 150% of the target award amount. Changes in the probability estimates associated with performance-based awards are accounted for in the period of change using a cumulative expense adjustment to apply the new probability estimate. In any period in which we determine the achievement of the performance targets is not probable, we cease recording compensation expense and all previously recognized compensation expense for the performance-based award is reversed. Because the actual number of shares to be awarded is not known until the end of the performance period, the actual compensation expense related to these awards could differ from our current expectations.
Income Taxes
We use the liability method of accounting for income taxes as set forth in the authoritative guidance for accounting for income taxes. Under this method, we recognize deferred tax liabilities and assets for the expected future tax consequences of temporary differences between the respective carrying amounts and tax basis of our assets and liabilities.
In calculating our effective tax rate, we make judgments regarding certain tax positions, including the timing and amount of deductions and allocations of income among various tax jurisdictions.
The guidance requires us to identify, evaluate and measure all uncertain tax positions taken or to be taken on tax returns and to record liabilities for the amount of these positions that may not be sustained, or may only partially be sustained, upon examination by the relevant taxing authorities. Although we believe that our estimates and judgments are reasonable, actual results may differ from these estimates. Some or all of these judgments are subject to review by the taxing authorities. To the extent that the actual results of these matters is different than the amounts recorded, such differences will affect our effective tax rate.
We establish valuation allowances when necessary to reduce deferred tax assets to the amounts expected to be realized. On a quarterly basis, we evaluate the need for, and the adequacy of, valuation allowances based on the expected realization of our deferred tax assets. The factors used to assess the likelihood of realization include our latest forecast of future taxable income,
48
available tax planning strategies that could be implemented, reversal of taxable temporary differences and carryback potential to realize the net deferred tax assets. As of December 31, 2019, we had a valuation allowance of $9.9 million.
Beginning January 1, 2018, we began recognizing the tax impact of including certain foreign earnings in U.S. taxable income as a period cost. We have recognized an immaterial amount of deferred income taxes for state income taxes that could be incurred on distributions of certain foreign earnings or for outside basis differences in our subsidiaries.
Off-Balance Sheet Arrangements
During the year ended December 31, 2019, we did not have any relationships with unconsolidated organizations or financial partnerships, such as structured finance or special purpose entities that would have been established for the purpose of facilitating off-balance sheet arrangements or other contractually narrow or limited purposes.
Recent Accounting Pronouncements
See Note 2. Summary of Significant Accounting Policies in the Notes to Consolidated Financial Statements in Item 8 of Part II of this Annual Report on Form 10-K, for a full description of recent accounting pronouncements, which is incorporated herein by reference.
ITEM 7A. QUANTITATIVE AND QUALITATIVE DISCLOSURES ABOUT MARKET RISK
Interest Rate Risk
We had cash and cash equivalents of $173.4 million and $382.6 million at December 31, 2019 and 2018, respectively. Our cash and cash equivalents consist primarily of bank demand deposits and money market funds. We hold cash and cash equivalents and short-term investments for working capital purposes. Our investments are made for capital preservation purposes, and we do not enter into investments for trading or speculative purposes.
We do not have material exposure to market risk with respect to our cash and cash equivalents, as these consist primarily of highly liquid investments purchased with original maturities of three months or less at December 31, 2019.
We had total indebtedness with an outstanding principal balance of $2.0 billion at December 31, 2019 and 2018. Borrowings outstanding under our various credit agreements bear interest at variable rates equal to applicable margins plus specified base rates or LIBOR-based rates with a 1% floor. As of December 31, 2019 and 2018, the annual weighted-average rate on borrowings was 4.55% and 5.27%, respectively. If there was a hypothetical 100 basis point increase in interest rates, the annual impact to interest expense would be approximately $19.5 million. This hypothetical change in interest expense has been calculated based on the borrowings outstanding at December 31, 2019 and a 100 basis point per annum change in interest rate applied over a one-year period.
We do not have material exposure to fair value market risk with respect to our total long-term outstanding indebtedness which consists of $2.0 billion U.S. dollar term loans as of December 31, 2019, not subject to market pricing.
See Note 9. Debt in the Notes to Consolidated Financial Statements in Item 8 of Part II of this Annual Report on Form 10-K for additional information regarding our debt.
Foreign Currency Exchange Risk
As a global company, we face exposure to adverse movements in foreign currency exchange rates. We primarily conduct business in the following locations: the United States, Europe, Canada, South America and Australia. This exposure is the result of selling in multiple currencies, growth in our international investments, additional headcount in foreign countries and operating in countries where the functional currency is the local currency. Specifically, our results of operations and cash flows are subject to fluctuations in the following currencies: the Euro, British Pound Sterling and Australian Dollar against the United States Dollar, or USD. These exposures may change over time as business practices evolve and economic conditions change. Changes in foreign currency exchange rates could have an adverse impact on our financial results and cash flows.
Our consolidated statements of operations are translated into USD at the average exchange rates in each applicable period. Our international revenue, operating expenses and significant balance sheet accounts denominated in currencies other than the USD primarily flow through our United Kingdom and European subsidiaries, which have British Pound Sterling and Euro functional currencies, respectively. This results in a two-step currency exchange process wherein the currencies other than the British Pound Sterling and Euro are first converted into those functional currencies and then translated into USD for our consolidated financial statements. As an example, revenue for sales in Australia is translated from the Australian Dollar to the Euro and then into the USD.
Our statement of operations and balance sheet accounts are also impacted by the re-measurement of non-functional currency transactions such as intercompany loans, cash accounts held by our overseas subsidiaries, accounts receivable denominated in foreign currencies, deferred revenue and accounts payable denominated in foreign currencies.
49
Foreign Currency Transaction Risk
Our foreign currency exposures typically arise from selling annual and multi-year maintenance contracts and subscriptions in multiple currencies, accounts receivable, intercompany transfer pricing arrangements and other intercompany transactions. Our foreign currency management objective is to minimize the effect of fluctuations in foreign exchange rates on selected assets or liabilities without exposing us to additional risk associated with transactions that could be regarded as speculative.
We utilize purchased foreign currency forward contracts to minimize our foreign exchange exposure on certain foreign balance sheet positions denominated in currencies other than the Euro. We do not enter into any derivative financial instruments for trading or speculative purposes. Our objective in managing our exposure to foreign currency exchange rate fluctuations is to reduce the impact of adverse fluctuations in such exchange rates on our earnings and cash flow. The notional amounts and currencies underlying our foreign currency forward contracts will fluctuate period to period as they are principally dependent on the balances of the balance sheet positions that are denominated in currencies other than the Euro held by our global entities. There can be no assurance that our foreign currency hedging activities will substantially offset the impact of fluctuation in currency exchange rates on our results of operations and functional positions. As of December 31, 2019 and 2018, we did not have any forward contracts outstanding and while we do not have a formal policy to settle all derivatives prior to the end of each quarter, our current practice is to do so. The effect of derivative instruments on our consolidated statements of operations was insignificant for the years ended December 31, 2019 and 2018.
We are exposed to credit-related losses in the event of non-performance by counterparties to derivative financial instruments, but we do not expect any counterparties to fail to meet their obligations given their high credit ratings. In addition, we diversify this risk across several counterparties and actively monitor their ratings.
Foreign Currency Translation Risk
Fluctuations in foreign currencies impact the amount of total assets, liabilities, revenue, operating expenses and cash flows that we report for our foreign subsidiaries upon the translation of these amounts into U.S. dollars. If there is a change in foreign currency exchange rates, the amounts of assets, liabilities, revenue, operating expenses and cash flows that we report in U.S. dollars for foreign subsidiaries that transact in international currencies may be higher or lower to what we would have reported using a constant currency rate. To the extent the U.S. dollar strengthens against foreign currencies, the translation of these foreign currency denominated transactions results in reduced assets, liabilities, revenue, operating expenses and cash flows for our international operations. Similarly, our assets, liabilities, revenue, operating expenses and cash flows will increase for our international operations if the U.S. dollar weakens against foreign currencies. The conversion of the foreign subsidiaries’ financial statements into U.S. dollars will also lead to remeasurement gains and losses recorded in income, or translation gains or losses that are recorded as a component of accumulated other comprehensive income (loss).
ITEM 8. FINANCIAL STATEMENTS AND SUPPLEMENTARY DATA
The information required by this item is incorporated by reference to the Consolidated Financial Statements set forth on pages F-1 through F-44 hereof.
ITEM 9. CHANGES IN DISAGREEMENTS WITH ACCOUNTANTS ON ACCOUNTING AND FINANCIAL DISCLOSURE
There were no changes in or disagreements with our accountants on accounting and financial disclosure matters.
ITEM 9A. CONTROLS AND PROCEDURES
Evaluation of Disclosure Controls and Procedures
Our management, with the participation of our Chief Executive Officer and our Chief Financial Officer, evaluated the effectiveness of our disclosure controls and procedures as of December 31, 2019. The term “disclosure controls and procedures,” as defined in Rules 13a-15(e) and 15d-15(e) under the Securities Exchange Act of 1934, as amended (the “Exchange Act”), means controls and other procedures of a company that are designed to ensure that information required to be disclosed by a company in the reports that it files or submits under the Exchange Act is recorded, processed, summarized and reported, within the time periods specified in the SEC’s rules and forms.
Disclosure controls and procedures include, without limitation, controls and procedures designed to ensure that information required to be disclosed by a company in the reports that it files or submits under the Exchange Act is accumulated and communicated to the company’s management, including its principal executive and principal financial officers, as appropriate to allow timely decisions regarding required disclosure. Management recognizes that any controls and procedures, no matter how well designed and operated, can provide only reasonable assurance of achieving their objectives and management necessarily applies its judgment in evaluating the cost-benefit relationship of possible controls and procedures. Based on the evaluation of our disclosure controls
50
and procedures as of December 31, 2019, our Chief Executive Officer and Chief Financial Officer concluded that, as of such date, our disclosure controls and procedures were effective at a reasonable assurance level.
Management’s Annual Report on Internal Control over Financial Reporting
Our management is responsible for establishing and maintaining adequate internal control over financial reporting to provide reasonable assurance regarding the reliability of our financial reporting and the preparation of financial statements for external purposes in accordance with generally accepted accounting principles. Internal control over financial reporting includes those policies and procedures that:
• | Pertain to the maintenance of records that in reasonable detail accurately and fairly reflect the transactions and dispositions of the assets of the Company; |
• | Provide reasonable assurance that transactions are recorded as necessary to permit preparation of financial statements in accordance with generally accepted accounting principles, and that receipts and expenditures of the Company are being made only in accordance with authorizations of management and directors of the Company; and |
• | Provide reasonable assurance regarding prevention or timely detection of unauthorized acquisition, use or disposition of the Company’s assets that could have a material effect on the financial statements. |
Because of its inherent limitations, internal control over financial reporting may not prevent or detect misstatements. Also, projections of any evaluation of effectiveness to future periods are subject to the risk that controls may become inadequate because of changes in conditions, or that our degree of compliance with the policies or procedures may deteriorate.
Our management conducted an evaluation of the effectiveness of our internal control over financial reporting as of the end of the period covered by this report based on the framework in Internal Control— Integrated Framework issued in 2013 by the Committee of Sponsoring Organization of the Treadway Commission. Based on this evaluation, management concluded that the Company’s internal control over financial reporting was effective as of the end of the period covered by this report.
SAManage, Ltd. and VividCortex, Inc., which were acquired during the year, have been excluded from management's assessment of internal control over financial reporting as of December 31, 2019. The total assets and total revenue of these acquired businesses collectively represent approximately 0.5% and 1.4%, respectively, of the related consolidated financial statement amounts of the Company as of and for the year ended December 31, 2019.
Our independent registered public accounting firm, which has audited our consolidated financial statements included in this Form 10-K, has also audited the effectiveness of the Company’s internal control over financial reporting as of December 31, 2019, and issued an audit report on our internal controls over financial reporting, which is included in Part II, Item 8 of this report.
Changes in Internal Control over Financial Reporting
There were no changes in our internal control over financial reporting that occurred during the quarter ended December 31, 2019 that have materially affected, or are reasonably likely to materially affect, our internal control over financial reporting.
ITEM 9B. OTHER INFORMATION
None.
51
PART III
Certain information required by Part III is omitted from this report. We intend to include such information in our definitive proxy statement ("Proxy Statement") related to our 2020 annual meeting of stockholders pursuant to Regulation 14A under the Exchange Act, which we intend to file with the Securities and Exchange Commission not later than 120 days after the end of the fiscal year covered by this report.
ITEM 10. DIRECTORS, EXECUTIVE OFFICERS AND CORPORATE GOVERNANCE
Except as set forth below, the information required by this Item will be included in our Proxy Statement and is incorporated herein by reference.
Code of Business Ethics and Conduct
Our board of directors has adopted a code of business conduct and ethics for all employees, including our Chief Executive Officer and President, Chief Financial Officer, and other executive and senior financial officers. The code of business ethics and conduct is available on the investor relations portion of our website at www.solarwinds.com. To the extent and in the manner required by applicable rules of the SEC and NYSE, we intend to disclose any amendments to our code of business conduct and ethics, or waivers of its requirements, on our website or in filings under the Exchange Act. Our website and the contents therein or connected thereto are not intended to be incorporated into this Annual Report on Form 10-K.
ITEM 11. EXECUTIVE COMPENSATION
The information required by this Item will be included in our Proxy Statement and is incorporated herein by reference.
ITEM 12. SECURITY OWNERSHIP OF CERTAIN BENEFICIAL OWNERS AND MANAGEMENT AND RELATED STOCKHOLDER MATTERS
The information required by this Item will be included in our Proxy Statement and is incorporated herein by reference.
ITEM 13. CERTAIN RELATIONSHIPS AND RELATED TRANSACTIONS, AND DIRECTOR INDEPENDENCE
The information required by this Item will be included in our Proxy Statement and is incorporated herein by reference.
ITEM 14. PRINCIPAL ACCOUNTANT FEES AND SERVICES
The information required by this Item will be included in our Proxy Statement and is incorporated herein by reference.
52
PART IV
ITEM 15. EXHIBITS, FINANCIAL STATEMENT SCHEDULES
(a) The following documents are filed as part of this Annual Report on Form 10-K:
1. | Financial Statements. |
Report of Independent Registered Public Accounting Firm | |
Consolidated Balance Sheets | |
Consolidated Statements of Operations | |
Consolidated Statements of Comprehensive Income (Loss) | |
Consolidated Statements of Redeemable Convertible Class A Common Stock and Stockholders' Equity (Deficit) | |
Consolidated Statements of Cash Flows | |
Notes to Consolidated Financial Statements | |
2. Financial Statement Schedules.
The following financial statement schedule should be read in conjunction with the consolidated financial statements of SolarWinds Corporation filed as part of this Report:
• | Schedule II—Valuation and Qualifying Accounts |
Schedules other than that listed above have been omitted since they are either not required or not applicable or because the information required is included in the consolidated financial statements included elsewhere herein or the notes thereto.
3. Exhibits.
EXHIBIT INDEX
Incorporated by Reference | ||||||||||
Exhibit Number | Exhibit Description | Form | File No. | Exhibit | Filing Date | |||||
Share Purchase Agreement, dated as of May 8, 2016, among Project Lake Holdings, Ltd., SolarWinds Holdings, Inc., LOGICnow Holding S.à r.l., and LOGICnow Holdings Ltd. | S-1 | 181082032 | 2.1 | 9/21/2018 | ||||||
Third Amended and Restated Certificate of Incorporation as currently in effect | 10-Q | 181203681 | 3.1 | 11/27/2018 | ||||||
Amended and Restated Bylaws as currently in effect | 10-Q | 181203681 | 3.2 | 11/27/2018 | ||||||
Amended and Restated Stockholders' Agreement, dated October 18, 2018, by and among the Company and the stockholders' named therein | 10-Q | 181203681 | 4.1 | 11/27/2018 | ||||||
Registration Rights Agreement, dated as of February 5, 2016, by and among the registrant and certain stockholders named therein | S-1 | 181082032 | 4.3 | 9/21/2018 | ||||||
Description of Registrant's Securities Registered under Section 12 of the Exchange Act | ||||||||||
53
Incorporated by Reference | ||||||||||
Exhibit Number | Exhibit Description | Form | File No. | Exhibit | Filing Date | |||||
First Lien Credit Agreement, dated as of February 5, 2016, by and among SolarWinds Holdings, Inc., as borrower, SolarWinds Intermediate Holdings I, Inc., the other guarantors party thereto, Credit Suisse AG, Cayman Islands Branch, as administrative agent and collateral agent, Goldman Sachs Lending Partners LLC, Credit Suisse Securities (USA) LLC, Macquarie Capital (USA) Inc. and Nomura Securities International, Inc., as joint lead arrangers and joint bookrunners, Goldman Sachs Lending Partners LLC, as syndication agent, and Goldman Sachs Lending Partners LLC, as documentation agent | S-1 | 181082032 | 10.1 | 9/21/2018 | ||||||
Amendment No. 1 to First Lien Credit Agreement, dated as of May 27, 2016, by and among SolarWinds Holdings, Inc., as borrower, SolarWinds Intermediate Holdings I, Inc., the other guarantors party thereto, Credit Suisse AG, Cayman Islands Branch, as administrative agent, and the lenders party thereto | S-1 | 181082032 | 10.1.1 | 9/21/2018 | ||||||
Amendment No. 2 to First Lien Credit Agreement, dated as of August 18, 2016, by and among SolarWinds Holdings, Inc., as borrower, SolarWinds Intermediate Holdings I, Inc., the other guarantors party thereto, Credit Suisse AG, Cayman Islands Branch, as administrative agent, and the lenders party thereto | S-1 | 181082032 | 10.1.2 | 9/21/2018 | ||||||
Amendment No. 3 to First Lien Credit Agreement, dated as of February 21, 2017, by and among SolarWinds Holdings, Inc., as borrower, SolarWinds Intermediate Holdings I, Inc., the other guarantors party thereto, Credit Suisse AG, Cayman Islands Branch, as administrative agent, and the lenders party thereto | S-1 | 181082032 | 10.1.3 | 9/21/2018 | ||||||
Amendment No. 4 to First Lien Credit Agreement, dated as of March 15, 2018, by and among SolarWinds Intermediate Holdings I, Inc., SolarWinds Holdings, Inc. and Credit Suisse AG, Cayman Islands Branch, as administrative agent, and the lenders party thereto | S-1 | 181082032 | 10.1.4 | 9/21/2018 | ||||||
Management Fee Agreement, dated as of February 5, 2016, among the registrant, SolarWinds Intermediate Holdings II, Inc., SolarWinds Intermediate Holdings I, Inc., SolarWinds Holdings, Inc., SolarWinds MSP Holdings Limited, SolarWinds International Holdings, Ltd., SolarWinds, Inc., Silver Lake Management Company IV, L.L.C., Thoma Bravo, LLC and Thoma Bravo Partners XI, L.P. | S-1 | 181082032 | 10.3 | 9/21/2018 | ||||||
Form of Indemnification Agreement between the registrant and each of its directors and executive officers | S-1 | 181082032 | 10.4 | 9/21/2018 | ||||||
54
Incorporated by Reference | ||||||||||
Exhibit Number | Exhibit Description | Form | File No. | Exhibit | Filing Date | |||||
SolarWinds Corporation Equity Plan, dated as of June 24, 2016, and forms of agreement thereunder | S-1 | 181082032 | 10.5 | 9/21/2018 | ||||||
SolarWinds Corporation 2018 Equity Incentive Plan and forms of agreements thereunder | 10-Q | 181203681 | 10.1 | 11/27/2018 | ||||||
SolarWinds Corporation 2018 Employee Stock Purchase Plan | 10-K | 19630606 | 10.7 | 2/25/2019 | ||||||
Form of SolarWinds Corporation Bonus Plan | S-1 | 181082032 | 10.8 | 9/21/2018 | ||||||
Second Amended and Restated Employment Agreement, dated as of September 30, 2016, between SolarWinds, Inc. and Kevin B. Thompson | S-1 | 181082032 | 10.9 | 9/21/2018 | ||||||
Amended and Restated Employment Agreement, dated as of April 27, 2016, between SolarWinds Worldwide, LLC and J. Barton Kalsu | S-1 | 181082032 | 10.10 | 9/21/2018 | ||||||
Employment Agreement, dated as of October 15, 2015, between SolarWinds Worldwide, LLC and David Gardiner | S-1 | 181082032 | 10.11 | 9/21/2018 | ||||||
Amendment to Employment Agreement, dated as of April 27, 2016, between SolarWinds Worldwide, LLC and David Gardiner | S-1 | 181082032 | 10.11.1 | 9/21/2018 | ||||||
Letter of Assignment (2017–2018), dated as of July 1, 2017, between SolarWinds Worldwide, LLC and David Gardiner | S-1 | 181082032 | 10.11.2 | 9/21/2018 | ||||||
List of subsidiaries of the registrant | ||||||||||
Consent of PricewaterhouseCoopers LLP, independent registered public accounting firm | ||||||||||
Certification of Chief Executive Officer pursuant to Exchange Act Rules 13a-14(a) and 15d-14(a), as adopted pursuant to Section 302 of the Sarbanes-Oxley Act of 2002 | ||||||||||
Certification of Chief Financial Officer pursuant to Exchange Act Rules 13a-14(a) and 15d-14(a), as adopted pursuant to Section 302 of the Sarbanes-Oxley Act of 2002 | ||||||||||
Certifications of Chief Executive Officer, Chief Financial Officer and Chief Accounting Officer pursuant to Exchange Act Rule 13a-14(b) and 18 U.S.C. Section 1350, as adopted pursuant to Section 906 of the Sarbanes-Oxley Act of 2002 | ||||||||||
101.INS | XBRL Instance Document (formatted as Inline XBRL) | |||||||||
101.SCH | XBRL Taxonomy Extension Schema Document | |||||||||
55
Incorporated by Reference | ||||||||||
Exhibit Number | Exhibit Description | Form | File No. | Exhibit | Filing Date | |||||
101.CAL | XBRL Taxonomy Extension Calculation Linkbase Document | |||||||||
101.DEF | XBRL Taxonomy Extension Definition Linkbase Document | |||||||||
101.LAB | XBRL Taxonomy Extension Label Linkbase Document | |||||||||
101.PRE | XBRL Taxonomy Extension Presentation Linkbase Document | |||||||||
104 | Cover Page Interactive Data File (formatted as Inline XBRL and contained in Exhibit 101) | |||||||||
# | Indicates management contract or compensatory plan or arrangement. |
* | Filed herewith |
** | The certifications attached as Exhibit 32.1 accompanying this Annual Report on Form 10-K, are deemed furnished and not filed with the Securities and Exchange Commission and are not to be incorporated by reference into any filing of the Registrant under the Securities Act of 1933, as amended, or the Securities Exchange Act of 1934, as amended, whether made before or after the date of this Annual Report on Form 10-K, irrespective of any general incorporation language contained in such filing |
ITEM 16. FORM 10–K SUMMARY
None.
56
SOLARWINDS CORPORATION
SIGNATURES
Pursuant to the requirements of the Securities Exchange Act of 1934, the registrant has duly caused this report to be signed on its behalf by the undersigned thereunto duly authorized.
SOLARWINDS CORPORATION | |||
Dated: | February 24, 2020 | By: | /s/ J. Barton Kalsu |
J. Barton Kalsu | |||
Chief Financial Officer | |||
(Principal Financial and Accounting Officer) | |||
Pursuant to the requirements of the Securities Act of 1934, as amended, this report has been signed by the following persons on behalf of the registrant and in the capacities and on the dates indicated.
Signature | Title | Date | ||
/s/ Kevin B. Thompson | President and Chief Executive Officer and Director (Principal Executive Officer) | February 24, 2020 | ||
Kevin B. Thompson | ||||
/s/ J. Barton Kalsu | Chief Financial Officer (Principal Financial and Accounting Officer) | February 24, 2020 | ||
J. Barton Kalsu | ||||
/s/ Michael Bingle | Director | February 24, 2020 | ||
Michael Bingle | ||||
/s/ William Bock | Director | February 24, 2020 | ||
William Bock | ||||
/s/ Seth Boro | Director | February 24, 2020 | ||
Seth Boro | ||||
/s/ Paul Cormier | Director | February 24, 2020 | ||
Paul Cormier | ||||
/s/ Kenneth Y. Hao | Director | February 24, 2020 | ||
Kenneth Y. Hao | ||||
/s/ Michael Hoffmann | Director | February 24, 2020 | ||
Michael Hoffmann | ||||
/s/ Catherine Kinney | Director | February 24, 2020 | ||
Catherine Kinney | ||||
/s/ James Lines | Director | February 24, 2020 | ||
James Lines | ||||
/s/ Jason White | Director | February 24, 2020 | ||
Jason White | ||||
57
INDEX TO CONSOLIDATED FINANCIAL STATEMENTS
Page | |
SOLARWINDS CORPORATION | |
F-1
Report of Independent Registered Public Accounting Firm
To the Board of Directors and Stockholders of SolarWinds Corporation
Opinions on the Financial Statements and Internal Control over Financial Reporting
We have audited the accompanying consolidated balance sheets of SolarWinds Corporation and its subsidiaries (the “Company”) as of December 31, 2019 and 2018, and the related consolidated statements of operations, of comprehensive income (loss), of redeemable convertible Class A common stock and stockholders' equity (deficit) and of cash flows for each of the three years in the period ended December 31, 2019, including the related notes and financial statement schedule listed in the accompanying index (collectively referred to as the “consolidated financial statements”). We also have audited the Company's internal control over financial reporting as of December 31, 2019, based on criteria established in Internal Control - Integrated Framework (2013) issued by the Committee of Sponsoring Organizations of the Treadway Commission (COSO).
In our opinion, the consolidated financial statements referred to above present fairly, in all material respects, the financial position of the Company as of December 31, 2019 and 2018, and the results of its operations and its cash flows for each of the three years in the period ended December 31, 2019 in conformity with accounting principles generally accepted in the United States of America. Also in our opinion, the Company maintained, in all material respects, effective internal control over financial reporting as of December 31, 2019, based on criteria established in Internal Control - Integrated Framework (2013) issued by the COSO.
Changes in Accounting Principles
As discussed in Note 2 to the consolidated financial statements, the Company changed the manner in which it accounts for revenue from contracts with customers and the manner in which it accounts for leases in 2019.
Basis for Opinions
The Company's management is responsible for these consolidated financial statements, for maintaining effective internal control over financial reporting, and for its assessment of the effectiveness of internal control over financial reporting, included in Management’s Annual Report on Internal Control over Financial Reporting appearing under Item 9A. Our responsibility is to express opinions on the Company’s consolidated financial statements and on the Company's internal control over financial reporting based on our audits. We are a public accounting firm registered with the Public Company Accounting Oversight Board (United States) (PCAOB) and are required to be independent with respect to the Company in accordance with the U.S. federal securities laws and the applicable rules and regulations of the Securities and Exchange Commission and the PCAOB.
We conducted our audits in accordance with the standards of the PCAOB. Those standards require that we plan and perform the audits to obtain reasonable assurance about whether the consolidated financial statements are free of material misstatement, whether due to error or fraud, and whether effective internal control over financial reporting was maintained in all material respects.
Our audits of the consolidated financial statements included performing procedures to assess the risks of material misstatement of the consolidated financial statements, whether due to error or fraud, and performing procedures that respond to those risks. Such procedures included examining, on a test basis, evidence regarding the amounts and disclosures in the consolidated financial statements. Our audits also included evaluating the accounting principles used and significant estimates made by management, as well as evaluating the overall presentation of the consolidated financial statements. Our audit of internal control over financial reporting included obtaining an understanding of internal control over financial reporting, assessing the risk that a material weakness exists, and testing and evaluating the design and operating effectiveness of internal control based on the assessed risk. Our audits also included performing such other procedures as we considered necessary in the circumstances. We believe that our audits provide a reasonable basis for our opinions.
As described in Management’s Annual Report on Internal Control over Financial Reporting, management has excluded SAManage, Ltd. and VividCortex, Inc. from its assessment of internal control over financial reporting as of December 31, 2019 because they were acquired by the Company in purchase business combinations during 2019. We have also excluded these entities from our audit of internal control over financial reporting. These entities, each of which is wholly-owned, comprised, in the aggregate, total assets and total revenue excluded from management’s assessment and our audit of internal control over financial reporting of approximately 0.5% and 1.4% of consolidated total assets and consolidated total revenue, respectively, as of and for the year ended December 31, 2019.
F-2
Definition and Limitations of Internal Control over Financial Reporting
A company’s internal control over financial reporting is a process designed to provide reasonable assurance regarding the reliability of financial reporting and the preparation of financial statements for external purposes in accordance with generally accepted accounting principles. A company’s internal control over financial reporting includes those policies and procedures that (i) pertain to the maintenance of records that, in reasonable detail, accurately and fairly reflect the transactions and dispositions of the assets of the company; (ii) provide reasonable assurance that transactions are recorded as necessary to permit preparation of financial statements in accordance with generally accepted accounting principles, and that receipts and expenditures of the company are being made only in accordance with authorizations of management and directors of the company; and (iii) provide reasonable assurance regarding prevention or timely detection of unauthorized acquisition, use, or disposition of the company’s assets that could have a material effect on the financial statements.
Because of its inherent limitations, internal control over financial reporting may not prevent or detect misstatements. Also, projections of any evaluation of effectiveness to future periods are subject to the risk that controls may become inadequate because of changes in conditions, or that the degree of compliance with the policies or procedures may deteriorate.
Critical Audit Matters
The critical audit matters communicated below are matters arising from the current period audit of the consolidated financial statements that were communicated or required to be communicated to the audit committee and that (i) relate to accounts or disclosures that are material to the consolidated financial statements and (ii) involved our especially challenging, subjective, or complex judgments. The communication of critical audit matters does not alter in any way our opinion on the consolidated financial statements, taken as a whole, and we are not, by communicating the critical audit matters below, providing separate opinions on the critical audit matters or on the accounts or disclosures to which they relate.
Revenue Recognition - Standalone Selling Price for Transactions with Multiple Performance Obligations
As described in Note 2 to the consolidated financial statements, the Company recognized $165.3 million and $446.5 million of license and maintenance revenue, respectively, during the year ended December 31, 2019. The Company’s performance obligations include perpetual and time-based licenses and maintenance support including unspecified upgrades or enhancements to new versions of their software products. Management allocates the transaction price of the contract to each distinct performance obligation in the contract based on a relative standalone selling price. Determining standalone selling prices for the Company’s performance obligations requires judgment and is based on multiple factors including, but not limited to historical selling prices and discounting practices for products and services, internal pricing policies and pricing practices in different regions and through different sales channels.
The principal considerations for our determination that performing procedures relating to revenue recognition - standalone selling price for transactions with multiple performance obligations is a critical audit matter are there was significant auditor subjectivity and effort in performing procedures and evaluating audit evidence relating to standalone selling prices used to allocate the transaction price of the contract to each distinct performance obligation in the contract.
Addressing the matter involved performing procedures and evaluating audit evidence in connection with forming our overall opinion on the consolidated financial statements. These procedures included testing the effectiveness of controls relating to the determination of standalone selling prices, including controls over the completeness and accuracy of the underlying data. These procedures also included, among others, testing management’s process for determining the standalone selling prices. Testing management’s process included evaluating the appropriateness of the overall methodology used by management, evaluating the reasonableness of the segmentation considerations by product, sales channels and geography, as well as testing the completeness and accuracy of the historical selling prices used, including list prices and discounts.
Acquisition of SAManage Ltd. - Valuation of Identifiable Intangible Assets
As described in Notes 2 and 3 to the consolidated financial statements, the Company acquired SAManage Ltd. in 2019 for net consideration of $342.1 million, which resulted in $49.7 million of identifiable intangible assets being recorded. The fair value of identifiable intangible assets is based on significant judgments made by management. Management typically engages third party valuation appraisal firms to assist in determining the fair values and useful lives of the assets acquired. The valuation estimates and assumptions are based on historical experience and information obtained by management, and include, but are not limited to, future expected cash flows earned from the product technology and discount rates applied in determining the present value of those cash flows.
F-3
The principal considerations for our determination that performing procedures relating to valuation of identifiable intangible assets related to the acquisition of SAManage Ltd. is a critical audit matter are there was significant judgment by management when developing the estimated fair value of identifiable intangible assets. This in turn led to significant auditor judgment and subjectivity in performing procedures relating to the valuation of identifiable intangible assets and significant audit effort was necessary in evaluating the significant assumptions relating to the estimate, including the future expected cash flows and discount rates. In addition, the audit effort involved the use of professionals with specialized skill and knowledge.
Addressing the matter involved performing procedures and evaluating audit evidence in connection with forming our overall opinion on the consolidated financial statements. These procedures included testing the effectiveness of controls relating to acquisition accounting, including controls over estimating the fair value of identifiable intangible assets. These procedures also included, among others, testing management’s process for estimating the fair value of identifiable intangible assets. Testing management's process included evaluating the appropriateness of the valuation methods and the reasonableness of significant assumptions, including future expected cash flows and discount rates. Evaluating the reasonableness of the future expected cash flows involved considering the past performance of the acquired businesses, growth rates of similar historical acquisitions by the Company, and historical results of peer companies. Professionals with specialized skill and knowledge were used to assist in evaluating the appropriateness of the valuation methods used and the reasonableness of certain significant assumptions, including the discount rates.
/s/ PricewaterhouseCoopers LLP
Austin, Texas
February 24, 2020
We have served as the Company’s auditor since 2004.
F-4
SolarWinds Corporation
Consolidated Balance Sheets
(In thousands, except share and per share information)
December 31, | |||||||
2019 | 2018 | ||||||
Assets | |||||||
Current assets: | |||||||
Cash and cash equivalents | $ | $ | |||||
Accounts receivable, net of allowances of $3,171 and $3,196 as of December 31, 2019 and 2018, respectively | |||||||
Income tax receivable | |||||||
Prepaid and other current assets | |||||||
Total current assets | |||||||
Property and equipment, net | |||||||
Operating lease assets | — | ||||||
Deferred taxes | |||||||
Goodwill | |||||||
Intangible assets, net | |||||||
Other assets, net | |||||||
Total assets | $ | $ | |||||
Liabilities and stockholders’ equity | |||||||
Current liabilities: | |||||||
Accounts payable | $ | $ | |||||
Accrued liabilities and other | |||||||
Current operating lease liabilities | — | ||||||
Accrued interest payable | |||||||
Income taxes payable | |||||||
Current portion of deferred revenue | |||||||
Current debt obligation | |||||||
Total current liabilities | |||||||
Long-term liabilities: | |||||||
Deferred revenue, net of current portion | |||||||
Non-current deferred taxes | |||||||
Non-current operating lease liabilities | — | ||||||
Other long-term liabilities | |||||||
Long-term debt, net of current portion | |||||||
Total liabilities | |||||||
Commitments and contingencies (Note 16) | |||||||
Stockholders’ equity: | |||||||
Common stock, $0.001 par value: 1,000,000,000 shares authorized and 308,290,310 and 304,942,415 shares issued and outstanding as of December 31, 2019 and 2018, respectively | |||||||
Preferred stock, $0.001 par value: 50,000,000 shares authorized and no shares issued and outstanding as of December 31, 2019 and 2018, respectively | |||||||
Additional paid-in capital | |||||||
Accumulated other comprehensive income (loss) | ( | ) | |||||
Accumulated deficit | ( | ) | ( | ) | |||
Total stockholders’ equity | |||||||
Total liabilities and stockholders’ equity | $ | $ | |||||
The accompanying notes are an integral part of these financial statements.
F-5
SolarWinds Corporation
Consolidated Statements of Operations
(In thousands, except per share information)
Year Ended December 31, | |||||||||||
2019 | 2018 | 2017 | |||||||||
Revenue: | |||||||||||
Subscription | $ | $ | $ | ||||||||
Maintenance | |||||||||||
Total recurring revenue | |||||||||||
License | |||||||||||
Total revenue | |||||||||||
Cost of revenue: | |||||||||||
Cost of recurring revenue | |||||||||||
Amortization of acquired technologies | |||||||||||
Total cost of revenue | |||||||||||
Gross profit | |||||||||||
Operating expenses: | |||||||||||
Sales and marketing | |||||||||||
Research and development | |||||||||||
General and administrative | |||||||||||
Amortization of acquired intangibles | |||||||||||
Total operating expenses | |||||||||||
Operating income | |||||||||||
Other income (expense): | |||||||||||
Interest expense, net | ( | ) | ( | ) | ( | ) | |||||
Other income (expense), net | ( | ) | |||||||||
Total other income (expense) | ( | ) | ( | ) | ( | ) | |||||
Income (loss) before income taxes | ( | ) | ( | ) | |||||||
Income tax expense (benefit) | ( | ) | |||||||||
Net income (loss) | $ | $ | ( | ) | $ | ( | ) | ||||
Net income (loss) available to common stockholders | $ | $ | $ | ( | ) | ||||||
Net income (loss) available to common stockholders per share: | |||||||||||
Basic earnings (loss) per share | $ | $ | $ | ( | ) | ||||||
Diluted earnings (loss) per share | $ | $ | $ | ( | ) | ||||||
Weighted-average shares used to compute net income (loss) available to common stockholders per share: | |||||||||||
Shares used in computation of basic earnings (loss) per share | |||||||||||
Shares used in computation of diluted earnings (loss) per share | |||||||||||
The accompanying notes are an integral part of these consolidated financial statements.
F-6
SolarWinds Corporation
Consolidated Statements of Comprehensive Income (Loss)
(In thousands)
Year Ended December 31, | |||||||||||
2019 | 2018 | 2017 | |||||||||
Net income (loss) | $ | $ | ( | ) | $ | ( | ) | ||||
Other comprehensive income (loss): | |||||||||||
Foreign currency translation adjustment | ( | ) | ( | ) | |||||||
Other comprehensive income (loss) | ( | ) | ( | ) | |||||||
Comprehensive income (loss) | $ | ( | ) | $ | ( | ) | $ | ||||
The accompanying notes are an integral part of these consolidated financial statements.
F-7
SolarWinds Corporation
Consolidated Statements of Redeemable Convertible Class A Common Stock and
Stockholders' Equity (Deficit)
(In thousands)
Redeemable Convertible Class A Common Stock | Common Stock | Additional Paid-in Capital | Accumulated Other Comprehensive Income (Loss) | Accumulated Deficit | Total Stockholders’ Equity (Deficit) | |||||||||||||||||||||||||
Shares | Amount | Shares | Amount | |||||||||||||||||||||||||||
Balance at December 31, 2016 | $ | $ | $ | $ | ( | ) | $ | ( | ) | $ | ( | ) | ||||||||||||||||||
Foreign currency translation adjustment | — | — | — | — | — | — | ||||||||||||||||||||||||
Net loss | — | — | — | — | — | — | ( | ) | ( | ) | ||||||||||||||||||||
Comprehensive income | ||||||||||||||||||||||||||||||
Exercise of stock options | — | — | — | — | — | |||||||||||||||||||||||||
Issuance of stock | — | — | — | |||||||||||||||||||||||||||
Repurchase of stock | ( | ) | ( | ) | ( | ) | — | ( | ) | — | — | ( | ) | |||||||||||||||||
Accumulating dividends | — | — | — | ( | ) | — | ( | ) | ( | ) | ||||||||||||||||||||
Stock-based compensation | — | — | — | — | — | — | ||||||||||||||||||||||||
Balance at December 31, 2017 | ( | ) | ( | ) | ||||||||||||||||||||||||||
Foreign currency translation adjustment | — | — | — | — | — | ( | ) | — | ( | ) | ||||||||||||||||||||
Net loss | — | — | — | — | — | — | ( | ) | ( | ) | ||||||||||||||||||||
Comprehensive loss | ( | ) | ||||||||||||||||||||||||||||
Issuance of stock upon initial public offering, net of offering costs | — | — | — | — | ||||||||||||||||||||||||||
Exercise of stock options | — | — | — | — | — | |||||||||||||||||||||||||
Issuance of stock | — | — | — | — | ||||||||||||||||||||||||||
Repurchase of stock | — | ( | ) | ( | ) | — | ( | ) | — | — | ( | ) | ||||||||||||||||||
Accumulating dividends | — | — | — | ( | ) | — | ( | ) | ( | ) | ||||||||||||||||||||
Conversion of Class A shares and accumulated dividends to common stock upon initial public offering | ( | ) | ( | ) | — | |||||||||||||||||||||||||
Stock-based compensation | — | — | — | — | — | — | ||||||||||||||||||||||||
Balance at December 31, 2018 | ( | ) | ||||||||||||||||||||||||||||
Cumulative effect adjustment of adoption of revenue recognition accounting standard | — | — | — | — | — | — | ||||||||||||||||||||||||
Foreign currency translation adjustment | — | — | — | — | — | ( | ) | — | ( | ) | ||||||||||||||||||||
Net income | — | — | — | — | — | — | ||||||||||||||||||||||||
Comprehensive loss | ( | ) | ||||||||||||||||||||||||||||
Exercise of stock options | — | — | — | — | — | |||||||||||||||||||||||||
Restricted stock units issued, net of shares withheld for taxes | — | — | ( | ) | — | — | ( | ) | ||||||||||||||||||||||
Issuance of stock | — | — | — | — | ||||||||||||||||||||||||||
Issuance of stock under employee stock purchase plan | — | — | — | — | — | |||||||||||||||||||||||||
Equity awards assumed in acquisitions | — | — | — | — | — | — | ||||||||||||||||||||||||
Stock-based compensation | — | — | — | — | — | — | ||||||||||||||||||||||||
Balance at December 31, 2019 | $ | $ | $ | $ | ( | ) | $ | ( | ) | $ | ||||||||||||||||||||
The accompanying notes are an integral part of these consolidated financial statements.
F-8
Year Ended December 31, | |||||||||||
2019 | 2018 | 2017 | |||||||||
Cash flows from operating activities | |||||||||||
Net income (loss) | $ | $ | ( | ) | $ | ( | ) | ||||
Adjustments to reconcile net income (loss) to net cash provided by operating activities: | |||||||||||
Depreciation and amortization | |||||||||||
Provision for doubtful accounts | |||||||||||
Stock-based compensation expense | |||||||||||
Amortization of debt issuance costs | |||||||||||
Loss on extinguishment of debt | |||||||||||
Deferred taxes | ( | ) | ( | ) | ( | ) | |||||
(Gain) loss on foreign currency exchange rates | ( | ) | ( | ) | |||||||
Other non-cash expenses (benefits) | ( | ) | |||||||||
Changes in operating assets and liabilities, net of assets acquired and liabilities assumed in business combinations: | |||||||||||
Accounts receivable | ( | ) | ( | ) | ( | ) | |||||
Income taxes receivable | ( | ) | |||||||||
Prepaid and other current assets | ( | ) | ( | ) | |||||||
Accounts payable | ( | ) | |||||||||
Accrued liabilities and other | ( | ) | |||||||||
Accrued interest payable | ( | ) | ( | ) | |||||||
Income taxes payable | ( | ) | ( | ) | |||||||
Deferred revenue | |||||||||||
Other long-term liabilities | |||||||||||
Net cash provided by operating activities | |||||||||||
Cash flows from investing activities | |||||||||||
Purchases of property and equipment | ( | ) | ( | ) | ( | ) | |||||
Purchases of intangible assets | ( | ) | ( | ) | ( | ) | |||||
Acquisitions, net of cash acquired | ( | ) | ( | ) | ( | ) | |||||
Proceeds from sale of cost method investment and other | |||||||||||
Net cash used in investing activities | ( | ) | ( | ) | ( | ) | |||||
Cash flows from financing activities | |||||||||||
Proceeds from our initial public offering, net of underwriting discounts | |||||||||||
Proceeds from issuance of common stock, common stock under employee stock purchase plan and incentive restricted stock | |||||||||||
Repurchase of common stock and incentive restricted stock | ( | ) | ( | ) | ( | ) | |||||
Exercise of stock options | |||||||||||
Premium paid on debt extinguishment | ( | ) | |||||||||
Proceeds from credit agreement | |||||||||||
Repayments of borrowings from credit agreement | ( | ) | ( | ) | ( | ) | |||||
Payment of debt issuance costs | ( | ) | ( | ) | |||||||
Payment for deferred offering costs | ( | ) | |||||||||
Net cash used in financing activities | ( | ) | ( | ) | ( | ) | |||||
Effect of exchange rate changes on cash and cash equivalents | ( | ) | ( | ) | |||||||
Net increase (decrease) in cash and cash equivalents | ( | ) | |||||||||
Cash and cash equivalents | |||||||||||
Beginning of period | |||||||||||
End of period | $ | $ | $ | ||||||||
F-9
Year Ended December 31, | |||||||||||
2019 | 2018 | 2017 | |||||||||
Supplemental disclosure of cash flow information | |||||||||||
Cash paid for interest | $ | $ | $ | ||||||||
Cash paid (received) for income taxes | $ | $ | $ | ( | ) | ||||||
Non-cash investing and financing transactions | |||||||||||
Conversion of redeemable convertible Class A common stock and accumulated dividends to common stock | $ | $ | $ | ||||||||
The accompanying notes are an integral part of these consolidated financial statements.
F-10
1. Organization and Nature of Operations
SolarWinds Corporation, a Delaware corporation, and its subsidiaries (“Company”, “we,” “us” and “our”) is a leading provider of information technology, or IT, infrastructure management software. Our products give organizations worldwide, regardless of type, size or IT infrastructure complexity, the power to monitor and manage the performance of their IT environments, whether on-premise, in the cloud, or in hybrid infrastructure models. Our approach, which we refer to as the SolarWinds Model, combines powerful, scalable, affordable, easy to use products with high-velocity, low-touch sales. We’ve built our business to enable the technology professionals who use our products to manage “all things IT.” Our range of customers has expanded over time to include network and systems engineers, database administrators, storage administrators, DevOps and service desk professionals, as well as managed service providers, or MSPs. Our SolarWinds Model enables us to sell our products for use in organizations ranging in size from very small businesses to large enterprises.
SolarWinds Corporation was incorporated in the State of Delaware in 2015 under the name Project Aurora Parent, Inc. It changed its name to SolarWinds Parent, Inc. in May 2016, and in May 2018 changed its name to SolarWinds Corporation.
Take Private
In February 2016, we were acquired by affiliates of investment firms Silver Lake and Thoma Bravo, or the Sponsors, to complete a take private transaction, or the Take Private, of SolarWinds, Inc. We applied purchase accounting on the date of the Take Private which required all assets acquired and liabilities assumed, including deferred revenue, be recorded at the date of acquisition at their respective fair values.
Initial Public Offering and Follow-On Offering by Selling Stockholders
In October 2018, we completed our initial public offering, or IPO, in which we sold and issued 25,000,000 shares of our common stock at an issue price of $15.00 per share. We raised a total of $375.0 million in gross proceeds from the offering, or approximately $353.0 million in net proceeds after deducting underwriting discounts and commissions of $17.8 million and offering-related expenses of approximately $4.2 million. A portion of the net proceeds from the offering were used to repay the $315.0 million in borrowings outstanding under our Second Lien Term Loan (as defined below).
Upon the closing of our IPO, all shares of Class A Common Stock that were outstanding immediately prior to the closing of the offering converted into shares of common stock at a conversion price of $19.00 per share as in accordance with the terms of our certificate of incorporation, as amended. In addition, we converted the accrued and unpaid dividends on the Class A Common Stock into shares of common stock equal to the result of the accrued and unpaid dividends on each share of Class A Common Stock divided by the conversion price of $19.00 per share. See Note 10. Redeemable Convertible Class A Common Stock and Note 11. Stockholders’ Equity (Deficit) and Stock-Based Compensation for additional details.
2. Summary of Significant Accounting Policies
Basis of Consolidation
The accompanying consolidated financial statements include the accounts of SolarWinds Corporation and the accounts of its wholly owned subsidiaries. We have eliminated all intercompany balances and transactions.
Reclassifications
Certain reclassifications have been made to prior periods' consolidated financial statements to conform to the current period presentation. These reclassifications did not result in any change in previously reported net income (loss), total assets or stockholders' equity.
Use of Estimates
The preparation of financial statements in conformity with GAAP requires our management to make estimates and assumptions that affect the reported amounts and the disclosure of assets and liabilities at the date of the financial statements and the reported amounts of revenue and expenses during the reporting periods. The actual results that we experience may differ materially from our estimates. The accounting estimates that require our most significant, difficult and subjective judgments include:
• | the valuation of goodwill, intangibles, long-lived assets and contingent consideration; |
• | revenue recognition; |
F-11
• | stock-based compensation; and |
• | income taxes. |
Foreign Currency Translation
The functional currency of our foreign subsidiaries is determined in accordance with authoritative guidance issued by the Financial Accounting Standards Board, or FASB. We translate assets and liabilities for these subsidiaries at exchange rates in effect at the balance sheet date. We translate income and expense accounts for these subsidiaries at the average monthly exchange rates for the periods. We record resulting translation adjustments as a component of accumulated other comprehensive income (loss) within stockholders’ equity (deficit). We record gains and losses from currency transactions denominated in currencies other than the functional currency as other income (expense) in our consolidated statements of operations. There were no equity transactions denominated in foreign currencies for the years ended December 31, 2019 and 2018. Local currency transactions of international subsidiaries that have the U.S. dollar as the functional currency are remeasured into U.S. dollars using current rates of exchange for monetary assets and liabilities and historical rates of exchange for non-monetary assets and liabilities.
We recorded a net transaction gain related to the remeasurement of monetary assets and liabilities of $0.3 million within our consolidated statements of operations for the year ended December 31, 2019, a net transaction loss of $14.9 million for the year ended December 31, 2018 and a net transaction gain of $54.0 million for the year ended December 31, 2017, primarily related to various intercompany loans.
Recent Accounting Pronouncements Not Yet Adopted
Under the Jumpstart our Business Startups Act, or the JOBS Act, emerging growth companies can delay adopting new or revised accounting standards until such time as those standards apply to non-public companies. Subsequent to our IPO in October 2018, we were an emerging growth company within the meaning of the JOBS Act. As a result of the market value of our common stock held by non-affiliates at the end of our second fiscal quarter, we no longer qualify as an emerging growth company as of December 31, 2019 and can no longer take advantage of the extended transition period for adopting new or revised accounting standards. Accordingly, we have revised our planned adoption dates below from the non-public company effective dates to the public company effective dates.
In January 2017, FASB issued an accounting standard to simplify the accounting for goodwill impairment. The new guidance removes step two of the two-step quantitative goodwill impairment test, which requires a hypothetical purchase price allocation. The updated guidance is effective for public companies for fiscal years beginning after December 15, 2019 and may be adopted early for any interim or annual goodwill impairment tests performed after January 1, 2017. We will adopt the updated guidance in fiscal year 2020. We do not believe that this standard will have a material impact on our consolidated financial statements.
Recently Adopted Accounting Pronouncements
Revenue
On January 1, 2019 we adopted the FASB Accounting Standards Codification, or ASC, No. 2014-09 “Revenue from Contracts with Customers,” or ASC 606, which replaced all existing revenue guidance under ASC 605 “Revenue Recognition,” including prescriptive industry-specific guidance, or ASC 605. This standard’s core principle is that an entity will recognize revenue when it transfers promised goods or services to customers in an amount that reflects the consideration to which the entity expects to be entitled in exchange for those goods or services. We adopted ASC 606 using the modified-retrospective method. Results for reporting periods beginning after January 1, 2019 are presented in compliance with the new revenue recognition standard ASC 606. Historical financial results for reporting periods prior to 2019 are presented in conformity with amounts previously disclosed under the prior revenue recognition standard, ASC 605. These financial statements include additional information regarding the impacts from the adoption of the new revenue recognition standard on our financial results for the year ended December 31, 2019. This includes the presentation of financial results for the year ended December 31, 2019 under ASC 605 for comparison to the prior year period.
F-12
The most significantly impacted areas are the following:
• | License and Recurring Revenue. The adoption of the new standard resulted in changes to the classification and timing of our revenue recognition. Under the new guidance, the requirement to establish VSOE to recognize license revenue separately from the other elements is eliminated. This change impacted the allocation of the transaction price and timing of our revenue recognition between deliverables, or performance obligations, within an arrangement. In addition, we now recognize time-based license revenue upon the transfer of the license and the associated maintenance revenue over the contract period under the new standard instead of recognizing both the license and maintenance revenue ratably over the contract period. The overall adoption impact to total revenue is immaterial, though we have experienced some changes to the timing and classification between license and recurring revenue. Additionally, some historical deferred revenue, primarily from arrangements involving time-based licenses, will never be recognized as revenue and instead has been recorded as a cumulative effect adjustment within accumulated deficit. |
• | Contract Acquisition Costs. We expensed all sales commissions as incurred under the previous guidance. The new guidance requires the deferral and amortization of certain direct and incremental costs incurred to obtain a contract. This guidance requires us to capitalize and amortize certain sales commission costs over the remaining contractual term or over an expected period of benefit, which we have determined to be approximately four to |
• | Other Items. The impact of the adoption of the new standard on income taxes resulted in an increase of deferred income tax liabilities. The adoption of this standard did not impact our total operating cash flows. |
The cumulative effect of the changes made to our consolidated balance sheet as of January 1, 2019 for the adoption of ASC 606 to all contracts with customers that were not completed as of December 31, 2018 was recorded as an adjustment to accumulated deficit as of the adoption date as follows:
December 31, 2018 | January 1, 2019 | ||||||||||
As reported | Adjustments | As adjusted | |||||||||
(in thousands) | |||||||||||
Assets: | |||||||||||
Prepaid and other current assets(1) | $ | $ | $ | ||||||||
Other assets, net(1) | |||||||||||
Total assets(1) | |||||||||||
Liabilities: | |||||||||||
Current portion of deferred revenue(2) | ( | ) | |||||||||
Deferred revenue, net of current portion(2) | ( | ) | |||||||||
Non-current deferred taxes | |||||||||||
Total liabilities | ( | ) | |||||||||
Stockholders' equity (deficit): | |||||||||||
Accumulated deficit | ( | ) | ( | ) | |||||||
_______
(1) | Adjustment represents the impact of the adoption of ASC 606 on deferred contract acquisition costs related to the capitalization of certain sales commissions. See Deferred Commissions below for further discussion. |
(2) | Adjustment represents the impact of the adoption of ASC 606 on our deferred revenue balances. See Deferred Revenue below for further discussion. |
F-13
The impact of adoption of ASC 606 on our consolidated statement of operations and consolidated balance sheet was as follows:
Year Ended December 31, 2019 | |||||||||||
As reported ASC 606 | ASC 606 impact | Without adoption of ASC 606 (ASC 605) | |||||||||
(in thousands) | |||||||||||
Revenue: | |||||||||||
Subscription | $ | $ | $ | ||||||||
Maintenance | |||||||||||
Total recurring revenue | |||||||||||
License | ( | ) | |||||||||
Total revenue | $ | $ | ( | ) | $ | ||||||
Gross profit | ( | ) | |||||||||
Total operating expenses | |||||||||||
Operating income (loss) | ( | ) | |||||||||
Net income (loss) | $ | $ | ( | ) | $ | ||||||
December 31, 2019 | |||||||||||
As reported ASC 606 | ASC 606 impact | Without adoption of ASC 606 (ASC 605) | |||||||||
(in thousands) | |||||||||||
Assets: | |||||||||||
Prepaid and other current assets | $ | $ | ( | ) | $ | ||||||
Other assets, net | ( | ) | |||||||||
Total assets | ( | ) | |||||||||
Liabilities: | |||||||||||
Current portion of deferred revenue | |||||||||||
Deferred revenue, net of current portion | |||||||||||
Non-current deferred taxes | ( | ) | |||||||||
Total liabilities | |||||||||||
Stockholders' equity (deficit): | |||||||||||
Accumulated deficit | ( | ) | ( | ) | ( | ) | |||||
Leases
On December 31, 2019, as we no longer qualify as an emerging growth company, we retroactively adopted the FASB ASC No. 2016-02 “Leases,” or ASC 842, as of January 1, 2019 using the optional transition method in which an entity can apply the new standard at the adoption date without adjusting comparative prior periods. Historical financial results for reporting periods prior to 2019 are presented in conformity with amounts previously disclosed under the prior lease accounting standard.
The new lease accounting standard replaces existing lease accounting standards and expands disclosure requirements. The adoption of the new standard resulted in leases currently designated as operating leases being reported on our consolidated balance sheet at their net present value. We elected the package of practical expedients permitted under the transition guidance within the new standard, which, among other things, allowed us to carry forward our historical lease classification and not reassess whether any expired or existing contracts are or contain leases. Additionally, we elected to not separate lease and non-lease components for certain classes of assets and we excluded all the leases with original terms of one year or less.
F-14
Acquisitions
The purchase price of our acquired businesses is allocated to the assets acquired and the liabilities assumed based on their estimated fair values, with the excess recorded as goodwill. If applicable, we estimate the fair value of contingent consideration payments in determining the purchase price. Goodwill is allocated to our reporting units expected to benefit from the business combination based on the relative fair value at the acquisition date. During the measurement period, which may be up to one year from the acquisition date, we may record adjustments to the fair value of the tangible and intangible assets acquired and liabilities assumed, including the deferred tax asset valuation allowances and acquired income tax uncertainties, with the corresponding offset to goodwill. We include the operating results of acquisitions in our consolidated financial statements from the effective date of the acquisitions. Acquisition related costs are expensed separately from the acquisition as incurred and are primarily included in general and administrative expenses in our consolidated statements of operations.
The fair value of identifiable intangible assets is based on significant judgments made by management. We typically engage third party valuation appraisal firms to assist us in determining the fair values and useful lives of the assets acquired. The valuation estimates and assumptions are based on historical experience and information obtained by management, and include, but are not limited to, future expected cash flows earned from the product technology and discount rates applied in determining the present value of those cash flows. Unanticipated events and circumstances may occur that could affect the accuracy or validity of such assumptions, estimates or actual results. Acquired identifiable intangible assets are amortized on the straight-line method over their estimated economic lives, which are generally two to ten years for trademarks, customer relationships, customer backlog, non-competition covenants and acquired developed product technologies and ten years for intellectual property. We include amortization of acquired developed product technologies in cost of revenue and amortization of other acquired intangible assets in operating expenses in our consolidated statements of operations.
Impairment of Goodwill, Intangible Assets and Long-lived Assets
Goodwill
Indefinite-lived Intangible Assets
Long-lived Assets
We evaluate the recoverability of our long-lived assets, including finite-lived intangible assets and other assets, for impairment whenever events or changes in circumstances indicate that the carrying amount of the assets may not be recoverable. Events or changes in circumstances that could result in an impairment review include, but are not limited to, significant underperformance relative to historical or projected future operating results, significant changes in the manner of use of the acquired assets or the strategy for our overall business, and significant negative industry or economic trends. In the event that the net book value of our long-lived assets exceeds the future undiscounted net cash flows attributable to such assets, an impairment charge would be required. Impairment, if any, is recognized in the period of identification to the extent the carrying amount of an asset or asset group exceeds
F-15
Fair Value Measurements
We apply the authoritative guidance on fair value measurements for financial assets and liabilities that are measured at fair value on a recurring basis and non-financial assets and liabilities, such as goodwill, intangible assets and property, plant and equipment that are measured at fair value on a non-recurring basis.
The guidance establishes a three-tiered fair value hierarchy that prioritizes inputs to valuation techniques used in fair value calculations. The three levels of inputs are defined as follows:
Level 1: Unadjusted quoted prices for identical assets or liabilities in active markets accessible by us.
Level 2: Inputs that are observable in the marketplace other than those inputs classified as Level 1.
Level 3: Inputs that are unobservable in the marketplace and significant to the valuation.
See Note 5. Fair Value Measurements for a summary of our financial instruments accounted for at fair value on a recurring basis. The carrying amounts reported in our consolidated balance sheets for cash, accounts receivable, accounts payable and other accrued expenses approximate fair value due to relatively short periods to maturity.
Accounts Receivable
Accounts receivable represent trade receivables from customers when we have sold subscriptions, perpetual licenses or related maintenance services and have not yet received payment. We present accounts receivable net of an allowance for doubtful accounts. We maintain an allowance for doubtful accounts for estimated losses resulting from the inability of customers to make required payments. In doing so, we consider the current financial condition of the customer, the specific details of the customer account, the age of the outstanding balance and the current economic environment. Any change in the assumptions used in analyzing a specific account receivable might result in an additional allowance for doubtful accounts being recognized in the period in which the change occurs. We have historically had insignificant write-offs related to bad debts.
Property and Equipment
We record property and equipment at cost and depreciate them using the straight-line method over their estimated useful lives as follows:
Useful Life (in years) | |
Equipment, servers and computers | 3 - 5 |
Furniture and fixtures | 5 - 7 |
Software | 3 - 5 |
Leasehold improvements | Lesser of lease term or useful life |
Upon retirement or sale of property and equipment, we remove the cost of assets disposed of and any related accumulated depreciation from our accounts and credit or charge any resulting gain or loss to operating expense. We expense repairs and maintenance as they are incurred.
Research and Development Costs
F-16
Internal-Use Software and Website Development Costs
We had $7.9 million and $5.0 million of internal-use software, net capitalized as of December 31, 2019 and 2018, respectively. Amortization expense of internal-use software and website development costs was $3.5 million, $2.5 million and $1.1 million for the years ended December 31, 2019, 2018 and 2017, respectively.
Debt Issuance Costs
Contingencies
Accumulated Other Comprehensive Income (Loss)
Changes in accumulated other comprehensive income (loss) by component are summarized below:
Foreign Currency Translation Adjustments | Accumulated Other Comprehensive Income (Loss) | ||||||
(in thousands) | |||||||
Balance at December 31, 2017 | $ | $ | |||||
Other comprehensive gain (loss) before reclassification | ( | ) | ( | ) | |||
Amount reclassified from accumulated other comprehensive income (loss) | |||||||
Net current period other comprehensive income (loss) | ( | ) | ( | ) | |||
Balance at December 31, 2018 | |||||||
Other comprehensive gain (loss) before reclassification | ( | ) | ( | ) | |||
Amount reclassified from accumulated other comprehensive income (loss) | |||||||
Net current period other comprehensive income (loss) | ( | ) | ( | ) | |||
Balance at December 31, 2019 | $ | ( | ) | $ | ( | ) | |
Revenue Recognition
We generate recurring revenue from fees received for subscriptions and from the sale of maintenance services associated with our perpetual license products and license revenue from the sale of our perpetual license products. We recognize revenue related to contracts from customers when we transfer promised goods or services to customers in an amount that reflects the consideration
F-17
to which the entity expects to be entitled in exchange for those goods or services. This is determined by following a five-step process which includes (1) identifying the contract with a customer, (2) identifying the performance obligations in the contract, (3) determining the transaction price, (4) allocating the transaction price, and (5) recognizing revenue when or as we satisfy a performance obligation, as described below.
• | Identify the contract with a customer. We generally use a purchase order, an authorized credit card, an electronic or manually signed license agreement, or the receipt of a cash payment as evidence of a contract with a customer provided that collection is considered probable. We sell our products through our direct inside sales force and through our distributors and resellers. Our distributors and resellers do not carry inventory of our software and we generally require them to specify the end user of the software at the time of the order. If the distributor or reseller does not provide end-user information, then we will generally not fulfill the order. Our distributors and resellers have no rights of return or exchange for software that they purchase from us and payment for these purchases is due to us without regard to whether the distributors or resellers collect payment from their customers. Sales through resellers and distributors are typically evidenced by a reseller or distributor agreement, together with purchase orders or authorized credit cards on a transaction-by-transaction basis. |
• | Identify the performance obligations in the contract. Performance obligations promised in a contract are identified based on the goods or services that will be transferred to the customer that are separately identifiable from other promises in the contract, or distinct. If not considered distinct, the promised goods or services are combined with other goods or services and accounted for as a combined performance obligation. Determining the distinct performance obligations in a contract requires judgment. Our performance obligations primarily include perpetual and time-based licenses, maintenance support including unspecified upgrades or enhancements to new versions of our software products and software-as-a-service, or SaaS, offerings. See additional discussion of our performance obligations below. |
• | Determine the transaction price. We determine the transaction price based on the contractual consideration and the amount of consideration we expect to receive in exchange for transferring the promised goods or services to the customer. We account for sales incentives to customers, resellers or distributors as a reduction of revenue at the time we recognize the revenue from the related product sale. We report revenue net of any sales tax collected. Our return policy generally does not allow our customers to return software products. |
• | Allocate the transaction price. We allocate the transaction price of the contract to each distinct performance obligation based on a relative standalone selling price basis. Determining standalone selling prices for our performance obligations requires judgment and are based on multiple factors including, but not limited to historical selling prices and discounting practices for products and services, internal pricing policies and pricing practices in different regions and through different sales channels. For our subscription products and maintenance services, our standalone selling prices are generally observable using standalone sales or renewals. For our perpetual and time-based license products, given there are no observable standalone sales, we estimate our standalone selling prices by evaluating our historical pricing and discounting practices in observable bundled transactions. We review the standalone selling price for our performance obligations periodically and update, if needed, to ensure that the methodology utilized reflects our current pricing practices. |
• | Recognize revenue when or as we satisfy a performance obligation. Revenue is recognized when or as performance obligations are satisfied either over time or at a point in time by transferring a promised good or service. We consider this transfer to have occurred when risk of loss transfers to the customer, reseller or distributor or the customer has access to their subscription which is generally upon electronic transfer of the license key or password that provides immediate availability of the product to the purchaser. See further discussion below regarding the timing of revenue recognition for each of our performance obligations. |
F-18
The following summarizes our performance obligations from which we generate revenue:
Performance obligation | When performance obligation is typically satisfied | |
Subscription revenue | ||
SaaS offerings | Over the subscription term, once the service is made available to the customer (over time) | |
Time-based licenses | Upon the delivery of the license key or password that provides immediate availability of the product (point in time) | |
Time-based technical support and unspecified software upgrades | Ratably over the contract period (over time) | |
Maintenance revenue | ||
Technical support and unspecified software upgrades | Ratably over the contract period (over time) | |
License revenue | ||
Perpetual licenses | Upon the delivery of the license key or password that provides immediate availability of the product (point in time) | |
Recurring Revenue. Recurring revenue consists of subscription and maintenance revenue.
• | Subscription Revenue. We primarily derive subscription revenue from fees received for subscriptions to our SaaS offerings and our time-based license arrangements. We generally invoice subscription agreements monthly based on usage or in advance over the subscription period on either a monthly or annual basis. Subscription revenue for our SaaS offerings is generally recognized ratably over the subscription term once the service is made available to the customer or when we have the right to invoice for services performed. Revenue for the license performance obligation of our time-based license arrangements is recognized at a point in time upon delivery of the license key and the revenue for the technical support performance obligation of our time-based license arrangements is recognized ratably over the contract period. The amount of revenue related to the license performance obligations of our time-based license arrangements included in subscription revenue is less than 10% of our total consolidated revenue. Our subscription revenue includes our MSP, application performance management and IT service management, or ITSM, products. |
• | Maintenance Revenue. We derive maintenance revenue from the sale of maintenance services associated with our perpetual license products. We typically include |
License Revenue. We derive license revenue from the sale of our perpetual licenses. Revenue for the license performance obligation of our perpetual license arrangements is recognized at a point in time upon delivery of the electronic license key. Perpetual license arrangements are invoiced upon delivery.
Deferred Revenue
Deferred revenue primarily consists of transaction prices allocated to remaining performance obligations from maintenance services associated with our perpetual license products which are delivered over time. We generally bill maintenance agreements annually in advance for services to be performed over a 12 -month period. Customers have the option to purchase maintenance renewals for periods other than 12 months. We initially record the amounts allocated to maintenance performance obligations as deferred revenue and recognize these amounts ratably on a daily basis over the term of the maintenance agreement. We record deferred revenue that will be recognized during the succeeding 12 -month period as current deferred revenue and the remaining portion is recorded as long-term deferred revenue.
F-19
Details of our total deferred revenue balance was as follows:
Total Deferred Revenue | |||
(in thousands) | |||
Balance at December 31, 2018 | $ | ||
Adoption of ASC 606 | ( | ) | |
Deferred revenue recognized | ( | ) | |
Additional amounts deferred | |||
Deferred revenue acquired in business combinations | |||
Balance at December 31, 2019 | $ | ||
We expect to recognize revenue related to these remaining performance obligations as follows:
Revenue Recognition Expected by Period | |||||||||||||||
Total | Less than 1 year | 1-3 years | More than 3 years | ||||||||||||
(in thousands) | |||||||||||||||
Expected recognition of deferred revenue | $ | $ | $ | $ | |||||||||||
Deferred Commissions
Deferred commissions, which consist of direct and incremental sales commissions and related fringe benefits, are capitalized using the portfolio approach if we expect to benefit from those costs for more than one year. Deferred commissions are allocated to each performance obligation within the contract and amortized on a straight-line basis over the expected benefit period of the related performance obligations. We expense commissions as incurred when the expected amortization period is one year or less. Deferred commissions allocated to new maintenance arrangements and certain SaaS offerings are amortized over an average expected benefit period of approximately four to six years which was determined based on the expected life of our technology. Deferred commissions allocated to perpetual licenses, maintenance renewal arrangements and MSP offerings are expensed as incurred. Deferred commissions are classified as current or non-current assets based on the timing the expense will be recognized. The current and non-current portions of our deferred commissions are included in prepaid and other current assets and other assets, net respectively, in our consolidated balance sheets. The amortization of our deferred commissions is included in sales and marketing expense in our consolidated statement of operations.
Details of our deferred commissions balance was as follows:
Deferred Commissions | |||
(in thousands) | |||
Balance at December 31, 2018 | $ | ||
Adoption of ASC 606 | |||
Commissions capitalized | |||
Amortization recognized | ( | ) | |
Balance at December 31, 2019 | $ | ||
Classified as: | |||
Current | $ | ||
Non-current | |||
Total deferred commissions | $ | ||
Cost of Revenue
Cost of recurring revenue. Cost of recurring revenue consists of technical support personnel costs which includes salaries, bonuses and stock-based compensation and related employer-paid payroll taxes for technical support personnel, as well as an allocation of overhead costs. Royalty fees, public cloud infrastructure and hosting fees related to our application performance
F-20
management, MSP and ITSM products are also included in cost of recurring revenue. Cost of license revenue is immaterial to our financial statements and is included in cost of recurring revenue in our consolidated statements of operations.
Amortization of acquired technologies. Amortization of acquired technologies included in cost of revenue relate to our licensed products and subscription products as follows:
Year Ended December 31, | |||||||||||
2019 | 2018 | 2017 | |||||||||
(in thousands) | |||||||||||
Amortization of acquired license technologies | $ | $ | $ | ||||||||
Amortization of acquired subscription technologies | |||||||||||
Total amortization of acquired technologies | $ | $ | $ | ||||||||
Advertising
We expense advertising costs as incurred. Advertising expense is included in sales and marketing expenses in our consolidated statements of operations.
Year Ended December 31, | |||||||||||
2019 | 2018 | 2017 | |||||||||
(in thousands) | |||||||||||
Advertising expense | $ | $ | $ | ||||||||
Leases
We lease facilities worldwide and certain equipment under non-cancellable lease agreements. During 2019, we adopted the new lease accounting guidance, ASC 842 as discussed above. Under ASC 842, we evaluate if a contract is or contains a lease at inception of the contract. If we determine that a contract is or contains a lease, we determine the appropriate lease classification and recognize a right-of-use asset and lease liability at the commencement date of the lease based on the present value of fixed lease payments over the lease term reduced by lease incentives. To determine the present value of lease payments, we use an estimated incremental borrowing rate based on the interest rate a similar borrowing on a collateralized basis would incur based on information available on the lease commencement date as none of our leases provide an implicit rate. We generally base this discount rate on the interest rate incurred by our senior secured debt, adjusted for considerations for the value, term and currency of the lease. Lease terms include options to extend or terminate the lease when it is reasonably certain that we will exercise those options.
We recognize right-of-use assets and lease liabilities for leasing arrangements with terms greater than one year. Certain lease contracts include obligations to pay for other services, such as operations and maintenance. We account for lease and non-lease components in a contract as a single lease component for all classes of underlying assets except certain classes of equipment. Right-of-use assets are tested for impairment in the same manner as long-lived assets.
The terms of some of our lease agreements provide for rental payments on a graduated basis. Operating lease costs are recognized on a straight-line basis over the lease term and recorded in the appropriate income statement line item based on the asset or a headcount allocation for office leases. Certain of our office leases require the payment of our proportionate share of common area maintenance or service charges. As we have elected to account for lease and non-lease components as a single lease component for our real estate leases, these costs are included in variable lease costs. In addition, certain of our leases may include variable payments based on measures that include changes in price indices or market interest rates which are included in variable lease costs and expensed as incurred. We had no finance leases as of and for the year ended December 31, 2019. See Note 7. Leases for additional information regarding our lease arrangements.
For the years ended December 31, 2018 and 2017 prior to the adoption of ASC 842, we accounted for leases under the previous lease accounting guidance and recognized rent expense on a straight-line basis over the lease period and accrued rent expense incurred but not paid. Cash or lease incentives, or tenant allowances, received pursuant to certain leases were recognized on a straight-line basis as a reduction to rent over the lease term. The unamortized portion of tenant allowances were included in accrued liabilities and other and other long-term liabilities.
F-21
Income Taxes
We use the liability method of accounting for income taxes as set forth in the authoritative guidance for accounting for income taxes. Under this method, we recognize deferred tax liabilities and assets for the expected future tax consequences of temporary differences between the respective carrying amounts and tax basis of our assets and liabilities.
The guidance on accounting for uncertainty in income taxes prescribes a recognition threshold and measurement attribute for financial statement disclosure of tax positions taken or expected to be taken on a tax return. We accrue interest and penalties related to unrecognized tax benefits as a component of income tax expense.
Stock-Based Compensation
We have granted our employees, directors and certain contractors stock-based incentive awards. These awards are in the form of stock options, restricted stock and restricted stock units. We measure stock-based compensation expense for all share-based awards granted to employees and directors based on the estimated fair value of those awards on the date of grant. The fair value of stock option awards is estimated using a Black-Scholes valuation model. The fair value of restricted stock unit awards and restricted stock is determined using the fair market value of the underlying common stock on the date of grant less any amount paid at the time of the grant, or intrinsic value. Our stock awards vest on service-based or performance-based vesting conditions. For our service-based awards, we recognize stock-based compensation expense on a straight-line basis over the service period of the award. For our performance-based awards, we recognize stock-based compensation expense on a graded-vesting basis over the service period of each separately vesting tranche of the award, if it is probable that the performance target will be achieved.
We estimated the fair value for stock options at the date of grant using the Black-Scholes option pricing model with the following weighted-average assumptions:
Year Ended December 31, | ||||||||
2019* | 2018 | 2017 | ||||||
Expected dividend yield | % | % | % | |||||
Volatility | % | % | % | |||||
Risk-free rate of return | — | 2.6 - 2.9% | 1.9 - 2.2% | |||||
Expected life | — | |||||||
________________
* | There were no grants of stock options made in the year ended December 31, 2019. |
F-22
The impact to our income (loss) before income taxes due to stock-based compensation expense and the related income tax benefits were as follows:
Year Ended December 31, | |||||||||||
2019 | 2018 | 2017 | |||||||||
(in thousands) | |||||||||||
Impact to income (loss) before income taxes due to stock-based compensation | $ | $ | $ | ||||||||
Income tax benefit related to stock-based compensation | |||||||||||
Net Income (Loss) Per Share
We calculate basic and diluted net income (loss) per share attributable to common stockholders in conformity with the two-class method required for companies with participating securities. Under the two-class method, basic and diluted net income (loss) per share is determined by calculating net income (loss) per share for common stock and participating securities based on participation rights in undistributed earnings. We computed basic net income (loss) per share available to common stockholders by dividing net income (loss) available to common stockholders by the weighted-average number of common shares outstanding during the reporting period. Redeemable convertible Class A Common Stock was not included in the basic or diluted net income (loss) per share calculations for the periods it was outstanding as it was contingently convertible upon a future event. Net income (loss) available to common stockholders is defined as net income (loss), less the accretion of dividends on our redeemable convertible Class A Common Stock and earnings allocated to unvested restricted stock plus the gain on conversion of our redeemable convertible Class A Common Stock at our IPO. Our unvested incentive restricted stock has the right to receive non-forfeitable dividends on an equal basis with common stock and therefore are considered participating securities that must be included in the calculation of net income per share using the two-class method. The holders of unvested incentive restricted stock do not have a contractual obligation to share in our losses. As such, in periods in which we had net losses available to common stockholders, our net losses were not allocated to these participating securities.
Concentrations of Risks
December 31, | |||||||
2019 | 2018 | ||||||
(in thousands) | |||||||
Demand deposit accounts | $ | $ | |||||
Money market funds | |||||||
Total cash and cash equivalents | $ | $ | |||||
Our cash deposited with banks in demand deposit accounts may exceed the amount of insurance provided on these deposits. Our cash equivalents invested in money market funds are not insured and we are therefore at risk of losing our full investment. Generally, we may withdraw our cash deposits and redeem our invested cash equivalents upon demand. We strive to maintain our cash deposits and invest in money market funds with multiple financial institutions of reputable credit and therefore bear minimal credit risk.
F-23
At December 31, 2019 and 2018, no distributor, reseller or direct customer represented a significant concentration of our outstanding accounts receivable balance. We do not believe that our business is substantially dependent on any distributor or that the loss of a distributor relationship would have a material adverse effect on our business.
3. Acquisitions
2019 Acquisitions
SAManage
On April 30, 2019, we acquired SAManage Ltd., or Samanage, an IT service desk solution company, for approximately $342.1 million, including $341.5 million paid in cash and $0.6 million in fair value of replacement equity awards attributable to pre-acquisition service. By acquiring Samanage, we entered the ITSM market and based on the acquired technology introduced the SaaS-based service desk solution, SolarWinds Service Desk, into our product portfolio. We funded the transaction with cash on hand and $35.0 million of borrowings under our Revolving Credit Facility. We incurred $2.1 million in acquisition related costs, which are primarily included in general and administrative expense for the year ended December 31, 2019. Goodwill for this acquisition is not deductible for tax purposes.
The following table summarizes the consideration paid and the amounts recognized for the assets acquired and liabilities assumed:
Total Fair Value | |||
(in thousands) | |||
Current assets, including cash acquired of $6.2 million | $ | ||
Property and equipment and other assets | |||
Identifiable intangible assets | |||
Goodwill | |||
Current liabilities | ( | ) | |
Other long-term liabilities | ( | ) | |
Deferred revenue | ( | ) | |
Total consideration | $ | ||
The following table summarizes the fair value of the acquired identifiable intangible assets and weighted-average useful life:
Fair Value | Weighted-average useful life | ||||
(in thousands) | (in years) | ||||
Developed product technologies | $ | ||||
Customer relationships | |||||
Total identifiable intangible assets | $ | ||||
The amount of revenue related to the Samanage acquisition included in our consolidated financial statements from the effective date of the acquisition is insignificant. We estimate the amount of net loss related to the Samanage acquisition included in our consolidated financial statements from the effective date of the acquisition is $25.0 million, which includes $7.4 million in amortization of acquired intangible assets and $5.2 million in stock-based compensation expense. Pro forma information for the acquisition has not been provided because the impact of the historical financials on our revenue, net income (loss) and net income (loss) per share is not material.
VividCortex
On December 10, 2019, we acquired VividCortex, Inc., or VividCortex, a SaaS-based database performance management solution company, for approximately $117.6 million, including $4.5 million of cash acquired. We funded the transaction with cash on hand. We incurred $0.5 million in acquisition related costs, which are primarily included in general and administrative expense for the year ended December 31, 2019. Goodwill for this acquisition is not deductible for tax purposes.
The initial determination of the fair value of the assets acquired and liabilities assumed is based on a preliminary valuation and the estimates and assumptions for these items are subject to change as we obtain additional information during the measurement
F-24
period. Subsequent changes to the purchase price or other fair value adjustments determined during the measurement period will be recorded as an adjustment to goodwill.
The following table summarizes the consideration paid and the amounts recognized for the assets acquired and liabilities assumed:
Total Fair Value | |||
(in thousands) | |||
Current assets, including cash acquired of $4.5 million | $ | ||
Property and equipment and other assets | |||
Identifiable intangible assets | |||
Goodwill | |||
Current liabilities | ( | ) | |
Other long-term liabilities | ( | ) | |
Deferred revenue | ( | ) | |
Total consideration | $ | ||
The following table summarizes the fair value of the acquired identifiable intangible assets and weighted-average useful life:
Fair Value | Weighted-average useful life | ||||
(in thousands) | (in years) | ||||
Developed product technologies | $ | ||||
Customer relationships | |||||
Total identifiable intangible assets | $ | ||||
We estimate the amounts of revenue and net loss related to the VividCortex acquisition included in our consolidated financial statements from the effective date of the acquisition are insignificant for the year ended December 31, 2019. Pro forma information for the acquisition has not been provided because the impact of the historical financials on our revenue, net income (loss) and net income (loss) per share is not material.
2018 Acquisitions
In the year ended December 31, 2018, we completed acquisitions for a combined purchase price of approximately $62.9 million in cash, including $2.4 million of cash acquired. The acquisitions were funded with available cash on hand. We incurred $1.2 million in acquisition related costs, which are included in general and administrative expense for the year ended December 31, 2018. Goodwill for these acquisitions is no t deductible for tax purposes.
The following table summarizes the consideration paid and the amounts recognized for the assets acquired and liabilities assumed for our acquisitions completed in the year ended December 31, 2018:
Total Fair Value | |||
(in thousands) | |||
Current assets, including cash acquired | $ | ||
Deferred tax asset | |||
Fixed assets | |||
Identifiable intangible assets | |||
Goodwill | |||
Current liabilities | ( | ) | |
Deferred tax liabilities | ( | ) | |
Deferred revenue | ( | ) | |
Total consideration | $ | ||
F-25
The following table summarizes the fair value of the acquired identifiable intangible assets and weighted-average useful life:
Fair Value | Weighted-average useful life | ||||
(in thousands) | (in years) | ||||
Developed product technologies | $ | ||||
Customer relationships | |||||
Trademarks | |||||
Total identifiable intangible assets | $ | ||||
The amounts of revenue and net loss related to these acquisitions included in our consolidated financial statements from the effective date of the respective acquisitions are insignificant for the year ended December 31, 2018. Pro forma information for these acquisitions has not been provided because the impact of the historical financials on our revenue, net loss and net income (loss) per share is not material.
We recognize revenue on acquired products in accordance with our revenue recognition policy as described above in Note 2. Summary of Significant Accounting Policies.
4. Goodwill and Intangible Assets
Goodwill
The following table reflects the changes in goodwill for the years ended December 31, 2019 and 2018:
(in thousands) | |||
Balance at December 31, 2017 | $ | ||
Acquisitions | |||
Foreign currency translation and other adjustments | ( | ) | |
Balance at December 31, 2018 | |||
Acquisitions | |||
Foreign currency translation and other adjustments | ( | ) | |
Balance at December 31, 2019 | $ | ||
The goodwill from acquisitions resulted primarily from our expectations that we will now be able to offer our customers additional products in new markets. Additionally, we expect the acquisitions will attract new customers for our entire line of products.
Intangible Assets
Intangible assets consisted of the following at December 31, 2019 and 2018:
December 31, 2019 | December 31, 2018 | ||||||||||||||||||||||
Gross Carrying Amount | Accumulated Amortization | Net | Gross Carrying Amount | Accumulated Amortization | Net | ||||||||||||||||||
(in thousands) | |||||||||||||||||||||||
Developed product technologies | $ | $ | ( | ) | $ | $ | $ | ( | ) | $ | |||||||||||||
Customer relationships | ( | ) | ( | ) | |||||||||||||||||||
Intellectual property | ( | ) | ( | ) | |||||||||||||||||||
Trademarks | ( | ) | ( | ) | |||||||||||||||||||
Total intangible assets | $ | $ | ( | ) | $ | $ | $ | ( | ) | $ | |||||||||||||
F-26
Intangible asset amortization expense was as follows:
Year Ended December 31, | |||||||||||
2019 | 2018 | 2017 | |||||||||
(in thousands) | |||||||||||
Intangible asset amortization expense | $ | $ | $ | ||||||||
As of December 31, 2019, we estimate aggregate intangible asset amortization expense to be as follows:
Estimated Amortization | |||
(in thousands) | |||
2020 | $ | ||
2021 | |||
2022 | |||
2023 | |||
2024 | |||
The expected amortization expense is an estimate. Actual amounts of amortization expense may differ from estimated amounts due to additional intangible asset acquisitions, changes in foreign currency exchange rates, impairment of intangible assets, future changes to expected asset lives of intangible assets and other events. We had $82.4 million and $82.8 million of trademarks recorded with an indefinite life that are not amortized at December 31, 2019 and 2018, respectively. Our indefinite-lived trademarks primarily include the SolarWinds and THWACK trademarks.
5. Fair Value Measurements
The following table summarizes the fair value of our financial assets that were measured on a recurring basis as of December 31, 2019 and 2018. There have been no transfers between fair value measurement levels during the year ended December 31, 2019.
Fair Value Measurements at December 31, 2019 Using | |||||||||||||||
Quoted Prices in Active Markets for Identical Assets (Level 1) | Significant Other Observable Inputs (Level 2) | Significant Unobservable Inputs (Level 3) | Total | ||||||||||||
(in thousands) | |||||||||||||||
Money market funds | $ | $ | $ | $ | |||||||||||
Trading security | |||||||||||||||
Total assets | $ | $ | $ | $ | |||||||||||
Fair Value Measurements at December 31, 2018 Using | |||||||||||||||
Quoted Prices in Active Markets for Identical Assets (Level 1) | Significant Other Observable Inputs (Level 2) | Significant Unobservable Inputs (Level 3) | Total | ||||||||||||
(in thousands) | |||||||||||||||
Money market funds | $ | $ | $ | $ | |||||||||||
F-27
6. Property and Equipment
Property and equipment, including software, consisted of the following:
December 31, | |||||||
2019 | 2018 | ||||||
(in thousands) | |||||||
Equipment, servers and computers | $ | $ | |||||
Furniture and fixtures | |||||||
Software | |||||||
Leasehold improvements | |||||||
$ | $ | ||||||
Less: Accumulated depreciation and amortization | ( | ) | ( | ) | |||
Property and equipment, net | $ | $ | |||||
Depreciation and amortization expense on property and equipment was as follows:
Year Ended December 31, | |||||||||||
2019 | 2018 | 2017 | |||||||||
(in thousands) | |||||||||||
Depreciation and amortization | $ | $ | $ | ||||||||
7. Leases
We lease our offices and do not own any real estate. Our corporate headquarters is located in Austin, Texas and currently consists of approximately 348,000 square feet. We also lease office space domestically and internationally in various locations for our operations, including facilities located in Cork, Ireland; Brno, Czech Republic; Durham, North Carolina; Manila, Philippines; Ottawa, Canada; Dundee, United Kingdom; Krakow, Poland; Lehi, Utah and Singapore. In addition, we lease certain information technology, office and other equipment. Our leases are all classified as operating and generally have remaining terms of less than one year to 13 years.
Subsequent to the adoption of ASC 842, the components of operating lease costs for the year ended December 31, 2019 were as follows:
Year Ended December 31, | |||
2019 | |||
(in thousands) | |||
Operating lease costs | $ | ||
Variable lease costs(1) | |||
Short-term lease costs | |||
Sublease income received | ( | ) | |
Total lease costs | $ | ||
(1) | Primarily includes common area maintenance and other service charges for leases in which we pay a proportionate share of those costs as we have elected to not separate lease and non-lease components for our office leases. |
F-28
Maturities of our operating lease liabilities as of December 31, 2019 were as follows:
December 31, 2019 | |||
(in thousands) | |||
2020 | $ | ||
2021 | |||
2022 | |||
2023 | |||
2024 | |||
Thereafter | |||
Total minimum lease payments | |||
Less: imputed interest | ( | ) | |
Present value of operating lease liabilities | $ | ||
As of December 31, 2019, the weighted-average remaining lease term of our operating leases were 7.6 years and the weighted-average discount rate used in the calculation of our lease liabilities was 5.0 %.
During 2019, we entered into various lease agreements in which the lease did not commence prior to December 31, 2019 and therefore the lease liabilities and corresponding right-of-use assets had not been recorded in our consolidated balance sheet. We expect to take control of the leased assets beginning in 2020 and our future minimum lease payments under these leases is approximately $52.0 million over lease terms of two to eleven years .
Supplemental cash flow information related to our leases was as follows:
Year Ended December 31, | |||
2019 | |||
(in thousands) | |||
Cash paid for amounts included in the measurement of operating lease liabilities | $ | ||
Right-of-use assets obtained in exchange for operating lease liabilities | |||
As of December 31, 2018, as previously disclosed in our 2018 Annual Report on Form 10-K, future minimum lease payments under non-cancellable operating leases accounted for under the previous lease accounting guidance were as follows:
Minimum Lease Payments | |||
(in thousands) | |||
2019 | $ | ||
2020 | |||
2021 | |||
2022 | |||
2023 | |||
Thereafter | |||
Total minimum lease payments | $ | ||
Prior to our adoption of ASC 842, rent expense was as follows:
Year Ended December 31, | |||||||
2018 | 2017 | ||||||
(in thousands) | |||||||
Rent expense | $ | $ | |||||
F-29
8. Accrued Liabilities and Other
Accrued liabilities and other current liabilities were as follows:
December 31, | |||||||
2019 | 2018 | ||||||
(in thousands) | |||||||
Payroll-related accruals | $ | $ | |||||
Other accrued expenses and current liabilities | |||||||
Total accrued liabilities and other | $ | $ | |||||
9. Debt
Debt Agreements
The following table summarizes information relating to our debt:
December 31, | December 31, | ||||||||||||
2019 | 2018 | ||||||||||||
Amount | Effective Rate | Amount | Effective Rate | ||||||||||
(in thousands, except interest rates) | |||||||||||||
Revolving credit facility | $ | % | $ | % | |||||||||
First Lien Term Loan (as amended) due Feb 2024 | % | % | |||||||||||
Total principal amount | |||||||||||||
Unamortized discount and debt issuance costs | ( | ) | ( | ) | |||||||||
Total debt | |||||||||||||
Less: Current portion of long-term debt | ( | ) | ( | ) | |||||||||
Total long-term debt | $ | $ | |||||||||||
Senior Secured Debt
Senior Secured First Lien Credit Facilities
In connection with the Take Private in 2016, we entered into a first lien credit agreement with Credit Suisse AG, Cayman Islands Branch, or Credit Suisse, as administrative agent and collateral agent, and a syndicate of institutional lenders and financial institutions, or Initial First Lien Credit Agreement.
In February 2017, we entered into Amendment No. 3 to the Initial First Lien Credit Agreement, or Amendment No. 3, which replaced the outstanding borrowings with a new $1.695 billion U.S. dollar term loan, or 2017 Refinancing First Lien Term Loan. For certain lenders of the syndicate, Amendment No. 3 was determined to be a debt extinguishment and, accordingly, a loss on debt extinguishment of $18.6 million was recorded to other income (expense) in the consolidated statement of operations for the year ended December 31, 2017.
In March 2018, we entered into Amendment No. 4 to the Initial First Lien Credit Agreement, or Amendment No. 4, which replaced the outstanding borrowings with a new $1.99 billion U.S. dollar term loan, or First Lien Term Loan. The Initial First Lien Credit Agreement, as amended, is referred to here as the First Lien Credit Agreement. The proceeds of the First Lien Term Loan were used to repay all outstanding borrowings including accrued interest under the 2017 Refinancing First Lien Term Loan and a portion of the Second Lien Notes (as defined below), including accrued interest and related transaction costs. In connection with Amendment No. 4, a loss on debt extinguishment of $21.4 million was recorded to other income (expense) in the consolidated statement of operations for the year ended December 31, 2018.
F-30
The First Lien Credit Agreement provides for senior secured first lien credit facilities, consisting of the following as of December 31, 2019:
• | a $ |
• | a $ |
Prior to the completion of our IPO in October 2018, borrowings under our Revolving Credit Facility bore interest at a floating rate which was, at our option, either (1) a Eurodollar rate for a specified interest period plus an applicable margin of 3.00 % or (2) a base rate plus an applicable margin of 2.00 %. Upon completion of our IPO, the applicable margins for Eurodollar rate and base rate borrowings were reduced to 2.50 % and to 1.50 %, respectively. The Eurodollar rate applicable to the Revolving Credit Facility is subject to a “floor” of 0.0 %.
Prior to the completion of our IPO, borrowings under our First Lien Term Loan bore interest at a floating rate which was, at our option, either (1) a Eurodollar rate for a specified interest period plus an applicable margin of 3.00 % or (2) a base rate plus an applicable margin of 2.00 %. Upon completion of our IPO, the applicable margins for Eurodollar and base rate borrowings were reduced to 2.75 % and 1.75 %, respectively. The Eurodollar rate applicable to the First Lien Term Loan is subject to a “floor” of 0.0 %.
The Eurodollar rate is equal to an adjusted London Interbank Offered Rate, or LIBOR, for a one-, two-, three- or six-month interest period with a LIBOR floor of 0 %. The base rate for any day is a fluctuating rate per annum equal to the highest of (a) the rate of interest in effect for such day as publicly announced by Credit Suisse as its “prime rate” and (b) the federal funds effective rate in effect on such day plus 0.50 % and (c) the one-month adjusted LIBOR plus 1.0 % per annum.
The First Lien Term Loan requires equal quarterly repayments equal to 0.25 % of the original principal amount.
In addition to paying interest on loans outstanding under the Revolving Credit Facility and the First Lien Term Loan, we are required to pay a commitment fee of 0.50 % per annum of unused commitments under the Revolving Credit Facility. The commitment fee is subject to a reduction to 0.375 % per annum based on our first lien net leverage ratio.
The First Lien Credit Agreement contains a number of covenants that, among other things, restrict, subject to certain exceptions, our ability to: incur additional indebtedness; incur liens; engage in mergers, consolidations, liquidations or dissolutions; pay dividends and distributions on, or redeem, repurchase or retire our capital stock; and make certain investments, acquisitions, loans, or advances. In addition, the terms of the First Lien Credit Agreement include a financial covenant which requires that, at the end of each fiscal quarter, if the aggregate amount of borrowings under the Revolving Credit Facility exceeds 35 % of the aggregate commitments under the Revolving Credit Facility, our first lien net leverage ratio cannot exceed 7.40 to 1.00. The First Lien Credit Agreement also contains certain customary representations and warranties, affirmative covenants and events of default. As of December 31, 2019, we were in compliance with all covenants of the First Lien Credit Agreement.
The following table summarizes the future minimum principal payments under the First Lien Term Loan outstanding as of December 31, 2019:
As of December 31, 2019 | |||
(in thousands) | |||
2020 | $ | ||
2021 | |||
2022 | |||
2023 | |||
2024 | |||
Total minimum principal payments | $ | ||
Senior Secured Second Lien Credit Facility
In February 2016, in connection with the Take Private, we issued senior secured second lien floating rate notes, or the Second Lien Notes, with approximately $580.0 million aggregate principal amount due in February 2024. In May 2016, we entered into Amendment No.1 to the Second Lien Notes and issued an additional $100.0 million to finance a portion of an acquisition. The Second Lien Notes bore interest at a rate per annum, reset quarterly, equal to a three-month Adjusted LIBOR Rate, with a “floor” of 1.0 %, plus 8.75 %.
F-31
In March 2018, we terminated the agreements governing our Second Lien Notes and repaid or exchanged the then-outstanding principal on our Second Lien Notes of $680.0 million and replaced the Second Lien Notes with a new second lien credit agreement, or the Second Lien Credit Agreement, with Wilmington Trust, National Association or Wilmington Trust, as administrative agent and collateral agent, and certain other financial institutions. The Second Lien Credit Agreement provided for a $315.0 million U.S. dollar term loan, or the Second Lien Term Loan, with a final maturity of February 5, 2025 and did not require periodic principal payments. In connection with the redemption and exchange of our Second Lien Notes, a loss on debt extinguishment of $39.2 million, which includes a $22.7 million redemption premium, was recorded to other income (expense) in the consolidated statement of operations for the year ended December 31, 2018.
10. Redeemable Convertible Class A Common Stock
Prior to the conversion of Class A Common Stock into common stock at the IPO in October 2018, the Class A Common Stock accrued dividends at a rate of 9 % per annum and had a liquidation preference equal to $1,000 per share plus any accrued and unpaid dividends. Redeemable convertible Class A Common Stock was recorded at liquidation value plus accrued, unpaid dividends in our consolidated balance sheets.
11. Stockholders’ Equity (Deficit) and Stock-Based Compensation
Common Stock and Preferred Stock
As set by our certificate of incorporation, the Company has authorized 1,000,000,000 shares of common stock, par value of $0.001 per share, and 50,000,000 shares of preferred stock, par value of $0.001 per share. Each share of common stock entitles the holder thereof to one vote on each matter submitted to a vote at any meeting of stockholders.
Equity Incentive Awards
2016 Equity Incentive Plan
The board of directors adopted, and the stockholders approved, the SolarWinds Corporation Equity Plan, or 2016 Plan, in June 2016. Under the 2016 Plan, the Company was able to sell or grant shares of Class A Common Stock and Class B Common Stock and common stock-based awards, including nonqualified stock options, to the Company’s employees, consultants, directors, managers and advisors. Our ability to grant any future equity awards under the 2016 Plan terminated in October 2018 following the consummation of our IPO. Our 2016 Plan will continue to govern the terms and conditions of all outstanding equity awards granted under the 2016 Plan.
The Company has issued common stock-based incentive awards, consisting of nonqualified stock options exercisable for shares of common stock and restricted shares of common stock, under the 2016 Plan to employees and certain members of the Company’s board of directors. Options and restricted stock issued under the 2016 Plan to employees at the level of vice president and below generally vest annually over four or five years on each anniversary of the vesting commencement date, subject to continued employment through each applicable vesting date. Options and restricted stock issued under the 2016 Plan to employees at the level of group vice president and above generally vest 50 % annually over four or five years on each anniversary of the vesting commencement date and 50 % annually over four or five years after the end of each applicable fiscal year provided specified performance targets set by the board of directors are achieved for that fiscal year, subject to continued employment through each
F-32
applicable vesting date. The term of an incentive stock option granted under our 2016 Plan may not exceed ten years . Under the terms of the applicable stock option agreements and restricted stock purchase agreements, the Company has the right (but will not be required) to repurchase restricted stock that has been purchased by an employee or director in the event that stockholder ceases to be employed or engaged (as applicable) by the Company for any reason or in the event of a change of control or due to certain regulatory burdens. The repurchase price for any unvested shares is equal to the lesser of (i) the price the stockholder paid for those shares and (ii) the fair market value of those shares. The repurchase price for any vested shares is equal to the fair market value of those shares unless the stockholder was terminated for cause or the stockholder violated any restrictive covenants in its agreements with the Company. If a stockholder is terminated for cause or violates any restrictive covenants, the repurchase price for the stockholder’s vested shares is the same as for unvested shares.
We have granted employees restricted stock and options at exercise prices equal to the fair value of the underlying common stock at the time of grant, as determined by our board of directors on a contemporaneous basis. As of December 31, 2019, common stock-based incentive awards of 5,122,050 were outstanding under the 2016 Plan consisting of 2,105,825 stock options and 3,016,225 shares of restricted common stock. For the years ended December 31, 2019, 2018 and 2017, the Company repurchased 407,200 , 272,133 and 640,454 shares, respectively, of vested and unvested restricted common stock upon employee terminations.
2018 Equity Incentive Plan
In October 2018, the board of directors adopted, and the stockholders approved, the SolarWinds Corporation 2018 Equity Incentive Plan, or 2018 Plan. Under the 2018 Plan, the Company is able to sell or grant shares of common stock-based awards, including nonstatutory stock options or incentive stock options, stock appreciation rights, restricted stock, restricted stock units, performance stock units and other cash-based or stock-based awards, to the Company’s employees, contractors, consultants, directors, managers and advisors. The term of a stock option and stock appreciation right granted under our 2018 Plan may not exceed ten years . We reserved 30,000,000 shares of our common stock for issuance under the 2018 Plan. As of December 31, 2019, stock-based incentive awards of 7,122,203 were outstanding under the 2018 Plan, consisting of 6,118,177 restricted stock units, or RSUs, and 1,004,026 performance stock units, or PSUs, at the target award amount and 21,822,569 shares were reserved for future grants.
RSUs generally vest annually over four years on each anniversary of the vesting commencement date, subject to continued employment through each applicable vesting date. PSUs generally vest over a three-year period based on the achievement of specified performance targets for the fiscal year ended December 31, 2019 and subject to continued service through the applicable vesting dates. Based on the extent to which the performance targets are achieved, vested shares may range from 0 % to 150 % of the target award amount.
Stock Awards Outside of Plan
In connection with our 2019 acquisitions, certain outstanding unvested options to purchase shares of the acquired companies were cancelled and converted into RSUs granted outside any equity plan and subject to substantially the same vesting schedules and other conditions applicable to the unvested options, but settable solely in shares of common stock of the Company. The converted RSUs generally vest on a monthly, quarterly or annual basis over one to four years, subject to continued employment through each applicable vesting date. As of December 31, 2019, stock-based incentive awards outstanding that were granted outside of an equity plan consisted of 503,707 RSUs.
Stock-based compensation expense recorded for the years ended December 31, 2019 and 2018 was $34.4 million and $5.8 million, respectively, and was immaterial for the year ended December 31, 2017.
F-33
Stock Option Awards
Option grant activity under the 2016 Plan was as follows:
Number of Shares Outstanding | Weighted- Average Exercise Price | Aggregate Intrinsic Value (in thousands) | Weighted- Average Remaining Contractual Term (in years) | |||||||||
Outstanding balances at December 31, 2018 | $ | |||||||||||
Options granted | ||||||||||||
Options exercised | ( | ) | ||||||||||
Options forfeited | ( | ) | ||||||||||
Options expired | ( | ) | ||||||||||
Outstanding balances at December 31, 2019 | $ | |||||||||||
Options exercisable at December 31, 2019 | $ | $ | ||||||||||
Options vested and expected to vest at December 31, 2019 | $ | $ | ||||||||||
Additional information regarding options follows (in thousands except for per share amounts):
Year Ended December 31, | |||||||||||
2019 | 2018 | 2017 | |||||||||
Weighted-average grant date fair value per share of options granted during the period | $ | $ | $ | ||||||||
Aggregate intrinsic value of options exercised during the period | |||||||||||
Aggregate fair value of options vested during the period | |||||||||||
The unrecognized stock-based compensation expense related to unvested stock options and subject to recognition in future periods was approximately $1.1 million as of December 31, 2019. We expect to recognize this expense over weighted average periods of approximately 2.4 years at December 31, 2019.
Restricted Stock
The following table summarizes information about restricted stock activity subject to vesting under the 2016 Plan:
Number of Shares Outstanding | ||
Unvested balances at December 31, 2018 | ||
Restricted stock granted and issued | ||
Restricted stock vested | ( | ) |
Restricted stock repurchased - unvested shares | ( | ) |
Unvested balances at December 31, 2019 | ||
Restricted stock was purchased at fair market value by the employee and common stock was issued at the date of grant. The weighted-average grant date fair market value of restricted common stock purchased was $2.10 per share and $0.67 per share for the years ended December 31, 2018 and 2017, respectively. The aggregate intrinsic value of restricted stock vested during the years ended December 31, 2019, 2018 and 2017 was $28.9 million, $3.7 million and $0.8 million, respectively.
Restricted stock is subject to certain restrictions, such as vesting and a repurchase right. The common stock acquired by the employee is restricted stock because vesting is conditioned upon (i) continued employment through the applicable vesting date and (ii) for employees at the level of group vice president and above, the achievement of certain financial performance targets determined by the board of directors. The restricted stock is subject to repurchase in the event the stockholder ceases to be employed or engaged (as applicable) by the Company for any reason or in the event of a change of control or due to certain regulatory burdens. As the restricted stock is purchased at fair market value at the time of grant, there is no stock-based compensation expense recognized related to these awards. The related liability for unvested shares is included in other long-term liabilities on the consolidated balance sheet and was $1.9 million and $2.9 million as of December 31, 2019 and 2018, respectively.
F-34
Restricted Stock Units
The following table summarizes information about restricted stock unit activity under the 2018 Plan and other awards granted outside of a plan:
Number of Units Outstanding | Weighted-Average Grant Date Fair Value Per Share | Aggregate Intrinsic Value (in thousands) | Weighted-Average Remaining Contractual Term (in years) | |||||||||
Unvested balances at December 31, 2018 | $ | |||||||||||
Restricted stock units granted | ||||||||||||
Restricted stock units vested | ( | ) | ||||||||||
Restricted stock units forfeited | ( | ) | ||||||||||
Unvested balances at December 31, 2019 | $ | $ | ||||||||||
The total fair value of restricted stock units vested during the year ended December 31, 2019 was $28.6 million. The total unrecognized stock-based compensation expense related to unvested restricted stock units and subject to recognition in future periods is $94.3 million as of December 31, 2019 and we expect to recognize this expense over a weighted-average period of 3.0 years.
Performance Stock Units
The following table summarizes information about performance stock unit activity under the 2018 Plan:
Number of Units Outstanding | Weighted-Average Grant Date Fair Value Per Share | Aggregate Intrinsic Value (in thousands) | Weighted-Average Remaining Contractual Term (in years) | |||||||||
Unvested balances at December 31, 2018 | $ | |||||||||||
Performance stock units granted | ||||||||||||
Performance stock units vested | ||||||||||||
Performance stock units forfeited | ( | ) | ||||||||||
Unvested balances at December 31, 2019 | $ | $ | ||||||||||
The total unrecognized stock-based compensation expense related to unvested performance stock units and subject to recognition in future periods is $4.9 million as of December 31, 2019 and we expect to recognize this expense over a weighted-average period of 1.4 years.
For restricted stock units and performance stock units, the number of shares issued on the date of vesting is generally net of statutory withholding requirements that we pay in cash to the appropriate taxing authorities on behalf of our employees. We withheld and retired approximately 385,000 shares to satisfy $7.3 million of employees’ tax obligations during the year ended December 31, 2019. These shares are treated as common stock repurchases in our consolidated financial statements.
Employee Stock Purchase Plan
In October 2018, our board of directors adopted and our stockholders approved our 2018 Employee Stock Purchase Plan, or the ESPP. We reserved a total of 3,750,000 shares of our common stock available for sale under our ESPP.
Our ESPP permits eligible participants to purchase common stock through payroll deductions of up to 20 % of their eligible compensation during the offering period. The ESPP will typically be implemented through consecutive six-month offering periods. Amounts deducted and accumulated from participant compensation, or otherwise funded in any participating non-U.S. jurisdiction in which payroll deductions are not permitted, are used to purchase shares of our common stock at the end of each offering period. The purchase price of the shares will be 85 % of the lesser of the fair market value of our common stock on the first day of the offering period and the fair market value on the last day of the offering period. No participant may purchase more than $25,000 worth of common stock per calendar year.
F-35
12. Net Income (Loss) Per Share
A reconciliation of net income (loss) available to common stockholders and the number of shares in the calculation of basic and diluted income (loss) per share follows:
Year Ended December 31, | |||||||||||
2019 | 2018 | 2017 | |||||||||
(in thousands) | |||||||||||
Basic net earnings (loss) per share | |||||||||||
Numerator: | |||||||||||
Net income (loss) | $ | $ | ( | ) | $ | ( | ) | ||||
Accretion of dividends on Class A common stock | ( | ) | ( | ) | |||||||
Gain on conversion of Class A common stock | |||||||||||
Earnings allocated to unvested restricted stock | ( | ) | ( | ) | |||||||
Net income (loss) available to common stockholders | $ | $ | $ | ( | ) | ||||||
Denominator: | |||||||||||
Weighted-average common shares outstanding used in computing basic net earnings (loss) per share | |||||||||||
Diluted net earnings (loss) per share | |||||||||||
Numerator: | |||||||||||
Net income (loss) available to common stockholders | $ | $ | $ | ( | ) | ||||||
Denominator: | |||||||||||
Weighted-average shares used in computing basic net earnings (loss) per share | |||||||||||
Add stock-based incentive stock awards | |||||||||||
Weighted-average shares used in computing diluted net earnings (loss) per share | |||||||||||
The following weighted-average outstanding shares of common stock equivalents were excluded from the computation of the diluted net income (loss) per share attributable to common stockholders for the periods presented because their effect would have been anti-dilutive or for which the performance condition had not been met at the end of the period:
Year Ended December 31, | ||||||||
2019 | 2018 | 2017 | ||||||
(in thousands) | ||||||||
Stock options to purchase common stock | ||||||||
Performance-based stock options to purchase common stock | ||||||||
Non-vested restricted stock incentive awards | ||||||||
Performance-based non-vested restricted stock incentive awards | ||||||||
Restricted stock units | ||||||||
Performance stock units | ||||||||
Employee stock purchase plan | ||||||||
Total anti-dilutive shares | ||||||||
Prior to the conversion at the IPO, Class A Common Stock was not included in the basic or diluted earnings (loss) per share calculations as it was contingently convertible upon a future event. See Note 10. Redeemable Convertible Class A Common Stock for additional details of the conversion of the Class A Common Stock.
F-36
13. Employee Benefit Plans
401(k) Plan
We maintain a 401(k) matching program for all eligible employees. We, as sponsor of the plan, use an independent third party to provide administrative services to the plan. We have the right to terminate the plan at any time. Employees are fully vested in all contributions to the plan. Our expense related to the plan was as follows:
Year Ended December 31, | |||||||||||
2019 | 2018 | 2017 | |||||||||
(in thousands) | |||||||||||
Employee benefit plan expense | $ | $ | $ | ||||||||
14. Related Party Transactions
Management Fee Agreement with Silver Lake Management, Thoma Bravo and TB Partners
On February 5, 2016, we entered into a Management Fee Agreement with Silver Lake Management Company IV, L.L.C. (Silver Lake Management), Thoma Bravo, LLC (Thoma Bravo) and Thoma Bravo Partners XI, L.P. (TB Partners and, collectively with Silver Lake Management and Thoma Bravo, the Managers), pursuant to which the Managers provided business and organizational strategy and financial and advisory services. Under the Management Fee Agreement, we paid to the Managers quarterly payments of $2.5 million in the aggregate, plus fees for certain corporate transactions in the Managers’ discretion. Each payment of fees under the Management Fee Agreement was allocated among the Managers as follows: 50 % to Silver Lake Management, 40.73 % to Thoma Bravo and 9.27 % to TB Partners. We also reimbursed each of the Managers for all out-of-pocket costs incurred in connection with activities under the Management Fee Agreement, and we indemnified the Managers and their respective related parties from and against all losses, claims, damages and liabilities related to the performance of the Managers obligations under the Management Fee Agreement. The Management Fee Agreement terminated upon the consummation of the IPO in October 2018 and no future payments are required.
The following table details the management fees for the respective periods:
Year Ended December 31, | |||||||
2018 | 2017 | ||||||
(in thousands) | |||||||
Silver Lake Management | $ | $ | |||||
Thoma Bravo | |||||||
TB Partners | |||||||
$ | $ | ||||||
F-37
15. Income Taxes
U.S. and international components of income (loss) before income taxes were as follows:
Year Ended December 31, | |||||||||||
2019 | 2018 | 2017 | |||||||||
(in thousands) | |||||||||||
U.S. | $ | ( | ) | $ | ( | ) | $ | ( | ) | ||
International | ( | ) | ( | ) | |||||||
Income (loss) before income taxes | $ | $ | ( | ) | $ | ( | ) | ||||
Income tax expense (benefit) was composed of the following:
Year Ended December 31, | |||||||||||
2019 | 2018 | 2017 | |||||||||
(in thousands) | |||||||||||
Current: | |||||||||||
Federal | $ | $ | ( | ) | $ | ||||||
State | |||||||||||
International | |||||||||||
Deferred: | |||||||||||
Federal | ( | ) | ( | ) | ( | ) | |||||
State | ( | ) | |||||||||
International | ( | ) | ( | ) | ( | ) | |||||
( | ) | ( | ) | ( | ) | ||||||
$ | $ | ( | ) | $ | |||||||
F-38
The difference between the income tax expense (benefit) derived by applying the federal statutory income tax rate to our income (loss) before income taxes and the amount recognized in our consolidated financial statements is as follows:
Year Ended December 31, | |||||||||||
2019 | 2018 | 2017 | |||||||||
(in thousands) | |||||||||||
Expense (benefit) derived by applying the federal statutory income tax rate to income (loss) before income taxes | $ | $ | ( | ) | $ | ( | ) | ||||
State taxes, net of federal benefit | ( | ) | |||||||||
Permanent items | ( | ) | ( | ) | |||||||
Impact of the Tax Act | |||||||||||
One-time transition tax | |||||||||||
Rate change | ( | ) | |||||||||
Domestic production activity benefit | ( | ) | |||||||||
Foreign-derived intangible income | ( | ) | |||||||||
Research and experimentation tax credits | ( | ) | ( | ) | ( | ) | |||||
Withholding tax | |||||||||||
Valuation allowance for deferred tax assets | |||||||||||
Stock-based compensation | ( | ) | |||||||||
Effect of foreign operations | |||||||||||
$ | $ | ( | ) | $ | |||||||
The effective tax rate for the year ended December 31, 2019 increased from the year ended December 31, 2018 primarily due to the valuation allowance recognized on the deferred tax assets of the entities acquired in the Samanage acquisition, partially offset by the foreign-derived intangible income deduction.
Included in the provisional amount recorded for the year ended December 31, 2017 was a one-time transition tax of $130.8 million on our accumulated foreign earnings. We have elected to pay the related liability due to this transition tax of $120.8 million over eight years. This income tax expense was partially offset by $91.5 million related to the re-measurement of our deferred tax assets and liabilities at the revised U.S. statutory rates.
During 2018, we completed our accounting for the income tax effects of the Tax Cuts and Jobs Act, or Tax Act. Upon further analysis of the Tax Act, additional guidance issued by the U.S. Treasury Department, state taxing authorities, and other standard-setting bodies, we finalized our calculation of the transition tax during the year ended December 31, 2018. We recognized an additional expense of $0.1 million to the provisional amounts noted above and included these adjustments as a component of income tax expense from continuing operations. We reduced our liability related to the transition tax by $9.6 million. The final transition tax liability of $111.2 million will be paid over eight years.
F-39
The components of the net deferred tax amounts recognized in the accompanying consolidated balance sheets were:
December 31, | |||||||
2019 | 2018 | ||||||
(in thousands) | |||||||
Deferred tax assets: | |||||||
Allowance for doubtful accounts | $ | $ | |||||
Accrued expenses | |||||||
Net operating loss | |||||||
Research and experimentation credits | |||||||
Stock-based compensation | |||||||
Interest | |||||||
Deferred revenue | |||||||
Unrealized exchange gain | |||||||
Leases | — | ||||||
Other credits | |||||||
Total deferred tax assets | |||||||
Valuation allowance | ( | ) | ( | ) | |||
Deferred tax assets, net of valuation allowance | |||||||
Deferred tax liabilities: | |||||||
Property and equipment | |||||||
Prepaid expenses | |||||||
Debt costs | |||||||
Foreign royalty | |||||||
Leases | — | ||||||
Unremitted foreign earnings | |||||||
Intangibles | |||||||
Total deferred tax liabilities | |||||||
Net deferred tax liability | $ | $ | |||||
At December 31, 2019 and 2018, we had net operating loss carry forwards for U.S. federal income tax purposes of approximately $66.6 million and $12.2 million, respectively, of which $33.8 million and $12.2 million, respectively, are limited due to IRC Section 382 limitations. These U.S. federal net operating losses are available to offset future U.S. federal taxable income and begin to expire at various dates from 2021 through 2038.
At December 31, 2019 and 2018, we had net operating loss carry forwards for certain state income tax purposes of approximately $180.8 million and $106.7 million, respectively, some of which are limited due to IRC Section 382. These state net operating losses are available to offset future state taxable income and begin to expire in 2031.
At December 31, 2019 and 2018, we had foreign net operating loss carry forwards of approximately $88.3 million and $78.6 million, respectively, which are available to offset future foreign taxable income, and begin to expire in 2022.
At December 31, 2019 and 2018, we had research and experimentation tax credit carry forwards of approximately $0.7 million and $0.7 million, respectively, which are available to offset future U.S. federal income tax. These U.S. federal tax credits begin to expire in 2035.
We received a corporate income tax holiday in the Philippines which expired on March 31, 2019. The income tax expense related to the Philippines after expiration of the holiday has been recognized.
We establish valuation allowances when necessary to reduce deferred tax assets to amounts expected to be realized. As of December 31, 2019 and 2018, we have recorded a valuation allowance of $9.9 million and $1.8 million, respectively. The valuation allowance is related to the deferred tax assets of the entities acquired in the Samanage acquisition and a Canadian subsidiary.
The Tax Act imposes a mandatory transition tax on accumulated foreign earnings as of December 31, 2017. Effective January 1, 2018, the Tax Act creates a new territorial tax system in which we will recognize the tax impact of including certain foreign earnings in U.S. taxable income as a period cost. For the year ended December 31, 2019, we do not anticipate incurring a global intangible low-taxed income, or GILTI, liability; however, to the extent that we incur expense under the GILTI provisions, we will treat it as a component of income tax expense in the period incurred. As a result of the Tax Act, our accumulated foreign earnings
F-40
as of December 31, 2017 have been subjected to U.S. tax. Moreover, all future foreign earnings will be subject to a new territorial tax system and dividends received deduction regime in the U.S. As of December 31, 2019, undistributed earnings of certain foreign subsidiaries of approximately $1.0 billion are intended to be permanently reinvested outside the U.S. Accordingly, no provision for foreign withholding tax or state income taxes associated with a distribution of these earnings has been made. Determination of the amount of the unrecognized deferred tax liability on these unremitted earnings is not practicable. We have recorded an immaterial amount of deferred income taxes for state income taxes related to the earnings that are not indefinitely reinvested.
Gross unrecognized tax benefits, all of which, if recognized, would affect our effective tax rate were as follows:
Year Ended December 31, | |||||||||||
2019 | 2018 | 2017 | |||||||||
(in thousands) | |||||||||||
Gross unrecognized tax benefits | $ | $ | $ | ||||||||
At December 31, 2019 and 2018, we had accrued interest and penalties related to unrecognized tax benefits of approximately $5.5 million and $4.1 million, respectively.
The aggregate changes in the balance of our gross unrecognized tax benefits, excluding accrued interest, were as follows:
Year Ended December 31, | |||||||||||
2019 | 2018 | 2017 | |||||||||
(in thousands) | |||||||||||
Balance, beginning of year | $ | $ | $ | ||||||||
Increases for tax positions related to the current year | |||||||||||
Decreases for tax positions related to the current year | ( | ) | |||||||||
Increases for tax positions related to prior years | |||||||||||
Decreases for tax positions related to prior years | ( | ) | ( | ) | |||||||
Reductions due to lapsed statute of limitations | |||||||||||
Balance, end of year | $ | $ | $ | ||||||||
We do not believe that it is reasonably possible that our unrecognized tax benefits will significantly change in the next twelve months.
We file U.S., state and foreign income tax returns in jurisdictions with varying statutes of limitations. The 2011 through 2018 tax years generally remain open and subject to examination by federal tax authorities. The 2011 through 2018 tax years generally remain open and subject to examination by the state tax authorities and foreign tax authorities. We are currently under examination by the IRS for the tax years 2011 through the period ending February 2016. We are under audit by the Indian Tax Authority for the 2014 and 2017 tax years. We are currently under audit by the California Franchise Tax Board for the 2012 through 2014 tax years. We were notified in January 2019 that the Massachusetts Department of Revenue would audit the 2015 through February 2016 tax years. We were notified in December 2017 that the Swiss Tax Authorities would audit the 2014 through 2016 tax years. This audit concluded in April 2018 with no adjustments. We are not currently under audit in any other taxing jurisdictions.
On July 27, 2015, the U.S. Tax Court issued an opinion in Altera Corp. v. Commissioner related to the treatment of stock-based compensation expense in an intercompany cost-sharing arrangement. In February 2016, the U.S. Internal Revenue Service appealed the decision to the U.S. Court of Appeals for the Ninth Circuit. On June 7, 2019, the Ninth Circuit reversed the 2015 decision of the U.S. Tax Court. Due to the uncertainty surrounding the status of the current regulations, questions related to the scope of potential benefits or obligations, and the risk of the Tax Court's decision being overturned upon appeal, we have not recorded any benefit or expense as of December 31, 2019. We will continue to monitor ongoing developments and potential impacts to our consolidated financial statements.
16. Commitments and Contingencies
Legal Proceedings
From time to time, we have been and may be involved in various legal proceedings arising in our ordinary course of business. In the opinion of management, resolution of any pending claims (either individually or in the aggregate) is not expected to have a material adverse impact on our consolidated financial statements, cash flows or financial position and it is not possible to provide an estimated amount of any such loss. However, the outcome of disputes is inherently uncertain. Therefore, although management
F-41
considers the likelihood of such an outcome to be remote, an unfavorable resolution of one or more matters could materially affect our future results of operations or cash flows, or both, in a particular period.
17. Operating Segments and Geographic Information
We operate as a single segment. Our chief operating decision-maker is considered to be our Chief Executive Officer. The chief operating decision-maker allocates resources and assesses performance of the business at the consolidated level.
The authoritative guidance for disclosures about segments of an enterprise establishes standards for reporting information about operating segments. It defines operating segments as components of an enterprise about which separate financial information is available that is evaluated regularly by the chief operating decision-maker in deciding how to allocate resources and in assessing performance. Our Chief Executive Officer manages the business as a multi-product business that utilizes its model to deliver software products to customers regardless of their geography or IT environment. Operating results including new license and subscription sales, maintenance renewals and discrete financial information are reviewed at the consolidated entity level for purposes of making resource allocation decisions and for evaluating financial performance. Accordingly, we considered ourselves to be in a single operating and reporting segment structure.
We based revenue by geography on the shipping address of each customer. Other than the United States, no single country accounted for 10% or more of our total revenues during these periods. The following tables set forth revenue and net long-lived assets by geographic area:
Year Ended December 31, | |||||||||||
2019 | 2018 | 2017 | |||||||||
(in thousands) | |||||||||||
Revenue | |||||||||||
United States, country of domicile | $ | $ | $ | ||||||||
International | |||||||||||
Total revenue | $ | $ | $ | ||||||||
December 31, | |||||||
2019 | 2018 | ||||||
(in thousands) | |||||||
Long-lived assets, net | |||||||
United States, country of domicile | $ | $ | |||||
Switzerland | |||||||
All other international | |||||||
Total long-lived assets, net | $ | $ | |||||
F-42
18. Quarterly Results of Operations
The following table sets forth our unaudited quarterly consolidated statements of operations data for each of the quarters indicated. The information for each quarter has been prepared on a basis consistent with our audited consolidated financial statements included in this Annual Report on Form 10-K, and reflect, in the opinion of management, all adjustments of a normal, recurring nature that are necessary for a fair statement of the financial information contained in those statements. Our historical results are not necessarily indicative of the results that may be expected in the future. The following quarterly financial data should be read in conjunction with our consolidated financial statements included elsewhere in this Annual Report on Form 10-K.
Three months ended, | |||||||||||||||||||||||||||||||
Dec 31, 2019 | Sep 30, 2019 | June 30, 2019 | Mar 31, 2019 | Dec 31, 2018 | Sep 30, 2018 | June 30, 2018 | Mar 31, 2018 | ||||||||||||||||||||||||
(in thousands, except per share data) | |||||||||||||||||||||||||||||||
(unaudited) | |||||||||||||||||||||||||||||||
Revenue | $ | $ | $ | $ | $ | $ | $ | $ | |||||||||||||||||||||||
Gross profit | |||||||||||||||||||||||||||||||
Income (loss) before income taxes | ( | ) | ( | ) | ( | ) | ( | ) | |||||||||||||||||||||||
Net income (loss) | ( | ) | ( | ) | ( | ) | ( | ) | ( | ) | |||||||||||||||||||||
Net income (loss) available to common stockholders | ( | ) | ( | ) | ( | ) | ( | ) | |||||||||||||||||||||||
Basic income (loss) per share | $ | $ | $ | ( | ) | $ | $ | $ | ( | ) | $ | ( | ) | $ | ( | ) | |||||||||||||||
Diluted income (loss) per share | $ | $ | $ | ( | ) | $ | $ | $ | ( | ) | $ | ( | ) | $ | ( | ) | |||||||||||||||
Shares used in computation of basic income (loss) per share | |||||||||||||||||||||||||||||||
Shares used in computation of diluted income (loss) per share | |||||||||||||||||||||||||||||||
F-43
SOLARWINDS CORPORATION
FINANCIAL STATEMENT SCHEDULE
SCHEDULE II - VALUATION AND QUALIFYING ACCOUNTS
Beginning Balance | Additions (Charge to Expense) | Deductions (Write-offs, net of Recoveries) | Ending Balance | ||||||||||||
(in thousands) | |||||||||||||||
Allowance for doubtful accounts, customers and other: | |||||||||||||||
Year ended December 31, 2017 | $ | $ | $ | $ | |||||||||||
Year ended December 31, 2018 | |||||||||||||||
Year ended December 31, 2019 | |||||||||||||||
Tax valuation allowances: | |||||||||||||||
Year ended December 31, 2017 | $ | $ | $ | $ | |||||||||||
Year ended December 31, 2018 | |||||||||||||||
Year ended December 31, 2019 | |||||||||||||||
F-44