FYfalse0001737450Opera Ltd5one year0001737450ifrs-full:OtherIntangibleAssetsMemberifrs-full:AccumulatedDepreciationAmortisationAndImpairmentMember2023-12-310001737450opra:YoyoGamesLimitedMember2021-12-310001737450opra:OperaMemberopra:RestrictedShareUnitsRSU2023Member2024-01-012024-12-310001737450ifrs-full:GrossCarryingAmountMemberopra:Equipment1Member2024-12-310001737450opra:CarryingValueMemberopra:StarXMember2022-12-310001737450ifrs-full:LaterThanThreeMonthsMember2023-12-310001737450opra:NanobankMember2022-12-310001737450opra:KunlunTechRsuMember2023-12-310001737450opra:KunlunTechMemberopra:RestrictedShareUnitsRSU2024Member2024-12-310001737450opra:KunlunTechLimitedMember2023-12-310001737450ifrs-full:LaterThanThreeYearsAndNotLaterThanFiveYearsMember2023-12-310001737450opra:TemporaryDifferenceTaxLossesCarriedForwardMember2023-01-012023-12-310001737450opra:VerdaVenturesMember2023-12-310001737450opra:OtherCurrentLoansMember2022-12-310001737450ifrs-full:CurrentMember2024-12-310001737450opra:OtherNoncurrentLiabilities1Memberifrs-full:LaterThanThreeYearsAndNotLaterThanFiveYearsMember2023-12-310001737450ifrs-full:CustomerrelatedIntangibleAssetsMember2022-12-310001737450opra:OfficePropertiesMember2024-12-310001737450opra:TradeAndOtherPayablesMember2024-12-310001737450ifrs-full:TopOfRangeMemberifrs-full:CustomerrelatedIntangibleAssetsMember2024-01-012024-12-310001737450opra:PWERMMemberifrs-full:DiscountRateMeasurementInputMemberopra:OPayDigitalServicesLimitedMember2024-01-012024-12-310001737450ifrs-full:AdditionalPaidinCapitalMember2021-12-310001737450ifrs-full:DiscountRateMeasurementInputMemberopra:OPayDigitalServicesLimitedMember2024-12-3100017374502022-01-012022-12-310001737450ifrs-full:OrdinarySharesMember2022-12-310001737450ifrs-full:LaterThanOneYearAndNotLaterThanThreeYearsMemberifrs-full:LeaseLiabilitiesMember2024-12-310001737450ifrs-full:LaterThanFourYearsAndNotLaterThanFiveYearsMember2024-12-310001737450ifrs-full:TreasurySharesMember2023-12-310001737450currency:CNYifrs-full:CurrencyRiskMember2024-01-012024-12-310001737450ifrs-full:GoodwillMember2023-12-310001737450ifrs-full:LaterThanSixMonthsAndNotLaterThanOneYearMember2023-12-310001737450opra:nHorizonMember2024-12-310001737450opra:StarXMember2024-01-012024-12-310001737450country:NG2023-01-012023-12-310001737450opra:CurrentLeaseLiabilitiesMember2023-12-310001737450ifrs-full:FinancialAssetsAtAmortisedCostCategoryMember2023-12-310001737450opra:OfficePropertiesMember2023-12-310001737450opra:PWERMMemberopra:FinancialForecastOfCashInflowsOutflowsFromSalesTransactionsMeasurementInputMember2024-12-310001737450opra:PWERMMemberopra:FinancialForecastOfCashInflowsOutflowsFromInitialPublicOfferingMember2024-12-310001737450opra:AdvertisingRevenueMemberopra:nHorizonMember2023-01-012023-01-3100017374502022-12-310001737450ifrs-full:ReserveOfExchangeDifferencesOnTranslationMember2023-12-310001737450ifrs-full:CustomerrelatedIntangibleAssetsMemberifrs-full:GrossCarryingAmountMember2024-12-310001737450ifrs-full:TreasurySharesMember2022-01-012022-12-310001737450opra:PWERMMemberifrs-full:DiscountRateMeasurementInputMemberopra:OPayDigitalServicesLimitedMember2023-01-012023-12-310001737450opra:KunlunTechLimitedAndKeeneyesFutureHoldingIncMember2022-01-012022-12-310001737450ifrs-full:OtherIntangibleAssetsMember2023-01-012023-12-310001737450opra:KunlunTechMemberopra:RestrictedShareUnitsRSU2023Member2024-01-012024-12-310001737450opra:OfficePropertiesMember2023-01-012023-12-310001737450opra:OperaMember2024-01-012024-12-310001737450opra:NanobankMemberifrs-full:DiscountRateMeasurementInputMember2022-12-310001737450opra:TechnologyLicensingAndOtherMember2024-01-012024-12-310001737450ifrs-full:CurrentMember2023-12-310001737450ifrs-full:NotLaterThanOneYearMember2023-12-310001737450ifrs-full:TopOfRangeMemberifrs-full:CommunicationAndNetworkEquipmentMember2024-01-012024-12-310001737450country:NG2024-01-012024-12-310001737450ifrs-full:OtherTemporaryDifferencesMember2023-01-012023-12-310001737450ifrs-full:FinancialAssetsAtFairValueThroughProfitOrLossCategoryMember2024-12-310001737450ifrs-full:RetainedEarningsMember2024-01-012024-12-310001737450opra:OfficePropertiesMember2024-01-012024-12-310001737450opra:FurnitureAndFixtures1Memberifrs-full:AccumulatedDepreciationAmortisationAndImpairmentMember2024-12-310001737450ifrs-full:FinancialAssetsAtFairValueThroughProfitOrLossCategoryMember2023-12-310001737450ifrs-full:LeaseholdImprovementsMember2022-12-310001737450opra:ADSMember2024-07-012024-07-310001737450opra:TemporaryDifferenceIntangibleAssetsMember2023-01-012023-12-310001737450opra:TemporaryDifferencePropertyAndEquipmentMember2024-12-310001737450opra:OtherFinancialLiabilitiesMemberifrs-full:FinancialLiabilitiesAtAmortisedCostCategoryMember2024-12-310001737450ifrs-full:LaterThanSixMonthsAndNotLaterThanOneYearMemberopra:OtherCurrentLiabilities1Member2024-12-310001737450ifrs-full:TopOfRangeMemberopra:OPayDigitalServicesLimitedMember2024-01-012024-12-310001737450opra:Equipment1Member2024-12-310001737450ifrs-full:CurrencyRiskMembercurrency:SGD2024-01-012024-12-310001737450ifrs-full:GoodwillMember2023-01-012023-12-310001737450opra:Equipment1Member2024-01-012024-12-310001737450ifrs-full:LaterThanThreeYearsAndNotLaterThanFourYearsMember2023-12-310001737450ifrs-full:LaterThanThreeYearsAndNotLaterThanFourYearsMember2024-12-310001737450ifrs-full:GoodwillMemberifrs-full:GrossCarryingAmountMember2024-12-310001737450opra:RecurringSemiAnnualDividendOneMember2024-01-012024-12-310001737450opra:CurrentInterestBearingLoansMember2022-12-310001737450opra:Equipment1Member2022-12-310001737450opra:KunlunTechRsuMember2023-01-012023-12-310001737450ifrs-full:TechnologybasedIntangibleAssetsMember2022-12-310001737450opra:KunlunTechLimitedMember2023-06-132023-06-130001737450opra:KunlunTechLimitedAndKeeneyesFutureHoldingIncMember2023-01-012023-12-310001737450ifrs-full:CurrencyRiskMembercurrency:KES2024-01-012024-12-310001737450opra:PWERMMemberopra:FinancialForecastOfCashInflowsOutflowsFromRedemptionMeasurementInputMember2024-12-310001737450opra:RSUMember2024-01-012024-12-310001737450opra:KunlunTechMember2024-01-012024-12-310001737450opra:FurnitureAndFixtures1Member2023-12-310001737450ifrs-full:NotLaterThanOneYearMember2024-12-310001737450opra:StarXMember2022-04-300001737450ifrs-full:LaterThanTwoMonthsAndNotLaterThanThreeMonthsMember2023-12-310001737450opra:TemporaryDifferenceSharebasedRemunerationMember2023-01-012023-12-310001737450ifrs-full:LaterThanFourYearsAndNotLaterThanFiveYearsMember2023-12-310001737450opra:OtherGeographicalAreasMember2024-01-012024-12-3100017374502021-12-310001737450opra:ProvisionForImpairmentOfTradeReceivablesMember2024-01-012024-12-310001737450opra:RSUMember2024-12-310001737450ifrs-full:TechnologybasedIntangibleAssetsMember2024-01-012024-12-310001737450opra:OtherCurrentLiabilities1Memberifrs-full:LaterThanThreeYearsAndNotLaterThanFiveYearsMember2023-12-310001737450ifrs-full:AdditionalPaidinCapitalMember2023-12-310001737450opra:OtherCurrentLiabilities1Member2023-12-310001737450opra:SearchMember2022-01-012022-12-310001737450opra:PWERMMemberopra:WeightedAverageEquityValueMemberopra:OPayDigitalServicesLimitedMember2024-12-310001737450ifrs-full:GrossCarryingAmountMemberopra:Equipment1Member2023-12-310001737450ifrs-full:OtherTemporaryDifferencesMember2022-12-310001737450opra:OPayDigitalServicesLimitedMember2024-12-310001737450opra:PWERMMemberopra:RelativeChangeInProbabilityOfSaleMemberopra:OPayDigitalServicesLimitedMember2024-01-012024-12-310001737450opra:VerdaVenturesMember2024-12-310001737450ifrs-full:TechnologybasedIntangibleAssetsMember2023-01-012023-12-310001737450ifrs-full:RelatedPartiesMember2023-12-310001737450ifrs-full:GrossCarryingAmountMemberifrs-full:LeaseholdImprovementsMember2023-12-310001737450opra:Equipment1Member2023-01-012023-12-310001737450opra:CustomerGroup1Member2023-01-012023-12-310001737450ifrs-full:RetainedEarningsMember2022-01-012022-12-310001737450opra:KunlunTechRsuMember2024-01-012024-12-310001737450opra:TrademarkMember2023-01-012023-12-310001737450opra:CurrentLeaseLiabilitiesMember2024-12-310001737450ifrs-full:OtherRelatedPartiesMember2024-12-3100017374502023-01-012023-01-310001737450ifrs-full:GrossCarryingAmountMemberopra:TrademarkMember2023-12-310001737450ifrs-full:AccumulatedDepreciationAmortisationAndImpairmentMemberopra:OfficePropertiesMember2023-12-310001737450ifrs-full:TopOfRangeMemberifrs-full:TechnologybasedIntangibleAssetsMember2024-01-012024-12-310001737450ifrs-full:LaterThanThreeMonthsMember2024-12-310001737450opra:UnlistedEquitiesMemberifrs-full:FinancialAssetsAtFairValueThroughProfitOrLossCategoryMember2024-12-310001737450ifrs-full:GrossCarryingAmountMember2024-12-310001737450ifrs-full:AccumulatedDepreciationAmortisationAndImpairmentMemberopra:Equipment1Member2024-12-310001737450ifrs-full:NetworkInfrastructureMember2024-01-012024-12-310001737450opra:BeijingOfyMember2024-01-012024-12-310001737450ifrs-full:OtherIntangibleAssetsMember2024-12-310001737450ifrs-full:IntangibleAssetsUnderDevelopmentMember2024-01-012024-12-310001737450opra:KeeneyesFutureHoldingIncMember2023-01-012023-12-310001737450opra:LongTermStableGrowthRateMemberopra:OPayDigitalServicesLimitedMember2024-12-310001737450opra:ForecastedMembercountry:NG2025-01-012025-12-310001737450opra:ADSMember2023-01-012023-12-310001737450opra:Equipment1Member2022-01-012022-12-310001737450ifrs-full:LeaseLiabilitiesMember2023-12-310001737450opra:TechnologyLicensingAndOtherMember2023-01-012023-12-310001737450opra:OtherCurrentLoansMember2024-01-012024-12-310001737450opra:Russia1Member2023-01-012023-12-310001737450opra:FurnitureAndFixtures1Member2024-12-310001737450ifrs-full:GrossCarryingAmountMemberopra:OfficePropertiesMember2024-12-310001737450ifrs-full:LaterThanSixMonthsAndNotLaterThanOneYearMember2024-12-310001737450ifrs-full:CurrencyRiskMembercurrency:SGD2023-01-012023-12-310001737450ifrs-full:TechnologybasedIntangibleAssetsMember2023-01-012023-12-310001737450opra:CurrentLeaseLiabilitiesMember2024-01-012024-12-310001737450ifrs-full:LaterThanSixMonthsAndNotLaterThanOneYearMemberopra:TradeAndOtherPayablesMember2024-12-310001737450ifrs-full:OrdinarySharesMember2023-12-310001737450ifrs-full:LaterThanOneYearAndNotLaterThanThreeYearsMemberopra:OtherCurrentLiabilities1Member2023-12-310001737450opra:TechnologyLicensingAndOtherMember2022-01-012022-12-310001737450opra:OperaMemberopra:RestrictedShareUnitsRSU2024Member2024-01-012024-12-310001737450ifrs-full:CustomerrelatedIntangibleAssetsMember2023-01-012023-12-310001737450ifrs-full:LaterThanOneMonthAndNotLaterThanTwoMonthsMember2024-12-310001737450ifrs-full:RelatedPartiesMember2024-12-310001737450ifrs-full:AccumulatedDepreciationAmortisationAndImpairmentMember2023-12-310001737450ifrs-full:NotLaterThanOneMonthMember2023-12-310001737450ifrs-full:TreasurySharesMember2024-12-310001737450ifrs-full:IssuedCapitalMember2023-01-012023-12-310001737450ifrs-full:AdditionalPaidinCapitalMember2024-12-310001737450opra:TradeAndOtherPayablesMember2023-12-310001737450ifrs-full:LaterThanTwoYearsAndNotLaterThanThreeYearsMember2024-12-310001737450ifrs-full:GrossCarryingAmountMemberopra:OfficePropertiesMember2023-12-3100017374502024-01-012024-12-310001737450ifrs-full:WeightedAverageCostOfCapitalMeasurementInputMember2024-12-310001737450opra:Advertising1Member2024-01-012024-12-310001737450opra:CashAndCashEquivalentMemberifrs-full:FinancialAssetsAtAmortisedCostCategoryMember2024-12-310001737450opra:KunlunTechLimitedMember2023-01-012023-12-310001737450opra:TrademarkMember2024-01-012024-12-310001737450opra:WeightedAverageEquityValueMemberopra:PWERMMemberopra:OPayDigitalServicesLimitedMember2023-01-012023-12-310001737450ifrs-full:OtherTemporaryDifferencesMember2024-01-012024-12-310001737450opra:LeaseLiabilityMemberifrs-full:FinancialLiabilitiesAtAmortisedCostCategoryMember2023-12-310001737450ifrs-full:IssuedCapitalMember2024-12-310001737450opra:CELOAndOtherCryptoAssetsMember2023-12-310001737450opra:ADSMember2024-01-012024-12-310001737450opra:VerdaVenturesMember2022-12-310001737450country:NG2024-01-012024-12-310001737450opra:ProvisionForImpairmentOfTradeReceivablesMember2023-01-012023-12-310001737450ifrs-full:ReserveOfExchangeDifferencesOnTranslationMember2023-01-012023-12-310001737450opra:PWERMMemberifrs-full:DiscountRateMeasurementInputMemberopra:OPayDigitalServicesLimitedMember2024-12-310001737450opra:UnlistedEquitiesMemberifrs-full:FinancialAssetsAtFairValueThroughProfitOrLossCategoryMember2023-12-310001737450opra:OperaMember2024-01-012024-12-310001737450opra:TemporaryDifferenceIntangibleAssetsMember2022-12-310001737450ifrs-full:RestrictedShareUnitsMemberifrs-full:PotentialOrdinaryShareTransactionsMember2025-01-012025-02-280001737450ifrs-full:FinancialLiabilitiesAtAmortisedCostCategoryMemberopra:TradeAndOtherPayablesMember2023-12-310001737450currency:NOKifrs-full:CurrencyRiskMember2023-01-012023-12-310001737450ifrs-full:RetainedEarningsMember2021-12-3100017374502024-01-310001737450opra:KunlunTechLimitedMember2022-01-012022-12-310001737450opra:FurnitureAndFixtures1Member2024-01-012024-12-310001737450opra:TrademarkMemberifrs-full:AccumulatedDepreciationAmortisationAndImpairmentMember2024-12-310001737450ifrs-full:TopOfRangeMember2024-01-012024-12-310001737450opra:OtherReceivablesMemberifrs-full:FinancialAssetsAtAmortisedCostCategoryMember2023-12-310001737450opra:RecurringSemiAnnualDividendMember2023-01-012023-12-310001737450opra:Equipment1Member2023-01-012023-12-310001737450opra:PWERMMemberopra:OPayDigitalServicesLimitedMemberifrs-full:FinancialForecastOfProfitOrLossForCashgeneratingUnitMeasurementInputMember2023-01-012023-12-310001737450opra:TemporaryDifferenceIntangibleAssetsMember2024-01-012024-12-310001737450ifrs-full:CustomerrelatedIntangibleAssetsMember2024-01-012024-12-310001737450opra:OperaMember2022-01-012022-12-310001737450ifrs-full:OrdinarySharesMember2021-12-310001737450opra:TemporaryDifferencePropertyAndEquipmentMember2023-12-310001737450opra:TemporaryDifferenceTaxLossesCarriedForwardMember2024-12-3100017374502024-12-310001737450opra:LeaseLiabilityMemberifrs-full:FinancialLiabilitiesAtAmortisedCostCategoryMember2024-12-310001737450ifrs-full:AdditionalPaidinCapitalMember2023-01-012023-12-310001737450ifrs-full:CustomerrelatedIntangibleAssetsMemberifrs-full:GrossCarryingAmountMember2023-12-310001737450opra:Russia1Member2022-01-012022-12-310001737450opra:PWERMMemberopra:OPayDigitalServicesLimitedMemberifrs-full:FinancialForecastOfProfitOrLossForCashgeneratingUnitMeasurementInputMember2024-12-310001737450opra:OtherNoncurrentLiabilities1Memberifrs-full:LaterThanOneYearAndNotLaterThanThreeYearsMember2023-12-310001737450ifrs-full:LeaseholdImprovementsMember2024-01-012024-12-310001737450ifrs-full:LeaseLiabilitiesMemberifrs-full:LaterThanThreeYearsAndNotLaterThanFiveYearsMember2024-12-310001737450ifrs-full:LaterThanSixMonthsAndNotLaterThanOneYearMemberopra:OtherNoncurrentLiabilities1Member2024-12-310001737450ifrs-full:BottomOfRangeMember2024-01-012024-12-310001737450opra:OtherCurrentLoansMember2024-12-310001737450ifrs-full:TopOfRangeMemberifrs-full:LeaseholdImprovementsMember2024-01-012024-12-310001737450ifrs-full:ReserveOfExchangeDifferencesOnTranslationMember2024-12-310001737450ifrs-full:LaterThanSixMonthsAndNotLaterThanOneYearMemberopra:TradeAndOtherPayablesMember2023-12-310001737450opra:RSUMember2023-12-310001737450ifrs-full:GoodwillMemberifrs-full:AccumulatedDepreciationAmortisationAndImpairmentMember2024-12-310001737450opra:OPayDigitalServicesLimitedMemberifrs-full:WeightedAverageCostOfCapitalMeasurementInputMember2023-12-310001737450opra:PWERMMemberopra:FinancialForecastOfCashInflowsOutflowsFromSalesTransactionsMeasurementInputMemberifrs-full:TopOfRangeMember2024-12-310001737450opra:KunlunTechMemberopra:RestrictedShareUnitsRSU2024Member2024-01-012024-12-310001737450opra:PWERMMemberopra:OPayDigitalServicesLimitedMemberopra:DiscountForLackOfMarketability1Member2024-12-310001737450opra:ReceivablesFromSaleOfInvestmentsMemberifrs-full:FinancialAssetsAtAmortisedCostCategoryMember2023-12-310001737450ifrs-full:RetainedEarningsMember2024-12-310001737450opra:Singapore1Member2023-01-012023-12-310001737450opra:TemporaryDifferenceIntraGroupInterestExpensesCarriedForwardMember2023-01-012023-12-310001737450ifrs-full:TreasurySharesMember2021-12-310001737450opra:QifeiInternationalDevelopmentCoLtdMember2022-10-012022-10-310001737450opra:TrademarkMember2023-12-310001737450ifrs-full:OtherRelatedPartiesMember2023-12-310001737450opra:OfficePropertiesMember2024-12-310001737450ifrs-full:CustomerrelatedIntangibleAssetsMember2024-12-310001737450opra:KunlunTechRsuMember2022-12-310001737450ifrs-full:LaterThanSixMonthsAndNotLaterThanOneYearMemberopra:OtherNoncurrentLiabilities1Member2023-12-310001737450ifrs-full:GrossCarryingAmountMemberifrs-full:TechnologybasedIntangibleAssetsMember2024-12-310001737450ifrs-full:DiscountRateMeasurementInputMemberopra:OPayDigitalServicesLimitedMember2023-12-310001737450opra:OtherFinancialLiabilitiesMemberifrs-full:FinancialLiabilitiesAtAmortisedCostCategoryMember2023-12-310001737450opra:TemporaryDifferencePropertyAndEquipmentMember2024-01-012024-12-310001737450opra:KunlunTechLimitedMember2024-01-012024-12-310001737450opra:TemporaryDifferenceSharebasedRemunerationMember2022-12-310001737450opra:TemporaryDifferenceSharebasedRemunerationMember2024-12-310001737450ifrs-full:AccumulatedDepreciationAmortisationAndImpairmentMemberopra:OfficePropertiesMember2024-12-3100017374502023-06-012023-06-300001737450opra:PWERMMemberopra:FinancialForecastOfCashInflowsOutflowsFromDissolutionMeasurementInputMember2024-12-310001737450ifrs-full:LaterThanOneYearAndNotLaterThanThreeYearsMember2024-12-310001737450opra:PWERMMemberopra:FinancialForecastOfCashInflowsOutflowsFromSalesTransactionsMeasurementInputMemberifrs-full:BottomOfRangeMember2023-12-310001737450opra:VerdaVenturesMember2024-12-310001737450ifrs-full:OtherIntangibleAssetsMemberifrs-full:GrossCarryingAmountMember2023-12-310001737450ifrs-full:LaterThanTwoMonthsAndNotLaterThanThreeMonthsMember2024-12-310001737450ifrs-full:OrdinarySharesMember2024-12-310001737450ifrs-full:TopOfRangeMember2024-12-310001737450opra:PWERMMemberifrs-full:BottomOfRangeMemberopra:FinancialForecastOfCashInflowsOutflowsFromInitialPublicOfferingMember2024-12-310001737450opra:OtherNoncurrentLiabilities1Member2024-12-310001737450opra:PWERMMemberopra:OPayDigitalServicesLimitedMemberopra:DiscountForLackOfMarketability1Member2024-01-012024-12-310001737450ifrs-full:LaterThanOneYearAndNotLaterThanThreeYearsMemberopra:TradeAndOtherPayablesMember2024-12-310001737450ifrs-full:ReserveOfExchangeDifferencesOnTranslationMember2022-01-012022-12-310001737450opra:WeightedAverageEquityValueMemberopra:PWERMMemberopra:OPayDigitalServicesLimitedMember2024-01-012024-12-310001737450ifrs-full:TopOfRangeMemberopra:OfficePropertiesMember2024-01-012024-12-310001737450opra:TrademarkMemberifrs-full:AccumulatedDepreciationAmortisationAndImpairmentMember2023-12-310001737450opra:NoncurrentLeaseLiabilitiesMember2024-01-012024-12-310001737450opra:CurrentInterestBearingLoansMember2024-01-012024-12-310001737450opra:StarXMember2022-04-2100017374502025-01-012025-02-280001737450ifrs-full:GoodwillMember2024-12-310001737450ifrs-full:RetainedEarningsMember2023-01-012023-12-310001737450opra:ProvisionForImpairmentOfTradeReceivablesMember2022-12-310001737450opra:TemporaryDifferenceTradeReceivablesMember2023-12-310001737450opra:Equipment1Member2023-12-310001737450opra:TradeAndOtherPayablesMemberifrs-full:LaterThanThreeYearsAndNotLaterThanFiveYearsMember2024-12-310001737450ifrs-full:TradeReceivablesMemberifrs-full:FinancialAssetsAtAmortisedCostCategoryMember2024-12-310001737450ifrs-full:CustomerrelatedIntangibleAssetsMemberifrs-full:AccumulatedDepreciationAmortisationAndImpairmentMember2023-12-310001737450opra:UnitedStates1Member2024-01-012024-12-310001737450opra:QifeiInternationalDevelopmentCoLtdMemberifrs-full:OrdinarySharesMember2022-10-012022-10-310001737450ifrs-full:RetainedEarningsMember2022-12-310001737450opra:OfficePropertiesMember2023-12-310001737450ifrs-full:OrdinarySharesMember2024-12-310001737450opra:Russia1Member2024-01-012024-12-310001737450ifrs-full:GrossCarryingAmountMemberifrs-full:TechnologybasedIntangibleAssetsMember2023-12-310001737450opra:OPayLimitedMember2022-01-012022-12-310001737450opra:StarXMember2023-01-012023-12-310001737450opra:CustomerGroup1Member2024-01-012024-12-310001737450ifrs-full:IssuedCapitalMember2021-12-310001737450opra:EquityToAssetRatioMeasurementInputMember2024-12-310001737450currency:EURifrs-full:CurrencyRiskMember2023-01-012023-12-310001737450ifrs-full:OrdinarySharesMember2023-01-012023-12-310001737450opra:nHorizonInfiniteMember2022-01-012022-12-3100017374502024-07-310001737450ifrs-full:IntangibleAssetsUnderDevelopmentMember2023-01-012023-12-310001737450opra:ProvisionForImpairmentOfTradeReceivablesMember2024-12-310001737450opra:QifeiInternationalDevelopmentCoLtdMember2022-01-012022-12-310001737450opra:CurrentInterestBearingLoansMember2023-01-012023-12-310001737450opra:OPayDigitalServicesLimitedMember2024-01-012024-12-310001737450opra:PWERMMemberopra:FinancialForecastOfCashInflowsOutflowsFromSalesTransactionsMeasurementInputMemberifrs-full:TopOfRangeMember2023-12-310001737450opra:KunlunTechRsuMemberopra:OperaMember2024-01-012024-12-310001737450opra:ADSMember2022-01-310001737450ifrs-full:OtherIntangibleAssetsMemberifrs-full:AccumulatedDepreciationAmortisationAndImpairmentMember2024-12-310001737450opra:OtherCurrentLoansMember2023-01-012023-12-310001737450opra:CashAndCashEquivalentMemberifrs-full:FinancialAssetsAtAmortisedCostCategoryMember2023-12-310001737450opra:TemporaryDifferenceTaxLossesCarriedForwardMember2024-01-012024-12-310001737450ifrs-full:GrossCarryingAmountMemberopra:FurnitureAndFixtures1Member2023-12-310001737450opra:WisdomConnectionIiiHoldingMember2023-12-310001737450opra:WeightedAverageCostOfCapitalPretaxMeasurementInputMember2024-12-310001737450ifrs-full:LaterThanSixMonthsAndNotLaterThanOneYearMemberopra:OtherCurrentLiabilities1Member2023-12-310001737450opra:QifeiInternationalDevelopmentCoLtdMember2024-01-012024-12-3100017374502024-12-012024-12-310001737450opra:TemporaryDifferenceTradeReceivablesMember2022-12-310001737450opra:TemporaryDifferencePropertyAndEquipmentMember2022-12-310001737450opra:Advertising1Member2022-01-012022-12-310001737450opra:TemporaryDifferencePropertyAndEquipmentMember2023-01-012023-12-310001737450opra:PWERMMemberifrs-full:TopOfRangeMemberopra:FinancialForecastOfCashInflowsOutflowsFromInitialPublicOfferingMember2024-12-310001737450opra:KunlunTechMember2023-01-012023-12-310001737450ifrs-full:GoodwillMemberifrs-full:AccumulatedDepreciationAmortisationAndImpairmentMember2023-12-310001737450ifrs-full:CurrencyRiskMembercurrency:NGN2023-01-012023-12-310001737450opra:TrademarkMember2024-12-310001737450opra:PWERMMemberifrs-full:TopOfRangeMemberopra:FinancialForecastOfCashInflowsOutflowsFromInitialPublicOfferingMember2023-12-310001737450opra:CurrentInterestBearingLoansMember2024-12-310001737450ifrs-full:LaterThanOneYearAndNotLaterThanTwoYearsMember2024-12-310001737450ifrs-full:TechnologybasedIntangibleAssetsMember2024-01-012024-12-310001737450opra:TradeAndOtherPayablesMemberifrs-full:LaterThanThreeYearsAndNotLaterThanFiveYearsMember2023-12-310001737450ifrs-full:AccumulatedDepreciationAmortisationAndImpairmentMember2024-12-310001737450opra:BeijingOfyMember2023-01-012023-12-310001737450ifrs-full:BottomOfRangeMember2024-12-310001737450ifrs-full:OrdinarySharesMember2022-01-012022-12-310001737450opra:AmericanDepositarySharesADSMemberifrs-full:PotentialOrdinaryShareTransactionsMember2025-02-282025-02-280001737450opra:ThirdPartyReceivablesMember2023-12-310001737450opra:Equipment1Member2024-01-012024-12-310001737450opra:TemporaryDifferenceIntangibleAssetsMember2024-12-310001737450opra:PWERMMemberopra:FinancialForecastOfCashInflowsOutflowsFromRedemptionMeasurementInputMember2023-12-310001737450opra:OfficePropertiesMember2022-01-012022-12-310001737450ifrs-full:OtherIntangibleAssetsMember2024-01-012024-12-310001737450ifrs-full:LaterThanOneYearAndNotLaterThanThreeYearsMember2023-12-310001737450opra:KeeneyesFutureHoldingIncMember2024-01-012024-12-310001737450ifrs-full:ReserveOfExchangeDifferencesOnTranslationMember2022-12-310001737450opra:ADSMember2022-01-012022-12-310001737450opra:TemporaryDifferenceTradeReceivablesMember2024-12-310001737450opra:OPayDigitalServicesLimitedMember2023-01-012023-12-310001737450ifrs-full:LeaseholdImprovementsMember2023-01-012023-12-310001737450ifrs-full:AdditionalPaidinCapitalMember2022-01-012022-12-3100017374502023-01-012023-12-310001737450opra:PWERMMemberopra:FinancialForecastOfCashInflowsOutflowsFromInitialPublicOfferingMember2023-12-310001737450opra:VerdaVenturesMember2024-01-012024-12-310001737450ifrs-full:LaterThanOneMonthAndNotLaterThanTwoMonthsMember2023-12-310001737450opra:CarryingValueMemberopra:StarXMember2023-12-310001737450opra:NanobankMember2022-03-310001737450opra:ForecastedMembercountry:NG2026-01-012026-12-310001737450opra:SearchMember2023-01-012023-12-310001737450ifrs-full:FinancialAssetsAtAmortisedCostCategoryMember2024-12-310001737450ifrs-full:AccumulatedDepreciationAmortisationAndImpairmentMemberopra:Equipment1Member2023-12-310001737450opra:PWERMMemberopra:OPayDigitalServicesLimitedMemberopra:TimeToExitMember2023-01-012023-12-310001737450opra:ProvisionForImpairmentOfTradeReceivablesMember2023-12-310001737450opra:TemporaryDifferenceIntangibleAssetsMember2023-12-310001737450ifrs-full:TradeReceivablesMemberifrs-full:FinancialAssetsAtAmortisedCostCategoryMember2023-12-310001737450ifrs-full:LaterThanSixMonthsAndNotLaterThanOneYearMemberifrs-full:LeaseLiabilitiesMember2024-12-310001737450ifrs-full:LeaseLiabilitiesMemberifrs-full:LaterThanThreeYearsAndNotLaterThanFiveYearsMember2023-12-310001737450currency:PLNifrs-full:CurrencyRiskMember2024-01-012024-12-310001737450opra:ADSMember2022-02-012023-11-300001737450opra:TemporaryDifferenceTaxLossesCarriedForwardMember2023-12-3100017374502024-01-012024-01-310001737450opra:SearchMember2024-01-012024-12-310001737450opra:OtherGeographicalAreasMember2022-01-012022-12-310001737450opra:CELOAndOtherCryptoAssetsMember2024-12-3100017374502023-06-300001737450opra:KunlunTechLimitedMember2022-12-310001737450opra:OPayDigitalServicesLimitedMember2023-12-310001737450ifrs-full:LaterThanOneYearAndNotLaterThanThreeYearsMemberopra:TradeAndOtherPayablesMember2023-12-310001737450opra:ABFjordBankMember2024-01-012024-12-310001737450opra:StarXMember2022-04-012022-04-300001737450opra:OtherReceivablesMemberifrs-full:FinancialAssetsAtAmortisedCostCategoryMember2024-12-310001737450opra:SecurityDepositMember2023-12-310001737450opra:NoncurrentLeaseLiabilitiesMember2022-12-310001737450ifrs-full:TechnologybasedIntangibleAssetsMember2024-12-310001737450opra:OperaMember2023-01-012023-12-310001737450opra:PWERMMemberopra:RelativeChangeInProbabilityOfSaleMemberopra:OPayDigitalServicesLimitedMember2023-01-012023-12-310001737450ifrs-full:NotLaterThanOneMonthMember2024-12-310001737450opra:OperaMember2023-01-012023-12-310001737450opra:TemporaryDifferenceTaxLossesCarriedForwardMember2022-12-310001737450opra:PWERMMemberopra:RelativeChangeInProbabilityOfSaleMemberopra:OPayDigitalServicesLimitedMember2024-12-310001737450ifrs-full:GrossCarryingAmountMemberifrs-full:LeaseholdImprovementsMember2024-12-310001737450ifrs-full:OtherIntangibleAssetsMember2023-12-310001737450opra:QifeiInternationalDevelopmentCoLtdMember2023-01-012023-12-310001737450opra:Singapore1Member2022-01-012022-12-310001737450opra:ThirdPartyReceivablesMember2024-12-310001737450opra:OfficePropertiesMember2024-01-012024-12-310001737450opra:FurnitureAndFixtures1Member2022-12-310001737450ifrs-full:FinancialLiabilitiesAtAmortisedCostCategoryMemberopra:TradeAndOtherPayablesMember2024-12-310001737450ifrs-full:LeaseholdImprovementsMemberifrs-full:AccumulatedDepreciationAmortisationAndImpairmentMember2023-12-310001737450opra:OptionsAndRSUsMember2023-01-012023-12-310001737450opra:CurrentLeaseLiabilitiesMember2022-12-310001737450ifrs-full:CurrencyRiskMembercurrency:PLN2023-01-012023-12-310001737450opra:ADSMember2023-06-132023-06-130001737450opra:OtherCurrentLoansMember2023-12-310001737450opra:nHorizonMember2024-01-012024-12-310001737450opra:OfficePropertiesMember2022-12-310001737450opra:NanobankMember2022-08-310001737450opra:WisdomConnectionIiiHoldingMember2024-12-310001737450opra:nHorizonMember2024-01-012024-12-310001737450opra:KunlunTechLimitedMember2023-01-012023-12-310001737450opra:MarketRiskPremiumMeasurementInputMember2024-12-3100017374502023-01-310001737450opra:nHorizonInfiniteMember2024-01-012024-12-310001737450opra:Equipment1Member2024-12-310001737450ifrs-full:FinancialAssetsAtFairValueThroughProfitOrLossCategoryMemberopra:StablecoinsCashEquivalentsMember2023-12-310001737450opra:OfficePropertiesMember2023-01-012023-12-310001737450ifrs-full:FinancialLiabilitiesAtAmortisedCostCategoryMember2024-12-310001737450opra:ADSMember2018-06-302018-06-300001737450ifrs-full:TreasurySharesMember2022-12-310001737450ifrs-full:TopOfRangeMemberifrs-full:OtherIntangibleAssetsMember2024-01-012024-12-310001737450opra:FurnitureAndFixtures1Member2023-01-012023-12-310001737450ifrs-full:GrossCarryingAmountMemberopra:TrademarkMember2024-12-310001737450opra:OtherGeographicalAreasMember2023-01-012023-12-310001737450ifrs-full:LaterThanSixMonthsAndNotLaterThanOneYearMemberifrs-full:LeaseLiabilitiesMember2023-12-3100017374502023-12-310001737450ifrs-full:LeaseLiabilitiesMember2024-12-310001737450opra:SpecialDividendMember2023-01-012023-12-310001737450ifrs-full:AdditionalPaidinCapitalMember2022-12-310001737450opra:Equipment1Member2023-12-310001737450opra:PWERMMemberifrs-full:BottomOfRangeMemberopra:FinancialForecastOfCashInflowsOutflowsFromSalesTransactionsMeasurementInputMember2024-12-310001737450opra:RiskFreeRateMeasurementInputMember2024-12-310001737450ifrs-full:GrossCarryingAmountMember2023-12-310001737450ifrs-full:ReserveOfExchangeDifferencesOnTranslationMember2021-12-310001737450ifrs-full:IssuedCapitalMember2023-12-310001737450opra:TemporaryDifferenceIntraGroupInterestExpensesCarriedForwardMember2024-12-310001737450opra:KunlunTechMemberopra:RestrictedShareUnitsRSU2023Member2024-12-310001737450opra:OptionsAndRSUsMember2024-01-012024-12-310001737450opra:TrademarkMember2022-12-310001737450opra:KunlunTechLimitedMember2024-12-310001737450opra:CarryingValueMemberopra:StarXMember2024-12-310001737450opra:CurrentInterestBearingLoansMember2023-12-310001737450opra:PWERMMemberopra:FinancialForecastOfCashInflowsOutflowsFromDissolutionMeasurementInputMember2023-12-310001737450opra:StarXMember2022-04-212022-04-210001737450ifrs-full:LaterThanTwoYearsAndNotLaterThanThreeYearsMember2023-12-310001737450opra:LongTermStableGrowthRateMemberopra:OPayDigitalServicesLimitedMember2024-01-012024-12-310001737450opra:OPayDigitalServicesLimitedMember2023-12-310001737450ifrs-full:OtherIntangibleAssetsMemberifrs-full:GrossCarryingAmountMember2024-12-310001737450opra:VerdaVenturesMember2023-12-310001737450opra:OtherNoncurrentLiabilities1Memberifrs-full:LaterThanOneYearAndNotLaterThanThreeYearsMember2024-12-310001737450opra:KunlunTechRsuMember2024-12-310001737450opra:NanobankMember2022-03-012022-03-310001737450opra:OtherNoncurrentLiabilities1Memberifrs-full:LaterThanThreeYearsAndNotLaterThanFiveYearsMember2024-12-310001737450ifrs-full:IssuedCapitalMember2022-01-012022-12-310001737450opra:NoncurrentLeaseLiabilitiesMember2024-12-310001737450ifrs-full:IntangibleAssetsUnderDevelopmentMember2022-01-012022-12-310001737450ifrs-full:OtherTemporaryDifferencesMember2024-12-310001737450ifrs-full:IssuedCapitalMember2022-12-310001737450ifrs-full:TopOfRangeMemberopra:FurnitureAndFixtures1Member2024-01-012024-12-310001737450opra:nHorizonMember2024-12-310001737450currency:SEKifrs-full:CurrencyRiskMember2023-01-012023-12-310001737450opra:CountryRiskPremiumMeasurementInputMember2024-12-310001737450opra:UnitedStates1Member2023-01-012023-12-310001737450ifrs-full:TechnologybasedIntangibleAssetsMemberifrs-full:AccumulatedDepreciationAmortisationAndImpairmentMember2023-12-310001737450ifrs-full:OtherIntangibleAssetsMember2022-12-310001737450opra:TemporaryDifferenceIntraGroupInterestExpensesCarriedForwardMember2023-12-310001737450ifrs-full:CurrencyRiskMembercurrency:NGN2024-01-012024-12-310001737450currency:SEKifrs-full:CurrencyRiskMember2024-01-012024-12-310001737450opra:CustomerGroup1Member2022-01-012022-12-310001737450opra:ReceivablesFromSaleOfInvestmentsMemberifrs-full:FinancialAssetsAtAmortisedCostCategoryMember2024-12-310001737450opra:SecurityDepositMember2024-12-310001737450opra:TemporaryDifferenceIntraGroupInterestExpensesCarriedForwardMember2024-01-012024-12-310001737450opra:RSUMember2023-01-012023-12-310001737450opra:UnitedStates1Member2022-01-012022-12-310001737450currency:EURifrs-full:CurrencyRiskMember2024-01-012024-12-310001737450ifrs-full:GoodwillMemberifrs-full:GrossCarryingAmountMember2023-12-310001737450ifrs-full:LaterThanOneYearAndNotLaterThanThreeYearsMemberifrs-full:LeaseLiabilitiesMember2023-12-310001737450opra:OtherCurrentLiabilities1Member2024-12-310001737450opra:OPayDigitalServicesLimitedMember2024-12-310001737450opra:USDCAndUSDTMemberopra:PriceRiskMember2024-12-310001737450opra:nHorizonInfiniteMember2023-01-012023-12-310001737450opra:NoncurrentLeaseLiabilitiesMember2023-01-012023-12-310001737450opra:Advertising1Member2023-01-012023-12-310001737450opra:CurrentLeaseLiabilitiesMember2023-01-012023-12-310001737450ifrs-full:CustomerrelatedIntangibleAssetsMember2023-12-310001737450ifrs-full:LaterThanOneYearAndNotLaterThanThreeYearsMemberopra:OtherCurrentLiabilities1Member2024-12-310001737450ifrs-full:GoodwillMember2022-12-310001737450opra:OtherNoncurrentLiabilities1Member2023-12-310001737450opra:TemporaryDifferenceTradeReceivablesMember2023-01-012023-12-310001737450ifrs-full:LicencesMember2022-01-012022-12-310001737450opra:PWERMMemberopra:OPayDigitalServicesLimitedMemberopra:TimeToExitMember2024-12-310001737450opra:StarXMember2023-12-310001737450opra:OperaMemberopra:RestrictedShareUnitsRSU2023Member2024-12-310001737450country:NG2022-01-012022-12-310001737450ifrs-full:GoodwillMember2024-01-012024-12-310001737450opra:BeijingOfyMember2022-01-012022-12-310001737450opra:TrademarkMember2021-12-310001737450opra:Singapore1Member2024-01-012024-12-310001737450opra:TemporaryDifferenceTradeReceivablesMember2024-01-012024-12-310001737450opra:PWERMMemberifrs-full:BottomOfRangeMemberopra:FinancialForecastOfCashInflowsOutflowsFromInitialPublicOfferingMember2023-12-310001737450opra:SizePremiumMeasurementInputMember2024-12-310001737450opra:FurnitureAndFixtures1Memberifrs-full:AccumulatedDepreciationAmortisationAndImpairmentMember2023-12-310001737450ifrs-full:TreasurySharesMemberopra:ADSMember2024-01-012024-12-310001737450ifrs-full:OrdinarySharesMember2024-01-012024-12-310001737450opra:ADSMember2024-01-012024-01-310001737450ifrs-full:ReserveOfExchangeDifferencesOnTranslationMember2024-01-012024-12-310001737450ifrs-full:LaterThanThreeYearsAndNotLaterThanFiveYearsMember2024-12-310001737450opra:KunlunTechLimitedAndKeeneyesFutureHoldingIncMember2024-01-012024-12-310001737450ifrs-full:TechnologybasedIntangibleAssetsMemberifrs-full:AccumulatedDepreciationAmortisationAndImpairmentMember2024-12-310001737450ifrs-full:LaterThanOneYearAndNotLaterThanTwoYearsMember2023-12-310001737450opra:OperaNorwayASMember2016-12-310001737450opra:PWERMMemberopra:FinancialForecastOfCashInflowsOutflowsFromSalesTransactionsMeasurementInputMember2023-12-310001737450opra:NoncurrentLeaseLiabilitiesMember2023-12-310001737450currency:CNYifrs-full:CurrencyRiskMember2023-01-012023-12-310001737450dei:BusinessContactMember2024-01-012024-12-3100017374502024-07-012024-07-310001737450opra:StarXMember2024-12-310001737450opra:KeeneyesFutureHoldingIncMember2022-01-012022-12-310001737450opra:EbitdaMember2024-01-012024-12-310001737450opra:RecurringSemiAnnualDividendMember2024-01-012024-12-310001737450opra:OtherCurrentLiabilities1Memberifrs-full:LaterThanThreeYearsAndNotLaterThanFiveYearsMember2024-12-310001737450opra:TemporaryDifferenceIntraGroupInterestExpensesCarriedForwardMember2022-12-310001737450ifrs-full:BottomOfRangeMemberopra:OPayDigitalServicesLimitedMember2024-01-012024-12-310001737450opra:TemporaryDifferenceSharebasedRemunerationMember2023-12-310001737450opra:KunlunTechLimitedAndKeeneyesFutureHoldingIncMember2023-01-310001737450opra:OperaMemberopra:RestrictedShareUnitsRSU2024Member2024-12-310001737450ifrs-full:LeaseholdImprovementsMemberifrs-full:AccumulatedDepreciationAmortisationAndImpairmentMember2024-12-310001737450currency:NOKifrs-full:CurrencyRiskMember2024-01-012024-12-310001737450ifrs-full:RetainedEarningsMember2023-12-310001737450ifrs-full:OtherTemporaryDifferencesMember2023-12-310001737450ifrs-full:CustomerrelatedIntangibleAssetsMemberifrs-full:AccumulatedDepreciationAmortisationAndImpairmentMember2024-12-310001737450opra:nHorizonMember2023-12-310001737450opra:PWERMMemberopra:OPayDigitalServicesLimitedMemberopra:DiscountForLackOfMarketability1Member2023-01-012023-12-310001737450opra:RSUMember2022-12-310001737450opra:PWERMMemberopra:OPayDigitalServicesLimitedMemberopra:TimeToExitMember2024-01-012024-12-310001737450opra:OPayDigitalServicesLimitedMember2022-12-310001737450opra:OPayLimitedMember2023-02-012023-02-280001737450ifrs-full:FinancialLiabilitiesAtAmortisedCostCategoryMember2023-12-310001737450ifrs-full:LeaseholdImprovementsMember2023-12-310001737450ifrs-full:BottomOfRangeMemberifrs-full:CommunicationAndNetworkEquipmentMember2024-01-012024-12-310001737450ifrs-full:TopOfRangeMemberopra:Equipment1Member2024-01-012024-12-310001737450ifrs-full:GrossCarryingAmountMemberopra:FurnitureAndFixtures1Member2024-12-310001737450ifrs-full:CurrencyRiskMembercurrency:KES2023-01-012023-12-310001737450opra:OPayLimitedMember2023-02-280001737450ifrs-full:LeaseholdImprovementsMember2024-12-310001737450ifrs-full:AdditionalPaidinCapitalMember2024-01-012024-12-310001737450opra:OPayDigitalServicesLimitedMemberifrs-full:WeightedAverageCostOfCapitalMeasurementInputMember2024-12-310001737450ifrs-full:TechnologybasedIntangibleAssetsMember2023-12-310001737450ifrs-full:TreasurySharesMember2023-01-012023-12-310001737450opra:StablecoinsCashEquivalentsMemberifrs-full:FinancialAssetsAtFairValueThroughProfitOrLossCategoryMember2024-12-310001737450opra:TemporaryDifferenceSharebasedRemunerationMember2024-01-012024-12-310001737450opra:KunlunTechLimitedMember2024-01-012024-12-31opra:QuarterlyInstallmentopra:Installmentxbrli:purexbrli:sharesopra:QuarterlyInvestmentiso4217:USD
UNITED STATES
SECURITIES AND EXCHANGE COMMISSION
Washington, D.C. 20549
FORM 20-F
|
|
☐ |
REGISTRATION STATEMENT PURSUANT TO SECTION 12(b) OR (g) OF THE SECURITIES EXCHANGE ACT OF 1934 |
OR
|
|
☒ |
ANNUAL REPORT PURSUANT TO SECTION 13 OR 15(d) OF THE SECURITIES EXCHANGE ACT OF 1934 |
For the fiscal year ended December 31, 2024.
OR
|
|
☐ |
TRANSITION REPORT PURSUANT TO SECTION 13 OR 15(d) OF THE SECURITIES EXCHANGE ACT OF 1934 |
OR
|
|
☐ |
SHELL COMPANY REPORT PURSUANT TO SECTION 13 OR 15(d) OF THE SECURITIES EXCHANGE ACT OF 1934 |
Commission file number: 001-38588
Opera Limited
(Exact name of Registrant as specified in its charter)
Cayman Islands
(Jurisdiction of incorporation or organization)
Vitaminveien 4, 0485 Oslo, Norway
(Address of principal executive offices)
James Yahui Zhou, Chief Executive Officer
c/o Aaron McParlan, General Counsel
Vitaminveien 4, 0485 Oslo, Norway
Tel: +47 2369-2400
E-mail: legal@opera.com
(Name, Address, Telephone and E-mail of Company Contact Person)
Securities registered or to be registered pursuant to Section 12(b) of the Act:
|
|
|
|
|
Title of each class |
|
Trading Symbol |
|
Name of each exchange on which registered |
American Depositary Shares, each representing one ordinary share, par value $0.0002 per share |
|
OPRA |
|
The Nasdaq Stock Market LLC |
Securities registered or to be registered pursuant to Section 12(g) of the Act: None
Securities for which there is a reporting obligation pursuant to Section 15(d) of the Act: None
Indicate the number of outstanding shares of each of the Issuer’s classes of capital or common stock as of the close of the period covered by the annual report: 88,480,154 ordinary shares, par value $0.0002 per share, as of December 31, 2024.
Indicate by check mark if the registrant is a well-known seasoned issuer, as defined in Rule 405 of the Securities Act. Yes ☐ No ☒
If this report is an annual or transition report, indicate by check mark if the registrant is not required to file reports pursuant to Section 13 or 15(d) of the Securities Exchange Act of 1934. Yes ☐ No ☒
Indicate by check mark whether the registrant: (1) has filed all reports required to be filed by Section 13 or 15(d) of the Securities Exchange Act of 1934 during the preceding 12 months (or for such shorter period that the registrant was required to file such reports), and (2) has been subject to such filing requirements for the past 90 days. Yes ☒ No ☐
Indicate by check mark whether the registrant has submitted electronically every Interactive Data File required to be submitted pursuant to Rule 405 of Regulation S-T (§232.405 of this chapter) during the preceding 12 months (or for such shorter period that the registrant was required to submit such files). Yes ☒ No ☐
Indicate by check mark whether the registrant is a large accelerated filer, an accelerated filer, a non-accelerated filer, or an emerging growth company. See definition of “large accelerated filer,” “accelerated filer,” and “emerging growth company” in Rule 12b-2 of the Exchange Act.
|
|
|
|
Large accelerated filer ☐ |
Accelerated filer ☒ |
Non-accelerated filer ☐ |
Emerging growth company ☐ |
If an emerging growth company that prepares its financial statements in accordance with U.S. GAAP, indicate by check mark if the registrant has elected not to use the extended transition period for complying with any new or revised financial accounting standards provided pursuant to Section 13(a) of the Exchange Act. ☐
Indicate by check mark whether the registrant has filed a report on and attestation to its management’s assessment of the effectiveness of its internal control over financial reporting under Section 404(b) of the Sarbanes-Oxley Act (15 U.S.C. 7262(b)) by the registered public accounting firm that prepared or issued its audit report. ☒
If securities are registered pursuant to Section 12(b) of the Act, indicate by check mark whether the financial statements of the registrant included in the filing reflect the correction of an error to previously issued financial statements. ☐
Indicate by check mark whether any of those error corrections are restatements that required a recovery analysis of incentive-based compensation received by any of the registrant’s executive officers during the relevant recovery period pursuant to§240.10D-1(b). ☐
Indicate by check mark which basis of accounting the registrant has used to prepare the financial statements included in this filing:
|
|
|
U.S. GAAP ☐ |
International Financial Reporting Standards as issued by the International Accounting Standards Board ☒ |
Other ☐ |
If “Other” has been checked in response to the previous question, indicate by check mark which financial statement item the registrant has elected to follow. Item 17 ☐ Item 18 ☐
If this is an annual report, indicate by check mark whether the registrant is a shell company (as defined in Rule 12b-2 of the Exchange Act). Yes ☐ No ☒
CONVENTIONS THAT APPLY TO THIS ANNUAL REPORT ON FORM 20-F
Unless otherwise indicated and except where the context otherwise requires:
• “active user” refers to a user, calculated based on device identification, that has accessed one of our mobile browsers, PC browsers or other applications at least once during a given period. A unique user that is active in more than one of the applications on our platform is counted as more than one active user;
• “ADS” refers to an American depositary share in Opera Limited, trading on the Nasdaq Global Select Market under the ticker symbol “OPRA”, each of which representing one ordinary share in Opera Limited;
• “AI” refers to artificial intelligence and “AIGC” refers to artificial intelligence generated content;
• “ARPU,” which stands for “average revenue per user,” is calculated as our total advertising and search revenue in a given period, divided by our average MAUs in the period;
• “China” or “PRC” refers to the People’s Republic of China, excluding, for the purpose of this annual report only, Taiwan and the special administrative regions of Hong Kong and Macau;
• “EEA” refers to the European Economic Area consisting of the 27 countries of the European Union plus Norway, Liechtenstein and Iceland;
• “IFRS Accounting Standards” or “Accounting Standards” refer to IFRS® Accounting Standards as issued by the International Accounting Standards Board (IASB);
• “Kunlun” refers to Kunlun Tech Co., Ltd. and Hong Kong Kunlun Tech Holding Ltd., unless otherwise indicated;
• “LLMs” refers to large language models;
• “MAUs” or “monthly active users” refers to the average number of active users of any month (within a given period), calculated as of its final day using a 30-day lookback window;
• “Nasdaq” refers to the Nasdaq Stock Market LLC;
• “PC” means computers running versions of the Windows, Linux or macOS operating systems;
• “shares” or “ordinary shares” refers to our ordinary shares, par value $0.0002 per share;
• “SEC” refers to the United States Securities and Exchange Commission;
• “U.S. dollars,” or “$” and refer to the legal currency of the United States; and
• “Opera,” “the company,” “our group,” “we,” “us,” “our,” and similar terms refer to Opera Limited, a Cayman Islands company, and its subsidiaries, unless the context indicates otherwise.
All discrepancies in any table between the amounts identified as total amounts and the sum of the amounts listed therein are due to rounding.
FORWARD-LOOKING STATEMENTS
This annual report contains forward-looking statements that involve risks and uncertainties. All statements other than statements of current or historical facts are forward-looking statements. These forward-looking statements are made under the “safe harbor” provision under Section 21E of the Securities Exchange Act of 1934, as amended, or the Exchange Act, and as defined in the Private Securities Litigation Reform Act of 1995. These statements involve known and unknown risks, uncertainties and other factors, including those listed under “Item 3. Key Information—D. Risk Factors,” that may cause our actual results, performance or achievements to be materially different from those expressed or implied by the forward-looking statements.
In some cases, you can identify these forward-looking statements by words or phrases such as “may,” “will,” “expect,” “anticipate,” “aim,” “estimate,” “intend,” “plan,” “believe,” “likely to” or other similar expressions. We have based these forward-looking statements largely on our current expectations and projections about future events and financial trends that we believe may affect our financial condition, results of operations, business strategy and financial needs. These forward-looking statements include statements about:
• our goals and strategies;
• our expected development and launch, and market acceptance, of our products and services;
• our future business development, financial condition and results of operations;
• the expected growth in, and market size of, the global internet industry;
• expected changes in our revenues, costs or expenditures;
• our expectations regarding demand for and market acceptance of our brand, platforms and services;
• our expectations regarding growth in our user base and level of engagement, including MAUs;
• our ability to attract, retain and monetize users;
• our ability to continue to develop new technologies and/or upgrade our existing technologies;
• growth of, and trends of, competition in our industry;
• government policies and regulations relating to our industry and the geographic markets in which we have business operations; and
• general economic and business conditions in the markets where we have businesses.
You should read this annual report and the documents that we refer to in this annual report with the understanding that our actual future results may be materially different from, and worse than, what we expect. Other sections of this annual report include additional factors which could adversely impact our business and financial performance. Moreover, we operate in an evolving environment. New risk factors and uncertainties emerge from time to time, and it is not possible for our management to predict all risk factors and uncertainties, nor can we assess the impact of all factors on our business or the extent to which any factor, or combination of factors, may cause actual results to differ materially from those contained in any forward-looking statements. We qualify all of our forward-looking statements by these cautionary statements.
You should not rely upon forward-looking statements as predictions of future events. The forward-looking statements made in this annual report relate only to events or information as of the date on which the statements are made in this annual report. Except as required by law, we undertake no obligation to update or revise any forward-looking statements, whether as a result of new information, future events or otherwise.
This annual report also contains statistical data and estimates that we obtained from industry publications and reports generated by government or third-party providers of market intelligence. Although we have not independently verified the data, we believe that the publications and reports are reliable. However, the statistical data and estimates in these publications and reports are based on a number of assumptions and if any one or more of the assumptions underlying the market data are later found to be incorrect, actual results may differ from the projections based on these assumptions. In addition, due to the rapidly evolving nature of the online content consumption and e-commerce industries, projections or estimates about our business and financial prospects involve significant risks and uncertainties.
PART I
Item 1. Identity of Directors, Senior Management and Advisers
Not applicable.
Item 2. Offer Statistics and Expected Timetable
Not applicable.
Item 3. Key Information
B.Capitalization and Indebtedness
Not applicable.
C.Reasons for the Offer and Use of Proceeds
Not applicable.
There is a high degree of risk associated with our company and business. You should carefully consider the risks described below, together with all of the other information in this annual report on Form 20-F. The risks described below are not the only risks facing us. Additional risks and uncertainties not currently known to us or that we currently deem to be immaterial may also materially and adversely affect our business operations. If any of the following risks occur, our business, operating results and financial condition could be materially adversely affected and the trading price of our ADSs could decline.
Summary of Risk Factors
Below is a summary of certain material risks we face, organized under relevant headings.
Risks Related to Our Business and Industry
• We may fail to maintain or grow the size of our user base or the level of engagement of our users.
• We face intense competition in a number of spaces and industries and if we do not continue to innovate and provide products and services that meet the needs of our users, we may not remain competitive.
• Potential issues raised by the use of AI technologies in our products and services may result in reputational harm or liability, adversely affecting our business, financial condition, and operating results.
• We may fail to keep up with rapid changes in technologies and mobile devices.
• We may not succeed in managing or expanding our business across the expansive and diverse markets that we operate in.
• Our investments in new businesses, new products, services and technologies and companies are inherently risky and could disrupt our ongoing businesses.
• The impact of worldwide macroeconomic and geopolitical conditions may adversely affect our business, operating results, and financial condition.
• Direct and indirect impacts of the war in Ukraine are highly unpredictable, could be significant, and may have an adverse effect on our business, operations and our future financial performance.
• Our business depends on a strong brand and reputation, and we may not be able to maintain and enhance our brand or reputation or there may be negative publicity against us.
• We are subject to risks related to litigation, including intellectual property claims and regulatory disputes.
• If we fail to detect online advertising fraud, we could lose the confidence of our partners and our revenues could decline.
Risks Related to Our Technology and Intellectual Property.
• We may fail to maintain or improve our technology infrastructure.
• We may not be able to prevent others from unauthorized use of our intellectual property or brands.
• Many of our applications contain open source software, which may pose increased risk to our proprietary software.
• We have been and expect to continue to be subject to intellectual property infringement claims, which could be time consuming and costly to defend, and may require us to pay significant damages or cease offering any of our products or key features of our products.
• We do not have exclusive rights to certain technology, trademarks and designs that are crucial to our business.
• Privacy concerns relating to our services and the use of user information could negatively impact our user base or user engagement, or subject us to governmental regulation and other legal obligations.
• We are exposed to cyber-attacks, data breaches, internal employee and other insider misconduct, computer viruses, physical and electronic break-ins and similar disruptions that may adversely impact our ability to protect the confidential information of our users and partners.
• Interruption or failure of our information technology and communications systems may result in reduced user traffic and harm to our reputation and business.
Risks Related to Our Suppliers and Partners.
• A small number of business partners contribute a significant portion of our revenues.
• We rely on our users’ web searches within Opera browsers for a substantial portion of our revenues.
• Our existing business and our expansion strategy depend on certain key collaborative arrangements, and we may be unable to maintain or develop these relationships.
• We operate platforms, products and services that include third parties over whose actions we have no control.
Risks Related to Our Internal Controls and Reporting.
• If we fail to implement and maintain effective internal control over financial reporting, we may be unable to accurately report our results of operations, meet our reporting obligations or prevent fraud.
• The cumulative requirements of being based in Europe, a public company, and a Kunlun subsidiary may strain our resources and divert our management’s attention.
• Our user metrics and other operational metrics are subject to inherent challenges and industry data, projections and estimates contained in this annual report are inherently uncertain and subject to interpretation.
Risks related to our ADS.
• If securities or industry analysts do not publish research or reports about our business, or if they adversely change their recommendations regarding the ADSs, the market price for the ADSs and trading volume could decline.
• Your ability to achieve a return on your investment will depend on the combination of future dividend payments and the price appreciation of the ADSs.
• As a “controlled company” under Nasdaq rules, we may be exempt from certain corporate governance requirements that could adversely affect our public shareholders.
• We are a foreign private issuer within the meaning of the rules under the Exchange Act, and as such we are exempt from certain provisions applicable to United States domestic public companies.
• The voting rights of holders of ADSs are limited by the terms of the deposit agreement, and you may not be able to exercise your right to vote with respect to the ordinary shares.
Risks Related to Our Business and Industry
We may fail to maintain or grow the size of our user base or the level of engagement of our users.
The size, geographical composition and engagement level of our user base are critical to our success. Our business and financial performance have been and will continue to be significantly affected by our success in adding, retaining and engaging active users. We continue to invest significant resources to grow our user base and increase user engagement, whether through innovations, providing new or improved products or services, marketing efforts or other means. We cannot assure you that our user base and engagement levels will grow at satisfactory rates, or at all. Our user numbers and engagement could be adversely affected if:
• we fail to maintain the popularity of our products and services among users;
• we are unable to continue to develop products that work with a variety of operating systems, devices and networks;
• we are unable to maintain the quality of our existing products and services;
• we are unsuccessful in innovating or introducing new, best-in-class products and services;
• we fail to adapt to changes in user preferences, market trends or advancements in technology including with respect to adoption of AI powered solutions;
• we are unsuccessful with cross-selling new products and services to our existing user base;
• our partners who provide content for Opera News, GX Games or our other platforms do not renew agreements or do not create content that is engaging, useful, or relevant to our users;
• our global distribution partners decide not to distribute our software on their products or platforms or impose adverse new restrictions or requirements for distribution on their products or platforms;
• we fail to provide adequate service to users or partners;
• technical or other problems prevent us from delivering our products or services in a timely and reliable manner or otherwise affect the user experience;
• there are user concerns related to privacy, safety, security or other factors;
• there are adverse changes to our products that are mandated by, or that we elect to make to address, legislation, regulation or litigation, including settlements or consent decrees;
• we fail to maintain the brand image of our products, or our reputation is damaged; or
• there are unexpected changes to the demographic trends, political, regulatory or economic development in the markets that we compete in.
Our efforts to avoid or address any of these events could require us to incur substantial expenditures to modify or adapt our products, services or platforms. If we fail to retain or grow our user base, or if our users reduce their engagement with our platforms, our business, financial condition and results of operations could be materially and adversely affected.
We face intense competition in a number of spaces and industries and if we do not continue to innovate and provide products and services that meet the needs of our users, we may not remain competitive.
We face intense competition in all of the products and services we offer. In the browser space, we generally compete with other global browser developers, including companies such as Google (Chrome), Apple (Safari), Microsoft (Edge) and Samsung (Samsung Internet), which have distributional or other advantages on their respective hardware or software platforms. We also compete with independent browser companies such as Mozilla (Firefox), Brave, Avast, Yandex, DuckDuckGo and UCWeb (UC Browser) for users who want to choose an alternative browser for their devices. In the advertising space, we compete with other global internet companies which operate advertising platforms and audience extension products, such as those offered by Meta, ByteDance and Alphabet for both inventory and advertisers. In the content space, we have faced significant competition from other internet companies promoting their own content products and services globally, including Alphabet, Apple and Meta, as well as competition from news aggregation services and from traditional media such as local and global newspapers and magazines.
Our browsers operate in, support and rely on an open, standards-based web ecosystem which competes with the curated internet experiences offered by gatekeepers on the platforms they control. In addition, we compete with all major internet companies for user attention and advertising spend. Moreover, in emerging markets, where certain mobile devices lack large storage capabilities, we may compete with other applications for the limited space available on users’ mobile devices. As we introduce new products, as our existing products evolve, or as other companies introduce new products and services, we may become subject to additional competition. For example, we launched an initial set of generative AI tools in our PC flagship browser in March 2023, gradually expanding to other mobile and PC browsers, and deploying additional tools, such as our Aria browser AI. In 2024 we added support for additional AI models including Gemini and on-device local AI models. We launched MiniPay, a non-custodial stablecoin wallet built on the Celo blockchain, in September 2023, as well as Opera Air, the first browser built around the concept of mindfulness, in February 2025. While we view our new products as extensions of Opera’s existing product portfolio, adding new products and services subjects us to new competitors and enhanced competition from our current competitors.
Many of our current and potential competitors have significantly greater resources and broader global recognition, and occupy better competitive positions in certain markets or on certain platforms than we do. These factors may allow our competitors to respond to new or emerging technologies and changes in market requirements better than we can. Our competitors may also develop products, features or services that are similar to ours or that achieve greater market acceptance. These products, features and services may undertake more far-reaching and successful product development efforts or marketing campaigns, or may adopt more aggressive pricing policies. In addition, our partners may use information that we share with them to develop or work with competitors to develop products or features that compete with us. Certain competitors, including Apple, Meta, Microsoft, Samsung and Alphabet, could use strong or dominant positions on their respective platforms or in one or more markets to gain competitive advantages against us in areas where we operate, including by:
• integrating competing features into products they control such as web browsers or mobile device operating systems;
• making acquisitions for similar or complementary products or services; or
• impeding Opera’s accessibility and usability by modifying or imposing use restrictions on existing hardware and software on which the Opera applications operate or upon which they depend.
As a result, our competitors may acquire and engage users at the expense of our user base or engagement, which may seriously harm our business.
We believe that our ability to compete effectively depends on a number of factors, many of which are beyond our control, including:
• the usefulness, novelty, performance and reliability of our products compared to our competitors;
• the number and demographics of our MAUs;
• the timing and market acceptance of our products, including developments and enhancements of our competitors’ products;
• our ability to monetize our products;
• the effectiveness of our marketing activities and our marketing and distribution teams;
• our ability to establish and maintain partners’ interest in working with Opera;
• the frequency, relative prominence and type of advertisements displayed on our applications or by our competitors;
• the effectiveness of our customer service and support efforts;
• our ability to innovate and remain at the forefront of emerging technologies and related market trends;
• changes as a result of legislation, regulatory authorities or litigation, including settlements and consent decrees, some of which may have a disproportionate effect on us;
• acquisitions or consolidation within the industries in which we operate;
• our ability to attract, retain and motivate talented employees, particularly engineers and commercial personnel;
• our ability to cost-effectively manage and scale our rapidly growing operations; and
• our reputation and brand strength relative to our competitors.
If we cannot effectively compete, our user engagement may decrease, which could make us less attractive to users, advertisers and partners and seriously harm our business.
Potential issues raised by the use of AI technologies in our products and services may result in reputational harm or liability, adversely affecting our business, financial condition, and operating results.
In January 2017, we launched the Opera News service, which is our AI-powered personalized news discovery and aggregation service. In June 2023, we redesigned and reengineered our flagship PC browser into Opera One, a browser with a new modular design and AI at its core with the Aria browser AI, which is built on our own Composer engine that can tap into multiple LLMs, as well as providing live results from the web. In February 2024, we deployed a new AI cluster in Iceland, which features an NVIDIA DGX SuperPOD equipped with advanced GPUs and an AI enterprise software platform and powered entirely by green energy, and will support the growth of our browsers and form the base of our future AI services. In April 2024, Opera became the first browser with built in local LLM support giving users access to what is now over 50 families of LLMs. Utilizing the Ollama framework (implemented by llama.cpp), Opera enables users to download and run open source LLMs locally and without any data leaving their devices. For additional details, see “Item 4. Information on the Company—B. Business Overview—Technology.”
As with many developing technologies, AI technologies present risks and challenges that could affect its further development, adoption, and use, and therefore our business. Our products and services providing AI powered functionality may not be adopted by our users or customers. In addition, AI algorithms may be flawed. Datasets may be insufficient or contain biased information, and algorithms could produce discriminatory or unexpected results or behaviors. Inappropriate or controversial data could impair the acceptance of our AI solutions and harm our reputation, business, customers, or stakeholders. Moreover, AI generated content from models accessed through our solutions may result in copyright and other legal issues and may not be able to compete against content generated through solutions offered by our competitors. These deficiencies could undermine the decisions, predictions, or analysis that models accessed through our AI functionalities produce, subjecting us to legal liability, and brand or reputational harm. For instance, several high-profile lawsuits were filed in the United States concerning the use of artificial intelligence technologies in recent years. These legal actions often center around issues such as intellectual property rights, data privacy, and potential bias in AI algorithms. Some AI scenarios also present ethical issues. If we enable or offer AI solutions that are controversial because of their purported or actual impact on human rights, privacy, employment, or other social or political issues, we may experience brand or reputational harm, adversely affecting our business and operating results. In addition, the viability of fair use defenses for training the third-party LLMs accessible via our solutions is under significant scrutiny in recent years, with major companies like OpenAI, Google, and others facing extensive litigation in the United States over the use of copyrighted works. OpenAI, for instance, has begun licensing content to mitigate claims, while also facing increasing legal challenges in various jurisdictions. As a result, the high costs associated with training advanced AI models, coupled with licensing fees, may impact the operational expenses and profitability of the providers of LLMs. Furthermore, evolving rules, regulations, and industry standards governing AI may require us to expend significant resources to modify, maintain, or align our business practices or products to comply with rules and regulations of different jurisdictions in which we operate, the nature of which cannot be determined at this time. Several jurisdictions around the globe, including the European Union and certain U.S. states, have already proposed or enacted laws governing AI. For example, certain State legislatures of the U.S. introduced a substantial number of bills aimed at regulating AI in 2024. Also, on September 5, 2024, the Council of Europe’s Framework Convention on AI was signed by several countries and districts including Norway, the United Kingdom, the U.S., and the European Union. The regulatory environment surrounding the impact of the implementation of AI on our products and services may adversely affect our ability to produce products and provide services and as a result may cause harm to our reputation and financial liability.
We may fail to keep up with rapid changes in technologies and mobile devices.
The PC and mobile internet industry is characterized by rapid technological changes. Our future success will depend on our ability to respond to rapidly changing technologies, adapt our services to evolving industry standards and improve the performance and reliability of our products and services. Our failure to adapt to such changes could harm our business. In addition, changes in mobile devices resulting from technological development may also adversely affect our business. If we are slow to develop new products and services for the latest mobile devices, or if the products and services we develop are not widely accepted and used by mobile device users, we may not be able to capture a significant share of this increasingly important market. In addition, the widespread adoption of new internet, mobile, networking or telecommunications technologies or other technological changes could require substantial expenditures to modify or adapt our products, services or infrastructure. If we fail to keep up with rapid technological changes to remain competitive, our future success may be adversely affected.
We may not succeed in managing or expanding our business across the expansive and diverse markets that we operate in.
Our business has become increasingly complex as we have expanded the markets in which we operate, the variety of products and services we offer and the overall scale of our operations. We have expanded and expect to continue to expand our headcount, office facilities and infrastructure. As our operations continue to expand, our technology infrastructure systems and corporate functions will
need to be scaled to support our operations, and if they fail to do so, it could negatively affect our business, financial condition and results of operations, and our ability to provide accurate and timely information.
The markets where we operate are diverse and fragmented, with varying levels of economic and infrastructure development and distinct legal and regulatory systems, and do not operate seamlessly across borders as a single or common market. Managing our growing businesses across these emerging markets requires considerable management attention and resources. Entering into new markets also involves various legal and regulatory risks and requires us to obtain various licenses and permits. We cannot assure you that we will be able to maintain, renew or obtain such licenses or permits on commercially reasonable terms or at all. We may incur additional compliance costs and may be subject to regulatory action or be ordered to cease our operations in certain markets if we fail to maintain, renew or obtain any material license or permit. Should we choose to expand into additional markets, these complexities and challenges could further increase. Because each market presents its own unique challenges, the scalability of our business is dependent on our ability to tailor our content and services to this diversity.
Our growing multi-market operations also require that we incur certain additional costs, including costs relating to staffing, logistics, intellectual property licensing or protection, tariffs and other trade barriers. Moreover, we may become subject to risks associated with:
• recruiting and retaining talented and capable management and employees in various markets;
• challenges caused by distance, language and cultural differences;
• providing content and services that appeal to the tastes and preferences of users in multiple markets;
• implementing our businesses in a manner that complies with local laws and practices, which may differ significantly from market to market;
• maintaining adequate internal and accounting control in subsidiaries across various markets;
• currency exchange rate fluctuations;
• protectionist laws and business practices, as well as complex local tax regimes. Digital business models in general are under significant scrutiny from tax and data protection authorities around the world, given the considerable complexity that these can bring on a cross-border basis, particularly when there may be no physical presence involved;
• potential political, economic and social instability; and
• potential local government initiatives to restrict access to our products and services.
Any of the foregoing could negatively affect our business, financial condition and results of operations.
We plan to continue expanding our operations globally to markets where we have limited operating experience, which may subject us to increased business, economic and regulatory risks.
We plan to continue expanding our business operations globally, entering into new markets where we have limited or no experience in marketing, selling and deploying current and future products and services. If we fail to deploy or manage our operations in international markets successfully, our business may suffer. In the future, as our international operations increase, or more of our revenue and expenses are generated or denominated in currencies other than the U.S. dollar, our operating results may become more sensitive to fluctuations in the exchange rates of various currencies relative to the U.S. dollar. In addition, we are subject to a variety of risks inherent in doing business internationally, including:
• political, social and economic instability;
• risks related to the legal and regulatory environment in foreign jurisdictions, including with respect to privacy, localization and content laws as well as unexpected changes in laws, regulatory requirements and enforcement due to the wide discretion given local lawmakers and regulators regarding the enactment, interpretation and implementation of local regulations;
• potential damage to our brand and reputation due to compliance with local laws, including potential censorship and requirements to provide user information to local authorities;
• fluctuations in currency exchange rates;
• higher levels of credit risk and payment fraud;
• complying with multiple tax jurisdictions;
• enhanced difficulties of integrating any foreign acquisitions;
• complying with a variety of foreign laws, including certain employment laws requiring national collective bargaining agreements that set minimum salaries, benefits, working conditions and termination requirements;
• reduced protection for our intellectual property rights in some countries and/or heightened protection for intellectual property rights of content providers in other countries;
• difficulties in staffing and managing global operations and the travel, infrastructure and compliance costs associated with multiple international locations;
• regulations that might add difficulties in repatriating cash earned outside our core markets and otherwise preventing us from freely moving cash;
• import and export restrictions and changes in trade regulation;
• complying with statutory equity requirements;
• complying with the U.S. Foreign Corrupt Practices Act, the U.K. Bribery Act and similar laws in other jurisdictions, such as Norway; and
• complying with export controls and economic sanctions administered by the relevant local authorities, including in the United States and European Union, in our international business.
If we are unable to expand internationally and manage the complexity of our global operations successfully, our business could be seriously harmed.
Our investments in new businesses, new products, services and technologies and companies are inherently risky and could disrupt our ongoing businesses.
We have invested and expect to continue to invest in new businesses, products, services and technologies. For example, we launched the GX Games portal in November 2021, a premium Opera VPN Pro offering in April 2022, and our MiniPay stablecoin wallet in September 2023. Throughout 2023 and 2024 we have launched a variety of generative AI tools and services including our Aria browser AI, and in 2024 we opened a green energy-powered data cluster in Iceland featuring a NVIDIA DGX SuperPOD to serve as the basis for additional future AI services. We may pursue additional opportunities in or relating to gaming, AI, Web3 and blockchain technologies in the future. We have limited historical experience in most aspects of the operation of our new initiatives, which makes it difficult to evaluate our future prospects. We intend to promote our new product and service offerings to our existing user base, and the success of such cross promotional efforts is uncertain. Moreover, we may not be able to obtain the regulatory approvals, permits or licenses as may be required for all of our desired initiatives. Failure to manage or grow our initiatives may have material adverse effects on our overall financial position and results of operations.
We also had minority investments in OPay and an investment in a venture fund operated by Verda Ventures. OPay is a privately-held fintech company focused on financial inclusion in emerging markets, with Nigeria and Egypt as initial key markets. OPay provides online and offline payments, and digital wallet services leveraging AI, big data and other fintech innovations, thus helping countries in emerging markets advance their trajectory of digital payments and other financial services. Verda Ventures operates a venture fund formed in the second half of 2024 with the purpose of making investments in MiniPay ecosystem companies and projects.
Our investments in new businesses, products, services, technologies and our minority investments in other entities may not generate the operational, strategic or financial results we expect. They could result in occurrence of significant impairment charges, amortization expenses or credit losses. See “— We may be required to recognize impairment charges.” Moreover, general operational risks, such as inadequate or failing internal control of an investee, may also expose our investments to risks beyond our control. See “Item 4. Information on the Company—B. Business Overview—Our Investments in Unconsolidated Entities,” “Item 5. Operating and Financial Review and Prospects—A. Operating Results—Major Factors Affecting Our Results of Operations—Our Ability to Conduct and Manage Strategic Investments and Acquisitions” and Note 11 to our consolidated financial statements included elsewhere in this annual report for additional information regarding our minority investments in other entities.
Our MiniPay and Web3 initiatives are subject to risks including regulatory uncertainty, dependence on key partnerships, and sustainability challenges that could adversely affect our business.
In September 2023, we launched MiniPay, a non-custodial stablecoin wallet built on the Celo blockchain. The monetization of MiniPay depends on a small number of key partnerships, such as our collaboration with the AP Grant Foundation Company, which compensates us for supporting the blockchain. While we believe crypto assets and blockchain technology have significant potential, the popularity and prevalence of crypto assets is a relatively recent trend, and whether crypto assets and blockchain technology will continue to be adopted by consumers and businesses in the long term is uncertain. There has been increased focus on the use of cryptocurrencies for improper, illegal, or fraudulent activities associated with various cryptocurrency projects, and the indirect environmental impacts associated with cryptocurrencies and blockchain technology. Many crypto assets are distributed without an identifiable centralized issuer or governing body, and their legal and regulatory status in various jurisdictions is unclear and may change in the future. New legislation and regulations, law enforcement and regulatory interventions, and judicial decisions may adversely affect crypto assets, blockchain technology, and future adoption of both by consumers and businesses. Developments of this nature may adversely affect our MiniPay product and may also adversely affect the value of crypto assets we hold, and our ability to buy, sell, accept, and use crypto assets and blockchain technology in the future. Moreover, the evolving regulatory landscape poses additional risks, where new regulations could render MiniPay untenable in certain jurisdictions. As a result, the combination of regulatory uncertainty and dependence on a limited number of partners could limit the sustainability or growth potential of our MiniPay business in the future.
We may need additional capital to expand our businesses but may not be able to obtain it on favorable terms or at all.
While we believe we have sufficient capital to fund our current growth plans, we may require additional capital in order to fund future plans for the additional growth and development of our businesses and any additional investments or acquisitions we may decide to pursue. If our cash resources are insufficient to satisfy our cash requirements, we may seek to issue additional equity or debt securities or obtain new or expanded credit facilities. Our ability to obtain external financing in the future is subject to a variety of uncertainties, including inflation and changes in interest rates, geopolitical conflict, our future financial condition, results of operations, cash flows, share price performance, liquidity of international capital and lending markets and governmental regulations in the markets that we operate in. In addition, incurring indebtedness would subject us to increased debt service obligations and could result in operating and financing covenants that would restrict our operations. There can be no assurance that financing will be available in a timely manner or in amounts or on terms acceptable to us, or at all. Any failure to raise needed funds on terms favorable to us, or at all, could severely restrict our liquidity as well as have a material adverse effect on our business, financial condition and results of operations. Moreover, any issuance of equity or equity-linked securities could result in significant dilution to our existing shareholders.
The impact of worldwide macroeconomic and geopolitical conditions may adversely affect our business, operating results, and financial condition.
Our financial performance is affected by worldwide macroeconomic and geopolitical conditions, including adverse economic conditions caused by inflation, changes in interest rates and tighter credit, implementations of tariffs and other trade-limiting policies, geopolitical conflicts such as the war in Ukraine or Gaza, supply chain disruptions, and currency fluctuations (see “— Fluctuations in foreign currency exchange rates will affect our financial results, which we report in U.S. dollars.”) Advertiser expenditures are impacted by overall economic conditions, and reductions in advertising spending could have a material adverse impact on our business, operating results, and financial condition.
We are currently operating during a period of economic uncertainty and cannot predict the timing, strength, or duration of economic downturns. To the extent general macroeconomic conditions remain uncertain or worsen, our business may be harmed. Inflation has the potential to adversely affect our liquidity, business, operating results, and financial condition by increasing our overall cost structure, particularly if we are unable to achieve commensurate increases in the prices we charge our customers. The existence of inflation in the economy has resulted in, and may continue to result in, higher interest rates and capital costs, increased costs of labor, fluctuations in foreign currency exchange rates, and other similar effects. As a result of inflation, we have experienced, and may continue to experience, cost increases, which could materially and adversely affect our business, operating results, and financial condition. In addition, high inflation to the point an economy in which we operate becomes hyperinflationary, could significantly affect our financial results and condition by us having to restate the financial statements for the changes in the general purchasing power of the local currency, using a general price index at the end of the reporting period. See Note 2 to our consolidated financial statements included elsewhere in this annual report for additional information.
Fluctuations in foreign currency exchange rates will affect our financial results, which we report in U.S. dollars.
We operate in multiple jurisdictions, which exposes us to the effects of fluctuations in currency exchange rates. Most of our revenue is denominated in the U.S. dollar and euro, while operating expenses are incurred in a wider specter of currencies, including the Norwegian krone, Chinese renminbi, Polish zloty, Swedish krona, British pound, and the euro. The functional currency of our revenue-generating entities is primarily the U.S. dollar. We typically have currency exchange exposure also in cases of global partners, even as such partners typically make payments to us in a major international currency like the U.S. dollar, as the underlying
activity upon which our revenue is calculated, may be based on such local currencies as observed and collected by our partners prior to converting to the currency in which we are paid, and in many cases this currency exposure is less visible to us. Fluctuations in the exchange rates between the various currencies that we use or are exposed to could result in expenses being higher and revenue being lower than would be the case if exchange rates were stable. Inflation or hyperinflation can weaken a country's currency by reducing its purchasing power, leading to weakened exchange rates (see “— The impact of worldwide macroeconomic and geopolitical conditions may adversely affect our business, operating results, and financial condition.”) We generally do not use derivatives to hedge our exposure to foreign currency risk and we cannot assure you that movements in foreign currency exchange rates will not have a material adverse effect on our results of operations in future periods.
Direct and indirect impacts of the war in Ukraine are highly unpredictable, could be significant, and may have an adverse effect on our business, operations and our future financial performance.
The Russian Federation initiated a full-scale military invasion of Ukraine on February 24, 2022, precipitating a humanitarian crisis. This ongoing military conflict has provoked strong reactions from Norway, the United States, the United Kingdom, the European Union and various other countries around the world, including the imposition of export controls and other broad financial and economic sanctions against Russia, which may have far-reaching effects on the global economy. While the precise effects of the ongoing military conflict and the retaliatory measures that have been taken, or could be taken in the future, remain uncertain, they have already resulted in significant volatility in financial markets and rises in energy and commodity prices globally, and created worldwide security concerns that could have a lasting impact on regional and global economies.
The macroeconomic impacts on our business continue to evolve and be unpredictable and may continue to adversely affect our business, operations and financial performance. Examples of potential impacts of the war in Ukraine on our business include changes in our user base as a result of our inability to operate our products in affected countries, reduced demand affecting our advertising and search revenues, increased compliance costs and business limitations from export controls or economic sanctions, as well as broader fluctuations in exchange rates that may directly and indirectly affect our global revenue and costs as presented in U.S. dollars. For example, on December 16, 2022, the European Union adopted economic sanctions prohibiting the provision of “advertising services” to legal persons, entities or bodies established in Russia, and therefore we have terminated all advertising contracts with customers in Russia among other actions. For additional details, see “Item 4. Information on the Company—B. Business Overview—Regulations—European Economic Sanctions.”
Revenue generated from customers and monetization partners domiciled in Russia accounted for 5.2%, or $20.7 million, of our revenue in 2023 and 3.5%, or $17.0 million, of our revenue in 2024. In 2024 this amount consisted of search revenues from our business partner Yandex. Although our transactions with Yandex relating to search distribution are not at present subject to any export control or economic sanction against Russia, there is no assurance that broader sanctions will not be in place in the future, which may adversely affect our relationship with this business partner.
We estimate that approximately 5.7% of our revenue in 2023 and 3.4% of our revenue in 2024 was generated based on monetizing the portion of our user base in Russia. As a result of the scale of the ongoing crisis and the speed at which the global community has been impacted, our revenue growth rate and expense as a percentage of our revenues, and our operating results, may fall below expectations in future periods.
Our business depends on a strong brand and reputation, and we may not be able to maintain and enhance our brand or reputation or there may be negative publicity against us.
We believe that our “Opera” brand and our reputation have contributed significantly to the success of our business. We also believe that maintaining and enhancing the “Opera” brand and our reputation are critical to our success in the future. As our markets become increasingly competitive, our success in maintaining and enhancing our brand and reputation will depend largely on our ability to remain a leading provider of browsers, AI-powered tools, gaming solutions and other products and services, which may become more expensive and challenging.
We consistently conduct marketing and brand promotion efforts and over the years have increased related spending. However, we cannot assure you that our marketing and brand promotion activities in the future will achieve the expected brand promotion effect to acquire users in a cost-effective way. If we fail to maintain and further promote the “Opera” brand or our reputation, or if we incur excessive expenses in this effort, our business and results of operations may be materially and adversely affected.
We are subject to risks related to litigation, including intellectual property claims and regulatory disputes.
We may be, and in some instances have been, subject to claims, lawsuits (including class actions and individual lawsuits), government investigations and other proceedings relating to intellectual property, consumer protection, privacy, labor and employment, import and export practices, competition, securities, tax, marketing and communications practices, commercial disputes and other matters. For example, we and certain of our directors and officers were named as defendants in a putative class action filed in the United States District Court for the Southern District of New York: Brown v. Opera Limited et al., Case No. 20 cv 674 (S.D.N.Y.), which was dismissed with prejudice in April 2021. The number and significance of our legal disputes and inquiries have
increased as our products and services have grown in complexity and as our business has expanded in scope and geographic reach. For instance, when we attempted to collect from a non-paying customer in Kenya, the non-paying customer filed a domestic lawsuit against us. We have since obtained a judgment against the non-paying customer for the full amount in the U.K., and reached a settlement-in-principle of the domestic lawsuit in Kenya.
As a public company, we have an elevated public profile, which may result in increased litigation and public awareness of such litigation. Further, there is substantial uncertainty regarding the scope and application of many of the laws and regulations to which we are subject, which increases the risk that we will be subject to claims alleging violations of those laws and regulations. Many of these laws and regulations are subject to change and uncertain interpretation, and could result in investigations, claims, changes to our business practices, increased cost of operations and declines in our user base, retention or engagement, any of which could seriously harm our business. In the future, we may also be accused of having, or be found to have, infringed or violated third party intellectual property rights.
Regardless of the outcome, legal proceedings can have a material and adverse impact on us due to their costs, diversion of our resources and other factors. We may decide to settle legal disputes on terms that are unfavorable to us. Furthermore, if any litigation to which we are a party is resolved adversely, we may be subject to an unfavorable judgment that we may not choose to appeal or that may not be reversed upon appeal. We may have to seek a license to continue practices found to be in violation of a third party’s rights. If we are required, or choose to enter into, royalty or licensing arrangements, such arrangements may not be available on reasonable terms, or at all, and may significantly increase our operating costs and expenses. As a result, we may also be required to develop or procure alternative non-infringing technology or discontinue the use of technology, and doing so could require significant effort and expense, or may not be feasible. In addition, the terms of any settlement or judgment in connection with any legal claims, lawsuits or proceedings may require us to cease some or all of our operations, or pay substantial amounts to the other party and could materially and adversely affect our business, financial condition and results of operations.
We may be the subject of anti-competitive, harassing or other detrimental conduct that could harm our reputation and cause us to lose users and customers.
We may be the target of anti-competitive, harassing, or other detrimental conduct by third parties. Allegations, directly or indirectly against us or any of our executive officers, may be posted in internet chatrooms or on blogs or websites by anyone, whether or not related to us, on an anonymous basis. The availability of information on social media platforms and devices is virtually immediate, as is its impact. Social media platforms and devices immediately publish the content their subscribers and participants post, often without filters or checks on the accuracy of the content posted. Information posted may be inaccurate and adverse to us, and it may harm our business, prospects or financial performance. The harm may be immediate without affording us an opportunity for redress or correction. In addition, such conduct may include complaints, anonymous or otherwise, to regulatory agencies. We may be subject to regulatory investigations as a result of such third-party conduct and may be required to expend significant time and incur substantial costs to address such third party conduct, and there is no assurance that we will be able to conclusively refute each of the allegations within a reasonable period of time, or at all. Additionally, our reputation could be harmed as a result of the public dissemination of anonymous allegations or malicious statements about our business, which in turn may cause us to lose users and customers and adversely affect the price of our ADSs.
If we fail to detect online advertising fraud, we could lose the confidence of our partners and our revenues could decline.
Like others in our industry, our business is exposed to the risk of various forms of online advertising fraud perpetrated by bad actors to generate traffic that does not represent genuine user interest or intent. We seek to detect and prevent such invalid traffic and expect our marketing and advertising partners to do the same. We and our partners, however, have been unable and may continue to be unable to detect and prevent all such abuses. If we and our partners fail to detect significant online advertising fraud associated with our marketing campaigns or advertising campaigns in our or third-party inventory on our platforms, which reduces the competitiveness of Opera Ads and advertisers’ willingness to advertise on our platforms, our revenues may be negatively affected or we may incur contractual penalties. For example, affected advertisers may experience a reduced return on their investment in advertising on our platforms and advertisers or publishers may lose confidence in the integrity of our systems. If this happens, our revenues from such monetization partners may decline.
We may fail to attract, motivate and retain the key members of our management team or other experienced and capable employees.
Our future success is significantly dependent upon the continued service of our executives and other key employees. If we lose the services of a key member of management or any key personnel, we may not be able to locate a suitable or qualified replacement and we may incur additional expenses to recruit and train a replacement, which could severely disrupt our business and growth.
To maintain and grow our business, we will need to identify, hire, develop, motivate and retain highly skilled employees. Identifying, recruiting, training, integrating and retaining qualified individuals requires significant time, expense and attention. In addition, from time to time, there may be changes in our management team that may be disruptive to our business. We may also be subject to local hiring restrictions in certain markets, particularly in connection with the hiring of foreign employees, which may affect the flexibility of our management team. If our management team, including any new hires that we make, fail to work together
effectively and execute our plans and strategies, or if we are not able to recruit and retain employees effectively, our ability to achieve our strategic objectives will be adversely affected and our business and growth prospects will be harmed.
Competition for highly skilled personnel is intense, including in the markets where our business operations are located. We may need to invest significant amounts of cash and equity to attract and retain new employees and we may not be able to realize returns on these investments.
We face risks related to natural disasters, health epidemics or terrorist attacks, which could significantly disrupt our operations.
Our business could be adversely affected by natural disasters, such as earthquakes, floods, landslides, tsunamis, volcanic eruptions, outbreaks of health epidemics, as well as terrorist attacks, other acts of violence or war or social instability. If any of these occurs, we may be required to temporarily or permanently close our facilities, and our business operations may be suspended or terminated. For example, in early 2020, COVID-19 impacted market and economic conditions globally, resulting in the implementation of significant governmental measures to control the spread of COVID-19 as well as changes in our user behavior and the businesses of our monetization partners. Thus, our future operating and financial results may fluctuate substantially or fall below the expectations of securities analysts and investors. In such events, the trading price of our ADSs may fluctuate significantly. If any such situation persists, the global economy may be severely harmed and disrupted, which could adversely affect our results of operation.
We have limited business insurance coverage.
Our business insurance is limited. Any uninsured damage to our platforms, technology infrastructures or disruption of our business operations could require us to incur substantial costs and divert our resources, which could have an adverse effect on our business, financial condition and results of operations.
Our results of operations are subject to seasonality and other fluctuations due to a number of factors.
We are subject to seasonality and other fluctuations in our business. For example, revenues from our e-commerce and travel partners are typically affected by seasonality due to various holidays that may result in higher than usual e-commerce transactions and travel-related activities, and similar seasonal trends may affect revenues from our search partners. We may not yet have sufficient historical information to accurately anticipate seasonal or other fluctuations in our newer business areas. Historical patterns of seasonality may in any case be less relevant under current macroeconomic conditions as the ongoing impacts of rising inflation and changes in interest rate, supply chain disruptions, and geopolitical conflicts such as the wars in Ukraine or Gaza may alter seasonal trends. Furthermore, recent trade tensions between the U.S. and other jurisdictions may negatively impact revenues from our e-commerce partners and the digital advertising markets in general.
We may not achieve the intended tax efficiencies of our corporate structure and intercompany arrangements, which could increase our worldwide effective tax rate.
Our corporate structure and intercompany arrangements, including the manner in which we conduct our intercompany and related party transactions, are intended to provide us with worldwide tax efficiencies. The application of tax laws of various jurisdictions to our business activities is subject to interpretation and also depends on our ability to operate our business in a manner consistent with our corporate structure and intercompany arrangements. The tax authorities of jurisdictions where we operate may challenge our methodologies for intercompany and related party arrangements, including transfer pricing, or determine that the manner in which we operate does not achieve the intended tax consequences, which could increase our worldwide effective tax rate and adversely affect our financial position and results of operations.
A certain degree of judgment is required in evaluating our tax positions and determining our provision for income taxes. In the ordinary course of business, there are many transactions and calculations for which the ultimate tax determination is uncertain. Our effective tax rate could be adversely affected by several factors such as lower earnings in markets where we have lower statutory rates, higher earnings in markets where we have higher statutory rates, an inability to fully utilize tax assets recognized on our balance sheet, changes in foreign currency exchange rates or changes in the relevant tax, accounting and other laws, regulations, principles and interpretations. Any of these factors could materially and adversely affect our financial position and results of operations.
Crypto assets we hold may be subject to volatile fluctuations in value and may subject us to additional tax, legal and regulatory requirements.
As of December 31, 2024, we held crypto assets classified as intangible assets in the Statement of Financial Position with a total carrying amount of $3.1 million. At the same time we held stablecoins accounted for as financial assets measured at fair value through profit or loss and presented as cash equivalents with a total carrying amount of $0.8 million. A substantial portion of our holdings of crypto assets are derived from a strategic partnership agreement entered into in 2023 with AP Grant Foundation Company, an entity promoting the Celo blockchain. See “Item 5. Operating and Financial Review and Prospects—B. Liquidity and Capital Resources—Contractual Obligations.” Although we have implemented guidelines to limit our exposure to crypto assets, including caps on our
holdings and policies for converting assets to fiat currencies, our holdings of crypto assets may increase from time to time as we pursue additional opportunities in or relating to Web3 and blockchain technologies in the future.
The values of crypto assets we hold have been and may continue to be highly volatile, and our ability to exchange crypto assets for fiat currencies or other crypto assets such as stablecoins may be subject to unanticipated suspensions in trading, as well as unhedged exchange rate risk.
Crypto assets have no physical form and rely on blockchain and other technologies for their creation, existence, and transactional validation on their respective networks. This reliance subjects crypto assets, cryptocurrency exchanges, and other blockchain intermediaries to unique risks related to cybersecurity, malicious attack, and technological obsolescence. While we believe we have taken reasonable measures to secure our crypto assets, these risks, in addition to human errors and computer malfunctions, may result in the loss or destruction of private keys needed to access the crypto assets we hold, in which case we may lose part or all of the crypto assets we hold, and our financial condition and results of operations may be harmed.
In addition, most crypto assets are currently accounted for as intangible assets with indefinite useful lives under IFRS Accounting Standards, which means we will recognize decreases in the value of the crypto assets we hold as impairments of non-financial assets but we will not recognize any increases in their value until we have sold them. For more information, see Note 10 to our consolidated financial statements included elsewhere in this annual report, and “— We may be required to recognize impairment charges.” This accounting treatment may adversely affect our operating results in periods where we have recognized an impairment. There is also no guarantee that the accounting treatment of crypto assets will remain the same in the future. If the accounting treatment of crypto assets changes, then we may have to adjust our accounting treatment of the crypto assets we hold and how we acquire them in the future.
We may be required to recognize impairment charges.
The carrying amounts of goodwill and other intangible assets, which predominantly relate to our acquisition of Opera Norway AS in 2016, totaled $429.7 million and $97.5 million, respectively, as of December 31, 2024. We also had property and equipment with a carrying amount of $34.1 million as of December 31, 2024. Intangible assets, including goodwill, and property and equipment, are tested for impairment whenever events or changes in circumstances indicate that the carrying amount might not be recoverable. In assessing whether there are indicators of impairment, we consider both external and internal sources of information, including losses of key customers, unfavorable changes in technology or competition and unfavorable changes in user base or user tastes. Irrespective of any impairment indicators, goodwill and other intangible assets with indefinite useful lives are tested annually for impairment. In 2024, we recognized an impairment loss of $0.1 million on a non-strategic intangible asset while in 2023, we recognized an impairment loss of $0.7 million on another non-strategic intangible asset. Based upon future economic and financial market conditions, the operating and financial performances of our businesses and other factors, including those mentioned above, future impairment charges could be incurred. Any future impairment charges that we are required to record could be material and have a material adverse impact on our results of operations. See Notes 9 and 10 to our consolidated financial statements included elsewhere in this annual report for additional information on our intangible and fixed assets.
We also have a minority investment in OPay and an investment in a venture fund operated by Verda Ventures, which are accounted for at fair value through profit or loss and in accordance with the equity method, respectively. As of December 31, 2024, the carrying amount of our investment in OPay was $258.3 million, whereas the carrying amount of our investment in the venture fund operated by Verda Ventures was $1.2 million. While we recognized unrealized fair value gains on our investment in OPay of $89.8 million in 2023 and $5.0 million in 2024, we may recognize losses in future periods if the estimated fair value of the investment decreases. If we identify indicators of impairment on our investment in the venture fund operated by Verda Ventures, we will estimate the recoverable amount of our investment in the entity, and we will recognize an impairment loss if the recoverable amount is less than the carrying amount. Estimates of fair value of our investment in OPay and the recoverable amount of our investment in Verda Ventures are based on a wide range of unpredictable factors, including the financial and operating performance of the investees and market conditions where the entities operate and invest. Any future losses on these investments could have a material impact on our results of operations and our financial position. See Note 11 to our consolidated financial statements included elsewhere in this annual report for additional information on our investments in unconsolidated entities.
Risks Related to Our Technology and Intellectual Property
We may fail to maintain or improve our technology infrastructure.
We are constantly upgrading our technology to provide improved performance, increased scale and better integration among our platforms. Adopting new technologies, upgrading our internet ecosystem infrastructure, as well as maintaining and improving our technology infrastructure require significant investments of time and resources, including adding new hardware, updating software and recruiting and training new engineering personnel. For example, in 2024, we opened a green energy-powered AI data cluster in Iceland featuring a NVIDIA DGX SuperPOD. Adverse consequences from the failure to continue to make such investments may include unanticipated system disruptions, security breaches, computer virus attacks, slower response times, decreased user satisfaction and delays in reporting accurate operating and financial information. In addition, many of the software and interfaces we use are internally developed and proprietary technology. If we experience problems with the functionality and effectiveness of our software or
platforms, or are unable to maintain and constantly improve our technology infrastructure to handle our business needs and ensure a consistent and acceptable level of service for our users, our business, financial condition, results of operation and prospects, as well as our reputation, could be materially and adversely affected.
We may not be able to prevent others from unauthorized use of our intellectual property or brands.
We regard our patents, copyrights, trademarks, trade secrets, and other intellectual property as critical to our business. Unauthorized use of our intellectual property by third parties may adversely affect our business and reputation. We rely on a combination of intellectual property laws and contractual arrangements to protect our proprietary rights. It is often difficult to register, maintain and enforce intellectual property rights in the markets where we operate. For example, statutory laws and regulations are subject to judicial interpretation and enforcement and may not be applied consistently due to the lack of clear guidance on statutory interpretation in certain countries in which we operate. In addition, contractual agreements may be breached by counterparties and there may not be adequate remedies available to us for any such breach. Accordingly, we may not be able to effectively protect our intellectual property rights or to enforce our contractual rights. Policing any unauthorized use of our intellectual property is difficult and costly and the steps we have taken may be inadequate to prevent the misappropriation of our intellectual property. In the event that we resort to litigation to enforce our intellectual property rights, such litigation could result in substantial costs and a diversion of our managerial and financial resources. We can provide no assurance that we will prevail in such litigation. In addition, our trade secrets may be leaked or otherwise become available to, or be independently discovered by, our competitors.
Many of our applications contain open source software, which may pose increased risk to our proprietary software.
We regularly use open source software in our applications, including in particular our Opera browsers which incorporate browser technology from the Chromium open-source browser project. We also distribute our software applications for use on operating systems based on the Android open-source project and Linux Foundation. We are supportive of the open source community, and we regularly engage with open source software communities and release internal software projects under open source licenses and anticipate continuing to do so in the future. The terms of many open source licenses to which we are subject have not been interpreted by U.S. or foreign courts, and there is a risk that such licenses could be construed in a manner that imposes unanticipated conditions or restrictions on our ability to sell or distribute our applications.
Our use of open source software from the Chromium project and distribution of products on Android and Linux mean our business benefits from robust engagement of open source software communities contributing to those projects. The U.S. Department of Justice and a number of state Attorneys General filed a lawsuit alleging that Google violated antitrust laws relating to search and search advertising, and in August 2024, the U.S. District Court for the District of Columbia ruled that Google violated such antitrust laws. The Court is holding a separate proceeding to determine remedies, which could include alterations to Google's business models and operations with respect to its sponsorship of and participation in the Android and Chromium open source communities, including potentially structural remedies, and/or distribution arrangements, among other changes. Should the Chromium or Android open source communities be negatively affected, we could incur additional research and development costs, switching costs, or licensing fees.
Additionally, we may from time to time face threats or claims from third parties claiming ownership of, or demanding release of, the alleged open source software or derivative works we developed using such software, which could include our proprietary source code, or otherwise seeking to enforce the terms of the applicable open source license. These threats or claims could result in litigation and could require us to make our source code freely available, purchase a costly license or cease offering the implicated applications unless and until we can re-engineer them to avoid the alleged infringement. Such a re-engineering process could require significant additional research and development resources, and we may not be able to complete it successfully. In addition to risks related to license requirements, our use of certain open source software may lead to greater risks than use of third party commercial software, as open source licensors generally do not provide warranties or controls on the origin of the software. Additionally, because any software source code we contribute to open source projects is publicly available, our ability to protect our intellectual property rights with respect to such software source code may be limited or lost entirely, and we are unable to prevent our competitors or others from using such contributed software source code. Any of these risks could be difficult to eliminate or manage and, if not addressed, could adversely affect our business, financial condition and results of operations.
We have been and expect to continue to be subject to intellectual property infringement claims, which could be time consuming and costly to defend, and may require us to pay significant damages or cease offering any of our products or key features of our products.
We cannot be certain that the products, services and intellectual property used in the ordinary course of our business do not or will not infringe valid patents, copyrights or other intellectual property rights held by third parties. We operate platforms, in particular Opera News, which display third party content and through which third party content providers may distribute their content. We cannot assure you that we or such content providers have sufficient rights in all content distributed via our platforms. Despite our ongoing review of local operations aimed at identifying risk reduction measures, we cannot assure that risks associated with content distribution will not escalate. Unforeseen challenges may arise that could adversely affect our ability to manage and mitigate these risks effectively. We have been and expect to continue to be subject to claims or legal proceedings relating to the intellectual property of others in the ordinary course of our business and may in the future be required to pay damages or license fees, or to agree to restrict
our activities. In particular, if we are found to have violated the intellectual property rights of others, we may be enjoined from using such intellectual property, may be ordered to pay damages and may incur licensing fees or be forced to develop alternatives. We may incur substantial expense in defending against third party infringement claims, regardless of their merit. Successful infringement claims against us may result in substantial monetary liability or may materially disrupt the conduct of our business by restricting or prohibiting our use of the intellectual property in question.
We do not have exclusive rights to certain technology, trademarks and designs that are crucial to our business.
We have applied for various patents relating to our business, and evaluate new applications on an ongoing basis. Approvals of our patent applications are subject to determinations by the relevant local authorities that there are no prior rights in the applicable territory. In addition, we have also applied for registrations and/or changes in registrations relating to our Opera logos and other key trademarks to establish and protect our exclusive rights to these trademarks. While we have succeeded in registering the trademarks for most of these marks in our major markets under certain classes, the applications for initial registration, and/or changes in registrations relating to transfers, of some marks and/or of some of trademarks under other classes are still under examination by the relevant local authorities. Approvals of our trademark registration applications, and/or of changes in registrations, are subject to determinations by the relevant local authorities that there are no prior rights in the applicable territories. We cannot assure you that these patent and trademark applications will be approved. Any rejection of these applications could adversely affect our rights to the affected technology, marks and designs. In addition, even if these applications are approved, we cannot assure you that any issued patents or registered trademarks will be sufficient in scope to provide adequate protection of our rights.
Privacy concerns relating to our services and the use of user information could negatively impact our user base or user engagement, or subject us to governmental regulation and other legal obligations.
We collect certain data from our users (including data considered to be “personal data” under applicable law), which we use for various purposes important to our business. For example, we use such data to better understand our users, to support advertising in Opera’s products, and to provide users with personalized news, videos, and other content recommendations. Additionally, we process more limited data to operate Aria, our AI chatbot powered in part by third parties like OpenAI and Google. Further, in the context of Opera Ads, we process and transfer large amounts of data collected through websites, apps, and other services operated by third parties with whom Opera has no direct relationship. Concerns about the collection, use, disclosure or security of personal information and data or other privacy-related matters, even if unfounded, could damage our reputation, cause us to lose users and subject us to regulatory investigations, all of which may adversely affect our business. While we strive to comply with applicable data protection laws and regulations, and to be as clear and transparent as possible in our privacy policies and public statements, any failure or perceived failure to comply with these laws, regulations or policies may result in inquiries and other proceedings or actions against us by government agencies or others, as well as negative publicity and damage to our reputation and brands, each of which could cause us to lose users and have an adverse effect on our business and operating results.
Because we store, process and use data, some of which contains personal information, we are subject to complex and evolving laws and regulations across multiple jurisdictions regarding privacy, data protection and other matters.
We are subject to a variety of laws and regulations that involve matters central to our business, including user privacy, rights of publicity, data protection, protection of minors, and consumer protection. These laws can be particularly restrictive in certain countries, particularly in the European Economic Area, where courts and regulators applying the General Data Protection Regulation, or GDPR, have generally favored a strict application of the law, especially where international data transfers, AI, or internet advertising are at issue. For example, in recent years European regulators and courts issued several decisions that are broadly adverse to the internet advertising industry, and showed particular concern about the use of personal data in AI services, including OpenAI’s ChatGPT product. Further, such laws and regulations constantly evolve and many jurisdictions that are significant to our businesses, including Singapore, Nigeria, Kenya, Brazil, and India have enacted or updated privacy laws, while similar developments have been made or under consideration in the United States at both the federal and state levels. For instance, the Protecting Americans’ Data from Foreign Adversaries Act of 2024 (PADFAA) could introduce uncertainties for our advertisement business, particularly regarding data-sharing dynamics with U.S. based partners. The application and interpretation of these laws and regulations are often uncertain, particularly in the new and rapidly evolving industry in which we operate. Many of these laws and regulations are subject to change and uncertain interpretation, and could result in investigations, claims, changes to our business practices, increased cost of operations and declines in user growth, retention or engagement, any of which could seriously harm our business. See “Item 4. Information on the Company—B. Business Overview—Regulations—Regulations on Data Protection and Information Security” of this annual report.
We are exposed to cyber-attacks, data breaches, internal employee and other insider misconduct, computer viruses, physical and electronic break-ins and similar disruptions that may adversely impact our ability to protect the confidential information of our users and partners.
We collect, store and process certain personal and other sensitive data from our users during our daily business operations. The data that we have processed and stored makes us and our external service providers a target and potentially vulnerable to cyber-attacks, computer viruses, physical or electronic break-ins or similar disruptions. Unauthorized parties can and have attempted to gain access to our systems and facilities through various means, including, among others, hacking into the systems or facilities of us or our
service providers, or attempting to fraudulently induce our employees, suppliers, customers or others into disclosing usernames, passwords, or other sensitive information, which may in turn be used to access our information technology systems, and we expect such efforts will continue in the future. While we have taken measures to protect the confidential information that we have access to, our security measures could and in some cases have been breached. Moreover, the techniques used to obtain unauthorized, improper or illegal access to our and our external service providers’ systems, our data or customers’ data, disable or degrade service, or sabotage systems are constantly evolving and becoming more sophisticated, may be difficult to detect quickly, and often are not recognized until after they have been launched against a target. We cannot guarantee that our security measures or the security measures of external service providers will prevent all security breaches, intrusions or attacks, as computer circumvention tools and techniques become more advanced. Certain such malicious efforts may be state-sponsored and supported by significant financial and technological resources, making them even more difficult to detect and prevent. Cybersecurity threats may also be amplified by improper use of AI in addition to other related technologies, which may further increase our exposure to security breaches, intrusions or attacks and other cybersecurity risks. As attackers harness AI capabilities to launch more complex, automated, and targeted attacks, we may need to spend additional resources to further strengthen our defenses against such threats. In addition, cybersecurity organizations in many countries have published warnings of increased cybersecurity threats to businesses, and external events like the conflict between Russia and Ukraine may increase the likelihood of cybersecurity attacks. We and our customers and suppliers may be subject to retaliatory cyberattacks perpetrated by Russia or others at their direction in response to economic sanctions and other actions taken against Russia as a result of its invasion of Ukraine. Any failure or security breach of information systems or data could result in a violation of applicable privacy and other laws, significant legal and financial exposure, damage to our reputation or a loss of confidence in our security measures, which could also adversely affect our business.
Although to date we have not suffered any material costs or disruption to our business caused by any such incident, any future security breach could have a material adverse impact on our users’ willingness to use our services, and our reputation and brands, business operations and financial performance. For more information, see “Item 16K. Cybersecurity—Material Incidents” of this annual report.
Malware, viruses, hacking and phishing attacks, spamming and improper or illegal use of our products or services could seriously harm our business and reputation.
Malware, viruses, hacking and phishing attacks have become more prevalent in our industry, have occurred on our systems in the past and may occur on our systems in the future. Because of our prominence, we believe that we are an attractive target for these sorts of attacks. In addition, we possess certain personal data from our users as described in our privacy statement. The data that we process and store, while generally limited in scope, may also make us an attractive target for cyber-attacks due to the size of our user base. In some of our businesses we rely on mobile money providers and payment processors to conclude transactions. Such suppliers may hold funds on our behalf and may themselves be attractive targets for these sorts of attacks. Although it is difficult to determine what, if any, harm may directly result from an interruption or attack, any failure to maintain performance, reliability, security and availability of our products and technical infrastructure to the satisfaction of our users may seriously harm our reputation and our ability to retain existing users and attract new users. If these activities increase on our platform, our reputation, user growth and engagement, and operational cost structure could be seriously harmed. Likewise, such failures with respect to our suppliers may harm our reputation or result in a financial loss. For more information, see “Item 16K. Cybersecurity” of this annual report.
Our business may be adversely affected by third party software applications or practices that interfere with our receipt of information from, or provision of information to, our users, which may impair the user experience on our platform.
Our business may be adversely affected by third party software applications, which may be unintentional or malicious, that make changes to our users’ PCs or mobile devices and interfere with our products and services. These software applications may change the user experience on our platform by hijacking queries, altering or replacing the search results provided by our search engine partners to our users or otherwise interfering with our ability to connect with our users. Such interference can occur without disclosure to or consent from users, and users may associate any resulting negative experience with our products and services. Such software applications are often designed to be difficult to remove, block or disable. Further, software loaded on or added to mobile devices on which our software applications are pre-installed may be incompatible with or interfere with or prevent the operation of such applications, which might deter the owners of such devices from using our services. If we are unable to successfully prevent or limit any such applications or systems that interfere with our products and services, our ability to deliver a high-quality experience or recommend relevant content to our users may be adversely affected.
Interruption or failure of our information technology and communications systems may result in reduced user traffic and harm to our reputation and business.
Interruption or failure of any of our information technology and communications systems or those of the operators of third party internet properties that we collaborate with could impede or prevent our ability to provide our services. In addition, our operations could be interrupted by natural disasters and other events. Our disaster recovery plan for our servers cannot fully ensure safety in the event of damage from fire, floods, storms, earthquakes, volcanic eruptions, power loss, telecommunications failures, hacking and similar events. If any of the foregoing occurs, we may experience a partial or complete system shutdown. Furthermore, our servers, which are hosted at third party internet data centers, are also vulnerable to break-ins, sabotage and vandalism. Some of our systems are
not fully redundant, and our disaster recovery planning does not account for all possible scenarios. The occurrence of a natural disaster or a closure of an internet data center by a third-party provider without adequate notice could result in lengthy service interruptions. Any system failure or inadequacy that causes interruptions in the availability of our services, or increases the response time of our services, could have an adverse impact on our user experience and satisfaction, our attractiveness to users and advertisers and future user traffic and advertising on our platform. To improve performance and to prevent disruption of our services, we may have to make substantial investments to deploy additional servers or one or more copies of our internet platforms to mirror our online resources.
Risks Related to Our Suppliers and Partners
A small number of business partners contribute a significant portion of our revenues.
A small number of business partners contribute a significant portion of our revenues. For example, our largest business partner, Google, contributed approximately 40.2% of our revenues in 2024, representing a reduction from 42.4% in 2023 and 44.9% in 2022. Although we continue efforts to diversify our partner base, we cannot assure you that a limited number of partners will not continue to contribute a significant portion of our revenues for the near future. Consequently, any of the following events may materially and adversely impact our business, results of operations and growth prospects:
• reduction, delay or cancellation of services by our large business partners;
• a significant decrease in the business results or prospects of one of our large business partners;
• failure by one or more of our large business partners to pay for our services; or
• loss of one or more of our significant customers and any failure to identify and acquire additional or replacement partners.
Revenue generated from customers domiciled in Ireland accounted for 44.1%, 41.1% and 38.5% in 2022, 2023 and 2024, respectively. In addition, revenue generated from customers domiciled in Singapore accounted for 15.6%, 15.4% and 13.6% in 2022, 2023 and 2024, respectively. Revenue generated from customers domiciled in the United States accounted for 7.2%, 8.7% and 13.0% in 2022, 2023 and 2024, respectively. Geographic concentration is not necessarily an indication of where user activity occurs as our end users are located across the world but is affected by the geographic concentration of domicile among certain of our primary monetization partners. We are especially exposed to risks related to the economic conditions, regional specific legislation and tax law of the identified countries.
We rely on our users’ web searches within Opera browsers for a substantial portion of our revenues.
We share in the revenue generated by search partners when our users conduct searches initiated within the URL bar or search boxes embedded in our PC and mobile browsers. Revenue generated from users’ search activity accounted for 42.3%, 40.9% and 38.7% in 2022, 2023 and 2024, respectively. Our revenue sharing and fee arrangements, and the relationships and cooperation with our search providers are subject to change. Traditional search business models may, for example, evolve if AI chatbot powered search experiences become widely adopted. Moreover, the U.S. Department of Justice and a number of state Attorneys General filed a lawsuit alleging that Google violated antitrust laws relating to search and search advertising, and in August 2024, the U.S. District Court for the District of Columbia ruled that Google violated such antitrust laws. The Court is holding a separate proceeding to determine remedies, which could include alterations to Google's search distribution arrangements in the U.S., among other changes.
If our search partners reduce or discontinue their spending with us or see reduced monetization, and if we fail to establish comparable alternative monetization of the traffic we can drive to search or advertising partners, our business, financial condition and results of operations could be materially and adversely affected.
Our existing business and our expansion strategy depend on certain key collaborative arrangements, and we may be unable to maintain or develop these relationships.
Our existing business, and our strategy for developing our business, involve maintaining and developing various types of collaborations with third parties, which provide us with access to additional user traffic, advertising campaigns and inventory, search services, products and technology. For example, our collaboration with Google allows us to provide our global users with high quality search services. We also work with leading device manufacturers and software storefront providers, to ensure cost-efficient and reliable distribution of our products and services. For our Opera Ads in-house advertising platform, we work with a variety of mobile advertising platforms. We formed strong relationships with high profile media and independent content providers to obtain comprehensive news and other content that we can make available to users on our platforms. Moreover, as part of our focus on expanding our AI capabilities, we have key partnerships with leading providers of natural language processing services such as Google and OpenAI.
We consider these collaborations to be important to our ability to deliver attractive services, products and content offerings to our users, in order to maintain and expand our user and advertiser bases, and we believe that it will continue to be important for us to
develop similar partnerships in the future. Our inability to maintain and grow such relationships could have an adverse impact on our existing business and our growth prospects. In addition, our competitors may establish the same relationships that we have, which would diminish any advantage we might otherwise gain from these relationships.
We may fail to maintain and expand our collaborations with third party operators of internet properties.
We place promotional links to some of our search engine providers and other partners on our browsers, thereby providing easy access to premier search and other online services for our users and increasing our associated revenues. Moreover, we rely on third party operators of internet properties for auxiliary services. For example, we use a third-party service to store and analyze most of our system data including number of active users, clicks-per-user, impressions, comments, likes, visits, etc. If these third parties decide to stop collaborating with us, our revenues and growth and operations may be adversely affected.
We operate platforms, products and services that include third parties over whose actions we have no control.
Our browsers integrate online search capabilities from leading international and regional search companies. We cannot be certain that our search partners will provide our users with the search results that they are looking for. Our browsers also contain shortcuts to third party coupons and offers, e-commerce, travel and other businesses. We cannot be certain that the products and services that these third parties provide will be of a sufficiently high quality or that they will accurately represent the products and services in their postings.
We operate a number of online platforms and portals that collect the digital content of a wide variety of third parties over which we do not exercise control. For example, our GX Games portal provides users with games developed and offered by third-party game developers. Likewise, our Opera News content discovery platform includes third-party content and offers a platform for independent bloggers and journalists to publish their work. Moreover, we integrate third-party messaging and AI chatbot services into our PC browser sidebar and offer our own Aria browser AI which can tap into multiple LLMs supplied by third parties, as well as provide live results from the web. We cannot control the actions of these third parties. Our ability to identify and remove digital content that may be deemed inaccurate, misleading, defamatory, offensive, socially unacceptable, or that may violate applicable laws in relevant jurisdictions, may be insufficient. If these third-parties were to supply inappropriate content, or not perform their functions to our satisfaction or the satisfaction of our users, it may damage the reputation of our platform.
Moreover, although we may not be legally responsible for the conduct of third parties in most jurisdictions, the global nature of our internet-based operations exposes us to the risk that foreign legal or regulatory regimes may assert jurisdiction over us or adopt interpretations of liability that conflict with our understanding of applicable law. Governments or regulators in certain jurisdictions may take an expansive view of personal or subject-matter jurisdiction, seek to impose liability on us for third-party activities, or enforce laws and regulations in ways we do not anticipate. Further, while we have agreements with each of these third parties, any legal protections we might have in our agreements could be insufficient to compensate us for our losses and may not be able to repair the damage to our reputation.
We rely upon third party channels and partners in distributing our products and services.
We rely upon a number of third parties for distribution of our products and services to end users. For example, we rely on mobile software application storefronts, including Google Play and Apple’s App Store, as well as various mobile manufacturer app stores, to enable users to download our mobile software applications, and on key mobile device manufacturers to pre-install our mobile software applications on mobile phones prior to sale. The promotion, distribution and operation of our software applications are subject to the standard terms and conditions of these distribution channel providers, which may be broad, poorly tailored to local conditions, and subject to frequent unilateral changes and interpretation by the channel providers. If one or more of these channel providers halts the distribution of certain of our products and services on their platforms, as they have temporarily done in the past, our business may suffer. There is no guarantee that these distribution channel providers will distribute or continue to support or feature our product offerings. Furthermore, these channel providers may not enforce their standard terms and conditions for application developers consistently or uniformly across all applications and with all application developers, in part because such terms and conditions may not be practical or otherwise appropriate in certain markets. We will continue to be dependent on distribution channel providers, and any changes, bugs, technical or regulatory issues relating to such channel providers, our relationships with these channel providers, or the requirements or interpretation of their terms and conditions or pricing that is to our detriment could adversely impact our business. These may include any changes that degrade the functionality of our offerings, reduce or eliminate our ability to distribute our offerings, give preferential treatment to competitive products, limit our ability to deliver high quality offerings, or impose fees or other charges related to delivering our offerings. Further, if a channel provider believes that we have violated the terms and conditions of its platform, regardless of whether such terms and conditions have a legitimate basis or are practical in a given market, this could result in the channel provider restricting our ability to use their services and adversely affect our product usage and monetization. Furthermore, if any of these distribution channel providers delivers unsatisfactory services, engages in fraudulent action, or is unable or refuses to continue to provide its services to us and our users for any reason, it may materially and adversely affect our business, financial condition and results of operations.
We rely upon the internet infrastructure, cloud services, data centers and telecommunications networks of third parties in the markets where we operate.
Our business depends on the performance and reliability of the internet infrastructure as well as contracted data center and cloud computing providers in the markets where we operate. We may not have access to alternative networks or providers in the event of disruptions or failures of, or other problems with, the relevant internet infrastructure. In addition, the internet infrastructure, especially in the emerging markets where we operate, may not support the demands associated with continued growth in internet usage.
We use third party data center and cloud computing providers to host our services and for the storing of data related to our business. We do not control the operation of these facilities and rely on contracted agreements to employ their use. The owners of the data center facilities and cloud services have no obligation to renew their agreements with us on commercially reasonable terms, or at all. If we are unable to renew these agreements on commercially reasonable terms, or if one of our providers is acquired by another party, we may be required to transfer our servers and other infrastructure to alternative providers, and we may incur significant costs and possible lengthy service interruptions in connection with doing so. Any changes in third party service levels or any errors, defects, disruptions or other performance problems with our browsers or other services could adversely affect our reputation and adversely affect the online browsing experience. If navigation through our browsers is slower than our users expect, users may use our services less, if at all. Interruptions in our services might reduce our revenue, subject us to potential liability or adversely affect our ability to attract advertisers.
We also rely on major telecommunications operators in the markets where we operate to provide us with data communications capacity primarily through local telecommunications lines. We and our users may not have access to alternative services in the event of disruptions or failures of, or other problems with, the fixed telecommunications networks of these telecommunications operators, or if such operators otherwise fail to provide such services. Any service interruption could disrupt our operations, subject us to potential liability, or damage our reputation and result in a decrease in our revenue. Furthermore, we have no control over the costs of the services provided by the telecommunications operators to us and our users. If the prices that we pay for telecommunications and internet services rise significantly, our margins could be reduced. In addition, if internet access fees or other charges to internet users increase, our user traffic may decrease, which in turn may cause our revenue to decline.
Our business depends on continued and unimpeded access to the internet by us and our users. Internet access providers may be able to restrict, block, degrade or charge for access to certain of our products and services, which could lead to additional expenses and the loss of users and advertisers.
Our products and services depend on the ability of our users to access the internet. Currently, this access is provided by companies that have significant market power in the broadband and internet access marketplace, including incumbent telephone companies, cable companies, mobile communications companies and government-owned service providers. Some of these providers have taken, or have stated that they may take measures, including legal actions, that could degrade, disrupt or increase the cost of user access to certain of our products by restricting or prohibiting the use of their infrastructure to support or facilitate our offerings, or by charging increased fees to us or our users to provide our offerings.
In addition, in some markets, our products and services may be subject to government-initiated restrictions or blockages. Such interference could result in a loss of existing users and advertisers, and increased costs, and could impair our ability to attract new users and advertisers, thereby harming our revenues and growth.
Risks Related to Our Internal Controls and Reporting
If we fail to implement and maintain effective internal control over financial reporting, we may be unable to accurately report our results of operations, meet our reporting obligations or prevent fraud.
As a public company in the United States, we are subject to the Sarbanes-Oxley Act of 2002, or the Sarbanes-Oxley Act. Section 404 of the Sarbanes-Oxley Act requires that we include a report from management on the effectiveness of our internal control over financial reporting in our annual report on Form 20-F. In connection with the preparation of this annual report, our management concluded that our internal control over financial reporting as of December 31, 2024, was not effective as certain risks of material misstatements had been identified for which our control framework was not effective as of December 31, 2024. Specifically, as our remediation efforts for our previously reported material weaknesses were staged based on the capacity of our appropriately qualified personnel, the design and implementation of certain business process controls, including those over the completeness and accuracy of information used, were not yet completed. Although we are in the process of taking remedial measures to address the deficiencies described above, we cannot assure you that the material weakness will be cured in a timely manner. See “Item 15. Controls and Procedures—B. Management’s Annual Report on Internal Control over Financial Reporting.”
Moreover, we may identify additional control deficiencies and we may not be able to conclude on an ongoing basis that we have effective internal control over financial reporting in accordance with Section 404 of the Sarbanes-Oxley Act. If we fail to achieve and maintain an effective internal control environment, we could suffer material misstatements in our financial statements and may fail to meet our reporting obligations, which would likely cause investors to lose confidence in our reported financial information. This could
in turn limit our access to capital markets, harm our results of operations, and lead to a decline in the trading price of our ADSs. Additionally, ineffective internal control over financial reporting could expose us to increased risk of fraud or misuse of corporate assets and subject us to potential delisting from the Nasdaq Global Select Market, regulatory investigations and civil or criminal sanctions. We may also be required to restate our financial statements from prior periods.
We have incurred and anticipate that we will continue to incur considerable costs, management time and other resources in an effort to comply with Section 404 and other requirements of the Sarbanes-Oxley Act.
The cumulative requirements of being based in Europe, a public company, and a Kunlun subsidiary may strain our resources and divert our management’s attention.
We have been a public company since 2018. In 2021, Kunlun, a Chinese public company and our largest investor, increased its ownership stake in us beyond 50%, and as a result we became a consolidated subsidiary of Kunlun. As a public company, we are subject to the reporting requirements of the Exchange Act, the Sarbanes-Oxley Act, the Dodd-Frank Act and the listing standards of Nasdaq as applicable to a foreign private issuer, which are different in some material respects from those applicable to U.S. domestic issuers. Similarly, as a subsidiary of Kunlun, we are additionally subject to certain of the listing rules of the Shenzhen Stock Exchange and Chinese corporate governance standards. We are also headquartered in Norway and subject to Norwegian and EU environmental, social and governance (ESG) reporting requirements, see “Item 4. Information on the Company—B. Business Overview—Regulations—Regulations on Environmental, Social & Governance.” We expect that the requirements of these rules and regulations will increase, both in isolation and in combination, elevating our legal, accounting and financial compliance costs, making some activities more difficult, time consuming and costly, and placing additional requirements on our personnel, systems and resources. As a result, or for other reasons, we may also experience threatened or actual litigation, including by customers, suppliers, competitors, shareholders or other third parties. If such claims are successful, our business and operating results could be harmed, and even if the claims do not result in litigation or are resolved in our favor, these claims, and the time and resources necessary to resolve them, could divert the resources of our management and harm our business and operating results.
Our user metrics and other operational metrics are subject to inherent challenges in measuring our operations.
We regularly report metrics, including our MAUs and ARPU, to help investors evaluate our growth trends and measure our performance. These metrics are calculated using internal company data and have not been validated by an independent third party. While these numbers are based on what we believe to be reliable data, there are inherent challenges in measuring how our platforms are used across large populations throughout the regions that we operate in. For example, we typically are not able to distinguish individual users who use multiple applications. Our user metrics are also affected by technology on certain mobile devices that automatically runs in the background of our applications when another phone function is used, and this activity can cause our system to miscount the user metrics associated with such applications.
Errors or inaccuracies in our metrics or data could also result in incorrect business decisions and inefficiencies. For instance, if a significant understatement or overstatement of active users were to occur, we may expend resources to implement unnecessary business measures or fail to take required actions to remedy an unfavorable trend. Moreover, during the process of upgrading our platform in the past, we have lost certain historical metrics, such as the number of search queries, that we rely on to manage our operations. If partners or investors do not perceive our user, geographic or other operating metrics as accurately representing our user base, or if we discover material inaccuracies in our user, geographic or other operating metrics, our reputation may be seriously harmed.
Industry data, projections and estimates contained in this annual report are inherently uncertain and subject to interpretation. Accordingly, you should not place undue reliance on such information.
Certain facts, forecasts and other statistics relating to the industries in which we compete contained in this annual report have been derived from various public data sources and third party industry reports. In deriving the market size of the aforementioned industries and regions, these industry consultants may have adopted different assumptions and estimates, such as the number of internet users. While we generally believe such reports are reliable, we have not independently verified the accuracy or completeness of such information. Such reports may not be prepared on a comparable basis or may not be consistent with other sources.
Industry data, projections and estimates are subject to inherent uncertainty as they necessarily require certain assumptions and judgments. Our industry data and market share data should be interpreted in light of the defined geographic markets and defined industries we operate in. Any discrepancy in the interpretation thereof could lead to different industry data, measurements, projections and estimates and result in errors and inaccuracies.
Risks Related to Our ADSs
The trading price of ADSs may be volatile, which could result in substantial losses to investors.
The trading price of ADSs can be volatile and fluctuate widely due to factors beyond our control. This may happen because of broad market and industry factors such as but not limited to concerns over the health of the global economy and geopolitical concerns.
In addition to market and industry factors, the price and trading volume for the ADSs may be highly volatile for factors specific to our own operations, including the following:
• variations in our announced dividends as well as quarterly or annual revenue, earnings and cash flow;
• announcements of new investments or divestments, acquisitions, strategic partnerships or joint ventures by us or our competitors;
• announcements of new products, services and expansions by us or our competitors;
• changes in financial estimates by securities analysts;
• detrimental adverse publicity about us, our platforms or our industries;
• additions or departures of key personnel;
• short seller reports that make allegations against us or our affiliates, even if unfounded;
• share repurchase activity or sales of additional equity securities;
• potential litigation or regulatory investigations; and
• other risk factors mentioned in this annual report.
Any of these factors may result in large and sudden changes in the volume and price at which the ADSs will trade.
In the past, class action lawyers have often sought to bring securities class action suits against companies following periods of instability in the market price of their securities. Such class action suits may divert a significant amount of our management’s attention and other resources from our business and operations and may require us to incur significant expenses to defend the suit, which could harm our results of operations. Any such class action suit, whether or not successful, could harm our reputation and restrict our ability to raise capital in the future. In addition, if a claim is successfully made against us, we may be required to pay significant damages, which could have a material adverse effect on our financial condition and results of operations.
If securities or industry analysts do not publish research or reports about our business, or if they adversely change their recommendations regarding the ADSs, the market price for the ADSs and trading volume could decline.
The trading market for the ADSs will be influenced by research or reports that industry or securities analysts publish about our business. If one or more analysts who cover us downgrade the ADSs, the market price for the ADSs would likely decline. If one or more of these analysts cease to cover us or fail to regularly publish reports on us, we could lose visibility in the financial markets, which in turn could cause the market price or trading volume for the ADSs to decline.
Your ability to achieve a return on your investment will depend on the combination of future dividend payments and the price appreciation of the ADSs.
On June 13, 2023, our Board of Directors adopted a recurring semi-annual cash dividend program. The first semi-annual dividend of $0.40 per ADS was paid to shareholders of record as of June 30, 2023. Subsequently we have declared and paid semi-annual dividends under the program, each of $0.40 per ADS, to shareholders of record on January 3, 2024, July 2, 2024 and January 6, 2025. We intend to pay regular semi-annual dividends, with each payment subject to the approval of our Board of Directors and to certain requirements of Cayman Islands law. The form, frequency and amount of future dividends will depend upon our future operations and earnings, capital requirements and surplus, general financial condition, contractual restrictions and other factors that our Board of Directors may deem relevant.
Our Board of Directors has complete discretion as to whether to continue, increase, reduce or even cease distributing dividends, subject to certain requirements of Cayman Islands law. In addition, our shareholders may by ordinary resolution declare a dividend, but no dividend may exceed the amount recommended by our directors. Any dividends paid to ADS holders will be paid net of fees and expenses as provided under the deposit agreement.
The return on your investment in the ADSs will also likely depend upon any future price appreciation of the ADSs. There is no assurance that the ADSs will appreciate in value or even maintain the price at which you purchased the ADSs. You may not realize a return on your investment in the ADSs and you may even lose your entire investment in the ADSs.
Kunlun, our parent company, and James Yahui Zhou, our chairman of the board and chief executive officer, have control over our company and their interests may not be aligned with the interests of our other shareholders.
As of the date of this annual report, Kunlun, a Chinese public company listed on the Shenzhen Stock Exchange, indirectly owns 68.8% of our issued and outstanding ordinary shares. As such, we are a consolidated subsidiary of Kunlun. In addition, Mr. Zhou, our chairman of the board and chief executive officer, is also a controlling shareholder of Kunlun.
As a result of the foregoing, Kunlun and Mr. Zhou have the ability to control or exert significant influence over important corporate matters and investors may be prevented from affecting important corporate matters involving our company that require approval of shareholders, including:
• the composition of our Board of Directors and, through it, any determinations with respect to our operations, business direction and policies, including the appointment and removal of officers;
• any determinations with respect to mergers or other business combinations;
• our disposition of substantially all of our assets; and
• any change in control.
These actions may be taken even if they are opposed by our other shareholders, including the holders of the ADSs. Furthermore, this concentration of ownership may also discourage, delay or prevent a change in control of our company, which could have the dual effect of depriving our shareholders of an opportunity to receive a premium for their shares as part of a sale of our company and reducing the price of the ADSs. As a result of the foregoing, the value of your investment could be materially reduced.
In addition, the significant concentration of share ownership may adversely affect the trading price of the ADSs due to investors’ perception that conflicts of interest may exist or arise. For more information regarding our principal shareholder and its affiliated entities, see “Item 6. Directors, Senior Management and Employees—E. Share Ownership.” We have in the past, and likely will continue to enter into related party transactions involving entities directly or indirectly controlled by Kunlun or Mr. Zhou. See “Item 7. Major Shareholders and Related Party Transactions—B. Related Party Transactions” for details. Such related party transactions, while reviewed and approved by our Board’s Audit Committee consisting solely of independent directors, may indirectly benefit Kunlun or Mr. Zhou personally, by virtue of their interest in the related party.
As a “controlled company” under Nasdaq rules, we may be exempt from certain corporate governance requirements that could adversely affect our public shareholders.
Due to the shareholding of our chairman and chief executive officer, James Yahui Zhou, and because Kunlun is the beneficial owner of a majority of the voting power of our issued and outstanding share capital, we qualify as a “controlled company” under Nasdaq rules. Under these rules a company of which more than 50% of the voting power is held by an individual, group or another company is a controlled company and may elect not to comply with certain corporate governance requirements, including the requirement that a majority of our directors be independent, as defined in the Nasdaq rules, and the requirement that our compensation and corporate governance and nominating committees consist entirely of independent directors. We rely on certain corporate governance exemptions as described in “Item 16G. Corporate Governance” of this annual report. So long as we remain a controlled company relying on any of such exemptions and during any transition period following the time when we are no longer a controlled company, you would not have the same protections afforded to shareholders of companies that are subject to all of the Nasdaq corporate governance requirements.
If a United States person is treated as owning at least 10% of our ADSs or ordinary shares, such person may be subject to adverse United States federal income tax consequences.
If a United States person is treated as owning (directly, indirectly or constructively) at least 10% of the value or voting power of our ADSs or ordinary shares, such person may be treated as a “United States shareholder” with respect to each “controlled foreign corporation,” or CFC, in our group. In general, a non-United States corporation could be treated as a CFC if more than 50 percent of its voting power or value is owned by United States shareholders. Because our group includes one or more United States subsidiaries that are corporations for United States federal income tax purposes, in certain circumstances, we could be treated as a CFC and certain of our non-United States subsidiary corporations could be treated as CFCs (regardless of whether or not we are treated as a CFC).
A United States shareholder of a CFC may be required to annually report and include in its United States taxable income its pro rata share of “subpart F income,” “global intangible low-taxed income” and investments in United States property by CFCs, whether
or not we make any distributions. An individual who is a United States shareholder with respect to a CFC generally would not be allowed certain tax deductions or foreign tax credits that would be allowed to a corporation that is a United States shareholder. Furthermore, even if there is no entity within our group that is treated as a CFC, certain United States shareholders may still incur reporting obligations on certain foreign corporations under specific circumstances. A failure to comply with these reporting obligations may subject a United States shareholder to significant monetary penalties and may prevent the starting of the statute of limitations with respect to such shareholder’s United States federal income tax return for the year for which reporting was due. We do not intend to monitor whether we are or any of our non-United States subsidiaries is treated as a CFC or whether any investor is treated as a United States shareholder with respect to us or any of our CFC subsidiaries or to furnish to any United States shareholders information that may be necessary to comply with the aforementioned reporting and tax paying obligations. A United States investor should consult its tax advisor regarding the potential application of these rules to its particular circumstances.
We may be classified as a passive foreign investment company, which could result in adverse United States federal income tax consequences to United States Holders of our ADSs or ordinary shares.
We will be a passive foreign investment company, or PFIC, for United States federal income tax purposes for any taxable year if, applying applicable look-through rules, either (i) at least 75% of our gross income for such year is passive income or (ii) at least 50% of the value of our assets (generally determined based on an average of the quarterly values of the assets) during such year is attributable to assets that produce or are held for the production of passive income. A separate determination must be made after the close of each taxable year as to whether we are a PFIC for that year and involves extensive factual investigation, including ascertaining the fair market value of all of our assets on a quarterly basis and the character of each item of income that we earn, and is subject to uncertainty in several respects. Based on the market price of our ADSs, the value of our assets and the nature and composition of our income and assets, we do not believe that we were a PFIC for United States federal income tax purposes for our taxable year ended December 31, 2024, and we do not expect to become a PFIC for our current taxable year, although there can be no assurances in this regard. Moreover, we cannot assure you that the United States Internal Revenue Service, or the IRS, will agree with any position that we take. Accordingly, there can be no assurance that we will not be treated as a PFIC for any taxable year or that the IRS will not take a position contrary to any position that we take.
Changes in the nature or composition of our income or assets, including as a result of our investment in new businesses, products, services and technologies, may cause us to be or become a PFIC. In addition, the determination of whether we will be a PFIC for any taxable year may also depend in part upon the value of our goodwill and other unrecorded intangibles not reflected on our balance sheet (which may depend upon the market price of our ADSs or ordinary shares from time to time, which may fluctuate significantly) and also may be affected by if, how, and how quickly, we spend our liquid assets and the cash we generate from our operations and raise in any offering. In estimating the value of our goodwill and other unrecorded intangibles, we have taken into account our market capitalization. Among other matters, if our market capitalization declines, we may be or become a PFIC for the current or future taxable years because our liquid assets and cash (which are for this purpose considered assets that produce passive income) may then represent a greater percentage of the value of our overall assets. Further, while we believe our classification methodology and valuation approach are reasonable, it is possible that the IRS may challenge our classification or valuation of our goodwill and other unrecorded intangibles, which may result in our being or becoming a PFIC for our taxable year ended December 31, 2024, the current taxable year or one or more future taxable years.
If we are a PFIC for any taxable year during which a United States Holder (as defined in “Item 10. Additional Information—E. Taxation—United States Federal Income Tax Considerations”) holds our ADSs or ordinary shares, certain adverse United States federal income tax consequences would generally apply to such United States Holder. See “Item 10. Additional Information—E. Taxation—United States Federal Income Tax Considerations—Passive Foreign Investment Company.”
Our memorandum and articles of association contain anti-takeover provisions that could have a material adverse effect on the rights of holders of our ordinary shares and the ADSs.
Our memorandum and articles of association contain provisions to limit the ability of others to acquire control of our company or cause us to engage in change-of-control transactions. These provisions could have the effect of depriving our shareholders of an opportunity to sell their shares at a premium over prevailing market prices by discouraging third parties from seeking to obtain control of our company in a tender offer or similar transaction. For example, our Board of Directors has the authority, without further action by our shareholders, to issue preferred shares in one or more series and to fix their designations, powers, preferences, privileges and relative participating, optional or special rights and the qualifications, limitations or restrictions, including dividend rights, conversion rights, voting rights, terms of redemption and liquidation preferences, any or all of which may be greater than the rights associated with our ordinary shares, in the form of ADSs or otherwise. Preferred shares could be issued quickly with terms calculated to delay or prevent a change in control of our company or make removal of management more difficult. If our Board of Directors decides to issue preferred shares, the price of the ADSs may fall and the voting and other rights of the holders of our ordinary shares and the ADSs may be materially and adversely affected.
You may face difficulties in protecting your interests, and your ability to protect your rights through U.S. courts may be limited, because we are incorporated under Cayman Islands law.
We are an exempted company limited by shares incorporated under the laws of the Cayman Islands. Our corporate affairs are governed by our memorandum and articles of association, the Companies Act (As Revised) of the Cayman Islands and the common law of the Cayman Islands. The rights of shareholders to take action against the directors, actions by minority shareholders and the fiduciary duties owed by our directors under Cayman Islands law are to a large extent governed by the common law of the Cayman Islands. The common law of the Cayman Islands is derived in part from comparatively limited judicial precedent in the Cayman Islands as well as from the common law of England, the decisions of whose courts are of persuasive authority, but are not binding, on a court in the Cayman Islands. The rights of our shareholders and the fiduciary duties of our directors under Cayman Islands law are not as clearly established as they would be under statutes or judicial precedent in some jurisdictions in the United States. In particular, the Cayman Islands has a less developed body of securities laws than the United States. Some U.S. states, such as Delaware, have more fully developed and judicially interpreted bodies of corporate law than the Cayman Islands. In addition, Cayman Islands companies may not have standing to initiate a shareholder derivative action in a federal court of the United States.
Shareholders of Cayman Islands exempted companies like us have no general rights under Cayman Islands law to inspect corporate records (other than such companies’ memorandum and articles of association, any special resolutions and the register of mortgages and charges) or to obtain copies of lists of shareholders of these companies. Under Cayman Islands law, the names of our current directors can be obtained from a search conducted at the Registrar of Companies. Our directors have discretion under our memorandum and articles of association to determine whether or not, and under what conditions, our corporate records may be inspected by our shareholders, but are not obliged to make them available to our shareholders. This may make it more difficult for you to obtain the information needed to establish any facts necessary for a shareholder resolution or to solicit proxies from other shareholders in connection with a proxy contest.
Certain corporate governance practices in the Cayman Islands, which is our home country, differ significantly from requirements for companies incorporated in other jurisdictions such as the United States. We rely on certain corporate governance exemptions as described in “Item 16G. Corporate Governance” of this annual report which permit us to follow our home country practices. Consequently, our shareholders may be afforded less or different protections than they otherwise would under the rules and regulations applicable to U.S. domestic issuers.
As a result of all of the above, public shareholders may have more difficulty in protecting their interests in the face of actions taken by management, members of the Board of Directors or controlling shareholder than they would as public shareholders of a company incorporated in the United States.
Certain judgments obtained against us by our shareholders may not be enforceable.
We are an exempted company limited by shares incorporated under the laws of the Cayman Islands, and the majority of our assets are located, and the majority of our operations are conducted outside of the United States. In addition, a majority of our current directors and officers are nationals and residents of countries other than the United States. Substantially all of the assets of these persons are located outside the United States. As a result, it may be difficult or impossible for you to bring an action against us or against these individuals in the United States in the event that you believe that your rights have been infringed under the U.S. federal securities laws or otherwise. Even if you are successful in bringing an action of this kind, the laws of the Cayman Islands and of Norway may render you unable to enforce a judgment against our assets or the assets of our directors and officers.
As an exempted company incorporated in the Cayman Islands, we are permitted to adopt certain home country practices for corporate governance matters that differ significantly from the Nasdaq corporate governance listing standards; these practices may afford less protection to shareholders than they would enjoy if we complied fully with the corporate governance listing standards.
As a Cayman Islands exempted company listed on the Nasdaq Global Select Market, we are subject to Nasdaq corporate governance listing standards which permit a foreign private issuer like us to follow the corporate governance practices of its home country. Certain corporate governance practices in the Cayman Islands, which is our home country, may differ significantly from the Nasdaq corporate governance listing standards. For instance, we are not required to: (i) have a majority of the board be independent; or (ii) have a compensation committee consisting entirely of independent directors. We rely on certain corporate governance exemptions as described in “Item 16G. Corporate Governance” of this annual report. To the extent we choose to follow home country practice in the future, our shareholders may be afforded less protection than they would otherwise enjoy under the Nasdaq corporate governance listing standards applicable to U.S. domestic issuers.
We are a foreign private issuer within the meaning of the rules under the Exchange Act, and as such we are exempt from certain provisions applicable to United States domestic public companies.
Because we are a foreign private issuer under the Exchange Act, we are exempt from certain provisions of the securities rules and regulations in the United States that are applicable to U.S. domestic issuers, including:
• the rules under the Exchange Act requiring the filing of quarterly reports on Form 10-Q or current reports on Form 8-K with the SEC;
• the sections of the Exchange Act regulating the solicitation of proxies, consents or authorizations in respect of a security registered under the Exchange Act;
• the sections of the Exchange Act requiring insiders to file public reports of their stock ownership and trading activities and liability for insiders who profit from trades made in a short period of time; and
• the selective disclosure rules by issuers of material nonpublic information under Regulation FD.
We are required to file an annual report on Form 20-F within four months of the end of each fiscal year. In addition, we intend to continue to publish our results on a quarterly basis through press releases, distributed pursuant to the rules and regulations of the Nasdaq. Press releases relating to financial results and material events will also be furnished to the SEC on Form 6-K. However, the information we are required to file with or furnish to the SEC is less extensive and less timely compared to that required to be filed with the SEC by U.S. domestic issuers. As a result, you may not be afforded the same protections or information, which would be made available to you, were you investing in a U.S. domestic issuer.
The voting rights of holders of ADSs are limited by the terms of the deposit agreement, and you may not be able to exercise your right to vote with respect to the ordinary shares.
As a holder of ADSs, you will only be able to exercise the voting rights with respect to the underlying ordinary shares in accordance with the provisions of the deposit agreement. Under the deposit agreement, you must vote by giving voting instructions to the depositary. Upon receipt of your voting instructions, the depositary will try to vote the underlying ordinary shares in accordance with these instructions. You will not be able to directly exercise your right to vote with respect to the underlying shares unless you withdraw the shares. Under our amended and restated memorandum and articles of association, the minimum notice period required for convening a general meeting is seven days. When a general meeting is convened, you may not receive sufficient advance notice to withdraw the shares underlying your ADSs to allow you to vote with respect to any specific matter. If we ask for your instructions, the depositary will notify you of the upcoming vote and will arrange to deliver our voting materials to you. We cannot assure you that you will receive the voting materials in time to ensure that you can instruct the depositary to vote your shares. In addition, the depositary and its agents are not responsible for failing to carry out voting instructions or for their manner of carrying out your voting instructions. This means that you may not be able to exercise your right to vote and you may have no legal remedy if the shares underlying your ADSs are not voted as you requested.
ADSs holders may not be entitled to a jury trial with respect to claims arising under the deposit agreement, which could result in less favorable outcomes to the plaintiff(s) in any such action.
The deposit agreement governing the ADSs representing our ordinary shares provides that, to the fullest extent permitted by law, ADS holders waive the right to a jury trial for any claim they may have against us or the depositary arising out of or relating to our shares, the ADSs or the deposit agreement, including any claim under the U.S. federal securities laws.
If we or the depositary were to oppose a jury trial based on this waiver, the court would have to determine whether the waiver was enforceable based on the facts and circumstances of the case in accordance with applicable state and federal law. To our knowledge, the enforceability of a contractual pre-dispute jury trial waiver in connection with claims arising under the federal securities laws has not been finally adjudicated by the United States Supreme Court. However, we believe that a contractual pre-dispute jury trial waiver provision is generally enforceable, including under the laws of the State of New York, which govern the deposit agreement, or by a federal or state court in the City of New York, which has non-exclusive jurisdiction over matters arising under the deposit agreement. In determining whether to enforce a contractual pre-dispute jury trial waiver, courts will generally consider whether a party knowingly, intelligently and voluntarily waived the right to a jury trial. We believe that this would be the case with respect to the deposit agreement and the ADSs. It is advisable that you consult legal counsel regarding the jury waiver provision before investing in the ADSs.
If you or any other holders or beneficial owners of ADSs bring a claim against us or the depositary in connection with matters arising under the deposit agreement or the ADSs, including claims under federal securities laws, you or such other holder or beneficial owner may not be entitled to a jury trial with respect to such claims, which may have the effect of limiting and discouraging lawsuits against us or the depositary. If a lawsuit is brought against us or the depositary under the deposit agreement, it may be heard only by a judge or justice of the applicable trial court, which would be conducted according to different civil procedures and may result in
different outcomes than a trial by jury would have, including outcomes that could be less favorable to the plaintiff(s) in any such action.
Nevertheless, if this jury trial waiver is not permitted by applicable law, an action could proceed under the terms of the deposit agreement with a jury trial. No condition, stipulation or provision of the deposit agreement or the ADSs serves as a waiver by any holder or beneficial owner of ADSs or by us or the depositary of compliance with any substantive provision of the U.S. federal securities laws and the rules and regulations promulgated thereunder.
You may not receive dividends or other distributions on our ordinary shares, and you may not receive any value for them if it is illegal or impractical to make them available to you.
The depositary has agreed to pay to you the cash dividends or other distributions it or the custodian receives on the ordinary shares or other deposited securities underlying your ADSs, after deducting its fees and expenses. You will receive these distributions in proportion to the number of ordinary shares your ADSs represent. However, the depositary is not responsible if it decides that it is unlawful or impractical to make a distribution available to any holders of ADSs. For example, it would be unlawful to make a distribution to a holder of ADSs if it consists of securities that require registration under the Securities Act but that are not properly registered or distributed under an applicable exemption from registration. The depositary may also determine that it is not feasible to distribute certain property through the mail. Additionally, the value of certain distributions may be less than the cost of mailing them. In these cases, the depositary may determine not to distribute such property. We have no obligation under U.S. securities laws to register any ADSs, ordinary shares, rights or other securities received through such distributions. We also have no obligation to take any other action to permit the distribution of ADSs, ordinary shares, rights or anything else to holders of ADSs. This means that you may not receive distributions we make on our ordinary shares or any value for them if it is illegal or impractical for us to make them available to you. These restrictions may cause a material decline in the value of the ADSs.
You may experience dilution of your holdings due to inability to participate in rights offerings.
We may, from time to time, distribute rights to our shareholders, including rights to acquire securities. Under the deposit agreement, the depositary will not distribute rights to holders of ADSs unless the distribution and sale of rights and the securities to which these rights relate are either exempt from registration under the Securities Act with respect to all holders of ADSs, or are registered under the provisions of the Securities Act. The depositary may, but is not required to, attempt to sell these undistributed rights to third parties, and may allow the rights to lapse. We may be unable to establish an exemption from registration under the Securities Act, and we are under no obligation to file a registration statement with respect to these rights or underlying securities or to endeavor to have a registration statement declared effective. Accordingly, holders of ADSs may be unable to participate in our rights offerings and may experience dilution of their holdings as a result.
Item 4. Information on the Company
A.History and Development of the Company
We trace our history back to 1996 and the launch of the first version of our “Opera” branded browser software. We have since been a pioneer in redefining the web browsing experience, providing personalized content discovery platforms and offering gaming services for hundreds of millions of global internet users.
Opera Limited is an exempted company with limited liability incorporated in March 2018 in the Cayman Islands. Opera Limited is a holding company that does not have substantive operations. We conduct our principal activities through our subsidiaries, including in particular Opera Norway AS, a private limited liability company incorporated under the laws of Norway. We acquired Opera Norway AS and its subsidiaries on November 3, 2016, for a consideration of $575.0 million, less working capital adjustments. This acquisition included the business of providing Opera’s mobile and PC web browsers, as well as certain related products and services. Our principal executive offices are located at Vitaminveien 4, 0485 Oslo, Norway. Our telephone number at this address is +47 23 69 24 00. Our principal website is www.opera.com. The information contained on our website is not a part of this annual report.
We listed our ADSs on the Nasdaq Global Select Market under the symbol “OPRA” on July 27, 2018. On August 9, 2018, we completed the initial public offering of 9,600,000 ADSs, and the underwriters later exercised their over-allotment option for the purchase of an additional 334,672 ADSs. We also sold 4,999,999 ADSs, in a private placement concurrent with the initial public offering in 2018 and our pre-IPO shareholders held the equivalent of 95,125,000 ADSs at that time. On September 24, 2019, we completed a follow-on public offering of an additional 7,500,000 ADSs, and the underwriters later exercised their over-allotment option for the purchase of an additional 1,125,000 ADSs, which was completed on October 16, 2019. On October 4, 2023, we completed a secondary public offering of 6,876,506 ADS, which were sold by a pre-IPO shareholder.
On December 3, 2024, the annual general meeting of shareholders of our company voted for a proposal of our Board of Directors to consolidate each two ordinary shares into one ordinary share (the “share consolidation”), which took effect on December 6, 2024, and at the same time, the ratio between ordinary shares and ADSs was changed from two-to-one (2:1) to one-to-one (1:1). Consequently, there was no change in the number of ADSs outstanding or any investor’s ownership percentage in Opera, and as such
the changes were neutral to the value of each ADS in the Company as traded on Nasdaq. Following the share consolidation, the authorized share capital of the Company is $50,000 divided into 250,000,000 shares of a nominal or par value of $0.0002 each. As of the date of this annual report, a total of 89,500,854 shares were outstanding.
Available Information
We are subject to the periodic reporting and other informational requirements of the Exchange Act as applicable to foreign private issuers. Under the Exchange Act, we are required to file reports and other information with the SEC. Specifically, we are required to file annually a Form 20-F within four months after the end of each fiscal year. However, we are exempt from certain disclosure requirements under the U.S. Exchange Act that apply to domestic U.S. companies. See “Item 3. Key Information—D. Risk Factors—Risks Related to Our ADSs—We are a foreign private issuer within the meaning of the rules under the Exchange Act, and as such we are exempt from certain provisions applicable to United States domestic public companies.”
The SEC also maintains a website at www.sec.gov that contains reports, proxy and information statements, and other information regarding registrants that make electronic filings with the SEC using its EDGAR system. Our annual report and some of the other information submitted by us to the SEC may be accessed through this website. Such information can also be found on our investor relations website at investor.opera.com. See “Item 10. Additional Information—H. Documents on Display.”
Opera is a leading global internet brand with a large and engaged user base of over 296 million average MAUs in the fourth quarter of 2024. Building on over 29 years of innovation, starting with our browser products, we are leveraging our brand as well as our massive and engaged user base in order to expand our offerings and our business. Today, we offer users around the globe a range of products and services that include a variety of PC and mobile browsers, our Opera Gaming portals and development tools, our Opera News content recommendation products, our audience extension product (namely the Opera Ads platform) and a number of AI and Web3 products and services.
Opera launched one of the first PC browsers in 1996 and introduced the world’s first full web browser for mobile phones in 2002. Since then, Opera has remained an innovator in the browser space, launching features including tabbed browsing, data savings, PC-mobile sync, and numerous features focused on privacy and security, including ad blocking and a built-in VPN. Continuing to build on this tradition, in 2023 we redesigned and reengineered our flagship PC browser into Opera One and launched generative AI tools including Aria, our browser AI, in our browsers. Today, our browser products include Opera Mini, Opera Browser for Android and iOS, and Opera for Computers, as well as the Opera GX and Opera GX Mobile browsers tailored for gamers. Our browsers had approximately 268 million average MAUs in the fourth quarter of 2024.
The browser is an increasingly strategic application—often serving as the access point for content, e-commerce, AI, gaming and fintech activities on the internet, and Opera is utilizing this strategic position to launch and scale new offerings.
Opera Gaming, our emerging video game focused division, started with Opera GX, a browser tailored for gamers. We launched our GX browser for PCs in the second quarter of 2019 followed by a mobile version in May 2021. In early 2021, we purchased GameMaker, which allows anyone to develop a video game in a low-code environment. Building on the strength of our GX browser user base and the community of developers using GameMaker, in September 2021, we launched GX Games, a gaming portal which allows gamers to find and play games developed using GameMaker. In the fourth quarter of 2024, Opera GX reached 34 million MAUs.
Opera News, our content platform enabled by big data technologies, was launched in 2017, initially as part of our browser and later as a stand-alone app, leveraging our large user base and well-known brand in order to deliver a personalized and relevant content experience at scale. To ensure access to compelling content, Opera News Hub was launched to enable local content creators to publish exclusive content on our platform, which has helped grow engagement on the service by increasing page views and time spent. Since the initial launch of Opera News, we have expanded the platform to offer customized experiences for certain particular verticals, such as football (soccer). Today, Opera News is offered in a number of customizations and under a variety of brands, including Apex. In the fourth quarter of 2024, Opera News had an average of 368 million MAUs, which included 27 million MAUs from standalone news apps.
The Opera Ads platform, our audience extension product, was launched in 2021 as an online marketing platform that allows our advertising partners to reach an even larger audience than the one offered by Opera’s owned and operated apps and websites.
Since 2021, we have offered Web3 and e-commerce products including a premium VPN, and in 2023 we launched our MiniPay stablecoin wallet built on the Celo blockchain.
We intend to continue to leverage our brand as well as our large and engaged user base to launch additional consumer facing products in the future.
Our Products and Users
Our products include: (i) Opera Browsers – the web browsers Opera Mini, Opera Browser for Android and iOS, Opera for Computers, and Opera GX for PCs and mobile; (ii) Opera Gaming – which builds on the success of Opera GX with the GX Games gaming portal and the GameMaker video game development engine; (iii) Opera News – the content aggregation and personalized recommendation platform; (iv) Opera Ads – the intelligent online marketing platform; and (v) our Web3 and e-commerce offerings.
Our cloud-based technologies enable hundreds of millions of users to discover and interact with the content and services that matter most to them. The application of leading AI-powered technologies and advanced data analytics and the recommendation engine built into our browsers and news apps, and other products and services, give our users a better, faster and more personalized online experience and enable advertisers to target relevant users in a more precise way.
We have a large and active global PC browser user base with 84 million average MAUs in the fourth quarter of 2024. Our smartphone average MAUs in the three months ended December 31, 2024, was 178 million. This figure comprises approximately 151 million smartphone browser users, and approximately 27 million users of the Opera News apps.
Our strategy has been to focus on and expand our marketing and distribution activities in Western markets while reducing our spending in certain emerging markets. From the fourth quarter of 2023 to the same quarter of 2024, this strategy led to a 9.9% increase in our total overall user base in Western markets and an 8.5% decrease in emerging markets. This shift of focus to Western markets resulted in improved monetization on a per-user basis, demonstrated by our metric of annualized ARPU increasing by 37% from the fourth quarter of 2023 to the same quarter in 2024, driven by the strong growth in advertising and search revenues over the period. See “Item 5. Operating and Financial Review and Prospects—A. Operating Results—User Metrics.” Our user base reached 55 million average MAUs in North America and Europe in the fourth quarter of 2024.
Opera Browsers
Our PC browsers: Opera for Computers and Opera GX
We believe Opera for Computers is one of the most innovative and differentiated PC browsers on the market, catering to the high-end user segment that requires performance and features beyond those offered by the pre-loaded system browsers on Windows, macOS and variants of Linux. Opera for Computers uses an Opera-tuned version of the Chromium browsing engine carefully optimized for performance metrics such as speed and laptop battery consumption. In addition, we provide users with unique features that are not found in other major web browsers, including a free, built-in VPN service that enhances user privacy and security, especially for laptops on public networks. The browser also includes a native ad block feature. Our PC browser makes it easier to shop online with built-in currency and foreign unit conversion and makes communication easier by embedding messaging and social network services such as Facebook Messenger, WhatsApp, Slack, Discord, Instagram, TikTok, Bluesky and X in the browser’s sidebar. In 2023, we continued to add features and functionality to our Opera for Computers offering. In June 2023, we redesigned and reengineered our flagship PC browser into Opera One, a browser with a new modular design, as well as a new, more streamlined architecture based on a multithreaded compositor and the new tab island feature for easier organization of the browser tabs. Most importantly, the Opera One version of our PC browser became our first browser to have AI at its core with the Aria browser AI, which is built on our own Composer AI engine that can tap into multiple LLMs, as well as provide live results from the web.
Opera GX, which launched in the second quarter of 2019, is a web browser tailored for gamers. Integrating seamlessly into gamers' broader gaming setups, Opera GX allows PC gamers to customize and tune their browsers to improve their gaming experience. In September 2019, Opera GX won the Red Dot Award in the Interface and User Experience Design category. Features, such as GX Control and embedding Twitch in the browser differentiates Opera GX from Opera for Computers. Opera GX now includes new features such as Aria, Opera’s browser AI, as well as Mods. Mods are modifications of the browser that can change visual themes and provide dynamic music and keyboard sounds, as well as shaders for websites, or animated, live wallpapers that can be created with GameMaker. Since the launch of Mods at the end of March 2023, users have downloaded over 100 million mods from the GX Games portal.
Our PC browser user base has historically been prominent in regions that value our innovations in browser technology and more recently in regions where gaming is particularly popular, such as Europe and the Americas. In February 2025 we continued to explore high-end user segments by launching Opera Air, the first browser built around the concept of mindfulness.
Our Mobile Browsers: Opera Browser for Android, Opera Browser for iOS, Opera GX Mobile and Opera Mini
Our mobile browser products currently include Opera Browser for Android and iOS, Opera GX Mobile and Opera Mini. Our mobile browser products are fast and optimized for mobile browsing. All mobile browsers tailored for high-ARPU markets come with our Aria browser AI, integrated VPN and native ad blockers, which provide users with the option to further increase privacy and browser speed by blocking ads that are often slow and intrusive.
Opera Browser for Android
Launched in 2013, the Opera Browser for Android is our flagship Android smartphone browser. It comes with a full browser engine, based on the Chromium project, and a user-friendly interface designed to give users a fast browsing experience on high-end smartphones. Opera for Android is a powerful and feature-rich browser, optimized for mobile phones with larger screens and tablets. In December 2018, Opera for Android became the first browser to feature an integrated crypto wallet, making it easy to use Ethereum-based cryptocurrencies and blockchain powered web applications. The browser also enables users to block annoying cookie dialogs, and in March 2019, the browser became the first major mobile browser to ship with an integrated VPN solution that was later expanded into a paid device-wide VPN. In July 2023, we brought our Aria browser AI to Opera Browser for Android.
During 2024, we made our Aria browser AI more accessible with one-click accountless onboarding, as well as introducing a range of features, including voice input/output, page summaries, image generation and understanding, and providing sources for verification and further explorations. We improved our built in ad blocker, including native support for popular lists such as uBlock Origin and AdGuard. To simplify the transition to Opera we added support for password and bookmark imports from Chrome. We have introduced numerous improvements on the start page and the built in AI powered news section, including AI podcasts in the U.S. market. Other improvements include mobile/desktop site improvements, sharing pages through QR code, a customizable bottom bar, added security through correction of mistyped domains, added functions to our advanced download manager, and speed and interoperability optimizations.
Opera Browser for iOS
In 2024, we relaunched Opera on iOS as Opera One. With a facelifted design to align with Opera One on desktop and introducing bottom search navigation and swipe to search we have made it easier to navigate and browse the web with one hand than ever. Additionally, the search experience was improved, introducing predictive search suggestion chips to speed up typing. The startpage has been improved and decluttered with a new minimalist design. Users get a glance at the latest headlines, live scores and product information from the startpage carousel while the news feed has been moved to its own immersive full screen view. Finally, Aria Browser AI is improved with new design, functionality and availability, free for all users with no need to sign in and create an account.
Opera GX Mobile
In May 2021, we announced the launch of Opera GX Mobile – the world’s first mobile browser designed specifically for gamers. Opera GX Mobile users enjoy custom navigation with the Fast Action Button using vibration and haptic feedback. This browser won two Red Dot Awards in the Apps and Mobile UIs category in 2021. Users are also getting the ability to sync mobile and PC experiences through the Flow feature, which enables gamers to share walkthroughs, tutorials and character builds between devices, and getting instant access to GX corner – a unique space on GX Mobile’s home screen featuring the latest gaming news, deals and a game release calendar. Opera GX Mobile also distinguishes itself with a unique gaming-inspired design supporting different color themes.
Opera Mini
First launched in 2006, Opera Mini is a mobile browser that provides a faster browser experience on Android smartphones and feature phones. Through the application of advanced data compression and efficiency technologies, Opera Mini has enabled hundreds of millions of users around the world to access the internet through their mobile devices, providing a reliable browsing experience regardless of their network conditions and compatible with limited hardware specifications. Opera Mini is a cloud-based browser that is fast to install and takes up very little space on users’ mobile phones. When browsing with Opera Mini, the data traffic can go through Opera servers, which compress web pages, including text and images, to as little as 10% of their original size, reducing the amount of data that needs to be sent over mobile networks that may be congested. Moreover, the reduced data traffic consumption can provide users with a significantly lower data cost compared to the pre-loaded browsers found on their phones. Opera Mini’s free data campaign – where users on selected networks receive 50 MB of free data to browse with Opera Mini every single day – was extended from Nigeria, South Africa and Ethiopia to also become available in Ghana and Tanzania.
In 2024, we launched PIN-protected browsing, empowering users to lock browsing tabs and downloads behind passcodes - a direct response to privacy needs in shared-device scenarios. We also adopted a simplified search interface, eliminating manual URL entry for faster access to frequent sites, and rolled out an upgraded start page featuring deeper MiniPay integrations and a quick access widget for instant tool navigation. Alongside streamlined design updates, we introduced Streaks Rewards, which offers incentives for daily browser users.
In 2023, we launched MiniPay, a new stablecoin wallet built on the Celo blockchain, initially integrated into Opera Mini and later launched as a separate native Android application. Opera Mini averaged 113 million users worldwide during the fourth quarter of 2024, with over 79 million MAU in its Android version alone. In addition, Opera Mini is one of the most widely used mobile browsers in emerging markets in 2024 according to Statcounter.
Our browser AI Initiative: Aria
In 2023, we launched our own native browser AI, Aria – a bold new step in our adoption of AI services. Aria brings users access to a high quality generative AI service free of charge. A web and browser expert, Aria lets users collaborate with AI while looking for information on the web, generating text or code, or getting product queries answered.
Based on our own “Composer” infrastructure, Aria connects to multiple LLM models including, for example, OpenAI’s GPT, Google's Gemini or self-hosted open source models like LLAMA. Our Composer engine architecture is fully modular and allows access to multiple external data sources like weather as well as webpages on the Internet, and also integrates functionality like image generation and understanding as well as voice generation and understanding. We have also enabled our users to download and use their preferred on-device LLM within Aria. Users can select from approximately 2,000 local LLM variants from more than 60 families of models. This solution is based on open source projects Ollama and llama-cpp and is enabling users to use AI locally with hardware acceleration where suitable.
Opera Gaming
Building on the success of Opera GX, Opera has developed a community of gamers and game creators. This included creating the Opera Gaming division that provides GameMaker, a 2D gaming development platform. The focus of Opera Gaming is to continue to grow the user base of Opera GX and build increased functionality within and outside the Opera GX browser, using GameMaker.
GameMaker provides game creators with a complete set of tools to create games for any platform. In the third quarter of 2021, Opera made it free for creators to develop games with GameMaker and publish those games to GX Games. Numerous product updates brought to GameMaker shaders, graphics filters, audio filters, commitments around long-term version support and initial multiplayer support. In November 2021, we launched GX Games, a portal connecting our Opera GX browser users with the games created by developers using our GameMaker development platform. Developers can publish their games to GX Games directly from GameMaker with a single click. GX Games gives users instant access to over 10,000 games directly from Opera GX. Over 10 million users have created accounts with GX Games. By bringing Opera GX and GameMaker together, the GX Games portal seeks to make creating, sharing and playing games as quick and easy as posting on social media.
Opera News
Leveraging our user base and innovation capability, we launched the Opera News service in January 2017. Opera News is our personalized news discovery and aggregation service. The service is featured prominently as part of our browsers, and also made available as a standalone app and website. These apps operate under both the Opera News and Apex brands. By providing AI-powered news and content recommendations, we have increased both user activity and the amount of time users spend in our ecosystem.
Opera News curates and intelligently recommends news, articles, videos and other online content that may be of interest to each individual user. Users can conveniently access this content through real-time intelligent ranking, top news and push notification features. Moreover, Opera News utilizes natural language processing and other technologies to quickly process linguistic differences and nuances to assess and recommend online content across different languages and cultures. When using an Opera product powered by our recommendation engine, people can efficiently discover, engage with and share online content that appeals to them.
We continue to improve Opera News, adding new features and functions for our users as well as improving the attractiveness of the platform for content creators and publishers. In September 2019, we launched Opera News Hub in Nigeria and then expanded to additional markets such as Kenya and South Africa. The Opera News Hub platform enables content creators to self-publish and monetize their content through our Opera News channels, which has enabled us to increasingly attract local content. In 2024, Opera News was ranked as one of top online news platforms in Kenya by the Reuters Institute for the Study of Journalism.
As a content platform, Opera News strives to add bespoke content to our audiences. In 2021, we launched a local news service which helps users to find information in their neighborhood. In 2024, we implemented hyper local information services such as nearby crime information, load shedding notice during the energy crisis in Africa, and earthquake/extreme weather notification.
Building upon the success of Opera News, we rolled out Apex Football (formerly known as Opera Football) in 2021. This website and related app use the Opera News platform, with a filter in place to highlight news about a specific vertical, in this case football (soccer). In addition to the filter, Apex Football integrated football news with historical matches/teams/players statistics and a live score stream to serve football fans with not only all-in-one football info portal but also real time match and score notifications. Plus, Apex Football is given a design aesthetic that gives the apps and website a unique look. In 2022, we introduced additional sports verticals including cricket, basketball and general sporting news. Furthermore, in 2022 and 2023, Opera embedded a live score feature into our Android browsers and Opera News app allowing users to subscribe and follow their favorite matches and teams from the browser or Opera News app start page. In 2024, Opera News also covered Olympics events for our sports audience during Paris 2024, including services such as an events schedule for all sports, an Olympic medal table and real-time result and gold medal notifications.
Our Opera News content platform reached an average audience of approximately 368 million per month in the fourth quarter of 2024 through Opera browsers, our dedicated Opera News apps, websites, and partner integrations. In light of the strong adoption of Opera News in emerging markets, we subsequently entered into additional markets in North America and Europe, and we have seen increased revenue contribution from these markets since then. Generally speaking, users in these markets monetize at a significantly higher rate than those in the initial Opera News markets in emerging markets.
Opera Ads
Opera Ads is our in-house advertising platform optimized for serving our owned and operated inventory targeting digital agencies, direct advertisers and brands to connect and engage directly with Opera users through both programmatic and fully managed advertising campaigns. The Opera Ads offering is an important part of our monetization strategy and it builds on top of our existing search monetization partnerships with third-party companies, such as Google, and partnerships with other monetization partners, such as Amazon. The Opera Ads platform was extended in 2021 with our audience extension service, which connects with partner inventories via real-time bidding, offering our advertising partners an audience extension and incremental reach for their campaigns. As a browser company, we can leverage the closed-loop environment of the browser to capture interest, context and intent. While remaining mindful of user privacy, we are able to create value and utility for the user throughout their online journey, unlike many advertising platforms which rely on third party signals and cookies. With the growth of high value users and the scale of our audience extension offering, we are becoming an increasingly relevant partner to even more potential advertisers.
Our Web3 and E-Commerce Initiatives
Our Web3 Initiatives
In 2018, Opera became the first browser to introduce a non-custodial crypto wallet inside our browsers, enabling access to a new generation of blockchain-based Web3 applications. This allows users to interact with these applications, send or receive various kinds of cryptocurrencies to sites and users, as well as identify themselves to sites and hold unique digital items from blockchain-based games. As of December 31, 2023, Opera supports the most relevant blockchains including Bitcoin, Ethereum, Polygon and Solana. In addition, we re-built our non-custodial Web3 wallet into a standalone SDK, which is embedded into Opera browser applications. In September 2023, we launched MiniPay, a new stablecoin wallet built on the Celo blockchain, initially integrated into Opera Mini and now available as a standalone Android application. MiniPay had more than 4 million activations by the end of 2024.
Our E-Commerce Initiatives
We launched a browser-based cashback offering that provides financial rewards to Opera users for certain online transactions. The Opera cashback rewards program aims to provide Opera’s users with an integrated, seamless, non-intrusive cashback experience inside their browser. The cashback service was initially offered in Spain and then rolled out to Polish users in October 2021. In 2022 and 2023, we continued rolling out Opera cashback services in additional markets including Germany, the United Kingdom, the United States, Mexico and Brazil. Opera cashback features hundreds of shops including brands such as AliExpress, Temu, and Shein. In late 2023, however, we started to scale back certain of our owned and operated cashback initiatives and began to promote third-party tools as a more efficient solution. The use of such third-party tools began in the United States in late 2023 and is expected to expand to additional markets in 2025.
Our Partners
We partner with companies that benefit from our ability to drive traffic to their services, including search engines, e-commerce and travel providers and digital advertising platforms. Through placement of shortcuts, or “Speed Dials”, and advertisements in our browsers and apps, we have the ability to promote both global and local partners that provide services to our users. These companies pay us either for referring traffic to them or for displaying their advertisements.
Search Providers
We partner with internet search providers such as Google and Yandex and have worked closely with them for over 20 and 15 years, respectively. These partnerships ensure a native integration of search technology for our users and enhance the visibility of our brand. We share the revenue generated by our search partners when our users conduct searches initiated within the URL bar, default search page or search boxes embedded in our PC and mobile browsers. In 2023, we also started to introduce search entry points into our Aria browser AI experience.
We have had a search distribution agreement with Google since 2001. We entered into our current search distribution agreement with Google in 2012 and have extended the term of that agreement multiple times, most recently until December 31, 2026. We have had a search distribution agreement with Yandex since 2007. Effective from January 1, 2025, we renewed our relationship with Yandex with a new three-year agreement with Yandex in UAE. Our agreements with Google and Yandex are subject to customary events of default, including failure to make payments, material breach, liquidation, as well as other termination trigger events as provided therein.
Our relationship and cooperation with our search providers may be impacted by any material investigations and restructurings relating to these search providers. See “Item 3. Key Information—D. Risk Factors—Risks Related to Our Suppliers and Partners—We rely on our users’ web searches within Opera browsers for a substantial portion of our revenues” of this annual report.
E-commerce and Online Travel Agencies
We work closely with large, global e-commerce and online travel agencies, such as Amazon, eBay, AliExpress, Temu and Booking.com, as well as strong local brands like Otto, Shopee, Lazada and others. The value of these partnerships continues to rise through increased user engagement with these popular services within our browsers, as well as our audience extension offering.
We earn revenue from transactions initiated by our directed users via links provided on our Speed Dial homepage and other advertisements, typically in the form of a defined share of the revenue generated by these service providers.
Digital Advertising Platforms
We have established relationships with leading digital advertising platforms such as Google AdSense, AdMob by Google, Pangle by ByteDance, Meta Audience Network, and others. We allow these digital advertising platforms to display their advertising demand in our browsers, content apps and websites where we recognize revenue based on the amounts we are entitled to receive from such advertising partners. We also sell selected premium advertising placements, such as roadblock banners, interstitials, videos, sponsored articles and notifications to global and local advertisers.
Our Opera Ads platform has a large and continuous focus on audience extension and is able to seamlessly integrate with both Opera’s owned and operated inventory and selected premium partner inventories supplied by companies such as Google, AppLovin, Adtechnacity, Vungle and others. The Opera advertising platform caters to the world's largest advertisers, brands, platforms, agencies, and e-commerce partners across the Americas, Asia, Europe, Africa, and the Middle East. A majority of our customers are operating within gaming, sports, and e-commerce verticals.
Content Providers
In addition to monetization partners, we have formed strong relationships with high profile media companies, while also focusing on regional and local content providers in key markets in Africa, Europe and the United States. These relationships enable us to obtain comprehensive news and other content that we can make available to users on our platform, provide more publicity for our content provider partners and generate revenues through the placement of advertising within our news service. Further, we are focused on the creation of exclusive local content through Opera News Hub. We also analyze users’ behavior to improve the relevance of the news stories and advertisements that we show to each user based on their preferences.
Marketing and Distribution
We partner with ad agencies, influencers, game affiliation networks, device manufacturers, mobile network operators and others to promote and distribute our products. We have long-term relationships with device manufacturers to ensure cost-efficient and reliable distribution benefiting both these distribution partners and us. We partner with mobile network operators in Africa for joint marketing campaigns. These campaigns promote the data saving features of our mobile browsers on our operator partner’s network, while providing free or reduced cost browsing to the consumer for a limited time. In addition, we partner with game affiliation networks to promote Opera GX.
Foundational Models
Aria, Opera’s browser integrated AI chatbot, is built on top of Opera’s own AI engine which relies on LLMs supplied by third parties such as OpenAI, Meta, and Google. It is built in a LLM agnostic way that allows any models to be added and used separately or in addition to existing models, including open source models.
Technology
Technology is key to our success as it enables us to innovate, improve our users’ experience and operate our business more efficiently. Our technology team is composed of highly skilled engineers, computer scientists and technicians whose expertise spans a wide range of areas. As of December 31, 2024, we employed a team of approximately 435 engineering and data analytics personnel. These staff members engage in building our technology platforms and developing new Opera products and services, with our core browser and AI assisted browsing development located mainly in Poland and Sweden, and our other products developed mainly in Poland, China, Sweden and the United Kingdom.
AI Assisted Browsing
We have a track record of pioneering functionalities that then become the new standard in the browsing world. In 2023, Opera redesigned its flagship browser to make it AI centric. Our key technologies for AI assisted browsing include the following features:
• Aria. Our browser AI allows users to access generative AI via a chat interface directly from the browser’s sidebar or via the browser overlay. Users then can collaborate with AI while looking for information on the web, generating text or code or getting their questions answered. Aria is multimodal and based on our own AI engine: Composer. When it comes to customer support, Aria is knowledgeable about our database of support documentation and can use Opera’s current product knowledge to answer users' questions.
• Composer. Our own AI engine, Composer, is powering Aria and Opera’s upcoming Browser Operator. It is LLM agnostic - meaning it uses multiple LLM models, including OpenAI’s GPT and Google’s Gemini, or self-hosted open source models like LLAMA. The Composer engine architecture is fully modular and is easily expandable, which allows access to multiple external data sources like weather as well as webpages on the Internet, and also allows Composer to integrate functionality like image generation and understanding as well as voice generation and understanding. Composer can access, understand and generate numerous file formats including .xls, .ods, .pdf, .doc, mp3, mp4 and others.
• Local LLMs. We have enabled our users to download and run their preferred on-device LLM within Aria. Users can select from approximately 2,000 local LLM variants from more than 60 families of models. This solution is based on open source projects Ollama and llama-cpp and is enabling users to use AI locally with hardware acceleration where suitable.
• Browser Operator. Demoed at Mobile World Congress in March 2025, Browser Operator is an active R&D project that is intended to be made available to our users in 2025. Browser Operator is an AI agent that allows a browser user to explain what they need to achieve in natural language, and the Browser Operator sets out to perform the necessary tasks. While working, Browser Operator lets the user monitor its decisions and steps. During this process, the user remains in full control and can take over or cancel the task at any given moment. Browser Operator works in the same environment as the user: the browser itself, and does not require a virtual machine or a server in the cloud. Unlike approaches to agentic browsing that are currently being tested by other companies, Opera’s solution utilizes native, client-side solutions. This protects user privacy by not relying on screenshots or video capture of the browsing session.
Content Recommendation
Our content discovery and recommendation platform provides our users with personalized news, audio, videos and other online content. We leverage our existing user base and cutting-edge technologies, such as LLMs and AIGC, to develop our AI-powered content discovery and multi-scenario/multi-modal/multi-objective recommendation platform that we integrate into a variety of our products and services. Our content recommendation platform evaluates a large volume of potentially correlated data points between each item of online content and each individual user to provide personalized content recommendations of high interest to our users in real time.
Our key AI technologies for content implement the following powerful features:
• Natural Language Processing. Classical models in natural language processing, or NLP, and deep learning models are used to analyze, sort, extract, classify, process and better understand content in a variety of languages. Our deep learning models help us to extract key entities, topics and other semantics tags. We can also find connections between top news, celebrities and other news elements, extract timeline and history of important events automatically. With the advance of generative AI, LLMs are also used in our system, from content understanding, topic summarization to content moderation and filtering and result in improved processing capacity and lowered cost.
• Computer Vision for Images and Videos. We analyze the images and videos that are associated with online text to better understand the content and optimize our recommendation engines. Apart from classical Computer Vision models, multi-modal LLMs are also introduced into our AI system: Vision Transformer (ViT) models and Language-Image Pre-Training (CLIP) are used in image understanding and in image-text matching, bringing in improved accuracy.
• Multi-objective/Multi-scenario/Multi-modal/ Personalized Recommendation System. On the basis of the personalized click prediction model (a large-scale deep neural network), we have developed a personalized multi-objective prediction model, which not only predict the click probability of a user to a certain news article, but also predict the reading time and whether the user will like/share the news or subscribe to the author, thereby better reflecting the user's satisfaction with the recommended content. This is a multi-objective neural network model with tens of billions of features, trained in real time based on user interactions. Multi-scenario modeling is used to provide personalized contextual recommendation under different use cases by associating user behavior with contextual information. Multi-modal modeling leverages content in
different forms, such as texts, images, videos, etc., to build the correlations and complementarities between different modality data, to enrich reading experience with contents in multimedia.
• Deep Reinforcement Learning Recommendation. By applying the improved version of Deep Deterministic Policy Gradient (DDPG), the machine learning algorithm not only optimizes the reward of the current recommended content, but also optimizes the total reward of a series of user interactions in a session. Such objective function leads to deeper reading interactions and also represents an increase in reading satisfaction.
• Big Data Capabilities. We are able to quickly develop and scale our presence across different geographies, languages and cultures, utilizing our big data capabilities. We have multiple data centers distributed across four continents that support massive petabyte-level distributed data storage and allow us to process in real-time hundreds of terabytes of data related to our users every day. We use data mining and analytics technologies to find patterns in the large amounts of data we collect, which helps us to understand our users and provide them with better content recommendations.
Cloud Compression Technologies
Our compression technologies, Turbo and Opera Binary Markup Language (OBML), are advanced compression technologies that are built into our apps to optimize data traffic and connection times for our users. These technologies allow our browsers to load web pages faster by downloading less data. Today, Turbo is our standard compression mode for high-end smartphones and computers, while OBML, adapted exclusively for Opera Mini, provides an extreme compression mode, which compresses web content by up to 90%, providing a good web browsing experience even on the most limited mobile data networks.
Network Infrastructure
We have built a reliable and secure network infrastructure that fully supports our operations. Our physical network infrastructure utilizes our data centers that are linked with high-speed networking. We have developed our architecture to work effectively in a dynamic cloud environment that has a high degree of elasticity. Our automatic provisioning tools have enabled us to scale up our storage and computing capacity in a short period of time in response to increasing demand for our services. Our proprietary network application protocols ensure fast and reliable mobile communications under different network conditions in the various markets where we operate. We aim to provide a consistent user experience across different devices, operating systems, carriers and network environments.
As of December 31, 2024, we owned 6,077 servers in seven data centers located in the Netherlands (two locations), the United States, Canada, Nigeria, Iceland and Singapore, with a total connectivity bandwidth of approximately 1.4 Tbps max throughput and 240 Gbps daily peak. The data center in Iceland features an NVIDIA DGX SuperPOD containing 248 H100 GPUs capable of delivering approximately 1 exaflops of FP8 AI performance, which will serve as the basis for our expanding AI services.
Our Investments in Unconsolidated Entities
We hold minority investments in the following entities:
OPay Limited, or OPay, an investee in which we currently hold a 9.4% ownership interest, is a mobile payment fintech company focused on emerging markets, with Nigeria and Egypt as initial key markets. OPay provides online and offline payments, and digital wallet services leveraging AI, big data and other fintech innovations, thus helping countries in emerging markets advance their trajectory of digital payments and other financial services.
Verda Ventures, LLC operates a venture fund formed with the purpose of making investments in MiniPay ecosystem companies and projects. MiniPay is our stablecoin-based, self-custodial wallet built on the Celo blockchain. We invested $1.25 million in this venture fund in the fourth quarter of 2024, and we have committed to make additional quarterly investments of $1.25 million until the third quarter of 2026, which together with the investment made in 2024 will total $10 million. Our primary objective with the investment is to contribute to the expanding ecosystem around MiniPay together with other investors.
nHorizon Innovation (Beijing) Software Ltd., or nHorizon Innovation, is an associate in which we have a 29.1% ownership interest. nHorizon Innovation generates income from the licensing of intellectual property, predominantly from nHorizon Infinite (Beijing) Software Limited, or nHorizon Infinite, which was our joint venture until mid-2023. nHorizon Infinite is focused on supporting Chinese app developers to monetize their apps internationally through advertising.
User Privacy and Safety
The vitality and integrity of our user base is the cornerstone of our business. We dedicate significant resources to the goal of strengthening our user base through developing and implementing programs designed to protect user privacy, promote a safe environment, and ensure the security of user data. We also implement unique features in our products and services to protect users’
online digital presence, such as a free, no-log VPN service, a premium, paid VPN service for enhanced protection, native ad blocking and anti-tracking options.
Our privacy statements seek to describe our data use practices and how privacy works on our platforms in a user-friendly manner. We provide users with adequate notice as to what data is being collected and undertake to manage and use the data collected in accordance with applicable laws. We consider the protection of the personal privacy of each of our users to be of paramount importance.
We continuously strive to prevent unauthorized use, loss or leak of user data. In addition, we use a variety of technical and organizational measures to protect the data with which we are entrusted, including encryption of personal data at rest and in transit, and, for our external interfaces, we also utilize network segmentation and web application firewalls to protect against potential attacks or unauthorized access. We have privacy and security teams dedicated to the ongoing review and monitoring of data protection practices, including penetration testing, auditing, and carrying out data privacy impact assessments.
Product Marketing and Distribution
For the majority of our products and services, the main source of new users is brand awareness of our products and the “word-of-mouth” from our large user base. The trust and reliance that our users place in us is a key growth driver of our business, since prospective users that hear positive feedback from their friends and colleagues about our products and services are more likely to try them. We have run influencer marketing campaigns to raise awareness and gain trust and mind-share among key target demographics. We also run promotional campaigns around global events, such as sporting events, to further engage users and drive adoption.
In 2024, organic installs were our most important channel for new user acquisition, representing approximately 81.4% of our new smartphone users. In parallel, we cooperate with industry partners to promote our products. In 2024, approximately 7.7% of new smartphone users originated from our paid online promotions.
Our products are available through our official website, www.opera.com, as well as Google Play, Apple’s App Store, and other online distribution channels.
Competition
We face intense competition in all of the products and services we offer. In the browser space, we generally compete with other global browser developers, including companies such as Google (Chrome), Apple (Safari), Microsoft (Edge) and Samsung (Samsung Internet), which have distributional or other advantages on their respective hardware or software platforms. We also compete with independent browser companies such as Mozilla (Firefox), Brave, Avast, Yandex, DuckDuckGo and UCWeb (UC Browser) as well for those users who want to choose an alternative browser for their devices. In the advertising space, we compete with other global internet companies which operate advertising platforms and audience extension products, such as those offered by Meta, ByteDance and Alphabet for both inventory and advertisers. In the content space, we have faced significant competition from other internet companies promoting their own content products and services globally, including Alphabet, Apple and Meta, as well as competition from other news aggregation services and from traditional media such as local and global newspapers and magazines.
In addition, we compete with all major internet companies for user attention and advertising spend. Moreover, in emerging markets, where certain mobile devices lack large storage capabilities, we may compete with other applications for the limited space available on users’ mobile devices. As we introduce new products, as our existing products evolve, or as other companies introduce new products and services, we may become subject to additional competition. For example, we launched an initial set of generative AI tools in our PC flagship browser in March 2023, gradually expanding to other mobile and PC browsers, and deploying additional tools, such as our Aria browser AI, during 2023, and adding support for additional AI models including Gemini and on-device local AI models in 2024. We also launched MiniPay, a new stablecoin wallet built on the Celo blockchain, in September 2023 as well as Opera Air, the first browser built around the concept of mindfulness, in February 2025. While we view our new products as extensions of Opera’s existing product portfolio, adding new products and services subjects us to new competitors and enhanced competition from our current competitors.
See “Item 3. Key Information—D. Risk Factors—Risks Related to Our Business and Industry—We face intense competition in a number of spaces and industries and if we do not continue to innovate and provide products and services that meet the needs of our users, we may not remain competitive.”
Seasonality
See “Item 3. Key Information—D. Risk Factors—Risks Related to Our Business and Industry—Our results of operations are subject to seasonality and other fluctuations due to a number of factors.”
Intellectual Property
We regard our patents, copyrights, service marks, trademarks, trade secrets and other intellectual properties as critical to our success. We rely on patents, trademarks, copyrights and trade secret protection, as well as non-competition, confidentiality, and license agreements with our employees, customers, partners and others to protect our intellectual property rights. Despite our precautions, it may be possible for third parties to obtain and use our intellectual properties without authorization. Furthermore, the validity, enforceability and scope of protection of intellectual property rights in internet-related industries are uncertain and still evolving.
As of December 31, 2024, we had over 380 active registrations or pending applications for the OPERA, Opera with Red O (both old and new versions) and OPERA SOFTWARE trademarks in over 90 countries, and for our red “O” logo in over 80 countries. We have also registered the OPERA GX word mark, Opera GX “O” logo, and a GAMEMAKER trademark in other key jurisdictions. Opera has a patent portfolio that includes more than 20 patents issued in the United States as well as certain international patent registrations. In addition, as of December 31, 2024, we had hundreds of registered domain names related to our businesses.
Regulations
Norwegian Regulations on Intellectual Property Rights
Norway adheres to key international agreements for the protection of intellectual property rights, hereunder the Paris Convention for the Protection of Industrial Property, Berne Convention, Universal Copyright Convention of 1952, the Rome Convention and the TRIPS agreement.
The main acts governing intellectual property rights in Norway are the Patents Act of December 15, 1967, Designs Act of March 14, 2003, Trademarks Act of March 26, 2010, Copyrights Act of June 15, 2018, and Marketing Act of January 9, 2009. The Trade Secrets Act of March 27, 2020, protects trade secrets.
Trademarks, designs and patents must be registered by applying to the Norwegian Industrial Property Office, or the NIPO, in order to be valid in Norway. Patent applications which have been granted at the European Patent Office can be validated in Norway by applying to the NIPO.
Regulations on Data Protection and Information Security
The principal data protection legislation in Norway is the Personal Data Act of June 15, 2018, no. 38. The Personal Data Act implements 2016/679/EU - General Data Protection Regulation, or GDPR, in its entirety. The purpose of the act is to protect natural persons from violation of their right to privacy through the processing of personal data. Broadly speaking, the GDPR applies to the processing of personal data conducted by companies established in the European Economic Area, or EEA, and to the processing of personal data of data subjects in the EEA, where the processing is linked to offering services to such data subjects or monitoring their behavior.
A significant number of the users of our products are in the EEA and we also serve many of our users from our business establishments in Norway and Ireland, and consequently our processing of the personal data of such users is subject to the GDPR. Since the GDPR came into effect in 2018, courts and data protection authorities have enforced its requirements strictly and levied significant fines against various technology companies for violations. Decisions by such authorities, as well as guidance from the European Data Protection Board have repeatedly emphasized that international transfers of personal data should be subject to heightened scrutiny. Furthermore, regulatory decisions and related litigation (such as the so-called IAB Decision) underscore that the internet advertising industry is an area of particular attention for privacy authorities.
The United States is also adopting new regulations related to data protection. For example, in 2024, the Protecting Americans’ Data from Foreign Adversaries Act of 2024 (PADFAA) was enacted in the United States. PADFAA prohibits “data brokers” from disclosing certain categories of personal data, defined as “personally identifiable sensitive data,” to foreign adversaries. The act targets entities that profit from selling or providing access to U.S. individual data that they did not directly collect, while excluding businesses that provide products or services where sensitive data is not the main offering. The PADFAA legislation could introduce uncertainties for parts of our advertisement business, particularly regarding data-sharing dynamics with U.S. based partners. For example, restrictions on third-party identifiers like cookies could disrupt traditional targeting methods.
In recent years many additional jurisdictions, including Brazil, Kenya, Nigeria, India, and China, have enacted or updated data privacy or data localization laws. Similarly, several states of the U.S. have passed or are debating their own privacy laws. The precise requirements of each law vary widely, though we see some general trends towards more regulatory oversight, especially of data-driven businesses like ours, and increased focus on service and data localization. We anticipate continued developments in data protection, privacy and data localization rules in various countries, which will continue to affect our business and impact our products and services. See “Item 3. Key Information—D. Risk Factors—Risks Related to Our Technology and Intellectual Property—Because we
store, process and use data, some of which contains personal information, we are subject to complex and evolving laws and regulations across multiple jurisdictions regarding privacy, data protection and other matters” of this annual report.
Regulations on Artificial Intelligence and Digital Services
New laws, regulations, policies, and international accords relating to artificial intelligence and digital service, are being developed and formalized in Europe and the U.S., which could result in monetary penalties or other regulatory actions. For example, the EU’s recently adopted EU Artificial Intelligence Act includes specific transparency and other requirements for general purpose AI systems and the models on which those systems are based. In addition, the White House's Executive Order on the Safe, Secure, and Trustworthy Development and Use of Artificial Intelligence devises a framework for the U.S. government, among other things, to regulate private sector use and development of certain foundation models.
The EU’s Digital Markets Act (DMA), which entered into force on November 1, 2022, is intended to ensure a higher degree of competition in European digital markets. The DMA prohibits companies designated as “gatekeepers” and providing core platform services from engaging in certain kinds of self-preferencing behaviors, resulting in increased implementation of browser choice screens and other similar effects.
Regulations Relating to Content Recommendation
Our Opera News content discovery and recommendation platform is available in a wide variety of markets worldwide. In recent years, there has been an increased emphasis on the veracity of online news reports, with the increasing social expectation that content platforms and aggregators will take steps to prevent the dissemination of “fake news.” Moreover, a number of countries have adopted regulatory regimes for news aggregation services requiring local registration or licensing, in some cases enabling more effective governmental restrictions on their citizens’ access to certain categories of information. Other countries have adopted legislation expanding publishers’ copyright entitlements on digital platforms including search engines, social media and content recommendation platforms. Various countries, including Australia and Indonesia, for example, have adopted laws which afford publishers of digital media the right to receive payment for use of their content in search results or content recommendations. In 2019, the European Union adopted Directive (EU) 2019/790 on copyright and related rights in the Digital Single Market, which gives press publications more direct control over the re-use of their content and also tasks online content sharing platforms, which host user-generated content, with certain duties related to preventing their users from violating copyright of others. In short, content aggregation is becoming increasingly regulated, and we anticipate that we will be subject to an increasingly diverse and fragmented regulatory environment over time.
Regulations Relating to the Crypto Industry
MiniPay is our stablecoin-based, self-custodial wallet built on the Celo blockchain. On December 30, 2024, European Union Regulation (EU) 2023/1114 on markets in crypto-assets, or MiCA, went into force. While MiCA does not directly apply to MiniPay, the regulation has impacted ecosystem participants. For example, certain crypto exchanges have limited access in the EEA to stablecoin tokens that fall under the MiCA e-money token definitions but do not hold the required e-money token issuance authorization. Additionally, under European Union Regulation (EU) 2023/1113 on information accompanying transfers of funds and certain crypto-assets, MiCA crypto assets service providers are obliged to collect information about the originator of the incoming crypto transactions from non-custodial wallets. In short, the regulatory environment for crypto assets is becoming increasingly diverse and fragmented over time.
European Economic Sanctions
The European Union adopted certain economic sanctions following the 2014 invasion and purported annexation of Crimea in Council Regulation (EU) 833/2014 of 31 July 2014 concerning restrictive measures in view of Russia’s actions destabilizing the situation in Ukraine, or the EU Regulation. Norway, as a member of the EEA, has incorporated the EU Regulation’s economic sanctions into its domestic law in the Norwegian Sanctions Act. Since 2014 and in light of Russia’s continuing aggression in Ukraine, the European Union has amended the EU Regulation with various additional packages of economic sanctions and accordingly additional sanctions have in due course likewise been incorporated into Norwegian domestic law. For example, on December 16, 2022, the European Union adopted an amendment to the EU Regulation prohibiting the provision of “advertising services” to legal persons, entities or bodies established in Russia, and therefore we have subsequently terminated all advertising contracts with customers in Russia among other actions. Likewise, on June 24, 2024, the European Union adopted an amendment to the EU Regulation requiring companies in the EU to use “best efforts” to ensure their respective non-EU subsidiaries also comply with the sanctions. The European Union, as well as other jurisdictions including the United States, have continued to periodically adopt more and additional sanctions throughout 2024 and early 2025.
Regulations on Environment, Social and Governance
In July 2022, the Norwegian Åpenhetsloven (Transparency Act) came into force. To promote respect for basic human rights and decent working conditions, the Transparency Act imposes a duty on Norwegian companies to publish certain information regarding
how they work to ensure basic human rights and decent working conditions, both in their own businesses as well as in their supply chains. In accordance with the Transparency Act, Opera carries out due diligence assessments of the risks associated with Opera’s business of potential violation of basic human rights or decent working conditions by Opera, its suppliers, or its business partners. The results of these due diligence assessments are reported and made public annually on Opera’s website at www.opera.com/legal/environmental-social-and-governance-esg.
On January 5, 2023, the European Union’s Corporate Sustainability Reporting Directive (“CSRD”) entered into force, and on June 11, 2024, the Norwegian Parliament implemented it into Norwegian law. The CSRD requires European companies such as Opera Norway AS to provide comprehensive and granular disclosures covering environmental, social and governance topics, as detailed in the European Sustainability Reporting Standards issued by the European Financial Reporting Advisory Group. On February 26, 2025, however, the European Commission adopted a legislative proposal to reduce the sustainability reporting requirements, including changing the scope of CSRD to apply only to companies with more than 1,000 employees. In the event that the proposal is adopted and implemented into law as proposed, our business may no longer be within the scope of CSRD reporting requirements. As the legislative process is ongoing, however, significant uncertainty remains.
Similarly, on March 6, 2024, the SEC adopted final rules (the “Climate Rules”) that would require disclosure of material climate-related risks, greenhouse gas emissions and climate-related financial metrics not previously required by the SEC. However, on April 4, 2024, the SEC issued an order staying the Climate Rules pending judicial review, with litigation consolidated in the Eighth Circuit Court of Appeals. There is significant uncertainty regarding the timing and outcome of these legal proceedings and the SEC’s approach to the Climate Rules and climate-related disclosures in general under new SEC leadership following a change in presidential administration.
C.Organizational Structure
The chart below summarizes our corporate structure as of the date of this annual report and identifies all our principal subsidiaries and their places of incorporation:
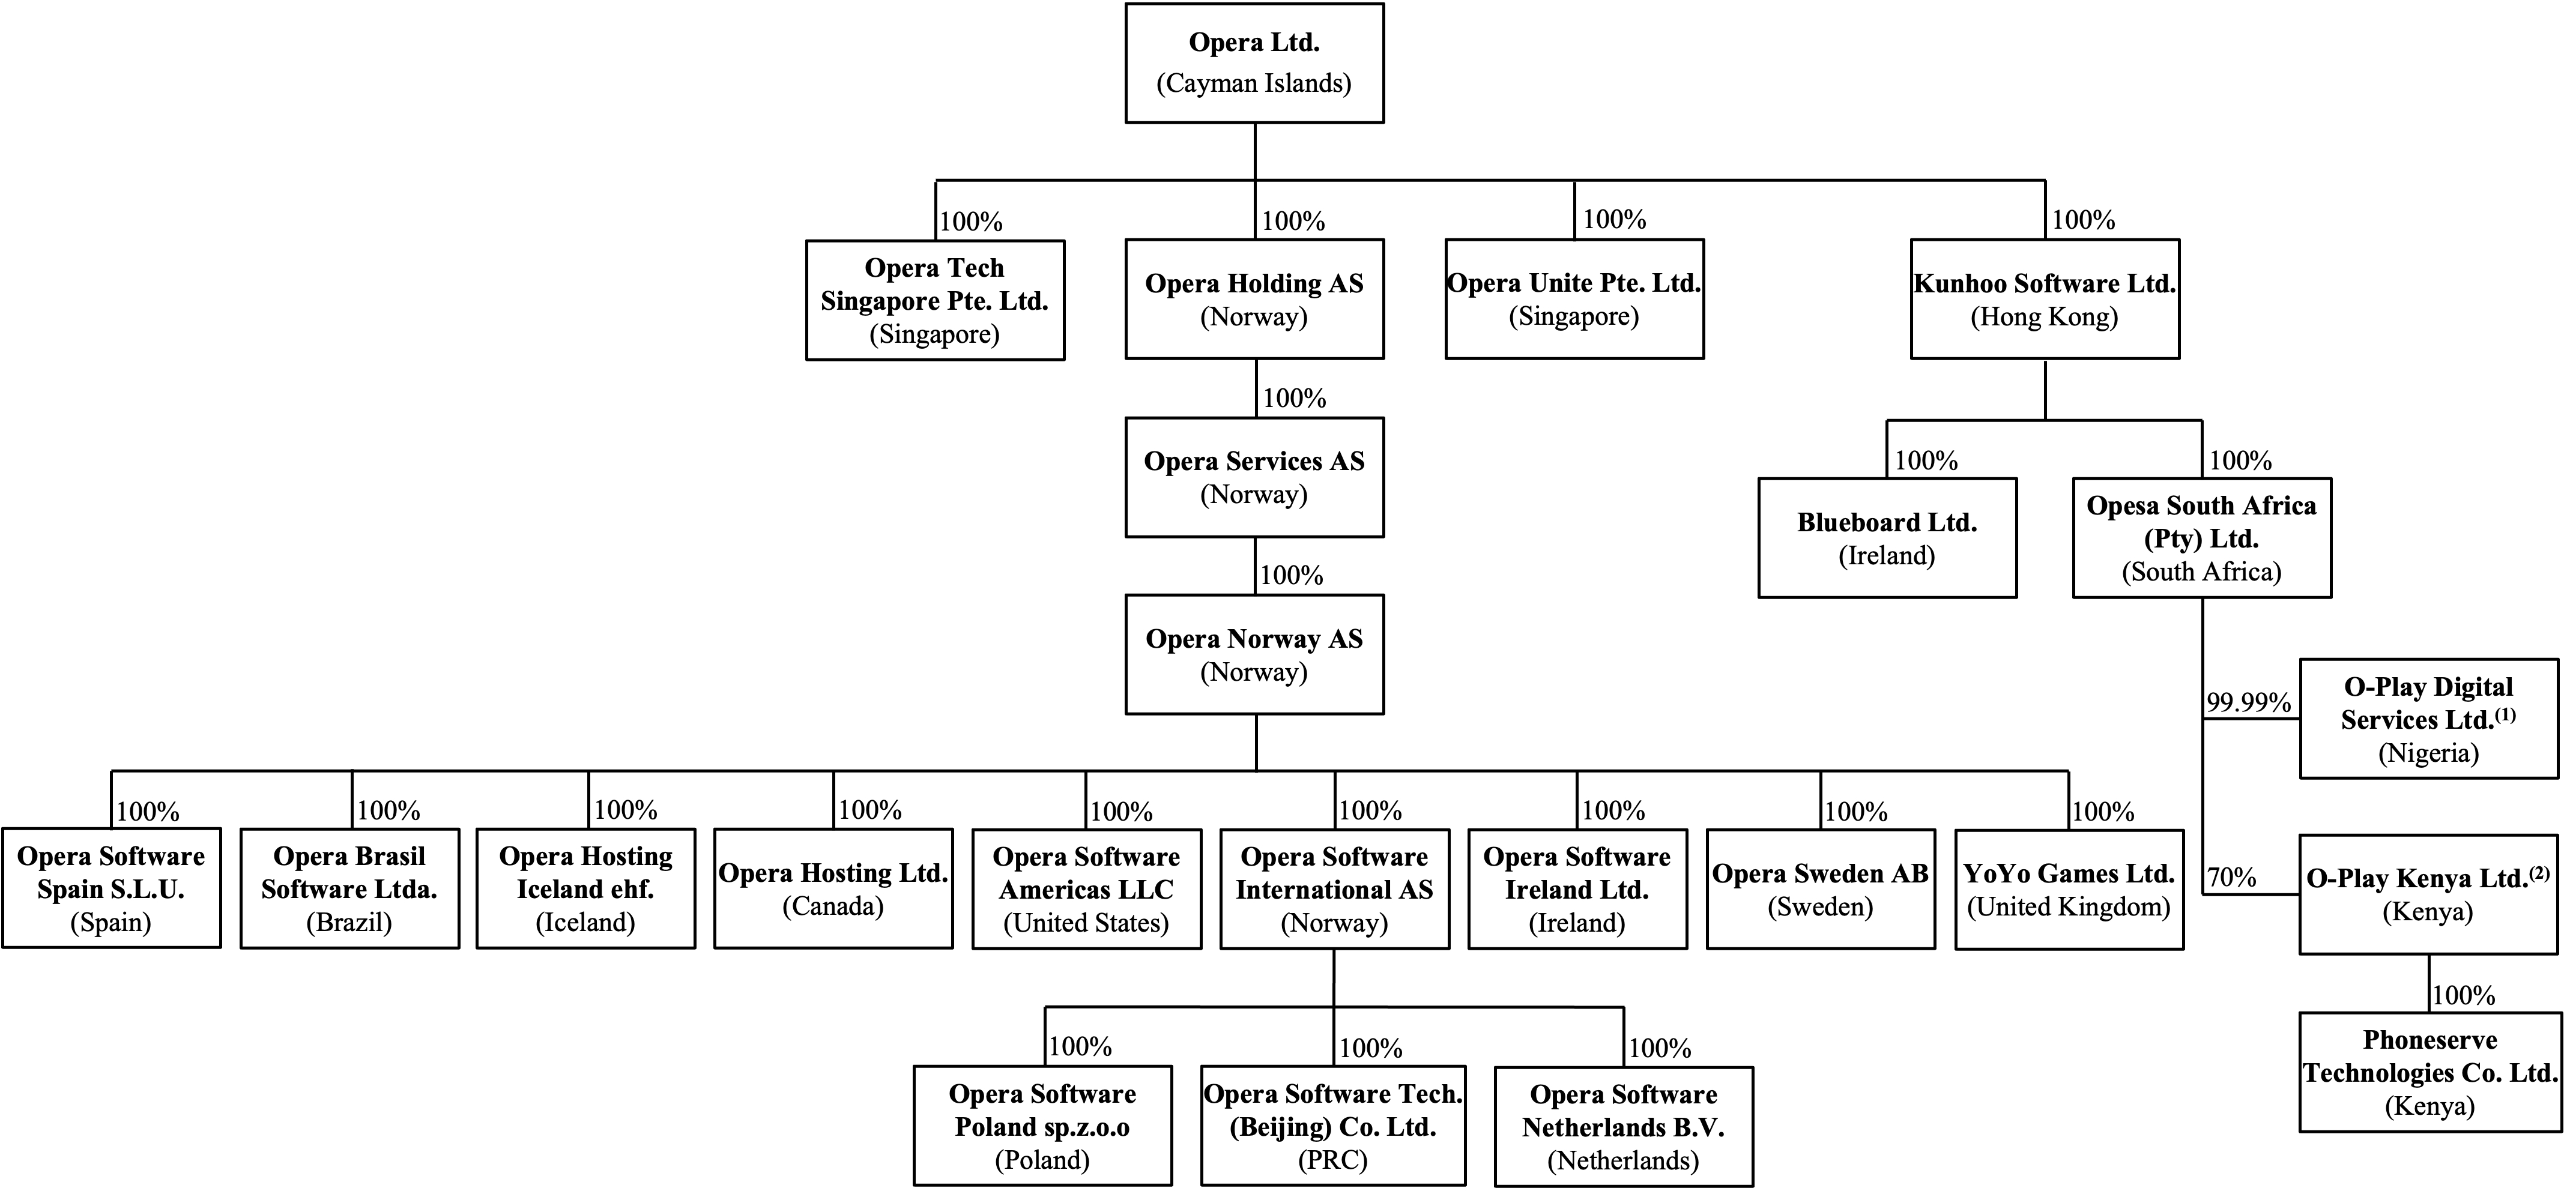
_______________
(1)0.01% is held by another Opera group entity.
(2)30% is held by a nominee shareholder.
D.Property, Plants and Equipment
Our corporate headquarters is located in Oslo, Norway. Our principal technical development facilities are located in Wroclaw, Poland, Dundee, Scotland, Beijing, China and both Linköping and Gothenburg, Sweden. We also have offices in Nigeria, Ireland, France, Germany, Spain, South Africa and Kenya among other countries.
Our servers are hosted in leased data centers in the Netherlands, the United States, Canada, Nigeria, Iceland and Singapore. The data centers in our network are owned and maintained for us by major domestic and international data center providers. We generally enter into leasing and hosting service agreements with renewal terms that range from one to three years.
Item 4A. Unresolved Staff Comments
None.
Item 5. Operating and Financial Review and Prospects
You should read the following discussion and analysis of our results of operations and financial condition in conjunction with our consolidated financial statements and the related notes included elsewhere in this annual report. In addition to our historical consolidated financial information, the following discussion contains forward-looking statements that reflect our plans, estimates, and beliefs. Our actual results could differ materially from those discussed in the forward-looking statements as a result of various factors, including those set forth under “Item 3. Key Information—D. Risk Factors” and elsewhere in this annual report.
In this section, we discuss our results of operations and financial condition for the year ended December 31, 2024 compared to the year ended December 31, 2023. For a discussion of the year ended December 31, 2023 compared to the year ended December 31, 2022, see “Item 5. Operating and Financial Review and Prospects” in our annual report on Form 20-F for the year ended December 31, 2023, which was filed with the SEC on April 24, 2024, and amended on April 30, 2024.
To supplement our consolidated financial statements, which are prepared and presented in accordance with IFRS Accounting Standards, we present adjusted net income, adjusted EBITDA, adjusted diluted earnings per share and free cash flow from operations, which are non-IFRS financial measures. Their definitions, our rationale for presenting them and reconciliations to the most directly comparable measure under IFRS Accounting Standards are provided in the sections below titled “Adjusted Net Income, Adjusted EBITDA and Adjusted Diluted Earnings per Share,” and “Free Cash Flow From Operations.”
Executive Overview
We are a user-centric and innovative software company focused on enabling the best possible internet browsing experience across all devices. Hundreds of millions of people use the Opera browsers for their unique and secure features on their mobile phones and desktop computers. We generate revenue from selling advertising placements and when users of our browsers make searches using the integrated search and address bar. Our chairman and chief executive officer, who has been identified as our chief operating decision maker, reviews operating results at the aggregate level of Opera as a whole, and therefore we have only one operating segment. See “Item 4. Information on the Company—B. Business Overview” for a more detailed description of our business, product and service offerings.
The following table presents our financial highlights (in thousands, except for per share amounts and percentages):
|
|
|
|
|
|
|
|
|
|
|
|
|
|
|
|
|
|
|
|
|
|
|
Year Ended December 31, |
|
|
% Change |
|
|
|
2022 |
|
|
2023 |
|
|
2024 |
|
|
2023 vs. 2022 |
|
|
2024 vs. 2023 |
|
Revenue |
|
$ |
331,037 |
|
|
$ |
396,827 |
|
|
$ |
480,648 |
|
|
|
20 |
% |
|
|
21 |
% |
|
|
|
|
|
|
|
|
|
|
|
|
|
|
|
|
Net income |
|
$ |
15,035 |
|
|
$ |
153,301 |
|
|
$ |
80,771 |
|
|
|
920 |
% |
|
|
(47 |
)% |
Net income margin |
|
|
5 |
% |
|
|
39 |
% |
|
|
17 |
% |
|
|
|
|
|
|
|
|
|
|
|
|
|
|
|
|
|
|
|
|
|
|
Adjusted net income (1) |
|
$ |
12,863 |
|
|
$ |
72,284 |
|
|
$ |
86,093 |
|
|
|
462 |
% |
|
|
19 |
% |
Adjusted net income margin (1) |
|
|
4 |
% |
|
|
18 |
% |
|
|
18 |
% |
|
|
|
|
|
|
|
|
|
|
|
|
|
|
|
|
|
|
|
|
|
|
Adjusted EBITDA (1) |
|
$ |
68,084 |
|
|
$ |
93,719 |
|
|
$ |
115,309 |
|
|
|
38 |
% |
|
|
23 |
% |
Adjusted EBITDA margin (1) |
|
|
21 |
% |
|
|
24 |
% |
|
|
24 |
% |
|
|
|
|
|
|
|
|
|
|
|
|
|
|
|
|
|
|
|
|
|
|
Diluted earnings per share |
|
$ |
0.14 |
|
|
$ |
1.69 |
|
|
$ |
0.90 |
|
|
|
1140 |
% |
|
|
(47 |
)% |
Adjusted diluted earnings per share (1) |
|
$ |
0.12 |
|
|
$ |
0.80 |
|
|
$ |
0.96 |
|
|
|
582 |
% |
|
|
21 |
% |
|
|
|
|
|
|
|
|
|
|
|
|
|
|
|
|
Net cash flow from operating activities |
|
$ |
56,662 |
|
|
$ |
82,761 |
|
|
$ |
104,977 |
|
|
|
46 |
% |
|
|
27 |
% |
As percentage of adjusted EBITDA |
|
|
83 |
% |
|
|
88 |
% |
|
|
91 |
% |
|
|
|
|
|
|
|
|
|
|
|
|
|
|
|
|
|
|
|
|
|
|
Free cash flow from operations (1) |
|
$ |
42,849 |
|
|
$ |
72,451 |
|
|
$ |
70,190 |
|
|
|
69 |
% |
|
|
(3 |
)% |
As percentage of adjusted EBITDA |
|
|
63 |
% |
|
|
77 |
% |
|
|
61 |
% |
|
|
|
|
|
|
_______________
(1)See the sections below titled “Adjusted Net Income, Adjusted EBITDA and Adjusted Diluted Earnings per Share” and “Free Cash Flow From Operations” for explanations and reconciliations of these non-IFRS financial measures.
• Revenue was $480.6 million in 2024, an increase of $83.8 million, or 21%, from 2023. Solid monetization performance of our browsers, along with continuing growth of our Opera Ads platform and our ability to deliver targeted high purchase intent traffic to our advertising partners, resulted in advertising revenue increasing $62.5 million, or 27%, from 2023 to 2024. Search revenue increased $24.1 million, or 15%, over the same period, driven by our ongoing focus on users with potential for the greatest monetization.
• Operating expenses totaled $390.8 million, an increase of $56.1 million, or 17%, from 2023 to 2024, primarily driven by the cost of inventory sold, which increased by $32.8 million, or 38%, to $118.7 million, and marketing and distribution expenses, which increased by $22.0 million, or 20%, to $132.0 million. Personnel expenses, including share-based compensation, totaled $79.7 million in 2024, a decrease of $3.1 million, or 4%, from 2023.
• Net income was $80.8 million in 2024, a decrease of 47% from 2023 which included a fair value gain on our investment in OPay of $84.8 million, compared to $5.0 million in 2024. Adjusted net income, which excludes gains and losses on unconsolidated investments and other items that may not be indicative of our recurring core business operating results, was $86.1 million in 2024, an increase of 19% from 2023.
• Adjusted EBITDA was $115.3 million in 2024, representing a 24% margin, up from $93.7 million and a 24% margin in 2023.
• In 2024, diluted earnings per share was $0.90, whereas adjusted diluted earnings per share was $0.96.
• Net cash flow from operating activities in 2024 was $105.0 million, or 91% of adjusted EBITDA, representing an increase of 27% from 2023 when net cash flow from operating activities was $82.8 million, or 88% of adjusted EBITDA. Free cash flow from operations was $70.2 million, or 61% of adjusted EBITDA, reflecting our investments in technical infrastructure in 2024, including $19.1 million spent on an AI data cluster. In 2023, free cash flow from operations was $72.5 million, or 77% of adjusted EBITDA. At year-end 2024, cash and cash equivalents totaled $126.8 million.
Other Information
• We paid two cash dividends in 2024 under our recurring dividend program, each of $0.40 per share. In December, we announced that our Board of Directors had declared the next semi-annual cash dividend, also of $0.40 per share, which was paid to shareholders of record on January 6, 2025.
• As of December 31, 2024, we had 599 full-time employees, an increase of 1% year-over-year.
User Metrics
We disclose MAU and ARPU metrics to help investors evaluate our growth trends and measure our performance. See “Item 3. Key Information—D. Risk Factors—Risks Related to Our Internal Controls and Reporting—Our user metrics and other operational metrics are subject to inherent challenges in measuring our operations.”
The following table presents our MAU metrics for the periods indicated (in millions):
|
|
|
|
|
|
|
|
|
|
|
|
|
|
|
|
|
|
|
|
|
|
|
|
|
|
|
Three months ended (1) |
|
|
Mar. 31,
2023 |
|
June 30,
2023 |
|
Sept. 30,
2023 |
|
Dec. 31,
2023 |
|
|
Mar. 31,
2024 |
|
June 30,
2024 |
|
Sept. 30,
2024 |
|
Dec. 31,
2024 |
Smartphone average MAUs |
|
|
189.7 |
|
|
190.5 |
|
|
185.8 |
|
|
185.8 |
|
|
177.6 |
|
|
180.2 |
|
|
179.6 |
|
|
178.1 |
PC browser average MAUs |
|
|
76.4 |
|
|
76.2 |
|
|
76.8 |
|
|
79.5 |
|
|
80.4 |
|
|
78.2 |
|
|
78.9 |
|
|
83.9 |
Feature phone average MAUs |
|
|
53.0 |
|
|
48.9 |
|
|
48.6 |
|
|
47.4 |
|
|
45.4 |
|
|
39.9 |
|
|
37.3 |
|
|
33.4 |
Other |
|
|
0.2 |
|
|
0.2 |
|
|
0.1 |
|
|
0.2 |
|
|
0.2 |
|
|
0.2 |
|
|
0.2 |
|
|
0.2 |
Total MAUs |
|
|
319.4 |
|
|
315.9 |
|
|
311.3 |
|
|
312.9 |
|
|
303.6 |
|
|
298.5 |
|
|
296.0 |
|
|
295.5 |
_______________
(1)Average across the three months included in each period, with each month calculated as of its final day using a 30-day lookback window.
Our smartphone average MAUs in the three months ended December 31, 2024, was 178 million. This figure comprises approximately 151 million smartphone browser users, and approximately 27 million users of the Opera News apps. The Opera GX gaming browser had 34 million MAUs across PC and mobile in the fourth quarter of 2024, up 22% from the same quarter in 2023.
Our strategy has been to focus on and expand our marketing and distribution activities in Western markets while reducing our spending in certain emerging markets. From the fourth quarter of 2023 to the same quarter of 2024, this strategy led to a 9.9% increase in our total overall user base in Western markets and an 8.5% decrease in emerging markets. As shown in the chart below, this shift of
focus to Western markets resulted in improved monetization on a per-user basis, demonstrated by our metric of annualized ARPU increasing by 37% from the fourth quarter of 2023 to the same quarter in 2024, driven by the strong growth in advertising and search revenues over the period.

_______________
(1)Total advertising and search revenue in the quarter ended on the date indicated, divided by the quarter’s average MAUs, and multiplied by four to annualize.
Major Factors Affecting Our Results of Operations
Our Ability to Maintain and Expand Our User Base, and Maintain and Enhance User Engagement
Our user base is important for our revenue generation, both in terms of its attractiveness to our advertising and search partners and in terms of its direct impact on our user-generated revenues. We have elected to prioritize our user growth efforts on geographies and segments that are most monetizable. This has led to a directional shift in our user base and revenue mix towards more developed markets, with a decline in total MAUs that has been well offset by the increase in ARPU.
Our ability to continue to effectively maintain and grow our user base in regions and segments with attractive monetization potential will affect the growth of our business and our revenues going forward. We generate revenues from our business partners, including search providers and advertisers, who are drawn to our platform in part because of the size of our user base, our attractive demographics, and our level of user engagement. Our ability to maintain and enhance user engagement depends on, among other things, the effectiveness of our marketing and distribution spend, our ability to continuously offer comprehensive and effective products and services, recommend personalized content through technological innovation and provide a superior content discovery experience.
The continuing evolution of the online world has contributed to the growth of our business and our revenues since inception. While we face increasing competition for user engagement and advertisers, we expect that this evolution will continue to benefit our business and our revenues.
Our Ability to Monetize
We have long and deep relationships with many of our major monetization partners. Changes in the revenue sharing or fee arrangements with our key monetization partners may materially affect our revenues, although we have not seen such material impacts to our revenues over the 2022 to 2024 period. However, for example, a change in the revenue sharing percentage paid by certain of our major partners such as Google, or a change in their payment policies or other contractual arrangements, could impact our revenues, either positively or negatively. For example, the U.S. Department of Justice and a number of state Attorneys General filed a lawsuit alleging that Google violated antitrust laws relating to search and search advertising, and in August 2024, the U.S. District Court for the District of Columbia ruled that Google violated such antitrust laws. A negative outcome for Google could eventually have implications for our ability to thereafter collect search revenues from Google for the United States, although the timeline and
scope of any implications are highly uncertain. Likewise, with respect to certain major advertising partners, changes in the fee rate we receive per click or per sale may affect our revenues. The growth, seasonality and strength of our major advertising partners’ businesses may also materially affect our revenues, positively or negatively.
Further, our revenue generation is affected by our ability to promote and improve our users’ experience with our partners’ services, and our ability to open additional third party advertising inventories. In 2024, we had more than 630 monetization partners and a number of our top suppliers were providers of third party inventory. We intend to maintain and deepen our relationships with current partners and attract more partners to increase and diversify our revenue sources. Our ability to further increase the number of partners primarily depends on whether we can provide integrated marketing services, helping advertisers more precisely reach their targeted users and publishers more effectively monetize their inventories through our Opera Ads platform. We rely on targeting and measurement tools that incorporate data signals from user activity on websites and services that we do not control in order to deliver relevant and effective ads to our users and partners. As a result, our advertising revenue could be adversely affected by reduced marketer spending due to limitations on our ad targeting and measurement tools arising from changes to the regulatory environment and third-party mobile operating systems and browsers.
Our Brand Recognition and Market Leadership
We believe that the strong brand recognition of “Opera” is a key element of our success. Our ability to maintain our massive user base and brand recognition as a leading independent browser and content discovery platform is key to our ability to maintain and enhance relationships with our users, monetization partners, content partners and distribution partners. In addition, the reputation and attractiveness of our platform among internet users also serves as a highly efficient marketing channel for our new products and services.
We Continue to Face an Evolving Regulatory Environment, Which Could Affect Our Business Practices and Financial Results
Changes in social, political, economic, tax, and regulatory conditions or in laws and policies governing a wide range of topics and related legal matters, may cause us to change our business practices. As these global trends continue, our cost of doing business may increase, our ability to pursue certain business models or offer certain products or services may be limited, and we may need to change our business practices to comply with evolving regulatory and legal matters.
Macroeconomic Conditions
The prevailing global economic climate, the indirect effects of the conflicts in Ukraine and the Middle East, and other macroeconomic conditions, including but not limited to slower growth or economic recession, high inflation, changes to fiscal and monetary policy and exchange rate fluctuations have adversely affected and may continue to adversely impact our business. The domestic developments in the United States led to strengthening of the U.S. dollar against other global currencies in 2024. We continuously monitor the direct and indirect impacts of these circumstances on our business and financial results. See “Item 3. Key Information—D. Risk Factors—Risks Related to Our Business and Industry—The impact of worldwide macroeconomic and geopolitical conditions may adversely affect our business, operating results, and financial condition.”
Our Ability to Conduct and Manage Strategic Investments and Acquisitions
We have invested and expect to continue to invest in new businesses, products, services and technologies, and we have also invested in promising companies. Our financial results could be adversely affected by our investments or acquisitions. The investments and acquired assets or businesses may not generate the financial results we expect. They could result in occurrence of significant investments and goodwill impairment charges, amortization expenses for other intangible assets and credit losses on trade and other receivables. We may continue to incur impairment charges in connection with our investments or acquisitions, which could depress our profitability and have a material adverse impact on our financial results. See “Item 3. Key Information—D. Risk Factors—Risks Related to Our Business and Industry—Our investments in new businesses, new products, services and technologies and companies are inherently risky and could disrupt our ongoing businesses.”
Results of Operations
The following table set forth our consolidated Statement of Operations data (in thousands):
|
|
|
|
|
|
|
|
|
|
|
|
|
|
|
Year Ended December 31, |
|
|
|
2022 |
|
|
2023 |
|
|
2024 |
|
Revenue |
|
$ |
331,037 |
|
|
$ |
396,827 |
|
|
$ |
480,648 |
|
Other operating income |
|
|
469 |
|
|
|
666 |
|
|
|
2,367 |
|
Operating expenses: |
|
|
|
|
|
|
|
|
|
Technology and platform fees |
|
|
(4,104 |
) |
|
|
(3,145 |
) |
|
|
(10,010 |
) |
Content cost |
|
|
(3,834 |
) |
|
|
(4,297 |
) |
|
|
(3,891 |
) |
Cost of inventory sold |
|
|
(46,650 |
) |
|
|
(85,808 |
) |
|
|
(118,658 |
) |
Personnel expenses, including share-based compensation |
|
|
(74,588 |
) |
|
|
(82,750 |
) |
|
|
(79,658 |
) |
Marketing and distribution expenses |
|
|
(114,988 |
) |
|
|
(109,947 |
) |
|
|
(131,951 |
) |
Credit loss expense |
|
|
(1,387 |
) |
|
|
(3,967 |
) |
|
|
784 |
|
Depreciation and amortization |
|
|
(13,939 |
) |
|
|
(13,165 |
) |
|
|
(15,582 |
) |
Impairment of non-financial assets |
|
|
(3,194 |
) |
|
|
(681 |
) |
|
|
(113 |
) |
Other operating expenses |
|
|
(27,015 |
) |
|
|
(30,842 |
) |
|
|
(31,674 |
) |
Total operating expenses |
|
|
(289,699 |
) |
|
|
(334,603 |
) |
|
|
(390,753 |
) |
Operating profit |
|
|
41,808 |
|
|
|
62,890 |
|
|
|
92,262 |
|
Share of net loss of equity-accounted investees |
|
|
(6 |
) |
|
|
— |
|
|
|
(2 |
) |
Fair value gain on long-term investments |
|
|
1,500 |
|
|
|
89,838 |
|
|
|
5,000 |
|
Net finance income (expense): |
|
|
|
|
|
|
|
|
|
Finance income |
|
|
21,454 |
|
|
|
8,876 |
|
|
|
3,577 |
|
Finance expense |
|
|
(39,729 |
) |
|
|
(644 |
) |
|
|
(586 |
) |
Foreign exchange gain (loss) |
|
|
(1,157 |
) |
|
|
(963 |
) |
|
|
(1,839 |
) |
Net finance income (expense) |
|
|
(19,432 |
) |
|
|
7,269 |
|
|
|
1,152 |
|
Income before income taxes |
|
|
23,870 |
|
|
|
159,997 |
|
|
|
98,412 |
|
Income tax expense |
|
|
(8,835 |
) |
|
|
(6,697 |
) |
|
|
(17,642 |
) |
Net income attributable to Opera shareholders |
|
$ |
15,035 |
|
|
$ |
153,301 |
|
|
$ |
80,771 |
|
The following table sets forth the components of our consolidated Statement of Operations data as a percentage of revenue (1):
|
|
|
|
|
|
|
|
|
|
|
|
|
|
|
Year Ended December 31, |
|
|
|
2022 |
|
|
2023 |
|
|
2024 |
|
Revenue |
|
|
100 |
% |
|
|
100 |
% |
|
|
100 |
% |
Other operating income |
|
|
— |
|
|
|
— |
|
|
|
— |
|
Operating expenses: |
|
|
|
|
|
|
|
|
|
Technology and platform fees |
|
|
(1 |
) |
|
|
(1 |
) |
|
|
(2 |
) |
Content cost |
|
|
(1 |
) |
|
|
(1 |
) |
|
|
(1 |
) |
Cost of inventory sold |
|
|
(14 |
) |
|
|
(22 |
) |
|
|
(25 |
) |
Personnel expenses, including share-based compensation |
|
|
(23 |
) |
|
|
(21 |
) |
|
|
(17 |
) |
Marketing and distribution expenses |
|
|
(35 |
) |
|
|
(28 |
) |
|
|
(27 |
) |
Credit loss expense |
|
|
— |
|
|
|
(1 |
) |
|
|
— |
|
Depreciation and amortization |
|
|
(4 |
) |
|
|
(3 |
) |
|
|
(3 |
) |
Impairment of non-financial assets |
|
|
(1 |
) |
|
|
— |
|
|
|
— |
|
Other operating expenses |
|
|
(8 |
) |
|
|
(8 |
) |
|
|
(7 |
) |
Total operating expenses |
|
|
(88 |
) |
|
|
(84 |
) |
|
|
(81 |
) |
Operating profit |
|
|
13 |
|
|
|
16 |
|
|
|
19 |
|
Share of net loss of equity-accounted investees |
|
|
— |
|
|
|
— |
|
|
|
— |
|
Fair value gain on long-term investments |
|
|
— |
|
|
|
23 |
|
|
|
1 |
|
Net finance income (expense): |
|
|
|
|
|
|
|
|
|
Finance income |
|
|
6 |
|
|
|
2 |
|
|
|
1 |
|
Finance expense |
|
|
(12 |
) |
|
|
— |
|
|
|
— |
|
Foreign exchange gain (loss) |
|
|
— |
|
|
|
— |
|
|
|
— |
|
Net finance income (expense) |
|
|
(6 |
) |
|
|
2 |
|
|
|
— |
|
Income before income taxes |
|
|
7 |
|
|
|
40 |
|
|
|
20 |
|
Income tax expense |
|
|
(3 |
) |
|
|
(2 |
) |
|
|
(4 |
) |
Net income attributable to Opera shareholders |
|
|
5 |
% |
|
|
39 |
% |
|
|
17 |
% |
_______________
(1)Percentages have been rounded for presentation purposes and may differ from unrounded results.
Revenue
We generate revenue from advertising, search, technology licensing and other services. Advertising revenue is generated by delivering advertising on our PC and mobile browsers, such as predefined bookmarks (Speed Dials), on Opera News, and on Opera network partners’ properties. Advertising revenue also includes income from all other user-generated activities other than search revenue. Search revenue is generated when a user of our PC and mobile browsers conducts a qualified search using a search partner, such as Google or Yandex, through the browsers’ built-in combined address and search bar, or when otherwise redirected to the search partner via browser functionality. Technology licensing and other revenue include income from the sale of software and licenses to our game development platform GameMaker, provision of cloud computing resources, licensing of our proprietary technology, and provision of related maintenance, support and hosting services, provision of professional services, and customization of browser configurations for mobile operators. The table below shows the amount of revenue from each category (in thousands, except for percentages):
|
|
|
|
|
|
|
|
|
|
|
|
|
|
|
|
|
|
|
|
|
|
|
Year Ended December 31, |
|
|
% Change |
|
|
|
2022 |
|
|
2023 |
|
|
2024 |
|
|
2023 vs. 2022 |
|
|
2024 vs. 2023 |
|
Advertising |
|
$ |
187,434 |
|
|
$ |
230,980 |
|
|
$ |
293,448 |
|
|
|
23 |
% |
|
|
27 |
% |
Search |
|
|
140,162 |
|
|
|
162,168 |
|
|
|
186,273 |
|
|
|
16 |
% |
|
|
15 |
% |
Technology licensing and other revenue |
|
|
3,441 |
|
|
|
3,679 |
|
|
|
927 |
|
|
|
7 |
% |
|
|
(75 |
)% |
Total revenue |
|
$ |
331,037 |
|
|
$ |
396,827 |
|
|
$ |
480,648 |
|
|
|
20 |
% |
|
|
21 |
% |
Advertising revenue increased $62.5 million, or 27%, from 2023 to 2024. Underlying advertising demand led to better monetization on a per-user basis, which together with improved pricing factors and the growth of our user bases in Western markets, resulted in the continuing growth of our Opera Ads platform where we also leveraged third party inventories to meet the demand we sourced from advertisers, as evidenced by the growth of our cost of inventory sold.
Search revenue increased $24.1 million, or 15%, from 2023 to 2024. The increase was driven by both underlying monetization improvements by our search partners and the growth of our browser user base in Western markets where advertisers typically pay more to be promoted. As our search revenue is based on revenue sharing arrangements with our search partners, these factors together had a direct positive impact on our search revenue.
Technology licensing and other revenue decreased $2.8 million, or 75%, from 2023 to 2024. See Note 3 to our consolidated financial statements included elsewhere in this annual report for more information about our revenues.
Other Operating Income
Other operating income includes items of income that are not generated from our ordinary activities. For example, other operating income includes net gains on disposals of property, equipment and intangible assets. The table below shows the amount of other operating income (in thousands, except for percentages):
|
|
|
|
|
|
|
|
|
|
|
|
|
|
|
|
|
|
|
|
|
|
|
Year Ended December 31, |
|
|
% Change |
|
|
|
2022 |
|
|
2023 |
|
|
2024 |
|
|
2023 vs. 2022 |
|
|
2024 vs. 2023 |
|
Other operating income |
|
$ |
469 |
|
|
$ |
666 |
|
|
$ |
2,367 |
|
|
|
42 |
% |
|
|
255 |
% |
Other operating income increased $1.7 million, or 255%, from 2023 to 2024, primarily due to net gains on disposals of crypto assets.
Technology and Platform Fees
Technology and platform fees primarily comprise of (i) costs of platforms and collection services used to facilitate subscription services where we are the principal in the transaction, and (ii) transaction and communication platform expenses. The table below shows the amount of technology and platform fees (in thousands, except for percentages):
|
|
|
|
|
|
|
|
|
|
|
|
|
|
|
|
|
|
|
|
|
|
|
Year Ended December 31, |
|
|
% Change |
|
|
|
2022 |
|
|
2023 |
|
|
2024 |
|
|
2023 vs. 2022 |
|
|
2024 vs. 2023 |
|
Technology and platform fees |
|
$ |
(4,104 |
) |
|
$ |
(3,145 |
) |
|
$ |
(10,010 |
) |
|
|
(23 |
)% |
|
|
218 |
% |
Technology and platform fees increased $6.9 million, or 218%, from 2023 to 2024, primarily driven by increased spending on performance marketing technologies and solutions used in our advertising business.
Content Cost
Content cost includes payments to content creators on our platforms such as Opera News Hub, and payments to publishers and monetization partners. We continue our efforts to increase the amount of content available on our applications by onboarding more European and American publishers. Another significant part of our content cost is cashback payments where we share part of the cashback with our customers. We expect our content cost will be fairly stable as a percentage of the related revenue streams. The table below shows the amount of content cost (in thousands, except for percentages):
|
|
|
|
|
|
|
|
|
|
|
|
|
|
|
|
|
|
|
|
|
|
|
Year Ended December 31, |
|
|
% Change |
|
|
|
2022 |
|
|
2023 |
|
|
2024 |
|
|
2023 vs. 2022 |
|
|
2024 vs. 2023 |
|
Content cost |
|
$ |
(3,834 |
) |
|
$ |
(4,297 |
) |
|
$ |
(3,891 |
) |
|
|
12 |
% |
|
|
(9 |
)% |
Content cost was relatively stable from 2023 to 2024, decreasing by $0.4 million, or 9%, to $3.9 million.
Cost of Inventory Sold
Cost of inventory sold consists primarily of the cost for third party advertising inventory that is sold to our customers along with our own inventory to better serve our advertisers’ demand. We expect this cost category to grow as a percentage of revenue as we see it driving incremental profitability of our advertising business. The table below shows the amount of cost of inventory sold (in thousands, except for percentages):
|
|
|
|
|
|
|
|
|
|
|
|
|
|
|
|
|
|
|
|
|
|
|
Year Ended December 31, |
|
|
% Change |
|
|
|
2022 |
|
|
2023 |
|
|
2024 |
|
|
2023 vs. 2022 |
|
|
2024 vs. 2023 |
|
Cost of inventory sold |
|
$ |
(46,650 |
) |
|
$ |
(85,808 |
) |
|
$ |
(118,658 |
) |
|
|
84 |
% |
|
|
38 |
% |
The cost of inventory sold increased $32.8 million, or 38%, from 2023 to 2024, and represented 25% of our revenue in 2024, up from 22% of our revenue in 2023. This increase was driven mainly by the continuing expansion of the Opera Ads platform, our audience extension product.
Personnel Expenses Including Share-based Compensation
Our personnel expenses primarily consist of salaries and bonuses together with applicable social security contributions, costs of external temporary hires and other personnel-related expenses, as well as share-based compensation, including related social security contributions. Personnel expenses are net of capitalized development costs. We expect our personnel expenses excluding share-based compensation to increase relatively steadily over time in absolute amounts due to the anticipated growth of business and expansion of our global operations, as well as periodic salary adjustments, while we expect it to decline as a percentage of revenue. Share-based compensation expense is expected to remain volatile as it depends on (i) the estimated fair value of equity awards at the grant dates, which amongst other factors is impacted by our share price at the time, (ii) the number of equity instruments, and (iii) the duration of vesting periods.
Kunlun, our majority shareholder, has enrolled certain of our employees in its share incentive plan under which these employees have received options issued by Kunlun as a compensation for services provided to us. We do not have any obligation to settle the awards Kunlun has granted to our employees but they are accounted for as equity-settled share-based payments in our consolidated financial statements, similar to equity awards granted under our own share incentive plan. The table below shows the amount of personnel expenses, including share-based compensation (in thousands, except for percentages):
|
|
|
|
|
|
|
|
|
|
|
|
|
|
|
|
|
|
|
|
|
|
|
Year Ended December 31, |
|
|
% Change |
|
|
|
2022 |
|
|
2023 |
|
|
2024 |
|
|
2023 vs. 2022 |
|
|
2024 vs. 2023 |
|
Personnel expenses excluding share-based compensation |
|
$ |
(65,284 |
) |
|
$ |
(65,801 |
) |
|
$ |
(69,940 |
) |
|
|
1 |
% |
|
|
6 |
% |
Share-based compensation expense for Opera-granted awards |
|
|
(7,439 |
) |
|
|
(10,500 |
) |
|
|
(6,846 |
) |
|
|
41 |
% |
|
|
(35 |
)% |
Share-based compensation expense for parent-granted awards |
|
|
(1,865 |
) |
|
|
(6,450 |
) |
|
|
(2,872 |
) |
|
|
246 |
% |
|
|
(55 |
)% |
Total personnel expenses, including share-based compensation |
|
$ |
(74,588 |
) |
|
$ |
(82,750 |
) |
|
$ |
(79,658 |
) |
|
|
11 |
% |
|
|
(4 |
)% |
Our personnel expenses including share-based compensation decreased $3.1 million, or 4%, from 2023 to 2024. Cash-based compensation expenses increased $4.1 million, or 6%, due to salary adjustments and an increase in the cost of temporary hires, whereas share-based compensation expense decreased $7.2 million, or 43%, primarily because of a reduction during the period in the
number of outstanding equity awards under Opera’s share incentive plan and a reduction in the number of equity awards that are expected to vest under Kunlun’s share incentive plan. See Note 4 to our consolidated financial statements included elsewhere in this annual report for additional details of our personnel expenses.
Marketing and Distribution Expenses
Marketing and distribution expenses primarily consist of performance-based campaigns for our browsers and news platform. We expect our marketing and distribution expenses to increase relative to 2024 as measured in absolute terms, while decreasing as a percentage of revenue. The table below shows the amount of marketing and distribution expenses (in thousands, except for percentages):
|
|
|
|
|
|
|
|
|
|
|
|
|
|
|
|
|
|
|
|
|
|
|
Year Ended December 31, |
|
|
% Change |
|
|
|
2022 |
|
|
2023 |
|
|
2024 |
|
|
2023 vs. 2022 |
|
|
2024 vs. 2023 |
|
Marketing and distribution expenses |
|
$ |
(114,988 |
) |
|
$ |
(109,947 |
) |
|
$ |
(131,951 |
) |
|
|
(4 |
)% |
|
|
20 |
% |
Our marketing and distribution expenses increased $22.0 million, or 20%, from 2023 to 2024. As we expanded our marketing and distribution activities in Western markets to target users with greater monetization potential, the marketing and distribution expenses related to our browsers increased from 2023 by $28.4 million, or 32%, to $116.8 million in 2024. Marketing and distribution expenses related to our Opera GX gaming browser increased $12.6 million, or 32%, from 2023 to 2024. For Opera News, marketing and distribution expenses declined $7.1 million, or 34%, from 2023 to 2024.
Credit Loss Expense
Our credit loss expense reflects write-offs of receivables for which we have no reasonable expectation of recovery and the net change in provisions for expected credit losses on outstanding balances. We make loss provisions at the level of specific invoices where information exists that we can utilize in determining credit risk. For trade receivables where no specific risk information is identified, we have established a provision matrix that is based on our historical credit loss experience, adjusted for forward-looking factors specific to the debtors and the economic environment. Our credit losses are affected by our ability to collect the contractual cash flows due and the credit risk of our customers, including general market conditions affecting our trade partners. The table below shows the amount of credit loss expense (in thousands, except for percentages):
|
|
|
|
|
|
|
|
|
|
|
|
|
|
|
|
|
|
|
|
|
Year Ended December 31, |
|
|
% Change |
|
|
2022 |
|
|
2023 |
|
|
2024 |
|
|
2023 vs. 2022 |
|
|
2024 vs. 2023 |
Credit loss expense |
|
$ |
(1,387 |
) |
|
$ |
(3,967 |
) |
|
$ |
784 |
|
|
|
186 |
% |
|
NM |
_______________
NM - not meaningful.
Our credit loss recovery was $0.8 million in 2024, due to reversals of previous provisions for credit losses on receivables due from certain specific customers in emerging markets as the receivables were ultimately settled. See Note 12 to our consolidated financial statements included elsewhere in this annual report for more information about our credit loss allowance.
Depreciation and Amortization
Depreciation expenses primarily relate to our servers and other equipment, and office properties we lease, whereas amortization expenses primarily relate to technology assets, including such assets recognized from our internal development projects, as well as customer relationship assets recognized as part of the 2016 acquisition of Opera Norway AS. The amounts of depreciation and amortization are driven by the costs of assets we acquire and intangible assets we develop, and the expected useful lives of these assets. We expect our depreciation and amortization expenses to increase relative to 2024 as we continue to invest in our products and digital infrastructure. The table below shows the amount of depreciation and amortization (in thousands, except for percentages):
|
|
|
|
|
|
|
|
|
|
|
|
|
|
|
|
|
|
|
|
|
|
|
Year Ended December 31, |
|
|
% Change |
|
|
|
2022 |
|
|
2023 |
|
|
2024 |
|
|
2023 vs. 2022 |
|
|
2024 vs. 2023 |
|
Depreciation and amortization |
|
$ |
(13,939 |
) |
|
$ |
(13,165 |
) |
|
$ |
(15,582 |
) |
|
|
(6 |
)% |
|
|
18 |
% |
Depreciation and amortization increased $2.4 million, or 18%, from 2023 to 2024, primarily because of the AI data cluster we acquired early in 2024 for $19.1 million, which is depreciated over six years, or $3.2 million per year.
In the beginning of 2024, our estimates for useful lives of servers and network equipment were changed from five to six years due to continuous improvements in hardware, software, and data center designs. Overall, the increase in the estimated useful lives resulted
in a reduction in the depreciation expense in 2024 of $1.0 million. See Notes 9 and 10 to our consolidated financial statements included elsewhere in this annual report for more information about our fixed and intangible assets.
Impairment of Non-financial Assets
Impairment of non-financial assets include impairment losses on our fixed and intangible assets. Impairment losses arise when the recoverable amount of the individual asset or the cash-generating unit to which it belongs is less than the carrying amount of the asset or group of assets. The table below shows the amount of impairment of non-financial assets (in thousands, except for percentages):
|
|
|
|
|
|
|
|
|
|
|
|
|
|
|
|
|
|
|
|
|
|
|
Year Ended December 31, |
|
|
% Change |
|
|
|
2022 |
|
|
2023 |
|
|
2024 |
|
|
2023 vs. 2022 |
|
|
2024 vs. 2023 |
|
Impairment of non-financial assets |
|
$ |
(3,194 |
) |
|
$ |
(681 |
) |
|
$ |
(113 |
) |
|
|
(79 |
)% |
|
|
(83 |
)% |
Impairment of non-financial assets decreased $0.6 million, or 83%, from 2023 to 2024. The impairment charge in 2024 was related to a technology asset for which we determined that the carrying amount was not recoverable. See Note 10 to our consolidated financial statements included elsewhere in this annual report for more information.
Other Operating Expenses
Our other operating expenses primarily consist of hosting expenses, audit and advisory fees, software license fees, rent and other office expenses, and travel expenses. We expect our other operating expenses to increase in absolute amounts in the foreseeable future due to the anticipated growth of our business, while continuing to decline as a percentage of revenue. The table below shows the amount of other operating expenses (in thousands, except for percentages):
|
|
|
|
|
|
|
|
|
|
|
|
|
|
|
|
|
|
|
|
|
|
|
Year Ended December 31, |
|
|
% Change |
|
|
|
2022 |
|
|
2023 |
|
|
2024 |
|
|
2023 vs. 2022 |
|
|
2024 vs. 2023 |
|
Other operating expenses |
|
$ |
(27,015 |
) |
|
$ |
(30,842 |
) |
|
$ |
(31,674 |
) |
|
|
14 |
% |
|
|
3 |
% |
Our other operating expenses increased $0.8 million, or 3%, from 2023 to 2024. The increase was driven by our hosting expenses increasing by $2.2 million, and software license fees increasing by $0.7 million, largely offset by the cost of professional services decreasing by $1.0 million and all other items of other operating expenses decreasing by $1.1 million in total. See Note 5 to our consolidated financial statements included elsewhere in this annual report for more information.
Share of Net Loss of Equity-accounted Investees
We have invested in a venture fund operated by Verda Ventures and in nHorizon Innovation, both of which are accounted for in accordance with the equity method under which we recognize our share of the investees’ net income or loss. The venture fund operated by Verda Ventures was formed in the second half of 2024 with the purpose of making investments in companies operating in the stablecoin ecosystem around our MiniPay platform. Our share of Verda Venture’s net income or loss will depend on the performance of the investments the fund makes.
In 2022, as our accumulated share of nHorizon Innovation’s losses exceeded our interest in the company, we discontinued recognizing our share of further losses. If nHorizon Innovation subsequently reports profits, we will recognize our share of those profits only after our share of the profits equals the share of losses not recognized. However, we do not expect to recognize a material amount of profits from our investment in nHorizon Innovation. The table below shows the share of net income (loss) of equity-accounted investees (in thousands, except for percentages):
|
|
|
|
|
|
|
|
|
|
|
|
|
|
|
|
|
|
|
|
|
Year Ended December 31, |
|
|
% Change |
|
|
2022 |
|
|
2023 |
|
|
2024 |
|
|
2023 vs. 2022 |
|
|
2024 vs. 2023 |
Share of net loss of equity-accounted investees |
|
$ |
(6 |
) |
|
$ |
— |
|
|
$ |
(2 |
) |
|
|
(100 |
)% |
|
N/A |
As the venture fund operated by Verda Ventures was established in the second half of 2024 and thus is in the process of making its initial investments, the fund generated an immaterial loss in 2024. Our unrecorded share of nHorizon Innovation’s net loss in 2024 was also immaterial. See Note 11 to our consolidated financial statements included elsewhere in this annual report for more information.
Fair Value Gain on Long-Term Investments
Our long-term minority investments in unconsolidated entities over which we do not have significant influence or joint control are accounted for at fair value through profit or loss with changes in fair value presented in the Statement of Operations as Fair value gain on long-term investments. After the sale in 2024 of our minority investment in Fjord Bank for $0.8 million, which corresponded to our
acquisition cost and carrying amount of the investment, this category of investments includes only OPay. Future fair value gains or losses on our investment in OPay will depend on a wide range of factors, including OPay’s financial and operating performance, and market conditions where OPay operates, each representing uncertainty. The table below presents the amounts of fair value gains on our long-term investments (in thousands, except for percentages):
|
|
|
|
|
|
|
|
|
|
|
|
|
|
|
|
|
|
|
|
|
|
|
Year Ended December 31, |
|
|
% Change |
|
|
|
2022 |
|
|
2023 |
|
|
2024 |
|
|
2023 vs. 2022 |
|
|
2024 vs. 2023 |
|
Fair value gain on long-term investments |
|
$ |
1,500 |
|
|
$ |
89,838 |
|
|
$ |
5,000 |
|
|
|
5889 |
% |
|
|
(94 |
)% |
Fair value gain on long-term investments, which solely was related to our investment in OPay in the periods presented, was $5.0 million in 2024, compared to $89.8 million in 2023. The fair value gain in 2024 was primarily the result of reversing a specific discount to the fair value measurement. See Note 11 to our consolidated financial statements included elsewhere in this annual report for more details.
Net Finance Income (Expense)
Our finance income primarily includes interest income on deposits of cash with financial institutions, whereas our finance expense primarily includes interest expense on our leases of office properties and equipment.
Our net foreign exchange gain or loss, which is included in the subtotal of net finance income (expense) in our Statement of Operations, is the net gain or loss arising from settlement or translation of monetary items denominated in currencies other than the functional currency, including on intercompany balances within the Opera group.
The table below shows the amounts of finance income, finance expense and foreign exchange gain (loss) (in thousands, except for percentages):
|
|
|
|
|
|
|
|
|
|
|
|
|
|
|
|
|
|
|
|
|
|
|
Year Ended December 31, |
|
|
% Change |
|
|
|
2022 |
|
|
2023 |
|
|
2024 |
|
|
2023 vs. 2022 |
|
|
2024 vs. 2023 |
|
Finance income |
|
$ |
21,454 |
|
|
$ |
8,876 |
|
|
$ |
3,577 |
|
|
|
(59 |
)% |
|
|
(60 |
)% |
Finance expense |
|
|
(39,729 |
) |
|
|
(644 |
) |
|
|
(586 |
) |
|
|
(98 |
)% |
|
|
(9 |
)% |
Foreign exchange gain (loss) |
|
|
(1,157 |
) |
|
|
(963 |
) |
|
|
(1,839 |
) |
|
|
(17 |
)% |
|
|
91 |
% |
Net finance income (expense) |
|
$ |
(19,432 |
) |
|
$ |
7,269 |
|
|
$ |
1,152 |
|
|
NM |
|
|
|
(84 |
)% |
_______________
NM - not meaningful.
Net finance income decreased $6.1 million, or 84%, from 2023 to 2024. In 2024, finance income, primarily from our deposits of cash, totaled $3.6 million, whereas finance expense, mainly the interest expenses on leases, totaled $0.5 million. In 2023, the amount of finance income included a gain of $3.2 million on marketable securities held under an investment program that was terminated in February of that year. See Note 6 to our consolidated financial statements included elsewhere in this annual report for more details.
Income Tax Expense
Our income tax expense for the period is the tax payable on the current period’s taxable income, based on the applicable income tax rate for each jurisdiction, adjusted for changes in deferred tax assets and liabilities attributable to temporary differences and to unused tax losses.
The vast majority of our revenue and operating profit is generated in countries with stable and transparent tax regimes, such as Norway, Ireland and Singapore, where the applicable tax rates were 22.0%, 12.5% and 17%, respectively. We do not expect significant exposure to other tax regimes over the foreseeable future.
Gains on our investment in OPay is not taxable income for Opera, which represents a significant factor in our low effective tax rate. There is no corporate tax in the Cayman Islands (see “Item 10. Additional Information—E. Taxation—Cayman Islands Tax Considerations”). If this investment provides additional realized or unrealized gains to us in the future, we expect a continuation of this factor to our effective tax rate as well in future periods.
We receive tax deductions from the exercise of equity awards granted to employees based on the fair value of the shares. For equity awards scheduled to vest in future periods, the amount of estimated future tax deduction, for which we recognize a deferred tax asset, is based on Opera’s share price at the end of the reporting period. Where the amount of tax deduction (or estimated future tax deduction) exceeds the amount of the related cumulative share-based compensation expense, the current or deferred tax associated
with the excess is recognized directly in equity. The table below shows the amount of income tax expense and the effective tax rate (in thousands, except for percentages):
|
|
|
|
|
|
|
|
|
|
|
|
|
|
|
|
|
|
|
|
|
|
|
Year Ended December 31, |
|
|
% Change |
|
|
|
2022 |
|
|
2023 |
|
|
2024 |
|
|
2023 vs. 2022 |
|
|
2024 vs. 2023 |
|
Income tax expense |
|
$ |
(8,835 |
) |
|
$ |
(6,697 |
) |
|
$ |
(17,642 |
) |
|
|
(24 |
)% |
|
|
163 |
% |
Effective tax rate |
|
|
37.0 |
% |
|
|
4.2 |
% |
|
|
17.9 |
% |
|
|
|
|
|
|
The income tax expense increased $10.9 million, or 163%, from 2023 to 2024, resulting in the effective tax rate also increasing. The increase in our effective tax rate was primarily due to the amount of fair value gain on our investment in OPay, which represents tax-exempt income, decreasing from $89.8 million in 2023 to $5.0 million in 2024. See Note 7 to our consolidated financial statements included elsewhere in this annual report for further details.
Adjusted Net Income, Adjusted EBITDA and Adjusted Diluted Earnings per Share
In addition to revenue, net income and other financial measures presented in accordance with IFRS Accounting Standards, we use adjusted net income, adjusted EBITDA and adjusted diluted earnings per share to manage our business, make planning decisions, evaluate our performance, and allocate resources. We believe these non-IFRS financial measures provide meaningful supplemental information regarding our financial performance by excluding certain items that may not be indicative of recurring core business operating results.
Adjusted net income and adjusted diluted earnings per share were introduced in 2024 to highlight the underlying profitability of our core operations. Adjusted net income is defined as net income excluding (i) profit (loss) from discontinued operations, (ii) gain (loss) on investments in unconsolidated entities, (iii) non-recurring expenses, (iv) impairment of non-financial assets, (v) amortization of acquired intangible assets, (vi) share-based compensation expense, and (vii) the income tax effect of these adjustments. Adjusted net income margin is calculated as adjusted net income divided by revenue, whereas adjusted diluted earnings per share is calculated as adjusted net income divided by the diluted weighted average number of shares outstanding.
We define adjusted EBITDA as net income excluding (i) profit (loss) from discontinued operations, (ii) income tax expense, (iii) net finance income (expense), (iv) gain (loss) on long-term investments in unconsolidated entities, (v) non-recurring expenses, (vi) impairment of non-financial assets, (vii) depreciation and amortization, (viii) share-based compensation expense, and (ix) other operating income. Adjusted EBITDA margin is calculated as adjusted EBITDA divided by revenue.
We believe the non-IFRS financial measures defined above are useful to investors both because they allow for greater transparency with respect to key metrics used by management in its financial and operational decision-making and they are used by our institutional investors and the analyst community to help them analyze the health of our business. However, these non-IFRS financial measures should not be considered substitutes for, or superior to, the financial information presented in accordance with IFRS Accounting Standards. Our calculations of adjusted net income, adjusted EBITDA and adjusted diluted earnings per share may differ from similarly-titled non-IFRS measures, if any, reported by our peers. In addition, the non-IFRS financial measures may be limited in their usefulness because they do not present the full economic effects of certain items of income and expenses. We compensate for these limitations by providing reconciliations of our non-IFRS financial measures to the most closely related financial measures in IFRS Accounting Standards. We encourage investors and others to review our financial information in its entirety, not to rely on any single financial measure and to view our reported non-IFRS financial measures in conjunction with net income and other financial measures prepared in accordance with IFRS Accounting Standards.
The following table presents a reconciliation of adjusted net income to net income (in thousands):
|
|
|
|
|
|
|
|
|
|
|
|
|
|
|
Year Ended December 31, |
|
|
|
2022 |
|
|
2023 |
|
|
2024 |
|
Net income |
|
$ |
15,035 |
|
|
$ |
153,301 |
|
|
$ |
80,771 |
|
Add (deduct): |
|
|
|
|
|
|
|
|
|
Fair value (gain) loss on short-term investments (1) |
|
|
(15,946 |
) |
|
|
(3,243 |
) |
|
|
— |
|
Fair value (gain) loss on long-term investments |
|
|
(1,500 |
) |
|
|
(89,838 |
) |
|
|
(5,000 |
) |
Share of net loss of equity-accounted investees |
|
|
6 |
|
|
|
— |
|
|
|
2 |
|
Non-recurring expenses (2) |
|
|
1,517 |
|
|
|
698 |
|
|
|
— |
|
Impairment of non-financial assets |
|
|
3,194 |
|
|
|
681 |
|
|
|
113 |
|
Amortization of acquired intangible assets |
|
|
2,580 |
|
|
|
2,580 |
|
|
|
2,580 |
|
Share-based compensation expense |
|
|
9,304 |
|
|
|
16,950 |
|
|
|
9,718 |
|
Income tax effect on adjustments |
|
|
(1,326 |
) |
|
|
(8,845 |
) |
|
|
(2,091 |
) |
Adjusted net income |
|
$ |
12,863 |
|
|
$ |
72,284 |
|
|
$ |
86,093 |
|
_______________
(1)The amounts of fair value gains on short-term investments were presented as part of finance income in the Statement of Operations.
(2)The amount of non-recurring expenses in 2023 included certain audit, legal, and other advisory services acquired in connection with the secondary public offering completed in 2023 by a pre-IPO shareholder. These expenses were classified in the Statement of Operations as other operating expenses. In 2022, non-recurring expenses included $1.2 million related to the disposal of Nanobank, which were classified in the Statement of Operations as finance expenses, and $0.3 million classified as other operating expenses.
The following table is a reconciliation of adjusted EBITDA to net income (in thousands):
|
|
|
|
|
|
|
|
|
|
|
|
|
|
|
Year Ended December 31, |
|
|
|
2022 |
|
|
2023 |
|
|
2024 |
|
Net income |
|
$ |
15,035 |
|
|
$ |
153,301 |
|
|
$ |
80,771 |
|
Add (deduct): |
|
|
|
|
|
|
|
|
|
Income tax expense |
|
|
8,835 |
|
|
|
6,697 |
|
|
|
17,642 |
|
Net finance (income) expense |
|
|
18,224 |
|
|
|
(7,269 |
) |
|
|
(1,152 |
) |
Fair value (gain) on long-term investments |
|
|
(1,500 |
) |
|
|
(89,838 |
) |
|
|
(5,000 |
) |
Share of net loss of equity-accounted investees |
|
|
6 |
|
|
|
— |
|
|
|
2 |
|
Non-recurring expenses |
|
|
1,517 |
|
|
|
698 |
|
|
|
— |
|
Impairment of non-financial assets |
|
|
3,194 |
|
|
|
681 |
|
|
|
113 |
|
Depreciation and amortization |
|
|
13,939 |
|
|
|
13,165 |
|
|
|
15,582 |
|
Share-based compensation expense |
|
|
9,304 |
|
|
|
16,950 |
|
|
|
9,718 |
|
Other operating income |
|
|
(469 |
) |
|
|
(666 |
) |
|
|
(2,367 |
) |
Adjusted EBITDA |
|
$ |
68,084 |
|
|
$ |
93,719 |
|
|
$ |
115,309 |
|
The following table is a reconciliation of adjusted diluted earnings per share to diluted earnings per share:
|
|
|
|
|
|
|
|
|
|
|
|
|
|
|
Year Ended December 31, |
|
|
|
2022 |
|
|
2023 |
|
|
2024 |
|
Diluted earnings per share |
|
$ |
0.14 |
|
|
$ |
1.69 |
|
|
$ |
0.90 |
|
Add (deduct): |
|
|
|
|
|
|
|
|
|
Fair value (gain) loss on short-term investments |
|
|
(0.14 |
) |
|
|
(0.04 |
) |
|
|
— |
|
Fair value (gain) loss on long-term investments |
|
|
(0.01 |
) |
|
|
(0.99 |
) |
|
|
(0.06 |
) |
Share of net loss of equity-accounted investees |
|
|
— |
|
|
|
— |
|
|
|
— |
|
Non-recurring expenses |
|
|
0.01 |
|
|
|
0.01 |
|
|
|
— |
|
Impairment of non-financial assets |
|
|
0.03 |
|
|
|
0.01 |
|
|
|
— |
|
Amortization of acquired intangible assets |
|
|
0.02 |
|
|
|
0.03 |
|
|
|
0.03 |
|
Share-based compensation expense |
|
|
0.08 |
|
|
|
0.19 |
|
|
|
0.11 |
|
Income tax effect on adjustments |
|
|
(0.01 |
) |
|
|
(0.10 |
) |
|
|
(0.02 |
) |
Adjusted diluted earnings per share |
|
$ |
0.12 |
|
|
$ |
0.80 |
|
|
$ |
0.96 |
|
B.Liquidity and Capital Resources
Cash Flows
Our principal sources of liquidity are our cash and cash equivalents, and cash generated from our operating activities. As of December 31, 2024, we had $126.8 million in cash and cash equivalents, comprising of cash on deposit with banks and limited holdings of stablecoins, primarily denominated in U.S. dollars, with limited amounts held in euros, Norwegian kroner and other local currencies of the markets where we operate. As part of our cash management strategy, we concentrate cash deposits with large financial institutions.
The following table sets forth a summary of our cash flows for the periods indicated (in thousands):
|
|
|
|
|
|
|
|
|
|
|
|
|
|
|
Year Ended December 31, |
|
|
|
2022 |
|
|
2023 |
|
|
2024 |
|
Net cash flow from operating activities |
|
$ |
56,662 |
|
|
$ |
82,761 |
|
|
$ |
104,977 |
|
Net cash flow from (used in) investing activities |
|
$ |
44,450 |
|
|
$ |
19,999 |
|
|
$ |
(27,112 |
) |
Net cash flow used in financing activities |
|
$ |
(150,578 |
) |
|
$ |
(59,843 |
) |
|
$ |
(42,146 |
) |
Cash Provided by Operating Activities
Net cash flow from operating activities was $105.0 million in 2024. Operating profit of $92.3 million, adjusted for non-cash items such as depreciation, amortization and share-based compensation totaling $24.3 million, contributed $116.5 million, which was partially offset by changes in items of working capital such as trade receivables and payables totaling $3.9 million. Income taxes paid in 2024 amounted to $7.6 million.
The increase in net cash flow from operating activities during 2024 compared to 2023 of $22.2 million, was due to an increase in cash collection from customers driven by the increases in advertising and search revenues, partially offset by a higher amount of cash paid for operational spending.
Cash Provided by and Used in Investing Activities
Cash used in investing activities during 2024 mostly consisted of $23.3 million spent on purchases of property and equipment, including $19.1 million spent on AI data center infrastructure, and $7.3 million spent on the development of new products and services.
In 2023, investing activities included a net cash inflow of $23.4 million from the sale of marketable securities in connection with the termination of an investment program. In the same period, we spent $1.9 million on purchases of property and equipment, and $4.3 million on the development of new products and services.
Cash Used in Financing Activities
Cash used in financing activities during 2024 mostly consisted of dividend payments totaling $37.4 million and to a lesser extent payments of lease liabilities of $4.2 million.
In 2023, cash dividend payments were lower at $23.1 million, though in addition we spent $32.7 million on capital returns in the form of share repurchases. Payments of lease liabilities amounted to $3.9 million in 2023. In total, cash used in financing activities was $17.7 million higher in 2023 compared to 2024.
Free Cash Flow From Operations
In addition to net cash flow from operating activities and other cash flow measures presented in accordance with IFRS Accounting Standards, we use free cash flow from operations to evaluate our performance. We define free cash flow from operations as net cash flows from operating activities less (i) purchases of fixed and intangible assets, (ii) development expenditure and (iii) payment of lease liabilities.
While our measure of free cash flow from operations does not represent the residual cash flow available for discretionary expenditures, we believe the measure provides useful information regarding our ability to generate cash from business operations that is available for acquisitions and other investments, and for distributions to our shareholders. Moreover, we believe free cash flow from operations is useful to investors and the analyst community to analyze the health of our business. However, this non-IFRS financial measure should not be considered a substitute for, or superior to, the financial information presented in accordance with IFRS Accounting Standards. Our calculation of free cash flow from operations may differ from similarly-titled non-IFRS measures, if any, reported by our peers. In addition, free cash flow from operations may be limited in its usefulness because it does not present the full economic effects of certain cash flow items. We compensate for these limitations by providing a reconciliation of free cash flow from
operations to net cash flow from operating activities, which is the most closely related financial measure in IFRS Accounting Standards. We encourage investors and others to review our financial information in its entirety, not to rely on any single financial measure and to view free cash flow from operations in conjunction with net cash flow from operating activities.
The table below reconciles free cash flow from operations to net cash flow from operating activities (in thousands):
|
|
|
|
|
|
|
|
|
|
|
|
|
|
|
Year Ended December 31, |
|
|
|
2022 |
|
|
2023 |
|
|
2024 |
|
Net cash flow from operating activities |
|
$ |
56,662 |
|
|
$ |
82,761 |
|
|
|
104,977 |
|
(Deduct): |
|
|
|
|
|
|
|
|
|
Purchase of equipment |
|
|
(3,187 |
) |
|
|
(1,873 |
) |
|
|
(23,344 |
) |
Purchase of intangible assets |
|
|
— |
|
|
|
(250 |
) |
|
|
— |
|
Development expenditure |
|
|
(6,789 |
) |
|
|
(4,281 |
) |
|
|
(7,263 |
) |
Payment of lease liabilities |
|
|
(3,837 |
) |
|
|
(3,907 |
) |
|
|
(4,181 |
) |
Free cash flow from operations |
|
$ |
42,849 |
|
|
$ |
72,451 |
|
|
$ |
70,190 |
|
Liquidity and Material Cash Requirements
We expect existing cash, cash equivalents, and cash flows from operating activities to be sufficient to fund our operating activities and cash commitments for investing and financing activities, including dividends, for at least the next 12 months and thereafter for the foreseeable future. We continuously evaluate our liquidity and capital resources, including our access to external capital, to ensure we can finance our future capital requirements.
Dividends
On June 13, 2023, our Board of Directors adopted a recurring semi-annual cash dividend program. Our first semi-annual cash dividend of $0.40 per ADS was paid in July 2023. Subsequently we have paid semi-annual cash dividends under the program, each of $0.40 per ADS, in January 2024, July 2024 and January 2025, respectively. Of the first three semi-annual dividends, an aggregate amount of $58.1 million that was payable to ordinary shares held by Kunlun, was offset against our receivable from the sale in 2022 of shares in Star X to Kunlun, resulting in the receivable being fully settled in July 2024. As a result, the cash distributions for the first three semi-annual dividends were limited to $10.8 million, $9.9 million and $27.6 million, respectively. The semi-annual dividend paid in January 2025 of $0.40 per share, resulted in an aggregate cash distribution of $35.4 million.
We intend to continue paying regular semi-annual cash dividends, but with each payment subject to the approval of our Board of Directors and to certain requirements of Cayman Islands law. The form, frequency and amount of future dividends will depend upon our future operations and earnings, capital requirements and surplus, general financial condition, contractual restrictions and other factors that our Board of Directors may deem relevant.
Capital Expenditures
Our capital investments in property and equipment consist primarily of technical infrastructure, such as servers and network equipment for computing, storage, and networking requirements for ongoing business activities, including AI. In addition to investments in fixed assets, we are continuously investing in the development of our software products.
During the years ended December 31, 2023 and 2024, we spent $6.4 million and $30.6 million on capital expenditures, respectively. The significant increase in capital expenditures in 2024 was predominantly the result of our acquisition of an AI data cluster at a cost of $19.1 million. While we will continue to invest in new products and services, including Aria, our browser AI, we do not expect to make similar significant investments in AI data clusters in the foreseeable future, and as a result we anticipate that our capital expenditures will reduce substantially relative to 2024.
Contractual Obligations
As of December 31, 2024, our contractual obligations for which we had recognized financial liabilities in our Statement of Financial Position, such as trade payables and leases, totaled $98.9 million, of which $92.9 million is due to be paid during 2025. See Note 15 to our consolidated financial statements included elsewhere in this annual report for more details on our financial liabilities, including their maturity profiles, and on how we manage liquidity risk.
In addition to obligations for which we have recognized financial liabilities, we had the following contractual commitments as of December 31, 2024:
• We have entered into a subscription agreement under which we subscribe to units of a venture fund operated by Verda Ventures. The fund’s purpose is to invest in companies and projects that promote or are otherwise connected with MiniPay, our stablecoin wallet integrated into Opera Mini. We invested $1.25 million in the fund in the fourth quarter of 2024, and we have committed to make a further seven equal quarterly investments, totaling $10 million.
• As part of a strategic partnership agreement entered into with AP Grant Foundation Company, an entity promoting the Celo blockchain, we have committed to purchasing CELO assets for $0.25 million per quarter until the first quarter of 2029 with a contractual lockup requiring us to hold the CELO assets for one year from the date of purchase.
C.Research and Development, Patents and Licenses, etc.
See “Item 4. Information on the Company—B. Business Overview—Technology.” and “Item 4. Information on the Company—B. Business Overview—Intellectual Property.”
Other than as disclosed elsewhere in this annual report, we are not aware of any other trends, uncertainties, demands, commitments or events for the period from January 1, 2024, to December 31, 2024, that are reasonably likely to have a material adverse effect on our net revenues, income, profitability, liquidity or capital resources, or that would cause reported financial information not necessarily to be indicative of future operating results or financial conditions.
E.Critical Accounting Estimates
Note 2 to our consolidated financial statements included elsewhere in this annual report provides an overview of our critical accounting estimates.
Item 6. Directors, Senior Management and Employees
A.Directors and Senior Management
The following table provides information regarding our directors and executive officers as of the date of this annual report.
|
|
|
|
|
Directors and Executive Officers |
|
Age |
|
Position/Title |
James Yahui Zhou |
|
48 |
|
Chairman of the Board and Chief Executive Officer |
Lin Song |
|
44 |
|
Director and Co-Chief Executive Officer |
Xiaoling Qian |
|
36 |
|
Director |
Tian Jin |
|
45 |
|
Director |
Lori Wheeler Næss |
|
54 |
|
Independent Director |
Trond Riiber Knudsen |
|
61 |
|
Independent Director |
James Liu |
|
52 |
|
Independent Director |
Frode Jacobsen |
|
42 |
|
Chief Financial Officer |
James Yahui Zhou has served as our chairman and chief executive officer since July 2016. Mr. Zhou is the controlling shareholder of Kunlun Tech Co., Ltd. (300418:CH), a global internet company listed on the Shenzhen Stock Exchange, and had served as a director from April 2020 to May 2021, the chairman of the board from March 2011 to April 2020, and an executive director and general manager from March 2008 to March 2011 in Kunlun. Prior to that, he served as general manager of Beijing JiNaiTe Internet Technology Co., Ltd. from March 2007 to March 2008. From November 2005 to March 2007, Mr. Zhou was an executive officer in charge of new business development at RenRen Inc. (which renamed to Moatable, Inc. in June 2023), a NYSE-listed company. From September 2000 to January 2004, Mr. Zhou was general manager of Beijing Huoshen Technology Co., Ltd. Mr. Zhou received his bachelor’s degree in mechanical engineering and his master’s degree in optical engineering from Tsinghua University in 1999 and 2006, respectively.
Lin Song has served as our co-chief executive officer since August 2020 and as a member of our Board of Directors since October 2022. He has worked for our group beginning in 2002 in Oslo, Norway and served as our chief operating officer from March 2017 to August 2020. Mr. Song has an engineering background and has served in various roles inside our group, including project manager of one of our group’s earliest initiatives to enable full web browsing on mobile devices and as director of engineering delivery. Later on, he served as general manager of Opera’s subsidiary in China and assisted in the establishment of Opera’s R&D center in Beijing. Mr. Song also served as a director of Otello Corporation ASA (OSE: OTEC), a Norwegian internet company, from June 2020 until January 2025. Mr. Song obtained a bachelor’s degree in information systems from the University of International Business and Economics in 2004.
Xiaoling Qian has been a member of our Board of Directors since June 2021. Ms. Qian is an executive of Kunlun Tech. Co., Ltd. (300418:CH), a global internet company listed on the Shenzhen Stock Exchange. Ms. Qian has taken a leading role in managing Kunlun’s investment in Opera and has worked with our other board members and the Opera management team since 2016. Ms. Qian obtained a bachelor’s degree in Japanese from Zhejiang University in 2010.
Tian Jin was a member of our Board of Directors from December 2019 until June 2021, rejoining our Board of Directors in October 2022. Mr. Jin held positions of the vice general manager and secretary of the board of Kunlun Tech Co., Ltd. (300418:CH), a global internet company listed on the Shenzhen Stock Exchange, from 2015 to 2018, the general manager since July 2020 to May 2021, and has been serving as a director since November 2018 and chairman of the board since July 2020. Prior to that, Mr. Jin had six years of experience in the banking industry. He held the positions of vice president of the customer development department of Nanjing Bank Beijing branch from 2010 to 2011 and vice president of the bank’s Beichuan sub-branch from 2011 to 2015, and he also served as a key account manager of Agricultural Bank of China Beijing branch from 2009 to 2010. Before that, Mr. Jin worked at Heyi Ceramics (Shanghai) Co., Ltd., a high-end ceramics manufacturing company, where he served as the managing director and supervisor from 2000 to 2009. Mr. Jin received his bachelor’s degree in marketing management from Upper Iowa University in 2006.
Lori Wheeler Næss has served as our independent director since July 2018. She has served as a director of the technical department of PricewaterhouseCoopers, a global auditing service provider, leading IFRS reviews for companies listed in Oslo from September 2012 to June 2015. Prior to that, Ms. Næss served as a senior advisor of the Section for Prospectuses and Financial Reporting of The Financial Supervisory Authority of Norway, a Norwegian government agency responsible for the supervision of financial companies from January 2011 to September 2012. She served as an audit director and manager for U.S. GAAP and SEC Reporting at PricewaterhouseCoopers and its predecessor Coopers & Lybrand at various offices in the United States, Norway and Germany from September 1994 to January 2011. Ms. Næss has also served as a board member and the audit committee chair of Golar LNG Limited, a Nasdaq-listed liquefied natural gas shipping company since March 2016 and served on its Nasdaq-listed limited partner, Golar LNG Partners Limited, from March 2016 until April 2021. Ms. Næss has also served as a board member and the audit committee chair of 2020 Bulkers Ltd., a shipping company listed on the Oslo Stock Exchange since September 2024. Ms. Næss also served as a board member at Klaveness Combination Carriers ASA from January 2019 to April 2021, a shipping company listed on the Oslo Stock Exchange in Norway. Ms. Næss is a U.S. Certified Public Accountant (inactive). She received her bachelor’s degree in business administration in 1994 and her master’s degree in accounting in 1994 from the University of Michigan.
Trond Riiber Knudsen has served as our independent director since July 2018. Mr. Knudsen has served as the founder and CEO of TRK Group AS, an Oslo-based investment and advisory firm since June 2015. He worked at McKinsey & Company, a management consulting firm and served as a senior partner with responsibility for the company’s marketing and sales practice from August 1992 to June 2015. Mr. Knudsen received his sivilingeniør (equivalent of a Master of Science degree) in structural engineering from the Norwegian University of Science and Technology in 1987 and a master’s degree in business administration from Harvard University in 1992.
James Liu has served as our independent director since July 2019. Mr. Liu had over 20 years of experience with China’s high growth internet and technologies companies. Mr. Liu served as an executive director since January 2008 and chief operating officer from 2006 to 2004 of Moatable, Inc. (formerly RenRen Inc.), a NYSE-listed company. Prior to that, in September 2003, he founded UUME.com (which was later acquired by RenRen in May 2005), one of the earliest social networking service websites in China. Previously, from February 2002 to August 2003, Mr. Liu served as the founding product management director at Fortinet (NASDAQ: FTNT), a Nasdaq-listed network security solution provider. From July 2000 to January 2002, he served as a product manager at Siebel Systems Inc., a U.S. software company. Mr. Liu started his career as a management consultant at Boston Consulting Group in China from September 1995 to August 1998. Mr. Liu earned his bachelor’s degree in computer science from Shanghai Jiao Tong University in 1995 and later received his MBA degree from Stanford University in 2000.
Frode Jacobsen has served as the chief financial officer of our group since April 2016. Prior to becoming our chief financial officer, he has worked as the senior vice president responsible for strategic initiatives beginning in February 2015 and as the senior director for corporate development beginning in January 2013. Prior to joining our group, Mr. Jacobsen worked for McKinsey & Company, a management consulting firm which conducts qualitative and quantitative analyses to inform management decisions across the public and private sectors, beginning in August 2008 and served as engagement manager before he left the position in January 2013. Mr. Jacobsen had served as a director of Otello Corporation ASA (OSE: OTEC), a Norwegian internet company, from December 2016 to June 2020. He graduated with a master’s degree in management from HEC Paris in 2008 and obtained his bachelor’s degree in economics and business administration from Norwegian School of Economics in 2006.
Compensation of Directors and Executive Officers
In 2022, 2023 and 2024, we paid an aggregate of $2.4 million, $2.6 million and $2.2 million, respectively, in cash and benefits to our directors and executive officers. Such amounts do not include the share-based compensation we paid to our directors and executive officers. For additional details, including share-based compensation, see Note 4 to our consolidated financial statements included elsewhere in this annual report. We have not set aside or accrued any amount to provide pension, retirement or other similar
benefits to our executive officers and directors. We have no service contracts with any of our directors providing for benefits upon termination of employment.
Share Incentive Plan
We maintain a share incentive plan in order to attract, motivate, retain and reward talent, provide additional incentives to our officers, employees, directors and other eligible persons, and promote the success of our business and the interests of our shareholders.
We adopted the 2017 Restricted Share Unit Plan on April 7, 2017 and later adopted an Amended and Restated Share Incentive Plan on January 10, 2019, or the Plan, to promote the success of our business and the interests of our employees and shareholders by providing long term incentives in the form of Restricted Share Units, or RSUs, or Options, together with the RSUs, collectively the Awards, to attract, motivate, retain and reward our officers, employees, directors and other eligible persons and to link their interests with those of our shareholders.
Under this Plan, up to a maximum of 10,000,000 ordinary shares are available for Awards (excluding dividend adjustments), corresponding to 10,000,000 ADSs after the completion of share consolidation in 2024. Vested RSUs (as reported) entitle the participant of the Plan to receive ADSs, subject to adjustments for dividend payments. Each vested option entitles the participant of the Plan to purchase an ADS at a defined price. As of December 31, 2024, RSU grants equivalent to 7,784,534 ADSs (excluding dividend adjustments) and Options to purchase 100,000 ADSs had been granted, net of forfeitures.
In February 2023, we completed the payment of a special dividend of $0.80 per ADS to all of our shareholders, and as a consequence of this special dividend, non-exercised RSU grants in Opera were adjusted with the dividend yield, resulting in an RSU increase equivalent to 218,020 ADSs. On June 13, 2023, we adopted a recurring semi-annual cash dividend program. Our first semi-annual dividend of $0.40 per ADS was paid in July 2023. Subsequently we have paid semi-annual cash dividends under the program, each of $0.40 per ADS, in January 2024, July 2024 and January 2025. As a result of these semi-annual dividends, non-exercised RSU grants in Opera were adjusted with the dividend yields at the payment dates, resulting in an RSU increase equivalent to 405,071 ADSs in aggregate and net of forfeitures.
The following paragraphs summarize the terms of the Plan:
Plan administration. Our compensation committee or executive officers delegated by our compensation committee acts as the plan administrator.
Type of Awards. The Plan permits the award of Options or grant of RSUs singly, in combination or in tandem.
Award Agreement. Each Award is evidenced by an Award agreement between the Award recipient and our company.
Eligibility. All of our staff members are eligible for the grant of Awards under the Plan at the discretion of the compensation committee. A grant of Awards to any member of the compensation committee requires Board approval.
Vesting Schedule and Other Restrictions. The plan administrator has discretion in making adjustments in the individual vesting schedules and other restrictions applicable to the Awards granted under the Plan. The default vesting period is four years. So long as James Yahui Zhou is a member of the Board, he has authority to cancel equity instruments for any participant of this Plan that are scheduled to vest in the current vesting period, based solely on his assessment that such participant’s professional performance has not been in line with the Company’s expectations. The vesting period is set forth in each Award agreement.
Exercise price. The plan administrator has discretion in determining the price of the Awards, subject to a number of limitations. The plan administrator has absolute discretion in making adjustments to the exercise price of Options.
Payment. The plan administrator determines the methods by which payments by any recipient of any Awards under the Plan are made.
Transfer Restrictions. Except as permitted by the plan administrator, and subject to all the transfer restrictions under the applicable laws and regulations and restrictions set forth in the applicable award agreement, all Awards are not transferable or assignable.
Term of the Options. The term of any Option granted under the Plan cannot exceed ten years from its effective date.
The table below sets forth certain information as of the date of this annual report, concerning the outstanding Awards we have granted to our directors and executive officers individually.
|
|
|
|
|
|
|
|
|
|
|
|
|
|
|
|
|
|
|
|
|
Name |
|
Type of Awards Granted |
|
|
Ordinary Shares Underlying Outstanding Awards Granted |
|
|
Price ($/Share) |
|
|
Year of Grant (1) |
|
|
Year of Expiration |
|
James Yahui Zhou |
|
|
— |
|
|
|
— |
|
|
|
— |
|
|
|
— |
|
|
|
— |
|
Lin Song |
|
* |
|
|
* |
|
|
* |
|
|
2023, 2025 |
|
|
2025, 2027 |
|
Xiaoling Qian |
|
|
— |
|
|
|
— |
|
|
|
— |
|
|
|
— |
|
|
|
— |
|
Tian Jin |
|
|
— |
|
|
|
— |
|
|
|
— |
|
|
|
— |
|
|
|
— |
|
Lori Wheeler Næss |
|
|
— |
|
|
|
— |
|
|
|
— |
|
|
|
— |
|
|
|
— |
|
Trond Riiber Knudsen |
|
|
— |
|
|
|
— |
|
|
|
— |
|
|
|
— |
|
|
|
— |
|
James Liu |
|
|
— |
|
|
|
— |
|
|
|
— |
|
|
|
— |
|
|
|
— |
|
Frode Jacobsen |
|
* |
|
|
* |
|
|
* |
|
|
2021, 2025 |
|
|
2025, 2027 |
|
_______________
* The outstanding awards held by each of these directors and executive officers represent less than 1% of our total outstanding shares.
(1)Excluding dividend adjustment grant dates (issued at every dividend date to ensure that original grants maintain their value).
Kunlun’s Share Incentive Plan
Kunlun, our parent company, has enrolled certain of our employees in its share incentive plan under which these employees have received options issued by Kunlun as a compensation for services provided to us. We do not have any obligation to settle the awards granted by Kunlun but grants from Kunlun to our employees are accounted for as equity-settled share-based payments in our consolidated financial statements, similar to those grants awarded under our own share incentive plan. For details of Kunlun’s share incentive plan, see Note 4 to our consolidated financial statements included elsewhere in this annual report.
Clawback Policy
In November 2023, the Board adopted a policy, effective from October 2, 2023, for the recovery of erroneously awarded incentive-based compensation (the “Clawback Policy”) providing for the recovery of certain incentive-based compensation from current and former executive officers of the Company in the event the Company is required to restate its financial statements in order to correct (i) material noncompliance of the Company with any financial reporting requirement under the securities laws, including any required accounting restatement to correct an error in previously issued financial statements that is material to the previously issued financial statements, or (ii) an error that is not material to previously issued financial statements, but would result in a material misstatement if the error were corrected in the current period or left uncorrected in the current period. The adoption of the Clawback Policy was in accordance with Rule 5608 of the Nasdaq listing rules and Section 10D and Rule 10D-1 of the Securities Exchange Act Rule of 1934. A copy of the Clawback Policy was filed as Exhibit 97.1 to our annual report on Form 20-F for the year ended December 31, 2023, filed with the SEC on April 24, 2024.
Our Board of Directors consists of seven directors. A director is not required to hold any shares in our company to qualify to serve as a director. A director who is in any way, whether directly or indirectly, interested in a contract or proposed contract with our company is required to declare the nature of his interest at a meeting of our directors. A general notice given to the directors by any director to the effect that he is a member, shareholder, director, partner, officer or employee of any specified company or firm and is to be regarded as interested in any contract or transaction with that company or firm is deemed a sufficient declaration of interest for the purposes of voting on a resolution in respect to a contract or transaction in which he has an interest, and after such general notice it is not necessary to give special notice relating to any particular transaction. Subject to any separate requirement for audit committee approval under applicable law or the Nasdaq Stock Market Rules and disqualification by the chairman of the relevant board meeting, a director may vote in respect of any contract, proposed contract, arrangement or transaction notwithstanding that he may be interested therein and if he does so his vote is counted and he is counted in the quorum at any meeting of the directors at which any such contract, proposed contract, arrangement or transaction is considered, provided that the nature of the interest of any directors in such contract or transaction is disclosed by him at or prior to its consideration and any vote in that matter. Our Board of Directors may exercise all of the powers of our company to borrow money, to mortgage or charge its undertaking, property and uncalled capital, or any part thereof, and to issue debentures, debenture stock or other securities whenever money is borrowed or as security for any debt, liability or obligation of our company or of any third party. None of our directors has a service contract with us that provides for benefits upon termination of service.
Committees of the Board of Directors
We have an audit committee, a compensation committee and a corporate governance and nominating committee under the Board of Directors. We have adopted a charter for each of the three committees. Each committee’s members and functions are described below.
Audit Committee. Our audit committee consists of Lori Wheeler Næss, Trond Riiber Knudsen and James Liu, and is chaired by Ms. Næss. Each of them satisfies the “independence” requirements of Rule 5605(a)(2) of the Nasdaq Stock Market Rules and meet the independence standards under Rule 10A-3 under the Exchange Act. Our Board of Directors has also determined that Ms. Næss qualifies as an “audit committee financial expert” within the meaning of the SEC rules and possesses financial sophistication within the meaning of the Nasdaq Stock Market Rules. The audit committee oversees our accounting and financial reporting processes and the audits of the financial statements of our company. The audit committee is responsible for, among other things:
• reviewing and approving all transactions with the Company’s related parties, as defined in Item 404 of Regulation S-K;
• selecting our independent registered public accounting firm and pre-approving all auditing and non-auditing services permitted to be performed by our independent registered public accounting firm;
• reviewing with our independent registered public accounting firm any audit problems or difficulties and management’s response;
• discussing the annual audited financial statements with management and our independent registered public accounting firm;
• periodically reviewing and reassessing the adequacy of our audit committee charter;
• meeting periodically with the management and our independent registered public accounting firm;
• reporting regularly to the Board of Directors;
• reviewing the adequacy and effectiveness of our financial reporting processes and internal control over financial reporting, as well as reviewing our policies, procedures and any steps taken to monitor and control major financial risk exposure; and
• such other matters that are specifically delegated to the audit committee by our Board of Directors from time to time.
Compensation Committee. Our compensation committee consists of Trond Riiber Knudsen, James Liu and Xiaoling Qian, and is chaired by Mr. Knudsen. Mr. Knudsen and Mr. Liu both satisfy the “independence” requirements of Rule 5605(a)(2) of the Nasdaq Stock Market Rules. As a controlled company and foreign private issuer, we have elected to not have our compensation committee consist of entirely independent directors. Our compensation committee assists the Board of Directors in reviewing and approving the compensation structure, including all forms of compensation, relating to our directors and executive officers. Our chief executive officer may not be present at any committee meeting during which his compensation is deliberated upon. The compensation committee is responsible for, among other things:
• reviewing and approving to the Board of Directors with respect to the total compensation package for our chief executive officer (if any);
• reviewing and making recommendations to the Board of Directors with respect to the total compensation package for our other executive officers;
• reviewing employee compensation plans and trends and recommending any proposed changes to our management;
• reviewing and recommending to the Board of Directors with respect to the total compensation package of our directors;
• at the committee's discretion, selecting and receiving advice from compensation consultants, legal counsel or other advisors after taking into consideration all factors relevant to that person’s independence from management; and
• periodically reviewing and reassessing the adequacy of our compensation committee charter.
Corporate Governance and Nominating Committee. Our corporate governance and nominating committee consists of Lori Wheeler Næss, Trond Riiber Knudsen and James Liu, and is chaired by Mr. Liu. Each of them satisfies the “independence” requirements of Rule 5605(a)(2) of the Nasdaq Stock Market Rules. The corporate governance and nominating committee assists the
Board of Directors in selecting individuals qualified to become our directors and in determining the composition of the Board of Directors and its committees. The corporate governance and nominating committee is responsible for, among other things:
• identifying and recommending nominees for election to our Board of Directors or for appointment to fill any vacancy;
• reviewing annually with our Board of Directors its current composition in light of the characteristics of independence, age, skills, experience and availability of service to us;
• advising the Board of Directors periodically with respect to significant developments in the law and practice of corporate governance as well as our compliance with applicable laws and regulations, and making recommendations to our Board of Directors on all matters of corporate governance and on any corrective action to be taken;
• monitoring compliance with our code of business conduct and ethics, including reviewing the adequacy and effectiveness of our procedures to ensure proper compliance; and
• periodically reviewing and reassessing the adequacy of our corporate governance and nominating committee charter.
Duties of Directors
Under Cayman Islands law, our directors owe fiduciary duties to our company, including a duty of loyalty, a duty to act honestly, and a duty to act in what they consider in good faith to be in our best interests. Our directors must also exercise their powers only for a proper purpose. Our directors also owe to our company a duty to act with skill and care. It was previously considered that a director need not exhibit in the performance of his or her duties a greater degree of skill than may reasonably be expected from a person of his knowledge and experience. However, English and Commonwealth courts have moved towards an objective standard with regard to the required skill and care and these authorities are likely to be followed in the Cayman Islands. In fulfilling their duty of care to us, our directors must ensure compliance with our memorandum and articles of association, as amended and restated from time to time. Our company has the right to seek damages if a duty owed by our directors is breached. In limited exceptional circumstances, a shareholder may have the right to seek damages in our name if a duty owed by our directors is breached.
The functions and powers of our Board of Directors include, among others:
• convening shareholders’ annual general meetings and reporting its work to shareholders at such meetings;
• declaring dividends and distributions;
• appointing officers and determining the term of office of officers;
• exercising the borrowing powers of our company and mortgaging the property of our company; and
• approving the transfer of shares of our company, including the registering of such shares in our share register.
Terms of Directors and Executive Officers
Each of our directors holds office until his or her successor has been elected and qualified, until his or her resignation or until his or her office is otherwise vacated in accordance with our memorandum and articles of association. All of our executive officers are appointed by and serve at the discretion of our Board of Directors. Our directors may be appointed or removed from office by an ordinary resolution of shareholders. A director will be removed from office automatically if, among other things, the director (i) becomes bankrupt or makes any arrangement or composition with his creditors; (ii) dies or is found to be or becomes of unsound mind; (iii) resigns by notice in writing to our company; (iv) without special leave of absence from our Board of Directors, is absent from three consecutive meetings of the board and the board resolves that his office be vacated; (v) is prohibited by law from being a director; or (vi) is removed pursuant to our memorandum and articles of association then in effect. The compensation of our directors is determined by the Board of Directors. There is no mandatory retirement age for directors.
Employment Agreements and Indemnification Agreements
We have entered into employment agreements with our executive officers. Each of our executive officers is employed for a continuous term, or a specified time period which will be automatically extended, unless either we or the executive officer gives prior notice to terminate such employment. Subject to local labor regulations, we may terminate the employment for cause, at any time and without remuneration, for certain acts of the executive officer, including but not limited to the commitments of any serious or persistent breach or non-observance of the terms and conditions of the employment, conviction of a criminal offense other than one which in the opinion of the board does not affect the executive’s position, willful, disobedience of a lawful and reasonable order, misconduct being inconsistent with the due and faithful discharge of the executive officer’s material duties, fraud or dishonesty, or
habitual neglect of his or her duties. An executive officer may terminate his or her employment at any time with a three- to six-month prior written notice.
Each executive officer has agreed to hold, both during and after the employment agreement expires or is earlier terminated, in strict confidence and not to use or disclose to any person, corporation or other entity without written consent, any confidential information or trade secrets. In addition, all executive officers have agreed to be bound by non-competition and non-solicitation restrictions set forth in their agreements. Subject to local labor regulations, each executive officer has agreed not to, for a certain period following termination of his or her employment or expiration of the employment agreement: (i) carry on or be engaged, concerned or interested directly or indirectly whether as shareholder, director, employee, partner, agent or otherwise carry on any business in direct competition with us, or (ii) employ, solicit or entice away or attempt to employ, solicit or entice away any of our officers, managers, consultants or employees.
We have entered into indemnification agreements with our directors and executive officers, pursuant to which we will agree to indemnify our directors and executive officers against certain liabilities and expenses incurred by such persons in connection with claims made by reason of their being such a director or executive officer.
We had 606, 592 and 599 full-time employees as of December 31, 2022, 2023 and 2024, respectively, mainly based in Norway, Poland, China, Sweden and the United Kingdom. As of December 31, 2024, 73% of our full-time employees served research and development roles. The following table sets forth the number of employees in each functional area as of the date indicated.
|
|
|
|
|
|
|
|
|
As of December 31, 2024 |
Area |
|
R&D |
|
Other |
|
Total |
Browser and News |
|
357 |
|
48 |
|
405 |
AdTech |
|
38 |
|
10 |
|
48 |
Sales and Commercial |
|
13 |
|
18 |
|
31 |
Hosting and Infrastructure |
|
14 |
|
— |
|
14 |
Group functions |
|
13 |
|
88 |
|
101 |
Total |
|
435 |
|
164 |
|
599 |
Additionally, as of December 31, 2024, we had engaged 81 contractors and we had 54 temporary employees to fill open positions for general and administrative, R&D, marketing and sales functions.
We believe we offer our employees competitive compensation packages and a discrimination-free, collegial and creative working environment. As a result, we have generally been able to attract and retain qualified employees and have had limited attrition at senior leadership levels.
We generally enter into standard confidentiality and employment agreements with our management and other employees. These contracts include a non-solicitation covenant and, to the extent permissible under local law, a non-compete covenant that prohibits the employee from competing with us, directly or indirectly, during his or her employment and for a defined period after the termination of his or her employment.
The following table sets forth information concerning the beneficial ownership of our ordinary shares as of the date of this annual report for:
• each of our directors and executive officers; and
• each person known to us to beneficially own more than 5% of our ordinary shares.
The calculations in the table below are based on 89,500,854 ordinary shares issued and outstanding as of the date of this annual report.
Beneficial ownership is determined in accordance with the rules and regulations of the SEC. In computing the number of shares beneficially owned by a person and the percentage ownership of that person, we have included shares that the person has the right to acquire within 60 days of the date of this annual report, including through the exercise of any option, warrant, or other right or the conversion of any other security. These shares, however, are not included in the computation of the percentage ownership of any other person.
|
|
|
|
|
|
|
|
|
Ordinary Shares Beneficially Owned |
|
|
Percentage of Total Voting Power held (%) (1) |
|
Directors and Executive Officers: (2) |
|
|
|
|
|
|
James Yahui Zhou (3) |
|
61,567,443 |
|
|
68.8% |
|
Lin Song |
|
* |
|
|
* |
|
Xiaoling Qian |
|
— |
|
|
— |
|
Tian Jin |
|
— |
|
|
— |
|
Lori Wheeler Næss |
|
* |
|
|
* |
|
Trond Riiber Knudsen |
|
* |
|
|
* |
|
James Liu |
|
— |
|
|
— |
|
Frode Jacobsen |
|
* |
|
|
* |
|
Principal Shareholder: |
|
|
|
|
|
|
Hong Kong Kunlun Tech Holding Limited (4) |
|
61,567,443 |
|
|
68.8% |
|
_______________
* Less than 1% of our total outstanding shares.
(1)For each person and group included in this column, percentage ownership is calculated by dividing the number of ordinary shares beneficially owned by such person or group, including shares that such person or group has the right to acquire within 60 days after the date of this annual report, by the sum of (i) 89,500,854, which is the total number of ordinary shares outstanding as of the date of this annual report, and (ii) the number of ordinary shares that such person or group has the right to acquire beneficial ownership within 60 days after the date of this annual report. The ordinary shares outstanding as of the date of this annual report excludes shares on deposit with our depositary bank but for which the corresponding ADSs are held by Opera as a result of, for example, Opera’s former share repurchase programs.
(2)Unless otherwise indicated, the business address of our directors and executive officers is Vitaminveien 4, 0485 Oslo, Norway.
(3)Represents 54,833,333 ordinary shares and 6,734,110 ADSs held by Hong Kong Kunlun Tech Holding Limited, a limited liability company incorporated in Hong Kong, of which 68.03% of the equity interest is owned by Kunlun Group Limited, a company incorporated in Hong Kong and wholly owned by Kunlun, and 31.97% of the equity interest is owned directly by Kunlun, a company incorporated in the People’s Republic of China, in which Mr. Zhou is the controlling shareholder.
(4)Represents 54,833,333 ordinary shares and 6,734,110 ADSs held by Hong Kong Kunlun Tech Holding Limited, a limited liability company incorporated in Hong Kong. As of the date of this annual report, Mr. Zhou directly holds 11.77% of the equity interest and indirectly holds 15.41% of the equity interest of Kunlun through Xinyu Yingrui Century Software R&D Center L.P., a limited partnership established in the People’s Republic of China, or Xinyu Yingrui, which is co-owned by Mr. Zhou and his ex-wife. Mr. Zhou, holds 54.8% of the equity interest of Xinyu Yingrui and, as the general partner, has sole decision making authority in terms of how the partnership exercises its ownership rights in Kunlun Tech Co., Ltd. The registered address of Hong Kong Kunlun Tech Holding Limited is FLAT/RM 3561, 35/F, Central Plaza, 18 Harbour Road, Wanchai, HK. The business address of Kunlun Group Limited is RM 3508, 35/F., Central Plaza, 18 Harbour Road, Wanchai, Hong Kong. The business address of Kunlun is 46 Xizongbu Hutong, Mingyang International Center, Block B, Dongcheng District, Beijing 100005, People’s Republic of China.
As of the date of this annual report, we had no ordinary shares outstanding that were held by a record holder in the United States. None of our shareholders has informed us that it is affiliated with a registered broker-dealer or is in the business of underwriting securities. We are not aware of any arrangement that may, at a subsequent date, result in a change of control of our company.
F.Disclosure of a Registrant’s Action to Recover Erroneously Awarded Compensation
Not applicable.
Item 7. Major Shareholders and Related Party Transactions
See “Item 6. Directors, Senior Management and Employees—E. Share Ownership.”
B.Related Party Transactions
See Note 17 to our consolidated financial statements included elsewhere in this annual report for details of our transactions with related parties.
Share Incentive Plan
See “Item 6. Directors, Senior Management and Employees—B. Compensation—Share Incentive Plan.”
Employment Agreements and Indemnification Agreements
See “Item 6. Directors, Senior Management and Employees—C. Board Practice—Employment Agreements and Indemnification Agreements.”
C.Interest of Experts and Counsel
Not applicable.
Item 8. Financial Information
A.Consolidated Statement and Other Financial Information
Consolidated Financial Statements
See “Item 18. Financial Statements.”
Legal and Administrative Proceedings
From time to time, we are subject to various legal proceedings, investigations and claims incidental to the conduct of our business. Such proceedings can be costly and time consuming, and are inherently unpredictable. Therefore, no assurance can be given of the final outcome of any proceeding or that such proceeding will not materially impact our financial condition or results of operation. See “Item 3. Key Information—D. Risk Factors—Risks Related to Our Business and Industry—We are subject to risks related to litigation, including intellectual property claims and regulatory disputes.”
As of the date of this annual report, we are not a party to, nor are we aware of, any other legal proceeding, investigation or claim which, in the opinion of our management, is likely to have an adverse material effect on our business, financial condition or results of operations. We may periodically be subject to legal proceedings, investigations and claims relating to our business. We may also initiate legal proceedings to protect our rights and interests.
Dividend Policy
On June 13, 2023, our Board of Directors adopted a recurring semi-annual cash dividend program. Our first semi-annual dividend of $0.40 per ADS was paid to shareholders of record as of June 30, 2023. Subsequently we have declared and paid semi-annual dividends under the program, each of $0.40 per ADS, to shareholders of record on January 3, 2024, July 2, 2024 and January 6, 2025. We intend to pay regular semi-annual dividends, with each payment subject to the approval of our Board of Directors and to certain requirements of Cayman Islands law. The form, frequency and amount of future dividends will depend upon our future operations and earnings, capital requirements and surplus, general financial condition, contractual restrictions and other factors that our Board of Directors may deem relevant.
Our Board of Directors has discretion as to whether to continue, reduce or even cease distributing dividends, subject to certain requirements of Cayman Islands law. In addition, our shareholders may by ordinary resolution declare a dividend, but no dividend may exceed the amount recommended by our directors. Under Cayman Islands law, a Cayman Islands company may pay a dividend out of either profit or share premium account, provided that in no circumstances may a dividend be paid if this would result in the company being unable to pay its debts as they fall due in the ordinary course of business. When we pay any dividends on our ordinary shares, we will pay those dividends which are payable in respect of the ordinary shares underlying the ADSs to the depositary, as the registered holder of such ordinary shares, and the depositary then will pay such amounts to the ADS holders who will receive payment to the same extent as holders of our ordinary shares, subject to the terms of the deposit agreement, including the fees and expenses payable thereunder. Cash dividends on our ordinary shares, if any, will be paid in U.S. dollars.
We are a holding company incorporated in the Cayman Islands. For our cash requirements, including any payment of dividends to our shareholders, we rely upon payments from our operating entities such as Opera Norway AS. Regulations in Norway where we utilize dividend payments may restrict the ability of our subsidiaries to pay dividends to us.
See “Risk Factors—Risks Related to Our ADSs—Your ability to achieve a return on your investment will depend on the combination of future dividend payments and the price appreciation of the ADSs.”
Except as disclosed elsewhere in this annual report, we have not experienced any significant changes since the date of our audited consolidated financial statements included elsewhere in this annual report.
Item 9. The Offer and Listing
A.Offer and Listing Details
Our ADSs have been listed on the Nasdaq Global Select Market since July 27, 2018, and traded under the symbol “OPRA.”
Not applicable.
Our ADSs have been listed on the Nasdaq Global Select Market since July 27, 2018, under the symbol “OPRA.”
Not applicable.
Not applicable.
Not applicable.
Item 10. Additional Information
Not applicable.
B.Memorandum and Articles of Association
We incorporate by reference into this annual report our Second Amended and Restated Memorandum and Articles of Association, as currently in effect, filed as Exhibit 3.2 to our registration statement on Amendment No.1 to Form F-1 (File No. 333-226017), filed with the SEC on July 13, 2018.
We have not entered into any material contracts other than in the ordinary course of business and other than those described in “Item 4. Information on the Company,” “Item 5. Operating and Financial Review and Prospects,” and Note 17 to our consolidated financial statements or elsewhere in this annual report.
The Cayman Islands currently has no exchange control regulations or currency restrictions.
The following summary of Cayman Islands, Norway and U.S. federal income tax consequences of an investment in the ADSs or ordinary shares is based upon laws and relevant interpretations thereof in effect as of the date of this annual report, all of which are subject to change. This summary does not deal with all possible tax consequences relating to an investment in the ADSs or ordinary shares, such as the tax consequences under state, local and other tax laws, or tax laws of jurisdictions other than the Cayman Islands, Norway, and the United States.
Cayman Islands Tax Considerations
The Cayman Islands currently levies no taxes on individuals or corporations based upon profits, income, gains or appreciation and there is no taxation in the nature of inheritance tax or estate duty. There are no other taxes likely to be material to us levied by the government of the Cayman Islands except for stamp duties which may be applicable on instruments executed in or, after execution brought within, the jurisdiction of the Cayman Islands. The Cayman Islands is not party to any double tax treaties which are applicable to any payments made by or to our company. There are no exchange control regulations or currency restrictions in the Cayman Islands.
Payments of dividends and capital in respect of our ordinary shares or the ADSs will not be subject to taxation in the Cayman Islands and no withholding tax will be required on the payment of a dividend or capital to any holder of our ordinary shares or the ADSs, as the case may be, nor will gains derived from the disposal of our ordinary shares or the ADSs be subject to Cayman Islands income or corporation tax. The Cayman Islands currently have no income, corporation or capital gains tax and no estate duty, inheritance tax or gift tax.
Norway Tax Considerations
Below is a summary of the primary tax issue in Norway for Norwegian corporate holders of the ADSs.
The ADS is a financial instrument with shares in Opera Limited, an exempted company incorporated under the laws of the Cayman Islands with limited liability, as the underlying object. For Norwegian tax purposes, the ADSs will not be covered by the participation exemption since the underlying object is an entity in a low tax jurisdiction outside the EEA. For limited liability companies (and certain similar entities) resident in Norway for tax purposes, dividends from the ADSs will be considered as taxable income. Gains on realization (including sales) of the ADSs will also be considered as taxable income for limited liability companies (and certain similar entities) resident in Norway for tax purposes. The tax rate for 2024 for limited liability companies (and certain similar entities) was 22% and will be 22% for 2025.
United States Federal Income Tax Considerations
The following discussion describes the material United States federal income tax consequences to a United States Holder (as defined below), under current law, of an investment in our ADSs or ordinary shares. This discussion is based on the federal income tax laws of the United States as of the date of this annual report, including the United States Internal Revenue Code of 1986, as amended, or the Code, existing and proposed Treasury regulations promulgated thereunder, judicial authority, published administrative positions of the IRS, and other applicable authorities, all as of the date of this annual report. All of the foregoing authorities are subject to change, which change could apply retroactively and could significantly affect the tax consequences described below. We have not sought any ruling from the IRS with respect to the statements made and the conclusions reached in the following discussion and there can be no assurance that the IRS or a court will agree with our statements and conclusions.
This discussion applies only to a United States Holder (as defined below) that holds our ADSs or ordinary shares as capital assets for United States federal income tax purposes (generally, property held for investment). The discussion neither addresses the tax consequences to any particular investor nor describes all of the tax consequences applicable to persons in special tax situations, such as:
• banks and certain other financial institutions;
• insurance companies;
• regulated investment companies;
• real estate investment trusts;
• brokers or dealers in stocks and securities, or currencies;
• persons that use or are required to use a mark-to-market method of accounting;
• certain former citizens or residents of the United States subject to Section 877 or Section 877A of the Code;
• entities subject to the United States anti-inversion rules;
• tax-exempt organizations and entities;
• persons subject to the alternative minimum tax provisions of the Code;
• persons whose functional currency is other than the United States dollar;
• persons holding ADSs or ordinary shares as part of a straddle, hedging, conversion or integrated transaction;
• persons that actually or constructively own ADSs or ordinary shares representing 10% or more of our total voting power or value;
• persons who acquired ADSs or ordinary shares pursuant to the exercise of an employee equity grant or otherwise as compensation;
• persons who choose to be treated as a resident of the United States under Section 6013(g) election;
• persons who changed their tax residency status during the taxable year;
• persons who is an officer or director of our group;
• S-corporation, partnerships or other pass-through entities, or persons holding ADSs or ordinary shares through such entities;
• persons required to accelerate the recognition of any item of gross income with respect to our ADSs or ordinary shares as a result of such income being recognized on an applicable financial statement; or
• persons that held, directly, indirectly or by attribution, ADSs or ordinary shares or other ownership interests in us prior to our initial public offering.
This discussion, moreover, does not address the United States federal estate, gift, Medicare, or alternative minimum tax considerations, or any state, local or non-United States tax considerations, relating to the ownership and disposition of our ADSs or ordinary shares.
Except as specifically described below, this discussion does not address any tax consequences or reporting obligations that may be applicable to persons holding our ADSs or ordinary shares through a bank, financial institution or other entity, or a branch thereof, located, organized or resident outside the United States, and does not describe any tax consequences arising in respect of the Foreign Account Tax Compliance Act, or FATCA regime.
If a partnership (including an entity or arrangement treated as a partnership for United States federal income tax purposes) holds our ADSs or ordinary shares, the tax treatment of a partner in the partnership generally will depend upon the status of the partner and the activities of the partnership. A partnership or partner in a partnership holding our ADSs or ordinary shares should consult its tax advisors regarding the tax consequences of investing in and holding our ADSs or ordinary shares.
THE FOLLOWING DISCUSSION IS FOR INFORMATIONAL PURPOSES ONLY AND IS NOT A SUBSTITUTE FOR CAREFUL TAX PLANNING AND ADVICE. HOLDERS SHOULD CONSULT THEIR TAX ADVISORS WITH RESPECT TO THE APPLICATION OF THE UNITED STATES FEDERAL INCOME TAX LAWS TO THEIR PARTICULAR SITUATIONS, AS WELL AS ANY TAX CONSEQUENCES ARISING UNDER THE UNITED STATES FEDERAL ESTATE OR GIFT TAX LAWS OR THE LAWS OF ANY STATE, LOCAL OR NON-UNITED STATES TAXING JURISDICTION OR UNDER ANY APPLICABLE TAX TREATY.
For purposes of the discussion below, a “United States Holder” is a beneficial owner of our ADSs or ordinary shares that is, for United States federal income tax purposes:
• an individual who is a citizen or resident of the United States;
• a corporation created or organized in or under the laws of the United States, any state thereof or the District of Columbia;
• an estate, the income of which is subject to United States federal income taxation regardless of its source; or
• a trust, if (i) a court within the United States is able to exercise primary jurisdiction over its administration and one or more United States persons have the authority to control all of its substantial decisions or (ii) in the case of a trust that was treated as a domestic trust under the law in effect before 1997, a valid election is in place under applicable Treasury regulations to treat such trust as a domestic trust.
The discussion below assumes that the representations contained in the deposit agreement and any related agreement are true and that the obligations in such agreements will be complied with in accordance with their terms.
ADSs
If you own our ADSs, then you should be treated as the owner of the underlying ordinary shares represented by those ADSs for United States federal income tax purposes. Accordingly, deposits or withdrawals of ordinary shares for ADSs should not be subject to United States federal income tax.
Dividends and Other Distributions on our ADSs or Ordinary Shares
Subject to the PFIC rules discussed below, the gross amount of any distribution that we make to you with respect to our ADSs or ordinary shares (including any amounts withheld to reflect withholding taxes) will be taxable as a dividend, to the extent paid out of our current or accumulated earnings and profits, as determined under United States federal income tax principles. Such income (including any withheld taxes) will be includable in your gross income on the day actually or constructively received by you, if you own our ordinary shares, or by the depositary, if you own our ADSs. If a distribution exceeds the amount of our current and accumulated earnings and profits, as so determined under United States federal income tax principles, the excess will be treated first as a non-taxable return of capital to the extent of the United States Holder’s tax basis in the ordinary shares or ADSs, and thereafter as
capital gain, which will be either long-term or short-term capital gain depending on whether the United States Holder held the ordinary shares or ADSs for more than one year.
Because we do not intend to determine our earnings and profits on the basis of United States federal income tax principles, any distribution paid generally will be reported as a “dividend” for United States federal income tax purposes. Such dividends will not be eligible for the dividends-received deduction allowed to qualifying corporations under the Code.
Dividends received by a non-corporate United States Holder may qualify for the lower rates of tax applicable to “qualified dividend income,” if the dividends are paid by a “qualified foreign corporation” and other conditions discussed below are met. A non-United States corporation is treated as a qualified foreign corporation (i) with respect to dividends paid by that corporation on shares (or ADSs backed by such shares) that are readily tradable on an established securities market in the United States or (ii) if such non-United States corporation is eligible for the benefits of a qualifying income tax treaty with the United States that includes an exchange of information program. We do not expect to be eligible for the benefits of such an income tax treaty. In addition, a non-United States corporation will not be treated as a qualified foreign corporation if it is a PFIC in the taxable year in which the dividend is paid or the preceding taxable year.
Under a published IRS Notice, common or ordinary shares, or ADSs representing such shares (such as our ADSs), are considered to be readily tradable on an established securities market in the United States if they are listed on the Nasdaq Global Select Market, as our ADSs are (but not our ordinary shares). Based on existing guidance, it is unclear whether the ordinary shares will be considered to be readily tradable on an established securities market in the United States, because only our ADSs, and not the underlying ordinary shares, are listed on a securities market in the United States. We believe, but we cannot assure you, that dividends we pay on the ordinary shares that are represented by our ADSs, but not on the ordinary shares that are not so represented, will, subject to applicable limitations, be eligible for the reduced rates of taxation applicable to “qualified dividend income.”
Even if dividends would be treated as paid by a qualified foreign corporation, a non-corporate United States Holder will not be eligible for reduced rates of taxation if it does not hold our ADSs or ordinary shares for more than 60 days during the 121-day period beginning 60 days before the ex-dividend date (disregarding certain periods of ownership while the United States Holder’s risk of loss is diminished) or if such United States Holder elects to treat the dividend income as “investment income” pursuant to Section 163(d)(4) of the Code. In addition, the rate reduction will not apply to dividends of a qualified foreign corporation if the non-corporate United States Holder receiving the dividend is obligated to make related payments with respect to positions in substantially similar or related property.
You should consult your tax advisors regarding the availability of the lower tax rates applicable to qualified dividend income for any dividends that we pay with respect to our ADSs or ordinary shares, as well as the effect of any change in applicable law after the date of this annual report.
Any non-United States withholding taxes imposed on dividends paid to you with respect to our ADSs or ordinary shares may be treated as foreign taxes eligible for deduction or credit against your United States federal income tax liability, subject to the various limitations and disallowance rules that apply to foreign tax credits generally (including that the election to deduct or credit foreign taxes applies to all of your other applicable foreign taxes for a particular tax year). For purposes of calculating the foreign tax credit limitation, dividends paid to you with respect to our ADSs or ordinary shares will be treated as income from sources outside the United States and generally will constitute passive category income, or in certain cases, general category income. Regulations impose additional requirements that must be met for a foreign tax to be creditable (including requirements that a “covered withholding tax” be imposed on nonresidents in lieu of a generally applicable tax that satisfies the regulatory definition of a “net income tax”, which may be unclear or difficult to determine). However, a recent IRS notice provides temporary relief from certain of these requirements if the notice is applied consistently to all foreign taxes paid during the relevant taxable year until the date that a notice or other guidance withdrawing or modifying the temporary relief is issued (or any later date specified in such notice or other guidance). The rules relating to the determination of the foreign tax credit are complex, and you should consult your tax advisors regarding the availability of a foreign tax credit in your particular circumstances.
Disposition of our ADSs or Ordinary Shares
You will recognize gain or loss on a sale or exchange of our ADSs or ordinary shares in an amount equal to the difference between the amount realized on the sale or exchange and your tax basis in our ADSs or ordinary shares. Subject to the discussion under “—Passive Foreign Investment Company” below, such gain or loss generally will be capital gain or loss. Capital gains of a non-corporate United States Holder, including an individual that has held our ADSs or ordinary shares for more than one year currently are eligible for reduced tax rates. The deductibility of capital losses is subject to limitations.
Any gain or loss that you recognize on a disposition of our ADSs or ordinary shares generally will be treated as United States-source income or loss for foreign tax credit limitation purposes. Under U.S. regulations, non-United States withholding tax imposed on such U.S. source gain may not constitute a creditable tax. You should consult your tax advisors regarding the proper treatment of gain or loss, as well as the availability of a foreign tax credit, in your particular circumstances.
Passive Foreign Investment Company
Based on the market price of our ADSs, the value of our assets and the nature and composition of our income and assets, we do not believe that we were a PFIC for United States federal income tax purposes for our taxable year ended December 31, 2024, although there can be no assurances in this regard. The determination of PFIC status is based on an annual determination that cannot be made until the close of a taxable year, involves extensive factual investigation, including ascertaining the fair market value of all of our assets on a quarterly basis and the character of each item of income that we earn, and is subject to uncertainty in several respects. Moreover, we cannot assure you that the IRS will agree with any position that we take. Accordingly, there can be no assurance that we will not be treated as a PFIC for any taxable year or that the IRS will not take a contrary position to any determination we make.
We will be treated as a PFIC for United States federal income tax purposes for any taxable year if, applying applicable look-through rules, either:
• at least 75% of our gross income for such year is passive income; or
• at least 50% of the value of our assets (generally determined based on a quarterly average) during such year is attributable to assets that produce or are held for the production of passive income.
For this purpose, passive income generally includes dividends, interest, royalties and rents (other than certain royalties and rents derived in the active conduct of a trade or business and not derived from a related person). We will be treated as owning a proportionate share of the assets and earning a proportionate share of the income of any other corporation in which we own, directly or indirectly, at least 25% by value of the stock.
Changes in the nature or composition of our income or assets, including as a result of our investment in new businesses, products, services and technologies, may cause us to be or become a PFIC. The determination of whether we will be a PFIC for any taxable year may depend in part upon the value of our goodwill and other unrecorded intangibles not reflected on our balance sheet (which may depend upon the market value of our ADSs or ordinary shares from time to time, which may be volatile) and also may be affected by how, and how quickly, we spend our liquid assets and the cash we generate from our operations and raise in any offering. In estimating the value of our goodwill and other unrecorded intangibles, we have taken into account our market capitalization. Among other matters, if our market capitalization declines, we may be or become a PFIC for the current or future taxable years because our liquid assets and cash (which are for this purpose considered assets that produce passive income) may then represent a greater percentage of the value of our overall assets. Further, while we believe our classification methodology and valuation approach are reasonable, it is possible that the IRS may challenge our classification or valuation of our goodwill and other unrecorded intangibles, which may result in our being or becoming a PFIC for our taxable year ended December 31, 2024, the current taxable year or one or more future taxable years.
If we are a PFIC for any taxable year during your holding period for our ADSs or ordinary shares, we will continue to be treated as a PFIC with respect to you for all succeeding years during which you hold our ADSs or ordinary shares, unless we were to cease to be a PFIC and you make a “deemed sale” election with respect to our ADSs or ordinary shares. If such election is made, you will be deemed to have sold the ADSs or ordinary shares you hold at their fair market value and any gain from such deemed sale would be subject to the rules described in the following two paragraphs. After the deemed sale election, so long as we do not become a PFIC in a subsequent taxable year, such ADSs or ordinary shares with respect to which such election was made will not be treated as shares in a PFIC and, as a result, you will not be subject to the rules described below with respect to any “excess distribution” you receive from us or any gain from a sale or other taxable disposition of our ADSs or ordinary shares. You are strongly urged to consult your tax advisors as to the possibility and consequences of making a deemed sale election if we are and then cease to be a PFIC and such an election becomes available to you.
If we are a PFIC for any taxable year during your holding period for our ADSs or ordinary shares, then, unless you make a “mark-to-market” election (as discussed below), you generally will be subject to special and adverse tax rules with respect to any “excess distribution” that you receive from us and any gain that you recognize from a sale or other disposition, including a pledge, of the ADSs or ordinary shares. For this purpose, distributions that you receive in a taxable year that are greater than 125% of the average annual distributions that you received during the shorter of the three preceding taxable years or your holding period for the ADSs or ordinary shares will be treated as an excess distribution. Under these rules:
• the excess distribution or recognized gain will be allocated ratably over your holding period for the ADSs or ordinary shares;
• the amount of the excess distribution or recognized gain allocated to the taxable year of distribution or gain, and to any taxable years in your holding period prior to the first taxable year in which we were treated as a PFIC, will be treated as ordinary income; and
• the amount of the excess distribution or recognized gain allocated to each other taxable year will be subject to the highest tax rate in effect for individuals or corporations, as applicable, for each such year and the resulting tax will be subject to the interest charge generally applicable to underpayments of tax.
If we are a PFIC for any taxable year during your holding period for our ADSs or ordinary shares and any of our non-United States subsidiaries that are corporations (or other corporations in which we directly or indirectly own equity interests) is also a PFIC, you would be treated as owning a proportionate amount (by value) of the shares of each such non-United States corporation classified as a PFIC (each such corporation, a lower-tier PFIC) for purposes of the application of these rules. You should consult your tax advisors regarding the application of the PFIC rules to any of our lower-tier PFICs.
If we are a PFIC for any taxable year during your holding period for our ADSs or ordinary shares, then in lieu of being subject to the tax and interest-charge rules discussed above, you may make an election to include gain on our ADSs or ordinary shares as ordinary income under a mark-to-market method, provided that such ADSs or ordinary shares constitute “marketable stock.” Marketable stock is stock that is regularly traded on a qualified exchange or other market, as defined in applicable Treasury regulations. Our ADSs, but not our ordinary shares, are listed on the Nasdaq Global Select Market, which is a qualified exchange or other market for these purposes. Consequently, as long as our ADSs remain listed on the Nasdaq Global Select Market and are regularly traded, and you are a holder of such ADSs, we expect that the mark-to-market election would be available to you if we were a PFIC, but no assurances are given in this regard.
Because a mark-to-market election cannot be made for any lower-tier PFICs that we may own, if we were a PFIC for any taxable year, a United States Holder that makes a mark-to-market election with respect to our ADSs or ordinary shares may continue to be subject to the tax and interest charges under the general PFIC rules with respect to such United States Holder’s indirect interest in any investments held by us that are treated as an equity interest in a PFIC for United States federal income tax purposes.
In certain circumstances, a United States Holder of shares in a PFIC may avoid the adverse tax and interest-charge regime described above by making a “qualified electing fund” election to include in income its share of the corporation’s income on a current basis. However, you may make a qualified electing fund election with respect to our ADSs or ordinary shares only if we agree to furnish you annually with a PFIC annual information statement as specified in the applicable Treasury regulations. We currently do not intend to prepare or provide the information that would enable you to make a qualified electing fund election.
A United States Holder that holds our ADSs or ordinary shares in any year in which we are a PFIC will be required to file an annual report containing such information as the United States Treasury Department may require. In addition, under certain circumstances, regulations also require a “United States person” (as such term is defined in the Code) that owns an interest in a PFIC as an indirect shareholder through one or more United States persons to file an annual report for any taxable year during which such indirect shareholder is treated as receiving an excess distribution in connection with the ownership or disposition of such interest, or reports income pursuant to a mark-to-market election.
You should consult your tax advisors regarding the application of the PFIC rules to your ownership and disposition of our ADSs or ordinary shares and the availability, application and consequences of the elections discussed above.
Information Reporting and Backup Withholding
Information reporting to the IRS and backup withholding generally will apply to dividends in respect of our ADSs or ordinary shares, and the proceeds from the sale or exchange of our ADSs or ordinary shares, that are paid to you within the United States (and in certain cases, outside the United States), unless you furnish a correct taxpayer identification number and make any other required certification, generally on IRS Form W-9, or you otherwise establish an exemption from information reporting and backup withholding. Backup withholding is not an additional tax. Amounts withheld as backup withholding generally are allowed as a credit against your United States federal income tax liability, and you may be entitled to obtain a refund of any excess amounts withheld under the backup withholding rules if you file an appropriate claim for refund with the IRS and furnish any required information in a timely manner. United States Holders should consult their tax advisors regarding the application of the information reporting and backup withholding rules.
Information with Respect to Foreign Financial Assets
United States Holders who are individuals (and certain entities closely held by individuals) generally will be required to report our name, address and such information relating to an interest in our ADSs or ordinary shares as is necessary to identify the class or issue of which our ADSs or ordinary shares are a part. These requirements are subject to exceptions, including an exception for ADSs or ordinary shares held in accounts maintained by certain financial institutions and an exception applicable if the aggregate value of all “specified foreign financial assets” (as defined in the Code) does not exceed $50,000 (and in some circumstances, a higher threshold).
United States Holders should consult their tax advisors regarding the application of these information reporting rules.
F.Dividends and Paying Agents
Not applicable.
Not applicable.
We previously filed with the SEC a registration statement on Form F-1 (File No. 333-226017), as amended, including the prospectus contained therein to register our ordinary shares in relation to our initial public offering. We later filed with the SEC a registration on Form F-3 (File No. 333-233691), as amended, including the prospectus contained therein to register our ordinary shares in relation to our follow-on offering and a registration on Form F-3 (File No. 333-273242), as amended, including the prospectus contained therein to register our ordinary shares in relation to follow-on offerings of us or the selling securityholders. We also filed with the SEC a related registration statement on Form F-6 (File No. 333-226171) to register the ADSs and a registration statement on Form S-8 (File No. 333-229285) to register our securities to be issued under our Amended and Restated Share Incentive Plan.
We are subject to the periodic reporting and other informational requirements of the Exchange Act as applicable to foreign private issuers. Under the Exchange Act, we are required to file reports and other information with the SEC. Specifically, we are required to file annually a Form 20-F within four months after the end of each fiscal year. Copies of reports and other information, when so filed with the SEC, can be inspected and copied at the public reference facilities maintained by the SEC at 100 F Street, N.E., Room 1580, Washington, D.C. 20549. You can request copies of these documents, upon payment of a duplicating fee, by writing to the SEC. The public may obtain information regarding the Washington, D.C. Public Reference Room by calling the Commission at 1-800-SEC-0330.
The SEC also maintains a web site at www.sec.gov that contains reports, proxy and information statements, and other information regarding registrants that make electronic filings with the SEC using its EDGAR system. As a foreign private issuer, we are exempt from the rules of the Exchange Act prescribing the furnishing and content of quarterly reports and proxy statements, and our executive officers, directors and principal shareholder are exempt from the reporting and short-swing profit recovery provisions contained in Section 16 of the Exchange Act. In addition, we are not required under the Exchange Act to file periodic reports and financial statements with the SEC as frequently or as promptly as U.S. companies whose securities are registered under the Exchange Act.
We will furnish The Bank of New York Mellon, the depositary of our ADSs, with our annual reports, which will include a review of operations and annual audited consolidated financial statements prepared in accordance with IFRS Accounting Standards, and all notices of shareholders’ meetings and other reports and communications that are made generally available to our shareholders. The depositary will make such notices, reports and communications available to holders of ADSs and, upon our request, will mail to all record holders of ADSs the information contained in any notice of a shareholders’ meeting received by the depositary from us.
Not applicable.
J.Annual Report to Security Holders
Not applicable.
Item 11. Quantitative and Qualitative Disclosures About Market Risk
Quantitative and qualitative disclosures about our exposure to market risks are provided in Note 15 to our consolidated financial statements included elsewhere in this annual report.
Item 12. Description of Securities Other Than Equity Securities
Not applicable.
Not applicable.
Not applicable.
D.American Depositary Shares
The Bank of New York Mellon, as depositary, registered and delivered ADSs. The depositary’s office at which the ADSs are administered and its principal executive office is located at 240 Greenwich Street, New York, New York 10286.
Fees and Expenses
Our ADS holders are required to pay the following service fees to the depositary bank, The Bank of New York Mellon, and certain taxes and governmental charges (in addition to any applicable fees, expenses, taxes and other governmental charges payable on the deposited securities represented by any of ADSs):
|
|
|
Persons depositing or withdrawing shares or ADS holders must pay: |
|
For: |
$5.00 (or less) per 100 ADSs (or portion of 100 ADSs) |
|
Issuance of ADSs, including issuances resulting from a distribution of shares or rights or other property Cancelation of ADSs for the purpose of withdrawal, including if the deposit agreement terminates |
$0.05 (or less) per ADS |
|
Any cash distribution to ADS holders |
A fee equivalent to the fee that would be payable if securities distributed to you had been shares and the shares had been deposited for issuance of ADSs |
|
Distribution of securities distributed to holders of deposited securities (including rights) that are distributed by the depositary to ADS holders |
$0.05 (or less) per ADS per calendar year |
|
Depositary services |
Registration or transfer fees |
|
Transfer and registration of shares on our share register to or from the name of the depositary or its agent when you deposit or withdraw shares |
Expenses of the depositary |
|
Cable and facsimile transmissions (when expressly provided in the deposit agreement) Converting foreign currency to U.S. dollars |
Taxes and other governmental charges the depositary or the custodian have to pay on any ADSs or shares underlying ADSs, such as stock transfer taxes, stamp duty or withholding taxes |
|
As necessary |
Any charges incurred by the depositary or its agents for servicing the deposited securities |
|
As necessary |
The depositary collects its fees for delivery and surrender of ADSs directly from investors depositing shares or surrendering ADSs for the purpose of withdrawal or from intermediaries acting for them. The depositary collects fees for making distributions to investors by deducting those fees from the amounts distributed or by selling a portion of distributable property to pay the fees. The depositary may collect its annual fee for depositary services by deduction from cash distributions or by directly billing investors or by charging the book-entry system accounts of participants acting for them. The depositary may collect any of its fees by deduction from any cash distribution payable (or by selling a portion of securities or other property distributable) to ADS holders that are obligated to pay those fees. The depositary may generally refuse to provide fee-attracting services until its fees for those services are paid.
From time to time, the depositary may make payments to us to reimburse us for costs and expenses generally arising out of establishment and maintenance of the ADS program, waive fees and expenses for services provided to us by the depositary or share revenue from the fees collected from ADS holders. In performing its duties under the deposit agreement, the depositary may use brokers, dealers, foreign currency dealers or other service providers that are owned by or affiliated with the depositary and that may earn or share fees, spreads or commissions.
The depositary may convert currency itself or through any of its affiliates and, in those cases, acts as principal for its own account and not as agent, advisor, broker or fiduciary on behalf of any other person and earns revenue, including, without limitation, transaction spreads, that it will retain for its own account.
The revenue is based on, among other things, the difference between the exchange rate assigned to the currency conversion made under the deposit agreement and the rate that the depositary or its affiliate receives when buying or selling foreign currency for its own account. The depositary makes no representation that the exchange rate used or obtained in any currency conversion under the deposit agreement will be the most favorable rate that could be obtained at the time or that the method by which that rate will be determined will be the most favorable to ADS holders, subject to the depositary’s obligations under the deposit agreement. The methodology used to determine exchange rates used in currency conversions is available upon request.
Payments by Depositary
In 2024, we did not receive payments from The Bank of New York Mellon, the depositary bank for our ADS program.
PART II
Item 13. Defaults, Dividend Arrearages and Delinquencies
None.
Item 14. Material Modifications to the Rights of Security Holders and Use of Proceeds
See “Item 10. Additional Information” for a description of the rights of shareholders, which remain unchanged.
Item 15. Controls and Procedures
A.Disclosure Controls and Procedures
Our management, with the participation of our chief executive officer and chief financial officer, has performed an evaluation of the effectiveness of our disclosure controls and procedures (as defined in Rule 13a-15(e) under the Exchange Act) as of the end of the period covered by this annual report, as required by Rule 13a-15(b) under the Exchange Act. Based upon that evaluation, our management concluded that due to a material weakness (as defined in Rule 12b-2 of the Exchange Act) in internal control over financial reporting as further described below, our disclosure controls and procedures were ultimately not effective as of December 31, 2024.
Notwithstanding the material weakness described below, management has concluded that the consolidated financial statements included elsewhere in this annual report fairly present, in all material respects, our results of operations, cash flows and financial position for and at the periods presented, in conformity with IFRS Accounting Standards. We have performed additional procedures to ensure that the material weakness did not result in a misstatement of our accounts or disclosures. Additionally, we have devoted and intend to continue to devote significant time and resources to enhance our controls and procedures by executing a plan to remediate the identified control deficiencies, as elaborated below.
B.Management’s Annual Report on Internal Control over Financial Reporting
Our management is responsible for establishing and maintaining adequate internal control over financial reporting, as such term is defined in Rules 13a-15(f) under the Exchange Act, for our company. Internal control over financial reporting is a process designed to provide reasonable assurance regarding the reliability of financial reporting and the preparation of consolidated financial statements in accordance with IFRS Accounting Standards. The company’s internal control over financial reporting includes policies and procedures that (i) pertain to the maintenance of records that, in reasonable detail, accurately and fairly reflect the transactions and dispositions of assets, (ii) provide reasonable assurance that transactions are recorded as necessary to permit preparation of consolidated financial statements in accordance with IFRS Accounting Standards and that receipts and expenditures are being made only in accordance with authorizations of the management and directors, and (iii) provide reasonable assurance regarding prevention or timely detection of unauthorized acquisition, use, or disposition of the company’s assets that could have a material effect on the consolidated financial statements. Because of its inherent limitations, internal control over financial reporting may not prevent or detect all misstatements.
As required by Section 404 of the Sarbanes-Oxley Act and related rules as promulgated by the U.S. Securities and Exchange Commission, our management has assessed the effectiveness of our internal control over financial reporting as of December 31, 2024, based on the Internal Control – Integrated Framework (2013) issued by the Committee of Sponsoring Organizations of the Treadway Commission (COSO). Based on this assessment, our management has concluded that our internal control over financial reporting as of December 31, 2024, was not yet effective due to the presence of control deficiencies set out below in the section “Material Weakness in Internal Control over Financial Reporting,” which in accordance with the rules and regulations of the U.S. Securities and Exchange Commission constituted a material weakness in our internal control over financial reporting. Rule 12b-2 of the Exchange Act defines a material weakness as a deficiency, or combination of deficiencies, in internal control over financial reporting, such that there is a reasonable possibility that a material misstatement of the company's annual or interim financial statements will not be prevented or detected on a timely basis.
Material Weakness in Internal Control over Financial Reporting
Certain risks of material misstatements have been identified for which our control framework was not effective as of December 31, 2024, in accordance with the Internal Control – Integrated Framework (2013) issued by the Committee of Sponsoring Organizations of the Treadway Commission (COSO). Specifically, as our remediation efforts for our previously reported material weaknesses were staged based on the capacity of our appropriately qualified personnel, the design and implementation of certain business process controls, including those over the completeness and accuracy of information used, were not yet completed.
Attestation Report of the Registered Public Accounting Firm
Our independent registered public accounting firm, KPMG AS, which audited the consolidated financial statements included elsewhere in this annual report, has expressed an adverse opinion on the Company’s internal control over financial reporting.
C.Attestation Report of the Registered Public Accounting Firm
To the Shareholders and Board of Directors of Opera Limited:
Opinion on Internal Control Over Financial Reporting
We have audited Opera Limited and subsidiaries’ (the Company) internal control over financial reporting as of December 31, 2024, based on criteria established in Internal Control – Integrated Framework (2013) issued by the Committee of Sponsoring Organizations of the Treadway Commission. In our opinion, because of the effect of the material weakness, described below, on the achievement of the objectives of the control criteria, the Company has not maintained effective internal control over financial reporting as of December 31, 2024, based on criteria established in Internal Control – Integrated Framework (2013) issued by the Committee of Sponsoring Organizations of the Treadway Commission.
We also have audited, in accordance with the standards of the Public Company Accounting Oversight Board (United States) (PCAOB), the consolidated statements of financial position of the Company as of December 31, 2024 and 2023, the related consolidated statements of operations, comprehensive income, changes in equity, and cash flows for each of the years in the three-year period ended December 31, 2024 and the related notes (collectively, the consolidated financial statements), and our report dated April 10, 2025 expressed an unqualified opinion on those consolidated financial statements.
A material weakness is a deficiency, or a combination of deficiencies, in internal control over financial reporting, such that there is a reasonable possibility that a material misstatement of the company’s annual or interim financial statements will not be prevented or detected on a timely basis. A material weakness has been identified and included in management’s assessment related to the design and implementation of certain business process controls, including those over the completeness and accuracy of information used, that were not completed by December 31, 2024. The material weakness was considered in determining the nature, timing, and extent of audit tests applied in our audit of the 2024 consolidated financial statements, and this report does not affect our report on those consolidated financial statements.
Basis for Opinion
The Company’s management is responsible for maintaining effective internal control over financial reporting and for its assessment of the effectiveness of internal control over financial reporting, included in the accompanying Management’s Annual Report on Internal Control over Financial Reporting. Our responsibility is to express an opinion on the Company’s internal control over financial reporting based on our audit. We are a public accounting firm registered with the PCAOB and are required to be independent with respect to the Company in accordance with the U.S. federal securities laws and the applicable rules and regulations of the Securities and Exchange Commission and the PCAOB.
We conducted our audit in accordance with the standards of the PCAOB. Those standards require that we plan and perform the audit to obtain reasonable assurance about whether effective internal control over financial reporting was maintained in all material respects. Our audit of internal control over financial reporting included obtaining an understanding of internal control over financial reporting, assessing the risk that a material weakness exists, and testing and evaluating the design and operating effectiveness of internal control based on the assessed risk. Our audit also included performing such other procedures as we considered necessary in the circumstances. We believe that our audit provides a reasonable basis for our opinion.
Definition and Limitations of Internal Control Over Financial Reporting
A company’s internal control over financial reporting is a process designed to provide reasonable assurance regarding the reliability of financial reporting and the preparation of financial statements for external purposes in accordance with generally accepted accounting principles. A company’s internal control over financial reporting includes those policies and procedures that (1) pertain to the maintenance of records that, in reasonable detail, accurately and fairly reflect the transactions and dispositions of the assets of the company; (2) provide reasonable assurance that transactions are recorded as necessary to permit preparation of financial statements in accordance with generally accepted accounting principles, and that receipts and expenditures of the company are being made only in accordance with authorizations of management and directors of the company; and (3) provide reasonable assurance regarding prevention or timely detection of unauthorized acquisition, use, or disposition of the company’s assets that could have a material effect on the financial statements.
Because of its inherent limitations, internal control over financial reporting may not prevent or detect misstatements. Also, projections of any evaluation of effectiveness to future periods are subject to the risk that controls may become inadequate because of changes in conditions, or that the degree of compliance with the policies or procedures may deteriorate.
/s/ KPMG AS
Oslo, Norway
April 10, 2025
D.Changes in Internal Control Over Financial Reporting
Management has evaluated, with the participation of our chief executive officer and chief financial officer, whether any changes in our internal control over financial reporting that occurred during our last fiscal year have materially affected, or are reasonably likely to materially affect, our internal control over financial reporting.
Remediation of Previously Disclosed Material Weaknesses
As previously reported in “Item 15. Controls and Procedures—B. Management’s Annual Report on Internal Control over Financial Reporting” of our annual report on Form 20-F for the fiscal year ended December 31, 2023, in connection with our assessment of the effectiveness of internal control over financial reporting as of December 31, 2023, we determined that we had insufficient competence and capacity to maintain effective internal control, and that the risk assessment procedures were not performed in a timely manner, which resulted in insufficient design, implementation and operation of business and IT general controls. Further, due to ineffective IT general controls, automated controls and controls dependent on these, including those dependent on the completeness and accuracy of information derived from relevant IT systems, were rendered ineffective.
During 2024, we prioritized the training and allocation of personnel with skills and experience in internal controls to address the competence element of the identified material weakness. As of December 31, 2024, we had completed the planned remediation of the material weaknesses relating to timely risk assessment procedures, including risks of fraud, and the operation of IT general controls which included establishing procedures for management of critical roles and permissions, regular reviews of user access, change management, enforcement of IT operational controls, system backup and recovery, logging and monitoring of critical activities, and periodic IT risk assessments.
Remediation Plan for Remaining Material Weakness
While there have been significant improvements throughout the year, our management is continuing to focus on remediation efforts to address the remaining deficiency described above by undertaking the following actions:
• In accordance with our staged approach, personnel with skills and experience in internal controls will transition their focus to the remaining business process controls, including those over the completeness and accuracy of information used.
• Control responsibilities will be assessed on a continuous basis and reallocated if necessary to optimize workload distribution, ensuring critical controls receive adequate attention.
We are committed to remediating the material weakness and have made progress in that effort. The actions we have taken are subject to ongoing review by senior management, as well as oversight from our Audit Committee.
When fully implemented and operational, we believe the measures described above will remediate the underlying causes of the control deficiency that gave rise to the material weakness. Even though management has made significant progress, which resulted in resolving material weaknesses relating to capacity and competence, risk assessment and IT general controls, the remaining material weakness resulting from insufficient capacity during the year to finalize the design and implementation of certain business process controls, including those over the completeness and accuracy of information used, cannot be considered fully remediated until management has fully implemented the design of controls in accordance with the remediation plan, the applicable controls have operated for a sufficient period of time, and management concludes through performing a full assessment, including testing, that the controls are operating effectively.
To our knowledge, our deficiencies neither indicated ineffectiveness in the supervision of internal controls by our audit committee or management nor resulted in material misstatement in the financial statements, which was not detected by internal control during operation in accordance with PRC rules and regulations as applicable to our majority shareholder, which is a Chinese public company listed on the Shenzhen Stock Exchange.
Item 16. [Reserved]
Item 16A. Audit Committee Financial Expert
Our Board of Directors has determined that Lori Wheeler Næss, an independent director and the chair of our audit committee, qualifies as an “audit committee financial expert” within the meaning of the SEC rules and possesses financial sophistication within the meaning of the Nasdaq Stock Market Rules. Ms. Næss meets the independence standards under Rule 10A-3 under the Exchange Act.
Item 16B. Code of Ethics
We have adopted a code of business conduct and ethics that applies to all of our directors, officers and employees, including our chief executive officer and chief financial officer. Our code of business conduct and ethics is available on our website at investor.opera.com.
Item 16C. Principal Accountant Fees and Services
KPMG AS, Oslo, Norway (PCAOB ID 1363), is our independent registered public accounting firm. The following table sets forth the estimated aggregate fees for professional services and other services rendered by KPMG AS for the years ended December 31, 2023 and 2024 (in thousands):
|
|
|
|
|
|
|
|
|
|
|
Year Ended December 31, |
|
|
|
2023 |
|
|
2024 |
|
Audit fees (1) |
|
$ |
3,094 |
|
|
$ |
2,518 |
|
Audit-related fees (2) |
|
|
— |
|
|
|
— |
|
Tax fees (3) |
|
|
11 |
|
|
|
18 |
|
All other fees (4) |
|
|
— |
|
|
|
— |
|
Total fees |
|
$ |
3,105 |
|
|
$ |
2,536 |
|
_______________
(1)Audit fees include the audit of our annual financial statements and services that are normally provided by the independent registered public accounting firm in connection with statutory and regulatory filings or engagements for those fiscal years including review of documents filed with the SEC.
(2)Audit-related fees means the aggregate fees billed for professional services rendered by our principal auditors for the assurance and related services, which were not included under Audit fees above.
(3)Tax fees means the aggregate fees billed in each of the fiscal periods listed for professional services rendered by our principal auditors for tax compliance.
(4)All other fees means the aggregate fees billed for each of the fiscal years listed for products or professional services rendered by our independent registered public accounting firm not included in Audit fees, Audit-related fees or Tax fees.
The policy of our audit committee is to pre-approve all audit, audit-related and non-audit services provided by our independent registered public accounting firm to ensure that such services do not impair its independence.
Item 16D. Exemptions from the Listing Standards for Audit Committees
Not applicable.
Item 16E. Purchases of Equity Securities by the Issuer and Affiliated Purchasers
None.
Item 16F. Change in Registrant's Certifying Accountant
Not applicable.
Item 16G. Corporate Governance
As a Cayman Islands exempted company listed on the Nasdaq Global Select Market, we are subject to Nasdaq corporate governance listing standards. However, Rule 5615(a)(3) of the Nasdaq Stock Market Rules permits foreign private issuers like us to follow certain home country corporate governance practices in lieu of certain provisions of the Rule 5600 Series of the Nasdaq Stock Market Rules. A foreign private issuer that elects to follow a home country practice instead of such provisions, must disclose in its annual reports each requirement that it does not follow and describe the home country practice followed by it.
Our current corporate governance practices differ from Nasdaq corporate governance requirements for U.S. companies in certain respects, as summarized below:
• Rule 5605(b)(1) of the Nasdaq Stock Market Rules requires a Nasdaq-listed company to have a majority of the board be independent. In this regard we have elected to adopt the practices of our home country, the Cayman Islands, which practices do not require a majority independent board; and
• Rule 5605(d)(2) of the Nasdaq Stock Market Rules requires a Nasdaq-listed company to have a compensation committee composed solely of independent directors to determine or recommend the compensation of the executive officers of the company. In this regard we have elected to adopt the practices of our home country, the Cayman Islands, which practices do not require that any of the members of a company’s compensation committee be independent directors.
We have relied on and intend to continue to rely on some of these exemptions.
Item 16H. Mine Safety Disclosure
Not applicable.
Item 16I. Disclosure Regarding Foreign Jurisdictions That Prevent Inspections
Not applicable.
Item 16J. Insider Trading Policies
Our Board of Directors has adopted an insider trading policy governing the purchase, sale, and other dispositions of our securities by officers, directors, employees and consultants of our group. Our insider trading policy is designated to promote compliance with applicable insider trading laws, rules and regulations. A copy of our insider trading policy is attached as Exhibit 11.2 to this annual report.
Item 16K. Cybersecurity
Cyber-attacks are prevalent in the internet and technology sector in which we operate. Supervised by the audit committee, our experienced management team is responsible for identifying, assessing and mitigating cybersecurity risks. Our overall approach aims to address cybersecurity risks collaboratively and through a cross-function approach as part of our broader risk management process, with a particular focus on safeguarding the confidentiality of end-user information with which we have been entrusted. This involves identifying, preventing, and mitigating cybersecurity threats, as well as promptly and effectively responding to any cybersecurity incidents that may arise.
We employ a variety of strategies and measures to identify, assess and mitigate cybersecurity risks. Cybersecurity is the shared responsibility of our Security team, Global IT and various product teams. Our Security team promulgates security and data protection standards in the form of our Security Policy and related documents. Global IT maintains our network infrastructure, manages our hosting providers and supervises use of third-party information systems in accordance with our security standards. Our product teams design and operate software applications in accordance with our standards, each maintaining a “security champion” as point of contact for security related topics. For example:
a. Development Practices: Our Security team promulgates a Product Security Standard and related guidelines under our Security Policy. Product teams are expected to adhere to the standard by conducting the required security reviews by security champions, as well as automated scanning and product monitoring. The standard also provides instructions on secure development best practices and the implementation of security requirements in our software applications.
b. Infrastructure Security: Our Security team promulgates an Information Security Standard under our Security Policy. Global IT and other stakeholders are expected to implement the standard’s requirements relating to network access controls, password and authentication, and endpoint security. The standard also generally requires that the third-party collocation centers we use have a valid ISO 27001 certificate and that our servers are placed in special access zones.
c. Security Audits: The Security team’s security engineers conduct periodic audits of significant new and changed infrastructure elements, as well as risk assessments of new third-party service providers. We have a security-risk exception process where minor risks can be accepted by security team members and bigger risks require a business owner's approval. Security exceptions are regularly monitored and reviewed at least quarterly by the Security team. We have not engaged assessors, consultants, auditors, or other third parties in connection with any such processes.
d. Penetration Testing: Our Security team conducts penetration testing of systems and leverages external resources, including retaining a security consultant and maintaining an active bug bounty program which encourages white hat hackers to identify and report to us security vulnerabilities in our systems.
e. Security Training: Our Security team periodically provides security awareness training to our employees, educating them about common cybersecurity risks, phishing attacks, social engineering tactics, and safe online practices. Select staff and team members are also provided incident response training to educate them on the proper procedures for handling security incidents when they occur.
Despite the measures we have taken to protect our systems, our systems have in some cases been breached in the past and we cannot guarantee that, despite our reasonable efforts, they will not be breached again in the future.
Board Oversight
Pursuant to its charter, our audit committee has been delegated responsibility for discussing risk assessment and risk management with our management, as well as the actions management has taken to limit, monitor or control risk exposures, including with respect to cybersecurity threats. Management presents risk management issues to the audit committee on a quarterly basis. The audit committee is responsible for ensuring that our management has processes in place designed to identify and evaluate cybersecurity risks to which the company is exposed and implement processes and programs to manage cybersecurity risks and mitigate cybersecurity incidents. Our Board of Directors also includes additional directors with extensive experience in the internet and technology sector. See “Item 6. Directors, Senior Management and Employees.” For example, Director James Liu sits on our audit committee and has over 20 years of experience in internet and technologies companies and holds a bachelor’s degree in computer science from Shanghai Jiao Tong University. The work of the audit committee is reported to our board on a quarterly basis.
Management’s Role
Management is responsible for identifying, considering and assessing material cybersecurity risks on an ongoing basis, establishing processes to ensure that such potential cybersecurity risk exposures are monitored, and putting in place appropriate mitigation measures. The Opera Risk Management Standard describes our approach to identifying, assessing, and mitigating risks in general, including cybersecurity risks in particular. Our management works collaboratively to implement risk management standards and reports prompt and timely information to our audit committee regarding any cybersecurity incident that meets established reporting thresholds, as well as ongoing updates regarding any such incident when appropriate.
Our VP of Group IT, Mr. Krystian Zubel, owns Opera’s security program and is appointed as the risk owner for cybersecurity, providing periodic reporting on cybersecurity topics to management. Mr. Zubel manages our Global IT and Security teams and has 20 years of industry experience, as well as a master’s degree in computer science specializing in computer networks and systems from Wroclaw University of Science and Technology. Mr. Zubel has been managing Opera IT projects related to critical infrastructure at Opera for over a decade and reports directly to our Co-CEO, Mr. Lin Song, who sits on our Board of Directors, has a bachelor’s degree in information systems from the University of International Business and Economics, and has worked for our group for over 20 years serving in various technical and leadership roles. Mr. Zubel works closely with other members of our management team on cybersecurity issues, including in particular our EVP of Browsers, Mr. Krystian Kolondra. Mr. Kolondra has worked at Opera for over 18 years and has a master's degree in computer sciences from the University of Wroclaw.
Material Incidents
Cybersecurity incidents, as well as data breaches, are reported in our internal ticketing system and handled in accordance with our Incident Management Procedure. In accordance with the procedure, incidents must be promptly classified and mitigated by the incident owner based on severity. Relevant product and IT teams, together with the Security team, conduct a post-mortem analysis of all incidents to document mitigation, lessons learned, and future actions to prevent a recurrence. Incidents categorized as critical (including any personal data breach or incidents with potentially material effects) are reported within 12 hours of classification to our Co-CEO, General Counsel and CFO for materiality assessment and, where appropriate, reporting to our audit committee.
Over the past financial year, cybersecurity threats or incidents have not materially affected or are not reasonably likely to affect us, including our business strategy, results of operations or financial condition, but we cannot provide assurance that we will not be materially affected by any such risks, threats or incidents in the future.
PART III
Item 17. Financial Statements
We have elected to provide financial statements pursuant to Item 18.
Item 18. Financial Statements
The consolidated financial statements of Opera Limited are included at the end of this annual report.
Item 19. Exhibits
|
|
|
Exhibit Number |
|
Description of Document |
1.1 |
|
Second Amended and Restated Memorandum and Articles of Association of the Registrant, as currently in effect (incorporated by reference to Exhibit 3.2 from our registration statement on Amendment No. 1 to Form F-1 (File No. 333-226017) filed publicly with the SEC on July 13, 2018) |
2.1 |
|
Form of Registrant’s Specimen American Depositary Receipt (incorporated by reference from our Form 424B3 (File No. 333-226171) filed publicly with the SEC on December 4, 2024) |
2.2 |
|
Registrant’s Specimen Certificate for Ordinary Shares (incorporated by reference to Exhibit 4.2 from our registration statement on Form F-1 (File No. 333-226017) filed publicly with the SEC on June 29, 2018) |
2.3 |
|
Form of Deposit Agreement among the registrant, the depositary and owners and holders of the ADSs (incorporated by reference to Exhibit 4.3 from our registration statement on Amendment No. 2 to Form F-1 (File No. 333-226017) filed publicly with the SEC on July 23, 2018) |
2.4 |
|
Description of the Rights of Securities Registered under Section 12 of the Securities Act (incorporated herein by reference to Exhibit 2.4 to the Company’s annual report on Form 20-F (File No. 001-38588) filed publicly with the SEC on June 11, 2021, and as amended on June 28, 2021) |
4.1 |
|
Amended and Restated Share Incentive Plan, dated as of January 10, 2019, as currently in effect (incorporated by reference to Exhibit 10.1 from our registration statement on Form S-8 (File No. 333-229285) filed publicly with the SEC on January 10, 2019) |
4.2 |
|
Form of Indemnification Agreement between the Registrant and each of the directors and executive officers of the Registrant (incorporated by reference to Exhibit 10.2 from our registration statement on Form F-1 (File No. 333-226017) filed publicly with the SEC on June 29, 2018) |
4.3 |
|
Form of Employment Agreement between the Registrant and each executive officer of the Registrant (incorporated by reference to Exhibit 10.3 from our registration statement on Amendment No. 1 to Form F-1 (File No. 333-226017) filed publicly with the SEC on July 13, 2018) |
4.4 |
|
Form of Registration Rights Agreement (incorporated by reference to Exhibit 10.11 from our registration statement on Amendment No. 1 to Form F-1 (File No. 333-226017) filed publicly with the SEC on July 13, 2018) |
4.5 |
|
Amendment and Restatement Agreement to the Google Distribution Agreement, dated as of December 15, 2021, by and between Opera Norway AS (formerly known as Opera Software AS) and Google Ireland Limited (certain provisions of this exhibit have been omitted pursuant to Instruction No. 4 to Exhibits in Form 20-F) (incorporated herein by reference to Exhibit 4.4 to the Company’s annual report on Form 20-F (File No. 001-38588) filed publicly with the SEC on April 26, 2022 and as amended on June 28, 2022) |
8.1* |
|
List of Significant Subsidiaries of the Registrant |
11.1 |
|
Code of Business Conduct and Ethics of the Registrant (incorporated herein by reference to Exhibit 11.1 to the Company’s annual report on Form 20-F (File No. 001-38588) for the year ended December 31, 2023, filed with the SEC on April 24, 2024) |
11.2* |
|
Statement of Policies Governing Material, Non-Public Information and the Prevention of Insider Trading of the Registrant |
12.1* |
|
Certification by the Chief Executive Officer pursuant to Section 302 of the Sarbanes-Oxley Act of 2002 |
12.2* |
|
Certification by the Chief Financial Officer pursuant to Section 302 of the Sarbanes-Oxley Act of 2002 |
13.1** |
|
Certification by the Chief Executive Officer pursuant to Section 906 of the Sarbanes-Oxley Act of 2002 |
13.2** |
|
Certification by the Chief Financial Officer pursuant to Section 906 of the Sarbanes-Oxley Act of 2002 |
15.1* |
|
Consent of KPMG AS |
_______________
* Filed with this annual report on Form 20-F.
** Furnished with this annual report on Form 20-F.
SIGNATURES
The registrant hereby certifies that it meets all of the requirements for filing on Form 20-F and that it has duly caused and authorized the undersigned to sign this annual report on its behalf.
|
|
|
|
Opera Limited |
|
|
|
Date: April 10, 2025 |
By: |
/s/ James Yahui Zhou |
|
Name: |
James Yahui Zhou |
|
Title: |
Chairman of the Board and Chief Executive Officer |
INDEX TO CONSOLIDATED FINANCIAL STATEMENTS
Report of Independent Registered Public Accounting Firm
To the Shareholders and Board of Directors of Opera Limited:
Opinion on the Consolidated Financial Statements
We have audited the accompanying consolidated statements of financial position of Opera Limited and subsidiaries (the Company) as of December 31, 2024, and 2023, the related consolidated statements of operations, comprehensive income, changes in equity, and cash flows for each of the years in the three-year period ended December 31, 2024, and the related notes (collectively, the consolidated financial statements). In our opinion, the consolidated financial statements present fairly, in all material respects, the financial position of the Company as of December 31, 2024, and 2023, and the results of its operations and its cash flows for each of the years in the three-year period ended December 31, 2024, in conformity with IFRS Accounting Standards as issued by the International Accounting Standards Board (IASB).
We also have audited, in accordance with the standards of the Public Company Accounting Oversight Board (United States) (PCAOB), the Company’s internal control over financial reporting as of December 31, 2024, based on criteria established in Internal Control – Integrated Framework (2013) issued by the Committee of Sponsoring Organizations of the Treadway Commission, and our report dated April 10, 2025 expressed an adverse opinion on the effectiveness of the Company’s internal control over financial reporting.
Basis for Opinion
These consolidated financial statements are the responsibility of the Company’s management. Our responsibility is to express an opinion on these consolidated financial statements based on our audits. We are a public accounting firm registered with the PCAOB and are required to be independent with respect to the Company in accordance with the U.S. federal securities laws and the applicable rules and regulations of the Securities and Exchange Commission and the PCAOB.
We conducted our audits in accordance with the standards of the PCAOB. Those standards require that we plan and perform the audit to obtain reasonable assurance about whether the consolidated financial statements are free of material misstatement, whether due to error or fraud. Our audits included performing procedures to assess the risks of material misstatement of the consolidated financial statements, whether due to error or fraud, and performing procedures that respond to those risks. Such procedures included examining, on a test basis, evidence regarding the amounts and disclosures in the consolidated financial statements. Our audits also included evaluating the accounting principles used and significant estimates made by management, as well as evaluating the overall presentation of the consolidated financial statements. We believe that our audits provide a reasonable basis for our opinion.
Critical Audit Matter
The critical audit matter communicated below is a matter arising from the current period audit of the consolidated financial statements that was communicated or required to be communicated to the audit committee and that: (1) relates to accounts or disclosures that are material to the consolidated financial statements and (2) involved our especially challenging, subjective, or complex judgments. The communication of a critical audit matter does not alter in any way our opinion on the consolidated financial statements, taken as a whole, and we are not, by communicating the critical audit matter below, providing separate opinions on the critical audit matter or on the accounts or disclosures to which they relate.
Valuation of the Investment in OPay
As discussed in Note 11 to the consolidated financial statements, the Company’s investment in OPay Limited (OPay) shares was valued at $258.3 million at December 31, 2024. The company holds both ordinary and preferred shares in OPay, and the fair values of such shares were estimated using a probability-weighted expected return model (PWERM). In this model, the fair values of the shares were estimated based on the probability-weighted present value of expected future investment returns under various outcomes for OPay. The probability-weighted future investment returns were discounted using an estimated cost of equity (discount rate). Because OPay is a private company, a discount for lack of marketability (DLOM) was applied. In addition, the probability-weighted present value of expected future investment returns in the PWERM valuation was reconciled to an estimate of the overall equity value of OPay based on a discounted cash flow analysis (DCF).
We identified the valuation of the investment in OPay as a critical audit matter. Significant auditor judgment was required to evaluate certain assumptions used in the PWERM valuation, including the future equity value, timing, and probability of each of the future outcomes, the discount rate applied in the model, and the DLOM. In addition, significant auditor judgment was required to evaluate certain assumptions used in the DCF, specifically the projected revenue growth rate, the long-term growth rate, and the discount rate. The audit effort associated with the valuation also required specialized skills and knowledge.
The following are the primary procedures we performed to address this critical audit matter. We performed sensitivity analyses over the assumptions used to determine the fair value of the investment to determine the impact of changes in those assumptions on the fair value. We evaluated the reasonableness of the future equity value, timing, and probability of each of the future outcomes via comparison with OPay’s objectives and strategies, memorandum and articles of association, the shareholders’ agreement, and relevant industry, regulatory, and economic factors. In addition, we evaluated the PWERM valuation by comparing it to the value derived from management’s DCF. We evaluated the reasonableness of the Company’s projected revenue growth rate in the DCF by comparing it to publicly available industry reports and market data. We also compared the Company’s historical revenue forecasts to actual results to assess the Company’s ability to accurately forecast.
We involved valuation professionals with specialized skills and knowledge, who assisted in:
• evaluating the reasonableness of the DLOM by comparing the Company’s assumption to publicly available restricted stock studies and pre-IPO studies
• developing an independent range for the discount rates using publicly available market data and comparing it to the Company’s assumptions used in the PWERM valuation and DCF
• developing an independent range for the long-term growth rate based on Valuation Services Technical Committee (“VSTC”) guidelines and an H-model and comparing it to the Company’s assumption.
/s/ KPMG AS
We have served as the Company’s and its predecessor’s auditor since 2000.
Oslo, Norway
April 10, 2025
Opera Limited
Consolidated Statement of Operations
(In thousands, except per share amounts)
|
|
|
|
|
|
|
|
|
|
|
|
|
|
|
|
|
|
|
Year Ended December 31, |
|
|
|
Notes |
|
2022 |
|
|
2023 |
|
|
2024 |
|
Revenue |
|
3 |
|
$ |
331,037 |
|
|
$ |
396,827 |
|
|
$ |
480,648 |
|
Other operating income |
|
|
|
|
469 |
|
|
|
666 |
|
|
|
2,367 |
|
Operating expenses: |
|
|
|
|
|
|
|
|
|
|
|
Technology and platform fees |
|
|
|
|
(4,104 |
) |
|
|
(3,145 |
) |
|
|
(10,010 |
) |
Content cost |
|
|
|
|
(3,834 |
) |
|
|
(4,297 |
) |
|
|
(3,891 |
) |
Cost of inventory sold |
|
|
|
|
(46,650 |
) |
|
|
(85,808 |
) |
|
|
(118,658 |
) |
Personnel expenses, including share-based compensation |
|
4 |
|
|
(74,588 |
) |
|
|
(82,750 |
) |
|
|
(79,658 |
) |
Marketing and distribution expenses |
|
|
|
|
(114,988 |
) |
|
|
(109,947 |
) |
|
|
(131,951 |
) |
Credit loss expense |
|
12 |
|
|
(1,387 |
) |
|
|
(3,967 |
) |
|
|
784 |
|
Depreciation and amortization |
|
9, 10 |
|
|
(13,939 |
) |
|
|
(13,165 |
) |
|
|
(15,582 |
) |
Impairment of non-financial assets |
|
10 |
|
|
(3,194 |
) |
|
|
(681 |
) |
|
|
(113 |
) |
Other operating expenses |
|
5 |
|
|
(27,015 |
) |
|
|
(30,842 |
) |
|
|
(31,674 |
) |
Total operating expenses |
|
|
|
|
(289,699 |
) |
|
|
(334,603 |
) |
|
|
(390,753 |
) |
Operating profit |
|
|
|
|
41,808 |
|
|
|
62,890 |
|
|
|
92,262 |
|
Share of net loss of equity-accounted investees |
|
11 |
|
|
(6 |
) |
|
|
— |
|
|
|
(2 |
) |
Fair value gain on long-term investments |
|
11 |
|
|
1,500 |
|
|
|
89,838 |
|
|
|
5,000 |
|
Net finance income (expense): |
|
|
|
|
|
|
|
|
|
|
|
Finance income |
|
6 |
|
|
21,454 |
|
|
|
8,876 |
|
|
|
3,577 |
|
Finance expense |
|
6 |
|
|
(39,729 |
) |
|
|
(644 |
) |
|
|
(586 |
) |
Foreign exchange gain (loss) |
|
6 |
|
|
(1,157 |
) |
|
|
(963 |
) |
|
|
(1,839 |
) |
Net finance income (expense) |
|
|
|
|
(19,432 |
) |
|
|
7,269 |
|
|
|
1,152 |
|
Income before income taxes |
|
|
|
|
23,870 |
|
|
|
159,997 |
|
|
|
98,412 |
|
Income tax expense |
|
7 |
|
|
(8,835 |
) |
|
|
(6,697 |
) |
|
|
(17,642 |
) |
Net income attributable to Opera shareholders |
|
|
|
$ |
15,035 |
|
|
$ |
153,301 |
|
|
$ |
80,771 |
|
|
|
|
|
|
|
|
|
|
|
|
|
Earnings per share: |
|
|
|
|
|
|
|
|
|
|
|
Basic |
|
8 |
|
$ |
0.14 |
|
|
$ |
1.72 |
|
|
$ |
0.91 |
|
Diluted |
|
8 |
|
$ |
0.14 |
|
|
$ |
1.69 |
|
|
$ |
0.90 |
|
The accompanying notes are an integral part of the consolidated financial statements.
Opera Limited
Consolidated Statement of Comprehensive Income
(In thousands)
|
|
|
|
|
|
|
|
|
|
|
|
|
|
|
|
|
|
|
Year Ended December 31, |
|
|
|
Notes |
|
2022 |
|
|
2023 |
|
|
2024 |
|
Net income |
|
|
|
$ |
15,035 |
|
|
$ |
153,301 |
|
|
$ |
80,771 |
|
Other comprehensive income (loss): |
|
|
|
|
|
|
|
|
|
|
|
Items that are or may be reclassified to the Statement of Operations, (net of tax): |
|
|
|
|
|
|
|
|
|
|
|
Exchange differences on translation of foreign operations |
|
|
|
|
(3,477 |
) |
|
|
(742 |
) |
|
|
(811 |
) |
Reclassification of exchange differences on loss of control |
|
|
|
|
(96 |
) |
|
|
— |
|
|
|
— |
|
Reclassification of share of other comprehensive loss of equity-accounted investees |
|
|
|
|
708 |
|
|
|
— |
|
|
|
— |
|
Total other comprehensive income (loss) |
|
|
|
|
(2,865 |
) |
|
|
(742 |
) |
|
|
(811 |
) |
Total comprehensive income attributable to Opera shareholders |
|
|
|
$ |
12,170 |
|
|
$ |
152,559 |
|
|
$ |
79,960 |
|
The accompanying notes are an integral part of the consolidated financial statements.
Opera Limited
Consolidated Statement of Financial Position
(In thousands)
|
|
|
|
|
|
|
|
|
|
|
|
|
|
|
As of December 31, |
|
|
|
Notes |
|
2023 |
|
|
2024 |
|
Assets: |
|
|
|
|
|
|
|
|
Property and equipment |
|
9 |
|
$ |
16,074 |
|
|
$ |
34,058 |
|
Goodwill |
|
10 |
|
|
429,856 |
|
|
|
429,742 |
|
Intangible assets |
|
10 |
|
|
99,070 |
|
|
|
97,509 |
|
Investment in OPay |
|
11 |
|
|
253,300 |
|
|
|
258,300 |
|
Equity-accounted investments |
|
11 |
|
|
— |
|
|
|
1,248 |
|
Other non-current investments and financial assets |
|
11, 15 |
|
|
3,049 |
|
|
|
1,760 |
|
Deferred tax assets |
|
7 |
|
|
1,133 |
|
|
|
1,063 |
|
Total non-current assets |
|
|
|
|
802,482 |
|
|
|
823,681 |
|
Trade receivables |
|
12 |
|
|
69,382 |
|
|
|
92,823 |
|
Current receivables from sale of investments |
|
12 |
|
|
32,797 |
|
|
|
— |
|
Other current receivables |
|
12 |
|
|
7,760 |
|
|
|
4,560 |
|
Cash and cash equivalents |
|
15 |
|
|
93,863 |
|
|
|
126,797 |
|
Other current assets |
|
10 |
|
|
4,660 |
|
|
|
7,724 |
|
Total current assets |
|
|
|
|
208,461 |
|
|
|
231,904 |
|
Total assets |
|
|
|
$ |
1,010,943 |
|
|
$ |
1,055,585 |
|
|
|
|
|
|
|
|
|
|
Equity: |
|
|
|
|
|
|
|
|
Share capital |
|
1 |
|
$ |
18 |
|
|
$ |
18 |
|
Additional paid-in capital |
|
|
|
|
717,610 |
|
|
|
647,212 |
|
Treasury shares |
|
16 |
|
|
(238,815 |
) |
|
|
(238,815 |
) |
Retained earnings |
|
|
|
|
445,164 |
|
|
|
536,623 |
|
Foreign currency translation reserve |
|
|
|
|
(4,127 |
) |
|
|
(4,938 |
) |
Total equity attributable to Opera shareholders |
|
|
|
|
919,850 |
|
|
|
940,100 |
|
Liabilities: |
|
|
|
|
|
|
|
|
Non-current lease liabilities |
|
13 |
|
|
6,776 |
|
|
|
5,631 |
|
Deferred tax liabilities |
|
7 |
|
|
2,813 |
|
|
|
8,689 |
|
Other non-current liabilities |
|
|
|
|
94 |
|
|
|
71 |
|
Total non-current liabilities |
|
|
|
|
9,682 |
|
|
|
14,391 |
|
Trade and other payables |
|
14 |
|
|
52,247 |
|
|
|
75,285 |
|
Current lease liabilities |
|
13 |
|
|
3,770 |
|
|
|
3,955 |
|
Income tax payable |
|
|
|
|
1,838 |
|
|
|
3,190 |
|
Deferred revenue |
|
3 |
|
|
10,272 |
|
|
|
5,441 |
|
Other current liabilities |
|
14 |
|
|
13,285 |
|
|
|
13,222 |
|
Total current liabilities |
|
|
|
|
81,411 |
|
|
|
101,093 |
|
Total liabilities |
|
|
|
|
91,093 |
|
|
|
115,484 |
|
Total equity and liabilities |
|
|
|
$ |
1,010,943 |
|
|
$ |
1,055,585 |
|
The accompanying notes are an integral part of the consolidated financial statements.
Opera Limited
Consolidated Statement of Changes in Equity
(In thousands, except number of shares)
|
|
|
|
|
|
|
|
|
|
|
|
|
|
|
|
|
|
|
|
|
|
|
|
|
|
|
|
|
|
|
|
|
Notes |
|
Number of shares outstanding |
|
|
Share capital |
|
|
Additional paid-in capital |
|
|
Treasury shares |
|
|
Retained earnings |
|
|
Foreign currency translation reserve |
|
|
Total equity attributable to Opera shareholders |
|
As of January 1, 2022 |
|
|
|
|
115,145,866 |
|
|
$ |
24 |
|
|
$ |
824,832 |
|
|
$ |
(60,453 |
) |
|
$ |
249,155 |
|
|
$ |
(520 |
) |
|
$ |
1,013,039 |
|
Net income |
|
|
|
|
— |
|
|
|
— |
|
|
|
— |
|
|
|
— |
|
|
|
15,035 |
|
|
|
— |
|
|
|
15,035 |
|
Other comprehensive loss |
|
|
|
|
— |
|
|
|
— |
|
|
|
— |
|
|
|
— |
|
|
|
— |
|
|
|
(2,865 |
) |
|
|
(2,865 |
) |
Share-based compensation |
|
4 |
|
|
— |
|
|
|
— |
|
|
|
— |
|
|
|
— |
|
|
|
9,073 |
|
|
|
— |
|
|
|
9,073 |
|
Issuance of shares upon exercise of RSUs |
|
4 |
|
|
798,750 |
|
|
|
— |
|
|
|
— |
|
|
|
— |
|
|
|
— |
|
|
|
— |
|
|
|
— |
|
Share repurchases |
|
16 |
|
|
(26,729,495 |
) |
|
|
(6 |
) |
|
|
— |
|
|
|
(146,063 |
) |
|
|
— |
|
|
|
— |
|
|
|
(146,068 |
) |
As of December 31, 2022 |
|
|
|
|
89,215,121 |
|
|
|
18 |
|
|
|
824,832 |
|
|
|
(206,514 |
) |
|
|
273,262 |
|
|
|
(3,385 |
) |
|
|
888,213 |
|
Net income |
|
|
|
|
— |
|
|
|
— |
|
|
|
— |
|
|
|
— |
|
|
|
153,301 |
|
|
|
— |
|
|
|
153,301 |
|
Other comprehensive loss |
|
|
|
|
— |
|
|
|
— |
|
|
|
— |
|
|
|
— |
|
|
|
— |
|
|
|
(742 |
) |
|
|
(742 |
) |
Share-based compensation |
|
4 |
|
|
— |
|
|
|
— |
|
|
|
— |
|
|
|
— |
|
|
|
18,600 |
|
|
|
— |
|
|
|
18,600 |
|
Issuance of shares upon exercise of RSUs and options |
|
4 |
|
|
1,068,509 |
|
|
|
— |
|
|
|
— |
|
|
|
394 |
|
|
|
— |
|
|
|
— |
|
|
|
394 |
|
Share repurchases |
|
16 |
|
|
(2,765,346 |
) |
|
|
— |
|
|
|
— |
|
|
|
(32,695 |
) |
|
|
— |
|
|
|
— |
|
|
|
(32,695 |
) |
Dividends |
|
16 |
|
|
— |
|
|
|
— |
|
|
|
(107,222 |
) |
|
|
— |
|
|
|
— |
|
|
|
— |
|
|
|
(107,222 |
) |
As of December 31, 2023 |
|
|
|
|
87,518,284 |
|
|
|
18 |
|
|
|
717,610 |
|
|
|
(238,815 |
) |
|
|
445,164 |
|
|
|
(4,127 |
) |
|
|
919,850 |
|
Net income |
|
|
|
|
— |
|
|
|
— |
|
|
|
— |
|
|
|
— |
|
|
|
80,771 |
|
|
|
— |
|
|
|
80,771 |
|
Other comprehensive loss |
|
|
|
|
— |
|
|
|
— |
|
|
|
— |
|
|
|
— |
|
|
|
— |
|
|
|
(811 |
) |
|
|
(811 |
) |
Share-based compensation |
|
4 |
|
|
— |
|
|
|
— |
|
|
|
— |
|
|
|
— |
|
|
|
10,689 |
|
|
|
— |
|
|
|
10,689 |
|
Issuance of shares upon exercise of RSUs |
|
4 |
|
|
961,870 |
|
|
|
— |
|
|
|
— |
|
|
|
— |
|
|
|
— |
|
|
|
— |
|
|
|
— |
|
Dividends |
|
16 |
|
|
— |
|
|
|
— |
|
|
|
(70,398 |
) |
|
|
— |
|
|
|
— |
|
|
|
— |
|
|
|
(70,398 |
) |
As of December 31, 2024 |
|
|
|
|
88,480,154 |
|
|
$ |
18 |
|
|
$ |
647,212 |
|
|
$ |
(238,815 |
) |
|
$ |
536,623 |
|
|
$ |
(4,938 |
) |
|
$ |
940,100 |
|
The accompanying notes are an integral part of the consolidated financial statements.
Opera Limited
Consolidated Statement of Cash Flows
(In thousands)
|
|
|
|
|
|
|
|
|
|
|
|
|
|
|
|
|
|
|
Year Ended December 31, |
|
|
|
Notes |
|
2022 |
|
|
2023 |
|
|
2024 |
|
Cash flows from operating activities: |
|
|
|
|
|
|
|
|
|
|
|
Income before income taxes |
|
|
|
$ |
23,870 |
|
|
$ |
159,997 |
|
|
$ |
98,412 |
|
Adjustments to reconcile income before income taxes to net cash flow from operating activities: |
|
|
|
|
|
|
|
|
|
|
|
Net finance (income) expense |
|
6 |
|
|
18,224 |
|
|
|
(7,269 |
) |
|
|
(1,152 |
) |
Fair value gain on long-term investments |
|
11 |
|
|
(1,500 |
) |
|
|
(89,838 |
) |
|
|
(5,000 |
) |
Share of net loss of equity-accounted investees |
|
11 |
|
|
6 |
|
|
|
— |
|
|
|
2 |
|
Impairment of non-financial assets |
|
10 |
|
|
3,194 |
|
|
|
681 |
|
|
|
113 |
|
Depreciation and amortization |
|
9, 10 |
|
|
13,939 |
|
|
|
13,165 |
|
|
|
15,582 |
|
Share-based compensation |
|
4 |
|
|
9,073 |
|
|
|
14,926 |
|
|
|
8,631 |
|
Other adjustments |
|
|
|
|
(452 |
) |
|
|
(255 |
) |
|
|
(66 |
) |
Changes in working capital: |
|
|
|
|
|
|
|
|
|
|
|
Trade and other receivables |
|
12 |
|
|
(19,299 |
) |
|
|
(17,956 |
) |
|
|
(20,199 |
) |
Other current assets |
|
|
|
|
4,253 |
|
|
|
(500 |
) |
|
|
(1,820 |
) |
Trade and other payables |
|
14 |
|
|
8,559 |
|
|
|
5,310 |
|
|
|
23,038 |
|
Deferred revenue |
|
3 |
|
|
(97 |
) |
|
|
9,277 |
|
|
|
(4,830 |
) |
Other liabilities |
|
14 |
|
|
3 |
|
|
|
1,158 |
|
|
|
(86 |
) |
Income taxes paid |
|
|
|
|
(3,111 |
) |
|
|
(5,937 |
) |
|
|
(7,649 |
) |
Net cash flow from operating activities |
|
|
|
|
56,662 |
|
|
|
82,761 |
|
|
|
104,977 |
|
Cash flows from investing activities: |
|
|
|
|
|
|
|
|
|
|
|
Purchase of equipment |
|
9 |
|
|
(3,187 |
) |
|
|
(1,873 |
) |
|
|
(23,344 |
) |
Purchase of intangible assets |
|
10 |
|
|
— |
|
|
|
(250 |
) |
|
|
— |
|
Development expenditure |
|
4, 10 |
|
|
(6,789 |
) |
|
|
(4,281 |
) |
|
|
(7,263 |
) |
Investment in an associate |
|
11 |
|
|
— |
|
|
|
— |
|
|
|
(1,250 |
) |
Sale of long-term investments |
|
11, 17 |
|
|
36,879 |
|
|
|
— |
|
|
|
1,333 |
|
Net sale of short-term investments |
|
16 |
|
|
16,178 |
|
|
|
23,414 |
|
|
|
— |
|
Interest received |
|
|
|
|
1,368 |
|
|
|
2,989 |
|
|
|
3,412 |
|
Net cash flow from (used in) investing activities |
|
|
|
|
44,450 |
|
|
|
19,999 |
|
|
|
(27,112 |
) |
Cash flows from financing activities: |
|
|
|
|
|
|
|
|
|
|
|
Share repurchases |
|
16 |
|
|
(146,068 |
) |
|
|
(32,695 |
) |
|
|
— |
|
Dividends paid |
|
16 |
|
|
— |
|
|
|
(23,105 |
) |
|
|
(37,435 |
) |
Proceeds from exercise of share options |
|
4 |
|
|
— |
|
|
|
394 |
|
|
|
— |
|
Repayment of borrowings |
|
|
|
|
(378 |
) |
|
|
(161 |
) |
|
|
— |
|
Payment of lease liabilities |
|
13 |
|
|
(3,837 |
) |
|
|
(3,907 |
) |
|
|
(4,181 |
) |
Interest paid |
|
|
|
|
(293 |
) |
|
|
(369 |
) |
|
|
(530 |
) |
Net cash flow used in financing activities |
|
|
|
|
(150,578 |
) |
|
|
(59,843 |
) |
|
|
(42,146 |
) |
Net change in cash and cash equivalents |
|
|
|
|
(49,465 |
) |
|
|
42,918 |
|
|
|
35,720 |
|
Cash and cash equivalents at beginning of period |
|
|
|
|
102,876 |
|
|
|
52,414 |
|
|
|
93,863 |
|
Effect of exchange rate changes on cash and cash equivalents |
|
|
|
|
(996 |
) |
|
|
(1,469 |
) |
|
|
(2,785 |
) |
Cash and cash equivalents at end of period |
|
15 |
|
$ |
52,414 |
|
|
$ |
93,863 |
|
|
$ |
126,797 |
|
The accompanying notes are an integral part of the consolidated financial statements.
Opera Limited
Notes to Consolidated Financial Statements
Note 1. Corporate Information and Group Structure
Opera is a user-centric and innovative software company focused on enabling the best possible internet browsing experience across all devices. People use the Opera browsers for their unique and secure features on their mobile phones and desktop computers. Opera generates revenue from selling advertising placements and when users of its web browsers make searches using the integrated search and address bar.
The chart below provides an overview of the corporate structure of the Opera group, comprising Opera Limited (the “Company” or the “Parent”) and its subsidiaries (collectively, “Opera” or the “Group”):

_______________
(1)0.01% is held by another Opera group entity.
(2)30% is held by a nominee shareholder.
In addition to the subsidiaries outlined above, Opera has minority investments in unconsolidated entities (see Note 11).
The Company’s chairman and chief executive officer, who has been identified as Opera’s chief operating decision maker, reviews operating results at the aggregate level of Opera as a whole, and therefore Opera has only one operating segment.
Opera Limited is an exempted company under the laws of the Cayman Islands. Its registered office is Maples Corporate Services Limited, PO Box 309, Ugland House, Grand Cayman, KY1- 1104, Cayman Islands. The address of the principal executive office is Vitaminveien 4, 0485 Oslo, Norway.
The Company has American depositary shares (“ADSs”) listed on the Nasdaq Global Select Market, trading under the “OPRA” ticker symbol. Following a two-to-one consolidation of ordinary shares in December 2024 and a concurrent change in the ratio of ordinary shares to ADSs, each ADS represents one ordinary share in the Company. All share counts and per share amounts in these consolidated financial statements have been retrospectively adjusted to reflect the share consolidation. As of December 31, 2024, the total number of ordinary shares in the Company authorized for issue was 250,000,000, of which 88,480,154 were outstanding. Each ordinary share has a par value of $0.0002.
Note 2. Accounting Policies, Judgments, and Estimation Uncertainty
Basis of Preparation
These consolidated financial statements have been prepared in accordance with IFRS Accounting Standards as issued by the International Accounting Standards Board (IASB). The Board of Directors of the Company authorized the consolidated financial statements for issue on April 10, 2025.
The consolidated financial statements have been prepared on a historical cost basis, except for the investments in OPay (see Note 11) and certain stablecoins (see Note 15), which are measured at estimated fair values. Fair value is the price that would be received to sell an asset or paid to transfer a liability in an orderly transaction between market participants at the measurement date, regardless of whether that price is directly observable or estimated using another valuation technique. In estimating the fair value of an asset or a liability, Opera considers the characteristics of the asset or liability if market participants would take those characteristics into account when pricing the asset or liability at the measurement date.
Except for the general accounting policies described below, Opera’s material accounting policies are described in the individual notes to the consolidated financial statements.
Basis of Consolidation
The consolidated financial statements comprise the financial statements of Opera Limited and entities it controls. Control is achieved when Opera is exposed, or has rights, to variable returns from its involvement with an investee and has the ability to affect those returns through its power over the investee. Generally, there is a presumption that a majority of voting rights results in control.
Aggregation of Income, Expenses, Assets, Liabilities and Cash Flows
Individually immaterial items of income, expenses, assets, liabilities and cash flows are aggregated in the primary statements, and presented using the label “other,” for example “other operating expenses.” Such aggregated line items, which may include items of dissimilar characteristics, are disaggregated in the notes to the consolidated financial statements when material.
Foreign Currencies
Items included in the financial statements of each of the Group’s entities are measured using the currency of the primary economic environment in which the entity operates (the “functional currency”). The consolidated financial statements are presented in U.S. dollars, which is the functional currency of the Parent. All amounts presented and disclosed in the primary financial statements and notes are rounded off to the nearest thousand except when otherwise indicated. Rounding differences may occur.
Foreign currency transactions are recognized at their respective functional currency spot rate at the date the transaction first qualifies for initial recognition. Monetary assets and liabilities denominated in foreign currencies are translated at the functional currency exchange rates at the reporting date. Gains or losses arising from settlement or translation of monetary items are recognized in the Statement of Operations as “Foreign exchange gain (loss).” Non-monetary items that are measured at historical cost in a foreign currency are translated using the exchange rates at the dates of the initial transactions.
The assets and liabilities of entities within the Group with functional currencies other than the U.S. dollar are translated into U.S. dollars using the currency exchange rates at the reporting date. Income and expense items are translated at average currency exchange rates for the respective period. The overall foreign currency impact from translating assets, liabilities, income, and expenses to U.S. dollars is recognized in the Statement of Comprehensive Income as “Exchange differences on translation of foreign operations.”
The financial statements of an entity whose functional currency is the currency of a hyperinflationary economy, will be restated for the changes in the general purchasing power of the local currency, using a general price index at the end of the reporting period, before translation into U.S. dollars and, as a result, will be stated in terms of the measuring unit current at the end of the reporting period. Several factors are considered when evaluating whether an economy is hyperinflationary, including the cumulative three-year inflation rate, and the degree to which the population’s behaviors and government policies are consistent with such a condition. In Nigeria, where O-Play Digital Services Ltd., a subsidiary, is operating with the Nigerian naira as its functional currency, the three-year cumulative inflation rate at the end of 2024 was 111% according to data from the National Bureau of Statistics. The World Economic Outlook report issued by the International Monetary Fund in October 2024 showed that the three-year cumulative inflation rate in Nigeria is forecasted to be 110% in 2025 and 91% in 2026. Other indicators for identifying hyperinflation were considered inconclusive with respect to the Nigerian economy. Based on significant judgment, taking into account fiscal and economic interventions currently expected to positively impact the Nigerian economy, Opera concluded that the Nigerian economy was not hyperinflationary in 2024.
Accounting Judgments and Estimation Uncertainty
The preparation of Opera’s consolidated financial statements requires management to exercise judgment and to make estimates and assumptions that affect the application of accounting policies and the reported amounts of income, expenses, assets and liabilities as well as the accompanying disclosures. Accounting estimates and assumptions, which are continuously reviewed, are based on historical experience and various other factors that are believed to be reasonable and appropriate under the circumstances. Uncertainty about these estimates and assumptions could result in outcomes that require a material adjustment to the carrying amount of assets or liabilities in future periods. Changes in estimates are recognized in the period in which the estimates are revised, if the revisions affect only that period, or in the period of the revisions and future periods if the revisions affect both current and future periods.
Listed below are the areas that involved a higher degree of judgment or complexity, and the items which are most likely to be materially adjusted due to the final outcomes deviating from estimates and assumptions made:
• Assessment of whether the Nigerian economy was hyperinflationary (see above).
• Determining whether product development activities meet the criteria for capitalization (see Note 4).
• Measurement of share-based compensation expense (see Note 4).
• Classification and fair value measurement of the investment in OPay (see Note 11).
New and Amended Accounting Standards
The accounting policies applied in the preparation of these consolidated financial statements are consistent with those applied in the preparation of the consolidated financial statements for the year ended December 31, 2023. Several amendments to IFRS Accounting Standards became effective for the first time in 2024, but these were either not applicable or had no material impact on the measurement, recognition, or presentation of items in Opera’s consolidated financial statements. Opera has not early adopted accounting standards or amendments to accounting standards that had a material impact on these consolidated financial statements.
New and Amended Accounting Standards Not Yet Effective
IFRS 18 Presentation and Disclosure in Financial Statements will replace IAS 1 Presentation of Financial Statements from the annual reporting period beginning on January 1, 2027. IFRS 18 introduces new requirements intended to (i) improve comparability of the financial performance of similar entities and (ii) provide more relevant information and transparency to users of financial statements. Based on a preliminary assessment of the new accounting standard, the following impacts on Opera’s consolidated financial statements are expected when the standard is adopted:
• In the Statement of Operations:
oEven though IFRS 18 will not impact the recognition or measurement of items in the financial statements and thus will have no impact on Opera’s net income, the new requirements for grouping items of income and expenses into the new operating, investing and financing categories will impact how operating profit is calculated and reported. In particular, foreign exchange gains and losses will be classified and presented in the same operating, investing or financing category as the items of income and expenses that gave rise to the foreign exchange differences. Alternatively, if classifying foreign exchange gains and losses this way will involve undue cost or effort, Opera is permitted to classify the aggregate amount of foreign exchange differences in the operating category.
oIFRS 18 requires a company to present expenses in the operating category in a way that provides the most useful structured summary of its expenses and allows some expenses to be classified by nature and others by function to the extent such mixed classification results in the most useful structured summary. Based on this new concept and requirement of a useful structured summary, costs directly related to the provision of goods or services for which Opera recognizes revenue will be classified and presented in the Statement of Operations as cost of revenue – a new line item that is expected to represent an aggregation of technology and platform fees, content cost, and cost of inventory sold, as currently presented. Other expenses will continue to be classified based on their nature.
oInterest income on cash deposits and other items of income and expenses from assets that generate returns individually and largely independently of Opera’s other resources will be classified and presented in the new investing category. On the other hand, interest expenses on lease liabilities will be classified and presented in the new financing category. These items are all currently presented as part of finance income and finance expense.
• The requirement to disclose material information remains unchanged, and consequently Opera does not expect there to be a significant change in the information that is currently disclosed in the financial statements. However, the way in which the information is grouped might change, and there will be new disclosures required for:
oAdjusted net income and adjusted EBITDA as management-defined performance measures;
othe nature of expenses currently presented separately that will be included in the new functional line item cost of revenue; and
ofor the first annual period of application of IFRS 18, a reconciliation for each line item in the Statement of Operations between the restated amounts presented by applying IFRS 18 and the amounts previously presented applying IAS 1.
• In the Statement of Cash Flows, cash flows from operating activities will be calculated with operating profit as the starting point.
None of the other new and amended accounting standards that are issued, but not yet effective, are expected to have a material impact on Opera’s consolidated financial statements when they are adopted in future periods.
Note 3. Revenue
Accounting Policies
Revenue is income arising in the course of Opera’s ordinary activities. Opera generates revenue from the provision of advertising, search, technology licensing and related services. Revenue from contracts with customers is recognized when control of the goods or services is transferred to the customer at an amount that reflects the consideration to which Opera expects to be entitled in exchange for those goods or services. Crypto assets received from a customer as consideration are measured at fair value.
Advertising
Advertising revenue is generated by delivering advertising in Opera’s PC and mobile browsers, including predefined bookmarks (“Speed Dials”), in Opera News, and on properties of advertising partners. Advertising revenue is recognized when the advertising service is delivered based on the specific terms of the underlying contract. Revenue from impression-based ads is recognized in the contracted period in which the impressions are delivered. Impressions are considered delivered when an ad is displayed to users. Revenue from the delivery of action-based ads is recognized in the period in which a user takes the action the marketer contracted for. In addition to income from impression and action-based ads, advertising revenue also includes income from contracts with customers where the income is generated from activities of users of Opera’s products and services, except for web searches.
For ads placed on properties of network partners, Opera is the principal because Opera controls the advertising inventory before it is transferred to its customers. Opera’s control is evidenced by its sole ability to monetize the advertising inventory before it is transferred to its customers and is further supported by Opera being primarily responsible to its customers and having a level of discretion in establishing pricing. As the principal, advertising revenue for ads placed on properties of network partners are reported on a gross basis, that is, the amounts billed to Opera’s customers are recorded as revenue, and amounts paid to the partners are recorded as cost of inventory sold.
Search
When users of Opera’s PC and mobile browsers use the built-in combined address and search bar, and other browser features, to conduct web searches using search engines of partners such as Google and Yandex, Opera is entitled to a share of the partners’ advertising revenue if the users click on ads on the search results pages. The contractually agreed amount is recognized as revenue in the period the qualified search occurs. Search revenue also includes any fixed or variable fees received for customizations and integrations of search engines in the browsers, which are recognized linearly over the contractually agreed period during which Opera must maintain those customizations and integrations, or activities otherwise growing our traffic to search partners.
Technology licensing and other revenue
Revenue from the sale of licenses to GameMaker, a platform for developing games, is recognized ratably over the license periods.
Revenue from the provision of on-demand cloud computing resources is recognized based on the quantity of compute instances delivered and is recognized in the period the resources are made available to the customer.
Income from the provision of distinct engineering services is recognized as revenue during the development period in line with the degree of completion.
Disaggregation of Revenue
The following table presents revenue disaggregated by type (in thousands):
|
|
|
|
|
|
|
|
|
|
|
|
|
|
|
Year ended December 31, |
|
|
|
2022 |
|
|
2023 |
|
|
2024 |
|
Advertising |
|
$ |
187,434 |
|
|
$ |
230,980 |
|
|
$ |
293,448 |
|
Search |
|
|
140,162 |
|
|
|
162,168 |
|
|
|
186,273 |
|
Technology licensing and other revenue |
|
|
3,441 |
|
|
|
3,679 |
|
|
|
927 |
|
Total revenue |
|
$ |
331,037 |
|
|
$ |
396,827 |
|
|
$ |
480,648 |
|
The table below presents the revenue by customer location based on where the customer has its primary geographical presence, which usually is where its parent company is incorporated, but which is not necessarily an indication of where revenue-generating activities occur because the users of Opera’s products and services are located worldwide (in thousands):
|
|
|
|
|
|
|
|
|
|
|
|
|
|
|
Year ended December 31, |
|
|
|
2022 |
|
|
2023 |
|
|
2024 |
|
United States |
|
$ |
172,288 |
|
|
$ |
203,056 |
|
|
$ |
256,009 |
|
Singapore |
|
|
28,876 |
|
|
|
41,181 |
|
|
|
46,659 |
|
Nigeria |
|
|
10,888 |
|
|
|
20,636 |
|
|
|
19,706 |
|
Russia |
|
|
20,288 |
|
|
|
34,976 |
|
|
|
16,984 |
|
Other locations |
|
|
98,696 |
|
|
|
96,978 |
|
|
|
141,290 |
|
Total revenue |
|
$ |
331,037 |
|
|
$ |
396,827 |
|
|
$ |
480,648 |
|
Revenue from one customer of search and advertising services amounted to more than ten percent of total revenue, as shown below (in thousands):
|
|
|
|
|
|
|
|
|
|
|
|
|
|
|
Year ended December 31, |
|
|
|
2022 |
|
|
2023 |
|
|
2024 |
|
Customer group 1 |
|
$ |
148,481 |
|
|
$ |
168,428 |
|
|
$ |
193,294 |
|
Remaining Performance Obligations
Remaining performance obligations represent Opera’s contractual commitments to deliver goods or services to customers that have not yet been fulfilled. The following table shows the amounts of remaining performance obligations under fixed-price long-term contracts, and the expected timing for recognition of revenue relative to the end of the reporting period (in thousands):
|
|
|
|
|
|
|
|
|
|
|
As of December 31, |
|
|
|
2023 |
|
|
2024 |
|
In the first year |
|
$ |
8,773 |
|
|
$ |
10,273 |
|
In the second year |
|
|
10,273 |
|
|
|
10,068 |
|
In the third year |
|
|
2,568 |
|
|
|
10,000 |
|
In the fourth year |
|
|
— |
|
|
|
10,000 |
|
In the fifth year |
|
|
— |
|
|
|
2,500 |
|
Total remaining performance obligations |
|
$ |
21,614 |
|
|
$ |
42,841 |
|
Deferred Revenue
Deferred revenue represents short-term advances from customers of search and advertising services where the performance obligations are due to be fully satisfied during the next reporting period. The table below shows the movements in the balance of deferred revenue (in thousands):
|
|
|
|
|
|
|
|
|
|
|
Year ended December 31, |
|
|
|
2023 |
|
|
2024 |
|
Deferred revenue as of January 1 |
|
$ |
995 |
|
|
$ |
10,272 |
|
Deferred during the year |
|
|
10,272 |
|
|
|
5,441 |
|
Recognized as revenue during the year |
|
|
(995 |
) |
|
|
(10,272 |
) |
Deferred revenue as of December 31 |
|
$ |
10,272 |
|
|
$ |
5,441 |
|
Note 4. Personnel Expenses, Including Share-based Compensation
Accounting Policies
Personnel expenses, other than share-based compensation, are recognized at the undiscounted amount due to the employees or the de-facto employees when they have rendered services to Opera or when the liability otherwise arises. Contributions to publicly or privately administered pension insurance plans are recognized as personnel expenses when they are due. Opera has no further payment obligations related to pensions after the contributions have been paid.
Equity awards granted to employees under Opera’s share incentive plan are classified as equity-settled transactions because the employees will receive equity instruments in the Company when the awards are exercised. Similarly, equity awards granted to Opera employees by Kunlun Tech Co., Ltd. ("Kunlun"), the majority shareholder of Opera, are also classified as equity-settled transactions. Opera does not have any obligation to settle the awards granted by Kunlun and these awards do not lead to dilution for Opera shareholders because the employees receive shares in Kunlun when the awards are exercised.
The cost of equity-settled transactions is determined by the fair value at the date when the grant is made using an appropriate valuation technique. Service and non-market performance conditions are not taken into account when determining the grant date fair value of awards, but the likelihood of the conditions being met is assessed as part of Opera’s best estimate of the number of equity instruments that will ultimately vest. The cost of equity-settled transactions is recognized as a personnel expense, together with a corresponding increase in equity, over the period in which the service and, where applicable, the performance conditions are fulfilled (the “vesting period”). The cumulative expense recognized for equity-settled transactions at each reporting date until the vesting date reflects the extent to which the vesting period has expired and Opera’s best estimate of the number of equity instruments that will ultimately vest, such that the amount ultimately recognized is based on the number of awards that meet the service and performance conditions at the vesting date.
For social security contributions payable in connection with equity awards granted by Opera, a liability is recognized over the vesting period based on the fair values of the awards at the reporting date, taking into account awards that are expected to be exercised. The related expense is allocated over the period from the grant date to the end of the vesting period and is presented as part of the share-based compensation expense. From the end of the vesting period to the date of exercise, the liability is adjusted by reference to the current market value of the equity instruments.
Research and development expenditure predominantly consists of compensation to engineering and technical employees. Compensation costs related to research activities are expensed when incurred while compensation costs during the development phase of an internal project to develop an intangible asset are capitalized as part of the cost of the intangible asset when Opera can demonstrate:
• the technical feasibility of completing the intangible asset so that it will be available for use or sale;
• its intention to complete the intangible asset and use or sell it;
• its ability to use or sell the intangible asset;
• how the intangible asset will generate probable future economic benefits;
• the availability of adequate technical, financial, and other resources to complete the development and to use or sell the intangible asset; and
• its ability to measure reliably the expenditure attributable to the intangible asset during its development.
Assessing if and when the criteria above are met is based on judgment, which takes into account past experiences and expectations about the technical ability to complete the development project as intended. The cost of developing new products, features and significant and pervasive improvements of core platform functionality are capitalized as separate intangible assets or as additions to existing intangible assets when the criteria listed above are met. Expenditures related to product maintenance, such as bug fixes, updates needed to comply with changes in laws and regulations, and updates needed to keep pace with the latest trends, are expensed in the period they are incurred.
Personnel Expenses
The table below presents the amounts of personnel expenses including share-based compensation (in thousands):
|
|
|
|
|
|
|
|
|
|
|
|
|
|
|
Year ended December 31, |
|
|
|
2022 |
|
|
2023 |
|
|
2024 |
|
Salaries, including bonuses |
|
$ |
(43,235 |
) |
|
$ |
(41,890 |
) |
|
$ |
(40,890 |
) |
Social security contribution, excluding amounts related to share-based compensation |
|
|
(5,222 |
) |
|
|
(5,825 |
) |
|
|
(6,519 |
) |
External temporary hires |
|
|
(10,318 |
) |
|
|
(11,796 |
) |
|
|
(15,568 |
) |
Defined contribution pension expense |
|
|
(4,752 |
) |
|
|
(3,814 |
) |
|
|
(4,135 |
) |
Other personnel-related expenses |
|
|
(1,758 |
) |
|
|
(2,476 |
) |
|
|
(2,827 |
) |
Total personnel expenses, excluding share-based compensation |
|
|
(65,285 |
) |
|
|
(65,801 |
) |
|
|
(69,940 |
) |
Share-based compensation expense for Opera-granted awards |
|
|
(7,439 |
) |
|
|
(10,500 |
) |
|
|
(6,846 |
) |
Share-based compensation expense for parent-granted awards |
|
|
(1,865 |
) |
|
|
(6,450 |
) |
|
|
(2,872 |
) |
Total personnel expenses, including share-based compensation |
|
$ |
(74,588 |
) |
|
$ |
(82,750 |
) |
|
$ |
(79,658 |
) |
Share-based Compensation
Opera has adopted a share incentive plan for the purpose of rewarding, attracting, and retaining employees by providing long term incentives in the form of restricted share units (“RSUs”) and options. Furthermore, Kunlun, the majority shareholder of Opera, has enrolled certain employees of Opera in its share incentive plan under which these employees have received options issued by Kunlun as compensation for services they provide to Opera. In these consolidated financial statements, the awards granted by Kunlun are described as RSUs to be consistent with their classification under Chinese securities regulations. Opera does not have any obligation to settle the awards granted by Kunlun and these awards do not lead to dilution for Opera shareholders because the employees receive shares in Kunlun when the awards are exercised. All counts of RSUs, options and per-unit values, as disclosed in these consolidated financial statements, are converted to share-equivalent units.
The following table shows the movements in the number of RSUs and options:
|
|
|
|
|
|
|
|
|
|
|
|
|
|
|
|
|
|
|
|
|
|
|
|
|
|
|
Opera: RSUs |
|
|
Opera: Options |
|
|
Kunlun: RSUs |
|
|
|
Number of RSUs |
|
|
Weighted average grant date fair value |
|
|
Number of options |
|
|
Weighted average grant date fair value |
|
|
Number of RSUs |
|
|
Weighted average grant date fair value |
|
Outstanding as of January 1, 2023 |
|
|
1,785,275 |
|
|
$ |
9.90 |
|
|
|
100,000 |
|
|
$ |
3.40 |
|
|
|
2,925,000 |
|
|
$ |
1.22 |
|
Regular awards during the year |
|
|
934,359 |
|
|
$ |
8.39 |
|
|
|
— |
|
|
$ |
— |
|
|
|
6,200,000 |
|
|
$ |
2.01 |
|
Dividend adjustment awards during the year |
|
|
257,551 |
|
|
$ |
— |
|
|
|
— |
|
|
$ |
— |
|
|
|
— |
|
|
$ |
— |
|
Forfeited during the year |
|
|
(50,203 |
) |
|
$ |
8.66 |
|
|
|
— |
|
|
$ |
— |
|
|
|
(2,000,000 |
) |
|
$ |
1.68 |
|
Exercised during the year |
|
|
(1,008,509 |
) |
|
$ |
8.37 |
|
|
|
(60,000 |
) |
|
$ |
1.92 |
|
|
|
(832,500 |
) |
|
$ |
1.10 |
|
Outstanding as of December 31, 2023 |
|
|
1,918,473 |
|
|
$ |
8.67 |
|
|
|
40,000 |
|
|
$ |
5.62 |
|
|
|
6,292,500 |
|
|
$ |
1.86 |
|
Regular awards during the year |
|
|
390,000 |
|
|
$ |
12.58 |
|
|
|
— |
|
|
$ |
— |
|
|
|
1,610,824 |
|
|
$ |
3.22 |
|
Dividend adjustment awards during the year |
|
|
89,946 |
|
|
$ |
— |
|
|
|
— |
|
|
$ |
— |
|
|
|
— |
|
|
$ |
— |
|
Forfeited during the year |
|
|
(19,295 |
) |
|
$ |
8.84 |
|
|
|
— |
|
|
$ |
— |
|
|
|
— |
|
|
$ |
— |
|
Exercised during the year |
|
|
(961,870 |
) |
|
$ |
8.16 |
|
|
|
— |
|
|
$ |
— |
|
|
|
(2,199,000 |
) |
|
$ |
1.72 |
|
Outstanding as of December 31, 2024 |
|
|
1,417,254 |
|
|
$ |
9.54 |
|
|
|
40,000 |
|
|
$ |
5.62 |
|
|
|
5,704,324 |
|
|
$ |
2.23 |
|
Dividend adjustment awards represent adjustments to the number of un-exercised RSUs based on the yield of dividends paid. These awards are designed to ensure that un-exercised RSUs maintain their value, and therefore dividend adjustment grants do not have any incremental value when considered together with the original regular awards.
RSUs granted by Kunlun have as non-market performance conditions for vesting requirements for Kunlun’s consolidated net income to exceed defined thresholds. In connection with the preparation of Opera’s consolidated financial statements for 2024, it was determined that 1,666,500 RSUs granted by Kunlun are not expected to vest because Kunlun’s consolidated net income in 2024 was not expected to exceed the threshold for vesting. This resulted in the reversal in 2024 of the cumulative share-based compensation expense of $2.9 million for these RSUs. In the table above showing movements in the number of equity awards, these RSUs were, however, presented as outstanding as of year-end because they are expected to be forfeited in 2025 subsequent to when Kunlun’s consolidated financial statements have been issued.
As of December 31, 2024, the weighted average remaining vesting period for the RSUs and options outstanding under Opera’s share incentive plan was 0.44 years (2023: 0.64 years), whereas the weighted average remaining vesting period for the RSUs outstanding under Kunlun’s share incentive plan was 0.79 years (2023: 1.10 years).
The fair values of RSUs granted by Opera were measured using a Monte Carlo simulation, whereas the fair values of options granted by Opera and RSUs granted by Kunlun were measured using the Black-Scholes model. The application of these valuation techniques requires an assessment and identification of appropriate inputs, including fair value of the underlying equity instruments at the grant date, expected life of the grant and volatility. Set forth in the table below are the weighted average values for inputs used in the valuation techniques:
|
|
|
|
|
|
|
|
|
|
|
|
|
|
|
|
|
|
|
Opera |
|
|
Kunlun |
|
|
|
2023 RSU grants |
|
|
2024 RSU grants |
|
|
2023 RSU grants |
|
|
2024 RSU grants |
|
Fair value of underlying share at grant date |
|
$ |
8.46 |
|
|
$ |
12.61 |
|
|
$ |
3.48 |
|
|
$ |
5.78 |
|
Expected volatility |
|
|
50.5 |
% |
|
|
63.0 |
% |
|
|
24.6 |
% |
|
|
23.5 |
% |
Risk-free rate |
|
|
4.9 |
% |
|
|
4.3 |
% |
|
|
2.1 |
% |
|
|
2.1 |
% |
Duration of initial simulation period (years to longstop date) |
|
|
2.49 |
|
|
|
2.39 |
|
|
N/A |
|
|
N/A |
|
Duration of second simulation period with postponed exercise (years) |
|
|
3.00 |
|
|
|
3.00 |
|
|
N/A |
|
|
N/A |
|
Exercise price |
|
$ |
— |
|
|
$ |
— |
|
|
$ |
1.54 |
|
|
$ |
2.69 |
|
The expected volatility was computed based on the annualized standard deviation on the continuously compounded rates of return for the historical prices of Opera’s and Kunlun’s shares, and with regard to RSUs granted by Kunlun, certain similar companies, over a period equal to the expected lifetime of the equity awards.
Based on the inputs above, the weighted average fair value at the grant dates of regular RSUs was $8.39 in 2023 and $12.58 in 2024, whereas the weighted average fair value at the grant dates of RSUs granted by Kunlun was $2.01 in 2023 and $3.22 in 2024.
Compensation to Key Management Personnel
The table below presents the amounts of expensed compensation to the directors and executive officers of the Company, including the grant-date fair value of vested equity awards (in thousands):
|
|
|
|
|
|
|
|
|
|
|
|
|
|
|
Year ended December 31, |
|
|
|
2022 |
|
|
2023 |
|
|
2024 |
|
Short-term employee benefits |
|
$ |
(2,371 |
) |
|
$ |
(2,495 |
) |
|
$ |
(2,064 |
) |
Post-employment and medical benefits |
|
|
(56 |
) |
|
|
(72 |
) |
|
|
(116 |
) |
Share-based compensation |
|
|
(1,488 |
) |
|
|
(1,693 |
) |
|
|
(3,571 |
) |
Total compensation to key management personnel |
|
$ |
(3,914 |
) |
|
$ |
(4,260 |
) |
|
$ |
(5,751 |
) |
No loans have been granted and no guarantees have been issued to key management personnel. Key management personnel do not have any agreements for compensation upon termination or change of employment or directorship.
Research and Development Expenditure
The following table presents the amounts of compensation to employees engaged in research and development activities (in thousands):
|
|
|
|
|
|
|
|
|
|
|
|
|
|
|
Year ended December 31, |
|
|
|
2022 |
|
|
2023 |
|
|
2024 |
|
Total research and development expenditure |
|
$ |
(50,537 |
) |
|
$ |
(46,098 |
) |
|
$ |
(54,378 |
) |
Less: Capitalized development expenditure (Note 10) |
|
|
6,825 |
|
|
|
4,587 |
|
|
|
7,705 |
|
Net research and development expenditure recognized as part of personnel expenses |
|
$ |
(43,713 |
) |
|
$ |
(41,511 |
) |
|
$ |
(46,673 |
) |
Note 5. Other Operating Expenses
The table below presents the items of other operating expenses (in thousands):
|
|
|
|
|
|
|
|
|
|
|
|
|
|
|
Year ended December 31, |
|
|
|
2022 |
|
|
2023 |
|
|
2024 |
|
Hosting |
|
$ |
(9,267 |
) |
|
$ |
(10,161 |
) |
|
$ |
(12,360 |
) |
Audit, legal and other advisory services |
|
|
(6,857 |
) |
|
|
(8,669 |
) |
|
|
(7,687 |
) |
Software license fees |
|
|
(2,149 |
) |
|
|
(3,357 |
) |
|
|
(4,026 |
) |
Rent and other office expenses |
|
|
(3,743 |
) |
|
|
(2,700 |
) |
|
|
(2,305 |
) |
Travel |
|
|
(1,496 |
) |
|
|
(1,848 |
) |
|
|
(1,959 |
) |
Other expenses |
|
|
(3,502 |
) |
|
|
(4,106 |
) |
|
|
(3,338 |
) |
Total other operating expenses |
|
$ |
(27,015 |
) |
|
$ |
(30,842 |
) |
|
$ |
(31,674 |
) |
Note 6. Finance Income and Finance Expenses
The table below presents the items of finance income and finance expenses, including foreign exchange gains and losses (in thousands):
|
|
|
|
|
|
|
|
|
|
|
|
|
|
|
Year ended December 31, |
|
|
|
2022 |
|
|
2023 |
|
|
2024 |
|
Finance income: |
|
|
|
|
|
|
|
|
|
Interest income on receivables from sales of investments (Note 12) |
|
$ |
3,675 |
|
|
$ |
1,556 |
|
|
$ |
165 |
|
Other interest income |
|
|
1,675 |
|
|
|
2,989 |
|
|
|
3,412 |
|
Gain on settlement of receivable from sale of investment (Note 12) |
|
|
— |
|
|
|
1,084 |
|
|
|
— |
|
Fair value gain on short-term investments (Note 16) |
|
|
15,946 |
|
|
|
3,243 |
|
|
|
— |
|
Other finance income |
|
|
157 |
|
|
|
5 |
|
|
|
— |
|
Total finance income |
|
|
21,454 |
|
|
|
8,876 |
|
|
|
3,577 |
|
Finance expenses: |
|
|
|
|
|
|
|
|
|
Interest expense |
|
|
(282 |
) |
|
|
(369 |
) |
|
|
(530 |
) |
Fair value loss on receivable from sale of investment (Note 12) |
|
|
(37,923 |
) |
|
|
— |
|
|
|
— |
|
Other finance expenses |
|
|
(1,524 |
) |
|
|
(276 |
) |
|
|
(56 |
) |
Total finance expenses |
|
|
(39,729 |
) |
|
|
(644 |
) |
|
|
(586 |
) |
Foreign exchange gain (loss): |
|
|
|
|
|
|
|
|
|
Unrealized foreign exchange gain (loss) |
|
|
(1,512 |
) |
|
|
(1,901 |
) |
|
|
1,248 |
|
Realized foreign exchange gain (loss) |
|
|
355 |
|
|
|
938 |
|
|
|
(3,087 |
) |
Total foreign exchange gain (loss) |
|
|
(1,157 |
) |
|
|
(963 |
) |
|
|
(1,839 |
) |
Net finance income (expense) |
|
$ |
(19,432 |
) |
|
$ |
7,269 |
|
|
$ |
1,152 |
|
Note 7. Income Taxes
Accounting Policies
The income tax expense for the period is the tax payable on the current period’s taxable income, based on the applicable income tax rate for each jurisdiction, adjusted for changes in deferred tax assets and liabilities attributable to temporary differences and to unused tax losses.
The current income tax charge is calculated based on the tax laws enacted or substantively enacted at the end of the reporting period in the countries where Opera generates taxable income. Management periodically evaluates positions taken in tax returns with respect to situations in which applicable tax regulation is subject to interpretation, and considers whether it is probable that a taxation authority will accept an uncertain tax treatment. Opera measures its tax balances either based on the most likely amount or the expected value, depending on which method provides a better prediction of the resolution of the uncertainty.
Deferred tax is provided in full, using the liability method, on temporary differences arising between the tax bases of assets and liabilities, and their carrying amounts in the consolidated financial statements. The amount of deferred tax provided is based on the expected manner of realization or settlement of the underlying items, using tax rates enacted or substantively enacted at the end of the reporting period.
A deferred tax asset is only recognized to the extent that it is probable that future taxable profits will allow the deferred tax asset to be realized. When an entity has a history of recent losses, Opera recognizes a deferred tax asset arising from unused tax losses or tax credits only to the extent that the entity has sufficient taxable temporary differences or there is convincing other evidence that sufficient taxable profit will be available against which the unused tax losses or unused tax credits can be utilized by the entity.
Deferred tax assets and liabilities are offset if there is a legally enforceable right to offset current tax liabilities and assets, and they relate to income taxes levied by the same tax authority on the same taxable entity, or on different tax entities, but they intend to settle current tax liabilities and assets on a net basis, or their tax assets and liabilities will be realized simultaneously.
Tax deductions from equity awards granted to employees are based on the fair values of the shares at the time of exercise. For equity awards scheduled to vest in future periods, the amount of estimated future tax deduction is based on Opera’s share price at the end of the reporting period. Where the amount of tax deduction (or estimated future tax deduction) exceeds the amount of the related cumulative share-based compensation expense, as measured for each individual grant, the current or deferred tax associated with the excess is recognized directly in equity and presented as part of the line item for share-based compensation in the Statement of Changes in Equity.
Income Tax Expense
The table below presents the components of the income tax expense (in thousands):
|
|
|
|
|
|
|
|
|
|
|
|
|
|
|
Year ended December 31, |
|
|
|
2022 |
|
|
2023 |
|
|
2024 |
|
Current income taxes |
|
$ |
(7,293 |
) |
|
$ |
(7,227 |
) |
|
$ |
(10,757 |
) |
Deferred income taxes |
|
|
(1,542 |
) |
|
|
531 |
|
|
|
(6,884 |
) |
Income tax expense |
|
$ |
(8,835 |
) |
|
$ |
(6,697 |
) |
|
$ |
(17,642 |
) |
Opera Limited, the Parent of the Opera group, is domiciled in the Cayman Islands, which currently levies no taxes on corporations based upon profits, income, gains or appreciation. With Opera being headquartered in Norway and with a large share of the Group’s income being recognized by Opera Norway AS, a subsidiary domiciled in Norway, the reconciliation below explains the differences between the expected income tax expense expressed as the accounting profit multiplied by the corporate income tax rate in Norway of 22%, and Opera’s actual income tax expense (in thousands, except for percentages):
|
|
|
|
|
|
|
|
|
|
|
|
|
|
|
|
|
|
|
|
|
|
|
|
|
|
|
Year ended December 31, |
|
|
|
2022 |
|
|
2023 |
|
|
2024 |
|
|
|
Amount |
|
|
Effective tax rate (1) |
|
|
Amount |
|
|
Effective tax rate (1) |
|
|
Amount |
|
|
Effective tax rate (1) |
|
Income before income taxes |
|
$ |
23,870 |
|
|
|
|
|
$ |
159,997 |
|
|
|
|
|
$ |
98,412 |
|
|
|
|
Tax using the Norwegian tax rate of 22% |
|
|
(5,251 |
) |
|
|
22.0 |
% |
|
|
(35,199 |
) |
|
|
22.0 |
% |
|
|
(21,651 |
) |
|
|
22.0 |
% |
Differences between computed tax rate and effective tax rate due to: |
|
|
|
|
|
|
|
|
|
|
|
|
|
|
|
|
|
|
Different tax rates of subsidiaries operating in other jurisdictions |
|
|
1,408 |
|
|
|
(5.9 |
) |
|
|
5,346 |
|
|
|
(3.3 |
) |
|
|
7,945 |
|
|
|
(8.1 |
) |
Changes in tax rates |
|
|
21 |
|
|
|
(0.1 |
) |
|
|
(64 |
) |
|
|
— |
|
|
|
2 |
|
|
|
— |
|
Non-deductible expenses |
|
|
(3,585 |
) |
|
|
15.0 |
|
|
|
(4,588 |
) |
|
|
2.9 |
|
|
|
(3,861 |
) |
|
|
3.9 |
|
Tax-exempt income |
|
|
480 |
|
|
|
(2.0 |
) |
|
|
23,149 |
|
|
|
(14.5 |
) |
|
|
2,986 |
|
|
|
(3.0 |
) |
Foreign withholding taxes |
|
|
299 |
|
|
|
(1.3 |
) |
|
|
270 |
|
|
|
(0.2 |
) |
|
|
(138 |
) |
|
|
0.1 |
|
Recognition and derecognition of deferred tax assets |
|
|
(2,027 |
) |
|
|
8.5 |
|
|
|
4,848 |
|
|
|
(3.0 |
) |
|
|
(1,554 |
) |
|
|
1.6 |
|
Changes in estimates related to prior years |
|
|
549 |
|
|
|
(2.3 |
) |
|
|
(67 |
) |
|
|
— |
|
|
|
48 |
|
|
|
— |
|
Movements in exchange rates |
|
|
(729 |
) |
|
|
3.1 |
|
|
|
(391 |
) |
|
|
0.2 |
|
|
|
(1,419 |
) |
|
|
1.4 |
|
Income tax expense at effective tax rate |
|
$ |
(8,835 |
) |
|
|
37.0 |
% |
|
$ |
(6,697 |
) |
|
|
4.2 |
% |
|
$ |
(17,642 |
) |
|
|
17.9 |
% |
_______________
(1)Percentages have been rounded for presentation purposes and may differ from unrounded results.
Deferred Tax Assets and Liabilities
The following table shows a reconciliation of deferred taxes by type of temporary differences (in thousands):
|
|
|
|
|
|
|
|
|
|
|
|
|
|
|
|
|
|
|
|
|
|
|
|
|
|
|
|
|
|
|
|
|
|
|
Property and equipment |
|
|
Intangible assets |
|
|
Trade receivables |
|
|
Equity awards |
|
|
Intra-group interest expenses carried forward |
|
|
Tax losses carried forward |
|
|
Other |
|
|
Total |
|
Net deferred tax asset (liability) as of January 1, 2023 |
|
$ |
83 |
|
|
$ |
(20,549 |
) |
|
$ |
300 |
|
|
$ |
— |
|
|
$ |
8,066 |
|
|
$ |
5,399 |
|
|
$ |
822 |
|
|
$ |
(5,878 |
) |
Income (expense) recognized in the Statement of Operations |
|
|
(121 |
) |
|
|
571 |
|
|
|
67 |
|
|
|
420 |
|
|
|
(418 |
) |
|
|
(152 |
) |
|
|
163 |
|
|
|
531 |
|
Expense recognized in the Statement of Comprehensive Income |
|
|
— |
|
|
|
— |
|
|
|
— |
|
|
|
— |
|
|
|
— |
|
|
|
— |
|
|
|
(6 |
) |
|
|
(6 |
) |
Deferred tax benefit recognized in equity |
|
|
— |
|
|
|
— |
|
|
|
— |
|
|
|
3,674 |
|
|
|
— |
|
|
|
— |
|
|
|
— |
|
|
|
3,674 |
|
Net deferred tax asset (liability) as of December 31, 2023 |
|
|
(38 |
) |
|
|
(19,978 |
) |
|
|
367 |
|
|
|
4,094 |
|
|
|
7,648 |
|
|
|
5,247 |
|
|
|
979 |
|
|
|
(1,679 |
) |
Income (expense) recognized in the Statement of Operations |
|
|
(1,188 |
) |
|
|
568 |
|
|
|
(346 |
) |
|
|
(401 |
) |
|
|
(1,497 |
) |
|
|
(4,081 |
) |
|
|
61 |
|
|
|
(6,884 |
) |
Expense recognized in the Statement of Comprehensive Income |
|
|
— |
|
|
|
— |
|
|
|
— |
|
|
|
— |
|
|
|
— |
|
|
|
— |
|
|
|
(55 |
) |
|
|
(55 |
) |
Deferred tax benefit recognized in equity |
|
|
— |
|
|
|
— |
|
|
|
— |
|
|
|
993 |
|
|
|
— |
|
|
|
— |
|
|
|
— |
|
|
|
993 |
|
Net deferred tax asset (liability) as of December 31, 2024 |
|
$ |
(1,226 |
) |
|
$ |
(19,410 |
) |
|
$ |
21 |
|
|
$ |
4,686 |
|
|
$ |
6,151 |
|
|
$ |
1,166 |
|
|
$ |
985 |
|
|
$ |
(7,626 |
) |
The net deferred tax liability for intangible assets is mainly related to differences between the fair values and tax bases for such assets that were recognized in 2016 as part of the purchase price allocation when Opera Norway AS and its subsidiaries were acquired. The Opera brand, which is recognized as a trademark with indefinite useful life and consequently is not amortized, represented a deferred tax liability of $15.5 million, whereas customer-related intangible assets, which are amortized, represented a deferred tax liability of $3.9 million as of year-end 2024. See Note 10 for more information on these intangible assets.
Opera has recognized deferred tax assets related to intra-group interest expenses that are carried forward due to limitations in Norway to the annual amount that can be deducted for tax purposes. Such intra-group interest expenses can be carried forward for up to ten years. Opera has also recognized deferred tax assets for tax losses that can be carried forward indefinitely. The recognition of these deferred tax assets is based on an assessment of when they are likely to be recovered and a judgment as to whether or not there will be sufficient taxable profits available to offset the assets. Based on business forecasts, management determined that it is probable that such taxable profits will be available.
Opera recognized deferred tax assets of $3.7 million in 2023 and $1.0 million in 2024 as the tax benefit arising due to the amount of future tax deductions from the expected exercise of equity awards exceeding the amount of the related cumulative share-based compensation expense. This deferred tax benefit was recognized directly in equity.
After offsetting deferred tax assets and liabilities within the same tax jurisdiction, the following amounts are presented in the Statement of Financial Position (in thousands):
|
|
|
|
|
|
|
|
|
|
|
As of December 31, |
|
|
|
2023 |
|
|
2024 |
|
Deferred tax assets |
|
$ |
1,133 |
|
|
$ |
1,063 |
|
Deferred tax liabilities |
|
$ |
2,813 |
|
|
$ |
8,689 |
|
Note 8. Earnings Per Share
Basic earnings per share is calculated by dividing the net income for the year attributable to ordinary equity holders of the Company by the weighted average number of ordinary shares outstanding during the year. Diluted earnings per share is calculated by increasing the denominator by the effect of unexercised equity awards, specifically (i) the number of ordinary shares that would be issued pursuant to Opera’s share incentive plan based on period-average employee equity awards, partially offset by (ii) the number of ordinary shares that could have been repurchased with the amount of unamortized share-based compensation expense related to such equity awards at the period-average market price per share.
The table below presents basic and diluted earnings per share:
|
|
|
|
|
|
|
|
|
|
|
|
|
|
|
Year ended December 31, |
|
|
|
2022 |
|
|
2023 |
|
|
2024 |
|
Basic earnings per share |
|
$ |
0.14 |
|
|
$ |
1.72 |
|
|
$ |
0.91 |
|
Diluted earnings per share |
|
$ |
0.14 |
|
|
$ |
1.69 |
|
|
$ |
0.90 |
|
The table below shows the calculations of basic and diluted weighted-average number of shares:
|
|
|
|
|
|
|
|
|
|
|
|
|
|
|
Year ended December 31, |
|
|
|
2022 |
|
|
2023 |
|
|
2024 |
|
Issued shares at beginning of period |
|
|
115,145,866 |
|
|
|
89,215,121 |
|
|
|
87,518,284 |
|
Effect of shares issued upon exercise of equity awards |
|
|
790,476 |
|
|
|
1,003,925 |
|
|
|
944,983 |
|
Effect of share repurchases |
|
|
(6,457,254 |
) |
|
|
(963,143 |
) |
|
|
— |
|
Basic weighted-average number of shares in the period |
|
|
109,479,088 |
|
|
|
89,255,903 |
|
|
|
88,463,267 |
|
Effect of unexercised equity awards |
|
|
853,464 |
|
|
|
1,665,705 |
|
|
|
1,213,007 |
|
Diluted weighted-average number of shares in the period |
|
|
110,332,552 |
|
|
|
90,921,608 |
|
|
|
89,676,274 |
|
See Note 4 for details on Opera’s share incentive plan and Note 16 for information on share repurchases.
Note 9. Property and Equipment
Accounting Policies
Property and equipment, which include right-of-use assets arising from leases (see Note 13), are recognized at cost, less accumulated depreciation, and impairment losses. Depreciation is computed using the straight-line method over the estimated useful lives of the assets or the remaining lease term, whichever is shorter. Useful lives, residual values and the depreciation method are reviewed at each financial year-end and adjusted prospectively, if appropriate.
Property and equipment are tested for impairment whenever events or changes in circumstances indicate that the carrying amount may not be recoverable. An impairment loss is recognized for the amount by which the asset’s carrying amount exceeds its recoverable amount. The recoverable amount is the higher of an asset’s fair value less costs of disposal and value in use. For the purposes of assessing impairment, assets are grouped at the lowest levels for which there are separately identifiable cash inflows which are largely independent of the cash inflows from other assets or groups of assets (“cash-generating units”). Value in use is calculated as the present value of estimated future cash flows, which are discounted to their present value using a discount rate that reflects current market assessments of the time value of money and the risks specific to the asset or cash-generating unit. Property and equipment that have suffered an impairment in prior periods are reviewed for possible reversal of the impairment at the end of each reporting period.
Reconciliation of the Carrying Amounts of Property and Equipment
|
|
|
|
|
|
|
|
|
|
|
|
|
|
|
|
|
|
|
|
|
|
|
Office properties |
|
|
Equipment |
|
|
Leasehold improvements |
|
|
Furniture and fixtures |
|
|
Total |
|
Net book value as of January 1, 2023 |
|
$ |
6,308 |
|
|
$ |
8,097 |
|
|
$ |
127 |
|
|
$ |
90 |
|
|
$ |
14,623 |
|
Additions |
|
|
1,829 |
|
|
|
6,356 |
|
|
|
— |
|
|
|
44 |
|
|
|
8,229 |
|
Depreciation |
|
|
(1,664 |
) |
|
|
(4,841 |
) |
|
|
(116 |
) |
|
|
(40 |
) |
|
|
(6,660 |
) |
Effect of movements in exchange rates |
|
|
(131 |
) |
|
|
23 |
|
|
|
2 |
|
|
|
(10 |
) |
|
|
(116 |
) |
Net book value as of December 31, 2023 |
|
|
6,343 |
|
|
|
9,635 |
|
|
|
14 |
|
|
|
83 |
|
|
|
16,074 |
|
Additions |
|
|
1,137 |
|
|
|
26,121 |
|
|
|
— |
|
|
|
20 |
|
|
|
27,278 |
|
Depreciation |
|
|
(1,838 |
) |
|
|
(7,034 |
) |
|
|
(14 |
) |
|
|
(34 |
) |
|
|
(8,921 |
) |
Effect of movements in exchange rates |
|
|
(41 |
) |
|
|
(328 |
) |
|
|
— |
|
|
|
(6 |
) |
|
|
(375 |
) |
Net book value as of December 31, 2024 |
|
$ |
5,600 |
|
|
$ |
28,393 |
|
|
$ |
— |
|
|
$ |
65 |
|
|
$ |
34,058 |
|
|
|
|
|
|
|
|
|
|
|
|
|
|
|
|
|
As of December 31, 2023: |
|
|
|
|
|
|
|
|
|
|
|
|
|
|
|
Cost |
|
$ |
15,405 |
|
|
$ |
36,753 |
|
|
$ |
1,725 |
|
|
$ |
859 |
|
|
$ |
54,742 |
|
Accumulated depreciation and impairment |
|
$ |
(9,063 |
) |
|
$ |
(27,118 |
) |
|
$ |
(1,711 |
) |
|
$ |
(776 |
) |
|
$ |
(38,669 |
) |
As of December 31, 2024: |
|
|
|
|
|
|
|
|
|
|
|
|
|
|
|
Cost |
|
$ |
16,517 |
|
|
$ |
61,508 |
|
|
$ |
1,710 |
|
|
$ |
779 |
|
|
$ |
80,514 |
|
Accumulated depreciation and impairment |
|
$ |
(10,916 |
) |
|
$ |
(33,115 |
) |
|
$ |
(1,710 |
) |
|
$ |
(714 |
) |
|
$ |
(46,456 |
) |
Additions to equipment in 2024 included an NVIDIA DGX SuperPOD to establish an AI data center cluster for Opera, with an acquisition cost of $19.1 million. See Note 13 for information about additions to right-of-use assets.
Depreciation
Depreciation is calculated on a straight-line basis over the estimated useful lives of the assets, as follows:
• Office properties: Up to 7 years.
• Equipment: Up to 10 years, or term of lease contract.
• Leasehold improvements: Up to 6 years, or term of lease contract.
• Furniture and fixtures: Up to 5 years.
In the beginning of 2024, the estimates for useful lives of servers and network equipment were changed from five to six years due to continuous improvements in hardware, software, and data center designs. The effect of these changes was a reduction in depreciation expenses in 2024 of $1.0 million.
Note 10. Goodwill and Intangible Assets
Accounting Policies
Intangible assets are measured on initial recognition at cost. Government grants that relate to the development of technology are deducted in arriving at the carrying amount of the asset when there is reasonable assurance that the grant will be received, and all attached conditions will be complied with. Following initial recognition, intangible assets are carried at cost less accumulated amortization and impairment losses.
Intangible assets with finite useful lives are amortized on a straight-line basis over their useful lives and tested for impairment whenever events or changes in circumstances indicate that their carrying amount might not be recoverable. The amortization period and the amortization method are reviewed at each financial year-end.
Goodwill is initially recognized as the excess of the aggregate of the consideration transferred when acquiring a business over the net identifiable assets acquired and liabilities assumed. After initial recognition, goodwill is measured at cost less any accumulated impairment losses. Goodwill and other intangible assets that have indefinite useful lives are not subject to amortization and are tested for impairment at each year-end, or more frequently if events or changes in circumstances indicate that they might be impaired. In the impairment test, goodwill is allocated to the cash-generating unit or group of cash-generating units that are expected to benefit from the business combination in which the goodwill arose. The cash-generating unit or group of cash-generating units are identified at the lowest level at which goodwill is monitored for internal management purposes.
When there is an impairment indicator or when an annual impairment test is required, the asset’s recoverable amount is estimated. The recoverable amount is the higher of an asset’s fair value less costs of disposal and value in use. An impairment loss is recognized for the amount by which the asset’s carrying amount exceeds its recoverable amount. For the purposes of assessing impairment, assets are grouped at the lowest levels for which there are separately identifiable cash inflows which are largely independent of the cash inflows from other assets or groups of assets (“cash-generating units”). Value in use is calculated as the present value of estimated future cash flows, which are discounted to their present value using a discount rate that reflects current market assessments of the time value of money and the risks specific to the asset or cash-generating unit. The most recent detailed calculation of the recoverable amount made in a preceding period may be used in the impairment test in the current period provided all of the following criteria are met:
• the assets and liabilities making up the cash-generating unit have not changed significantly since the most recent recoverable amount calculation;
• the most recent recoverable amount calculation resulted in an amount that exceeded the carrying amount of the unit by a substantial margin; and
• based on an analysis of events that have occurred and circumstances that have changed since the most recent recoverable amount calculation, the likelihood that a current recoverable amount determination would be less than the current carrying amount of the unit is remote.
Intangible assets other than goodwill that have suffered an impairment are reviewed for possible reversal of the impairment at the end of each reporting period.
Opera has purchased, or received as payment, crypto assets such as CELO and certain stablecoins. Holdings of crypto assets are classified based on their terms and conditions and the purpose for holding them. An inherent characteristic of all crypto assets held by Opera is that they are digital representations and, hence, intangible by nature. Crypto assets that are short-term, highly liquid investments that are readily convertible to known amounts of cash and which are subject to an insignificant risk of changes in value, are presented as cash equivalents when they are held for the purpose of meeting short-term cash commitments rather than for investment or other purposes. Holdings of USD Coin (“USDC”) and Tether (“USDT”), both stablecoins, are presented as cash equivalents, whereas other crypto assets are classified as intangible assets. Cash flows from the purchase and sale of crypto assets are classified as cash flows from operating activities.
Reconciliation of the Carrying Amounts of Goodwill and Intangible Assets
|
|
|
|
|
|
|
|
|
|
|
|
|
|
|
|
|
|
|
|
|
|
|
|
|
|
|
Goodwill |
|
|
Trademark |
|
|
Customer relationships |
|
|
Technology |
|
|
Other intangible assets (1) |
|
|
Total |
|
Net book value as of January 1, 2023 |
|
$ |
429,445 |
|
|
$ |
70,600 |
|
|
$ |
22,790 |
|
|
$ |
6,528 |
|
|
$ |
66 |
|
|
$ |
529,428 |
|
Additions, net of government grants |
|
|
— |
|
|
|
— |
|
|
|
— |
|
|
|
4,281 |
|
|
|
524 |
|
|
|
4,805 |
|
Transfers |
|
|
— |
|
|
|
— |
|
|
|
— |
|
|
|
— |
|
|
|
1,488 |
|
|
|
1,488 |
|
Amortization |
|
|
— |
|
|
|
— |
|
|
|
(2,580 |
) |
|
|
(3,908 |
) |
|
|
(17 |
) |
|
|
(6,505 |
) |
Impairment |
|
|
— |
|
|
|
— |
|
|
|
— |
|
|
|
(681 |
) |
|
|
— |
|
|
|
(681 |
) |
Effect of movements in exchange rates |
|
|
411 |
|
|
|
— |
|
|
|
— |
|
|
|
(18 |
) |
|
|
(2 |
) |
|
|
391 |
|
Net book value as of December 31, 2023 |
|
|
429,856 |
|
|
|
70,600 |
|
|
|
20,210 |
|
|
|
6,200 |
|
|
|
2,059 |
|
|
|
528,926 |
|
Additions, net of government grants |
|
|
— |
|
|
|
— |
|
|
|
— |
|
|
|
7,263 |
|
|
|
4,749 |
|
|
|
12,013 |
|
Reclassification |
|
|
— |
|
|
|
— |
|
|
|
— |
|
|
|
— |
|
|
|
(801 |
) |
|
|
(801 |
) |
Amortization |
|
|
— |
|
|
|
— |
|
|
|
(2,580 |
) |
|
|
(4,079 |
) |
|
|
(2 |
) |
|
|
(6,662 |
) |
Disposals |
|
|
— |
|
|
|
— |
|
|
|
— |
|
|
|
— |
|
|
|
(2,888 |
) |
|
|
(2,888 |
) |
Impairment |
|
|
— |
|
|
|
— |
|
|
|
— |
|
|
|
(113 |
) |
|
|
— |
|
|
|
(113 |
) |
Effect of movements in exchange rates |
|
|
(114 |
) |
|
|
— |
|
|
|
— |
|
|
|
(22 |
) |
|
|
(14 |
) |
|
|
(151 |
) |
Net book value as of December 31, 2024 |
|
$ |
429,742 |
|
|
$ |
70,600 |
|
|
$ |
17,630 |
|
|
$ |
9,249 |
|
|
$ |
3,103 |
|
|
$ |
530,325 |
|
|
|
|
|
|
|
|
|
|
|
|
|
|
|
|
|
|
|
|
As of December 31, 2023: |
|
|
|
|
|
|
|
|
|
|
|
|
|
|
|
|
|
|
Cost |
|
$ |
432,937 |
|
|
$ |
70,600 |
|
|
$ |
40,732 |
|
|
$ |
40,852 |
|
|
$ |
6,041 |
|
|
$ |
591,162 |
|
Accumulated amortization and impairment |
|
$ |
(3,081 |
) |
|
$ |
— |
|
|
$ |
(20,522 |
) |
|
$ |
(34,652 |
) |
|
$ |
(3,982 |
) |
|
$ |
(62,237 |
) |
As of December 31, 2024: |
|
|
|
|
|
|
|
|
|
|
|
|
|
|
|
|
|
|
Cost |
|
$ |
432,823 |
|
|
$ |
70,600 |
|
|
$ |
40,732 |
|
|
$ |
48,104 |
|
|
$ |
6,970 |
|
|
$ |
599,231 |
|
Accumulated amortization and impairment |
|
$ |
(3,081 |
) |
|
$ |
— |
|
|
$ |
(23,102 |
) |
|
$ |
(38,854 |
) |
|
$ |
(3,867 |
) |
|
$ |
(68,905 |
) |
_______________
(1)Other intangible assets include holdings of Celo Dollar (“cUSD”), CELO (see below) and other crypto assets with a total carrying amount of $2.0 million and $3.1 million as of December 31, 2023 and 2024, respectively. These assets have indefinite useful lives and are included in “Other current assets” in the Statement of Financial Position as of December 31, 2024, as Opera expects to realize them within twelve months after the reporting period. See Note 15 for information on crypto assets accounted for as financial assets and presented as cash equivalents.
As part of a strategic partnership agreement entered into with AP Grant Foundation Company, an entity promoting the Celo blockchain, Opera has committed to purchasing CELO assets for $0.25 million per quarter until the first quarter of 2029 with a contractual lockup requiring Opera to hold the CELO assets for one year from the date of purchase.
Opera has received grants from the Norwegian government for the research and development of new technologies. Such grants totaled $0.3 million in 2023 and $0.4 million in 2024. The grants were recognized as reductions to the cost of the related technology assets.
Amortization
For intangible assets with finite useful lives, amortization is calculated on a straight-line basis over the following periods:
• Customer relationships: Up to 15 years.
• Technology: Up to 5 years.
• Other intangible assets: Up to 5 years.
Impairment Test for Crypto Assets
Crypto assets classified as intangible assets have indefinite useful lives and are consequently tested for impairment at least annually, or more frequently if events or changes in circumstances indicate that they might be impaired. Their recoverable amounts were estimated as fair values less costs of disposal. Unadjusted quoted prices on crypto exchanges that are the principal markets for the crypto assets, which are level 1 inputs within the fair value hierarchy, were determined to represent fair values, while costs of disposal were estimated based on transaction fees observed on the crypto exchanges. The impairment tests demonstrated that the recoverable amounts exceeded the carrying amounts in all of the periods presented in these consolidated financial statements.
Impairment Losses on Technology and Other Intangible Assets
In 2022, Opera recognized an impairment charge of $2.2 million on a non-strategic technology asset that subsequently was sold to Kunlun. The fair value of the consideration for the asset was the same as the asset’s carrying amount subsequent to the impairment charge.
At year-end 2022, Opera determined that the carrying amount of a license related to the former European fintech initiative was not recoverable, which led to the recognition of an impairment loss of $1.0 million.
In 2023, Opera recognized an impairment charge of $0.7 million on a non-strategic technology asset, and in 2024, Opera recognized an impairment charge of $0.1 million on another non-strategic technology asset.
Impairment Test for Goodwill and Trademark
Of the goodwill recognized as of December 31, 2024, $421.6 million was attributable to the acquisitions of Opera Norway AS and its subsidiaries in 2016 and $8.1 million to the acquisition of YoYo Games Ltd. in 2021. As part of the acquisition of Opera Norway AS and its subsidiaries, the Opera brand was recognized as a trademark with an estimated fair value at the time of $70.6 million.
Opera is organized into business units based on its main categories of products and services, and each such business unit represents a cash-generating unit. Goodwill is monitored at the Opera group level for internal management purposes, while the trademark is a corporate asset that contributes to the future cash flows of all business units. Consequently, in the annual impairment test for goodwill and the trademark, the assets were allocated to the group of cash-generating units that comprise Opera as a whole.
In the annual impairment test for goodwill and the trademark performed at the end of 2024, the recoverable amount calculated at the end of 2023 was used as the criteria outlined in the accounting policies section above for use of the most recent calculation made in a preceding period in the impairment test in the current period were met.
The recoverable amount was measured as the value in use by estimating the present value of the future cash flows from the cash-generating units. The projected cash flows were based on the most up-to-date forecast that had been approved by management and did not include cash flows arising from future enhancements of assets that have not been committed to and have not substantively commenced. The management-approved forecast at the time was for 2024 only as management does not approve forecasts longer than one year into the future. Because the length of the projection period for the forecasts used in the impairment test is into perpetuity, management identified a “steady state” set of assumptions for the cash flows based on an approach where, in addition to the forecast for 2024, cash flows in 2025 and 2026 were estimated and then the estimated cash flows in 2026 were used as the basis for the terminal value. This two-stage approach was aimed to take cash flows to a level at which they can be regarded as reflecting
maintainable earnings and to the period in a mid-point of the cycle – i.e., not at peak or trough of the cycle. Beyond 2026, the cash flows were extrapolated using a constant nominal growth rate.
The value-in-use calculation demonstrated that the recoverable amount exceeded by a substantial margin the carrying amount of the cash-generating units, both at the end of 2023 and the end of 2024. The sections below outline the key assumptions in the value-in-use calculation, including their sensitivities.
Cash Flows in Projected Period
Cash inflows were expected to grow at an annualized rate of 15.3% over the projected period, before reaching a long-term stable level. Cash inflows were forecasted for each product and country with sufficient and reliable data on which to base projections. Forecasted cash outflows were partly based on actual costs in 2023 and a bottom-up assessment for the relevant business unit. Operating expenditures are expected to grow in U.S. dollar terms but decline relative to revenue due to economies of scale. As a result, the EBITDA margin in the projected period was expected to increase at an average rate of 0.9 percentage points per year.
Long-term Growth
Long-term GDP growth rates in the relevant regions were estimated as the basis for the long-term growth rate in the terminal value. Both the labor force and productivity were assumed to be stable, which resulted in zero real GDP growth. The International Monetary Fund's inflation estimates for 2028, broken down across regions, were used as the basis for estimating long-term inflation. As a result, the long-term nominal growth rate was estimated to be 2.8%.
Discount Rate
The estimated weighted average cost of capital (“WACC”) was used to discount the projected cash flows, as converted to U.S. dollars. The post-tax WACC was calculated to be 14.0%, whereas the derived pre-tax WACC was calculated to be 16.1%. The post-tax WACC was estimated based on the following inputs: Risk-free rate: 3.9%, market risk premium: 4.6%, equity beta: 0.9, country risk premium: 3.3%, size premium: 2.6%, and equity-to-asset ratio: 100%.
Sensitivity Analysis
Listed below are the changes to the key assumptions that individually would result in an impairment loss as of year-end 2024:
• Decrease of the annualized growth rate for cash inflows in the projected period by more than 18.6 percentage points.
• Decrease of the EBITDA margin in the projected period by more than 2.3 percentage points each year.
• Decrease of the long-term growth rate by more than 11.3 percentage points.
• Increase of the discount rate by more than 7.5 percentage points.
Note 11. Investments in Unconsolidated Entities
Accounting Policies
The accounting for investments in unconsolidated entities is based on Opera’s degree of influence over the investees. When Opera has significant influence, i.e., the power to participate in the financial and operating policy decisions of the investee, but not control or joint control of those policies, the investee is classified as an associate. When Opera and other parties have contractually agreed to share control over an arrangement and Opera and the other parties have rights to the net assets of the arrangement, it is classified as a joint venture. Investments in associates and joint ventures are accounted for in accordance with the equity method, whereas other investments in unconsolidated entities are classified and accounted for as financial assets.
Equity-accounted investees
Under the equity method, the investment is initially recognized at cost and adjusted thereafter to recognize Opera’s share of the post-acquisition profits or losses of the investee in the Statement of Operations, and Opera’s share of movements in other comprehensive income of the investee in the Statement of Comprehensive Income. Unrealized gains arising from transactions with equity-accounted investees are eliminated against the investment to the extent of Opera’s interest in the investee.
When Opera’s share of losses exceeds its interest in an equity-accounted investee, the carrying amount of that interest, including any long-term interests that in substance form part of its net investment, is reduced to zero, and the recognition of further losses is discontinued. However, additional losses are provided for, and a liability is recognized, to the extent that Opera has incurred legal or constructive obligations or has made payments on behalf of the investee.
Financial assets
Long-term investments in entities over which Opera does not have control, joint control, or significant influence, are measured at fair value on a recurring basis with the net change in fair value recognized in the Statement of Operations as “Fair value gain (loss) on long-term investments.” Transaction costs related to these investments are expensed when incurred.
Summary of Investments in Unconsolidated Entities
The table below shows a summary of Opera’s investments in unconsolidated entities (in thousands except for percentages):
|
|
|
|
|
|
|
|
|
|
|
|
|
|
|
|
|
|
|
|
|
|
|
|
|
|
Carrying amount as of December 31, |
|
Investee |
|
Ownership interest |
|
|
Classification of investment |
|
Basis of accounting for investment |
|
2023 |
|
|
2024 |
|
OPay |
|
|
9.4 |
% |
|
Financial asset |
|
Fair value through profit or loss |
|
$ |
253,300 |
|
|
$ |
258,300 |
|
Verda Ventures |
|
|
26.0 |
% |
|
Associate |
|
Equity method |
|
$ |
— |
|
|
$ |
1,248 |
|
nHorizon Innovation |
|
|
29.1 |
% |
|
Associate |
|
Equity method |
|
$ |
— |
|
|
$ |
— |
|
OPay
OPay is a privately-held mobile payment fintech company focused on emerging markets, with Nigeria and Egypt as initial key markets. OPay provides online and offline payments, and digital wallet services leveraging AI, big data and other fintech innovations, thus helping countries in emerging markets advance their trajectory of digital payments and other financial services. Opera holds a combination of ordinary and preferred shares in OPay, representing an ownership interest of 9.4%.
Even though Opera’s chairman and chief executive officer is also the chairman and chief executive officer of OPay and has the ability to participate in the financial and operating policy decisions of OPay, the management of Opera has concluded, based on significant judgment, that Opera does not have significant influence over OPay. The primary reasons for this are that he holds his roles in OPay as a representative of his personal investment companies, and the corporate governance framework in OPay prohibits him from exercising significant influence in OPay on behalf of Opera.
The fair values of the shares in OPay were measured using the probability-weighted expected return model (“PWERM”), which was determined to be an appropriate model because it can capture and reflect the characteristics of the company and the economic rights and benefits of the various classes of shares, including redemption rights and liquidation preferences. In the model, as applied, fair values of the shares were estimated based on the probability-weighted present value of expected future investment returns, considering a total of eight possible future scenarios, including three variations each for initial public offering and private sale transactions, one scenario for dissolution and one for redemption, with future equity values ranging from $0.2 billion to $6.0 billion after one to three years. The table below shows the estimates for equity values (in millions), period of time until potential liquidity events and probabilities of the respective outcomes, with the narrowed valuation ranges reflecting an underlying belief that such liquidity events are closer in time at year-end 2024 versus year-end 2023:
|
|
|
|
|
|
|
|
|
|
|
|
|
|
|
Equity value (in millions) |
|
Time horizon (in years) |
|
Probability |
Scenarios |
|
2023 |
|
2024 |
|
2023 |
|
2024 |
|
2023 |
|
2024 |
Initial public offering |
|
$2,900 – $8,000 |
|
$3,000 – $6,000 |
|
1 – 3 |
|
1 – 2 |
|
72% |
|
80% |
Sale transaction |
|
$3,500 – $7,500 |
|
$3,000 – $5,500 |
|
1 – 3 |
|
1 – 2 |
|
8% |
|
10% |
Dissolution |
|
$234 |
|
$236 |
|
3 |
|
3 |
|
10% |
|
5% |
Redemption |
|
$1,000 |
|
$1,000 |
|
3 |
|
3 |
|
10% |
|
5% |
Each class of shares was allocated its portion of the equity value based on the economic rights and benefits of the shares. The future outcomes were discounted using an estimated cost of equity of 18.9% (2023: 18.9%). Accordingly, the present equity values of the scenarios ranged from $0.1 billion to $4.2 billion, with a probability-weighted present value of $3.0 billion (2023: $3.0 billion). Additionally, as OPay is a private company and its shares are illiquid, a judgmental discount for lack of marketability of 10% was applied in the fair value measurement of the shares (2023: 10%). Because the fair value measurement incorporated significant unobservable inputs, it was classified as a level 3 measurement in the fair value hierarchy.
The probability-weighted present value estimated by PWERM was reconciled to an estimate for the overall equity value of OPay based on a discounted cash flow analysis. In the discounted cash flow analysis, revenue was estimated to grow at an annualized rate of 37% over the 2024-2031 period, and thereafter reaching a long-term growth rate of 7%. The free cash flow was expected to increase over the forecasted period in line with the growth of profitability, with the present value of these cash flows calculated using a discount rate of 18.9%.
In 2023, Opera received preferred shares in OPay as settlement of the receivable due from the buyer of Opera’s former ownership interest in Nanobank (see Note 12). These shares were received with a contractual obligation of return to OPay on a pro-rata basis if the cumulative financial performance in the 2023-2024 period for a business OPay acquired from Nanobank fell short of a defined target. In connection with the valuation of these preferred shares in 2023, scenarios for achieving the financial performance target were identified and weighted, resulting in a 6% discount to fair value. At the end of 2024 it was determined that the target for financial performance was met, which resulted in a reversal of the related discount on the fair value measurement of the shares, corresponding to an increase in fair value of $4.9 million.
The table below provides a reconciliation of the carrying amount of Opera’s investment in OPay (in thousands):
|
|
|
|
|
|
|
|
|
|
|
Year ended December 31, |
|
|
|
2023 |
|
|
2024 |
|
Carrying amount as of January 1 |
|
$ |
86,100 |
|
|
$ |
253,300 |
|
Shares acquired recognized at fair value |
|
|
77,362 |
|
|
|
— |
|
Fair value gain on investment |
|
|
89,838 |
|
|
|
5,000 |
|
Carrying amount as of December 31 |
|
$ |
253,300 |
|
|
$ |
258,300 |
|
The table below shows the individual sensitivities of key unobservable inputs to the fair value measurement (in thousands):
|
|
|
|
|
|
|
|
|
|
|
|
|
|
|
|
|
|
|
|
|
|
|
|
|
|
As of December 31, 2023 |
|
|
As of December 31, 2024 |
|
Significant unobservable inputs |
|
Change in assumption (1) |
|
|
Decrease in assumption |
|
|
Increase in assumption |
|
|
Decrease in assumption |
|
|
Increase in assumption |
|
Weighted average equity value |
|
|
10 |
% |
|
$ |
(24,791 |
) |
|
$ |
24,791 |
|
|
$ |
(25,495 |
) |
|
$ |
25,495 |
|
Time to exit |
|
1 year |
|
|
$ |
47,872 |
|
|
$ |
(40,263 |
) |
|
$ |
48,553 |
|
|
$ |
(40,855 |
) |
Relative change in probability of sale (2) |
|
|
100 |
% |
|
$ |
(630 |
) |
|
$ |
630 |
|
|
$ |
826 |
|
|
$ |
(826 |
) |
Discount for lack of marketability |
|
5 pp |
|
|
$ |
14,072 |
|
|
$ |
(14,072 |
) |
|
$ |
14,350 |
|
|
$ |
(14,350 |
) |
Discount rate |
|
2 pp |
|
|
$ |
9,759 |
|
|
$ |
(9,202 |
) |
|
$ |
6,965 |
|
|
$ |
(6,657 |
) |
Achievement of financial target (3) |
|
10 pp |
|
|
$ |
(8,452 |
) |
|
$ |
5,017 |
|
|
N/A |
|
|
N/A |
|
_______________
(1)pp - percentage points.
(2)Represents a relative change in the probabilities of sale scenarios, offset by an equal change in the probabilities of initial public offering scenarios.
(3)Only applicable to the preferred shares acquired in 2023, as discussed above.
Verda Ventures
Verda Ventures operates a venture fund formed in the second half of 2024 with the purpose of making investments in companies operating in the stablecoin ecosystem around Opera’s MiniPay platform. Opera invested $1.25 million in the fund in the fourth quarter of 2024, and has a commitment to make a further seven equal quarterly investments, totaling $10 million.
The fund operated by Verda Ventures is classified as an associate and accounted for in accordance with the equity method as Opera has a member on the fund’s investment committee and thus has the ability to participate in financial and operating policy decisions. Opera’s share of the fund’s net loss, including management fee, was $2 thousand in 2024.
nHorizon Innovation and nHorizon Infinite
nHorizon Innovation and nHorizon Infinite were classified as joint ventures of Opera until mid-2023, after which the arrangements establishing joint control were terminated. At the time the carrying amounts of the investments were zero. Opera continues to hold a 29.1% ownership interest in nHorizon Innovation, which is classified as an associate. As Opera’s accumulated share of nHorizon Innovation’s losses exceeds Opera’s interest in the entity, Opera did not recognize its share of nHorizon Innovation’s net loss in 2024, which was $31 thousand. As of December 31, 2024, the accumulated balance of unrecognized share of losses was $0.2 million.
Fjord Bank
In 2024, Opera sold its shares in Fjord Bank, an independent niche bank operating in several EU countries. The consideration received amounted to $0.8 million, which matched the acquisition cost of the shares and the carrying amount of the investment prior to the sale.
Note 12. Trade and Other Receivables
Accounting Policies
Trade receivables that do not contain a significant financing component are initially measured at the transaction price determined in accordance with the accounting policies for revenue (see Note 3). Other receivables are initially measured at their fair values plus, in the case of a receivable not at fair value through profit or loss, transaction costs. Transaction costs of receivables measured at fair value through profit or loss are expensed when incurred.
On initial recognition, Opera classifies a receivable as subsequently measured at amortized cost, or at fair value through profit or loss, depending on Opera’s business model for managing the receivable and the contractual cash flow characteristics. Receivables that are held for collection of contractual cash flows, where those cash flows represent solely payments of principal and interest, are measured at amortized cost. Receivables that do not meet the criteria for amortized cost are measured at fair value through profit or loss, with gains or losses recognized in the Statement of Operations as part of finance income or finance expense.
An allowance for expected credit losses (“ECLs”) is recognized for all receivables not held at fair value through profit or loss. ECLs are based on the difference between the contractual cash flows due in accordance with the contract and all cash flows that are expected to be received, discounted at the original effective interest rate. The expected cash flows will include cash flows from the sale of any collateral held or other credit enhancements that are integral to the contractual terms.
Opera applies a simplified approach for calculating ECLs on trade receivables. Under the simplified approach, Opera does not track changes in credit risk, but instead recognizes a loss allowance based on lifetime ECLs at each reporting date. Loss provisions are made at the level of specific invoices where information exists that management can utilize in its determination of credit risk. For trade receivables where no specific risk information is identified, Opera has established a provision matrix that is based on its historical credit loss experience, adjusted for forward-looking factors specific to the debtors and the economic environment.
Trade receivables are written off where there is no reasonable expectation of recovery. Indicators that there is no reasonable expectation of recovery include, amongst others, having exhausted all commercially reasonable recovery actions and the failure of a debtor to make contractual payments for a period of greater than 180 days past due. Each trade receivable is assessed individually with respect to the timing and amount of write-off. Impairment losses on trade receivables are presented as credit loss expense within operating profit. Subsequent recoveries of amounts previously written off are credited against the same line item.
Receivables are derecognized when the rights to receive cash flows have expired or have been transferred and Opera has transferred substantially all the risks and rewards of ownership. Any gain or loss arising on derecognition is recognized directly in the Statement of Operations together with any foreign exchange gains and losses. When the terms and conditions of a contract underlying a receivable are changed, Opera performs a quantitative and qualitative evaluation of whether the modification is substantial, that is, whether the cash flows of the original receivable and the modified or replacement receivable are substantially different. The evaluation considers the changes to the terms of the contract, including whether those give rise on specified dates to cash flows that are solely payments of principal and interest on the principal amount outstanding. When the cash flows are substantially different, the contractual rights to cash flows from the original receivable are deemed to have expired.
Trade Receivables
The table below presents a disaggregation of trade receivables (in thousands):
|
|
|
|
|
|
|
|
|
|
|
As of December 31, |
|
|
|
2023 |
|
|
2024 |
|
Trade receivables due from third-party customers |
|
$ |
76,468 |
|
|
$ |
97,290 |
|
Trade receivables due from related parties (Note 17) |
|
|
591 |
|
|
|
713 |
|
Total gross trade receivables |
|
|
77,059 |
|
|
|
98,003 |
|
Allowance for expected credit losses |
|
|
(7,677 |
) |
|
|
(5,180 |
) |
Trade receivables net of loss allowance |
|
$ |
69,382 |
|
|
$ |
92,823 |
|
The credit loss allowance was determined as follows (in thousands, except for percentages):
|
|
|
|
|
|
|
|
|
|
|
|
|
|
|
|
|
|
|
|
|
|
|
|
|
|
|
|
|
|
Past due |
|
|
|
|
As of December 31, 2023: |
|
Current |
|
|
<30 days |
|
|
30-60 days |
|
|
61-90 days |
|
|
>90 days |
|
|
Total |
|
Weighted-average expected credit loss rate |
|
|
0.7 |
% |
|
|
1.2 |
% |
|
|
2.1 |
% |
|
|
3.1 |
% |
|
|
86.4 |
% |
|
|
10.0 |
% |
Gross carrying amount of trade receivables |
|
$ |
62,815 |
|
|
$ |
4,116 |
|
|
$ |
1,247 |
|
|
$ |
634 |
|
|
$ |
8,248 |
|
|
$ |
77,059 |
|
Loss allowance as of December 31, 2023 |
|
$ |
458 |
|
|
$ |
47 |
|
|
$ |
26 |
|
|
$ |
20 |
|
|
$ |
7,126 |
|
|
$ |
7,677 |
|
|
|
|
|
|
|
|
|
|
|
|
|
|
|
|
|
|
|
|
|
|
|
|
|
Past due |
|
|
|
|
As of December 31, 2024: |
|
Current |
|
|
<30 days |
|
|
30-60 days |
|
|
61-90 days |
|
|
>90 days |
|
|
Total |
|
Weighted-average expected credit loss rate |
|
|
0.7 |
% |
|
|
1.7 |
% |
|
|
2.6 |
% |
|
|
3.8 |
% |
|
|
80.8 |
% |
|
|
5.3 |
% |
Gross carrying amount of trade receivables |
|
$ |
85,973 |
|
|
$ |
4,793 |
|
|
$ |
1,334 |
|
|
$ |
387 |
|
|
$ |
5,516 |
|
|
$ |
98,003 |
|
Loss allowance as of December 31, 2024 |
|
$ |
589 |
|
|
$ |
83 |
|
|
$ |
35 |
|
|
$ |
15 |
|
|
$ |
4,459 |
|
|
$ |
5,180 |
|
The credit loss allowance for trade receivables as of year-end reconciles to the opening loss allowance as follows (in thousands):
|
|
|
|
|
|
|
|
|
|
|
Year ended December 31, |
|
|
|
2023 |
|
|
2024 |
|
Loss allowance as of January 1 |
|
$ |
4,062 |
|
|
$ |
7,677 |
|
Write-offs |
|
|
(252 |
) |
|
|
(1,982 |
) |
Increase (decrease) in loss allowance |
|
|
4,066 |
|
|
|
(516 |
) |
Effect of movements in exchange rates |
|
|
(199 |
) |
|
|
— |
|
Loss allowance as of December 31 |
|
$ |
7,677 |
|
|
$ |
5,180 |
|
In 2024, previous provisions for credit losses on receivables due from certain specific customers in emerging markets were reversed as the receivables were settled, which contributed to a net reduction in the total loss allowance at the end of 2024 as compared to the end of 2023. See Note 15 for information about how Opera manages credit risk.
Receivables from Sale of Investments
Star X
In April 2022, Opera sold its 19.4% ownership interest in Star X to Kunlun, the ultimate parent of both Opera and Star X, for a fixed consideration of $83.5 million in cash, payable in three installments. The first installment of $28.4 million was received in connection with the closing of the transaction in 2022, while the remaining two installments of equal amounts were due at the end of 2023 and 2024, respectively. A simple annual interest of 3.5% accrued on the deferred payments. The receivable was classified as subsequently measured at amortized cost.
In June 2023, Opera and Kunlun entered into an amendment to the share transfer agreement in connection with Opera adopting a recurring dividend program (see Note 16). The amendment modified the payment terms. Specifically, dividends declared and payable to Kunlun’s holding of ordinary shares in Opera were to be offset against the receivable until the receivable, including accrued interest, became settled. This in lieu of Kunlun making the then remaining installment payments to Opera in cash. Such offsets totaled $25.1 million in 2023 and $33.0 million in 2024, after which the receivable was fully settled.
The table below shows the movements in the carrying amount of the receivable (in thousands):
|
|
|
|
|
|
|
|
|
|
|
Year ended December 31, |
|
|
|
2023 |
|
|
2024 |
|
Carrying amount as of January 1 |
|
$ |
56,374 |
|
|
$ |
32,797 |
|
Interest income |
|
|
1,556 |
|
|
|
165 |
|
Dividend set-off |
|
|
(25,133 |
) |
|
|
(32,962 |
) |
Carrying amount as of December 31 |
|
$ |
32,797 |
|
|
$ |
— |
|
Nanobank
In March 2022, Opera sold its 42.4% ownership interest in Nanobank for a fixed consideration of $127.1 million in cash, payable in eight equal installments over the following two years. The receivable was recognized at its estimated fair value of $120.3 million and subsequently measured at amortized cost. In August 2022, Opera and the buyer agreed to make certain modifications to the sales agreement, including to the total purchase price, payment period and installment amounts. The adjusted purchase price was $131.7 million, payable in 16 quarterly installments, the first of which had been made at the time the modified share transfer agreement was entered into. The modified share transfer agreement also introduced certain mechanisms which would potentially reduce the purchase price or trigger an immediate settlement in the form of the transfer of shares in any acquiring company following a sale or merger in
which Nanobank would be the target entity sold or merged for consideration in equity of the acquirer. Because of the substantial modifications to the share transfer agreement, the contractual rights to cash flows from the original receivable were deemed to have expired. The original receivable was therefore derecognized, and a new receivable recognized at its estimated fair value. The terms of the modified share transfer agreement were not consistent with a basic financing arrangement and the new receivable was therefore subsequently measured at fair value through profit or loss.
As of December 31, 2022, fair value of the receivable was estimated to be $76.3 million based on an expected present value technique where the probability-weighted average of possible future cash flows and non-cash payments was discounted using a discount rate of 8.0%, which was based on the yield of U.S. treasury bonds with the same maturity as the receivable and a risk premium to capture the uncertainty with regard to amount and timing of future cash flows not reflected in the scenarios for future cash flows. This led to the recognition of a fair value loss on the receivable of $37.9 million in 2022.
In February 2023, Nanobank sold the majority of its business in Asia to OPay in exchange for shares in OPay. In connection with this, Opera and the third-party buyer of Opera’s former ownership stake in Nanobank agreed to treat the transaction as a full sale of Nanobank, triggering an immediate settlement of Opera’s receivable in the form of 58,785,744 Series C preferred shares in OPay. The settlement was based on the valuation applied in the transaction as well as an estimate for the value of Nanobank’s remaining business. Opera entered into a final share transfer agreement with the third-party buyer mirroring relevant provisions of the sales agreement between Nanobank and OPay, which included a defined target for financial performance over the 2023-2024 period for the Nanobank business acquired and a provision for the seller to return on a pro-rata basis the Series C preferred shares received as consideration if the cumulative financial performance over the 2023-2024 period fell short of the target. The estimated fair value of the shares in OPay received was $77.4 million, which reflected a 6% discount, equal to $4.9 million, due to the contingent obligation for some or potentially all of the shares to be returned after 2024. As the fair value of the shares was $1.1 million higher than the carrying amount of the receivable as of December 31, 2022, a gain on settlement of $1.1 million was recognized as part of finance income in 2023.
Other Current Receivables
The table below presents the items of other current receivables (in thousands):
|
|
|
|
|
|
|
|
|
|
|
As of December 31, |
|
|
|
2023 |
|
|
2024 |
|
Value added tax |
|
$ |
5,781 |
|
|
$ |
3,275 |
|
Receivable due from Kunlun (Note 17) |
|
|
1,300 |
|
|
|
— |
|
Other |
|
|
678 |
|
|
|
1,284 |
|
Total other current receivables |
|
$ |
7,760 |
|
|
$ |
4,560 |
|
Note 13. Leases
Accounting Policies
For each contract that is or contains a lease, Opera recognizes a lease liability and a right-of-use asset at the lease commencement date, except for short-term leases of 12 months or less and leases of low-value assets, which are recognized as expenses on a straight-line basis over the lease term.
The lease liability is initially measured at the present value of the lease payments to be made over the lease term, which include:
• fixed payments (and payments that are fixed in substance) less any lease incentives;
• variable lease payments that depend on an index or a rate;
• amounts expected to be paid under residual value guarantees; and
• the exercise price of any purchase option reasonably certain to be exercised by Opera, and payments of penalties for terminating a lease, if the lease term reflects management’s expectation of exercising the option to terminate.
The lease payments are discounted using Opera’s incremental borrowing rate because the interest rate implicit in the lease cannot be readily determined. A build-up approach was used to determine the incremental borrowing rate, starting with a risk-free rate, which was adjusted for estimated credit risk and other factors specific to the lease, including term, geographic location, currency and collateral.
After the commencement date, the lease liability is increased to reflect the accretion of interest and reduced for the lease payments made. The interest expense is charged to profit or loss over the lease period so as to produce a constant periodic rate of interest on the
remaining balance of the liability for each period. The lease liability is remeasured when there is a change in future lease payments following a contract renegotiation, a change of an index or rate or a reassessment of purchase options.
The right-of-use asset is initially measured at cost, which corresponds to the initial amount of the lease liability adjusted for any lease payments made at or before the lease commencement date, initial direct costs and the obligation to refurbish the asset, less any lease incentives granted by the lessor. Right-of-use assets are presented as property and equipment according to the nature of the underlying assets leased and are depreciated on a straight-line basis over the shorter of the lease term and the estimated useful lives of the assets, as disclosed in Note 9. Any remeasurement of the lease liability results in a corresponding adjustment to the right-of-use asset.
Disaggregation of Leases
Opera has entered into leases of office properties and equipment such as servers and network equipment. Lease terms are negotiated on an individual basis and are for a wide range of different terms and conditions. Lease contracts are typically made for fixed periods of 6 months up to 7 years, but several property and equipment leases include extension and early termination options. These options are used to maximize operational flexibility. The majority of the extension and termination options are exercisable only by Opera and not by the respective lessors.
The table below presents the amounts of lease liabilities (in thousands):
|
|
|
|
|
|
|
|
|
|
|
As of December 31, |
|
|
|
2023 |
|
|
2024 |
|
Non-current lease liabilities |
|
$ |
6,776 |
|
|
$ |
5,631 |
|
Current lease liabilities |
|
|
3,770 |
|
|
|
3,955 |
|
Total lease liabilities |
|
$ |
10,545 |
|
|
$ |
9,586 |
|
See Note 15 for a maturity analysis of lease and other financial liabilities.
Set out below are the carrying amounts of right-of-use assets (in thousands):
|
|
|
|
|
|
|
|
|
|
|
As of December 31, |
|
|
|
2023 |
|
|
2024 |
|
Office properties |
|
$ |
6,343 |
|
|
$ |
5,600 |
|
Equipment |
|
|
3,713 |
|
|
|
3,894 |
|
Total right-of-use assets |
|
$ |
10,056 |
|
|
$ |
9,494 |
|
Additions to right-of-use assets during 2024 totaled $3.9 million (2023: $6.4 million). See Note 9 for additional details on right-of-use assets.
The Statement of Operations has the following amounts relating to leases (in thousands):
|
|
|
|
|
|
|
|
|
|
|
|
|
|
|
Year ended December 31, |
|
|
|
2022 |
|
|
2023 |
|
|
2024 |
|
Depreciation expense of right-of-use assets presented as property |
|
$ |
(2,047 |
) |
|
$ |
(1,664 |
) |
|
$ |
(1,838 |
) |
Depreciation expense of right-of-use assets presented as equipment |
|
|
(1,636 |
) |
|
|
(1,971 |
) |
|
|
(2,514 |
) |
Expense relating to short-term leases (included in other operating expenses) |
|
|
(2,609 |
) |
|
|
(1,254 |
) |
|
|
(1,251 |
) |
Interest expense (included in finance expense) |
|
|
(242 |
) |
|
|
(356 |
) |
|
|
(518 |
) |
Foreign exchange gain (loss) |
|
|
103 |
|
|
|
(196 |
) |
|
|
601 |
|
Total lease-related expenses |
|
$ |
(6,431 |
) |
|
$ |
(5,441 |
) |
|
$ |
(5,520 |
) |
In 2024, the total cash outflow for leases was $6.5 million (2023: $6.1 million, and 2022: $6.2 million). Payments relating to leases of low-value assets were not material.
Security
Some lease agreements require that Opera provide cash deposits as security for lease payments. As of December 31, 2024, such cash deposits totaled $1.3 million (2023: $1.7 million). Leased assets may not be used as collateral for borrowing purposes.
Note 14. Trade and Other Payables, and Other Current Liabilities
Accounting Policies
A trade payable is a liability to pay for goods or services that have been received or supplied and have been invoiced or formally agreed with the supplier. Trade and other payables, and other financial liabilities, are derecognized when the obligation under the liability is discharged, canceled or expires. A financial liability that is settled in cash using an electronic payment system is considered discharged on the settlement date.
A provision is recognized when Opera has a present legal or constructive obligation because of a past event, it is probable that a future outflow of resources will be required to settle the obligation, and the amount can be reliably estimated. Provisions are measured at the present value of management’s best estimate of the expenditure required to settle the present obligation at the end of the reporting period. The discount rate used to determine the present value is a pre-tax rate that reflects current market assessments of the time value of money and the risks specific to the liability.
Disaggregation of Trade and other Payables, and Other Current Liabilities
The table below presents the items of trade and other payables (in thousands):
|
|
|
|
|
|
|
|
|
|
|
As of December 31, |
|
|
|
2023 |
|
|
2024 |
|
Trade payables due to third-party suppliers |
|
$ |
49,345 |
|
|
$ |
72,694 |
|
Trade and other payables due to related parties (Note 17) |
|
|
483 |
|
|
|
— |
|
Value added tax |
|
|
373 |
|
|
|
538 |
|
Payroll tax |
|
|
2,045 |
|
|
|
2,052 |
|
Total trade and other payables |
|
$ |
52,247 |
|
|
$ |
75,285 |
|
The following table shows the items of other current liabilities (in thousands):
|
|
|
|
|
|
|
|
|
|
|
As of December 31, |
|
|
|
2023 |
|
|
2024 |
|
Accrued personnel expenses |
|
$ |
12,887 |
|
|
$ |
13,039 |
|
Other current liabilities |
|
|
398 |
|
|
|
182 |
|
Total other current liabilities |
|
$ |
13,285 |
|
|
$ |
13,222 |
|
Note 15. Financial Assets and Financial Liabilities
The following table shows the carrying amounts of financial assets (in thousands):
|
|
|
|
|
|
|
|
|
|
|
As of December 31, |
|
|
|
2023 |
|
|
2024 |
|
Financial assets at amortized cost: |
|
|
|
|
|
|
Trade receivables (Note 12) |
|
$ |
69,382 |
|
|
$ |
92,823 |
|
Receivables from sale of investments (Note 12) |
|
|
32,797 |
|
|
|
— |
|
Other receivables (1) |
|
|
9,911 |
|
|
|
6,320 |
|
Cash and cash equivalents (excluding stablecoins) |
|
|
93,863 |
|
|
|
125,997 |
|
Total financial assets at amortized cost |
|
|
205,953 |
|
|
|
225,139 |
|
Financial assets at fair value through profit or loss: |
|
|
|
|
|
|
Unlisted shares (Note 11) |
|
|
254,197 |
|
|
|
258,300 |
|
Stablecoins (cash equivalents) (2) |
|
|
— |
|
|
|
801 |
|
Total financial assets at fair value through profit or loss |
|
|
254,197 |
|
|
|
259,101 |
|
Total financial assets |
|
$ |
460,150 |
|
|
$ |
484,240 |
|
_______________
(1)Other receivables include “Other current receivables,” as presented separately in the Statement of Financial Position and disaggregated in Note 12, and receivables presented in the Statement of Financial Position as part of the line item “Other non-current investments and financial assets.”
(2)Stablecoins include holdings of USDC and USDT, which are presented as cash equivalents in the Statement of Financial Position.
The following table shows the carrying amounts of financial liabilities, all of which are measured at amortized cost (in thousands):
|
|
|
|
|
|
|
|
|
|
|
As of December 31, |
|
|
|
2023 |
|
|
2024 |
|
Lease liabilities (Note 13) |
|
$ |
10,545 |
|
|
$ |
9,586 |
|
Trade and other payables (Note 14) |
|
|
52,247 |
|
|
|
75,285 |
|
Other financial liabilities (1) |
|
|
13,379 |
|
|
|
13,293 |
|
Total financial liabilities |
|
$ |
76,171 |
|
|
$ |
98,164 |
|
_______________
(1)Other financial liabilities are presented in the Statement of Financial Position as “Other current liabilities” (see Note 14) and “Other non-current liabilities.”
Fair Values of Financial Assets and Financial Liabilities
The carrying amounts of trade and other receivables, cash and cash equivalents, trade payables and other current liabilities are reasonable approximations of fair values. The stablecoins accounted for as financial assets are designed to maintain a one-to-one peg against the U.S. dollar by each unit being redeemable for one U.S. dollar from the issuers, which support the peg with portfolios of treasury securities, cash and other assets. See Note 11 for details on the fair value measurement of shares in OPay.
Financial Risk Management - Overview
The financial assets and financial liabilities held by Opera create exposure to market, credit, and liquidity risks. The management team seeks to minimize potential adverse effects of these risks through sound business practices and risk management. The Board of Directors, together with senior management, is involved in the risk assessment process. Opera has not utilized derivatives for hedging purposes.
Market Risk
Market risk is the risk that the fair value or future cash flows of a financial instrument will fluctuate because of changes in market prices. Opera is exposed to three types of market risk: interest rate risk, foreign currency risk and price risk.
Interest Rate Risk
Interest rate risk is the risk that the fair value or future cash flows of a financial instrument will fluctuate because of changes in market interest rates. The exposure to interest rate risk at the end of 2024 was immaterial as financial liabilities and financial assets other than demand deposits are non-interest-bearing.
Foreign Currency Risk
Foreign currency risk is the risk that the fair value or future cash flows of a financial instrument will fluctuate because of changes in foreign exchange rates. Opera is exposed to transactional foreign currency risk to the extent that there is a mismatch between the currencies in which sales, purchases, receivables, and payables are denominated, and the respective functional currencies of the individual entities in the Opera group. Most of Opera’s revenue is denominated in U.S. dollars and euros, while operating expenses are incurred in a wider specter of currencies, including Norwegian kroner, Chinese renminbi, Polish zlotys, Swedish kronor, British pounds and euros. The functional currency of revenue-generating entities in the Opera group is primarily the U.S. dollar. Management is closely monitoring Opera’s exposure to foreign currency risk and seeks to minimize its exposure to such risk.
The sensitivity analysis below shows the impact on income before income taxes from a 5% strengthening in the closing exchange rate of foreign currencies relative to the U.S. dollar. The currencies listed are those to which Opera had the most significant exposure as of year-end. The sensitivity associated with a 5% weakening of a particular currency would be opposite of equal magnitude. The sensitivity analysis assumes that each currency moves in isolation (in thousands):
|
|
|
|
|
|
|
|
|
|
|
As of December 31, |
|
Currency |
|
2023 |
|
|
2024 |
|
Chinese renminbi |
|
$ |
795 |
|
|
$ |
823 |
|
Euro |
|
$ |
(220 |
) |
|
$ |
(589 |
) |
Kenyan shilling |
|
$ |
(229 |
) |
|
$ |
(113 |
) |
Nigerian Naira |
|
$ |
25 |
|
|
$ |
(182 |
) |
Norwegian krone |
|
$ |
157 |
|
|
$ |
189 |
|
Polish zloty |
|
$ |
336 |
|
|
$ |
256 |
|
Singapore dollar |
|
$ |
(254 |
) |
|
$ |
95 |
|
Swedish krona |
|
$ |
227 |
|
|
$ |
170 |
|
In addition to transactional foreign currency risk, Opera is exposed to foreign currency translation risk arising from financial and non-financial items held by subsidiaries with other functional currencies than the U.S. dollar, which is the presentation currency for the consolidated financial statements. Opera seeks to minimize this risk by limiting funding of subsidiaries to near-term cash needs.
Price Risk
Opera is exposed to price risk from its investment in OPay, an unlisted entity, which is accounted for at fair value through profit or loss (see Note 11). The nature of the investment and OPay’s business entail uncertainties about the future value of the shares. This price risk is monitored by Opera’s senior management on a regular basis by reviewing OPay’s financial performance and position, and its forecasts for future performance.
Opera is also exposed to price risk from holdings of USDC and USDT, both accounted for as financial assets measured at fair value through profit or loss and presented as cash equivalents. However, the price risk of these stablecoins is insignificant because they are backed by reserves, including treasury securities and cash, and they are convertible to known amounts of cash by each unit being redeemable for one U.S. dollar from the issuers. As such, they are designed to maintain a one-to-one peg against the U.S. dollar. The aggregate carrying amount of USDC and USDT as of December 31, 2024 was $0.8 million. In addition to USDC and USDT, Opera holds certain other crypto assets, primarily cUSD, a stablecoin, and CELO, which are classified as intangible assets (see Note 10).
Credit Risk
Credit risk is the risk that a counterparty will not meet its obligations under a financial instrument or customer contract, leading to a financial loss for Opera. Opera’s exposure to credit risk primarily arises from trade and other receivables, deposits of cash with banks and financial institutions, and from the investment in preferred shares in OPay.
Credit risk is managed on a group basis. Deposits of cash are only made with banks and financial institutions that are considered solvent, resulting in management considering its exposure to credit risk for cash being low. For trade receivables due from customers, the exposure to credit risk is limited by Opera having established maximum payment periods in the range of 30 to 90 days after invoices being issued. Management is continuously monitoring the exposure to credit risk from outstanding trade receivables and is managing this risk as part of the management of business risk. Additional details on trade receivables and the provision for expected credit losses are provided in Note 12.
The investment in preferred shares in OPay (see Note 11) gives rise to credit risk due to the redemption rights granted to Opera and other holders of preferred shares. The redemption rights entail that if certain defined events occur, such as the failure to complete an initial public offering within a certain period or material breaches of contractual obligations, Opera (and other investors) can demand repayment of the invested amount plus a return on that investment at a simple annual interest rate of 8%. Holders of preferred shares in OPay will incur credit losses if OPay is unable to honor its potential future redemption obligation. Opera’s management believes this specific contingent credit risk is low based on the financial position of OPay, but the shares are monitored for credit deterioration.
Liquidity Risk
Liquidity risk is the risk that Opera will encounter difficulty in meeting its obligations associated with financial liabilities that are settled by delivering cash or another financial asset. The senior management of Opera is monitoring the exposure to liquidity risk and has adopted a centralized cash pooling process, which enables Opera to manage liquidity surpluses and deficits according to the actual needs at the group and subsidiary levels. The liquidity management takes into account the maturities of financial assets and financial
liabilities and estimates of cash flows from operations. The goal is to have a strong liquidity position in terms of available cash and cash equivalents.
Opera’s liquidity risk is low because of the relatively strong liquidity position and Opera’s low debt-to-equity ratio. The table below summarizes the maturity profile of Opera’s financial liabilities based on contractual undiscounted payments due (in thousands):
|
|
|
|
|
|
|
|
|
|
|
|
|
|
|
|
|
As of December 31, 2023: |
|
In the first year |
|
|
In the second and third years |
|
|
After the third year |
|
|
Total |
|
Non-current: |
|
|
|
|
|
|
|
|
|
|
|
|
Lease liabilities |
|
$ |
— |
|
|
$ |
4,734 |
|
|
$ |
2,374 |
|
|
$ |
7,109 |
|
Other non-current liabilities |
|
|
— |
|
|
|
— |
|
|
|
94 |
|
|
|
94 |
|
Current: |
|
|
|
|
|
|
|
|
|
|
|
|
Trade and other payables |
|
|
52,247 |
|
|
|
— |
|
|
|
— |
|
|
|
52,247 |
|
Lease liabilities |
|
|
4,024 |
|
|
|
— |
|
|
|
— |
|
|
|
4,024 |
|
Other current liabilities |
|
|
13,285 |
|
|
|
— |
|
|
|
— |
|
|
|
13,285 |
|
Total financial liabilities, including interest |
|
$ |
69,556 |
|
|
$ |
4,734 |
|
|
$ |
2,468 |
|
|
$ |
76,758 |
|
|
|
|
|
|
|
|
|
|
|
|
|
|
As of December 31, 2024: |
|
In the first year |
|
|
In the second and third years |
|
|
After the third year |
|
|
Total |
|
Non-current: |
|
|
|
|
|
|
|
|
|
|
|
|
Lease liabilities |
|
$ |
— |
|
|
$ |
4,657 |
|
|
$ |
1,349 |
|
|
$ |
6,006 |
|
Other non-current liabilities |
|
|
— |
|
|
|
— |
|
|
|
71 |
|
|
|
71 |
|
Current: |
|
|
|
|
|
|
|
|
|
|
|
|
Trade and other payables |
|
|
75,285 |
|
|
|
— |
|
|
|
— |
|
|
|
75,285 |
|
Lease liabilities |
|
|
4,363 |
|
|
|
— |
|
|
|
— |
|
|
|
4,363 |
|
Other current liabilities |
|
|
13,222 |
|
|
|
— |
|
|
|
— |
|
|
|
13,222 |
|
Total financial liabilities, including interest |
|
$ |
92,869 |
|
|
$ |
4,657 |
|
|
$ |
1,420 |
|
|
$ |
98,946 |
|
Changes in Liabilities Arising from Financing Activities
The table below shows the changes in liabilities arising from financing activities (in thousands):
|
|
|
|
|
|
|
|
|
|
|
|
|
|
|
|
|
|
|
|
|
|
|
Non-current lease liabilities |
|
|
Current lease liabilities |
|
|
Current interest-bearing loans |
|
|
Other current loans |
|
|
Total |
|
As of January 1, 2023 |
|
$ |
4,723 |
|
|
$ |
2,840 |
|
|
$ |
146 |
|
|
$ |
126 |
|
|
$ |
7,836 |
|
Net cash flow |
|
|
(1,647 |
) |
|
|
(2,260 |
) |
|
|
(146 |
) |
|
|
(15 |
) |
|
|
(4,068 |
) |
New, modified and terminated leases |
|
|
3,310 |
|
|
|
2,915 |
|
|
|
— |
|
|
|
— |
|
|
|
6,225 |
|
Interest expense |
|
|
243 |
|
|
|
113 |
|
|
|
— |
|
|
|
— |
|
|
|
356 |
|
Foreign exchange (gain) loss |
|
|
146 |
|
|
|
50 |
|
|
|
— |
|
|
|
— |
|
|
|
196 |
|
As of December 31, 2023 |
|
|
6,776 |
|
|
|
3,659 |
|
|
|
— |
|
|
|
111 |
|
|
|
10,545 |
|
Net cash flow |
|
|
(3,073 |
) |
|
|
(1,627 |
) |
|
|
— |
|
|
|
— |
|
|
|
(4,699 |
) |
New, modified and terminated leases |
|
|
2,007 |
|
|
|
1,927 |
|
|
|
— |
|
|
|
— |
|
|
|
3,934 |
|
Interest expense |
|
|
303 |
|
|
|
216 |
|
|
|
— |
|
|
|
— |
|
|
|
518 |
|
Foreign exchange (gain) loss |
|
|
(382 |
) |
|
|
(219 |
) |
|
|
— |
|
|
|
— |
|
|
|
(601 |
) |
Other changes |
|
|
— |
|
|
|
— |
|
|
|
— |
|
|
|
(111 |
) |
|
|
(111 |
) |
As of December 31, 2024 |
|
$ |
5,631 |
|
|
$ |
3,955 |
|
|
$ |
— |
|
|
$ |
— |
|
|
$ |
9,586 |
|
Note 16. Capital Management
The objective of Opera’s capital management is to maximize shareholder value while maintaining a strong capital base to support both the confidence of stakeholders and Opera’s development and growth.
Dividends
In January 2023, the Board of Directors of the Company declared a special cash dividend of $0.80 per share, representing an aggregate distribution of $71.3 million. Of this amount, a total of $59.0 million was payable to Kunlun and Keeneyes Future Holding, each a shareholder in Opera at the time, and was offset against receivables due from these shareholders by the same aggregate amount. The offsetting receivables arose from Opera’s sale in January 2023 of marketable securities in connection with the termination of the investment program discussed in a separate section below. The remaining $12.3 million of the dividend was paid in cash.
In June 2023, the Board of Directors of the Company adopted a recurring semi-annual cash dividend program. The first semi-annual dividend of $0.40 per share was declared at the same time, representing an aggregate dividend of $36.0 million. In January and July 2024, Opera distributed the second and third round of semi-annual dividends, each $0.40 per share, and in the aggregate $70.4 million. Of the semi-annual dividends payable on the ordinary shares held by Kunlun, $25.1 million in 2023 and $33.0 million in 2024 were offset against the receivable due from Kunlun from the sale of Opera’s former ownership interest in Star X, which resulted in the receivable being settled in July 2024 (see Note 12).
The table below summarizes the dividends declared and distributed in 2023 and 2024 (in thousands except per share amounts):
|
|
|
|
|
|
|
|
|
|
|
|
|
|
|
|
|
|
|
Payment date |
|
Type |
|
Per share |
|
|
Total dividends |
|
|
Offset against receivables |
|
|
Paid in cash |
|
February 9, 2023 |
|
Special |
|
$ |
0.80 |
|
|
$ |
71,256 |
|
|
$ |
58,983 |
|
|
$ |
12,273 |
|
July 12, 2023 |
|
Recurring |
|
$ |
0.40 |
|
|
$ |
35,965 |
|
|
$ |
25,133 |
|
|
$ |
10,832 |
|
Total dividends paid in 2023 |
|
|
|
$ |
1.20 |
|
|
$ |
107,222 |
|
|
$ |
84,116 |
|
|
$ |
23,105 |
|
January 9, 2024 |
|
Recurring |
|
$ |
0.40 |
|
|
$ |
35,007 |
|
|
$ |
25,133 |
|
|
$ |
9,874 |
|
July 15, 2024 |
|
Recurring |
|
$ |
0.40 |
|
|
$ |
35,391 |
|
|
$ |
7,829 |
|
|
$ |
27,561 |
|
Total dividends paid in 2024 |
|
|
|
$ |
0.80 |
|
|
$ |
70,398 |
|
|
$ |
32,962 |
|
|
$ |
37,435 |
|
In December 2024, the Board of Directors of the Company declared the fourth semi-annual cash dividend of $0.40 per share under the recurring dividend program, which was payable to shareholders of record on January 6, 2025. Because the Company’s Board of Directors had the ability to cancel the dividend up until the record date, the dividend did not represent a liability as of December 31, 2024.
While Opera intends to continue paying regular semi-annual dividends, each distribution will require the approval of the Company’s Board of Directors, which will consider the form, frequency and amounts of future dividends based upon Opera’s future operations and earnings, capital requirements and surplus, financial condition, contractual restrictions, and other relevant factors.
Share Repurchases
In January 2022, the Board of Directors of the Company approved a share repurchase program which authorized the Company’s management to execute the repurchase of ADSs for up to $50 million by the end of March 2024, in any form that management deemed fit. The repurchase program was launched in February 2022 and was completed in November 2023, at which point in time Opera had repurchased 6,119,841 ADSs under the program for a total cost of $50 million.
In October 2022, Opera repurchased the current equivalent of 23,375,000 ordinary shares for $128.6 million from its pre-IPO shareholder Qifei International Development Co. Ltd., a subsidiary of 360 Security Technology Inc. This repurchase of ordinary shares was made separately from the share repurchase program for the Company’s ADSs that was active at the time.
Including two separate share repurchase programs for the Company’s ADSs that commenced in 2018 and 2020, and which were completed in 2019 and 2021, respectively, Opera has repurchased a total of 36,971,296 shares for a total cost of $239.0 million since the Company’s initial public offering in 2018. As of year-end 2024, Opera held 2,768,009 ADSs in treasury. Treasury shares are recognized at cost and deducted from equity. No gain or loss is recognized in the Statement of Operations on the purchase, sale, reissue, or cancellation of the Company’s own equity instruments.
The following table summarizes total capital returned to shareholders in the Company through share repurchases and dividends during 2022, 2023 and 2024 (in thousands, except number of shares and per share amounts):
|
|
|
|
|
|
|
|
|
|
|
|
|
|
|
|
|
|
|
|
|
|
|
|
|
|
|
Share repurchases |
|
|
Dividends |
|
|
|
|
Year ended December 31, |
|
Number of shares |
|
|
Average price paid per share |
|
|
Amount |
|
|
Per share |
|
|
Amount |
|
|
Total capital returns |
|
2022 |
|
|
26,729,495 |
|
|
$ |
5.46 |
|
|
$ |
146,068 |
|
|
$ |
— |
|
|
$ |
— |
|
|
$ |
146,068 |
|
2023 |
|
|
2,765,346 |
|
|
$ |
11.82 |
|
|
$ |
32,695 |
|
|
$ |
1.20 |
|
|
$ |
107,222 |
|
|
$ |
139,917 |
|
2024 |
|
|
— |
|
|
$ |
— |
|
|
$ |
— |
|
|
$ |
0.80 |
|
|
$ |
70,398 |
|
|
$ |
70,398 |
|
Investment Program
Early in 2023, following the sale of the majority of the investment portfolio to Kunlun and Keeneyes Future Holding (see Note 17), and the subsequent sale of the remaining securities in market transactions, Opera terminated its investment program under which up to $70 million of Opera’s capital was set aside for investments in listed equity securities. The table below summarizes the net gains on the investment portfolio in the periods presented, which were included in the amount of finance income in the Statement of Operations (in thousands):
|
|
|
|
|
|
|
|
|
|
|
|
|
|
|
Year ended December 31, |
|
|
|
2022 |
|
|
2023 |
|
|
2024 |
|
Realized net gain (loss) |
|
$ |
(18,375 |
) |
|
$ |
37,564 |
|
|
$ |
— |
|
Change in unrealized net gain (loss) |
|
|
34,321 |
|
|
|
(34,321 |
) |
|
|
— |
|
Total fair value gain on short-term investments |
|
$ |
15,946 |
|
|
$ |
3,243 |
|
|
$ |
— |
|
The investment program existed through relatively volatile market conditions, and overall provided a net gain of $34.2 million since its inception in 2018.
Note 17. Related Parties
Set out in the table below are the related parties with which Opera had transactions or outstanding balances in the periods included in these consolidated financial statements:
|
|
|
Related parties |
|
Nature of related party relationship (1) |
Beijing OFY Co., Ltd. |
|
Entity over which Opera’s chairman and chief executive officer had control. |
Keeneyes Future Holding Inc. |
|
Entity controlled by Opera’s chairman and chief executive officer. |
Kunlun Tech Co., Ltd., and its subsidiaries (“Kunlun”) |
|
Kunlun is controlled by Opera’s chairman and chief executive officer, and it is the parent of Opera. |
nHorizon Infinite (Beijing) Software Ltd. (“nHorizon Infinite”) |
|
Entity over which Opera had joint control. |
OPay Ltd., and its subsidiaries (“OPay”) |
|
Opera’s chairman and chief executive officer has significant influence over OPay and he is a member of its key management personnel. |
Qifei International Development Co., Ltd. |
|
Entity which had significant influence over Opera. |
Verda Ventures, LLC |
|
Entity over which Opera has significant influence. |
Wisdom Connection III Holding Inc. |
|
Entity controlled by a member of the key management personnel of Opera’s majority shareholder, who also was a director of Opera. |
_______________
(1)The table describes the nature of the related party relationships at the time Opera had transactions with the entities.
Transactions with Related Parties
In April 2022, Opera sold its 19.4% ownership interest in Star X to Kunlun for a fixed consideration of $83.5 million, plus a simple annual interest of 3.5% accruing on the agreed deferred settlement. An initial $28.4 million installment was received in 2022. In mid-2023, as Opera declared the first semi-annual dividend of $0.40 per share under the recurring cash dividend program adopted at the same time (see Note 16), the dividends payable on the ordinary shares held by Kunlun, totaling $25.1 million, were offset against Opera’s Star X receivable. As Opera declared its second and third semi-annual dividends, each of $0.40 per share, the offsets against the Star X receivable was another $25.1 million in January 2024 and a final $7.8 million in July 2024, after which the receivable was fully settled. See Note 12 for additional information.
In October 2022, Opera repurchased the current equivalent of 23,375,000 ordinary shares for $128.6 million from its pre-IPO shareholder Qifei International Development Co. Ltd., a subsidiary of 360 Security Technology Inc., which is no longer a shareholder in Opera as a result.
In January 2023, Opera sold a portfolio of marketable securities to Kunlun and Keeneyes Future Holding. Opera had acquired the securities as part of its investment program, which was terminated after the sale transaction (see Note 16). The transaction price was determined as the daily average closing price for the shares over the 15 trading days preceding the sale transaction. The receivables, totaling $59.0 million, were settled by offsetting equal amounts of dividends payable to Kunlun and Keeneyes Future Holding following the special dividend declared in the same month (see Note 16).
In January 2023, Opera entered into a strategic cooperation agreement with nHorizon Infinite under which nHorizon Infinite sources advertising inventory from supply-side platforms and publishers for Opera to sell to its customers. nHorizon Infinite is entitled to 30% of the net revenue Opera generates from the sale of the inventory. At the time the agreement was entered into, nHorizon Infinite was classified as a joint venture, but later in 2023 the arrangement establishing joint control was terminated. The table below showing the amount of transactions with related parties include the income and expenses from transactions with nHorizon Infinite during the period it was a joint venture.
In May 2024, Opera entered into an agreement with Kunlun to provide it with on-demand cloud computing resources when excess capacity allows in exchange for fixed monthly fees per instance (server) used. Total revenue recognized in 2024 from this arrangement was $0.7 million.
In July 2024, Opera entered into subscription and capital commitment agreements with a venture fund operated by Verda Ventures, as described in Note 11. The fund operated by Verda Ventures is classified as an associate and accounted for in accordance with the equity method as Opera has significant influence over the entity.
Kunlun has enrolled certain employees of Opera in its share incentive plan under which these employees have received options issued by Kunlun as compensation for services they provide to Opera. Opera does not have any obligation to settle the awards granted by Kunlun and these awards do not lead to dilution for Opera shareholders because the employees receive shares in Kunlun when the awards are exercised. Opera accounts for the fair value of the awards as a personnel expense over the vesting period with a corresponding increase in equity, effectively as an equity contribution from Kunlun. See Note 4 for additional details on Kunlun’s share incentive plan.
Opera acquires various services from Kunlun on a continuous basis, including a lease of office property in Beijing, China, and engineering services. Certain costs Opera incurs due to being a subsidiary of Kunlun are reimbursed by Kunlun.
The following table summarizes the amounts of transactions with related parties by type of transaction (in thousands):
|
|
|
|
|
|
|
|
|
|
|
|
|
|
|
Year ended December 31, |
|
|
|
2022 |
|
|
2023 |
|
|
2024 |
|
Beijing OFY: |
|
|
|
|
|
|
|
|
|
Sale of goods and services |
|
$ |
256 |
|
|
$ |
— |
|
|
$ |
— |
|
Keeneyes Future Holding: |
|
|
|
|
|
|
|
|
|
Sale of marketable securities |
|
$ |
— |
|
|
$ |
7,800 |
|
|
$ |
— |
|
Kunlun: |
|
|
|
|
|
|
|
|
|
Sale of goods and services |
|
$ |
1,055 |
|
|
$ |
926 |
|
|
$ |
744 |
|
Purchases of goods and services |
|
$ |
(5,737 |
) |
|
$ |
(1,361 |
) |
|
$ |
(615 |
) |
Share-based compensation |
|
$ |
(1,865 |
) |
|
$ |
(6,450 |
) |
|
$ |
(2,872 |
) |
Sale of shares in Star X |
|
$ |
83,468 |
|
|
$ |
— |
|
|
$ |
— |
|
Interest income on receivable from sale of Star X |
|
$ |
1,285 |
|
|
$ |
1,556 |
|
|
$ |
165 |
|
Sale of marketable securities |
|
$ |
— |
|
|
$ |
51,208 |
|
|
$ |
— |
|
nHorizon Infinite: |
|
|
|
|
|
|
|
|
|
Sale of goods and services |
|
$ |
543 |
|
|
$ |
42 |
|
|
$ |
— |
|
Purchases of goods and services |
|
$ |
(1,777 |
) |
|
$ |
(2,448 |
) |
|
$ |
— |
|
Qifei International Development Co.: |
|
|
|
|
|
|
|
|
|
Repurchase of shares |
|
$ |
(128,563 |
) |
|
$ |
— |
|
|
$ |
— |
|
Verda Ventures: |
|
|
|
|
|
|
|
|
|
Investment in units |
|
$ |
— |
|
|
$ |
— |
|
|
$ |
1,250 |
|
See Note 4 for details on compensation to key management personnel.
Balances with Related Parties
The table below shows outstanding balances with related parties (in thousands):
|
|
|
|
|
|
|
|
|
|
|
|
|
|
|
|
|
|
|
As of December 31, 2023 |
|
|
As of December 31, 2024 |
|
|
|
Receivables |
|
|
Payables |
|
|
Receivables |
|
|
Payables |
|
Kunlun |
|
$ |
34,098 |
|
|
$ |
372 |
|
|
$ |
233 |
|
|
$ |
24 |
|
OPay |
|
|
589 |
|
|
|
111 |
|
|
|
479 |
|
|
|
— |
|
Wisdom Connection III Holding |
|
|
500 |
|
|
|
— |
|
|
|
— |
|
|
|
— |
|
Total |
|
$ |
35,187 |
|
|
$ |
483 |
|
|
$ |
713 |
|
|
$ |
24 |
|
The receivable due from Wisdom Connection III Holding, which arose in 2019 from a sale of shares in OPay, was paid in 2024.
As of December 31, 2024, Opera had recognized loss provisions for receivables due from related parties of $0.1 million (2023: $0.3 million).
Note 18. Events After the Reporting Period
During January and February 2025, Opera granted a total of 1,853,450 RSUs to employees, which are scheduled to vest over the 2025-2028 period, and with a weighted average grant date fair value of $19.67. As a consequence of the dividend of $0.40 per share announced on December 12, 2024, and distributed on January 13, 2025, all unexercised RSU grants as of the record date were adjusted with the dividend yield, resulting in an increase of 65,572 RSUs. Subsequent to February 27, 2025, an exercise period under Opera’s share incentive plan took place from which 1,020,700 ADSs were transferred to Opera employees.