0001726173FALSEFY2021.2111.2http://biglariholdings.com/20211231#OperatingAndFinanceLeaseLiabilityCurrenthttp://biglariholdings.com/20211231#OperatingAndFinanceLeaseLiabilityCurrenthttp://biglariholdings.com/20211231#OperatingAndFinanceLeaseLiabilityNoncurrenthttp://biglariholdings.com/20211231#OperatingAndFinanceLeaseLiabilityNoncurrenthttp://biglariholdings.com/20211231#OperatingAndFinanceLeaseLiabilityCurrenthttp://biglariholdings.com/20211231#OperatingAndFinanceLeaseLiabilityCurrenthttp://biglariholdings.com/20211231#OperatingAndFinanceLeaseLiabilityNoncurrenthttp://biglariholdings.com/20211231#OperatingAndFinanceLeaseLiabilityNoncurrent00017261732021-01-012021-12-310001726173us-gaap:CommonClassAMember2021-01-012021-12-310001726173us-gaap:CommonClassBMember2021-01-012021-12-3100017261732021-06-30iso4217:USD0001726173us-gaap:CommonClassAMember2022-02-21xbrli:shares0001726173us-gaap:CommonClassBMember2022-02-2100017261732021-12-3100017261732020-12-310001726173bh:RestaurantOperationsMember2021-01-012021-12-310001726173bh:RestaurantOperationsMember2020-01-012020-12-310001726173bh:RestaurantOperationsMember2019-01-012019-12-310001726173bh:InsuranceOperationsMember2021-01-012021-12-310001726173bh:InsuranceOperationsMember2020-01-012020-12-310001726173bh:InsuranceOperationsMember2019-01-012019-12-310001726173us-gaap:OilAndGasMember2021-01-012021-12-310001726173us-gaap:OilAndGasMember2020-01-012020-12-310001726173us-gaap:OilAndGasMember2019-01-012019-12-310001726173bh:MediaAndLicensingMember2021-01-012021-12-310001726173bh:MediaAndLicensingMember2020-01-012020-12-310001726173bh:MediaAndLicensingMember2019-01-012019-12-3100017261732020-01-012020-12-3100017261732019-01-012019-12-31iso4217:USDxbrli:shares0001726173us-gaap:CommonClassAMember2020-01-012020-12-310001726173us-gaap:CommonClassAMember2019-01-012019-12-310001726173us-gaap:CommonClassBMember2020-01-012020-12-310001726173us-gaap:CommonClassBMember2019-01-012019-12-31xbrli:pure00017261732019-12-3100017261732018-12-310001726173us-gaap:CommonStockMember2018-12-310001726173us-gaap:AdditionalPaidInCapitalMember2018-12-310001726173us-gaap:RetainedEarningsMember2018-12-310001726173us-gaap:AccumulatedOtherComprehensiveIncomeMember2018-12-310001726173us-gaap:TreasuryStockMember2018-12-310001726173us-gaap:RetainedEarningsMember2019-01-012019-12-310001726173srt:CumulativeEffectPeriodOfAdoptionAdjustmentMemberus-gaap:RetainedEarningsMember2018-12-310001726173srt:CumulativeEffectPeriodOfAdoptionAdjustmentMember2018-12-310001726173us-gaap:AccumulatedOtherComprehensiveIncomeMember2019-01-012019-12-310001726173us-gaap:AdditionalPaidInCapitalMember2019-01-012019-12-310001726173us-gaap:TreasuryStockMember2019-01-012019-12-310001726173us-gaap:CommonStockMember2019-12-310001726173us-gaap:AdditionalPaidInCapitalMember2019-12-310001726173us-gaap:RetainedEarningsMember2019-12-310001726173us-gaap:AccumulatedOtherComprehensiveIncomeMember2019-12-310001726173us-gaap:TreasuryStockMember2019-12-310001726173us-gaap:RetainedEarningsMember2020-01-012020-12-310001726173us-gaap:AccumulatedOtherComprehensiveIncomeMember2020-01-012020-12-310001726173us-gaap:AdditionalPaidInCapitalMember2020-01-012020-12-310001726173us-gaap:TreasuryStockMember2020-01-012020-12-310001726173us-gaap:CommonStockMember2020-12-310001726173us-gaap:AdditionalPaidInCapitalMember2020-12-310001726173us-gaap:RetainedEarningsMember2020-12-310001726173us-gaap:AccumulatedOtherComprehensiveIncomeMember2020-12-310001726173us-gaap:TreasuryStockMember2020-12-310001726173us-gaap:RetainedEarningsMember2021-01-012021-12-310001726173us-gaap:AccumulatedOtherComprehensiveIncomeMember2021-01-012021-12-310001726173us-gaap:AdditionalPaidInCapitalMember2021-01-012021-12-310001726173us-gaap:TreasuryStockMember2021-01-012021-12-310001726173us-gaap:CommonStockMember2021-12-310001726173us-gaap:AdditionalPaidInCapitalMember2021-12-310001726173us-gaap:RetainedEarningsMember2021-12-310001726173us-gaap:AccumulatedOtherComprehensiveIncomeMember2021-12-310001726173us-gaap:TreasuryStockMember2021-12-310001726173bh:MrBiglariMember2021-12-310001726173srt:MinimumMemberus-gaap:BuildingAndBuildingImprovementsMember2021-01-012021-12-310001726173srt:MaximumMemberus-gaap:BuildingAndBuildingImprovementsMember2021-01-012021-12-310001726173us-gaap:EquipmentMembersrt:MinimumMember2021-01-012021-12-310001726173us-gaap:EquipmentMembersrt:MaximumMember2021-01-012021-12-310001726173us-gaap:CommonClassAMember2021-12-310001726173us-gaap:CommonClassBMember2021-12-310001726173us-gaap:CommonClassAMember2020-12-310001726173us-gaap:CommonClassBMember2020-12-310001726173us-gaap:CommonClassBMember2019-12-310001726173us-gaap:CommonClassAMember2019-12-310001726173bh:RestaurantOperationsMemberus-gaap:ProductMember2021-01-012021-12-310001726173bh:RestaurantOperationsMemberus-gaap:ProductMember2020-01-012020-12-310001726173bh:RestaurantOperationsMemberus-gaap:ProductMember2019-01-012019-12-310001726173bh:RestaurantOperationsMemberus-gaap:FranchisorMember2021-01-012021-12-310001726173bh:RestaurantOperationsMemberus-gaap:FranchisorMember2020-01-012020-12-310001726173bh:RestaurantOperationsMemberus-gaap:FranchisorMember2019-01-012019-12-310001726173bh:RestaurantOperationsMemberus-gaap:RoyaltyMember2021-01-012021-12-310001726173bh:RestaurantOperationsMemberus-gaap:RoyaltyMember2020-01-012020-12-310001726173bh:RestaurantOperationsMemberus-gaap:RoyaltyMember2019-01-012019-12-310001726173bh:RestaurantOperationsMemberus-gaap:ProductAndServiceOtherMember2021-01-012021-12-310001726173bh:RestaurantOperationsMemberus-gaap:ProductAndServiceOtherMember2020-01-012020-12-310001726173bh:RestaurantOperationsMemberus-gaap:ProductAndServiceOtherMember2019-01-012019-12-310001726173bh:RestaurantOperationsMember2021-01-012021-12-310001726173bh:RestaurantOperationsMember2020-01-012020-12-310001726173bh:RestaurantOperationsMember2019-01-012019-12-310001726173us-gaap:FranchiseMember2021-01-012021-12-310001726173us-gaap:FranchiseMember2020-01-012020-12-310001726173us-gaap:FranchiseMember2019-01-012019-12-310001726173us-gaap:FranchiseMember2021-12-310001726173us-gaap:FranchiseMember2020-12-3100017261732022-01-01us-gaap:FranchiseMember2021-12-310001726173us-gaap:AdvertisingMember2021-01-012021-12-310001726173us-gaap:AdvertisingMember2020-01-012020-12-310001726173us-gaap:AdvertisingMember2019-01-012019-12-310001726173us-gaap:AdvertisingMember2021-12-310001726173us-gaap:AdvertisingMember2020-12-310001726173us-gaap:AdvertisingMember2022-01-012021-12-310001726173bh:GiftCardsMember2021-01-012021-12-310001726173bh:GiftCardsMember2020-01-012020-12-310001726173bh:GiftCardsMember2019-01-012019-12-310001726173bh:GiftCardsMember2021-12-310001726173bh:GiftCardsMember2020-12-3100017261732022-01-01bh:GiftCardsMember2021-12-3100017261732014-12-31utr:acre00017261732014-01-012014-12-310001726173bh:FairValueMember2018-12-310001726173bh:CompanyCommonStockMember2018-12-310001726173bh:CarryingValueMember2018-12-310001726173bh:FairValueMember2019-01-012019-12-310001726173bh:CompanyCommonStockMember2019-01-012019-12-310001726173bh:CarryingValueMember2019-01-012019-12-310001726173bh:FairValueMember2019-12-310001726173bh:CompanyCommonStockMember2019-12-310001726173bh:CarryingValueMember2019-12-310001726173bh:FairValueMember2020-01-012020-12-310001726173bh:CompanyCommonStockMember2020-01-012020-12-310001726173bh:CarryingValueMember2020-01-012020-12-310001726173bh:FairValueMember2020-12-310001726173bh:CompanyCommonStockMember2020-12-310001726173bh:CarryingValueMember2020-12-310001726173bh:FairValueMember2021-01-012021-12-310001726173bh:CompanyCommonStockMember2021-01-012021-12-310001726173bh:CarryingValueMember2021-01-012021-12-310001726173bh:FairValueMember2021-12-310001726173bh:CompanyCommonStockMember2021-12-310001726173bh:CarryingValueMember2021-12-310001726173bh:BiglariEntitiesMember2021-12-310001726173bh:LionFundMember2021-12-310001726173bh:LionFundIIMember2021-12-310001726173bh:LionFundMember2021-01-012021-12-310001726173bh:LionFundIIMember2021-01-012021-12-310001726173bh:LionFundMember2020-12-310001726173bh:LionFundIIMember2020-12-310001726173bh:LionFundMember2020-01-012020-12-310001726173bh:LionFundIIMember2020-01-012020-12-310001726173bh:LionFundMember2019-12-310001726173bh:LionFundIIMember2019-12-310001726173bh:LionFundMember2019-01-012019-12-310001726173bh:LionFundIIMember2019-01-012019-12-310001726173us-gaap:BuildingMember2021-01-012021-12-310001726173us-gaap:LandMember2021-01-012021-12-310001726173us-gaap:LandAndLandImprovementsMember2021-01-012021-12-310001726173bh:RestaurantOperationsMember2018-12-310001726173bh:InsuranceSegmentMember2018-12-310001726173bh:InsuranceSegmentMember2019-01-012019-12-310001726173bh:RestaurantOperationsMember2019-12-310001726173bh:InsuranceSegmentMember2019-12-310001726173bh:InsuranceSegmentMember2020-01-012020-12-310001726173bh:RestaurantOperationsMember2020-12-310001726173bh:InsuranceSegmentMember2020-12-310001726173bh:InsuranceSegmentMember2021-01-012021-12-310001726173bh:RestaurantOperationsMember2021-12-310001726173bh:InsuranceSegmentMember2021-12-310001726173us-gaap:TradeNamesMember2019-12-310001726173bh:LeaseRightsMember2019-12-310001726173us-gaap:TradeNamesMember2020-01-012020-12-310001726173bh:LeaseRightsMember2020-01-012020-12-310001726173us-gaap:TradeNamesMember2020-12-310001726173bh:LeaseRightsMember2020-12-310001726173us-gaap:TradeNamesMember2021-01-012021-12-310001726173bh:LeaseRightsMember2021-01-012021-12-310001726173us-gaap:TradeNamesMember2021-12-310001726173bh:LeaseRightsMember2021-12-310001726173bh:InternationalRestaurantOperationsMember2021-01-012021-12-310001726173bh:InternationalRestaurantOperationsMember2020-01-012020-12-310001726173bh:SteakNShakeCreditFacilityMember2014-03-190001726173bh:SteakNShakeCreditFacilityMember2020-12-310001726173us-gaap:RevolvingCreditFacilityMemberbh:WesternSizzlinRevolverMember2020-12-310001726173us-gaap:RevolvingCreditFacilityMemberbh:WesternSizzlinRevolverMember2021-12-310001726173bh:SubleasesMember2021-12-310001726173bh:OwnedPropertiesMember2021-12-310001726173bh:BiglariEntitiesMember2017-10-012017-10-010001726173bh:BiglariEntitiesMember2021-01-012021-12-310001726173bh:BiglariEntitiesMember2020-01-012020-12-310001726173bh:LionFundIILPMember2021-12-310001726173bh:LionFundLPMember2021-12-310001726173bh:MrBiglariMember2021-01-012021-12-310001726173bh:MrBiglariMember2019-01-012019-12-310001726173bh:MrBiglariMember2020-01-012020-12-310001726173us-gaap:FairValueInputsLevel1Member2021-12-310001726173us-gaap:FairValueInputsLevel2Member2021-12-310001726173us-gaap:FairValueInputsLevel3Member2021-12-310001726173us-gaap:FairValueInputsLevel1Member2020-12-310001726173us-gaap:FairValueInputsLevel2Member2020-12-310001726173us-gaap:FairValueInputsLevel3Member2020-12-310001726173us-gaap:FairValueInputsLevel1Memberbh:ConsumerGoodsEquitySecurityMember2021-12-310001726173us-gaap:FairValueInputsLevel2Memberbh:ConsumerGoodsEquitySecurityMember2021-12-310001726173bh:ConsumerGoodsEquitySecurityMemberus-gaap:FairValueInputsLevel3Member2021-12-310001726173bh:ConsumerGoodsEquitySecurityMember2021-12-310001726173us-gaap:FairValueInputsLevel1Memberbh:ConsumerGoodsEquitySecurityMember2020-12-310001726173us-gaap:FairValueInputsLevel2Memberbh:ConsumerGoodsEquitySecurityMember2020-12-310001726173bh:ConsumerGoodsEquitySecurityMemberus-gaap:FairValueInputsLevel3Member2020-12-310001726173bh:ConsumerGoodsEquitySecurityMember2020-12-310001726173us-gaap:FairValueInputsLevel1Memberbh:InsuranceEquitySecurityMember2021-12-310001726173us-gaap:FairValueInputsLevel2Memberbh:InsuranceEquitySecurityMember2021-12-310001726173us-gaap:FairValueInputsLevel3Memberbh:InsuranceEquitySecurityMember2021-12-310001726173bh:InsuranceEquitySecurityMember2021-12-310001726173us-gaap:FairValueInputsLevel1Memberbh:InsuranceEquitySecurityMember2020-12-310001726173us-gaap:FairValueInputsLevel2Memberbh:InsuranceEquitySecurityMember2020-12-310001726173us-gaap:FairValueInputsLevel3Memberbh:InsuranceEquitySecurityMember2020-12-310001726173bh:InsuranceEquitySecurityMember2020-12-310001726173us-gaap:FairValueInputsLevel1Memberbh:TechnologyEquitySecurityMember2021-12-310001726173us-gaap:FairValueInputsLevel2Memberbh:TechnologyEquitySecurityMember2021-12-310001726173bh:TechnologyEquitySecurityMemberus-gaap:FairValueInputsLevel3Member2021-12-310001726173bh:TechnologyEquitySecurityMember2021-12-310001726173us-gaap:FairValueInputsLevel1Memberbh:TechnologyEquitySecurityMember2020-12-310001726173us-gaap:FairValueInputsLevel2Memberbh:TechnologyEquitySecurityMember2020-12-310001726173bh:TechnologyEquitySecurityMemberus-gaap:FairValueInputsLevel3Member2020-12-310001726173bh:TechnologyEquitySecurityMember2020-12-310001726173us-gaap:FairValueInputsLevel1Memberus-gaap:USTreasuryAndGovernmentMember2021-12-310001726173us-gaap:FairValueInputsLevel2Memberus-gaap:USTreasuryAndGovernmentMember2021-12-310001726173us-gaap:FairValueInputsLevel3Memberus-gaap:USTreasuryAndGovernmentMember2021-12-310001726173us-gaap:USTreasuryAndGovernmentMember2021-12-310001726173us-gaap:FairValueInputsLevel1Memberus-gaap:USTreasuryAndGovernmentMember2020-12-310001726173us-gaap:FairValueInputsLevel2Memberus-gaap:USTreasuryAndGovernmentMember2020-12-310001726173us-gaap:FairValueInputsLevel3Memberus-gaap:USTreasuryAndGovernmentMember2020-12-310001726173us-gaap:USTreasuryAndGovernmentMember2020-12-310001726173us-gaap:FairValueInputsLevel1Memberus-gaap:CorporateDebtSecuritiesMember2021-12-310001726173us-gaap:FairValueInputsLevel2Memberus-gaap:CorporateDebtSecuritiesMember2021-12-310001726173us-gaap:FairValueInputsLevel3Memberus-gaap:CorporateDebtSecuritiesMember2021-12-310001726173us-gaap:CorporateDebtSecuritiesMember2021-12-310001726173us-gaap:FairValueInputsLevel1Memberus-gaap:CorporateDebtSecuritiesMember2020-12-310001726173us-gaap:FairValueInputsLevel2Memberus-gaap:CorporateDebtSecuritiesMember2020-12-310001726173us-gaap:FairValueInputsLevel3Memberus-gaap:CorporateDebtSecuritiesMember2020-12-310001726173us-gaap:CorporateDebtSecuritiesMember2020-12-310001726173us-gaap:AccumulatedTranslationAdjustmentMember2020-12-310001726173us-gaap:AccumulatedTranslationAdjustmentMember2019-12-310001726173us-gaap:AccumulatedTranslationAdjustmentMember2018-12-310001726173us-gaap:AccumulatedTranslationAdjustmentMember2021-01-012021-12-310001726173us-gaap:AccumulatedTranslationAdjustmentMember2020-01-012020-12-310001726173us-gaap:AccumulatedTranslationAdjustmentMember2019-01-012019-12-310001726173us-gaap:AccumulatedTranslationAdjustmentMember2021-12-310001726173bh:RestaurantOperationsMemberbh:SteakNShakeMember2021-01-012021-12-310001726173bh:RestaurantOperationsMemberbh:SteakNShakeMember2020-01-012020-12-310001726173bh:RestaurantOperationsMemberbh:SteakNShakeMember2019-01-012019-12-310001726173bh:WesternSizzlinMemberbh:RestaurantOperationsMember2021-01-012021-12-310001726173bh:WesternSizzlinMemberbh:RestaurantOperationsMember2020-01-012020-12-310001726173bh:WesternSizzlinMemberbh:RestaurantOperationsMember2019-01-012019-12-310001726173bh:InsuranceUnderwritingMemberbh:InsuranceOperationsMemberbh:FirstGuardMember2021-01-012021-12-310001726173bh:InsuranceUnderwritingMemberbh:InsuranceOperationsMemberbh:FirstGuardMember2020-01-012020-12-310001726173bh:InsuranceUnderwritingMemberbh:InsuranceOperationsMemberbh:FirstGuardMember2019-01-012019-12-310001726173bh:InsuranceUnderwritingMemberbh:SouthernPioneerMemberbh:InsuranceOperationsMember2021-01-012021-12-310001726173bh:InsuranceUnderwritingMemberbh:SouthernPioneerMemberbh:InsuranceOperationsMember2020-01-012020-12-310001726173bh:InsuranceUnderwritingMemberbh:SouthernPioneerMemberbh:InsuranceOperationsMember2019-01-012019-12-310001726173bh:InsuranceOperationsMemberbh:InsuranceInvestmentIncomeAndOtherMember2021-01-012021-12-310001726173bh:InsuranceOperationsMemberbh:InsuranceInvestmentIncomeAndOtherMember2020-01-012020-12-310001726173bh:InsuranceOperationsMemberbh:InsuranceInvestmentIncomeAndOtherMember2019-01-012019-12-310001726173bh:InsuranceOperationsMember2021-01-012021-12-310001726173bh:InsuranceOperationsMember2020-01-012020-12-310001726173bh:InsuranceOperationsMember2019-01-012019-12-310001726173bh:SouthernOilMember2021-01-012021-12-310001726173bh:SouthernOilMember2020-01-012020-12-310001726173bh:SouthernOilMember2019-01-012019-12-310001726173bh:MaximMember2021-01-012021-12-310001726173bh:MaximMember2020-01-012020-12-310001726173bh:MaximMember2019-01-012019-12-310001726173bh:RestaurantOperationsMemberbh:SteakNShakeMemberus-gaap:OperatingSegmentsMember2021-01-012021-12-310001726173bh:RestaurantOperationsMemberbh:SteakNShakeMemberus-gaap:OperatingSegmentsMember2020-01-012020-12-310001726173bh:RestaurantOperationsMemberbh:SteakNShakeMemberus-gaap:OperatingSegmentsMember2019-01-012019-12-310001726173bh:WesternSizzlinMemberbh:RestaurantOperationsMemberus-gaap:OperatingSegmentsMember2021-01-012021-12-310001726173bh:WesternSizzlinMemberbh:RestaurantOperationsMemberus-gaap:OperatingSegmentsMember2020-01-012020-12-310001726173bh:WesternSizzlinMemberbh:RestaurantOperationsMemberus-gaap:OperatingSegmentsMember2019-01-012019-12-310001726173bh:RestaurantOperationsMemberus-gaap:OperatingSegmentsMember2021-01-012021-12-310001726173bh:RestaurantOperationsMemberus-gaap:OperatingSegmentsMember2020-01-012020-12-310001726173bh:RestaurantOperationsMemberus-gaap:OperatingSegmentsMember2019-01-012019-12-310001726173bh:InsuranceUnderwritingMemberbh:InsuranceOperationsMemberbh:FirstGuardMemberus-gaap:OperatingSegmentsMember2021-01-012021-12-310001726173bh:InsuranceUnderwritingMemberbh:InsuranceOperationsMemberbh:FirstGuardMemberus-gaap:OperatingSegmentsMember2020-01-012020-12-310001726173bh:InsuranceUnderwritingMemberbh:InsuranceOperationsMemberbh:FirstGuardMemberus-gaap:OperatingSegmentsMember2019-01-012019-12-310001726173bh:InsuranceUnderwritingMemberbh:SouthernPioneerMemberbh:InsuranceOperationsMemberus-gaap:OperatingSegmentsMember2021-01-012021-12-310001726173bh:InsuranceUnderwritingMemberbh:SouthernPioneerMemberbh:InsuranceOperationsMemberus-gaap:OperatingSegmentsMember2020-01-012020-12-310001726173bh:InsuranceUnderwritingMemberbh:SouthernPioneerMemberbh:InsuranceOperationsMemberus-gaap:OperatingSegmentsMember2019-01-012019-12-310001726173bh:InsuranceOperationsMemberus-gaap:OperatingSegmentsMemberbh:InsuranceInvestmentIncomeAndOtherMember2021-01-012021-12-310001726173bh:InsuranceOperationsMemberus-gaap:OperatingSegmentsMemberbh:InsuranceInvestmentIncomeAndOtherMember2020-01-012020-12-310001726173bh:InsuranceOperationsMemberus-gaap:OperatingSegmentsMemberbh:InsuranceInvestmentIncomeAndOtherMember2019-01-012019-12-310001726173bh:InsuranceOperationsMemberus-gaap:OperatingSegmentsMember2021-01-012021-12-310001726173bh:InsuranceOperationsMemberus-gaap:OperatingSegmentsMember2020-01-012020-12-310001726173bh:InsuranceOperationsMemberus-gaap:OperatingSegmentsMember2019-01-012019-12-310001726173bh:SouthernOilMemberus-gaap:OperatingSegmentsMember2021-01-012021-12-310001726173bh:SouthernOilMemberus-gaap:OperatingSegmentsMember2020-01-012020-12-310001726173bh:SouthernOilMemberus-gaap:OperatingSegmentsMember2019-01-012019-12-310001726173us-gaap:OperatingSegmentsMemberbh:MaximMember2021-01-012021-12-310001726173us-gaap:OperatingSegmentsMemberbh:MaximMember2020-01-012020-12-310001726173us-gaap:OperatingSegmentsMemberbh:MaximMember2019-01-012019-12-310001726173us-gaap:OperatingSegmentsMember2021-01-012021-12-310001726173us-gaap:OperatingSegmentsMember2020-01-012020-12-310001726173us-gaap:OperatingSegmentsMember2019-01-012019-12-310001726173us-gaap:MaterialReconcilingItemsMember2021-01-012021-12-310001726173us-gaap:MaterialReconcilingItemsMember2020-01-012020-12-310001726173us-gaap:MaterialReconcilingItemsMember2019-01-012019-12-310001726173bh:RestaurantOperationsMemberbh:SteakNShakeMemberus-gaap:OperatingSegmentsMember2021-12-310001726173bh:RestaurantOperationsMemberbh:SteakNShakeMemberus-gaap:OperatingSegmentsMember2020-12-310001726173bh:WesternSizzlinMemberbh:RestaurantOperationsMemberus-gaap:OperatingSegmentsMember2021-12-310001726173bh:WesternSizzlinMemberbh:RestaurantOperationsMemberus-gaap:OperatingSegmentsMember2020-12-310001726173bh:RestaurantOperationsMemberus-gaap:OperatingSegmentsMember2021-12-310001726173bh:RestaurantOperationsMemberus-gaap:OperatingSegmentsMember2020-12-310001726173bh:InsuranceOperationsMemberbh:FirstGuardMemberus-gaap:OperatingSegmentsMember2021-12-310001726173bh:InsuranceOperationsMemberbh:FirstGuardMemberus-gaap:OperatingSegmentsMember2020-12-310001726173bh:SouthernPioneerMemberbh:InsuranceOperationsMemberus-gaap:OperatingSegmentsMember2021-12-310001726173bh:SouthernPioneerMemberbh:InsuranceOperationsMemberus-gaap:OperatingSegmentsMember2020-12-310001726173bh:InsuranceOperationsMemberus-gaap:OperatingSegmentsMember2021-12-310001726173bh:InsuranceOperationsMemberus-gaap:OperatingSegmentsMember2020-12-310001726173bh:SouthernOilMemberus-gaap:OperatingSegmentsMember2021-12-310001726173bh:SouthernOilMemberus-gaap:OperatingSegmentsMember2020-12-310001726173us-gaap:OperatingSegmentsMemberbh:MaximMember2021-12-310001726173us-gaap:OperatingSegmentsMemberbh:MaximMember2020-12-310001726173us-gaap:CorporateNonSegmentMember2021-12-310001726173us-gaap:CorporateNonSegmentMember2020-12-310001726173us-gaap:MaterialReconcilingItemsMember2021-12-310001726173us-gaap:MaterialReconcilingItemsMember2020-12-310001726173srt:OilReservesMember2020-12-310001726173srt:NaturalGasReservesMember2020-12-310001726173bh:BarrelOfOilEquivalentMember2020-12-310001726173srt:OilReservesMember2021-01-012021-12-310001726173srt:NaturalGasReservesMember2021-01-012021-12-310001726173bh:BarrelOfOilEquivalentMember2021-01-012021-12-310001726173srt:OilReservesMember2021-12-310001726173srt:NaturalGasReservesMember2021-12-310001726173bh:BarrelOfOilEquivalentMember2021-12-31
UNITED STATES
SECURITIES AND EXCHANGE COMMISSION
Washington, D.C. 20549
FORM 10-K
| | | | | | | | |
| x | | ANNUAL REPORT PURSUANT TO SECTION 13 OR 15(d) OF THE SECURITIES EXCHANGE ACT OF 1934 |
For the fiscal year ended December 31, 2021
or
| | | | | | | | |
| ¨ | | TRANSITION REPORT PURSUANT TO SECTION 13 OR 15(d) OF THE SECURITIES EXCHANGE ACT OF 1934 |
For the transition period from ____ to ____
Commission file number 001-38477
BIGLARI HOLDINGS INC.
(Exact name of registrant as specified in its charter)
| | | | | | | | |
| Indiana | | 82-3784946 |
| (State or other jurisdiction of incorporation) | | (I.R.S. Employer Identification No.) |
| | | | | | | | |
| 17802 IH 10 West, | Suite 400 | |
San Antonio, | Texas | 78257 |
| (Address of principal executive offices) | (Zip Code) |
(210) 344-3400
Registrant’s telephone number, including area code
Securities registered pursuant to Section 12(b) of the Act:
| | | | | | | | |
| Title of each class | Trading Symbols | Name of each exchange on which registered |
| Class A Common Stock, no par value | BH.A | New York Stock Exchange |
| Class B Common Stock, no par value | BH | New York Stock Exchange |
Securities registered pursuant to Section 12(g) of the Act:
NONE
Indicate by check mark if the registrant is a well-known seasoned issuer, as defined in Rule 405 of the Securities Act. Yes ¨ No x
Indicate by check mark if the registrant is not required to file reports pursuant to Section 13 or Section 15(d) of the Act. Yes ¨ No x
Indicate by check mark whether the registrant (1) has filed all reports required to be filed by Section 13 or 15(d) of the Securities Exchange Act of 1934 during the preceding 12 months (or for such shorter period that the registrant was required to file such reports), and (2) has been subject to such filing requirements for the past 90 days. Yes x No ¨
Indicate by check mark whether the registrant has submitted electronically every Interactive Data File required to be submitted pursuant to Rule 405 of Regulation S-T (Section 232.405 of this chapter) during the preceding 12 months (or for such shorter period that the registrant was required to submit such files). Yes x No ¨
Indicate by check mark whether the registrant is a large accelerated filer, an accelerated filer, a non-accelerated filer, a smaller reporting company, or an emerging growth company. See the definitions of “large accelerated filer,” “accelerated filer,” “smaller reporting company” and “emerging growth company” in Rule 12b-2 of the Exchange Act. (Check one):
| | | | | | | | | | | | | | | | | | | | | | | | | | | | | |
| Large accelerated filer | ¨ | Accelerated filer | x | Non-accelerated filer | ¨ | Smaller reporting company | ¨ | Emerging growth company | ¨ |
If an emerging growth company, indicate by check mark if the registrant has elected not to use the extended transition period for complying with any new or revised financial accounting standards provided pursuant to Section 13(a) of the Exchange Act. ¨
Indicate by check mark whether the registrant has filed a report on and attestation to its management’s assessment of the effectiveness of internal control over financial reporting under Section 404(b) of the Sarbanes-Oxley Act (15 U.S.C. 7262(b)) by the registered public accounting firm that prepared or issued its audit report. x
Indicate by check mark whether the registrant is a shell company (as defined in Rule 12b-2 of the Exchange Act). Yes ¨ No x
The aggregate market value of the voting and non-voting common stock held by non-affiliates of the registrant as of June 30, 2021 was approximately $173,487,448.
Number of shares of common stock outstanding as of February 21, 2022:
| | | | | |
| Class A common stock – | 206,864 | |
| Class B common stock – | 2,068,640 | |
DOCUMENTS INCORPORATED BY REFERENCE
Portions of the Registrant’s definitive Proxy Statement to be filed for its 2022 Annual Meeting of Shareholders are incorporated by reference into Part III of this Form 10-K.
Table of Contents
Part I
Item 1. Business
Biglari Holdings Inc. is a holding company owning subsidiaries engaged in a number of diverse business activities, including property and casualty insurance, licensing and media, restaurants, and oil and gas. The Company’s largest operating subsidiaries are involved in the franchising and operating of restaurants. Biglari Holdings is founded and led by Sardar Biglari, Chairman and Chief Executive Officer of the Company.
Biglari Holdings’ management system combines decentralized operations with centralized finance decision-making. Operating decisions for the various business units are made by their respective managers. All major investment and capital allocation decisions are made for the Company and its subsidiaries by Mr. Biglari.
As of December 31, 2021, Mr. Biglari beneficially owns shares of the Company that represent approximately 66.2% of the economic interest and approximately 70.4% of the voting interest.
Overview of the Impact of COVID-19
The novel coronavirus (“COVID-19”), declared a pandemic by the World Health Organization in March 2020, caused governments to impose restrictive measures to contain its spread. Those shutdowns significantly affected our operating businesses to varying degrees. The risks and uncertainties resulting from the pandemic may continue to affect our future earnings, cash flows, and financial condition. Accordingly, estimates used in the preparation of our financial statements, including those associated with the evaluation of certain long-lived assets, goodwill, and other intangible assets for impairment, may be subject to significant adjustments in future periods.
Restaurant Operations
The Company’s restaurant operations are conducted through two subsidiaries: Steak n Shake Inc. (“Steak n Shake”) and Western Sizzlin Corporation (“Western Sizzlin”) for a combined 577 units. As of December 31, 2021, Steak n Shake had 199 company-operated restaurants, 159 franchise partner units, and 178 traditional franchise units. Of the 199 company-operated units, 42 are currently closed but Steak n Shake intends to refranchise a majority of them. Western Sizzlin had 3 company-operated restaurants and 38 franchise units.
Founded in 1934 in Normal, Illinois, on Route 66, Steak n Shake is a classic American brand serving premium burgers and milkshakes. Steak n Shake is headquartered in Indianapolis, Indiana.
Founded in 1962 in Augusta, Georgia, Western Sizzlin is a steak and buffet concept serving signature steak dishes as well as other classic American menu items. Western Sizzlin also operates two other concepts: Great American Steak & Buffet, and Wood Grill Buffet. Western Sizzlin is headquartered in Roanoke, Virginia.
In response to COVID-19, our restaurants were required to close their dining rooms in the first quarter of 2020, and the majority of those dining rooms remained closed during 2020. Steak n Shake reopened the majority of dining rooms during 2021, and in doing so has implemented a self-service model. Our restaurant operations followed the guidance of health officials in determining the appropriate restrictions to put in place for each restaurant.
Company-Operated Restaurants
A typical company-operated restaurant management team consists of a general manager, a restaurant manager, and other managers, depending on the sales volume of the restaurant. Each restaurant’s general manager has primary responsibility for the day-to-day operations of his or her unit. Restaurant operations obtain food products and supplies from independent national distributors. Purchases are centrally negotiated to ensure uniformity in product quality.
Franchise Partner Restaurants
Steak n Shake offers a franchise partner program to transition company-operated restaurants to franchise partnerships. The franchise agreement stipulates that the franchisee make an upfront investment totaling $10,000. Steak n Shake, as the franchisor, assesses a fee of up to 15% of sales as well as 50% of profits. Potential franchise partners are screened based on entrepreneurial attitude and ability, but they become franchise partners based on achievement. Each must meet the gold standard in service. Franchise partners are required to be hands-on operators, limited to a single location.
Traditional Franchise Restaurants
Restaurant operations’ traditional franchising program extends the brands to areas in which there are no current development plans for company stores. The expansion plans include seeking qualified new franchisees and expanding relationships with
current franchisees. Restaurant operations typically seek franchisees with both the financial resources necessary to fund successful development and significant experience in the restaurant/retail business. Both restaurant chains assist franchisees with the development and ongoing operation of their restaurants. In addition, personnel assist franchisees with site selection, approve restaurant sites, and provide prototype plans, construction support, and specifications. Restaurant operations staff provides both on-site and off-site instruction to franchise restaurant management and associates.
International
We have a corporate office in Monaco and an international organization with personnel in various functions to support our international business. As of December 31, 2021, we operated four company locations in Europe to promote the Steak n Shake brand to prospective franchisees. Similar to our traditional domestic franchise agreements, a typical international franchise development agreement includes development and franchise fees in addition to subsequent royalty fees based on the gross sales of each restaurant. As of December 31, 2021, there were a total of 35 franchise units in Europe.
Competition
The restaurant business is one of the most intensely competitive industries. As there are virtually no barriers to entry into the restaurant business, competitors may include national, regional, and local establishments. Restaurant businesses compete on the basis of price, convenience, service, experience, menu variety, and product quality. The restaurant business is often affected by changes in consumer tastes and by national, regional, and local economic conditions. The performance of individual restaurants may be impacted by factors such as traffic patterns, demographic trends, weather conditions, and competing restaurants.
Because of government actions to contain the spread of COVID-19, our restaurants were required to close their dining rooms during the first quarter of 2020. Many of our competitors reopened their dining rooms in 2020, whereas the majority of our dining rooms reopened by December 31, 2021.
Government Regulations
The Company is subject to various global, federal, state, and local laws affecting its restaurant operations. Each of the restaurants must comply with licensing and regulation by a number of governmental authorities, i.e., health, sanitation, safety and fire agencies in the jurisdiction in which the restaurant is located.
Various federal and state labor laws govern our relationship with our employees, e.g., minimum wage, overtime pay, unemployment tax, health insurance, and workers’ compensation. Federal, state and local government agencies have established regulations requiring that we disclose nutritional information.
Trademark and Licenses
The name and reputation of Steak n Shake is a material asset, and management protects it and other service marks through appropriate registrations.
Insurance Business
Biglari Holdings’ insurance activities are conducted through two insurance entities, First Guard Insurance Company and its affiliated agency, 1st Guard Corporation (collectively “First Guard”), and Southern Pioneer Property & Casualty Insurance Company and its affiliated agency, Southern Pioneer Insurance Agency, Inc. (collectively “Southern Pioneer”). Our insurance businesses provide insurance of property and casualty.
The insurance business is stringently regulated by state insurance departments. Insurers based in the United States are subject to regulation by their states of domicile and by those states in which they are licensed to write policies on an admitted basis. First Guard and Southern Pioneer operate under licenses issued by various state insurance authorities. The primary focus of regulation is to assure that insurers are financially solvent and that policyholder interests are otherwise protected. States establish minimum capital levels for insurance companies and establish guidelines for permissible business and investment activities. States have the authority to suspend or revoke a company’s authority to do business as conditions warrant. States regulate the payment of dividends by insurance companies to their shareholders and other transactions with affiliates. Dividends, capital distributions, and other transactions of extraordinary amounts are subject to prior regulatory approval. Insurers may market, sell, and service insurance policies in the states where they are licensed. These insurers are referred to as admitted insurers. Admitted insurers are generally required to obtain regulatory approval of their policy forms and premium rates. Except for regulatory considerations, there are virtually no barriers to entry into the insurance industry.
First Guard is a direct underwriter of commercial truck insurance, selling physical damage and nontrucking liability insurance to truckers. The commercial truck insurance business is highly competitive in the areas of price and service. Vigorous competition is provided by large, well-capitalized companies and by small regional insurers. First Guard’s insurance products are marketed primarily through direct response methods via the Internet or by telephone. First Guard’s cost-efficient direct response marketing methods enable it to be a low-cost insurer. First Guard uses its own claim staff to manage claims. Seasonal
variations in First Guard’s insurance business are not significant. However, extraordinary weather conditions or other factors may have a significant effect upon the frequency or severity of claims. First Guard is headquartered in Venice, Florida.
Southern Pioneer underwrites garage liability and commercial property as well as homeowners and dwelling fire insurance on an admitted basis. Insurance coverages are offered nationwide, primarily through insurance agents. Southern Pioneer competes with large companies and local insurers. Southern Pioneer is headquartered in Jonesboro, Arkansas.
Biglari Holdings’ insurance operations may be affected by extraordinary weather conditions or other factors, any of which may have a significant effect upon the frequency or severity of claims.
Oil and Gas Business
Southern Oil Company ("Southern Oil") primarily operates oil and natural gas properties offshore in the shallow waters of the Gulf of Mexico. Southern Oil is headquartered in Madisonville, Louisiana.
The oil and gas industry is fundamentally a commodity business. Southern Oil’s operations and earnings, therefore, may be significantly affected by changes in oil and natural gas prices. The COVID-19 pandemic caused oil demand to decrease significantly during the second and third quarters of 2020, which created oversupplied markets and lower commodity prices and margins. In response, the Company cut production and expenses in its oil and natural gas business during 2020. However, the significant increase in average crude oil and natural gas prices in 2021 compared to 2020 resulting from the lifting of COVID-19 restrictions, the resumption of normal economic activity, and the resulting improvement in supply and demand fundamentals caused Southern Oil to return to full production during 2021. Southern Oil competes with fully integrated, major global petroleum companies, as well as independent and national petroleum companies. In addition, the Company is subject to a variety of risks inherent in the oil and gas business, including a wide range of local, state, and federal regulations.
Brand Licensing Business
Maxim’s business lies principally in brand licensing. Maxim is headquartered in New York City, New York.
Maxim competes for licensing business with other companies. The nature of the licensing business is predicated on projects that materialize with irregularity. In addition, publishing is a highly competitive business.
Maxim products are marketed under various registered brand names, including, but not limited to, “MAXIM®” and “Maxim®”.
Investments
The Company and its subsidiaries have invested in The Lion Fund, L.P. and The Lion Fund II, L.P. (collectively, “the investment partnerships”). The investment partnerships operate as private investment funds. As of December 31, 2021, the fair value of the investments was $474.2 million. These investments are subject to a rolling five-year lock-up period under the terms of the respective partnership agreements.
Employees
As of December 31, 2021, the Company employed 2,633 persons. When hiring personnel, we do not consider circumstances of birth, race, gender, ethnicity, religion, or any other factor unrelated to talent. The factor of prime importance to us, talent, is invariably found across a wide spectrum of humanity. We seek to associate with people of high character and competence.
Additional information with respect to Biglari Holdings’ businesses
Information related to our reportable segments may be found in Part II, Item 8 of this Form 10-K.
Biglari Holdings maintains a website (www.biglariholdings.com) where its annual reports, press releases, interim shareholder reports, and links to its subsidiaries’ websites can be found. Biglari Holdings’ periodic reports filed with the Securities and Exchange Commission (the “SEC”), which include Form 10-K, Form 10-Q, Form 8-K, and amendments thereto, may be accessed by the public free of charge from the SEC and through Biglari Holdings’ website. In addition, corporate governance documents such as Corporate Governance Guidelines, Code of Conduct, Compensation Committee Charter, and Audit Committee Charter are posted on the Company’s website and are available without charge upon written request. The Company’s website and the information contained therein or connected thereto are not intended to be incorporated into this report on Form 10-K.
Item 1A. Risk Factors
Biglari Holdings and its subsidiaries (referred to herein as “we,” “us,” “our,” or similar expressions) are subject to certain risks and uncertainties in their business operations, which are described below. The risks and uncertainties described below are not the only risks we face. Additional risks and uncertainties not presently known or that are currently deemed immaterial may also impair our business operations.
Risks relating to Biglari Holdings
We are dependent on our Chairman and CEO.
Our success depends on the services of Sardar Biglari, Chairman and Chief Executive Officer. All major investment and capital allocation decisions are made for the Company and its subsidiaries by Mr. Biglari. If for any reason the services of Mr. Biglari were to become unavailable, a material adverse effect on our business could occur.
Sardar Biglari, Chairman and CEO, beneficially owns over 50% of our outstanding shares of common stock, enabling Mr. Biglari to exert control over matters requiring shareholder approval.
Mr. Biglari has the ability to control the outcome of matters submitted to our shareholders for approval, including the election or removal of directors, the amendment of our certificate of incorporation or bylaws, and other significant transactions. In addition, Mr. Biglari has the ability to control the management and affairs of the Company. This control position may conflict with the interests of some or all of the Company’s passive shareholders, and reduce the possibility of a merger proposal, tender offer, or proxy contest for the removal of directors.
We are a “controlled company” within the meaning of the New York Stock Exchange rules and thus can rely on exemptions from certain corporate governance requirements.
Because Mr. Biglari beneficially owns more than 50% of the Company’s outstanding voting stock, we are considered a “controlled company” pursuant to New York Stock Exchange rules. As a result, we are not required to comply with certain director independence and board committee requirements. The Company does not have a governance and nominating committee.
Biglari Holdings’ access to capital is subject to restrictions that may adversely affect its ability to satisfy its cash requirements or implement its growth strategy.
We are a holding company and are largely dependent upon dividends and other sources of funds from our subsidiaries in order to meet our needs. The ability of our insurance subsidiaries to pay dividends to Biglari Holdings is regulated by state insurance laws, which limit the amount of, and in certain circumstances may prohibit the payment of, cash dividends. Furthermore, as a result of our substantial investments in The Lion Fund, L.P. and The Lion Fund II, L.P., investment partnerships controlled by Mr. Biglari, our access to capital is restricted by the terms of their respective partnership agreements. There is also a high likelihood that we will make additional investments in these investment partnerships.
Competition.
Each of our operating businesses faces intense competitive pressure within the markets in which they operate. Competition may arise domestically as well as internationally. Accordingly, future operating results will depend to some degree on whether our operating units are successful in protecting or enhancing their competitive advantages. If our operating businesses are unsuccessful in these efforts, our periodic operating results may decline from current levels in the future. We also highlight certain competitive risks in the sections below.
Deterioration of general economic conditions may significantly reduce our operating earnings.
Our operating businesses are subject to normal economic cycles, which affect the general economy or the specific industries in which they operate. Significant deterioration of economic conditions over a prolonged period could produce a material adverse effect on one or more of our significant operations.
Our operating businesses face a variety of risks associated with doing business in foreign markets.
There is no assurance that our international operations will remain profitable. Our international operations are subject to all of the risks associated with our domestic operations, as well as a number of additional risks, varying substantially country by country. These include, inter alia, international economic and political conditions, corruption, terrorism, social and ethnic unrest, foreign currency fluctuations, differing cultures, and consumer preferences.
In addition, we may become subject to foreign governmental regulations that impact the way we do business with our international franchisees and vendors. These include antitrust and tax requirements, anti-boycott regulations, international trade regulations, the USA Patriot Act, the Foreign Corrupt Practices Act, Office of Foreign Assets Control regulations, and
applicable local laws. Failure to comply with any such legal requirements could subject us to monetary liabilities and other sanctions, which could harm our business and our financial condition.
Epidemics, pandemics, or other outbreaks, including COVID-19, could hurt our operating businesses and investments.
The outbreak of COVID-19 adversely affected our operations and investments, and in the future it or other epidemics, pandemics, or outbreaks may do the same. This is or may be due to closures or restrictions requested or mandated by governmental authorities, disruption to supply chains and workforce, reduction of demand for our products and services, credit losses when customers and other counterparties fail to satisfy their obligations to us, and volatility in global equity securities markets, among other factors.
Potential changes in laws or regulations may have a negative impact on our Class A common stock and Class B common stock.
In prior years, bills have been introduced in Congress that, if enacted, would have prohibited the listing of common stock on a national securities exchange if such common stock were part of a class of securities that has no voting rights or carries disproportionate voting rights. Although these bills have not been acted upon by Congress, there can be no assurance that such a bill (or a modified version thereof) will not be introduced in Congress in the future. Legislation or other regulatory developments could make the shares of Class A common stock and Class B common stock ineligible for trading on the NYSE or other national securities exchanges.
Litigation could have a material adverse effect on our financial position, cash flows, and results of operations.
We are or may be from time to time a party to various legal actions, investigations, and other proceedings brought by employees, consumers, policyholders, suppliers, shareholders, government agencies, or other third parties in connection with matters pertaining to our business, including those related to our investment activities. The outcome of such matters is often difficult to assess or quantify, and the cost to defend future proceedings may be significant. Even if a claim is unsuccessful or is not fully pursued, the negative publicity surrounding any negative allegation regarding our Company, our business, or our products could adversely affect our reputation. While we believe that the ultimate outcome of routine legal proceedings, individually and in the aggregate will not have a material impact on our financial position, we cannot assure that an adverse outcome on, or reputational damage from, any of these matters would not, in fact, materially impact our business and results of operations for the period after these matters are completed or otherwise resolved.
Risks Relating to Our Restaurant Operations
Our restaurant operations face intense competition from a wide range of industry participants.
The restaurant business is one of the most intensely competitive industries. As there are virtually no barriers to entry into the restaurant business, competitors may include national, regional, and local establishments. Restaurant businesses compete on the basis of price, convenience, service, experience, menu variety, and product quality. The restaurant business is often affected by changes in consumer tastes and by national, regional, and local economic conditions. The performance of individual restaurants may be impacted by factors such as traffic patterns, demographic trends, weather conditions, and competing restaurants. Additional factors that may adversely affect the restaurant industry include, but are not limited to, food and wage inflation, safety, and food-borne illness.
Changes in economic conditions may have an adverse impact on our restaurant operations.
Our restaurant operations are subject to normal economic cycles affecting the economy in general or the restaurant industry in particular. The restaurant industry has been affected by economic factors, including the deterioration of global, national, regional and local economic conditions, declines in employment levels, and shifts in consumer spending patterns. Declines in consumer restaurant spending could be harmful to our financial position and results of operations. As a result, decreased cash flow generated from our business may adversely affect our financial position and our ability to fund our operations. In addition, macroeconomic disruptions could adversely impact the availability of financing for our franchisees’ expansions and operations.
Fluctuations in commodity and energy prices and the availability of commodities, including beef and dairy, could affect our restaurant business.
The cost, availability, and quality of ingredients restaurant operations use to prepare their food are subject to a range of factors, many of which are beyond their control. A significant component of our restaurant business costs is related to food commodities, including beef and dairy products, which can be subject to significant price fluctuations due to seasonal shifts, climate conditions, industry demand, changes in commodity markets, and other factors. If there is a substantial increase in prices for these food commodities, our results of operations may be negatively affected. In addition, our restaurants are dependent upon frequent deliveries of perishable food products that meet certain specifications. Shortages or interruptions in the supply of perishable food products caused by unanticipated demand, problems in production or distribution, disease or food-
borne illnesses, inclement weather, or other conditions could adversely affect the availability, quality, and cost of ingredients, which would likely lower revenues, damage our reputation, or otherwise harm our business.
Adverse weather conditions or losses due to casualties could negatively impact our operating performance.
Property damage caused by casualties and natural disasters, instances of inclement weather, flooding, hurricanes, fire, and other acts of nature can adversely impact sales in several ways. Many of Steak n Shake’s and Western Sizzlin’s restaurants are located in the Midwest and Southeast portions of the United States. During the first and fourth quarters, restaurants in the Midwest may face harsh winter weather conditions. During the third and fourth quarters, restaurants in the Southeast may experience hurricanes or tropical storms. Our sales and operating results may be negatively affected by these harsh weather conditions, which could make it more difficult for guests to visit our restaurants, necessitate the closure of restaurants, cause physical damage, or lead to a shortage of employees.
We are subject to health, employment, environmental, and other government regulations, and failure to comply with existing or future government regulations could expose us to litigation or penalties, damage our reputation, and lower profits.
We are subject to various global, federal, state, and local laws and regulations affecting our restaurant operations. Changes in existing laws, rules, and regulations applicable to us, or increased enforcement by governmental authorities, may require us to incur additional costs and expenses necessary for compliance. If we fail to comply with any of these laws, we may be subject to governmental action or litigation, and our reputation could be accordingly harmed. Injury to our reputation would, in turn, likely reduce revenues and profits.
The development and construction of restaurants is subject to compliance with applicable zoning, land use, and environmental regulations. Difficulties in obtaining, or failure to obtain, the required licenses or approvals could delay or prevent the development of a new restaurant in a particular area.
In recent years, there has been increased legislative, regulatory, and consumer focus on nutrition and advertising practices in the food industry. As a result, restaurant operations have become subject to regulatory initiatives in the area of nutrition disclosure or advertising, such as requirements to provide information about the nutritional content of our food products. The operation of the Steak n Shake and Western Sizzlin franchise system is also subject to franchise laws and regulations enacted by a number of states, and to rules promulgated by the U.S. Federal Trade Commission. Any future legislation regulating franchise relationships may negatively affect our operations, particularly our relationship with franchisees. Failure to comply with new or existing franchise laws and regulations in any jurisdiction, or to obtain required government approvals, could result in a ban or temporary suspension on future franchise sales. Further national, state, and local government initiatives, such as mandatory health insurance coverage or proposed increases in minimum wage rates, could adversely affect our business.
Risks Relating to Our Investment Activities
The majority of our investment activities are conducted through outside investment partnerships, The Lion Fund, L.P. and The Lion Fund II, L.P., which are controlled by Mr. Biglari.
Our investment activities are conducted mainly through these outside investment partnerships. Under the terms of their partnership agreements, each contribution made by the Company to the investment partnerships is subject to a five-year lock-up period, and any distribution upon our withdrawal of funds will be paid out over a two-year period (and may be paid in-kind rather than in cash, thus increasing the difficulty of liquidating these investments). As a result of these provisions and our consequent inability to access this capital for a defined period, our capital invested in the investment partnerships may be subject to an increased risk of loss of all or a significant portion of value, and we may become unable to meet our capital requirements. There is a high likelihood that we will make additional investments in these investment partnerships in the future.
We have a services agreement with Biglari Capital Corp., the general partner of the investment partnerships (“Biglari Capital”), and Biglari Enterprises LLC (collectively, the “Biglari Entities”), in which the Company pays a fixed fee to the Biglari Entities for business and administrative-related services. The Biglari Entities are owned by Mr. Biglari. There can be no assurance that the fees paid will be commensurate with the benefits received.
The incentive allocation to which Mr. Biglari, as Chairman and Chief Executive Officer of Biglari Capital, is entitled under the terms of the respective partnership agreements is equal to 25% of the net profits allocated to the limited partners in excess of a 6% hurdle rate over the previous high-water mark.
Our investments may be concentrated, and fair values are subject to a loss in value.
The majority of our investments are held through the investment partnerships, which generally invest in common stocks. These investments may be largely concentrated in the common stocks of a few investees. A significant decline in the major values of
these investments may produce a large decrease in our consolidated shareholders’ equity and can have a material adverse effect on our consolidated book value per share and earnings.
We are subject to the risk of possibly becoming an investment company under the Investment Company Act of 1940.
We run the risk of inadvertently becoming an investment company, which would require us to register under the Investment Company Act of 1940, as amended (the “Investment Company Act”). Registered investment companies are subject to extensive, restrictive, and potentially adverse regulations relating to, among other things, operating methods, management, capital structure, dividends, and transactions with affiliates. Registered investment companies are not permitted to operate their business in the manner in which we operate our business, nor are registered investment companies permitted to have many of the relationships that we have with our affiliated companies.
To avoid becoming and registering as an investment company under the Investment Company Act, we operate as an ongoing enterprise, with approximately 2,600 employees, along with an asset base from which to pursue acquisitions. Furthermore, Section 3(c)(3) of the Investment Company Act excludes insurance companies from the definition of “investment company.” Because we monitor the value of our investments and structure transactions accordingly, we may structure transactions in a less advantageous manner than if we did not have Investment Company Act concerns, or we may avoid otherwise economically desirable transactions due to those concerns. In addition, adverse developments with respect to our ownership of certain of our operating subsidiaries, including significant appreciation or depreciation in the market value of certain of our publicly traded holdings, could result in our inadvertently becoming an investment company. If it were established that we were an investment company, there would be a risk, among other material adverse consequences, that we could become subject to monetary penalties or injunctive relief, or both, in an action brought by the SEC, that we would be unable to enforce contracts with third parties, or that third parties could seek to obtain rescission of transactions with us undertaken during the period it was established that we were an unregistered investment company.
Risks Relating to Our Insurance Business
Our success depends on our ability to underwrite risks accurately and to charge adequate rates to policyholders.
Our results of operations depend on our ability to underwrite and set rates accurately for risks assumed. A primary role of the pricing function is to ensure that rates are adequate to generate sufficient premiums to pay losses, loss adjustment expenses, and underwriting expenses.
Our insurance business is vulnerable to significant catastrophic property loss, which could have an adverse effect on its financial condition and results of operations.
Our insurance business faces a significant risk of loss in the ordinary course of its business for property damage resulting from natural disasters, man-made catastrophes and other catastrophic events. These events typically increase the frequency and severity of commercial property claims. Because catastrophic loss events are by their nature unpredictable, historical results of operations may not be indicative of future results of operations, and the occurrence of claims from catastrophic events may result in significant volatility in our insurance business’ financial condition and results of operations from period to period. We attempt to manage our exposure to these events through reinsurance programs, although there is no assurance we will be successful in doing so.
Our insurance business is subject to extensive existing state, local, and foreign governmental regulations that restrict its ability to do business and generate revenues.
Our insurance business is subject to regulation in the jurisdictions in which it operates. These regulations may relate to, among other things, the types of business that can be written, the rates that can be charged for coverage, the level of capital and reserves that must be maintained, and restrictions on the types and size of investments that can be placed. Regulations may also restrict the timing and amount of dividend payments. Accordingly, existing or new regulations related to these or other matters or regulatory actions imposing restrictions on our insurance business may adversely impact its results of operations.
Risks Relating to Our Brand Licensing Business
Licensing opportunities for the Maxim brand may be difficult to maintain.
Maxim’s success depends to a significant degree upon licensing agreements. These licensing agreements mature from time to time and we may be unable to secure favorable terms for future licensing arrangements. Future licensing partners may also fail to honor their contractual obligations or take other actions that can diminish the value of the Maxim brand. Disputes could arise that prevent or delay our ability to collect licensing revenues under these arrangements. If any of these developments occur or our licensing efforts are otherwise not successful, the value and recognition of the Maxim brand, as well as the prospects of our media business, could be materially, adversely affected.
Risks Relating to Our Oil and Gas Business
Our oil and gas business is exposed to the effects of volatile commodity prices.
The single largest variable that affects Southern Oil’s results of operations is the price of crude oil and natural gas. The price we receive for our oil and natural gas production heavily influences Southern Oil’s revenue and profitability. Extended periods of low prices for crude oil or natural gas can have a material adverse impact on our results of operations.
Our scope of business is concentrated in the shallow waters of the Gulf of Mexico.
Any disruption of its extractive business would adversely affect Southern Oil’s revenues and profitability. Southern Oil’s operations are therefore subject to disruption from natural or human causes beyond its control, including physical risks from hurricanes, severe storms, and other forms of system failures, any of which could result in suspension of operations or harm to people or the natural environment.
Our oil and gas business can be adversely affected by political or regulatory developments affecting our operations.
Southern Oil’s operations can be affected by changing economic, regulatory, and political environments. Litigation or changes in national, state, or local environmental regulations or laws, including those designed to stop or impede the development or production of oil and natural gas, could adversely affect Southern Oil’s operations and profitability.
Item 1B. Unresolved Staff Comments
None.
Item 2. Properties
Restaurant Properties
As of December 31, 2021, restaurant operations included 577 company-operated and franchise locations. Restaurant operations own the land and building for 157 restaurants; they also own 10 other properties. The following table lists the locations of the restaurants, as of December 31, 2021.
| | | | | | | | | | | | | | | | | | | | | | | | | | | | | | | | | | | |
| Steak n Shake | | Western Sizzlin | | |
| Company
Operated | | Franchise
Partner | | Traditional
Franchise | | Company
Operated | | Franchise | | Total |
| Domestic: | | | | | | | | | | | |
| Alabama | — | | | 2 | | | 6 | | | — | | | 6 | | | 14 | |
| Arizona | — | | | — | | | 1 | | | — | | | — | | | 1 | |
| Arkansas | — | | | — | | | 5 | | | — | | | 8 | | | 13 | |
| California | — | | | — | | | 2 | | | — | | | — | | | 2 | |
| Colorado | 1 | | | — | | | 1 | | | — | | | — | | | 2 | |
| Delaware | — | | | — | | | 1 | | | — | | | — | | | 1 | |
| Florida | 23 | | | 54 | | | 6 | | | — | | | — | | | 83 | |
| Georgia | 11 | | | 10 | | | 12 | | | — | | | 4 | | | 37 | |
| Illinois | 36 | | | 19 | | | 10 | | | — | | | — | | | 65 | |
| Indiana | 43 | | | 17 | | | 2 | | | — | | | — | | | 62 | |
| Iowa | 2 | | | 1 | | | 1 | | | — | | | — | | | 4 | |
| Kansas | — | | | — | | | 4 | | | — | | | — | | | 4 | |
| Kentucky | 6 | | | 6 | | | 9 | | | — | | | — | | | 21 | |
| Louisiana | — | | | — | | | 2 | | | — | | | — | | | 2 | |
| Maryland | — | | | — | | | 1 | | | — | | | 1 | | | 2 | |
| Michigan | 15 | | | 3 | | | — | | | — | | | — | | | 18 | |
| Mississippi | — | | | — | | | 7 | | | — | | | 1 | | | 8 | |
| Missouri | 13 | | | 9 | | | 22 | | | — | | | — | | | 44 | |
| Nebraska | — | | | — | | | 1 | | | — | | | — | | | 1 | |
| Nevada | — | | | — | | | 6 | | | — | | | — | | | 6 | |
| North Carolina | 1 | | | 5 | | | 3 | | | — | | | 6 | | | 15 | |
| Ohio | 32 | | | 18 | | | 2 | | | — | | | 1 | | | 53 | |
| Oklahoma | — | | | — | | | 2 | | | — | | | 2 | | | 4 | |
| Pennsylvania | 5 | | | — | | | 1 | | | — | | | — | | | 6 | |
| South Carolina | — | | | 1 | | | 2 | | | — | | | 2 | | | 5 | |
| Tennessee | 2 | | | 6 | | | 14 | | | — | | | 3 | | | 25 | |
| Texas | 5 | | | 8 | | | 14 | | | — | | | 1 | | | 28 | |
| Virginia | — | | | — | | | 3 | | | 2 | | | 3 | | | 8 | |
| Washington DC | — | | | — | | | 1 | | | — | | | — | | | 1 | |
| West Virginia | — | | | — | | | 2 | | | 1 | | | — | | | 3 | |
| International: | | | | | | | | | | | |
| France | 2 | | | — | | | 31 | | | — | | | — | | | 33 | |
| Monaco | 1 | | | — | | | — | | | — | | | — | | | 1 | |
| Portugal | — | | | — | | | 4 | | | — | | | — | | | 4 | |
| Spain | 1 | | | — | | | — | | | — | | | — | | | 1 | |
| Total | 199 | | | 159 | | | 178 | | | 3 | | | 38 | | | 577 | |
As of December 31, 2021, 42 of the 199 Steak n Shake company-operated stores were closed. The Company intends to refranchise the majority of its 42 closed stores.
Other Properties
Southern Oil primarily operates oil and natural gas wells in Louisiana. Its operations are primarily offshore in the shallow waters of the Gulf of Mexico.
First Guard owns the land and building of its office in Venice, Florida. Southern Pioneer owns the land and building of its office in Jonesboro, Arkansas.
The Company owns Steak n Shake’s office building in Indianapolis, Indiana, along with two other undeveloped properties in other states.
Item 3. Legal Proceedings
Refer to Commitments and Contingencies - Note 14 to the Consolidated Financial Statements included in Item 8 for a discussion of legal proceedings.
Item 4. Mine Safety Disclosures
Not applicable.
Part II
Item 5. Market for Registrant’s Common Equity, Related Stockholder Matters and Issuer Purchases of Equity
Securities
Market Information
Biglari Holdings’ Class A common stock and Class B common stock are listed for trading on the NYSE, trading symbol: BH.A and BH, respectively.
Shareholders
Biglari Holdings had 2,104 beneficial shareholders of its Class A common stock and 4,100 beneficial shareholders of its Class B common stock as of February 16, 2022.
Dividends
Biglari Holdings has never declared a dividend.
Issuer Purchases of Equity Securities
From November 22, 2021 through December 17, 2021, The Lion Fund II, L.P. purchased 198 shares of Class A common stock and 39,776 shares of Class B common stock. The Lion Fund II, L.P. may be deemed to be an “affiliated purchaser” as defined in Rule 10b-18(a)(3) under the Securities Exchange Act of 1934, as amended. The purchases were made through open market transactions.
| | | | | | | | | | | | | | | | | | | | | | | | | | | | | | | | | | | | | | |
| | Total Number of Class A Shares Purchased | | Average Price Paid per Class A Share | | Total Number of Class B Shares Purchased | | Average Price Paid per Class B Share | | Total Number of Shares Purchased as Part of Publicly Announced Plans or Programs | | Maximum Number of Shares That May Yet Be Purchased Under Plans or Programs |
| | | | | | | | | | | | |
| October 1, 2021 – October 31, 2021 | | — | | | $ | — | | | — | | | $ | — | | | — | | | — | |
| November 1, 2021 – November 30, 2021 | | 198 | | | $ | 720.77 | | | 28,768 | | | $ | 143.25 | | | — | | | — | |
| December 1, 2021 – December 31, 2021 | | — | | | $ | — | | | 11,008 | | | $ | 148.30 | | | — | | | — | |
| Total | | 198 | | | | | 39,776 | | | | | — | | | |
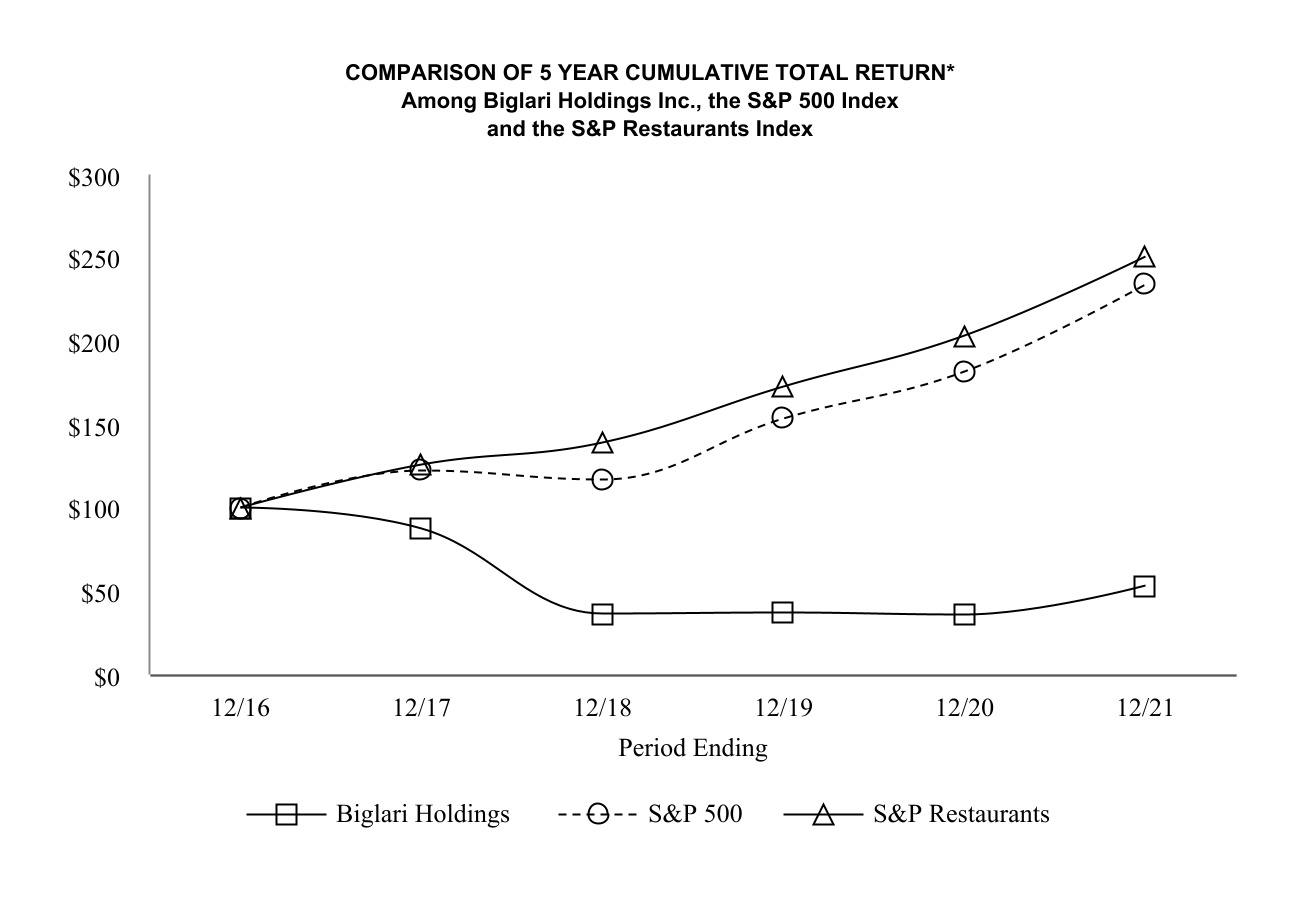
Performance Graph
The graph below compares Biglari Holdings Inc.’s cumulative 5-year total shareholder return on its Class A common stock and Class B common stock (on an equivalent Class A common stock basis) with the cumulative total returns of the S&P 500 Index and the S&P Restaurants Index. The graph tracks the performance of a $100 investment in our common stock and in each index (with the reinvestment of all dividends) from December 31, 2016 to December 31, 2021.
*$100 invested on 12/31/16 in stock or index, including reinvestment of dividends.
Fiscal year ending December 31.
Copyright© 2022 Standard & Poor’s, a division of S&P Global. All rights reserved.
The preceding stock price performance graph and related information shall not be deemed “soliciting material” or to be “filed” with the SEC, nor shall such information be incorporated by reference into any future filings under the Securities Exchange Act of 1934, as amended, or the Securities Act of 1933, as amended, except to the extent that we specifically incorporate it by reference into such filings.
Securities Authorized for Issuance Under Equity Compensation Plans
Biglari Holdings does not have any equity compensation plans.
Item 6. Selected Financial Data
(dollars in thousands except per share data)
| | | | | | | | | | | | | | | | | | | | | | | | | | | | | |
| 2021 | | 2020 | | 2019 | | 2018 | | 2017 |
| Revenue: | | | | | | | | | |
| Restaurant operations | $ | 271,290 | | | $ | 350,666 | | | $ | 610,220 | | | $ | 775,690 | | | $ | 807,153 | |
| Insurance premiums and other | 58,609 | | | 52,679 | | | 30,083 | | | 27,628 | | | 24,943 | |
| Oil and gas | 33,004 | | | 26,255 | | | 24,436 | | | — | | | — | |
| Licensing and media | 3,203 | | | 4,083 | | | 4,099 | | | 6,576 | | | 7,708 | |
| Total revenues | $ | 366,106 | | | $ | 433,683 | | | $ | 668,838 | | | $ | 809,894 | | | $ | 839,804 | |
| | | | | | | | | |
| Earnings: | | | | | | | | | |
| Net earnings (loss) | $ | 35,478 | | | $ | (37,989) | | | $ | 45,380 | | | $ | 19,392 | | | $ | 50,071 | |
| Net earnings (loss) per equivalent Class A share | $ | 111.83 | | | $ | (110.05) | | | $ | 131.64 | | | $ | 55.71 | | | $ | 136.01 | |
| | | | | | | | | |
| Year-end data: | | | | | | | | | |
| Total assets | $ | 894,807 | | | $ | 1,017,968 | | | $ | 1,139,309 | | | $ | 1,029,493 | | | $ | 1,063,584 | |
| Notes payable | $ | — | | | $ | 152,261 | | | $ | 180,264 | | | $ | 181,521 | | | $ | 182,990 | |
| Biglari Holdings Inc. shareholders’ equity | $ | 587,696 | | | $ | 564,828 | | | $ | 616,298 | | | $ | 570,455 | | | $ | 571,328 | |
Earnings per share of common stock is based on the weighted average number of shares outstanding during the period. The Company has applied the “two-class method” of computing earnings per share as prescribed in Accounting Standards Codification 260, “Earnings Per Share.”
We adopted ASC 606 "Revenue" on January 1, 2018, which resulted in recording initial franchise fees as deferred revenue. These fees are recognized as revenue over the term of the franchise agreement. 2017 has not been adjusted.
Item 7. Management’s Discussion and Analysis of Financial Condition and Results of Operations
(dollars in thousands except per share data)
Biglari Holdings Inc. is a holding company owning subsidiaries engaged in a number of diverse business activities, including property and casualty insurance, licensing and media, restaurants, and oil and gas. The Company’s largest operating subsidiaries are involved in the franchising and operating of restaurants. Biglari Holdings is founded and led by Sardar Biglari, Chairman and Chief Executive Officer of the Company.
Biglari Holdings’ management system combines decentralized operations with centralized finance decision-making. Operating decisions for the various business units are made by their respective managers. All major investment and capital allocation decisions are made for the Company and its subsidiaries by Mr. Biglari.
As of December 31, 2021, Mr. Biglari beneficially owns shares of the Company that represent approximately 66.2% of the economic interest and approximately 70.4% of the voting interest.
Overview of the Impact of COVID-19
The novel coronavirus (“COVID-19”), declared a pandemic by the World Health Organization in March 2020, caused governments to impose restrictive measures to contain its spread. Those shutdowns significantly affected our operating businesses to varying degrees. The risks and uncertainties resulting from COVID-19 and its variants may continue to affect our future earnings, cash flows, and financial condition. Accordingly, estimates used in the preparation of our financial statements, including those associated with the evaluation of certain long-lived assets, goodwill, and other intangible assets for impairment, may be subject to significant adjustments in future periods.
Business Acquisition
On March 9, 2020, Biglari Holdings acquired the stock of Southern Pioneer Property & Casualty Insurance Company and its affiliated agency, Southern Pioneer Insurance Agency, Inc. (collectively “Southern Pioneer”). Southern Pioneer underwrites garage liability and commercial property as well as homeowners and dwelling fire insurance coverage. The Company’s financial results include the results of Southern Pioneer from the date of acquisition.
Discussion of Operations
Net earnings attributable to Biglari Holdings shareholders are disaggregated in the table that follows. Amounts are recorded after deducting income taxes.
| | | | | | | | | | | | | | | | | |
| 2021 | | 2020 | | 2019 |
| Operating businesses: | | | | | |
| Restaurant | $ | 11,235 | | | $ | (4,961) | | | $ | (10,734) | |
| Insurance | 11,290 | | | 9,840 | | | 5,584 | |
| Oil and gas | 7,528 | | | 1,890 | | | 5,921 | |
| Brand licensing | 2,364 | | | 1,374 | | | 572 | |
| Interest expense | (841) | | | (6,940) | | | (8,817) | |
| Corporate and other | (9,829) | | | (9,563) | | | (7,919) | |
| Total operating businesses | 21,747 | | | (8,360) | | | (15,393) | |
| Investment partnership gains | 8,899 | | | (32,506) | | | 60,773 | |
| Investment gains | 4,832 | | | 2,877 | | | — | |
| $ | 35,478 | | | $ | (37,989) | | | $ | 45,380 | |
The following discussion should be read in conjunction with Item 1, Business and our Consolidated Financial Statements and the notes thereto included in this Form 10-K. The following discussion should also be read in conjunction with the “Cautionary Note Regarding Forward-Looking Statements” and the risks and uncertainties described in Item 1A, Risk Factors set forth above.
Our Management Discussion and Analysis generally discusses 2021 and 2020 items and year-to-year comparisons between 2021 and 2020. Discussions of 2019 items and year-to-year comparisons between 2020 and 2019 can be found in “Management’s Discussion and Analysis of Financial Condition and Results of Operations” in Part II, Item 7 of our Annual Report on Form 10-K for the year ended December 31, 2020, filed with the SEC on March 1, 2021.
Management’s Discussion and Analysis (continued)
Restaurants
Our restaurant businesses, which include Steak n Shake and Western Sizzlin, comprise 577 company-operated and franchise restaurants as of December 31, 2021.
| | | | | | | | | | | | | | | | | | | | | | | | | | | | | | | | | | | |
| Steak n Shake | | Western Sizzlin | | |
| Company-
operated | | Franchise
Partner | | Traditional
Franchise | | Company-
operated | | Franchise | | Total |
| Total stores as of December 31, 2018 | 413 | | | — | | | 213 | | | 4 | | | 55 | | | 685 | |
| Corporate stores transitioned | (29) | | | 29 | | | — | | | — | | | — | | | — | |
| Net restaurants opened (closed) | (16) | | | — | | | — | | | — | | | (7) | | | (23) | |
| Stores open on December 31, 2019 | 368 | | | 29 | | | 213 | | | 4 | | | 48 | | | 662 | |
| Corporate stores transitioned | (58) | | | 57 | | | 1 | | | — | | | — | | | — | |
| Net restaurants opened (closed) | (34) | | | — | | | (20) | | | (1) | | | (9) | | | (64) | |
| Stores open on December 31, 2020 | 276 | | | 86 | | | 194 | | | 3 | | | 39 | | | 598 | |
| Corporate stores transitioned | (73) | | | 73 | | | — | | | — | | | — | | | — | |
| Net restaurants opened (closed) | (4) | | | — | | | (16) | | | — | | | (1) | | | (21) | |
| Stores open on December 31, 2021 | 199 | | | 159 | | | 178 | | | 3 | | | 38 | | | 577 | |
As of December 31, 2021, 42 of the 199 company-operated Steak n Shake stores were closed. Over the past two years, Steak n Shake reopened 50 locations that were previously closed. We plan to refranchise a majority of our closed company-operated restaurants.
Management’s Discussion and Analysis (continued)
Restaurant operations for 2021, 2020 and 2019 are summarized below.
| | | | | | | | | | | | | | | | | | | | | | | | | | | | | | | | | | | |
| 2021 | | | | 2020 | | | | 2019 | | |
| Revenue | | | | | | | | | | | |
| Net sales | $ | 187,913 | | | | | $ | 306,577 | | | | | $ | 578,164 | | | |
| Franchise partner fees | 55,641 | | | | | 22,213 | | | | | 3,829 | | | |
| Franchise royalties and fees | 21,736 | | | | | 18,794 | | | | | 23,360 | | | |
| Other revenue | 6,000 | | | | | 3,082 | | | | | 4,867 | | | |
| Total revenue | 271,290 | | | | | 350,666 | | | | | 610,220 | | | |
| | | | | | | | | | | |
| Restaurant cost of sales | | | | | | | | | | | |
| Cost of food | 55,315 | | | 29.4 | % | | 88,698 | | | 28.9 | % | | 176,346 | | | 30.5 | % |
| Restaurant operating costs | 92,543 | | | 49.2 | % | | 137,574 | | | 44.9 | % | | 307,337 | | | 53.2 | % |
| Occupancy costs | 19,633 | | | 10.4 | % | | 20,383 | | | 6.6 | % | | 17,266 | | | 3.0 | % |
| Total cost of sales | 167,491 | | | | | 246,655 | | | | | 500,949 | | | |
| | | | | | | | | | | |
| Selling, general and administrative | | | | | | | | | | | |
| General and administrative | 39,940 | | | 14.7 | % | | 35,922 | | | 10.2 | % | | 47,685 | | | 7.8 | % |
| Marketing | 13,923 | | | 5.1 | % | | 21,507 | | | 6.1 | % | | 39,476 | | | 6.5 | % |
| Other expenses | 3,323 | | | 1.2 | % | | 2,972 | | | 0.8 | % | | 1,753 | | | 0.3 | % |
| Total selling, general and administrative | 57,186 | | | 21.1 | % | | 60,401 | | | 17.2 | % | | 88,914 | | | 14.6 | % |
| | | | | | | | | | | |
| Impairments | 4,635 | | | 1.7 | % | | 23,646 | | | 6.7 | % | | 8,186 | | | 1.3 | % |
| | | | | | | | | | | |
| Depreciation and amortization | 21,484 | | | 7.9 | % | | 19,042 | | | 5.4 | % | | 21,174 | | | 3.5 | % |
| | | | | | | | | | | |
| Interest on finance leases and obligations | 6,039 | | | | | 6,274 | | | | | 7,816 | | | |
| | | | | | | | | | | |
| Earnings (loss) before income taxes | 14,455 | | | | | (5,352) | | | | | (16,819) | | | |
| | | | | | | | | | | |
| Income tax expense (benefit) | 3,220 | | | | | (391) | | | | | (6,085) | | | |
| | | | | | | | | | | |
| Contributions to net earnings | $ | 11,235 | | | | | $ | (4,961) | | | | | $ | (10,734) | | | |
Cost of food, restaurant operating costs, and occupancy costs are expressed as a percentage of net sales.
General and administrative, marketing, other expenses, impairments, and depreciation and amortization are expressed as a percentage of total revenue.
The COVID-19 pandemic has adversely affected our restaurant operations and financial results. Our restaurants were required to close their dining rooms during the first quarter of 2020.
The majority of Steak n Shake’s dining rooms remained closed through the end of 2020 but were reopened during 2021, and in doing so implemented a self-service model. The transformation has resulted in higher capital expenditures in 2021 as compared to prior years. Steak n Shake has spent approximately $40,000 in capital expenditures related to the conversion of table-service restaurants to self-service restaurants.
Net sales during 2021 were $187,913, as compared to $306,577 during 2020. The decrease in revenue of company-owned restaurants is primarily due to the shift of company units to franchise partner units. For company-operated units, sales to the end customer are recorded as revenue generated by the Company, but for franchise partner units, only our share of the restaurant's profits, along with certain fees, are recorded as revenue. Because we derive most of our revenue from our share of the profits, revenue will continue to decline as we transition from company-operated units to franchise partner units.
Management’s Discussion and Analysis (continued)
Franchise partner fees were $55,641 during 2021, as compared to $22,213 during 2020. As of December 31, 2021, there were 159 franchise partner units, as compared to 86 franchise partner units as of December 31, 2020. For a franchise partner to be awarded a restaurant, he or she must demonstrate the gold standard in service.
The franchise royalties and fees generated by the traditional franchising business were $21,736 during 2021, as compared to $18,794 during 2020. The increase in franchise royalties and fees was primarily due to the reopening of dining rooms in 2021.
Our drive-through, carryout, and delivery capabilities positioned us to improve profitability in 2021 and 2020; however, our business has been challenged by COVID-19 related labor availability.
The cost of food in 2021 was $55,315, or 29.4% of net sales, as compared to $88,698, or 28.9% of net sales in 2020. Restaurant operating costs during 2021 were $92,543, or 49.2% of net sales, as compared to $137,574, or 44.9% of net sales in 2020. The decreases in the cost of food and operating costs are mainly attributable to the transitioning of company-operated units to franchise partner units. The increase in operating costs as a percentage of net sales is mainly attributable to increasing wages — in our pursuit to become the maximum-wage employer in our category.
Selling, general and administrative expenses during 2021 were $57,186, or 21.1% of total revenues compared to $60,401, or 17.2% of total revenues during 2020. General and administrative expenses increased as a percentage of net sales during 2021, as compared to 2020, primarily because of an increase in legal fees. Marketing expenses decreased by $7,584 in 2021 as compared to 2020, primarily by shifting to a digital strategy.
Asset impairments decreased $19,011 during 2021 compared to 2020. Higher asset impairments were recorded in 2020 primarily because of dining room closures and uncertainties caused by the pandemic.
Interest on obligations under leases was $6,039 during 2021, versus $6,274 during 2020. The year-over-year decrease in interest expense is primarily attributable to the maturity and retirement of lease obligations.
Insurance
We view our insurance businesses as possessing two activities: underwriting and investing. Underwriting decisions are the responsibility of the unit managers, whereas investing decisions are the responsibility of our Chairman and CEO, Sardar Biglari. Our business units are operated under separate local management. Biglari Holdings’ insurance operations consist of First Guard and Southern Pioneer.
Underwriting results of our insurance operations are summarized below.
| | | | | | | | | | | | | | | | | |
| 2021 | | 2020 | | 2019 |
| Underwriting gain attributable to: | | | | | |
| First Guard | $ | 10,573 | | | $ | 9,379 | | | $ | 6,477 | |
| Southern Pioneer | 1,744 | | | 620 | | | — | |
| Pre-tax underwriting gain | 12,317 | | | 9,999 | | | 6,477 | |
| Income tax expense | 2,587 | | | 2,100 | | | 1,295 | |
| Net underwriting gain | $ | 9,730 | | | $ | 7,899 | | | $ | 5,182 | |
Management’s Discussion and Analysis (continued)
Earnings of our insurance operations are summarized below.
| | | | | | | | | | | | | | | | | |
| 2021 | | 2020 | | 2019 |
| Premiums earned | $ | 55,411 | | | $ | 49,220 | | | $ | 28,746 | |
| Insurance losses | 27,649 | | | 24,828 | | | 16,924 | |
| Underwriting expenses | 15,445 | | | 14,393 | | | 5,345 | |
| Pre-tax underwriting gain | 12,317 | | | 9,999 | | | 6,477 | |
| Other income and expenses | | | | | |
| Investment income | 704 | | | 1,212 | | | 790 | |
| Other income (expense) | 1,414 | | | 1,220 | | | (164) | |
| Total other income | 2,118 | | | 2,432 | | | 626 | |
| Earnings before income taxes | 14,435 | | | 12,431 | | | 7,103 | |
| Income tax expense | 3,145 | | | 2,591 | | | 1,519 | |
| Contribution to net earnings | $ | 11,290 | | | $ | 9,840 | | | $ | 5,584 | |
Insurance premiums and other on the consolidated statement of earnings includes premiums earned, investment income, other income, and commissions. Commissions are in other income (expense) in the above table.
First Guard
First Guard is a direct underwriter of commercial truck insurance, selling physical damage and nontrucking liability insurance to truckers. First Guard’s insurance products are marketed primarily through direct response methods via the Internet or by telephone. First Guard’s cost-efficient direct response marketing methods enable it to be a low-cost insurer. A summary of First Guard’s underwriting results follows.
| | | | | | | | | | | | | | | | | | | | | | | | | | | | | | | | | | | | | | |
| | 2021 | | 2020 | | 2019 |
| | Amount | | % | | Amount | | % | | Amount | | % |
| Premiums earned | | $ | 33,521 | | | 100.0 | % | | $ | 30,210 | | | 100.0 | % | | $ | 28,746 | | | 100.0 | % |
| Insurance losses | | 16,338 | | | 48.7 | % | | 14,031 | | | 46.5 | % | | 16,924 | | | 58.9 | % |
| Underwriting expenses | | 6,610 | | | 19.7 | % | | 6,800 | | | 22.5 | % | | 5,345 | | | 18.6 | % |
| Total losses and expenses | | 22,948 | | | 68.4 | % | | 20,831 | | | 69.0 | % | | 22,269 | | | 77.5 | % |
| Pre-tax underwriting gain | | $ | 10,573 | | | | | $ | 9,379 | | | | | $ | 6,477 | | | |
Southern Pioneer
Southern Pioneer underwrites garage liability and commercial property insurance, as well as homeowners and dwelling fire insurance. The financial results for Southern Pioneer are from the date of acquisition March 9, 2020. A summary of Southern Pioneer’s underwriting results follows.
| | | | | | | | | | | | | | | | | | | | | | | | | | |
| | 2021 | | 2020 |
| | Amount | | % | | Amount | | % |
| Premiums earned | | $ | 21,890 | | | 100.0 | % | | $ | 19,010 | | | 100.0 | % |
| Insurance losses | | 11,311 | | | 51.7 | % | | 10,797 | | | 56.8 | % |
| Underwriting expenses | | 8,835 | | | 40.4 | % | | 7,593 | | | 39.9 | % |
| Total losses and expenses | | 20,146 | | | 92.1 | % | | 18,390 | | | 96.7 | % |
| Pre-tax underwriting gain | | $ | 1,744 | | | | | $ | 620 | | | |
Management’s Discussion and Analysis (continued)
Insurance – Investment Income
A summary of net investment income attributable to our insurance operations follows.
| | | | | | | | | | | | | | | | | | | | |
| | 2021 | | 2020 | | 2019 |
| Interest, dividends, and other investment income: | | | | | | |
| First Guard | | $ | 133 | | | $ | 285 | | | $ | 790 | |
| Southern Pioneer | | 571 | | | 927 | | | — | |
| Pre-tax investment income | | 704 | | | 1,212 | | | 790 | |
| Income tax expense | | 148 | | | 255 | | | 166 | |
| Net investment income | | $ | 556 | | | $ | 957 | | | $ | 624 | |
We consider investment income as a component of our aggregate insurance operating results. However, we consider investment gains and losses, whether realized or unrealized, as non-operating.
Oil and Gas
Southern Oil primarily operates oil and natural gas properties offshore in the shallow waters of the Gulf of Mexico. Southern Oil was acquired on September 9, 2019. Earnings for Southern Oil are summarized below.
| | | | | | | | | | | | | | | | | |
| 2021 | | 2020 | | 2019 |
| Oil and gas revenue | $ | 33,004 | | | $ | 26,255 | | | $ | 24,436 | |
| | | | | |
| Oil and gas production costs | 10,470 | | | 8,700 | | | 7,259 | |
| Depreciation, depletion, and accretion | 8,073 | | | 12,527 | | | 8,218 | |
| General and administrative expenses | 4,748 | | | 3,010 | | | 927 | |
| Earnings before income taxes | 9,713 | | | 2,018 | | | 8,032 | |
| Income tax expense | 2,185 | | | 128 | | | 2,111 | |
| Contribution to net earnings | $ | 7,528 | | | $ | 1,890 | | | $ | 5,921 | |
Initially, the COVID-19 pandemic caused oil demand to significantly decrease, creating oversupplied markets that have resulted in lower commodity prices and margins. In response, the Company cut production and expenses in its oil and natural gas business during 2020. In 2021, however, the significant increase in average crude oil and natural gas prices resulting from the lifting of COVID-19 restrictions, the resumption of normal economic activity, and the resulting improvement in supply and demand fundamentals caused Southern Oil to return to full production.
Brand Licensing
Maxim’s business lies principally in licensing and media. Earnings of operations are summarized below.
| | | | | | | | | | | | | | | | | |
| 2021 | | 2020 | | 2019 |
| Licensing and media revenue | $ | 3,203 | | | $ | 4,083 | | | $ | 4,099 | |
| | | | | |
| Licensing and media cost | 2,275 | | | 2,156 | | | 3,181 | |
| General and administrative expenses | 114 | | | 143 | | | 176 | |
| Earnings before income taxes | 814 | | | 1,784 | | | 742 | |
| Income tax expense | (1,550) | | | 410 | | | 170 | |
| Contribution to net earnings | $ | 2,364 | | | $ | 1,374 | | | $ | 572 | |
Management’s Discussion and Analysis (continued)
We acquired Maxim with the idea of transforming its business model. The magazine developed the Maxim brand, a franchise we are utilizing to generate nonmagazine revenue, notably through licensing, a cash-generating business related to consumer products, services, and events.
Investment Gains and Investment Partnership Gains
Investment gains were $6,401 ($4,832 net of tax) in 2021 and $3,644 ($2,877 net of tax) in 2020. Investment gains in 2021 included a gain from the sale of real estate of $5,047 ($3,785, net of tax). Dividends earned on investments are reported as investment income by our insurance companies. We consider investment income as a component of our aggregate insurance operating results. However, we consider investment gains and losses, whether realized or unrealized, as non-operating.
Earnings from our investments in partnerships are summarized below.
| | | | | | | | | | | | | | | | | |
| 2021 | | 2020 | | 2019 |
| Investment partnership gains (losses) | $ | 10,953 | | | $ | (43,032) | | | $ | 78,133 | |
| Tax expense (benefit) | 2,054 | | | (10,526) | | | 17,360 | |
| Contribution to net earnings | $ | 8,899 | | | $ | (32,506) | | | $ | 60,773 | |
Investment partnership gains include gains/losses from changes in market values of underlying investments and dividends earned by the partnerships. Dividend income has a lower effective tax rate than income from capital gains. These gains and losses have caused and will continue to cause significant volatility in our periodic earnings.
The investment partnerships hold the Company’s common stock as investments. The Company’s pro-rata share of its common stock held by the investment partnerships is recorded as treasury stock even though these shares are legally outstanding. Gains and losses on Company common stock included in the earnings of the partnerships are eliminated in the Company’s consolidated financial results.
Interest Expense
The Company’s interest expense is summarized below.
| | | | | | | | | | | | | | | | | |
| 2021 | | 2020 | | 2019 |
| Interest expense on notes payable and other borrowings | $ | (1,121) | | | $ | (9,262) | | | $ | (12,442) | |
| Tax benefit | (280) | | | (2,322) | | | (3,625) | |
| Interest expense net of tax | $ | (841) | | | $ | (6,940) | | | $ | (8,817) | |
Interest expense during 2021 decreased by $8,141 compared to 2020 due to the repayment of Steak n Shake’s term loan in full on February 19, 2021.
Income Taxes
Consolidated income tax expense was $6,789 in 2021 versus a benefit of $12,212 in 2020. Income tax expense increased during 2021 compared to 2020, primarily due to a tax benefit of $10,526 for investment partnership losses of $43,032 in 2020.
Corporate and Other
Corporate expenses exclude the activities of the restaurant, insurance, brand licensing, and oil and gas businesses. Corporate and other net losses of $9,829 during 2021 increased compared to 2020 due to higher legal expenses.
Financial Condition
Our consolidated shareholders’ equity on December 31, 2021 was $587,696, an increase of $22,868 compared to the December 31, 2020 balance. The increase was primarily due to net income of $35,478 offset by an increase in treasury stock of $12,234.
Management’s Discussion and Analysis (continued)
Consolidated cash and investments are summarized below.
| | | | | | | | | | | |
| December 31, |
| 2021 | | 2020 |
| Cash and cash equivalents | $ | 42,349 | | | $ | 24,503 | |
| Investments | 83,061 | | | 94,861 | |
| Fair value of interest in investment partnerships | 474,201 | | | 590,926 | |
| Total cash and investments | 599,611 | | | 710,290 | |
| Less: portion of Company stock held by investment partnerships | (223,802) | | | (171,376) | |
| Carrying value of cash and investments on balance sheet | $ | 375,809 | | | $ | 538,914 | |
Unrealized gains/losses of Biglari Holdings’ stock held by the investment partnerships are eliminated in the Company’s consolidated financial results.
Liquidity
Our balance sheet continues to maintain significant liquidity. Consolidated cash flow activities are summarized below.
| | | | | | | | | | | | | | | | | |
| 2021 | | 2020 | | 2019 |
| Net cash provided by operating activities | $ | 228,767 | | | $ | 117,556 | | | $ | 93,683 | |
| Net cash used in investing activities | (58,525) | | | (129,487) | | | (69,982) | |
| Net cash used in financing activities | (156,157) | | | (29,109) | | | (8,010) | |
| Effect of exchange rate changes on cash | (64) | | | 10 | | | (5) | |
| Increase (decrease) in cash, cash equivalents and restricted cash | $ | 14,021 | | | $ | (41,030) | | | $ | 15,686 | |
In 2021, cash from operating activities increased by $111,211, as compared to 2020. The increase was primarily attributable to distributions from investment partnerships of $180,170 for 2021 and $98,330 for 2020. The distributions during 2021 were primarily used to repay Steak n Shake’s term loan.
Net cash used in investing activities decreased during 2021 by $70,962, as compared to 2020. The decrease was primarily due to the acquisition of Southern Pioneer and purchases of limited partner interests during 2020.
Net cash used in financing activities increased by $127,048 in 2021, as compared to 2020. The increase was primarily due to the repayment of Steak n Shake’s outstanding balance of its term debt during 2021.
We intend to meet the working capital needs of our operating subsidiaries, principally through cash flows generated from operations and cash on hand. We continually review available financing alternatives.
Steak n Shake Credit Facility
On March 19, 2014, Steak n Shake and its subsidiaries entered into a credit agreement that provided for a senior secured term loan facility in an aggregate principal amount of $220,000. The term loan was scheduled to mature on March 19, 2021. As of December 31, 2020, $152,506 was outstanding. The Company repaid Steak n Shake’s outstanding balance in full on February 19, 2021.
Western Sizzlin Revolver
As of December 31, 2021 and 2020, Western Sizzlin had no debt outstanding under its revolver.
Critical Accounting Policies
Certain accounting policies require us to make estimates and judgments in determining the amounts reflected in the consolidated financial statements. Such estimates and judgments necessarily involve varying, and possibly significant, degrees of uncertainty. Accordingly, certain amounts currently recorded in the financial statements will likely be adjusted in the future based on new available information and changes in other facts and circumstances. A discussion of our principal accounting policies that required the application of significant judgments as of December 31, 2021, follows.
Management’s Discussion and Analysis (continued)
Consolidation
The consolidated financial statements include the accounts of Biglari Holdings Inc. and the wholly owned subsidiaries of Biglari Holdings Inc. The analysis as to whether to consolidate an entity is subject to a significant amount of judgment. All intercompany accounts and transactions are eliminated in consolidation.
Our interests in the investment partnerships are accounted for as equity method investments because of our retained limited partner interest in the investment partnerships. The Company records gains from investment partnerships (inclusive of the investment partnerships’ unrealized gains and losses on their securities) in the consolidated statement of earnings based on our proportional ownership interest in the investment partnerships.
Impairment of Restaurant Long-lived Assets
We review company-operated restaurants for impairment on a restaurant-by-restaurant basis when events or circumstances indicate a possible impairment. Assets included in the impairment assessment generally consist of property, equipment and leasehold improvements directly associated with an individual restaurant as well as any related finance or operating lease assets. We test for impairment by comparing the carrying value of the asset to the undiscounted future cash flows expected to be generated by the asset. If the total estimated future cash flows are less than the carrying amount of the asset, the carrying value is written down to the estimated fair value, and a loss is recognized in earnings. Determining the future cash flows expected to be generated by an asset requires significant judgment regarding future performance of the asset, fair market value if the asset were to be sold, and other financial and economic assumptions.
Oil and Natural Gas Reserves
Crude oil and natural gas reserves are estimates of future production that impact certain asset and expense accounts. Proved reserves are the estimated quantities of oil and gas that geoscience and engineering data demonstrate with reasonable certainty to be economically producible in the future under existing economic conditions, operating methods and government regulations. Proved reserves include both developed and undeveloped volumes. Proved developed reserves represent volumes expected to be recovered through existing wells with existing equipment and operating methods. Proved undeveloped reserves are volumes expected to be recovered from new wells on undrilled proved acreage, or from existing wells where expenditure is required for recompletion. We estimate our proved oil and natural gas reserves in accordance with the guidelines established by the SEC. Due to the inherent uncertainties and the limited nature of reservoir data, estimates of reserves are subject to change as additional information becomes available.
Income Taxes
We record deferred tax assets or liabilities based on differences between financial reporting and the tax basis of assets and liabilities using currently enacted rates and laws that will be in effect when the differences are expected to reverse. We record deferred tax assets to the extent we believe there will be sufficient future taxable income to utilize those assets prior to their expiration. To the extent deferred tax assets are unable to be utilized, we would record a valuation allowance against the unrealizable amount and record that amount as a charge against earnings. Due to changing tax laws and state income tax rates, significant judgment is required to estimate the effective tax rate applicable to tax differences arising from reversal in the future. We must also make estimates about the sufficiency of taxable income in future periods to offset any deductions related to deferred tax assets currently recorded.
Goodwill and Other Intangible Assets
We evaluate goodwill and any indefinite-lived intangible assets for impairment annually, or more frequently if circumstances indicate impairment may have occurred. Goodwill impairment occurs when the estimated fair value of goodwill is less than its carrying value. The valuation methodology and underlying financial information included in our determination of fair value require significant managerial judgment. We use both market and income approaches to derive fair value. The methods behind these two approaches include, but are not limited to, comparable market multiples, long-term projections of future financial performance, and the selection of appropriate discount rates used to determine the present value of future cash flows.
Leases
We determine whether a contract is or contains a lease at contract inception based on the presence of identified assets and our right to obtain substantially all of the economic benefit from, or to direct the use of, such assets. When we determine a lease exists, we record a right-of-use asset and corresponding lease liability on our consolidated balance sheets. Right-of-use assets represent our right to use an underlying asset for the lease term. Lease liabilities represent our obligation to make lease payments arising from the lease. Right-of-use assets are recognized at commencement date at the value of the lease liability and are adjusted for any prepayments, lease incentives received, and initial direct costs incurred. Lease liabilities are recognized at the lease commencement date based on the present value of remaining lease payments over the lease term. As the discount rate
Management’s Discussion and Analysis (continued)
implicit in the lease is not readily determinable in most of our leases, we use our incremental borrowing rate based on the information available at commencement date in determining the present value of lease payments. Our lease terms include options to extend or terminate the lease when it is reasonably certain that we will exercise that option. We do not record lease contracts with a term of 12 months or less on our consolidated balance sheets. We recognize fixed lease expense for operating leases on a straight-line basis over the lease term. For finance leases, we recognize amortization expense on the right-of-use asset and interest expense on the lease liability over the lease term.
Cautionary Note Regarding Forward-Looking Statements
This report includes forward-looking statements within the meaning of the Private Securities Litigation Reform Act of 1995. In general, forward-looking statements include estimates of future revenues, cash flows, capital expenditures, or other financial items, and assumptions underlying any of the foregoing. Forward-looking statements reflect management’s current expectations regarding future events and use words such as “anticipate,” “believe,” “expect,” “may,” and other similar terminology. A forward-looking statement is neither a prediction nor a guarantee of future events or circumstances, and those future events or circumstances may not occur. Investors should not place undue reliance on the forward-looking statements, which speak only as of the date of this report. These forward-looking statements are all based on currently available operating, financial, and competitive information and are subject to various risks and uncertainties. Our actual future results and trends may differ materially depending on a variety of factors, many beyond our control, including, but not limited to, the risks and uncertainties described in Item 1A, Risk Factors set forth above. We undertake no obligation to publicly update or revise them, except as may be required by law.
Item 7A. Quantitative and Qualitative Disclosures About Market Risk
The majority of our investments are conducted through investment partnerships, which generally hold common stocks. We also hold marketable securities directly. Through investment partnerships we hold concentrated positions. A significant decline in the general stock market or in the prices of major investments may produce a large net loss and a decrease in our consolidated shareholders’ equity. Decreases in values of equity investments can have a materially adverse effect on our earnings and on consolidated shareholders’ equity.
We prefer to hold equity investments for very long periods of time so we are not troubled by short-term price volatility with respect to our investments. Our interests in the investment partnerships are committed on a rolling 5-year basis, and any distributions upon our withdrawal of funds will be paid out over two years (and may be paid in kind rather than in cash). Market prices for equity securities are subject to fluctuation. Consequently, the amount realized in the subsequent sale of an investment may significantly differ from the reported market value. A hypothetical 10% increase or decrease in the market price of our investments would result in a respective increase or decrease in the fair market value of our investments of $33,346 along with a corresponding change in shareholders’ equity of approximately 4%.
We have had minimal exposure to foreign currency exchange rate fluctuations in 2021, 2020 and 2019.
Southern Oil’s business is fundamentally a commodity business. This means Southern Oil’s operations and earnings may be significantly affected by changes in oil and gas prices. Such commodity prices depend on local, regional, and global events or conditions that affect supply and demand for oil and gas. Any material decline in crude oil or natural gas prices could have a material adverse effect on Southern Oil’s operations.
Item 8. Financial Statements and Supplementary Data
REPORT OF INDEPENDENT REGISTERED PUBLIC ACCOUNTING FIRM
To the Shareholders and the Board of Directors of Biglari Holdings Inc.
Opinion on the Financial Statements
We have audited the accompanying consolidated balance sheets of Biglari Holdings Inc. and subsidiaries (the "Company") as of December 31, 2021 and 2020, the related consolidated statements of earnings, comprehensive income, changes in shareholders' equity, and cash flows for each of the three years in the period ended December 31, 2021, and the related notes (collectively referred to as the "financial statements"). In our opinion, the financial statements present fairly, in all material respects, the financial position of the Company as of December 31, 2021 and 2020, and the results of its operations and its cash flows for each of the three years in the period ended December 31, 2021, in conformity with accounting principles generally accepted in the United States of America.
We have also audited, in accordance with the standards of the Public Company Accounting Oversight Board (United States) (PCAOB), the Company's internal control over financial reporting as of December 31, 2021, based on criteria established in Internal Control — Integrated Framework (2013) issued by the Committee of Sponsoring Organizations of the Treadway Commission and our report dated February 26, 2022 expressed an unqualified opinion on the Company’s internal control over financial reporting.
Basis for Opinion
These financial statements are the responsibility of the Company’s management. Our responsibility is to express an opinion on the Company's financial statements based on our audits. We are a public accounting firm registered with the PCAOB and are required to be independent with respect to the Company in accordance with the U.S. federal securities laws and the applicable rules and regulations of the Securities and Exchange Commission and the PCAOB.
We conducted our audits in accordance with the standards of the PCAOB. Those standards require that we plan and perform the audit to obtain reasonable assurance about whether the financial statements are free of material misstatement, whether due to error or fraud. Our audits included performing procedures to assess the risks of material misstatement of the financial statements, whether due to error or fraud, and performing procedures that respond to those risks. Such procedures included examining, on a test basis, evidence regarding the amounts and disclosures in the financial statements. Our audits also included evaluating the accounting principles used and significant estimates made by management, as well as evaluating the overall presentation of the financial statements. We believe that our audits provide a reasonable basis for our opinion.
Emphasis of a Matter
As discussed in Note 3 and Note 13 to the consolidated financial statements, the Company and its subsidiaries have invested in investment partnerships in the form of limited partnership interests. These investment partnerships represent related parties, and such investments are subject to a rolling five-year lock up period under the terms of the respective partnership agreements for the investment partnerships. The value of these investments reported in the Company’s consolidated balance sheets as of December 31, 2021 and 2020 totals $250,399,000 and $419,550,000, respectively. Our opinion is not modified with respect to this matter.
Critical Audit Matter
The critical audit matter communicated below is a matter arising from the current-period audit of the financial statements that was communicated or required to be communicated to the audit committee and that (1) relates to accounts or disclosures that are material to the financial statements and (2) involved our especially challenging, subjective, or complex judgments. The communication of critical audit matters does not alter in any way our opinion on the financial statements, taken as a whole, and we are not, by communicating the critical audit matter below, providing a separate opinion on the critical audit matter or on the accounts or disclosures to which it relates.
Property and Equipment — Refer to Note 5 to the financial statements
Critical Audit Matter Description
Company-operated restaurants and associated long-lived assets are evaluated for impairment on a restaurant-by-restaurant basis when events or circumstances indicate a possible impairment may have occurred. The Company’s evaluation of potential impairment of long-lived assets involves the comparison of undiscounted future cash flows expected to be generated by the asset group, generally an individual restaurant, over the expected remaining useful life of that asset group, to the respective carrying amount. The Company also applied a market analysis for certain properties. The Company’s undiscounted future cash flows analysis requires management to make estimates and assumptions related to future revenues, labor costs and planned operating periods. To the extent that the undiscounted cash flows are not sufficient to recover the related assets, the Company estimates the fair value of the related assets using a discounted cash flow model to assess the amount of any impairment.
We identified the impairment of company-operated restaurant long-lived assets as a critical audit matter because of the estimates and assumptions required by management to evaluate the potential impairment of these asset groups. This required a high degree of auditor judgment and an increased extent of effort when performing audit procedures to evaluate the reasonableness of certain assumptions, in management’s undiscounted and discounted future cash flows analyses, including revenue growth, food costs, labor costs, and planned operating periods of restaurants.
How the Critical Audit Matter Was Addressed in the Audit
Our audit procedures related to the undiscounted and discounted future cash flows analysis and the assessment of the expected remaining holding period included the following, among others:
•We tested the effectiveness of controls over management’s evaluation of the recoverability of long-lived assets, including those over revenue, food costs, labor costs and the planned operating period for the store.
•We evaluated the undiscounted future cash flows analysis, including estimates of revenue growth, labor costs and planned operating periods of restaurants by (1) evaluating the underlying source information and assumptions used by management (2) performing sensitivity analyses and (3) testing the mathematical accuracy of the undiscounted future cash flows analysis.
•We evaluated the reasonableness of management’s undiscounted future cash flows analysis by comparing management’s projections to the Company’s historical results and available market data.
•We evaluated the discount rates used by management in the performance of discounted cash flow analyses by testing management’s calculation, performing sensitivity analyses, comparing components to external market information as applicable, and assessed the mathematical accuracy of the Company’s calculations of potential impairment.
/s/ DELOITTE & TOUCHE LLP
Indianapolis, Indiana
February 26, 2022
We have served as the Company’s auditor since 2003.
REPORT OF INDEPENDENT REGISTERED PUBLIC ACCOUNTING FIRM
To the Shareholders and the Board of Directors of Biglari Holdings Inc.
Opinion on Internal Control over Financial Reporting
We have audited the internal control over financial reporting of Biglari Holdings Inc. and subsidiaries (the “Company”) as of December 31, 2021, based on criteria established in Internal Control — Integrated Framework (2013) issued by the Committee of Sponsoring Organizations of the Treadway Commission (COSO). In our opinion, the Company maintained, in all material respects, effective internal control over financial reporting as of December 31, 2021, based on criteria established in Internal Control — Integrated Framework (2013) issued by COSO.
We have also audited, in accordance with the standards of the Public Company Accounting Oversight Board (United States) (PCAOB), the consolidated financial statements as of and for the year ended December 31, 2021, of the Company and our report dated February 26, 2022, expressed an unqualified opinion on those financial statements and included an emphasis of a matter paragraph relating to the Company’s investment in related party investment partnerships.
Basis for Opinion
The Company’s management is responsible for maintaining effective internal control over financial reporting and for its assessment of the effectiveness of internal control over financial reporting, included in the accompanying Management’s Report on Internal Control Over Financial Reporting. Our responsibility is to express an opinion on the Company’s internal control over financial reporting based on our audit. We are a public accounting firm registered with the PCAOB and are required to be independent with respect to the Company in accordance with the U.S. federal securities laws and the applicable rules and regulations of the Securities and Exchange Commission and the PCAOB.
We conducted our audit in accordance with the standards of the PCAOB. Those standards require that we plan and perform the audit to obtain reasonable assurance about whether effective internal control over financial reporting was maintained in all material respects. Our audit included obtaining an understanding of internal control over financial reporting, assessing the risk that a material weakness exists, testing and evaluating the design and operating effectiveness of internal control based on the assessed risk, and performing such other procedures as we considered necessary in the circumstances. We believe that our audit provides a reasonable basis for our opinion.
Definition and Limitations of Internal Control over Financial Reporting
A company’s internal control over financial reporting is a process designed to provide reasonable assurance regarding the reliability of financial reporting and the preparation of financial statements for external purposes in accordance with generally accepted accounting principles. A company’s internal control over financial reporting includes those policies and procedures that (1) pertain to the maintenance of records that, in reasonable detail, accurately and fairly reflect the transactions and dispositions of the assets of the company; (2) provide reasonable assurance that transactions are recorded as necessary to permit preparation of financial statements in accordance with generally accepted accounting principles, and that receipts and expenditures of the company are being made only in accordance with authorizations of management and directors of the company; and (3) provide reasonable assurance regarding prevention or timely detection of unauthorized acquisition, use, or disposition of the company’s assets that could have a material effect on the financial statements.
Because of its inherent limitations, internal control over financial reporting may not prevent or detect misstatements. Also, projections of any evaluation of effectiveness to future periods are subject to the risk that controls may become inadequate because of changes in conditions, or that the degree of compliance with the policies or procedures may deteriorate.
/s/ DELOITTE & TOUCHE LLP
Indianapolis, Indiana
February 26, 2022
BIGLARI HOLDINGS INC.
CONSOLIDATED BALANCE SHEETS
(dollars in thousands)
| | | | | | | | | | | |
| December 31, |
| 2021 | | 2020 |
| Assets | | | |
| Current assets: | | | |
| Cash and cash equivalents | $ | 42,349 | | | $ | 24,503 | |
| Investments | 83,061 | | | 94,861 | |
| Receivables | 28,508 | | | 19,185 | |
| Inventories | 3,803 | | | 2,737 | |
| Other current assets | 7,088 | | | 6,492 | |
| Total current assets | 164,809 | | | 147,778 | |
| Property and equipment | 349,351 | | | 316,122 | |
| Operating lease assets | 42,538 | | | 42,832 | |
| Goodwill | 53,547 | | | 53,596 | |
| Other intangible assets | 23,463 | | | 24,065 | |
| Investment partnerships | 250,399 | | | 419,550 | |
| Other assets | 10,700 | | | 14,025 | |
| Total assets | $ | 894,807 | | | $ | 1,017,968 | |
| | | |
| Liabilities and shareholders’ equity | | | |
| Liabilities | | | |
| Current liabilities: | | | |
| Accounts payable and accrued expenses | $ | 100,467 | | | $ | 90,892 | |
| Loss and loss adjustment expenses | 14,609 | | | 14,652 | |
| Unearned premiums | 11,667 | | | 13,277 | |
| Current portion of lease obligations | 16,898 | | | 17,365 | |
| Current portion of notes payable | — | | | 152,261 | |
| Total current liabilities | 143,641 | | | 288,447 | |
| Lease obligations | 104,479 | | | 111,645 | |
| Deferred taxes | 46,533 | | | 41,346 | |
| Asset retirement obligations | 10,389 | | | 10,022 | |
| Other liabilities | 2,069 | | | 1,680 | |
| Total liabilities | 307,111 | | | 453,140 | |
| | | |
| Shareholders’ equity | | | |
| Common stock | 1,138 | | | 1,138 | |
| Additional paid-in capital | 381,788 | | | 381,788 | |
| Retained earnings | 608,528 | | | 573,050 | |
| Accumulated other comprehensive loss | (1,907) | | | (1,531) | |
| Treasury stock, at cost | (401,851) | | | (389,617) | |
| Biglari Holdings Inc. shareholders’ equity | 587,696 | | | 564,828 | |
| Total liabilities and shareholders’ equity | $ | 894,807 | | | $ | 1,017,968 | |
See accompanying Notes to Consolidated Financial Statements.
BIGLARI HOLDINGS INC.
CONSOLIDATED STATEMENTS OF EARNINGS
(dollars in thousands except per-share amounts)
| | | | | | | | | | | | | | | | | |
| Year Ended December 31, |
| 2021 | | 2020 | | 2019 |
| Revenues | | | | | |
| Restaurant operations | $ | 271,290 | | | $ | 350,666 | | | $ | 610,220 | |
| Insurance premiums and other | 58,609 | | | 52,679 | | | 30,083 | |
| Oil and gas | 33,004 | | | 26,255 | | | 24,436 | |
| Licensing and media | 3,203 | | | 4,083 | | | 4,099 | |
| | 366,106 | | | 433,683 | | | 668,838 | |
| Cost and expenses | | | | | |
| Restaurant cost of sales | 167,491 | | | 246,655 | | | 500,949 | |
| Insurance losses and underwriting expenses | 43,094 | | | 39,221 | | | 22,269 | |
| Oil and gas production costs | 10,470 | | | 8,700 | | | 7,259 | |
| Licensing and media costs | 2,275 | | | 2,156 | | | 3,181 | |
| Selling, general and administrative | 76,018 | | | 76,360 | | | 100,150 | |
| Impairments | 4,635 | | | 23,646 | | | 8,186 | |
| Depreciation, depletion, and amortization | 30,050 | | | 32,222 | | | 29,578 | |
| Interest expense on leases | 6,039 | | | 6,274 | | | 7,816 | |
| Interest expense on note payable | 1,121 | | | 9,262 | | | 12,442 | |
| | 341,193 | | | 444,496 | | | 691,830 | |
| Other income (expenses) | | | | | |
| Investment gains | 6,401 | | | 3,644 | | | — | |
| Investment partnership gains (losses) | 10,953 | | | (43,032) | | | 78,133 | |
| Total other income (expenses) | 17,354 | | | (39,388) | | | 78,133 | |
| Earnings (loss) before income taxes | 42,267 | | | (50,201) | | | 55,141 | |
| Income tax expense (benefit) | 6,789 | | | (12,212) | | | 9,761 | |
| Net earnings (loss) | $ | 35,478 | | | $ | (37,989) | | | $ | 45,380 | |
| | | | | |
| Net earnings per equivalent Class A share * | $ | 111.83 | | | $ | (110.05) | | | $ | 131.64 | |
* Net earnings per equivalent Class B share outstanding are one-fifth of the equivalent Class A share or $22.37 for 2021, $(22.01) for 2020 and $26.33 for 2019.
CONSOLIDATED STATEMENTS OF COMPREHENSIVE INCOME
(dollars in thousands)
| | | | | | | | | | | | | | | | | |
| Year Ended December 31, |
| 2021 | | 2020 | | 2019 |
| Net earnings (loss) | $ | 35,478 | | | $ | (37,989) | | | $ | 45,380 | |
| Other comprehensive income: | | | | | |
| Foreign currency translation | (376) | | | 1,279 | | | (294) | |
| Other comprehensive income (loss), net | (376) | | | 1,279 | | | (294) | |
| Total comprehensive income (loss) | $ | 35,102 | | | $ | (36,710) | | | $ | 45,086 | |
See accompanying Notes to Consolidated Financial Statements.
BIGLARI HOLDINGS INC.
CONSOLIDATED STATEMENTS OF CASH FLOWS
(dollars in thousands)
| | | | | | | | | | | | | | | | | |
| Year Ended December 31, |
| 2021 | | 2020 | | 2019 |
| Operating activities | | | | | |
| Net earnings (loss) | $ | 35,478 | | | $ | (37,989) | | | $ | 45,380 | |
| Adjustments to reconcile net earnings to operating cash flows: | | | | | |
| Depreciation and amortization | 30,050 | | | 32,222 | | | 29,578 | |
| Provision for deferred income taxes | 5,269 | | | (12,216) | | | (38,545) | |
| Asset impairments and other non-cash expenses | 4,772 | | | 24,636 | | | 9,113 | |
| (Gains) losses on disposal of assets | (25) | | | (868) | | | 264 | |
| Investment (gains) losses | (6,214) | | | (4,856) | | | (1,172) | |
| Investment partnership (gains) losses | (10,953) | | | 43,032 | | | (78,133) | |
| Distributions from investment partnerships | 180,170 | | | 98,330 | | | 129,329 | |
| Changes in receivables and inventories | (9,324) | | | 7,014 | | | 3,669 | |
| Changes in other assets | 136 | | | 733 | | | 10,450 | |
| Changes in accounts payable and accrued expenses | (592) | | | (32,482) | | | (16,250) | |
| Net cash provided by operating activities | 228,767 | | | 117,556 | | | 93,683 | |
| Investing activities | | | | | |
| Capital expenditures | (64,549) | | | (20,702) | | | (17,679) | |
| Proceeds from property and equipment disposals | 10,101 | | | 4,415 | | | 4,577 | |
| Acquisition of business, net of cash acquired | — | | | (36,187) | | | (51,062) | |
| Distributions from investment partnerships | — | | | — | | | 40,000 | |
| Purchases of limited partner interests | (12,300) | | | (70,130) | | | (40,000) | |
| Purchases of investments | (110,199) | | | (299,950) | | | (154,848) | |
| Redemptions of fixed maturity securities | 118,422 | | | 293,067 | | | 149,030 | |
| Net cash used in investing activities | (58,525) | | | (129,487) | | | (69,982) | |
| Financing activities | | | | | |
| Payments on revolving credit facility | — | | | (500) | | | — | |
| Proceeds from revolving credit facility | — | | | 500 | | | — | |
| Principal payments on long-term debt | (149,952) | | | (23,279) | | | (2,200) | |
| Principal payments on direct financing lease obligations | (6,205) | | | (5,830) | | | (5,810) | |
| Net cash used in financing activities | (156,157) | | | (29,109) | | | (8,010) | |
| Effect of exchange rate changes on cash | (64) | | | 10 | | | (5) | |
| Increase (decrease) in cash, cash equivalents and restricted cash | 14,021 | | | (41,030) | | | 15,686 | |
| Cash, cash equivalents and restricted cash at beginning of period | 29,666 | | | 70,696 | | | 55,010 | |
| Cash, cash equivalents and restricted cash at end of period | $ | 43,687 | | | $ | 29,666 | | | $ | 70,696 | |
| | | | | | | | | | | | | | | | | |
| Year Ended December 31, |
| 2021 | | 2020 | | 2019 |
| Cash and cash equivalents | $ | 42,349 | | | $ | 24,503 | | | $ | 67,772 | |
| Restricted cash included in other long-term assets | 1,338 | | | 5,163 | | | 2,924 | |
| Cash, cash equivalents and restricted cash at end of period | $ | 43,687 | | | $ | 29,666 | | | $ | 70,696 | |
See accompanying Notes to Consolidated Financial Statements.
BIGLARI HOLDINGS INC.
CONSOLIDATED STATEMENTS OF CHANGES IN SHAREHOLDERS’ EQUITY
(dollars in thousands)
| | | | | | | | | | | | | | | | | | | | | | | | | | | | | | | | | | | |
| Common Stock | | Additional Paid-
In Capital | | Retained
Earnings | | Accumulated
Other
Comprehensive
Income (Loss) | | Treasury Stock | | Total |
| Balance at December 31, 2018 | $ | 1,138 | | | $ | 381,904 | | | $ | 564,160 | | | $ | (2,516) | | | $ | (374,231) | | | $ | 570,455 | |
| Net earnings | | | | | 45,380 | | | | | | | 45,380 | |
| Adoption of accounting standards | | | | | 1,499 | | | | | | | 1,499 | |
| Other comprehensive income, net | | | | | | | (294) | | | | | (294) | |
| Adjustment to treasury stock for | | | | | | | | | | | |
| holdings in investment partnerships | | | (116) | | | | | | | (626) | | | (742) | |
| Balance at December 31, 2019 | $ | 1,138 | | | $ | 381,788 | | | $ | 611,039 | | | $ | (2,810) | | | $ | (374,857) | | | $ | 616,298 | |
| Net earnings | | | | | (37,989) | | | | | | | (37,989) | |
| Other comprehensive income, net | | | | | | | 1,279 | | | | | 1,279 | |
| Adjustment to treasury stock for | | | | | | | | | | | |
| holdings in investment partnerships | | | | | | | | | (14,760) | | | (14,760) | |
| Balance at December 31, 2020 | $ | 1,138 | | | $ | 381,788 | | | $ | 573,050 | | | $ | (1,531) | | | $ | (389,617) | | | $ | 564,828 | |
| Net earnings (loss) | | | | | 35,478 | | | | | | | 35,478 | |
| Other comprehensive income, net | | | | | | | (376) | | | | | (376) | |
| Adjustment to treasury stock for | | | | | | | | | | | |
| holdings in investment partnerships | | | | | | | | | (12,234) | | | (12,234) | |
| Balance at December 31, 2021 | $ | 1,138 | | | $ | 381,788 | | | $ | 608,528 | | | $ | (1,907) | | | $ | (401,851) | | | $ | 587,696 | |
See accompanying Notes to Consolidated Financial Statements.
BIGLARI HOLDINGS INC.
NOTES TO CONSOLIDATED FINANCIAL STATEMENTS
(Years Ended December 31, 2021, 2020 and 2019)
(dollars in thousands, except share and per-share data)
Note 1. Summary of Significant Accounting Policies
Description of Business
Biglari Holdings Inc. is a holding company owning subsidiaries engaged in a number of diverse business activities, including property and casualty insurance, licensing and media, restaurants, and oil and gas. The Company’s largest operating subsidiaries are involved in the franchising and operating of restaurants. Biglari Holdings is founded and led by Sardar Biglari, Chairman and Chief Executive Officer of the Company.
Biglari Holdings’ management system combines decentralized operations with centralized finance decision-making. Operating decisions for the various business units are made by their respective managers. All major investment and capital allocation decisions are made for the Company and its subsidiaries by Mr. Biglari.
As of December 31, 2021, Mr. Biglari beneficially owns shares of the Company that represent approximately 66.2% of the economic interest and approximately 70.4% of the voting interest.
Overview of the Impact of COVID-19
The novel coronavirus (“COVID-19”) was declared a pandemic by the World Health Organization in March of 2020. Government and private sector responses to contain its spread began to affect our operating businesses significantly that same month. COVID-19 and its variants have adversely affected nearly all of our operations, although the effects vary significantly. The risks and uncertainties resulting from the pandemic may continue to affect our future earnings, cash flows, and financial condition. The extent of such effects over the long term cannot be reasonably estimated at this time.
Business Acquisitions
On March 9, 2020, Biglari Holdings acquired the stock of Southern Pioneer Property & Casualty Insurance Company and its agency, Southern Pioneer Insurance Agency, Inc. (collectively “Southern Pioneer”). Southern Pioneer underwrites garage liability insurance and commercial property coverage, as well as homeowners and dwelling fire insurance coverage. The financial results for Southern Pioneer are included from the date of acquisition. Pro-forma financial information of Southern Pioneer is not material.
Principles of Consolidation
The consolidated financial statements include the accounts of the Company and its wholly owned subsidiaries, including Steak n Shake Inc., Western Sizzlin Corporation, First Guard Insurance Company, Maxim Inc., Southern Pioneer, and Southern Oil. Intercompany accounts and transactions have been eliminated in consolidation.
Cash, Cash Equivalents, and Restricted Cash
Cash equivalents primarily consist of U.S. Government securities and money market accounts, all of which have original maturities of three months or less. Cash equivalents are carried at fair value. The statement of cash flows includes restricted cash with cash and cash equivalents.
Investments
We classify investments in fixed maturity securities at the acquisition date as either available-for-sale or held-to-maturity and re-evaluate the classification at each balance sheet date. Securities classified as held-to-maturity are carried at amortized cost, reflecting the ability and intent to hold the securities to maturity. As of December 31, 2021 and 2020, all investments were classified as available-for-sale and carried at fair value with net unrealized gains or losses reported in the statements of earnings. Realized gains and losses on disposals of investments are determined by the specific identification of cost of investments sold. Dividends earned on investments are reported as investment income by our insurance companies. We consider investment income as a component of our aggregate insurance operating results. However, we consider investment gains and losses, whether realized or unrealized, as non-operating.
Note 1. Summary of Significant Accounting Policies (continued)
Investment Partnerships
The Company holds a limited interest in The Lion Fund, L.P. and The Lion Fund II, L.P. (collectively the “investment partnerships”). Biglari Capital Corp. (“Biglari Capital”), an entity solely owned by Mr. Biglari, is the general partner of the investment partnerships. Our interests in the investment partnerships are accounted as equity method investments because of our retained limited partner interests. The Company records investment partnership gains (inclusive of the investment partnerships’ unrealized gains and losses on their securities) as a component of other income based on our proportional ownership interest in the partnerships. The investment partnerships are, for purposes of generally accepted accounting principles (“GAAP”), investment companies under the AICPA Audit and Accounting Guide Investment Companies.
Concentration of Equity Price Risk
The majority of our investments are conducted through investment partnerships that generally hold common stocks. We also hold marketable securities directly. We concentrate a high percentage of the investments in a small number of equity securities. A significant decline in the general stock market or in the prices of major investments may have a materially adverse effect on our earnings and on consolidated shareholders’ equity.
Receivables
Our accounts receivable balance consists primarily of franchisee, customer, and other receivables. We carry our accounts receivable at cost less an allowance for doubtful accounts, which is based on a history of past write-offs and collections and current credit conditions. Allowance for doubtful accounts was $505 and $6,859 at December 31, 2021 and 2020, respectively.
Inventories
Inventories are valued at the lower of cost (first-in, first-out method) or market, and consist primarily of restaurant food items and supply inventory.
Property and Equipment
Property and equipment are stated at cost less accumulated depreciation and amortization. Depreciation and amortization are recognized on the straight-line method over the estimated useful lives of the assets (10 to 30 years for buildings and land improvements, and 3 to 10 years for equipment). Leasehold improvements are amortized on the straight-line method over the shorter of the estimated useful lives of the improvements or the term of the related leases. Interest costs associated with the construction of new restaurants are capitalized. Major improvements are also capitalized while repairs and maintenance are expensed as incurred. We review our long-lived restaurant assets whenever events or changes in circumstances indicate that their carrying amounts may not be recoverable. For purposes of this assessment, assets are evaluated at the lowest level for which there are identifiable cash flows, which is generally at the individual restaurant level. Assets included in the impairment assessment generally consist of property, equipment, and leasehold improvements directly associated with an individual restaurant as well as any related finance or operating lease assets. If the future undiscounted cash flows of an asset are less than the recorded value, an impairment is recorded for the difference between the carrying value and the estimated fair value of the asset.
Oil and Gas Properties
The successful efforts method is used for crude oil and natural gas exploration and production activities. All costs for development wells, related plant and equipment, proved mineral interests in crude oil and natural gas properties, and related asset retirement obligation assets are capitalized. Costs of exploratory wells are capitalized pending determination of whether the wells found proved reserves. Costs of wells that are assigned proved reserves remain capitalized. Costs are also capitalized for exploratory wells that have found crude oil and natural gas reserves, even if the reserves cannot be classified as proved when the drilling is completed, provided the exploratory well has found a sufficient quantity of reserves to justify its completion as a producing well and the company is making sufficient progress assessing the reserves and the economic and operating viability of the project. All other exploratory wells and costs are expensed. There were no capitalized costs for exploratory activities during 2021.
Asset Retirement Obligations
Asset retirement obligations relate to future costs associated with the plugging and abandonment of oil and gas wells, the removal of equipment and facilities from leased acreage, and the return of such land to its original condition. The Company determines its asset retirement obligation amounts by calculating the present value of the estimated future cash outflows associated with its plug and abandonment obligations. The fair value of a liability for an asset retirement obligation is recorded in the period in which it is incurred, and the cost of such liability increases the carrying amount of the related long-lived asset by the same amount. The liability is accreted each period through charges to depreciation, depletion, and amortization expense,
Note 1. Summary of Significant Accounting Policies (continued)
and the capitalized cost is depleted on a unit-of-production basis over the proved developed reserves of the related asset. If an asset retirement obligation is settled for an amount other than the recorded amount, a gain or loss is recognized.
Goodwill and Other Intangible Assets
Goodwill and indefinite life intangible assets are not amortized, but are tested for potential impairment on an annual basis using either a qualitative or quantitative approach, or more often if events or circumstances change that could cause goodwill or indefinite life intangible assets to become impaired. Other purchased intangible assets are amortized over their estimated useful lives, generally on a straight-line basis. We perform reviews for impairment of intangible assets whenever events or changes in circumstances indicate that the carrying value of an asset may not be recoverable. An impairment loss is recognized when estimated future cash flows expected to result from the use of the asset and its eventual disposition are less than its carrying value. When an impairment is identified, we reduce the carrying value of the asset to its estimated fair value. During 2021, no impairments were recorded to goodwill and other intangible assets. During 2020, we recorded an impairment to goodwill of $300 and to indefinite life intangible assets of $3,728. No impairment was recorded in 2019. Refer to Note 7 for information regarding our goodwill and other intangible assets.
Dual Class Common Stock
The Company has two classes of common stock, designated Class A common stock and Class B common stock. Each Class A common share is entitled to one vote. Class B common stock possesses economic rights equal to one-fifth (1/5th) of such rights of Class A common stock; however, Class B common stock has no voting rights.
The following table presents shares authorized, issued, and outstanding.
| | | | | | | | | | | | | | | | | | | | | | | | | | | | | | | | | | | |
| December 31, 2021 | | December 31, 2020 | | December 31, 2019 |
| Class A | | Class B | | Class A | | Class B | | Class A | | Class B |
| Common stock authorized | 500,000 | | | 10,000,000 | | | 500,000 | | | 10,000,000 | | | 500,000 | | | 10,000,000 | |
| Common stock issued and outstanding | 206,864 | | | 2,068,640 | | | 206,864 | | | 2,068,640 | | | 206,864 | | | 2,068,640 | |
Earnings Per Share
Earnings per share of common stock is based on the weighted average number of shares outstanding during the year. The shares of Company stock attributable to our limited partner interest in the investment partnerships — based on our proportional ownership during this period — are considered treasury stock on the consolidated balance sheet and thereby deemed not to be included in the calculation of weighted average common shares outstanding. However, these shares are legally outstanding.
The Company has applied the “two-class method” of computing earnings per share as prescribed in Accounting Standards Codification (“ASC”) 260, “Earnings Per Share.” The equivalent Class A common stock applied for computing earnings per share excludes the proportional shares of Biglari Holdings’ stock held by the investment partnerships. In the tabulation below is the equivalent Class A common stock for earnings per share. There are no dilutive securities outstanding.
| | | | | | | | | | | | | | | | | |
| 2021 | | 2020 | | 2019 |
| Equivalent Class A common stock outstanding | 620,592 | | | 620,592 | | | 620,592 | |
| Proportional ownership of Company stock held by investment partnerships | 303,341 | | | 275,400 | | | 275,856 | |
| Equivalent Class A common stock for earnings per share | 317,251 | | | 345,192 | | | 344,736 | |
Note 1. Summary of Significant Accounting Policies (continued)
Revenue Recognition
Restaurant operations
Restaurant operations revenues were disaggregated as follows.
| | | | | | | | | | | | | | | | | |
| 2021 | | 2020 | | 2019 |
| Net sales | $ | 187,913 | | | $ | 306,577 | | | $ | 578,164 | |
| Franchise partner fees | 55,641 | | | 22,213 | | | 3,829 | |
| Franchise royalties and fees | 21,736 | | | 18,794 | | | 23,360 | |
| Other | 6,000 | | | 3,082 | | | 4,867 | |
| $ | 271,290 | | | $ | 350,666 | | | $ | 610,220 | |
Net Sales
Net sales are composed of retail sales of food through company-operated stores. Company-operated store revenues are recognized, net of discounts and sales taxes, when our obligation to perform is satisfied at the point of sale. Sales taxes related to these sales are collected from customers and remitted to the appropriate taxing authority and are not reflected in the Company’s consolidated statements of earnings as revenue.
Franchise Partner Fees
Franchise partner fees are composed of up to 15% of sales as well as 50% of profits. We are therefore fully affected by the operating results of the business, unlike in a traditional franchising arrangement, where the franchisor obtains a royalty fee based on sales only. We generate most of our revenue from our share of the franchise partners’ profits. An initial franchise fee of ten thousand dollars is recognized when the operator becomes a franchise partner. The Company recognizes franchise partner fees monthly as underlying restaurant sales occur.
The Company leases or subleases property and equipment to franchisees under lease arrangements. Both real estate and equipment rental payments are charged to franchisees and are recognized in accordance with ASC 842, "Leases". During the years ended 2021, 2020 and 2019, restaurant operations recognized $15,483, $5,675, and $1,084, respectively, in franchise partner fees related to rental income.
Franchise Royalties and Fees
Franchise royalties and fees from Steak n Shake and Western Sizzlin franchisees are based upon a percentage of sales of the franchise restaurant and are recognized as earned. Franchise royalties are billed on a monthly basis. Initial franchise fees when a new restaurant opens or at the start of a new franchise term are recorded as deferred revenue when received and recognized as revenue over the term of the franchise agreement.
During the years ended December 31, 2021, 2020 and 2019 restaurant operations recognized $2,033, $1,879 and $1,725, respectively, in revenue related to initial franchise fees. As of December 31, 2021 and 2020, restaurant operations had deferred revenue recorded in accrued expenses related to franchise fees of $5,199 and $6,928, respectively. Restaurant operations expect to recognize approximately $972 of deferred revenue during 2022.
Our advertising arrangements with franchisees are reported in franchise royalties and fees. During the years ended December 31, 2021, 2020 and 2019 restaurant operations recognized $6,829, $5,193 and $7,815, respectively, in revenue related to franchisee advertising fees. As of December 31, 2021 and 2020, restaurant operations had deferred revenue recorded in accrued expenses related to franchisee advertising fees of $4,151 and $4,391, respectively. Restaurant operations expect to recognize approximately $3,113 of deferred revenue during 2022.
Other Revenue
Restaurant operations sells gift cards to customers which can be redeemed for retail food sales within our stores. Gift cards are recorded as deferred revenue when issued and are subsequently recorded as net sales upon redemption. Restaurant operations estimates breakage related to gift cards when the likelihood of redemption is remote. This estimate utilizes historical trends based on the vintage of the gift card. Breakage on gift cards is recorded as other revenue in proportion to the rate of gift card redemptions by vintage.
Note 1. Summary of Significant Accounting Policies (continued)
For the years ended December 31, 2021, 2020 and 2019 restaurant operations recognized $5,903, $9,201 and $22,869 respectively, of revenue from gift card redemptions. As of December 31, 2021 and 2020, restaurant operations had deferred revenue recorded in accrued expenses related to unredeemed gift cards of $15,059 and $17,431, respectively. Restaurant operations expect to recognize approximately $8,202 of deferred revenue during 2022.
Insurance Premiums and Commissions
Insurance premiums are earned over the terms of the related policies. Expenses incurred in connection with acquiring new insurance business, including acquisition costs, are charged to operations as incurred. Premiums earned are stated net of amounts ceded to reinsurer.
Oil and Gas
Revenues are derived from the sale of produced oil and natural gas. Revenue is recognized when the performance obligation is satisfied, which typically occurs at the point in time when control of the product transfers to the customer. Payment is due within 30 days of delivery.
Licensing Revenue and Other
Licensing revenue is recognized when earned. We derive value and revenues from intellectual property assets through a range of licensing and business activities, including licensing and syndication of our trademarks and copyrights in the United States and internationally. Magazine subscription and advertising revenues are recognized at the magazine cover date. The unearned portion of magazine subscriptions is deferred until the magazine’s cover date, at which time a proportionate share of the gross subscription price is recognized as revenue.
Restaurant Cost of Sales
Cost of sales includes the cost of food, restaurant operating costs, and restaurant occupancy costs. Cost of sales excludes depreciation and amortization, which is presented as a separate line item on the consolidated statement of earnings.
Insurance Losses and Underwriting Expenses
Liabilities for estimated unpaid losses and loss adjustment expenses with respect to claims occurring on or before the balance sheet date are established under insurance contracts issued by our insurance subsidiaries. Such estimates include provisions for reported claims or case estimates, provisions for incurred but not reported claims, and legal and administrative costs to settle claims. The estimates of unpaid losses and amounts recoverable under reinsurance are established and continually reviewed by using a variety of actuarial, statistical, and analytical techniques. Reinsurance contracts do not relieve the ceding company of its obligations to indemnify policyholders with respect to the underlying insurance contracts. Liabilities for insurance losses of $14,609 and $14,652 are included in accrued expenses in the consolidated balance sheet as of December 31, 2021 and 2020, respectively.
Oil and Gas Production Costs
Oil and gas production costs are composed of lease operating expenses and production taxes.
Marketing Expense
Advertising costs are charged to expense at the later of the date the expenditure is incurred or the date the promotional item is first communicated. Marketing expense is included in selling, general and administrative expenses in the consolidated statement of earnings.
Insurance Reserves
We self-insure a significant portion of expected losses under our workers’ compensation, general liability, auto, directors and officers liability, and medical liability insurance programs, and record a reserve for our estimated losses on all unresolved open claims and our estimated incurred but not reported claims at the anticipated cost to us. Insurance reserves are recorded in accrued expenses in the consolidated balance sheet.
Savings Plans
Several of our subsidiaries also sponsor deferred compensation and defined contribution retirement plans, such as 401(k) or profit sharing plans. Employee contributions to the plans are subject to regulatory limitations and the specific plan provisions.
Note 1. Summary of Significant Accounting Policies (continued)
Some of the plans allow for discretionary contributions as determined by management. Employer contributions expensed with respect to these plans were not material.
Foreign Currency Translation
The Company has certain subsidiaries located in foreign jurisdictions. For subsidiaries whose functional currency is other than the U.S. dollar, the translation of functional currency statements to U.S. dollar statements uses end-of-period exchange rates for assets and liabilities, weighted average exchange rates for revenue and expenses, and historical rates for equity. The resulting currency translation adjustment is recorded in accumulated other comprehensive income, as a component of equity.
Use of Estimates
Preparation of the consolidated financial statements in accordance with GAAP requires management to make estimates and assumptions that affect the amounts reported in the consolidated financial statements and accompanying notes. Actual results could differ from the estimates.
Note 2. Investments
Investments were $83,061 and $94,861 as of December 31, 2021 and 2020, respectively. We classify investments in fixed maturity securities at the acquisition date as either available-for-sale or held-to-maturity and re-evaluate the classification at each balance sheet date. Securities classified as held-to-maturity are carried at amortized cost, reflecting the ability and intent to hold the securities to maturity. Realized gains and losses on disposals of investments are determined on a specific identification basis. Dividends earned on investments are reported as investment income by our insurance companies. We consider investment income as a component of our aggregate insurance operating result. However, we consider investment gains and losses, whether realized or unrealized, as non-operating.
Investment gains in 2021 were $6,401, which include a $5,047 gain on the sale of real estate. The Company purchased 26 acres of land in Murfreesboro, Tennessee, in 2014 for $2,145 and sold it in the third quarter of 2021. Investment gains in 2020 were $3,644. There were no investment gains in 2019.
The carrying value of investments net of deferred taxes is presented below.
| | | | | | | | | | | |
| December 31, |
| 2021 | | 2020 |
| Carrying value of investments | $ | 83,061 | | | $ | 94,861 | |
| Deferred tax liability related to investments | (845) | | | (665) | |
| Carrying value of investments net of deferred taxes | $ | 82,216 | | | $ | 94,196 | |
Note 3. Investment Partnerships
The Company reports on the limited partnership interests in investment partnerships under the equity method of accounting. We record our proportional share of equity in the investment partnerships but exclude Company common stock held by said partnerships. The Company’s pro-rata share of its common stock held by the investment partnerships is recorded as treasury stock even though these shares are legally outstanding. The Company records gains/losses from investment partnerships (inclusive of the investment partnerships’ unrealized gains and losses on their securities) in the consolidated statements of earnings based on our carrying value of these partnerships. The fair value is calculated net of the general partner’s accrued incentive fees. Gains and losses on Company common stock included in the earnings of these partnerships are eliminated because they are recorded as treasury stock.
Biglari Capital is the general partner of the investment partnerships and is an entity solely owned by Mr. Biglari.
Note 3. Investment Partnerships (continued)
The fair value and adjustment for Company common stock held by the investment partnerships to determine the carrying value of our partnership interest are presented below.
| | | | | | | | | | | | | | | | | |
| Fair Value | | Company Common Stock | | Carrying
Value |
| Partnership interest at December 31, 2018 | $ | 715,102 | | | $ | 157,622 | | | $ | 557,480 | |
| Investment partnership gains (losses) | 80,350 | | | 2,217 | | | 78,133 | |
| Distributions (net of contributions) | (129,329) | | | | | (129,329) | |
| Increase in proportionate share of Company stock held | | | 742 | | | (742) | |
| Partnership interest at December 31, 2019 | $ | 666,123 | | | $ | 160,581 | | | $ | 505,542 | |
| Investment partnership gains (losses) | (46,997) | | | (3,965) | | | (43,032) | |
| Distributions (net of contributions) | (28,200) | | | | | (28,200) | |
| Increase in proportionate share of Company stock held | | | 14,760 | | | (14,760) | |
| Partnership interest at December 31, 2020 | $ | 590,926 | | | $ | 171,376 | | | $ | 419,550 | |
| Investment partnership gains (losses) | 51,145 | | | 40,192 | | | 10,953 | |
| Distributions (net of contributions) | (167,870) | | | | | (167,870) | |
| Increase in proportionate share of Company stock held | | | 12,234 | | | (12,234) | |
| Partnership interest at December 31, 2021 | $ | 474,201 | | | $ | 223,802 | | | $ | 250,399 | |
The carrying value of the investment partnerships net of deferred taxes is presented below.
| | | | | | | | | | | |
| December 31, |
| 2021 | | 2020 |
| Carrying value of investment partnerships | $ | 250,399 | | | $ | 419,550 | |
| Deferred tax liability related to investment partnerships | (44,532) | | | (44,805) | |
| Carrying value of investment partnerships net of deferred taxes | $ | 205,867 | | | $ | 374,745 | |
The Company’s proportionate share of Company stock held by investment partnerships at cost was $401,851 and $389,617 at December 31, 2021 and 2020, respectively, and was recorded as treasury stock.
The carrying value of the partnership interest approximates fair value adjusted by the value of held Company stock. Fair value of our partnership interest is assessed according to our proportional ownership interest of the fair value of investments held by the investment partnerships. Unrealized gains and losses on marketable securities held by the investment partnerships affect our net earnings.
Gains/losses from investment partnerships recorded in the Company’s consolidated statements of earnings are presented below.
| | | | | | | | | | | | | | | | | |
| 2021 | | 2020 | | 2019 |
| Gains (losses) from investment partnerships | $ | 10,953 | | | $ | (43,032) | | | $ | 78,133 | |
| Tax expense (benefit) | 2,054 | | | (10,526) | | | 17,360 | |
| Contribution to net earnings | $ | 8,899 | | | $ | (32,506) | | | $ | 60,773 | |
On December 31 of each year, the general partner of the investment partnerships, Biglari Capital, will earn an incentive reallocation fee for the Company’s investments equal to 25% of the net profits above an annual hurdle rate of 6% over the previous high-water mark. Our policy is to accrue an estimated incentive fee throughout the year. The total incentive reallocation from Biglari Holdings to Biglari Capital includes gains on the Company’s common stock. Gains and losses on the Company’s common stock and the related incentive reallocations are eliminated in our financial statements.
Note 3. Investment Partnerships (continued)
There were no incentive reallocations from Biglari Holdings to Biglari Capital during 2021. There were $987 of incentive reallocations from Biglari Holdings to Biglari Capital during 2020, including $253 associated with gains on the Company’s common stock. There were no incentive reallocations from Biglari Holdings to Biglari Capital during 2019.
Summarized financial information for The Lion Fund, L.P. and The Lion Fund II, L.P. is presented below.
| | | | | | | | | | | |
| Equity in Investment Partnerships |
| Lion Fund | | Lion Fund II |
| Total assets as of December 31, 2021 | $ | 114,749 | | | $ | 564,022 | |
| Total liabilities as of December 31, 2021 | $ | 7,763 | | | $ | 130,417 | |
| Revenue for the year ended December 31, 2021 | $ | 20,068 | | | $ | 41,486 | |
| Earnings for the year ended December 31, 2021 | $ | 19,994 | | | $ | 40,621 | |
| Biglari Holdings’ ownership interest | 62.7 | % | | 93.9 | % |
| | | |
| Total assets as of December 31, 2020 | $ | 112,970 | | | $ | 566,663 | |
| Total liabilities as of December 31, 2020 | $ | 189 | | | $ | 25,453 | |
| Revenue for the year ended December 31, 2020 | $ | (4,052) | | | $ | (48,544) | |
| Earnings for the year ended December 31, 2020 | $ | (4,120) | | | $ | (49,832) | |
| Biglari Holdings’ ownership interest | 66.2 | % | | 95.4 | % |
| | | |
| Total assets as of December 31, 2019 | $ | 117,135 | | | $ | 758,663 | |
| Total liabilities as of December 31, 2019 | $ | 158 | | | $ | 114,639 | |
| Revenue for the year ended December 31, 2019 | $ | 10,637 | | | $ | 85,831 | |
| Earnings for the year ended December 31, 2019 | $ | 10,567 | | | $ | 78,604 | |
| Biglari Holdings’ ownership interest | 66.1 | % | | 92.9 | % |
Revenue in the financial information of the investment partnerships, summarized above, includes investment income and unrealized gains and losses on investments.
Note 4. Other Current Assets
Other current assets include the following.
| | | | | | | | | | | |
| December 31, |
| 2021 | | 2020 |
| Deferred commissions on gift cards sold by third parties | $ | 3,221 | | | $ | 3,491 | |
| Prepaid contractual obligations | 3,867 | | | 3,001 | |
| Other current assets | $ | 7,088 | | | $ | 6,492 | |
Note 5. Property and Equipment
Property and equipment is composed of the following.
| | | | | | | | | | | |
| December 31, |
| 2021 | | 2020 |
| Land | $ | 144,605 | | | $ | 142,601 | |
| Buildings | 148,605 | | | 138,734 | |
| Land and leasehold improvements | 147,349 | | | 141,351 | |
| Equipment | 224,581 | | | 192,735 | |
| Oil and gas properties | 74,147 | | | 75,900 | |
| Construction in progress | 2,815 | | | 1,032 | |
| 742,102 | | | 692,353 | |
| Less accumulated depreciation, depletion, and amortization | (392,751) | | | (376,231) | |
| Property and equipment, net | $ | 349,351 | | | $ | 316,122 | |
Depreciation and amortization expense for property and equipment for 2021, 2020 and 2019 was $22,012, $19,586 and $18,881, respectively. Depletion expense related to oil and gas properties was $7,600, $11,989 and $8,077 during 2021, 2020 and 2019, respectively. Accretion expense of the Company’s asset retirement obligations was $438, $497 and $177 during 2021, 2020 and 2019, respectively. Depletion and accretion expense are included in depreciation and amortization within the consolidated statement of earnings.
The Company recorded impairments to restaurant long-lived assets of $4,635, $19,618 and $8,186 during 2021, 2020 and 2019, respectively. The fair value of the long-lived assets was determined based on Level 3 inputs using a discounted cash flow model and quoted prices for the properties.
The property and equipment cost related to finance obligations as of December 31, 2021 is as follows: $44,849 of buildings, $45,548 of land, $26,345 of land and leasehold improvements, and $53,965 of accumulated depreciation.
Note 6. Asset Retirement Obligations
A reconciliation of the ending aggregate carrying amount of asset retirement obligations is as follows.
| | | | | | | | | | | |
| December 31 |
| 2021 | | 2020 |
| Beginning balance | $ | 10,258 | | | $ | 10,631 | |
| Liabilities settled | (72) | | | (870) | |
| Accretion expense | 438 | | | 497 | |
| Asset retirement obligation | $ | 10,624 | | | $ | 10,258 | |
As of December 31, 2021 and 2020, $235 and $236, respectively, is classified as current and is included in accounts payable and accrued expenses in the consolidated balance sheets.
Note 7. Goodwill and Other Intangible Assets
Goodwill
Goodwill consists of the excess of the purchase price over the fair value of the net assets acquired in connection with business acquisitions. No goodwill was recorded with the acquisition of Southern Oil.
Note 7. Goodwill and Other Intangible Assets (continued)
A reconciliation of the change in the carrying value of goodwill is as follows.
| | | | | | | | | | | | | | | | | |
| Restaurants | | Insurance | | Total |
| Goodwill at December 31, 2018 | $ | 28,139 | | | $ | 11,913 | | | $ | 40,052 | |
| Change in foreign exchange rates during 2019 | (12) | | | — | | | (12) | |
| Goodwill at December 31, 2019 | $ | 28,127 | | | $ | 11,913 | | | $ | 40,040 | |
| Goodwill from acquisition | — | | | 13,800 | | | 13,800 | |
| Impairments to goodwill | (300) | | | — | | | (300) | |
| Change in foreign exchange rates during 2020 | 56 | | | — | | | 56 | |
| Goodwill at December 31, 2020 | $ | 27,883 | | | $ | 25,713 | | | $ | 53,596 | |
| Change in foreign exchange rates during 2021 | (49) | | | — | | | (49) | |
| Goodwill at December 31, 2021 | $ | 27,834 | | | $ | 25,713 | | | $ | 53,547 | |
We evaluate goodwill and any indefinite-lived intangible assets for impairment annually, or more frequently if circumstances indicate impairment may have occurred. Goodwill impairment occurs when the estimated fair value of goodwill is less than its carrying value. GAAP allows entities testing for impairment the option of performing a qualitative assessment before calculating the fair value of a reporting unit for the goodwill impairment test. We used both qualitative and quantitative assessments in 2021. The valuation methodology and underlying financial information included in our quantitative determination of fair value require significant management judgments. We use both market and income approaches to derive fair value of reporting units utilizing a quantitative assessment. The judgments in these two approaches include, but are not limited to, comparable market multiples, long-term projections of future financial performance, and the selection of appropriate discount rates used to determine the present value of future cash flows. Changes in such estimates or the application of alternative assumptions could produce significantly different results. No impairment was recorded for our reporting units in 2021. The fair value of certain of Steak n Shake’s reporting units declined in 2020, and an impairment to goodwill of $300 was recorded. No impairment was recorded in 2019. Western Sizzlin has experienced a decline in its franchised units for several years. If Western Sizzlin’s franchised units continue to decline, an impairment of its goodwill may be necessary.
Other Intangible Assets
Intangible assets with indefinite lives are composed of the following.
| | | | | | | | | | | | | | | | | |
| Trade Names | | Lease Rights | | Total |
| Balance at December 31, 2019 | $ | 15,876 | | | $ | 11,323 | | | $ | 27,199 | |
| Impairments | — | | | (3,728) | | | (3,728) | |
| Change in foreign exchange rates during 2020 | — | | | 594 | | | 594 | |
| Balance at December 31, 2020 | 15,876 | | | 8,189 | | | 24,065 | |
| Change in foreign exchange rates during 2021 | — | | | (602) | | | (602) | |
| Balance at December 31, 2021 | $ | 15,876 | | | $ | 7,587 | | | $ | 23,463 | |
Intangible assets with indefinite lives consist of trade names, franchise rights as well as lease rights. No impairment was recorded in 2021. During 2020, the Company recorded impairment charges of $3,728 on lease rights related to our international restaurant operations because of the adverse effects of the COVID-19 pandemic. The impairment and fair value were determined using Level 3 inputs and available market data. No amortization expense was recorded in 2021. Amortization expense in 2020 and 2019 was $150 and $549, respectively. The Company’s intangible assets with definite lives fully amortized in 2020.
Note 8. Accounts Payable and Accrued Expenses
Accounts payable and accrued expenses include the following.
| | | | | | | | | | | |
| December 31, |
| 2021 | | 2020 |
| Accounts payable | $ | 36,684 | | | $ | 26,537 | |
| Gift card and other marketing | 19,244 | | | 21,822 | |
| Insurance accruals | 6,428 | | | 6,559 | |
| Salaries, wages, and vacation | 5,905 | | | 8,285 | |
| Deferred revenue | 6,683 | | | 9,324 | |
| Taxes payable | 11,392 | | | 10,922 | |
| Professional fees | 11,731 | | | 5,882 | |
| Other | 2,400 | | | 1,561 | |
| Accounts payable and accrued expenses | $ | 100,467 | | | $ | 90,892 | |
Note 9. Other Liabilities
Other liabilities include the following.
| | | | | | | | | | | |
| December 31, |
| 2021 | | 2020 |
| Non qualified deferred compensation | $ | 1,607 | | | $ | 1,368 | |
| Other | 462 | | | 312 | |
| Other liabilities | $ | 2,069 | | | $ | 1,680 | |
Note 10. Income Taxes
The components of the provision for income taxes consist of the following.
| | | | | | | | | | | | | | | | | |
| 2021 | | 2020 | | 2019 |
| Current: | | | | | |
| Federal | $ | 1,053 | | | $ | (472) | | | $ | 41,005 | |
| State | 467 | | | 476 | | | 7,301 | |
| Deferred | 5,269 | | | (12,216) | | | (38,545) | |
| Income tax expense (benefit) | $ | 6,789 | | | $ | (12,212) | | | $ | 9,761 | |
| | | | | |
| Reconciliation of effective income tax: | | | | | |
| Tax at U.S. statutory rates | $ | 8,875 | | | $ | (10,542) | | | $ | 11,579 | |
| State income taxes, net of federal benefit | 192 | | | (1,750) | | | 1,573 | |
| Federal income tax credits | (864) | | | (424) | | | (3,004) | |
| Dividends received deduction | (468) | | | (233) | | | (955) | |
| Valuation allowance | (723) | | | 733 | | | 441 | |
| Foreign tax rate differences | (78) | | | 240 | | | 116 | |
| Other | (145) | | | (236) | | | 11 | |
| Income tax expense (benefit) | $ | 6,789 | | | $ | (12,212) | | | $ | 9,761 | |
Note 10. Income Taxes (continued)
The Company did not have a net tax expense or benefit on income from international operations. Earnings (losses) before income taxes derived from domestic operations during 2021, 2020 and 2019 were $43,886, $(40,989) and $57,877, respectively. Losses before income taxes derived from international operations during 2021, 2020 and 2019 were $1,619, $9,212, and $2,736, respectively.
As of December 31, 2021, we had $83 of unrecognized tax benefits, including $4 of interest and penalties, which are included in other long-term liabilities in the consolidated balance sheet. As of December 31, 2020, we had $204 of unrecognized tax benefits, including $59 of interest and penalties, which are included in other long-term liabilities in the consolidated balance sheet. Our continuing practice is to recognize interest expense and penalties related to income tax matters in income tax expense. The unrecognized tax benefits of $83 would impact the effective income tax rate if recognized. Adjustments to the Company’s unrecognized tax benefit for gross increases for the current period tax position, gross decreases for prior period tax positions and the lapse of statute of limitations during 2021, 2020 and 2019 were not significant.
We file income tax returns which are periodically audited by various foreign, federal, state, and local jurisdictions. With few exceptions, we are no longer subject to federal, state, and local tax examinations for fiscal years prior to 2018. We believe we have certain state income tax exposures related to fiscal years 2017 through 2021. Because of the expiration of the various state statutes of limitations for these fiscal years, it is possible that the total amount of unrecognized tax benefits will decrease by approximately $15 within 12 months.
Deferred tax assets and liabilities are determined based on differences between financial reporting and tax basis of assets and liabilities and are measured using the currently enacted tax rates and laws that will be in effect when the differences are expected to reverse.
Our deferred tax assets and liabilities consist of the following.
| | | | | | | | | | | |
| December 31, |
| 2021 | | 2020 |
| Deferred tax assets: | | | |
| Insurance reserves | $ | 1,464 | | | $ | 1,621 | |
| Compensation accruals | 647 | | | 1,439 | |
| Gift card accruals | 2,350 | | | 2,387 | |
| Net operating loss credit carryforward | 11,018 | | | 7,121 | |
| Valuation allowance on net operating losses | (5,429) | | | (6,152) | |
| Fixed assets and depletable assets basis difference | 588 | | | 8,234 | |
| Income tax credit carryforward | 813 | | | 2,178 | |
| Other | 2,954 | | | 2,516 | |
| Total deferred tax assets | 14,405 | | | 19,344 | |
| | | |
| Deferred tax liabilities: | | | |
| Investment partnerships | 44,532 | | | 44,805 | |
| Investments | 845 | | | 665 | |
| Goodwill and intangibles | 15,561 | | | 15,220 | |
| Total deferred tax liabilities | 60,938 | | | 60,690 | |
| Net deferred tax liability | $ | (46,533) | | | $ | (41,346) | |
Receivables on the balance sheet include income taxes receivable of $344 as of December 31, 2021 and accrued expenses on the balance sheet include income taxes payable $2,436 as of December 31, 2020. Income taxes paid during 2021, 2020 and 2019 were $4,532, $15,402 and $30,375, respectively. Income tax refunds during 2021, 2020 and 2019 were $111, $68 and $1,546, respectively.
Note 11. Notes Payable and Lease Obligations
Steak n Shake Credit Facility
On March 19, 2014, Steak n Shake and its subsidiaries entered into a credit agreement which provided for a senior secured term loan facility in an aggregate principal amount of $220,000. The term loan was scheduled to mature on March 19, 2021. As of December 31, 2020, $152,506 was outstanding. The Company repaid Steak n Shake’s outstanding balance in full on February 19, 2021.
Western Sizzlin Revolver
As of December 31, 2021 and 2020, Western Sizzlin had no debt outstanding under its revolver.
Lease Obligations
Lease obligations include the following.
| | | | | | | | | | | |
| December 31, |
| 2021 | | 2020 |
| Current portion of lease obligations | | | |
| Finance lease liabilities | $ | 1,414 | | | $ | 1,897 | |
| Finance obligations | 4,944 | | | 4,854 | |
| Operating lease liabilities | 10,540 | | | 10,614 | |
| Total current portion of lease obligations | $ | 16,898 | | | $ | 17,365 | |
| | | |
| Long-term lease obligations | | | |
| Finance lease liabilities | $ | 5,347 | | | $ | 7,034 | |
| Finance obligations | 63,119 | | | 68,148 | |
| Operating lease liabilities | 36,013 | | | 36,463 | |
| Total long-term lease obligations | $ | 104,479 | | | $ | 111,645 | |
Interest
Interest paid on debt and obligations under leases are as follows.
| | | | | | | | | | | | | | | | | |
| 2021 | | 2020 | | 2019 |
| Interest paid on debt | $ | 994 | | | $ | 9,397 | | | $ | 11,273 | |
| Interest paid on obligations under leases | $ | 6,039 | | | $ | 6,274 | | | $ | 7,816 | |
Note 12. Leased Assets and Lease Commitments
Nature of Leases
Steak n Shake and Western Sizzlin operate restaurants that are located on sites owned by us and leased from third parties. In addition, they own sites and lease sites from third parties that are leased and/or subleased to franchisees.
Lease Costs
Total lease costs consist of the following.
| | | | | | | | | | | | | | | | | |
| 2021 | | 2020 | | 2019 |
| Finance lease costs: | | | | | |
| Amortization of right-of-use assets | $ | 1,576 | | | $ | 1,404 | | | $ | 1,952 | |
| Interest on lease liabilities | 521 | | | 582 | | | 828 | |
| Operating lease costs * | 1,119 | | | 9,995 | | | 16,483 | |
| Total lease costs | $ | 3,216 | | | $ | 11,981 | | | $ | 19,263 | |
*Includes short-term leases, variable lease costs and sublease income.
Note 12. Leased Assets and Lease Commitments (continued)
Supplemental cash flow information related to leases is as follows.
| | | | | | | | | | | |
| Year Ended December 31, 2021 | | Year Ended December 31, 2020 |
| Cash paid for amounts included in the measurement of lease liabilities: | | | |
| Financing cash flows from finance leases | $ | 1,629 | | | $ | 1,512 | |
| Operating cash flows from finance leases | $ | 506 | | | $ | 632 | |
| Operating cash flows from operating leases | $ | 13,195 | | | $ | 13,627 | |
| Right-of-use assets obtained in exchange for lease obligations: | | | |
| Operating lease liabilities | $ | — | | | $ | 73 | |
Supplemental balance sheet information related to leases is as follows.
| | | | | | | | | | | |
| December 31, 2021 | | December 31, 2020 |
| Finance leases: | | | |
| Property and equipment, net | $ | 5,634 | | | $ | 6,501 | |
| | | |
| Current portion of notes payable and other borrowings | $ | 1,414 | | | $ | 1,897 | |
| Long-term notes payable and other borrowings | 5,347 | | | 7,034 | |
| Total finance lease liabilities | $ | 6,761 | | | $ | 8,931 | |
Weighted-average lease terms and discount rates are as follows.
| | | | | |
| 2021 |
| Weighted-average remaining lease terms: | |
| Finance leases | 5.06 years |
| Operating leases | 5.14 years |
| |
| Weighted-average discount rates: | |
| Finance leases | 7.0% |
| Operating leases | 6.9% |
Maturities of lease liabilities as of December 31, 2021 are as follows.
| | | | | | | | | | | | | | |
| Year | | Operating Leases | | Finance
Leases |
| 2022 | | $ | 13,282 | | | $ | 1,834 | |
| 2023 | | 11,230 | | | 1,551 | |
| 2024 | | 9,402 | | | 1,534 | |
| 2025 | | 7,817 | | | 1,298 | |
| 2026 | | 5,166 | | | 959 | |
| After 2026 | | 8,631 | | | 855 | |
| Total lease payments | | 55,528 | | | 8,031 | |
| Less interest | | 8,975 | | | 1,270 | |
| Total lease liabilities | | $ | 46,553 | | | $ | 6,761 | |
Note 12. Leased Assets and Lease Commitments (continued)
Rent expense is presented below.
| | | | | | | | | | | | | | | | | |
| 2021 | | 2020 | | 2019 |
| Minimum rent | $ | 14,926 | | | $ | 15,672 | | | $ | 17,968 | |
| Contingent rent | 137 | | | 137 | | | 1,050 | |
| Rent expense | $ | 15,063 | | | $ | 15,809 | | | $ | 19,018 | |
Lease Income
The components of lease income are as follows.
| | | | | | | | | | | | | | | | | |
| 2021 | | 2020 | | 2019 |
| Operating lease income | $ | 13,173 | | | $ | 5,027 | | | $ | 1,376 | |
| Variable lease income | 3,479 | | | 1,738 | | | 347 | |
| Total lease income | $ | 16,652 | | | $ | 6,765 | | | $ | 1,723 | |
The following table displays the Company’s future minimum rental receipts for non-cancelable leases and subleases as of December 31, 2021. Franchise partner leases and subleases are short-term leases and have been excluded from the table. | | | | | | | | | | | | | | |
| | Operating Leases |
| Year | | Subleases | | Owned Properties |
| 2022 | | $ | 609 | | | $ | 247 | |
| 2023 | | 421 | | | 247 | |
| 2024 | | 338 | | | 247 | |
| 2025 | | 338 | | | 250 | |
| 2026 | | 19 | | | 247 | |
| After 2026 | | — | | | 805 | |
| Total future minimum receipts | | $ | 1,725 | | | $ | 2,043 | |
| | | | |
Note 13. Related Party Transactions
Services Agreement
During 2017, the Company entered into a services agreement with Biglari Enterprises LLC and Biglari Capital Corp. (collectively, the “Biglari Entities”) under which the Biglari Entities provide business and administrative related services to the Company. The Biglari Entities are owned by Mr. Biglari. The services agreement has a five-year term, effective on October 1, 2017. The fixed fee is $700 per month for the first year with adjustments in years two through five. The monthly fee remained at $700 during 2021.
The Company paid Biglari Enterprises $8,400 in service fees during 2021 and 2020. The services agreement does not alter the Company’s hurdle rate connected with the incentive reallocation paid to Biglari Capital Corp.
Investments in The Lion Fund, L.P. and The Lion Fund II, L.P.
As of December 31, 2021, the Company’s investments in The Lion Fund, L.P. and The Lion Fund II, L.P. had a fair value of $474,201.
Note 13. Related Party Transactions (continued)
Contributions to and distributions from The Lion Fund, L.P. and The Lion Fund II, L.P. were as follows.
| | | | | | | | | | | | | | | | | |
| 2021 | | 2020 | | 2019 |
| Contributions of cash | $ | 12,300 | | | $ | 70,130 | | | $ | 40,000 | |
| Distributions of cash | (180,170) | | | (98,330) | | | (169,329) | |
| $ | (167,870) | | | $ | (28,200) | | | $ | (129,329) | |
As the general partner of the investment partnerships, Biglari Capital on December 31 of each year will earn an incentive reallocation fee for the Company’s investments equal to 25% of the net profits above a hurdle rate of 6% over the previous high-water mark. There were no incentive reallocations in 2021. There were $987 of incentive reallocations from Biglari Holdings to Biglari Capital during 2020, including $253 associated with gains on the Company’s common stock. Gains on the Company’s common stock and the related incentive reallocations are eliminated in our financial statements. There were no incentive reallocations from Biglari Holdings to Biglari Capital during 2019.
Incentive Agreement
The Incentive Agreement establishes a performance-based annual incentive payment for Mr. Biglari contingent upon the growth in adjusted equity in each year attributable to our operating businesses. In order for Mr. Biglari to receive any incentive, our operating businesses must achieve an annual increase in shareholders’ equity in excess of 6% (the “Hurdle Rate”) above the previous highest level (the “High Water Mark”). Mr. Biglari will receive 25% of any incremental book value created above the High Water Mark plus the Hurdle Rate. In any year in which book value declines, our operating businesses must completely recover their deficit from the previous High Water Mark, along with attaining the Hurdle Rate, before Mr. Biglari becomes eligible to receive any further incentive payment. No incentive fees were earned during 2021, 2020 and 2019.
Note 14. Commitments and Contingencies
We are involved in various legal proceedings and have certain unresolved claims pending. We believe, based on examination of these matters and experiences to date, that the ultimate liability, if any, in excess of amounts already provided in our consolidated financial statements is not likely to have a material effect on our results of operations, financial position or cash flow.
Note 15. Fair Value of Financial Assets
The fair values of substantially all of our financial instruments were measured using market or income approaches. Considerable judgment may be required in interpreting market data used to develop the estimates of fair value. Accordingly, the fair values presented are not necessarily indicative of the amounts that could be realized in an actual current market exchange. The use of alternative market assumptions and/or estimation methodologies may have a material effect on the estimated fair value.
The hierarchy for measuring fair value consists of Levels 1 through 3, which are described below.
•Level 1 – Inputs represent unadjusted quoted prices for identical assets or liabilities exchanged in active markets.
•Level 2 – Inputs include directly or indirectly observable inputs (other than Level 1 inputs) such as quoted prices for similar assets or liabilities exchanged in active or inactive markets; quoted prices for identical assets or liabilities exchanged in inactive markets; other inputs that may be considered in fair value determinations of the assets or liabilities, such as interest rates and yield curves, volatilities, prepayment speeds, loss severities, credit risks and default rates; and inputs that are derived principally from or corroborated by observable market data by correlation or other means. Pricing evaluations generally reflect discounted expected future cash flows, which incorporate yield curves for instruments with similar characteristics, such as credit ratings, estimated durations and yields for other instruments of the issuer or entities in the same industry sector.
•Level 3 – Inputs include unobservable inputs used in the measurement of assets and liabilities. Management is required to use its own assumptions regarding unobservable inputs because there is little, if any, market activity in the assets or liabilities and we may be unable to corroborate the related observable inputs. Unobservable inputs require management to make certain projections and assumptions about the information that would be used by market participants in pricing assets or liabilities.
Note 15. Fair Value of Financial Assets (continued)
The following methods and assumptions were used to determine the fair value of each class of the following assets recorded at fair value in the consolidated balance sheets:
Cash equivalents: Cash equivalents primarily consist of money market funds which are classified within Level 1 of the fair value hierarchy.
Equity securities: The Company’s investments in equity securities are classified within Levels 1 and 2 of the fair value hierarchy.
Bonds: The Company’s investments in bonds consist of both corporate and government debt. Bonds are classified as Level 1 or Level 2 of the fair value hierarchy.
Non-qualified deferred compensation plan investments: The assets of the non-qualified plan are set up in a rabbi trust. They represent mutual funds and publicly traded securities, each of which are classified within Level 1 of the fair value hierarchy.
Derivative instruments: Options related to equity securities are marked to market each reporting period and are classified within Level 2 of the fair value hierarchy depending on the instrument.
As of December 31, 2021 and 2020 the fair values of financial assets were as follows.
| | | | | | | | | | | | | | | | | | | | | | | | | | | | | | | | | | | | | | | | | | | | | | | |
| December 31, |
| 2021 | | 2020 |
| Level 1 | | Level 2 | | Level 3 | | Total | | Level 1 | | Level 2 | | Level 3 | | Total |
| Assets | | | | | | | | | | | | | | | |
| Cash equivalents | $ | 18,447 | | | $ | — | | | $ | — | | | $ | 18,447 | | | $ | 23,885 | | | $ | — | | | $ | — | | | $ | 23,885 | |
| Equity securities: | | | | | | | | | | | | | | | |
| Consumer goods | 10,775 | | | 2,368 | | | — | | | 13,143 | | | 7,274 | | | 5,652 | | | — | | | 12,926 | |
| Insurance | 6,513 | | | — | | | — | | | 6,513 | | | 261 | | | — | | | — | | | 261 | |
| Technology | 2,887 | | | — | | | — | | | 2,887 | | | — | | | — | | | — | | | — | |
| Bonds: | | | | | | | | | | | | | | | |
| Government | 54,584 | | | — | | | — | | | 54,584 | | | 39,472 | | | 14,043 | | | — | | | 53,515 | |
| Corporate | 4,512 | | | — | | | — | | | 4,512 | | | — | | | 5,406 | | | — | | | 5,406 | |
| Options on equity securities | — | | | 2,095 | | | — | | | 2,095 | | | — | | | 2,911 | | | — | | | 2,911 | |
| Non-qualified deferred compensation plan investments | 1,607 | | | — | | | — | | | 1,607 | | | 1,368 | | | — | | | — | | | 1,368 | |
| Total assets at fair value | $ | 99,325 | | | $ | 4,463 | | | $ | — | | | $ | 103,788 | | | $ | 72,260 | | | $ | 28,012 | | | $ | — | | | $ | 100,272 | |
There were no changes in our valuation techniques used to measure fair values on a recurring basis.
Note 16. Accumulated Other Comprehensive Income
Changes in the balances of each component of accumulated other comprehensive income (loss), net of tax, were as follows.
| | | | | | | | | | | | | | | | | |
| 2021 | | 2020 | | 2019 |
| Beginning Balance | $ | (1,531) | | | $ | (2,810) | | | $ | (2,516) | |
| Foreign currency translation | (376) | | | 1,279 | | | (294) | |
| Ending Balance | $ | (1,907) | | | $ | (1,531) | | | $ | (2,810) | |
There were no reclassifications from accumulated other comprehensive income to earnings during 2021, 2020 or 2019.
Note 17. Business Segment Reporting
Our reportable business segments are organized in a manner that reflects how management views those business activities. Our restaurant operations include Steak n Shake and Western Sizzlin. Our insurance operations include First Guard and Southern Pioneer. The Company also reports segment information for Maxim and Southern Oil. Other business activities not specifically identified with reportable business segments are presented in corporate. We report our earnings from investment partnerships separate from our corporate expenses. We assess and measure segment operating results based on segment earnings as disclosed below. Segment earnings from operations are neither necessarily indicative of cash available to fund cash requirements, nor synonymous with cash flow from operations. The tabular information that follows shows data of our reportable segments reconciled to amounts reflected in the consolidated financial statements.
A disaggregation of our consolidated data for each of the three most recent years is presented in the tables which follow.
| | | | | | | | | | | | | | | | | |
| Revenue |
| 2021 | | 2020 | | 2019 |
| Operating Businesses: | | | | | |
| Restaurant Operations: | | | | | |
| Steak n Shake | $ | 263,135 | | | $ | 344,305 | | | $ | 595,004 | |
| Western | 8,155 | | | 6,361 | | | 15,216 | |
| Total Restaurant Operations | 271,290 | | | 350,666 | | | 610,220 | |
| | | | | |
| Insurance Operations: | | | | | |
| Underwriting: | | | | | |
| First Guard | 33,521 | | | 30,210 | | | 28,746 | |
| Southern Pioneer | 21,890 | | | 19,010 | | | — | |
| Investment income and other | 3,198 | | | 3,459 | | | 1,337 | |
| Total Insurance Operations | 58,609 | | | 52,679 | | | 30,083 | |
| | | | | |
| Southern Oil | 33,004 | | | 26,255 | | | 24,436 | |
| Maxim | 3,203 | | | 4,083 | | | 4,099 | |
| $ | 366,106 | | | $ | 433,683 | | | $ | 668,838 | |
Note 17. Business Segment Reporting (continued)
| | | | | | | | | | | | | | | | | |
| Earnings (Loss) Before Income Taxes |
| 2021 | | 2020 | | 2019 |
| Operating Businesses: | | | | | |
| Restaurant Operations: | | | | | |
| Steak n Shake | $ | 13,524 | | | $ | (4,587) | | | $ | (18,575) | |
| Western | 931 | | | (765) | | | 1,756 | |
| Total Restaurant Operations | 14,455 | | | (5,352) | | | (16,819) | |
| | | | | |
| Insurance Operations: | | | | | |
| Underwriting: | | | | | |
| First Guard | 10,573 | | | 9,379 | | | 6,477 | |
| Southern Pioneer | 1,744 | | | 620 | | | — | |
| Investment income and other | 2,118 | | | 2,432 | | | 626 | |
| Total Insurance Operations | 14,435 | | | 12,431 | | | 7,103 | |
| | | | | |
| Southern Oil | 9,713 | | | 2,018 | | | 8,032 | |
| Maxim | 814 | | | 1,784 | | | 742 | |
| Interest expense not allocated to segments | (1,121) | | | (9,262) | | | (12,442) | |
| Operating Businesses | 38,296 | | | 1,619 | | | (13,384) | |
| | | | | |
| Corporate and other | (13,383) | | | (12,432) | | | (9,608) | |
| Investment gains | 6,401 | | | 3,644 | | | — | |
| Investment partnership gains (losses) | 10,953 | | | (43,032) | | | 78,133 | |
| | | | | |
| $ | 42,267 | | | $ | (50,201) | | | $ | 55,141 | |
| | | | | | | | | | | | | | | | | |
| Capital Expenditures |
| 2021 | | 2020 | | 2019 |
| Operating Businesses: | | | | | |
| Restaurant | $ | 60,296 | | | $ | 17,858 | | | $ | 10,023 | |
| Insurance | 1,451 | | | 5 | | | 43 | |
| Southern Oil | 996 | | | 2,806 | | | 7,594 | |
| Maxim | — | | | — | | | — | |
| Operating Businesses | 62,743 | | | 20,669 | | | 17,660 | |
| Corporate and other | 1,806 | | | 33 | | | 19 | |
| Consolidated results | $ | 64,549 | | | $ | 20,702 | | | $ | 17,679 | |
| | | | | | | | | | | | | | | | | |
| Depreciation, Depletion, and Amortization |
| 2021 | | 2020 | | 2019 |
| Operating Businesses: | | | | | |
| Restaurant | $ | 21,484 | | | $ | 19,042 | | | $ | 21,174 | |
| Insurance | 176 | | | 414 | | | 85 | |
| Southern Oil | 8,073 | | | 12,527 | | | 8,218 | |
| Maxim | — | | | — | | | — | |
| Operating Businesses | 29,733 | | | 31,983 | | | 29,477 | |
| Corporate and other | 317 | | | 239 | | | 101 | |
| Consolidated results | $ | 30,050 | | | $ | 32,222 | | | $ | 29,578 | |
Note 17. Business Segment Reporting (continued)
A disaggregation of our consolidated assets is presented in the table that follows.
| | | | | | | | | | | |
| Identifiable Assets |
| December 31, |
| 2021 | | 2020 |
| Reportable segments: | | | |
| Restaurant Operations: | | | |
| Steak n Shake | $ | 377,676 | | | $ | 341,190 | |
| Western | 17,239 | | | 16,512 | |
| Total Restaurant Operations | 394,915 | | | 357,702 | |
| | | |
| Insurance Operations: | | | |
| First Guard | 74,615 | | | 64,764 | |
| Southern Pioneer | 72,321 | | | 74,063 | |
| Total Insurance Operations | 146,936 | | | 138,827 | |
| | | |
| Southern Oil | 53,359 | | | 61,017 | |
| Maxim | 16,605 | | | 16,485 | |
| Corporate | 32,593 | | | 24,387 | |
| Investment partnerships | 250,399 | | | 419,550 | |
| Total assets | $ | 894,807 | | | $ | 1,017,968 | |
Note 18. Supplemental Disclosures of Cash Flow Information
Capital expenditures in accounts payable at December 31, 2021, 2020 and 2019 were $8,733, $2,399 and $339, respectively. In 2021, we had new finance lease obligations of $733 and lease retirements of $1,216. In 2020, we had new finance lease obligations of $3,285 and lease retirements of $4,842. During 2019, we had new finance lease obligations of $5,026 and lease retirements of $940.
Note 19. Supplemental Oil and Gas Disclosures (Unaudited)
The Company has determined it has significant oil and gas producing activities during the year ended December 31, 2021 in accordance with ASC 932 "Extractive Activities — Oil and Gas". The Company did not have significant oil and gas producing activities within the meaning of ASC 932 during the years ended December 31, 2020 and 2019.
Estimated Quantities of Proved Oil and Natural Gas Reserves
The Company classifies recoverable hydrocarbons based on their status at the time of reporting. Within the commercial classification are proved reserves and two categories of unproved reserves: probable and possible. The potentially recoverable categories are also referred to as contingent resources. For reserve estimates to be classified as proved, they must meet all SEC and Company standards.
Proved oil and gas reserves are the estimated quantities that geoscience and engineering data demonstrate with reasonable certainty to be economically producible from known reservoirs under existing economic conditions, operating methods, and government regulations. Net proved reserves exclude royalties and interests owned by others and reflect contractual arrangements and royalty obligations in effect at the time of the estimate. Proved reserves are classified as either developed or undeveloped. Proved developed reserves are the quantities expected to be recovered through existing wells with existing equipment and operating methods. Proved undeveloped reserves are the quantities expected to be recovered from new wells on undrilled acreage or from existing wells where a relatively major expenditure is required from recompletion. Due to the inherent uncertainties and the limited nature of reservoir data, estimates of reserves are subject to change as additional information becomes available.
Note 19. Supplemental Oil and Gas Disclosures (Unaudited) (continued)
We engaged Netherland, Sewell & Associates, Inc. ("NSAI") to prepare our reserve estimates for all of our estimated proved reserves at December 31, 2021. All proved oil and natural gas reserves are located in the United States primarily offshore in the shallow waters of the Gulf of Mexico.
The following table sets forth our estimate of the net proved oil and gas reserves for the year ended December 31, 2021.
| | | | | | | | | | | | | | | | | |
| Oil (MBbl) | | Gas (MMcf) | | MBOE |
| Total proved reserves at December 31, 2020 | 2,223 | | | 24,917 | | | 6,376 | |
Revisions (1) | 433 | | | 4,235 | | | 1,139 | |
| Extensions | 62 | | | 189 | | | 94 | |
| Production | (357) | | | (2,798) | | | (824) | |
| Total proved reserves at December 31, 2021 | 2,361 | | | 26,544 | | | 6,785 | |
| | | | | |
| Total proved developed reserves as of December 31, 2021 | 1,897 | | | 18,427 | | | 4,968 | |
| Total proved undeveloped reserves as of December 31, 2021 | 464 | | | 8,117 | | | 1,817 | |
(1) Revisions are primarily related to increasing commodity prices.
Bbl — One stock tank barrel, of 42 United States gallons liquid volume.
MBbl — Thousand barrels.
MMcf — Million cubic feet of natural gas.
MBOE — Thousand barrels of oil equivalent.
Standardized Measure of Discounted Future Net Cash Flows Relating to Proved Oil and Natural Gas Reserves
The standardized measure of discounted future net cash flows presented in the following table was computed using the 12-month unweighted average of the first-day-of-the-month commodity prices, the costs in effect at December 31, 2021, and a 10 percent discount factor. The Company cautions that actual future net cash flows may vary considerably from these estimates. Although the Company’s estimates of total proved reserves, development costs and production rates were based on the best available information, the development and production of the crude oil and natural gas reserves may not occur in the periods assumed. Actual prices realized, costs incurred and production quantities may vary significantly from those used. Therefore, the estimated future net cash flow computations should not be considered to represent the Company’s estimate of the expected revenues or the current value of proved reserves.
The following table sets forth the standardized measure of discounted future net cash flows attributable to proved crude oil and natural gas reserves as of December 31, 2021.
| | | | | |
| (in thousands) | December 31, 2021 |
| Future cash inflows | $ | 247,294 | |
| Future production costs | (78,207) | |
| Future development and abandonment costs | (32,673) | |
| Future income tax expense | (28,904) | |
| Future net cash flows | 107,510 | |
| 10% annual discount for estimated timing of cash flows | (29,751) | |
| Standardized measure of discounted future net cash flows | $ | 77,759 | |
Note 19. Supplemental Oil and Gas Disclosures (Unaudited) (continued)
Changes in Standardized Measure of Discounted Future Net Cash Flows
Principle changes in the standardized measure of discounted future net cash flows attributable to the Company’s proved oil and natural gas reserves are as follows.
| | | | | |
| (in thousands) | 2021 |
| Standardized measure at December 31, 2020 | $ | 31,330 | |
| Net change in prices and production costs | 67,058 | |
| Net change in future development costs | (85) | |
| Sales of oil and natural gas, net of production expenses | (22,098) | |
| Extensions | 104 | |
| Revisions of previous quantity estimates | 17,754 | |
| Net change in taxes | (14,604) | |
| Accretion of discount | 3,759 | |
| Changes in timing and other | (5,459) | |
| Standardized measure at December 31, 2021 | $ | 77,759 | |
Item 9. Changes in and Disagreements with Accountants on Accounting and Financial Disclosure
Not applicable.
Item 9A. Controls and Procedures
Based on an evaluation of our disclosure controls and procedures (as defined in Exchange Act Rules 13a-15(e) and 15d-15(e)), our Chief Executive Officer and Controller have concluded that our disclosure controls and procedures were effective as of December 31, 2021.
Changes in Internal Control over Financial Reporting
There have been no changes in our internal control over financial reporting that occurred during the quarter ended December 31, 2021 that have materially affected, or that are reasonably likely to materially affect, our internal control over financial reporting.
Management’s Report on Internal Control Over Financial Reporting
Management of Biglari Holdings Inc. is responsible for establishing and maintaining adequate internal control over financial reporting, as such term is defined in the Securities Exchange Act of 1934 Rule 13a-15(f). Under the supervision of our principal executive officer and principal financial officer, we conducted an evaluation of the effectiveness of the Company’s internal control over financial reporting as of December 31, 2021 as required by the Securities Exchange Act of 1934 Rule 13a-15(c). In making this assessment, we used the criteria set forth in the framework in Internal Control—Integrated Framework (2013) issued by the Committee of Sponsoring Organizations of the Treadway Commission. Based on our evaluation under the framework in Internal Control—Integrated Framework (2013), our management concluded that our internal control over financial reporting was effective as of December 31, 2021.
The effectiveness of our internal control over financial reporting as of December 31, 2021 has been audited by Deloitte & Touche LLP, an independent registered public accounting firm, as stated in their report which is included herein.
Biglari Holdings Inc.
February 26, 2022
Item 9B. Other Information
None.
Part III
Item 10. Directors, Executive Officers and Corporate Governance
Item 11. Executive Compensation
Item 12. Security Ownership of Certain Beneficial Owners and Management and Related Stockholder Matters
Item 13. Certain Relationships and Related Transactions, and Director Independence
Item 14. Principal Accountant Fees and Services
The information required by Part III Items 10, 11, 12, 13 and 14 will be contained in the Company’s definitive proxy statement for its 2022 Annual Meeting of Shareholders, to be filed on or before April 30, 2022, and such information is incorporated herein by reference.
Part IV
Item 15. Exhibits and Financial Statement Schedules
(a) 1. Financial Statements
The following Consolidated Financial Statements, as well as the Reports of Independent Registered Public Accounting Firm, are included in Part II, Item 8 of this report:
| | | | | |
| PAGE |
Reports of Independent Registered Public Accounting Firm (PCAOB ID No 34) | 25-27 |
| Consolidated Balance Sheets | 28 |
| Consolidated Statements of Earnings | 29 |
| Consolidated Statements of Comprehensive Income | 29 |
| Consolidated Statements of Cash Flows | 30 |
| Consolidated Statements of Changes in Shareholders’ Equity | 31 |
| Notes to Consolidated Financial Statements | 32 |
| Management’s Report on Internal Control over Financial Reporting | 54 |
2. Financial Statement Schedule
Schedules have been omitted for the reason that they are not required, are not applicable, or the required information is set forth in the financial statements or notes thereto.
(b). Exhibits
| | | | | | | | |
Exhibit
Number | | Description |
| | |
| 2.01 | | |
| 3.01 | | |
| 3.02 | | |
| 3.03 | | |
| 4.01 | | |
| 4.02 | | |
| 4.03 | | |
| 10.01* | | |
| 10.02 | | |
| 10.03 | | |
| | | | | | | | |
| 10.04* | | |
| 10.05 | | Credit Agreement, dated as of March 19, 2014, among Steak n Shake Operations, Inc., as borrower, Steak n Shake Enterprises, Inc. and Steak n Shake, LLC, as subsidiary guarantors, the lenders party thereto, Jefferies Finance LLC, as joint lead arranger, syndication agent, documentation agent, book manager, administrative agent and collateral agent, and Fifth Third Bank, as joint lead arranger, swingline lender and issuing bank (incorporated by reference to Exhibit 10.1 to the Predecessor’s Current Report on Form 8-K dated March 21, 2014). |
| 10.06 | | Security Agreement, dated as of March 19, 2014, by Steak n Shake Operations, Inc., Steak n Shake Enterprises, Inc. and Steak n Shake, LLC, as pledgors, assignors and debtors, in favor of Jefferies Finance LLC, in its capacity as collateral agent, pledgee, assignee and secured party (incorporated by reference to Exhibit 10.2 to the Predecessor’s Current Report on Form 8-K dated March 21, 2014). |
| 10.07 | | |
| 10.08 | | |
| 10.09* | | |
| 21.01 | | |
| 31.01 | | |
| 31.02 | | |
| 32.01** | | |
| 99.1 | | |
| 101* | | Interactive Data Files |
| 104 | | | Cover page Interactive Data File (embedded within the Inline XBRL document and contained in Exhibit 101) |
| * | | Indicates management contract or compensatory plans or arrangements required to be filed as an exhibit to the Annual Report on Form 10-K. |
| ** | | Furnished herewith. |
Item 16. Form 10-K Summary
Not applicable.
SIGNATURES
Pursuant to the requirements of Section 13 or 15(d) of the Securities Exchange Act of 1934, the registrant has duly caused this report to be signed on its behalf by the undersigned, thereunto duly authorized, on February 26, 2022.
| | | | | | | | |
| BIGLARI HOLDINGS INC. |
| | |
| By: | /s/ BRUCE LEWIS |
| | Bruce Lewis
Controller |
Pursuant to the requirements of the Securities Exchange Act of 1934, this report has been signed below by the following persons on behalf of the registrant and in the capacities indicated, on February 26, 2022.
| | | | | | | | |
| Signature | | Title |
| | |
| /s/ SARDAR BIGLARI | | Chairman of the Board and Chief Executive Officer (Principal Executive Officer) |
| Sardar Biglari | | |
| | |
| /s/ BRUCE LEWIS | | Controller (Principal Financial and Accounting Officer) |
| Bruce Lewis | | |
| | |
| /s/ JOHN G. CARDWELL | | Director |
| John G. Cardwell | | |
| | |
| /s/ PHILIP COOLEY | | Director - Vice Chairman |
| Philip Cooley | | |
| | |
| /s/ KENNETH R. COOPER | | Director |
| Kenneth R. Cooper | | |
| | |
| /s/ RUTH J. PERSON | | Director |
| Ruth J. Person | | |
| | |
| /s/ EDMUND B. CAMPBELL, III | | Director |
| Edmund B. Campbell, III | | |