0001711291false2022FYP3YP3Y3P1Yhttp://fasb.org/us-gaap/2022#OtherAssetsMiscellaneous3http://fasb.org/us-gaap/2022#OtherAssetsMiscellaneoushttp://fasb.org/us-gaap/2022#OtherAssetsMiscellaneousP5Y33.3300017112912022-01-012022-12-3100017112912022-06-30iso4217:USD00017112912023-03-03xbrli:shares00017112912022-12-3100017112912021-12-310001711291us-gaap:VariableInterestEntityPrimaryBeneficiaryMember2022-12-310001711291us-gaap:VariableInterestEntityPrimaryBeneficiaryMember2021-12-31iso4217:USDxbrli:shares0001711291curo:InterestAndFeesRevenueMember2022-01-012022-12-310001711291curo:InterestAndFeesRevenueMember2021-01-012021-12-310001711291curo:InterestAndFeesRevenueMember2020-01-012020-12-310001711291curo:InsurancePremiumsAndCommissionsMember2022-01-012022-12-310001711291curo:InsurancePremiumsAndCommissionsMember2021-01-012021-12-310001711291curo:InsurancePremiumsAndCommissionsMember2020-01-012020-12-310001711291curo:OtherRevenueMember2022-01-012022-12-310001711291curo:OtherRevenueMember2021-01-012021-12-310001711291curo:OtherRevenueMember2020-01-012020-12-3100017112912021-01-012021-12-3100017112912020-01-012020-12-310001711291us-gaap:CommonStockMember2019-12-310001711291us-gaap:TreasuryStockMember2019-12-310001711291us-gaap:AdditionalPaidInCapitalMember2019-12-310001711291us-gaap:RetainedEarningsMember2019-12-310001711291us-gaap:AccumulatedOtherComprehensiveIncomeMember2019-12-3100017112912019-12-310001711291us-gaap:RetainedEarningsMember2020-01-012020-12-310001711291us-gaap:AccumulatedOtherComprehensiveIncomeMember2020-01-012020-12-310001711291us-gaap:AdditionalPaidInCapitalMember2020-01-012020-12-310001711291us-gaap:CommonStockMember2020-01-012020-12-310001711291us-gaap:TreasuryStockMember2020-01-012020-12-310001711291us-gaap:CommonStockMember2020-12-310001711291us-gaap:TreasuryStockMember2020-12-310001711291us-gaap:AdditionalPaidInCapitalMember2020-12-310001711291us-gaap:RetainedEarningsMember2020-12-310001711291us-gaap:AccumulatedOtherComprehensiveIncomeMember2020-12-3100017112912020-12-310001711291us-gaap:RetainedEarningsMember2021-01-012021-12-310001711291us-gaap:AccumulatedOtherComprehensiveIncomeMember2021-01-012021-12-310001711291us-gaap:CommonStockMember2021-01-012021-12-310001711291us-gaap:AdditionalPaidInCapitalMember2021-01-012021-12-310001711291us-gaap:TreasuryStockMember2021-01-012021-12-310001711291us-gaap:CommonStockMember2021-12-310001711291us-gaap:TreasuryStockMember2021-12-310001711291us-gaap:AdditionalPaidInCapitalMember2021-12-310001711291us-gaap:RetainedEarningsMember2021-12-310001711291us-gaap:AccumulatedOtherComprehensiveIncomeMember2021-12-310001711291us-gaap:RetainedEarningsMember2022-01-012022-12-310001711291us-gaap:AccumulatedOtherComprehensiveIncomeMember2022-01-012022-12-310001711291us-gaap:AdditionalPaidInCapitalMember2022-01-012022-12-310001711291us-gaap:CommonStockMember2022-01-012022-12-310001711291us-gaap:TreasuryStockMember2022-01-012022-12-310001711291us-gaap:CommonStockMember2022-12-310001711291us-gaap:TreasuryStockMember2022-12-310001711291us-gaap:AdditionalPaidInCapitalMember2022-12-310001711291us-gaap:RetainedEarningsMember2022-12-310001711291us-gaap:AccumulatedOtherComprehensiveIncomeMember2022-12-310001711291curo:ShareRepurchaseAgreementWithFaulkner2017DynastyTrustMembersrt:AffiliatedEntityMember2021-01-012021-12-310001711291curo:AdAstraMember2022-01-012022-12-310001711291curo:AdAstraMember2021-01-012021-12-310001711291curo:AdAstraMember2020-01-012020-12-310001711291curo:FlexitiMember2022-01-012022-12-310001711291curo:FlexitiMember2021-01-012021-12-310001711291curo:FlexitiMember2020-01-012020-12-310001711291curo:HeightsFinanceMember2022-01-012022-12-310001711291curo:HeightsFinanceMember2021-01-012021-12-310001711291curo:HeightsFinanceMember2020-01-012020-12-310001711291curo:FirstHeritageCreditMember2022-01-012022-12-310001711291curo:FirstHeritageCreditMember2021-01-012021-12-310001711291curo:FirstHeritageCreditMember2020-01-012020-12-310001711291curo:SPVAndSPEFacilitiesMember2022-01-012022-12-310001711291curo:SPVAndSPEFacilitiesMember2021-01-012021-12-310001711291curo:SPVAndSPEFacilitiesMember2020-01-012020-12-310001711291curo:SeniorSecuredRevolvingLoanFacilityMember2022-01-012022-12-310001711291curo:SeniorSecuredRevolvingLoanFacilityMember2021-01-012021-12-310001711291curo:SeniorSecuredRevolvingLoanFacilityMember2020-01-012020-12-310001711291curo:SeniorSecuredNotesDue2025Memberus-gaap:SeniorNotesMember2021-12-31xbrli:pure0001711291curo:SeniorSecuredNotesDue2025Member2022-01-012022-12-310001711291curo:SeniorSecuredNotesDue2025Member2021-01-012021-12-310001711291curo:SeniorSecuredNotesDue2025Member2020-01-012020-12-310001711291curo:SeniorSecuredNotesDue2028Memberus-gaap:SeniorNotesMember2021-12-310001711291curo:SeniorSecuredNotesDue2028Member2022-01-012022-12-310001711291curo:SeniorSecuredNotesDue2028Member2021-01-012021-12-310001711291curo:SeniorSecuredNotesDue2028Member2020-01-012020-12-31curo:location0001711291curo:UnitedStatesSegmentMember2022-12-31curo:state0001711291curo:CanadaDirectLendingMember2022-12-31curo:province0001711291country:CA2022-12-31curo:territory0001711291curo:CanadaPOSLendingMember2022-12-31curo:storecuro:partner0001711291curo:FirstHeritageCreditMember2022-07-132022-07-130001711291curo:HeightsMember2021-12-272021-12-270001711291curo:FlexitiMember2021-03-102021-03-100001711291curo:FlexitiMembersrt:MaximumMember2021-03-100001711291curo:AdAstraMember2020-01-030001711291curo:AdAstraMember2020-01-032020-01-030001711291curo:USLegacyDirectLendingBusinessMemberus-gaap:DiscontinuedOperationsDisposedOfBySaleMember2022-07-080001711291curo:USLegacyDirectLendingBusinessMemberus-gaap:DiscontinuedOperationsDisposedOfBySaleMember2022-07-082022-07-080001711291curo:USLegacyDirectLendingBusinessMemberus-gaap:DiscontinuedOperationsDisposedOfBySaleMember2022-01-012022-09-300001711291curo:USLegacyDirectLendingBusinessMemberus-gaap:DiscontinuedOperationsDisposedOfBySaleMember2022-07-012022-09-300001711291curo:PreviousLagPeriodMembercuro:KatapultMember2021-06-012021-06-010001711291curo:PreviousLagPeriodMembercuro:KatapultMember2021-01-012021-03-310001711291curo:InstallmentMemberus-gaap:ConsumerPortfolioSegmentMember2022-12-310001711291curo:HeightsInsuranceProgramMember2022-12-310001711291curo:FundingFacilitiesMember2022-12-310001711291curo:AutoTitleLoanMemberus-gaap:ConsumerPortfolioSegmentMember2022-01-012022-12-310001711291us-gaap:FurnitureAndFixturesMembersrt:MinimumMember2022-01-012022-12-310001711291us-gaap:FurnitureAndFixturesMembersrt:MaximumMember2022-01-012022-12-310001711291srt:MinimumMemberus-gaap:LeaseholdImprovementsMember2022-01-012022-12-310001711291us-gaap:LeaseholdImprovementsMembersrt:MaximumMember2022-01-012022-12-310001711291srt:MinimumMemberus-gaap:ComputerSoftwareIntangibleAssetMember2022-01-012022-12-310001711291us-gaap:ComputerSoftwareIntangibleAssetMembersrt:MaximumMember2022-01-012022-12-310001711291srt:MinimumMember2022-01-012022-12-310001711291srt:MaximumMember2022-01-012022-12-310001711291stpr:CA-ONus-gaap:SalesRevenueNetMemberus-gaap:GeographicConcentrationRiskMember2022-01-012022-12-310001711291us-gaap:SalesRevenueNetMemberus-gaap:GeographicConcentrationRiskMemberstpr:TX2022-01-012022-12-310001711291stpr:CA-ONus-gaap:SalesRevenueNetMemberus-gaap:GeographicConcentrationRiskMember2021-01-012021-12-310001711291us-gaap:SalesRevenueNetMemberus-gaap:GeographicConcentrationRiskMemberstpr:TX2021-01-012021-12-310001711291us-gaap:SalesRevenueNetMemberus-gaap:GeographicConcentrationRiskMemberstpr:TX2020-01-012020-12-310001711291stpr:CAus-gaap:SalesRevenueNetMemberus-gaap:GeographicConcentrationRiskMember2020-01-012020-12-310001711291stpr:CA-ONus-gaap:SalesRevenueNetMemberus-gaap:GeographicConcentrationRiskMember2020-01-012020-12-310001711291curo:HeightsAndFirstHeritageMember2022-12-310001711291stpr:CA-ONcuro:LoansReceivableBenchmarkMemberus-gaap:GeographicConcentrationRiskMember2022-01-012022-12-310001711291stpr:TNcuro:LoansReceivableBenchmarkMemberus-gaap:GeographicConcentrationRiskMember2022-01-012022-12-310001711291curo:LoansReceivableBenchmarkMemberus-gaap:GeographicConcentrationRiskMemberstpr:TX2022-01-012022-12-310001711291curo:MerchantConcentrationRiskMemberus-gaap:SalesRevenueNetMembercuro:LFLMember2022-01-012022-12-310001711291curo:MerchantConcentrationRiskMemberus-gaap:AccountsReceivableMembercuro:LFLMember2022-01-012022-12-310001711291srt:ScenarioForecastMembersrt:CumulativeEffectPeriodOfAdoptionAdjustmentMember2023-01-010001711291srt:ScenarioForecastMembersrt:CumulativeEffectPeriodOfAdoptionAdjustmentMember2023-01-012023-01-010001711291curo:KatapultMembercuro:CurrentLagPeriodMember2021-01-012021-03-310001711291curo:RevolvingLOCMemberus-gaap:ConsumerPortfolioSegmentMember2022-01-012022-12-310001711291curo:RevolvingLOCMemberus-gaap:ConsumerPortfolioSegmentMember2021-01-012021-12-310001711291curo:RevolvingLOCMemberus-gaap:ConsumerPortfolioSegmentMember2020-01-012020-12-310001711291curo:TotalInstallmentMemberus-gaap:ConsumerPortfolioSegmentMember2022-01-012022-12-310001711291curo:TotalInstallmentMemberus-gaap:ConsumerPortfolioSegmentMember2021-01-012021-12-310001711291curo:TotalInstallmentMemberus-gaap:ConsumerPortfolioSegmentMember2020-01-012020-12-310001711291us-gaap:ConsumerPortfolioSegmentMember2022-01-012022-12-310001711291us-gaap:ConsumerPortfolioSegmentMember2021-01-012021-12-310001711291us-gaap:ConsumerPortfolioSegmentMember2020-01-012020-12-310001711291curo:InsuranceRevenueMemberus-gaap:UnallocatedFinancingReceivablesMember2022-01-012022-12-310001711291curo:InsuranceRevenueMemberus-gaap:UnallocatedFinancingReceivablesMember2021-01-012021-12-310001711291curo:InsuranceRevenueMemberus-gaap:UnallocatedFinancingReceivablesMember2020-01-012020-12-310001711291curo:OtherRevenueMemberus-gaap:UnallocatedFinancingReceivablesMember2022-01-012022-12-310001711291curo:OtherRevenueMemberus-gaap:UnallocatedFinancingReceivablesMember2021-01-012021-12-310001711291curo:OtherRevenueMemberus-gaap:UnallocatedFinancingReceivablesMember2020-01-012020-12-310001711291curo:CreditServicesOrganizationProgramsMember2022-01-012022-12-310001711291curo:CreditServicesOrganizationProgramsMember2021-01-012021-12-310001711291curo:CreditServicesOrganizationProgramsMember2020-01-012020-12-310001711291curo:RevolvingLOCMemberus-gaap:ConsumerPortfolioSegmentMemberus-gaap:FinancialAssetNotPastDueMember2022-12-310001711291curo:TotalInstallmentCompanyOwnedMemberus-gaap:ConsumerPortfolioSegmentMemberus-gaap:FinancialAssetNotPastDueMember2022-12-310001711291us-gaap:ConsumerPortfolioSegmentMemberus-gaap:FinancialAssetNotPastDueMember2022-12-310001711291curo:RevolvingLOCMemberus-gaap:FinancingReceivables1To29DaysPastDueMemberus-gaap:ConsumerPortfolioSegmentMember2022-12-310001711291us-gaap:FinancingReceivables1To29DaysPastDueMembercuro:TotalInstallmentCompanyOwnedMemberus-gaap:ConsumerPortfolioSegmentMember2022-12-310001711291us-gaap:FinancingReceivables1To29DaysPastDueMemberus-gaap:ConsumerPortfolioSegmentMember2022-12-310001711291curo:RevolvingLOCMemberus-gaap:FinancingReceivables30To59DaysPastDueMemberus-gaap:ConsumerPortfolioSegmentMember2022-12-310001711291curo:TotalInstallmentCompanyOwnedMemberus-gaap:FinancingReceivables30To59DaysPastDueMemberus-gaap:ConsumerPortfolioSegmentMember2022-12-310001711291us-gaap:FinancingReceivables30To59DaysPastDueMemberus-gaap:ConsumerPortfolioSegmentMember2022-12-310001711291us-gaap:FinancingReceivables60To89DaysPastDueMembercuro:RevolvingLOCMemberus-gaap:ConsumerPortfolioSegmentMember2022-12-310001711291us-gaap:FinancingReceivables60To89DaysPastDueMembercuro:TotalInstallmentCompanyOwnedMemberus-gaap:ConsumerPortfolioSegmentMember2022-12-310001711291us-gaap:FinancingReceivables60To89DaysPastDueMemberus-gaap:ConsumerPortfolioSegmentMember2022-12-310001711291curo:RevolvingLOCMemberus-gaap:FinancingReceivablesEqualToGreaterThan90DaysPastDueMemberus-gaap:ConsumerPortfolioSegmentMember2022-12-310001711291us-gaap:FinancingReceivablesEqualToGreaterThan90DaysPastDueMembercuro:TotalInstallmentCompanyOwnedMemberus-gaap:ConsumerPortfolioSegmentMember2022-12-310001711291us-gaap:FinancingReceivablesEqualToGreaterThan90DaysPastDueMemberus-gaap:ConsumerPortfolioSegmentMember2022-12-310001711291us-gaap:FinancialAssetPastDueMembercuro:RevolvingLOCMemberus-gaap:ConsumerPortfolioSegmentMember2022-12-310001711291us-gaap:FinancialAssetPastDueMembercuro:TotalInstallmentCompanyOwnedMemberus-gaap:ConsumerPortfolioSegmentMember2022-12-310001711291us-gaap:FinancialAssetPastDueMemberus-gaap:ConsumerPortfolioSegmentMember2022-12-310001711291curo:RevolvingLOCMemberus-gaap:ConsumerPortfolioSegmentMember2022-12-310001711291curo:TotalInstallmentCompanyOwnedMemberus-gaap:ConsumerPortfolioSegmentMember2022-12-310001711291us-gaap:ConsumerPortfolioSegmentMember2022-12-310001711291country:CAcuro:SinglePayMemberus-gaap:ConsumerPortfolioSegmentMember2022-12-310001711291curo:RevolvingLOCMemberus-gaap:ConsumerPortfolioSegmentMemberus-gaap:FinancialAssetNotPastDueMember2021-12-310001711291curo:TotalInstallmentCompanyOwnedMemberus-gaap:ConsumerPortfolioSegmentMemberus-gaap:FinancialAssetNotPastDueMember2021-12-310001711291us-gaap:ConsumerPortfolioSegmentMemberus-gaap:FinancialAssetNotPastDueMember2021-12-310001711291curo:RevolvingLOCMemberus-gaap:FinancingReceivables1To29DaysPastDueMemberus-gaap:ConsumerPortfolioSegmentMember2021-12-310001711291us-gaap:FinancingReceivables1To29DaysPastDueMembercuro:TotalInstallmentCompanyOwnedMemberus-gaap:ConsumerPortfolioSegmentMember2021-12-310001711291us-gaap:FinancingReceivables1To29DaysPastDueMemberus-gaap:ConsumerPortfolioSegmentMember2021-12-310001711291curo:RevolvingLOCMemberus-gaap:FinancingReceivables30To59DaysPastDueMemberus-gaap:ConsumerPortfolioSegmentMember2021-12-310001711291curo:TotalInstallmentCompanyOwnedMemberus-gaap:FinancingReceivables30To59DaysPastDueMemberus-gaap:ConsumerPortfolioSegmentMember2021-12-310001711291us-gaap:FinancingReceivables30To59DaysPastDueMemberus-gaap:ConsumerPortfolioSegmentMember2021-12-310001711291us-gaap:FinancingReceivables60To89DaysPastDueMembercuro:RevolvingLOCMemberus-gaap:ConsumerPortfolioSegmentMember2021-12-310001711291us-gaap:FinancingReceivables60To89DaysPastDueMembercuro:TotalInstallmentCompanyOwnedMemberus-gaap:ConsumerPortfolioSegmentMember2021-12-310001711291us-gaap:FinancingReceivables60To89DaysPastDueMemberus-gaap:ConsumerPortfolioSegmentMember2021-12-310001711291curo:RevolvingLOCMemberus-gaap:FinancingReceivablesEqualToGreaterThan90DaysPastDueMemberus-gaap:ConsumerPortfolioSegmentMember2021-12-310001711291us-gaap:FinancingReceivablesEqualToGreaterThan90DaysPastDueMembercuro:TotalInstallmentCompanyOwnedMemberus-gaap:ConsumerPortfolioSegmentMember2021-12-310001711291us-gaap:FinancingReceivablesEqualToGreaterThan90DaysPastDueMemberus-gaap:ConsumerPortfolioSegmentMember2021-12-310001711291us-gaap:FinancialAssetPastDueMembercuro:RevolvingLOCMemberus-gaap:ConsumerPortfolioSegmentMember2021-12-310001711291us-gaap:FinancialAssetPastDueMembercuro:TotalInstallmentCompanyOwnedMemberus-gaap:ConsumerPortfolioSegmentMember2021-12-310001711291us-gaap:FinancialAssetPastDueMemberus-gaap:ConsumerPortfolioSegmentMember2021-12-310001711291curo:RevolvingLOCMemberus-gaap:ConsumerPortfolioSegmentMember2021-12-310001711291curo:TotalInstallmentCompanyOwnedMemberus-gaap:ConsumerPortfolioSegmentMember2021-12-310001711291us-gaap:ConsumerPortfolioSegmentMember2021-12-310001711291curo:SinglePayMemberus-gaap:ConsumerPortfolioSegmentMember2021-12-310001711291country:CAcuro:SinglePayMemberus-gaap:ConsumerPortfolioSegmentMember2021-12-310001711291curo:TotalInstallmentMemberus-gaap:ConsumerPortfolioSegmentMember2021-12-310001711291us-gaap:UnallocatedFinancingReceivablesMemberus-gaap:ConsumerPortfolioSegmentMember2021-12-310001711291us-gaap:UnallocatedFinancingReceivablesMemberus-gaap:ConsumerPortfolioSegmentMember2022-01-012022-12-310001711291curo:TotalInstallmentMemberus-gaap:ConsumerPortfolioSegmentMember2022-12-310001711291us-gaap:UnallocatedFinancingReceivablesMemberus-gaap:ConsumerPortfolioSegmentMember2022-12-310001711291curo:RevolvingLOCMemberus-gaap:ConsumerPortfolioSegmentMember2020-12-310001711291curo:TotalInstallmentMemberus-gaap:ConsumerPortfolioSegmentMember2020-12-310001711291us-gaap:UnallocatedFinancingReceivablesMemberus-gaap:ConsumerPortfolioSegmentMember2020-12-310001711291us-gaap:ConsumerPortfolioSegmentMember2020-12-310001711291us-gaap:UnallocatedFinancingReceivablesMemberus-gaap:ConsumerPortfolioSegmentMember2021-01-012021-12-310001711291curo:InstallmentMemberus-gaap:ConsumerPortfolioSegmentMember2021-12-310001711291curo:CreditServicesOrganizationProgramsMemberus-gaap:ConsumerPortfolioSegmentMemberus-gaap:FinancialAssetNotPastDueMember2022-12-310001711291curo:CreditServicesOrganizationProgramsMemberus-gaap:ConsumerPortfolioSegmentMemberus-gaap:FinancialAssetNotPastDueMember2021-12-310001711291us-gaap:FinancialAssetPastDueMembercuro:CreditServicesOrganizationProgramsMemberus-gaap:ConsumerPortfolioSegmentMember2022-12-310001711291us-gaap:FinancialAssetPastDueMembercuro:CreditServicesOrganizationProgramsMemberus-gaap:ConsumerPortfolioSegmentMember2021-12-310001711291curo:CreditServicesOrganizationProgramsMemberus-gaap:ConsumerPortfolioSegmentMember2022-12-310001711291curo:CreditServicesOrganizationProgramsMemberus-gaap:ConsumerPortfolioSegmentMember2021-12-310001711291curo:CreditServicesOrganizationProgramsMemberus-gaap:ConsumerPortfolioSegmentMember2022-01-012022-12-310001711291curo:CreditServicesOrganizationProgramsMemberus-gaap:ConsumerPortfolioSegmentMember2021-01-012021-12-310001711291curo:CreditServicesOrganizationProgramsMemberus-gaap:ConsumerPortfolioSegmentMember2020-01-012020-12-310001711291curo:OpenEndMembercuro:CreditServicesOrganizationProgramsMemberus-gaap:ConsumerPortfolioSegmentMember2022-12-31curo:loancuro:facility0001711291curo:UnitedStatesSegmentMember2020-12-310001711291curo:CanadaDirectLendingMember2020-12-310001711291curo:CanadaPOSLendingMember2020-12-310001711291curo:UnitedStatesSegmentMember2021-01-012021-12-310001711291curo:CanadaDirectLendingMember2021-01-012021-12-310001711291curo:CanadaPOSLendingMember2021-01-012021-12-310001711291curo:UnitedStatesSegmentMember2021-12-310001711291curo:CanadaDirectLendingMember2021-12-310001711291curo:CanadaPOSLendingMember2021-12-310001711291curo:UnitedStatesSegmentMember2022-01-012022-12-310001711291curo:CanadaDirectLendingMember2022-01-012022-12-310001711291curo:CanadaPOSLendingMember2022-01-012022-12-3100017112912022-10-012022-12-31curo:Unit0001711291curo:CanadaPOSLendingMembercuro:FlexitiMember2021-12-310001711291curo:CanadaPOSLendingMembercuro:FlexitiMember2021-01-012021-12-310001711291curo:UnitedStatesSegmentMembercuro:HeightsMember2021-12-272021-12-270001711291curo:UnitedStatesSegmentMembercuro:HeightsFinanceMember2022-12-3100017112912022-07-012022-09-3000017112912022-01-012022-09-300001711291curo:UnitedStatesSegmentMember2022-07-132022-07-130001711291us-gaap:TradeNamesMember2022-12-310001711291us-gaap:TradeNamesMember2021-12-310001711291curo:MerchantRelationshipsMember2022-01-012022-12-310001711291curo:MerchantRelationshipsMember2022-12-310001711291curo:MerchantRelationshipsMember2021-12-310001711291us-gaap:CustomerRelationshipsMember2022-01-012022-12-310001711291us-gaap:CustomerRelationshipsMember2022-12-310001711291us-gaap:CustomerRelationshipsMember2021-12-310001711291us-gaap:ComputerSoftwareIntangibleAssetMember2022-01-012022-12-310001711291us-gaap:ComputerSoftwareIntangibleAssetMember2022-12-310001711291us-gaap:ComputerSoftwareIntangibleAssetMember2021-12-310001711291us-gaap:TradeNamesMember2022-01-012022-12-310001711291us-gaap:TradeNamesMember2022-12-310001711291us-gaap:TradeNamesMember2021-12-310001711291us-gaap:SoftwareDevelopmentMember2022-12-310001711291us-gaap:SoftwareDevelopmentMember2021-12-310001711291curo:CashMoneyTradeNameMember2022-12-310001711291us-gaap:OtherIntangibleAssetsMembersrt:MinimumMember2022-01-012022-12-310001711291us-gaap:OtherIntangibleAssetsMembersrt:MaximumMember2022-01-012022-12-310001711291us-gaap:CarryingReportedAmountFairValueDisclosureMemberus-gaap:FairValueMeasurementsRecurringMember2022-12-310001711291us-gaap:EstimateOfFairValueFairValueDisclosureMemberus-gaap:FairValueInputsLevel1Memberus-gaap:FairValueMeasurementsRecurringMember2022-12-310001711291us-gaap:EstimateOfFairValueFairValueDisclosureMemberus-gaap:FairValueMeasurementsRecurringMemberus-gaap:FairValueInputsLevel2Member2022-12-310001711291us-gaap:EstimateOfFairValueFairValueDisclosureMemberus-gaap:FairValueInputsLevel3Memberus-gaap:FairValueMeasurementsRecurringMember2022-12-310001711291us-gaap:EstimateOfFairValueFairValueDisclosureMemberus-gaap:FairValueMeasurementsRecurringMember2022-12-310001711291curo:FlexitiMember2021-01-012021-03-310001711291curo:FlexitiMember2021-03-3100017112912021-03-310001711291curo:FlexitiMember2022-07-012022-07-310001711291us-gaap:CarryingReportedAmountFairValueDisclosureMemberus-gaap:FairValueMeasurementsRecurringMember2021-12-310001711291us-gaap:EstimateOfFairValueFairValueDisclosureMemberus-gaap:FairValueInputsLevel1Memberus-gaap:FairValueMeasurementsRecurringMember2021-12-310001711291us-gaap:EstimateOfFairValueFairValueDisclosureMemberus-gaap:FairValueMeasurementsRecurringMemberus-gaap:FairValueInputsLevel2Member2021-12-310001711291us-gaap:EstimateOfFairValueFairValueDisclosureMemberus-gaap:FairValueInputsLevel3Memberus-gaap:FairValueMeasurementsRecurringMember2021-12-310001711291us-gaap:EstimateOfFairValueFairValueDisclosureMemberus-gaap:FairValueMeasurementsRecurringMember2021-12-310001711291us-gaap:CarryingReportedAmountFairValueDisclosureMemberus-gaap:FairValueMeasurementsNonrecurringMember2022-12-310001711291us-gaap:EstimateOfFairValueFairValueDisclosureMemberus-gaap:FairValueInputsLevel1Memberus-gaap:FairValueMeasurementsNonrecurringMember2022-12-310001711291us-gaap:EstimateOfFairValueFairValueDisclosureMemberus-gaap:FairValueInputsLevel2Memberus-gaap:FairValueMeasurementsNonrecurringMember2022-12-310001711291us-gaap:EstimateOfFairValueFairValueDisclosureMemberus-gaap:FairValueInputsLevel3Memberus-gaap:FairValueMeasurementsNonrecurringMember2022-12-310001711291us-gaap:EstimateOfFairValueFairValueDisclosureMemberus-gaap:FairValueMeasurementsNonrecurringMember2022-12-310001711291us-gaap:SeniorNotesMembercuro:SecuredNotesDue2028Member2022-12-310001711291us-gaap:CarryingReportedAmountFairValueDisclosureMemberus-gaap:SeniorNotesMembercuro:SecuredNotesDue2028Memberus-gaap:FairValueMeasurementsNonrecurringMember2022-12-310001711291us-gaap:EstimateOfFairValueFairValueDisclosureMemberus-gaap:SeniorNotesMemberus-gaap:FairValueInputsLevel1Membercuro:SecuredNotesDue2028Memberus-gaap:FairValueMeasurementsNonrecurringMember2022-12-310001711291us-gaap:EstimateOfFairValueFairValueDisclosureMemberus-gaap:SeniorNotesMembercuro:SecuredNotesDue2028Memberus-gaap:FairValueMeasurementsNonrecurringMemberus-gaap:FairValueInputsLevel2Member2022-12-310001711291us-gaap:EstimateOfFairValueFairValueDisclosureMemberus-gaap:SeniorNotesMemberus-gaap:FairValueInputsLevel3Membercuro:SecuredNotesDue2028Memberus-gaap:FairValueMeasurementsNonrecurringMember2022-12-310001711291us-gaap:EstimateOfFairValueFairValueDisclosureMemberus-gaap:SeniorNotesMembercuro:SecuredNotesDue2028Memberus-gaap:FairValueMeasurementsNonrecurringMember2022-12-310001711291curo:HeightsRevolvingCreditFacilityMemberus-gaap:CarryingReportedAmountFairValueDisclosureMemberus-gaap:FairValueMeasurementsNonrecurringMember2022-12-310001711291us-gaap:EstimateOfFairValueFairValueDisclosureMembercuro:HeightsRevolvingCreditFacilityMemberus-gaap:FairValueInputsLevel1Memberus-gaap:FairValueMeasurementsNonrecurringMember2022-12-310001711291us-gaap:EstimateOfFairValueFairValueDisclosureMembercuro:HeightsRevolvingCreditFacilityMemberus-gaap:FairValueInputsLevel2Memberus-gaap:FairValueMeasurementsNonrecurringMember2022-12-310001711291us-gaap:EstimateOfFairValueFairValueDisclosureMembercuro:HeightsRevolvingCreditFacilityMemberus-gaap:FairValueInputsLevel3Memberus-gaap:FairValueMeasurementsNonrecurringMember2022-12-310001711291us-gaap:EstimateOfFairValueFairValueDisclosureMembercuro:HeightsRevolvingCreditFacilityMemberus-gaap:FairValueMeasurementsNonrecurringMember2022-12-310001711291curo:FirstHeritageCreditRevolvingCreditFacilityMemberus-gaap:CarryingReportedAmountFairValueDisclosureMemberus-gaap:FairValueMeasurementsNonrecurringMember2022-12-310001711291us-gaap:EstimateOfFairValueFairValueDisclosureMembercuro:FirstHeritageCreditRevolvingCreditFacilityMemberus-gaap:FairValueInputsLevel1Memberus-gaap:FairValueMeasurementsNonrecurringMember2022-12-310001711291us-gaap:EstimateOfFairValueFairValueDisclosureMembercuro:FirstHeritageCreditRevolvingCreditFacilityMemberus-gaap:FairValueInputsLevel2Memberus-gaap:FairValueMeasurementsNonrecurringMember2022-12-310001711291us-gaap:EstimateOfFairValueFairValueDisclosureMembercuro:FirstHeritageCreditRevolvingCreditFacilityMemberus-gaap:FairValueInputsLevel3Memberus-gaap:FairValueMeasurementsNonrecurringMember2022-12-310001711291curo:FlexitiSPVFacilityMemberus-gaap:CarryingReportedAmountFairValueDisclosureMemberus-gaap:FairValueMeasurementsNonrecurringMember2022-12-310001711291us-gaap:EstimateOfFairValueFairValueDisclosureMembercuro:FlexitiSPVFacilityMemberus-gaap:FairValueInputsLevel1Memberus-gaap:FairValueMeasurementsNonrecurringMember2022-12-310001711291us-gaap:EstimateOfFairValueFairValueDisclosureMembercuro:FlexitiSPVFacilityMemberus-gaap:FairValueInputsLevel2Memberus-gaap:FairValueMeasurementsNonrecurringMember2022-12-310001711291us-gaap:EstimateOfFairValueFairValueDisclosureMembercuro:FlexitiSPVFacilityMemberus-gaap:FairValueInputsLevel3Memberus-gaap:FairValueMeasurementsNonrecurringMember2022-12-310001711291us-gaap:EstimateOfFairValueFairValueDisclosureMembercuro:FlexitiSPVFacilityMemberus-gaap:FairValueMeasurementsNonrecurringMember2022-12-310001711291us-gaap:CarryingReportedAmountFairValueDisclosureMembercuro:FlexitiSecuritizationMemberus-gaap:FairValueMeasurementsNonrecurringMember2022-12-310001711291us-gaap:EstimateOfFairValueFairValueDisclosureMembercuro:FlexitiSecuritizationMemberus-gaap:FairValueInputsLevel1Memberus-gaap:FairValueMeasurementsNonrecurringMember2022-12-310001711291us-gaap:EstimateOfFairValueFairValueDisclosureMembercuro:FlexitiSecuritizationMemberus-gaap:FairValueInputsLevel2Memberus-gaap:FairValueMeasurementsNonrecurringMember2022-12-310001711291us-gaap:EstimateOfFairValueFairValueDisclosureMembercuro:FlexitiSecuritizationMemberus-gaap:FairValueInputsLevel3Memberus-gaap:FairValueMeasurementsNonrecurringMember2022-12-310001711291us-gaap:EstimateOfFairValueFairValueDisclosureMembercuro:FlexitiSecuritizationMemberus-gaap:FairValueMeasurementsNonrecurringMember2022-12-310001711291us-gaap:CarryingReportedAmountFairValueDisclosureMembercuro:CanadaSPVFacilityMemberus-gaap:FairValueMeasurementsNonrecurringMember2022-12-310001711291us-gaap:EstimateOfFairValueFairValueDisclosureMemberus-gaap:FairValueInputsLevel1Membercuro:CanadaSPVFacilityMemberus-gaap:FairValueMeasurementsNonrecurringMember2022-12-310001711291us-gaap:EstimateOfFairValueFairValueDisclosureMemberus-gaap:FairValueInputsLevel2Membercuro:CanadaSPVFacilityMemberus-gaap:FairValueMeasurementsNonrecurringMember2022-12-310001711291us-gaap:EstimateOfFairValueFairValueDisclosureMemberus-gaap:FairValueInputsLevel3Membercuro:CanadaSPVFacilityMemberus-gaap:FairValueMeasurementsNonrecurringMember2022-12-310001711291us-gaap:EstimateOfFairValueFairValueDisclosureMembercuro:CanadaSPVFacilityMemberus-gaap:FairValueMeasurementsNonrecurringMember2022-12-310001711291us-gaap:CarryingReportedAmountFairValueDisclosureMemberus-gaap:FairValueMeasurementsNonrecurringMember2021-12-310001711291us-gaap:EstimateOfFairValueFairValueDisclosureMemberus-gaap:FairValueInputsLevel1Memberus-gaap:FairValueMeasurementsNonrecurringMember2021-12-310001711291us-gaap:EstimateOfFairValueFairValueDisclosureMemberus-gaap:FairValueInputsLevel2Memberus-gaap:FairValueMeasurementsNonrecurringMember2021-12-310001711291us-gaap:EstimateOfFairValueFairValueDisclosureMemberus-gaap:FairValueInputsLevel3Memberus-gaap:FairValueMeasurementsNonrecurringMember2021-12-310001711291us-gaap:EstimateOfFairValueFairValueDisclosureMemberus-gaap:FairValueMeasurementsNonrecurringMember2021-12-310001711291us-gaap:SeniorNotesMembercuro:SecuredNotesDue2028Member2021-12-310001711291us-gaap:CarryingReportedAmountFairValueDisclosureMemberus-gaap:SeniorNotesMembercuro:SecuredNotesDue2028Memberus-gaap:FairValueMeasurementsNonrecurringMember2021-12-310001711291us-gaap:EstimateOfFairValueFairValueDisclosureMemberus-gaap:SeniorNotesMemberus-gaap:FairValueInputsLevel1Membercuro:SecuredNotesDue2028Memberus-gaap:FairValueMeasurementsNonrecurringMember2021-12-310001711291us-gaap:EstimateOfFairValueFairValueDisclosureMemberus-gaap:SeniorNotesMembercuro:SecuredNotesDue2028Memberus-gaap:FairValueMeasurementsNonrecurringMemberus-gaap:FairValueInputsLevel2Member2021-12-310001711291us-gaap:EstimateOfFairValueFairValueDisclosureMemberus-gaap:SeniorNotesMemberus-gaap:FairValueInputsLevel3Membercuro:SecuredNotesDue2028Memberus-gaap:FairValueMeasurementsNonrecurringMember2021-12-310001711291us-gaap:EstimateOfFairValueFairValueDisclosureMemberus-gaap:SeniorNotesMembercuro:SecuredNotesDue2028Memberus-gaap:FairValueMeasurementsNonrecurringMember2021-12-310001711291curo:USSPVFacilityMemberus-gaap:CarryingReportedAmountFairValueDisclosureMemberus-gaap:FairValueMeasurementsNonrecurringMember2021-12-310001711291us-gaap:EstimateOfFairValueFairValueDisclosureMembercuro:USSPVFacilityMemberus-gaap:FairValueInputsLevel1Memberus-gaap:FairValueMeasurementsNonrecurringMember2021-12-310001711291us-gaap:EstimateOfFairValueFairValueDisclosureMembercuro:USSPVFacilityMemberus-gaap:FairValueInputsLevel2Memberus-gaap:FairValueMeasurementsNonrecurringMember2021-12-310001711291us-gaap:EstimateOfFairValueFairValueDisclosureMembercuro:USSPVFacilityMemberus-gaap:FairValueInputsLevel3Memberus-gaap:FairValueMeasurementsNonrecurringMember2021-12-310001711291us-gaap:EstimateOfFairValueFairValueDisclosureMembercuro:USSPVFacilityMemberus-gaap:FairValueMeasurementsNonrecurringMember2021-12-310001711291us-gaap:CarryingReportedAmountFairValueDisclosureMembercuro:CanadaSPVFacilityMemberus-gaap:FairValueMeasurementsNonrecurringMember2021-12-310001711291us-gaap:EstimateOfFairValueFairValueDisclosureMemberus-gaap:FairValueInputsLevel1Membercuro:CanadaSPVFacilityMemberus-gaap:FairValueMeasurementsNonrecurringMember2021-12-310001711291us-gaap:EstimateOfFairValueFairValueDisclosureMemberus-gaap:FairValueInputsLevel2Membercuro:CanadaSPVFacilityMemberus-gaap:FairValueMeasurementsNonrecurringMember2021-12-310001711291us-gaap:EstimateOfFairValueFairValueDisclosureMemberus-gaap:FairValueInputsLevel3Membercuro:CanadaSPVFacilityMemberus-gaap:FairValueMeasurementsNonrecurringMember2021-12-310001711291us-gaap:EstimateOfFairValueFairValueDisclosureMembercuro:CanadaSPVFacilityMemberus-gaap:FairValueMeasurementsNonrecurringMember2021-12-310001711291curo:FlexitiSPVFacilityMemberus-gaap:CarryingReportedAmountFairValueDisclosureMemberus-gaap:FairValueMeasurementsNonrecurringMember2021-12-310001711291us-gaap:EstimateOfFairValueFairValueDisclosureMembercuro:FlexitiSPVFacilityMemberus-gaap:FairValueInputsLevel1Memberus-gaap:FairValueMeasurementsNonrecurringMember2021-12-310001711291us-gaap:EstimateOfFairValueFairValueDisclosureMembercuro:FlexitiSPVFacilityMemberus-gaap:FairValueInputsLevel2Memberus-gaap:FairValueMeasurementsNonrecurringMember2021-12-310001711291us-gaap:EstimateOfFairValueFairValueDisclosureMembercuro:FlexitiSPVFacilityMemberus-gaap:FairValueInputsLevel3Memberus-gaap:FairValueMeasurementsNonrecurringMember2021-12-310001711291us-gaap:EstimateOfFairValueFairValueDisclosureMembercuro:FlexitiSPVFacilityMemberus-gaap:FairValueMeasurementsNonrecurringMember2021-12-310001711291us-gaap:CarryingReportedAmountFairValueDisclosureMembercuro:FlexitiSecuritizationMemberus-gaap:FairValueMeasurementsNonrecurringMember2021-12-310001711291us-gaap:EstimateOfFairValueFairValueDisclosureMembercuro:FlexitiSecuritizationMemberus-gaap:FairValueInputsLevel1Memberus-gaap:FairValueMeasurementsNonrecurringMember2021-12-310001711291us-gaap:EstimateOfFairValueFairValueDisclosureMembercuro:FlexitiSecuritizationMemberus-gaap:FairValueInputsLevel2Memberus-gaap:FairValueMeasurementsNonrecurringMember2021-12-310001711291us-gaap:EstimateOfFairValueFairValueDisclosureMembercuro:FlexitiSecuritizationMemberus-gaap:FairValueInputsLevel3Memberus-gaap:FairValueMeasurementsNonrecurringMember2021-12-310001711291us-gaap:EstimateOfFairValueFairValueDisclosureMembercuro:FlexitiSecuritizationMemberus-gaap:FairValueMeasurementsNonrecurringMember2021-12-310001711291curo:HeightsFinanceSPVMemberus-gaap:CarryingReportedAmountFairValueDisclosureMemberus-gaap:FairValueMeasurementsNonrecurringMember2021-12-310001711291us-gaap:EstimateOfFairValueFairValueDisclosureMembercuro:HeightsFinanceSPVMemberus-gaap:FairValueInputsLevel1Memberus-gaap:FairValueMeasurementsNonrecurringMember2021-12-310001711291us-gaap:EstimateOfFairValueFairValueDisclosureMembercuro:HeightsFinanceSPVMemberus-gaap:FairValueInputsLevel2Memberus-gaap:FairValueMeasurementsNonrecurringMember2021-12-310001711291us-gaap:EstimateOfFairValueFairValueDisclosureMembercuro:HeightsFinanceSPVMemberus-gaap:FairValueInputsLevel3Memberus-gaap:FairValueMeasurementsNonrecurringMember2021-12-310001711291us-gaap:EstimateOfFairValueFairValueDisclosureMembercuro:HeightsFinanceSPVMemberus-gaap:FairValueMeasurementsNonrecurringMember2021-12-310001711291us-gaap:EquityMethodInvestmentsMemberus-gaap:FairValueMeasurementsNonrecurringMember2019-12-310001711291us-gaap:EquityMethodInvestmentsMemberus-gaap:FairValueMeasurementsRecurringMember2019-12-310001711291us-gaap:EquityMethodInvestmentsMember2019-12-310001711291us-gaap:EquityMethodInvestmentsMemberus-gaap:FairValueMeasurementsNonrecurringMember2020-01-012020-12-310001711291us-gaap:EquityMethodInvestmentsMemberus-gaap:FairValueMeasurementsRecurringMember2020-01-012020-12-310001711291us-gaap:EquityMethodInvestmentsMember2020-01-012020-12-310001711291curo:CommonStockWarrantsAndPreferredStockMemberus-gaap:EquityMethodInvestmentsMemberus-gaap:FairValueMeasurementsNonrecurringMember2020-01-012020-12-310001711291curo:CommonStockWarrantsAndPreferredStockMemberus-gaap:EquityMethodInvestmentsMemberus-gaap:FairValueMeasurementsRecurringMember2020-01-012020-12-310001711291curo:CommonStockWarrantsAndPreferredStockMemberus-gaap:EquityMethodInvestmentsMember2020-01-012020-12-310001711291us-gaap:CommonStockMemberus-gaap:EquityMethodInvestmentsMemberus-gaap:FairValueMeasurementsNonrecurringMember2020-01-012020-12-310001711291us-gaap:CommonStockMemberus-gaap:EquityMethodInvestmentsMemberus-gaap:FairValueMeasurementsRecurringMember2020-01-012020-12-310001711291us-gaap:CommonStockMemberus-gaap:EquityMethodInvestmentsMember2020-01-012020-12-310001711291us-gaap:EquityMethodInvestmentsMemberus-gaap:FairValueMeasurementsNonrecurringMember2020-12-310001711291us-gaap:EquityMethodInvestmentsMemberus-gaap:FairValueMeasurementsRecurringMember2020-12-310001711291us-gaap:EquityMethodInvestmentsMember2020-12-310001711291us-gaap:EquityMethodInvestmentsMemberus-gaap:FairValueMeasurementsNonrecurringMember2021-01-012021-12-310001711291us-gaap:EquityMethodInvestmentsMemberus-gaap:FairValueMeasurementsRecurringMember2021-01-012021-12-310001711291us-gaap:EquityMethodInvestmentsMember2021-01-012021-12-310001711291us-gaap:CommonStockMemberus-gaap:EquityMethodInvestmentsMemberus-gaap:FairValueMeasurementsNonrecurringMember2021-01-012021-12-310001711291us-gaap:CommonStockMemberus-gaap:EquityMethodInvestmentsMemberus-gaap:FairValueMeasurementsRecurringMember2021-01-012021-12-310001711291us-gaap:CommonStockMemberus-gaap:EquityMethodInvestmentsMember2021-01-012021-12-310001711291us-gaap:EquityMethodInvestmentsMemberus-gaap:FairValueMeasurementsNonrecurringMember2021-12-310001711291us-gaap:EquityMethodInvestmentsMemberus-gaap:FairValueMeasurementsRecurringMember2021-12-310001711291us-gaap:EquityMethodInvestmentsMember2021-12-310001711291us-gaap:EquityMethodInvestmentsMemberus-gaap:FairValueMeasurementsNonrecurringMember2022-01-012022-12-310001711291us-gaap:EquityMethodInvestmentsMemberus-gaap:FairValueMeasurementsRecurringMember2022-01-012022-12-310001711291us-gaap:EquityMethodInvestmentsMember2022-01-012022-12-310001711291us-gaap:EquityMethodInvestmentsMemberus-gaap:FairValueMeasurementsNonrecurringMember2022-12-310001711291us-gaap:EquityMethodInvestmentsMemberus-gaap:FairValueMeasurementsRecurringMember2022-12-310001711291us-gaap:EquityMethodInvestmentsMember2022-12-310001711291curo:KatapultMember2021-06-092021-06-090001711291curo:KatapultMember2021-04-012021-06-300001711291us-gaap:EquityMethodInvestmentsMemberus-gaap:FairValueMeasurementsNonrecurringMember2022-10-012022-12-310001711291curo:KatapultMember2021-10-012021-12-3100017112912021-06-09curo:boardSeat0001711291curo:KatapultMember2022-12-310001711291curo:SeniorSecuredNotesDue2028Memberus-gaap:SeniorNotesMember2022-12-310001711291curo:CorporateDebtMember2022-12-310001711291curo:CorporateDebtMember2021-12-310001711291us-gaap:SecuredOvernightFinancingRateSofrOvernightIndexSwapRateMembercuro:HeightsMember2022-01-012022-12-310001711291us-gaap:LineOfCreditMemberus-gaap:RevolvingCreditFacilityMembercuro:HeightsMember2022-12-310001711291us-gaap:LineOfCreditMemberus-gaap:RevolvingCreditFacilityMembercuro:HeightsMember2021-12-310001711291us-gaap:SecuredOvernightFinancingRateSofrOvernightIndexSwapRateMembercuro:FirstHeritageCreditMember2022-01-012022-12-310001711291curo:FirstHeritageCreditMemberus-gaap:LineOfCreditMemberus-gaap:RevolvingCreditFacilityMember2022-12-310001711291curo:FirstHeritageCreditMemberus-gaap:LineOfCreditMemberus-gaap:RevolvingCreditFacilityMember2021-12-310001711291curo:FlexitiSPVFacilityMember2022-12-310001711291curo:FlexitiSPVFacilityMemberus-gaap:LineOfCreditMemberus-gaap:RevolvingCreditFacilityMember2022-12-31iso4217:CAD0001711291curo:FlexitiSPVFacilityMemberus-gaap:LineOfCreditMemberus-gaap:RevolvingCreditFacilityMember2021-12-310001711291curo:FlexitiSecuritizationMembercuro:CanadianDollarOfferedRateCDORMember2022-01-012022-12-310001711291us-gaap:LineOfCreditMembercuro:FlexitiSecuritizationMemberus-gaap:RevolvingCreditFacilityMember2022-12-310001711291us-gaap:LineOfCreditMembercuro:FlexitiSecuritizationMemberus-gaap:RevolvingCreditFacilityMember2021-12-310001711291curo:CanadianDollarOfferedRateCDORMembercuro:CanadaSPVFacilityMember2022-01-012022-12-310001711291us-gaap:LineOfCreditMemberus-gaap:RevolvingCreditFacilityMembercuro:CanadaSPVFacilityMember2022-12-310001711291us-gaap:LineOfCreditMemberus-gaap:RevolvingCreditFacilityMembercuro:CanadaSPVFacilityMember2021-12-310001711291curo:HeightsFinanceSPVMemberus-gaap:LondonInterbankOfferedRateLIBORMembercuro:BasisSpreadScenarioOneMember2022-01-012022-12-310001711291curo:HeightsFinanceSPVMemberus-gaap:LineOfCreditMemberus-gaap:RevolvingCreditFacilityMember2022-12-310001711291curo:HeightsFinanceSPVMemberus-gaap:LineOfCreditMemberus-gaap:RevolvingCreditFacilityMember2021-12-310001711291curo:USSPVFacilityMemberus-gaap:LondonInterbankOfferedRateLIBORMembercuro:BasisSpreadScenarioOneMember2022-01-012022-12-310001711291us-gaap:LineOfCreditMembercuro:USSPVFacilityMemberus-gaap:RevolvingCreditFacilityMember2022-12-310001711291us-gaap:LineOfCreditMembercuro:USSPVFacilityMemberus-gaap:RevolvingCreditFacilityMember2021-12-310001711291curo:CuroCanadaRevolvingCreditFacilityMemberus-gaap:PrimeRateMember2022-01-012022-12-310001711291us-gaap:LineOfCreditMemberus-gaap:RevolvingCreditFacilityMembercuro:CuroCanadaRevolvingCreditFacilityMember2022-12-310001711291us-gaap:LineOfCreditMemberus-gaap:RevolvingCreditFacilityMembercuro:CuroCanadaRevolvingCreditFacilityMember2021-12-310001711291us-gaap:SecuredOvernightFinancingRateSofrOvernightIndexSwapRateMembercuro:SeniorSecuredRevolvingLoanFacilityMember2022-01-012022-12-310001711291us-gaap:LineOfCreditMemberus-gaap:RevolvingCreditFacilityMembercuro:SeniorSecuredRevolvingLoanFacilityMember2022-12-310001711291us-gaap:LineOfCreditMemberus-gaap:RevolvingCreditFacilityMembercuro:SeniorSecuredRevolvingLoanFacilityMember2021-12-310001711291curo:FundingDebtMember2022-12-310001711291curo:FundingDebtMember2021-12-310001711291curo:FlexitiSecuritizationMember2022-07-070001711291us-gaap:RevolvingCreditFacilityMembercuro:CuroCanadaRevolvingCreditFacilityMember2022-12-200001711291curo:SeniorSecuredNotesDue2028Memberus-gaap:SeniorNotesMember2021-07-310001711291curo:SeniorSecuredNotesDue2025Memberus-gaap:SeniorNotesMember2018-08-310001711291curo:SeniorSecuredNotesDue2025Memberus-gaap:SeniorNotesMember2021-09-300001711291curo:SeniorSecuredNotesDue2028Memberus-gaap:SeniorNotesMember2021-09-300001711291curo:SeniorSecuredNotesDue2025Memberus-gaap:SeniorNotesMember2021-07-012021-09-300001711291curo:HeightsRevolvingCreditFacilityMemberus-gaap:LineOfCreditMemberus-gaap:RevolvingCreditFacilityMember2022-07-150001711291us-gaap:SecuredOvernightFinancingRateSofrOvernightIndexSwapRateMembercuro:HeightsRevolvingCreditFacilityMemberus-gaap:LineOfCreditMemberus-gaap:RevolvingCreditFacilityMember2022-07-150001711291curo:HeightsRevolvingCreditFacilityMemberus-gaap:LineOfCreditMember2022-01-012022-12-310001711291us-gaap:LineOfCreditMembercuro:FirstHeritageCreditRevolvingCreditFacilityMemberus-gaap:RevolvingCreditFacilityMember2022-07-130001711291us-gaap:SecuredOvernightFinancingRateSofrOvernightIndexSwapRateMemberus-gaap:LineOfCreditMembercuro:FirstHeritageCreditRevolvingCreditFacilityMemberus-gaap:RevolvingCreditFacilityMember2022-07-130001711291us-gaap:LineOfCreditMembercuro:FirstHeritageCreditRevolvingCreditFacilityMember2022-01-012022-12-310001711291curo:FlexitiSPVFacilityMemberus-gaap:RevolvingCreditFacilityMember2022-09-280001711291curo:FlexitiSPVFacilityMemberus-gaap:RevolvingCreditFacilityMember2022-09-290001711291curo:FlexitiSPVFacilityMemberus-gaap:LineOfCreditMember2022-01-012022-12-310001711291us-gaap:LineOfCreditMemberus-gaap:RevolvingCreditFacilityMembercuro:CanadaSPVFacilityMember2018-08-310001711291us-gaap:RevolvingCreditFacilityMembercuro:CanadaSPVFacilityMember2022-12-3100017112912022-03-310001711291us-gaap:LineOfCreditMembercuro:CanadaSPVFacilityMember2022-01-012022-12-310001711291curo:HeightsFinanceSPVMemberus-gaap:RevolvingCreditFacilityMember2022-12-310001711291curo:HeightsFinanceSPVMemberus-gaap:LondonInterbankOfferedRateLIBORMembercuro:BasisSpreadScenarioOneMember2019-12-012019-12-310001711291curo:HeightsFinanceSPVMemberus-gaap:LineOfCreditMemberus-gaap:RevolvingCreditFacilityMember2022-07-1500017112912022-07-152022-07-150001711291curo:USSPVFacilityMemberus-gaap:RevolvingCreditFacilityMember2020-04-300001711291curo:USSPVFacilityMemberus-gaap:LondonInterbankOfferedRateLIBORMembercuro:BasisSpreadScenarioOneMember2020-04-012020-04-300001711291us-gaap:LineOfCreditMembercuro:USSPVFacilityMember2022-01-012022-12-310001711291curo:USSPVFacilityMemberus-gaap:RevolvingCreditFacilityMember2022-07-082022-07-080001711291us-gaap:LineOfCreditMemberus-gaap:LetterOfCreditMembercuro:SeniorSecuredRevolvingLoanFacilityMember2022-12-310001711291us-gaap:LineOfCreditMemberus-gaap:LetterOfCreditMembercuro:SeniorSecuredRevolvingLoanFacilityMember2022-01-012022-12-310001711291us-gaap:LondonInterbankOfferedRateLIBORMembercuro:SeniorSecuredRevolvingLoanFacilityMember2022-01-012022-12-310001711291us-gaap:LineOfCreditMemberus-gaap:RevolvingCreditFacilityMembercuro:CuroCanadaRevolvingCreditFacilityMember2022-12-200001711291us-gaap:LineOfCreditMemberus-gaap:RevolvingCreditFacilityMembercuro:CuroCanadaRevolvingCreditFacilityMember2022-12-210001711291curo:FlexitiSPVFacilityMemberus-gaap:RevolvingCreditFacilityMember2022-10-110001711291curo:FlexitiSPVFacilityMemberus-gaap:DesignatedAsHedgingInstrumentMemberus-gaap:InterestRateSwapMember2022-12-310001711291curo:FlexitiSPVFacilityMemberus-gaap:InterestRateSwapMember2022-01-012022-12-310001711291curo:FlexitiSecuritizationMemberus-gaap:RevolvingCreditFacilityMember2022-07-070001711291curo:FlexitiSecuritizationMemberus-gaap:DesignatedAsHedgingInstrumentMemberus-gaap:InterestRateSwapMember2022-12-310001711291curo:FlexitiSecuritizationMemberus-gaap:InterestRateSwapMember2022-01-012022-12-310001711291curo:SeniorSecuredNotesDue2025Memberus-gaap:SeniorNotesMemberus-gaap:DebtInstrumentRedemptionPeriodOneMember2022-01-012022-12-310001711291curo:SeniorSecuredNotesDue2025Memberus-gaap:DebtInstrumentRedemptionPeriodTwoMemberus-gaap:SeniorNotesMember2022-01-012022-12-310001711291curo:SeniorSecuredNotesDue2025Memberus-gaap:SeniorNotesMemberus-gaap:DebtInstrumentRedemptionPeriodThreeMember2022-01-012022-12-310001711291curo:SeniorSecuredNotesDue2025Memberus-gaap:SeniorNotesMemberus-gaap:DebtInstrumentRedemptionPeriodFourMember2022-01-012022-12-3100017112912020-12-012020-12-310001711291curo:ShareholderDerivativeLawsuitsMember2020-07-31curo:lawsuit0001711291curo:ShareholderDerivativeLawsuitsWithFFLDefendantsMember2020-07-3100017112912022-10-272022-10-270001711291srt:ProFormaMemberus-gaap:CanadaRevenueAgencyMember2022-01-012022-12-310001711291us-gaap:ForeignCountryMember2022-12-310001711291us-gaap:ForeignCountryMember2020-12-310001711291us-gaap:CanadaRevenueAgencyMember2022-12-310001711291us-gaap:StateAndLocalJurisdictionMember2022-12-310001711291curo:A2010IncentivePlanMember2010-12-310001711291curo:A2017IncentivePlanMember2017-12-310001711291curo:StockOptionsMember2022-01-012022-12-3100017112912019-01-012019-12-310001711291us-gaap:PerformanceSharesMembersrt:MinimumMember2022-01-012022-12-310001711291us-gaap:PerformanceSharesMembersrt:MaximumMember2022-01-012022-12-310001711291us-gaap:PerformanceSharesMember2022-01-012022-12-310001711291curo:RestrictedStockUnitsRSUsPerformanceBasedMember2022-01-012022-12-310001711291us-gaap:RestrictedStockUnitsRSUMember2019-12-310001711291us-gaap:PerformanceSharesMember2019-12-310001711291curo:RestrictedStockUnitsRSUsPerformanceBasedMember2019-12-310001711291us-gaap:RestrictedStockUnitsRSUMember2020-01-012020-12-310001711291us-gaap:PerformanceSharesMember2020-01-012020-12-310001711291curo:RestrictedStockUnitsRSUsPerformanceBasedMember2020-01-012020-12-310001711291us-gaap:RestrictedStockUnitsRSUMember2020-12-310001711291us-gaap:PerformanceSharesMember2020-12-310001711291curo:RestrictedStockUnitsRSUsPerformanceBasedMember2020-12-310001711291us-gaap:RestrictedStockUnitsRSUMember2021-01-012021-12-310001711291us-gaap:PerformanceSharesMember2021-01-012021-12-310001711291curo:RestrictedStockUnitsRSUsPerformanceBasedMember2021-01-012021-12-310001711291us-gaap:RestrictedStockUnitsRSUMember2021-12-310001711291us-gaap:PerformanceSharesMember2021-12-310001711291curo:RestrictedStockUnitsRSUsPerformanceBasedMember2021-12-310001711291us-gaap:RestrictedStockUnitsRSUMember2022-01-012022-12-310001711291us-gaap:RestrictedStockUnitsRSUMember2022-12-310001711291us-gaap:PerformanceSharesMember2022-12-310001711291curo:RestrictedStockUnitsRSUsPerformanceBasedMember2022-12-310001711291curo:UnrelatedThirdPartyMember2022-01-012022-12-310001711291curo:UnrelatedThirdPartyMember2021-01-012021-12-310001711291curo:UnrelatedThirdPartyMember2020-01-012020-12-310001711291curo:RelatedPartyMember2022-01-012022-12-310001711291curo:RelatedPartyMember2021-01-012021-12-310001711291curo:RelatedPartyMember2020-01-012020-12-310001711291curo:UnrelatedThirdPartyMember2022-12-310001711291curo:RelatedPartyMember2022-12-3100017112912020-02-2900017112912021-05-3100017112912022-02-0400017112912022-03-012022-03-0100017112912022-04-2800017112912022-05-232022-05-2300017112912022-08-0300017112912022-08-262022-08-2600017112912021-01-2900017112912021-03-022021-03-0200017112912021-05-0300017112912021-05-272021-05-2700017112912021-07-2800017112912021-08-192021-08-1900017112912021-10-2700017112912021-11-222021-11-220001711291curo:UnitedStatesSegmentMember2020-01-012020-12-310001711291curo:CanadaDirectLendingMember2020-01-012020-12-310001711291curo:CanadaPOSLendingMember2020-01-012020-12-310001711291curo:FirstHeritageCreditMember2022-05-182022-05-180001711291curo:FirstHeritageCreditMember2022-07-130001711291curo:FirstHeritageCreditMemberus-gaap:TradeNamesMember2022-07-130001711291curo:FirstHeritageCreditMemberus-gaap:TradeNamesMember2022-07-132022-07-130001711291curo:FirstHeritageCreditMemberus-gaap:CustomerRelationshipsMember2022-07-130001711291curo:FirstHeritageCreditMemberus-gaap:CustomerRelationshipsMember2022-07-132022-07-130001711291curo:FirstHeritageCreditMember2022-12-310001711291curo:HeightsMember2021-12-27curo:branch0001711291curo:HeightsMember2022-01-012022-12-3100017112912022-01-012022-03-310001711291curo:HeightsMember2022-10-012022-12-310001711291curo:HeightsMember2022-12-310001711291curo:HeightsMember2021-12-282022-12-310001711291curo:FlexitiMember2021-03-100001711291curo:FlexitiMember2021-03-102021-12-310001711291curo:FlexitiMember2021-12-310001711291curo:FlexitiMember2021-03-112021-12-310001711291curo:FlexitiMembercuro:DevelopedTechnologyMember2022-12-310001711291curo:FlexitiMembercuro:DevelopedTechnologyMember2022-01-012022-12-310001711291curo:FlexitiMembercuro:MerchantRelationshipsMember2022-12-310001711291curo:FlexitiMembercuro:MerchantRelationshipsMember2022-01-012022-12-310001711291curo:FlexitiMemberus-gaap:CustomerRelationshipsMember2022-12-310001711291curo:FlexitiMemberus-gaap:CustomerRelationshipsMember2022-01-012022-12-310001711291curo:FlexitiMember2022-12-310001711291curo:FlexitiMembersrt:MinimumMember2021-03-100001711291curo:AdAstraMember2019-01-012019-12-310001711291curo:USLegacyDirectLendingBusinessMemberus-gaap:DiscontinuedOperationsDisposedOfBySaleMember2022-01-012022-12-310001711291curo:USLegacyDirectLendingBusinessMember2022-01-012022-12-310001711291curo:USLegacyDirectLendingBusinessMember2021-01-012021-12-310001711291srt:AffiliatedEntityMembersrt:MinimumMembercuro:AdAstraMember2022-01-012022-12-310001711291srt:AffiliatedEntityMembercuro:AdAstraMembersrt:MaximumMember2022-01-012022-12-310001711291srt:AffiliatedEntityMembercuro:AdAstraMembercuro:CommissionsforCollectionActivitiesMember2022-01-012022-12-310001711291us-gaap:LeaseholdImprovementsMember2022-12-310001711291us-gaap:LeaseholdImprovementsMember2021-12-310001711291us-gaap:FurnitureAndFixturesMember2022-12-310001711291us-gaap:FurnitureAndFixturesMember2021-12-310001711291curo:DeferredCompensationAgreementPeriodOneMember2022-01-012022-12-310001711291curo:DeferredCompensationAgreementPeriodTwoMember2022-01-012022-12-310001711291curo:RegisteredRetirementSavingsPlanMember2022-01-012022-12-310001711291curo:RegisteredRetirementSavingsPlanMember2022-01-012022-12-310001711291curo:DefinedContributionPlanPeriodOneMembercuro:RegisteredRetirementSavingsPlanMember2022-01-012022-12-310001711291curo:DefinedContributionPlanPeriodTwoMembercuro:RegisteredRetirementSavingsPlanMember2022-01-012022-12-310001711291curo:A2021RegisteredRetirementSavingsPlanMembercuro:ContactCenterEmployeesMember2022-01-012022-12-310001711291curo:A2021RegisteredRetirementSavingsPlanMembercuro:ContactCenterEmployeesMember2022-01-012022-12-310001711291curo:A2021RegisteredRetirementSavingsPlanMembercuro:CorporateEmployeesMember2022-01-012022-12-310001711291curo:A2021RegisteredRetirementSavingsPlanMembercuro:CorporateEmployeesMember2022-01-012022-12-310001711291curo:A2021RegisteredRetirementSavingsPlanMember2022-01-012022-12-31curo:contract0001711291curo:RegisteredRetirementSavingsPlanMember2021-01-012021-12-310001711291curo:RegisteredRetirementSavingsPlanMember2020-01-012020-12-310001711291curo:A401kRetirementSavingsPlanMember2022-01-012022-12-310001711291curo:Tier1Membercuro:A401kRetirementSavingsPlanHeightsMember2022-01-012022-12-310001711291curo:Tier2Membercuro:A401kRetirementSavingsPlanHeightsMember2022-01-012022-12-310001711291curo:A401kRetirementSavingsPlanMember2022-01-012022-12-310001711291curo:A401kRetirementSavingsPlanMember2021-01-012021-12-310001711291curo:A401kRetirementSavingsPlanMember2020-01-012020-12-310001711291us-gaap:EmployeeSeveranceMember2022-01-012022-12-310001711291us-gaap:FacilityClosingMember2022-01-012022-12-310001711291curo:UNITEDSTATESANDCANADAMember2022-01-012022-12-310001711291curo:LaborAndRelatedExpenseMemberus-gaap:EmployeeSeveranceMember2022-10-062022-12-310001711291curo:LaborAndRelatedExpenseMemberus-gaap:FacilityClosingMember2022-10-062022-12-310001711291curo:LaborAndRelatedExpenseMember2022-10-062022-12-310001711291us-gaap:CostOfSalesMemberus-gaap:EmployeeSeveranceMember2022-10-062022-12-310001711291us-gaap:CostOfSalesMemberus-gaap:FacilityClosingMember2022-10-062022-12-310001711291us-gaap:CostOfSalesMember2022-10-062022-12-310001711291us-gaap:EmployeeSeveranceMemberus-gaap:OtherOperatingIncomeExpenseMember2022-10-062022-12-310001711291us-gaap:FacilityClosingMemberus-gaap:OtherOperatingIncomeExpenseMember2022-10-062022-12-310001711291us-gaap:OtherOperatingIncomeExpenseMember2022-10-062022-12-310001711291us-gaap:EmployeeSeveranceMember2022-10-062022-12-310001711291us-gaap:FacilityClosingMember2022-10-062022-12-3100017112912022-10-062022-12-3100017112912022-10-050001711291country:US2021-01-012021-12-310001711291stpr:IL2021-01-012021-12-310001711291stpr:OR2021-01-012021-12-310001711291stpr:CO2021-01-012021-12-310001711291stpr:WA2021-01-012021-12-310001711291stpr:TX2021-01-012021-12-310001711291stpr:CA2021-01-012021-12-310001711291stpr:LA2021-01-012021-12-310001711291stpr:NV2021-01-012021-12-310001711291stpr:TN2021-01-012021-12-310001711291country:US2021-04-012021-06-300001711291country:US2021-07-012021-09-300001711291curo:CorporateDistrictAndOtherExpensesMember2021-01-012021-12-310001711291us-gaap:CostOfSalesMember2021-01-012021-12-310001711291curo:U.KSegmentMemberus-gaap:DiscontinuedOperationsDisposedOfByMeansOtherThanSaleMember2020-01-012020-12-310001711291curo:RepurchaseProgram2022Member2022-02-280001711291curo:RepurchaseProgram2021Member2021-05-310001711291curo:RepurchaseProgram2021Member2022-12-310001711291curo:RepurchaseProgram2021Member2022-10-012022-12-310001711291curo:RepurchaseProgram2021Member2022-01-012022-12-310001711291curo:ShareRepurchaseAgreementWithFaulkner2017DynastyTrustMembersrt:AffiliatedEntityMember2021-11-012021-11-300001711291curo:ShareRepurchaseAgreementWithFaulkner2017DynastyTrustMembersrt:AffiliatedEntityMember2021-11-300001711291curo:RepurchaseProgram2021Member2021-07-012021-09-300001711291curo:RepurchaseProgram2020Member2020-02-290001711291us-gaap:LineOfCreditMemberus-gaap:SubsequentEventMemberus-gaap:RevolvingCreditFacilityMembercuro:CuroCanadaRevolvingCreditFacilityMember2023-01-06
UNITED STATES
SECURITIES AND EXCHANGE COMMISSION
Washington, D.C. 20549
FORM 10-K
☒ ANNUAL REPORT PURSUANT TO SECTION 13 OR 15(d) OF THE SECURITIES EXCHANGE ACT OF 1934
For the fiscal year ended December 31, 2022
OR
☐ TRANSITION REPORT PURSUANT TO SECTION 13 OR 15(d) OF THE SECURITIES EXCHANGE ACT OF 1934
For the transition period from _________to__________
Commission File Number: 1-38315
CURO GROUP HOLDINGS CORP.
(Exact name of registrant as specified in its charter)
| | | | | | | | |
| Delaware | | 90-0934597 |
(State or other jurisdiction
Of incorporation or organization) | | (I.R.S. Employer Identification No.) |
| | |
200 W Hubbard Street, 8th Floor, Chicago, IL | | 60654 |
| (Address of principal executive offices) | | (Zip Code) |
Registrant’s telephone number, including area code: (312) 470-2000
Securities registered pursuant to Section 12(b) of the Act:
| | | | | | | | |
| Title of each class | Trading Symbol(s) | Name of each exchange on which registered |
| Common stock, $0.001 par value per share | CURO | New York Stock Exchange |
Securities registered pursuant to Section 12(g) of the Act: None
Indicate by check mark if the registrant is a well-known seasoned issuer, as defined in Rule 405 of the Securities Act. Yes ☐ No ☒
Indicate by check mark if the registrant is not required to file reports pursuant to Section 13 or Section 15(d) of the Act. Yes ☐ No ☒
Indicate by check mark whether the registrant (1) has filed all reports required to be filed by Section 13 or 15(d) of the Securities Exchange Act of 1934 during the preceding 12 months (or for such shorter period that the registrant was required to file such reports), and (2) has been subject to such filing requirements for the past 90 days. Yes ☒ No ☐
Indicate by check mark whether the registrant has submitted electronically every Interactive Data File required to be submitted pursuant to Rule 405 of Regulation S-T (§232.405 of this chapter) during the preceding 12 months (or for such shorter period that the registrant was required to submit such files). Yes ☒ No ☐
Indicate by check mark whether the registrant is a large accelerated filer, an accelerated filer, a non-accelerated filer, a smaller reporting company, or an emerging growth company. See the definitions of “large accelerated filer,” “accelerated filer,” “smaller reporting company,” and “emerging growth company” in Rule 12b-2 of the Exchange Act.
| | | | | | | | | | | | | | |
| Large accelerated filer | ☐ | | Accelerated filer | ☒ |
| Non-accelerated filer | ☐ | | | |
| Smaller reporting company | ☒ | | Emerging growth company | ☐ |
If an emerging growth company, indicate by check mark if the registrant has elected not to use the extended transition period for complying with any new or revised financial accounting standards provided pursuant to Section 13(a) of the Exchange Act. ☐
Indicate by check mark whether the registrant has filed a report on and attestation to its management's assessment of the effectiveness of its internal control over financial reporting under Section 404(b) of the Sarbanes-Oxley Act (15 U.S.C. 7262(b)) by the registered public accounting firm that prepared or issued its audit report. ☒
If securities are registered pursuant to Section 12(b) of the Act, indicate by check mark whether the financial statements of the registrant included in the filing reflect the correction of an error to previously issued financial statements. ☐
Indicate by check mark whether any of those error corrections are restatements that required a recovery analysis of incentive-based compensation received by any of the registrant’s executive officers during the relevant recovery period pursuant to §240.10D-1(b). ☐
Indicate by check mark whether the registrant is a shell company (as defined in Rule 12b-2 of the Act). Yes ☐ No ☒
The aggregate market value of 23,535,837 shares of the registrant’s common stock, par value $0.001 per share, held by non-affiliates on June 30, 2022 was approximately $130,153,179.
As of March 3, 2023 there were 40,835,943 shares of the registrant’s Common Stock, $0.001 par value per share, outstanding.
Documents Incorporated by Reference:
Certain information required by Part III of this Annual Report on Form 10-K is incorporated herein by reference to the Proxy Statement for the registrant’s 2023 Annual Meeting of Stockholders, which is expected to be filed pursuant to Regulation 14A within 120 days after the end of the registrant’s fiscal year ended December 31, 2022.
CURO GROUP HOLDINGS CORP. AND SUBSIDIARIES
YEAR ENDED DECEMBER 31, 2022
INDEX
| | | | | | | | | | | | | | | | | | | | | | | |
| | | | | | | Page |
| |
| | | | | | | |
|
| Item 1. | | |
| Item 1A. | | |
| Item 1B. | | |
| Item 2. | | |
| Item 3. | | |
| Item 4. | | |
| | | | | | | |
|
Item 5. | | |
Item 6. | | |
| Item 7. | | |
| Item 7A. | | |
| Item 8. | | |
| Item 9. | | |
| Item 9A. | | |
| Item 9B. | | |
| Item 9C. | | |
| | | | | | | |
|
| Item 10. | | |
| Item 11. | | |
| Item 12. | | |
| Item 13. | | |
| Item 14. | | |
| | | | | | | |
|
| Item 15. | Exhibits, Financial Statement Schedules | |
| Item 16. | | |
| | |
GLOSSARY
Terms and abbreviations used throughout this report are defined below.
| | | | | | | | |
| Term or abbreviation | | Definition |
| | |
| | |
| | |
| | |
| 2021 Form 10-K | | Annual Report on Form 10-K for the year ended December 31, 2021, filed with the SEC on March 7, 2022 |
| 7.50% Senior Secured Notes | | 7.50% Senior Secured Notes, issued in July 2021 for $750.0 million, which mature in August 2028 |
| 8.25% Senior Secured Notes | | 8.25% Senior Secured Notes, issued in August 2018 for $690.0 million, which were extinguished during the third quarter of 2021 |
| Ad Astra | | Ad Astra Recovery Services, Inc., a wholly-owned subsidiary of the Company, which, prior to acquisition in January 2020, was our exclusive provider of third-party collection services for the legacy Direct Lending U.S. business. The Company ceased operations of Ad Astra in January 2023. |
| ABL | | Asset-Backed Lending |
| Adjusted EBITDA | | EBITDA plus or minus certain non-cash and other adjusting items; Refer to "Supplemental Non-GAAP Financial Information" for additional details |
| ALL | | Allowance for loan losses |
| | |
| AOCI | | Accumulated other comprehensive income (loss) |
| ASC | | Accounting Standards Codification |
| ASU | | Accounting Standards Update |
| Average gross loans receivable | | Utilized to calculate product yield and NCO rates; calculated as average of beginning of quarter and end of quarter gross loans receivable |
| BNPL | | Buy-Now-Pay-Later |
| bps | | Basis points |
| C$ | | Canadian dollar |
| CAB | | Credit Access Business |
| Canada SPV | | A four-year revolving credit facility with capacity up to C$400.0 million |
| | |
| Curo Canada Revolving Credit Facility | | C$5.0 million revolving credit facility (formerly known as Cash Money Revolving Credit Facility), maintained by CURO Canada. This facility was terminated in January 2023. |
| CDOR | | Canadian Dollar Offered Rate |
| CECL | | In June 2016, the Financial Accounting Standards Board (“FASB”) issued Accounting Standards Update (“ASU”) No. 2016-13, Financial Instruments—Credit Losses (Topic 326): Measurement of Credit Losses on Financial Instruments. This ASU requires an impairment model (known as the current expected credit loss (“CECL”) model) that is based on expected rather than incurred losses, with an anticipated result of more timely loss recognition. This guidance will be effective for us on January 1, 2023. |
| | |
| | |
| | |
| CODM | | Chief Operating Decision Maker |
| | |
| | |
| Community Choice Financial | | Community Choice Financial Inc., a consumer financial services company based in Dublin, Ohio, which we sold our Legacy U.S. Direct Lending Business to on July 8, 2022 |
| CSO | | Credit services organization |
| | |
| Curo Canada | | Curo Canada Corp, a wholly-owned Canadian subsidiary of the Company, formerly known as Cash Money Cheque Cashing Inc. |
| Curo Receivables Finance II, LLC | | A U.S. bankruptcy remote special purpose vehicle and an indirect wholly-owned subsidiary of the Company |
| | |
| | |
| EBITDA | | Earnings Before Interest, Taxes, Depreciation and Amortization |
| Exchange Act | | Securities Exchange Act of 1934, as amended |
| | |
| FASB | | Financial Accounting Standards Board |
| FinServ | | FinServ Acquisition Corp., a publicly traded special purpose acquisition company |
| FinTech | | Financial Technology; the term used to describe any technology that delivers financial services through software, such as online banking, mobile payment apps or cryptocurrency |
| First Heritage | | First Heritage Credit, LLC, a wholly-owned U.S. subsidiary of the Company, which we acquired in July 2022 |
| First Heritage SPV | | A revolving credit facility, entered into concurrent with the acquisition of First Heritage, with capacity up to $225.0 million |
| Flexiti | | Flexiti Financial Inc., a wholly-owned Canadian subsidiary of the Company, which we acquired in March 2021 |
| Flexiti Securitization | | A non-recourse revolving credit facility, entered into on December 9, 2021, with capacity up to C$526.5 million |
| | | | | | | | |
| Term or abbreviation | | Definition |
| Flexiti SPV | | A revolving credit facility, entered into concurrent with the acquisition of Flexiti, with capacity up to C$535.0 million |
| Form 10-K | | This report on Form 10-K for the year ended December 31, 2022 |
| Gross Combined Loans Receivable | | Gross loans receivable plus loans originated by third-party lenders which are Guaranteed by the Company. As a result of the sale of the Legacy U.S. Direct Lending business on July 8, 2022, the Company no longer guarantees loans originated by third-party lenders through CSO programs |
| Guaranteed by the Company | | Loans originated by third-party lenders through the CSO program which we historically guaranteed but did not include in the Consolidated Financial Statements. All balances in connection with the CSO programs were disposed of on July 8, 2022 with the divestiture of the Legacy U.S. Direct Lending Business. |
| Heights Finance | | SouthernCo, Inc., a Delaware corporation d/b/a Heights Finance, a wholly-owned U.S. subsidiary of
the Company, which we acquired in December 2021 |
| Heights Finance SPV | | A non-recourse revolving credit facility, entered into concurrent with the acquisition of Heights Finance, with capacity up to $350.0 million. This facility was extinguished on July 15, 2022 when we entered into a new non-recourse revolving warehouse facility, see "Heights SPV." |
| Heights SPV | | A revolving credit facility, entered into to replace the incumbent lender's facility and finance future loans originated by Heights Finance, with capacity up to $425.0 million |
| ICFR | | Internal control over financial reporting |
| Katapult | | Katapult Holdings, Inc. a lease-to-own platform for online, brick and mortar and omni-channel retailers. |
| Legacy U.S. Direct Lending Business | | The Legacy U.S. Direct Lending Business historically operated under the Speedy Cash, Rapid Cash and Avio Credit brands. We sold the Legacy U.S. Direct Lending Business to Community Choice Financial on July 8, 2022. |
| LFL | | LFL Group, Canada's largest home furnishings retailer. |
| LIBOR | | London Inter-Bank Offered Rate |
| MDR | | Merchant discount revenue |
| NCO | | Net charge-off; total charge-offs less total recoveries |
| | |
| POS | | Point-of-sale |
| | |
| | |
| ROU | | Right of use |
| RSU | | Restricted Stock Unit |
| SEC | | U.S. Securities and Exchange Commission |
| Senior Revolver | | Senior Secured Revolving Loan Facility with borrowing capacity of $40.0 million as of December 31, 2022 |
| Sequential | | The change from one quarter to the next fiscal quarter |
| SOFR | | Secured Overnight Financing Rate |
| SPAC | | Special Purpose Acquisition Company |
| | |
| SPE | | Special Purpose Entity |
| SPV | | Special Purpose Vehicle |
| SRC | | Smaller Reporting Company as defined by the SEC |
| TDR | | Troubled Debt Restructuring. Debt restructuring for which a concession is granted to the borrower as a result of economic or legal reasons related to the borrower's financial difficulties |
| | |
| UDAAP | | Unfair, deceptive, or abusive acts and practices |
| U.K. Subsidiaries | | Collectively, Curo Transatlantic Limited and SRC Transatlantic Limited. These wholly-owned subsidiaries were placed into administration in February 2019. |
| U.S. | | United States of America |
| | |
| U.S. GAAP | | Accounting principles generally accepted in the U.S. |
| U.S. SPV | | An asset-backed revolving credit facility with capacity up to $200.0 million if certain conditions are met. This facility was extinguished on July 7, 2022. |
| VIE | | Variable Interest Entity; our wholly-owned, bankruptcy-remote special purpose subsidiaries |
FORWARD LOOKING STATEMENTS
This Form 10-K contains forward-looking statements. These forward-looking statements include projections, estimates and assumptions about various matters, including future financial and operational performance and may be identified by words such as "guidance," "estimate," "anticipate," "believe," "forecast," "step," "plan," "predict," "focused," "project," "is likely," "is possible," "expect," "anticipate," "intend," "should," "will," 'may," "confident," "trend" and variations of such words and similar expressions. The matters discussed in these forward-looking statements are based on management's beliefs, assumptions, current expectations and estimates and projections, and are subject to risk, uncertainties and other factors that could cause actual results to differ materially from those made, projected or implied in the forward-looking statements. Except as required by applicable law and regulations, we undertake no obligation to update any forward-looking statements or other statements we may make in the following discussion or elsewhere in this document even though these statements may be affected by events or circumstances occurring after the forward-looking statements or other statements were made. Please see the section titled “Risk Factors” below for a discussion of the uncertainties, risks and assumptions associated with our business.
PART I
The terms "CURO," "we," "our," "us" and "Company" include CURO Group Holdings Corp. and all of its direct and indirect subsidiaries as a combined entity, except where otherwise stated.
This report references third-party reports and studies solely for informational purposes only. Investors and market participants should not place undue reliance on such references, and the underlying reports and studies are not part of this report.
ITEM 1. BUSINESS
Company Overview
We are a tech-enabled, omni-channel consumer finance company serving a full spectrum of non-prime, near-prime and prime consumers in portions of the U.S. and Canada. CURO was founded over 25 years ago to meet the growing needs of consumers looking for alternative access to credit. We continuously update our products and technology platform to offer a variety of convenient, accessible financial and loan services. We design our customer experience to allow consumers to apply for, update and manage their loans in the channels they prefer—in branch, and via mobile device or over the phone. Our high customer satisfaction scores speak to our ability to anticipate and exceed customers’ needs.
In the U.S., we operate under several principal brands, including "Covington Credit," "Heights Finance," "Quick Credit," "Southern Finance" and "First Heritage." In Canada, we operate under “Cash Money” and “LendDirect” direct lending brands and the "Flexiti" POS/BNPL brand. As of December 31, 2022, we operated our direct lending and online services in eight Canadian provinces and one Canadian territory. Our point-of-sale operations are available at over 8,400 retail locations and over 3,500 merchant partners across 10 provinces and two territories. Until the sale of our Legacy U.S. Direct Lending Business in July 2022, we also operated under brands that included "Speedy Cash," "Rapid Cash" and "Avio Credit." We also offered demand deposit accounts in the U.S. under the "Revolve Finance" brand, and credit card programs under the "First Phase" brand, until the fourth quarter of 2022. As of December 31, 2022, our store network consisted of 496 locations across 13 U.S. states.
Recent Business Developments
Flexiti Acquisition
On March 10, 2021, we acquired Flexiti, an emerging growth Canadian POS/BNPL provider, which provided us instant capability and scale opportunity in Canada's credit card and POS financing markets. Flexiti offers the customers of its retail partners a variety of promotional financing offers on big-ticket purchases such as furniture, appliances, jewelry and electronics.
Heights Finance Acquisition
On December 27, 2021, we acquired Heights Finance, a consumer finance company that provides Installment loans and offers customary opt-in insurance and other financial products in the U.S. The acquisition of Heights Finance accelerated our strategic transition toward longer term, higher balance and lower credit risk products, and provided us with access to a larger addressable market while mitigating regulatory risk.
Divestiture of Legacy U.S. Direct Lending Business
On July 8, 2022, we sold our Legacy U.S. Direct Lending Business, which operated under the "Speedy Cash", "Rapid Cash" and "Avio Credit" brands, to Community Choice Financial.
First Heritage Acquisition
On July 13, 2022, we purchased First Heritage, a consumer lender that provides near-prime installment loans and customary opt-in insurance and other financial products in the U.S. This acquisition furthered our strategic shift to broaden our presence in the near-prime consumer lending market in the U.S.
These transactions were foundational to our strategic transition into longer term, higher balance and lower rate credit products. Refer to Note 14, "Acquisitions and Divestiture" for additional details regarding the divestiture of our Legacy U.S. Direct Lending Business and the acquisitions of First Heritage, Heights Finance and Flexiti.
2022 Restructuring and Expense Saving Initiatives
In October 2022, we began restructuring actions to increase our operating efficiency by reducing our global workforce and closing 89 stores across the U.S. and Canada. These actions were aimed at reducing duplicative corporate functions and stores with overlapping customer populations as a result of our recent acquisitions. Refer to Note 21, "Restructuring and Store Closures" for additional details regarding these initiatives.
Regulatory Developments
Our Products and Services
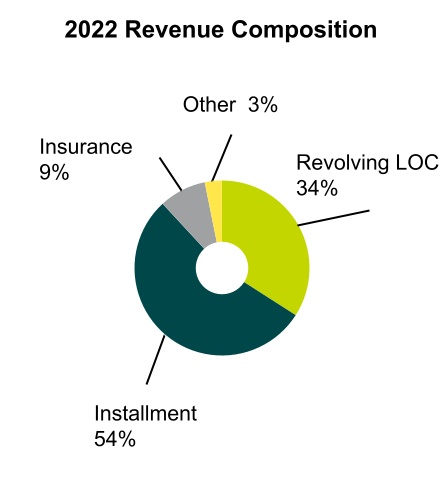
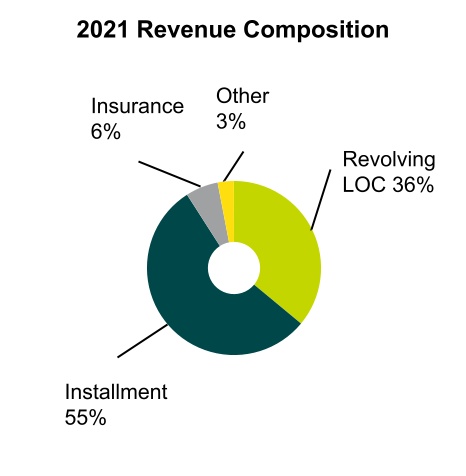
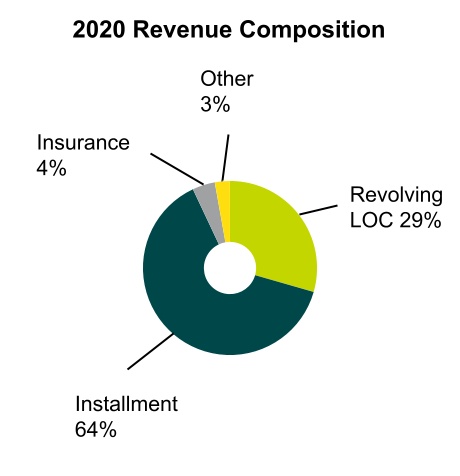
Overview of Loan Product Revenue
The following charts depict the revenue contribution, including CSO fees, of our products and services:
Our direct lending operations include a broad range of direct-to-consumer finance products focusing on revolving LOC, installment loans, insurance and other ancillary products, serving our customers' diversified needs as they address credit and related financial needs. The acquisitions of Heights Finance and First Heritage enable us to expand the geographic reach of our Installment products in the U.S. Through our acquisition of Flexiti in March 2021, we diversified our products, now offering POS financing options for consumers in Canada. We also provide a number of ancillary financial products such as optional credit protection, demand deposit accounts, proprietary general-purpose credit cards, check cashing and money transfer services. Our products are licensed and governed by enabling federal and state legislation in the U.S. and federal and provincial regulations in Canada. For additional details regarding recent regulatory developments, see "Regulatory Environment and Compliance" below.
Installment Loans
Installment loan products range from unsecured, short-term loans in Canada whereby a customer receives cash in exchange for a post-dated personal check or a pre-authorized debit from the customer’s bank account, to fixed-term, fully amortizing loans with a fixed payment amount due each period during the term of the loan in both U.S. and Canada. Certain Installment loans are secured by a clear vehicle title or security interest in the vehicle. The customer receives the benefit of immediate cash and retains possession of the vehicle while the loan is outstanding. Payments are due bi-weekly or monthly to match the customer's pay cycle. Customers may prepay without penalty or fees. Loans offered by Heights Finance and First Heritage are considered Installment loans, and can be unsecured or secured. Installment loans comprised 53.5%, 54.9% and 63.6% of our consolidated revenue during the years ended December 31, 2022, 2021 and 2020, respectively.
Revolving LOC Loans
Revolving LOC loans are lines of credit without a specified maturity date. Customers in good standing may draw against their line of credit, repay with minimum, partial or full payment and redraw as needed. We earn interest on the outstanding loan balances. Customers may prepay without penalty or fees. Typically, customers do not initially draw the full amount of their credit limits. Canada Direct Lending Revolving LOC loans comprised 93.8%, 94.2% and 91.8% of our total Canada Direct Lending loans as of December 31, 2022, 2021 and 2020, respectively. As of December 31 2022, Revolving LOC loans also included the Flexiti POS financing products, which are included in our Canada POS Lending segment and allow us to offer BNPL products as well as Flexiti branded credit cards at merchant locations. Canada POS Lending Revolving LOC gross loans receivable increased $374.3 million, or 81.5% from December 31, 2021. For the years ended December 31, 2022, 2021 and 2020, revolving loans revenues were $345.8 million, $294.6 million and $249.5 million, respectively.
Insurance Premiums and Commissions
We offer consumers a number of insurance products, including Credit Life and Disability, Involuntary Unemployment, Personal Property Collateral and Collateral Protection Plans. These products are optional and not a condition of the loan. We do not sell insurance to non-borrowers. We own a captive insurance company in the U.S. that reinsures a portion of our insurance sales. We earn revenue from the sale of optional credit protection insurance, which we recognize ratably over the term of the loan. Credit protection insurance is available to consumers on certain Revolving LOC and Installment products. For the years ended December 31, 2022, 2021 and 2020, insurance revenues were $88.5 million, $49.4 million and $35.6 million, respectively.
Other
Other products we offer include general-purpose credit cards, ancillary financial products including check cashing, prepaid cards, demand deposit and money transfer services. We offer memberships for car club, home and auto related services. We have no direct risk of loss on these membership plans. Check cashing, demand deposit and money transfer product lines in the U.S.ended with the divestiture of the Legacy U.S. Direct Lending Business and are now only offered by Canada Direct Lending. Revenues from consumer products include credit card revenue, check cashing and miscellaneous fees such as administrative fees, annual membership fees, over limit fees and deferral fees.
For the years ended December 31, 2022, 2021 and 2020, other revenues were $32.0 million, $24.7 million and $23.7 million, respectively.
CSO Programs
Through our CSO programs, we acted as a CSO/CAB on behalf of customers in accordance with applicable state laws. We offered Installment loans with a maximum term of 180 days through CSO programs in stores and online in the state of Texas. As a CSO, we earned revenue by charging the customer a CSO fee for arranging an unrelated third party to make a loan to that customer.
CSO loans were made by a third-party lender, and thus we did not include them in our Consolidated Balance Sheets as loans receivable; instead, we included fees receivable in “Prepaid expenses and other” in our Consolidated Balance Sheets.
As a result of the sale of the Legacy U.S. Direct Lending Business in July 2022, we no longer guarantee loans originated by third-party lenders through CSO programs. Refer to Note 14, "Acquisitions and Divestiture" for additional information.
Geography
For the years ended December 31, 2022, 2021 and 2020, approximately 60.0%, 64.3% and 75.4%, respectively, of our consolidated revenues were generated from services provided within the U.S. and approximately 40.0%, 35.7 % and 24.6%, respectively, were generated from services provided within Canada. For the years ended December 31, 2022 and 2021, respectively, approximately 43.8% and 59.9%, of our long-lived assets were located within the U.S., and approximately 56.2% and 40.1%, were located within Canada. See Item 7. "Management's Discussion and Analysis of Financial Condition and Results of Operations" for additional information on our geographic segments.
Stores: As of December 31, 2022, we had a total of 645 stores, with 496 stores across 13 U.S. states and 149 stores across eight provinces in Canada. Our U.S. stores include 106 stores acquired with the acquisition of First Heritage in July 2022.
The largest concentrations of U.S. Direct Lending gross loan receivables, as of December 31, 2022, based on location of originating store, were in Tennessee, Texas, Mississippi and South Carolina. The largest concentrations of U.S. Direct Lending gross loan receivables, as of December 31, 2021, based on location of originating store, were in Tennessee, Texas and South Carolina. The largest concentrations of Canada Direct Lending gross loan receivables as of December 31, 2022 and December 31, 2021, based on location of originating store, were in Ontario, British Columbia and Alberta.
Retail: We offer POS Lending in Canada at over 8,400 retail locations and over 3,500 merchant partners across 10 provinces and two territories.
Strategy
We believe our diversification across brands, products and geography positions us well for long-term growth. Our acquisitions of Flexiti, Heights Finance and First Heritage established us as a full-spectrum lender able to meet our target customers' evolving credit demands.
•Focus on operating new business—We have undergone a complete strategic repositioning over the past several years, including the sale of our Legacy U.S. Direct Lending Business and a shift toward longer term, higher balance and lower interest rate credit products. Our near-term focus is to ensure a successful integration of our acquired businesses and execution of our business plan.
•Focus on customer experience—We will continue our focus on customer service and experience, by designing our stores and website interfaces to appeal to our customers’ needs and behaviors.
•Effectively manage our operating expenses—We have made significant investments in our business over the past several years, primarily through acquisitions, to drive our strategic initiatives. As we work to fully integrate these businesses, we will remain focused on operating efficiencies through the prudent management of our expenses, which has included cost savings measures starting in the fourth quarter of 2022.
•Demonstrated access to capital markets and diversified funding sources— We have raised over $4.9 billion of debt financing across 18 separate offerings and various credit facilities since 2010, including over $1.0 billion raised during 2022. This aggregate amount includes the existing $1.0 billion of 7.50% Senior Secured Notes, five asset based revolving facilities used to support growth across our U.S. Direct Lending, Canada Direct Lending and Canada POS Lending segments, and a U.S. bank revolving credit facility to supplement intra-period liquidity. For more information, see Item 7. “Management’s Discussion and Analysis of Financial Condition and Results of Operations—Liquidity and Capital Resources.”
Customers
Our U.S. Direct Lending and Canada Direct Lending customers require essential financial services and value timely, transparent, affordable and convenient alternatives to banks, credit card companies and other traditional financial services companies, which are generally not available to them. Our U.S. Direct Lending and Canada Direct Lending customers typically earn between $10,000 and $60,000 annually while the average annual earnings of Canada POS Lending customers are approximately C$100,000. Based on our experience, our target consumer utilizes the products provided by our industry for a variety of reasons, such as when they often:
•have unexpected expenses such as car repairs or other bills;
•have been rejected for or have limited access to traditional banking services;
•maintain insufficient account balances to make a bank account economically efficient;
•prefer and trust the simplicity, transparency and convenience of our products and customer experience;
•need access to financial services outside of normal banking hours;
•seek an opportunity to improve their credit history and profile; or
•reject complicated fee structures in some bank products (e.g., credit cards and overdrafts).
Our Canada POS Lending consumers are looking for flexible payment solutions at the time of purchase, primarily at retail locations. The Flexiti card offers deferred payment solutions, for up to 24 months at 0% interest during the promotional period, monthly installment payment solutions of up to 72 months also at 0% interest during the promotional period provided that scheduled payments are made, or a revolving credit experience similar to a typical credit card. The fully automated application process typically results in a credit decision within three minutes with Flexiti branded credit cards available to use at over 8,400 partner retail locations.
Marketing
Our U.S Direct Lending and Canada Direct Lending Businesses use a multi-channel approach to attract new customers and retain valued customer relationships. We engage with customers across targeted, direct response channels digitally, in stores and through our insourced contact centers. We reach out to our customers via email, text, direct mail and phone calls to enhance customer satisfaction and preference, which in turn results in customer recommendations to family and friends. Our most effective marketing techniques include paid and organic search, prescreen direct mail campaigns, email, local store marketing, “send a friend” promotions and asking customers to leave us an online review..
Information Systems
Our Canada Direct Lending business is powered by our proprietary loan management system, which is a platform that integrates activities related to customer acquisition, underwriting, scoring, servicing, collections, compliance and reporting. It is designed to support and monitor compliance with regulatory and other legal requirements. With this technology we can make real-time, data-driven changes to our acquisition and risk models, which yields significant benefits in terms of customer acquisition costs and credit performance.
Our proprietary, highly scalable scoring system employs various algorithms which are continuously reviewed and refreshed. They focus on several factors related to the loan applicant's disposable income, expense trends or cash flows, among other factors. The predictability of our scoring models is driven by the combination of application data, purchased third-party data and our robust historical customer data. These variables are then analyzed using a series of algorithms to produce a "Curo Score" that allows us to optimize lending decisions in a scalable manner.
Our U.S. Direct Lending business is powered by a combination of third party vendors as well as proprietary software. The vendor solution provides the underpinnings for managing loan origination, decisioning and servicing. The proprietary software is an overlay sitting on top that provides a streamlined user interface and capabilities to enhance the efficiency of the branch workforce.
Our Canada POS Lending Business is powered by Flexiti’s proprietary POS technology platform, which powers the entire lifecycle of customer and merchant transactions. Data related to loan originations, servicing activities, collection activities, payments and defaults are also captured. The platform enables data-driven decisions that optimize performance across all aspects of the POS business.
A credit risk rating model is applied in real-time to every customer’s application and drives our underwriting decision. Our credit risk models combined with our scalable omni-channel instant apply-and-buy POS financing solution yield significant benefits in terms of customer acquisition costs and credit performance.
Cybersecurity Management
We rely on information technology systems and networks in connection with many of our business activities. We periodically evaluate ourselves for appropriate business continuity and disaster recovery planning using test scenarios and simulations. Our networks and systems are tested multiple times throughout the year by third-party security firms through penetration and vulnerability testing and our networks and systems are monitored by intrusion detection services as well as state-of-the-art network behavior analysis hardware and software. We mitigate vulnerabilities in our systems through a robust patch management program that we review annually. We employ a skilled IT workforce to implement our cybersecurity programs and to perform all security and compliance-related responsibilities in a timely manner. For risks associated with cybersecurity, see “Item 1A – Risk Factors.”
Collections
We operate collections through centralized and/or branch locations in the U.S. and Canada to enable store employees to focus primarily on customer service and to improve effectiveness and compliance management. Our collections personnel contact customers after a missed payment, primarily via phone calls, letters, text, push notifications and emails, and help the customer understand available payment arrangements or alternatives to help resolve the deficiency. We use a variety of collection strategies, including payment plans, settlements and adjustments to due dates. Collections teams are trained to apply different strategies and tools for the various stages of delinquency and also employ varying methodologies by product type.
At Canada POS Lending, we utilize a combination of internal and external collection agencies to collect on past due and charged off accounts. Prior to an account charging off, accounts are addressed by either our internal collection call center or external agencies that we hire. After an account charges off, third party collection agencies call on our behalf to arrange repayment of debt. Attempts to collect are primarily made via phone calls, but email, text messages and letters may be used.
Competition
We believe that the primary factors upon which we compete are:
•range of services and products;
•flexibility of product offering;
•convenience;
•reliability;
•fees;
•omni-channel technology;
•ability to partner with retailers and add value as an advisor;
•experienced management; and
•speed.
Our customers value service that is quick and convenient, lenders that can provide the most appropriate structure, loan terms that are fair and payments that are affordable. We face competition in all of our markets from other financial services providers, banks, savings and loan institutions, short-term consumer lenders and other financial services entities. Our industry has a small number of large, national participants with a significant presence in markets across the country and a significant number of smaller localized operators. Our competitors in the alternative financial services industry include monoline operators (both public and private) specializing in short-term cash advances, multiline providers offering cash advance services in addition to check cashing and other services and subprime specialty finance and consumer finance companies, as well as businesses conducting operations online and by phone. In our Canada POS Lending segment, our competitors include POS/BNPL companies that operate both in store with retailers and online through e-commerce sites.
Seasonality
Our direct lending businesses in the U.S. and Canada typically experience the greatest demand during the third and fourth calendar quarters. In the U.S., this demand generally declines in the first calendar quarter as a result of federal income tax refunds and credits. Typically, our cost of revenue for loan products, which represents our provision for losses, is lowest as a percentage of revenue in the first quarter of each year due to our customers’ receipt of income tax refunds, and increases as a percentage of revenue for the remainder of the year. As a result, we experience seasonal fluctuations in our U.S. operating results and cash needs. Our direct lending business in Canada experiences less seasonality than our U.S. direct lending business.
Our Canada POS Lending sales are largely driven by the typical seasonality has some of the typical seasonality experienced in the Canadian retail markets, with 31% of 2022 sales falling in the last quarter of the year. The business also saw strong growth and momentum with an 89% increase in net sales compared to 2021.
Human Capital Resources
Employee Profile. As of December 31, 2022, we had approximately 4,000 full-time employees, approximately 2,600 of whom work in our branches. We moved our corporate headquarters from Wichita, Kansas to Chicago, Illinois in January 2023, which, coupled with our remote and hybrid first model, allows us to attract and retain talented technology and data science professionals. We also have offices in Toronto, Ontario; Greenville, South Carolina; Wichita, Kansas; and Ridgeland, Mississippi servicing our Canadian and U.S. segments. We are closing our Canadian corporate office in 2023 but will retain our Flexiti corporate office in Toronto. None of our employees are unionized or covered by a collective bargaining agreement and we consider our employee relations to be good.
Diversity and Inclusion and Social Responsibility. We strive to foster and cultivate a culture of diversity, equity and inclusion. To this end, we launched a Diversity and Inclusion Council in 2020 with Board and executive sponsorship to ensure we have the resources to appropriately address racial and social issues. We are committed to being a StigmaFree company by partnering with the National Alliance on Mental Illness. Led by our Diversity and Inclusion Council, we annually identify and contribute to non-profit organizations supporting vulnerable communities. We also launched the CURO Cares Employee Relief Fund, which is a grant program to help employees cope with unexpected hardships that place undue financial stress on them and their families.
Regulatory Environment and Compliance
The financial services industry is regulated at the federal, state and local levels in the U.S. and at the federal and provincial levels in Canada. Laws and regulations governing our loan products typically impose restrictions and requirements, such as those on:
•the terms of loans (such as interest rates, fees, durations, repayment terms, maximum loan amounts, renewals and extensions and repayment plans) and the number and frequency of loans;
•underwriting requirements;
•collection and servicing activity, including initiation of payments from consumer accounts;
•licensing, reporting and document retention;
•unfair, deceptive and abusive acts and practices and discrimination;
•disclosures, notices, advertising and marketing;
•loans to members of the military and their dependents;
•insurance products and traditional ancillary products; requirements governing electronic payments, transactions, signatures and disclosures;
•check cashing;
•privacy and use of personally identifiable information and consumer data, including credit reports;
•repossession practices in certain jurisdictions where we operate as a title lender.
For more information regarding the regulations applicable to our business and the risks to which they subject us, see “Item 1A—Risk Factors.”
The legal environment is constantly changing as new laws and regulations are introduced and adopted, and existing laws and regulations are repealed, amended or reinterpreted, any of which could have material adverse effect on our results of operations or financial condition. We work with regulatory authorities, both directly and through our active memberships in industry trade associations, to support our industry and to promote the development of laws and regulations that we believe are equitable to businesses and consumers alike, that facilitate competition and thus lower costs associated with financial products and services, and that enable consumers to access myriad responsible credit products that meet their needs.
U.S. Regulations
U.S. Federal Regulations
Dodd-Frank. Title X of the Dodd-Frank Wall Street Reform and Consumer Protection Act ("Dodd-Frank") passed by Congress created the Consumer Financial Protection Bureau (“CFPB”) and provided the CFPB with broad rulemaking, supervisory and enforcement powers regarding consumer financial services. Title X of Dodd-Frank also contains “UDAAP” provisions, which declare unlawful “unfair,” “deceptive” or “abusive” acts and practices in connection with the delivery of consumer financial services and gives the CFPB the power to enforce UDAAP prohibitions and adopt UDAAP rules defining unlawful acts and practices. Additionally, Section 5 of the Federal Trade Commission Act prohibits “unfair” and “deceptive” acts and practices in connection with a trade or business and gives the Federal Trade Commission enforcement authority to prevent and redress violations of this prohibition.
Dodd-Frank also gives the CFPB authority to pursue administrative proceedings or litigation for violations of federal consumer financial laws (including Dodd-Frank’s UDAAP provisions and the CFPB’s own rules). Further, Dodd-Frank empowers state attorneys general and state regulators to bring civil actions for the kind of cease and desist orders available to the CFPB (but not for civil penalties). The CFPB also has supervisory powers over many providers of consumer financial products and services, including certain non-bank providers that the CFPB determines may pose a risk to consumers.
Our business is heavily regulated and subject to a number of key Federal laws and regulations, including the following:
•The Military Lending Act, which imposes a 36% cap on the “all-in” annual percentage rates charged on loans to active-duty members of the U.S. military, Reserves and National Guard and their dependents.
•The Truth in Lending Act and Regulation Z, which require creditors to deliver disclosures to borrowers prior to consummation of both closed-end and open-end loans.
•Equal Credit Opportunity Act and Regulation B, which prohibits discrimination based on protected bases. We must also deliver notices specifying the basis for credit denials, as well as certain other notices.
•The Fair Credit Reporting Act, which regulates the use of consumer reports and reporting of information to credit reporting agencies.
•The Electronic Signatures In Global And National Commerce Act, which governs the use of electronic signatures and disclosures.
•The Electronic Funds Transfer Act and Regulation E, which define requirements related to electronic payments.
•The Telephone Consumers Protection Act and CAN-SPAM (Controlling the Assault of Non-Solicited Pornography and Marketing Act) as well as rules from the Federal Communications Commission, which require limitations on telemarketing calls, auto-dialed calls, pre-recorded calls, text messages and unsolicited faxes.
•Prohibition of dealing with a list of individuals and companies identified by the Office of Foreign Assets Control.
Privacy Laws. The Gramm-Leach-Bliley Act and the FTC’s Safeguards Rule and its implementing regulations, require us to protect the confidentiality of our customers’ nonpublic personal information and to disclose to our customers our privacy policy and practices, including those regarding sharing customers’ nonpublic personal information with third parties. That disclosure must be made to customers at the time the customer relationship is established and at least annually thereafter. The FTC’s Safeguards Rule includes, among other things: (i) detailed requirements for an information security program; (ii) new requirements for accountability, including designation of a Qualified Individual (as defined in the Rule); and (iii) an expansion of the definition of a financial institution. Under the Safeguards Rule, safeguards must address access controls, data inventory and classification, encryption, secure development of application practices, authentication, information disposal procedures, change management, testing and incident response. Our Board of Directors has appointed a Qualified Individual and adopted a Safeguards Rule Policy.
Additionally, various states have enacted their own privacy and security laws which cover employees and business to business data.
U.S. State and Local Regulations
Currently, we make loans in approximately 13 states in the U.S. pursuant to enabling legislation that specifically allows direct loans of the type that we make. Our consumer loans must comply with extensive laws of the states where our branches are located.
Canada Regulations
Unsecured Installment Loans, Revolving LOC Loans and POS/BNPL Products
Unsecured Installment loans, Revolving LOC loans and POS/BNPL products are regulated at both the federal and provincial level in Canada. At the federal level, such lending products are subject to the criminal rate of interest provisions of the Criminal Code, which prohibit receiving (or entering into an agreement to receive) interest at an effective annual rate that exceeds 60% on the credit advanced under the loan agreement. These provisions have been in place since 1980. In August 2022, the federal government released “Consultation on Fighting Predatory Lending,” a consultation paper posing questions specific to the criminal rate of interest and its impact on Canadian consumers. The consultation closed in October 2022 with approximately 100 submissions from diverse industry organizations and individuals. The federal government is now considering the feedback it received and has not provided a timeline for a decision on whether it will change the criminal rate of interest.
We are also subject to provincial legislation that requires lenders to provide cost of credit disclosures and extend consumer protection rights to borrowers, such as prepayment rights, and prohibits the charging of certain default fees.
In addition. some provinces have enacted legislation that regulates high-cost credit grantors. These laws define a high-cost credit product and require licensing and additional consumer protection oversight.
Single-Pay
Canadian federal legislation exempts from the criminal rate of interest provisions of the Criminal Code cash advance loans of $1,500 or less if the term of the loan is 62 days or less (“payday loans”) and the lender is licensed under provincial legislation as a short-term cash advance lender and the province has been designated under the Criminal Code.
Check Cashing
In Canada, the federal government generally does not regulate check cashing businesses, other than federally regulated financial institutions (and other than the prohibition noted above regarding charging or receiving in excess of 60% annual interest rate on the credit advanced for the fee of a check cashing transaction), nor do most provincial governments impose regulations specific to the check cashing industry. There are some minor exceptions in various provinces.
Available Information
Information about us, including our Code of Business Conduct and Ethics, Corporate Governance Guidelines and charters of our committees, is available at our website at www.curo.com. Printed copies of the documents listed above are available upon request, without charge, by writing to us at 200 W. Hubbard, 8th Floor, Chicago, Illinois 60654, Attention: Investor Relations.
We also make available through our website at www.ir.curo.com, free of charge, our Annual Reports on Form 10-K, Quarterly Reports on Form 10-Q, Current Reports on Form 8-K and any amendments to those reports (along with certain other Company filings with the SEC) as soon as reasonably practicable after we electronically file those reports with or furnish them to the SEC. These materials are also accessible on the SEC's website at www.sec.gov.
ITEM 1A. RISK FACTORS
Our operations and financial results are subject to many risks and uncertainties that could adversely affect our business, results of operations, financial condition or share price of our stock. While we believe the discussion below addresses the key risk factors affecting our business, there may be additional risks and uncertainties not currently known or that we currently deem to be immaterial that may become material in the future or that could adversely affect our business, results of operations, financial condition or share price. You should carefully consider these risk factors.
Risks Relating to Our Business
If our ALL is not adequate to absorb our actual losses, this could have a material adverse effect on our results of operations or financial condition.
Our customers may fail to repay their loans in full. We maintain an ALL for estimated probable losses on company-funded loans and loans in default. See Note 1, “Summary of Significant Accounting Policies and Nature of Operations” of the Notes to Consolidated Financial Statements for factors we consider when estimating the ALL. This reserve is an estimate. Actual losses are difficult to forecast, especially if losses stem from factors that we have not experienced historically, and unlike traditional banks, we are not subject to periodic review by bank regulatory agencies of our ALL. In addition, Flexiti offers loans to consumers with various terms, including no interest and/or no payment promotional offers. While many of Flexiti’s customers have prime credit scores, these promotional offers can make credit losses less predictable. As a result, our ALL may not be sufficient to cover incurred losses or comparable to that of traditional banks subject to regulatory oversight. If actual losses are greater than our reserve and allowance, this could have a material adverse effect on our results of operations or financial condition.
Because of the non-prime nature of many of our customers, we have experienced a high rate of NCOs as a percentage of revenues, and it is essential that we price loans appropriately. We rely on our proprietary credit and fraud scoring models to forecast loss rates. If we are unable to effectively forecast loss rates, it may negatively and materially impact our operating results.
Because of the non-prime credit rating score status of certain of our customers, we have much higher charge-off rates than traditional lenders. Accordingly, it is essential that we price our products appropriately to account for these credit risks. In deciding whether to extend credit and the terms of such credit, including price, we rely heavily on our proprietary credit and fraud scoring models, which are an empirically derived suite of statistical models built using third-party data, customer data and our historical credit experience. If we do not regularly enhance our scoring models to ensure optimal performance, our models may become less effective. If we were unable to rebuild our scoring models or if they did not perform as expected, our products could experience increasing defaults, higher customer acquisition costs, or both.
If our scoring models fail to adequately predict the creditworthiness of customers, or if they fail to assess prospective customers’ ability to repay loans, or other components of our credit decision process fail, higher than forecasted losses may result. Similarly, if our scoring models overprice our products, we could lose customers. Among other things, the cessation of government stimulus programs related to the COVID-19 pandemic, an inflationary or a recessionary environment or higher interest rates, can further add volatility to loan balances, repayments and profitability. Furthermore, if we are unable to access third-party data, or access to such data is limited or cost prohibitive, our ability to accurately evaluate potential customers will be compromised. As a result, we may be unable to effectively predict probable credit losses inherent in the resulting loan portfolio, and we may experience higher defaults or customer acquisition costs, which could have a material adverse effect on our business, prospects, results of operations or financial condition.
Additionally, if any of the models or tools used to underwrite loans contain errors in development or validation, such loans may result in higher delinquencies and losses. Moreover, if future performance of customer loans differs from past experience, delinquency rates and losses could increase, all of which could have a material adverse effect on our business, prospects, results of operations or financial condition. An inability to effectively forecast loss rates could also inhibit our ability to borrow from our debt facilities, which could further hinder our growth and have a material adverse effect on our business, prospects, results of operations or financial condition.
Changes in the demand for our products and specialty financial services or our failure to adapt to such changes could have a material adverse effect on our business, prospects, results of operations or financial condition.
The demand for a product or service may change due to many factors such as regulatory restrictions that reduce customer access to products, the availability of competing products, reduction in our marketing spend, macroeconomic changes (including inflation, recession or higher interest rates) or changes in customers’ financial conditions among others. If we do not adapt to a significant change in customers’ demand for, or access to, our products or services, our revenue could decrease significantly. Even if we make adaptations or introduce new products or services, customer demand could decrease if the adaptations make them less attractive, less available or more expensive, all of which could have a material adverse effect on our business, prospects, results of operations or financial condition.
We face strong direct and indirect competition.
The consumer finance industry is highly competitive, and the barriers to entry for new competitors are relatively low in the markets in which we operate. We compete for customers, locations, employees and other aspects of our business with many other local, regional and national institutions. Our profitability depends, in large part, on our ability to underwrite and originate loans. Some of
our competitors have greater financial, technical and marketing resources than we possess. Some competitors may also have a lower cost of funds and access to funding sources that may not be available to us. We cannot give assurances that the competitive pressures we face will not have a material adverse effect on our financial condition or results of operations.
We have grown significantly in recent years, and if we are unable to manage growth effectively, our results of operations or financial condition may be materially adversely affected.
We have experienced significant growth in recent years. We may not be able to manage this growth successfully, and the pace of our future growth may slow. In addition, if we do not continue to grow the business and generate sufficient levels of cash flow, our ability to service our debt obligations could be negatively and materially impacted. The profitability of our operations and any future growth depends upon many factors, including our ability to appropriately price our products, manage credit risk, manage our foreign currency exposure, respond to regulatory and legislative changes, obtain and maintain financing, hire, train and retain qualified employees, obtain and maintain required licenses and other factors, some of which are beyond our control, such as changes in regulation and legislation. As a result, our profitability and cash flows could suffer if we do not successfully implement our business strategy.
Our failure to expand our management systems and controls to support our recent growth or integrate acquisitions could seriously harm our operating results and business.
Our recent growth and executing our business strategy has placed significant demands on management and our administrative, operational, information technology, financial and personnel resources. Accordingly, our future operating results will depend on the ability of our officers and other key employees to continue to implement and improve our operational, information technology and financial control systems, and effectively expand, train and manage our employee base. Otherwise, we may not be able to manage our recent growth successfully.
We face risks associated with our growth strategies including those related to acquisitions.
We have expanded our products and markets in part through strategic acquisitions, including the acquisitions of Flexiti, Heights Finance and First Heritage, and we may continue to do so in the future, depending on our ability to identify and successfully pursue suitable acquisition candidates. Acquisitions involve numerous risks, including risks inherent in entering new markets in which we may not have prior experience; potential loss of significant customers or key personnel of the acquired business; not obtaining the expected benefits of the acquisition on a timely basis or at all; managing geographically-remote operations or different technology platforms; and potential diversion of management's attention from other aspects of our business operations. Acquisitions may also cause us to incur debt or result in dilutive issuances of equity securities, additional write-offs of goodwill and substantial amortization expenses associated with acquired intangible assets. We may not be able to obtain financing for future acquisitions on favorable terms, making any such acquisitions more expensive. Any such financing may have terms that restrict our operations. We may not be able to successfully integrate the operations of any acquired businesses into our operations and achieve the expected benefits of any acquisitions. The failure to successfully integrate newly acquired businesses or achieve the expected benefits of strategic acquisitions in the future, or consummate a potential acquisition after incurring material costs, could have an adverse effect on our business, results of operations and financial position.
The outcome of a CFPB investigation into certain of Heights Finance’s business practices is uncertain and may materially and adversely affect Heights Finance's business and, ultimately, the combined business.
In April 2020, Heights Finance received a civil investigative demand (“CID”) from the CFPB applicable to its small loan business. We have received and responded to additional CIDs and are fully cooperating with the investigation. In May and June of 2022, Heights Finance responded to the CFPB’s Notice and Opportunity to Respond and Advise, which was substantively aligned with the previously received CIDs. We continue to await a response from the CFPB.
We are currently unable to predict the ultimate timing or outcome of the CFPB investigation. While we have contractual rights to indemnification under the acquisition document for certain losses that arise with respect to the CFPB investigation, there can be no assurance that such indemnification will be sufficient to address all covered losses or that the CFPB’s ongoing investigation or future exercise of its enforcement, regulatory, discretionary or other powers will not result in findings or alleged violations of consumer financial protection laws that could lead to enforcement actions, proceedings or litigation, whether by the CFPB, other state or federal agencies, or other parties, and the imposition of damages, fines, penalties, restitution, other monetary liabilities, sanctions, settlements or changes to Heights Finance’s business practices or operations that could materially and adversely affect its or the combined business’, financial condition, results of operations or reputation.
Our substantial indebtedness could materially impact our business, results of operations or financial condition.
We have significant debt. The amount of our indebtedness could have significant effects on our business, including:
•making it more difficult to satisfy our financial obligations;
•inhibiting our ability to obtain additional financing for operational and strategic purposes;
•requiring the use of a substantial portion of our cash flow from operations to pay interest on our debt, especially in a prolonged high interest rate environment, which reduces funds available for other operational and strategic purposes;
•putting us at a competitive disadvantage compared to our competitors that may have proportionately less debt;
•restricting our ability to pay dividends; and
•limiting our flexibility in planning for, or reacting to, changes in our business and the industry in which we operate.
For instance, our ability to offer our current products or services or the financial performance of these products and services could be negatively impacted by regulatory changes, which could inhibit our ability to comply with the terms of our debt.
If our cash flows and capital resources are insufficient to fund our debt obligations, or if we confront regulatory uncertainty or challenges in debt capital markets, we may not be able to refinance our indebtedness prior to maturity on favorable terms, or at all. In addition, prevailing interest rates or other factors at the time of refinancing could increase our interest or other debt capital expense. A refinancing could also require us to comply with more onerous covenants on our business operations. If we are unable to refinance our indebtedness prior to maturity we will be required to pursue alternative measures that could include restructuring our current indebtedness, selling all or a portion of our business or assets, seeking additional capital, reducing or delaying capital expenditures or taking other steps to address obligations under the terms of our indebtedness.
Our ability to meet our debt obligations, refinance current debt obligations or access capital markets in the future depends on our future performance, which will be affected by financial, business, economic, regulatory and other factors, many of which we cannot control or predict. Our business may not generate sufficient cash flow from operations, and we may not realize our anticipated growth in revenue and cash flow, either of which could result in being unable to repay indebtedness, or to fund other liquidity needs. If we do not have enough capital resources, we may need to refinance all or part of our debt, sell assets or borrow more funds, which we may not be able to do on terms acceptable to us, or at all. In addition, the terms of existing or future debt agreements may restrict us from pursuing any of these alternatives.
In preparing our financial statements, including implementing accounting principles, financial reporting requirements or tax rules or tax positions, we use our judgment, and that judgment encompasses many risks.
We prepare our financial statements in accordance with U.S. GAAP and its interpretations are subject to change. If new rules or interpretations of existing rules require us to change our accounting, financial reporting or tax positions, our results of operations or financial condition could be materially adversely affected, and we could be required to restate financial statements. Preparing financial statements requires management to make estimates and assumptions, including those impacting allowances for loan losses, goodwill and intangibles, acquisition related contingent consideration payments and accruals related to self-insurance. These affect the reported amounts of assets and liabilities and disclosures of contingent assets and liabilities as well as the reported amounts of revenue and expenses. In addition, management’s judgment is required in determining the provision for income taxes, deferred tax assets and liabilities and any valuation allowance recorded against deferred tax assets. As a result, our assumptions and provisions may not be sufficient to cover actual losses. If actual losses are greater than our assumptions and provisions, our results of operations or financial condition could be adversely affected.
Further, FASB issued new guidance requiring us to adopt the current expected credit loss (“CECL”) model to evaluate impairment of loans. The CECL approach, effective for us by January 1, 2023, requires evaluation of credit impairment based on an estimate of life of loan losses as opposed to credit impairment based on incurred losses. Our adoption of CECL as of January 1, 2023 will result in an estimated CECL allowance for credit losses of $257 million, causing an increase to the allowance for credit losses of approximately $135 million. Adjusting the CECL allowance for credit losses for changes in economic forecasts and conditions may result in the need for significant and unanticipated changes in our provision for credit losses in the future, which would materially affect our results of operations. If we misinterpret or make inaccurate assumptions under the new guidance, our results of operations or financial condition could also be adversely affected.
Changes in our financial condition or a potential disruption in the capital markets could reduce available capital.
If we do not have sufficient funds from our operations, excess cash or debt agreements, we will be required to rely on banking and credit markets to meet our financial commitments and short-term liquidity needs. We also expect to periodically access debt capital markets to finance the growth of our consumer loans receivable portfolio. Efficient access to such markets, which could be critical for us, may be restricted due to many factors, including deterioration of our earnings, cash flows or balance sheet quality, overall business or industry prospects, adverse regulatory changes, disruption to or deterioration in capital markets, a rising interest rate
environment or a negative bias toward our industry by consumers or market participants. Disruptions and volatility in capital markets may cause banks and other credit providers to restrict availability of new credit. We may also have more limited access to commercial bank lending than other businesses due to the negative bias toward our industry. If adequate funds are not available, or are not available at favorable terms, we may not have sufficient liquidity to fund our operations, make future investments, take advantage of strategic opportunities or respond to competitive challenges, all of which could negatively impact our ability to achieve our strategic plans. Additionally, if the capital and credit markets experience volatility, and the availability of funds is limited, third parties with whom we do business may incur increased costs or business disruption and this could have a material adverse effect on our business relationships with such third parties.
Adverse economic conditions, including those resulting from a recession or recessionary environment or weather-related events or other natural disasters, man-made events or health emergencies, could have an adverse impact on our business or the economy and could cause demand for our loan products to decline or make it more difficult for our customers to make payments on our loans and increase our default rates, which could adversely affect our results of operations or financial condition.
We operate stores across the U.S. and Canada and derive the majority of our revenue from consumer lending. Macroeconomic conditions, such as interest rates, whether the economy is in a recession or recessionary environment, levels of employment, personal income and consumer sentiment, may influence demand for our products. Additionally, weather-related events, power losses, telecommunication failures, terrorist attacks, acts of war, widespread health emergencies (such as COVID-19) and governmental responses thereto, and similar events, may significantly impact our customers’ ability to repay their loans and cause other negative impacts on our business. These conditions may result in us changing the way we operate our business, including tightening credit, waiving certain fees and granting concessions to customers.
Our underwriting standards require our customers to have a steady source of income. Therefore, if unemployment increases among our customer base, the number of loans we originate may decline and defaults could increase. If consumers become more pessimistic regarding the economic outlook and spend less and save more, demand for consumer loans may decline. Accordingly, poor economic conditions could have a material adverse effect on our results of operations or financial condition.
We may be limited in our ability to collect on our loan portfolio, and the security interests securing a significant portion of our loan portfolio are not perfected, which may increase our credit losses.
Legal and practical limitations may limit our ability to collect on our loan portfolio, resulting in increased credit losses, decreased revenues and decreased earnings. State and federal laws and regulations restrict our collection efforts and the amounts that we are able to recover from the repossession and sale of collateral in the event of a customer’s default typically do not fully cover the outstanding loan balance and costs of recovery. A significant portion of our secured loans have not been and will not be perfected, which means that we cannot be certain that such security interests will be given first priority over other creditors. The lack of perfected security interests is one of several factors that may make it more difficult for us to collect on our loan portfolio. Additionally, for those of our loans that are unsecured, borrowers may choose to repay obligations under other indebtedness before repaying loans to us because such borrowers may feel that they have no collateral at risk. In addition, given the relatively small size of our loans, the costs of collecting loans may be high relative to the amount of the loan. As a result, many collection practices that are legally available, such as litigation, may be financially impracticable. These factors may increase our credit losses, which would have a material adverse effect on our results of operations and financial condition.
Goodwill comprises a significant portion of our assets. We assess goodwill for impairment at least annually. If we recognize an impairment, it could have a material adverse effect on our results of operations or financial condition.
We assess goodwill for impairment on an annual basis at the reporting unit level. We assess goodwill between annual tests if an event occurs or circumstances change that would more likely than not reduce the fair value of a reporting unit below its carrying value. Due to macroeconomic conditions and our current earnings outlook, we have determined that it is appropriate to impair the goodwill associated with our U.S. Direct Lending business and Canada POS Lending business, as described in Note 4, "Goodwill and Intangibles."
Our impairment reviews require extensive use of accounting judgment and financial estimates. Application of alternative assumptions and definitions could produce significantly different results. A material impairment of goodwill could adversely affect our results of operations or financial condition. Due to the current economic environment and the uncertainties that future economic consequences will have on our reporting units, we cannot be sure that our estimates and assumptions made for purposes of our annual goodwill impairment test will be accurate predictions of the future. If our assumptions regarding forecasted revenues or margins for our reporting units are not achieved, we may be required to record additional goodwill impairment losses in the future. We cannot determine if any such future impairment will occur, and if it does occur, whether such charge would be material.
Our lending business is somewhat seasonal which causes our revenues to fluctuate and could have a material adverse effect on our ability to service our debt obligations.
Our U.S. business typically experiences reduced demand in the first quarter because of customers’ receipt of tax refund checks. Demand for our U.S. lending services is generally greatest during the third and fourth quarters. This seasonality requires us to manage our cash flows during the year. If a governmental authority pursued economic stimulus actions or issued additional tax refunds or tax credits at other times during the year, such actions could have a material adverse effect on our business, prospects, results of operations or financial condition during those periods. If our revenues fall substantially below expectations during certain periods, our annual results and our ability to service our debt obligations could be materially adversely affected.
Flexiti has substantial merchant partner concentration, with a limited number of merchant partners accounting for a substantial portion of its point-of-sale lending revenues.
Flexiti currently derives a significant portion of its point-of-sale lending originations through a limited number of merchant partners. For the year ended December 31, 2022 and 2021, Flexiti had two merchant partners that accounted for 35% and 18% of its total point-of-sales lending originations, respectively. There are inherent risks whenever a large percentage of revenues are concentrated with a limited number of merchant partners. It is not possible for us to predict the future level of demand for our services that will be generated by these merchant partners or new merchant partners, or the future demand for the products and services of these merchant partners or new merchant partners. If any of these merchant partners experience declining or delayed sales due to market, economic or competitive conditions, we could be pressured to reduce the prices we charge for our products which could have an adverse effect on our margins and financial position and could negatively affect our revenues and results of operations and/or the trading price of our common stock.
Our credit agreements contain covenants which may restrict our flexibility to operate our business. If we do not comply with these covenants, our failure could have a material adverse effect on our results of operations or financial condition.
Our credit agreements contain performance and financial covenants (both at the parent and SPV level) that could adversely affect our business and our flexibility to respond to changing business and economic conditions or opportunities. Among other things, these covenants limit our ability to:
•incur or guarantee additional indebtedness;
•create or incur liens;
•sell assets, including our loan portfolio or the capital stock of our subsidiaries;
•pay dividends or make distributions on our capital stock or make certain other restricted payments;
•make certain investments, including in our subsidiaries; and
•consolidate, merge, sell or other dispose of substantially all of our assets.
In addition, credit facilities for our SPVs contain certain performance covenants on the receivables pledged to each respective facility. If we violate these covenants, our ability to draw under these facilities could be impacted and we may be required to redirect all excess cash to the lenders.
The credit agreements also impose certain obligations on us relating to our underwriting standards, recordkeeping and servicing of our loans and our loss reserves and charge-off policies, and they require us to comply with certain financial ratios, including leverage, equity and interest coverage ratios. If we were to breach any covenants or obligations under our credit agreements and such breaches were to result in an event of default, our lenders could cause all amounts outstanding to become due and payable, subject to applicable grace periods. An event of default in any one credit agreement could also trigger cross-defaults under other existing and future credit agreements and other debt instruments, which in turn could materially and adversely affect our financial condition and ability to continue operating our business as a going concern. Failure to comply with any covenants could have a material adverse effect on our liquidity, results of operation or financial condition if we are unable to access capital when we need it or if we are required to reduce our outstanding indebtedness.
Because we depend on third-party lenders to provide cash needed to fund our loans, an inability to affordably access third-party financing could have a material adverse effect on our business.
Our principal sources of liquidity to fund our customer loans are cash provided by operations and our SPV facilities. We may not be able to secure additional operating capital from third-party lenders or refinance our existing credit facilities on reasonable terms or at all. As the volume of loans that we make to customers increases, we may have to expand our borrowing capacity on our existing SPV facilities or add new sources of capital. If the underlying collateral does not perform as expected, our access to the SPV facilities could be reduced or eliminated. The availability of these financing sources depends on many factors, some of which we cannot control. In the event of a sudden shortage of funds in the banking system or capital markets, we may not be able to maintain necessary levels of funding without incurring high funding costs, suffering a reduction in the term of funding instruments or having to liquidate certain assets. If our cost of borrowing increases or we are unable to arrange new methods of financing on
favorable terms, we may have to curtail our origination of loans, which could have a material adverse effect on our results of operations or financial condition.
We are subject to interest rate risk resulting from general economic conditions and policies of various governmental and regulatory agencies.
Interest rate risk arises from the possibility that changes in interest rates will affect our results of operations and financial condition. Interest rates are highly sensitive to many factors that are beyond our control, including general economic conditions and policies of various governmental and regulatory agencies, in particular, the Federal Reserve Board and Bank of Canada. In response to elevated inflation, the agencies have rapidly increased interest rates since early 2022. The Federal Reserve Board and Bank of Canada have indicated that they may raise rates further if deemed necessary to combat continued inflation growth. Furthermore, market conditions or regulatory restrictions on interest rates we charge may prevent us from passing any increases in interest rates along to our customers. In addition, rising interest rates will increase our cost of capital by influencing the amount of interest we pay on our revolving credit facilities, or any other floating interest rate obligations that we may incur, which would increase our operating costs and decrease our operating margins.
Our use of derivatives exposes us to credit and market risk.
From time to time, we may elect to purchase derivative financial instruments such as interest rate caps, interest rate swaps, collars or similar instruments with the objective of reducing our borrowing cost volatility. By using derivative instruments, we are exposed to credit and market risk, including the risk of loss associated with variations in the spread between the asset yield and the funding and/or hedge cost, default risk and the risk of insolvency or other inability of the counterparty to a particular derivative financial instrument to perform its obligations.
We may be unable to protect our proprietary technology and analytics or keep up with that of our competitors.
The success of our business depends, in part, upon our ability to protect our proprietary technology, which we use for pricing and underwriting loans. We seek to protect our intellectual property with nondisclosure agreements with third parties and employees and through standard measures to protect trade secrets. We also implement cybersecurity policies and procedures to prevent unauthorized access to our systems and technology. However, we may be unable to deter misappropriation of our proprietary information, detect unauthorized use or take appropriate steps to enforce our intellectual property rights. We do not have agreements with all of our employees requiring them to assign to us proprietary rights to technology developed in the scope of employment. Additionally, while we have registered trademarks and pending applications for trademark registration(s), we do not own any patents or copyrights with respect to our intellectual property.
If a competitor learns our trade secrets (especially with regard to our marketing, pricing and risk management capabilities), if a third-party reverse engineers or otherwise uses our proprietary technology, or if an employee makes commercial use of the technology he or she develops for us, our business will be harmed. Pursuing a claim against a third-party or employee for infringement would be costly and our efforts may not be successful. If we are unable to protect our intellectual property, our competitors would have an advantage over us.
Our risk management efforts may not be effective.
We could incur substantial losses and our business operations could be disrupted if we are unable to effectively identify, manage, monitor and mitigate financial risks, such as credit risk, interest rate risk, prepayment risk, liquidity risk and other market-related risks, as well as well as regulatory and operational risks related to our business, assets and liabilities. Our risk management policies, procedures and techniques may not be sufficient to identify all of the risks we are exposed to, mitigate the risks we have identified or identify concentrations of risk or additional risks to which we may become subject in the future.
Our controls and procedures may fail or be circumvented.
Management regularly reviews and updates our internal controls, disclosure controls and procedures and corporate governance policies and procedures. Any system of controls, however well designed and operated, is based in part on certain assumptions and can provide only reasonable, not absolute, assurances that the objectives of the system are met. If we fail to identify and remediate control deficiencies, it is possible that a material misstatement of interim or annual financial statements will not be prevented or detected on a timely basis. In addition, any failure or circumvention of our other controls and procedures or failure to comply with regulations related to controls and procedures could have a material adverse effect on our business, results of operations and financial condition.
If a third party cannot provide us products, services or support, it could disrupt our operations or reduce our revenue.
Some of our lending activity depends on support we receive from third parties that provide services to facilitate lending, loan underwriting and payment processing. We also use third parties to support and maintain certain of our communication and information systems. If our relationship with any of these third parties end and we are unable to replace them or if they do not maintain quality and consistency in their services, we could lose customers which would substantially decrease our revenue and earnings.
Our core operations are dependent upon maintaining relationships with banks and other third-party electronic payment solutions providers. Any inability to manage cash movements through the banking system or the Automated Clearing House (“ACH”) system would materially impact our business.
We maintain relationships with commercial banks and third-party payment processors who provide a variety of treasury management services including depository accounts, transaction processing, merchant card processing, cash management and ACH processing. We rely on commercial banks to receive and clear deposits, provide cash for our store locations, perform wire transfers and ACH transactions and process debit card transactions. We rely on the ACH system to deposit loan proceeds into customer accounts and to electronically withdraw authorized payments from those accounts. The failure or inability of retail banks and/or payment providers to continue to provide services to us could adversely affect our operations.
Improper disclosure of customer personal data could result in liability and harm our reputation. Our costs could increase as we seek to minimize or respond to cybersecurity risks and security breaches.
We store and process large amounts of personally identifiable information, including sensitive customer and employee information. While we believe that we maintain adequate policies and procedures, including antivirus and malware software and access controls, and use appropriate safeguards to protect against attacks, our security controls over personal data and our employee training may not prevent improper disclosure of personally identifiable information. Such disclosure could harm our reputation and subject us to liability, resulting in increased costs or loss of revenue.
We are subject to cybersecurity risks and security breaches which could result in the unauthorized disclosure or appropriation of customer and employee data. We may not be able to implement effective preventive measures against these types of breaches, especially because the techniques change frequently or may not be recognized until launched. We may need to spend significant resources to protect against security breaches or to address problems caused by breaches. Actual or anticipated attacks and risks may increase our expenses, including costs to deploy additional personnel and protection technologies, train employees and engage third-party experts and consultants. Our protective measures also could fail to prevent a cyber-attack and the resulting disclosure or appropriation of customer data. A significant data breach could harm our reputation, diminish customer confidence and subject us to significant legal claims, any of which may have a material adverse effect on us.
A successful penetration of our systems could cause serious negative consequences, including significant disruption of our operations, misappropriation of our or our customers' confidential information or damage to our computers or systems or those of our customers and counterparties, and could result in violations of privacy and other laws, financial loss to us or to our customers, customer dissatisfaction, significant litigation exposure and harm to our reputation, all of which could have a material adverse effect on us. We rely on encryption and authentication technology licensed from third parties to provide the security and authentication to effectively secure transmission of confidential information. The technology we use to protect transaction data may be compromised due to advances in computer capabilities, new discoveries in cryptography or other developments. Data breaches can also occur because of non-technical issues.
Our servers are also vulnerable to computer viruses, physical or electronic break-ins and similar disruptions, including “denial-of-service” type attacks. We may need to expend significant resources to protect against security breaches or to address problems caused by breaches. Security breaches, including any breach of our systems or unauthorized release of consumers’ personal information, could damage our reputation and expose us to litigation and liability.
We share confidential customer information and our own proprietary information with vendors, service providers and business partners who provide products, services or support to us. The information systems of these third parties are also vulnerable to any of the above cyber risks or security breaches, and we may not be able to ensure that these third parties have adequate security controls in place to protect the information that we share with them. If our proprietary or confidential customer information is intercepted, stolen, misused or mishandled while in possession of a third party, it could result in reputational harm to us, loss of customers and suppliers, additional regulatory scrutiny and it could expose us to civil litigation and possible financial liability, any of which could have a material adverse effect on our business, financial condition and liquidity. Although we maintain insurance that is intended to cover certain losses from such events, there can be no assurance that such insurance will be adequate or available.
In addition, federal and some state regulators have implemented, or are considering implementing, rules and standards to address cybersecurity risks and many U.S. states have already enacted laws requiring companies to notify individuals of data security
breaches involving their personal data. These standards and mandatory disclosures are costly to implement and may lead to widespread negative publicity, which may cause customers to lose confidence in the effectiveness of our data security measures.
If the information provided by customers to us is inaccurate, we may misjudge a customer’s qualification to receive a loan, which may adversely affect our results of operations.
A large portion of our underwriting activities and our credit extension decisions are made online. We rely on certain third-party vendors in connection with verifying application data related to loans originated online. Any error or failure by a third-party vendor in verifying the information may cause us to originate loans to borrowers that do not meet our underwriting standards. From time to time in the past, these checks have failed and there is a risk that these checks could also fail in the future. We cannot be certain that every loan is made in accordance with our underwriting standards. Variances in underwriting standards could expose us to greater delinquencies and credit losses than we have historically experienced.
In addition, in deciding whether to extend credit or enter into other transactions with customers, we rely heavily on information provided by customers, counterparties and other third parties, including credit bureaus and data aggregators, and we further rely on representations of customers and counterparties as to the accuracy and completeness of that information. If a significant percentage of our customers were to intentionally or negligently misrepresent any of this information, or provide incomplete information, and our internal processes were to fail to detect such misrepresentations in a timely manner, we could end up approving a loan that, based on our underwriting criteria, we would not have otherwise made. As a result, our earnings and our financial condition could be negatively impacted.
Employee misconduct could harm us by subjecting us to monetary loss, legal liability, regulatory scrutiny and reputational harm.
Our reputation is crucial to maintaining and developing relationships with existing and potential customers and third parties with whom we do business. There is a risk that our employees could engage in misconduct that adversely affects our business. For example, if an employee were to engage—or be accused of engaging—in illegal or suspicious activities, including fraud or theft, we could be subject to regulatory sanctions and suffer significant harm to our reputation, financial condition, customer relationships and ability to attract future customers or employees. Employee misconduct could prompt regulators to allege or to determine, based upon such misconduct, that we have not established adequate supervisory systems and procedures to inform employees of applicable rules or to detect and deter violations of such rules. It is not always possible to deter employee misconduct, and the precautions we take to detect and prevent misconduct may not be effective in all cases. Misconduct by our employees, or even unsubstantiated allegations, could result in a material adverse effect on our reputation and our business.
Risks Relating to Our Industry
The CFPB authority over U.S. consumer lending could have a significant impact on our U.S. business.
The CFPB regulates U.S. consumer financial products and services. The CFPB has regulatory, supervisory and enforcement powers over providers of consumer financial products and services. It also has supervisory authority over certain non-bank providers, such as payday lenders and any non-bank provider that the CFPB determines may pose risk to consumers.
The CFPB has examined our lending products, services and practices, and we expect the CFPB will continue to examine us. CFPB examiners have the authority to require quarterly monitoring, inspect our books and records and probe our business practices, and its examination includes review of marketing activities; loan application and origination activities; payment processing activities and sustained use by consumers; collections, accounts in default and consumer reporting activities as well as third-party relationships. As a result of these examinations of us or other parties, we could be required to change our products, services or practices, or we could be subject to monetary penalties, which could materially adversely affect us. Beginning in the fourth quarter of 2021, we were required to submit certain information regarding our business to the CFPB on a quarterly basis. In November 2022, the CFPB notified us that it had paused its monitoring of us until further notice.
The CFPB also has broad authority to prohibit unfair, deceptive or abusive acts or practices and to investigate and take enforcement action against financial institutions. In addition to assessing financial penalties, the CFPB can require remediation of practices, restitution and rescission or reformation of contracts. Also, if a company has violated Title X of the Dodd-Frank Act or related CFPB regulations, the Dodd-Frank Act empowers state attorneys general and state regulators to bring civil actions to remedy violations. If the CFPB or state attorneys general or state regulators believe that we have violated any laws or regulations, they could exercise their enforcement powers which could have a material adverse effect on our business, prospects, results of operations, financial condition or cash flows.
The CFPB's Final Payday Rule, if implemented in its current form, could negatively affect our U.S. consumer lending business.
Pursuant to its authority to adopt UDAAP rules, the CFPB issued the 2017 and 2020 Final CFPB Rule, which contained payment restrictions, among other things. The repayment provisions applicable to us include those for longer-term loans with (a) annual percentage rates exceeding 36% and (b) lender access to the consumer’s account, whether by ACH, card payment, check or otherwise. The payment provisions generally prohibit lenders from seeking payment, without explicit reauthorization, when two consecutive payments have failed due to insufficient funds and also require a series of prescribed notices for initial payments, “unusual” payments (by amount, payment date or payment modality) and the triggering of limitations and a consumer rights notice after two consecutive failed payment attempts.
The 2017 Final CFPB Rule was originally scheduled to go into effect by August 2019. However, the Community Financial Services Association and the Consumer Service Alliance of Texas (collectively, the “Trade Groups”), brought a lawsuit (the “Texas Lawsuit”) against the CFPB in a federal district court in Texas. The Texas Lawsuit challenged the 2017 Final CFPB Rule and resulted in a court-ordered stay of the Rule.
In August 2021, following the U.S. District Court’s ruling in favor of the CFPB, the Trade Groups filed a Notice of Appeal with the Fifth Circuit and simultaneously filed a motion to stay the effective compliance date, pending the decision on appeal. On October 14, 2021, the Fifth Circuit granted the compliance stay extension.
On October 19, 2022, the Fifth Circuit, handed down a decision invalidating the payment restrictions of the 2017 and later modified 2020 Final CFPB Rule on the basis that the CFPB’s funding mechanism is unconstitutional. Specifically, the Fifth Circuit ruled that the CFPB’s funding structure violates the Constitution because the CFPB does not receive its funding from annual congressional appropriations, but instead receives funding directly from the Federal Reserve based on a request from the CFPB’s director. Thus, while Congress properly authorized the CFPB to promulgate the 2017 and 2020 Final Rule, the CFPB itself did not have the ability to exercise that power via constitutionally appropriated funds. The Fifth Circuit ruled, following this logic, that the appropriate remedy for the resulting harm to the Trade Groups due to this improper use of unappropriated funds in conducting the rulemaking associated with the 2017 and 2020 Final CFPB Rule was to nullify the CFPB’s action. The CFPB has appealed this decision to the Supreme Court, which has agreed to hear oral arguments next term, starting October 2023.
If the payment provisions of the 2017 and 2020 Final CFPB Payday Rule become effective in the current form, we will need to make changes to our payment processes and customer notifications in our U.S. consumer lending business. If we are not able to make all of these changes successfully, the payment provisions of the 2017 and 2020 Final CFPB Payday Rule could have a significant adverse impact on our business, prospects, results of operations, financial condition and cash flows. Refer to Business—Regulatory Environment and Compliance—U.S. Regulations—U.S. Federal Regulations— CFPB Rules."
Our use of third-party vendors is subject to regulatory review.
The CFPB and other regulators have issued regulatory guidance focusing on the need for financial institutions to perform due diligence and ongoing monitoring of third-party vendor relationships, which increases the scope of management involvement and decreases the benefit that we receive from using third-party vendors. Moreover, if our regulators conclude that we have not met the standards for oversight of our third-party vendors, we could be subject to enforcement actions, civil monetary penalties, supervisory orders to cease and desist or other remedial actions, which could have a material adverse effect on our business, reputation, financial condition and results of operations. Further, federal and state regulators have scrutinized the practices of lead aggregators and providers. If regulators place restrictions on certain practices by lead aggregators or providers, our ability to use them as a source for applicants could be affected.
Our industry is highly regulated. Existing and new laws and regulations could have a material adverse effect on our results of operations or financial condition and failure to comply with these laws and regulations could subject us to various fines, civil penalties and other relief.
In the U.S. and Canada, our business is subject to a variety of statutes and regulations enacted at the federal, state, provincial and municipal levels. Accordingly, regulatory requirements, and the actions we must take to comply with regulations, vary considerably by jurisdiction. Managing this complex regulatory environment requires considerable compliance efforts. It is costly to operate in this environment, and it is possible that those costs will increase materially over time. This complexity also increases the risks that we will fail to comply with regulations which could have a material adverse effect on our results of operations or financial condition. These regulations affect our business in many ways, and include regulations relating to:
•the terms of loans (such as interest rates, fees, durations, repayment terms, maximum loan amounts, renewals and extensions and repayment plans) and the number and frequency of loans;
•underwriting requirements;
•collection and servicing activity, including initiation of payments from consumer accounts;
•licensing, reporting and document retention;
•unfair, deceptive and abusive acts and practices and discrimination;
•disclosures, notices, advertising and marketing;
•loans to members of the military and their dependents;
•insurance products and traditional ancillary products;
•requirements governing electronic payments, transactions, signatures and disclosures;
•check cashing;
•money transmission;
•currency and suspicious activity recording and reporting;
•privacy and use of personally identifiable information and consumer data, including credit reports;
•posting of fees and charges; and
•repossession practices in certain jurisdictions where we operate as a title lender.
These regulations affect the entire life cycle of our customer relationships and compliance with the regulations affects our loan volume, revenues, delinquencies and other aspects of our business, including our results of operations. We expect that regulation of our industry will continue and that laws and regulations currently proposed, or other future laws and regulations, will be enacted and will adversely affect our pricing, product mix, compliance costs or other business activities in a way that is detrimental to our results of operations or financial condition.
There are a range of penalties that governmental entities could impose if we fail to comply with the various laws and regulations that apply to us, including:
•ordering corrective actions, including changes to compliance systems, product terms and other business operations;
•imposing fines or other monetary penalties, which could be substantial;
•ordering restitution, damages or other amounts to customers, including multiples of the amounts charged;
•requiring disgorgement of revenues or profits from certain activities;
•imposing cease and desist orders, including orders requiring affirmative relief, targeting specific business activities;
•subjecting our operations to monitoring or additional regulatory examinations during a remediation period;
•revoking licenses required to operate in particular jurisdictions; and/or
•ordering the closure of one or more stores.
Accordingly, if we fail to comply with applicable laws and regulations, it could have a material adverse effect on our results of operations or financial condition.
Our direct lending insurance operations are subject to a number of risks and uncertainties.
Our direct lending customers can either purchase optional insurance products through an unaffiliated insurance company and finance the premiums with their loan from us. Our insurance operations are subject to a number of risks and uncertainties, including changes in laws and regulations, customer demand, claims experience and insurance carrier relationships, the manner in which we can offer such products, capital and reserve requirements, the frequency and type of regulatory monitoring and reporting, benefits or loss ratio requirements, insurance producer and agent licensing or appointment requirements and reinsurance operations. In addition, the credit insurance products that we offer are optional and solely related to the loans we originate. Because we finance substantially all of our customers' insurance premiums, any decrease in demand for credit insurance products would adversely impact our insurance income as well as our interest and fee income. Insurance claims and policyholder liabilities are also difficult to predict and may exceed the related reserves set aside for claims and associated expenses for claims adjudication.
We are also dependent on the continued willingness of unaffiliated third-party insurance companies to participate in the credit insurance market, and we cannot be certain that the credit insurance market will remain viable. Further, if our insurance providers are unable or unwilling to meet claims and premium reimbursement payment obligations or premium ceding obligations, we could be subject to increased net credit losses, regulatory scrutiny, litigation and other losses and expenses. If any of these events, risks,
or uncertainties were to occur, it could have a material adverse effect on our financial condition and results of operations and cash flows.
Our stock price, reputation and financial results could be adversely affected by media and public perception of our credit products.
Consumer advocacy groups and various media outlets continue to criticize alternative financial services providers. These critics often characterize such alternative financial services providers as predatory or abusive toward consumers. If these persons were to criticize the products that we offer, it could negatively impact our relationships with existing borrowers and our ability to attract new borrowers and generate dissatisfaction among our employees.
Litigation, including class actions, and administrative proceedings against us or our industry could have a material adverse effect on our results of operations, cash flows or financial condition.
We have been the subject of administrative proceedings and lawsuits, as well as class actions, in the past, and may be involved in future proceedings, lawsuits or other claims. See Item 1, "Business—Regulatory Environment and Compliance— U.S. Regulations—U.S. and State" and Note 7, “Commitments and Contingencies” for a description of material litigation. Other companies in our industry have also been subject to litigation, class action lawsuits and administrative proceedings regarding the offering of consumer loans and the resolution of those matters could adversely affect our business. We anticipate that lawsuits and enforcement proceedings involving our industry, and potentially involving us, will continue to be brought.
We may incur significant expenses associated with the defense or settlement of lawsuits. The adverse resolution of legal or regulatory proceedings could force us to refund fees and interest collected, refund the principal amount of advances, pay damages or monetary penalties or modify or terminate our operations in particular jurisdictions. The defense of such legal proceedings, even if successful, is expensive and requires significant time and attention from our management. Settlement of proceedings may also result in significant cash payouts, foregoing future revenues and modifications to our operations. Additionally, an adverse judgment or settlement could result in the termination, non-renewal, suspension or denial of a license required for us to do business in a particular jurisdiction (or multiple jurisdictions). A sufficiently serious violation of law in one jurisdiction or with respect to one product could have adverse licensing consequences in other jurisdictions and/or with respect to other products. Thus, legal and enforcement proceedings could have a material adverse effect on our business, future results of operations, financial condition or our ability to service our debt obligations.
Judicial decisions or new legislation could potentially render our arbitration agreements unenforceable.
We include arbitration provisions in certain customer loan agreements in the United States. Arbitration provisions require that disputes with customers be resolved through individual arbitration rather than in court. Thus, our arbitration provisions, if enforced, have the effect of shielding us from class action liability. The effectiveness of arbitration provisions depends on whether courts will enforce these provisions. A number of courts, including the California Supreme Court, have concluded that arbitration agreements with class action waivers are unenforceable, particularly where a small dollar amount is in controversy on an individual basis. If our arbitration provisions are found to be unenforceable, our costs to litigate and settle customer disputes could increase and we could face class action lawsuits, with a potential material adverse effect on our results of operations or financial condition.
Risk Factor Relating to our Investment in Katapult
Our operating results may be adversely affected by our investment in Katapult.
Our fully diluted ownership of Katapult as of December 31, 2022 was 19.5%, assuming full payout of earnout shares, and 18.2% excluding payout of earnout shares. We apply the equity method of accounting to certain shares of common stock and interests that qualify as in-substance common stock. We recognize our share of Katapult's income or losses on a one-quarter lag related to the equity method investment. We cannot provide assurance that our investment will (i) increase or maintain its value, or (ii) that we will not incur losses from the holding of such investments.
General Risk Factors
We may fail to meet our publicly announced guidance or other expectations about our business and future operating results which would cause our stock price to decline.
We may provide guidance about our business and future operating results. In developing this guidance, we make certain assumptions and judgments about our future performance, which are difficult to predict. Furthermore, analysts and investors may develop and publish their own projections of our business, which may form a consensus about our future performance. The
assumptions used or judgments applied to our operations to project future operating and financial results may be inaccurate and could result in a material reduction in the price of our common stock, which we have experienced in the past. Our business results may also vary significantly from our guidance or our analyst’s consensus due to a number of factors which are outside of our control and which could adversely affect our operations and financial results. Furthermore, if we make downward revisions of previously announced guidance, or if our publicly announced guidance of future operating results fails to meet expectations of securities analysts, investors or other interested parties, the price of our common stock could decline.
The market price of our common stock may be volatile.
The stock market is highly volatile. As a result, the market price and trading volume for our stock may also be highly volatile, and investors may experience a decrease in the value of their shares, which may be unrelated to our operating performance or business prospects. Factors that could cause the market price of our common stock to fluctuate significantly include:
•our operating and financial performance and prospects and the performance of competitors;
•our quarterly or annual earnings or those of competitors;
•the size of the public float of our common stock;
•conditions that impact demand for our products and services;
•our ability to accurately forecast our financial results;
•changes in earnings estimates or recommendations by securities or research analysts who track our common stock;
•market and industry perception of our level of success in pursuing our business strategy;
•strategic actions by us or our competitors, such as acquisitions or restructurings;
•changes in laws and regulations;
•changes in accounting standards, policies, guidance, interpretations or principles;
•arrival or departure of members of senior management or other key personnel;
•the number of shares that are publicly traded;
•exclusion of our common stock from certain market indices, which could reduce the ability of certain investment funds to own our common stock and put short-term selling pressure on our common stock;
•sales of common stock by us, our investors or members of our management team;
•potential dilution to our common stock, including the award and vesting of equity awards to our employees under our 2017 Incentive Plan;
•unfavorable or misleading information published by securities or industry analysts;
•factors affecting the industry in which we operate, including competition, innovation, regulation and the economy; and
•changes in general market, economic and political conditions, including those resulting from natural disasters, health emergencies (such as COVID-19), telecommunications failures, cyber-attacks, civil unrest, acts of war, terrorist attacks or other catastrophic events.
Any of these factors may result in large and sudden changes in the trading volume and market price of our common stock and may prevent you from being able to sell your shares at or above the price you paid for them. Following periods of volatility, stockholders may file securities class action lawsuits. Securities class action lawsuits are costly to defend and divert management’s attention and, if adversely determined, could involve substantial damages that may not be covered by insurance.
Our business could suffer as the result of the loss of the services of our senior executives or if we cannot attract and retain talented employees.
We compete with other companies both within and outside of our industry for talented employees. If we cannot recruit, train, develop and retain sufficient numbers of talented employees, we could experience increased turnover, decreased customer satisfaction, operational challenges, low morale, inefficiency or internal control failures. Insufficient numbers of talented employees, particularly IT developers, could also limit our ability to grow and expand our businesses. Labor shortages could also result in higher wages that would increase our labor costs, which could reduce our profits. In addition, the efforts and abilities of our senior executives are important elements of maintaining our competitive position and driving future growth, and the loss of the services of one or more of our senior executives could result in challenges executing our business strategies or other adverse effects on our business. The reduced value of the equity awards we have awarded under our 2017 Incentive Plan could be a factor in causing an individual senior executive to leave the Company.
The original founders of the company ("Founders") own a significant percentage of our outstanding common stock and their interests may conflict with ours or yours in the future.
At March 3, 2023, the Founders owned approximately 41.8% of our outstanding common stock. Two of the Founders are members of our Board of Directors, and one also serves as Chairman of the Board. Accordingly, the Founders collectively can exert control over many aspects of our company, including the election of directors. The Founders interests may not in all cases be aligned with your interests.
Provisions in our charter documents could discourage a takeover that stockholders may consider favorable.
Certain provisions in our governing documents could make a merger, tender offer or proxy contest involving us difficult, even if such events would be beneficial to your interests. Among other things, these provisions:
•permit our Board of Directors to set the number of directors and fill vacancies and newly-created directorships;
•authorize “blank check” preferred stock that our Board of Directors could use to implement a stockholder rights plan;
•provide that our Board of Directors is authorized to amend or repeal any provision of our bylaws;
•restrict the forum for certain litigation against us to Delaware;
•establish advance notice requirements for nominations for election to our Board of Directors or for proposing matters that can be acted upon by stockholders at annual stockholder meetings;
•require that actions to be taken by our stockholders be taken only at an annual or special meeting of our stockholders, and not by written consent; and
•establish certain limitations on convening special stockholder meetings.
These provisions may delay or prevent attempts by our stockholders to replace members of our management by making it more difficult for stockholders to replace members of our Board of Directors. These provisions also may delay, prevent or deter a merger, acquisition, tender offer, proxy contest or other transaction that might otherwise result in our stockholders receiving a premium over the market price for their common stock. We believe these provisions will protect our stockholders from coercive or otherwise unfair takeover tactics by requiring potential acquirers or investors aiming to effect changes in management to negotiate with our Board of Directors and by providing our Board of Directors with more time to assess any proposal. However, such anti-takeover provisions could also depress the price of our common stock by acting to delay or prevent a change in control.
Our amended and restated certificate of incorporation provides that the Court of Chancery of the State of Delaware is the exclusive forum for substantially all disputes between us and our stockholders, which could limit our stockholders’ ability to obtain a favorable judicial forum for disputes with us or our directors, officers or employees.
The choice of forum provision in our amended and restated certificate of incorporation provides that the Court of Chancery of the State of Delaware is the exclusive forum for substantially all disputes with stockholders. This choice of forum provision may limit a stockholder’s ability to bring a claim in a judicial forum that it finds favorable for disputes with us or our directors, officers or other employees and may discourage many types of lawsuits.
ITEM 1B. UNRESOLVED STAFF COMMENTS
None.
ITEM 2. PROPERTIES
As of December 31, 2022, we leased 496 stores in the U.S. and 149 stores in Canada. Our U.S. stores include 390 branches from the acquisition of Heights Finance, which we acquired in December 2021 and 106 branches from the acquisition of First Heritage, which we acquired in July 2022. We lease our principal executive office in Chicago, Illinois. We also lease administrative offices in Wichita, Kansas; Greenville, South Carolina; Toronto, Ontario and Ridgeland, Mississippi. Our centralized collections facilities are in the U.S. and Canada. See Note 11, "Leases" and Note 15, "Related Party Transactions" of the Notes to Consolidated Financial Statements for additional information on our operating leases with real estate entities that are related to us through common ownership.
ITEM 3. LEGAL PROCEEDINGS
Item 4. Mine Safety Disclosures
None.
PART II. FINANCIAL INFORMATION
ITEM 5. MARKET FOR REGISTRANT'S COMMON EQUITY, RELATED STOCKHOLDER MATTERS AND ISSUER PURCHASES OF EQUITY SECURITIES
The principal market for our common stock is the NYSE and our shares of common stock are listed under the symbol "CURO."
As of March 3, 2022, there were approximately 12 holders of record of our common stock. Holders of record do not include an indeterminate number of beneficial holders whose shares are held through brokerage accounts and clearing agencies.
Dividends
Our Board of Directors approved a quarterly dividend program in 2020 for $0.055 per share ($0.22 annualized), which was increased to $0.11 per share in May of 2021 ($0.44 annualized), which was continued on a quarterly basis until the third quarter of 2022. In October 2022, our Board suspended the quarterly dividend program. Our Board has discretion to determine whether to pay dividends in the future based on a variety of factors, including our earnings, cash flow generation, financial condition, results of operations, the terms of our indebtedness and other contractual restrictions, capital requirements, business prospects and other factors the Board may deem relevant.
Issuer Purchases of Equity Securities
In May 2021, our Board of Directors authorized a share repurchase program providing for the repurchase of up to $50.0 million of our common stock. The program commenced in June 2021 and was completed in February 2022. In February 2022, our Board authorized a new share repurchase program for the repurchase of up to $25.0 million of CURO common stock. There were no repurchases under this program as of December 31, 2022.
The following table provides information with respect to repurchases we made of our common stock during the quarter ended December 31, 2022.
| | | | | | | | | | | | | | |
| Period | Total Number of Shares Purchased(1) | Average Price Paid Per Share | Total Number of Shares Purchased as Part of Publicly Announced Plans or Programs | Dollar Value of Shares that may yet be Purchased under the Plans or Programs(2) (in millions) |
| October 2022 | — | | $ | — | | — | | $ | 25.0 | |
| November 2022 | 1,022 | | 3.51 | | — | | 25.0 | |
| December 2022 | 12,537 | | 3.44 | | — | | 25.0 | |
| Total | 13,559 | | $ | 3.45 | | — | | |
| (1) Includes shares withheld from employees as tax payments for shares issued under our stock-based compensation plans. See Note 10, "Share-based compensation" of the 2022 Form 10-K for additional details on our stock-based compensation plans. |
| (2) As of the end of the period. | | | | |
ITEM 6. [RESERVED]
ITEM 7. MANAGEMENT'S DISCUSSION AND ANALYSIS OF FINANCIAL CONDITION AND RESULTS OF OPERATIONS
Components of Our Results of Operations
As a result of the sale of the Legacy U.S. Direct Lending Business on July 8, 2022, the Company no longer guarantees loans originated by third-party lenders through CSO programs. As such, the Company's results of operations discussed below only include the results from the CSO program through July 8, 2022. Refer to Note 14, "Acquisitions and Divestiture" for additional information.
Revenue
The core consumer finance products we offer include Revolving LOC and Installment loans. Interest and fees revenue in our Consolidated Statements of Operations includes interest income, merchant discount revenue (MDR), finance charges and CSO fees. Insurance revenue includes the premiums and commissions we earn on insurance products. Other revenue includes late fees, membership fees and non-sufficient funds fees. Product offerings differ by, and are governed by the laws in each, jurisdiction in which we operate.
Revolving LOC loans are lines of credit without specified maturity dates and include our POS financing products at Flexiti. We record revenue from Revolving LOC loans on a simple-interest basis. Revolving LOC revenues include interest income on outstanding revolving balances and other usage or maintenance fees as permitted by underlying statutes. Accrued interest and fees are included in "Gross loans receivable" in the Consolidated Balance Sheets. Revolving LOC revenues also include MDR, which represents a fee charged to merchant partners to facilitate customer purchases at merchant locations. The fee is recorded as unearned revenue when received and recognized over the expected loan term.
Historically, Installment loans range from unsecured, short-term, small-denomination loans, whereby a customer receives cash in exchange for a post-dated personal check or pre-authorized debit from the customer's bank account, to fixed-term, fully amortizing loans with a fixed payment amount due each period during the term of the loan. With the acquisitions of Heights Finance in December 2021 and First Heritage in July 2022, we now offer long-term large loans to customers. For our short-term, small denomination loans, we recognize revenue on a constant-yield basis ratably over the team of each loan. We defer and recognize unearned fees over the remaining term of the loan at the end of each reporting period. Revenues from these short-term loans represent deferred presentment or other fees as defined by the underlying provincial or national regulations. For our fixed-term, fully amortizing loans, we record revenues on a simple-interest basis. Revenue for fixed-term Installment loans includes interest income from Company-Owned loans, CSO fees and non-sufficient funds or returned-items fees on late or defaulted payments on past-due loans, known as late fees. Late fees comprise approximately 1% of Installment revenues. Accrued interest and fees are included in "Gross loans receivable" in the Consolidated Balance Sheets.
We also offer a number of insurance products, including optional credit protection insurance, life insurance, auto and home insurance, property insurance, check cashing, prepaid cards, demand deposit accounts and money transfer services. We earn miscellaneous fees revenues such as administrative fees, deferral fees, annual membership fees and over limit fees. Heights Finance and First Heritage offer optional insurance products, including credit life, credit accident and health, credit property insurance and credit involuntary unemployment insurance through policies written by unaffiliated third-party insurance companies. Insurance commissions, written in connection with certain loans, are credited to unearned insurance commissions and recognized as income over the life of the related insurance contracts, using a method similar to that used for the recognition of interest income.
Provision for Losses
Credit losses are an inherent part of outstanding loans receivable. We maintain an ALL for gross loans receivable at a level estimated to be adequate to absorb such losses based primarily on our analysis of historical loss rates of products containing similar risk characteristics. The ALL reduces the outstanding gross loans receivables balance in the Consolidated Balance Sheets. The liability for estimated incurred losses related to loans originated by third-party lenders through CSO programs, which we guarantee but do not include in the Consolidated Financial Statements (referred to as "Guaranteed by the Company"), is reported in "Liability for losses on CSO lender-owned consumer loans" in the Consolidated Balance Sheets. Changes in either the allowance or the liability, net of charge-offs and recoveries, are recorded as “Provision for losses” in the Consolidated Statements of Operations.
Operating Expense
Our primary categories of operating expense are as follows:
•Salaries and Benefits—includes salaries and personnel-related costs, including benefits, bonuses and share-based compensation expense.
•Occupancy—includes rent expense on our leased facilities and equipment, utilities, insurance and certain maintenance expenses.
•Advertising—costs are expensed as incurred and include costs associated with attracting, retaining and/or reactivating customers as well as creating brand awareness. We have internal creative, web and print design capabilities and if we outsource these services, it is limited to mass-media production and placement. Advertising expense also includes costs for all marketing activities including paid search, advertising on social networking sites, affiliate programs, direct response television, radio air time and direct mail.
•Direct Operations—includes expenses associated with the direct operations and technology infrastructure related to loan underwriting, collections and processing, and bank service charges and credit scoring charges.
•Depreciation and amortization—includes all store and corporate depreciation and amortization expense.
•Other operating expense—includes expenses such as office expense, security expense, travel and entertainment expenses, certain taxes, legal and professional fees, foreign currency impact to our intercompany balances, gains or losses on foreign currency exchanges, disposals of fixed assets, certain store closure costs and other miscellaneous income and expense amounts.
Other Expense
Our non-operating expenses include the following:
•Interest Expense—includes interest primarily related to our Senior Secured Notes, our SPV facilities and our revolvers, including any unused portion of commitment fees.
•Loss (income) from equity method investment, Gain from equity method investment—includes our share of Katapult's income or loss and a recognized gain from the merger of Katapult and FinServ in 2021. Refer to Item 1, "Business—Company History and Overview" and Note 5, "Fair Value Measurements" of the Notes to the Consolidated Financial Statements for additional details on our equity method investment.
•Goodwill impairment—includes the impairment losses recorded on the U.S. Direct Lending and Canada POS Lending reporting unit in the fourth quarter of 2022. Refer to Note 4, "Goodwill and Intangibles" of the Notes to the Consolidated Financial Statements for additional details.
•Loss on extinguishment of debt— includes costs associated with the extinguishment of debt facilities.
•(Gain) loss on change in fair value of contingent consideration—includes change in contingent consideration payable as part of the Flexiti acquisition in March 2021.
.
Consolidated Revenue by Product and Segment
Beginning in 2022, we report "Interest and fees revenue," "Insurance premiums and commissions" and "Other revenue" in place of our previously reported "Revenue" on our Statements of Operations. Prior period presentations have been revised to conform to the current period presentation.
As a result of the sale of the Legacy U.S. Direct Lending Business on July 8, 2022, the Company no longer guarantees loans originated by third-party lenders through CSO programs. As such, the Company's results of operations discussed below only include the results from the CSO program through July 8, 2022. Refer to Note 14, "Acquisitions and Divestiture" for additional information.
The following table summarizes revenue by product for the period indicated:
| | | | | | | | | | | | | | | | | | | | | | | | | | | | | | | | | | | | | | |
| | For the Year Ended |
| | December 31, 2022 | | December 31, 2021 |
| (in thousands) | | U.S. Direct Lending | Canada Direct Lending | Canada POS Lending | Total | % of Total | | U.S. Direct Lending | Canada Direct Lending | Canada POS Lending | Total | % of Total |
| Revolving LOC | | $ | 57,269 | | $ | 193,212 | | $ | 95,332 | | $ | 345,813 | | 33.7 | % | | $ | 106,302 | | $ | 156,000 | | $ | 32,289 | | $ | 294,591 | | 36.0 | % |
| Installment | | 511,538 | | 48,056 | | — | | 559,594 | | 54.5 | % | | 405,409 | | 43,735 | | — | | 449,144 | | 54.9 | % |
| Total interest and fees revenue | | 568,807 | | 241,268 | | 95,332 | | 905,407 | | 88.3 | % | | 511,711 | | 199,735 | | 32,289 | | 743,735 | | 90.9 | % |
| Insurance premiums and commissions | | 31,594 | | 54,561 | | 2,335 | | 88,490 | | 8.6 | % | | 275 | | 48,714 | | 421 | | 49,410 | | 6.0 | % |
| Other revenue | | 15,321 | | 7,921 | | 8,779 | | 32,021 | | 3.1 | % | | 13,976 | | 8,590 | | 2,132 | | 24,698 | | 3.0 | % |
| Total revenue | | $ | 615,722 | | $ | 303,750 | | $ | 106,446 | | $ | 1,025,918 | | 100.0 | % | | $ | 525,962 | | $ | 257,039 | | $ | 34,842 | | $ | 817,843 | | 100.0 | % |
During the year ended December 31, 2022, total revenue increased $208.1 million, or 25.4%, to $1,025.9 million, compared to the prior-year period, primarily driven by growth in U.S. Direct Lending revenue due to our acquisitions of Heights Finance in December 2021 and First Heritage in July 2022, partially offset by the sale of the Legacy U.S. Direct Lending Business in July 2022, organic growth in Canada Direct Lending and increased revenue in Canada POS Lending related to a full year of consolidated results and significant increases in loan balances at Flexiti, which we acquired in March 2021.
Product Revenue for the Year Ended December 31, 2022
•Revolving LOC
◦Revolving LOC revenue for the year ended December 31, 2022 increased $51.2 million, or 17.4%, compared to the prior-year period, driven by growth and a full year of consolidated results in Canada POS lending of $63.0 million, or 195.2%, and Canada Direct Lending revenue of $37.2 million, or 23.9%, partially offset by the impact of the sale of the Legacy U.S. Direct Lending Business in July 2022.
•Installment
◦Installment revenue for the year ended December 31, 2022 increased $110.5 million, or 24.6%, compared to the prior-year period, primarily due to an increase of $106.1 million in U.S. Direct Lending installment revenue driven by our acquisitions of Heights Finance and First Heritage.
•Insurance premiums and commissions
◦Insurance premiums and commissions for the year ended December 31, 2022 increased $39.1 million, or 79.1%, compared to the prior-year period, primarily due to an increase of $31.3 million in U.S. Direct Lending insurance premiums and commission revenue driven by our acquisitions of Heights Finance and First Heritage. Canada Direct Lending grew $5.8 million, or 12.0%, year over year, due to organic growth in the sale of insurance products to Revolving LOC and Installment loan customers in Canada.
•Other revenue
◦Other revenue for the year ended December 31, 2022 increased $7.3 million, or 29.7%, versus the prior-year period, due to a $6.6 million increase in other revenue for Canada POS Lending as ancillary fees rose in line with overall loan growth.
The following table summarizes revenue by product for the periods indicated:
| | | | | | | | | | | | | | | | | | | | | | | | | | | | | | | | | | | | | | |
| | For the Year Ended |
| | December 31, 2021 | | December 31, 2020 |
| (in thousands) | | U.S. Direct Lending | Canada Direct Lending | Canada POS Lending | Total | % of Total | | U.S. Direct Lending | Canada Direct Lending | Canada POS Lending | Total | % of Total |
| Revolving LOC | | $ | 106,302 | | $ | 156,000 | | $ | 32,289 | | $ | 294,591 | | 36.0 | % | | $ | 134,449 | | $ | 115,053 | | $ | — | | $ | 249,502 | | 29.4 | % |
| Installment | | 405,409 | | 43,735 | | — | | 449,144 | | 54.9 | % | | 489,057 | | 49,628 | | — | | 538,685 | | 63.6 | % |
| Total interest and fees | | 511,711 | | 199,735 | | 32,289 | | 743,735 | | 90.9 | % | | 623,506 | | 164,681 | | — | | 788,187 | | 93.0 | % |
| Insurance premiums and commissions | | 275 | | 48,714 | | 421 | | 49,410 | | 6.0 | % | | — | | 35,553 | | — | | 35,553 | | 4.2 | % |
| Other revenue | | 13,976 | | 8,590 | | 2,132 | | 24,698 | | 3.0 | % | | 15,018 | | 8,638 | | — | | 23,656 | | 66.5 | % |
| Total revenue | | $ | 525,962 | | $ | 257,039 | | $ | 34,842 | | $ | 817,843 | | 100.0 | % | | $ | 638,524 | | $ | 208,872 | | $ | — | | $ | 847,396 | | 100.0 | % |
For a comparison of our results of operations for the years ended December 31, 2021 and 2020, see "Management's Discussion and Analysis of Financial Condition and Results of Operations—Revenue by Product and Segment and Related Loan Portfolio Performance" in Part II Item 7 of our 2021 Form 10-K.
Consolidated Results of Operations
Beginning in 2021, we changed our presentation of operating expenses on our Statements of Operations. We have revised prior period presentations to conform to the current period presentation. Refer to "—Operating Expense" above for a description of expenses included within each operating expense line item.
As a result of the sale of the Legacy U.S. Direct Lending Business on July 8, 2022, the Company no longer guarantees loans originated by third-party lenders through CSO programs. As such, the Company's results of operations discussed below only include the results from the CSO program through July 8, 2022. Refer to Note 14, "Acquisitions and Divestiture" for additional information.
The table below presents our consolidated results of operations. A further discussion of the results of our operating segments is provided under "Segment Analysis" below.
| | | | | | | | | | | | | | | | | | | | | |
| (in thousands) | | | | For the Year Ended December 31, |
| | | | | | 2022 | 2021 | 2020 | | |
| Revenue | | | | | | | | | | | |
| Interest and fees revenue | | | | | | | $ | 905,407 | | $ | 743,735 | | $ | 788,188 | | | |
| Insurance premiums and commissions | | | | | | | 88,490 | | 49,411 | | 35,553 | | | |
| Other revenue | | | | | | | 32,021 | | 24,697 | | 23,655 | | | |
| Total revenue | | | | | | | 1,025,918 | | 817,843 | | $ 847,396 | | | |
| Provision for losses | | | | | | | 400,325 | | 245,668 | | 288,811 | | | |
| Net revenue | | | | | | | 625,593 | | 572,175 | | 558,585 | | | |
| Operating Expenses | | | | | | | | | | | |
| Salaries and benefits | | | | | | | 281,636 | | 237,109 | | 196,817 | | | |
| Occupancy | | | | | | | 59,485 | | 55,559 | | 57,271 | | | |
| Advertising | | | | | | | 32,143 | | 38,762 | | 44,552 | | | |
| Direct operations | | | | | | | 64,128 | | 60,056 | | 46,893 | | | |
| Depreciation and amortization | | | | | | | 36,322 | | 26,955 | | 17,498 | | | |
| Other operating expense | | | | | | | 82,811 | | 68,473 | | 47,048 | | | |
| Total operating expenses | | | | | | | 556,525 | | 486,914 | | 410,079 | | | |
| Other expense (income) | | | | | | | | | | | |
| Interest expense | | | | | | | 185,661 | | 97,334 | | 72,709 | | | |
| Loss (income) from equity method investment | | | | | | | 3,985 | | (3,658) | | — | | | |
| Gain from equity method investment | | | | | | | — | | (135,387) | | (4,546) | | | |
| Goodwill impairment | | | | | | | 145,241 | | — | | — | | | |
| Loss on extinguishment of debt | | | | | | | 4,391 | | 40,206 | | — | | | |
| (Gain) loss on change in fair value of contingent consideration | | | | | | | (7,605) | | 6,209 | | — | | | |
| Gain on sale of business | | | | | | | (68,443) | | — | | — | | | |
| Total other expense (income) | | | | | | | 263,230 | | 4,704 | | 68,163 | | | |
| (Loss) income from continuing operations before income taxes | | | | | | | (194,162) | | 80,557 | | 80,343 | | | |
| (Benefit) provision for income taxes | | | | | | | (8,678) | | 21,223 | | 5,895 | | | |
| Net (loss) income from continuing operations | | | | | | | (185,484) | | 59,334 | | 74,448 | | | |
| Net income from discontinued operations, net of tax | | | | | | | — | | — | | 1,285 | | | |
| Net (loss) income | | | | | | | $ | (185,484) | | $ | 59,334 | | $ | 75,733 | | | |
Comparison of Consolidated Results of Operations for the Years Ended December 31, 2022 and 2021
As a result of the sale of the Legacy U.S. Direct Lending Business on July 8, 2022, the Company no longer guarantees loans originated by third-party lenders through CSO programs. As such, the Company's results of operations discussed below only include the results from the CSO program through July 8, 2022. Refer to Note 14, "Acquisitions and Divestiture" for additional information.
Revenue
For a discussion of revenue, see "—Consolidated Revenue by Product and Segment" above.
Provision for Losses
Provision for losses increased by $154.7 million, or 63.0%, for the year ended December 31, 2022 compared to the prior-year period, primarily driven by:
•Year-over-year loan growth, driven by strong consumer demand, across all loan portfolios compared to the same period in the prior year;
◦Continued orderly credit normalization associated with loan growth as customers returned to pre-COVID-19 payment behaviors resulting in higher NCO rates and past due rates as compared to the prior year when customers received government stimulus payments;
◦Full year of provision for losses for our Heights Finance acquisition of $114.6 million;
◦Full year of provision for loan losses and increased gross loans receivable balance for Canada POS Lending of $45.2 million, an increase of $20.5 million compared to the prior-year period;
◦Partial year of provision for losses for our First Heritage acquisition of $14.5 million; and
◦Decrease in provision for losses compared to the prior-year period for our Legacy U.S. Direct Lending Business divestiture of $53.5 million.
Operating Expenses
Operating expenses for the year ended December 31, 2022 increased $69.6 million, or 14.3%, primarily driven by:
Salaries and benefits. Salaries and benefits expense was $281.6 million for the year ended December 31, 2022, an increase of $44.5 million, or 18.8%, compared to the prior-year period. The increase is largely due to the acquisitions of Heights Finance and First Heritage, and a full year of Canada POS Lending business salaries and benefits, partially offset by the July 2022 divestiture of our Legacy U.S. Direct Lending Business and severance benefits as the result of restructuring initiatives implemented in the fourth quarter of 2022.
Occupancy. Occupancy expense was $59.5 million for the year ended December 31, 2022, an increase of $3.9 million, or 7.1%, compared to the prior-year period. The increase was largely due to the acquisitions of Heights Finance and First Heritage, which represent all U.S. Direct Lending stores, as of December 31, 2022, partially offset by the 160 stores transferred as part of the July 2022 divestiture of our Legacy U.S. Direct Lending Business.
Advertising. Advertising expense was $32.1 million for the year ended December 31, 2022, a decrease of $6.6 million, or 17.1%, compared to the prior-year period. The decrease was primarily due to decreases in advertising spending in the U.S. Direct Lending business due to lower advertising at Heights Finance and First Heritage compared to the Legacy U.S. Direct Lending Business.
Direct operations. Direct operations expense was $64.1 million for the year ended December 31, 2022, an increase of $4.1 million, or 6.8%, compared to the prior-year period. The increase is primarily driven by increased expenses incurred while growing the loan portfolio year over year.
Depreciation and amortization. Depreciation and amortization expense for the year ended December 31, 2022, increased $9.4 million, or 34.8%, compared to the prior-year period, primarily due to amortization expense recorded on Canada POS Lending and acquired intangible asserts related to Heights Finance and First Heritage, offset by decreased depreciation expense related to store fixed assets sold as part of the Legacy U.S. Direct Lending Business divestiture.
Other operating expenses. Other operating expenses were $82.8 million for the year ended December 31, 2022, an increase of $14.3 million, or 20.9%, compared to the prior-year period, primarily driven by costs incurred for the sale of the Legacy U.S. Direct Lending Business and the acquisitions of Heights Finance and First Heritage. Refer to the "—Segment Analysis" below for additional details.
Other Expense
Other expenses for the year ended December 31, 2022 were $263.2 million, an increase of $258.5 million compared to the prior-year period, primarily driven by:
Interest expense. Interest expense for the year ended December 31, 2022, increased $88.3 million, or 90.7%, primarily driven by increased non-recourse ABL borrowing to support organic loan growth and acquired portfolios, Senior Notes issued to fund in part our Heights Finance acquisition and an increase in benchmark rates on variable rate debt.
Equity method investment. During the second quarter of 2021 Katapult became a public company via a SPAC merger, generating a pretax gain of $135.4 million. The Company's share of Katapult earnings and losses was $3.7 million of income for 2021 and $4.0 million of losses for 2022.
Goodwill impairment. We recorded a $107.8 million goodwill impairment in the U.S. Direct Lending reporting unit and a $37.4 million goodwill impairment in the Canada POS Lending reporting unit during the fourth quarter of 2022.
Loss on extinguishment of debt. We recorded a $4.4 million loss on extinguishment of debt for the year ended December 31, 2022 related to the write off of deferred financing costs of debt facilities that we refinanced during 2022. The Loss on extinguishment of debt for the year ended December 31, 2021 of $40.2 million was due to the redemption of the 8.25% Senior Secured Notes.
Gain or loss on change in fair value of contingent consideration. We recorded a $7.6 million gain related to the decrease in fair value of the contingent consideration liability related to the Flexiti acquisition during the year ended December 31, 2022 and a $6.2 million loss related to the increase in the fair value of contingent consideration liability during the year ended December 31, 2021.
Gain on sale of business. We recorded a gain on sale of our Legacy U.S. Direct Lending Business of $68.4 million that occurred in July 2022.
Provision for Income Taxes
The effective income tax rate for the year ended December 31, 2022 was 4.5%. The income tax benefit recognized as a result of being in a pre-tax loss position was lower than the blended federal and state/provincial statutory rate of approximately 26%, primarily as a result of lost tax benefits related to the divestiture of the Legacy U.S. Direct Lending Business of $11.1 million, share-based compensation of $0.2 million, officers’ compensation of $1.5 million, non-deductible transaction costs of $0.2 million and non-deductible goodwill impairment of $26.9 million, partially offset by tax benefits related to change in fair value of contingent consideration of $2.1 million. The effective income tax rate of adjusted tax expense included in Adjusted Net Income for the year ended December 31, 2022 was 22.1%.
The effective income tax rate for the year ended December 31, 2021 was 26.3%, consistent with the blended federal and state/provincial statutory rate of approximately 26%. The income tax expense includes nondeductible expense items related to the change in fair value of contingent consideration of $1.6 million and nondeductible transaction costs of $1.2 million, partially offset by proportionally more net income in lower-tax rate jurisdictions, driven by the gain on the Katapult transaction of $146.9 million in the second quarter of 2021 and the loss on extinguishment of debt of $40.2 million in the third quarter of 2021. Additionally, income tax expense includes the release of a valuation allowance of $0.4 million due to our share of Katapult's income, tax benefits related to share-based compensation of $0.8 million, $0.2 million tax expense of additional Texas accrual for 2020 due to the settlement of 2013 to 2019 Texas returns and a tax benefit of $0.9 million for the recognition of research and development tax credit.
Comparison of Consolidated Results of Operations for the Years Ended December 31, 2021 and 2020
For a comparison of our results of operations for the years ended December 31, 2021 and 2020, see "Management's Discussion and Analysis of Financial Condition and Results of Operations—Consolidated Results of Operations" in Part II Item 7 of our 2021 Form 10-K.
Segment Analysis
The following is a summary of portfolio performance and results of operations for the segment and period indicated. We report financial results for three reportable segments: U.S.Direct Lending, Canada Direct Lending and Canada POS Lending.
U.S. Direct Lending Portfolio Performance | | | | | | | | | | | | | | | | | | | | | | | | | | | | |
| (in thousands, except percentages, unaudited) | | Q4 2022 | Q3 2022 | Q2 2022(2) | Q1 2022 | | Q4 2021(1) | | | | | |
| Gross loans receivable | | | | | | | | | | | | |
| Revolving LOC | | $ | — | $ | — | $ | 58,471 | $ | 49,077 | | $ | 52,532 | | | | | |
| Installment loans | | 773,380 | 739,100 | 627,651 | 589,652 | | 137,782 | | | | | |
Total gross loans receivable (3) | | $ | 773,380 | $ | 739,100 | $ | 686,122 | $ | 638,729 | | $ | 190,314 | | | | | |
| | | | | | | | | | | | |
| Lending Revenue: | | | | | | | | | | | | |
| Revolving LOC | | $ | — | $ | 2,210 | $ | 28,145 | $ | 26,913 | | $ | 27,911 | | | | | |
Installment loans (4) | | 88,001 | 90,834 | 169,878 | 162,824 | | 104,168 | | | | | |
| Total lending revenue | | $ | 88,001 | $ | 93,044 | $ | 198,023 | $ | 189,737 | | $ | 132,079 | | | | | |
| | | | | | | | | | | | |
| Lending Provision: | | | | | | | | | | | | |
| Revolving LOC | | $ | — | $ | — | $ | 11,831 | $ | 9,577 | | $ | 11,592 | | | | | |
Installment loans (5) | | 42,523 | 29,045 | 83,181 | 54,711 | | 44,585 | | | | | |
| Total lending provision | | $ | 42,523 | $ | 29,045 | $ | 95,012 | $ | 64,288 | | $ | 56,177 | | | | | |
| | | | | | | | | | | | |
NCOs (6) | | | | | | | | | | | | |
| Revolving LOC | | $ | — | $ | 1,140 | $ | 10,248 | $ | 10,055 | | $ | 11,481 | | | | | |
| | | | | | | | | | | | | | | | | | | | | | | | | | | | |
| (in thousands, except percentages, unaudited) | | Q4 2022 | Q3 2022 | Q2 2022(2) | Q1 2022 | | Q4 2021(1) | | | | | |
Installment loans (7) | | 34,664 | 27,311 | 68,152 | 57,739 | | 45,729 | | | | | |
| Total NCOs | | $ | 34,664 | $ | 28,451 | $ | 78,400 | $ | 67,794 | | $ | 57,210 | | | | | |
| | | | | | | | | | | | |
NCO rate (annualized) (6) (8) | | | | | | | | | | | | |
| Revolving LOC | | —% | 15.6% | 76.4% | 79.2% | | 88.4% | | | | | |
| Installment loans | | 18.4% | 16.0% | 44.8% | 63.6% | | 132.8% | | | | | |
Total NCO rate (9) | | 18.4% | 15.6% | 44.0% | 58.8% | | 97.6% | | | | | |
| | | | | | | | | | | | |
ALL rate (10) | | | | | | | | | | | | |
| Revolving LOC | | — | % | — | % | 25.1% | 26.7% | | 25.9% | | | | | |
| Installment loans | | 5.2 | % | 4.4 | % | 8.1% | 5.4% | | 17.7% | | | | | |
Total ALL rate (11) | | 5.2 | % | 4.4 | % | 8.9% | 6.6% | | 16.0% | | | | | |
| | | | | | | | | | | | |
31+ days past-due rate (10) | | | | | | | | | | | | |
| Revolving LOC | | — | % | — | % | 17.4% | 19.1% | | 19.2% | | | | | |
| Installment loans | | 9.9 | % | 10.5 | % | 20.5% | 19.0% | | 19.0% | | | | | |
Total past-due rate(12) | | 9.9 | % | 10.5 | % | 10.1% | 10.0% | | 9.7% | | | | | |
| | | | | | | | | | | | |
| | | | | | | | | | | | |
| | | | | | | | | | | | | | | | | | | | | | | | | | | | | | | | | | | | | | |
(1) On December 27, 2021, we acquired Heights Finance, which accounted for approximately $472 million of U.S. Direct Lending Installment loans as of December 31, 2021. As the period between December 27, 2021 and December 31, 2021 did not result in material loan performance, we have excluded Heights Finance from the table for the fourth quarter of 2021. |
| (2) Includes loan balances and activity classified as Held for Sale. |
| (3)Total combined gross loans receivable including receivables from installment loans originated by third-party lenders through CSO programs and guaranteed by the Company were $737.4 million,$683.1 million and $236.6 million as of June 30, 2022, March 31, 2022 and December 31, 2021, respectively, including installment loans – guaranteed by the Company of $51.3 million, $44.4 million and $46.3 million as of June 30, 2022, March 31, 2022 and December 31, 2021, respectively. All balances in connection with the CSO programs were disposed of on July 8, 2022 upon closing of the divestiture of the Legacy U.S. Direct Lending business. Total Gross Combined Loans Receivable and installment loans – guaranteed by the Company are non-GAAP measures. For a description of each non-GAAP metric, see "Non-GAAP Financial Measures.” |
| (4) Includes lending revenue from installment loans originated by third-party lenders through CSO programs and guaranteed by the Company of $3.9 million,$48.3 million, $49.0 million and $47.3 million for the three months ended September 30, 2022, June 30, 2022, March 31, 2022 and December 31, 2021, respectively. All balances in connection with the CSO programs were disposed of on July 8, 2022 upon closing of the divestiture of the Legacy U.S. Direct Lending Business. |
| (5) Includes provision from installment loans originated by third-party lenders through CSO programs and guaranteed by the Company of $28.3 million, $21.7 million and $26.0 million for the three months ended June 30, 2022, March 31, 2022 and December 31, 2021, respectively. All balances in connection with the CSO programs were disposed of on July 8, 2022 upon closing of the divestiture of the Legacy U.S. Direct Lending Business. |
| (6) NCOs presented above include $0.0 million, $0.5 million, $10.3 million and $5.0 million, for the three months ended December 31, 2022, September 30, 2022, June 30, 2022 and March 31, 2022, respectively, related to the purchase accounting fair value discount, which are excluded from provision. |
| (7) Total NCOs included NCOs for installment loans originated by third-party lenders through CSO programs and guaranteed by the Company of $1.6 million, $27.4 million, $21.5 million and $26.07 million for the three months ended September 30, 2022, June 30, 2022, March 31, 2022 and December 31, 2021, respectively. All balances in connection with the CSO programs were disposed of on July 8, 2022 upon closing of the divestiture of the Legacy U.S. Direct Lending Business. |
| (8) We calculate NCO rate as total quarterly NCOs divided by Average gross loans receivable, then we annualize the rate. The amount and timing of recoveries are impacted by our collection strategies, which are based on customer behavior and risk profile and include direct customer communications and the periodic sale of charged off loans. |
| (9) Total NCO rate included the NCO rate for installment loans originated by third-party lenders through CSO programs and guaranteed by the Company was 24.8%, 228.8%, 189.6% and 232.4% for the three months ended September 30, 2022, June 30, 2022, March 31, 2022 and December 31, 2021, respectively. All balances in connection with the CSO programs were disposed of on July 8, 2022 upon closing of the divestiture of the Legacy U.S. Direct Lending Business. |
(10) We calculate (i) Allowance for loan losses (ALL) rate and (ii) past-due rate as the respective totals divided by gross loans receivable at each respective quarter end. |
| (11)Total CSO liability for losses for installment loans originated by third-party lenders through CSO programs and guaranteed by the Company was 0%, 15.7%, 16.1% and 14.9% for the three months ended September 30, 2022, June 30, 2022, March 31, 2022 and December 31, 2021, respectively. All balances in connection with the CSO programs were disposed of on July 8, 2022 upon closing of the divestiture of the Legacy U.S. Direct Lending business. Total U.S. Direct Lending ALL and CSO liability for losses rate was 8.9%, 6.6% and 16.0% for the three months ended June 30, 2022, March 31, 2022 and December 31, 2021, respectively. |
| (12) Total past-due rate included the past-due rate for installment loans originated by third-party lenders through CSO programs and guaranteed by the Company was 2.6%, 4.5% and 3.1% for the three months ended June 30, 2022, March 31, 2022 and December 31, 2021, respectively. All balances in connection with the CSO programs were disposed of on July 8, 2022 upon closing of the divestiture of the Legacy U.S. Direct Lending Business. |
| | | | | | | | | | | | |
| | | | | | | | | | | | |
Following is a summary of results of operations for the U.S. Direct Lending segment for the periods indicated.
| | | | | | | | | | | | | | | | | | |
| | | For the Year Ended December 31, |
| (dollars in thousands, unaudited) | | | | | | 2022 | 2021 | 2020 | | |
| Revenue | | | | | | | | | | |
| Interest and fees revenue | | | | | | $ | 568,807 | | $ | 511,711 | | $ | 623,507 | | | |
| Insurance premiums and commissions | | | | | | 31,594 | | 275 | | — | | | |
| Other revenue | | | | | | 15,321 | | 13,976 | | 15,017 | | | |
| Total revenue | | | | | | 615,722 | | 525,962 | | $ 638,524 | | | |
| Provision for losses | | | | | | 240,578 | | 166,033 | | 230,164 | | | |
| Net revenue | | | | | | 375,144 | | 359,929 | | 408,360 | | | |
| Operating Expenses | | | | | | | | | | |
| Salaries and benefits | | | | | | 200,930 | | 170,508 | | 151,344 | | | |
| Occupancy | | | | | | 36,000 | | 32,565 | | 35,814 | | | |
| Advertising | | | | | | 27,038 | | 33,223 | | 40,702 | | | |
| Direct operations | | | | | | 38,306 | | 35,899 | | 39,112 | | | |
| Depreciation and amortization | | | | | | 18,094 | | 12,005 | | 12,992 | | | |
| Other operating expenses | | | | | | 63,076 | | 54,508 | | 35,357 | | | |
| Total operating expenses | | | | | | 383,444 | | 338,708 | | 315,321 | | | |
| Other expense (income) | | | | | | | | | | |
| Interest expense | | | | | | 119,955 | | 72,543 | | 63,413 | | | |
| Loss (income) from equity method investment | | | | | | 3,985 | | (3,658) | | (4,546) | | | |
| Gain from equity method investment | | | | | | — | | (135,387) | | — | | | |
| Goodwill impairment | | | | | | 107,827 | | — | | — | | | |
| Loss on extinguishment of debt | | | | | | 3,726 | | 40,206 | | — | | | |
| Gain on disposal of business | | | | | | (68,443) | | — | | — | | | |
| Total other expense (income) | | | | | | 167,050 | | (26,296) | | 58,867 | | | |
| Segment (loss) income before income taxes | | | | | | $ | (175,350) | | $ | 47,517 | | $ | 34,172 | | | |
U.S. Direct Lending Segment Results - For the Years Ended December 31, 2022 and 2021
Total Revenue. Total revenue increased $89.8 million, or 17.1%, compared to the prior-year period for the year ended December 31, 2022, primarily as a result of the acquisitions of Heights Finance in December 2021 and First Heritage in July 2022 and increases in revenue earned in 2022 by the Legacy U.S. Direct Lending Business prior to its divestiture in July 2022. Installment loan balances as of December 31, 2022 increased $635.6 million, or 461.3%, as a result of our acquisitions and divestiture. Following the sale of the Legacy U.S. Direct Lending Business, we no longer offer Revolving LOC loan products in the U.S. or guarantee loans originated by third party lenders through CSO programs.
Provision for Losses. The provision for losses increased $74.5 million, or 44.9%, for the year ended December 31, 2022, compared to the prior-year period, primarily as a result of the increase in U.S. Installment loan balances. Heights Finance and First Heritage offer higher balance, lower yield products that have lower charge off rates and delinquency rates compared to the Legacy U.S. Direct Lending Business. Total NCO rates (annualized) decreased 7,920 bps, or 81.1%, year over year and increased 280 bps, or 17.9%, sequentially due to the change in the composition of the U.S. Direct Lending business following the acquisitions and divestiture.
Operating Expenses. Operating expenses for the year ended December 31, 2022 were $383.4 million, an increase of $44.7 million, or 13.2%, compared to $338.7 million for the year ended December 31, 2021, primarily driven by the Salaries and benefits expense associated with a full year of consolidated Heights Finance results and partial year of First Heritage, partially offset by the divestiture of the Legacy U.S. Direct lending Business in July 2022. The Company experienced an increase in Depreciation and amortization expense of $6.1 million related to the amortization of intangible assets capitalized as part of the acquisitions of Heights Finance and First Heritage. Other operating expense increased by $8.6 million primarily due to costs incurred in the divestiture of the Legacy U.S. Direct Lending Business and the acquisition of First Heritage during 2022. These increases are partially offset by the $6.2 million decrease in Advertising expense which was primarily due to recurring advertising spending being higher on the Legacy U.S. Direct Lending Business as compared to the Heights Finance and First Heritage businesses.
Interest expense. Interest expense for the year ended December 31, 2022 increased $47.4 million, or 65.4%, compared to the prior-year period, primarily driven by (i) increased non-recourse ABL borrowing to support organic loan growth and acquired loans, including the new $225 million non-recourse revolving warehouse facility to finance future loans originated by First Heritage and the new $425 million non-recourse revolving warehouse facility to replace our incumbent lender and finance future loans originated by Heights Finance, (ii) Senior Notes issued to fund in part our Heights Finance acquisition and (iii) an increase in benchmark rates on variable rate debt.
Equity method investment. We recorded a loss of $4.0 million for the year ended December 31, 2022 for our share of Katapult's loss. As of December 31, 2022, we own 19.5% of Katapult on a fully diluted basis (assuming full pay-out of earn-out shares), or 18.2% (excluding pay-out of earn-out shares). During the second quarter of 2021, Katapult became a public company via a SPAC merger, generating a pretax gain of $135.4 million in the year ended December 31, 2021.
Goodwill impairment. On October 1, 2022, management determined the estimated fair value of the U.S. Direct lending reporting unit did not exceed its carrying value. A two step analysis was performed to determine the amount of impairment for the U.S. Direct Lending reporting unit. The goodwill impairment charge unit was driven by rising interest rates, macroeconomic conditions and performance of recent acquisitions. As such, we recorded a pre-tax goodwill impairment charge of $107.8 million for the U.S. Direct Lending Reporting Unit.
Loss on extinguishment of debt. We recorded a $3.7 million loss on extinguishment of debt for the year ended December 31, 2022 related to the write off of deferred financing costs of debt facilities that we refinanced during 2022, as discussed in "—Interest expense" above. The Loss on extinguishment of debt for the year ended December 31, 2021 of $40.2 million was due to the redemption of the 8.25% Senior Secured Notes.
Gain on sale of business. We recorded a gain on sale of our Legacy U.S. Direct Lending Business of $68.4 million that occurred in July 2022.
Comparison of U.S. Direct Lending Segment Results of Operations for the Years Ended December 31, 2021 and 2020
For a comparison of our U.S. Direct Lending segment results of operations for the years ended December 31, 2021 and 2020, see "Management's Discussion and Analysis of Financial Condition and Results of Operations—Segment Analysis" in Part II Item 7 of our 2021 Form 10-K.
Canada Direct Lending Portfolio Performance | | | | | | | | | | | | | | | | | | | | | | | | | | | | |
| (in thousands, except percentages, unaudited) | | Q4 2022 | Q3 2022 | Q2 2022 | Q1 2022 | | Q4 2021 | | | | | |
| Gross loans receivable: | | | | | | | | | | | | |
| Revolving LOC | | $ | 451,077 | $ | 439,117 | $ | 442,738 | $ | 424,485 | | $ | 402,405 | | | | | |
| Installment loans | | 29,938 | 25,941 | 24,817 | 23,578 | | 24,792 | | | | | |
| Total gross loans receivable | | $ | 481,015 | $ | 465,058 | $ | 467,555 | $ | 448,063 | | $ | 427,197 | | | | | |
| | | | | | | | | | | | |
| Lending Revenue: | | | | | | | | | | | | |
| Revolving LOC | | $ | 49,915 | $ | 50,251 | $ | 47,591 | $ | 45,455 | | $ | 43,943 | | | | | |
| Installment loans | | 12,434 | 12,645 | 11,868 | 11,109 | | 11,416 | | | | | |
| Total lending revenue | | $ | 62,349 | $ | 62,896 | $ | 59,459 | $ | 56,564 | | $ | 55,359 | | | | | |
| | | | | | | | | | | | |
| Lending Provision: | | | | | | | | | | | | |
| Revolving LOC | | $ | 29,620 | $ | 28,408 | $ | 22,641 | $ | 19,156 | | $ | 20,080 | | | | | |
| Installment loans | | 3,919 | 4,466 | 3,303 | 2,723 | | 2,945 | | | | | |
| Total lending provision | | $ | 33,539 | $ | 32,874 | $ | 25,944 | $ | 21,879 | | $ | 23,025 | | | | | |
| | | | | | | | | | | | |
| | | | | | | | | | | | |
| | | | | | | | | | | | |
| | | | | | | | | | | | |
| | | | | | | | | | | | |
| | | | | | | | | | | | |
| NCOs | | | | | | | | | | | | |
| Revolving LOC | | $ | 26,715 | $ | 23,652 | $ | 20,160 | $ | 21,590 | | $ | 15,112 | | | | | |
| Installment loans | | 3,504 | 4,061 | 2,904 | 2,647 | | 2,758 | | | | | |
| Total NCOs | | $ | 30,219 | $ | 27,713 | $ | 23,064 | $ | 24,237 | | $ | 17,870 | | | | | |
| | | | | | | | | | | | |
NCO rate (annualized) (1) | | | | | | | | | | | | |
| Revolving LOC | | 24.0 | % | 21.6% | 18.4% | 20.8% | | 3.9% | | | | | |
| Installment loans | | 50.0 | % | 64.0% | 48.0% | 43.6% | | 11.2% | | | | | |
| Total NCO rate | | 25.6 | % | 23.6% | 20.0% | 22.0% | | 4.4% | | | | | |
| | | | | | | | | | | | |
| | | | | | | | | | | | |
| | | | | | | | | | | | |
| | | | | | | | | | | | |
| | | | | | | | | | | | |
| | | | | | | | | | | | |
ALL rate (2) | | | | | | | | | | | | |
| Revolving LOC | | 8.4 | % | 7.9 | % | 7.2 | % | 7.2 | % | | 8.0 | % | | | | | |
| Installment loans | | 10.4 | % | 10.3 | % | 9.7 | % | 8.8 | % | | 8.0 | % | | | | | |
| Total ALL rate | | 8.5 | % | 8.0 | % | 7.4 | % | 7.3 | % | | 8.0 | % | | | | | |
| | | | | | | | | | | | |
31+ days past-due rate (2) | | | | | | | | | | | | |
| Revolving LOC | | 4.1 | % | 5.1 | % | 4.2 | % | 4.3 | % | | 3.2 | % | | | | | |
| Installment loans | | 1.9 | % | 1.0 | % | 0.8 | % | 1.0 | % | | 0.9 | % | | | | | |
| Total past-due rate | | 4.0 | % | 4.8 | % | 4.0 | % | 4.1 | % | | 3.1 | % | | | | | |
| | | | | | | | | | | | |
| | | | | | | | | | | | |
| | | | | | | | | | | | |
| | | | | | | | | | | | |
| | | | | | | | | | | | |
| | | | | | | | | | | | |
| | | | | | | | | | | | |
| | | | | | | | | | | | |
| (1) We calculate NCO rate as total quarterly NCOs divided by Average gross loans receivable; then we annualize the rate. The amount and timing of recoveries are impacted by our collection strategies, which are based on customer behavior and risk profile and include direct customer communications and the periodic sale of charged off loans. |
| (2) We calculate ALL rate and past-due rate as the respective totals divided by gross loans receivable at each respective quarter end. |
|
|
Canada Direct Lending Results of Operations
| | | | | | | | | | | | | | | | | | |
| | | For the Year Ended December 31, |
| (dollars in thousands, unaudited) | | | | | | 2022 | 2021 | 2020 | | |
| Revenue | | | | | | | | | | |
| Interest and Fees Revenue | | | | | | $ | 241,268 | | $ | 199,735 | | $ | 164,681 | | | |
| Insurance Premiums and Commissions | | | | | | 54,561 | | 48,714 | | 35,553 | | | |
| Other Revenue | | | | | | 7,921 | | 8,590 | | 8,638 | | | |
| Total Revenue | | | | | | 303,750 | | 257,039 | | $ 208,872 | | | |
| Provision for Losses | | | | | | 114,567 | | 54,997 | | 58,647 | | | |
| Net Revenue | | | | | | 189,183 | | 202,042 | | 150,225 | | | |
| Operating expenses | | | | | | | | | | |
| Salaries and Benefits | | | | | | 55,340 | | 52,118 | | 45,473 | | | |
| Occupancy | | | | | | 22,228 | | 22,482 | | 21,457 | | | |
| Advertising Expense | | | | | | 3,686 | | 4,267 | | 3,850 | | | |
| Direct Operations | | | | | | 11,053 | | 9,777 | | 7,781 | | | |
| Amortization and Depreciation | | | | | | 4,305 | | 4,505 | | 4,506 | | | |
| Other operating expenses | | | | | | 16,343 | | 10,364 | | 11,691 | | | |
| Total operating expenses | | | | | | 112,955 | | 103,513 | | 94,758 | | | |
| Other expense (income) | | | | | | | | | | |
| Interest Expense | | | | | | 25,065 | | 9,798 | | 9,296 | | | |
| Other Expense/Income | | | | | | 25,065 | | 9,798 | | 9,296 | | | |
| Segment income before income taxes | | | | | | $ | 51,163 | | $ | 88,731 | | $ | 46,171 | | | |
Canada Direct Lending Segment Results - For the Year Ended December 31, 2022 and 2021
Total Revenue. Canada Direct Lending total revenue increased $46.7 million, or 18.2%, ($58.6 million, or 22.8%, on a constant currency basis) compared to the prior-year period for the year ended December 31, 2022, primarily due to the organic growth of Revolving LOC and Installment loans in Canada. Gross loans receivable increased $53.8 million, or 12.6%, ($85.3 million, or 20.0%, on a constant currency basis) year over year.
Provision for Losses. The provision for losses increased $59.6 million, or 108.3%, ( $64.5 million, or 117.2%, on a constant currency basis) for the year ended December 31, 2022, compared to the prior-year period. The increase in provision for losses was primarily driven by (i) normalized provisioning on strong year-over-year loan growth as customer behavior returned to pre-COVID-19 levels, (ii) orderly credit normalization to higher NCO and past-due rates as COVID-19 impacts lessened compared to the same period in the prior year, and (iii) continued shift in online originations which have inherently more credit risk versus in-store originations. Fourth quarter NCO rates (annualized) increased 800 bps, or 45.5%, year over year and increased 200 bps, 8.5%, sequentially. Total past-due rates increased 90 bps year over year and decreased 87 bps sequentially.
Operating Expenses. Operating expenses were $113.0 million for the year ended December 31, 2022, an increase of $9.4 million, or 9.1%, ($13.9 million, or 13.5%, on a constant currency basis), compared to the prior-year period. The increase is primarily due to a $6.0 million ($6.9 million on a constant currency basis) increase in other operating expenses related to higher variable costs, largely collection and financial service fees, on higher volume.
Interest expense. Interest expense for the year ended December 31, 2022 was $25.1 million, compared to $9.8 million for the year ended December 31, 2021, due to increased non-recourse asset-backed lending borrowing from the Canada SPV facility to support organic loan growth and an increase in benchmark rates on variable rate debt.
Comparison of Canada Direct Lending Segment Results of Operations for the Years Ended December 31, 2021 and 2020
For a comparison of our Canada Direct Lending segment results of operations for the years ended December 31, 2021 and 2020, see "Management's Discussion and Analysis of Financial Condition and Results of Operations—Segment Analysis" in Part II Item 7 of our 2021 Form 10-K.
Canada POS Lending Portfolio Performance
| | | | | | | | | | | | | | | | | | | | | | | | | | | | |
| (in thousands, except percentages, unaudited) | | Q4 2022 | Q3 2022 | Q2 2022 | Q1 2022 | | Q4 2021 | | | | | |
| Revolving LOC | | | | | | | | | | | | |
| Total gross loans receivable | | $ | 833,438 | $ | 690,270 | $ | 627,163 | $ | 541,776 | | $ | 459,176 | | | | | |
| | | | | | | | | | | | |
| | | | | | | | | | | | |
| Total lending revenue | | $ | 31,255 | $ | 24,575 | $ | 20,846 | $ | 18,655 | | $ | 13,704 | | | | | |
| | | | | | | | | | | | |
| | | | | | | | | | | | |
| Total lending provision | | $ | 17,125 | $ | 13,379 | $ | 5,963 | $ | 8,714 | | $ | 12,511 | | | | | |
| | | | | | | | | | | | |
| | | | | | | | | | | | |
| | | | | | | | | | | | |
| | | | | | | | | | | | |
| | | | | | | | | | | | |
NCOs (1) | | $ | 8,672 | $ | 6,114 | $ | 3,537 | $ | 2,727 | | $ | 1,731 | | | | | |
| | | | | | | | | | | | |
| | | | | | | | | | | | |
NCO rate (annualized) (1)(2) | | 4.4 | % | 3.6 | % | 2.4 | % | 2.0 | % | | 2.0 | % | | | | | |
| | | | | | | | | | | | |
| | | | | | | | | | | | |
| | | | | | | | | | | | |
| | | | | | | | | | | | |
| | | | | | | | | | | | |
ALL rate (3) | | 4.9 | % | 4.8 | % | 4.5 | % | 5.1 | % | | 4.8 | % | | | | | |
| | | | | | | | | | | | |
| | | | | | | | | | | | |
31+ days past-due rate (3) | | 2.9 | % | 3.6 | % | 2.8 | % | 1.8 | % | | 1.5 | % | | | | | |
| | | | | | | | | | | | |
| | | | | | | | | | | | |
| | | | | | | | | | | | |
| | | | | | | | | | | | |
| | | | | | | | | | | | |
| | | | | | | | | | | | |
| | | | | | | | | | | | |
| | | | | | | | | | | | |
(1) NCOs presented above include $0.8 million for the three months ended December 31, 2021 of NCOs related to the purchase accounting fair value discount, which are excluded from provision. |
| (2) We calculate NCO rate as total quarterly NCOs divided by Average gross loans receivable then we annualized the rate. The amount and timing of recoveries are impacted by our collection strategies, which are based on customer behavior and risk profile and include direct customer communications and the periodic sale of charged off loans. |
| (3) We calculate ALL rate and past-due rate as the respective totals divided by gross loans receivable at each respective quarter end. |
Canada POS Lending Results of Operations
| | | | | | | | | | | | | | | |
| | | For the Year Ended December 31, |
| (dollars in thousands, unaudited) | | | | | | 2022 | 2021(1) | | |
| Revenue | | | | | | | | | |
| Interest and fees revenue | | | | | | $ | 95,332 | | $ | 32,289 | | | |
| Insurance premiums and commissions | | | | | | 2,335 | | 421 | | | |
| Other revenue | | | | | | 8,779 | | 2,132 | | | |
| Total revenue | | | | | | 106,446 | | 34,842 | | | |
| Provision for losses | | | | | | 45,180 | | 24,638 | | | |
| Net revenue | | | | | | 61,266 | | 10,204 | | | |
| Operating expenses | | | | | | | | | |
| Salaries and benefits | | | | | | 25,365 | | 14,483 | | | |
| Occupancy | | | | | | 1,258 | | 512 | | | |
| Advertising | | | | | | 1,420 | | 1,272 | | | |
| Direct operations | | | | | | 14,768 | | 14,380 | | | |
| Depreciation and amortization | | | | | | 13,923 | | 10,445 | | | |
| Other operating expense | | | | | | 3,392 | | 3,601 | | | |
| Total operating expenses | | | | | | 60,126 | | 44,693 | | | |
| Other expense | | | | | | (7,605) | | — | | | |
| Goodwill Impairment | | | | | | 37,414 | | — | | | |
| Loss on Extinguishment of Debt | | | | | | 665 | | — | | | |
| Interest expense | | | | | | 40,641 | | 14,993 | | | |
| Total other expense | | | | | | 71,115 | | 14,993 | | | |
| Segment loss before income taxes | | | | | | $ | (69,975) | | $ | (49,482) | | | |
| | | | | | | |
| (1) The totals reported for the year ended December 31, 2021 include results from the date of the Flexiti acquisition, March 10, 2021, through December 31, 2021. |
Canada POS Lending Segment Results - For the Years Ended December 31, 2022 and 2021
Total Revenue. Total revenue increased year over year by $71.6 million, or 205.5% ($76.3 million, or 219.1%, on a constant currency basis) driven by year over year significant organic loan growth of $374.3 million, or 81.5% ($0.4 million, or 93.4%, on a constant currency basis). The increase in gross loans receivable was driven by growth associated with both existing and new merchant partners.
Provision for losses. The provision for losses increased $20.5 million, or 83.4% ($22.7 million, or 92.3%, on a constant currency basis) for the year ended December 31, 2022, compared to the prior-year period. The increase in provision for losses was primarily driven by organic loan growth, orderly credit normalization to higher NCO and past-due rates as COVID-19 impacts decreased comparatively and strategic loosening of certain credit approval metrics to include select near-prime customers. Total NCO rates for the fourth quarter of 2022 (annualized) increased to 4.4% from 2.0% year over year. Total past-due rates increased 144 bps year over year and decreased 61 bps sequentially.
Operating expenses. Operating expenses for the year ended December 31, 2022 were $60.1 million, an increase of $15.4 million, or 34.5% ($17.6 million, or 39.4%, on a constant currency basis) compared to $44.7 million for the year ended December 31, 2021. The increase was primarily driven by a $10.9 million increase in Salaries and benefits expense due to increased headcount to support higher loan volume year over year. Depreciation and amortization expense increased $3.5 million due to a full year of amortization of intangible assets capitalized upon the March 2021 acquisition of Flexiti.
Interest expense. Interest expense for the year ended December 31, 2022 increased $25.6 million, or 171.1%, compared to the prior-year period, primarily driven by increased non-recourse asset-backed lending borrowing to support significant loan growth and increased benchmark rates on variable debt prior to entering into interest rate swap agreements.
Goodwill impairment. On October 1, 2022, management determined the estimated fair value of the Canada POS Lending reporting unit did not exceed its carrying value. A two step analysis was performed to determine the amount of impairment for the Canada POS Lending reporting unit. The goodwill impairment charge unit was driven by rising interest rates, macroeconomic conditions and performance of recent acquisitions. As such, we recorded a pre-tax goodwill impairment charge of $37.4 million for the Canada POS Lending reporting unit.
Loss on extinguishment of debt. We incurred $0.7 million of debt extinguishment costs for the year ended December 31, 2022 related to the write off of deferred finance costs upon the September 2022 refinance of the Flexiti SPV.
Gain or loss on change in fair value of contingent consideration. We recorded a $7.6 million gain following a decrease in fair value of the Flexiti contingent consideration liability during the year ended December 31, 2022 compared to a $6.2 million loss following an increase in the fair value of Flexiti contingent consideration liability during the year ended December 31, 2021.
Results of Canada POS Lending Segment Results of Operations for the Year Ended December 31, 2021
For the results of our Canada POS Lending segment results of operations for the year ended December 31, 2021, see "Management's Discussion and Analysis of Financial Condition and Results of Operations—Segment Analysis" in Part II Item 7 of our 2021 Form 10-K. The company acquired Flexiti on March 10, 2021.
Supplemental Non-GAAP Financial Information
Non-GAAP Financial Measures
In addition to the financial information prepared in conformity with U.S. GAAP, we provide certain “non-GAAP financial measures,” including:
•Adjusted Net Income ("ANI") and Adjusted Diluted Earnings Per Share (net income plus or minus certain legal and other costs, income or loss from equity method investment, goodwill and intangible asset impairments, transaction-related costs, restructuring costs, loss on extinguishment of debt, adjustments related to acquisition accounting, share-based compensation, intangible asset amortization, gain on sale of business, changes in fair value of contingent consideration, certain tax adjustments and cumulative tax effect of applicable adjustments, on a total and per share basis); and
•Gross Combined Loans Receivable (includes loans originated by third-party lenders through CSO programs which are not included in the Consolidated Financial Statements). As a result of the sale of the Legacy U.S. Direct Lending Business, we no longer guarantee loans originated by third-party lenders through CSO programs.
We believe that the presentation of non-GAAP financial information is meaningful and useful in understanding the activities and business metrics of our operations. We believe that these non-GAAP financial measures reflect an additional way of viewing aspects of the business that, when viewed with our U.S. GAAP results, provide a more complete understanding of factors and trends affecting the business.
We believe that investors regularly rely on non-GAAP financial measures to assess operating performance and that such measures may highlight trends in the business that may not otherwise be apparent when relying on financial measures calculated in accordance with U.S. GAAP. In addition, we believe that the adjustments shown below are useful to investors to allow them to compare our financial results during the periods shown without the effect of each of these income or expense items. In addition, we believe that these financial measures are frequently used by securities analysts, investors and other interested parties in the evaluation of public companies in our industry, many of which present similar financial measures when reporting their results.
In addition to reporting loans receivable information in accordance with U.S. GAAP, we provide Gross Combined Loans Receivable consisting of owned loans receivable plus loans originated by third-party lenders through the CSO programs, which we historically guaranteed but did not include in the Consolidated Financial Statements. We believe this analysis provides investors with important information needed to evaluate overall lending performance. All balances in connection with the CSO programs were disposed of on July 8, 2022 with the completion of the divestiture of the Legacy U.S. Direct Lending Business.
We provide non-GAAP financial information for informational purposes and to enhance understanding of the U.S. GAAP Consolidated Financial Statements. These financial measures should not be considered as alternatives to income, segment operating income, or any other performance measure derived in accordance with U.S. GAAP, or as an alternative to cash flows from operating activities or any other liquidity measure derived in accordance with U.S. GAAP. Readers should consider the information in addition to, but not instead of or superior to, the financial statements prepared in accordance with U.S. GAAP. This non-GAAP financial information may be determined or calculated differently by other companies, limiting the usefulness of those measures for comparative purposes.
Description and Reconciliations of Non-GAAP Financial Measures
Adjusted Net Income and Adjusted Diluted Earnings per Share Measures have limitations as analytical tools, and you should not consider these measures in isolation or as a substitute for analysis of our income or cash flows as reported under U.S. GAAP. Some of these limitations are:
•they do not include cash expenditures or future requirements for capital expenditures or contractual commitments;
•they do not include changes in, or cash requirements for, working capital needs;
•they do not include the interest expense, or the cash requirements necessary to service interest or principal payments on debt;
•depreciation and amortization are non-cash expense items reported in the statements of cash flows; and
•other companies in our industry may calculate these measures differently, limiting their usefulness as comparative measures.
We calculate Adjusted Diluted Earnings per Share utilizing diluted shares outstanding at year-end. If the Company records a loss under U.S. GAAP, shares outstanding utilized to calculate Diluted Earnings per Share are equivalent to basic shares outstanding. Shares outstanding utilized to calculate Adjusted Diluted Earnings per Share reflect the number of diluted shares the Company would have reported if reporting net income under U.S. GAAP.
As noted above, Gross Combined Loans Receivable includes loans originated by third-party lenders through CSO programs which are not included in the consolidated financial statements but from which we earn revenue and for which we provide a guarantee to the lender. All balances in connection with the CSO programs were disposed of on July 8, 2022 with the completion of the divestiture of the Legacy U.S. Direct Lending Business. Management believes this analysis provides investors with important information needed to evaluate overall lending performance.
We believe Adjusted Net Income and Adjusted Diluted Earnings per Share are used by investors to analyze operating performance and to evaluate our ability to incur and service debt and the capacity for making capital expenditures.
Reconciliation of Net Income and Diluted Earnings per Share to Adjusted Net Income and Adjusted Diluted Earnings per Share, non-GAAP measures (in thousands, except per share data)
| | | | | | | | | | | | | | | | | | | | | |
| | | | For the Year Ended
December 31, |
| | | | | | 2022 | 2021 | 2020 | | |
| Net (loss) income from continuing operations | | | | | | | $ | (185,484) | | $ | 59,334 | | $ | 74,448 | | | |
| Adjustments: | | | | | | | | | | | |
Restructuring costs (1) | | | | | | | 16,038 | | 12,717 | | 510 | | | |
Legal and other costs (2) | | | | | | | 1,489 | | 2,134 | | 2,415 | | | |
Loss (income) from equity method investment (3) | | | | | | | 3,985 | | (3,658) | | (4,546) | | | |
Gain from equity method investment (4) | | | | | | | — | | (135,387) | | — | | | |
Transaction costs (5) | | | | | | | 11,179 | | 15,406 | | 2,737 | | | |
Acquisition-related adjustments (6) | | | | | | | (2,004) | | 13,949 | | — | | | |
Change in fair value of contingent consideration (7) | | | | | | | (7,605) | | 6,209 | | — | | | |
Loss on extinguishment of debt (8) | | | | | | | 4,391 | | 42,262 | | — | | | |
Share-based compensation (9) | | | | | | | 13,956 | | 13,976 | | 12,910 | | | |
Intangible asset amortization (10) | | | | | | | 12,753 | | 6,282 | | 2,951 | | | |
Gain on sale of business (11) | | | | | | | (68,443) | | — | | — | | | |
Goodwill impairment (12) | | | | | | | 145,241 | | — | | — | | | |
Cumulative tax effect of adjustments (13) | | | | | | | 5,316 | | 8,455 | | (4,534) | | | |
Canada GST adjustment (14) | | | | | | | — | | — | | 2,160 | | | |
Income tax valuations (15) | | | | | | | — | | — | | (3,472) | | | |
Impact of tax law changes (16) | | | | | | | — | | — | | (11,251) | | | |
| Adjusted net (loss) income | | | | | | | $ | (49,188) | | $ | 41,679 | | $ | 74,328 | | | |
| | | | | | | | | | | |
| Net (loss) income | | | | | | | $ | (185,484) | | $ | 59,334 | | $ | 74,448 | | | |
| Diluted weighted average shares outstanding | | | | | | | 40,428 | | 43,143 | | 42,091 | | | |
| Adjusted diluted weighted average shares outstanding | | | | | | | 40,428 | | 43,143 | | 42,091 | | | |
| Diluted (loss) earnings per share | | | | | | | $ | (4.59) | | $ | 1.38 | | $ | 1.77 | | | |
| Per share impact of adjustments to net income (loss) | | | | | | | 3.37 | | (0.41) | | — | | | |
| Adjusted diluted (loss) earnings per share | | | | | | | $ | (1.22) | | $ | 0.97 | | $ | 1.77 | | | |
| Note: Footnotes follow Reconciliation of Net income table on the next page |
| | | | | |
| (1) | Restructuring costs primarily related to U.S. and Canada store closures and other cost saving initiatives. |
| (2) | Legal and other costs primarily related to settlement costs related to certain legal matters. |
| (3) | Share of Katapult's U.S. GAAP net income or loss, recognized on a one quarter lag. |
| (4) | Gain on investment in Katapult recorded as a result of the completion of its reverse merger with FinServ. |
| (5) | Transaction costs primarily related to the sale of the Legacy U.S. Direct Lending Business in July 2022, the acquisition of First Heritage in July 2022 and the acquisition of Heights Finance in December 2021. |
| (6) | During 2022, acquisition-related adjustments related to the Heights Finance and First Heritage acquisitions.
During 2022 and 2021, acquisition-related adjustments related to the Flexiti acquisition. |
| (7) | Adjustments related to the fair value of the contingent consideration related to the acquisition of Flexiti. |
| (8) | On July 30, 2021, we entered into new 7.50% Senior Secured Notes due 2028, which were used on August 12, 2021 to extinguish the 8.25% Senior Secured Notes due 2025. During the three and nine months ended December 30, 2021, $40.2 million from the loss on the extinguishment of debt was due to the early redemption of the 8.25% Senior Secured Notes due 2025. An additional $2.1 million of interest was incurred for the year ended December 30, 2021, which represents interest on the 8.25% Senior Secured Notes due 2025 for the period between July 30, 2021 and August 12, 2021, the period during which the 8.25% Senior Secured Notes and 7.50% Senior Secured Notes were outstanding.
During the year ended December 31, 2022,, $3.1 million of the loss on extinguishment of debt was due to the early extinguishment of the U.S. SPV on July 8, 2022 upon the completion of the divestiture of our Legacy U.S.Direct Lending business to Community Choice Financial, $0.6 million was due to the extinguishment of the Heights Finance SPV on July 15, 2022 and $0.7 million of the loss on extinguishment of debt was due to the Flexiti SPF loan settlement. |
| (9) | Estimated fair value of share-based awards was recognized as non-cash compensation expense on a straight-line basis over the vesting period. |
| (10) | Intangible asset amortization primarily included amortization of identifiable intangible assets established in connection with the acquisitions of Flexiti in March 2021, Heights Finance in December 2021 and First Heritage in July 2022. |
| (11) | Gain on the divestiture of its Legacy U.S. Direct Lending Business to Community Choice Financial in July 2022. |
| (12) | Goodwill impairment charge of $107.8 million recorded on the U.S. Direct Lending reporting unit and $37.4 million recorded on the Canada POS Lending reporting unit during the fourth quarter of 2022. |
| (13) | Cumulative tax effect of adjustments included in Reconciliation of Net (loss) income to Adjusted net (loss) income table is calculated using the estimated incremental tax rate by country. |
| (14) | We received a Notice of Adjustment from Canadian tax authority auditors in the second quarter 2020 related to the treatment of certain expenses in prior years
for purposes of calculating the Goods and Services Tax ("GST") due. |
| (15) | During the year ended December 31, 2020, a Texas court ruling related to the apportionment of income to the state for an unrelated company resulted in a
change in estimate regarding the realization of a tax benefit previously taken. Accordingly, we recorded a $1.1 million liability for our estimated exposure related
to this position, which was settled in April 2021. Also in the year ended December 31, 2020, we released a $4.6 million valuation allowance related to Net
Operating Losses ("NOLs") for certain entities in Canada. |
| (16) | On March 27, 2020, the Coronavirus Aid, Relief and Economic Security Act ("CARES Act") was enacted by the U.S. Federal government in response to the
COVID-19 pandemic. The CARES Act, among other things, allows NOLs incurred in 2018, 2019 and 2020 to be carried back to each of the five preceding
taxable years to generate a refund of previously paid income taxes. For the year ended December 31, 2020, we recorded an income tax benefit of $11.3 million
related to the carryback of NOL from tax years 2018 and 2019. |
| |
| |
| |
| |
| |
Currency Information
We operate in the U.S. and Canada and our consolidated results are reported in U.S. dollars.
Changes in our reported revenues and net (loss) income include the effect of changes in currency exchange rates. We translate the Consolidated Balance Sheet into U.S. dollars at the currency exchange rate in effect at the end of each period. We translate the Consolidated Statement of Operations at the average rates of exchange for the period. We record currency translation adjustments as a component of Accumulated other comprehensive loss in Stockholders’ Equity.
Constant Currency Analysis
We have operations in the U.S. and Canada. For the year ended December 31, 2022 and 2021, 40.0% and 35.7%, respectively, of our revenues were originated in Canadian Dollars. As a result, changes in our reported results include the impacts of changes in foreign currency exchange rates for the Canadian Dollar.
Income Statement
| | | | | | | | | | | | | | | | | | | | | | | | | | | | | | | | | | | | | | |
| | | For the Year Ended December 31, | | For the Year Ended December 31, |
| | | | | | | 2022 | 2021 | | | % Change | | 2021 | 2020 | | % Change |
| Average Exchange Rates for the Canadian Dollar | | | | | | | 0.7689 | | $ | 0.7979 | | | | (3.6) | % | | $ | 0.7979 | | $ | 0.7462 | | | 6.9 | % |
| | | | | | | | | | | | | | | | |
Balance Sheet - Exchange Rate as of December 31, 2022 and December 31, 2021
| | | | | | | | | | | | | | | | | |
| December 31, | December 31, | | Change |
| 2022 | 2021 | | $ | % |
| Exchange Rate for the Canadian Dollar | 0.7365 | | 0.7846 | | | (0.0481) | | (6.1) | % |
| | | | | |
The following constant currency analysis removes the impact of the fluctuation in foreign exchange rates and utilizes constant currency results in our analysis of the Canada Direct Lending and Canada POS Lending segment performance. Our constant currency assessment assumes foreign exchange rates in the current fiscal periods remained the same as in the prior fiscal periods. All conversion rates below are based on the U.S. Dollar equivalent to the Canadian Dollar. We believe that the constant currency assessment below is a useful measure in assessing the comparable growth and profitability of our operations.
We calculated the revenues and gross margin below for our Canadian segments during the year ended December 31, 2022 using the actual average exchange rate during the year ended December 31, 2021 (in thousands).
| | | | | | | | | | | | | | | | | | | | | | | | | | |
| | | | For the Year Ended December 31, |
| | | | | | | | 2022 | 2021 | | $ Change | % Change |
| Canada Direct Lending – constant currency basis: | | | | | | | | | |
| Revenues | | | | | | | | $ | 315,655 | | $ | 257,039 | | | $ | 58,616 | | 22.8 | % |
| Net revenue | | | | | | | | 196,179 | | 202,042 | | | (5,863) | | (2.9) | % |
| Segment income before income taxes | | | | | | | | 52,574 | | 88,731 | | | (36,157) | | (40.7) | % |
Canada POS Lending – constant currency basis(1): | | | | | | | | | |
| Revenues | | | | | | | | $ | 111,163 | | 34,842 | | | $ | 76,321 | | 219.0 | % |
| Net revenue | | | | | | | | 63,788 | | 10,204 | | | 53,584 | | 525.1 | % |
| Segment loss before income taxes | | | | | | | | (74,135) | | (49,482) | | | (24,653) | | 49.8 | % |
(1) The totals reported for the year ended December 31, 2021 include results from the date of acquisition, March 10, 2021, through December 31, 2021. |
| | | | | | |
| | | | | | | | | | | | |
We calculated gross loans receivable for our Canada segments below as of December 31, 2022 using the actual exchange rate as of December 31, 2021 (in thousands).
| | | | | | | | | | | | | | | | | | | | | |
| | December 31, | | December 31, | | Change |
| | 2022 | | 2021 | | $ | % |
| Canada Direct Lending – constant currency basis: | | | |
| Gross loans receivable | | $ | 512,454 | | | $ | 427,197 | | | $ | 85,257 | | 20.0 | % |
| Canada POS Lending – constant currency basis: | | | |
| Gross loans receivable | | $ | 887,911 | | | $ | 459,176 | | | $ | 428,735 | | 93.4 | % |
| | | | | | | |
| | | | | | | |
|
| | | | | | | |
LIQUIDITY AND CAPITAL RESOURCES
Our principal sources of liquidity to fund the loans we make to our customers are (i) cash provided by operations and (ii) our revolving credit facilities and our non-recourse funding facilities, as further described in Note 6, "Debt" of the Notes to the Consolidated Financial Statements. Historically, we also used funds from third-party lenders under our CSO programs. As a result of the sale of the Legacy U.S. Direct Lending Business on July 8, 2022, we no longer guarantee loans originated by third-party lenders through CSO programs.
We anticipate that our primary use of cash will be to fund growth in our working capital, finance capital expenditures to further our business strategy in both the U.S. and Canada and meet our debt obligations. We may also use cash for potential strategic investments in and acquisitions of other companies that help us extend our reach and product portfolio. Additionally, we may use cash to fund a return on capital for our stockholders through share repurchase programs or in the form of dividends. Our Board of Directors authorized a $25.0 million share repurchase program in February 2022, under which no shares have been repurchased to date. Refer to Note 23, "Share Repurchase Program" of the Notes to the Consolidated Financial Statements for further details of the program. The Board of Directors suspended the quarterly dividend payment in October 2022.
Our level of cash flow provided by operating activities typically experiences seasonal fluctuations related to our levels of net income and changes in working capital levels, particularly loans receivable. Unexpected changes in our financial condition or other unforeseen factors may result in our inability to obtain third-party financing or could increase our borrowing costs in the future. We have the ability to adjust our volume of lending to consumers to the extent we experience any short-term or long-term funding shortfalls, such as tightening our credit approval practices (as we did during the COVID-19 pandemic), which has the effect of reducing cash outflow requirements while increasing cash inflows through loan repayments.
We may also sell or securitize our assets, draw on our available revolving credit facilities or lines of credit, enter into additional refinancing agreements or reduce our capital spending to generate additional liquidity. The impacts to cash as described in "—Cash Flows" below and other factors resulted in our available unrestricted cash on hand of $73.9 million as of December 31, 2022. We believe our cash on hand and available borrowings provide us with sufficient liquidity for at least the next 12 months.
Our recent acquisitions of First Heritage and Heights Finance have increased our product offerings to include additional customers in the near-prime and prime space. The acquisition of First Heritage and Heights Finance completed our strategic transition in the U.S. toward longer term, higher balance and lower rate credit products and provides us with access to a larger addressable market while mitigating regulatory risk. These initiatives to expand our product offerings and grow the U.S. and Canadian businesses could materially impact our future cash flows. For further information regarding the acquisitions, refer to Note 1, "Summary of Significant Accounting Policies and Nature of Operations," and Note 14,"Acquisitions and Divestiture" of the Notes to the Consolidated Financial Statements.
As of December 31, 2022, we were in compliance with or have received waivers of all financial ratios, covenants and other requirements in our debt agreements. These waivers are temporary and management expects to extend the waivers and renegotiate related covenants. If we do not reach an agreement, we will be in default under certain debt agreements.
We have no additional material commitments or demands that are likely to affect our liquidity.
Debt Capitalization Summary
(in thousands, except capacity, net of deferred financing costs)
| | | | | | | | | | | | | | | | | | | |
| | Capacity | Interest Rate | Maturity | Balance as of December 31, 2022 (in USD) | | |
7.50% Senior Secured Notes (due 2028) (2) | | $1.0 billion | 7.50% | August 1, 2028 | $ | 982,934 | | | |
| Heights SPV | | $425.0 million | 1-Mo SOFR + 4.25% | July 15, 2025 | 393,181 | | | |
| First Heritage SPV | | $225.0 million | 1-Mo SOFR + 4.25% | July 13, 2025 | 178,622 | | | |
Flexiti SPV(1) | | C$535.0 million | Weighted average interest rate (3)(5) 8.33% | September 29, 2025 | 339,651 | | | |
Flexiti Securitization(1) | | C$526.5 million | 1-Mo CDOR + 3.59%)(5) | December 9, 2025 | 385,054 | | | |
Canada SPV(1) | | C$400.0 million | 3-Mo CDOR + 6.00% | August 2, 2026 | 292,872 | | | |
Curo Canada Revolving Credit Facility(1)(4) | | C$5.0 million | Canada Prime Rate + 1.95% | January 6, 2023 | — | | | |
| Senior Revolver | | $40.0 million | 1-Mo SOFR + 5.00% | August 31, 2023 | 35,000 | | | |
(1) Capacity amounts are denominated in Canadian dollars, while outstanding balances as of December 31, 2022 are denominated in U.S. dollars. | | |
| (2) On July 30, 2021, we closed our $750 million aggregate principal amount of new 7.50% Senior Secured Notes, which was used to redeem our $690.0 million 8.25% Senior Secured Notes due 2025. On December 27, 2021, we issued an additional $250.0 million of our 7.50% Senior Secured Notes for a total capacity of $1.0 billion. | | |
(3) The weighted average interest rate does not include the impact of the amortization of deferred loan origination costs or debt discounts.
| | |
(4) On December 21, 2022 the maximum amount of the CURO Canada Revolving Credit Facility was reduced from C$10.0million to C$5.0 million, and the facility was cancelled in its entirety on January 6, 2023.
| | |
| (5) Swapped to fixed rate via interest rate swap hedging arrangement that terminates on September 29, 2025 for Flexiti SPV and December 9, 2025 for Flexiti Securitization. |
Refer to Note 6, "Debt," for details on each of our credit facilities and resources.
Cash Flows
The following highlights our cash flow activity and the sources and uses of funding during the periods indicated (in thousands):
| | | | | | | | | | | | | | | | | | | | |
| | For the Year Ended December 31, |
| | 2022 | | 2021 | | 2020 |
| Net cash provided by continuing operating activities | | $ | 284,607 | | | $ | 323,173 | | | $ | 403,505 | |
| Net cash used in investing activities | | (777,949) | | | (923,488) | | | (255,056) | |
| Net cash provided by financing activities | | 501,062 | | | 491,291 | | | 7,329 | |
| | | | | | |
Years Ended December 31, 2022 and 2021
Operating Activities
Net cash provided by operating activities for the year ended December 31, 2022 was $284.6 million, which is primarily attributable to the effect of non-cash reconciling items of $505.7 million offset by net loss of $185.5 million, and changes in our operating assets and liabilities of $35.6 million. Our non-cash reconciling items of $505.7 million primarily included $400.3 million of provision for losses, $145.2 million of goodwill impairment expense recorded on the U.S. Direct Lending and Canada POS Lending segments, and $36.3 million of depreciation and amortization, offset by the gain on the disposal of our Legacy U.S. Direct Lending Business of $68.4 million and deferred income tax benefit of $38.3 million. Our changes in operating assets and liabilities of $35.6 million were primarily related to $46.6 million of lower accounts payable and accrued liabilities as a result of timing on the settlement of certain accruals and $37.3 million of lower accrued interest on our gross loans receivable offset primarily by an increase in deferred revenue of $17.8 million and $17.9 million of lower Income taxes receivable.
Investing Activities
Net cash used in investing activities for the year ended December 31, 2022 was $777.9 million, primarily due to net origination of loans of $890.1 million. In addition, we used cash to purchase $45.8 million of property, equipment and software, an increase from the prior year due to the acquisitions of Flexiti and Heights Finance in 2021 and First Heritage in 2022. We also utilized $131.0 million of cash to acquire First Heritage and received $289.0 million of cash for the sale of the Legacy U.S. Direct Lending Business, net of cash.
Financing Activities
Net cash provided by financing activities for the year ended December 31, 2022 was $501.1 million primarily due to $549.6 million of net proceeds from our non-recourse debt facilities partially offset by (i) $12.5 million of share repurchases in the first quarter of 2022 and (ii) $13.7 million of cash dividends.
Years Ended December 31, 2021 and 2020
For a comparison of our cash flows for the years ended December 31, 2021 and 2020, see "Management's Discussion and Analysis of Financial Condition and Results of Operations—Cash Flows" in Part II Item 7 of our 2021 Form 10-K.
Critical Accounting Policies and Estimates
The preparation of financial statements in conformity with U.S. GAAP requires management to make estimates and assumptions about future events that affect the amounts reported in the financial statements and accompanying notes. Actual results could differ significantly from those estimates. We consider the following accounting policies to be critical in understanding our historical and future performance and require management's most subjective and complex judgments.
Allowance for Loan Losses
Credit losses are an inherent part of outstanding loans receivable. We maintain an ALL for loans and interest receivable at a level we estimate to be adequate to absorb incurred losses based primarily on our analysis of historical loss or charge-off rates by products containing similar risk characteristics. The ALL on our gross loans receivables reduces the outstanding gross loans receivables balance in the Consolidated Balance Sheets. We record increases in the allowance, net of charge-offs and recoveries, as “Provision for losses” in the Consolidated Statements of Operations. We adopted CECL as of January 1, 2023, which requires a broader range of reasonable and supportable information to inform credit loss estimates. See "Recently Issued Accounting Pronouncements Not Yet Adopted" in Note 1, "Summary of Significant Policies and Nature of Operations for more information."
We also consider delinquency trends as well as macro-economic conditions we believe may affect portfolio losses. If a loan is deemed to be uncollectible before it is fully reserved based on information we become aware of (e.g., receipt of customer bankruptcy notice or death), we charge off such loan at that time. Qualitative factors such as the impact of new loan products, changes to underwriting criteria or lending policies, new store development or entrance into new markets, changes in jurisdictional regulations or laws, recent credit trends and general economic conditions impact management’s judgment on the overall adequacy of the allowance for loan losses. Any recoveries on loans previously charged to the allowance are credited to the allowance when collected.
Business Combinations and Contingent Consideration
We include the results of operations of acquired businesses from the date of acquisition. We determine the fair value of the assets acquired and liabilities assumed based on their estimated fair value as of the date of acquisition. The excess purchase price over the fair values of identifiable assets and liabilities is recorded as goodwill.
Determining the fair value of assets acquired and liabilities assumed requires management to use significant judgment and estimates including the selection of valuation methodologies, estimates of future revenue and cash flows, discount rates and selection of comparable companies. Our estimates of fair value are based on assumptions believed to be reasonable, but which are inherently uncertain and unpredictable and, as a result, actual results may differ from estimates.
During the measurement period, not to exceed one year from the date of acquisition, we may record adjustments to the assets acquired and liabilities assumed, with a corresponding offset to goodwill. After the conclusion of the measurement period, any subsequent adjustments are reflected in the consolidated statements of operations. When we grant equity to employees of the selling stockholders in connection with an acquisition, we evaluate whether the awards are compensatory. This evaluation includes whether stock award vesting is contingent on the continued employment beyond the acquisition date. If continued employment is required for stock awards to vest, the award is treated as compensation for post-acquisition services and is recognized as compensation expense.
Transaction costs associated with business combinations are expensed as incurred and are included in Other operating expense in our Consolidated Statements of Operations.
On July 13, 2022, we completed the acquisition of First Heritage. The fair value of total consideration paid as part of the acquisition was comprised of $140.0 million in cash. Net assets acquired were $89.0 million, resulting in goodwill of $75.4 million.
On December 27, 2021, we acquired 100% of the outstanding stock of Heights Finance. The fair value of total consideration paid as part of the acquisition was comprised of $335.0 million in cash and $25.0 million of our common stock. Net assets acquired were $162.4 million, resulting in goodwill of $265.7 million. As of December 31, 2021, we completed the determination of the fair values of the acquired identifiable assets and liabilities. During the year ended December 31, 2022,we recorded measurement period adjustments that increased goodwill by $11.8 million$11.8 million. The measurement period adjustment related to the fair value of the loan portfolio and would have resulted in $7.7 million of incremental interest and fee revenue during the three months ended March 31, 2022 and no impact on the year ended December 31, 2022. We recorded a measurement period adjustment in the
fourth quarter of 2022 that decreased goodwill by $3.5 million related to the final true-up of deferred tax balances after the pre-acquisition income tax returns were filed in October 2022. We made these measurement period adjustments to reflect the correct deferred tax balances which existed as of the acquisition date rather than events subsequent to such date. As of December 31, 2022, we completed the determination of the fair values of the acquired identifiable assets and liabilities.
On March 10, 2021, we acquired 100% of the outstanding stock of Flexiti. The fair value of total consideration paid as part of the acquisition was comprised of $86.5 million in cash, $6.3 million in debt costs and $20.6 million in contingent cash consideration subject to future operating metrics, including revenue less NCOs and loan originations. Net assets acquired were $68.5 million, resulting in goodwill of $44.9 million. During the year ended December 31, 2021, we recorded a cumulative net measurement period adjustment that decreased goodwill by $4.5 million. The measurement period adjustment would have resulted in an insignificant increase in amortization expense related to the merchant relationships intangible asset during the first quarter of 2021 when we acquired Flexiti. We made these measurement period adjustments to reflect facts and circumstances that existed as of the acquisition date rather than from intervening events subsequent to such date. As of December 31, 2021, we completed the determination of the fair values of the acquired identifiable assets and liabilities. For the year ended December 31, 2022, we recorded a $7.6 million gain related to the decrease in fair value of contingent consideration.
Goodwill
We exercise judgment in evaluating assets for impairment. Goodwill is tested for impairment annually, or when circumstances arise which could more likely than not reduce the fair value of a reporting unit below its carrying value. These tests require comparing carrying values to estimated fair values of the reporting unit under review.
Our reporting units consist of the U.S. Direct Lending, Canada Direct Lending and Canada POS Lending segments, as defined by FASB’s ASC 280, Segment Reporting, for which we assess goodwill for impairment. Considering the uncertain macroeconomic environment, for the annual goodwill impairment analysis at October 1, 2022, management elected to forgo the qualitative assessment, and performed a Step 1 analysis for all three reporting units. Management calculated the fair value of each reporting unit using a weighted combination of the income approach and the market approach. An impairment would occur if the carrying amount of a reporting unit exceeds the fair value of that reporting unit. We describe our approach to calculating fair value of the goodwill in Note 1, "Summary of Significant Policies and Nature of Operations." As a result of the goodwill impairment test at October 1, 2022, management determined the estimated fair value of the U.S. Direct Lending and Canada POS Lending reporting units did not exceed their respective carrying value. A two step analysis was performed to determine the amount of impairment for the U.S. Direct Lending reporting unit. The Canada Direct Lending reporting unit estimated fair values exceeded its carrying value. As such, we recorded a pre-tax goodwill impairment charge of $107.8 million for the U.S. Direct Lending reporting unit and $37.4 million for the Canada POS Lending reporting unit. No impairment charge was required for the Canada Direct Lending reporting units. Events or circumstances that could indicate an impairment include a significant change in the business climate, a change in strategic direction, legal factors, operating performance indicators, a change in the competitive environment, the sale or divestiture of a significant portion of a reporting unit or economic outlook. These and other macroeconomic factors were considered when performing the annual test as of October 1, 2022 and the quarterly triggering event analyses.
For the three months ended December 31, 2022, we reviewed U.S. Direct Lending, Canada Direct Lending and Canada POS Lending goodwill for triggering events that would indicate a need for an interim quantitative or qualitative assessment of goodwill impairment. As a result of the review, no additional assessment was deemed necessary, and thus there was no additional goodwill impairment recorded.
There continues to be uncertainty surrounding macroeconomic factors that could impact our reporting units. Changes in the expected length of the current economic downturn, timing of recovery or long-term revenue growth or profitability for these reporting units could increase the likelihood of a future goodwill impairment. Additionally, changes in market participant assumptions such as an increased discount rate or further share price reductions could increase the likelihood of a future impairment.
The following table summarizes the segment allocation of recorded goodwill on our Consolidated Balance Sheets as of December 31, 2022:
| | | | | | | | | | | | | | | | | |
| (in thousands) | December 31, 2022 | Percent of Total | | December 31, 2021 | Percent of Total |
U.S. Direct Lending (1) | $ | 248,011 | | 89.8 | % | | $ | 359,779 | | 83.7 | % |
| Canada Direct Lending | 28,258 | | 10.2 | % | | 30,105 | | 7.0 | % |
| Canada POS Lending | — | | — | % | | 39,908 | | 9.3 | % |
| Total Goodwill | $ | 276,269 | | | | $ | 429,792 | | |
(1) Changes in Goodwill between December 31, 2021 and September 30, 2022 are primarily due to the acquisition of First Heritage, offset by the sale of the Legacy U.S. Direct Lending Business, refer to FN 14 "Acquisitions and Divestitures".
|
ITEM 7A. QUANTITATIVE AND QUALITATIVE DISCLOSURES ABOUT MARKET RISK
Interest Rate Risk
We are exposed to interest rate risk on our unhedged revolving credit facilities and non-recourse funding facilities, as further described in Note 6, "Debt." Our variable interest expense is sensitive to changes in the general level of interest rates. We may enter into interest rate caps, interest rate swaps, collars or similar instruments with the objective of reducing our borrowing cost volatility. We do not use derivative financial instruments for speculative or trading purposes.
Interest expense on such borrowings is sensitive to changes in the market rate of interest. Hypothetically, a 1% increase in the average market rate would result in an increase in our annual interest expense of $9.1 million. This amount is determined by considering the impact of the hypothetical interest rates on our borrowing cost, but does not consider the effects of the reduced level of overall economic activity that could exist in such an environment. Due to the uncertainty of the specific changes and their possible effects, the foregoing sensitivity analysis assumes no changes in our financial structure.
All of our customer loan portfolios have fixed interest rates and fees that do not fluctuate over the life of the loan. Notwithstanding that, we support fixed rate lending in part with variable rate borrowing. We do not believe there is any material interest rate sensitivity associated with our customer loan portfolio, primarily due to their short duration.
Foreign Currency Exchange Rate Risk
Foreign currency exchange rate fluctuations impact the translation of the financial results of the Canadian operations from Canadian Dollars to U.S. Dollars. Our operations in Canada represent a significant portion of our total operations, and as a result, material changes in the currency exchange rate between these countries could have a significant impact on our consolidated results of operations, financial condition or cash flows. At December 31, 2022, revenue would decrease by $56.1 million and net loss from continuing operations before income taxes would decrease by approximately $39.4 million, if average foreign exchange rates had declined by 10% against the U.S. dollar in 2022. These amounts were determined by considering the adverse impact of a hypothetical foreign exchange rate on the revenue and net loss before income taxes of the Company based on Canadian operations.
We may elect to purchase derivatives as hedges against foreign exchange rate risks with the objective of mitigating the impact of foreign currency fluctuations on our results of operations. We typically hedge existing short-term balance sheet exposures, as well as anticipated cash flows between our foreign subsidiaries and domestic subsidiaries. We do not purchase derivatives for speculative purposes.
We record derivative instruments at fair value on the balance sheet as either an asset or liability. Changes in the options intrinsic value, to the extent that they are effective as a hedge, are recorded in Other comprehensive income (loss). For derivatives that qualify and have been designated as cash flow or fair value hedges for accounting purposes, changes in fair value have no net impact on earnings to the extent the derivative is considered perfectly effective in achieving offsetting changes in fair value or cash flows attributable to the risk being hedged.
ITEM 8. FINANCIAL STATEMENTS AND SUPPLEMENTARY DATA
| | | | | | | | |
| Index to Consolidated Financial Statements | | Page |
| | |
| | |
| | |
| | |
| | |
| | |
| | |
REPORT OF INDEPENDENT REGISTERED PUBLIC ACCOUNTING FIRM
To the stockholders and the Board of Directors of CURO Group Holdings Corp.
Opinion on the Financial Statements
We have audited the accompanying consolidated balance sheets of CURO Group Holdings Corp. and subsidiaries (the "Company") as of December 31, 2022 and 2021, the related consolidated statements of operations, comprehensive income (loss), changes in equity and cash flows, for each of the three years in the period ended December 31, 2022, and the related notes (collectively referred to as the "financial statements"). In our opinion, the financial statements present fairly, in all material respects, the financial position of the Company as of December 31, 2022 and 2021, and the results of its operations and its cash flows for each of the three years in the period ended December 31, 2022, in conformity with accounting principles generally accepted in the United States of America.
We have also audited, in accordance with the standards of the Public Company Accounting Oversight Board (United States) (PCAOB), the Company's internal control over financial reporting as of December 31, 2022, based on criteria established in Internal Control — Integrated Framework (2013) issued by the Committee of Sponsoring Organizations of the Treadway Commission and our report dated March 9, 2023, expressed an unqualified opinion on the Company's internal control over financial reporting.
Basis for Opinion
These financial statements are the responsibility of the Company's management. Our responsibility is to express an opinion on the Company's financial statements based on our audits. We are a public accounting firm registered with the PCAOB and are required to be independent with respect to the Company in accordance with the U.S. federal securities laws and the applicable rules and regulations of the Securities and Exchange Commission and the PCAOB.
We conducted our audits in accordance with the standards of the PCAOB. Those standards require that we plan and perform the audit to obtain reasonable assurance about whether the financial statements are free of material misstatement, whether due to error or fraud. Our audits included performing procedures to assess the risks of material misstatement of the financial statements, whether due to error or fraud, and performing procedures that respond to those risks. Such procedures included examining, on a test basis, evidence regarding the amounts and disclosures in the financial statements. Our audits also included evaluating the accounting principles used and significant estimates made by management, as well as evaluating the overall presentation of the financial statements. We believe that our audits provide a reasonable basis for our opinion.
Critical Audit Matters
The critical audit matters communicated below are matters arising from the current-period audit of the financial statements that were communicated or required to be communicated to the audit committee and that (1) relate to accounts or disclosures that are material to the financial statements and (2) involved our especially challenging, subjective, or complex judgments. The communication of critical audit matters does not alter in any way our opinion on the financial statements, taken as a whole, and we are not, by communicating the critical audit matters below, providing separate opinions on the critical audit matters or on the accounts or disclosures to which they relate.
Allowance for Loan Losses — Refer to Notes 1 and 2 to the financial statements
Critical Audit Matter Description
The Company originates various loan products in the United States (“U.S.”) and Canada, including Unsecured Installment, Secured Installment, Revolving Line of Credit and Single-Pay loans. The Company estimates and records an allowance for loans and interest receivable based on historical loss rates and other factors for loans containing similar risk characteristics. In addition, management evaluates whether qualitative adjustments to historical loss rates should be made based on relevant factors. The allowance for loan losses at December 31, 2022 was $122 million.
There is a significant amount of judgment required by management in evaluating qualitative factors. Auditing the allowance for loan losses, inclusive of assessing the adequacy of qualitative adjustments requires a high degree of auditor judgment and an increased extent of effort, including involving our credit specialists.
How the Critical Audit Matter Was Addressed in the Audit
Our audit procedures related to the allowance for loan losses included the following, among others:
•We tested the design and operating effectiveness of management’s controls over the allowance for loan losses including controls over identification of qualitative adjustments for the U.S. Direct Lending, Canada Direct Lending and Canada POS Lending portfolios.
•With the assistance of our credit specialists, we evaluated the reasonableness of the quantitative model and methodology used to determine the allowance.
•We reviewed management’s modeling methodology including assumptions for reasonableness.
•We reviewed independent economic statistics such as common macroeconomic indicators, as well as industry peers, and we used data analytics to identify any changes in the loan portfolio to assess the completeness of management’s qualitative adjustments on the allowance for loan losses.
•We tested the completeness and accuracy of underlying loan data used in management’s models and we recalculated management’s model to validate its mathematical accuracy.
•We assessed the reasonableness of the model by comparing modeled losses to actual historical losses incurred.
Business Combinations — Refer to Notes 1 and 14 to the financial statements
Critical Audit Matter Description
The Company completed the acquisition of First Heritage Credit (“First Heritage” or “FHC”) on July 13, 2022. Total consideration paid for the acquisition was approximately $140 million. The Company accounted for the acquisition under the acquisition method of accounting for business combinations. Accordingly, the purchase price was allocated to the assets acquired and liabilities assumed based on their respective fair values as of the date of acquisition, including loans receivable of $218 million.
Determining the fair value of assets acquired and liabilities assumed requires management to use significant judgment and estimates including the selection of valuation methodologies, estimates of future cash flows and discount rates.
The fair value determination of loans receivable requires management to make significant estimates and assumptions regarding projected cash flows and discount rates. Performing audit procedures to evaluate the reasonableness of those estimates and assumptions required a high degree of auditor judgment, and an increased extent of effort, including involving fair value specialists.
How the Critical Audit Matter Was Addressed in the Audit
Our audit procedures related to the fair value of loans receivable from First Heritage included the following, among others:
•We tested the design and operating effectiveness of controls over the valuation methodology used, including management’s controls over significant assumptions and discounts rates.
•We assessed the knowledge, skill, ability and objectivity of management’s valuation specialist and evaluated the work performed.
•We assessed the reasonableness of management’s forecasts and performed sensitivity analyses to evaluate the impact of changes in significant assumptions to the valuation of loans receivable.
•With the assistance of fair value specialists, we evaluated:
◦The reasonableness of the valuation methodology, and
◦The reasonableness of the discount rates used to present value the expected cash flows by:
▪Testing the source information underlying the determination of the discount rate and testing mathematical accuracy of the calculation.
▪Developing a range of independent estimates and comparing those to the discount rate selected by management to evaluate the inputs used in the calculation.
•We evaluated whether the estimated cash flows were consistent with evidence obtained in other areas of the audit.
Goodwill — Refer to Notes 1 and 4 to the financial statements
Critical Audit Matter Description
The Company completed their annual impairment analysis as of October 1, 2022. The Company assesses goodwill on a reporting unit level (U.S. Direct Lending, Canada POS Lending and Canada Direct Lending). Based on this analysis, $37 million and $108 million of impairment was recorded at the Canada POS Lending and U.S. Direct Lending, respectively.
The Company determines the fair value of each reporting unit using a weighted combination of the income approach and the market approach. The determining the fair value of the reporting unit requires management to make significant estimates and assumptions related to forecasts of revenues, margins and discount rates.
The fair value determination of the Canada POS Lending and U.S. Direct Lending reporting units requires management to make significant estimates and assumptions. Performing audit procedures to evaluate the reasonableness of those estimates and assumptions required a high degree of auditor judgment, and an increased extent of effort, including involving fair value specialists.
How the Critical Audit Matter Was Addressed in the Audit
Our audit procedures related to goodwill impairment of the Canada POS Lending and U.S. Direct Lending reporting units included the following, among others:
•We tested design and operating effectiveness of management’s controls over goodwill impairment.
•We evaluated management’s ability to accurately forecast by comparing actual results to management’s historical forecasts.
•We evaluated the reasonableness of management’s forecasts by comparing the forecasts to historical results, internal communications to management and the Board of Directors, and forecasted information included in Company press releases as well as in analyst and industry reports of the Company and companies in its peer group.
•With the assistance of fair value specialists, we evaluated management’s key judgments and estimates applied in their determination of fair value by assessing the appropriateness of the valuation methodology, the selected discount rate and valuation multiples and comparing those to management’s assumptions and testing the mathematical accuracy of management’s calculation.
/s/ Deloitte & Touche LLP
Chicago, Illinois
March 9, 2023
We have served as the Company's auditor since 2019.
REPORT OF INDEPENDENT REGISTERED PUBLIC ACCOUNTING FIRM
To the stockholders and the Board of Directors of CURO Group Holdings Corp.
Opinion on Internal Control over Financial Reporting
We have audited the internal control over financial reporting of CURO Group Holdings Corp. and subsidiaries (the “Company”) as of December 31, 2022, based on criteria established in Internal Control — Integrated Framework (2013) issued by the Committee of Sponsoring Organizations of the Treadway Commission (COSO). In our opinion, the Company maintained, in all material respects, effective internal control over financial reporting as of December 31, 2022, based on criteria established in Internal Control — Integrated Framework (2013) issued by COSO.
We have also audited, in accordance with the standards of the Public Company Accounting Oversight Board (United States) (PCAOB), the consolidated financial statements as of and for the year ended December 31, 2022, of the Company and our report dated March 9, 2023, expressed an unqualified opinion on those financial statements.
As described in Management’s Annual Report on Internal Control over Financial Reporting, management excluded from its assessment the internal control over financial reporting at First Heritage Credit LLC, which was acquired on July 13, 2022, whose financial statements constitute 9.0% of total assets, and 5.3% of revenues of the consolidated financial statement amount as of and for the year ended December 31, 2022. Accordingly, our audit did not include the internal control over financial reporting at First Heritage Credit LLC.
Basis for Opinion
The Company’s management is responsible for maintaining effective internal control over financial reporting and for its assessment of the effectiveness of internal control over financial reporting, included in the accompanying Management's Annual Report on Internal Control over Financial Reporting. Our responsibility is to express an opinion on the Company’s internal control over financial reporting based on our audit. We are a public accounting firm registered with the PCAOB and are required to be independent with respect to the Company in accordance with the U.S. federal securities laws and the applicable rules and regulations of the Securities and Exchange Commission and the PCAOB.
We conducted our audit in accordance with the standards of the PCAOB. Those standards require that we plan and perform the audit to obtain reasonable assurance about whether effective internal control over financial reporting was maintained in all material respects. Our audit included obtaining an understanding of internal control over financial reporting, assessing the risk that a material weakness exists, testing and evaluating the design and operating effectiveness of internal control based on the assessed risk, and performing such other procedures as we considered necessary in the circumstances. We believe that our audit provides a reasonable basis for our opinion.
Definition and Limitations of Internal Control over Financial Reporting
A company’s internal control over financial reporting is a process designed to provide reasonable assurance regarding the reliability of financial reporting and the preparation of financial statements for external purposes in accordance with generally accepted accounting principles. A company’s internal control over financial reporting includes those policies and procedures that (1) pertain to the maintenance of records that, in reasonable detail, accurately and fairly reflect the transactions and dispositions of the assets of the company; (2) provide reasonable assurance that transactions are recorded as necessary to permit preparation of financial statements in accordance with generally accepted accounting principles, and that receipts and expenditures of the company are being made only in accordance with authorizations of management and directors of the company; and (3) provide reasonable assurance regarding prevention or timely detection of unauthorized acquisition, use, or disposition of the company’s assets that could have a material effect on the financial statements.
Because of its inherent limitations, internal control over financial reporting may not prevent or detect misstatements. Also, projections of any evaluation of effectiveness to future periods are subject to the risk that controls may become inadequate because of changes in conditions, or that the degree of compliance with the policies or procedures may deteriorate.
/s/ Deloitte & Touche LLP
Chicago, Illinois
March 9, 2023
CURO GROUP HOLDINGS CORP. AND SUBSIDIARIES
CONSOLIDATED BALANCE SHEETS
(in thousands, except share data)
| | | | | | | | | | | | | | |
| December 31, 2022 | | December 31,
2021 | | | |
| | | | |
| ASSETS | | | |
| Cash and cash equivalents | $ | 73,932 | | | $ | 63,179 | | | | |
Restricted cash (includes restricted cash of consolidated VIEs of $52,277 and $57,155 as of December 31, 2022 and December 31, 2021, respectively) | 91,745 | | | 98,896 | | | | |
Gross loans receivable (includes loans of consolidated VIEs of $1,964,275 and $1,294,706 as of December 31, 2022 and December 31, 2021, respectively) | 2,087,833 | | | 1,548,318 | | | | |
Less: Allowance for loan losses (includes allowance for loan losses of consolidated VIEs of $108,451 and $66,618 as of December 31, 2022 and December 31, 2021, respectively) | (122,028) | | | (87,560) | | | | |
Loans receivable, net | 1,965,805 | | | 1,460,758 | | | | |
| Income taxes receivable | 21,918 | | | 31,774 | | | | |
Prepaid expenses and other (includes prepaid expenses and other of consolidated VIEs of $12,908 and $— as of December 31, 2022 and December 31, 2021, respectively) | 53,057 | | | 42,038 | | | | |
| Property and equipment, net | 31,957 | | | 54,635 | | | | |
| Investment in Katapult | 23,915 | | | 27,900 | | | | |
| Right of use asset - operating leases | 61,197 | | | 116,300 | | | | |
| Deferred tax assets | 49,893 | | | 15,639 | | | | |
| Goodwill | 276,269 | | | 429,792 | | | | |
| Intangibles, net | 123,677 | | | 109,930 | | | | |
| Other assets | 15,828 | | | 9,755 | | | | |
| Total Assets | $ | 2,789,193 | | | $ | 2,460,596 | | | | |
| LIABILITIES AND STOCKHOLDERS' EQUITY | | | | | | |
| Liabilities | | | | | | |
Accounts payable and accrued liabilities (includes accounts payable and accrued liabilities of consolidated VIEs of $13,571 and $9,886 as of December 31, 2022 and December 31, 2021, respectively) | $ | 73,827 | | | $ | 121,434 | | | | |
| Deferred revenue | 32,259 | | | 21,649 | | | | |
| Lease liability - operating leases | 62,847 | | | 122,431 | | | | |
| Contingent consideration related to acquisition | 16,884 | | | 26,508 | | | | |
| Income taxes payable | — | | | 680 | | | | |
Accrued interest (includes accrued interest of consolidated VIEs of $7,023 and $3,279 as of December 31, 2022 and December 31, 2021, respectively) | 38,460 | | | 34,974 | | | | |
| Liability for losses on CSO lender-owned consumer loans | — | | | 6,908 | | | | |
Debt (includes debt and issuance costs of consolidated VIEs of $1,609,427 and $20,047 as of December 31, 2022 and $979,500 and $14,428 as of December 31, 2021, respectively) | 2,607,314 | | | 1,945,793 | | | | |
| Other long-term liabilities | 11,736 | | | 13,845 | | | | |
| Deferred tax liabilities | — | | | 6,044 | | | | |
| Total Liabilities | 2,843,327 | | | 2,300,266 | | | | |
Commitments and contingencies (Note 7) | | | | | | |
| Stockholders' Equity | | | | | | |
Preferred stock - $0.001 par value, 25,000,000 shares authorized; no shares were issued | — | | | — | | | | |
Common stock - $0.001 par value; 225,000,000 shares authorized; 50,216,165 and 49,684,080 shares issued; and 40,518,052 and 40,810,444 shares outstanding at the respective period ends | 23 | | | 23 | | | | |
Treasury stock, at cost - 9,698,113 and 8,873,636 shares at the respective period ends | (136,832) | | | (124,302) | | | | |
| Paid-in capital | 124,483 | | | 113,520 | | | | |
| Retained earnings | 4,268 | | | 203,467 | | | | |
| Accumulated other comprehensive loss | (46,076) | | | (32,378) | | | | |
| Total Stockholders' (Deficit) Equity | (54,134) | | | 160,330 | | | | |
| Total Liabilities and Stockholders' (Deficit) Equity | $ | 2,789,193 | | | $ | 2,460,596 | | | | |
See accompanying Notes to Consolidated Financial Statements.
CURO GROUP HOLDINGS CORP. AND SUBSIDIARIES
CONSOLIDATED STATEMENTS OF OPERATIONS
(in thousands, except per share data)
| | | | | | | | | | | | | | | | | | | | | |
| | | For the Year Ended
December 31, |
| | | | | 2022 | | 2021 | | 2020 |
| Revenue | | | | | | | | | |
| Interest and fees revenue | | | | | $ | 905,407 | | | $ | 743,735 | | | $ | 788,188 | |
| Insurance premiums and commissions | | | | | 88,490 | | | 49,411 | | | 35,553 | |
| Other revenue | | | | | 32,021 | | | 24,697 | | | 23,655 | |
| Total revenue | | | | | 1,025,918 | | | 817,843 | | | 847,396 | |
| Provision for losses | | | | | 400,325 | | | 245,668 | | | 288,811 | |
| Net revenue | | | | | 625,593 | | | 572,175 | | | 558,585 | |
| Operating Expenses | | | | | | | | | |
| Salaries and benefits | | | | | 281,636 | | | 237,109 | | | 196,817 | |
| Occupancy | | | | | 59,485 | | | 55,559 | | | 57,271 | |
| Advertising | | | | | 32,143 | | | 38,762 | | | 44,552 | |
| Direct operations | | | | | 64,128 | | | 60,056 | | | 46,893 | |
| Depreciation and amortization | | | | | 36,322 | | | 26,955 | | | 17,498 | |
| Other operating expense | | | | | 82,811 | | | 68,473 | | | 47,048 | |
| Total operating expenses | | | | | 556,525 | | | 486,914 | | | 410,079 | |
| Other expense (income) | | | | | | | | | |
| Interest expense | | | | | 185,661 | | | 97,334 | | | 72,709 | |
| Loss (income) from equity method investment | | | | | 3,985 | | | (3,658) | | | (4,546) | |
| Gain from equity method investment | | | | | — | | | (135,387) | | | — | |
| Goodwill impairment | | | | | 145,241 | | | — | | | — | |
| Loss on extinguishment of debt | | | | | 4,391 | | | 40,206 | | | — | |
| (Gain) loss on change in fair value of contingent consideration | | | | | (7,605) | | | 6,209 | | | — | |
| Gain on sale of business | | | | | (68,443) | | | — | | | — | |
| Total other expense (income) | | | | | 263,230 | | | 4,704 | | | 68,163 | |
| (Loss) income from continuing operations before income taxes | | | | | (194,162) | | | 80,557 | | | 80,343 | |
| (Benefit) provision for income taxes | | | | | (8,678) | | | 21,223 | | | 5,895 | |
| Net (loss) income from continuing operations | | | | | $ | (185,484) | | | $ | 59,334 | | | $ | 74,448 | |
| Income from discontinued operations, before income taxes | | | | | — | | | — | | | 1,714 | |
| Income tax expense related to disposition | | | | | — | | | — | | | 429 | |
| Net income from discontinued operations | | | | | — | | | — | | | 1,285 | |
| Net (loss) income | | | | | (185,484) | | | 59,334 | | | 75,733 | |
| | | | | | | | | |
| Basic (loss) earnings per share: | | | | | | | | | |
| Continuing operations | | | | | $ | (4.59) | | | $ | 1.44 | | | $ | 1.82 | |
| Discontinued operations | | | | | — | | | — | | | 0.03 | |
| Basic (loss) earnings per share | | | | | $ | (4.59) | | | $ | 1.44 | | | $ | 1.85 | |
| | | | | | | | | |
| Diluted (loss) earnings per share: | | | | | | | | | |
| Continuing operations | | | | | $ | (4.59) | | | $ | 1.38 | | | $ | 1.77 | |
| Discontinued operations | | | | | — | | | — | | | 0.03 | |
| Diluted (loss) earnings per share | | | | | $ | (4.59) | | | $ | 1.38 | | | $ | 1.80 | |
| | | | | | | | | |
| Weighted average common shares outstanding: | | | | | | | | | |
| Basic | | | | | 40,428 | | | 41,155 | | | 40,886 | |
| Diluted | | | | | 40,428 | | | 43,143 | | | 42,091 | |
See accompanying Notes to Consolidated Financial Statements.
CURO GROUP HOLDINGS CORP. AND SUBSIDIARIES
CONSOLIDATED STATEMENTS OF COMPREHENSIVE (LOSS) INCOME
(in thousands)
| | | | | | | | | | | | | | | | | | | | | |
| | | For the Year Ended
December 31, |
| | | | | 2022 | | 2021 | | 2020 |
| Net (loss) income | | | | | $ | (185,484) | | | $ | 59,334 | | | $ | 75,733 | |
| Other comprehensive (loss) income, net of tax: | | | | | | | | | |
| Change in derivative instruments designated as cash flow hedges, net of tax | | | | | 5,333 | | | — | | | — | |
| Foreign currency translation adjustment, net of tax | | | | | (19,031) | | | (2,246) | | | 8,531 | |
| Other comprehensive (loss) income, net of tax | | | | | (13,698) | | | (2,246) | | | 8,531 | |
| Comprehensive (loss) income | | | | | $ | (199,182) | | | $ | 57,088 | | | $ | 84,264 | |
See accompanying Notes to Consolidated Financial Statements.
CURO GROUP HOLDINGS CORP. AND SUBSIDIARIES
CONSOLIDATED STATEMENTS OF CHANGES IN EQUITY
(in thousands, except share data)
| | | | | | | | | | | | | | | | | | | | | | | | | | | | | | | | | | | | | | | | | |
| Common Stock | | Treasury Stock, at cost | | Paid-in capital | | Retained Earnings (Deficit) | | AOCI (1) | | Total Stockholders' Equity |
| | | | | | | | |
| | | | | | | | | | | | | |
| | | | | | | | | | | | | |
| | | | | | | | | | | | | |
| | | | | | | | | | | | | |
| | | | | | | | | | | | | |
| | | | | | | | | | | | | |
| | | | | | | | | | | | | |
| | | | | | | | | | | | | |
| | | | | | | | | | | | | |
| | | | | | | | | | | | | |
| | | | | | | | | | | | | |
| | | | | | | | | | | | | |
| | | | | | | | | | | | | |
| | | | | | | | | | | | | |
| | | | | | | | | | | | | |
| | | | | | | | | | | | | |
| | | | | | | | | | | | | |
| | | | | | | | | | | | | |
| | | | | | | | | | | | | |
| | | | | | | | | | | | | |
| | | | | | | | | | | | | |
| Balances at December 31, 2019 | 41,156,224 | | | $ | 9 | | | $ | (72,343) | | | $ | 68,087 | | | $ | 93,423 | | | $ | (38,663) | | | $ | 50,513 | |
| Net income | — | | | — | | | — | | | — | | | 75,733 | | | — | | | 75,733 | |
| Foreign currency translation adjustment and other | — | | | — | | | — | | | — | | | — | | | 8,531 | | | 8,531 | |
| Dividends | — | | | — | | | — | | | — | | | (9,088) | | | — | | | (9,088) | |
| Share-based compensation | — | | | — | | | — | | | 12,910 | | | — | | | — | | | 12,910 | |
| Proceeds from exercise of stock options | 274,510 | | | — | | | — | | | 765 | | | — | | | — | | | 765 | |
| Repurchase of common stock | (540,762) | | | — | | | (5,509) | | | — | | | — | | | — | | | (5,509) | |
| Net settlement of share-based awards | 480,532 | | | — | | | — | | | (1,950) | | | — | | | — | | | (1,950) | |
| Balances at December 31, 2020 | 41,370,504 | | | $ | 9 | | | $ | (77,852) | | | $ | 79,812 | | | $ | 160,068 | | | $ | (30,132) | | | $ | 131,905 | |
| Net income | — | | | — | | | — | | | — | | | 59,334 | | | — | | | 59,334 | |
| Foreign currency translation adjustment and other | — | | | — | | | — | | | — | | | — | | | (2,246) | | | (2,246) | |
| Dividends | — | | | — | | | — | | | — | | | (15,935) | | | — | | | (15,935) | |
| Common stock issued for acquisition of Heights Finance | 1,446,257 | | | 14 | | | — | | | 24,355 | | | — | | | — | | | 24,369 | |
| Share-based compensation | — | | | — | | | — | | | 13,976 | | | — | | | — | | | 13,976 | |
| Proceeds from exercise of stock options | 66,972 | | | — | | | — | | | 272 | | | — | | | — | | | 272 | |
Repurchase of common stock (2) | (2,718,333) | | | — | | | (46,450) | | | — | | | — | | | — | | | (46,450) | |
| Net settlement of share-based awards | 645,044 | | | — | | | — | | | (4,895) | | | — | | | — | | | (4,895) | |
| Balances at December 31, 2021 | 40,810,444 | | | $ | 23 | | | $ | (124,302) | | | $ | 113,520 | | | $ | 203,467 | | | $ | (32,378) | | | $ | 160,330 | |
| Net loss | — | | | — | | | — | | | — | | | (185,484) | | | | | (185,484) | |
| Other comprehensive loss, net of tax | — | | | — | | | — | | | — | | | — | | | (13,698) | | | (13,698) | |
| Dividends | — | | | — | | | — | | | — | | | (13,715) | | | — | | | (13,715) | |
| Share based compensation expense | — | | | — | | | — | | | 13,957 | | | — | | | — | | | 13,957 | |
| Repurchase of common stock | (824,477) | | | — | | | (12,530) | | | — | | | — | | | — | | | (12,530) | |
| Common stock issued for RSUs vesting, net of shares withheld and withholding paid for employee taxes | 532,085 | | | — | | | | | (2,994) | | | — | | | — | | | (2,994) | |
| Balances at December 31, 2022 | 40,518,052 | | | $ | 23 | | | $ | (136,832) | | | $ | 124,483 | | | $ | 4,268 | | | $ | (46,076) | | | $ | (54,134) | |
(1) Accumulated other comprehensive income (loss) |
(2)Includes the repurchase of 500,000 shares of common stock from a related party for $18.10 per share. See Note 23, "Share Repurchase Program" for additional information. |
See the accompanying Notes to Consolidated Financial Statements
CURO GROUP HOLDINGS CORP. AND SUBSIDIARIES
CONSOLIDATED STATEMENT OF CASH FLOWS
(dollars in thousands)
| | | | | | | | | | | | | | | | | |
| For the Year Ended
December 31, |
| 2022 | | 2021 | | 2020 |
| Cash flows from operating activities | | | | | |
| Net (loss) income | $ | (185,484) | | | $ | 59,334 | | | $ | 74,448 | |
Adjustments to reconcile net income to net cash provided by operating activities: | | | | | |
| Depreciation and amortization | 36,322 | | | 26,955 | | | 17,498 | |
| Provision for losses | 400,325 | | | 245,668 | | | 288,811 | |
| Amortization of debt issuance costs and bond discount | 11,315 | | | 6,871 | | | 3,935 | |
| Loss on extinguishment of debt | 4,391 | | | 40,206 | | | — | |
| Deferred income tax benefit | (38,254) | | | (18,297) | | | 11,691 | |
| Gain on disposal of Legacy U.S. Direct Lending business | (68,443) | | | — | | | — | |
| Loss on disposal of property and equipment | 4,420 | | | 7,054 | | | 150 | |
| Loss from equity method investment | 3,985 | | | (3,658) | | | (4,546) | |
| Impairment loss (gain) from equity method investment | — | | | (135,387) | | | — | |
| Change in fair value of contingent consideration | (7,605) | | | 6,209 | | | — | |
| Share-based compensation | 13,957 | | | 13,976 | | | 12,910 | |
| Goodwill impairment | 145,241 | | | — | | | — | |
| Changes in operating assets and liabilities: | | | | | |
| Accrued interest on loans receivable | (37,257) | | | 8,751 | | | 23,714 | |
| Prepaid expenses and other assets | 15,003 | | | (6,053) | | | 8,058 | |
| Accounts payable and accrued liabilities | (46,624) | | | 43,832 | | | (11,876) | |
| Deferred revenue | 17,765 | | | 16,581 | | | (4,769) | |
| Income taxes payable | (9,088) | | | 678 | | | — | |
| Income taxes receivable | 17,892 | | | 3,829 | | | (20,603) | |
| Accrued interest | 3,624 | | | 13,069 | | | 264 | |
| Other long-term liabilities | 3,122 | | | (6,445) | | | 3,820 | |
| Net cash provided by continuing operating activities | 284,607 | | | 323,173 | | | 403,505 | |
| Net cash provided by (used in) discontinued operating activities | — | | | — | | | 1,714 | |
| Net cash provided by operating activities | 284,607 | | | 323,173 | | | 405,219 | |
| Cash flows from investing activities | | | | | |
| Purchase of property, equipment and software | (45,821) | | | (23,648) | | | (10,920) | |
| Loans receivable originated or acquired | (2,554,947) | | | (1,517,275) | | | (1,296,398) | |
| Loans receivable repaid | 1,664,851 | | | 928,302 | | | 1,079,437 | |
| Proceeds from Katapult | | | 136,879 | | | (12,757) | |
| Acquisition of Ad Astra, net of acquiree's cash received | — | | | — | | | (14,418) | |
| Acquisition of Flexiti, net of acquiree's cash received | | | (91,203) | | | — | |
| Acquisition of Heights Finance, net of acquiree's cash received | — | | | (356,543) | | | — | |
| Divestiture of Legacy U.S. Direct Lending Business, net of cash provided | 288,980 | | | — | | | — | |
| Acquisition of First Heritage, net of acquiree's cash received | (131,012) | | | — | | | — | |
| Net cash used in investing activities | (777,949) | | | (923,488) | | | (255,056) | |
| Cash flows from financing activities | | | | | |
| Proceeds from SPV and SPE facilities | 1,724,600 | | | 549,511 | | | 73,037 | |
| Payments on SPV and SPE facilities | (1,175,047) | | | (244,577) | | | (42,535) | |
| Debt issuance costs paid | (19,252) | | | (26,387) | | | (6,992) | |
| Proceeds from credit facilities | 169,496 | | | 68,108 | | | 69,947 | |
| Payments on credit facilities | (169,496) | | | (68,108) | | | (69,947) | |
Extinguishment of 8.25% Senior Secured Notes | — | | | (690,000) | | | — | |
Proceeds from issuance of 7.50% Senior Secured Notes | — | | | 1,000,000 | | | — | |
| Payments of call premiums from early debt extinguishments | — | | | (31,250) | | | — | |
| Proceeds from exercise of stock options | — | | | 272 | | | 765 | |
| Payments to net share settle equity awards | (2,994) | | | (4,895) | | | (1,950) | |
| Repurchase of common stock | (12,530) | | | (45,448) | | | (5,908) | |
| Dividends paid to stockholders | (13,715) | | | (15,935) | | | (9,088) | |
| Net cash provided by financing activities | 501,062 | | | 491,291 | | | 7,329 | |
| Effect of exchange rate changes on cash, cash equivalents and restricted cash | (4,118) | | | 2,991 | | | 595 | |
| Net increase in cash, cash equivalents and restricted cash | 3,602 | | | (106,033) | | | 158,087 | |
| Cash, cash equivalents and restricted cash at beginning of period | 162,075 | | | 268,108 | | | 110,021 | |
| Cash, cash equivalents and restricted cash at end of period | $ | 165,677 | | | $ | 162,075 | | | $ | 268,108 | |
CURO GROUP HOLDINGS CORP. AND SUBSIDIARIES
CONSOLIDATED STATEMENT OF CASH FLOWS
(dollars in thousands)
SUPPLEMENTAL CASH FLOW INFORMATION
The following table provides a reconciliation of cash, cash equivalents and restricted cash reported within the Consolidated Balance Sheets as of December 31, 2022, 2021 and 2020 to the cash, cash equivalents and restricted cash used in the Statement of Cash Flows (in thousands):
| | | | | | | | | | | | | | | | | | | | |
| | December 31, |
| | 2022 | | 2021 | | 2020 |
| Cash and cash equivalents | | $ | 73,932 | | | $ | 63,179 | | | $ | 213,343 | |
Restricted cash (includes restricted cash of consolidated VIEs of $52,277 and $57,155 as of December 31, 2022 and December 31, 2021, respectively) | | 91,745 | | | 98,896 | | | 54,765 | |
| Total cash, cash equivalents and restricted cash used in the Statement of Cash Flows | | $ | 165,677 | | | $ | 162,075 | | | $ | 268,108 | |
The following table provides supplemental cash flow information for the periods indicated (in thousands):
| | | | | | | | | | | | | | | | | |
| Year Ended December 31, |
| 2022 | | 2021 | | 2020 |
| Cash paid for: | | | | | |
| Interest | $ | 162,365 | | | $ | 81,536 | | | $ | 69,212 | |
| Income taxes, net of refunds | 15,646 | | | 34,878 | | | 15,841 | |
| Non-cash investing activities: | | | | | |
| Property and equipment accrued in accounts payable | 444 | | | 883 | | | 861 | |
See accompanying Notes to Consolidated Financial Statements.
CURO GROUP HOLDINGS CORP. AND SUBSIDIARIES
NOTES TO CONSOLIDATED FINANCIAL STATEMENTS
NOTE 1 – SUMMARY OF SIGNIFICANT ACCOUNTING POLICIES AND NATURE OF OPERATIONS
Nature of Operations
The terms “CURO" and the “Company” refer to CURO Group Holdings Corp. and its direct and indirect subsidiaries as a combined entity, except where otherwise stated.
The Company is a full-spectrum consumer credit lender serving U.S. and Canadian customers for over 25 years. Our roots in the consumer finance market run deep. We have worked diligently to provide customers a variety of convenient, easily accessible financial services. Our decades of alternative data power a hard-to-replicate underwriting and scoring engine, mitigating risk across the full spectrum of credit products.
In the U.S., CURO operates under several principal brands, including "Covington Credit," "Heights Finance," "Quick Credit," "Southern Finance" and "First Heritage Credit." Until July 2022, CURO also operated under "Speedy Cash," "Rapid Cash" and "Avio Credit." As of December 31, 2022, our store network consisted of 496 U.S. retail locations across 13 states.
In Canada, we operate under “Cash Money” and “LendDirect” direct lending brands and the "Flexiti" point-of-sale brand. As of December 31, 2022, we operated our direct lending and online services in eight Canadian provinces and one Canadian territory. Our point-of-sale operations are available at over 8,400 retail locations and over 3,500 merchant partners across 10 provinces and two territories.
Following the acquisitions in 2022 and 2021, the Company reports Flexiti operations as the "Canada POS Lending" segment and First Heritage and Heights Finance operations within the U.S. Direct Lending segment throughout this 2022 Form 10-K. Refer to Note 13, "Segment Reporting" for further information.
The Company has prepared the accompanying audited Consolidated Financial Statements in accordance with U.S. GAAP. The Company will continue to take advantage of the scaled disclosure requirements permitted by the SEC as a Smaller Reporting Company (SRC) for the periods presented. SRC status is determined on an annual basis as of the last business day of the most recently completed second fiscal quarter. Under these rules, the Company met the definition of an SRC as of June 30, 2022 and has elected to continue to report as an SRC. The Company will reevaluate its status as of June 30, 2023.
Revised Revenue Presentation
Beginning in the first quarter of 2022, the Company started reporting "Interest and fees revenue," "Insurance premiums and commissions" and "Other revenue" in place of the previously reported "Revenue" line item in the Consolidated Statements of Operations. Prior period amounts have been reclassified to conform with current period presentation.
Revised Operating Expense Presentation
Beginning in the fourth quarter of 2021, the Company revised its presentation of operating expenses in the Consolidated Statement of Operations. Where applicable, prior period amounts have been reclassified to conform to the current period presentation. These changes had no impact on the Company's previously reported consolidated results of operations or financial position.
U.K. Segment Financial Information Recast for Discontinued Operations
On February 25, 2019, the Company placed its U.K. segment into administration, which resulted in treatment of the U.K. segment as discontinued operations for all periods presented. Throughout this report, financial information for all periods are presented on a continuing operations basis, excluding the results and positions of the U.K. segment. See Note 22, "Discontinued Operations" for additional information.
Principles of Consolidation
The Consolidated Financial Statements reflect the accounts of CURO and its direct and indirect subsidiaries, including the divestiture of the Legacy U.S.Direct Lending Business on July 8, 2022 and the acquisition of First Heritage on July 13, 2022. Refer to Note 14, "Acquisitions and Divestiture" for further disclosures related to these acquisitions. Intercompany transactions and balances have been eliminated in consolidation.
Use of Estimates
The preparation of the Consolidated Financial Statements in conformity with U.S. GAAP requires management to make estimates and assumptions, including those impacted by COVID-19, that affect the reported amounts of assets and liabilities and the disclosure of contingent assets and liabilities at the date of the financial statements. Some estimates may also affect the reported
CURO GROUP HOLDINGS CORP. AND SUBSIDIARIES
NOTES TO CONSOLIDATED FINANCIAL STATEMENTS (continued)
amounts of revenues and expenses during the periods presented. Significant estimates that the Company made in the accompanying Consolidated Financial Statements include ALL, certain assumptions related to equity investments, goodwill and intangibles, accruals related to self-insurance, CSO liability for losses, estimated tax liabilities and the accounting for the First Heritage, Heights Finance and Flexiti acquisitions. Actual results may differ from those estimates.
Acquisitions
First Heritage
On July 13, 2022, CURO closed the acquisition of First Heritage, a consumer lender that provides near-prime installment loans along with customary opt-in insurance and other financial products, for a total purchase price of $140.0 million in cash.
Heights Finance
On December 27, 2021, CURO closed the acquisition of Heights Finance, a consumer finance company that provides Installment loans and offers customary opt-in insurance and other financial products, for a total purchase price of $360.0 million ($335.0 million in cash plus $25.0 million in stock).
Flexiti
On March 10, 2021, CURO closed its acquisition of Flexiti, a POS and BNPL provider based in Toronto, Ontario, in a transaction accounted for as a business combination, for a total purchase price of up to $122.5 million ($86.5 million in cash and up to $32.8 million in contingent cash consideration subject to future operating metrics).
Ad Astra
On January 3, 2020, the Company acquired 100% of the outstanding stock of Ad Astra, a related party, for $14.4 million, net of cash received. Prior to the acquisition, Ad Astra was the Company's exclusive provider of third-party collection services for owned and managed loans in the U.S. that are in later-stage delinquency. Ad Astra, now a wholly-owned subsidiary, is included in the Consolidated Financial Statements. Upon the sale of the Legacy U.S. Direct Lending Business in July 2022, Ad Astra continued to service these loans as part of the Transition Services Agreement with Community Choice Financial. In January 2023, the Company ceased operations of Ad Astra. Refer to Note 24, "Subsequent Events" for further discussion on Ad Astra.
Divestiture
Legacy U.S. Direct Lending Business
On July 8, 2022, the Company completed the divestiture of its Legacy U.S. Direct Lending Business to Community Choice Financial, for total cash of $345.0 million, of which $35.0 million is payable over 12 months. The divestiture resulted in a gain of $68.4 million for the three and nine months ended September 30, 2022, which was recorded in "Gain on sale of business" on the Consolidated Statement of Operations.
As a result of this sale, the Company no longer guarantees loans originated by third-party lenders through CSO programs. As such the Company's results of operations discussed in the following paragraphs only include the results from the CSO program through July 8, 2022.
Refer to Note 14, "Acquisitions and Divestiture" for further information regarding the divestiture and Note 4, "Goodwill" for the impact to the Company's goodwill balance as a result of the divestiture.
Change in Accounting Principle Related to Equity Method Investment in Katapult
CURO first invested in Katapult in 2017 and increased its investment in later years. Katapult is an e-commerce focused, FinTech company offering an innovative lease financing solution to consumers and enabling essential transactions at the merchant POS. The Company accounted for its investment in Katapult under the equity method of accounting as of December 31, 2022. Refer to Note 5, "Fair Value Measurements" for further information regarding the accounting for the Company's investment in Katapult.
CURO GROUP HOLDINGS CORP. AND SUBSIDIARIES
NOTES TO CONSOLIDATED FINANCIAL STATEMENTS (continued)
Historically, the Company reported income and loss from its equity method investment in Katapult on a two-month reporting lag. The merger between Katapult and FinServ in June 2021 triggered a change in Katapult's control environment and reporting structure to coincide with SEC reporting requirements. As a result, during the first quarter of 2021, the Company applied a change in accounting principle to reflect the Company's share of Katapult's historical and ongoing results from a two-month reporting lag to a one-quarter reporting lag. The Company believes this change in accounting principle is preferable as it provides the Company with the ability to present the results of its equity method investment after Katapult’s results are publicly available and related internal controls have been completed. The Company has not retrospectively applied the change in accounting principle because the impact on the financial statements was immaterial for all periods presented.
Impacts of COVID-19
As a result of COVID-19, our customers and their overall credit performance were impacted through the years ended December 31, 2022, 2021 and 2020. We have maintained our historical allowance approach, but have adjusted estimates for changes in past-due gross loans receivable due to market conditions.
Revenue Recognition
As a result of the sale of the Legacy U.S. Direct Lending Business on July 8, 2022, the Company no longer guarantees loans originated by third-party lenders through CSO programs. As such, the Company's results of operations discussed below only include the results from the CSO program through July 8, 2022. Refer to Note 14, "Acquisitions and Divestiture" for additional information.
CURO offers a broad range of consumer finance products including Revolving LOC, Unsecured Installment, Secured Installment and Single-Pay loans. Revenue in the Consolidated Statements of Operations includes: interest income, Merchant Discount Revenue ("MDR"), finance charges, CSO fees, late fees, insurance protection fees, non-sufficient funds fees and other ancillary fees. Product offerings differ and are governed by laws in each jurisdiction.
Revolving LOC revenues include interest income on outstanding revolving balances, MDR related to Canada POS Lending and other usage or maintenance fees as permitted by underlying statutes. Revolving LOC loans have a periodic payment that is a fixed percentage of the customer’s outstanding loan balance, and there is no defined loan term. The Company records revenue from Revolving LOC loans on a simple-interest basis. Accrued interest and fees are included in gross loans receivable in the Consolidated Balance Sheets.
Installment revenue is comprised of both unsecured and secured installment revenue, which includes interest income and non-sufficient-funds or returned-items fees on late or defaulted payments on past-due loans, known as late fees. Late fees comprise less than 1% of Installment revenues. Installment loans are fully amortizing, with a fixed payment amount, which includes principal and accrued interest, due each period during the loan term. The loan terms for Installment loans can range up to 60 months depending on state or provincial regulations. The Company records revenue from Installment loans on a simple-interest basis. Accrued interest and fees are included in gross loans receivable in the Consolidated Balance Sheets as earned. CSO fees are recognized ratably over the term of the loan as earned. Secured Installment loans are similar to Unsecured Installment loans but are secured by a clear vehicle title or security interest in the vehicle.
Single-Pay loan revenue, a component of installment revenue, consists primarily of unsecured, short-term, small denomination loans, with a small portion being auto title loans, which allow a customer to obtain a loan using their car as collateral. Revenues from Single-Pay loan products are recognized under the Installment revenue product. Revenues are recognized each period on a constant-yield basis ratably over the term of each loan as earned. The Company defers recognition of the unearned fees the Company expects to collect based on the remaining term of the loan at the end of each reporting period.
Insurance premiums, commissions and other revenue includes revenue from a number of financial products such as check cashing, demand deposit accounts, optional credit protection insurance and money transfer services. Check cashing fees, money order fees and other fees from ancillary products and services are generally recognized at the POS when the transaction is completed. The sale of credit protection insurance and additional insurance the Company now offers as a result of the acquisition of Heights Finance and First Heritage are recognized ratably over the term of the loan. The Company is required to maintain an actuarial determined reserve for Heights Finance insurance products due to its reinsurance activities. As of December 31, 2022, the reserve was $1.9 million and is reported in "Accounts payable and accrued liabilities" in the Consolidated Balance Sheet.
Merchant Discount Revenue
Following the acquisition of Flexiti, the Company recognizes MDR, which represents a fee charged to merchant partners to facilitate customer purchases at merchant locations. The fee is recorded as unearned revenue when received and recognized over the expected loan term. The amount of fees charged, or merchant discount, is generally deducted from the payment to the merchant at the time a customer enters into a POS transaction with the merchant. The merchant discount rate is individually
CURO GROUP HOLDINGS CORP. AND SUBSIDIARIES
NOTES TO CONSOLIDATED FINANCIAL STATEMENTS (continued)
negotiated between the Company and each merchant and is initially recorded as deferred revenue upon the completion of each POS transaction.
Cash and cash equivalents
The Company considers deposits in banks and short-term investments with original maturities of 90 days or less as cash and cash equivalents.
Restricted Cash
The Company's restricted cash includes deposits in collateral accounts with financial institutions, consumer deposits related to prepaid cards and checking account programs and funds related to loan facilities disclosed in Note 3, "Variable Interest Entities." In connection with insurance products offered by Heights Finance, certain of the Company's cash is restricted by agreements with financial institutions to meet certain state licensing requirements as required under various reinsurance agreements. As of December 31, 2022, our restricted cash related balance included $21.4 million for the Heights Finance reinsurance program and $52.3 million held for funding facilities. See Note 3, "Variable Interest Entities" and Note 6, "Debt" for further discussion on these facilities.
Consumer Loans Receivable
Consumer loans receivable are net of the allowance for loan losses, unearned insurance, unearned interest and fees and unamortized fair value discount for acquired loans receivable and are comprised of Revolving LOC, Unsecured Installment, Secured Installment and Single-Pay loans.
Revolving LOC loans are lines of credit without a specified maturity date. Revolving LOC loans require periodic payments of principal and interest that is a fixed percentage of the customer's outstanding loan balance. Customers in good standing may draw against their line of credit, repay with minimum, partial or full payments and redraw as needed.
Unsecured Installment and Secured Installment loans are fully amortizing loans with a fixed payment amount due each period during the term of the loan. The loan terms for Unsecured Installment and Secured Installment loans can range up to 60 months, depending on state regulations. Secured Installment loans are typically collateralized by titled vehicles. Revolving LOC loans are primarily unsecured. The product offerings differ by jurisdiction and are governed by the laws in each jurisdiction.
Single-Pay loans are primarily unsecured, short-term, small denomination loans, with a small portion being auto title loans, which allow a customer to obtain a loan using their car as collateral. A Single-Pay loan transaction consists of providing a customer cash in exchange for the customer’s personal check or ACH authorization (in the aggregate amount of that cash plus a service fee), with an agreement to defer the presentment or deposit of that check or scheduled ACH withdrawal until the customer’s next payday, which is typically either two weeks or a month from the loan’s origination date. An auto title loan allows a customer to obtain a loan using the customer’s car as collateral for the loan, with a typical loan term of 30 days. Single-Pay loans are classified as Installment loans.
Current and Past-Due Loans Receivable
CURO classifies loans receivable as either current or past due. Single-Pay loans are considered past-due if a customer misses a scheduled payment, at which point the loan is charged-off. If a U.S. Direct Lending customer misses a scheduled payment for Revolving LOC or Installment loans, the entire customer balance is classified as past-due and is charged-off when the loan has been contractually past-due for 180 consecutive days. If a Canada Direct Lending or Legacy U.S. Direct Lending customer misses a scheduled payment for Revolving LOC or Installment loans, the entire customer balance is classified as past-due and is charged-off when the loan has been contractually past-due for 90 consecutive days. Canada POS Lending loans historically were charged-off when the loan was contractually past due for 180 days. Beginning January 1, 2023, Canada Direct Lending loans will have the same charge-off policy as U.S. Direct Lending loans. All loan receivables charge-off when notice of customer bankruptcy or consumer proposal has been received.
Allowance for Loan Losses
The Company maintains an ALL for loans and interest receivable at a level estimated to be adequate to absorb incurred losses based primarily on the Company's analysis of historical loss or charge-off rates for loans containing similar risk characteristics. The ALL on gross loans receivables reduces the outstanding gross loans receivables balance in the Consolidated Balance Sheets. Changes in the ALL, net of charge-offs and recoveries, are recorded as “Provision for losses” in the Consolidated Statements of Operations.
In addition to an analysis of historical loss and charge-off rates, the Company also considers delinquency trends and any macro-economic conditions that it believes may affect portfolio losses. If a loan is deemed to be uncollectible before it is fully reserved
CURO GROUP HOLDINGS CORP. AND SUBSIDIARIES
NOTES TO CONSOLIDATED FINANCIAL STATEMENTS (continued)
based on received information (e.g., receipt of customer bankruptcy notice or death), the Company charges off the loan at that time. Qualitative factors such as the impact of new loan products, changes to underwriting criteria or lending policies, new store development or entrance into new markets, changes in jurisdictional regulations or laws, recent credit trends and general economic conditions impact management’s judgment on the overall adequacy of the ALL. Any recoveries on loans previously charged to the ALL are credited to the ALL when collected.
Troubled Debt Restructuring
In certain circumstances, the Company modifies the terms of its loans receivable for borrowers. Under U.S. GAAP, a modification of loans receivable terms is considered a TDR if the borrower is experiencing financial difficulty and the Company grants a concession to the borrower it would not have otherwise granted under the terms of the original agreement. The Company modifies loans only if it believes the customer has the ability to pay under the restructured terms. The Company continues to accrue and collect interest on these loans in accordance with the restructured terms.
The Company records its ALL related to TDRs by discounting the estimated cash flows associated with the respective TDR at the effective interest rate immediately after the loan modification and records any difference between the discounted cash flows and the carrying value as an ALL adjustment. A loan that has been classified as a TDR remains so classified until the loan is paid off or charged-off. A TDR is charged off consistent with the Company's policies for the related loan product.
Loans Receivable on a Non-Accrual Basis
The Company may place loans receivable on non-accrual status due to statutory requirements or, if in management’s judgment, the timely collection of principal and interest becomes uncertain. After a loan is placed on non-accrual status, no further interest is accrued. Loans remain on non-accrual status until payment or charged-off. Payments are applied initially to any outstanding past due loan balances prior to current loan balances. Not all past-due payments will bring a loan off non-accrual status. The Company's policy for determining past due status is consistent with the accounts receivable aging disclosure.
Credit Services Organization
As a result of the sale of the Legacy U.S. Direct Lending Business on July 8, 2022, the Company no longer guarantees loans originated by third-party lenders through CSO programs. Refer to Note 14, "Acquisitions and Divestiture" for additional information. The paragraphs below outline the Company's accounting for the CSO program through July 8, 2022, the date of the divestiture of the CSO program.
Through the CSO programs, the Company acted as a CSO/CAB on behalf of customers in accordance with applicable state laws. The Company offered loans through CSO programs in stores and online in the state of Texas. As a CSO, CURO earned revenue by charging the customer a CSO fee for arranging an unrelated third-party to make a loan to that customer. When a customer executed an agreement with CURO under the CSO programs, the Company agreed, for a CSO fee payable to the Company by the customer, to provide certain services to the customer, one of which was to guarantee the customer’s obligation to repay the loan to the third-party lender. CSO fees were calculated based on the amount of the customer's outstanding loan. For CSO loans, each lender was responsible for providing the criteria by which the customer’s application was underwritten and, if approved, determining the amount of the customer loan. The Company was, in turn, responsible for assessing whether or not to guarantee the loan. This guarantee represented an obligation to purchase loans if they were charged-off.
CURO estimated a liability for losses associated with the guaranty provided to the CSO lenders using assumptions and methodologies similar to the ALL, which was recognized for the consumer loans and included as "Liability for losses on CSO lender-owned consumer loans" on the Consolidated Balance Sheets.
For services provided under the CSO programs, the Company received payments from customers on their scheduled loan repayment due dates. The CSO fee was earned ratably over the term of the loan as the customers made payments. If a loan was paid off early, no additional CSO fees were due or collected.
Since CSO loans were made by a third-party lender, they were not included in the Company's Consolidated Balance Sheets as loans receivable. CSO fees receivable were included in “Prepaid expenses and other” in the Consolidated Balance Sheets. The Company received cash from customers for these fees on their scheduled loan repayment due dates.
Variable Interest Entities
As part of its funding strategy and efforts to support the liquidity from sources other than the traditional capital market sources, the Company established a securitization program through the Heights SPV, First Heritage SPV, Flexiti SPV, Flexiti Securitization and Canada SPV facilities. See Note 3, "Variable Interest Entities" and Note 6, "Debt" for further discussion on these facilities. The
CURO GROUP HOLDINGS CORP. AND SUBSIDIARIES
NOTES TO CONSOLIDATED FINANCIAL STATEMENTS (continued)
Company transfers certain consumer loan receivables to the VIEs that issues term notes backed by the underlying consumer loan receivables which are serviced by other wholly-owned subsidiaries.
For each facility, the Company has the ability to direct the activities of the VIE that most significantly impact the economic performance of the entities as the servicer of the securitized loan receivables. Additionally, CURO has the right to receive residual payments, which exposes the Company to the potential for significant losses and returns. Accordingly, the Company determined that they are the primary beneficiary of the VIEs and are required to consolidate them.
Derivatives
As foreign currency exchange rates change, translation of the financial results of the Canadian operations into U.S. Dollars are impacted. Operations in Canada represent a significant portion of total operations, and material changes in the currency exchange rates as between these two countries could have a significant impact on the Company's consolidated financial condition, results of operations or cash flows. The Company may elect to purchase derivatives to hedge exposures that would qualify as a cash flow or fair value hedge. The Company records derivative instruments at fair value as either an asset or liability on the Consolidated Balance Sheet. Changes in the derivative instruments' intrinsic value, to the extent that they are effective as a hedge, are recorded in Other comprehensive income (loss). For derivatives that qualify and have been designated as cash flow or fair value hedges for accounting purposes, the changes in fair value have no net impact on earnings, to the extent the derivative is considered perfectly effective in achieving offsetting changes in fair value or cash flows attributable to the risk being hedged, until the hedged item is recognized in earnings (commonly referred to as the “hedge accounting” method). During the year ended December 31, 2022, the Company entered into interest rate swaps on both the Flexiti SPV and Flexiti Securitization facilities. See Note 6, "Debt" for further discussion on these facilities.
Property and Equipment
Property and equipment is carried at cost less accumulated depreciation and amortization, except for property and equipment accounted for as part of a business combination, which is carried at fair value as of the acquisition date less accumulated depreciation and amortization. Expenditures for significant additions and improvements are capitalized. Maintenance repairs and renewals, that do not materially add to the fixed asset's value or appreciably prolong its life, are charged to expense as incurred. Gains and losses on dispositions of property and equipment are included in results of operations.
The estimated useful lives for furniture, fixtures and equipment are five years to seven years. The estimated useful lives for leasehold improvements can vary from five years to 15 years, not to exceed the remaining term of the lease. Depreciation and amortization are computed using the straight-line method over the estimated useful lives of the depreciable or amortizable assets.
Business Combination Accounting
Business combination accounting requires that the Company determines the fair value of all assets acquired, including identifiable intangible assets, liabilities assumed and contingent consideration issued in a business combination. The cost of the acquisition is allocated to these assets and liabilities in amounts equal to the estimated fair value of each asset and liability as of the acquisition date, and any remaining acquisition cost is classified as goodwill. This allocation process requires extensive use of estimates and assumptions, including estimates of future cash flows to be generated by the acquired assets. The Company engages third-party appraisal firms to assist in fair value determination when appropriate. The acquisitions may also include contingent consideration, or earn-out provisions, which provide for additional consideration to be paid to the seller if certain conditions are met in the future. These earn-out provisions are estimated and recognized at fair value at the acquisition date based on projected earnings or other financial metrics over specified future periods. These estimates are reviewed during each subsequent reporting period and adjusted based upon actual results. Acquisition-related costs for potential and completed acquisitions are expensed as incurred and included in "Other operating expense" in the Consolidated Statements of Operations.
Goodwill is initially valued based on the excess of the purchase price of a business combination over the fair value of the acquired net assets recognized and represents the future economic benefits arising from other assets acquired that could not be individually identified and separately recognized. Intangible assets other than goodwill are initially valued at fair value. When appropriate, the Company utilizes independent valuation experts to advise and assist in determining the fair value of the identified intangible assets acquired in connection with a business acquisition and in determining appropriate amortization methods and periods for those intangible assets. Any contingent consideration included as part of the purchase is recognized at its fair value on the acquisition date.
CURO GROUP HOLDINGS CORP. AND SUBSIDIARIES
NOTES TO CONSOLIDATED FINANCIAL STATEMENTS (continued)
Goodwill and Intangible Assets
Goodwill represents the excess of the purchase price over the fair value of the net tangible and identifiable intangible assets acquired in each business combination at the time of acquisition. In accordance with ASC 350, Intangibles - Goodwill and Other ("ASC 350"), the Company performs impairment testing for goodwill and indefinite-lived intangible assets annually, as of October 1st, or whenever indicators of impairment exist. An impairment would occur if the carrying amount of a reporting unit exceeded the fair value of that reporting unit. These events or circumstances could include a significant change in the business climate, a change in strategic direction, legal factors, operating performance indicators, a change in the competitive environment, the sale or disposition of a significant portion of a reporting unit or economic outlook. The Company recorded an impairment loss on goodwill for the U.S. Direct Lending and Canada POS Lending reporting units during the year-ended December 31, 2022. No impairment was recorded on the Canada Direct Lending during the year-ended December 31, 2022 or any reporting unit for the year ended December 31, 2021.
Goodwill
The annual impairment review for goodwill consists of performing a qualitative assessment to determine whether it is more likely than not that a reporting unit’s fair value is less than its carrying amount as a basis for determining whether or not further testing is required. The Company may elect to bypass the qualitative assessment and proceed directly to the two-step process, for any reporting unit, in any period. The Company can resume the qualitative assessment for any reporting unit in any subsequent period. If the Company determines, on the basis of qualitative factors, that it is more likely than not that the fair value of the reporting unit is less than the carrying amount, the Company will then apply a two-step process of (i) determining the fair value of the reporting unit and (ii) comparing it to the carrying value of the net assets allocated to the reporting unit. Management uses both the income approach and market approach to complete its annual goodwill valuation. The income approach uses future cash flows and estimated terminal values for the Company that are discounted using a market participant perspective to determine the fair value. The income approach includes assumptions about revenue growth rates, operating margins and terminal growth rates discounted by an estimated weighted-average cost of capital. The market approach calculates the fair value of the invested capital based on the Company’s market capitalization and a comparison to guideline public companies multiples. When performing the two-step process, if the fair value of the reporting unit exceeds it carrying value, no further analysis or write-down of goodwill is required. In the event the estimated fair value of a reporting unit is less than the carrying value, the Company would recognize an impairment loss equal to such excess, which could significantly and adversely impact reported results of operations and stockholders’ equity. See Note 4, "Goodwill " for additional information.
Intangible Assets
The Company's identifiable intangible assets, resulting from business combinations and internally developed capitalized software, consist of trade names, developed technology, merchant relationships, customer relationships and computer software. See Note 14, "Acquisitions and Divestiture" for additional information on intangible assets resulting from business combinations.
The Company applied the guidance under ASC 350 to software that is purchased or internally developed. Under ASC 350, eligible internal and external costs incurred for the development of computer software applications, as well as for upgrades and enhancements that result in additional functionality of the applications, are capitalized to "Intangibles, net" in the Consolidated Balance Sheets. Internal and external training and maintenance costs are charged to expense as incurred or over the related service period. When a software application is placed in service, the Company begins amortizing the related capitalized software costs using the straight-line method over its estimated useful life, which ranges from three to 10 years.
The “Cash Money” trade name was determined to be an intangible asset with an indefinite life. Intangible assets with indefinite lives are not amortized, but instead are tested annually for impairment and reviewed for impairment whenever events or changes in circumstances indicate that the carrying amount of the asset might not be recoverable. Impairment of identifiable intangible assets with indefinite lives occurs when the fair value of the asset is less than its carrying amount. If deemed impaired, the asset’s carrying amount is reduced to its estimated fair value. No indefinite life intangible impairments were recorded during the years ended December 31, 2022, 2021 or 2020. See Note 4, "Goodwill and Intangibles" for further information.
The Company's finite lived intangible assets are amortized over their estimated economic benefit period, generally from three to ten years. The Company reviews the intangible assets for impairment annually in the fourth quarter or whenever events or changes in circumstances have indicated that the carrying amount of these assets might not be recoverable. If the Company were to determine that events and circumstances warrant a change to the estimate of an identifiable intangible asset’s remaining useful life, then the remaining carrying amount of the identifiable intangible asset would be amortized prospectively over that revised remaining useful life. Additionally, information resulting from the annual assessment, or other events and circumstances, may indicate that the carrying value of one or more identifiable intangible assets is not recoverable which would result in recognition of an impairment charge. There were no changes in events or circumstances related to the Company's continuing operations that caused the Company to review the finite lived intangible assets for impairment for the years ended December 31, 2022, 2021 or 2020. Additionally, no finite lived impairments were recorded during the years ended December 31, 2022, 2021 or 2020. See Note 4, "Goodwill and Intangibles" for further information.
CURO GROUP HOLDINGS CORP. AND SUBSIDIARIES
NOTES TO CONSOLIDATED FINANCIAL STATEMENTS (continued)
Deferred Financing Costs
Deferred financing costs consist of debt issuance costs incurred in obtaining financing. These costs are presented in the Consolidated Balance Sheets as a direct reduction from the carrying amount of associated debt, consistent with discounts or premiums. The effective interest rate method is used to amortize the deferred financing costs over the life of the Senior Secured Notes and the straight-line method is used to amortize the deferred financing costs of the SPV facilities. See Note 6, "Debt" for additional details on the Company's capital resources.
Fair Value Measurements
The Company determines fair value measurements of financial and non-financial assets and liabilities in accordance with FASB ASC 820, Fair Value Measurements and Disclosures. This guidance defines fair value as the price that would be received to sell an asset or paid to transfer a liability in an orderly transaction between market participants at the measurement date (also referred to as an exit price). This guidance also establishes a framework for measuring fair value and expands disclosures about fair value measurements. The standard applies whenever other standards require (or permit) assets or liabilities to be measured at fair value. See Note 5, “Fair Value Measurements” for additional information.
Concentration Risk
Financial instruments that potentially subject the Company to concentrations of credit risk primarily consist of its loans receivable.
Direct Lending operations in the U.S. and Canada are subject to concentration risk at the state and province level. To the extent that laws and regulations are passed that affect the manner in which the Company conducts business in a heavily concentrated market, its financial condition, results of operations and cash flows could be adversely affected. Additionally, the Company's ability to meet its financial obligations could be negatively impacted.
Revenues originated in Ontario and Texas represented approximately 29.2% and 15.3%, respectively, of the Company's consolidated revenues for the year ended December 31, 2022 and 20.2% and 21.0% , respectively, for the year ended December 31, 2021. Revenues originated in Texas, California and Ontario represented approximately 22.6%, 13.6% and 16.6%, respectively, of the Company's consolidated revenues for the year ended December 31, 2020.
Following the acquisition of Heights Finance and First Heritage, which accounted for approximately $769.0 million of gross loans receivable as of December 31, 2022, the Company operates in new U.S. markets, primarily the southern and eastern states. Receivables originated in Ontario, Tennessee and Texas represented approximately 14.8%, 6.2% and 3.0%, respectively, of the Company's consolidated receivables for the year ended December 31, 2022.
The Company operates its Canada POS Lending operations with various merchant partners. The Company entered into a merchant relationship with LFL in the third quarter of 2021. The revenue contribution from LFL represented approximately 5.9% of the Company's consolidated revenues for the year ended December 31, 2022 and 26.7% of the Company's consolidated receivables as of year ended December 31, 2022.
The Company holds cash at major financial institutions that often exceed FDIC insured limits. The Company manages its concentration risk by maintaining cash deposits in high quality financial institutions and by periodically evaluating the credit quality of the financial institutions holding such deposits. Historically, the Company has not experienced any losses due to such cash concentration.
Leases
Leases entered into by the Company are primarily for retail stores in certain U.S. states and Canadian provinces. Upon entering into an agreement, the Company determines if an arrangement is a lease.
Typically, a contract constitutes a lease if it conveys the right to control the use of an identified property, plant or equipment (an identified asset) for a period of time in exchange for consideration. To determine whether a contract conveys the right to control the use of an identified asset for a period of time, the Company must assess whether, throughout the period of use, the customer has both (i) the right to obtain substantially all of the economic benefits from use of the identified asset and (ii) the right to direct the use of the identified asset. If the customer has the right to control the use of an identified asset for only a portion of the term of the contract, the contract contains a lease for that portion of the term.
Leases classified as finance were immaterial to the Company as of December 31, 2022. Operating leases expire at various times through 2033. Operating leases are included in "Right of use asset - operating leases" and "Lease liability - operating leases" on the Consolidated Balance Sheets.
CURO GROUP HOLDINGS CORP. AND SUBSIDIARIES
NOTES TO CONSOLIDATED FINANCIAL STATEMENTS (continued)
The Company recognizes ROU assets and lease liabilities based on the present value of lease payments over the lease term at commencement date. The rate implicit in the Company's leases typically are not readily determinable. As a result, the Company uses its estimated incremental borrowing rate, as allowed by ASC 842, Leases, in determining the present value of lease payments. The incremental borrowing rate is based on internal and external information available at the lease commencement date and is determined using a portfolio approach (i.e., using the weighted average terms of all leases in the Company's portfolio). This rate is the theoretical rate the Company would pay to borrow an amount equal to the lease payments on a collateralized basis over a similar term as that of the portfolio.
The Company uses quoted interest rates obtained from financial institutions as an input, adjusted for Company-specific factors, to derive the incremental borrowing rate as the discount rate for the leases. As new leases are added each period, the Company evaluates whether the incremental borrowing rate has changed. If the incremental borrowing rate has changed, the Company will apply the rate to new leases if not doing so would result in a material difference to the ROU asset and lease liability presented on the Consolidated Balance Sheets.
The majority of the leases have an original term up to five years plus renewal options for additional similar terms. The Consumer Price Index is used in determining future lease payments and for purposes of calculating operating lease liabilities. Lease terms may include options to extend or terminate the lease when it is reasonably certain that the Company will exercise that option. Most of the leases have escalation clauses and certain leases also require payment of period costs, including maintenance, insurance and property taxes. The Company has elected to combine lease and non-lease components and to exclude short-term leases, defined as having an initial term of 12 months or less, from the Consolidated Balance Sheets. Some of the leases are with related parties and have terms similar to the non-related party leases. See Note 15, "Related Party Transactions" for further information. The Company's lease agreements do not contain any material residual value guarantees or material restrictive covenants.
Operating Expenses
Salaries and Benefits—Salaries and benefits include personnel-related costs, including salaries, benefits, bonuses and share-based compensation and are driven by the number of global employees.
Occupancy—Occupancy includes costs related to the Company's leased facilities, including rent, utilities, maintenance, repairs and insurance expense.
Advertising—Advertising costs are expensed as incurred.
Direct operations—Direct operations include costs related to the Company's Direct Lending and POS operations, including collections and financial services fees.
Depreciation and amortization—includes the depreciation and amortization of property and equipment and intangible assets.
Other operating expense—Other operating expense includes office expense, professional fees, security expense, travel and entertainment and non-routine costs such as transaction costs and store closure costs.
Other Expense (Income)
Interest Expense—includes interest related to the Company's Senior Secured Notes, SPV and securitization facilities and Senior Revolvers.
Loss (income) from equity method investment—includes the Company's share of the net income from its equity method investments.
Gain from equity method investment—includes the Company's net gain from its equity method investment.
Loss on extinguishment of debt—includes the Company's loss on early redemption on Senior Secured Notes and early extinguishment of SPVs.
Goodwill impairment—includes the Company's impairment of U.S. Direct Lending and Canada POS Lending reporting units recorded during the fourth quarter of 2022.
CURO GROUP HOLDINGS CORP. AND SUBSIDIARIES
NOTES TO CONSOLIDATED FINANCIAL STATEMENTS (continued)
Change in fair value of contingent consideration—includes adjustments related to the fair value of the contingent consideration related to the acquisition of Flexiti.
Gain on sale of business—Gain on the divestiture of its Legacy U.S. Direct Lending Business to Community Choice Financial in July 2022.
Share-Based Compensation
CURO accounts for share-based compensation expense for awards to employees and directors at the estimated fair value on the grant date. The Company determines the fair value of stock option grants using the Black-Scholes option pricing model, which requires CURO to make several assumptions including, but not limited to, the risk-free interest rate and the expected volatility of publicly traded stocks in the financial services industry. The expected option term is calculated using the average of the vesting period and the original contractual term. For RSUs, the value of the award is calculated using the closing market price of the common stock on the grant date for time-based and performance-based RSUs, and using the Monte Carlo simulation pricing model for the market-based RSUs. The Company recognizes the estimated fair value of share-based awards as compensation expense on a straight-line basis over the vesting period. The Company accounts for forfeitures as they occur for all share-based awards.
In accordance with ASC 718, Compensation - Stock Compensation, the Company may choose, upon vesting of employees' RSUs, to return shares of common stock underlying the vested RSUs to the Company in satisfaction of employees' tax withholding obligations (collectively, "net-share settlements") rather than requiring shares of common stock to be sold on the open market to satisfy these tax withholding obligations. The total number of shares of common stock returned to the Company is based on the closing price of the Company's common stock on the applicable vesting date. These net-share settlements reduced the number of shares of common stock that would have otherwise been outstanding on the open market, and the cash CURO paid to satisfy the employee portion of the tax withholding obligations are reflected as a reduction to "Paid-in capital" in the Company's Consolidated Balance Sheets and Consolidated Statements of Changes in Equity.
Income Taxes
A deferred tax asset or liability is recognized for the anticipated future tax consequences of temporary differences between the tax basis of assets or liabilities and their reported amounts in the financial statements and for operating loss and tax credit carryforwards. A valuation allowance is provided when, in the opinion of management, it is more likely than not that some portion or all of a deferred tax asset will not be realized. Realization of the deferred tax assets is dependent on the Company's ability to generate sufficient future taxable income and, if necessary, execution of tax planning strategies. In the event CURO determines that future taxable income, taking into consideration tax planning strategies, may not generate sufficient taxable income to fully realize net deferred tax assets, the Company may be required to establish or increase valuation allowances by a charge to income tax expense in the period such a determination is made, which may have a material impact on the Consolidated Statements of Operations. The Company measures deferred tax assets and liabilities using enacted tax rates expected to apply to taxable income in the years in which they expect those temporary differences to be recovered or settled. The effect on deferred tax assets and liabilities of a change in tax rates is recognized in income in the period that includes the enactment date and it may have a material impact on the Consolidated Statements of Operations.
CURO follows accounting guidance which prescribes a comprehensive model for how companies should recognize, measure, present and disclose in their financial statements unrecognized tax benefits for tax positions taken or expected to be taken on a tax return. Under this guidance, tax positions are initially recognized in the financial statements when it is more likely than not that the position will be sustained upon examination by the tax authorities. Such tax positions are initially and subsequently measured as the largest amount of tax benefit that is greater than 50% likely of being realized upon ultimate settlement with the tax authority assuming full knowledge of the position and all relevant facts. Application of this guidance requires numerous estimates based on available information. The Company considers many factors when evaluating and estimating tax positions and tax benefits, and the recognized tax positions and tax benefits may not accurately anticipate actual outcomes. As the Company obtains additional information, they may need to adjust the recognized tax positions and tax benefits. For additional information related to unrecognized tax benefits, see Note 8, "Income Taxes."
Foreign Currency Translation
The Canadian dollar is considered the functional currency for operations in Canada. All balance sheet accounts are translated into U.S. dollars at the exchange rate in effect at each balance sheet date. The Statements of Operations are translated at the average rates of exchange during each period. The Company has determined that certain intercompany balances are long-term in nature, and therefore, currency translation adjustments related to those accounts are recorded as a component of "Accumulated other comprehensive income (loss)" in the Statements of Stockholders' Equity. For intercompany balances that are settled on a regular basis, currency translation adjustments related to those accounts are recorded as a component of "Other operating expense" in the Consolidated Statements of Operations.
CURO GROUP HOLDINGS CORP. AND SUBSIDIARIES
NOTES TO CONSOLIDATED FINANCIAL STATEMENTS (continued)
Legal and Other Commitments and Contingencies
The Company is subject to litigation in the normal course of its business. The Company applies the provisions as defined in the guidance related to accounting for contingencies in determining the recognition and measurement of expense recognition associated with legal claims against the Company. Management uses guidance from internal and external legal counsel on the potential outcome of litigation in determining the need to record liabilities for potential losses and the disclosure of pending legal claims. Refer to Note 7, "Commitments and Contingencies" for further information.
Recently Issued Accounting Pronouncements Not Yet Adopted
ASU 2016-13 and subsequent amendments
In June 2016, the FASB issued ASU 2016-13, Financial Instruments - Credit Losses (Topic 326): Measurement of Credit Losses on Financial Instruments, and subsequent amendments to the guidance: ASU 2018-19 in November 2018, ASU 2019-04 in April 2019, ASU 2019-05 in May 2019, ASU 2019-10 and -11 in November 2019, ASU 2020-02 in February 2020 and ASU 2022-02 in March 2022. The amended standard changes how entities measure credit losses for most financial assets and certain other instruments that are not measured at fair value through net income. The standard replaces the current “incurred loss” approach with an “expected loss” model for instruments measured at amortized cost and affects loans, debt securities, trade receivables, net investments in leases, off-balance sheet credit exposures, reinsurance receivables and any other financial assets not excluded from the scope that have the contractual right to receive cash.
ASU 2016-13 and related amendments are effective for fiscal years beginning after December 15, 2022 for entities that qualified as an SRC as of June 30, 2019, such as the Company. ASU 2016-13 and its amendments should be applied on either a prospective transition or modified-retrospective approach depending on the subtopic. The Company adopted ASU 2016-13 and the related ASUs effective January 1, 2023. Based on the December 31, 2022 loan portfolio and current expectations, the Company estimates the impact of the adoption, through a modified-retrospective approach, to cause an increase to the allowance for credit losses of $135 million and a corresponding one-time, cumulative reduction to retained earnings of $100 million (net of $35 million in taxes) in the consolidated balance sheet as of January 1, 2023.
ASU 2020-04 and subsequent amendments
In March 2020, the FASB issued ASU 2020-04, Reference Rate Reform - Facilitation of the Effects of Reference Rate Reform on Financial Reporting. This ASU provides temporary optional expedients and exceptions to U.S. GAAP guidance on contract modifications and hedge accounting to ease the financial reporting burdens of the upcoming market transition from LIBOR and other interbank offered rates to alternative reference rates, such as SOFR. Entities can elect to not apply certain modification accounting requirements to contracts affected by this reference rate reform, if certain criteria are met. An entity that makes this election would not have to remeasure the contracts at the modification date or reassess a previous accounting determination. Entities also can elect various optional expedients that would allow them to continue applying hedge accounting for hedging relationships affected by reference rate reform if certain criteria are met. The FASB has recently extended the adoption date to December 31, 2024. The FASB also issued ASU 2021-01, Reference Rate Reform (Topic 848): Scope in January 2021, which clarifies that certain optional expedients and exceptions in Topic 848 apply to derivatives that are affected by the discounting transition. The amendments in this ASU affect the guidance in ASU 2020-04 and are effective in the same timeframe as ASU 2020-04. As of September 30, 2022, the Company has transitioned all debt facilities from LIBOR to SOFR.
ASU 2021-08
In October 2021, the FASB issued ASU 2021-08, Business Combinations (Topic 805): Accounting for Contract Assets and Contract Liabilities from Contracts with Customers, which requires an acquirer in a business combination to recognize and measure contract assets and contract liabilities in accordance with ASC 606, Revenue from Contracts with Customers. ASU 2021-08 is effective for fiscal years beginning after December 15, 2022, and early adoption is permitted. While the Company is continuing to assess the timing of adoption and the potential impacts of ASU 2021-08, it does not expect ASU 2021-08 will have a material effect on its financial statements.
CURO GROUP HOLDINGS CORP. AND SUBSIDIARIES
NOTES TO CONSOLIDATED FINANCIAL STATEMENTS (continued)
NOTE 2 – LOANS RECEIVABLE AND REVENUE
As a result of the sale of the Legacy U.S. Direct Lending Business on July 8, 2022, the Company no longer guarantees loans originated by third-party lenders through CSO programs. The Company will continue to present these loans in the tables that follow based on historical practice and for comparability purposes.
The following table summarizes revenue by product (in thousands):
| | | | | | | | | | | | | | | | | | | | | | | | |
| | | | For the Year Ended December 31, |
| | | | | | 2022 | | 2021 | | 2020 |
| Revolving LOC | | | | | | $ | 345,813 | | | $ | 294,591 | | | $ | 249,502 | |
| Installment | | | | | | 559,594 | | | 449,144 | | | 538,685 | |
| Total interest and fees revenue | | | | | | 905,407 | | | 743,735 | | | 788,187 | |
| Insurance premiums and commissions | | | | | | 88,490 | | | 49,410 | | | 35,553 | |
| Other revenue | | | | | | 32,021 | | | 24,698 | | | 23,655 | |
Total revenue(1) | | | | | | $ | 1,025,918 | | | $ | 817,843 | | | $ | 847,396 | |
(1) Includes revenue from CSO programs of $101.2 million, $167.1 million and $185.5 million for the years ended December 31, 2022, 2021 and 2020, respectively. |
The following tables summarize loans receivable by product and the related delinquent loans receivable (in thousands):
| | | | | | | | | | | | | | | | | | | | | | | | |
| | December 31, 2022 | |
| | Revolving LOC | | | | | Installment(1) | | Total | |
| Current loans receivable | | $ | 1,194,554 | | | | | | $ | 649,262 | | | $ | 1,843,816 | | |
| 1-30 days past-due | | 46,956 | | | | | | 76,709 | | | 123,665 | | |
| 31-60 days past-due | | 17,677 | | | | | | 21,480 | | | 39,157 | | |
| 61-90 days past-due | | 12,190 | | | | | | 14,143 | | | 26,333 | | |
| 91 + days past-due | | 13,138 | | | | | | 41,724 | | | 54,862 | | |
| Total delinquent loans receivable | | 43,005 | | | | | | 77,347 | | | 120,352 | | |
| Total loans receivable | | 1,284,515 | | | | | | 803,318 | | | 2,087,833 | | |
| Less: allowance for losses | | (78,815) | | | | | | (43,213) | | | (122,028) | | |
| Loans receivable, net | | $ | 1,205,700 | | | | | | $ | 760,105 | | | $ | 1,965,805 | | |
(1) Of the $803.3 million of installment receivables, $12.7 million relate to mandated extended payment options for certain Canada Single-Pay loans. | |
| | | | | | | | | | | | | | | | | | | | | | | |
| | December 31, 2021 |
| | Revolving LOC | | | | | Installment - Company Owned(1) | | Total |
| Current loans receivable | | $ | 843,379 | | | | | | $ | 512,207 | | | $ | 1,355,586 | |
| 1-30 days past-due | | 35,657 | | | | | | 58,373 | | | 94,030 | |
| 31-60 days past-due | | 15,452 | | | | | | 21,185 | | | 36,637 | |
| 61-90 days past-due | | 13,397 | | | | | | 17,146 | | | 30,543 | |
| 91 + days past-due | | 6,228 | | | | | | 25,294 | | | 31,522 | |
| Delinquent loans receivable | | 35,077 | | | | | | 63,625 | | | 98,702 | |
| Total loans receivable | | 914,113 | | | | | | 634,205 | | | 1,548,318 | |
| Less: allowance for losses | | (68,140) | | | | | | (19,420) | | | (87,560) | |
| Loans receivable, net | | $ | 845,973 | | | | | | $ | 614,785 | | | $ | 1,460,758 | |
(1) Of the $42.5 million of Single-Pay receivables, $11.3 million relate to mandated extended payment options for certain Canada Single-Pay loans. |
|
CURO GROUP HOLDINGS CORP. AND SUBSIDIARIES
NOTES TO CONSOLIDATED FINANCIAL STATEMENTS (continued)
The following tables summarize loans Guaranteed by the Company under CSO programs and the related delinquent receivables (in thousands):
| | | | | | | |
| | | December 31, 2021 |
| | | Total Installment - Guaranteed by the Company |
| Current loans receivable Guaranteed by the Company | | | $ | 38,102 | |
| 1-30 days past-due | | | 6,795 | |
| Delinquent loans receivable Guaranteed by the Company | | | 1,420 | |
| Total loans receivable Guaranteed by the Company | | | 46,317 | |
| Less: Liability for losses on CSO lender-owned consumer loans | | | (6,908) | |
| Loans receivable Guaranteed by the Company, net | | | $ | 39,409 | |
| | | | | | | | | | |
| | | | December 31, 2021 |
| | | | Total Installment - Guaranteed by the Company |
| Delinquent loans receivable | | | | |
| 31-60 days past-due | | | | $ | 1,031 | |
| 61-90 days past-due | | | | 285 | |
| 91 + days past-due | | | | 104 | |
| Total delinquent loans receivable | | | | $ | 1,420 | |
The following tables summarize activity in the ALL and the liability for losses on CSO lender-owned consumer loans in total (in thousands):
| | | | | | | | | | | | | | | | | | | |
| For the Year Ended
December 31, 2022 |
| Revolving LOC | | | | | Installment | | Other | Total |
| Allowance for loan losses: | | | | | | | | | |
| Balance, beginning of period | $ | 68,140 | | | | | | $ | 19,420 | | | $ | — | | $ | 87,560 | |
| Charge-offs | (162,587) | | | | | | (221,197) | | | (11,443) | | (395,227) | |
| Recoveries | 27,976 | | | | | | 85,033 | | | 1,401 | | 114,410 | |
| Net charge-offs | (134,611) | | | | | | (136,164) | | | (10,042) | | (280,817) | |
| Provision for losses | 166,414 | | | | | | 173,810 | | | 10,042 | | 350,266 | |
Divestiture (2) | (13,555) | | | | | | (13,691) | | | — | | (27,246) | |
| Effect of foreign currency translation | (7,573) | | | | | | (162) | | | — | | (7,735) | |
| Balance, end of period | $ | 78,815 | | | | | | $ | 43,213 | | | $ | — | | $ | 122,028 | |
| | | | | | | | | |
Liability for losses on CSO lender-owned consumer loans: (1) | | | | | | | | | |
| Balance, beginning of period | $ | — | | | | | | $ | 6,908 | | | $ | — | | $ | 6,908 | |
| Decrease in liability | — | | | | | | (1,280) | | | — | | (1,280) | |
Divestiture (2) | — | | | | | | (5,628) | | | — | | (5,628) | |
| Balance, end of period | $ | — | | | | | | $ | — | | | $ | — | | $ | — | |
(1) All balances in connection with the CSO programs were disposed of on July 8, 2022 upon the divestiture of the Legacy U.S. Direct Lending Business. |
| (2) Write off of the ALL or liability for losses on CSO lender-owned consumer loans related to loan balance sold or guarantees transferred from the Company on July 8, 2022 upon the divestiture of the Legacy U.S. Direct Lending Business. |
CURO GROUP HOLDINGS CORP. AND SUBSIDIARIES
NOTES TO CONSOLIDATED FINANCIAL STATEMENTS (continued)
| | | | | | | | | | | | | | | | | |
| For the Year Ended
December 31, 2021 |
| Revolving LOC | | | | Installment | Other | Total |
| Allowance for loan losses: | | | | | | | |
| Balance, beginning of period | $ | 51,958 | | | | | $ | 34,204 | | $ | — | | $ | 86,162 | |
| Charge-offs | (114,827) | | | | | (191,734) | | (3,911) | | (310,472) | |
| Recoveries | 29,454 | | | | | 107,147 | | 1,810 | | 138,411 | |
| Net charge-offs | (85,373) | | | | | (84,587) | | (2,101) | | (172,061) | |
| Provision for losses | 102,457 | | | | | 69,766 | | 2,101 | | 174,324 | |
| Effect of foreign currency translation | (902) | | | | | 37 | | — | | (865) | |
| Balance, end of period | $ | 68,140 | | | | | $ | 19,420 | | $ | — | | $ | 87,560 | |
| | | | | | | |
| Liability for losses on CSO lender-owned consumer loans: | | | | | | | |
| Balance, beginning of period | $ | — | | | | | $ | 7,228 | | $ | — | | $ | 7,228 | |
| Decrease in liability | — | | | | | $ | (320) | | — | | $ | (320) | |
| Balance, end of period | $ | — | | | | | $ | 6,908 | | $ | — | | $ | 6,908 | |
As of December 31, 2022, Revolving LOC and Installment loans classified as non-accrual were $5.3 million and $54.6 million, respectively. As of December 31, 2021, Revolving LOC and Installment loans classified as non-accrual were $5.9 million and $41.4 million, respectively. The Company inherently considers non-accrual loans in its estimate of the ALL.
TDR Loans Receivable
The table below presents TDRs that are related to the Customer Care Program implemented in response to COVID-19, included in both gross loans receivable and the impairment included in the ALL (in thousands):
| | | | | | | | | | | |
| | As of December 31, 2022 | As of December 31, 2021 |
| Current TDR gross receivables | | $ | 10,169 | | $ | 11,580 | |
| Delinquent TDR gross receivables | | 2,635 | | 5,066 | |
| Total TDR gross receivables | | 12,804 | | 16,646 | |
| Less: Impairment included in the allowance for loan losses | | (2,691) | | (3,632) | |
| Less: Additional allowance | | (660) | | (2,212) | |
| Outstanding TDR receivables, net of impairment | | $ | 9,453 | | $ | 10,802 | |
CURO GROUP HOLDINGS CORP. AND SUBSIDIARIES
NOTES TO CONSOLIDATED FINANCIAL STATEMENTS (continued)
The tables below present loans modified and classified as TDRs during the periods presented (in thousands):
| | | | | | | | | | | | | | | | | | | | | |
| | | | For the Year Ended December 31, |
| | | | | | 2022 | | 2021 | 2020 |
| | | | | | | | | |
| Pre-modification TDR loans receivable | | | | | | $ | 9,030 | | | $ | 16,255 | | $ | 38,930 | |
| Post-modification TDR loans receivable | | | | | | 8,702 | | | 14,538 | | 34,252 | |
| Total concessions included in gross charge-offs | | | | | | $ | 328 | | | $ | 1,717 | | $ | 4,678 | |
There were $5.4 million and $14.0 million of loans classified as TDRs that were charged off and included as a reduction in the ALL during the year ended December 31, 2022 and 2021, respectively. The Company had commitments to lend additional funds of $1.4 million to customers with available and unfunded Revolving LOC loans classified as TDRs as of December 31, 2022.
The table below presents the Company's average outstanding TDR loans receivable, interest income recognized on TDR loans and number of TDR loans for the periods presented (dollars in thousands):
| | | | | | | | | | | | | | | | | | | | | | | |
| | | | For the Year Ended December 31, |
| | | | | | 2022 | | 2021 | 2020 |
| Average outstanding TDR loans receivable | | | | | | $ | 11,065 | | | $ | 18,259 | | $ | 20,631 | |
| Interest income recognized | | | | | | 5,320 | | | 18,328 | | 17,074 | |
| Number of TDR loans | | | | | | 3,531 | | | 11,693 | | 27,082 | |
NOTE 3 – VARIABLE INTEREST ENTITIES
As of December 31, 2022, the Company had five credit facilities, whereby certain loans receivable were sold to wholly-owned VIEs to collateralize debt incurred under each facility. See Note 6, "Debt" for additional details on each facility.
The Company has determined that it is the primary beneficiary of the VIEs and is required to consolidate them. The Company includes the assets and liabilities related to the VIEs in the Consolidated Financial Statements.
The carrying amounts of consolidated VIEs' assets and liabilities were as follows (in thousands):
| | | | | | | | | | | | | | |
| | December 31,
2022 | | December 31,
2021 |
| Assets | | | | |
| Restricted cash | | $ | 52,277 | | | $ | 57,155 | |
| Loans receivable, net | | 1,855,824 | | | 1,228,088 | |
| Prepaid expenses and other | | 12,908 | | | — | |
| Deferred tax assets | | 17,027 | | | — | |
| Total Assets | | $ | 1,938,036 | | | $ | 1,285,243 | |
| Liabilities | | | | |
| Accounts payable and accrued liabilities | | $ | 13,571 | | | $ | 9,886 | |
| Deferred revenue | | 31 | | | 106 | |
| Deferred tax liability | | — | | | 269 | |
| Accrued interest | | 7,023 | | | 3,279 | |
| Income taxes payable | | 7,850 | | | — | |
| Debt, net | | 1,589,380 | | | 965,072 | |
| Total Liabilities | | $ | 1,617,855 | | | $ | 978,612 | |
NOTE 4 – GOODWILL AND INTANGIBLES
Goodwill
The Goodwill balance includes impairments recorded on the U.S. Direct Lending and Canada POS Lending reporting units in the fourth quarter of 2022. The change in the carrying amount of Goodwill by operating segment, known as reporting unit for goodwill testing purposes, for the years ended December 31, 2022 and 2021, was as follows (in thousands):
CURO GROUP HOLDINGS CORP. AND SUBSIDIARIES
NOTES TO CONSOLIDATED FINANCIAL STATEMENTS (continued)
| | | | | | | | | | | | | | | | | | | | | | | |
| U.S. Direct Lending | | Canada Direct Lending | | Canada POS Lending | | Total |
| Goodwill at December 31, 2020 | $ | 105,922 | | | $ | 30,169 | | | $ | — | | | $ | 136,091 | |
| Foreign currency translation | — | | | (64) | | | (515) | | | (579) | |
| Measurement period adjustment | — | | | — | | | (4,478) | | | (4,478) | |
| Acquisition (Note 14) | 253,857 | | | — | | | 44,901 | | | 298,758 | |
| Goodwill at December 31, 2021 | 359,779 | | | 30,105 | | | 39,908 | | | 429,792 | |
| Foreign currency translation | — | | | (1,847) | | | (2,494) | | | (4,341) | |
| Measurement period adjustment | 11,825 | | | — | | | — | | | 11,825 | |
| Divestiture (Note 14) | (91,131) | | | — | | | — | | | (91,131) | |
| Acquisition (Note 14) | 75,365 | | | — | | | — | | | 75,365 | |
| Goodwill Impairment Charge | (107,827) | | | — | | | (37,414) | | | (145,241) | |
| Goodwill at December 31, 2022 | $ | 248,011 | | | $ | 28,258 | | | $ | — | | | $ | 276,269 | |
The Company tests goodwill at least annually for potential impairment, as of October 1, and more frequently if indicators are present or changes in circumstances suggest that impairment may exist. The indicators include, among others, declines in sales, earning or cash flows or the development of a material adverse change in business climate. The Company assesses goodwill for impairment at the reporting unit level, which is defined as an operating segment or one level below an operating segment, referred to as a reporting unit. See Note 1, "Summary of Significant Accounting Policies and Nature of Operations" for additional information on the Company's policy for assessing goodwill for impairment.
During the fourth quarter of 2022, the Company performed a quantitative assessment for each of its reporting units. Management considered the income approach and the guideline public company approach in determining a fair value for each of the three reporting units for purposes of testing the goodwill. Management utilized both the income approach and guideline public company approach equally weighted at 50% to estimate fair value. The income approach estimates fair value using the present value of future cash flows and the guideline public company approach estimates fair value using the fair value of publicly traded businesses in a similar line of business.
Management determined that the fair value of each of the U.S. Direct Lending and Canada POS Lending reporting units were less than their respective carrying values. As a result, the Company recognized a non-cash pre-tax impairment charge of $107.8 million on the U.S. Direct Lending reporting unit and $37.4 million on the Canada POS Lending reporting unit during the year ended December 31, 2022 to write down the carrying value of goodwill. The non-cash impairment charge is included in Goodwill impairment in the Consolidated Statements of Operations for the year ended December 31, 2022.
Management concluded that the estimated fair value of the Canada Direct Lending reporting unit was greater than its carrying value, as of the annual assessment date. As such, no impairment was required on the Canada Direct Lending reporting unit.
The Company performed a qualitative assessment for its reporting units as of December 31, 2022. As a result of the earlier triggering event review, the Company concluded an additional assessment was not necessary and did not record an additional impairment loss during the quarter ended December 31, 2022.
Flexiti Acquisition
The Company completed the acquisition of Flexiti on March 10, 2021, resulting in $39.9 million of goodwill as of December 31, 2021, based on the excess of the purchase price over the fair value of the acquired net assets. Goodwill of $39.9 million was net of $4.5 million of adjustments upon the conclusion of the measurement period, and a $0.5 million of foreign currency translation impact as of December 31, 2021. See Note 14, "Acquisitions and Divestiture" for more information related to the business combination.
Heights Finance Acquisition
The Company completed the acquisition of Heights Finance on December 27, 2021. Provisional goodwill was estimated at $253.9 million, based on the preliminary valuation. The Company recorded a net $11.8 million of adjustments during the fiscal year 2022, resulting in a goodwill balance of $265.7 million, as of December 31, 2022 upon the conclusion of the measurement period. See Note 14, "Acquisitions and Divestiture" for more information related to the business combination.
CURO GROUP HOLDINGS CORP. AND SUBSIDIARIES
NOTES TO CONSOLIDATED FINANCIAL STATEMENTS (continued)
Legacy U.S. Direct Lending Business Divestiture
On July 8, 2022 the Company completed the divestiture of its Legacy U.S. Direct Lending Business to Community Choice Financial, for total sale proceeds of $349.2 million, net of working capital adjustments, comprised of $314.2 million of cash received at close and $35.0 million in cash payable in monthly installment payments over the subsequent 12 months. The divestiture resulted in a gain of $68.4 million in the three and nine months ended September 30, 2022, which was recorded in "Gain on sale of business" on the Consolidated Statement of Operations. As part of the sale, $91.1 million of goodwill was written off. See Note 14,"Acquisitions and Divestiture" for more information related to the divestiture.
First Heritage Acquisition
On July 13, 2022, CURO closed the acquisition of First Heritage, a consumer lender that provides near-prime installment loans along with customary opt-in insurance and other financial products for a total purchase price of $140.0 million in cash. Provisional goodwill was recorded at $75.4 million.See Note 14, "Acquisitions and Divestiture" for more information related to the business combination.
Intangibles
Identifiable intangible assets consisted of the following:
| | | | | | | | | | | | | | | | | | | | | | | | | | | | | | | | | | | | | | | | | |
| | | December 31, 2022 | | December 31, 2021 |
| Weighted-Average Remaining Life (Years) | | Gross
Carrying
Amount | | Accumulated
Amortization | | Net | | Gross
Carrying
Amount | | Accumulated
Amortization | | Net |
| Assets not subject to amortization | | | | | | | | | | |
| Trade name | — | | $ | 21,432 | | | $ | — | | | $ | 21,432 | | | $ | 22,832 | | | $ | — | | | $ | 22,832 | |
| Assets subject to amortization | | | | | | | | | | |
| Merchant relationships | 3.3 | | 18,265 | | | (6,610) | | | 11,655 | | | 19,459 | | | (3,151) | | | 16,308 | |
| Customer relationships | 2.4 | | 18,005 | | | (5,957) | | | 12,048 | | | 20,285 | | | (10,295) | | | 9,990 | |
Computer software(1) | 5.4 | | 101,899 | | | (30,833) | | | 71,066 | | | 81,844 | | | (25,453) | | | 56,391 | |
| Trade name | 11.6 | | 8,411 | | | (935) | | | 7,476 | | | 4,621 | | | (212) | | | 4,409 | |
| Balance, end of year | | | $ | 168,012 | | | $ | (44,335) | | | $ | 123,677 | | | $ | 149,041 | | | $ | (39,111) | | | $ | 109,930 | |
(1) Includes internally developed software, of $60.6 million and $44.7 million, net, as of December 31, 2022 and 2021, respectively. |
| | |
The Company's identifiable intangible assets are amortized using the straight-line method over the estimated remaining useful lives, except for the Cash Money trade name intangible asset that has a carrying amount of $21.4 million, which was determined to have an indefinite life and is not amortized. The estimated useful lives for the Company's other intangible assets range from one to 15 years. Aggregate amortization expense related to identifiable intangible assets was $22.8 million, $13.8 million and $3.0 million for the years ended December 31, 2022, 2021 and 2020, respectively.
The following table outlines the estimated amortization expense related to intangible assets held at December 31, 2022 for each of the next five years (in thousands):
| | | | | |
| Year Ending December 31, |
| 2023 | $ | 23,817 | |
| 2024 | 21,859 | |
| 2025 | 16,947 | |
| 2026 | 6,158 | |
| 2027 | 4,252 | |
|
CURO GROUP HOLDINGS CORP. AND SUBSIDIARIES
NOTES TO CONSOLIDATED FINANCIAL STATEMENTS (continued)
NOTE 5 – FAIR VALUE MEASUREMENTS
Fair value is defined as the price that would be received to sell an asset or paid to transfer a liability in an orderly transaction between market participants. The Company is required to use valuation techniques that are consistent with the market approach, income approach and/or cost approach. Inputs to valuation techniques refer to the assumptions that market participants would use in pricing the asset or liability based on observable market data obtained from independent sources, or unobservable inputs, meaning those that reflect the Company's own judgment about the assumptions market participants would use in pricing the asset or liability based on the best information available for the specific circumstances. Accounting standards establish a three-level fair value hierarchy based upon the assumptions (inputs) used to price assets or liabilities. The hierarchy requires the Company to maximize the use of observable inputs and minimize the use of unobservable inputs.
The three levels of inputs used to measure fair value are listed below.
Level 1 – Inputs are unadjusted quoted prices in active markets for identical assets or liabilities that the Company has access to at the measurement date.
Level 2 – Inputs include quoted market prices for similar assets or liabilities in active markets, quoted prices for identical or similar assets or liabilities in markets that are not active, inputs other than quoted prices that are observable for the asset or liability and inputs that are derived principally from or corroborated by observable market data by correlation or other means (market corroborated inputs).
Level 3 – Unobservable inputs reflecting the Company's own judgments about the assumptions market participants would use in pricing the asset or liability as a result of limited market data. The Company develops these inputs based on the best information available, including its own data.
Financial Assets and Liabilities Carried at Fair Value
The table below presents the assets and liabilities that were carried at fair value on the Consolidated Balance Sheets at December 31, 2022 (in thousands):
| | | | | | | | | | | | | | | | | | |
| | Estimated Fair Value | |
| Carrying Value December 31,
2022 | Level 1 | Level 2 | Level 3 | Total | |
| Financial assets: | | | | | | |
| Cash Surrender Value of Life Insurance | $ | 7,591 | | $ | 7,591 | | $ | — | | $ | — | | $ | 7,591 | | |
| Derivative assets | 7,458 | | — | | 7,458 | | — | | 7,458 | | |
| Financial liabilities: | | | | | | |
| Non-qualified deferred compensation plan | $ | 5,149 | | $ | 5,149 | | $ | — | | $ | — | | 5,149 | | |
| Contingent consideration related to acquisition | 16,884 | | — | | — | | 16,884 | | 16,884 | | |
Derivative Assets
The Company uses interest rate swaps to manage interest rate risk exposure on variable rate debt. The Company typically classifies these derivatives as Level 2, given that significant inputs can be observed in a liquid market and the model itself does not require significant judgment. These derivative assets are included in other assets on the Consolidated Balance Sheets. During the year ended December 31, 2022, Flexiti entered into interest rate swaps with National Bank of Canada to protect against the interest risk on the Flexiti SPV variable rate borrowing facility and with Bank of Montreal (BMO) to protect against the interest rate risk on the Flexiti Securitization variable rate borrowing facility. Flexiti is required to hedge the variable interest rate aspect of the SPV under the facility's credit agreement. For additional information on the interest rate swaps, refer to Note 6, "Debt."
CURO GROUP HOLDINGS CORP. AND SUBSIDIARIES
NOTES TO CONSOLIDATED FINANCIAL STATEMENTS (continued)
Contingent consideration related to acquisition
In connection with the acquisition of Flexiti during the first quarter of 2021, the Company recorded a liability for contingent consideration based on the achievement of revenue less NCOs and loan origination targets over the two years following closing of the acquisition that could result in additional cash consideration up to $32.8 million to Flexiti's former stockholders. The fair value of the liability is estimated using the option-based income approach using a Monte Carlo simulation model discounted back to the reporting date. The significant unobservable inputs (Level 3) used to estimate the fair value included the expected future tax benefits associated with the acquisition, the probability that the risk adjusted-revenue and origination targets will be achieved and discount rates. The contingent consideration measured at fair value using unobservable inputs decreased from the initial measurement of $20.6 million as of March 31, 2021 to $16.9 million as of December 31, 2022. The Company paid $1.0 million of contingent consideration in July 2022. For additional information on Flexiti and the related contingent consideration, refer to Note 14, "Acquisitions and Divestiture."
Cash Surrender Value of Life Insurance and Non-qualified deferred compensation plan
The cash surrender value of life insurance is included in “Other assets” in the Company’s Consolidated Balance Sheets. The non-qualified deferred compensation plan offsetting liability is included in “Accounts payable and accrued liabilities” in the Company’s Consolidated Balance Sheets.
The table below presents the assets and liabilities that were carried at fair value on the Consolidated Balance Sheets at December 31, 2021 (in thousands):
| | | | | | | | | | | | | | | | | |
| | Estimated Fair Value |
| Carrying Value December 31,
2021 | Level 1 | Level 2 | Level 3 | Total |
| Financial assets: | | | | | |
| Cash Surrender Value of Life Insurance | $ | 8,242 | | $ | 8,242 | | $ | — | | $ | — | | $ | 8,242 | |
| Financial liabilities: | | | | | |
| Non-qualified deferred compensation plan | $ | 5,109 | | $ | 5,109 | | $ | — | | $ | — | | $ | 5,109 | |
| Contingent consideration related to acquisition | 26,508 | | — | | — | | 26,508 | | 26,508 | |
Financial Assets and Liabilities Not Carried at Fair Value
The table below presents the assets and liabilities that were not carried at fair value on the Consolidated Balance Sheets at December 31, 2022 (in thousands):
| | | | | | | | | | | | | | | | | | | | |
| | | Estimated Fair Value |
| | Carrying Value December 31,
2022 | Level 1 | Level 2 | Level 3 | Total |
| Financial assets: | | | | | |
| Cash and cash equivalents | $ | 73,932 | | $ | 73,932 | | $ | — | | $ | — | | $ | 73,932 | |
| Restricted cash | 91,745 | | 91,745 | | — | | — | | 91,745 | |
| Loans receivable, net | 1,965,805 | | — | | — | | 1,965,805 | | 1,965,805 | |
| Investment in Katapult | 23,915 | | 20,624 | | — | | — | | 20,624 | |
| Financial liabilities: | | | | | |
| 7.50% Senior Secured Notes | $ | 982,934 | | $ | — | | $ | 466,500 | | $ | — | | $ | 466,500 | |
| Heights SPV | 393,181 | | — | | — | | 393,181 | | 393,181 | |
| First Heritage SPV | 178,622 | | — | | — | | 182,751 | | 182,751 | |
| Flexiti SPV | 339,651 | | — | | — | | 343,565 | | 343,565 | |
| Flexiti Securitization | 385,054 | | — | | — | | 387,759 | | 387,759 | |
| Canada SPV | 292,872 | | — | | — | | 294,594 | | 294,594 | |
| | | | | | |
| | | | | | |
CURO GROUP HOLDINGS CORP. AND SUBSIDIARIES
NOTES TO CONSOLIDATED FINANCIAL STATEMENTS (continued)
The table below presents the assets and liabilities that were not carried at fair value on the Consolidated Balance Sheets at December 31, 2021 (in thousands):
| | | | | | | | | | | | | | | | | |
| | Estimated Fair Value |
| Carrying Value December 31,
2021 | Level 1 | Level 2 | Level 3 | Total |
| Financial assets: | | | | | |
| Cash and cash equivalents | $ | 63,179 | | $ | 63,179 | | $ | — | | $ | — | | $ | 63,179 | |
| Restricted cash | 98,896 | | 98,896 | | — | | — | | 98,896 | |
| Loans receivable, net | 1,460,758 | | — | | — | | 1,460,758 | | 1,460,758 | |
| Investment in Katapult | 27,900 | | 72,627 | | — | | — | | 72,627 | |
| Financial liabilities: | | | | | |
Liability for losses on CSO lender-owned consumer loans (1) | $ | 6,908 | | $ | — | | $ | — | | $ | 6,908 | | $ | 6,908 | |
7.50% Senior Secured Notes | 980,721 | | — | | 1,005,700 | | — | | 1,005,700 | |
U.S. SPV (1) | 45,392 | | — | | — | | 49,456 | | 49,456 | |
| Canada SPV | 157,813 | | — | | — | | 160,533 | | 160,533 | |
| Flexiti SPV | 172,739 | | — | | — | | 176,625 | | 176,625 | |
| Flexiti Securitization | 239,128 | | — | | — | | 242,886 | | 242,886 | |
Heights Finance SPV | 350,000 | | — | | — | | 350,000 | | 350,000 | |
(1) Liabilities were disposed of when we completed the divestiture of the Legacy U.S. Direct Lending Business on July 8, 2022. |
Loans Receivable, Net
Loans receivable are carried on the Consolidated Balance Sheets net of the ALL. The unobservable inputs used to calculate the carrying values include quantitative factors, such as current default trends. Also considered in evaluating the accuracy of the models are changes to the loan portfolio mix, the impact of new loan products, changes to underwriting criteria or lending policies, new store development or entrance into new markets, changes in jurisdictional regulations or laws, recent credit trends and general economic conditions. The carrying value of loans receivable approximates their fair value. Refer to Note 2, "Loans Receivable and Revenue" for additional information.
CSO Program
Following the sale of the Legacy U.S. Direct Lending Business on July 8, 2022, the Company no longer guarantees loans originated by third-party lenders through CSO programs. The Company will continue to present these loans in the tables that follow based on historical practice and for comparability purposes. Refer to Note 14, "Acquisitions and Divestiture" for additional information.
In connection with CSO programs, the Company guaranteed consumer loan payment obligations to unrelated third-party lenders for loans that the Company arranged for consumers on the third-party lenders’ behalf. The Company was required to purchase from the lender charged-off loans that it had guaranteed. Refer to Note 2, "Loans Receivable and Revenue" and Note 20, Credit Services Organization" for additional information. All balances in connection with the CSO programs were disposed of with the completion of the divestiture of the Legacy U.S. Direct Lending Business on July 8, 2022.
7.50% Senior Secured Notes, Heights SPV, First Heritage SPV, Flexiti SPV, Flexiti Securitization, Canada SPV, Curo Canada Revolving Credit Facility and Senior Revolver (U.S. SPV and Heights Finance SPV extinguished during the third quarter of 2022)
The fair value disclosures for the 7.50% Senior Secured Notes as of December 31, 2022 and December 31, 2021 were based on observable market trading data. The fair values of the Heights SPV, First Heritage SPV, Flexiti SPV, Flexiti Securitization, Canada SPV, Curo Canada Revolving Credit Facility and Senior Revolver were based on the cash needed for their respective final settlements.
CURO GROUP HOLDINGS CORP. AND SUBSIDIARIES
NOTES TO CONSOLIDATED FINANCIAL STATEMENTS (continued)
Investment in Katapult
The table below presents the Company's investment in Katapult (in thousands):
| | | | | | | | | | | | | | | | | | | | | |
| | Equity Method Investment | | Measurement Alternative (1) | | Total Investment in Katapult | |
| Balance at December 31, 2019 | | $ | 10,068 | | | $ | — | | | $ | 10,068 | | |
| Equity method income | | 4,546 | | | — | | | 4,546 | | |
| Accounting policy change for certain securities from equity method investment to measurement alternative | | (12,452) | | | 12,452 | | | — | | |
| Purchases of common stock warrants and preferred shares | | 4,030 | | | 7,157 | | | 11,187 | | |
| Purchases of common stock | | 1,570 | | | — | | | 1,570 | | |
| Balance at December 31, 2020 | | 7,762 | | | 19,609 | | | 27,371 | | |
| Equity method income | | 3,658 | | | — | | | 3,658 | | |
Conversion of investment(2) | | 6,481 | | | (19,609) | | | (13,128) | | |
| Purchases of common stock | | 9,999 | | | — | | | 9,999 | | |
| Balance at December 31, 2021 | | 27,900 | | | — | | | 27,900 | | |
| Equity method loss | | (3,985) | | | — | | | (3,985) | | |
| Balance at December 31, 2022 | | $ | 23,915 | | | $ | — | | | $ | 23,915 | | |
| | | | | | | |
| | | | | | | |
(1) The Company elected to measure this equity security without a readily determinable fair value equal to its cost minus impairment. If the Company identifies an observable price change in orderly transactions for same or similar investment in Katapult, it will measure the equity security at fair value as of the date that the observable transaction occurred. | |
(2) On June 9, 2021, Katapult completed its merger with FinServ. Immediately prior to the merger, the Company first converted all of its preferred stock and exercised all common stock warrants, and then exchanged all shares of Katapult common stock for $146.9 million in cash and 18.9 million shares of common stock in the resulting public company, Katapult (NASDAQ: KPLT). The Company's entire investment in Katapult is now accounted for under the equity method of accounting. The Company recorded a related net gain of $135.4 million on its equity method investment in Katapult, based on the pro rata cost basis of the investment and the discharge of the guarantee provided during the second quarter of 2021. | |
The Company began investing in Katapult in 2017 and increased its investment through multiple private placement acquisitions. During the first quarter of 2021, the Company changed the two-month reporting lag to a one-quarter reporting lag, as discussed in Note 1, "Summary of Significant Accounting Policies and Nature of Operations." The Company recorded a loss of $1.9 million for the three months ended December 31, 2022 based on its share of Katapult’s earnings.
During the fourth quarter of 2021, the Company purchased an additional 2.6 million shares of common stock of Katapult for an aggregate purchase price of $10.0 million.
On June 9, 2021, Katapult completed its merger with FinServ. As a result, the Company received $146.9 million in cash and 18.9 million shares of common stock of the resulting public company, Katapult (NASDAQ: KPLT). The Company recorded a related net gain of $135.4 million on its equity method investment in Katapult during the second quarter of 2021. Additionally, as part of the merger, CURO received 3.0 million earn-out warrants and holds two of the eight board of director seats for Katapult.
Both the equity method investment and the previously recognized investment measured at cost minus impairment are presented within "Investment in Katapult" on the Consolidated Balance Sheets.
The Company owns 19.5% of Katapult on a fully diluted basis assuming full pay-out of earn-out shares as of December 31, 2022, and 18.2% excluding pay-out of earn-out shares.
CURO GROUP HOLDINGS CORP. AND SUBSIDIARIES
NOTES TO CONSOLIDATED FINANCIAL STATEMENTS (continued)
NOTE 6 – DEBT
The Company's debt instruments and balances outstanding as of December 31, 2022 and December 31, 2021, including maturity date, effective interest rate and borrowing capacity, were as follows (dollars in thousands):
| | | | | | | | | | | | | | | | | | | | | | | |
| | Effective interest rate | | | Outstanding as of |
| Maturity Date | Borrowing Capacity | | December 31, 2022 | | December 31, 2021 |
| Corporate Debt: | | | | | | | |
7.50% Senior Secured Notes | August 1, 2028 | 7.50 | % | | | $ | 1,000,000 | | | $ | 1,000,000 | |
| | | | | | | |
| Total corporate debt | | | | | 1,000,000 | | | 1,000,000 | |
| Funding Debt: | | | | | | | |
| Heights SPV | July 15, 2025 | 1-Mo SOFR + 4.25% | $425.0 million | | $ | 400,758 | | | $ | — | |
| First Heritage SPV | July 13, 2025 | 1-Mo SOFR + 4.25% | $225.0 million | | 182,751 | | | — | |
Flexiti SPV (1) | September 29, 2025 | Weighted average interest rate (4)(7) 8.33% | C$535.0 million | | 343,565 | | | 176,625 | |
Flexiti Securitization (1) (5) | December 9, 2025 | 1-Mo CDOR + 3.59% (7) | C$526.5 million | | 387,759 | | | 242,886 | |
Canada SPV (1) | August 2, 2026 | 3-Mo CDOR + 6.00% | C$400.0 million | | 294,594 | | | 160,533 | |
Heights Finance SPV (3) | N/A (3) | 1-Mo LIBOR + 5.25% | $350.0 million | | — | | | 350,000 | |
U.S. SPV (2) | N/A (2) | 1-Mo LIBOR + 6.25% | $200.0 million | | — | | | 49,456 | |
Curo Canada Revolving Credit Facility (1)(6) | On-demand | Canada Prime Rate + 1.95% | C$5.0 million | | — | | | — | |
| Senior Revolver | August 31, 2023 | 1-Mo SOFR + 5.00% | $40.0 million | | 35,000 | | | — | |
| Total funding debt | | | | | $ | 1,644,427 | | | $ | 979,500 | |
| Less: debt issuance costs | | | | | (37,113) | | | (33,707) | |
| Total Debt | | | | | $ | 2,607,314 | | | $ | 1,945,793 | |
(1) Capacity amounts are denominated in Canadian dollars, whereas outstanding balances as of December 31, 2022 and December 31, 2021 are denominated in U.S. dollars. The exchange rate applied at December 31, 2022 was 0.7365 and the exchange rate at December 31, 2021 was 0.7846. |
| (2) The U.S. SPV was extinguished on July 8, 2022 upon the divestiture of the Legacy U.S. Direct lending Business. |
| (3) The Heights Finance SPV was extinguished on July 15, 2022 and replaced as of July 15, 2022 with Heights SPV. |
(4) The weighted average interest rate does not include the impact of the amortization of deferred loan origination costs or debt discounts.
|
(5) The effective rate is 7.09%. |
(6) On December 21, 2022, the maximum amount of the CURO Canada Revolving Credit Facility was reduced from C$10.0 million to C$5.0 million, and the facility was cancelled on January 6, 2023. |
| (7) Swapped to fixed rate via interest rate swap hedging arrangement entered into on July 7, 2022 for Flexiti Securitization and October 11, 2022 for Flexiti SPV. |
Corporate Debt
7.50% Senior Secured Notes
In July 2021, the Company issued $750.0 million of 7.50% Senior Secured Notes which mature on August 1, 2028. Interest on the notes is payable semiannually, in arrears, on February 1 and August 1. In December 2021, the Company issued an additional $250.0 million of 7.50% Senior Secured Notes, also maturing on August 1, 2028, to fund the acquisition of Heights Finance. Refer to Note 14, "Acquisitions and Divestiture" for additional details. In connection with the 7.50% Senior Secured Notes, financing costs of $17.1 million were capitalized, net of amortization, and included in the Consolidated Balance Sheets as a component of "Debt." These costs are amortized over the term of the 7.50% Senior Secured Notes as a component of interest expense.
8.25% Senior Secured Notes
In August 2018, the Company issued $690.0 million of 8.25% Senior Secured Notes maturing on September 1, 2025. In connection with the 8.25% Senior Secured Notes, the Company capitalized financing costs of $13.9 million, which were being amortized as a component of interest expense over its term.
During the third quarter of 2021, the 8.25% Senior Secured Notes were extinguished using proceeds from the 7.50% Senior Secured Notes described above. The early extinguishment of the 8.25% Senior Secured Notes resulted in a loss of $40.2 million.
CURO GROUP HOLDINGS CORP. AND SUBSIDIARIES
NOTES TO CONSOLIDATED FINANCIAL STATEMENTS (continued)
Funding Debt
As of December 31, 2022, the Company had five credit facilities whereby loans receivable were sold to wholly-owned VIEs to collateralize debt incurred under each facility. These facilities are the (i) Heights SPV, (ii) First Heritage SPV, (iii) Canada SPV, (iv) Flexiti SPV and (v) Flexiti Securitization. For further information on these facilities, refer to Note 3, "Variable Interest Entities".
Heights SPV
On July 15, 2022, we entered into a new $425.0 million non-recourse revolving warehouse facility to replace the incumbent lender's facility and finance future loans originated by Heights Finance. The effective interest rate is 1-month SOFR plus 4.25%. The Company also pays a 0.50% per annum commitment fee on the unused portion of the commitments. The warehouse revolving period matures on July 15, 2025.
First Heritage SPV
On July 13, 2022, concurrently with the closing of the First Heritage acquisition, the Company entered into a $225.0 million non-recourse revolving warehouse facility to replace the incumbent lender's facility and finance future loans originated by First Heritage. The effective interest rate is 1-month SOFR plus 4.25%. The Company also pays a 0.50% per annum commitment fee on the unused portion of the commitments. The warehouse revolving period matures on July 13, 2025.
Flexiti SPV
On September 29, 2022, Flexiti refinanced and increased its Flexiti SPV in order to increase the borrowing capacity from C$500.0 million to C$535.0 million and extend its maturity to September 29, 2025. As of December 31, 2022, the weighted average interest rate was 8.33%. Flexiti also pays a 0.50% per annum commitment fee on the unused portion of the commitments. All other material terms of the revolving warehouse credit facility remain unchanged. The early extinguishment of the Flexiti SPV resulted in a loss of $0.7 million.
Flexiti Securitization
In December 2021, Flexiti Securitization Limited Partnership, a wholly-owned Canadian subsidiary of the Company, entered into the Flexiti Securitization. The facility provides for C$526.5 million with a maturity of December 9, 2025. As of December 31, 2022, the effective interest was one-month CDOR plus 3.59%.
Canada SPV
In August 2018, CURO Canada Receivables Limited Partnership, a wholly-owned subsidiary of the Company, entered into the Canada SPV. During the fourth quarter of 2021 and first quarter of 2022, the Company amended the existing credit facility to, among other things, (i) increase the borrowing capacity from C$175.0 million to C$400.0 million, (ii) reduce borrowing costs and (iii) extend the initial maturity date by three years, to August 2, 2026.. The effective interest rate was 3-month CDOR plus 6.00%. The borrower also pays a 0.50% per annum commitment fee on the unused portion of the commitments.
Heights Finance SPV
In December 2021, the Company acquired Heights Finance, including the Heights Finance SPV. Heights Finance entered into the Heights Finance SPV in December 2019 with a total revolving commitment of $350.0 million. The interest rate on the facility is one-month LIBOR plus 5.25%. The Heights Finance SPV was scheduled to mature on December 31, 2024.
The Heights Finance SPV was extinguished on July 15, 2022, using proceeds from the new $425.0 million non-recourse revolving warehouse facility, "Heights SPV," as described above. The early extinguishment of the Heights Finance SPV resulted in a loss of $0.6 million.
U.S. SPV
In April 2020, CURO Receivables Finance II, LLC, a wholly-owned subsidiary of the Company, entered into the U.S. SPV, which provided for $200.0 million of borrowing capacity with an effective interest rate on the Company's borrowings of one-month LIBOR plus 6.25%. The borrower pays the lenders a monthly commitment fee at an annual rate of 0.50% on the unused portion of the commitments. The U.S. SPV was scheduled to mature on April 8, 2024.
The U.S. SPV was extinguished on July 8, 2022 upon the completion of the divestiture of our Legacy U.S. Direct Lending Business to Community Choice Financial. The early extinguishment of the U.S. SPV resulted in a loss of $3.1 million.
CURO GROUP HOLDINGS CORP. AND SUBSIDIARIES
NOTES TO CONSOLIDATED FINANCIAL STATEMENTS (continued)
Senior Revolver
The Company maintains the Senior Revolver that provides $40.0 million of borrowing capacity, including up to $4.0 million of standby letters of credit, for a one-year term, renewable for successive terms following annual review. The current term expires August 31, 2023. The Senior Revolver accrues interest at one-month SOFR plus 5.00%.
Curo Canada Revolving Credit Facility
Curo Canada maintains the Curo Canada Revolving Credit Facility, formerly known as the Cash Money Revolving Credit Facility, which provides short-term liquidity for the Company's Canadian direct lending operations.
The Curo Canada Revolving Credit Facility is collateralized by substantially all of CURO Canada’s assets and contains various covenants that require, among other things, that the aggregate borrowings outstanding under the facility not exceed the borrowing base, as well as restrictions on the encumbrance of assets and the creation of indebtedness. Borrowings under the Curo Canada Revolving Credit Facility bear interest per annum at the prime rate of a Canadian chartered bank plus 1.95%.
On December 21, 2022 the borrowing capacity under the Curo Canada Revolving Credit Facility was reduced from C$10.0 million to C$5.0 million, and the facility was cancelled on January 6, 2023. For additional information on Flexiti and the related contingent consideration, refer to Note 24, "Subsequent Events."
Derivative Instruments and Hedging Activities
During the year ended December 31, 2022, the Company entered into interest rate swaps to manage interest rate risk on variable rate debt. The Company designated these risk management derivatives as qualifying cash flow hedges under hedge accounting. The derivative assets are included in other assets on our Consolidated Balance Sheet and changes in the fair value of derivatives are recorded as a component of Accumulated other comprehensive income (“AOCI”). During the year ended December 31, 2022, the hedges were assessed as effective and as such there was no impact to earnings. However, for cash flow hedges during periods in which the forecasted transactions impact earnings, those amounts are reclassified into earnings in the same period during which the forecasted transactions impact earnings and presented in the same line item in the Consolidated Statements of Income as the earnings effect of the hedged items and reflected in operating activities on the Statement of Cash Flows.
Interest Rate Swap on Flexiti SPV
In accordance with the terms of the Flexiti SPV, on October 11, 2022, Flexiti entered into an interest rate swap to protect against the interest risk on the C$390.0 million, variable rate portion of the borrowing facility, with a notional amount of C$390.0 million. As of December 31, 2022, a $0.8 million interest rate swap is included in Other assets and a $0.6 million pre-tax gain is recognized in Other comprehensive income on the Consolidated Balance Sheet as a result of the change in fair value. The swap has a term ending on September 29, 2025.
Interest Rate Swap on Flexiti Securitization
In accordance with the terms of the Flexiti Securitization, on July 7, 2022, Flexiti entered into an interest rate swap to protect against the interest risk on the C$526.5 million, variable rate, borrowing facility, with a notional amount of C$526.5 million. As a result of the swap, the effective interest rate is 7.09%. As of December 31, 2022, a $6.6 million interest rate swap is included in other assets and a $6.6 million pre-tax gain as a result of the change in fair value is recognized in other comprehensive income on the Consolidated Balance Sheet. The swap has a term ending on December 9, 2025.
Ranking and Guarantees
The 7.50% Senior Secured Notes rank senior in right of payment to all of the Company's and its guarantor entities’ existing and future subordinated indebtedness and equal in right of payment with all of the Company's and its guarantor entities’ existing and future senior indebtedness, including borrowings under revolving credit facilities. Pursuant to the Inter-creditor Agreement, these notes and the guarantees will be effectively subordinated to credit facilities and certain other indebtedness to the extent of the value of the assets securing such indebtedness and to liabilities of subsidiaries that are not guarantors.
The 7.50% Senior Secured Notes are secured by liens on substantially all of the Company's and the guarantors’ assets, subject to certain exceptions. At any time prior to August 1, 2024, the Company may redeem (i) up to 40% of the aggregate principal amount of the notes at a price equal to 107.5% of the principal amount, plus accrued and unpaid interest, if any, to the applicable redemption date with the net proceeds to the Company of certain equity offerings; and (ii) some or all of the Notes at a make-whole price. On or after August 1, 2024, the Company may redeem some or all of the Notes at a premium that will decrease over time, plus accrued and unpaid interest, if any, to the applicable date of redemption. The redemption price for the Notes if redeemed during the 12 months beginning (i) August 1, 2024 is 103.8%, (ii) August 1, 2025 is 101.9% and (iii) on or after August 1, 2026 is 100.0%.
CURO GROUP HOLDINGS CORP. AND SUBSIDIARIES
NOTES TO CONSOLIDATED FINANCIAL STATEMENTS (continued)
Future Maturities of Debt
Annual maturities of outstanding debt for each of the five years after December 31, 2022 are as follows (in thousands):
| | | | | |
| Amount |
| 2023 | $ | 35,000 | |
| 2024 | — | |
| 2025 | 1,314,833 | |
| 2026 | 294,594 | |
| 2027 | — | |
| Thereafter | 1,000,000 | |
| Debt (before deferred financing costs and discounts) | 2,644,427 | |
| Less: deferred financing costs and discounts | 37,113 | |
| Debt, net | $ | 2,607,314 | |
NOTE 7 – COMMITMENTS AND CONTINGENCIES
Securities Litigation and Enforcement
In 2018, a putative securities fraud class action lawsuit was filed against the Company and certain of its directors and officers and other related parties in the United States District Court for the District of Kansas, captioned Yellowdog Partners, LP v. CURO Group Holdings Corp., Donald F. Gayhardt, William Baker and Roger W. Dean, Civil Action No. 18-2662 (the "Yellowdog Action"). The suit alleged the Company made misleading statements and omitted material information regarding the Company's efforts to transition the Canadian inventory of products from Installment loans to Revolving LOC loans. The case was resolved in 2020 for $9.0 million, of which the first $2.5 million was paid by the Company and the remainder paid by the Company's insurance carriers. For the year ended December 31, 2022, there was no further expense related to this litigation.
In June and July 2020, three shareholder derivative lawsuits were filed in the United States District Court for the District of Delaware ("Court") against the Company, certain of its directors and officers, and in two of the three lawsuits, a large stockholder. Plaintiffs generally alleged the same underlying facts of the Yellowdog Action. In July 2021, the derivative lawsuits were voluntarily dismissed and plaintiffs refiled two cases in the United States District Court for the District of Kansas. On October 27, 2022, the Court granted final approval of the parties' settlement and dismissed the case with prejudice. The terms of the settlement provided for the implementation of certain corporate governance reforms and a payment of $345,000 in attorneys’ fees and expenses to plaintiffs’ counsel, which was paid by the Company's insurers, and included no admission of liability or wrongdoing by the Company.
Other Legal Matters. The Company is a defendant in certain other litigation matters encountered from time-to-time in the ordinary course of business, some of which may be covered to an extent by insurance. While it is difficult to predict the outcome of any particular proceeding, the Company does not believe the result of any of these matters will have a material adverse effect on the Company's business, results of operations or financial condition.
CURO GROUP HOLDINGS CORP. AND SUBSIDIARIES
NOTES TO CONSOLIDATED FINANCIAL STATEMENTS (continued)
NOTE 8 – INCOME TAXES
Income before taxes and income tax expense (benefit) was comprised of the following (in thousands):
| | | | | | | | | | | |
| Year Ended December 31, |
| 2022 | 2021 | 2020 |
| (Loss) income before taxes | | | |
| U.S. | $ | (140,463) | | $ | 86,106 | | $ | 59,741 | |
| Non-U.S. | (53,697) | | (5,549) | | 20,602 | |
| (Loss) income from continuing operations before taxes | $ | (194,160) | | $ | 80,557 | | $ | 80,343 | |
| Current provision (benefit) | | | |
| Federal | $ | 16,254 | | $ | 21,549 | | $ | (14,585) | |
| State | 3,783 | | 4,553 | | 5,959 | |
| Foreign | 9,120 | | 13,639 | | 3,925 | |
| Current provision (benefit) | $ | 29,157 | | $ | 39,741 | | $ | (4,701) | |
| Deferred tax (benefit) provision | | | |
| Federal | $ | (19,691) | | $ | (5,022) | | $ | 14,949 | |
| State | (1,873) | | 154 | | (1,247) | |
| Foreign | (16,271) | | (13,650) | | (3,106) | |
| Deferred tax (benefit) provision | $ | (37,835) | | $ | (18,518) | | $ | 10,596 | |
| (Benefit) provision for income taxes | $ | (8,678) | | $ | 21,223 | | $ | 5,895 | |
Differences between the Company's effective income tax rate computed on net earnings or loss before income taxes and the statutory federal income tax rate were as follows (dollars in thousands):
| | | | | | | | | | | | | | | | | |
| Year Ended December 31, |
| 2022 | | 2021 | | 2020 |
| Income tax (benefit) expense using the statutory federal rate in effect | $ | (40,774) | | | $ | 16,917 | | | $ | 16,872 | |
| Tax effect of: | | | | | |
| Effects of foreign rates different than U.S. statutory rate | 3,222 | | | 518 | | | (1,236) | |
| State, local and provincial income taxes, net of federal benefit | (2,635) | | | 3,359 | | | 6,619 | |
| Tax credits | (678) | | | (802) | | | (3,188) | |
| Nondeductible expenses | 1,801 | | | 1,090 | | | 564 | |
| | | | | |
| | | | | |
| | | | | |
| Valuation allowance | 1,349 | | | (275) | | | (2,686) | |
| Prior year income tax re-determination | (602) | | | — | | | — | |
| | | | | |
| | | | | |
| | | | | |
| Share-based compensation | 132 | | | (705) | | | 1,119 | |
| | | | | |
| Gain on sale of business | 8,484 | | | — | | | — | |
| Impairment of Goodwill | 22,369 | | | — | | | — | |
| Federal NOL carryback | — | | | — | | | (11,251) | |
| Prior year basis adjustment | — | | | — | | | (659) | |
| Change in fair value of contingent consideration | (1,187) | | | 944 | | | — | |
| Other | (159) | | | 177 | | | (259) | |
| Total (benefit) provision for income taxes | $ | (8,678) | | | $ | 21,223 | | | $ | 5,895 | |
| Effective income tax rate | 4.5 | % | | 26.3 | % | | 7.3 | % |
| Statutory federal income tax rate | 21.0 | % | | 21.0 | % | | 21.0 | % |
On March 27, 2020, the CARES Act was enacted in response to the COVID-19 pandemic, which, among other things, allowed U.S. federal NOLs incurred in 2018, 2019 and 2020 to be carried back to each of the five preceding taxable years to generate a refund of previously paid income taxes. In 2020, the Company recorded an income tax benefit of $11.3 million due to the differential in income tax rates related to the carryback of NOLs from tax years 2018 and 2019 to years with a higher statutory tax rate.
CURO GROUP HOLDINGS CORP. AND SUBSIDIARIES
NOTES TO CONSOLIDATED FINANCIAL STATEMENTS (continued)
The Company's major tax jurisdictions are U.S. federal, various states and Canada (including provinces). In the U.S., the tax years 2018 through 2021 remain open to examination by the taxing authorities as well as tax years 2013 through 2017 to the extent of refund claims resulting from 2018 and 2019 NOL carrybacks. The tax years 2016 through 2021 remain open to examination by the taxing authorities in Canada. As of December 31, 2022, the Company is under income tax examinations in the U.S. by the Internal Revenue Service for tax years 2018 and 2019, in Canada by the Canadian Revenue Agency for tax years ending June 30, 2017 through June 30, 2018 and in Canada by Alberta Treasury Board and Finance for tax years ending December 31, 2018 and December 31, 2019.
The total amount of gross unrecognized tax benefits was $2.0 million and $0.3 million at December 31, 2022 and 2021, respectively. The total amount of unrecognized tax benefits that, if recognized, would affect the effective tax rate is $2.0 million at December 31, 2022. The Company expects no material change related to its current positions in recorded unrecognized income tax (benefit) liability in the next 12 months.
The Company classifies interest and penalties related to income taxes as other expenses. The Company did not record any interest or penalties related to unrecognized tax benefits during each of the years ended December 31, 2022 and 2021.
A reconciliation of the beginning and ending amounts of unrecognized tax benefits is as follows (in thousands):
| | | | | | | | | | | | | |
| Year Ended December 31, |
| 2022 | | 2021 | | |
| Balance at the beginning of year | $ | 250 | | | $ | 1,100 | | | |
| Additions for tax positions related to prior years | 1,648 | | | 125 | | | |
| Additions for tax positions related to the current year | 60 | | | 125 | | | |
| Settlements with taxing authorities | — | | | (1,100) | | | |
| Balance at end of year | $ | 1,958 | | | $ | 250 | | | |
The sources of deferred income tax assets (liabilities) are summarized as follows (in thousands):
| | | | | | | | |
| Year Ended December 31, |
| 2022 | 2021 |
| Deferred tax assets related to: | | |
| Loans receivable | $ | 9,913 | | $ | — | |
| Accrued expenses and other reserves | 7,309 | | 2,960 | |
| Lease liability | 16,055 | | 26,777 | |
| Compensation accruals | 6,826 | | 5,845 | |
| Deferred revenue | 1,811 | | 204 | |
| | |
| State and provincial NOL carryforwards | 18,560 | | 15,547 | |
| Foreign NOL and capital loss carryforwards | 21,378 | | 17,090 | |
| Tax credit carryforwards | 3,872 | | 3,905 | |
| Gross deferred tax assets | 85,724 | | 72,328 | |
| Less: Valuation allowance | (9,719) | | (7,732) | |
| Net deferred tax assets | $ | 76,005 | | $ | 64,596 | |
| Deferred tax liabilities related to: | | |
| Property and equipment | $ | (2,820) | | $ | (14,950) | |
| Right of use asset | (15,648) | | (25,304) | |
| Goodwill and other intangible assets | (2,730) | | (9,914) | |
| Prepaid expenses and other assets | (3,055) | | (466) | |
| Hedge accounting | (1,859) | | — | |
| Loans receivable | — | | (4,367) | |
| Gross deferred tax liabilities | (26,112) | | (55,001) | |
| Net deferred tax assets | $ | 49,893 | | $ | 9,595 | |
CURO GROUP HOLDINGS CORP. AND SUBSIDIARIES
NOTES TO CONSOLIDATED FINANCIAL STATEMENTS (continued)
Deferred tax assets and liabilities are included in the following line items in the Consolidated Balance Sheets (in thousands):
| | | | | | | | |
| Year Ended December 31, |
| 2022 | 2021 |
| Deferred tax assets | $ | 49,893 | | $ | 15,639 | |
| Deferred tax liabilities | — | | (6,044) | |
| Net deferred tax assets | $ | 49,893 | | $ | 9,595 | |
As of December 31, 2022, the Company had undistributed earnings of certain foreign subsidiaries of $255.2 million. The Company intends to reinvest its foreign earnings indefinitely in the non-U.S. operations and therefore has not provided for any non-U.S. withholding tax that would be assessed on dividend distributions. If the earnings of $255.2 million were distributed to the U.S., the Company would be subject to estimated Canadian withholding taxes of approximately $12.8 million. The determination of the U.S. state income taxes upon a potential foreign earnings distribution is impractical. In the event the earnings were distributed to the U.S., the Company would adjust its income tax provision for the period and would determine the amount of foreign tax credit that would be available.
A summary of the valuation allowance was as follows (in thousands):
| | | | | | | | | | | | | | | | | |
| Year Ended December 31, |
| 2022 | | 2021 | | 2020 |
| Balance at the beginning of year | $ | 7,732 | | | $ | 5,695 | | | $ | 8,328 | |
| Increase (decrease) to balance charged as expense | 1,349 | | | (275) | | | (2,686) | |
| Increase to balance charged to opening balance sheet of the acquisition | 1,044 | | | 1,873 | | | — | |
| (Decrease) to balance for the divestiture | (542) | | | — | | | — | |
| Increase (decrease) to balance charged to Other comprehensive income | 136 | | | 392 | | | (378) | |
| Effect of foreign currency translation | — | | | 47 | | | 431 | |
| Balance at end of year | $ | 9,719 | | | $ | 7,732 | | | $ | 5,695 | |
In general, management believes that the realization of its deferred tax assets is more likely than not based on the expectations of future taxable income; therefore, there was no deferred tax valuation allowance at December 31, 2022, 2021 or 2020 with the exception of the tax benefits from certain carryovers of state and foreign losses and Foreign Tax Credits ("FTC").
As of December 31, 2022, the Company's deferred tax assets from Canadian federal and provincial NOL carryforwards were approximately $34.8 million. The Canadian NOL carryforwards expire in varying amounts between 2033 and 2042. During the tax year ended December 31, 2020, the Company concluded that a planning strategy is prudent and feasible and that it will be implemented if needed to prevent Canadian NOLs from expiring. As such, the Company released a $4.6 million valuation allowance related to these NOLs and had no valuation allowance related to these NOLs as of December 31, 2020. Relying on this tax strategy for most of its Canadian NOLs, as of December 31, 2022, the Company had a valuation allowance of $1.2 million for NOLs without a feasible tax planning strategy. As of December 31, 2022, the Company's deferred tax assets from Canadian capital losses were $1.7 million. These losses can be carried forward indefinitely, however, the Company does not have material sources of generating capital gains, therefore, a full valuation allowance has been recorded against these losses. As of December 31, 2022, the Company had state NOL carryforward deferred tax assets of $3.5 million. These carryforwards expire in varying amounts between 2033 and 2042. The Company has recorded a valuation allowance of $3.2 million related to the NOLs generated in states in which the Company may not have taxable income in the near future.
For the year ended December 31, 2021, the Company recorded a deferred tax asset of $3.0 million related to FTC carryovers from prior years with a corresponding full valuation allowance, as the Company determined the FTC carryover will expire prior to utilization.
CURO GROUP HOLDINGS CORP. AND SUBSIDIARIES
NOTES TO CONSOLIDATED FINANCIAL STATEMENTS (continued)
NOTE 9 – EARNINGS PER SHARE
The following table presents the computation of basic and diluted earnings per share (in thousands, except per share amounts):
| | | | | | | | | | | | | | | | | | | | | |
| | | For the Year Ended
December 31, |
| | | | | 2022 | | 2021 | | 2020 |
| Net (loss) income from continuing operations | | | | | $ | (185,484) | | | $ | 59,334 | | | $ | 74,448 | |
| Net income from discontinued operations, net of tax | | | | | — | | | — | | | 1,285 | |
| Net income | | | | | $ | (185,484) | | | $ | 59,334 | | | $ | 75,733 | |
| | | | | | | | | |
| Weighted average common shares - basic | | | | | 40,428 | | | 41,155 | | | 40,886 | |
| Dilutive effect of stock options and restricted stock units | | | | | — | | | 1,988 | | | 1,205 | |
| Weighted average common shares - diluted | | | | | 40,428 | | | 43,143 | | | 42,091 | |
| | | | | | | | | |
| (Loss) earnings per share: | | | | | | | | | |
| Continuing operations | | | | | $ | (4.59) | | | $ | 1.44 | | | $ | 1.82 | |
| Discontinued operations | | | | | — | | | — | | | 0.03 | |
| Basic (loss) earnings per share | | | | | $ | (4.59) | | | $ | 1.44 | | | $ | 1.85 | |
| | | | | | | | | |
| Diluted (loss) earnings per share: | | | | | | | | | |
| Continuing Operations | | | | | $ | (4.59) | | | $ | 1.38 | | | $ | 1.77 | |
| Discontinued operations | | | | | — | | | — | | | 0.03 | |
| Diluted (loss) earnings per share | | | | | $ | (4.59) | | | $ | 1.38 | | | $ | 1.80 | |
| | |
Potential shares of common stock that would have the effect of increasing diluted earnings per share or decreasing diluted loss per share are considered to be anti-dilutive; therefore, these shares are not included in calculating diluted earnings per share. For the year ended December 31, 2022, 2021 and 2020 there were 2.8 million, 0.2 million and 0.8 million of potential shares of common stock excluded from the calculation of diluted earnings per share because their effect was anti-dilutive.
The Company utilizes the "control number" concept in the computation of diluted earnings per share to determine whether potential common stock instruments are dilutive. The control number used is income. The control number concept requires that the same number of potentially dilutive securities applied in computing diluted earnings per share is applied to all other categories of income or loss, regardless of their anti-dilutive effect on such categories.
NOTE 10 – SHARE BASED COMPENSATION
The 2010 Equity Incentive Plan provided for the issuance of up to 2.16 million shares, subject to certain adjustment provisions, in the form of stock options, restricted stock and stock grants. In connection with approval of the 2017 Incentive Plan, no new awards were granted under the 2010 Equity Incentive Plan.
The Company's 2017 Incentive Plan provides for the issuance of up to 9.0 million shares, subject to certain adjustments, which may be issued in the form of stock options, restricted stock awards, RSUs, stock appreciation rights, performance awards or other awards. Grants issued to date under the plan may be settled in or based on common stock. Awards may be granted to officers, employees, consultants and directors. The 2017 Incentive Plan provides that shares of common stock subject to awards granted become available for re-issuance if such awards expire, or are canceled, forfeited, settled in cash or otherwise terminated.
Stock Options
Stock options are awards which allow the grantee to purchase shares of common stock at prices equal to the fair value at the date of grant. Stock options typically vest at a rate of 20% per year over a 5-year period, have a term of 10 years and are subject to limitations on transferability. The Company did not grant stock option awards under the 2017 Incentive Plan in 2022, 2021 or 2020.
At the time of grant, the Company uses the Black-Scholes option pricing model to determine the fair value of stock options. Estimates of fair value are not intended to predict actual future events or the value ultimately realized by individuals who receive
CURO GROUP HOLDINGS CORP. AND SUBSIDIARIES
NOTES TO CONSOLIDATED FINANCIAL STATEMENTS (continued)
equity awards, and subsequent events are not indicative of the reasonableness of the Company's original estimates of fair value. The Company has estimated the expected term of stock options using a formula considering the weighted average vesting term and the original contract term. The expected volatility is estimated based upon the historical volatility of publicly traded stocks from the Company's industry sector (the alternative financial services sector). The expected risk-free interest rate is based on an average of various U.S. Treasury rates based on the expected term of the awards.
The following table summarizes the Company's stock option activity for the years ended December 31, 2022, 2021 and 2020:
| | | | | | | | | | | | | | | | | | | | | | | | | | | | | |
| Stock Options | | Weighted Average Exercise Price | | Weighted Average Grant Date Fair Value | | Weighted Average Remaining Contractual Term (years) | | Aggregate Intrinsic Value (in millions) |
| | | | | | | | | |
| | | | | | | | | |
| | | | | | | | | |
| | | | | | | | | |
| Outstanding at Outstanding at January 1, 2020 | 1,404,622 | | | $ | 3.56 | | | | | 2.6 | | $ | 12.1 | |
| Granted | — | | | $ | — | | | $ | — | | | | | |
| Exercised | (274,510) | | | $ | 2.79 | | | | | | | $ | 3.2 | |
| Forfeited | — | | | $ | — | | | $ | — | | | | | |
| Outstanding at December 31, 2020 | 1,130,112 | | | $ | 3.74 | | | | | 2.6 | | $ | 12.0 | |
| Granted | — | | | $ | — | | | $ | — | | | | | |
| Exercised | (615,024) | | | $ | 2.83 | | | | | | | $ | 8.1 | |
| Forfeited | — | | | $ | — | | | $ | — | | | | | |
| Outstanding at December 31, 2021 | 515,088 | | | $ | 4.83 | | | | | 4.2 | | $ | 5.8 | |
| Granted | — | | | $ | — | | | $ | — | | | | | |
| Exercised | — | | | $ | — | | | | | | | $ | — | |
| Forfeited | — | | | $ | — | | | $ | — | | | | | |
| Outstanding at December 31, 2022 | 515,088 | | | $ | 4.83 | | | | | 3.2 | | $ | (0.7) | |
| | | | | | | | | |
| Options exercisable at December 31, 2022 | 515,088 | | | $ | 4.83 | | | | | 3.2 | | $ | (0.7) | |
RSUs
As of December 31, 2022, the Company has granted three types of RSUs: time-based, market-based and performance-based.
Grants of time-based RSUs are valued at the date of grant based on the closing market price of the Company's common stock and are expensed using the straight-line method over the service period. Time-based RSUs typically vest over a three-year or four-year period.
Grants of market-based RSUs are valued using the Monte Carlo simulation pricing model. The market-based RSUs granted to date vest after three years if the Company's total stockholder return over the three-year performance period meets a specified target relative to other companies in its selected peer group. Expense recognition for the market-based RSUs occurs over the service period using the straight-line method.
The Company granted performance-based RSUs to certain Flexiti employees following the closing of the acquisition. Grants of performance-based RSUs are valued at the grant date based on the closing market price of the Company's common stock. The performance-based RSUs vest over two years ending in March 2023 if Flexiti achieves specified internal targets, including revenue less NCOs and loan originations metrics. Expense recognition for performance-based RSUs occurs ratably over the service period if it is probable that the targets will be achieved as of each period end. If such results are not probable, no share-based compensation expense is recognized and any previously recognized share-based compensation expense is reversed.
Unvested shares of RSUs generally are forfeited upon termination of employment, or failure to achieve the required performance condition, if applicable.
CURO GROUP HOLDINGS CORP. AND SUBSIDIARIES
NOTES TO CONSOLIDATED FINANCIAL STATEMENTS (continued)
A summary of the activity of time-based, market-based and performance-based unvested RSUs for the years ended December 31, 2022, 2021 and 2020 are presented in the following table:
| | | | | | | | | | | | | | | | | |
| Number of RSUs | | Weighted Average
Grant Date Fair Value per Share |
| Time-Based | Market-Based | Performance-Based | |
| | | | | |
| | | | | |
| | | | | |
| | | | | |
| January 1, 2020 | 1,061,753 | | 394,861 | | — | | | $ | 11.47 | |
| Granted | 694,213 | | 368,539 | | — | | | $ | 10.40 | |
| Vested | (716,268) | | — | | — | | | $ | 12.86 | |
| Forfeited | (26,906) | | (4,687) | | — | | | $ | 11.89 | |
| December 31, 2020 | 1,012,792 | | 758,713 | | — | | | $ | 10.26 | |
| Granted | 1,238,564 | | 299,053 | | 253,310 | | | $ | 15.51 | |
| Vested | (494,790) | | — | | — | | | $ | 11.04 | |
| Forfeited | (80,638) | | (51,032) | | — | | | $ | 11.46 | |
| December 31, 2021 | 1,675,928 | | 1,006,734 | | 253,310 | | | $ | 13.27 | |
| Granted | 1,649,980 | | 1,422,886 | | — | | | $ | 9.75 | |
| Vested | (785,751) | | — | | (7,568) | | | $ | 13.80 | |
| Forfeited | (444,088) | | (701,258) | | (101,252) | | | $ | 11.90 | |
| December 31, 2022 | 2,096,069 | | 1,728,362 | | 144,490 | | | $ | 10.87 | |
Share-based compensation expense, which includes compensation costs from stock options and RSUs, included in the Consolidated Statements of Operations as a component of "Salaries and benefits" is summarized in the following table (in thousands):
| | | | | | | | | | | | | | | | | |
| For the year ended, |
| 2022 | | 2021 | | 2020 |
| Pre-tax share-based compensation expense | $ | 13,957 | | | $ | 13,976 | | | $ | 12,910 | |
| Income tax benefit | (3,283) | | | (4,475) | | | (1,164) | |
| Total share-based compensation expense, net of tax | $ | 10,674 | | | $ | 9,501 | | | $ | 11,746 | |
As of December 31, 2022, there was $22.2 million of unrecognized compensation cost related to RSUs. Total unrecognized compensation costs will be recognized over a weighted-average period of 1.9 years. There was no unrecognized compensation cost related to stock options.
NOTE 11 – LEASES
Leases entered into by the Company are primarily for retail stores in certain U.S. states and Canadian provinces.
Leases classified as finance leases were immaterial to the Company as of December 31, 2022. Operating leases expire at various times through 2033. Operating leases are included in "Right of use asset - operating leases" and "Lease liability - operating leases" in the Consolidated Balance Sheets. Operating lease costs are included in "Occupancy" in the Consolidated Statement of Operations. The majority of leases have an original term up to five years plus renewal options under similar terms.
The following table summarizes the operating lease costs and other information for the years ended December 31, 2022, 2021
and 2020 (in thousands):
CURO GROUP HOLDINGS CORP. AND SUBSIDIARIES
NOTES TO CONSOLIDATED FINANCIAL STATEMENTS (continued)
| | | | | | | | | | | | | | | | | | | | |
| | Year Ended December 31, |
| | 2022 | | 2021 | | 2020 |
| Operating lease costs: | | | | | | |
Third-Party | | $ | 32,538 | | | $ | 31,197 | | | $ | 30,828 | |
Related-Party | | 2,282 | | | 3,394 | | | 3,386 | |
Total operating lease costs (1) | | $ | 34,820 | | | $ | 34,591 | | | $ | 34,214 | |
| | | | | | |
| Cash paid for amounts included in the measurement of operating lease liabilities | | $ | 28,414 | | | $ | 36,235 | | | $ | 34,651 | |
| ROU assets (divested) obtained | | $ | (24,749) | | | $ | 9,682 | | | $ | 18,847 | |
| Weighted average remaining lease term - Operating leases | | 4.4 years | | 4.9 years | | 5.7 years |
| Weighted average discount rate - Operating leases | | 7.8 | % | | 8.3 | % | | 9.9 | % |
(1) Includes immaterial variable lease costs. |
The following table summarizes the aggregate operating lease payments that the Company is contractually obligated to make
under operating leases as of December 31, 2022 (in thousands):
| | | | | | | | | | | | | | | | | | | | |
| | Third-Party | | Related-Party | | Total |
| 2023 | | $ | 24,323 | | | $ | 616 | | | $ | 24,939 | |
| 2024 | | 17,433 | | | 632 | | | 18,065 | |
| 2025 | | 11,813 | | | 649 | | | 12,462 | |
| 2026 | | 6,686 | | | 667 | | | 7,353 | |
| 2027 | | 4,265 | | | 685 | | | 4,950 | |
| Thereafter | | 8,139 | | | 993 | | | 9,132 | |
| Total | | 72,659 | | | 4,242 | | | 76,901 | |
| Less: Imputed interest | | (12,878) | | | (1,176) | | | (14,054) | |
| Operating lease liabilities | | $ | 59,781 | | | $ | 3,066 | | | $ | 62,847 | |
There were no material leases entered into subsequent to the balance sheet date.
CURO GROUP HOLDINGS CORP. AND SUBSIDIARIES
NOTES TO CONSOLIDATED FINANCIAL STATEMENTS (continued)
NOTE 12 – DIVIDENDS
Dividend Program
In February 2020, the Company initiated a dividend program which provided a quarterly dividend of $0.055 per share ($0.22 per share annualized). In May 2021, the Company increased its quarterly dividend to $0.11 per share.
The table below summarizes the Company's quarterly dividends for the years ended December 31, 2022 and 2021.
| | | | | | | | | | | | | | | | | |
| | | | | Dividends Paid |
| Date of declaration | Stockholders of record | Date paid | Dividend per share | (in thousands) |
| Q1 2022 | February 4, 2022 | February 18, 2022 | March 1, 2022 | $ | 0.11 | | $ | 4,517 | |
| Q2 2022 | April 28, 2022 | May 10, 2022 | May 23, 2022 | $ | 0.11 | | $ | 4,440 | |
| Q3 2022 | August 3, 2022 | August 15, 2022 | August 26, 2022 | $ | 0.11 | | $ | 4,453 | |
| | | | | |
| | | | | | | | | | | | | | | | | |
| | | | | Dividends Paid |
| Date of declaration | Stockholders of record | Date paid | Dividend per share | (in thousands) |
| Q1 2021 | January 29, 2021 | February 16, 2021 | March 2, 2021 | $ | 0.055 | | $ | 2,284 | |
| Q2 2021 | May 3, 2021 | May 14, 2021 | May 27, 2021 | $ | 0.11 | | $ | 4,580 | |
| Q3 2021 | July 28, 2021 | August 9, 2021 | August 19, 2021 | $ | 0.11 | | $ | 4,556 | |
| Q4 2021 | October 27, 2021 | November 12, 2021 | November 22, 2021 | $ | 0.11 | | $ | 4,453 | |
| | | | | |
| | | | | |
| | | | | |
In October 2022, the Company's Board of Directors suspended the quarterly dividend.
NOTE 13 – SEGMENT REPORTING
Segment information is prepared on the same basis that the Company's CODM reviews financial information for operational decision making purposes, including revenues, net revenue, gross margin, segment operating income and other items.
As of December 31, 2022, the Company has renamed the "U.S." reportable segment to the "U.S. Direct Lending" reportable segment.
U.S. Direct Lending. As of December 31, 2022, the Company operated over 490 U.S. retail locations in 13 states. The Company provides secured and unsecured installment loan products to near-prime and non-prime consumers as well as credit insurance and other ancillary financial products.
Canada Direct Lending. As of December 31, 2022, the Company operated nearly 150 stores across eight Canadian provinces and had an online presence in eight provinces and one territory. The Company provides Revolving LOC and Installment loans, which include Single-Pay loans, optional credit protection insurance products to Revolving LOC and Installment loan customers, check cashing, money transfer services, foreign currency exchange, reloadable prepaid debit cards and a number of other ancillary financial products and services.
Canada POS Lending. As of December 31, 2022, the Company served Canadian customers through POS financing available at over 8,400 retail locations and over 3,500 merchant partners across 10 provinces and two territories. The Company provides Revolving LOC loans and a number of other ancillary financial products. Results of operations for the year ended December 31, 2021 for Canada POS Lending represent results from the date of Flexiti's acquisition, March 10, 2021, through December 31, 2021.
CURO GROUP HOLDINGS CORP. AND SUBSIDIARIES
NOTES TO CONSOLIDATED FINANCIAL STATEMENTS (continued)
The following table illustrates summarized financial information concerning reportable segments (in thousands):
| | | | | | | | | | | | | | | | | | | | | | |
| | | | For the Year Ended
December 31, |
| | | | | | 2022 | | 2021 | | 2020 |
Revenues by segment: (1) | | | | | | | | | | |
| U.S. Direct Lending | | | | | | $ | 615,722 | | | $ | 525,962 | | | $ | 638,524 | |
| Canada Direct Lending | | | | | | 303,750 | | | 257,039 | | | 208,872 | |
| Canada POS Lending | | | | | | 106,446 | | | 34,842 | | | — | |
| Consolidated revenue | | | | | | $ | 1,025,918 | | | $ | 817,843 | | | $ | 847,396 | |
| Net revenues by segment: | | | | | | | | | | |
| U.S. Direct Lending | | | | | | $ | 375,144 | | | $ | 359,929 | | | $ | 408,360 | |
| Canada Direct Lending | | | | | | 189,183 | | | 202,042 | | | 150,225 | |
| Canada POS Lending | | | | | | 61,266 | | | 10,204 | | | — | |
| Consolidated net revenue | | | | | | $ | 625,593 | | | $ | 572,175 | | | $ | 558,585 | |
| Segment (loss) income before income taxes: | | | | | | | | | | |
| U.S. Direct Lending | | | | | | $ | (175,350) | | | $ | 47,517 | | | $ | 34,172 | |
| Canada Direct Lending | | | | | | 51,163 | | | 88,731 | | | 46,171 | |
| Canada POS Lending | | | | | | (69,975) | | | (55,691) | | | — | |
| Consolidated (loss) income before income taxes | | | | | | $ | (194,162) | | | $ | 80,557 | | | $ | 80,343 | |
| Expenditures for long-lived assets by segment: | | | | | | | | | | |
| U.S. Direct Lending | | | | | | $ | 18,173 | | | $ | 13,450 | | | $ | 10,079 | |
| Canada Direct Lending | | | | | | 6,768 | | | 2,238 | | | 639 | |
| Canada POS Lending | | | | | | 20,880 | | | 7,891 | | | — | |
| Consolidated expenditures for long-lived assets | | | | | | $ | 45,821 | | | $ | 23,579 | | | $ | 10,718 | |
|
The following table provides the proportion of gross loans receivable by segment (in thousands):
| | | | | | | | | | | | | | |
| | December 31,
2022 | | December 31,
2021 |
| U.S. Direct Lending | | $ | 773,380 | | | $ | 661,945 | |
| Canada Direct Lending | | 481,015 | | | 427,197 | |
| Canada POS Lending | | 833,438 | | | 459,176 | |
| Total gross loans receivable | | $ | 2,087,833 | | | $ | 1,548,318 | |
The following table represents the Company's net long-lived assets, comprised of property and equipment, by segment. These amounts are aggregated on a legal entity basis and do not necessarily reflect where the asset is physically located (in thousands):
| | | | | | | | | | | | | | |
| | December 31,
2022 | | December 31,
2021 |
| U.S. Direct Lending | | $ | 13,993 | | | $ | 32,753 | |
| Canada Direct Lending | | 15,239 | | | 21,072 | |
| Canada POS Lending | | 2,725 | | | 810 | |
| Total net long-lived assets | | $ | 31,957 | | | $ | 54,635 | |
The Company's CODM does not review assets by segment for purposes of allocating resources or decision-making purposes; therefore, total assets by segment are not disclosed.
CURO GROUP HOLDINGS CORP. AND SUBSIDIARIES
NOTES TO CONSOLIDATED FINANCIAL STATEMENTS (continued)
NOTE 14 – ACQUISITIONS AND DIVESTITURE
ACQUISITIONS
First Heritage
On July 13, 2022, we completed the acquisition of First Heritage, a consumer lender that provides near-prime installment loans along with customary opt-in insurance and other financial products, for a purchase price of $140.0 million in cash, subject to certain customary working capital and other adjustments. The Company began consolidating the financial results of First Heritage in the Consolidated Financial Statements on July 13, 2022 within the U.S. Direct Lending operating segment.
This transaction has been accounted for using the acquisition method of accounting, which requires that assets acquired and liabilities assumed be recognized at their fair values as of the acquisition date. The Company was the acquirer for purposes of accounting for the business combination. The values assigned to the acquired assets and liabilities assumed are provisional based on the preliminary fair value estimates as of the acquisition date. The values assigned to the assets acquired and liabilities assumed are based on preliminary estimates of fair value available as of the date of this Form 10-K and may be adjusted during the measurement period of up to 12 months from the date of acquisition as further information becomes available. Any changes in the fair values of the assets acquired and liabilities assumed during the measurement period may result in adjustments to goodwill. As of December 31, 2022, the areas that remain primarily relate to the valuation of certain loans receivables, intangible assets and certain tax-related balances.
The following table presents the preliminary purchase price allocation recorded in the Company’s Consolidated Balance Sheet as of the date of acquisition (in thousands):
| | | | | |
| Amounts acquired on July 13, 2022 |
| Assets | |
Cash and cash equivalents | $ | 31,396 | |
| Restricted cash | 1,933 | |
Gross loans receivable(1) | 218,011 | |
| Prepaid expenses and other | 1,285 | |
| Property and equipment | 345 | |
Right-of-use assets | 4,241 | |
| Intangibles, net | 10,670 | |
| Total assets | $ | 267,880 | |
| |
| Liabilities | |
| Accounts payable and accrued liabilities | $ | 4,270 | |
| Lease liabilities | 4,241 | |
| Debt | 170,392 | |
| Total liabilities | 178,904 | |
| |
| Net assets acquired | 88,976 | |
| Total consideration paid | 164,341 | |
| Goodwill | $ | 75,365 | |
(1) The gross contractual loans receivables as of July 13, 2022 were $236.1 million, of which the Company estimates $18.1 million will not be collected. |
The following table sets forth the components of identifiable intangible assets acquired and their estimated useful lives as of the date of acquisition (dollars in thousands):
| | | | | | | | | | | |
| Fair Value | Useful Life | | | |
| Trade name | $ | 3,790 | | 10.0 years | | | |
| Customer relationships | 6,880 | | 3.5 years | | | |
| Total identified intangible assets | $ | 10,670 | | | | | |
CURO GROUP HOLDINGS CORP. AND SUBSIDIARIES
NOTES TO CONSOLIDATED FINANCIAL STATEMENTS (continued)
Goodwill of $75.4 million represents the excess of the consideration paid over the fair value of the net tangible and intangible assets acquired. The goodwill was primarily attributable to expected synergies created with the Company’s future product offerings and the value of the combined workforce. Goodwill from this transaction is deductible for income tax purposes.
The Company incurred costs related to this acquisition of $10.1 million that were recorded in "Other operating expense" in the U.S. Direct Lending operating segment in the accompanying Consolidated Statement of Operations for the year ended December 31, 2022.
Heights Finance
On December 27, 2021, the Company acquired 100% of the outstanding stock of Heights Finance for $360.0 million, consisting of $335.0 million in cash and $25.0 million of our common stock. Heights Finance is a consumer finance company that provides secured and unsecured Installment loans to near-prime and non-prime consumers, and offers customary opt-in insurance and other financial products across 390 branches in 11 U.S. states.
The Company began consolidating the financial results of Heights Finance in the Consolidated Financial Statements on December 27, 2021 within the U.S. Direct Lending operating segment. For additional information, see Note 15, "Acquisitions" of the 2021 Form 10-K.
As of December 31, 2021, the Company completed the determination of the fair values of the acquired identifiable assets and liabilities. During the year ended December 31, 2022, the Company recorded measurement period adjustments that increased goodwill by $11.8 million. The measurement period adjustment related to the fair value of the loan portfolio and would have resulted in $7.7 million of incremental interest and fee revenue during the three months ended March 31, 2022 and no impact on the 12 months ended December 31, 2022. The Company recorded a measurement period adjustment in the fourth quarter of 2022 that decreased goodwill by $3.5 million related to the final true-up of deferred tax balances after the pre-acquisition income tax returns were filed in October 2022. The Company made these measurement period adjustments to reflect the correct deferred tax balances that existed as of the acquisition date and not from events subsequent to such date. Additionally, in the fourth quarter of 2022, a measurement period adjustment was recorded related to tax filings for pre-acquisition activity which resulted in $4.2 million of income tax receivables and an increase to accounts payable for the same amount. As of December 31, 2022, the Company completed the determination of the fair values of the acquired identifiable assets and liabilities.
The following table presents the purchase price allocation recorded in the Company’s Consolidated Balance Sheet as of the date of acquisition of Heights Finance (in thousands):
CURO GROUP HOLDINGS CORP. AND SUBSIDIARIES
NOTES TO CONSOLIDATED FINANCIAL STATEMENTS (continued)
| | | | | | | | | | | | |
| Amounts acquired on December 27, 2021 | Measurement period adjustments | Amounts acquired on December 27, 2021 (as adjusted) | |
| Assets | | | | |
Cash and cash equivalents | $ | 13,564 | | $ | — | | $ | 13,564 | | |
| Restricted cash | 33,630 | | — | | 33,630 | | |
Gross loans receivable(1) | 471,630 | | (15,379) | | 456,251 | | |
| Income tax receivable | 3,526 | | 4,209 | | 7,735 | | |
| Prepaid expenses and other | 7,410 | | — | | 7,410 | | |
| Property and equipment | 4,748 | | — | | 4,748 | | |
Right-of-use assets | 16,111 | | — | | 16,111 | | |
| Intangibles, net | 11,900 | | — | | 11,900 | | |
| Deferred tax asset | — | | 2,477 | | 2,477 | | |
| Other assets | 98 | | — | | 98 | | |
| Total assets | $ | 562,617 | | $ | (8,693) | | $ | 553,924 | | |
| | | | |
| Liabilities | | | | |
| Accounts payable and accrued liabilities | $ | 19,186 | | $ | 4,209 | | $ | 23,395 | | |
| Lease liabilities | 16,315 | | — | | 16,315 | | |
| Deferred tax liability | 1,077 | | (1,077) | | — | | |
| Accrued interest on debt | 1,781 | | — | | 1,781 | | |
| Debt | 350,000 | | — | | 350,000 | | |
| Total liabilities | $ | 388,359 | | $ | 3,132 | | $ | 391,491 | | |
| | | | |
| Net assets acquired | $ | 174,258 | | $ | (11,825) | | $ | 162,433 | | |
| Total consideration paid | 428,115 | | | 428,115 | | |
| Goodwill | $ | 253,857 | | | $ | 265,682 | | |
(1) The gross contractual loans receivables as of December 27, 2021 were $485.4 million, of which the Company estimates $29.1 million will not be collected. | |
Flexiti
On March 10, 2021, the Company acquired 100% of the outstanding stock of Flexiti. The fair value of total consideration paid was $86.5 million in cash, $6.3 million in debt costs and $20.6 million in contingent cash consideration subject to future operating metrics, including revenue less NCOs and loan originations. Flexiti provides POS financing solution to retailers across Canada and provides the Company capability and scale opportunity in Canada’s credit card and POS financing markets.
The Company began consolidating the financial results of Flexiti in the Consolidated Financial Statements on March 10, 2021. Flexiti generated $34.8 million of revenue and incurred $50.9 million of operating expenses during the period March 10 through December 31, 2021.
This transaction was accounted for using the acquisition method of accounting, which requires that assets acquired and liabilities assumed be recognized at their fair values as of the acquisition date. The Company was the acquirer for purposes of accounting for the business combination. The values assigned to the assets acquired and liabilities assumed were based on their estimates of fair value available.
CURO GROUP HOLDINGS CORP. AND SUBSIDIARIES
NOTES TO CONSOLIDATED FINANCIAL STATEMENTS (continued)
The following table presents the purchase price allocation recorded in the Company’s Consolidated Balance Sheet as of the date of acquisition (in thousands):
| | | | | | | | | | | | |
| Amounts acquired on March 10, 2021 | Measurement period adjustments | Amounts acquired on March 10, 2021 (as adjusted) | |
| Assets | | | | |
Cash and cash equivalents | $ | 1,267 | | $ | — | | $ | 1,267 | | |
Gross loans receivable(1) | 196,138 | | — | | 196,138 | | |
| Prepaid expenses and other | 687 | | — | | 687 | | |
| Property and equipment | 460 | | — | | 460 | | |
Right-of-use assets | 616 | | — | | 616 | | |
Intangibles | 50,876 | | 3,572 | | 54,448 | | |
Deferred tax assets | 2,741 | | 908 | | 3,649 | | |
| Total assets | $ | 252,785 | | $ | 4,480 | | $ | 257,265 | | |
| | | | |
| Liabilities | | | | |
| Accounts payable and accrued liabilities | $ | 9,356 | | $ | — | | $ | 9,356 | | |
| Credit facilities | 174,367 | | — | | 174,367 | | |
| Lease liabilities | 616 | | — | | 616 | | |
| Total liabilities | $ | 184,339 | | $ | — | | $ | 184,339 | | |
| | | | |
| Net assets acquired | $ | 68,446 | | $ | 4,480 | | $ | 72,926 | | |
| Total consideration paid | 113,347 | | — | | 113,347 | | |
| Goodwill | $ | 44,901 | | $ | (4,480) | | $ | 40,421 | | |
(1) The gross contractual loans receivables as of March 10, 2021 were $208.6 million, of which the Company estimates $12.5 million will not be collected. | |
During the year ended December 31, 2021, the Company recorded a cumulative net measurement period adjustment that decreased goodwill by $4.5 million. The measurement period adjustment would have resulted in an insignificant increase in amortization expense related to the merchant relationships intangible asset during the first quarter of 2021 when the Company acquired Flexiti. The Company made these measurement period adjustments to reflect facts and circumstances that existed as of the acquisition date and did not result from intervening events subsequent to such date. As of December 31, 2021, the Company completed the determination of the fair values of the acquired identifiable assets and liabilities.
The following table sets forth the components of identifiable intangible assets acquired, as adjusted for measurement period adjustments, and their estimated useful lives as of the date of acquisition (dollars in thousands):
| | | | | | | | | | | |
| Fair Value | Useful Life | | | |
| Developed technology | $ | 31,827 | | 5.0 years | | | |
| Merchant relationships | 19,684 | | 5.0 years | | | |
| Customer relationships | 2,937 | | 3.0 years | | | |
| Total identified intangible assets | $ | 54,448 | | | | | |
Goodwill of $40.4 million represents the excess of the consideration paid over the fair value of the net tangible and intangible assets acquired. The goodwill was primarily attributed to expected synergies created with the Company’s future product offerings and the value of the combined workforce. Goodwill and the intangibles from this transaction are not deductible for Canadian income tax purposes because this was a stock acquisition.
In connection with the acquisition, the Company recognized contingent cash consideration of $20.6 million as of the acquisition date. The contingent consideration is based on Flexiti achieving certain operating metrics from April 1, 2021 through March 31, 2023, including revenue less NCOs and loan originations. Cash consideration can range from zero to $32.8 million over the period. As of December 31, 2022, the estimated value of the contingent cash consideration increased to $16.9 million. Refer to Note 5, "Fair Value Measurements" for additional information regarding fair value inputs related to the contingent cash consideration.
CURO GROUP HOLDINGS CORP. AND SUBSIDIARIES
NOTES TO CONSOLIDATED FINANCIAL STATEMENTS (continued)
In connection with the acquisition, the Company also granted RSUs to certain Flexiti employees who joined the Company, with grant-date fair value totaling approximately $8.1 million. Of that total, $4.0 million relates to RSU contingent consideration structured similar to the contingent cash consideration described above. All RSU grants to Flexiti employees will be ratably recognized as stock-based compensation over the requisite service period of two years ending July 2023. Refer to Note 11, "Share-based Compensation" for further information related to these RSUs.
The Company incurred costs related to this acquisition of $3.3 million that were recorded in "Other operating expense" in the U.S. Direct Lending segment in the accompanying Consolidated Statement of Operations for the year ended December 31, 2022.
Ad Astra
On January 3, 2020, the Company acquired 100% of the outstanding stock of Ad Astra, a related party, for $14.4 million, net of cash received. Prior to the acquisition, Ad Astra had been the Company's exclusive provider of third-party collection services for owned and managed loans in the Legacy U.S. Direct Lending Business that are in later-stage delinquency.
The Company began consolidating the financial results of this acquisition in Consolidated Financial Statements on January 3, 2020. Prior to the acquisition, and for the year ended December 31, 2019, Ad Astra incurred $15.5 million of costs that were reflected in "Direct operations," consistent with the presentation of other internal collection costs. Subsequent to the acquisition, Ad Astra incurred $10.0 million and $9.6 million of operating expense during the years ended December 31, 2021 and 2020, respectively.
The transaction was accounted for using the acquisition method of accounting, which requires that assets acquired and liabilities assumed be recognized at their fair values as of the acquisition date. The Company was the acquirer for purposes of accounting for the business combination. The values assigned to the assets acquired and liabilities assumed were based on their estimates of fair value available. During March 2020, the Company completed the determination of the fair values of the acquired identifiable assets and liabilities.
The following table summarizes the allocation of the estimated fair values of the assets acquired and liabilities assumed at the date of acquisition:
| | | | | |
| (in thousands) | Amounts acquired on January 3, 2020 |
| Assets | |
Cash and cash equivalents | $ | 3,360 | |
Accounts receivable | 465 | |
Property and equipment | 358 | |
Intangible assets | 1,101 | |
Goodwill | 14,791 | |
Operating lease asset | 235 | |
| Total assets | $ | 20,310 | |
| |
| Liabilities | |
Accounts payable and accrued liabilities | 2,264 | |
Operating lease liabilities | 235 | |
| Total liabilities | $ | 2,499 | |
| |
| Total cash consideration transferred | $ | 17,811 | |
Goodwill of $14.8 million represents the excess over the fair value of the net tangible and intangible assets acquired. The goodwill was primarily attributed to expected synergies created through cost and process efficiencies in the collections process. The total estimated tax-deductible Goodwill as a result of this transaction is $15.4 million.
In January 2023, the Company ceased operations of Ad Astra.
DIVESTITURE
CURO GROUP HOLDINGS CORP. AND SUBSIDIARIES
NOTES TO CONSOLIDATED FINANCIAL STATEMENTS (continued)
Legacy U.S. Direct Lending Business
On July 8, 2022, the Company completed the divestiture of its Legacy U.S. Direct Lending Business to Community Choice Financial, for total sale proceeds of $349.2 million, net of working capital adjustments, comprised of $314.2 million of cash received at close and $35.0 million in cash payable in monthly installment payments over the subsequent 12 months.
The divestiture resulted in a gain of $68.4 million for the year ended December 31, 2022, which was recorded in "Gain on sale of business" on the Consolidated Statement of Operations. Per ASC 205, the sale of the business is not classified as discontinued operations in the Company’s operations or financial results.
The following table presents the amounts attributable to each category recorded in the Company’s Consolidated Balance Sheet as of the date of divestiture of the Legacy U.S. Direct Lending Business (in thousands):
| | | | | | | | |
| | July 8, 2022 |
| Assets | | |
| Cash, cash equivalents and restricted cash | | $ | 21,292 | |
| Loans receivable | | 162,147 | |
| Right of use asset | | 39,326 | |
| Goodwill | | 91,131 | |
Other assets (1) | | 30,690 | |
| Total assets | | $ | 344,586 | |
| | |
| Liabilities | | |
| Accounts payable and accrued liabilities | | $ | (8,947) | |
| Right of use liability | | (43,433) | |
| Liability for losses on CSO lender-owned consumer loans | | (5,628) | |
Other long term liabilities (2) | | (5,815) | |
| Total liabilities | | (63,823) | |
| | |
| Net assets sold | | 280,763 | |
| Total proceeds | | 349,207 | |
| Total pretax gain on sale of business | | $ | 68,444 | |
| (1) Includes income tax receivable, property and equipment, intangibles, deferred tax assets and other assets. |
| (2) Includes deferred revenue, income taxes payable, deferred tax liability and other long-term liabilities |
The Legacy U.S. Direct Lending Business had pre-tax net income of $60.7 million year ended December 31, 2022 and $140.2 million for the year ended December 31, 2021. Pre-tax net income is comprised of net revenue and expenses directly related to the Legacy U.S. Direct Lending Business, which does not include certain costs recorded in the U.S. Direct Lending operating segment that are not classified as disposed of, such as interest expense on the 7.50% Senior Secured Notes and certain corporate expenses.
CURO GROUP HOLDINGS CORP. AND SUBSIDIARIES
NOTES TO CONSOLIDATED FINANCIAL STATEMENTS (continued)
NOTE 15 – RELATED PARTY TRANSACTIONS
In November 2021, the Company entered into a Share Repurchase Agreement with a trust advised by a director and greater than 10% owner of the Company. See Note 23, "Share Repurchase Program" for further information.
The Company has historically used Ad Astra as its third-party collection service for the Legacy U.S. Direct Lending Business. The Company acquired Ad Astra from the Company's founders on January 3, 2020. See Note 14 - "Acquisitions and Divestiture" for further information. Prior to the acquisition, the Company generally referred loans that were between 91 and 121 days delinquent to Ad Astra for collections and Ad Astra earned a commission fee equal to 30% of any amounts successfully recovered. The Company ceased Ad Astra operations in January 2023.
The Company historically entered into several lease agreements for its corporate office and stores in which the Company operated, with several real estate entities that are owned by one or more of the founders of the Company. These leases are discussed in Note 11, "Leases." All but one of these related party leases related to the Legacy U.S. Direct Lending Business, which was sold in 2022.
NOTE 16 – PREPAID EXPENSES AND OTHER
Components of Prepaid expenses and other assets were as follows (in thousands):
| | | | | | | | | | | |
| December 31, 2022 | | December 31, 2021 |
Settlements and collateral due from third-party lenders (1) | $ | — | | | $ | 5,465 | |
Fees receivable from customers under CSO programs (1) | — | | | 8,412 | |
| Prepaid expenses | 13,963 | | | 16,243 | |
| Other assets | 39,094 | | | 11,918 | |
| Total prepaid expenses and other | $ | 53,057 | | | $ | 42,038 | |
(1) All balances in connection with the CSO programs were disposed of on July 8, 2022 upon the completion of the divestiture of the Legacy U.S. Direct Lending Business. |
NOTE 17 – PROPERTY AND EQUIPMENT
The classification of property and equipment was as follows (in thousands):
| | | | | | | | | | | |
| December 31, 2022 | | December 31, 2021 |
| Leasehold improvements | $ | 52,031 | | | $ | 122,049 | |
| Furniture, fixtures and equipment | 44,019 | | | 43,276 | |
| Property and equipment, gross | 96,050 | | 165,325 |
| Accumulated depreciation and amortization | (64,093) | | | (110,690) | |
| Property and equipment, net | $ | 31,957 | | | $ | 54,635 | |
Depreciation expense for continuing operations was $13.5 million, $13.2 million and $14.5 million for the years ended December 31, 2022, 2021 and 2020, respectively.
NOTE 18 – ACCOUNTS PAYABLE AND ACCRUED LIABILITIES
Components of Accounts payable and accrued liabilities were as follows (in thousands):
| | | | | | | | | | | |
| December 31, 2022 | | December 31, 2021 |
| Trade accounts payable | $ | 14,100 | | | $ | 43,094 | |
| Money orders payable | 2,112 | | | 3,460 | |
| Accrued taxes, other than income taxes | 1,248 | | | 1,053 | |
| Accrued payroll and fringe benefits | 16,487 | | | 41,658 | |
| Other accrued liabilities | 39,880 | | | 32,169 | |
| Total accounts payable and accrued liabilities | $ | 73,827 | | | $ | 121,434 | |
|
CURO GROUP HOLDINGS CORP. AND SUBSIDIARIES
NOTES TO CONSOLIDATED FINANCIAL STATEMENTS (continued)
The decrease in accounts payable and accrued liabilities from December 31, 2021 to December 31, 2022 was primarily the result of the divestiture of the Legacy U.S. Direct Lending Business in July 2022 and the decrease in Accrued payroll and fringe benefits.
NOTE 19 – BENEFIT PLANS
In 2015, the Company instituted a nonqualified deferred compensation plan that provides certain employees with the opportunity to elect to defer base salary and performance-based compensation, which, upon such election, will be credited to the participant’s deferred compensation account. Participant contributions are fully vested at all times. Each deferred compensation account is invested in one or more investment funds made available by the Company and selected by the participant. The Company may make discretionary contributions to the individual deferred compensation accounts, with the amount, if any, determined annually by the Company. The Company's contributions vest over three years. Each vested deferred compensation account will be paid out in either a lump sum or annual installments over a five or 10 year period as elected by the participant during enrollment. Payments shall be made or commence either on January 1 of the year following a participant’s separation from service or a future date chosen by the participant at the time of enrollment. The plan is closed to new participants, and ongoing enrollment is only available to employees who had previously elected to make deferrals. The amount deferred under this plan totaled $5.1 million, $5.1 million and $4.7 million as of December 31, 2022, 2021 and 2020, respectively, and was recorded in "Other long-term liabilities" on the Consolidated Balance Sheet.
In 2013, the Company instituted a Registered Retirement Savings Plan (“RRSP”) which covers all Canadian employees. The Company matches the employee contribution at a rate of 50% of the first 6% of compensation contributed to the RRSP. Employee contributions vest immediately. Employer contributions vest 50% after one year and 100% after two years. In March 2021, the Company acquired Flexiti and instituted a RRSP which covers all full-time, permanent Canadian employees. For contact center employees, the Company matches the employee contribution at a rate of 50% of the first 6%of compensation contributed to the RRSP. For corporate employees, the Company matches the employee contribution at a rate of 100% of the first 6% of compensation contributed to the RRSP. Employee contributions vest immediately. Employer contributions vest 100% after one year of plan membership. The Company's combined contributions to these two RRSPs were $0.5 million, $0.4 million and $0.3 million as of December 31, 2022, 2021 and 2020, respectively.
In 2010, the Company instituted a 401(k) retirement savings plan which covers all U.S. employees. Employees may voluntarily contribute up to 90% of their compensation to the 401(k) plan. The Company matches the employee contribution at a rate of 50% of the first 6% of compensation contributed to the plan. Employer contributions vest one-third for each of the first three years of employment until fully vested after three years of employment. The Company also provides a 401(k) plan covering all full-time employees, whereby employees can invest their gross pay up to 90% of their compensation by the 401(k) plan. The Company makes a matching contribution in an amount equal to: (i) 100% of the first 3% of an employee’s gross income contributed to the plan, plus (ii) 50% of the next 2% of an employee’s amount of the employee contributions that exceed 3% of gross pay but that do not exceed 5% of gross pay. The Company's combined contributions to these three plans were $3.0 million, $1.7 million and $1.7 million for the years ended December 31, 2022, 2021 and 2020, respectively.
The Company owns life insurance policies on plan beneficiaries as an informal funding vehicle to meet future benefit obligations. These policies are recorded at their cash surrender value and are included in other assets. Income generated from policies is recorded in "Salaries and benefits" on the Consolidated Statement of Operations. Refer to Note 5, "Fair Value Measurements" for additional information.
NOTE 20 – CREDIT SERVICE ORGANIZATION
As a result of the sale of the Legacy U.S. Direct Lending Business on July 8, 2022, the Company no longer guarantees loans originated by third-party lenders through CSO programs. The Company will continue to present these loans in the paragraphs that follow based on historical practice and for comparability purposes. Refer to Note 14, "Acquisitions and Divestiture" for additional information.
The CSO fee receivables balance was $5.2 million at December 31, 2021 and is reflected in "Prepaid expenses and other" in the Consolidated Balance Sheets. The Company bore the risk of loss through its guarantee to purchase customer loans that were charged-off. The terms of these loans ranged up to six months. See Note 1, "Summary of Significant Accounting Policies and Nature of Operations" for further details of the Company's accounting policy.
As of December 31, 2021, the incremental maximum amount payable under all such guarantees was $38.4 million. This liability is not included in the Company's Consolidated Balance Sheets. The Company held no collateral in respect of the guarantees. The Company estimated a liability for losses associated with the guaranty provided to the CSO lenders, which was $6.9 million at December 31, 2021. This liability is reflected in "Liability for losses on CSO lender-owned consumer loans" in the Consolidated Balance Sheets.
The Company placed $5.5 million in collateral accounts for the benefit of lenders for the year ended December 31, 2021 which is reflected in "Prepaid expenses and other" in the Consolidated Balance Sheets. The balances required to be maintained in these
CURO GROUP HOLDINGS CORP. AND SUBSIDIARIES
NOTES TO CONSOLIDATED FINANCIAL STATEMENTS (continued)
collateral accounts varied by lender, typically based on a percentage of the outstanding loan balances held by the lender. The percentage of outstanding loan balances required for collateral was negotiated between the Company and each lender.
Deferred revenue associated with the CSO program was immaterial as of December 31, 2021 and there were no costs to obtain, or costs to fulfill, capitalized under the program.
NOTE 21 – RESTRUCTURING AND STORE CLOSURES
2022 Restructuring
On October 5, 2022, our Board of Directors approved restructuring actions to reduce operating expenses through store closures and headcount reductions in both the U.S. and Canada, and the elimination of duplicative corporate office functions in the U.S. Both the workforce reduction and store closures were aimed at reducing duplicative corporate functions and stores with overlapping customer populations as a result of our acquisitions of Heights Finance in December of 2021 and First Heritage in July of 2022.
For the year ended December 31, 2022, we incurred $16.0 million of expense related to our restructuring actions, of which $7.9 million relates to employee termination benefits resulting from the workforce reduction of approximately 150 employees, and $8.2 million in lease abandonment costs resulting from the closure of 89 stores in the U.S. and Canada.
The following table shows the total restructuring costs incurred during the year ended December 31, 2022 (in thousands):
| | | | | | | | | | | |
| Employee Termination Benefits | Lease Exit Costs | Total Restructuring Costs |
| Salaries and Benefits | $ | 6,601 | | $ | — | | $ | 6,601 | |
| Direct Operations | 1,266 | | — | | 1,266 | |
| Other Operating Expense | — | | 8,171 | | 8,171 | |
| Total | $ | 7,867 | | $ | 8,171 | | $ | 16,038 | |
The following table shows the total amount incurred and liability, which is recorded in accounts payables and other accrued liabilities in the Consolidated Balance Sheets, for restructuring-related costs as of December 31, 2022:
| | | | | |
| Total Restructuring Costs |
| Accrued restructuring costs as of October 5, 2022 | $ | — | |
| Restructuring costs incurred during the year ended December 31, 2022 | $ | 16,038 | |
| Amount paid during the year ended December 31, 2022 | $ | (11,292) | |
| Accrued restructuring costs as of December 31, 2022 | $ | 4,746 | |
2021 Store Closures
The Company closed or did not renew leases for 49 U.S. stores in Illinois (8), Oregon (2), Colorado (2), Washington (1), Texas (31), California (2), Louisiana (1), Nevada (1) and Tennessee (1), of which 19 and 30 stores closed in the second and third quarters of 2021, respectively. The Company exited Illinois entirely given that state's legislative changes that effectively eliminated the Company's product offerings. The store closure decisions in other states were made after extensive analysis and in response to ongoing migration of customer transactions toward the online channel and the impact of COVID-19 on store traffic and profitability.
CURO GROUP HOLDINGS CORP. AND SUBSIDIARIES
NOTES TO CONSOLIDATED FINANCIAL STATEMENTS (continued)
The Company incurred $12.7 million of total one-time charges associated with the U.S. Direct Lending store closures during the year ended December 31, 2021 as follows:
| | | | | |
| (in thousands) | Year Ended December 31, 2021 (1) |
| Store closure costs | |
| Severance and employee costs | $ | 3,943 | |
| Lease termination costs | 1,710 | |
| Net accelerated depreciation and write-off of ROU assets and lease liabilities | 7,064 | |
| Total store closure costs | $ | 12,717 | |
|
(1) During the year ended December 31, 2021, the Consolidated Statement of Operations included $3.9 million of store closure costs recorded within "Salaries and benefits" and $8.7 million recorded within "Other operating expense." |
NOTE 22 – DISCONTINUED OPERATIONS
On February 25, 2019, in accordance with the provisions of the U.K. Insolvency Act 1986 and as approved by the Boards of Directors of the U.K. Subsidiaries, insolvency practitioners from KPMG were appointed as Administrators for the U.K. Subsidiaries. The effect of the U.K. Subsidiaries’ entry into administration was to place their management, affairs, business and property of the U.K. Subsidiaries under the direct control of the Administrators. Accordingly, the Company deconsolidated the U.K. Subsidiaries, which comprised the U.K. reportable operating segment, as of February 25, 2019 and classified them as Discontinued Operations for all periods presented.
The following table presents the results of operations of the U.K. Subsidiaries, which meet the criteria of Discontinued Operations and, therefore, are excluded from the Company's results of continuing operations (in thousands):
| | | | | | | | | | | | | |
| | | | | For the Year Ended December 31, |
| | | | | 2020 | | | | |
| Revenue | | | | | $ | — | | | | | |
| Provision for losses | | | | | — | | | | | |
| Net revenue | | | | | — | | | | | |
| | | | | | | | | |
| Cost of providing services | | | | | | | | | |
| | | | | | | | | |
| | | | | | | | | |
| Advertising | | | | | — | | | | | |
| Non-advertising costs of providing services | | | | | — | | | | | |
| Total cost of providing services | | | | | — | | | | | |
| Gross margin | | | | | — | | | | | |
| | | | | | | | | |
| Operating expense (income) | | | | | | | | | |
| Corporate, district and other expenses | | | | | — | | | | | |
| Interest income | | | | | — | | | | | |
| | | | | | | | | |
| | | | | | | | | |
| Gain on disposition | | | | | (1,714) | | | | | |
| Total operating income | | | | | (1,714) | | | | | |
| Pre-tax income from operations of discontinued operations | | | | | 1,714 | | | | | |
| | | | | | | | | |
| Income tax expense related to disposition | | | | | 429 | | | | | |
| Net income from discontinued operations | | | | | $ | 1,285 | | | | | |
|
| | | | | | | | | |
| | | | | | | | | |
CURO GROUP HOLDINGS CORP. AND SUBSIDIARIES
NOTES TO CONSOLIDATED FINANCIAL STATEMENTS (continued)
For the years ended December 31, 2022 and 2021, the Consolidated Statements of Operations were not impacted by the U.K. Subsidiaries as there was no activity during those periods.
As of December 31, 2022 and 2021, the Consolidated Balance Sheets were not impacted by the U.K. Subsidiaries as all balances were written off when the U.K. segment entered into administration during the first quarter of 2019.
The following table presents cash flows of the U.K. Subsidiaries (in thousands):
| | | | | | | | | | | | |
| |
| | 2020 | | | | |
| Net cash provided by discontinued operating activities | | $ | 1,714 | | | | | |
| Net cash used in discontinued investing activities | | — | | | | | |
| Net cash used in discontinued financing activities | | — | | | | | |
|
For the years ended December 31, 2022 and 2021, the Consolidated Statements of Cash Flows were not impacted by the U.K. Subsidiaries as there was no activity during those periods.
NOTE 23 – SHARE REPURCHASE PROGRAM
In February 2022, the Company's Board of Directors authorized a new share repurchase program for the repurchase of up to $25.0 million of CURO common stock. There were no repurchases under this program as of December 31, 2022. Repurchases are at the Company's discretion and can continue until completed or terminated. The Company expects any repurchases to be made from time-to-time in the open market and/or in privately negotiated transactions at the Company's discretion, subject to market conditions and other factors. Any repurchased shares will be available for use in connection with equity plans and for other corporate purposes.
In May 2021, the Company's Board of Directors authorized a share repurchase program for up to $50.0 million of its common stock. The program commenced in June 2021 and was completed in February 2022. The table below summarizes share repurchase activity in the $50.0 million repurchase program during the years ended December 31, 2022 and December 31, 2021 (in thousands, except for per share amounts and number of share amounts):
| | | | | | | | |
| For the Year Ended December 31, 2022 | For the Year Ended December 31, 2021 |
| Total number of shares repurchased | 824,477 | | 2,218,333 | |
| Average price paid per share | $ | 15.20 | | $ | 16.86 | |
| Total value of shares repurchased | $ | 12,530 | | $ | 37,400 | |
In November 2021, the Company entered into a Share Repurchase Agreement with the Leah M. Faulkner 2017 Dynasty Trust ("Seller"), a Trust advised by a Director and greater than 10% owner of the Company. Pursuant to the Share Repurchase Agreement, the Company repurchased 500,000 shares of its common stock, par value $0.001 per share, owned by the Seller, in a private transaction at a purchase price equal to $18.10 per share of common stock. This transaction occurred outside of the share repurchase program authorized in May 2021.
In February 2020, the Company's Board of Directors authorized a share repurchase program for up to $25.0 million of its common stock. Due to uncertainty caused by COVID-19, the Board terminated the program on March 15, 2020. There were no material purchases under the program during the year ended December 31, 2020.
NOTE 24 – SUBSEQUENT EVENTS
Curo Canada Revolving Credit Facility
On January 6, 2023, the C$5 million Curo Canada Revolving Credit Facility was cancelled in its entirety.
CURO GROUP HOLDINGS CORP. AND SUBSIDIARIES
NOTES TO CONSOLIDATED FINANCIAL STATEMENTS (continued)
Ad Astra — Ceased Operations
We utilized Ad Astra as our debt collector for delinquent loans originated by Legacy U.S. Direct Lending Business. Loans were typically assigned to Ad Astra after 91 days without a scheduled payment. Upon the sale of the Legacy U.S. Direct Lending Business in July 2022, Ad Astra continued to service these loans as part of the Transition Services Agreement with Community Choice Financial. In January 2023, the Company ceased Ad Astra's operations.
ITEM 9. CHANGES IN AND DISAGREEMENTS WITH ACCOUNTANTS ON ACCOUNTING AND FINANCIAL DISCLOSURE
None.
ITEM 9A. CONTROLS AND PROCEDURES
Evaluation of Disclosure Controls and Procedures
Prior to the filing of this Form 10-K and under the supervision and with the participation of our management, including our Chief Executive Officer and Chief Financial Officer, we carried out an evaluation of the effectiveness of the design and operation of our disclosure controls and procedures as of the last day of the period covered by this Form 10-K.
Disclosure controls and procedures are defined by Rules 13a-15(e) and 15d-15(e) of the Exchange Act as controls and other procedures that are designed to ensure that information required to be disclosed in the reports that we file or submit under the Exchange Act is recorded, processed, summarized and reported within the time periods specified by the SEC's rules and forms. Disclosure controls and procedures include, without limitation, controls and procedures designed to ensure that information required to be disclosed in the reports that we file or submit under the Exchange Act is accumulated and communicated to our management, including our Chief Executive Officer and Chief Financial Officer, as appropriate to allow timely decisions regarding required disclosures.
Based upon the evaluation, our Chief Executive Officer and Chief Financial Officer concluded that, as of December 31, 2022, our disclosure controls and procedures were effective to provide reasonable assurance that information required to be disclosed by us in the reports that we file or submit under the Exchange Act is recorded, processed, summarized and reported accurately and within the time frames specified in the SEC's rules and forms and accumulated and communicated to our management, including our Chief Executive Officer and Chief Financial Officer, as appropriate to allow timely decisions regarding required disclosure.
Inherent Limitations of the Effectiveness of Internal Control
Our ICFR is designed to provide reasonable assurance regarding the reliability of financial reporting and the preparation of financial statements for external purposes in accordance with U.S. GAAP. Our ICFR includes those policies and procedures that:
(i)pertain to the maintenance of records that, in reasonable detail, accurately and fairly reflect the transactions and dispositions of our assets;
(ii)provide reasonable assurance that transactions are recorded as necessary to permit preparation of financial statements in accordance with U.S. GAAP and that our receipts and expenditures are being made only in accordance with authorizations of our management and directors; and
(iii)provide reasonable assurance regarding prevention or timely detection of unauthorized acquisition, use, or disposition of our assets that could have a material effect on the financial statements.
Management, including our Chief Executive Officer and Chief Financial Officer, does not expect that our internal controls will prevent or detect all errors and all fraud. A control system, no matter how well designed and operated, can provide only reasonable, not absolute, assurance that the objectives of the control system are met. Further, the design of a control system must reflect the fact that there are resource constraints, and the benefits of controls must be considered relative to their costs. Because of the inherent limitations in all control systems, no evaluation of internal controls can provide absolute assurance that all control issues and instances of fraud, if any, have been detected. Also, any evaluation of the effectiveness of controls in future periods are subject to the risk that those internal controls may become inadequate because of changes in business conditions, or that the degree of compliance with the policies or procedures may deteriorate.
Management's Annual Report on Internal Control over Financial Reporting
Our management is responsible for establishing and maintaining adequate ICFR. Our internal control system was designed to provide reasonable assurance to our management and Board of Directors regarding the preparation and fair presentation of our published financial statements.
CURO GROUP HOLDINGS CORP. AND SUBSIDIARIES
NOTES TO CONSOLIDATED FINANCIAL STATEMENTS (continued)
Prior to the filing of this Form 10-K, our management, with the participation of our Chief Executive Officer and Chief Financial Officer, assessed the effectiveness of our ICFR, excluding the operations of First Heritage as noted below, as of the last day of the period covered by the report. In making this assessment, our management used the criteria set forth by the Committee of Sponsoring Organizations of the Treadway Commission ("COSO") in the Internal Control-Integrated Framework (“2013 Framework”). Based on our Evaluation under the 2013 Framework, our management concluded that our ICFR was effective as of December 31, 2022. Deloitte & Touche LLP has audited the Consolidated Financial Statements included in this Form 10-K and, as part of its audit, has issued an attestation report, included herein, on the effectiveness of our ICFR.
In conducting the evaluation of effectiveness of its internal control over financial reporting as of December 31, 2022, we excluded the operations of First Heritage as permitted by the guidance issued by the Office of the Chief Accountant of the SEC (provided that the period of such exclusion does not extend more than one year beyond the date of acquisition or for more than one annual reporting period). In conducting the evaluation of the effectiveness of its disclosure on controls and procedures as of December 31, 2022, we excluded those disclosure controls and procedures of First Heritage that are subsumed by our ICFR. The First Heritage acquisition was completed on July 13, 2022. As of and for the year ended December 31, 2022, First Heritage's tangible assets represented approximately 9.0% of our consolidated assets and 5.3% of our consolidated revenues. See Note 14, "Acquisitions and Divestiture" for additional information on the First Heritage acquisition and the impact on our consolidated financial statements.
Changes in Internal Control over Financial Reporting
We are working to integrate First Heritage into our overall internal control over financial reporting processes. Except for changes made in connection with the integration of First Heritage, there were no changes in our ICFR (as defined in Rules 13a-15(e) and 15d-15(e) under the Exchange Act) during the year ended December 31, 2022, that have materially affected, or are reasonably likely to materially affect, our ICFR.
ITEM 9B. OTHER INFORMATION
None.
ITEM 9C. DISCLOSURE REGARDING FOREIGN JURISDICTIONS THAT PREVENT INSPECTIONS
None.
PART III.
ITEM 10. DIRECTORS, EXECUTIVE OFFICERS AND CORPORATE GOVERNANCE
The information called for by this Item 10 is incorporated by reference to the sections entitled "Election of Directors," "Executive Officers," "Corporate Governance," "Certain Relationships and Related Transactions" and "Delinquent Section 16(a) Reports" of our Proxy Statement for the Annual Meeting of Stockholders to be held on June 14, 2023. We intend to file such Proxy Statement with the Securities and Exchange Commission within 120 days after the end of the fiscal year covered by this Form 10-K.
We have adopted a Code of Business Conduct and Ethics that applies to all of our directors, officers and employees, including our principal executive, principal financial and principal accounting officers, or persons performing similar functions. Our Code of Business Conduct and Ethics is posted on our website located at https://www.ir.curo.com/corporate-governance/governance-documents. We intend to disclose future amendments to certain provisions of the Code of Business Conduct and Ethics, and waivers of the Code of Business Conduct and Ethics granted to executive officers and directors, on the website within four business days following the date of the amendment or waiver.
ITEM 11. EXECUTIVE COMPENSATION
The information called for by this Item 11 is incorporated by reference to the sections entitled "Non-Employee Director Compensation" and "Executive Compensation" of our Proxy Statement referenced above in Item 10.
ITEM 12. SECURITY OWNERSHIP OF CERTAIN BENEFICIAL OWNERS AND MANAGEMENT AND RELATED STOCKHOLDER MATTERS
The information called for by this Item 12 is incorporated by reference to the sections entitled "Security Ownership of Certain Beneficial Owners and Management" and "Equity Compensation Plan for Information" of our Proxy Statement referenced above in Item 10.
Equity Compensation Plan Information
The following table provides information about the Company's equity compensation plans as of December 31, 2022:
CURO GROUP HOLDINGS CORP. AND SUBSIDIARIES
NOTES TO CONSOLIDATED FINANCIAL STATEMENTS (continued)
| | | | | | | | | | | |
| Plan Category | Number of Securities to be Issued Upon Exercise of Outstanding Options (a)(1) | Weighted Average Exercise Price of Outstanding Options (b)(2) | Number of Securities Remaining Available for Future Issuance Under Equity Compensation Plans (excluding securities reflected in column(a)) (c)(3) |
| Equity compensation plans approved by security holders | 4,484,009 | | $ | 4.83 | | 2,967,721 | |
| Equity compensation plans not approved by security holders | — | | — | | — | |
| Total | 4,484,009 | | $ | 4.83 | | 2,967,721 | |
| (1)This amount includes 515,088 shares of common stock to be issued for stock options and 3,824,431 shares of common stock to be issued upon the vesting of RSU's. |
| (2) This amount represents only the stock options outstanding as of December 31, 2022, since RSU awards do not have an exercise price. |
| (3) This amount represents securities issuable under the 2017 Incentive Plan which is comprised of only RSU's as of December 31, 2022. |
ITEM 13. CERTAIN RELATIONSHIPS AND RELATED TRANSACTIONS, AND DIRECTOR INDEPENDENCE
The information called for by this Item 13 is incorporated by reference to the section entitled "Certain Relationships and Related Transactions" of our Proxy Statement referenced above in Item 10.
ITEM 14. PRINCIPAL ACCOUNTING FEES AND SERVICES
Our independent registered public accounting firm is Deloitte & Touche LLP; Chicago, IL; Firm ID: 34
The information called for by this Item 14 is incorporated by reference to the section entitled "Ratification of Appointment of Independent Registered Public Accounting Firm" of our Proxy Statement referenced above in Item 10.
PART IV.
ITEM 15. EXHIBITS AND FINANCIAL STATEMENT SCHEDULES
(a) List of documents filed as part of this report
| | | | | |
| (1) | Consolidated Financial Statements |
| |
| The consolidated financial statements and related notes, together with the reports of Deloitte & Touche LLP, appear in Part II, Item 8. "Financial Statements and Supplementary Data" of this Report.
The consolidated financial statements consist of the following: |
| |
| Consolidated Balance Sheets as of December 31, 2022 and 2021 |
| |
| Consolidated Statements of Operations for the years ended December 31, 2022, 2021 and 2020 |
| |
| Consolidated Statements of Comprehensive (Loss) Income for the years ended December 31, 2022, 2021 and 2020 |
| |
| Consolidated Statements of Changes in Equity for the years ended December 31, 2022, 2021 and 2020 |
| |
| Consolidated Statements of Cash Flows for the years ended December 31, 2022, 2021 and 2020 |
| |
| Notes to Consolidated Financial Statements |
| |
| (2) | Consolidated Financial Statement Schedules |
| |
| All schedules have been omitted because they are not applicable, are insignificant or the required information is shown in the consolidated financial statements or notes thereto. |
| |
| (3) | Exhibits |
| |
| The exhibits are listed on the Exhibit Index. |
ITEM 16. FORM 10-K SUMMARY
None.
CURO Group Holdings Corp.
Form 10-K Annual Report
for the Period Ended
December 31, 20222
Exhibit Index
| | | | | | | | | | | | | | | |
| Exhibit | | Description | Filed/Incorporated by Reference from Form | Incorporated by Reference from Exhibit Number | Filing Date |
| 2.1 | | | 10-K | 2.1 | 3/5/21 |
| 2.2 | | | 8-K | 2.1 | 11/19/21 |
| 2.3 | | | 8-K | 2.1 | 5/19/22 |
| 2.4 | | | 8-K | 2.2 | 7/14/22 |
| 2.5 | | | 8-K | 2.2 | 5/19/22 |
| 2.6 | | | 8-K | 2.4 | 7/14/22 |
| 3.1 | | | 10-Q | 10.1 | 8/5/20 |
| 3.2 | | | 8-K | 3.2 | 12/11/17 |
| 4.1 | | | S-1 | 4.1 | 11/28/17 |
| 4.2 | | | S-1 | 4.2 | 11/28/17 |
| 4.3 | | | S-1 | 4.3 | 5/14/18 |
| 4.4 | | | 8-K | 4.1 | 8/3/21 |
| 4.5 | | | 8-K | 4.1 | 12/3/21 |
| 4.6 | | | 8-K | 4.2 | 12/3/21 |
| 4.7 | | | 8-K | 4.1 | 12/28/21 |
| 4.8 | | | 10-K | 4.4 | 3/9/20 |
| 10.1 | | | 10-K | 10.6 | 3/7/22 |
| | | | | | | | | | | | | | | |
| 10.2 | | Second Amended and Restated Guaranty dated as of November 12, 2021 among CURO Group Holdings Corp., as guarantor; LendDirect Corp., as seller and servicer; CURO Canada Corp., as seller and servicer; Canada Receivables Limited Partnership, by its general partner, CURO Canada Receivables GP Inc., as borrower; WF Marlie 2018-1, Ltd., as lender; and Waterfall Asset Management, LLC, as administrative agent¥ | 10-K | 10.7 | 3/7/22 |
| 10.3 | | | 8-K | 10.3 | 8/6/18 |
| 10.4 | | | 8-K | 10.4 | 8/6/18 |
| 10.5 | | | S-1 | 10.53 | 10/24/17 |
| 10.6 | | | 10-Q | 10.69 | 5/3/18 |
| 10.7 | | | 8-K | 10.4 | 8/27/18 |
| 10.8 | | | 8-K | 10.1 | 11/13/18 |
| 10.9 | | | 10-Q | 10.1 | 11/3/22 |
| 10.10 | | | 10-Q | 10.2 | 5/7/21 |
| 10.11 | | | 8-K | 10.1 | 8/3/21 |
| 10.12 | | | 8-K | 10.2 | 8/3/21 |
| 10.13 | | | 8-K | 10.3 | 8/3/21 |
| 10.14 | | | 10-K | 10.19 | 3/7/22 |
| | | | | | | | | | | | | | | |
| 10.15 | | | 10-K | 10.20 | 3/7/22 |
| 10.16 | | | 10-K | 10.21 | 3/7/22 |
| 10.17 | | | 10-K | 10.22 | 3/7/22 |
| 10.18 | | | 10-K | 10.23 | 3/7/22 |
| 10.19 | | | 10-K | 10.24 | 3/7/22 |
| 10.20 | | Credit Agreement, dated as of July 13, 2022, among First Heritage Financing I, LLC, First Heritage Credit, LLC, the lenders and agents from time to time party thereto, the subservicers party thereto, Computershare Trust Company, National Association, Wilmington Trust, National Association and Credit Suisse AG, New York Branch¥ | 8-K | 10.1 | 7/14/22 |
| 10.21 | | Credit Agreement, dated as of July 15, 2022, among Heights Financing I, LLC, SouthernCo, Inc., the lenders and agents from time to time party thereto, the subservicers party thereto, Computershare Trust Company, National Association, Wilmington Trust, National Association and Credit Suisse AG, New York Branch* ¥ | 8-K | 10.1 | 7/20/22 |
| 10.22 | | | S-1 | 10.26 | 10/24/17 |
| 10.23 | | | 10-K | 10.28 | 3/7/22 |
| 10.24 | | | 10-K | 10.29 | 3/7/22 |
| 10.25 | | | 10-Q | 10.1 | 7/28/21 |
| 10.26 | | | 10-Q | 10.2 | 7/28/21 |
| 10.27 | | | S-1 | 10.31 | 11/1/17 |
| 10.28 | | | S-1 | 10.7 | 10/24/17 |
| 10.29 | | | S-1 | 10.57 | 10/24/17 |
| | | | | | | | | | | | | | | |
| 10.30 | | | S-1 | 10.6 | 11/28/17 |
| 10.31 | | | S-1 | 10.4 | 11/1/17 |
| 10.32 | | | DEF14A | Annex A | 4/29/21 |
| 10.33 | | | 8-K | 10.1 | 2/23/23 |
| 10.34 | | | 8-K | 10.2 | 2/23/23 |
| 10.35 | | | 8-K | 10.1 | 11/15/22 |
| 10.36 | | | 8-K | 10.1 | 12/6/22 |
| 10.37 | | | 8-K | 10.2 | 12/12/22 |
| 10.38 | | | Filed herewith | | |
| 21.1 | | | Filed herewith | | |
| 23.1 | | | Filed herewith | | |
| 24.1 | | | Filed herewith | | |
| 31.1 | | | Filed herewith | | |
| 31.2 | | | Filed herewith | | |
| 32.1 | | | Filed herewith | | |
| 101 | | The following audited financial information from the Company's Annual Report on Form 10-K for the year ended December 31, 2021, filed with the SEC on March 7, 2022, formatted in Inline Extensible Business Reporting Language (“XBRL”) includes: (i) Consolidated Balance Sheets at December 31, 2021 and December 31, 2020, (ii) Consolidated Statements of Operations for the years ended December 31, 2021, 2020 and 2019, (iii) Consolidated Statements of Comprehensive Income for the years ended December 31, 2021, 2020 and 2019, (iv) Consolidated Statements of Cash Flows for the years ended December 31, 2021, 2020 and 2019 and (v) Notes to Consolidated Financial Statements* | Filed herewith | | |
| 104 | | Cover Page Interactive Data File (embedded within the Inline XBRL document) | Fired herewith | | |
| * | | Schedules have been omitted pursuant to Item 601(a)(5) of Regulation S-K. The Company agrees to furnish on a supplemental basis to the SEC a copy of any omitted schedule upon request by the SEC. |
| ¥ | | Portions of this exhibit have been omitted pursuant to Item 601(b)(2)(ii) or 601(b)(10)(iv), as applicable, of Regulation S-K. The Company agrees to furnish on a supplemental basis to the SEC an un-redacted copy upon request by the SEC.. |
| + | | Management contract or compensatory plan, contract or arrangement. |
SIGNATURES
Pursuant to the requirements of Section 13 or 15(d) of the Securities Exchange Act of 1934, the registrant has duly caused this report to be signed on its behalf by the undersigned, thereunto duly authorized.
Dated: March 9, 2023 CURO Group Holdings Corp.
By: /s/ Douglas Clark_________________________
Douglas Clark
Chief Executive Officer
Pursuant to the requirements of the Securities Exchange Act of 1934, this report has been signed below by the following persons on behalf of the registrant and in the capacities and on the dates indicated.
| | | | | |
| /s/ Douglas Clark | |
| Douglas Clark | |
| Chief Executive Officer and a Director | |
| (Principal Executive Officer) | |
| March 9, 2023 | |
| |
| /s/ Ismail Dawood | |
| Ismail Dawood | |
| Chief Financial Officer | |
| (Principal Financial Officer) | |
| March 9, 2023 | |
| |
| /s/ Tamara Schulz | |
| Tamara Schulz | |
| Chief Accounting Officer | |
| (Principal Accounting Officer) | |
| March 9, 2023 | |
| |
| * | |
| Chad Faulkner | |
| Chairman of Board of Directors | |
| March 9, 2023 | |
| |
| * | |
| Andrew Frawley | |
| Director | |
| March 9, 2023 | |
| |
| * | |
| David M. Kirchheimer | |
| Director | |
| March 9, 2023 | |
| |
| * | |
| Chris Masto | |
| Director | |
| | | | | |
| March 9, 2023 | |
| |
| * | |
| Mike McKnight | |
| Director | |
| March 9, 2023 | |
| |
| * | |
| Gillian Van Schaick | |
| Director | |
| March 9, 2023 | |
| |
| * | |
| Issac Vaughn | |
| Director | |
| March 9, 2023 | |
| |
| * /s/ Ismail Dawood | |
| Ismail Dawood | |
| Attorney-in-Fact | |
| March 9, 2023 | |