SECURITIES AND EXCHANGE COMMISSION
Washington, D.C. 20549
FORM 6-K
Report of Foreign Private Issuer
Pursuant to Rule 13a-16 or 15d-16 of
the Securities Exchange Act of 1934
For the six months ended March 31, 2020
Commission File Number: 001-38397
Farmmi, Inc.
(Registrant’s name)
No. 307, Tianning Industrial Area
Lishui, Zhejiang Province
People’s Republic of China 323000
(Address of principal executive offices)
Indicate by check mark whether the registrant files or will file annual reports under cover of Form 20-F or Form 40-F.:
Form 20-F x | Form 40-F ¨ |
Indicate by check mark if the registrant is submitting the Form 6-K on paper as permitted by Regulation S-T Rule 101(b)(1): ¨
Indicate by check mark if the registrant is submitting the Form 6-K on paper as permitted by Regulation S-T Rule 101(b)(7): ¨
Incorporation By Reference
This report on Form 6-K is hereby incorporated by reference into the Company’s registration statements on Form S-8 (file No. 333-224463) filed with SEC on April 26, 2018 and Form F-1 (file No. 333-228677) filed with SEC on December 4, 2018, declared effective on February 12, 2019, amended by post-effective amendment on Form F-3 which was filed with SEC on November 27, 2019 and declared effective on December 3, 2019.
Explanatory Note:
The Registrant is filing this Report on Form 6-K to report its financial results for the six months ended Mach 31, 2020 and to discuss its recent corporate developments.
Attached as exhibits to this Report on Form 6-K are:
(1) | the unaudited condensed interim consolidated financial statements and related notes as Exhibit 99.1; |
(2) | Management’s Discussion and Analysis of Financial Condition and Results of Operations as Exhibit 99.2; |
(3) | the press release dated September 28, 2020 titled “Farmmi Reports Financial Results for the First Six Months of Fiscal Year 2020” as Exhibit 99.3; |
(4) | Interactive Data File disclosure as Exhibit 101 in accordance with Rule 405 of Regulation S-T. |
2
SPECIAL NOTE REGARDING FORWARD-LOOKING STATEMENTS
Statements in this current report with respect to the Company’s current plans, estimates, strategies and beliefs and other statements that are not historical facts are forward-looking statements about the future performance of the Company. Forward-looking statements include, but are not limited to, those statements using words such as “believe,” “expect,” “plans,” “strategy,” “prospects,” “forecast,” “estimate,” “project,” “anticipate,” “aim,” “intend,” “seek,” “may,” “might,” “could” or “should,” and words of similar meaning in connection with a discussion of future operations, financial performance, events or conditions. From time to time, oral or written forward-looking statements may also be included in other materials released to the public. These statements are based on management’s assumptions, judgments and beliefs in light of the information currently available to it. The Company cautions investors that a number of important risks and uncertainties could cause actual results to differ materially from those discussed in the forward-looking statements, including but not limited to, product and service demand and acceptance, changes in technology, economic conditions, the impact of competition and pricing, government regulation, and other risks contained in reports filed by the company with the Securities and Exchange Commission. Therefore, investors should not place undue reliance on such forward-looking statements. Actual results may differ significantly from those set forth in the forward-looking statements.
All such forward-looking statements, whether written or oral, and whether made by or on behalf of the company, are expressly qualified by the cautionary statements and any other cautionary statements which may accompany the forward-looking statements. In addition, the company disclaims any obligation to update any forward-looking statements to reflect events or circumstances after the date hereof.
3
Exhibit Index:
99.1 | Unaudited Consolidated Financial Statements and Related Notes for the Six Months Ended March 31, 2020 and 2019 |
99.2 | Management’s Discussion and Analysis of Financial Condition and Results of Operations |
99.3 | Press release dated September 28, 2020 titled “Farmmi Reports Financial Results for the First Six Months of Fiscal Year 2020” |
101.INS | XBRL Instance Document. |
101.SCH | XBRL Taxonomy Extension Schema Document. |
101.CAL | XBRL Taxonomy Extension Calculation Linkbase Document. |
101.DEF | XBRL Taxonomy Extension Definition Linkbase Document. |
101.LAB | XBRL Taxonomy Extension Labels Linkbase Document. |
101.PRE | XBRL Taxonomy Extension Presentation Linkbase Document. |
4
SIGNATURES
Pursuant to the requirements of the Securities Exchange Act of 1934, the registrant has duly caused this report to be signed on its behalf by the undersigned, thereunto duly authorized.
FARMMI, INC. | ||
Date: September 28, 2020 | By: | /s/ Yefang Zhang |
Name: | Yefang Zhang | |
Title: | Chief Executive Officer |
5
Exhibit 99.1
FARMMI, INC.
UNAUDITED CONDENSED CONSOLIDATED FINANCIAL STATEMENTS
FOR THE SIX MONTHS ENDED MARCH 31, 2020 AND 2019
1 |
FARMMI, INC.
TABLE OF CONTENTS
Page | ||
Unaudited Condensed Consolidated Financial Statements | ||
Unaudited Condensed Consolidated Balance Sheets as of March 31, 2020 and September 30, 2019 | 3 | |
Unaudited Condensed Consolidated Statements of Operations and Comprehensive Income for the six months ended March 31, 2020 and 2019 | 4 | |
Unaudited Condensed Consolidated Statements of Changes in Equity for the six months ended March 31, 2020 and 2019 | 5 | |
Unaudited Condensed Consolidated Statements of Cash Flows for the six months ended March 31, 2020 and 2019 | 6 | |
Notes to Unaudited Condensed Consolidated Financial Statements | 7-30 |
2 |
Farmmi, Inc.
Condensed Consolidated Balance Sheets
March 31, | September 30, | ||||||
2020 | 2019 | ||||||
Assets | (Unaudited) | ||||||
Current Assets | |||||||
Cash | $ | 5,100,133 | $ | 135,125 | |||
Restricted cash | 600,000 | 18,690 | |||||
Accounts receivable | 9,026,526 | 13,824,937 | |||||
Accounts receivable - related party | 8,582 | 2,654 | |||||
Due from related parties | 3,636,377 | - | |||||
Inventory, net | 710,160 | 1,459,247 | |||||
Advances to suppliers | 11,732,283 | 14,034,379 | |||||
Other current assets | 191,379 | 229,996 | |||||
Total current assets | 31,005,440 | 29,705,028 | |||||
Property, plant and equipment, net | 289,799 | 139,468 | |||||
Intangible assets, net | 117,591 | 38,135 | |||||
Operating lease right-of-use assets, net | 300,095 | - | |||||
Restricted cash – non-current | - | 600,000 | |||||
Total Assets | $ | 31,712,925 | $ | 30,482,631 | |||
Liabilities and Equity | |||||||
Current Liabilities | |||||||
Short-term bank loans | $ | 1,834,300 | $ | 1,400,894 | |||
Accounts payable | 444,410 | 293,264 | |||||
Due to related parties | 1,770,898 | 2,652,882 | |||||
Advances from customers | 51,264 | 5,926 | |||||
Convertible notes payable | 1,879,688 | 2,926,361 | |||||
Operating lease liabilities - current | 55,491 | - | |||||
Other current liabilities | 666,851 | 865,753 | |||||
Total current liabilities | 6,702,902 | 8,145,080 | |||||
Operating lease liabilities – non-current | 258,864 | - | |||||
Total Liabilities | 6,961,766 | 8,145,080 | |||||
Commitments and contingencies | |||||||
Equity | |||||||
Common stock, $0.001 par value, 20,000,000 shares authorized, 15,896,285 and 12,589,857 shares issued and outstanding at March 31, 2020 and September 30, 2019, respectively | 15,896 | 12,590 | |||||
Additional paid-in capital | 18,032,186 | 15,762,867 | |||||
Statutory reserve | 597,528 | 597,528 | |||||
Retained earnings | 6,264,332 | 6,321,384 | |||||
Accumulated other comprehensive loss | (997,200 | ) | (1,195,866 | ) | |||
Total Farmmi, Inc.’s Stockholders' Equity | 23,912,742 | 21,498,503 | |||||
Non-controlling Interest | 838,417 | 839,048 | |||||
Total Equity | 24,751,159 | 22,337,551 | |||||
Total Liabilities and Equity | $ | 31,712,925 | $ | 30,482,631 |
The accompanying notes are an integral part of these unaudited condensed consolidated financial statements.
3 |
Farmmi, Inc.
Condensed Consolidated Statements of Operations and Comprehensive Income
(Unaudited)
For the Six Months Ended | ||||||||
March 31, | ||||||||
2020 | 2019 | |||||||
Revenues | ||||||||
Sales to third parties | $ | 13,574,767 | $ | 14,386,404 | ||||
Sales to related party | 6,015 | 1,783 | ||||||
Total revenues | 13,580,782 | 14,388,187 | ||||||
Cost of revenues | (11,470,717 | ) | (11,845,025 | ) | ||||
Gross Profit | 2,110,065 | 2,543,162 | ||||||
Operating expenses | ||||||||
Selling and distribution expenses | (142,382 | ) | (281,213 | ) | ||||
General and administrative expenses | (828,414 | ) | (876,746 | ) | ||||
Total operating expenses | (970,796 | ) | (1,157,959 | ) | ||||
Income from operations | 1,139,269 | 1,386,203 | ||||||
Other income (expenses) | ||||||||
Interest income | 141 | 451 | ||||||
Interest expense | (1,290,039 | ) | (1,527,302 | ) | ||||
Other income (expenses), net | 110,966 | (1,583 | ) | |||||
Total other expenses, net | (1,178,932 | ) | (1,528,434 | ) | ||||
Loss before income taxes | (39,663 | ) | (143,231 | ) | ||||
Provision for income taxes | (24,144 | ) | (27,860 | ) | ||||
Net loss | (63,807 | ) | (171,091 | ) | ||||
Less: Net loss attributable to non-controlling interest | 6,755 | 1,015 | ||||||
Net loss attributable to Farmmi, Inc. | $ | (57,052 | ) | $ | (170,076 | ) | ||
Comprehensive income | ||||||||
Net loss | (63,807 | ) | (171,091 | ) | ||||
Other comprehensive income: foreign currency translation gain | 204,790 | 683,614 | ||||||
Total comprehensive income | 140,983 | 512,523 | ||||||
Comprehensive loss (income) attributable to non-controlling interest | 631 | (19,708 | ) | |||||
Comprehensive income attributable to Farmmi, Inc. | $ | 141,614 | $ | 492,815 | ||||
Weighted average number of shares, basic | 13,783,362 | 11,427,753 | ||||||
Weighted average number of shares, diluted | 18,404,780 |
19,882,233 |
||||||
Basic loss per common share | $ | (0.00 |
) | $ | (0.01 | ) | ||
Diluted loss per common share | $ | (0.00 | ) | $ | (0.01 | ) |
The accompanying notes are an integral part of these unaudited condensed consolidated financial statements.
4 |
Farmmi, Inc.
Condensed Consolidated Statements of Changes in Equity
For the Six Months Ended March 31, 2020 and 2019
(Unaudited)
Accumulated | ||||||||||||||||||||||||||||||||||||
Additional | Other | Total | ||||||||||||||||||||||||||||||||||
Common Stock | Paid-in | Statutory | Retained | Comprehensive | Stockholders' | Non-Controlling | Total | |||||||||||||||||||||||||||||
Shares | Amount | Capital | Reserve | Earnings | Income (loss) | Equity | Interest | Equity | ||||||||||||||||||||||||||||
Balance at September 30, 2018 | 11,932,000 | $ | 11,932 | $ | 11,322,819 | $ | 229,512 | $ | 6,996,837 | $ | (222,830 | ) | $ | 18,338,270 | $ | 875,372 | $ | 19,213,642 | ||||||||||||||||||
Issuance of common shares for convertible notes redemption | 131,223 | 131 | 485,077 | - | - | - | 485,208 | - | 485,208 | |||||||||||||||||||||||||||
Beneficial conversion feature associated with convertible notes | - | - | 670,618 | - | - | - | 670,618 | - | 670,618 | |||||||||||||||||||||||||||
Issuance of warrants associated with convertible notes | - | - | 1,819,997 | - | - | - | 1,819,997 | - | 1,819,997 | |||||||||||||||||||||||||||
Foreign currency translation gain | - | - | - | - | - | 662,891 | 662,891 | 20,723 | 683,614 | |||||||||||||||||||||||||||
Net loss | - | - | - | - | (170,076 | ) | - | (170,076 | ) | (1,015 | ) | (171,091 | ) | |||||||||||||||||||||||
Balance at March 31, 2019 | 12,063,223 | $ | 12,063 | $ | 14,298,511 | $ | 229,512 | $ | 6,826,761 | $ | 440,061 | $ | 21,806,908 | $ | 895,080 | $ | 22,701,988 | |||||||||||||||||||
Balance at September 30, 2019 | 12,589,857 | $ | 12,590 | $ | 15,762,867 | $ | 597,528 | $ | 6,321,384 | $ | (1,195,866 | ) | $ | 21,498,503 | $ | 839,048 | $ | 22,337,551 | ||||||||||||||||||
Issuance of common shares for convertible notes redemption | 3,306,428 | 3,306 | 2,269,319 | - | - | - | 2,272,625 | - | 2,272,625 | |||||||||||||||||||||||||||
Foreign currency translation gain | - | - | - | - | - | 198,666 | 198,666 | 6,124 | 204,790 | |||||||||||||||||||||||||||
Net loss | - | - | - | - | (57,052 | ) | - | (57,052 | ) | (6,755 | ) | (63,807 | ) | |||||||||||||||||||||||
Balance at March 31, 2020 | 15,896,285 | $ | 15,896 | $ | 18,032,186 | $ | 597,528 | $ | 6,264,332 | $ | (997,200 | ) | $ | 23,912,742 | $ | 838,417 | $ | 24,751,159 |
The accompanying notes are an integral part of these unaudited condensed consolidated financial statements.
5 |
Farmmi, Inc.
Condensed Consolidated Statements of Cash Flows
(Unaudited)
For the Six Months Ended March 31, | ||||||||
2020 | 2019 | |||||||
Cash flows from operating activities | ||||||||
Net loss | $ | (63,807 | ) | $ | (171,091 | ) | ||
Adjustments to reconcile net loss to net cash provided by (used in) operating activities: | ||||||||
Changes in allowances - inventories | 225,408 | - | ||||||
Depreciation and amortization | 15,790 | 22,976 | ||||||
Non-cash lease expenses | 14,255 | - | ||||||
Accrued interest expense for convertible notes | 132,511 | 500,000 | ||||||
Amortization of deferred financing costs | 1,093,440 | 943,215 | ||||||
Changes in operating assets and liabilities: | ||||||||
Accounts receivable | 4,944,245 | (5,096,374 | ) | |||||
Inventory, net | 542,280 | (9,412 | ) | |||||
Advances to suppliers | 2,428,891 | (2,437,474 | ) | |||||
Due from related parties | (3,675,034 | ) | - | |||||
Other current assets | 40,705 | (87,404 | ) | |||||
Accounts payable | 150,615 | 70,694 | ||||||
Advances from customers | 45,777 | 53,993 | ||||||
Operating lease liabilities | 157 | - | ||||||
Other current liabilities | (208,766 | ) | 294,839 | |||||
Net cash provided by (used in) operating activities | 5,686,467 | (5,916,038 | ) | |||||
Cash flows from investing activities | ||||||||
Purchase of property, plant and equipment | (164,588 | ) | (6,346 | ) | ||||
Purchase of intangible assets | (82,138 | ) | (97,764 | ) | ||||
Net cash used in investing activities | (246,726 | ) | (104,110 | ) | ||||
Cash flows from financing activities | ||||||||
Payments of deferred financing costs | - | (716,318 | ) | |||||
Gross proceeds from issuance of convertible notes | - | 7,500,000 | ||||||
Borrowings from bank loans | 1,853,800 | 1,463,870 | ||||||
Repayments of bank loans | (1,426,000 | ) | (1,463,870 | ) | ||||
Repayments of loans from related parties | (881,557 | ) | (76,253 | ) | ||||
Net cash provided by (used in) financing activities | (453,757 | ) | 6,707,429 | |||||
Effect of exchange rate changes on cash, cash equivalents and restricted cash | (39,666 | ) | 225,773 | |||||
Net increase in cash, cash equivalents and restricted cash | 4,946,318 | 913,054 | ||||||
Cash and restricted cash, beginning of period | 753,815 | 5,525,165 | ||||||
Cash and restricted cash, end of period | $ | 5,700,133 | $ | 6,438,219 | ||||
Supplemental disclosure information: | ||||||||
Income taxes paid | $ | 22,998 | $ | 11,254 | ||||
Interest paid | $ | 42,596 | $ | 71,670 | ||||
Non-cash financing activities | ||||||||
Right of use assets obtained in exchange for operating lease obligations | $ | 317,540 | - | |||||
Conversion of notes to 3,306,428 and 131,223 shares of common stock | $ | 2,272,625 | $ | 485,208 | ||||
Accrued interest for convertible notes | $ | 132,511 | $ | 500,000 |
The accompanying notes are an integral part of these unaudited condensed consolidated financial statements.
6 |
FARMMI, INC.
NOTES TO UNAUDITED CONDENSED CONSOLIDATED FINANCIAL STATEMENTS
Note 1 — Organization and nature of business
Farmmi, Inc. (“FMI”) is a holding company incorporated under the laws of the Cayman Islands on July 28, 2015. FMI’s Chief Executive Officer (“CEO”) Ms. Yefang Zhang, as the sole shareholder of FarmNet Limited which is the sole shareholder of FMI, and her husband Mr. Zhengyu Wang, a director of FMI, are the ultimate shareholders of the Company (“Controlling Shareholders”). FMI owns 100% equity interest of Farmmi International Limited (“Farmmi International”), a Hong Kong company, who in turn owns 100% equity interest of Hangzhou Suyuan Agriculture Technology Co., Ltd. (“Suyuan Agriculture”), a company incorporated in the People’s Republic of China (“PRC” or “China”), through Farmmi (Hangzhou) Enterprise Management Co., Ltd. (“Farmmi Enterprise”) and Lishui Farmmi Technology Co., Ltd. (“Farmmi Technology”), two wholly foreign-owned entities (“WFOE”) formed by Farmmi International under the laws of China. Farmmi Enterprise and Farmmi Technology each owns 50% of Suyuan Agriculture. Suyuan Agriculture owns 96.15% equity interest of Zhejiang Forest Food Co., Ltd. (“Forest Food”) and 100% equity interest of Zhejiang FLS Mushroom Co., Ltd. (“FLS Mushroom”). Except for Forest Food and FLS Mushroom who are the main operating entities located in China, all other entities are holding companies without any material activities.
On September 18, 2016, Suyuan Agriculture entered into a series of contractual agreements with Zhengyu Wang, the owner of Hangzhou Nongyuan Network Technology Co., Ltd. (“Nongyuan Network”) and Nongyuan Network. Nongyuan Network is a company incorporated on December 8, 2015 that focuses on the development of network marketing and provides a network platform for sales of agriculture products. These agreements include an Exclusive Management Consulting and Technology Agreement, an Equity Pledge Agreement, an Exclusive Call Option Agreement, a Proxy Agreement and a Power of Attorney (collectively, the “Original VIE Agreements”). The Original VIE Agreements obligated Suyuan Agriculture to absorb a majority of the risk of loss from Nongyuan Network’s activities and entitled Suyuan Agriculture to receive a majority of their residual returns. In essence, Suyuan Agriculture and the Company had gained effective control over Nongyuan Network.
On December 4, 2019, Zhengyu Wang transferred his 100% shares of Nongyuan Network to his daughter Xinyang Wang. As a result, Xinyang Wang holds 100% shares of Nongyuan Network. On December 10, 2019, Xinyang Wang, as the new shareholder of Nongyuan Network, signed a series of VIE agreements (the “Xinyang Wang VIE Agreements”) with Nongyuan Network and Suyuan Agriculture. On May 15, 2020, the following agreements were signed with the effective date of December 10, 2019:
(1) Zhengyu Wang, Nongyuan Network and Suyuan Agriculture signed a termination agreement to confirm that the Original VIE Agreements have been terminated because Zhengyu Wang is no longer the shareholder of Nongyuan Network;
(2) Zhengyu Wang, Dehong Zhang (the legal representative of Nongyuan Network), Xinyang Wang, Nongyuan Network and Suyuan Agriculture signed a joint statement to confirm that the board of directors of the Company has the ultimate authority over the matters of the VIE entity Nongyuan Network.
FMI believes that Xinyang Wang VIE Agreements enable Suyuan Agriculture and FMI to keep the effective control over Nongyuan Network. Therefore, FMI believes that Nongyuan Network should be considered as Variable Interest Entity (“VIE”) under the Statement of Financial Accounting Standards Board (“FASB”) Accounting Standards Codification (“ASC”) 810 “Consolidation”. Accordingly, the accounts of this entity are consolidated with those of Suyuan Agriculture.
Since FMI and its subsidiaries are effectively controlled by the same Controlling Shareholders, they are considered under common control. The consolidation of FMI and its subsidiaries has been accounted for at historical cost and prepared on the basis as if the aforementioned transactions had become effective as of the beginning of the first period presented in the accompanying unaudited condensed consolidated financial statements.
On December 26, 2017, Zhejiang Farmmi Food Co., Ltd. (“Farmmi Food”) was established under the laws of the PRC. Initially Farmmi Food was wholly owned by Farmmi Technology. In January 2018, the share ownership was transferred to Suyuan Agriculture. In May 2018, Farmmi Food received its food production permit and began operation.
On March 22, 2019, Lishui Farmmi E-Commerce Co., Ltd. (“Farmmi E-Commerce”) was established under the laws of the PRC. Nongyuan Network and Suyuan Agriculture owns 98% and 2% of interests in Farmmi E-Commerce, respectively.
7 |
FARMMI, INC.
NOTES TO UNAUDITED CONDENSED CONSOLIDATED FINANCIAL STATEMENTS
Note 1 — Organization and nature of business (Continued)
Details of the subsidiaries of FMI are set out below:
Date of | Place of | % of | ||||||||||
Name of Entity | Incorporation | Incorporation | Ownership | Principal Activities | ||||||||
FMI | July 28, 2015 | Cayman | Parent | Holding Company | ||||||||
Farmmi International | August 20, 2015 | Hong Kong | 100 | Holding Company | ||||||||
Farmmi Enterprise | May 23, 2016 | Zhejiang, China | 100 | Holding Company | ||||||||
Farmmi Technology | June 6, 2016 | Zhejiang, China | 100 | Holding Company | ||||||||
Suyuan Agriculture | December 8, 2015 | Zhejiang, China | 100 | Holding Company | ||||||||
Drying, further processing and | ||||||||||||
Forest Food | May 8, 2003 | Zhejiang, China | 96.15 | distribution of edible fungus | ||||||||
Light processing and distribution of | ||||||||||||
FLS Mushroom | March 25, 2011 | Zhejiang, China | 100 | dried mushrooms | ||||||||
Drying, further processing and | ||||||||||||
Farmmi Food | December 26, 2017 | Zhejiang, China | 100 | distribution of edible fungus | ||||||||
Nongyuan Network | July 7, 2016 | Zhejiang, China | 0 (VIE) | Trading | ||||||||
Technology development, technical | ||||||||||||
services and technical consultation | ||||||||||||
Farmmi E-Commerce | March 22, 2019 | Zhejiang, China | Subsidiary of the VIE | related to agricultural products |
FMI, Farmmi International, Farmmi Enterprise, Farmmi Technology, Suyuan Agriculture, Forest Food, FLS Mushroom, Farmmi Food, Nongyuan Network and Farmmi E-Commerce (herein collectively referred to as the “Company”) are engaged in processing and distributing dried Shiitake mushrooms and Mu Er mushrooms. Approximately 93% of the Company’s products are sold in China and the remaining 7% internationally, including USA, Japan, Canada, Europe and the Middle East.
8 |
FARMMI, INC.
NOTES TO UNAUDITED CONDENSED CONSOLIDATED FINANCIAL STATEMENTS
Note 2 — Summary of significant accounting policies
Basis of Presentation and Principles of Consolidation
The accompanying unaudited condensed consolidated financial statements of the Company have been prepared in accordance with generally accepted accounting principles (“U.S. GAAP”) for interim financial information pursuant to the rules and regulations of the Securities and Exchange Commission (the “SEC”). In the opinion of management, all adjustments (consisting of normal recurring accruals) considered necessary for a fair presentation have been included. Operating results for the six month period ended March 31, 2020 are not necessarily indicative of the results that may be expected for the fiscal year ending September 30, 2020. The information included in this Form 6-K should be read in conjunction with Management’s Discussion and Analysis, and the financial statements and notes thereto included in the Company’s Form 20-F for the fiscal year ended September 30, 2019, filed with the SEC on December 31, 2019.
The unaudited condensed consolidated financial statements of the Company reflect the principal activities of FMI, Farmmi international, Farmmi Enterprise, Farmmi Technology, Suyuan Agriculture, and Suyuan Agriculture’s main operation subsidiaries, Forest Food, Farmmi Food and FLS Mushroom, and the VIE Nongyuan Network and its subsidiary Farmmi E-Commerce. All intercompany transactions and balances have been eliminated upon consolidation.
Consolidation of Variable Interest Entities
In accordance with accounting standards regarding consolidation of variable interest entities (“VIEs”), VIEs are generally entities that lack sufficient equity to finance their activities without additional financial support from other parties or whose equity holders lack adequate decision-making ability. All VIEs with which the Company is involved must be evaluated to determine the primary beneficiary of the risks and rewards of the VIE. The primary beneficiary is required to consolidate the VIE for financial reporting purposes.
The Company determined that Nongyuan Network is a VIE because the Company is the primary beneficiary of risks and rewards of this VIE. The carrying amount of this VIE’s assets and liabilities are as follows:
March 31, | September 30, | |||||||
2020 | 2019 | |||||||
(Unaudited) | ||||||||
Current assets | $ | 556,348 | $ | 1,003,603 | ||||
Non-current assets | 163,169 | 89,182 | ||||||
Total assets | 719,517 | 1,092,785 | ||||||
Total liabilities | (454,951 | ) | (837,640 | ) | ||||
Net assets | $ | 264,566 | $ | 255,145 |
The financial performance of the VIE reported in the unaudited condensed consolidated statements of operations and comprehensive income for the six months ended March 31, 2020 and 2019 includes sales of $2,004,174 and $3,097,876, operating expenses of $1,996,513 and $3,176,450, and net income of $7,661 and net loss of $78,962, respectively.
9 |
FARMMI, INC.
NOTES TO UNAUDITED CONDENSED CONSOLIDATED FINANCIAL STATEMENTS
Note 2 — Summary of significant accounting policies (Continued)
Use of Estimates
In preparing the unaudited condensed consolidated financial statements in conformity with U.S. GAAP, management makes estimates and assumptions that affect the reported amounts of assets and liabilities and disclosures of contingent assets and liabilities at the dates of the unaudited condensed consolidated financial statements, as well as the reported amounts of revenues and expenses during the reporting year. Significant items subject to such estimates and assumptions include allowance for doubtful accounts and advances to suppliers, the valuation of inventories, the useful lives of property, plant and equipment, the valuation of beneficial conversion feature of the convertible notes, and the valuation of deferred tax assets.
Cash
For purposes of the statements of cash flows, the Company considers all highly liquid instruments purchased with an original maturity of three months or less and money market accounts to be cash equivalents. All cash balances are in bank accounts in PRC and are not insured by the Federal Deposit Insurance Corporation or other programs.
Restricted Cash
The Company adopted Accounting Standards Update (“ASU”) No. 2016-18, “Statement of Cash Flows: Restricted Cash” on October 1, 2018. This ASU applies to all entities that have restricted cash or restricted cash equivalents to be presented in the statement of cash flows under Topic 230. As of March 31, 2020 and September 30, 2019, the Company had restricted cash of $600,000 and $618,690, respectively. $600,000 of the restricted cash is the proceeds from the Initial Public Offering and will be released in February 2021, and $18,690 were the proceeds from the private placement (Note 8) and was designated to pay for professional service fees at any time. As of March 31, 2020 and September 30, 2019, the restricted cash was on deposit in the United States and was insured by the Federal Deposit Insurance Corporation (“FDIC”) up to $250,000.
Accounts Receivable
Accounts receivable are presented net of allowance for doubtful accounts. The Company maintains allowance for doubtful accounts for estimated losses. The Company reviews its accounts receivable on a periodic basis and makes general and specific allowances when there is doubt as to the collectability of individual balances. In evaluating the collectability of individual receivable balances, the Company considers various factors, including the age of the balance, customer’s payment history, its current credit-worthiness and current economic trends. Accounts are written off after efforts at collection prove unsuccessful.
As of March 31, 2020 and September 30, 2019, no allowance for doubtful accounts was recorded because all accounts receivable are fully collectible.
Inventory, net
The Company values its inventory at the lower of cost, determined on a weighted average basis, or net realizable value. The Company reviews its inventory periodically to determine if any reserves are necessary for potential obsolescence or if the carrying value exceeds net realizable value. The Company recorded inventory reserve of $223,037 and nil as of March 31, 2020 and September 30, 2019, respectively.
Advances to Suppliers
Advances to suppliers represent prepayments made to ensure continuous high-quality supplies and favorable purchase prices for premium quality. These advances are directly related to the purchases of raw materials used to fulfill sales orders. The Company is required from time to time to make cash advances when placing its purchase orders. These advances are settled upon suppliers delivering raw materials to the Company when the transfer of ownership occurs. The Company reviews its advances to suppliers on a periodic basis and makes general and specific allowances when there is doubt as to the ability of a supplier to provide supplies to the Company or refund an advance. As of March 31, 2020 and September 30, 2019, no allowance for doubtful accounts was recorded because all advances to suppliers are fully realizable.
10 |
FARMMI, INC.
NOTES TO UNAUDITED CONDENSED CONSOLIDATED FINANCIAL STATEMENTS
Note 2 — Summary of significant accounting policies (Continued)
Property, Plant and Equipment, net
Property, plant and equipment are stated at cost less accumulated depreciation. The cost of an asset comprises its purchase price and any directly attributable costs of bringing the asset to its present working condition and location for its intended use.
Depreciation is computed on a straight-line basis over the estimated useful lives of the related assets. The estimated useful lives for significant property, plant and equipment are as follows:
Plant, machinery and equipment | 5 – 10 years | |
Transportation equipment | 4 years | |
Office equipment | 3 – 5 years | |
Leasehold improvement | Shorter of lease term or useful life |
Expenditures for maintenance and repairs, which do not materially extend the useful lives of the assets, are charged to expense as incurred. Expenditures for major renewals and betterments which substantially extend the useful life of assets are capitalized.
Intangible Assets, net
Intangible assets consist primarily of purchased software. Intangible assets are stated at cost less accumulated amortization, and are amortized using the straight-line method with the estimated useful lives of three years.
Impairment of Long-lived Assets
The Company reviews long-lived assets for impairment whenever events or changes in circumstances indicate that the carrying amount of an asset may not be recoverable. Recoverability of assets to be held and used is measured by a comparison of the carrying amount of an asset to the future undiscounted net cash flows expected to be generated by the asset. If such assets are considered to be impaired, the impairment recognized is measured by the amount by which the carrying amount of the assets exceeds the fair value of the assets. No impairment of long-lived assets was recognized for the six months ended March 31, 2020 and 2019.
Revenue Recognition
The Company follows Accounting Standards Update (“ASU”) 2014-09 Revenue from Contracts with Customers (“ASC Topic 606”). In accordance with ASC 606, to determine revenue recognition for contracts with customers, the Company performs the following five steps: (i) identify the contract(s) with the customer, (ii) identify the performance obligations in the contract, (iii) determine the transaction price, including variable consideration to the extent that it is probable that a significant future reversal will not occur, (iv) allocate the transaction price to the respective performance obligations in the contract, and (v) recognize revenue when (or as) the Company satisfies the performance obligation.
The Company recognizes revenue when it transfers its goods and services to customers in an amount that reflects the consideration to which the Company expects to be entitled in such exchange. All of the Company’s contracts have a single performance obligation satisfied at a point in time and the transaction price is stated in the contract, usually as a price per ton.
The contract liabilities are recorded on the unaudited condensed consolidated balance sheets as advances from customers as of March 31, 2020 and September 30, 2019. For the six months ended March 31, 2020 and 2019, there was no revenue recognized from performance obligations related to prior periods.
Refer to Note 15 — Segment reporting for details of revenue segregation.
11 |
FARMMI, INC.
NOTES TO UNAUDITED CONDENSED CONSOLIDATED FINANCIAL STATEMENTS
Note 2 — Summary of significant accounting policies (Continued)
Cost of Revenues
Cost of revenues includes cost of raw materials purchased, inbound freight cost, cost of direct labor, depreciation expense and other overhead. Write-down of inventory for lower of cost or net realizable value adjustments is also recorded in cost of revenues.
Earnings (loss) per share
The Company computes earnings (loss) per share (“EPS”) in accordance with ASC 260, “Earnings per Share” (“ASC 260”). ASC 260 requires companies with complex capital structures to present basic and diluted EPS. Basic EPS is measured as net income (loss) divided by the weighted average common shares outstanding for the period. Diluted EPS is similar to basic EPS but presents the dilutive effect on a per share basis of potential common shares (e.g., convertible securities, options and warrants) as if they had been converted at the beginning of the periods presented, or issuance date, if later. Potential common shares that have an anti-dilutive effect (i.e., those that increase income per share or decrease loss per share) are excluded from the calculation of diluted EPS. There is no anti-dilutive effect for the six months ended March 31, 2020 and 2019.
Fair Value of Financial Instruments
The FASB Accounting Standards Codification (“ASC”) Topic 820, “Fair Value Measurements”, defines fair value, establishes a three-level valuation hierarchy for fair value measurements and enhances disclosure requirements.
The three levels are defined as follows:
Level 1 — Inputs to the valuation methodology are quoted prices (unadjusted) for identical assets or liabilities in active markets.
Level 2 — Inputs to the valuation methodology include quoted prices for similar assets and liabilities in active markets, quoted market prices for identical or similar assets in markets that are not active, inputs other than quoted prices that are observable and inputs derived from or corroborated by observable market data.
Level 3 — Inputs to the valuation methodology are unobservable.
Unless otherwise disclosed, the fair value of the Company’s financial instruments including cash, restricted cash, accounts receivable, due from related parties, advances to suppliers, other current assets, accounts payable, due to related parties, advances from customers, convertible notes payable, operating lease liabilities – current, other current liabilities and short-term bank loans approximate their recorded values due to their short-term maturities.
12 |
FARMMI, INC.
NOTES TO UNAUDITED CONDENSED CONSOLIDATED FINANCIAL STATEMENTS
Note 2 — Summary of significant accounting policies (Continued)
Beneficial Conversion Feature
The Company evaluates the conversion feature to determine whether it was beneficial as described in ASC 470-20. The intrinsic value of a beneficial conversion feature inherent to a convertible note payable, which is not bifurcated and accounted for separately from the convertible notes payable and may not be settled in cash upon conversion, is treated as a discount to the convertible notes payable. This discount is amortized over the period from the date of issuance to the date the notes is due using the effective interest method. If the notes payable are retired prior to the end of their contractual term, the unamortized discount is expensed in the period of retirement to interest expense. In general, the beneficial conversion feature is measured by comparing the effective conversion price, after considering the relative fair value of detachable instruments included in the financing transaction, if any, to the fair value of the shares of common stock at the commitment date to be received upon conversion.
Debt Issuance Costs and Debt Discounts
The Company records debt issuance costs and/or debt discounts in connection with raising funds through the issuance of debt. These costs may be paid in the form of cash, or equity (such as warrants). These costs are amortized to interest expense through the maturity of the debt. If a conversion of the underlying debt occurs prior to maturity a proportionate share of the unamortized amounts is immediately expensed.
Concentrations of Credit Risk
Financial instruments which potentially subject the Company to concentrations of credit risk consist principally of cash, accounts receivable and advances to suppliers. As of March 31, 2020 and September 30 2019, $5,021,605 and $114,036 of the Company’s cash is maintained in banks within the People’s Republic of China of which deposits of RMB0.5 million (equivalent to $70,550) per bank are covered by “deposit insurance regulation” promulgated by the State Council of the People’s Republic of China. The Company has not experienced any losses in such accounts. A significant portion of the Company’s sales are credit sales primarily to customers whose ability to pay is dependent upon the industry economics prevailing in these areas. The Company also makes cash advances to certain suppliers to ensure the stable supply of key raw materials. The Company performs ongoing credit evaluations of its customers and key suppliers to help further reduce credit risk.
Comprehensive Income (Loss)
Comprehensive income (loss) consists of two components, net income (loss) and other comprehensive income (loss). Other comprehensive income (loss) refers to revenue, expenses, gains and losses that under GAAP are recorded as an element of stockholders’ equity but are excluded from net income (loss). Other comprehensive income (loss) consists of foreign currency translation adjustment from the Company not using the U.S. dollar as its functional currency.
13 |
FARMMI, INC.
NOTES TO UNAUDITED CONDENSED CONSOLIDATED FINANCIAL STATEMENTS
Note 2 — Summary of significant accounting policies (Continued)
Lease
The Company adopted ASU 2016-02, “Leases” on October 1, 2019 and used the alternative transition approach which permits the effects of adoption to be applied at the effective date. The new standard provides a number of optional practical expedients in transition. The Company elected the “package of practical expedients”, which permits the Company not to reassess under the new standard our prior conclusions about lease identification, lease classification and initial direct costs. The Company also elected the short-term lease exemption and combining the lease and non-lease components practical expedients. The Company has not elected the practical expedient to use hindsight to determine the lease term for its leases at transition. The most significant impact upon adoption relates to the recognition of new Right-of-use (“ROU”) assets and lease liabilities on the Company’s consolidated balance sheets for office space operating leases. Upon adoption, the Company recognized additional operating liabilities of approximately $0.3 million, with corresponding ROU assets of the same amount based on the present value of the remaining rental payments under current leasing standards for existing operating leases. There was no cumulative effect of adopting the standard.
Foreign Currency Translation
The Company’s financial information is presented in U.S. dollars (“USD”). The functional currency of the Company is the Chinese Yuan Renminbi (“RMB”), the currency of PRC. Any transactions which are denominated in currencies other than RMB are translated into RMB at the exchange rate quoted by the People’s Bank of China prevailing at the dates of the transactions, and exchange gains and losses are included in the unaudited condensed consolidated statements of operations as foreign currency transaction gain or loss. The unaudited condensed consolidated financial statements of the Company have been translated into U.S. dollars in accordance with ASC 830, “Foreign Currency Matters”. The financial information is first prepared in RMB and then translated into U.S. dollars at period-end exchange rates for assets and liabilities and average exchange rates for revenue and expenses. Capital accounts are translated at their historical exchange rates when the capital transactions occurred. The effects of foreign currency translation adjustments are included as a component of accumulated other comprehensive income in stockholders’ equity. Cash flows from the Company’s operations are calculated based upon the local currencies using the average translation rate. As a result, amounts related to assets and liabilities reported on the unaudited condensed consolidated statements of cash flows will not necessarily agree with changes in the corresponding balances on the unaudited condensed consolidated balance sheets.
The exchange rates in effect as of March 31, 2020 and September 30, 2019 were RMB1 for $0.1411 and $0.1401, respectively. The average exchange rates for the six months ended March 31, 2020 and 2019 were RMB1 for $0.1426 and $0.1464, respectively.
Shipping and Handling Expenses
All shipping and handling costs are expensed as incurred and included in selling expenses. Total shipping and handling expenses were $79,302 and $114,669 for the six months ended March 31, 2020 and 2019, respectively.
Value Added Tax
The Company is generally subject to the value added tax (“VAT”) for selling merchandise, except for FLS Mushroom. Before May 1, 2018, the applicable VAT rate was 13% or 17% (depending on the type of goods involved) for products sold in PRC. After May 1, 2018, the Company is subject to a tax rate of 12% or 16%, and after April 1, 2019, the tax rate was further reduced to 9% or 13% based on the new Chinese tax law. Pursuant to approval issued by the State Administration of Taxation, FLS Mushroom’s major operation can be classified as agriculture products and its revenue is exempt from VAT. The amount of VAT liability is determined by applying the applicable tax rate to the invoiced amount of goods sold (output VAT) less VAT paid on purchases made with the relevant supporting invoices (input VAT). Under the commercial practice of PRC, the Company pays VAT based on tax invoices issued. The tax invoices may be issued subsequent to the date on which revenue is recognized, and there may be a considerable delay between the date on which the revenue is recognized and the date on which the tax invoice is issued. In the event the PRC tax authorities dispute the date on which revenue is recognized for tax purposes, the PRC tax authorities has the right to assess a penalty based on the amount of taxes which is determined to be late or deficient, with any penalty being expensed in the period when a determination is made by the tax authorities that a penalty is due. During the reporting periods, the Company had no dispute with PRC tax authorities and there was no tax penalty incurred.
14 |
FARMMI, INC.
NOTES TO UNAUDITED CONDENSED CONSOLIDATED FINANCIAL STATEMENTS
Note 2 — Summary of significant accounting policies (Continued)
Income Taxes
The Company is subject to the income tax laws of the PRC. No taxable income was generated outside the PRC for the six months ended March 31, 2020 and 2019. The Company accounts for income taxes in accordance with ASC 740, “Income Taxes”. ASC 740 requires an asset and liability approach for financial accounting and reporting for income taxes and allows recognition and measurement of deferred tax assets based upon the likelihood of realization of tax benefits in future years. Under the asset and liability approach, deferred taxes are provided for the net tax effects of temporary differences between the carrying amounts of assets and liabilities for financial reporting purposes and the amounts used for income tax purposes. A valuation allowance is provided for deferred tax assets if it is more likely than not these items will either expire before the Company is able to realize their benefits, or not be deductible in the future.
ASC 740-10-25 prescribes a more-likely-than-not threshold for financial statement recognition and measurement of a tax position taken (or expected to be taken) in a tax return. It also provides guidance on the recognition of income tax assets and liabilities, classification accounting for interest and penalties associated with tax positions, years open for tax examination, accounting for income taxes in interim periods and income tax disclosures. There were no material uncertain tax positions as of March 31, 2020 and September 30, 2019. As of March 31, 2020, the tax years ended December 31, 2015 through December 31, 2019 for the Company’s PRC subsidiaries remain open for statutory examination by PRC tax authorities.
Statement of Cash Flows
In accordance with ASC 230, “Statement of Cash Flows,” cash flows from the Company’s operations are formulated based upon the local currencies. As a result, amounts related to assets and liabilities reported on the statements of cash flows will not necessarily agree with changes in the corresponding balances on the balance sheets.
Risks and Uncertainties
The operations of the Company are located in PRC. Accordingly, the Company’s business, financial condition, and results of operations may be influenced by the political, economic, and legal environments in PRC, in addition to the general state of the PRC economy. The Company’s results may be adversely affected by changes in the political and social conditions in PRC, and by changes in governmental policies with respect to laws and regulations, anti-inflationary measures, currency conversion and remittance abroad, and rates and methods of taxation, among other things.
The Company’s sales, purchases and expense transactions are denominated in RMB, and a substantial part of the Company’s assets and liabilities are also denominated in RMB. RMB is not freely convertible into foreign currencies under the current law. In China, foreign exchange transactions are required by law to be transacted only by authorized financial institutions at exchange rates set by the People’s Bank of China, the central bank of China. Remittances in currencies other than RMB may require certain supporting documentation in order to effect the remittance.
The Company’s operating entities in PRC do not carry any business interruption insurance, product liability insurance or any other insurance policy except for a limited property insurance policy. As a result, the Company may incur uninsured losses, increasing the possibility that investors would lose their entire investment in the Company.
The Company’s business, financial condition and results of operations may also be negatively impacted by risks related to natural disasters, extreme weather conditions, health epidemics and other catastrophic incidents, which could significantly disrupt the Company’s operations (see Note 16 - Subsequent Events).
15 |
FARMMI, INC.
NOTES TO UNAUDITED CONDENSED CONSOLIDATED FINANCIAL STATEMENTS
Note 2 — Summary of significant accounting policies (Continued)
Recent Accounting Pronouncements
The Company considers the applicability and impact of all accounting standards updates (“ASUs”). Management periodically reviews new accounting standards that are issued.
In June 2016, the FASB issued Accounting Standards Update (“ASU”) 2016-13, Financial Instruments-Credit Losses (Topic 326), which requires entities to measure all expected credit losses for financial assets held at the reporting date based on historical experience, current conditions, and reasonable and supportable forecasts. This replaces the existing incurred loss model and is applicable to the measurement of credit losses on financial assets measured at amortized cost. ASU 2016-13 was subsequently amended by Accounting Standards Update 2018-19, Codification Improvements to Topic 326, Financial Instruments — Credit Losses, Accounting Standards Update 2019-04 Codification Improvements to Topic 326, Financial Instruments — Credit Losses, Topic 815, Derivatives and Hedging, and Topic 825, Financial Instruments, and Accounting Standards Update 2019-05, Targeted Transition Relief. For public entities, ASU 2016-13 and its amendments is effective for fiscal years, and interim periods within those fiscal years, beginning after December 15, 2019. For all other entities, this guidance and its amendments will be effective for fiscal years beginning after December 15, 2022, including interim periods within those fiscal years. As an emerging growth company, the Company plans to adopt this guidance effective October 1, 2023. The Company is currently evaluating the impact of its pending adoption of ASU 2016-13 on its consolidated financial statements.
In August 2018, the FASB Accounting Standards Board issued ASU No. 2018-13, “Fair Value Measurement (Topic 820): Disclosure Framework Changes to the Disclosure Requirements for Fair Value Measurement” (“ASU 2018-13”). ASU 2018-13 modifies the disclosure requirements on fair value measurements. ASU 2018-13 is effective for all entities for fiscal years and interim periods within those fiscal years beginning after December 15, 2019, with early adoption permitted for any removed or modified disclosures. The removed and modified disclosures will be adopted on a retrospective basis and the new disclosures will be adopted on a prospective basis. The Company will adopt this guidance effective October 1, 2020. The Company is currently evaluating the impact of its pending adoption of this guidance on its consolidated financial statements but does not expect this guidance will have a material impact on its consolidated financial statements.
In December 2019, the FASB issued ASU No. 2019-12, Income Taxes (Topic 740)—Simplifying the Accounting for Income Taxes. ASU 2019-12 is intended to simplify accounting for income taxes. It removes certain exceptions to the general principles in Topic 740 and amends existing guidance to improve consistent application. ASU 2019-12 is effective for fiscal years beginning after December 15, 2020 and interim periods within those fiscal years, with early adoption permitted. The Company will adopt this guidance effective October 1, 2021. The Company is currently evaluating the impact of its pending adoption of this guidance on its consolidated financial statements but does not expect this guidance will have a material impact on its consolidated financial statements.
In February 2020, the FASB issued ASU 2020-02, “Financial Instruments – Credit Losses (Topic 326) and Leases (topic 842) Amendments to SEC Paragraphs Pursuant to SEC Staff Accounting Bulletin No. 119 and Update to SEC Section on Effective Date Related to Accounting Standards Update No. 2016-02, Leases (topic 842)”. This ASU provides guidance regarding methodologies, documentation, and internal controls related to expected credit losses. This ASU is effective for interim and annual periods beginning after December 15, 2019, and early adoption is permitted. The Company will adopt this guidance effective October 1, 2020. The Company is currently evaluating the impact of its pending adoption of this guidance on its consolidated financial statements but does not expect this guidance will have a material impact on its consolidated financial statements.
16 |
FARMMI, INC.
NOTES TO UNAUDITED CONDENSED CONSOLIDATED FINANCIAL STATEMENTS
Note 3 — Accounts receivable
Accounts receivable consisted of the following:
March 31, | September 30, | |||||||
2020 | 2019 | |||||||
(Unaudited) | ||||||||
Accounts receivable - third parties | $ | 9,026,526 | $ | 13,824,937 | ||||
Accounts receivable - related party | 8,582 | 2,654 | ||||||
Accounts receivable | $ | 9,035,108 | $ | 13,827,591 |
No allowance for doubtful accounts was deemed necessary for the six months ended March 31, 2020 and 2019. The Company’s accounts receivable primarily includes balance due from customers when the Company’s products are sold and delivered to customers. For the Company’s net account receivable balance as of March 31, 2020, approximately 98.73% or $8.92 million has been subsequently collected and the Company expects to collect the remaining balance by December 31, 2020.
Note 4 – Inventory, net
Inventory consisted of the following:
March 31, 2020 |
September 30, 2019 |
|||||||
(Unaudited) | ||||||||
Raw materials | $ | 861,216 | $ | 1,415,226 | ||||
Packaging materials | 34,350 | 31,829 | ||||||
Finished goods | 37,631 | 12,192 | ||||||
Less: allowance for inventory reserve | (223,037 | ) | - | |||||
Inventory, net | $ | 710,160 | $ | 1,459,247 |
17 |
FARMMI, INC.
NOTES TO UNAUDITED CONDENSED CONSOLIDATED FINANCIAL STATEMENTS
Note 5 — Advances to suppliers
Movement of advances to suppliers is as follows:
March 31, 2020 |
September 30, 2019 |
|||||||
(Unaudited) | ||||||||
Beginning balance | $ | 14,034,379 | $ | 5,868,486 | ||||
Increased during the year | 7,647,709 | 30,753,022 | ||||||
Less: utilized during the year | (10,076,600 | ) | (22,366,650 | ) | ||||
Exchange rate difference | 126,795 | (220,479 | ) | |||||
Ending balance | $ | 11,732,283 | $ | 14,034,379 |
On April 1, 2016, the Company entered into two separate framework supply agreements (“Framework Agreements”) with two co-operatives, Jingning Liannong Trading Co., Ltd (“JLT”) and Qingyuan Nongbang Mushroom Industry Co., Ltd (“QNMI”). These two Framework Agreements were renewed for another three years in April 2019 upon expiration. Jingning County and Qingyuan County where JLT and QNMI are located produce premium Shiitake and Mu Er. Many competitors of the Company and other large buyers go there to source their supplies. Family farms and co-operatives traditionally request advance payments to secure supplies. By making advance payments to these suppliers, the Company is also able to lock in a more favorable price for premium quality than would be available in the open market.
The Framework Agreements only provide general guidelines. Actual prices are negotiated and agreed upon in individual purchase orders, and are typically set at market prices based on the quality grade and quantities determined and agreed with the suppliers. Prices may vary based on market demand and crop condition etc. The Company can generally secure the premium quality raw material supplies at prices slightly higher than the typical market prices for average quality raw materials. The quality of supplies must meet standardized specifications of both the mushroom industry and standards set by the Company.
The Company advances certain initial payments based on its estimated purchase plan from these two suppliers and additional advances based on individual purchase orders placed. The Company pays advances for no other reason than to secure an adequate supply of dried mushrooms to meet its sales demands. The Company’s purchase orders require that the advances shall be refunded by suppliers if they fail to produce any dried mushrooms or fail to deliver supplies to the Company timely.
Advances to suppliers are carried at cost and evaluated for recoverability. The realizability evaluation process is similar to that of the lower of cost or net realizable value evaluation process for inventories. The Company periodically evaluates its advances for recoverability by monitoring suppliers’ ability to deliver a sufficient supply of mushrooms as well as current crop and market condition. This includes analyzing historical quantity and quality of production with monitoring of crop information provided by the Company’s field personnel related to weather or disaster or any other reason. If for any reason the Company believes that it will not receive supplies of the contracted volumes, the Company will assess its advances for any likelihood of recoverability and adjust advances on its financial statements at the lower of cost or estimated recoverable amounts. The advances are made primarily to JLT and QNMI, which are co-operatives formed by many family farms, with which the Company has had long-term relationships over the years. If any of these family farms fail to deliver supplies, the Company would expect to receive a refund of the advances through JLT/QNMI. The Company accrues for any allowance for possible loss on advances when there is doubt as to the collectability of the refund.
18 |
FARMMI, INC.
NOTES TO UNAUDITED CONDENSED CONSOLIDATED FINANCIAL STATEMENTS
Note 5 — Advances to suppliers (Continued)
As of March 31, 2020, total advances made to these two suppliers amounted to $10,991,386, of which 88% has been utilized as of the date of these unaudited condensed consolidated financial statements, and the remaining 12% is expected to be utilized by October 31, 2020. The Company continuously makes advances to its suppliers on a rolling basis, which typically represent 30% of the total amount of each purchase order. The Company may maintain its outstanding advance payments at a relatively high level going forward because the Company anticipates continuous large orders from its largest customer, China Forestry Group Corporation.
Note 6 — Property, plant and equipment, net
Property, plant and equipment, net, stated at cost less accumulated depreciation, consisted of the following:
March 31, | September 30, | |||||||
2020 | 2019 | |||||||
(Unaudited) | ||||||||
Office equipment | $ | 43,196 | $ | 42,887 | ||||
Transportation equipment | 66,215 | 65,741 | ||||||
Plant, machinery and equipment | 141,743 | 97,454 | ||||||
Leasehold improvements | 276,141 | 155,746 | ||||||
Subtotal | 527,295 | 361,828 | ||||||
Accumulated depreciation | (237,496 | ) | (222,360 | ) | ||||
Total | $ | 289,799 | $ | 139,468 |
Depreciation expense was $13,676 and $22,976 for the six months ended March 31, 2020 and 2019, respectively.
Note 7 — Short-term bank loans
Short-term bank loans consist of the following:
March 31, 2020 |
September 30, 2019 |
|||||||
(Unaudited) | ||||||||
Bank of China (Lishui Branch) (1) | $ | 1,269,900 | $ | 1,400,894 | ||||
Hangzhou United Rural Commercial Bank Co., Ltd. (2) | 564,400 | - | ||||||
Total | $ | 1,834,300 | $ | 1,400,894 |
(1) | The loan in the amount of RMB9 million (equivalent of approximately $1.27 million) from Bank of China (Lishui Branch), was facilitated on January 6, 2020 through Forest Food, a subsidiary of the Company, as working capital for six months, with the original maturity of July 6, 2020 at an annual effective interest rate of 3.98%. The loan was repaid in full upon maturity and re-issued to the Company at RMB10 million (equivalent of approximately $1.41 million) on July 9, 2020 as working capital for a year, with a new maturity date of July 7, 2021 at a lower annual interest rate of 3.95%. |
The loan is secured by the real property and land use right owned by Forasen Group Co., Ltd., a related party. The loan is also guaranteed by Zhejiang Tantech Bamboo Technology Co., Ltd., Zhejiang Lishui Xinyite Automation Technology Co., Ltd., Lishui Kaige Bearing Co., Ltd., and Zhejiang MeiFeng Tea Industry co., Ltd, three unrelated parties, as well as two principal officers of the Company.
(2) | The loan in the amount of RMB4 million (equivalent of approximately $0.56 million) from Hangzhou United Rural Commercial Bank Co., Ltd., was facilitated on November 13, 2019 through Suyuan Agriculture, a subsidiary of the Company, as working capital for one year, with the maturity date of November 12, 2020 at an annual effective interest rate of 6.09%. |
The loan is secured by an office property and land use right owned by Zhejiang Tantech Bamboo Technology Co., Ltd., a related party of the Company, of which valued at RMB6.85 million (equivalent of approximately $0.97 million).
Interest expenses amounted to $42,596 and $71,670 for the six months ended March 31, 2020 and 2019, respectively.
19 |
FARMMI, INC.
NOTES TO UNAUDITED CONDENSED CONSOLIDATED FINANCIAL STATEMENTS
Note 8 — Convertible notes payable and warrants
On November 1, 2018, the Company completed a $7.5 million private placement with an institutional investor (the “Buyer”). Pursuant to the Securities Purchase Agreement, dated as of November 1, 2018 (the “Securities Purchase Agreement”), the Company issued and sold to the Buyer an aggregate of $7.5 million of senior convertible notes due April 1, 2020 (the “Notes”) and warrants (the “Investor Warrants”) to purchase an aggregate of 800,000 of the Company’s Ordinary Shares. The Notes were initially convertible into 1,198,084 Ordinary Shares at the rate of $6.26 per Ordinary Share, which rate is subject to adjustment as referenced in the form of Notes. The Notes bear interest at 10% per year. The Investor Warrants are exercisable by the holder thereof at any time on or after November 1, 2018 and before November 1, 2022. One year from the date of issuance of the Investor Warrants, the Exercise Price of the Investor Warrants will be lowered to the then-current Market Price (as such term is defined in the Notes) of an Ordinary Share, if such Market Price is less than the initial Exercise Price of $6.53 per Ordinary Share.
On November 1, 2018, the Company issued warrants to purchase 10% of the shares placed under the Notes (initially 119,808) to the placement agent, at an exercise price of $7.183 per share (the “Placement Agent Warrants”). The Placement Agent Warrants have a term of four years and are subject to adjustment under certain events.
On March 10, 2020, the Company adjusted the warrant exercise price of the Investor Warrants and the Placement Agent Warrants to $2 per Ordinary Share according to the terms of these warrants.
At the time of issuance, the Company allocated the proceeds to the Notes and Investor Warrants based on their relative fair values, and evaluated the intrinsic value of the beneficial conversion feature (“BCF”) associated with the conversion feature of the Notes. The Investor Warrants and BCF were recorded into additional paid-in capital.
The Investor Warrants were treated as a discount on the Notes and were valued at $1,496,153. Additionally, the Notes were considered to have an embedded BCF because the effective conversion price was less than the fair value of the Company’s common stock on November 1, 2018. The value of the BCF was $670,618 and was also recorded as a discount on the Notes. Hence, in connection with the issuance of the Notes and the Investor Warrants, together with other issuance costs, the Company recorded a total debt discount of $3,206,932 that will be amortized over the term of the Notes. For the six-months ended March 31, 2020, a total of $1,093,440 in amortization of the debt discounts was recorded and charged to the interest expense and 3,306,428 Ordinary Shares were issued by the Company to the Buyer equaling principal and interests amounted to $2,272,625. As of March 31, 2020, the Notes balance was $1,879,688.
The fair value of the Investor Warrants and Placement Agent Warrants was computed using the Black-Scholes option-pricing model. Variables used in the option-pricing model include (1) risk-free interest rate of 2.94% at the date of grant, (2) expected warrant life of 4 years, (3) expected volatility of 72.57%, and (4) expected dividend yield of 0.
20 |
FARMMI, INC.
NOTES TO UNAUDITED CONDENSED CONSOLIDATED FINANCIAL STATEMENTS
Note 9 — Other current liabilities
Other current liabilities consisted of the following:
March 31, 2020 |
September 30, 2019 |
|||||||
(Unaudited) | ||||||||
Payroll payable | $ | 183,846 |
$ | 58,963 |
||||
Professional service fees payable | 145,023 | 137,484 | ||||||
Shipping expenses payable | 138,148 | 246,957 | ||||||
Marketing expenses payable | 107,744 | 1,401 | ||||||
Renovation cost payable | 59,456 |
- |
||||||
IT service fees payable | 25,614 | 377,477 | ||||||
Others | 7,020 |
43,471 |
||||||
Total | $ | 666,851 | $ | 865,753 |
Note 10 — Related party transactions
The relationship and the nature of related party transactions are summarized as follow:
Name of Related Party | Relationship to the Company | Nature of Transactions | ||
Forasen Group Co., Ltd. (“Forasen Group”) | Owned by the Chairman of Board of Directors | Provides guarantee for the Company’s bank loans; purchases from the Company; leases factory building to the Company | ||
Yefang Zhang | Chief Executive Officer (“CEO”) | Provides working capital loan; provides guarantee for the Company’s bank loans | ||
Zhengyu Wang | Chairman of Board of Directors | Provides guarantee for the Company’s bank loans |
Due from related parties consisted of the following:
March 31, 2020 |
September 30, 2019 |
|||||||
(Unaudited) | ||||||||
Forasen Group Co., Ltd | $ | 3,636,377 | $ | - | ||||
Total | $ | 3,636,377 | $ | - |
The due from related party is non-interest bearing and due on demand. As of the date of these unaudited condensed consolidated financial statements, the Company has fully collected the outstanding amount.
Due to related parties consisted of the following:
March 31, 2020 |
September 30, 2019 |
|||||||
(Unaudited) | ||||||||
Yefang Zhang | $ | 1,730,811 | $ | 2,652,882 | ||||
Zhengyu Wang | 39,409 | - | ||||||
Greater Kingan Range Forasen Energy Technology Co., Ltd | 678 | - | ||||||
Total | $ | 1,770,898 | $ | 2,652,882 |
As of March 31, 2020 and September 30, 2019, the balance of due to related parties mainly consisted of advances from the Company’s principal shareholder for working capital purposes during the Company’s normal course of business. These advances are non-interest bearing and due on demand.
21 |
FARMMI, INC.
NOTES TO UNAUDITED CONDENSED CONSOLIDATED FINANCIAL STATEMENTS
Note 10 — Related party transactions (Continued)
Sales to a related party
The Company periodically sells merchandise to its affiliates during the ordinary course of business. For the six months ended March 31, 2020 and 2019, the Company recorded sales to Forasen Group of $6,015 and $1,783, respectively.
Operating lease from a related party
In October 2009, the Company entered into a lease agreement with Forasen Group for leasing the factory building located in the suburban area of Lishui City, Zhejiang Province. The lease term was 10 years with monthly rent of RMB 22,400 (equivalent of $3,257). The lease agreement was renewed in October 2019 for another 10 years with the same monthly rent.
Guarantees provided by related parties
The Company’s related parties provide guarantees for the Company’s short-term bank loans (see Note 7).
22 |
FARMMI, INC.
NOTES TO UNAUDITED CONDENSED CONSOLIDATED FINANCIAL STATEMENTS
Note 11 – Equity
Conversion of convertible notes
As disclosed in Note 8, during the six-months ended September 30, 2019, the Company issued total of 3,306,428 Ordinary Shares to the Buyer equaling principal and interests amounted to $2,272,625 of the convertible notes.
Additional paid-in capital
As disclosed in Note 8, on November 1, 2018, the Company issued and sold an aggregate of $7.5 million of senior convertible notes due April 1, 2020 and warrants to purchase an aggregate of 800,000 of its Ordinary Shares. In addition, the Company also issued warrants to purchase 10% of the shares placed under the Notes (initially 119,808) to the placement agent.
The Company evaluated the intrinsic value of the BCF, the relative fair value of the Investor Warrants and Placement Agent Warrants on their date of grant, which was determined to be $670,618, $1,496,153 and $323,843, respectively, and they were recorded as additional paid-in capital.
Statutory Reserve
The Company is required to make appropriations to reserve funds, comprising the statutory surplus reserve and discretionary surplus reserve, based on after-tax net income determined in accordance with generally accepted accounting principles of the PRC (“PRC GAAP”).
Appropriations to the statutory surplus reserve are required to be at least 10% of the after tax net income determined in accordance with PRC GAAP until the reserve is equal to 50% of the entities’ registered capital. Appropriations to the discretionary surplus reserve are made at the discretion of the Board of Directors. As of March 31, 2020 and September 30, 2019, the balance of the required statutory reserves was $597,528.
Non-controlling interest
The Company’s non-controlling interest consists of the following:
March 31, 2020 | September 30, 2019 | |||||||
(Unaudited) | ||||||||
Paid-in capital | $ | 107,461 | $ | 107,461 | ||||
Additional paid-in capital | 807,953 | 807,953 | ||||||
Foreign currency translation loss attributed to non-controlling interest | (68,873 | ) | (74,997 | ) | ||||
Net loss attributed to non-controlling interest | (8,124 | ) | (1,369 | ) | ||||
Total non-controlling interest | $ | 838,417 | $ | 839,048 |
23 |
FARMMI, INC.
NOTES TO UNAUDITED CONDENSED CONSOLIDATED FINANCIAL STATEMENTS
Note 12 — Taxes
Corporation Income Tax (“CIT”)
The Company is subject to income taxes on an entity basis on income derived from the location in which each entity is domiciled.
FMI is incorporated in the Cayman Islands as an offshore holding company and is not subject to tax on income or capital gain under the laws of the Cayman Islands.
Farmmi International is incorporated in Hong Kong as a holding company with no activities. Under the Hong Kong tax laws, an entity is not subject to income tax if no revenue is generated in Hong Kong.
In China the Corporate Income Tax Law generally applies an income tax rate of 25% to all enterprises. FLS Mushroom, Nongyuan Network, Farmmi Enterprise and Farmmi Technology are registered in PRC and are all subject to corporate income tax at a statutory rate of 25% on net income reported after certain tax adjustments. Forest Food, Farmmi Food, Nongyuan Network and Farmmi E-Commerce are approved by local government as small-scaled minimal profit enterprises. Once an enterprise meets certain requirements and is identified as a small-scale minimal profit enterprise, the part of its taxable income not more than RMB1 million is subject to a reduced rate of 5% and the part between RMB1 million and 3 million is subject to a reduced rate of 10%. Forest Food, Farmmi Food, FLS Mushroom and Nongyuan Network are entities with primary operating activities. Suyuan Agriculture, Farmmi Enterprise and Farmmi Technology are holding companies with no activities.
Under the Enterprise Income Tax (“EIT”) Law of PRC, domestic enterprises and foreign investment enterprises are usually subject to a unified 25% enterprise income tax rate while preferential tax rates, tax holidays and even tax exemption may be granted on a case-by-case basis. EIT is typically governed by the local tax authority in China. Each local tax authority at times may grant tax holidays to local enterprises as a way to encourage entrepreneurship and stimulate local economy. In April 2016, and January 2019, FLS Mushroom and Farmmi Food received a temporary income tax break from the local tax authority of Lishui City. Net income of $1.69 million and $1.50 million were exempt from income tax for the six months ended March 31, 2020 and 2019, respectively. The estimated tax savings as the result of the tax break for the six months ended March 31, 2020 and 2019 amounted to $421,450 and $373,043, respectively. Per share effect of the tax exemption were $0.03 and $0.03 for the six months ended March 31, 2020 and 2019, respectively.
24 |
FARMMI, INC.
NOTES TO UNAUDITED CONDENSED CONSOLIDATED FINANCIAL STATEMENTS
Note 12 — Taxes (Continued)
Corporation Income Tax (“CIT”) (Continued)
The following table reconciles PRC statutory rates to the Company’s effective tax rates for the six months ended March 31, 2020 and 2019:
For the six months ended March 31, |
||||||||
2020 | 2019 | |||||||
Statutory PRC income tax rate | 25.00 | % | 25.00 | % | ||||
Effect of income tax holiday | (31.11 | )% | (25.93 | )% | ||||
Favorable tax rate impact (a) | 0.10 | % | 1.43 | % | ||||
Permanent difference | 0.00 | % | 0.22 | % | ||||
Changes of deferred tax assets valuation allowances | 7.70 | % | 1.22 | % | ||||
Non-PRC entities not subject to PRC income tax | (62.57 | )% | (21.39 | )% | ||||
Total | (60.88 | )% | (19.45 | )% |
(a) | Forest Food, Farmmi Food, Nongyuan Network and Farmmi E-Commerce are subject to corporate income tax at a reduced rate of 5% as approved by local government as small-scaled minimal profit enterprises. |
The provision for income tax consists of the following:
For the six months ended March 31, |
|||||||||
2020 | 2019 | ||||||||
(Unaudited) | (Unaudited) | ||||||||
Current | $ | 24,144 | $ | 27,860 | |||||
Deferred | - | - | |||||||
Total | $ | 24,144 | $ | 27,860 |
25 |
FARMMI, INC.
NOTES TO UNAUDITED CONDENSED CONSOLIDATED FINANCIAL STATEMENTS
Note 12 — Taxes (Continued)
Corporation Income Tax (“CIT”) (Continued)
Components of deferred tax assets are as follows:
March 31, 2020 | September 30, 2019 | |||||||
(Unaudited) | ||||||||
Net operating loss carryforwards | $ | 181,681 | $ | 142,395 | ||||
Valuation allowance | (181,681 | ) | (142,395 | ) | ||||
Total | $ | - | $ | - |
The deferred tax expense (benefit) is the change of deferred tax assets and deferred tax liabilities resulting from the temporary difference between tax and U.S. GAAP. Forest Food had a cumulative net operating loss of approximately $727,000 and $570,000, respectively, as of March 31, 2020 and September 30, 2019, which may be available to reduce future taxable income. Deferred tax assets were primarily the result of these net operating losses.
26 |
FARMMI, INC.
NOTES TO UNAUDITED CONDENSED CONSOLIDATED FINANCIAL STATEMENTS
Note 12 — Taxes (Continued)
Corporation Income Tax (“CIT”) (Continued)
As of each reporting date, management considers evidence, both positive and negative, that could affect its view of the future realization of deferred tax assets. On the basis of this evaluation, a full valuation allowance of $181,681 was recorded against the gross deferred tax asset balance at March 31, 2020. The amount of the deferred tax asset is considered unrealizable because it is more likely than not that Forest Food will not generate sufficient future taxable income to utilize the net operating loss.
Note 13 — Concentration of major customers and suppliers
For the six months ended March 31, 2020 and 2019, one major customer accounted for approximately 45% and 66% of the Company’s total sales, respectively. Any decrease in sales to this major customer may negatively impact the Company’s operations and cash flows if the Company fails to increase its sales to other customers.
As of March 31, 2020 and September 30, 2019, one major customer accounted for approximately 93% and 82% of the Company’s accounts receivable balance, respectively.
For the six months ended March 31, 2020, two major suppliers accounted for approximately 56% and 25% of the total purchases, respectively. For the six months ended March 31, 2019, three major suppliers accounted for approximately 41%, 28% and 17% of the total purchases, respectively. A loss of either of these suppliers could have a negative effect on the operations of the Company.
As of March 31, 2020, two major suppliers accounted for approximately 56% and 38% of the Company’s advances to supplier balances, respectively. As of September 30, 2019, two major suppliers accounted for approximately 53% and 46% of the Company’s advances to supplier balances, respectively.
27 |
FARMMI, INC.
NOTES TO UNAUDITED CONDENSED CONSOLIDATED FINANCIAL STATEMENTS
Note 14 — Lease
Effective October 1, 2019, the Company adopted the new lease accounting standard Accounting Standards Update (ASU) No. 2016-02, Leases (Topic 842) using the alternative transition approach which allowed the Company to continue to apply the guidance under the lease standard in effect at the time in the comparative periods presented. Adoption of this standard resulted in the recording of operating lease right-of-use assets and corresponding operating lease liabilities of $300,095 and $314,355, respectively, as of March 31, 2020 with no impact on retained earnings. Financial position for reporting periods beginning on or after October 1, 2019, are presented under the new guidance, while prior period amounts are not adjusted and continue to be reported in accordance with previous guidance.
As of March 31, 2020, the remaining lease term was nine-and-a-half years. The Company’s lease agreements do not provide a readily determinable implicit rate nor is it available to the Company from its lessors. Instead, the Company estimates its incremental borrowing rate based on the benchmark lending rate for one-year loan as published by China’s central bank in order to discount lease payments to present value. The discount rate of the Company’s operating leases was 4.0%, as of March 31, 2020.
Supplemental balance sheet information related to operating leases was as follows:
As of March 31, 2020 |
||||
(Unaudited) | ||||
Operating lease right-of-use assets | $ | 314,200 | ||
Operating lease right-of-use assets – accumulated amortization | (14,105 | ) | ||
Operating lease right-of-use assets – net | $ | 300,095 | ||
Operating lease liabilities, current | $ | 55,491 | ||
Operating lease liabilities, non-current | 258,864 | |||
Total operating lease liabilities | $ | 314,355 |
As of March 31, 2020, maturities of operating lease liabilities were as follows:
Twelve months ending March 31, | As of March 31, 2020 | |||
2021 | $ | 56,892 | ||
2022 | 37,928 | |||
2023 | 37,928 | |||
2024 | 37,928 | |||
2025 | 37,928 | |||
2026 | 37,928 | |||
2027 | 37,928 | |||
2028 | 37,928 | |||
2029 | 37,928 | |||
2030 | 18,961 | |||
Total future minimum lease payments | 379,277 | |||
Less: Imputed interest | (64,922 | ) | ||
Total | $ | 314,355 |
28 |
FARMMI, INC.
NOTES TO UNAUDITED CONDENSED CONSOLIDATED FINANCIAL STATEMENTS
Note 15 — Segment reporting
ASC 280, “Segment Reporting”, establishes standards for reporting information about operating segments on a basis consistent with the Company’s internal organizational structure as well as information about geographical areas, business segments and major customers in financial statements for details on the Company’s business segments.
The Company uses the “management approach” in determining reportable operating segments. The management approach considers the internal organization and reporting used by the Company’s chief operating decision maker for making operating decisions and assessing performance as the source for determining the Company’s reportable segments. The Company currently has three main products from which revenue is earned and expenses are incurred: Shiitake Mushroom, Mu Er Mushroom and other edible fungi and other agricultural products. The operations of these product categories have similar economic characteristics. In particular, the Company uses the same or similar production processes; sells to the same or similar type of customers and uses the same or similar methods to distribute these products. The resources required by these products share high similarity. Switching cost between different products is minimal. Production is primarily determined by sales orders received and market trend. Therefore, management, including the chief operating decision maker, primarily relies on the revenue data of different products in allocating resources and assessing performance. Based on management’s assessment, the Company has determined that it has only one operating segment and therefore one reportable segment as defined by ASC.
The following table presents revenue by major product categories (from third parties and related party) for the six months ended March 31, 2020 and 2019, respectively:
For the six months ended March 31, |
||||||||
2020 | 2019 | |||||||
Shiitake Mushrooms | $ | 7,346,174 | $ | 8,346,344 | ||||
Mu Er | 5,762,752 | 5,167,414 | ||||||
Other edible fungi and other agricultural products | 471,857 | 874,429 | ||||||
Total | $ | 13,580,782 | $ | 14,388,187 |
All of the Company’s long-lived assets are located in PRC. Majority of the Company’s products are sold in China. Geographic information about the revenues, which are classified based on customers, is set out as follows:
For the six months ended March 31, |
||||||||
2020 | 2019 | |||||||
Revenue from China | $ | 13,086,183 | $ | 12,887,262 | ||||
Revenue from other countries | 494,599 | 1,500,925 | ||||||
Total | $ | 13,580,782 | $ | 14,388,187 |
29 |
FARMMI, INC.
NOTES TO UNAUDITED CONDENSED CONSOLIDATED FINANCIAL STATEMENTS
Note 16 — Subsequent event
In December 2019, a novel strain of coronavirus (“COVID-19”) was identified in Wuhan, China. On March 11, 2020, the World Health Organization declared COVID-19 a pandemic—the first pandemic caused by a coronavirus. The outbreak has reached more than 160 countries, resulting in the implementation of significant governmental measures, including lockdowns, closures, quarantines, and travel bans, intended to control the spread of the virus. The Chinese government has ordered quarantines, travel restrictions, and the temporary closure of stores and facilities. Companies are also taking precautions, such as requiring employees to work remotely, imposing travel restrictions and temporarily closing businesses.
Because of the shelter-in-place orders and travel restrictions mandated by the Chinese government, the production and sales activities of the Company stopped during the end of January and February 2020, which adversely impacted the Company’s production and sales during that period. Although the production and sales have resumed at the end of March 2020, if COVID-19 further impacts its production and sales, the Company’s financial condition, results of operations, and cash flows could continue to be adversely affected.
Consequently, the COVID-19 outbreak may materially adversely affect the Company’s business operations and condition and operating results for 2020, including but not limited to material negative impact on its total revenue, slower collection of accounts receivables, and additional allowance for doubtful accounts, and inventory allowance. The Company will continue to monitor and modify the operating strategies. Management does not expect a continued decline in sales in long term based on the existing sale orders.
On July 9, 2020, the short-term loan borrowed from Bank of China (Lishui Branch) was repaid in full upon maturity and re-issued to the Company at RMB10 million (equivalent of approximately $1.41 million) as working capital for a year, with a new maturity date of July 7, 2021 at an annual interest rate of 3.95%.
On September 12, 2020, the authorized share capital of the Company was increased from US$20,000 divided into 20,000,000 ordinary shares of US$0.001 par value each to US$200,000 divided into 200,000,000 ordinary shares of US$0.001 par value each.
30 |
Exhibit 99.2
MANAGEMENT’S DISCUSSION AND ANALYSIS OF FINANCIAL CONDITION AND RESULTS OF OPERATIONS
The following discussion and analysis of our company’s financial condition and results of operations should be read in conjunction with our consolidated financial statements and the related notes included elsewhere in this report. This discussion contains forward-looking statements that involve risks and uncertainties. Actual results and the timing of selected events could differ materially from those anticipated in these forward-looking statements as a result of various factors.
SPECIAL NOTE REGARDING FORWARD-LOOKING STATEMENTS
This report contains forward-looking statements. All statements contained in this report other than statements of historical fact, including statements regarding our future results of operations and financial position, our business strategy and plans, and our objectives for future operations, are forward-looking statements. The words “believe,” “may,” “will,” “estimate,” “continue,” “anticipate,” “intend,” “expect,” and similar expressions are intended to identify forward-looking statements. We have based these forward-looking statements largely on our current expectations and projections about future events and trends that we believe may affect our financial condition, results of operations, business strategy, short-term and long-term business operations and objectives, and financial needs. These forward-looking statements are subject to a number of risks, uncertainties and assumptions, including those described in the “Risk Factors” section. Moreover, we operate in a very competitive and rapidly changing environment. New risks emerge from time to time. It is not possible for our management to predict all risks, nor can we assess the impact of all factors on our business or the extent to which any factor, or combination of factors, may cause actual results to differ materially from those contained in any forward-looking statements we may make. In light of these risks, uncertainties and assumptions, the future events and trends discussed in this report may not occur and actual results could differ materially and adversely from those anticipated or implied in the forward-looking statements.
Business Overview
We currently produce and/or sell the following categories of agricultural products: Shiitake mushrooms, Mu Er mushrooms, other edible fungi and other agricultural products. We do not grow fungi, but purchase dried edible fungi from third party suppliers, mainly from family farms, and two co-operatives representing family farms, Jingning Liannong Trading Co. Ltd. (“JLT”) and Qingyuan Nongbang Mushroom Industry Co., Ltd. (“QNMI”), with whom we have worked with for many years. JLT and QNMI are two companies in Lishui area where our facilities are located. They are co-operatives representing family farms which plant and provide edible fungi. JLT and QNMI themselves do not have any facilities and do not process any fungi. They are established to share resources such as procurement information and to enjoy the advantage of economy of scale. After we select and filter the dried edible fungi for specific size and quality from our suppliers, we may further dehydrate them again, as deemed necessary, to ensure the uniform level of dryness of our products. We then package the fungi products for sale. The only products we process and package are edible fungi, which are processed and packaged at our own processing facilities. For other agricultural products, such as rice and edible oil, we purchase them from third-party suppliers, and sell these products at our online store Farmmi Liangpin Market. Mainly through distributors, we offer gourmet dried mushrooms to domestic and overseas retail supermarkets, produce distributors and foodservice distributors and operators. We have become an enterprise with advanced processing equipment and business management experience, and we pride ourselves on consistently producing quality mushrooms and serving our customers with a high level of commitment.
Currently, we estimate that approximately 93% of our products are sold in China to domestic distributors and the remaining 7% are sold internationally, including USA, Japan, Canada and other countries, through distributors. In addition, in order to enhance our e-commerce marketing presence, we developed our own e-commerce websites www.farmmi.com and www.farmmi88.com. We are also testing a few offline stores in Hangzhou to expand our brand presence and grow revenue.
Growth Strategy
Increasing our market share — the premium quality of our products has been long recognized by our customers. People’s increasing awareness of healthy dietary will likely lead to increased demand of our products. Our development plan mainly focuses on developing high-quality agricultural products market. Through our continued efforts of building e-commerce platform, expansion to international market, and building stable relationship with suppliers, we expect to expand our product lines and improve our brand awareness and customer loyalty, to meet the demands of market and customers, and improve our sales performance.
Expansion of our sources of supply, productivity and sales network — to meet the increasing demand, we emphasize cooperation with major suppliers as well as small family farms to ensure the quantity and quality of raw materials. While expanding supply resource, we also plan to increase our processing capability and upgrade production facilities to increase productivity. In addition to our present sales network, we intend to invest more in our online stores, continue to train our employees, upgrade relevant information technology and supply chain system, with the goal of making an integrated sales network with an international approach.
Securing high quality raw materials with competitive price — to meet the increasing demand for our products, we have been increasing our cooperation with major suppliers, with whom we have been working together for many years, to secure the quality and quantity of our raw materials. We also have dedicated teams that constantly visit and communicate with the family farm suppliers, to monitor the quality and quantity of raw materials. By working closely with our suppliers throughout the planting seasons, we have been providing such suppliers technical support to secure the stable supply of our raw materials. With our deep understanding of the edible fungi market, we have been able to purchase raw materials of premium quality at favorable prices. Edible fungi can be stored for a long time after simple processing, therefore we have been purchasing edible fungi when we expect their purchase price to increase, and store them to fulfill future sales orders. This strategy has been proven effective and will continue to be used by us as a cost control method.
Factors Affecting Our Results of Operations
Government Policy May Impact our Business and Operating Results
We have not seen any impact of unfavorable government policy upon our business in recent years. However, our business and operating results will be affected by China’s overall economic growth and government policies. Unfavorable changes in government policies could affect the demand for our products and could materially and adversely affect our results of operations. Our edible fungi products are currently eligible for certain favorable government tax incentive and other incentives, any future changes in the government’s policy upon edible fungi industry may have a negative effect on our operations.
2 |
Price Inelasticity of Raw Materials May Reduce Our Profit
As a processor of edible fungi, we rely on a continuous and stable supply of edible fungi raw materials to ensure our operation and expansion. The price of edible fungi may be inelastic when we wish to purchase supplies, resulting in an increase in raw material prices and thus reduce our profit. In addition, although we compete primarily the high-end market which puts more emphasize on the flavor, texture and quality of our products, we risk losing customers by increasing our selling prices.
Competition in Edible Fungi Industry
Although we have a lot of competitive advantages, such as premium product quality, stable and experienced factory employees, favorable production locations within proximity of significant mushroom planting bases and strong relationships with our significant suppliers, we face a series of challenges.
Our products face competition from a number of companies operating in the vicinity. One of the largest competitors has high sales volume, which enables this competitor to purchase and sell edible fungi at a relatively lower price. Another major competitor has much larger plants and warehouses than we have and its main product is Mu Er mushrooms with different sorts and qualities. Competition from these two major competitors may prevent us from increasing our revenue.
On the other hand, although we believe we distinguish our Company from competitors on the basis of product quality, the edible fungi industry is fragmented and subject to relatively low barriers of entry. Many of our competitors can provide products at relatively lower prices to increase their supplies which may affect our profit margins as we seek to compete with them.
At last, we have devoted significant resources to build and develop our online stores, Farmmi Jicai and Farmmi Liangpin Market. We plan to expand these two online stores. While this strategy may offer new opportunities to our Company, it is also a new venture and is impacted by many other factors. Farmmi Jicai and Farmmi Liangpin Market are not well known by consumers yet, and we do not have rich experience in e-commerce operation. As a result, we have no guarantee that we will be successful in this new expansion. If we do not manage our expansion effectively, our business prospects could be impaired.
Economy and Politics
Our results of operations have been adversely affected, to the extent that the COVID-19 or any other epidemic harms the Chinese and global economy in general. Any potential impact to our results will depend on, to a large extent, future developments and new information that may emerge regarding the duration and severity of the COVID-19 and the actions taken by government authorities and other entities to contain the COVID-19 or treat its impact, almost all of which are beyond our control.
Our ability to be successful in China depends in part on our awareness of trends in politics that may affect our company, including, for example, government initiatives that would either encourage or discourage programs and companies that produce healthy foods or efforts to increase export of agricultural products. In addition, we must be aware of political situations in destination countries of our products, particularly if such countries take action to stifle importation of food products from abroad.
3 |
Trend Information
We have noted the existence of the following trends since October 2019, all of which are likely to affect our business to the extent they continue in the future:
China’s edible fungi industry is growing, both in absolute terms and in market share.
Through its development of enoki mushroom industrialization technology in the 1960s, Japan became the world leader in mushroom farming. As other countries’ fungi farming technology improved, China began to supplant Japan and now became the largest worldwide edible mushroom producer. China’s growth has outpaced worldwide production growth rates. While China’s growth rates in the past much higher than world growth rates, it appears to be moving from rapid expansion to a more mature industry. As China’s mushroom industry is moving from rapid expansion to a more mature stage, we expect the effect of industry growth on promoting our sales volume will decrease.
The COVID-19 has had a significant impact on our operations since January 2020 and could adversely affect our business and financial results for the remaining months of the 2020 fiscal year.
Our sales volume of Shiitake mushroom for the six months ended March 31, 2020 was approximately 591 tons. This number represents a decrease of 71 tons compared with 662 tons sales volume for the same period of fiscal 2019. In the meanwhile, our sales volume of Mu Er for the six months ended March 31, 2020 was approximately 476 tons. This number represents an increase of 57 tons compared with 476 tons sales volume for the same period of fiscal 2019. On an overall basis, our sales volume of Shiitake mushroom and Mu Er was 1,067 tons for the six months ended March 31, 2020, a decrease of 14 tons as compared with 1,081 tons sales volume for the same period of fiscal 2019. The decreased sales of Shiitake mushroom and Mu Er was primarily due to the reduced economic activities caused by the pandemic of COVID-19. We expect such decrease should be temporary, and the sales may recover in the near future upon resumption and increase in economic activities as the spread of the disease has gradually been under control in China. However, COVID-19 could still adversely affect our business and financial results for the remaining months of fiscal year 2020. Although we do not expect a continued decline in sales in long term, the extent of the impact of COVID-19 on the our results of operations and financial condition will depend on future developments, including the duration and spread of the outbreak and the impact on our customers, which are still uncertain and cannot be reasonably estimated at this point of time.
4 |
Our aggregate employee salaries have been decreasing.
During the period of October 2019 to July 2020, our monthly salary expense was as follows:
The decrease in monthly employee salaries of January was mainly due to the Chinese New Year Holiday, when some employees took extended unpaid leaves during the holiday period. The decrease in monthly employee salaries of February and March was mainly due to the lock-down, travel restrictions and quarantine imposed by the Chinese government as a result of the COVID-19 pandemic. Monthly salaries after March decreased due mainly to reduction of sales volume as a major portion of salaries are commissions directly related to sales volume.
Raw material costs have been on the downward trends.
With our deep understanding of the edible fungi market, constant market research, and communication with our suppliers, we have been able to obtain favorable price for premium raw materials. With increased sales orders we receive, we need to purchase additional raw materials to meet the new demand. We expect the raw material costs in fiscal year 2020 will be decreasing, fluctuating between 1% and 5% comparing with fiscal year 2019.
5 |
During the period from October 2018 to July 2020, the average monthly unit price per ton for Shiitake and Mu Er we purchased were as follows:
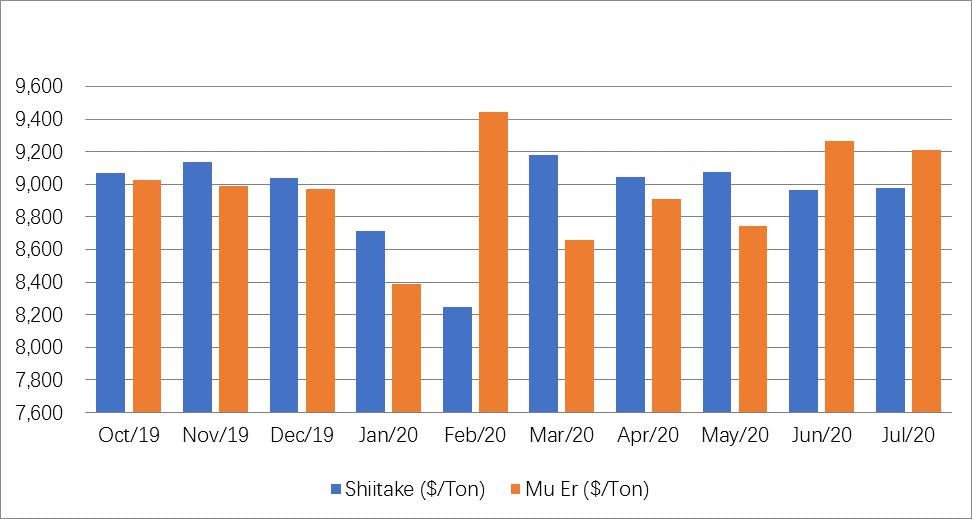
We anticipate that for fiscal year 2020, the average unit price of Shiitake and Mu Er we purchase will be about $9,214 per ton and $9,285 per ton, respectively. We expect our gross margin will be slightly lower in fiscal year 2020 than in fiscal year 2019.
We expect the agriculture industry in China to become increasingly reliant on Internet sales.
Government initiatives such as the concept of “Internet+” articulated by Premier Li Keqiang beginning in 2015, reflect the government’s push to incorporate Internet and other information technology in conventional industries. One of the specific applications of this concept has been “Internet + Agriculture”, which reflects the increased use of technology both in the growing and sales sides of farming.
In addition, we have seen shifts of Chinese consumers to purchase products — including food products like ours — online. We have been building our online store Farmmi Liangpin Market (now called Farmmi Jicai) in response to this trend, and this online store mainly targets on small wholesale clients, such as restaurants and retailers. Since its launch in December 2016, our online sales have been increasing rapidly. In September 2018, we started another Farmmi Liangpin Market online store, which mainly facing individual customers and started to generate revenue since October 2018. Besides selling edible mushrooms, this store also sells other agricultural products, such as rice, edible oil and other local specialty food products from different provinces of China.
6 |
During the six months ended March 31, 2020, our online sales accounted for 14.75% of our total sales. For the six months ended March 31, 2020, our aggregate online sales were $2,002,500, a decrease by 35.37% compared with online sales for the same period in 2019, and the average monthly online sales were $333,750. The following chart shows our online sales for each month from October 2019 to August 2020:
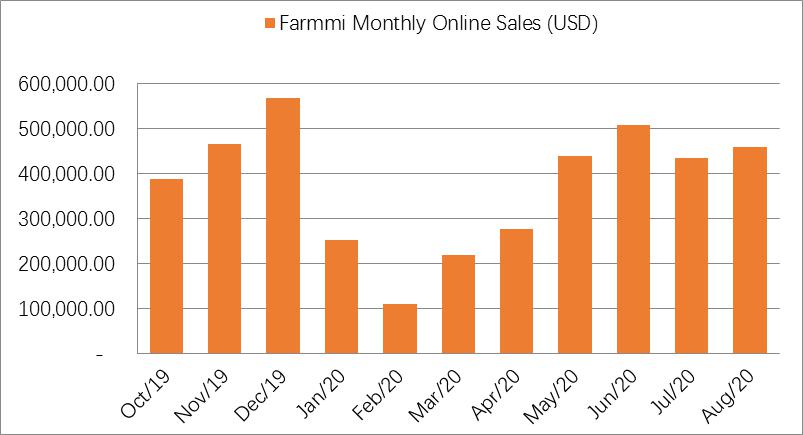
The online sales during the six months ended March 31, 2020 decreased as compared to the same period of last year. The significant decrease in monthly online sales from January 2020 to March 2020 was mainly attributable to the reduced economic activities due to the lockdown and travel restriction imposed by the Chinese government as a result of the COVID-19 pandemic.
Increased sales to China Forest.
China Forest, one of the biggest edible fungi exporters in China, has been one of our major customers since 2016. Our sales to China Forest for the six months ended March 31, 2020 totaled $10,409,681, an increase of 10.44% from $9,425,737 for the same period in 2019, mainly due to the increased sales volume of Mu Er. Our sales of Mu Er to China Forest for the six months ended March 31, 2020 were 421 tons, an increase of 28.29% from 328 tons for the same period in 2019. However, our sales of Shiitake mushroom to China Forest for the six months ended March 31, 2020 totaled 439 tons, a decrease of 2.12% from 448 tons for the same period in 2019.
7 |
Critical Accounting Policies and Estimates
The preparation of financial statements in conformity with U.S. generally accepted accounting principles requires the use of estimates and assumptions that affect the reported amounts of assets and liabilities, revenues and expenses, and related disclosures in the financial statements. Critical accounting policies are those accounting policies that may be material due to the levels of subjectivity and judgment necessary to account for highly uncertain matters or the susceptibility of such matters to change, and that have a material impact on financial condition or operating performance. While we base our estimates and judgments on our experience and on various other factors that we believe to be reasonable under the circumstances, actual results may differ from these estimates under different assumptions or conditions. We believe the following critical accounting policies used in the preparation of our financial statements require significant judgments and estimates. For additional information relating to these and other accounting policies, see Note 2 to our unaudited condensed consolidated financial statements included elsewhere in this report.
Use of Estimates
In preparing the consolidated financial statements in conformity with US GAAP, management makes estimates and assumptions that affect the reported amounts of assets and liabilities and disclosures of contingent assets and liabilities at the dates of the consolidated financial statements, as well as the reported amounts of revenues and expenses during the reporting year. Significant items subject to such estimates and assumptions include the useful lives of property, plant and equipment; allowances pertaining to the allowance for doubtful accounts and advances to suppliers; the valuation of inventories; the valuation of beneficial conversion feature of the convertible notes; and the valuation of deferred tax assets.
Revenue Recognition
We recognized revenue following Accounting Standards Update (“ASU”) 2014-09 Revenue from Contracts with Customers (“ASC Topic 606”). In accordance with ASC 606, to determine revenue recognition for contracts with customers, we perform the following five steps: (i) identify the contract(s) with the customer, (ii) identify the performance obligations in the contract, (iii) determine the transaction price, including variable consideration to the extent that it is probable that a significant future reversal will not occur, (iv) allocate the transaction price to the respective performance obligations in the contract, and (v) recognize revenue when (or as) the Company satisfies the performance obligation.
We recognize revenue when we transfer our goods and services to customers in an amount that reflects the consideration to which we expect to be entitled in such exchange. All of our contracts have a single performance obligation satisfied at a point in time and the transaction price is stated in the contract, usually as a price per ton. We evaluate whether it is appropriate to record the gross amount of product sales and related costs or the net amount earned as commissions. In accordance with ASC 606, when we act as a principal, that we obtain control of the specified goods before they are transferred to the customers, the revenues should be recognized in the gross amount of consideration to which it expects to be entitled in exchange for the specified goods transferred.
The contract liabilities are recorded on the unaudited condensed consolidated balance sheets as advances from customers as of March 31, 2020 and September 30, 2019. For the six months ended March 31, 2020 and 2019, there was no revenue recognized from performance obligations related to prior periods.
We do not have any contract assets since revenue is recognized when control of the promised goods is transferred and the payment from customers is not contingent on a future event.
Refer to Note 15 — Segment reporting for details of revenue segregation of our Unaudited Condensed Consolidated Financial Statements.
Accounts Receivable
Accounts receivable are presented net of allowance for doubtful accounts. We maintain allowance for doubtful accounts for estimated losses. We review our accounts receivable on a periodic basis and make general and specific allowances when there is doubt as to the collectability of individual balances. In evaluating the collectability of individual receivable balances, we consider various factors, including the age of the balance, customer’s payment history, its current credit-worthiness and current economic trends. Accounts are written off after efforts at collection prove unsuccessful. As of March 31, 2020 and September 30, 2019, no allowance for doubtful accounts was recorded because all accounts receivable are fully realizable.
Inventory, net
We value our inventory at the lower of cost, determined on a weighted average basis, or net realizable value. We review our inventory periodically to determine if any reserves are necessary for potential obsolescence or if the carrying value exceeds net realizable value. We recorded inventory reserve of $223,037 and nil as of March 31, 2020 and September 30, 2019, respectively.
8 |
Recent accounting pronouncements
In June 2016, the FASB issued Accounting Standards Update (“ASU”) 2016-13, Financial Instruments-Credit Losses (Topic 326), which requires entities to measure all expected credit losses for financial assets held at the reporting date based on historical experience, current conditions, and reasonable and supportable forecasts. This replaces the existing incurred loss model and is applicable to the measurement of credit losses on financial assets measured at amortized cost. ASU 2016-13 was subsequently amended by Accounting Standards Update 2018-19, Codification Improvements to Topic 326, Financial Instruments — Credit Losses, Accounting Standards Update 2019-04 Codification Improvements to Topic 326, Financial Instruments — Credit Losses, Topic 815, Derivatives and Hedging, and Topic 825, Financial Instruments, and Accounting Standards Update 2019-05, Targeted Transition Relief. For public entities, ASU 2016-13 and its amendments is effective for fiscal years, and interim periods within those fiscal years, beginning after December 15, 2019. For all other entities, this guidance and its amendments will be effective for fiscal years beginning after December 15, 2022, including interim periods within those fiscal years. As an emerging growth company, we plan to adopt this guidance effective October 1, 2023. We are currently evaluating the impact of our pending adoption of ASU 2016-13 on our consolidated financial statements.
In August 2018, the FASB Accounting Standards Board issued ASU No. 2018-13, “Fair Value Measurement (Topic 820): Disclosure Framework Changes to the Disclosure Requirements for Fair Value Measurement” (“ASU 2018-13”). ASU 2018-13 modifies the disclosure requirements on fair value measurements. ASU 2018-13 is effective for all entities for fiscal years and interim periods within those fiscal years beginning after December 15, 2019, with early adoption permitted for any removed or modified disclosures. The removed and modified disclosures will be adopted on a retrospective basis and the new disclosures will be adopted on a prospective basis. The Company will adopt this guidance effective October 1, 2020. The Company is currently evaluating the impact of its pending adoption of this guidance on its consolidated financial statements but does not expect this guidance will have a material impact on its consolidated financial statements.
In December 2019, the FASB issued ASU No. 2019-12, Income Taxes (Topic 740)—Simplifying the Accounting for Income Taxes. ASU 2019-12 is intended to simplify accounting for income taxes. It removes certain exceptions to the general principles in Topic 740 and amends existing guidance to improve consistent application. ASU 2019-12 is effective for fiscal years beginning after December 15, 2020 and interim periods within those fiscal years, with early adoption permitted. The Company will adopt this guidance effective October 1, 2021. The Company is currently evaluating the impact of its pending adoption of this guidance on its consolidated financial statements but does not expect this guidance will have a material impact on its consolidated financial statements.
In February 2020, the FASB issued ASU 2020-02, “Financial Instruments – Credit Losses (Topic 326) and Leases (topic 842) Amendments to SEC Paragraphs Pursuant to SEC Staff Accounting Bulletin No. 119 and Update to SEC Section on Effective Date Related to Accounting Standards Update No. 2016-02, Leases (topic 842)”. This ASU provides guidance regarding methodologies, documentation, and internal controls related to expected credit losses. This ASU is effective for interim and annual periods beginning after December 15, 2019, and early adoption is permitted. The Company will adopt this guidance effective October 1, 2020. The Company is currently evaluating the impact of its pending adoption of this guidance on its consolidated financial statements but does not expect this guidance will have a material impact on its consolidated financial statements.
The Company does not believe other recently issued but not yet effective accounting standards, if currently adopted, would have a material effect on the unaudited condensed consolidated financial position, statements of operations and cash flows.
9 |
Results of Operations for the Six Months Ended March 31, 2020 and 2019
Overview
The following table summarizes our results of operations for the six months ended March 31, 2020 and 2019:
Six Months Ended March 31, | Variance | |||||||||||||||
2020 | 2019 | Amount | % | |||||||||||||
Revenue | $ | 13,580,782 | $ | 14,388,187 | $ | (807,405 | ) | (5.61 | )% | |||||||
Cost of revenues | (11,470,717 | ) | (11,845,025 | ) | (374,308 | ) | (3.16 | )% | ||||||||
Gross profit | 2,110,065 | 2,543,162 | (433,097 | ) | (17.03 | )% | ||||||||||
Selling and distribution expenses | (142,382 | ) | (281,213 | ) | (138,831 | ) | (49.37 | )% | ||||||||
General and administrative expenses | (828,414 | ) | (876,746 | ) | (48,332 | ) | (5.51 | )% | ||||||||
Income from operations | 1,139,269 | 1,385,203 | (245,934 | ) | (17.75 | )% | ||||||||||
Interest income | 141 | 451 | (310 | ) | (68.74 | )% | ||||||||||
Interest expense | (1,290,039 | ) | (1,527,302 | ) | (237,263 | ) | (15.53 | )% | ||||||||
Other income (expense) net | 110,966 | (1,583 | ) | 112,549 | 7,109.85 | % | ||||||||||
Loss before income taxes | (39,663 | ) | (143,231 | ) | 103,568 | (72.31 | )% | |||||||||
Provision for income taxes | (24,144 | ) | (27,860 | ) | (3,716 | ) | (13.34 | )% | ||||||||
Net loss | $ | (63,807 | ) | $ | (171,091 | ) | $ | (107,284 | ) | (62.71 | )% |
10 |
Revenues
Currently, we have three main types of revenue streams deriving from our three major product categories: Shiitake, Mu Er and other edible fungi and other agricultural products.
The following table sets forth the breakdown of our revenues for the six months ended March 31, 2020 and 2019, respectively:
Six Months Ended March 31, | Variance | |||||||||||||||||||||||
2020 | % | 2019 | % | Amount | % | |||||||||||||||||||
Shiitake | $ | 7,346,174 | 54.09 | % | $ | 8,346,344 | 58.01 | % | $ | (1,000,170 | ) | (11.98 | )% | |||||||||||
Mu Er | 5,762,752 | 42.43 | % | 5,167,414 | 35.91 | % | 595,338 | 11.52 | % | |||||||||||||||
Other edible fungi and other agricultural products | 471,857 | 3.47 | % | 874,429 | 6.08 | % | (402,572 | ) | (46.04 | )% | ||||||||||||||
Total | $ | 13,580,782 | 100.00 | % | $ | 14,388,187 | 100.00 | % | $ | (807,405 | ) | (5.61 | )% |
Total revenues for the six months ended March 31, 2020 decreased by $807,405, or 5.61%, to $13,580,782 from $14,388,187 for the same period of last year.
Revenue from sales of Shiitake decreased by $1,000,170 or 11.98%, to $7,346,174 for the six months ended March 31, 2020 from $8,346,344 for the same period of last year, mainly due to the decreased sales volume, from 662 tons for the six months ended March 31, 2019 to 591 tons for the six months ended March 31, 2020, which resulted in a decrease of $885,891 in revenue from sales of Shiitake. The decrease in sales volume of Shiitake was caused by the reduced customer orders related to travel restriction imposed by the Chinese government due to the COVID-19 pandemic. Also, the average unit sales price for Shiitake reduced from $12,608 per ton for the six months ended March 31, 2019 to $12,425 per ton for the six months ended March 31, 2020, which resulted in a decrease of $114,279 in revenue from sales of Shiitake. The decrease in the average unit sales price of Shiitake was a result of our adjusted business strategy to stimulate customer orders to maintain the sales level.
Revenue from sales of Mu Er increased by $595,338, or 11.52%, to $5,762,752 for the six months ended March 31, 2020 from $5,167,414 for the same period of last year, mainly due to the increased sales volume. Sales volume of Mu Er increased to 476 tons for the six months ended March 31, 2020 from 419 tons for the same period of last year, which resulted in an increase of $698,188 in revenue from sales of Mu Er. The volume increase was partially offset by a lower average selling price from $12,333 per ton for the six months ended March 31, 2019 to $12,103 per ton for the six months ended March 31, 2020, which resulted in a decrease of $102,850 in revenue from sales of Mu Er. The increase in sales volume of Mu Er was caused by the increase in market demand for Mu Er. Average unit sales price of Mu Er decreased by 1.86%, which changed in line with the price of raw materials. As a result of the increased competition amongst the local suppliers. the Company was able to purchase raw materials from suppliers at lower prices during the six months ended March 31, 2020.
Revenue from sales of other edible fungi and other agricultural products decreased by $402,572, or 46.04%, to $471,857 for the six months ended March 31, 2020 from $874,429 for the same period of last year. The decrease was mainly attributed to the decrease in sales volume from 28 tons for the six months ended March 31, 2019 to 18 tons for the six months ended March 31, 2020, which resulted in a decrease of $289,874 in revenue from sales of other edible fungi and other agricultural products. The decrease in sales volume of other edible fungi and other agricultural products was caused by the stay-at-home order and travel restriction imposed by the Chinese government due to the COVID-19 pandemic. Further, the decrease in average unit sales price from $31,230 per ton for the six months ended March 31, 2019 to $26,322 per ton for the six months ended March 31, 2020, which resulted in a decrease of $112,698 in revenue from sales of other edible fungi and other agricultural products. The decrease in average unit sales price was in line with the decrease in price of raw materials.
11 |
Cost of Revenues
The following table sets forth the breakdown of the Company’s cost of revenue for the six months ended March 31, 2020 and 2019, respectively:
Six Months Ended March 31, | Variance | |||||||||||||||||||||||
2020 | % | 2019 | % | Amount | % | |||||||||||||||||||
Shiitake | $ | 6,289,207 | 54.86 | % | $ | 6,885,006 | 58.12 | % | $ | (595,799 | ) | (8.65) | % | |||||||||||
Mu Er | 4,805,731 | 41.92 | % | 4,295,736 | 36.27 | % | 509,995 | 11.87 | % | |||||||||||||||
Other edible fungi and other agricultural products | 369,237 | 3.22 | % | 664,283 | 5.61 | % | (295,046 | ) | (44.42) | % | ||||||||||||||
Total | $ | 11,464,175 | 100.00 | % | $ | 11,845,025 | 100.00 | % | $ | (380,850 | ) | (3.22 | )% |
Cost of revenues decreased by $380,850, or 3.22%, to $11,464,175 for the six months ended March 31, 2020 from $11,845,025 for the same period of last year.
Cost of revenues of Shiitake decreased by $595,799 or 8.65%, to $6,289,207 for the six months ended March 31, 2020 from $6,885,006 for the same period of last year. The decrease was primarily attributable to the decrease in sales volume from 662 tons for the six months ended March 31, 2019 to 591 tons for the six months ended March 31, 2020, which resulted in a decrease of $744,505 in cost of revenue of Shiitake. The decrease was partially offset by an increase in average unit cost of Shiitake from $10,400 per ton for the six months ended March 31, 2019 to $10,638 per ton for the six months ended March 31, 2020, which resulted in an increase of $148,706 in cost of revenue of Shiitake. The increase in average unit cost was caused by allowance for inventory reserve, due to the stay-at-home order and travel restriction imposed by the Chinese government resulted from the COVID-19 pandemic. Therefore, certain Shiitake was not sold as planned and was aged near or over 18 months, and full allowance was made for these Shiitake in the amount of $223,037.
Cost of revenue of Mu Er increased by $509,995 or 11.87% to $4,805,731 for the six months ended March 31, 2020 from $4,295,736 for the same period of last year. The increase was primarily attributable to the increase in sales volume from 419 tons for the six months ended March 31, 2019 to 476 tons for the six months ended March 31, 2020, which resulted in an increase of $581,317 in cost of revenue of Mu Er. The increase was partially offset by a decrease in average unit cost of Mu Er from $10,252 per ton for the six months ended March 31, 2019 to $10,093 per ton for the six months ended March 31, 2020, which resulted in a decrease of $71,322 in cost of revenue of Mu Er.
Cost of revenue of other edible fungi and agricultural products decreased by $295,046, or 44.42%, to $369,237 for the six months ended March 31, 2020 from $664,283 for the same period of last year. The decrease was primarily attributable to the decrease in sales volume from 28 tons for the six months ended March 31, 2019 to 18 tons for the six months ended March 31, 2020, which resulted in a decrease of $223,239 in cost of revenue of other edible fungi and agricultural products. Further, the decrease was attributable to the decrease in average unit cost of other edible fungi and agricultural products from $23,724 per ton for the six months ended March 31, 2019 to $20,597 per ton for the six months ended March 31, 2020, which resulted in a decrease of $71,808 in cost of revenue of other edible fungi and agricultural products.
12 |
Gross Profit
The following table sets forth the breakdown of the Company’s gross profit for the six months ended March 31, 2020 and 2019, respectively:
Six Months Ended March 31, | Variance | |||||||||||||||||||||||
2020 | % | 2019 | % | Amount | % | |||||||||||||||||||
Shiitake | $ | 1,056,967 | 49.94 | % | $ | 1,461,338 | 57.46 | % | $ | (404,371 | ) | (27.67) | % | |||||||||||
Mu Er | 957,020 | 45.21 | % | 871,678 | 34.28 | % | 85,342 | 9.79 | % | |||||||||||||||
Other edible fungi and other agricultural products | 102,620 | 4.85 | % | 210,146 | 8.26 | % | (107,526 | ) | (51.17) | % | ||||||||||||||
Total | $ | 2,116,607 | 100.00 | % | $ | 2,543,162 | 100.00 | % | $ | (426,555 | ) | (16.77) | % |
Overall gross profit decreased by $426,555 or 16.77%, to $2,116,607 for the six months ended March 31, 2020 from $2,543,162 for the same period of fiscal 2019. Gross profit from sales of Shiitake decreased by $404,371 or 27.67, to $1,056,967 for the six months ended March 31, 2020 from $1,461,338 for the same period of last year. Gross profit from sales of Mu Er increased by $85,342 or 9.79% to $957,020 for the six months ended March 31, 2020 from $871,678 for the same period of last year. Gross profit from sales of other edible fungi and agricultural products decreased by $107,526 or 51.17%, to $102,620 for the six months ended March 31, 2020 from $210,146 for the same period of last year. The decreased gross profit was caused by decreased sales for the six months ended March 31, 2020, as compared to the prior period, and a one-time inventory allowance of approximately $0.2 million for the six months ended March 31, 2020.
Overall gross margin decreased by 2.09 percentage points to 15.59% for the six months ended March 31, 2020 from 17.68% for the same period of last year. Overall average unit margin decrease from $2,293 for the six months ended March 31, 2019 to $1,950 for the six months ended March 31, 2020. The decrease in overall gross margin was caused by the allowance for inventory reserve, as mentioned above.
Selling and Distribution Expenses
Selling and distribution expenses decreased by $138,831, or 49.37%, to $142,382 for the six months ended March 31, 2020 from $281,213 for the same period of last year. The decrease was primarily due to a decrease of $35,000 in shipping expenses caused by the decrease in sales volume for the six months ended March 31, 2020, as compared to the same period of last year. Further, the decrease was due to a decrease of $100,000 in advertising and marketing expenses as the Company had already spent on the promotion for the Company’s online platforms last year.
General and Administrative Expenses
General and administrative expenses decreased by $48,332, or 5.51%, to $828,414 for the six months ended March 31, 2020 from $876,746 for the same period of last year. The decrease was primarily attributable to the reduction of headcounts which reduced salaries and related expenses.
Interest Expense
Interest expense was $1,290,039 for the six months ended March 31, 2020, as compared to $1,527,302 for the same period of last year. The decrease in interest expense was primarily attributable to the decreased amortization of debt issuance costs and decreased interest expense incurred for the convertible notes during the six months ended March 31, 2020.
Provision for Income Taxes
For the six months ended March 31, 2020 and 2019, our income tax expense was $24,144 and $27,860, respectively. Overall, the Company is in a loss position, the tax expense was primarily attributable to certain PRC entities that have taxable income from operations, the loss position was primarily incurred by overseas entities as a result of interest expenses of convertible notes.
13 |
A total net income of $1.69 million and $1.5 million was exempt from income tax for the six months ended March 31, 2020 and 2019, respectively. The aggregate amount of our tax holiday was approximately $0.42 million and $0.37 million for the six months ended March 31, 2020 and 2019, respectively. From April 1, 2020 to December 31, 2020, we expect to enjoy the tax exemption for 95% of our taxable income. The summary is below:
Exempted Net Income | Tax holiday | ||||
October 1, 2015 – September 30, 2016 | RMB7.8 million (approximately $1.2 million) |
RMB1.87 million (approximately $0.28 million) | |||
October 1, 2016 – September 30, 2017 | RMB23.71 million (approximately $3.5 million) |
RMB5.9 million (approximately $0.87 million) | |||
October 1, 2017 – September 30, 2018 | RMB25.38 million (approximately $3.9 million) |
RMB6.3 million (approximately $0.97 million) | |||
October 1, 2018 – September 30, 2019 | RMB24.72 million (approximately $3.6 million) |
RMB6.2 million (approximately $0.90 million) | |||
October 1, 2019 – March 31, 2020 | RMB11.82 million (approximately $1.69 million) |
RMB2.9 million (approximately $0.42 million) |
Net Loss
As a result of the factors described above, our net loss was $63,807 for the six months ended March 31, 2020, a decrease of $107,284 from net loss of $171,091 for the same period of fiscal year 2019.
Liquidity and Capital Resources
We are a holding company incorporated in the Cayman Islands. We may need dividends and other distributions on equity from our PRC subsidiaries to satisfy our liquidity requirements. Current PRC regulations permit our PRC subsidiaries to pay dividends to us only out of their accumulated profits, if any, determined in accordance with PRC accounting standards and regulations. In addition, our PRC subsidiaries are required to set aside at least 10% of their respective accumulated profits each year, if any, to fund certain reserve funds until the total amount set aside reaches 50% of their respective registered capital. Our PRC subsidiaries may also allocate a portion of its after-tax profits based on PRC accounting standards to employee welfare and bonus funds at their discretion. These reserves are not distributable as cash dividends.
Further, although instruments governing the current debts incurred by our PRC subsidiaries do not have restrictions on their abilities to pay dividends or make other payments to us, the lender may impose such restriction in the future. As a result, our ability to distribute dividends largely depends on earnings from our PRC subsidiaries and their ability to pay dividends out of earnings. Management believes that our current cash, cash flows provided by operating activities, and access to loans will be sufficient to meet our working capital needs for at least the next 12 months. We intend to continue to carefully execute our growth plans and manage market risk.
14 |
As of March 31, 2020 and September 30, 2019, we had cash in the amount of $5,100,133 and $135,125, respectively. Total current assets as of March 31, 2020 amounted to $31,005,440, an increase of $1,300,412 compared to $29,705,028 at September 30, 2019. The increase in total current assets at March 31, 2020 compared to September 30, 2019 was mainly due to the increase in cash. Current liabilities amounted to $ 6,702,902 at March 31, 2020, in comparison to $8,145,080 at September 30, 2018. This decrease of current liabilities was mainly attributable to the decrease in convertible notes payable.
Although management believes that the cash generated from operations will be sufficient to meet our normal working capital needs for at least the next twelve months, our ability to repay our current obligations will depend on the future realization of our current assets. Management has considered the historical experience, the economy, trends in the agricultural product industry, the expected collectability of accounts receivable and the realization of the inventories as of March 31, 2020. Based on the above considerations, management is of the opinion that we have sufficient funds to meet our working capital requirements and debt obligations as they become due. However, there is no assurance that management will be successful in our plan. There are a number of factors that could potentially arise which might result in shortfalls to what is anticipated, such as the demand for our products, economic conditions, the competition in the industry, and our bank and suppliers being able to provide continued support. If the future cash flow from operations and other capital resources is insufficient to fund our liquidity needs, we may be forced to obtain additional debt or equity capital, or refinance all or a portion of our debt.
Indebtedness. As of March 31, 2020, we have $1,834,300 of short-term bank loans and $1,879,688 convertible notes payable. Beside these loans and convertible notes payable, we did not have any finance leases or purchase commitments, guarantees or other material contingent liabilities.
Off-Balance Sheet Arrangements. We have not entered into any financial guarantees or other commitments to guarantee the payment obligations of any third parties. In addition, we have not entered into any derivative contracts that are indexed to our own shares and classified as shareholders’ equity, or that are not reflected in our consolidated financial statements. Furthermore, we do not have any retained or contingent interest in assets transferred to an unconsolidated entity that serves as credit, liquidity or market risk support to such entity. Moreover, we do not have any variable interest in any unconsolidated entity that we provide financing, liquidity, market risk or credit support to or engages in hedging or research and development services with us.
Capital Resources. The primary drivers and material factors impacting our liquidity and capital resources include our ability to generate sufficient cash flows from our operations and renew commercial bank loans, as well as proceeds from equity and debt financing, to ensure our future growth and expansion plans. On February 21, 2018, we announced the closing of our initial public offering of 1,680,000 Ordinary Shares at a price to the public of $4.00 per share for a total of $6,720,000 in gross proceeds. As of March 31, 2020, we had total assets of $31.7 million, which includes cash of $5.1 million, accounts receivable of $9.0 million, advance to suppliers of $11.7 million, due from related parties of $3.6 million and inventory of $0.7 million, working capital of $24.3 million, and total equity of $24.8 million.
Working Capital. Total working capital as of March 31, 2020 amounted to $24,302,538, compared to $21,559,948 as of September 30, 2019.
Capital Needs. Our capital needs include our daily working capital needs and capital needs to finance the development of our business. We have established effective collection procedures of our accounts receivable, and have been able to realize or receive the refund of the advances to suppliers in the past. Our management believes that income generated from our current operations can satisfy our daily working capital needs over the next 12 months. We may also raise additional capital through public offerings or private placements to finance our business development and to consummate any merger or acquisition, if necessary.
15 |
Cash Flows
The following table provides detailed information about our net cash flows for the six months ended March 31, 2020 and 2019:
For the six months ended March 31, |
||||||||
2020 | 2019 | |||||||
Net provided by (used in) operating activities | $ | 5,686,467 | $ | (5,916,038 | ) | |||
Net cash used in investing activities | (246,726 | ) | (104,110 | ) | ||||
Net cash (used in) provided by financing activities | (453,757 | ) | 6,707,429 | |||||
Effect of exchange rate changes on cash and restricted cash | (39,666 | ) | 225,773 | |||||
Net increase in cash and restricted cash | 4,946,318 | 913,054 | ||||||
Cash and restricted cash, beginning of period | 753,815 | 5,525,165 | ||||||
Cash and restricted cash, end of period | $ | 5,700,133 | $ | 6,438,219 |
Operating Activities
Net cash provided by operating activities was $5,686,467 for the six months ended March 31, 2020. This was an increase of $11,602,505 compared to net cash used in operating activities of $5,916,038 for the six months ended March 31, 2019. The increase in net cash provided by operating activities was primarily attributable to an increase of $4,944,245 in accounts receivable and an increase of $2,428,891 in advances to suppliers.
Investing Activities
For the six months ended March 31, 2020, net cash used in investing activities amounted to $246,726 as compared to net cash used in investing activities of $104,110 for the same period of 2019. The increase of $142,616 was primarily due to an increase of $158,242 in purchase of property, plant and equipment.
Financing Activities
Net cash used in financing activities amounted to $453,757 for the six months ended March 31, 2020, as compared to net cash provided by financing activities of $6,707,429 for the same period in 2019. The decrease of $7,161,186 in net cash provided by financing activities was mainly due to an increase of $7,500,000 in gross proceeds from the issuance of convertible notes in prior period and a decrease of $716,318 in direct costs disbursed from Initial Public Offering proceeds in prior period.
Commitments and Contractual Obligations
The following table presents the Company’s material contractual obligations as of March 31, 2020:
Less than 1 | More than 5 | |||||||||||||||||||
Contractual Obligations | Total | year | 1-3 years | 3-5 years | years | |||||||||||||||
Short-term bank loans | $ | 1,834,300 | $ | 1,834,300 | $ | - | $ | - | $ | - | ||||||||||
Operating lease obligations | 379,277 | 56,892 | 113,784 | 113,784 | 94,817 | |||||||||||||||
Total | $ | 2,213,577 | $ | 1,891,192 | $ | 113,784 | $ | 113,784 | $ | 94,817 |
16 |
Exhibit 99.3
Farmmi Reports Financial Results for the First Six Months of Fiscal Year 2020
· | Minimizes Financial Impact of COVID-19; Restores Operations to Normal |
· | Achieves Breakeven Despite Lower Revenue |
· | Maintains Healthy Balance Sheet to Support Long-Term Growth Plan |
LISHUI, September 28, 2020 – Farmmi, Inc. (“Farmmi” or the “Company”) (NASDAQ: FAMI), an agriculture products supplier in China, today announced its financial results for the six months ended March 31, 2020.
Ms. Yefang Zhang, Chairwoman and CEO of the Company stated, “We are proud of the Farmmi team for its commitment and resolve during the global COVID-19 pandemic. We were faced with considerable uncertainty, that continued through March, as our operations gradually returned to normal with the logistic challenges mostly resolved. During this difficult period, our priority remained on the health and safety of our employees and the chain of control across our supply chain. With the added stresses on the entire food supply chain, our role in providing fresh, high quality agricultural products became even more critical.”
Ms. Zhang continued: “Our focus has always been long-term growth as we execute on our business strategy, which calls for increasing market share, expansion of our supply chain and sales network, and ability to secure high quality raw materials at competitive prices. The main catalysts for our long-term growth remain in place giving us confidence moving in to the second half of 2020. Importantly, we expect sales of our edible fungi products will grow in the coming years. Consumptions of edible fungi in China has been rising significantly and the market remains underserved, as does the international market led by the U.S., Japan and Canada. Our steady progress can be seen in the numerous contracts we have been awarded from both existing and new customers for our sought-after agricultural products. Our focus is on continued execution as we leverage our strong brand and supply channels to drive further growth and improvement of our financial metrics.”
Financial Highlights
For the Six Months Ended March 31, | ||||||||||||
($ millions, except per share data) | 2020 | 2019 | % Change | |||||||||
Revenues | $ | 13.58 | $ | 14.39 | (5.63 | )% | ||||||
Shiitake | 7.35 | 8.35 | (11.98 | )% | ||||||||
Mu Er | 5.76 | 5.17 | 11.41 | % | ||||||||
Other edible fungi and other agricultural products | 0.47 | 0.87 | (45.98 | )% | ||||||||
Gross profit | 2.12 | 2.54 | (16.54 | )% | ||||||||
Gross margin | 15.59 | % | 17.68 | % | 2.09 pp* | |||||||
Income from operations | $ | 1.14 | $ | 1.39 | (17.99 | )% | ||||||
Interest Expense | 1.29 | 1.53 | (15.69 | )% | ||||||||
Net loss attributable to Farmmi, Inc. | (0.06 | ) | (0.17 | ) | 0.11 | |||||||
Basic and diluted loss per share | (0.00 | ) | (0.01 | ) | 0.01 |
*Notes: pp represents percentage points
1
First Six Months of Fiscal Year 2020 Financial Results
Revenue
For the Six Months Ended March 31, | ||||||||||||||||||||||||
2020 | 2019 | |||||||||||||||||||||||
($ millions) | Revenues | COGS | Gross Profit | Revenues | COGS | Gross Profit | ||||||||||||||||||
Shiitake | $ | 7.35 | $ | 6.29 | $ | 1.06 | $ | 8.35 | $ | 6.89 | $ | 1.46 | ||||||||||||
Mu Er | 5.76 | 4.80 | 0.96 | 5.17 | 4.30 | 0.87 | ||||||||||||||||||
Other edible fungi and other agricultural products | 0.47 | 0.37 | 0.10 | 0.87 | 0.66 | 0.21 | ||||||||||||||||||
Total | $ | 13.58 | $ | 11.46 | $ | 2.12 | $ | 14.39 | $ | 11.85 | $ | 2.54 |
Total revenues for the six months ended March 31, 2020 decreased by $0.81 million, or 5.63%, to $13.58 million from $14.39 million for the same period of last year. The decrease in sales of Shiitake, other edible fungi and other agricultural products primarily reflects the adverse impact of travel restrictions and supply chain disruptions due to the COVID-19 pandemic. Sales of Mu Er increased in line with overall market demand growth.
Revenue from sales of Shiitake decreased by $1.00 million or 11.98%, to $7.35 million for the six months ended March 31, 2020 from $8.35 million for the same period of last year, mainly due to the decreased sales volume of the Company’s Shiitake products, from 662 tons for the six months ended March 31, 2019 to 591 tons for the six months ended March 31, 2020, and unit sales price for Shiitake decreased slightly.
Revenue from sales of Mu Er increased by $0.59 million, or 11.41%, to $5.76 million for the six months ended March 31, 2020 from $5.17 million for the same period of last year. Sales volume of Mu Er increased to 476 tons for the six months ended March 31, 2020 from 419 tons for the same period of last year. A slightly lower unit sales price was offset by lower raw materials prices.
Revenue from sales of other edible fungi and other agricultural products decreased by $0.40 million, or 45.98%, to $0.47 million for the six months ended March 31, 2020 from $0.87 million for the same period of last year. The decrease was mainly attributed to the decrease in sales volume from 28 tons for the six months ended March 31, 2019 to 18 tons for the six months ended March 31, 2020, combined with a decrease in unit sales price, which was offset by a decline in the price of raw materials.
Cost of Revenues
Cost of revenues decreased by $0.38 million, or 3.22%, to $11.46 million for the six months ended March 31, 2020 from $11.85 million for the same period of last year.
Cost of revenues of Shiitake decreased by $0.60 million or 8.65%, to $6.29 million for the six months ended March 31, 2020 from $6.89 million for the same period of last year. Cost of revenue of Mu Er increased by $0.50 million or 11.87% to $4.80 million for the six months ended March 31, 2020 from $4.30 million for the same period of last year. Cost of revenue of other edible fungi and agricultural products decreased by $0.29 million, or 44.42%, to $0.37 million for the six months ended March 31, 2020 from $0.66 million for the same period of last year.
Gross Profit
Overall gross profit decreased by $0.42 million or 16.54%, to $2.12 million for the six months ended March 31, 2020 from $2.54 million for the same period of the last fiscal year. Gross profit from sales of Shiitake decreased by $0.40 million or 27.67%, to $1.06 million for the six months ended March 31, 2020 from $1.46 million for the same period of last year. Gross profit from sales of Mu Er increased by $0.09 million or 9.79% to $0.96 million for the six months ended March 31, 2020 from $0.87 million for the same period of last year. Gross profit from sales of other edible fungi and agricultural products decreased by $0.11 million or 51.17%, to $0.10 million for the six months ended March 31, 2020 from $0.21 million for the same period of last year.
Overall gross margin decreased by 2.09 percentage points to 15.59% for the six months ended March 31, 2020 from 17.68% for the same period of last year. The gross profit and gross margin declines reflect lower sales for the six months ended March 31, 2020, as compared to the prior period, primarily due to the adverse impact of the COVID-19 pandemic.
Income from Operations
Selling and distribution expenses decreased by $0.14 million, or 50%, to $0.14 million for the six months ended March 31, 2020 from $0.28 million for the same period of last year. The decrease was primarily due to a decrease in shipping expenses caused by the decrease in sales volume related to the COVID-19 pandemic, combined with the non-recurrence of certain advertising and marketing expenses in promotion support for the Company’s online platforms last year.
2
General and administrative expenses decreased by $0.05 million, or 5.68%, to $0.83 million for the six months ended March 31, 2020 from $0.88 million for the same period of last year. The decrease was primarily attributable to operating efficiency oversight combined with reduced economic activities caused by the COVID-19 pandemic.
As a result, income from operations decreased by $ 0.25 million or 17.99%, to $1.14 million for the six months ended March 31, 2020 from $1.39 million for the same period of last year.
Interest Expense
Interest expense was $1.29 million for the six months ended March 31, 2020, as compared to $1.53 million for the same period of last year. The decrease in interest expense was primarily attributable to lower amortization of debt issuance cost and interest expense incurred for the senior convertible notes during the six months ended March 31, 2020.
Provision for Income Taxes
For the six months ended March 31, 2020 and 2019, the Company’s income tax expense was $24,144 and $27,860, respectively. The low-income tax expense was primarily due to an income tax incentive the Company received from the tax authority of Lishui City. During the six months ended March 31, 2020, our subsidiaries, FLS Mushroom and Farmmi Food received a temporary income tax break from the local tax authority of Lishui City, for engaging in agricultural industry. Management expects that the Company will continue to enjoy the tax break going forward.
Net loss
Net loss attributable to common shareholders for the six months ended March 31, 2020 was $0.06 million, or $0.00 per basic and diluted share. This compares to a net loss attributable to common shareholders of $0.17 million, or $0.01 per basic and diluted share, for the same period of last year.
Other comprehensive income
Other comprehensive income was $0.20 million and $0.68 million for the six months ended March 31, 2020 and March 31, 2019, respectively. The decrease was mainly due to the change of the exchange rate of RMB against U.S. dollar.
Financial Condition
As of March 31, 2020, the Company had cash and cash equivalents of $5.1 million with a restricted cash balance of $0.6 million, and working capital of $24.3 million. As of March 31, 2020, the Company’s accounts receivable balance was $9.0 million, as compared to $14.0 million in the same period last year. The decrease is primarily due to the Company’s operating efficiency improvements and focus on expanding its operating cash flow. As of August 31, 2020, the Company has collected $8.9 million of the outstanding accounts receivable balance noted on March 31, 2020.
2018 Private Placement
On November 1, 2018, the Company completed a $7.5 million private placement with an institutional investor (the “Buyer”). Pursuant to the Securities Purchase Agreement, dated as of November 1, 2018 (the “Securities Purchase Agreement”), the Company issued and sold an aggregate of $7.5 million of senior convertible notes due April 1, 2020 (the “Notes”) and warrants (the “Investor Warrants”) to purchase an aggregate of 800,000 of our Ordinary Shares. The Notes were initially convertible into 1,198,084 Ordinary Shares at the rate of $6.26 per Ordinary Share, which rate is subject to adjustment as referenced in the form of Notes. The Notes bear interest at 10% per year. The Investor Warrants are exercisable by the holder thereof at any time on or after November 1, 2018 and before November 1, 2022. One year from the date of issuance of the Investor Warrants, the Exercise Price of the Investor Warrants was to be lowered to the then-current Market Price (as such term is defined in the Notes) of an Ordinary Share, if such Market Price is less than the initial Exercise Price of $6.53 per Ordinary Share.
On November 9, 2018, the Company issued warrants to purchase 10% of the shares placed under the Notes (initially 119,808) to the placement agent, at an exercise price of $7.183 per share (the “Placement Agent Warrants”). The Investor and Placement Agent Warrants have a term of four years and are subject to adjustment under certain events.
On March 10, 2020, the Company adjusted the warrant exercise price of the Investor Warrants and the Placement Agent Warrants to $2 per Ordinary Share according to the terms of these warrants.
For the six-months ended March 31, 2020, a total of $1,093,440 in amortization of the debt discounts was recorded and charged to the interest expense and Ordinary Shares totaling 3,306,428 were issued by the Company to the Buyer equaling principal and interests amounted to $2,272,625. As of March 31, 2020, the Notes balance was $1,879,688.
The Company repaid the Notes as of June 22, 2020. On July 10, 2020, the Company adjusted the number of the Ordinary Shares underlying the Placement Agent Warrants from 119,808 to 812,694, according to the terms of these warrants.
3
About Farmmi, Inc.
Headquartered in Lishui, Zhejiang, Farmmi, Inc. (NASDAQ: FAMI), is a leading agricultural products supplier, processor and retailer of Shiitake mushrooms, Mu Er mushrooms, other edible fungi, and many other sought-after agricultural products. The Company’s Farmmi Liangpin Market serves as a trading platform for Chinese geographical indication agricultural products and is a large platform for consumers to access locally sourced agricultural products. For further information about the Company, please visit: http://ir.farmmi.com.cn/.
Forward-Looking Statements
This announcement contains forward-looking statements within the meaning of the safe harbor provisions of the Private Securities Litigation Reform Act of 1995. All statements other than statements of historical fact in this announcement are forward-looking statements, including the potential impact of COVID-19 on our business within and outside of China. These forward-looking statements involve known and unknown risks and uncertainties and are based on current expectations and projections about future events and financial trends that the Company believes may affect its financial condition, results of operations, business strategy and financial needs. Investors can identify these forward-looking statements by words or phrases such as “may,” “will,” “expect,” “anticipate,” “aim,” “estimate,” “intend,” “plan,” “believe,” “potential,” “continue,” “is/are likely to” or other similar expressions. The Company undertakes no obligation to update forward-looking statements to reflect subsequent occurring events or circumstances, or changes in its expectations, except as may be required by law. Although the Company believes that the expectations expressed in these forward-looking statements are reasonable, it cannot assure you that such expectations will turn out to be correct, and the Company cautions investors that actual results may differ materially from the anticipated results.
For more information, please contact Investor Relations:
Global IR Partners | ||
David Pasquale | ||
New York Office Phone: +1-914-337-8801 | ||
FAMI@Globalirpartners.com |
4
#G]@
MKXQ^)B?^$A_:<\:,CGYH]'TU=-(^;)P\ :_?/H-QJWA_P 0ZEX8U"]T)G.E:I-9
M3F,7=IO9V$$R>7*JEWVA]N]\;CT5*,H5*E*7Q0;3^32?W-I?-=#&-6,J<*BV
MG:WS3:_!/[M>E_=J***R- HHKS/]M#XS:I^SI^R'\3_'^B06%UK'@OPMJ.MV
M,-\CO;2S6]M)*BRJC(Q0L@R%93C.".M)NRNS2C2E5J1I0WDTE\STRBO!_BA^
MW)#\$_#VDZIK?@+Q_J>A?V9::EX@\2:386PT;PY'.%'F2M<7,&
MXCF9I+I)YD"3KO6WAED3!9D"%7:W!J7)UNU]SM]VN^QA&I&4.=;63^3_ *VW
M/H^BOG/XS^/?$'Q&_;O^'GP^\+ZA?VECX*TB[\=^*/LVH-:PW@D26QTNPN=F
M6:*69KF )?LZ_LM>
M(OA_\8?$GQ*^(7C+2_&WC_Q'I-EX?-QH^@/H6EV.GVDD\L<<5K)=7<@D>6XD
M>1VG8,=@54"XKVVBBDY-Z=OZ_P"#ZZDVUO\ \'I;\$DEV2L%%%%(85X)??L=
M:UX]_:FU_P"(7C3Q?I.JZ5-X3O\ P7H.BZ5H$FG2:;8WLT,MRUU2UL;:!S=JI:*)5.-C\9 Z<#\J\NKWLO\ X'S9YN*_B!1117<]CC14C2=U55& H#' ]*^"S[XO\ MYGV&1=?1%2B
MBBOG3Z(VO"7_ ",]G_P/_P! :O3Z\L\,P0W7B&UAN(HY8FW[DD4,I^1NH->A
M_P!A:/\ ] JQ_P# =/\ "OH,J_@OU_1'SN;_ ,=>GZLT*\W^+'_,(_[;?^R5
MW']A:/\ ] JQ_P# =/\ "O/_ (G6%G9?V7]DM((-_G;O*C"[L;,9QUZG\Z][
M _QX_/\ (\/$_P )GGU%%%?0GEA7O_AW_D6=*_Z\X?\ T 5X!7N.@Z+I4OAW
M3))-,LG=[2)F9H%)8E!DDX]S7F9G\$?7]#LP?Q,\VHHHK\S/T8*Z?P)_R&YO
M^O9O_0EKF*Z'P;:6U[J\L=U;Q3H+=F"RH& .Y1G!^I_.NK!?[Q#U_P SEQW^
M[3]/\CTBBJ T/2
HSM(RSN"[8
MRWS'DX &?H*^"S[XO^WF?89%U]$5****^=/HC:\)?\C/9_\ _\ T!J]/KRS
MPS&TOB&U1)I(6._$D84L/D;IN!'Z5Z'_ &==?]!F^_[X@_\ C=?095_!?K^B
M/G