| • | Repayment of borrowings: |
Canon has been repaying borrowings in recent years, following investment for growth and return to shareholders. In fiscal 2021, in particular, Canon made steady progress in repayment of borrowings by utilizing net cash provided by operating activities, which increased from the previous fiscal year due to significantly improved business performance.
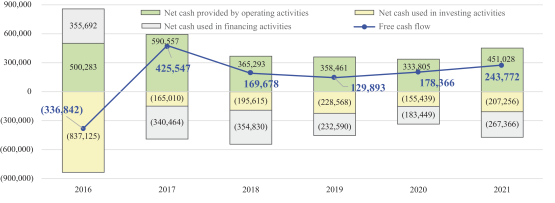
Cash flows (Millions of yen)
Cash and cash equivalents decreased by ¥6,289 million to ¥401,395 million in fiscal 2021 compared to the previous year. Canon’s cash and cash equivalents are primarily denominated in Japanese yen and in U.S. dollars, with the remainder denominated in other currencies.
Net cash provided by operating activities increased by ¥117,223 million to ¥451,028 million in fiscal 2021 compared to the previous year due to a significant increase in profit. The major component of Canon’s cash inflow is cash received from customers, and the major components of Canon’s cash outflow are payments for parts and materials, selling, general and administrative expenses, R&D expenses and income taxes.
For fiscal 2021, cash inflow from cash received from customers increased due to sales improvement. There were no significant changes in Canon’s collection rates. Cash outflow for payments for parts and materials increased due to an increase of inventory compared with the inventory in fiscal 2020 as a result of the global shortage of semiconductor chips and the disruption in logistic and distribution channels. Cash outflow for payments for income taxes increased due to an increase in taxable income.
Net cash used in investing activities increased by ¥51,817 million to ¥207,256 million in fiscal 2021 mainly due to an increase in acquisitions of business and in payment for purchases of fixed assets. Acquisitions of business increased by ¥31,624 million to ¥31,751 million in fiscal 2021 mainly due to the acquisition of Redlen that play an important role in PCCT development. Purchases of fixed assets increased by ¥12,631 million to ¥177,350 million in fiscal 2021 mainly due to capital investment to enhance production capacity and efficiency. Major purchases of fixed assets in fiscal 2021 included construction of new production base for consolidation and renovation at Canon Mold Co., Ltd. and capital investments to increase Complementary Metal Oxide Semiconductor (“CMOS”) sensor production capacity at Canon Inc., Hiratsuka Plant, etc.
Canon defines “free cash flow” as cash flows from operating activities less cash flows from investing activities. For fiscal 2021, free cash flow increased by ¥65,406 million to ¥243,772 million as compared with ¥178,366 million for fiscal 2020.
Note: “Free cash flow” is a
non-GAAP
measure. Refer to the “Non-GAAP
Financial Measures” section for the explanation and the reconciliation to the reported GAAP measure. 49
