UNITED STATES
SECURITIES AND EXCHANGE COMMISSION
Washington, D.C. 20549
Form 10-Q
(Mark One)
QUARTERLY REPORT PURSUANT TO SECTION 13 OR 15(d) OF THE SECURITIES EXCHANGE ACT OF 1934 | ||||
For the quarterly period ended | ||||
or
TRANSITION REPORT PURSUANT TO SECTION 13 OR 15(d) OF THE SECURITIES EXCHANGE ACT OF 1934 | ||
For the transition period from to | ||
(Exact name of registrant as specified in its charter)
 | |||
(State or other jurisdiction of incorporation or organization) | (I.R.S. Employer Identification No.) | ||
(Address of principal executive offices) | (Zip Code) | ||
(615 ) 771-6701
(Registrant’s telephone number, including area code)
Not Applicable
(Former name, former address and former fiscal year, if changed since last report)
Indicate by check mark whether the registrant: (1) has filed all reports required to be filed by Section 13 or 15(d) of the Securities Exchange Act of 1934 during the preceding 12 months (or for such shorter period that the registrant was required to file such reports), and (2) has been subject to such filing requirements for the past 90 days. Yes ☑ No ☐
Indicate by check mark whether the registrant has submitted electronically every Interactive Data File required to be submitted pursuant to Rule 405 of Regulation S-T during the preceding 12 months (or for such shorter period that the registrant was required to submit such files). Yes ☑ No ☐
Indicate by check mark whether the registrant is a large accelerated filer, an accelerated filer, a non-accelerated filer, a smaller reporting company or an emerging growth company. See the definitions of "large accelerated filer," "accelerated filer," "smaller reporting company" and "emerging growth company" in Rule 12b-2 of the Exchange Act.
☑ | Accelerated filer | ☐ | Non-accelerated filer | ☐ | Smaller reporting company | Emerging growth company | |||
If an emerging growth company, indicate by check mark if the registrant has elected not to use the extended transition period for complying with any new or revised financial accounting standards provided pursuant to Section 13(a) of the Exchange Act. ☐
Indicate by check mark whether the registrant is a shell company (as defined in Rule 12b-2 of the Exchange Act). Yes ☐ No ☑
Securities registered pursuant to Section 12(b) of the Act:
Title of Each Class | Trading Symbol | Name of Each Exchange on Which Registered |
At July 31, 2020, there were 73,657,437 shares of common stock, $0.01 par value, outstanding (excluding securities held by, or for the account of, the Company or its subsidiaries).
Table of Contents
Delek US Holdings, Inc.
Quarterly Report on Form 10-Q
For the Quarterly Period Ended June 30, 2020

2 | |  |
Financial Statements
Part I - FINANCIAL INFORMATION
ITEM 1. FINANCIAL STATEMENTS
Delek US Holdings, Inc.
Condensed Consolidated Balance Sheets (Unaudited)
(In millions, except share and per share data)
June 30, 2020 | December 31, 2019 | |||||||
ASSETS | ||||||||
Current assets: | ||||||||
Cash and cash equivalents | $ | $ | ||||||
Accounts receivable, net | ||||||||
Inventories, net of inventory valuation reserves | ||||||||
Other current assets | ||||||||
Total current assets | ||||||||
Property, plant and equipment: | ||||||||
Property, plant and equipment | ||||||||
Less: accumulated depreciation | ( | ) | ( | ) | ||||
Property, plant and equipment, net | ||||||||
Operating lease right-of-use assets | ||||||||
Goodwill | ||||||||
Other intangibles, net | ||||||||
Equity method investments | ||||||||
Other non-current assets | ||||||||
Total assets | $ | $ | ||||||
LIABILITIES AND STOCKHOLDERS’ EQUITY | ||||||||
Current liabilities: | ||||||||
Accounts payable | $ | $ | ||||||
Current portion of long-term debt | ||||||||
Obligation under Supply and Offtake Agreements | ||||||||
Current portion of operating lease liabilities | ||||||||
Accrued expenses and other current liabilities | ||||||||
Total current liabilities | ||||||||
Non-current liabilities: | ||||||||
Long-term debt, net of current portion | ||||||||
Obligation under Supply and Offtake Agreements | ||||||||
Environmental liabilities, net of current portion | ||||||||
Asset retirement obligations | ||||||||
Deferred tax liabilities | ||||||||
Operating lease liabilities, net of current portion | ||||||||
Other non-current liabilities | ||||||||
Total non-current liabilities | ||||||||
Stockholders’ equity: | ||||||||
Preferred stock, $0.01 par value, 11,000,000 shares and 10,000,000 shares authorized at June 30,2020 and December 31, 2019, respectively, no shares issued and outstanding | ||||||||
Common stock, $0.01 par value, 110,000,000 shares authorized, 91,232,964 shares and 90,987,025 shares issued at June 30, 2020 and December 31, 2019, respectively | ||||||||
Additional paid-in capital | ||||||||
Accumulated other comprehensive income | ||||||||
Treasury stock, 17,575,527 shares and 17,516,814 shares, at cost, as of June 30, 2020 and December 31, 2019, respectively | ( | ) | ( | ) | ||||
Retained earnings | ||||||||
Non-controlling interests in subsidiaries | ||||||||
Total stockholders’ equity | ||||||||
Total liabilities and stockholders’ equity | $ | $ | ||||||
See accompanying notes to condensed consolidated financial statements
3 | | |
Financial Statements
Delek US Holdings, Inc.
Condensed Consolidated Statements of Income (Unaudited)
(In millions, except share and per share)
Three Months Ended | Six Months Ended | |||||||||||||||
June 30, | June 30, | |||||||||||||||
2020 | 2019 | 2020 | 2019 | |||||||||||||
Net revenues | $ | $ | $ | $ | ||||||||||||
Cost of sales: | ||||||||||||||||
Cost of materials and other | ||||||||||||||||
Operating expenses (excluding depreciation and amortization presented below) | ||||||||||||||||
Depreciation and amortization | ||||||||||||||||
Total cost of sales | ||||||||||||||||
Operating expenses related to retail and wholesale business (excluding depreciation and amortization presented below) | ||||||||||||||||
General and administrative expenses | ||||||||||||||||
Depreciation and amortization | ||||||||||||||||
Other operating income, net | ( | ) | ( | ) | ( | ) | ( | ) | ||||||||
Total operating costs and expenses | ||||||||||||||||
Operating income (loss) | ( | ) | ||||||||||||||
Interest expense | ||||||||||||||||
Interest income | ( | ) | ( | ) | ( | ) | ( | ) | ||||||||
Income from equity method investments | ( | ) | ( | ) | ( | ) | ( | ) | ||||||||
Gain on sale of non-operating refinery | ( | ) | ( | ) | ||||||||||||
Other (income) expense, net | ( | ) | ( | ) | ||||||||||||
Total non-operating (income) expense, net | ( | ) | ( | ) | ||||||||||||
Income (loss) before income tax (benefit) expense | ( | ) | ||||||||||||||
Income tax (benefit) expense | ( | ) | ( | ) | ||||||||||||
Income (loss) from continuing operations, net of tax | ( | ) | ||||||||||||||
Discontinued operations: | ||||||||||||||||
Loss from discontinued operations, including gain (loss) on sale of discontinued operations | ( | ) | ( | ) | ||||||||||||
Income tax benefit | ( | ) | ( | ) | ||||||||||||
Loss from discontinued operations, net of tax | ( | ) | ( | ) | ||||||||||||
Net income (loss) | ( | ) | ||||||||||||||
Net income attributed to non-controlling interests | ||||||||||||||||
Net income (loss) attributable to Delek | $ | $ | $ | ( | ) | $ | ||||||||||
Basic income (loss) per share: | ||||||||||||||||
Income (loss) from continuing operations | $ | $ | $ | ( | ) | $ | ||||||||||
Loss from discontinued operations | $ | ( | ) | ( | ) | |||||||||||
Basic income (loss) per share | $ | $ | $ | ( | ) | $ | ||||||||||
Diluted income (loss) per share: | ||||||||||||||||
Income (loss) from continuing operations | $ | $ | $ | ( | ) | $ | ||||||||||
Loss from discontinued operations | ( | ) | ( | ) | ||||||||||||
Diluted income (loss) per share | $ | $ | $ | ( | ) | $ | ||||||||||
Dividends declared per common share outstanding | $ | $ | $ | $ | ||||||||||||
See accompanying notes to condensed consolidated financial statements
4 | | |
Financial Statements
Delek US Holdings, Inc.
Condensed Consolidated Statements of Comprehensive Income (Unaudited)
(In millions)
Three Months Ended June 30, | Six Months Ended June 30, | |||||||||||||||
2020 | 2019 | 2020 | 2019 | |||||||||||||
Net income (loss) | $ | $ | $ | ( | ) | $ | ||||||||||
Other comprehensive income (loss): | ||||||||||||||||
Commodity contracts designated as cash flow hedges: | ||||||||||||||||
Net gains (losses) related to commodity cash flow hedges | ( | ) | ( | ) | ( | ) | ||||||||||
Income tax expense (benefit) | ( | ) | ( | ) | ( | ) | ||||||||||
Net comprehensive income (loss) on commodity contracts designated as cash flow hedges | ( | ) | ( | ) | ( | ) | ||||||||||
Other income, net of taxes | ||||||||||||||||
Total other comprehensive income (loss) | ( | ) | ( | ) | ( | ) | ||||||||||
Comprehensive income (loss) | ( | ) | ||||||||||||||
Comprehensive income attributable to non-controlling interest | ||||||||||||||||
Comprehensive income (loss) attributable to Delek | $ | $ | $ | ( | ) | $ | ||||||||||
See accompanying notes to condensed consolidated financial statements
5 | | |
Financial Statements
Delek US Holdings, Inc.
Condensed Consolidated Statements of Changes in Stockholders' Equity (Unaudited)
(In millions, except share and per share data)
Three Months Ended June 30, 2020 | ||||||||||||||||||||||||||||||||||
Common Stock | Additional Paid-in Capital | Accumulated Other Comprehensive Income | Retained Earnings | Treasury Stock | Non-Controlling Interest in Subsidiaries | Total Stockholders' Equity | ||||||||||||||||||||||||||||
Shares | Amount | Shares | Amount | |||||||||||||||||||||||||||||||
Balance at | March 31, 2020 | $ | $ | $ | $ | ( | ) | $ | ( | ) | $ | $ | ||||||||||||||||||||||
Net income | — | — | — | — | — | — | ||||||||||||||||||||||||||||
Other comprehensive loss related to commodity contracts, net | — | — | — | ( | ) | — | — | — | — | ( | ) | |||||||||||||||||||||||
Common stock dividends ($0.31 per share) | — | — | — | — | ( | ) | — | — | ( | ) | ||||||||||||||||||||||||
Distributions to non-controlling interests | — | — | — | — | — | — | — | ( | ) | ( | ) | |||||||||||||||||||||||
Equity-based compensation expense | — | — | — | — | — | — | ||||||||||||||||||||||||||||
Repurchase of non-controlling interests | — | — | ( | ) | — | — | — | — | — | ( | ) | |||||||||||||||||||||||
Taxes paid due to the net settlement of equity-based compensation | — | — | ( | ) | — | — | — | — | ( | ) | ||||||||||||||||||||||||
Exercise of equity-based awards | — | — | — | — | — | — | — | — | ||||||||||||||||||||||||||
Other | — | — | ||||||||||||||||||||||||||||||||
Balance at | June 30, 2020 | $ | $ | $ | $ | ( | ) | $ | ( | ) | $ | $ | ||||||||||||||||||||||
6 | | |
Financial Statements
Delek US Holdings, Inc.
Condensed Consolidated Statements of Changes in Stockholders' Equity (Unaudited)
(In millions, except share and per share data)
Three Months Ended June 30, 2019 | ||||||||||||||||||||||||||||||||||
Common Stock | Additional Paid-in Capital | Accumulated Other Comprehensive Income | Retained Earnings | Treasury Stock | Non-Controlling Interest in Subsidiaries | Total Stockholders' Equity | ||||||||||||||||||||||||||||
Shares | Amount | Shares | Amount | |||||||||||||||||||||||||||||||
Balance at | March 31, 2019 | $ | $ | $ | $ | ( | ) | $ | ( | ) | $ | $ | ||||||||||||||||||||||
Net income | — | — | — | — | — | — | ||||||||||||||||||||||||||||
Other comprehensive loss related to commodity contracts, net | — | — | — | ( | ) | — | — | — | — | ( | ) | |||||||||||||||||||||||
Common stock dividends ($0.28 per share) | — | — | — | — | ( | ) | — | — | ( | ) | ||||||||||||||||||||||||
Distribution to non-controlling interest | — | — | — | — | — | — | — | ( | ) | ( | ) | |||||||||||||||||||||||
Equity-based compensation expense | — | — | — | — | — | — | ||||||||||||||||||||||||||||
Repurchase of common stock | — | — | — | — | — | ( | ) | ( | ) | ( | ) | |||||||||||||||||||||||
Taxes paid due to the net settlement of equity-based compensation | — | — | ( | ) | — | — | — | — | ( | ) | ||||||||||||||||||||||||
Exercise of equity-based awards | — | — | — | — | — | — | — | — | ||||||||||||||||||||||||||
Other | — | — | ||||||||||||||||||||||||||||||||
Balance at | June 30, 2019 | $ | $ | $ | $ | ( | ) | $ | ( | ) | $ | $ | ||||||||||||||||||||||
7 | | |
Financial Statements
Delek US Holdings, Inc.
Condensed Consolidated Statements of Changes in Stockholders' Equity (Unaudited)
(In millions, except share and per share data)
Six Months Ended June 30, 2020 | ||||||||||||||||||||||||||||||||||
Common Stock | Additional Paid-in Capital | Accumulated Other Comprehensive Income | Retained Earnings | Treasury Stock | Non-Controlling Interest in Subsidiaries | Total Stockholders' Equity | ||||||||||||||||||||||||||||
Shares | Amount | Shares | Amount | |||||||||||||||||||||||||||||||
Balance at | December 31, 2019 | $ | $ | $ | $ | ( | ) | $ | ( | ) | $ | $ | ||||||||||||||||||||||
Cumulative effect of adopting accounting principle regarding measurement of credit losses on financial instruments, net | — | — | — | — | ( | ) | — | — | — | ( | ) | |||||||||||||||||||||||
Net (loss) income | — | — | — | — | ( | ) | — | — | ( | ) | ||||||||||||||||||||||||
Other comprehensive income related to commodity contracts, net | — | — | — | — | — | — | — | |||||||||||||||||||||||||||
Common stock dividends ($0.62 per share) | — | — | — | — | ( | ) | — | — | ( | ) | ||||||||||||||||||||||||
Distributions to non-controlling interests | — | — | — | — | — | — | — | ( | ) | ( | ) | |||||||||||||||||||||||
Equity-based compensation expense | — | — | — | — | — | — | ||||||||||||||||||||||||||||
Repurchase of common stock | — | — | — | — | — | ( | ) | ( | ) | ( | ) | |||||||||||||||||||||||
Repurchases of non-controlling interests | — | — | ( | ) | — | — | — | — | ( | ) | ( | ) | ||||||||||||||||||||||
Taxes paid due to the net settlement of equity-based compensation | — | — | ( | ) | — | — | — | — | ( | ) | ||||||||||||||||||||||||
Exercise of equity-based awards | — | — | — | — | — | — | — | — | ||||||||||||||||||||||||||
Other | — | — | 0.1 | — | ||||||||||||||||||||||||||||||
Balance at | June 30, 2020 | $ | $ | $ | $ | ( | ) | $ | ( | ) | $ | $ | ||||||||||||||||||||||
8 | | |
Financial Statements
Delek US Holdings, Inc.
Condensed Consolidated Statements of Changes in Stockholders' Equity (Unaudited) (Continued)
(In millions, except share and per share data)
Six Months Ended June 30, 2019 | ||||||||||||||||||||||||||||||||||
Common Stock | Additional Paid-in Capital | Accumulated Other Comprehensive Income | Retained Earnings | Treasury Stock | Non-Controlling Interest in Subsidiaries | Total Stockholders' Equity | ||||||||||||||||||||||||||||
Shares | Amount | Shares | Amount | |||||||||||||||||||||||||||||||
Balance at | December 31, 2018 | $ | $ | $ | $ | ( | ) | $ | ( | ) | $ | $ | ||||||||||||||||||||||
Net income | — | — | — | — | — | — | ||||||||||||||||||||||||||||
Other comprehensive loss related to commodity contracts, net | — | — | — | ( | ) | — | — | — | — | ( | ) | |||||||||||||||||||||||
Common stock dividends ($0.55 per share) | — | — | — | — | ( | ) | — | — | ( | ) | ||||||||||||||||||||||||
Distribution to non-controlling interest | — | — | — | — | — | — | — | ( | ) | ( | ) | |||||||||||||||||||||||
Equity-based compensation expense | — | — | — | — | — | — | ||||||||||||||||||||||||||||
Repurchase of common stock | — | — | — | — | — | ( | ) | ( | ) | ( | ) | |||||||||||||||||||||||
Taxes paid due to the net settlement of equity-based compensation | — | — | ( | ) | — | — | — | — | ( | ) | ||||||||||||||||||||||||
Exercise of equity-based awards | — | — | — | — | — | — | — | — | ||||||||||||||||||||||||||
Other | — | — | ||||||||||||||||||||||||||||||||
Balance at | June 30, 2019 | $ | $ | $ | $ | ( | ) | $ | ( | ) | $ | $ | ||||||||||||||||||||||
See accompanying notes to condensed consolidated financial statements
9 | | |
Financial Statements
Delek US Holdings, Inc.
Condensed Consolidated Statements of Cash Flows (Unaudited)
(In millions)
Six Months Ended June 30, | ||||||||
2020 | 2019 | |||||||
Cash flows from operating activities: | ||||||||
Net (loss) income | $ | ( | ) | $ | ||||
Adjustments to reconcile net (loss) income to net cash (used in) provided by operating activities: | ||||||||
Depreciation and amortization | ||||||||
Other amortization/accretion | ||||||||
Non-cash lease expense | ||||||||
Deferred income taxes | ||||||||
Income from equity method investments | ( | ) | ( | ) | ||||
Dividends from equity method investments | ||||||||
Loss on disposal of assets | ||||||||
Gain on sale of non-operating refinery | ( | ) | ||||||
Equity-based compensation expense | ||||||||
Excess tax deficiency (benefit) of equity-based compensation | ( | ) | ||||||
Loss from discontinued operations | ||||||||
Changes in assets and liabilities: | ||||||||
Accounts receivable | ( | ) | ||||||
Inventories and other current assets | ( | ) | ||||||
Fair value of derivatives | ( | ) | ||||||
Accounts payable and other current liabilities | ( | ) | ||||||
Obligation under Supply and Offtake Agreements | ( | ) | ||||||
Non-current assets and liabilities, net | ( | ) | ||||||
Net cash (used in) provided by operating activities | ( | ) | ||||||
Cash flows from investing activities: | ||||||||
Equity method investment contributions | ( | ) | ( | ) | ||||
Distributions from equity method investments | ||||||||
Purchases of property, plant and equipment | ( | ) | ( | ) | ||||
Purchase of intangible assets | ( | ) | ||||||
Proceeds from sale of property, plant and equipment | ||||||||
Proceeds from sale of retail stores | ||||||||
Proceeds from sale of non-operating refinery | ||||||||
Net cash used in investing activities | ( | ) | ( | ) | ||||
Delek US Holdings, Inc.
Condensed Consolidated Statements of Cash Flows (Unaudited) (continued)
(In millions)
Six Months Ended June 30, | ||||||||
2020 | 2019 | |||||||
Cash flows from financing activities: | ||||||||
Proceeds from long-term revolvers | $ | $ | ||||||
Payments on long-term revolvers | ( | ) | ( | ) | ||||
Proceeds from term debt | ||||||||
Payments on term debt | ( | ) | ( | ) | ||||
Proceeds from product financing agreements | ||||||||
Repayments of product financing agreements | ( | ) | ( | ) | ||||
Taxes paid due to the net settlement of equity-based compensation | ( | ) | ( | ) | ||||
Repurchase of common stock | ( | ) | ( | ) | ||||
Repurchase of non-controlling interest | ( | ) | ||||||
Distribution to non-controlling interest | ( | ) | ( | ) | ||||
Dividends paid | ( | ) | ( | ) | ||||
Deferred financing costs paid | ( | ) | ( | ) | ||||
Net cash provided by (used in) financing activities | ( | ) | ||||||
Net decrease in cash and cash equivalents | ( | ) | ( | ) | ||||
Cash and cash equivalents at the beginning of the period | ||||||||
Cash and cash equivalents of continuing operations at the end of the period | $ | $ | ||||||
Supplemental disclosures of cash flow information: | ||||||||
Cash paid during the period for: | ||||||||
Interest, net of capitalized interest of $0.2 million and $0.7 million in the 2020 and 2019 periods, respectively | $ | $ | ||||||
Income taxes | $ | $ | ||||||
Non-cash investing activities: | ||||||||
(Decrease) increase in accrued capital expenditures | $ | ( | ) | $ | ||||
Non-cash financing activities: | ||||||||
Non-cash lease liability arising from recognition of right of use assets upon adoption of Accounting Standards Update ("ASU") 2016-02 | $ | $ | ||||||
Non-cash lease liability arising from obtaining right of use assets during the period | $ | $ | ||||||
See accompanying notes to condensed consolidated financial statements
10 | | |
Notes to Condensed Consolidated Financial Statements (Unaudited)
Note 1 - Organization and Basis of Presentation
Delek US Holdings, Inc. operates through its consolidated subsidiaries, which include Delek US Energy, Inc. ("Delek Energy") (and its subsidiaries) and Alon USA Energy, Inc. ("Alon") (and its subsidiaries). The terms "we," "our," "us," "Delek" and the "Company" are used in this report to refer to Delek and its consolidated subsidiaries. Delek's Common Stock is listed on the New York Stock Exchange ("NYSE") under the symbol "DK."
Our condensed consolidated financial statements include the accounts of Delek and its subsidiaries. Certain information and footnote disclosures normally included in annual financial statements prepared in accordance with U.S. Generally Accepted Accounting Principles ("GAAP") have been condensed or omitted, although management believes that the disclosures herein are adequate to make the financial information presented not misleading. Our unaudited condensed consolidated financial statements have been prepared in conformity with GAAP applied on a consistent basis with those of the annual audited consolidated financial statements included in our Annual Report on Form 10-K filed with the Securities and Exchange Commission ("SEC") on February 28, 2020 (the "Annual Report on Form 10-K") and in accordance with the rules and regulations of the SEC. These unaudited condensed consolidated financial statements should be read in conjunction with the audited consolidated financial statements and the notes thereto for the year ended December 31, 2019 included in our Annual Report on Form 10-K.
Our condensed consolidated financial statements include Delek Logistics Partners, LP ("Delek Logistics"), which is a variable interest entity. As the indirect owner of the general partner of Delek Logistics, we have the ability to direct the activities of this entity that most significantly impact its economic performance. We are also considered to be the primary beneficiary for accounting purposes for this entity and are Delek Logistics' primary customer. As Delek Logistics does not derive an amount of gross margin material to us from third parties, there is limited risk to Delek associated with Delek Logistics' operations. However, in the event that Delek Logistics incurs a loss, our operating results will reflect such loss, net of intercompany eliminations, to the extent of our ownership interest in this entity.
In the opinion of management, all adjustments necessary for a fair presentation of the financial condition and the results of operations for the interim periods have been included. All significant intercompany transactions and account balances have been eliminated in consolidation. All adjustments are of a normal, recurring nature. Operating results for the interim period should not be viewed as representative of results that may be expected for any future interim period or for the full year.
Accounting Policies
With the exception of the policy updates below, there have been no new or material changes to the significant accounting policies discussed in the Company’s Annual Report on Form 10-K for the fiscal year ended December 31, 2019.
Risks and Uncertainties Arising from the COVID-19 Pandemic and the OPEC Production Disputes
The recent outbreak of COVID-19 and its development into a pandemic in March 2020 (the "COVID-19 Pandemic") has resulted in significant economic disruption globally, including in the U.S. and specific geographic areas where we operate. Actions taken by various governmental authorities, individuals and companies around the world to prevent the spread of COVID-19 through social distancing have restricted travel, many business operations, public gatherings and the overall level of individual movement and in-person interaction across the globe. This has in turn significantly reduced global economic activity and resulted in airlines dramatically cutting back on flights and a decrease in motor vehicle use at a time when seasonal driving patterns typically result in an increase of consumer demand for gasoline. As a result, there has also been a decline in the demand for, and thus also the market prices of, crude oil and certain of our products. In April and June 2020, an agreement was reached to cut oil production between the members of the Organization of Petroleum Exporting Countries ("OPEC") and other leading oil producing countries (together with OPEC, “OPEC+”), as part of the efforts to resolve the oil production disputes ("OPEC Production Disputes") that significantly affected crude oil prices beginning in first quarter of 2020 and to provide stability in the oil markets. While OPEC+ have reached an agreement to cut oil production, uncertainty about the duration of the COVID-19 Pandemic has caused storage constraints in the United States resulting from over-supply of produced oil. Therefore, downward pressure on commodity prices has remained and could continue for the foreseeable future.
Uncertainties related to the impact of the COVID-19 Pandemic and other events exist that could impact our future results of operations and financial position, the nature of which and the extent to which are currently unknown. To the extent these uncertainties have been identified and are believed to have an impact on our current period results of operations or financial position based on the requirements for assessing such financial statement impact under GAAP, we have considered them in the preparation of our unaudited financial statements as of and for the three and six months ended June 30, 2020. The application of accounting policies impacted by such considerations include (but are not necessarily limited to) the following:
• | The interim evaluation of the risk of credit losses and the determination of our allowance for credit losses, pursuant to GAAP; |
• | The interim evaluation of long-lived assets for potential impairment, where indicators exist, as defined by GAAP; |
• | The interim evaluation of indefinite-lived intangibles and goodwill for potential impairment, where indicators exist, as defined by GAAP; |
11 | | |
Notes to Condensed Consolidated Financial Statements (Unaudited)
• | The interim evaluation of joint ventures for potential impairment, where indicators exist, as defined by GAAP; |
• | The evaluation of derivatives and hedge accounting for counterparty risk and changes in forecasted transactions, as provided for under GAAP; |
• | The evaluation of inventory valuation allowances that may be warranted under the lower of cost or net realizable value analysis, for first-in, first-out (“FIFO”), and the lower of cost or market analysis, for last-in, first-out ("LIFO"), pursuant to GAAP; |
• | The consideration of debt modifications and/or covenant requirements, as applicable; |
• | The evaluation of commitments and contingencies, including changes in concentrations, as applicable; |
• | The interim evaluation of the impact of changing forecasts on our assessment of deferred tax asset valuation allowances and annual effective tax rates; and |
• | The interim evaluation of our ability to continue as a going concern. |
Credit Losses
Under ASU 2016-13, Financial Instruments - Measurement of Credit Losses on Financial Instruments (as codified in Accounting Standards Codification ("ASC") 326), we have applied the expected credit loss model for recognition and measurement of impairments in financial assets measured at amortized cost or at fair value through other comprehensive income including accounts receivables. The expected credit loss model is also applied for notes receivables and contractual holdbacks to which ASU 2016-13 applies and which are not accounted for at fair value through profit or loss. The loss allowance for the financial asset is measured at an amount equal to the lifetime expected credit losses. If the credit risk on the financial asset has decreased significantly since initial recognition, the loss allowance for the financial asset is re-measured. Changes in loss allowances are recognized in profit and loss. For trade receivables, a simplified impairment approach is applied recognizing expected lifetime losses from initial recognition.
Reclassifications
New Accounting Pronouncements Adopted During 2020
ASU 2018-15, Intangible - Customer’s Accounting for Implementation Costs Incurred in a Cloud Computing Arrangement That Is a Service Contract
In August 2018, the Financial Accounting Standards Board (the "FASB") issued guidance related to customers’ accounting for implementation costs incurred in a cloud computing arrangement that is considered a service contract. This pronouncement aligns the requirements for capitalizing implementation costs in such arrangements with the requirements for capitalizing implementation costs incurred to develop or obtain internal-use software. This pronouncement is effective for fiscal years, and for interim periods within those fiscal years, beginning after December 15, 2019. We adopted this guidance on January 1, 2020 and the adoption did not have a material impact on our business, financial condition or results of operations.
ASU 2018-13, Fair Value Measurement - Changes to the Disclosure Requirements for Fair Value Measurement
In August 2018, the FASB issued guidance related to disclosure requirements for fair value measurements. The pronouncement eliminates, modifies and adds disclosure requirements for fair value measurements. The pronouncement is effective for fiscal years, and for interim periods within those fiscal years, beginning after December 15, 2019, with early adoption permitted. We adopted this guidance on January 1, 2020 and the adoption did not have a material impact on our business, financial condition or results of operations. See Note 10.
ASU 2016-13, Financial Instruments - Measurement of Credit Losses on Financial Instruments
In June 2016, the FASB issued guidance requiring the measurement of all expected credit losses for financial assets held at the reporting date based on historical experience, current conditions, and reasonable and supportable forecasts. Organizations will now use forward-looking information to better inform their credit loss estimates. This guidance is effective for interim and annual periods beginning after December 15, 2019. We adopted this guidance on January 1, 2020 using the modified retrospective approach as of the adoption date. The adoption did not have a material impact on the Company’s operating results, financial position or disclosures.
12 | | |
Notes to Condensed Consolidated Financial Statements (Unaudited)
Accounting Pronouncements Not Yet Adopted
ASU 2020-04, Facilitation of the Effects of Reference Rate Reform on Financial Reporting (Topic 848)
In March 2020, the FASB issued an amendment which is intended to provide temporary optional expedients and exceptions to GAAP guidance on contracts, hedge accounting and other transactions affected by the expected market transition from the London Interbank Offered Rate ("LIBOR") and other interbank rates. This guidance is effective for all entities at anytime beginning on March 12, 2020 through December 31, 2022 and may be applied from the beginning of an interim period that includes the issuance date of the ASU. The Company is currently evaluating the impact this guidance may have on its consolidated financial statements and related disclosures.
ASU 2020-01, Investments—Equity Securities (Topic 321), Investments—Equity Method and Joint Ventures (Topic 323), and Derivatives and Hedging (Topic 815)—Clarifying the Interactions between Topic 321, Topic 323, and Topic 815
In January 2020, the FASB issued ASU 2020-01 which is intended to clarify interactions between the guidance to account for certain equity securities under Topics 321, 323 and 815, and improve current GAAP by reducing diversity in practice and increasing comparability of accounting. The pronouncement is effective for fiscal years and interim periods within those fiscal years beginning after December 15, 2020, and early adoption is permitted. The Company is currently evaluating the impact this guidance may have on its consolidated financial statements and related disclosures.
ASU 2019-12, Simplifying the Accounting for Income Taxes
In December 2019, the FASB issued guidance intended to simplify various aspects related to accounting for income taxes, eliminate certain exceptions within ASC 740 and clarify certain aspects of the current guidance to promote consistency among reporting entities. The pronouncement is effective for fiscal years and for interim periods within those fiscal years beginning after December 15, 2020, with early adoption permitted. We expect to adopt this guidance on the effective date and are currently evaluating the impact that adopting this new guidance will have on our business, financial condition and results of operations.
ASU 2018-14, Compensation - Changes to the Disclosure Requirements for Defined Benefit Plans
In August 2018, the FASB issued guidance related to disclosure requirements for defined benefit plans. The pronouncement eliminates, modifies and adds disclosure requirements for defined benefit plans. The pronouncement is effective for fiscal years beginning after December 15, 2020, and early adoption is permitted. We expect to adopt this guidance on the effective date and do not expect adopting this new guidance will have a material impact on our business, financial condition or results of operations.
Note 2 - Segment Data
We aggregate our operating units into three reportable segments: Refining, Logistics, and Retail. Operations that are not specifically included in the reportable segments are included in Corporate, Other and Eliminations, which consist of the following:
• | our corporate activities; |
• | results of certain immaterial operating segments, including our Canadian crude trading operations (as discussed in Note 9); |
• | wholesale crude operations; |
• | Alon's asphalt terminal operations; and |
• | intercompany eliminations. |
Decisions concerning the allocation of resources and assessment of operating performance are made based on this segmentation. Management measures the operating performance of each of the reportable segments based on the segment contribution margin. Segment contribution margin is defined as net revenues less cost of materials and other and operating expenses, excluding depreciation and amortization.
During the first quarter of 2020, we revised the structure of the internal financial information reviewed by management and began allocating the results of hedging activity associated with managing risks of our refineries, previously reported in corporate, other and eliminations, to our refining segment. The historical results of this hedging activity have been reclassified to conform to the current presentation. The assets and/or liabilities associated with this hedging activity have not been allocated to the refining segment.
The refining segment processes crude oil and other feedstocks for the manufacture of transportation motor fuels, including various grades of gasoline, diesel fuel and aviation fuel, asphalt and other petroleum-based products that are distributed through owned and third-party product terminals. The refining segment has a combined nameplate capacity of 302,000 barrels per day ("bpd") as of June 30, 2020, including the following:
• |
• |
13 | | |
Notes to Condensed Consolidated Financial Statements (Unaudited)
• |
• |
• | a non-operating refinery located in Bakersfield, California, which was sold May 7, 2020. |
The refining segment also owns and operates three biodiesel facilities involved in the production of biodiesel fuels and related activities, located in Crossett, Arkansas, Cleburne, Texas and New Albany, Mississippi (acquired in October 2019). The biodiesel industry has historically been substantially aided by federal and state tax incentives. One tax incentive program that has been significant to our renewable fuels facilities is the federal blender's tax credit (also known as the biodiesel tax credit or "BTC"). The BTC provides a $1.00 refundable tax credit per gallon of pure biodiesel to the first blender of biodiesel with petroleum-based diesel fuel. The blender's tax credit was re-enacted in December 2019 for the years 2020 through 2022 and was retroactively reinstated for 2018 and 2019.
On May 7, 2020, we sold our equity interests in Alon Bakersfield Property, Inc., an indirect wholly-owned subsidiary that owns our non-operating refinery located in Bakersfield, California, to a subsidiary of Global Clean Energy Holdings, Inc. (“GCE”) for total cash consideration of $40 million. As a result of this sale, we recognized a gain of $56.9 million, largely due to the buyer assuming substantially all of the asset retirement obligations and environmental liabilities associated with this refinery, which is included in gain on sale of non-operating refinery on the accompanying condensed consolidated statements of income. As part of the transaction, GCE granted a call option to Delek to acquire up to a 33 1/3% interest in the acquiring subsidiary of GCE, exercisable by Delek through the 90th day after GCE demonstrates commercial operations, as contractually defined.
The refining segment's petroleum-based products are marketed primarily in the south central, southwestern and western regions of the United States. This segment also ships and sells gasoline into wholesale markets in the southern and eastern United States. Motor fuels are sold under the Alon or Delek brand through various terminals to supply Alon or Delek branded retail sites. In addition, Alon sells motor fuels through its wholesale distribution network on an unbranded basis.
Logistics Segment
Our logistics segment owns and operates crude oil and refined products logistics and marketing assets. The logistics segment generates revenue by charging fees for gathering, transporting and storing crude oil and for marketing, distributing, transporting and storing intermediate and refined products in select regions of the southeastern United States and West Texas for our refining segment and third parties, and sales of wholesale products in the West Texas market.
Retail Segment
Our retail segment consists of 253 owned and leased convenience store sites as of June 30, 2020, located primarily in Central and West Texas and New Mexico. These convenience stores typically offer various grades of gasoline and diesel primarily under the Alon or Delek brand name and food products, food service, tobacco products, non-alcoholic and alcoholic beverages, general merchandise as well as money orders to the public, primarily under the 7-Eleven and Alon brand names. Substantially all of the motor fuel sold through our retail segment is supplied by our Big Spring refinery, which is transferred to the retail segment at prices substantially determined by reference to published commodity pricing information. In November 2018, we terminated the license agreement with 7-Eleven, Inc. This agreement was amended in April 2020 to extend date for the required removal of all 7-Eleven branding on a store-by-store basis from December 31, 2021 to December 31, 2022. Merchandise sales at our convenience store sites will continue to be sold under the 7-Eleven brand name until 7-Eleven branding is removed at such convenience store sites.
Significant Inter-segment Transactions
All inter-segment transactions have been eliminated in consolidation and consist primarily of the following:
• | refining segment refined product sales to the retail segment to be sold through the store locations; |
• | refining segment sales of asphalt and refined product to entities included in corporate, other and eliminations; |
• | logistics segment service fee revenue under service agreements with the refining segment based on the number of gallons sold and to share a portion of the margin achieved in return for providing marketing, sales and customer services; |
• | logistics segment sales of wholesale finished product to our refining segment; and |
• | logistics segment crude transportation, terminalling and storage fee revenue from our refining segment for the utilization of pipeline, terminal and storage assets. |
14 | | |
Notes to Condensed Consolidated Financial Statements (Unaudited)
Business Segment Operating Performance
The following is a summary of business segment operating performance as measured by contribution margin for the period indicated (in millions):
Three Months Ended June 30, 2020 | ||||||||||||||||||||
(In millions) | Refining | Logistics | Retail | Corporate, Other and Eliminations | Consolidated | |||||||||||||||
Net revenues (excluding inter-segment fees and revenues) | $ | $ | $ | $ | $ | |||||||||||||||
Inter-segment fees and revenues | ( | ) | — | |||||||||||||||||
Operating costs and expenses: | ||||||||||||||||||||
Cost of materials and other | ||||||||||||||||||||
Operating expenses (excluding depreciation and amortization presented below) | ||||||||||||||||||||
Segment contribution margin | $ | $ | $ | $ | ( | ) | ||||||||||||||
Depreciation and amortization | $ | $ | $ | $ | ||||||||||||||||
General and administrative expenses | ||||||||||||||||||||
Other operating income, net | ( | ) | ||||||||||||||||||
Operating income | $ | |||||||||||||||||||
Capital spending (excluding business combinations) | $ | $ | $ | $ | $ | |||||||||||||||
Three Months Ended June 30, 2019 | ||||||||||||||||||||
Refining (1) | Logistics | Retail | Corporate, Other and Eliminations (1) | Consolidated | ||||||||||||||||
Net revenues (excluding inter-segment fees and revenues) | $ | $ | $ | $ | $ | |||||||||||||||
Inter-segment fees and revenues | ( | ) | — | |||||||||||||||||
Operating costs and expenses: | ||||||||||||||||||||
Cost of materials and other | ( | ) | ||||||||||||||||||
Operating expenses (excluding depreciation and amortization presented below) | ||||||||||||||||||||
Segment contribution margin | $ | $ | $ | $ | ( | ) | ||||||||||||||
Depreciation and amortization | $ | $ | $ | $ | ||||||||||||||||
General and administrative expenses | ||||||||||||||||||||
Other operating income, net | ( | ) | ||||||||||||||||||
Operating income | $ | |||||||||||||||||||
Capital spending (excluding business combinations) | $ | $ | $ | $ | $ | |||||||||||||||
Six Months Ended June 30, 2020 | ||||||||||||||||||||
(In millions) | Refining | Logistics | Retail | Corporate, Other and Eliminations | Consolidated | |||||||||||||||
Net revenues (excluding inter-segment fees and revenues) | $ | $ | $ | $ | $ | |||||||||||||||
Inter-segment fees and revenues | ( | ) | — | |||||||||||||||||
Operating costs and expenses: | ||||||||||||||||||||
Cost of materials and other | ( | ) | ||||||||||||||||||
Operating expenses (excluding depreciation and amortization presented below) | ||||||||||||||||||||
Segment contribution margin | $ | ( | ) | $ | $ | $ | ( | ) | ( | ) | ||||||||||
Depreciation and amortization | $ | $ | $ | $ | ||||||||||||||||
General and administrative expenses | ||||||||||||||||||||
Other operating income, net | ( | ) | ||||||||||||||||||
Operating loss | $ | ( | ) | |||||||||||||||||
Capital spending (excluding business combinations) | $ | $ | $ | $ | $ | |||||||||||||||
15 | | |
Notes to Condensed Consolidated Financial Statements (Unaudited)
Six Months Ended June 30, 2019 | ||||||||||||||||||||
Refining (1) | Logistics | Retail | Corporate, Other and Eliminations (1) | Consolidated | ||||||||||||||||
Net revenues (excluding inter-segment fees and revenues) | $ | $ | $ | $ | $ | |||||||||||||||
Inter-segment fees and revenues | ( | ) | — | |||||||||||||||||
Operating costs and expenses: | ||||||||||||||||||||
Cost of materials and other | ( | ) | ||||||||||||||||||
Operating expenses (excluding depreciation and amortization presented below) | ||||||||||||||||||||
Segment contribution margin | $ | $ | $ | $ | ( | ) | ||||||||||||||
Depreciation and amortization | $ | $ | $ | $ | ||||||||||||||||
General and administrative expenses | ||||||||||||||||||||
Other operating income, net | ( | ) | ||||||||||||||||||
Operating income | $ | |||||||||||||||||||
Capital spending (excluding business combinations) | $ | $ | $ | $ | $ | |||||||||||||||
(1) | The refining segment results of operations for the three and six months ended June 30, 2019, includes hedging gains, a component of cost of materials and other, of $ |
Other Segment Information
Total assets by segment were as follows as of June 30, 2020:
Refining | Logistics | Retail | Corporate, Other and Eliminations | Consolidated | ||||||||||||||||
Total assets | $ | $ | $ | $ | ( | ) | $ | |||||||||||||
Less: | ||||||||||||||||||||
Inter-segment notes receivable | ( | ) | — | |||||||||||||||||
Inter-segment right of use lease assets | ( | ) | — | |||||||||||||||||
Total assets, excluding inter-segment notes receivable and right of use assets | $ | $ | $ | $ | $ | |||||||||||||||
Property, plant and equipment and accumulated depreciation as of June 30, 2020 and depreciation expense by reporting segment for the three and six months ended June 30, 2020 are as follows (in millions):
Refining | Logistics | Retail | Corporate, Other and Eliminations | Consolidated | ||||||||||||||||
Property, plant and equipment | $ | $ | $ | $ | $ | |||||||||||||||
Less: Accumulated depreciation | ( | ) | ( | ) | ( | ) | ( | ) | ( | ) | ||||||||||
Property, plant and equipment, net | $ | $ | $ | $ | $ | |||||||||||||||
Depreciation expense for the three months ended June 30, 2020 | $ | $ | $ | $ | $ | |||||||||||||||
Depreciation expense for the six months ended June 30, 2020 | $ | $ | $ | $ | $ | |||||||||||||||
In accordance with ASC 360, Property, Plant and Equipment ("ASC 360"), Delek evaluates the realizability of property, plant and equipment as events occur that might indicate potential impairment. T here were no indicators of impairment related to our property, plant and equipment as of June 30, 2020 (see Note 1 for further discussion on the impact of COVID-19 Pandemic and OPEC Production Disputes).
16 | | |
Notes to Condensed Consolidated Financial Statements (Unaudited)
Note 3 - Earnings (Loss) Per Share
Basic earnings per share (or "EPS") is computed by dividing net income (loss) by the weighted average common shares outstanding. Diluted earnings per share is computed by dividing net income (loss), as adjusted for changes to income that would result from the assumed settlement of the dilutive equity instruments included in diluted weighted average common shares outstanding, by the diluted weighted average common shares outstanding. For all periods presented, we have outstanding various equity-based compensation awards that are considered in our diluted EPS calculation (when to do so would be dilutive), and is inclusive of awards disclosed in Note 15 to these condensed consolidated financial statements. For those instruments that are indexed to our common stock, they are generally dilutive when the market price of the underlying indexed share of common stock is in excess of the exercise price.
The following table sets forth the computation of basic and diluted earnings per share.
Three Months Ended | Six Months Ended | |||||||||||||||
June 30, | June 30, | |||||||||||||||
2020 | 2019 | 2020 | 2019 | |||||||||||||
Numerator: | ||||||||||||||||
Numerator for EPS | ||||||||||||||||
Income (loss) from continuing operations, net of tax | $ | $ | $ | ( | ) | $ | ||||||||||
Less: Income from continuing operations attributed to non-controlling interest | ||||||||||||||||
Numerator for basic and diluted EPS - attributable to Delek | $ | $ | $ | ( | ) | $ | ||||||||||
Numerator for EPS - discontinued operations | ||||||||||||||||
Loss from discontinued operations attributable to Delek | $ | $ | ( | ) | $ | $ | ( | ) | ||||||||
Denominator: | ||||||||||||||||
Weighted average common shares outstanding (denominator for basic EPS) | ||||||||||||||||
Dilutive effect of stock-based awards | ||||||||||||||||
Weighted average common shares outstanding, assuming dilution (denominator for diluted EPS) | ||||||||||||||||
EPS: | ||||||||||||||||
Basic income (loss) per share: | ||||||||||||||||
Income (loss) from continuing operations | $ | $ | $ | ( | ) | $ | ||||||||||
Loss from discontinued operations | $ | ( | ) | $ | ( | ) | ||||||||||
Basic income (loss) per share | $ | $ | $ | ( | ) | $ | ||||||||||
Diluted income (loss) per share: | ||||||||||||||||
Income (loss) from continuing operations | $ | $ | $ | ( | ) | $ | ||||||||||
Loss from discontinued operations | $ | ( | ) | $ | ( | ) | ||||||||||
Diluted income (loss) per share | $ | $ | $ | ( | ) | $ | ||||||||||
The following equity instruments were excluded from the diluted weighted average common shares outstanding because their effect would be antidilutive: | ||||||||||||||||
Antidilutive stock-based compensation (because average share price is less than exercise price) | ||||||||||||||||
Antidilutive due to loss | ||||||||||||||||
Total antidilutive stock-based compensation | ||||||||||||||||
17 | | |
Notes to Condensed Consolidated Financial Statements (Unaudited)
Note 4 - Delek Logistics
Delek Logistics is a publicly traded limited partnership that was formed by Delek in 2012 to own, operate, acquire and construct crude oil and refined products logistics and marketing assets. A substantial majority of Delek Logistics' assets are integral to Delek’s refining and marketing operations. As of June 30, 2020, we owned a 69.1 % interest in Delek Logistics, consisting of 20,745,868 common limited partner units (representing a 70.5 % interest), and a 94.8 % interest in Delek Logistics GP, LLC, which owns the entire 2.0 % general partner interest (consisting of 600,678 general partner units) in Delek Logistics as well as all of the incentive distribution rights.
The limited partner interests in Delek Logistics not owned by us are reflected in net income attributable to non-controlling interest in the accompanying condensed consolidated statements of income and in non-controlling interest in subsidiaries in the accompanying condensed consolidated balance sheets.
We have agreements with Delek Logistics that, among other things, establish fees for certain administrative and operational services provided by us and our subsidiaries to Delek Logistics, provide certain indemnification obligations and establish terms for fee-based commercial logistics and marketing services provided by Delek Logistics and its subsidiaries to us. The revenues and expenses associated with these agreements are eliminated in consolidation.
Delek Logistics is a variable interest entity, as defined under GAAP, and is consolidated into our condensed consolidated financial statements, representing our logistics segment. The assets of Delek Logistics can only be used to settle its own obligations and its creditors have no recourse to our assets. Exclusive of intercompany balances and the marketing agreement intangible asset between Delek Logistics and Delek which are eliminated in consolidation, the Delek Logistics condensed consolidated balance sheets as presented below are included in the condensed consolidated balance sheets of Delek (unaudited, in millions).
June 30, 2020 | December 31, 2019 | |||||||
ASSETS | ||||||||
Cash and cash equivalents | $ | $ | ||||||
Accounts receivable | ||||||||
Accounts receivable from related parties | ||||||||
Inventory | ||||||||
Other current assets | ||||||||
Property, plant and equipment, net | ||||||||
Equity method investments | ||||||||
Operating lease right-of-use assets | ||||||||
Goodwill | ||||||||
Intangible assets, net | ||||||||
Other non-current assets | ||||||||
Total assets | $ | $ | ||||||
LIABILITIES AND DEFICIT | ||||||||
Accounts payable | $ | $ | ||||||
Accounts payable to related parties | ||||||||
Current portion of operating lease liabilities | ||||||||
Accrued expenses and other current liabilities | ||||||||
Long-term debt | ||||||||
Asset retirement obligations | ||||||||
Deferred tax liabilities | ||||||||
Operating lease liabilities, net of current portion | ||||||||
Other non-current liabilities | ||||||||
Deficit | ( | ) | ( | ) | ||||
Total liabilities and deficit | $ | $ | ||||||
Effective May 1, 2020, Delek through its wholly owned subsidiaries Lion Oil Company (“Lion Oil”) and Delek Refining, Ltd. (“Delek Refining”) contributed certain leased and owned tractors and trailers and related assets used in the provision of trucking and transportation services for crude oil, petroleum and certain other products throughout Arkansas, Oklahoma and Texas to Delek Trucking, LLC (“Delek Trucking”), a direct wholly owned subsidiary of Lion Oil. Following this contribution, Lion Oil sold all of the issued and outstanding membership interests in Delek Trucking (the “Acquisition”) to DKL Transportation, LLC (“DKL Transportation”), a wholly owned subsidiary of Delek Logistics. Promptly following the consummation of the Acquisition, Delek Trucking merged with and into DKL Transportation, with DKL Transportation continuing as the surviving entity. Total consideration for the Acquisition was approximately $48.0 million in cash, subject to certain post-closing adjustments,
18 | | |
Notes to Condensed Consolidated Financial Statements (Unaudited)
financed primarily with borrowings under Delek Logistics’ revolving credit facility. In connection with the Acquisition, Delek Refining, Lion Oil and DKL Transportation entered into a Transportation Services Agreement pursuant to which DKL Transportation will gather, coordinate the pickup of, transport and deliver petroleum products for Delek Refining and Lion Oil, as well as provide ancillary services as requested. Prior periods have not been recast in our Segment Data Note 2, as these assets did not constitute a business in accordance with ASU 2017-01, Clarifying the Definition of a Business, and the transaction was accounted for as an acquisition of assets between entities under common control.
Effective March 31, 2020, Delek Logistics, through its wholly-owned subsidiary DKL Permian Gathering, LLC, acquired the Big Spring Gathering System, located in Howard, Borden and Martin Counties, Texas, from Delek, which included the execution of related commercial agreements. In connection with the closing of the transaction, Delek, Delek Logistics and various of their respective subsidiaries entered into a Throughput and Deficiency Agreement (the “T&D Agreement”). Under the T&D Agreement, Delek Logistics will operate and maintain the Big Spring Gathering System connecting our interests in and to certain crude oil production with the Delek Logistics' Big Spring, Texas terminal and provide gathering, transportation and other related services. The total consideration was subject to certain post-closing adjustments and was comprised of $100.0 million in cash and 5.0 million common units representing limited partner interest in Delek Logistics. The cash component of this dropdown was financed with borrowings on the DKL Credit Facility (as defined in Note 8). Prior periods have not been recast in our Segment Data Note 2, as these assets did not constitute a business in accordance with ASU 2017-01 and the transaction was accounted for as an acquisition of assets between entities under common control.
Additionally, in March 2020, we purchased 451,822 of Delek Logistics limited partner units from an investor pursuant to a Common Unit Purchase Agreement between Delek Marketing & Supply, LLC and such investor. The purchase price of the units amounted to approximately $5.0 million. As a result of the transaction, our ownership in Delek Logistics' outstanding common limited partner units increased to 64.5 % from 62.6 %. Our ownership in Delek Logistics' common limited partner units was further increased to 70.5 % as a result of the issuance of 5.0 million common units in connection with the Big Spring Gathering Assets Acquisition described above.
Note 5 - Equity Method Investments
On July 30, 2019, we, through our wholly-owned direct subsidiary Delek US Energy, Inc. ("Delek Energy" or "Delek Member"), entered into a limited liability company agreement (the “LLCA”) and related agreements with multiple joint venture members of Wink to Webster Pipeline LLC (“WWP”). Pursuant to the LLCA, Delek Energy acquired a 15 % ownership interest in WWP. WWP intends to construct and operate a crude oil pipeline system from Wink, Texas to Webster, Texas along with certain pipelines from Webster, Texas to other destinations in the Gulf Coast area. Pursuant to the LLCA, Delek Energy will be required to contribute its percentage interest of the applicable construction costs (including certain costs previously incurred by WWP) and it is anticipated that Delek Energy’s capital contributions will total approximately $340 million to $380 million over the course of construction (expected to be two to three years ). During the six months ended June 30, 2020, we made capital contributions totaling $18.9 million. As of December 31, 2019, Delek's investment balance in WWP totaled $125.3 million.
On February 21, 2020, we, through our wholly-owned direct subsidiary Delek Energy, entered into the W2W Holdings LLC ("HoldCo") Agreement with MPLX Operations LLC ("MPLX") (collectively, with its wholly-owned subsidiaries, the "WWP Project Financing Joint Venture" or the "WWP Project Financing JV"). The WWP Project Financing JV was created for the specific purpose of obtaining financing, through its wholly-owned subsidiary, W2W Finance LLC, to fund the majority of our combined capital calls resulting from and occurring during the construction period of the pipeline system under the WWP Joint Venture, and to service that debt. In connection with the arrangement, both Delek Energy and MPLX contributed their respective 15 % ownership interests to the WWP Project Financing JV as collateral for and in service of the related project financing. Accordingly, distributions received from WWP through the WWP Project Financing JV will first be applied in service of the related project financing debt, with excess distributions being made to the members of the WWP Project Financing JV as provided for in the W2W Holdings LLC Agreement and as allowed under the project financing debt. The obligations of the members under the W2W Holdings LLC Agreement are guaranteed by the parents of the members of the WWP Project Financing JV.
The Company evaluated Delek Member's investment in HoldCo and determined that HoldCo is a variable interest entity. The Company determined it is not the primary beneficiary since it does not have the power to direct activities that most significantly impact HoldCo. The Company does not hold a controlling financial interest in HoldCo because no single party has the power to direct the activities that most significantly impact HoldCo’s economic performance since power to make the decisions about the significant activities is shared equally with MPLX and all significant decisions require unanimous consent of the Board of Directors. The Company accounts for its investment in HoldCo using the equity method of accounting due to its significant influence with its 50% membership interest.
The Company's maximum exposure to any losses incurred by HoldCo is limited to its investment. As of June 30, 2020, except for the guarantee of member obligations under the W2W Holdings LLC Agreement, the Company does not have other existing guarantees with or to HoldCo, or any third-party work contracted with it.
As of June 30, 2020 , Delek's investment balance in WWP Project Financing Joint Venture totaled $73.0 million. During the six months ended June 30, 2020, we received distributions of $69.3 million from WWP Project Financing Joint Venture to return excess contributions made. In addition, we recognized a loss on the investment totaling $0.9 million and $2.0 million for the three and six months ended June 30, 2020,
19 | | |
Notes to Condensed Consolidated Financial Statements (Unaudited)
respectively. This investment is accounted for using the equity method and is included as part of total assets in corporate, other and eliminations in our segment disclosure.
Delek Logistics Investments
In May 2019, Delek Logistics, through its wholly owned indirect subsidiary DKL Pipeline, LLC (“DKL Pipeline”), entered into a Contribution and Subscription Agreement (the “Contribution Agreement”) with Plains Pipeline, L.P. (“Plains”) and Red River Pipeline Company LLC (“Red River”). Pursuant to the Contribution Agreement, DKL Pipeline contributed $124.7 million, substantially all of which was financed under the Delek Logistics Credit Facility (as defined in Note 8), to Red River in exchange for a 33 % membership interest in Red River and DKL Pipeline’s admission as a member of Red River (the "Red River Pipeline Joint Venture"). Red River owns a 16-inch crude oil pipeline running from Cushing, Oklahoma to Longview, Texas, with an expansion project planned to increase the pipeline capacity, which is expected to be completed during the third quarter of 2020. Delek Logistics contributed an additional $3.5 million related to such expansion project in May 2019 and, during the six months ended June 30, 2020, we made additional capital contributions totaling $10.5 million based on capital calls received. As of June 30, 2020 and December 31, 2019, Delek's investment balance in Red River totaled $142.0 million and $131.0 million, respectively, and we recognized income on the investment totaling $2.9 million and $4.7 million for the three and six months ended June 30, 2020, respectively. This investment is accounted for using the equity method and is included as part of total assets in our logistics segment.
In addition to Red River, Delek Logistics has two joint ventures that own and operate logistics assets, and which serve third parties and subsidiaries of Delek. We own a 50 % membership interest in the entity formed with an affiliate of Plains All American Pipeline, L.P. to operate one of these pipeline systems (the "Caddo Pipeline") and a 33 % membership interest in Andeavor Logistics RIO Pipeline LLC which operates the other pipeline system (the "RIO Pipeline"). As of June 30, 2020 and December 31, 2019, Delek Logistics' investment balances in these joint ventures totaled $113.3 million and $116.0 million, respectively, and were accounted for using the equity method. We recognized income on these investments totaling $3.5 million and $7.3 million for the three and six months ended June 30, 2020, respectively and $2.2 million and $4.1 million for the three and six months ended June 30, 2019, respectively.
Other Investments
We have a 50 % interest in a joint venture that owns an asphalt terminal located in Brownwood, Texas. As of June 30, 2020 and December 31, 2019, Delek's investment balance in this joint venture was $35.3 million and $30.7 million, respectively. We recognized income on this investment totaling $5.0 million and $5.5 million for the three and six months ended June 30, 2020, respectively and $4.7 million and $5.2 million for the three and six months ended June 30, 2019, respectively. This investment is accounted for using the equity method and is included as part of total assets in corporate, other and eliminations in our segment disclosure.
Delek Renewables, LLC, a wholly-owned subsidiary of Delek, has a joint venture that owns, operates and maintains a terminal consisting of an ethanol unit train facility with an ethanol tank in North Little Rock, Arkansas. As of June 30, 2020 and December 31, 2019, Delek Renewables, LLC's investment balance in this joint venture was $3.7 million and $4.3 million, respectively, and was accounted for using the equity method. The investment in this joint venture is reflected in the refining segment.
Note 6 - Inventory
Crude oil, work in process, refined products, blendstocks and asphalt inventory for all of our operations, excluding the Tyler refinery and merchandise inventory in our retail segment, are stated at the lower of cost determined using FIFO basis or net realizable value. Cost of all inventory at the Tyler refinery is determined using the LIFO inventory valuation method and inventory is stated at the lower of cost or market. Retail merchandise inventory consists of cigarettes, beer, convenience merchandise and food service merchandise and is stated at estimated cost as determined by the retail inventory method.
Carrying value of inventories consisted of the following (in millions):
June 30, 2020 | December 31, 2019 | |||||||
Refinery raw materials and supplies | $ | $ | ||||||
Refinery work in process | ||||||||
Refinery finished goods | ||||||||
Retail fuel | ||||||||
Retail merchandise | ||||||||
Logistics refined products | ||||||||
Total inventories | $ | $ | ||||||
20 | | |
Notes to Condensed Consolidated Financial Statements (Unaudited)
At June 30, 2020, we recorded a pre-tax inventory valuation reserve of $77.0 million, $76.3 million of which related to LIFO inventory, due to a market price decline below our cost of certain inventory products. At December 31, 2019, we recorded a pre-tax inventory valuation reserve of $1.7 million, $1.2 million of which related to LIFO inventory, which reversed in the first quarter of 2020 due to the sale of inventory quantities that gave rise to the December 31, 2019 reserve. We recognized a net (increase) reduction in cost of materials and other in the accompanying condensed consolidated statements of income related to the change in pre-tax inventory valuation of $203.1 million and $(75.1 ) million for the three and six months ended June 30, 2020, respectively, and $(0.6 ) million and $51.5 million for the three and six months ended June 30, 2019, respectively.
Note 7 - Crude Oil Supply and Inventory Purchase Agreement
Delek has Supply and Offtake Agreements with J. Aron & Company ("J. Aron") in connection with its El Dorado, Big Spring and Krotz Springs refineries (collectively, the "Supply and Offtake Agreements"). Pursuant to the Supply and Offtake Agreements, (i) J. Aron agrees to sell to us, and we agree to buy from J. Aron, at market prices, crude oil for processing at these refineries and (ii) we agree to sell, and J. Aron agrees to buy, at market prices, certain refined products produced at these refineries. The Supply and Offtake Agreements also provide for the lease to J. Aron of crude oil and refined product storage facilities, and the identification of prospective purchasers of refined products on J. Aron’s behalf. At the inception of the Supply and Offtake Agreements, we transferred title to a certain number of barrels of crude and other inventories to J. Aron (the "Step-In"), and the Supply and Offtake Agreements require the repurchase of remaining inventory (including certain "Baseline Volumes") at the termination of those Agreements (the "Step-Out"). The Supply and Offtake Agreements are accounted for as inventory financing arrangements under the fair value election provided by ASC 815 Derivatives and Hedging ("ASC 815") and ASC 825, Financial Instruments ("ASC 825").
Barrels subject to the Supply and Offtake Agreements are as follows:
(in millions) | El Dorado | Big Spring | Krotz Springs | ||||||
Baseline Volumes pursuant to the respective Supply and Offtake Agreements | |||||||||
Barrels of inventory consigned under the respective Supply and Offtake Agreements as of June 30, 2020 (1) | |||||||||
Barrels of inventory consigned under the respective Supply and Offtake Agreements as of December 31, 2019 (1) | |||||||||
(1) | Includes Baseline Volumes plus/minus over/short quantities. |
The Supply and Offtake Agreements have certain termination provisions, which may include requirements to negotiate with third parties for the assignment to us of certain contracts, commitments and arrangements, including procurement contracts, commitments for the sale of product, and pipeline, terminalling, storage and shipping arrangements.
The Supply and Offtake Agreements were amended in December 2018 for Big Spring and in January 2019 for El Dorado and Krotz Springs so that the Baseline Step-Out Liabilities, as defined below, were based upon a fixed price. As a result, we recorded gains on the change in fair value resulting from the modification in cost of materials and other in the periods in which the amendments occurred, including a gain of $7.6 million which was recognized in the first quarter of 2019. As a result of these amendments, the subsequent changes in fair value of the Baseline Step-Out Liabilities were recorded in interest expense.
In January 2020, we amended our three Supply and Offtake Agreements so that the repurchase of Baseline Volumes at the end of the Supply and Offtake Agreement term (representing the "Baseline Step-Out Liability" or, collectively, the "Baseline Step-Out Liabilities") would be based on market-indexed prices subject to commodity price risk. As a result of the amendment, such Baseline Step-Out Liabilities will continue to be recorded at fair value under the fair value election provided by ASC 815 and ASC 825, where the fair value will now reflect changes in commodity price risk rather than interest rate risk with subsequent changes in fair value being recorded in cost of materials and other. We recognized a loss in the first quarter of 2020 of $1.5 million on the change in fair value resulting from the modification.
In April 2020, we amended and restated our three Supply and Offtake Agreements to renew and extend the terms to December 30, 2022, with J. Aron having the sole discretion to further extend to May 30, 2025 by giving at least 6 months prior notice to the current maturity date. As part of this amendment, there were changes to the underlying market index, annual fee, the crude purchase fee, crude roll fees and timing of cash settlements related to periodic price adjustments (the "Periodic Price Adjustments"). The Baseline Step-Out Liabilities continue to be recorded at fair value under the fair value election included under ASC 815 and ASC 825. The Baseline Step-Out Liabilities have a floating component whose fair value reflects changes to commodity price risk with changes in fair value recorded in cost of materials and other and a fixed component whose fair value reflects changes to interest rate risk with changes in fair value recorded in interest expense. There was no amendment date change in fair value resulting from the modification. The Baseline Step-Out Liabilities are reflected as non-current liabilities on our consolidated balance sheet to the extent that they are not contractually due within twelve months.
Pursuant to the Periodic Price Adjustments provision in the Supply and Offtake Agreements, the Company may be required to pay down all or a portion of the fixed component of the Baseline Step-Out Liabilities or may receive additional proceeds depending on the change in fair value of the inventory collateral subject to a threshold at certain specified Periodic Pricing Dates, which occur on October 1st and May 1st, annually, not to extend beyond expiration of the Supply and Offtake Agreements. Additionally, at the Periodic Pricing Dates, if a Periodic Price Adjustment is triggered, the prospective pricing underlying the fixed component of the Baseline Step-Out Liabilities will be adjusted to reflect either the pay-down or the incremental proceeds, accordingly. As of June 30, 2020, the fixed component of the Baseline Step-Out Liabilities subject to the Periodic Price Adjustments amounted to approximately $58.8 million. All or some portion of that amount may become due or payable in periods occurring within twelve months, if Periodic Price Adjustments are triggered in October 2020 and May 2021.
21 | | |
Monthly activity resulting in over and short volumes continue to be valued using market-indexed pricing, and are included in current liabilities (or receivables) on our consolidated balance sheet.
Net balances payable (receivable) under the Supply and Offtake Agreements were as follows as of the balance sheet dates:
(in millions) | El Dorado | Big Spring | Krotz Springs | Total | ||||||||||||
Balances as of June 30, 2020: | ||||||||||||||||
Baseline Step-Out Liability | $ | $ | $ | $ | ||||||||||||
Revolving over/short inventory financing liability | ||||||||||||||||
Total Obligations Under Supply and Offtake Agreements | ||||||||||||||||
Less: Current portion | ||||||||||||||||
Obligations Under Supply and Offtake Agreements - Noncurrent portion | $ | $ | $ | $ | ||||||||||||
Other current payable (receivable) for monthly activity true-up | $ | $ | ( | ) | $ | $ | ||||||||||
(in millions) | El Dorado | Big Spring | Krotz Springs | Total | ||||||||||||
Balances as of December 31, 2019: | ||||||||||||||||
Baseline Step-Out Liability | $ | $ | $ | $ | ||||||||||||
Revolving over/short inventory financing liability | ||||||||||||||||
Total Obligations Under Supply and Offtake Agreements | ||||||||||||||||
Less: Current portion | ||||||||||||||||
Obligations Under Supply and Offtake Agreements - Noncurrent portion | $ | $ | $ | $ | ||||||||||||
Other current receivable for monthly activity true-up | $ | ( | ) | $ | ( | ) | $ | ( | ) | $ | ( | ) | ||||
The Supply and Offtake Agreements require payments of fixed annual fees which are factored into the interest rate yield under the fair value accounting model. Recurring cash fees paid during the periods presented were as follows:
(in millions) | El Dorado | Big Spring | Krotz Springs | Total | ||||||||||||
Recurring cash fees paid during the three months ended June 30, 2020 | $ | $ | $ | $ | ||||||||||||
Recurring cash fees paid during the three months ended June 30, 2019 | $ | $ | $ | $ | ||||||||||||
Recurring cash fees paid during the six months ended June 30,2020 | $ | $ | $ | $ | ||||||||||||
Recurring cash fees paid during the six months ended June 30, 2019 | $ | $ | $ | $ | ||||||||||||
Interest expense recognized under the Supply and Offtake Agreements includes the yield attributable to recurring cash fees, one-time cash fees (e.g., in connection with amendments), as well as other changes in fair value, which may increase or decrease interest expense. Total interest expense incurred during the periods presented was as follows:
(in millions) | El Dorado | Big Spring | Krotz Springs | Total | ||||||||||||
Interest expense for the three months ended June 30, 2020 | $ | $ | $ | $ | ||||||||||||
Interest expense for the three months ended June 30, 2019 | $ | $ | $ | $ | ||||||||||||
Interest expense for the six months ended June 30, 2020 | $ | $ | $ | $ | ||||||||||||
Interest expense for the six months ended June 30, 2019 | $ | $ | $ | $ | ||||||||||||
Reflected in interest expense are losses totaling $3.9 million for the six months ended June 30, 2020, and losses totaling $1.4 million and gains totaling $3.7 million for the three and six months ended June 30, 2019, respectively, related to the changes in fair value in the Baseline Step-Out Liabilities component of Obligations Under Supply and Offtake Agreements. There were no such gains or losses for three months ended June 30, 2020.
We maintained letters of credit under the Supply and Offtake Agreements as follows:
22 | | |
(in millions) | El Dorado | Big Spring and Krotz Springs | |||||||
Letters of credit outstanding as of | June 30, 2020 | $ | $ | ||||||
Letters of credit outstanding as of | December 31, 2019 | $ | $ | ||||||
Note 8 - Long-Term Obligations and Notes Payable
Outstanding borrowings, net of unamortized debt discounts and certain deferred financing costs, under Delek’s existing debt instruments are as follows (in millions):
June 30, 2020 | December 31, 2019 | |||||||
Revolving Credit Facility | $ | $ | ||||||
Term Loan Credit Facility (1) | ||||||||
Delek Logistics Credit Facility | ||||||||
Hapoalim Term Loan (2) | ||||||||
Delek Logistics Notes (3) | ||||||||
Reliant Bank Revolver | ||||||||
Promissory Notes | ||||||||
Less: Current portion of long-term debt and notes payable | ||||||||
$ | $ | |||||||
(1) | Net of deferred financing costs of $ |
(2) | Net deferred financing costs of $ |
(3) | Net of deferred financing costs of $ |
Delek Revolver and Term Loan
On March 30, 2018 (the "Closing Date"), Delek entered into (i) a new term loan credit agreement with Wells Fargo Bank, National Association, as administrative agent (the "Term Administrative Agent"), Delek, as borrower, certain subsidiaries of Delek, as guarantors, and the lenders from time to time party thereto, providing for a senior secured term loan facility in an amount of $700.0 million (the "Term Loan Credit Facility") and (ii) a second amended and restated credit agreement with Wells Fargo Bank, National Association, as administrative agent (the "Revolver Administrative Agent"), Delek, as borrower, certain subsidiaries of Delek, as guarantors, and the other lenders party thereto, providing for a senior secured asset-based revolving credit facility with commitments of $1.0 billion (the "Revolving Credit Facility" and, together with the Term Loan Credit Facility, the "New Credit Facilities").
The Revolving Credit Facility permits borrowings in Canadian dollars of up to $50.0 million. The Revolving Credit Facility also permits the issuance of letters of credit of up to $400.0 million, including letters of credit denominated in Canadian dollars of up to $10.0 million. Delek may designate restricted subsidiaries as additional borrowers under the Revolving Credit Facility.
The Term Loan Credit Facility was drawn in full for $700.0 million on the Closing Date at an original issue discount of 0.50 %. Proceeds under the Term Loan Credit Facility, as well as proceeds of approximately $300.0 million in borrowings under the Revolving Credit Facility on the Closing Date, were used to repay certain indebtedness of Delek and its subsidiaries (the “Refinancing”), as well as certain fees, costs and expenses in connection with the closing of the New Credit Facilities, with any remaining proceeds held in cash. Proceeds of future borrowings under the Revolving Credit Facility will be used for working capital and general corporate purposes of Delek and its subsidiaries.
23 | | |
Notes to Condensed Consolidated Financial Statements (Unaudited)
On May 22, 2019 (the "First Incremental Effective Date"), we amended the Term Loan Credit Facility agreement pursuant to the terms of the First Incremental Amendment to Term Loan Credit Agreement (the "Incremental Amendment"). Pursuant to the Incremental Amendment, the Company borrowed $250.0 million in aggregate principal amount of incremental term loans (the “Incremental Term Loans”) at an original issue discount of 0.75 %, increasing the aggregate principal amount of loans outstanding under the Term Loan Credit Facility on the First Incremental Effective Date to $943.0 million. On November 12, 2019 (the "Second Incremental Effective Date"), we amended the Term Loan Credit facility agreement pursuant to the terms of the Second Incremental Amendment to the Term Loan Credit Agreement (the "Second Incremental Amendment") and borrowed $150.0 million in aggregate principal amount of incremental term loans (the "Incremental Loans") at an original issue discount of 1.21 %, increasing the aggregate principal amount of loans outstanding under the Term Loan Credit Facility on the Second Incremental Effective Date to $1,088.3 million. The terms of the Incremental Term Loans and Incremental Loans are substantially identical to the terms applicable to the initial term loans under the Term Loan Credit Facility borrowed in March 2018. There are no restrictions on the Company's use of the proceeds of the Incremental Term Loans and Incremental Loans. The proceeds may be used for (i) reducing utilizations under the Revolving Credit Facility, (ii) general corporate purposes and (iii) paying transaction fees and expenses associated with the incremental amendments.
On May 19, 2020, we amended the Term Loan Credit Facility agreement and borrowed $200.0 million in aggregate principal amount of incremental term loans (the “Third Incremental Term Loan”) at an original issue discount of 7.00 %. The Third Incremental Term Loan constitutes a separate class of term loan (the "Class B Loan") under the Term Loan Credit Facility from those initially borrowed in March 2018 and the incremental term loans borrowed in May 2019 and November 2019 (collectively, the "Class A Loans"). Delek will be required to pay a make-whole prepayment fee if the Third Incremental Term Loan is prepaid pursuant to an optional prepayment, in connection with a non-permitted debt issuance or in connection with an acceleration within one year of the incurrence of the Third Incremental Term Loan. Delek may voluntarily prepay the outstanding Third Incremental Term Loans at any time subject to customary “breakage” costs with respect to LIBOR loans and subject to a prepayment premium of 1.0 % in connection with certain customary repricing events that may occur during the period from the day after the first anniversary of the Third Incremental Term Loan through the second anniversary of the Third Incremental Term Loan. The other terms of the Third Incremental Term Loan are substantially identical to the terms applicable to the Class A Loans. The proceeds of the Third Incremental Term Loan may be used (i) for general corporate purposes and (ii) to pay transaction fees and expenses associated with the Third Incremental Term Loan.
Interest and Unused Line Fees
The interest rates applicable to borrowings under the Term Loan Credit Facility and the Revolving Credit Facility are based on a fluctuating rate of interest measured by reference to either, at Delek’s option, (i) a base rate, plus an applicable margin, or (ii) a reserve-adjusted LIBOR, plus an applicable margin (or, in the case of Revolving Credit Facility borrowings denominated in Canadian dollars, the Canadian dollar bankers' acceptances rate ("CDOR")). The initial applicable margin for all Term Loan Credit Facility borrowings was 1.50 % per annum with respect to base rate borrowings and 2.50 % per annum with respect to LIBOR borrowings. On October 26, 2018, Delek entered into an amendment to the Term Loan Credit Facility (the “First Amendment”) to reduce the margin on certain borrowings under the Term Loan Credit Facility and incorporate certain other changes. The First Amendment decreased the applicable margins for Class A Loans under (i) Base Rate Loans from 1.50 % to 1.25 % and (ii) LIBOR Rate Loans from 2.50 % to 2.25 %, as such terms are defined in the Term Loan Credit Facility. Class B Loans incurred under the Third Incremental Term Loan bear interest at a rate that is determined, at the Company’s election, at LIBOR or at base rate, in each case, plus an applicable margin of 5.50 % with respect to LIBOR borrowings and 4.50 % with respect to base rate borrowings. Additionally, Class B loans that are LIBOR borrowings are subject to a minimum LIBOR rate floor of 1.00 %.
The initial applicable margin for Revolving Credit Facility borrowings was 0.25 % per annum with respect to base rate borrowings and 1.25 % per annum with respect to LIBOR and CDOR borrowings, and the applicable margin for such borrowings after September 30, 2018 is based on Delek’s excess availability as determined by reference to a borrowing base, ranging from 0.25 % to 0.75 % per annum with respect to base rate borrowings and from 1.25 % to 1.75 % per annum with respect to LIBOR and CDOR borrowings.
In addition, the Revolving Credit Facility requires Delek to pay an unused line fee on the average amount of unused commitments thereunder in each quarter, which the fee is at a rate of 0.25 % or 0.375 % per annum, depending on average commitment usage for such quarter. As of June 30, 2020, the unused line fee was 0.375 % per annum.
Maturity and Repayments
The Revolving Credit Facility will mature and the commitments thereunder will terminate on March 30, 2023. The Term Loan Credit Facility matures on March 30, 2025 and requires scheduled quarterly principal payments on the last business day of the applicable quarter. Pursuant to the Incremental Amendment, quarterly payments increased from $1.75 million to $2.38 million. Pursuant to the Second Incremental Amendment, the quarterly payments increased to $2.75 million commencing with December 31, 2019. Additionally, the Term Loan Credit Facility requires prepayments by Delek with the net cash proceeds from certain debt incurrences, asset dispositions and insurance or condemnation events with respect to Delek’s assets, subject to certain exceptions, thresholds and reinvestment rights. The Term Loan Credit Facility also requires annual prepayments with a variable percentage of Delek’s excess cash flow, ranging from 50.0 % to 0 % depending on Delek’s consolidated fiscal year end secured net leverage ratio. The Third Incremental Term Loan requires quarterly payments on the Class B Loans of $0.5 million commencing June 30, 2020.
24 | | |
Notes to Condensed Consolidated Financial Statements (Unaudited)
Guarantee and Security
The obligations of the borrowers under the New Credit Facilities are guaranteed by Delek and each of its direct and indirect, existing and future, wholly-owned domestic subsidiaries, subject to customary exceptions and limitations, and excluding Delek Logistics Partners, LP, Delek Logistics GP, LLC, and each subsidiary of the foregoing (collectively, the "MLP Subsidiaries"). Borrowings under the New Credit Facilities are also guaranteed by DK Canada Energy ULC, a British Columbia unlimited liability company and a wholly-owned restricted subsidiary of Delek.
The Revolving Credit Facility is secured by a first priority lien over substantially all of Delek’s and each guarantor's receivables, inventory, renewable identification numbers, instruments, intercompany loan receivables, deposit and securities accounts and related books and records and certain other personal property, subject to certain customary exceptions (the "Revolving Priority Collateral"), and a second priority lien over substantially all of Delek's and each guarantor's other assets, including all of the equity interests of any subsidiary held by Delek or any guarantor (other than equity interests in certain MLP Subsidiaries) subject to certain customary exceptions, but excluding real property (such real property and equity interests, the "Term Priority Collateral").
The Term Loan Credit Facility is secured by a first priority lien on the Term Priority Collateral and a second priority lien on the Revolving Priority Collateral, all in accordance with an intercreditor agreement between the Term Administrative Agent and the Revolver Administrative Agent and acknowledged by Delek and the subsidiary guarantors. Certain excluded assets are not included in the Term Priority Collateral and the Revolving Priority Collateral.
Additional Information
At June 30, 2020, the weighted average borrowing rate under the Revolving Credit Facility was 3.50 % and was comprised entirely of a base rate borrowing, and the principal amount outstanding thereunder was $100.0 million. Additionally, there were letters of credit issued of approximately $204.6 million as of June 30, 2020 under the Revolving Credit Facility. Unused credit commitments under the Revolving Credit Facility, as of June 30, 2020, were approximately $695.4 million.
At June 30, 2020, the weighted average borrowing rate under the Term Loan Credit Facility was approximately 3.06 % comprised entirely of LIBOR borrowings, and the principal amount outstanding thereunder was $1,279.5 million. As of June 30, 2020, the effective interest rate related to the Term Loan Credit Facility was 3.44 %.
Delek Hapoalim Term Loan
On December 31, 2019, Delek entered into a term loan credit and guaranty agreement (the "Agreement") with Bank Hapoalim B.M. ("BHI") as the administrative agent. Pursuant to the Agreement, on December 31, 2019, Delek borrowed $40.0 million (the "BHI Term Loan"). The interest rate under the Agreement is equal to LIBOR plus a margin of 3.00 %. The Agreement has a current maturity of December 31, 2022 and requires quarterly loan amortization payments of $0.1 million, commencing March 31, 2020. Proceeds may be used for general corporate purposes. The Agreement has an accordion feature that allows increasing the term loan to maximum size of $100.0 million, subject to receiving increased or new commitments from lenders and the satisfaction of certain other conditions precedent. Any such additional borrowings must be completed by December 31, 2021.
At June 30, 2020, the weighted average borrowing rate under the term loan was approximately 3.18 % comprised entirely of a LIBOR borrowing and the principal amount outstanding thereunder was $39.8 million. As of June 30, 2020, the effective interest rate related to the BHI Term Loan was 3.61 %.
Delek Logistics Credit Facility
Prior to its amendment and restatement on September 28, 2018, Delek Logistics had a $700.0 million senior secured revolving credit agreement with Fifth Third Bank ("Fifth Third"), as administrative agent, and a syndicate of lenders (the "2014 Facility"). On September 28, 2018, Delek Logistics and all of its subsidiaries entered into a third amended and restated senior secured revolving credit agreement with Fifth Third as administrative agent and a syndicate of lenders (hereafter, the "Delek Logistics Credit Facility"). Under the terms of the Delek Logistics Credit Facility, among other things, the lender commitments were increased from $700.0 million to $850.0 million. The Delek Logistics Credit Facility also contains an accordion feature whereby Delek Logistics can increase the size of the credit facility to an aggregate of $1.0 billion, subject to receiving increased or new commitments from lenders and the satisfaction of certain other conditions precedent.
The obligations under the Delek Logistics Credit Facility remain secured by first priority liens on substantially all of Delek Logistics' tangible and intangible assets. Additionally, a subsidiary of Delek provided a limited guaranty of Delek Logistics' obligations under the Delek Logistics Credit Facility. The guaranty was (i) limited to an amount equal to the principal amount, plus unpaid and accrued interest, of a promissory note made by Delek in favor of the subsidiary guarantor (the "Holdings Note") and (ii) secured by the subsidiary guarantor's pledge of the Holdings Note to the Delek Logistics Credit Facility lenders. Effective March 30, 2020, the limited guaranty and pledge of the Holdings Note was terminated pursuant to a guaranty and pledge release approved by the required lenders under the Delek Logistics Credit Facility.
The Delek Logistics Credit Facility has a maturity date of September 28, 2023. Borrowings under the Delek Logistics Credit Facility bear interest at either a U.S. dollar prime rate , Canadian dollar prime rate , LIBOR , or a CDOR rate, in each case plus applicable margins, at the
25 | | |
Notes to Condensed Consolidated Financial Statements (Unaudited)
election of the borrowers and as a function of draw down currency. The applicable margin in each case and the fee payable for the unused revolving commitments vary based upon Delek Logistics' most recent total leverage ratio calculation delivered to the lenders, as called for and defined under the terms of the Delek Logistics Credit Facility. At June 30, 2020, the weighted average borrowing rate was approximately 2.78 %. Additionally, the Delek Logistics Credit Facility requires Delek Logistics to pay a leverage ratio dependent quarterly fee on the average unused revolving commitment. As of June 30, 2020, this fee was 0.40 % on an annualized basis.
As of June 30, 2020, Delek Logistics had $750.0 million of outstanding borrowings under the Delek Logistics Credit Facility, with no letters of credit in place. Unused credit commitments under the Delek Logistics Credit Facility, as of June 30, 2020, were $100.0 million.
Delek Logistics Notes
On May 23, 2017, Delek Logistics and Delek Logistics Finance Corp. (collectively, the “Issuers”) issued $250.0 million in aggregate principal amount of 6.75 % senior notes due 2025 (the “Delek Logistics Notes”) at a discount. The Delek Logistics Notes are general unsecured senior obligations of the Issuers. The Delek Logistics Notes are unconditionally guaranteed jointly and severally on a senior unsecured basis by Delek Logistics' existing subsidiaries (other than Delek Logistics Finance Corp., the "Guarantors") and will be unconditionally guaranteed on the same basis by certain of Delek Logistics' future subsidiaries. The Delek Logistics Notes rank equal in right of payment with all existing and future senior indebtedness of the Issuers, and senior in right of payment to any future subordinated indebtedness of the Issuers. Interest on the Delek Logistics Notes is payable semi-annually in arrears on each May 15 and November 15, commencing November 15, 2017.
Beginning on May 15, 2020, the Issuers may, subject to certain conditions and limitations, redeem all or part of the Delek Logistics Notes, at a redemption price of 105.063 % of the redeemed principal for the twelve-month period beginning on May 15, 2020, 103.375 % for the twelve-month period beginning on May 15, 2021, 101.688 % for the twelve-month period beginning on May 15, 2022 and 100.00 % beginning on May 15, 2023 and thereafter, plus accrued and unpaid interest, if any.
In the event of a change of control, accompanied or followed by a ratings downgrade within a certain period of time, subject to certain conditions and limitations, the Issuers will be obligated to make an offer for the purchase of the Delek Logistics Notes from holders at a price equal to 101 % of the principal amount thereof, plus accrued and unpaid interest.
In May 2018, the Delek Logistics Notes were exchanged for new notes with terms substantially identical in all material respects with the 2025 Notes except the new notes do not contain terms with respect to transfer restrictions.
As of June 30, 2020, we had $250.0 million in outstanding principal amount under the Delek Logistics Notes. As of June 30, 2020, the effective interest rate related to the Delek Logistics Notes was 7.22 %.
Reliant Bank Revolver
Delek has an unsecured revolving credit agreement with Reliant Bank (the "Reliant Bank Revolver"). On December 16, 2019, we amended the Reliant Bank Revolver to extend the maturity date from June 28, 2020 to June 30, 2022, reduce the fixed interest rate from 4.75 % to 4.50 % per annum and increase the revolver commitment amount from $30.0 million to $50.0 million. There were no other significant changes to the agreement. The revolving credit agreement requires us to pay a quarterly fee of 0.50 % on an annualized basis on the average unused revolving commitment. As of June 30, 2020, we had $50.0 million outstanding and had no unused credit commitments under the Reliant Bank Revolver.
Promissory Notes
Delek has four notes payable (the "Promissory Notes") with various assignees of Alon Israel Oil Company, Ltd., the holder of a predecessor consolidated promissory note, which bear interest at a fixed rate of 5.50 % per annum and which, collectively, require annual principal amortization payments of $25.0 million to be made each January through 2020, followed by a final principal amortization payment of $20.0 million at maturity on January 4, 2021. As of June 30, 2020, a total principal amount of $20.0 million was outstanding under the Promissory Notes.
Restrictive Covenants
Under the terms of our Revolving Credit Facility, Term Loan Credit Facility, Delek Logistics Credit Facility, Delek Logistics Notes, Reliant Bank Revolver and BHI Agreement, we are required to comply with certain usual and customary financial and non-financial covenants. The terms and conditions of the Revolving Credit Facility include periodic compliance with a springing minimum fixed charge coverage ratio financial covenant if excess availability under the revolver borrowing base is below certain thresholds, as defined in the credit agreement. The Term Loan Credit Facility does not have any financial maintenance covenants. We believe we were in compliance with all covenant requirements under each of our credit facilities as of June 30, 2020.
26 | | |
Notes to Condensed Consolidated Financial Statements (Unaudited)
Note 9 - Derivative Instruments
We use the majority of our derivatives to reduce normal operating and market risks with the primary objective of reducing the impact of market price volatility on our results of operations. As such, our use of derivative contracts is aimed at:
• | limiting the exposure to price fluctuations of commodity inventory above or below target levels at each of our segments; |
• | managing our exposure to commodity price risk associated with the purchase or sale of crude oil, feedstocks and finished grade fuel products at each of our segments; |
• | managing the cost of our credits for commitments required by the U.S. Environmental Protection Agency ("EPA") to blend biofuels into fuel products ("RINs Obligation") using future commitments to purchase or sell renewable identification numbers ("RINs") at fixed prices and quantities; and |
• | limiting the exposure to interest rate fluctuations on our floating rate borrowings. |
We primarily utilize commodity swaps, futures, forward contracts and options contracts, generally with maturity dates of three years or less, and from time to time interest rate swap or cap agreements, to achieve these objectives. Futures contracts are standardized agreements, traded on a futures exchange, to buy or sell the commodity at a predetermined price at a specified future date. Options provide the right, but not the obligation to buy or sell the commodity at a specified price in the future. Commodity swap and futures contracts require cash settlement for the commodity based on the difference between a fixed or floating price and the market price on the settlement date, and options require payment of an upfront premium. Because these derivatives are entered into to achieve objectives specifically related to our inventory and production risks, such gains and losses (to the extent not designated as accounting hedges and recognized on an unrealized basis in other comprehensive income) are recognized in cost of materials and other.
Forward contracts are agreements to buy or sell a commodity at a predetermined price at a specified future date, and for our transactions, generally require physical delivery. Forward contracts where the underlying commodity will be used or sold in the normal course of business qualify as normal purchases and normal sales pursuant to ASC 815 and are not accounted for as derivative instruments. Rather, such forward contracts are accounted for under other applicable GAAP. Forward contracts entered into for trading purposes that do not meet the normal purchases, normal sales exception are accounted for as derivative instruments at fair value with changes in fair value recognized in earnings in the period of change. As of June 30, 2020 and December 31, 2019, and for the three and six months ended June 30, 2020 and June 30, 2019, all of our forward contracts that were accounted for as derivative instruments primarily consisted of contracts related to our Canadian crude trading operations. Since Canadian crude trading activity is not related to managing supply or pricing risk of the actual inventory that will be used in production, such unrealized and realized gains and losses are recognized in other operating income, net rather than cost of materials and other on the accompanying condensed consolidated statements of income.
Futures, swaps or other commodity related derivative instruments that are utilized to specifically provide economic hedges on our Canadian forward contract or investment positions are recognized in other operating income, net because that is where the related underlying transactions are reflected.
From time to time, we also enter into future commitments to purchase or sell RINs at fixed prices and quantities, which are used to manage the costs associated with our RINs Obligation. These future RIN commitment contracts meet the definition of derivative instruments under ASC 815, and are recorded at estimated fair value in accordance with the provisions of ASC 815. Changes in the fair value of these future RIN commitment contracts are recorded in cost of materials and other on the condensed consolidated statements of income.
As of June 30, 2020, we do not believe there is any material credit risk with respect to the counterparties to any of our derivative contracts.
In accordance with ASC 815, certain of our commodity swap contracts have been designated as cash flow hedges and the change in fair value between the execution date and the end of period has been recorded in other comprehensive income. The fair value of these contracts is recognized in income in the same financial statement line item as hedged transaction at the time the positions are closed and the hedged transactions are recognized in income.
The following table presents the fair value of our derivative instruments as of June 30, 2020 and December 31, 2019. The fair value amounts below are presented on a gross basis and do not reflect the netting of asset and liability positions permitted under our master netting arrangements, including cash collateral on deposit with our counterparties. We have elected to offset the recognized fair value amounts for multiple derivative instruments executed with the same counterparty in our financial statements. As a result, the asset and liability amounts below differ from the amounts presented in our condensed consolidated balance sheets. See Note 10 for further information regarding the fair value of derivative instruments (in millions).
27 | | |
Notes to Condensed Consolidated Financial Statements (Unaudited)
June 30, 2020 | December 31, 2019 | ||||||||||||||||
Derivative Type | Balance Sheet Location | Assets | Liabilities | Assets | Liabilities | ||||||||||||
Derivatives not designated as hedging instruments: | |||||||||||||||||
Commodity derivatives(1) | Other current assets | $ | $ | ( | ) | $ | $ | ( | ) | ||||||||
Commodity derivatives(1) | Other current liabilities | ( | ) | ( | ) | ||||||||||||
Commodity derivatives(1) | Other long-term liabilities | ( | ) | ( | ) | ||||||||||||
RIN commitment contracts(2) | Other current assets | ||||||||||||||||
RIN commitment contracts(2) | Other current liabilities | ( | ) | ( | ) | ||||||||||||
Derivatives designated as hedging instruments: | |||||||||||||||||
Commodity derivatives (1) | Other current assets | ( | ) | ( | ) | ||||||||||||
Commodity derivatives (1) | Other long-term assets | ( | ) | ||||||||||||||
Total gross fair value of derivatives | $ | $ | ( | ) | $ | $ | ( | ) | |||||||||
Less: Counterparty netting and cash collateral(3) | ( | ) | ( | ) | |||||||||||||
Total net fair value of derivatives | $ | $ | ( | ) | $ | $ | ( | ) | |||||||||
(1) | As of June 30, 2020 and December 31, 2019, we had open derivative positions representing |
(2) | As of June 30, 2020 and December 31, 2019, we had open RIN commitment contracts representing |
(3) | As of June 30, 2020 and December 31, 2019, $ |
Total gains on our hedging derivatives and RIN commitment contracts recorded in the condensed consolidated statements of income are as follows (in millions):
Three Months Ended June 30, | Six Months Ended June 30, | |||||||||||||||
2020 | 2019 | 2020 | 2019 | |||||||||||||
(Losses) gains on commodity derivatives not designated as hedging instruments recognized in cost of materials and other (1) | $ | ( | ) | $ | $ | ( | ) | $ | ||||||||
(Losses) gains on commodity derivatives not designated as hedging instruments recognized in other operating income, net (1) (2) | ( | ) | ||||||||||||||
Realized losses (gains) reclassified out of accumulated other comprehensive income and into cost of materials and other on commodity derivatives designated as cash flow hedging instruments | ( | ) | ( | ) | ||||||||||||
Total (losses) gains | $ | ( | ) | $ | $ | ( | ) | $ | ||||||||
(1) | Gains (losses) on commodity derivatives that are economic hedges but not designated as hedging instruments include unrealized (losses) gains of $( |
(2) | See separate table below for disclosures about "trading derivatives." |
The effect of cash flow hedge accounting on the condensed consolidated statements of income is as follows (in millions):
Three Months Ended June 30, | Six Months Ended June 30, | |||||||||||||||
2020 | 2019 | 2020 | 2019 | |||||||||||||
Gain (loss) on cash flow hedging relationships recognized in cost of materials and other: | ||||||||||||||||
Commodity contracts: | ||||||||||||||||
Hedged items | $ | ( | ) | $ | $ | ( | ) | $ | ||||||||
Derivative designated as hedging instruments | ( | ) | ( | ) | ||||||||||||
Total | $ | $ | $ | $ | ||||||||||||
28 | | |
Notes to Condensed Consolidated Financial Statements (Unaudited)
For cash flow hedges, no component of the derivative instruments’ gains or losses was excluded from the assessment of hedge effectiveness for the three and six months ended June 30, 2020 or 2019. Gains (losses), net of tax, on settled commodity contracts of $1.7 and $2.3 million during the three and six months ended June 30, 2020, respectively, and $(11.7 ) million and $(26.8 ) million during the three and six months ended June 30, 2019, respectively, were reclassified into cost of materials and other in the condensed consolidated statements of income. As of June 30, 2020, we estimate that $1.9 million of deferred gains related to commodity cash flow hedges will be reclassified into cost of materials and other over the next 12 months as a result of hedged transactions that are forecasted to occur.
Total (losses) gains on our trading physical forward contract derivatives (none of which were designated as hedging instruments) recorded in other operating income (expense), net on the condensed consolidated statements of income are as follows (in millions):
Three Months Ended June 30, | Six Months Ended June 30, | |||||||||||||||
2020 | 2019 | 2020 | 2019 | |||||||||||||
Realized (losses) gains | $ | ( | ) | $ | $ | ( | ) | $ | ||||||||
Unrealized (losses) gains | ( | ) | ||||||||||||||
Total | $ | ( | ) | $ | $ | ( | ) | $ | ||||||||
Note 10 - Fair Value Measurements
Delek applies the provisions of ASC 820, Fair Value Measurements ("ASC 820"), which defines fair value, establishes a framework for its measurement and expands disclosures about fair value measurements. ASC 820 requires disclosures that categorize assets and liabilities measured at fair value into one of three different levels depending on the observability of the inputs employed in the measurement. Level 1 inputs are quoted prices in active markets for identical assets or liabilities. Level 2 inputs are observable inputs other than quoted prices included within Level 1 for the asset or liability, either directly or indirectly through market-corroborated inputs. Level 3 inputs are unobservable inputs for the asset or liability reflecting our assumptions about pricing by market participants.
Our commodity derivative contracts, which consist of commodity swaps, exchange-traded futures, options and physical commodity forward purchase and sale contracts (that do not qualify as normal purchases or normal sales exception under ASC 815), are valued based on exchange pricing and/or price index developers such as Platts or Argus and are, therefore, classified as Level 2.
Investment commodities, which represent those commodities (generally crude oil) physically on hand as a result of trading activities with physical forward contracts, are valued using published market prices of the commodity on the applicable exchange and are, therefore, classified as Level 1. Such investment stores, included in other current assets on the condensed consolidated balance sheets, are maintained on a weighted average cost basis for determining realized gains and losses on physical sales under forward contracts, and ending balances are adjusted to fair value at each reporting date. The unrealized gain (loss) on commodity investments for the three and six months ended June 30, 2020 totaled $8.9 million and $1.0 million, respectively, and totaled $(1.0 ) million and $(2.0 ) million for the three and six months ended June 30, 2019, respectively.
In April 2020, we entered into a contract with the Department of Energy to deposit one million barrels of crude oil into one of the Strategic Petroleum Reserve ("SPR") storage locations where they will be stored on our behalf until October 2020 for a fee of approximately 100,000 barrels. The fee of 100,000 barrels was recorded as a prepaid asset at cost, and the right to receive the 900,000 barrels was recorded as a financial asset (the "Right to receive crude oil barrels"), measured at fair value based on the value of the underlying commodity using published market prices of the commodity on the applicable exchange. Such asset is, therefore, classified as Level 2. The unrealized gain on the underlying commodity related to the SPR financial asset for the three and six months ended June 30, 2020 of $9.7 million was recorded in other (income) expense, net.
Our RIN commitment contracts are future commitments to purchase or sell RINs at fixed prices and quantities, which are used to manage the costs associated with our RINs Obligation. These RIN commitment contracts are categorized as Level 2, and are measured at fair value based on quoted prices from an independent pricing service.
Our environmental credits obligation surplus or deficit is based on the amount of RINs or other emissions credits subject to fair value accounting that we must purchase, net of amounts internally generated and purchased and the price of those RINs or other emissions credits as of the balance sheet date, by refinery/obligor. The environmental credits obligation surplus or deficit is categorized as Level 2 if measured at fair value either directly through observable inputs or indirectly through market-corroborated inputs.
29 | | |
Notes to Condensed Consolidated Financial Statements (Unaudited)
The fair values of financial instruments are estimated based upon current market conditions and quoted market prices for the same or similar instruments. Management estimates that the carrying value approximates fair value for all of Delek's assets and liabilities that fall under the scope of ASC 825. As of and for the six months ended June 30, 2020 and 2019, we elected to account for our J. Aron step-out liability at fair value in accordance with ASC 825, as it pertains to the fair value option. This standard permits the election to carry financial instruments and certain other items similar to financial instruments at fair value on the balance sheet, with all changes in fair value reported in earnings. With respect to the amended and restated Supply and Offtake Agreements, such amendments being effective April 2020 for all the agreements, we apply fair value measurement as follows: (1) we determine fair value for our amended variable step-out liability based on changes in fair value related to market volatility based on a floating commodity-index price, and for our amended fixed step-out liability based on changes to interest rates and the timing and amount of expected future cash settlements where such obligation is categorized as Level 2. Gains (losses) related to changes in fair value due to commodity-index price are recorded as a component of cost of materials and other, and changes in fair value due to interest rate risk are recorded as a component of interest expense in the condensed consolidated statements of income; and (2) we determine fair value of the commodity-indexed revolving over/short inventory financing liability based on the market prices for the consigned crude oil and refined products collateralizing the financing/funding where such obligation is categorized as Level 2 and is presented in the current portion of the Obligation under Supply and Offtake Agreements on our condensed consolidated balance sheets. Gains (losses) related to the change in fair value are recorded as a component of cost of materials and other in the condensed consolidated statements of income. Before the January 2020 amendments, we determined the fair value for the fixed price step-out liability based on changes to interest rates reflecting changes to the interest rate risk, with obligation categorized as Level 2.
The fair value hierarchy for our financial assets and liabilities accounted for at fair value on a recurring basis was as follows (in millions):
June 30, 2020 | ||||||||||||||||
Level 1 | Level 2 | Level 3 | Total | |||||||||||||
Assets | ||||||||||||||||
Commodity derivatives | $ | $ | $ | $ | ||||||||||||
Commodity investments | ||||||||||||||||
Right to receive crude oil barrels | ||||||||||||||||
RIN commitment contracts | ||||||||||||||||
Total assets | ||||||||||||||||
Liabilities | ||||||||||||||||
Commodity derivatives | ( | ) | ( | ) | ||||||||||||
RIN commitment contracts | ( | ) | ( | ) | ||||||||||||
Environmental credits obligation deficit | ( | ) | ( | ) | ||||||||||||
J. Aron supply and offtake obligations | ( | ) | ( | ) | ||||||||||||
Total liabilities | ( | ) | ( | ) | ||||||||||||
Net assets (liabilities) | $ | $ | ( | ) | $ | $ | ( | ) | ||||||||
December 31, 2019 | ||||||||||||||||
Level 1 | Level 2 | Level 3 | Total | |||||||||||||
Assets | ||||||||||||||||
Commodity derivatives | $ | $ | $ | $ | ||||||||||||
Investment commodities | ||||||||||||||||
RIN commitment contracts | ||||||||||||||||
Environmental credits obligation surplus | ||||||||||||||||
Total assets | ||||||||||||||||
Liabilities | ||||||||||||||||
Commodity derivatives | ( | ) | ( | ) | ||||||||||||
RIN commitment contracts | ( | ) | ( | ) | ||||||||||||
Environmental credits obligation deficit | ( | ) | ( | ) | ||||||||||||
J. Aron supply and offtake obligations | ( | ) | ( | ) | ||||||||||||
Total liabilities | ( | ) | ( | ) | ||||||||||||
Net assets (liabilities) | $ | $ | ( | ) | $ | $ | ( | ) | ||||||||
30 | | |
Notes to Condensed Consolidated Financial Statements (Unaudited)
The derivative values above are based on analysis of each contract as the fundamental unit of account as required by ASC 820. In the table above, derivative assets and liabilities with the same counterparty are not netted where the legal right of offset exists. This differs from the presentation in the financial statements which reflects our policy, wherein we have elected to offset the fair value amounts recognized for multiple derivative instruments executed with the same counterparty and where the legal right of offset exists. As of June 30, 2020 and December 31, 2019, $11.5 million and $38.8 million, respectively, of cash collateral was held by counterparty brokerage firms and has been netted in the financial statements with the net derivative positions with each counterparty. See Note 9 for further information regarding derivative instruments.
Note 11 - Commitments and Contingencies
Litigation
In the ordinary conduct of our business, we are from time to time subject to lawsuits, investigations and claims, including environmental claims and employee-related matters. Although we cannot predict with certainty the ultimate resolution of lawsuits, investigations and claims asserted against us, including civil penalties or other enforcement actions, we do not believe that any currently pending legal proceeding or proceedings to which we are a party will have a material adverse effect on our financial statements. Certain environmental matters that have or may result in penalties or assessments are discussed below in the "Environmental, Health and Safety" section of this note.
One of our Alon subsidiaries was the defendant in a legal action related to an easement dispute arising from a purchase of property that occurred in October 2013. In June 2019, the court found in favor of the plaintiffs and assessed damages against such subsidiary totaling $6.7 million, which is included as of June 30, 2020 in accrued expenses and other current liabilities on the accompanying condensed consolidated balance sheet.
Self-insurance
Delek records a self-insurance accrual for workers’ compensation claims up to a $4.0 million deductible on a per accident basis, general liability claims up to $4.0 million on a per occurrence basis and medical claims for eligible full-time employees up to $0.3 million per covered individual per calendar year. We also record a self-insurance accrual for auto liability up to a $4.0 million deductible on a per accident basis.
We have umbrella liability insurance available to each of our segments in an amount determined reasonable by management.
Environmental, Health and Safety
We are subject to extensive federal, state and local environmental and safety laws and regulations enforced by various agencies, including the EPA, the United States Department of Transportation, the Occupational Safety and Health Administration, as well as numerous state, regional and local environmental, safety and pipeline agencies. These laws and regulations govern the discharge of materials into the environment, waste management practices, pollution prevention measures and the composition of the fuels we produce, as well as the safe operation of our plants and pipelines and the safety of our workers and the public. Numerous permits or other authorizations are required under these laws and regulations for the operation of our refineries, renewable fuels facilities, terminals, pipelines, underground storage tanks, trucks, rail cars and related operations, and may be subject to revocation, modification and renewal.
These laws and permits raise potential exposure to future claims and lawsuits involving environmental and safety matters which could include soil and water contamination, air pollution, personal injury and property damage allegedly caused by substances which we manufactured, handled, used, released or disposed of, transported, or that relate to pre-existing conditions for which we have assumed responsibility. We believe that our current operations are in substantial compliance with existing environmental and safety requirements. However, there have been and will continue to be ongoing discussions about environmental and safety matters between us and federal and state authorities, including notices of violations, citations and other enforcement actions, some of which have resulted or may result in changes to operating procedures and in capital expenditures. While it is often difficult to quantify future environmental or safety related expenditures, we anticipate that continuing capital investments and changes in operating procedures will be required for the foreseeable future to comply with existing and new requirements, as well as evolving interpretations and more strict enforcement of existing laws and regulations.
As of June 30, 2020, we have recorded an environmental liability of approximately $112.9 million, primarily related to the estimated probable costs of remediating or otherwise addressing certain environmental issues of a non-capital nature at our refineries, as well as terminals, some of which we no longer own. This liability includes estimated costs for ongoing investigation and remediation efforts for known contamination of soil and groundwater. Approximately $6.6 million of the total liability is expected to be expended over the next 12 months, with most of the balance expended by 2032, although some costs may extend up to 30 years. In the future, we could be required to extend the expected remediation period or undertake additional investigations of our refineries, pipelines and terminal facilities, which could result in the recognition of additional remediation liabilities.
31 | | |
Notes to Condensed Consolidated Financial Statements (Unaudited)
Crude Oil and Other Releases
We have experienced several crude oil and other releases involving our assets. There were no material releases that occurred during the six months ended June 30, 2020, and five releases that occurred throughout the year 2019. Cleanup operations and site maintenance and remediation efforts on these and other releases are at various stages of completion. The majority of the remediation efforts for these releases are substantially complete or have received regulatory closure. With the exception of the Sulphur Springs release defined below, we expect regulatory closure in 2020 for the release sites that have not yet received it.
On October 3, 2019, a finished product release involving one of our pipelines occurred near Sulphur Springs, Texas (the "Sulphur Springs Release"). Cleanup operations and site maintenance and remediation on this release have been substantially completed where such costs incurred totaled $7.1 million during 2019. During the three and six months ended June 30, 2020, we incurred approximately $0.1 million and $0.3 million of additional costs related to final clean-up of this release, respectively. The release is currently in boom maintenance. Ground water monitoring wells were installed in the second quarter of 2020. We expect to conduct quarterly ground water monitoring for at least a year. Additionally, we will be conducting creek bed sediment sampling in the third quarter of 2020. We have filed suit in January 2020 against a third party contractor, seeking damages related to this release. We have not received notification that any legal action with respect to fines and penalties will be pursued by the regulatory agencies.
Expenses incurred for the remediation of these crude oil and other releases are included in operating expenses in our consolidated statements of income.
Letters of Credit
Note 12 - Income Taxes
Under ASC 740, Income Taxes (“ASC 740”) we used an estimated annual tax rate to record income taxes for the three and six months ended June 30, 2020 and June 30, 2019. Our effective tax rate was (57.3 )% and 36.3 % for the three and six months ended June 30, 2020, respectively, compared to 22.5 % and 22.8 % for the three and six ended June 30, 2019, respectively. The difference between the effective tax rate and the statutory rate is generally attributable to permanent differences and discrete items. The change in our effective tax rate for the three and six months ended June 30, 2020 as compared to the three and six months ended June 30, 2019 was primarily due to tax benefit for federal tax credits attributable to the Company’s biodiesel blending operations that were re-enacted in December 2019, reversal of a valuation allowance for deferred tax assets in partnership investments due to changes in the future realizability of deferred tax basis differences, and expected net operating loss carryback provided under the CARES Act which allows the Company to recover federal taxes paid in prior years at a 35% tax rate creating a 14% tax rate benefit.
Note 13 - Related Party Transactions
Our related party transactions consist primarily of transactions with our equity method investees (See Note 5 ). Transactions with our related parties were as follows for the periods presented:
Three Months Ended June 30, | Six Months Ended June 30, | |||||||||||||||
(in millions) | 2020 | 2019 | 2020 | 2019 | ||||||||||||
Revenues (1) | $ | $ | $ | $ | ||||||||||||
Cost of materials and other (2) | $ | $ | $ | $ | ||||||||||||
(1) | Consists primarily of asphalt sales which are recorded in corporate, other and eliminations segment. |
(2) | Consists primarily of pipeline throughput fees paid by the refining segment and asphalt purchases. |
32 | | |
Notes to Condensed Consolidated Financial Statements (Unaudited)
Note 14 - Other Assets and Liabilities
The detail of other current assets is as follows (in millions):
Other Current Assets | June 30, 2020 | December 31, 2019 | |||||
Income and other tax receivables | $ | $ | |||||
Short-term derivative assets (see Note 9) | |||||||
RINs assets | |||||||
Right to receive crude oil barrels (see Note 10) | |||||||
Prepaid expenses | |||||||
Environmental Credits Obligation surplus (see Note 10) | |||||||
Biodiesel tax credit (see Note 2) | |||||||
Investment commodities | |||||||
Other | |||||||
Total | $ | $ | |||||
The detail of other non-current assets is as follows (in millions):
Other Non-Current Assets | June 30, 2020 | December 31, 2019 | |||||
Supply and Offtake receivable | $ | $ | |||||
Other equity Investments | |||||||
Deferred financing costs | |||||||
Long-term derivative assets (see Note 9) | |||||||
Other | |||||||
Total | $ | $ | |||||
The detail of accrued expenses and other current liabilities is as follows (in millions):
Accrued Expenses and Other Current Liabilities | June 30, 2020 | December 31, 2019 | |||||
Income and other taxes payable | |||||||
Product financing agreements | |||||||
Crude purchase liabilities | |||||||
Environmental Credits Obligation deficit (see Note 10) | |||||||
Short-term derivative liabilities (see Note 9) | |||||||
Employee costs | |||||||
Environmental liabilities (see Note 11) | |||||||
Interest payable | |||||||
Tank inspection liabilities | |||||||
Accrued utilities | |||||||
Other | |||||||
Total | $ | $ | |||||
33 | | |
Notes to Condensed Consolidated Financial Statements (Unaudited)
The detail of other non-current liabilities is as follows (in millions):
Other Non-Current Liabilities | June 30, 2020 | December 31, 2019 | |||||
Liability for unrecognized tax benefits | $ | $ | |||||
Tank inspection liabilities | |||||||
Pension and other postemployment benefit liabilities, net | |||||||
Long-term derivative liabilities (see Note 9) | |||||||
Other | |||||||
Total | $ | $ | |||||
Note 15 - Equity-Based Compensation
Delek US Holdings, Inc. 2006 and 2016 and Alon USA Energy, Inc. 2005 Long-Term Incentive Plans (collectively, the "Incentive Plans")
On May 5, 2020, the Company's stockholders approved an amendment to the Delek US Holdings, Inc. 2016 Long-Term Incentive Plan that increased the number of shares of Common Stock available for issuance under this plan by 2,120,000 shares to 11,020,000 shares.
Compensation expense related to equity-based awards granted under the Incentive Plans amounted to $5.0 million and $10.9 million for the three and six months ended June 30, 2020, respectively, and $6.6 million and $11.4 million for the three and six months ended June 30, 2019, respectively. These amounts are included in general and administrative expenses in the accompanying condensed consolidated statements of income.
As of June 30, 2020, there was $48.2 million of total unrecognized compensation cost related to non-vested share-based compensation arrangements, which is expected to be recognized over a weighted-average period of 2.1 years.
We issued net shares of common stock of 143,044 and 246,463 as a result of exercised or vested equity-based awards during the three and six months ended June 30, 2020, respectively, and 139,057 and 383,623 for the three and six months ended June 30, 2019, respectively. These amounts are net of 68,944 and 130,449 shares withheld to satisfy employee tax obligations related to the exercises and vestings during the three and six months ended June 30, 2020, respectively, and 153,940 and 324,076 for the three and six months ended June 30, 2019, respectively.
Delek Logistics GP, LLC 2012 Long-Term Incentive Plan
Note 16 - Shareholders' Equity
Dividends
During the six months ended June 30, 2020, our Board of Directors declared the following dividends:
Approval Date | Dividend Amount Per Share | Record Date | Payment Date | |||
February 24, 2020 | $ | March 10, 2020 | March 24, 2020 | |||
May 4, 2020 | $ | May 20, 2020 | June 3, 2020 | |||
Stock Repurchase Program
On November 6, 2018, our Board of Directors authorized a share repurchase program for up to $500.0 million of Delek common stock. Any share repurchases under the repurchase program may be implemented through open market transactions or in privately negotiated transactions, in accordance with applicable securities laws. The timing, price and size of repurchases are made at the discretion of management and will depend on prevailing market prices, general economic and market conditions and other considerations. The repurchase program does not obligate us to acquire any particular amount of stock and does not expire. During the six months ended June 30, 2020, 58,713 shares of our common stock were repurchased for a total of $1.9 million. No repurchases of our common stock were made in the three months
34 | | |
Notes to Condensed Consolidated Financial Statements (Unaudited)
ended June 30, 2020. During the three and six months ended June 30, 2019, we repurchased 1,647,078 and 2,938,722 shares of our common stock for a total of $58.6 million and $104.8 million, respectively. As of June 30, 2020, there was $229.7 million of authorization remaining under Delek's aggregate stock repurchase program.
Stockholder Rights Plan
On March 20, 2020, our Board of Directors declared a dividend of one preferred share purchase right (a “Right”) for each outstanding share of Delek’s common stock and adopted a stockholder rights plan (the “Rights Agreement”). The dividend was distributed in a non-cash transaction on March 30, 2020 to the stockholders of record on that date. The Rights initially trade with, and are inseparable from, Delek’s common stock. Once the Rights become exercisable, each Right will allow its holder to purchase one one-thousandth of a share of Series A Junior Participating Preferred Stock, par value $0.01 per share (a “Preferred Share”) for $92.24 , subject to adjustment (the “Exercise Price”). This portion of a Preferred Share will give the stockholder approximately the same dividend, voting and liquidation rights as would one share of Delek’s common stock. Prior to exercise, the Right does not give its holder any dividend, voting or liquidation rights.
The Rights will not be exercisable until 10 days after the public announcement that a person or group that has become an “Acquiring Person” (as defined in the Rights Agreement). The point at which these terms are met is otherwise referred to as the "Distribution Date." If a person or group becomes an Acquiring Person, all holders of Rights except the Acquiring Person may, for the Exercise Price, purchase shares of the Company’s common stock with a market value of two times the Exercise Price, based on the market price of the common stock prior to such acquisition. In addition, subject to certain conditions set forth in the Rights Agreement, the Board may extinguish the Rights. If the Company is later acquired in a merger or similar transaction after the Distribution Date, all holders of Rights except the Acquiring Person may, for the Exercise Price, purchase shares of the acquiring corporation with a market value of two times the Exercise Price, based on the market price of the acquiring corporation’s stock prior to such merger.
In the event the Company receives a fully financed, all-cash tender offer satisfying the conditions set forth in the Rights Agreement (a “Qualifying Offer”), and certain other events occur, the Rights Agreement provides a mechanism for stockholders holding more than 20 % of the shares of Delek common stock then outstanding (excluding shares beneficially owned by the person making the Qualifying Offer) to demand a special meeting of the stockholders of the Company to vote on a resolution exempting such Qualifying Offer from the provisions of the Rights Agreement.
The Rights will expire on March 19, 2021, subject to a possible earlier expiration to the extent provided in the Rights Agreement.
Preferred Stock
On March 20, 2020, our Board of Directors authorized 1,000,000 shares of preferred stock with a par value of $0.01 per share as Series A Junior Participating Preferred Stock.
Note 17 - Employees
Postretirement Benefits
Note 18 - Leases
We lease certain retail stores, land, building and various equipment from others. Leases with an initial term of 12 months or less are not recorded on the balance sheet; we recognize lease expense for these leases on a straight-line basis over the lease term. Most leases include one or more options to renew, with renewal terms that can extend the lease term from one to 15 years or more. The exercise of existing lease renewal options is at our sole discretion. Certain leases also include options to purchase the leased property. The depreciable life of assets and leasehold improvements are limited by the expected lease term, unless there is a transfer of title or purchase option reasonably certain of exercise.
Some of our lease agreements include a rate based on equipment usage and others include a rate with fixed increases or inflationary indices based increase. Our lease agreements do not contain any material residual value guarantees or material restrictive covenants. We rent or sublease certain real estate and equipment to third parties. Our sublease portfolio consists primarily of operating leases within our retail stores and crude storage equipment.
As of June 30, 2020, $27.3 million of our net property, plant, and equipment balance is subject to an operating lease. This agreement does not include options for the lessee to purchase our leasing equipment, nor does it include any material residual value guarantees or material restrictive covenants. The agreement includes a one year renewal option and certain variable payment based on usage.
35 | | |
Notes to Condensed Consolidated Financial Statements (Unaudited)
The following table presents additional information related to our operating leases in accordance ASC 842, Leases ("ASC 842"):
Three Months Ended June 30, | Six Months Ended June 30, | |||||||||||||||
(in millions) | 2020 | 2019 | 2020 | 2019 | ||||||||||||
Lease Cost | ||||||||||||||||
Operating lease costs | $ | $ | $ | $ | ||||||||||||
Short-term lease costs (1) | ||||||||||||||||
Sublease income | ( | ) | ( | ) | ( | ) | ( | ) | ||||||||
Net lease costs | $ | $ | $ | $ | ||||||||||||
Other Information | ||||||||||||||||
Cash paid for amounts included in the measurement of lease liabilities: | ||||||||||||||||
Operating cash flows from operating leases | $ | ( | ) | $ | ( | ) | $ | ( | ) | $ | ( | ) | ||||
Leased assets obtained in exchange for new operating lease liabilities | $ | $ | $ | $ | ||||||||||||
June 30, 2020 | ||||||||||||||||
Weighted-average remaining lease term (years) operating leases | ||||||||||||||||
Weighted-average discount rate operating leases (2) | % | |||||||||||||||
(1) Includes an immaterial amount of variable lease cost.
(2) Our discount rate is primarily based on our incremental borrowing rate in accordance with ASC 842.
Note 19 - Subsequent Events
Dividend Declaration
36 | | |
Management's Discussion and Analysis
ITEM 2. MANAGEMENT’S DISCUSSION AND ANALYSIS OF FINANCIAL CONDITION AND RESULTS OF OPERATIONS
Management’s Discussion and Analysis of Financial Condition and Results of Operations ("MD&A") is management’s analysis of our financial performance and of significant trends that may affect our future performance. The MD&A should be read in conjunction with our condensed consolidated financial statements and related notes included elsewhere in this Quarterly Report on Form 10-Q and in the Annual Report on Form 10-K as filed with the Securities and Exchange Commission ("SEC") on February 28, 2020 (the "Annual Report on Form 10-K"). Those statements in the MD&A that are not historical in nature should be deemed forward-looking statements that are inherently uncertain.
Unless otherwise noted or the context requires otherwise, the terms "we," "our," "us," "Delek" and the "Company" are used in this report to refer to Delek and its consolidated subsidiaries for all periods presented. You should read the following discussion of our financial condition and results of operations in conjunction with our historical condensed consolidated financial statements and notes thereto.
The Company announces material information to the public about the Company, its products and services and other matters through a variety of means, including filings with the Securities and Exchange Commission, press releases, public conference calls, the Company’s website (www.delekus.com), the investor relations section of its website (ir.delekus.com), the news section of its website (www.delekus.com/news), and/or social media, including its Twitter account (@DelekUSHoldings). The Company encourages investors and others to review the information it makes public in these locations, as such information could be deemed to be material information. Please note that this list may be updated from time to time.
Forward-Looking Statements
This Quarterly Report on Form 10-Q contains "forward-looking statements" within the meaning of Section 27A of the Securities Act of 1933, as amended, and Section 21E of the Exchange Act. These forward-looking statements reflect our current estimates, expectations and projections about our future results, performance, prospects and opportunities. Forward-looking statements include, among other things, statements regarding the effect, impact, potential duration or other implications of, or expectations expressed with respect to, the recent outbreak COVID-19 and the actions of members of the Organization of Petroleum Exporting Countries (“OPEC”) and Russia with respect to oil production and pricing, and statements regarding our efforts and plans in response to such events, the information concerning our possible future results of operations, business and growth strategies, financing plans, expectations that regulatory developments or other matters will or will not have a material adverse effect on our business or financial condition, our competitive position and the effects of competition, the projected growth of the industry in which we operate, and the benefits and synergies to be obtained from our completed and any future acquisitions, statements of management’s goals and objectives, and other similar expressions concerning matters that are not historical facts. Words such as "may," "will," "should," "could," "would," "predicts," "potential," "continue," "expects," "anticipates," "future," "intends," "plans," "believes," "estimates," "appears," "projects" and similar expressions, as well as statements in future tense, identify forward-looking statements.
Forward-looking statements should not be read as a guarantee of future performance or results, and will not necessarily be accurate indications of the times at, or by, which such performance or results will be achieved. Forward-looking information is based on information available at the time and/or management’s good faith belief with respect to future events, and is subject to risks and uncertainties that could cause actual performance or results to differ materially from those expressed in the statements. Important factors that, individually or in the aggregate, could cause such differences include, but are not limited to:
• | volatility in our refining margins or fuel gross profit as a result of changes in the prices of crude oil, other feedstocks and refined petroleum products and the impact of the COVID-19 Pandemic on such demand; |
• | reliability of our operating assets; |
• | actions of our competitors and customers; |
• | changes in, or the failure to comply with, the extensive government regulations applicable to our industry segments,including current and future restrictions on commercial and economic activities in response to the COVID-19 Pandemic; |
• | the possibility of inefficiencies, curtailments, or shutdowns in refinery operations or pipelines, whether due to infection in the workforce or in response to reductions in demand as a result of the COVID-19 Pandemic; |
• | our ability to execute our strategy of growth through acquisitions and capital projects and changes in the expected |
value of and benefits derived therefrom, including any ability to successfully integrate acquisitions, realize expected synergies or achieve operational efficiency and effectiveness;
• | diminishment in value of long-lived assets may result in an impairment in the carrying value of the assets on our balance sheet and a resultant loss recognized in the statement of operations; |
• | the unprecedented market environment and economic effects of the COVID-19 pandemic, including uncertainty regarding the timing, pace and extent of economic recovery in the United States due to the COVID-19 Pandemic; |
• | general economic and business conditions affecting the southern, southwestern and western United States, particularly levels of spending related to travel and tourism and the ongoing and future impacts of the COVID-19 Pandemic; |
• | volatility under our derivative instruments; |
37 | | |
Management's Discussion and Analysis
• | deterioration of creditworthiness or overall financial condition of a material counterparty (or counterparties); |
• | unanticipated increases in cost or scope of, or significant delays in the completion of, our capital improvement and periodic turnaround projects; |
• | risks and uncertainties with respect to the quantities and costs of refined petroleum products supplied to our pipelines and/or held in our terminals; |
• | operating hazards, natural disasters, casualty losses and other matters beyond our control; |
• | increases in our debt levels or costs; |
• | possibility of accelerated repayment on a portion of the J. Aron S&O liability if the purchase price adjustment feature triggers a change on the re-pricing dates; |
• | changes in our ability to continue to access the credit markets; |
• | compliance, or failure to comply, with restrictive and financial covenants in our various debt agreements; |
• | the inability of our subsidiaries to freely make dividends, loans or other cash distributions to us; |
• | seasonality; |
• | acts of terrorism (including cyber-terrorism) aimed at either our facilities or other facilities that could impair our ability to produce or transport refined products or receive feedstocks; |
• | future decisions by OPEC+ members regarding production and pricing and disputes between OPEC+ members regarding such; |
• | disruption, failure, or cybersecurity breaches affecting or targeting our IT systems and controls, our infrastructure, or the infrastructure of our cloud-based IT service providers; |
• | changes in the cost or availability of transportation for feedstocks and refined products; and |
• | other factors discussed under the headings "Management’s Discussion and Analysis of Financial Condition and Results of Operations" and "Risk Factors" and in our other filings with the SEC. |
In light of these risks, uncertainties and assumptions, our actual results of operations and execution of our business strategy could differ materially from those expressed in, or implied by, the forward-looking statements, and you should not place undue reliance upon them. In addition, past financial and/or operating performance is not necessarily a reliable indicator of future performance, and you should not use our historical performance to anticipate future results or period trends. We can give no assurances that any of the events anticipated by any forward-looking statements will occur or, if any of them do, what impact they will have on our results of operations and financial condition.
All forward-looking statements included in this report are based on information available to us on the date of this report. We undertake no obligation to revise or update any forward-looking statements as a result of new information, future events or otherwise.
Executive Summary
Business Overview |
We are an integrated downstream energy business focused on petroleum refining, the transportation, storage and wholesale distribution of crude oil, intermediate and refined products and convenience store retailing. Our operating segments consist of refining, logistics, and retail, and are discussed in the sections that follow.
The recent outbreak of COVID-19 and its development into a pandemic in March 2020 (the "COVID-19 Pandemic" or the "Pandemic") has resulted in significant economic disruption globally, including in the U.S. and specific geographic areas where we operate. Actions taken by various governmental authorities, individuals and companies around the world to prevent the spread of COVID-19 through both voluntary and mandated social distancing, curfews, shutdowns and expanded safety measures have restricted travel, many business operations, public gatherings and the overall level of individual movement and in-person interaction across the globe. This has in turn significantly reduced global economic activity which has had a significant impact on the nature and extent of travel. The COVID-19 Pandemic has had a devastating impact on the airline industry, dramatically reducing the number of domestic flights and, due to foreign travel bans and immigration restrictions abroad as well as traveler concerns over exposure, virtually eliminating international travel originating from the U.S to many parts of the world. Additionally, the COVID-19 Pandemic has had a significant negative impact on motor vehicle use at a time when seasonal driving patterns typically result in an increase of consumer demand for gasoline. As a result, there has also been a decline in the demand for, and thus also the market prices of, crude oil and certain of our products, particularly our refined petroleum products and most notably gasoline and jet fuel. In April and June 2020, agreements were reached to cut oil production between the members of the Organization of Petroleum Exporting Countries ("OPEC") and other leading oil producing countries (together with OPEC, “OPEC+”), as part of the efforts to resolve the oil production disputes that significantly affected crude oil prices beginning in the first quarter of 2020 (the "OPEC Production Disputes"), and to provide stability in the oil markets. While OPEC+ have reached an agreement to cut oil production, the uncertainty about the duration of the COVID-19 Pandemic has caused storage constraints in the United States resulting from over-supply of produced oil. Based on these conditions and events, downward pressure on commodity prices, crack spreads and demand remains a significant risk and could continue for the foreseeable future.
38 | | |
Management's Discussion and Analysis
During the latter part of the second quarter of 2020, governmental authorities in various states across the U.S., particularly those in our Permian Basin and U.S. Gulf Coast regions, began to lift many of the restrictions created by actions taken to slow down the spread of COVID-19. These actions have resulted in an increase in the level of individual movement and travel and, in turn, an increase in the demand and market prices for some of our products relative to late March 2020. However, many of the states where such restrictions were lifted have recently experienced a marked increase in the spread of COVID-19 and many governmental authorities in such areas have responded by reimposing certain restrictions they had previously lifted. This response, as well as the increased infection rates, impacts regions that we serve and could significantly impact demand in ways that we cannot predict. Additionally, increased infection rates could impact our refining, logistics and retail operations, particularly in high-infection states, if our employees are personally affected by the illness, both through direct infection and quarantine procedures.
During the three and six months ended June 30, 2020, Delek has experienced the impact on demand and pricing of these unprecedented conditions, most notably in our refining segment. Our business and our second quarter 2020 results reflect the impact of decreased demand combined with crack spreads that are 62% to 76% lower, on average, compared to the same quarter in the prior year. We have also experienced operational constraints as well, including COVID-19 infections at certain of our company locations that have resulted in re-imposed or expanded remote policies and quarantine protocols. And we continue to be faced with risk from our suppliers and customers who are facing similar challenges.
We have identified the following known uncertainties resulting from the COVID-19 Pandemic and the OPEC Production Disputes:
• | Significant declines and/or volatility in prices of refined products we sell and the feedstocks we purchase as well as in crack spreads resulting from the COVID-19 Pandemic and the OPEC Production Disputes could have a significant impact on our revenues, cost of sales, operating income and liquidity, as well to the carrying value of or long-lived or indefinite-lived assets; |
• | A decline in the market prices of refined products and feedstocks below the carrying value in our inventory may result in the adjustment of the value of our inventories to the lower market price and a corresponding loss on the value of our inventories (see also Note 1 to our Condensed Consolidated Financial Statements included in Part I, Item 1 of this Quarterly Report on Form 10-Q for additional discussion of specific financial statement risks); |
• | The decline in demand for refined product could significantly impact the demand for throughput at our refineries, unfavorably impacting operating results at our refineries, and could impact the demand for storage, which could impact our logistics segment; |
• | The decline in demand and margins impacting current results and forecasts could result in impairments in certain of our long-lived or indefinite-lived assets, including goodwill, or have other financial statement impacts that cannot currently be anticipated (see also Note 1 to our Condensed Consolidated Financial Statements included in Part I, Item 1 of this Quarterly Report on Form 10-Q for additional discussion of specific financial statement risks); |
• | A significant reduction or suspension in U.S. crude oil production could adversely affect our suppliers and sources of crude oil; |
• | An outbreak in one of our refineries, exacerbated by a limited pool of qualified replacements as well as quarantine protocols, could cause significant disruption in our production or, worst case, temporary idling of the facility; |
• | The restrictions on travel and requirements for social distancing could significantly impact the traffic at our convenience stores, particularly the demand for fuel; |
• | Customers of the refining segment as well as third-party customers of the logistics segment may experience financial difficulties which could interrupt the volumes ordered by those customers and/or could impact the credit worthiness of such customers and the collectability of their outstanding receivables; |
• | Equity method investees may be significantly impacted by the COVID-19 Pandemic and/or the OPEC Production Disputes, which may increase the risk of impairment of those investments; |
• | Access to capital markets may be significantly impacted by the volatility and uncertainty in the oil and gas market specifically which could restrict our ability to raise funds; |
• | While our current liquidity needs are managed by existing facilities, sources of future liquidity needs may be impacted by the volatility in the debt market and the availability and pricing of such funds as a result of the COVID-19 Pandemic and the OPEC Production Disputes; and |
• | The U.S. Federal Government has enacted certain stimulus and relief measures, including the Coronavirus Aid, Relief, and Economic Security Act (the "CARES Act") passed on March 27, 2020, and is continuing to consider additional relief legislation. Beyond the direct impact of existing legislation on Delek in the current period, the extent to which the provisions of the existing or any future legislation will achieve its intention to stimulate or provide relief to the greater U.S. economy and/or consumer, as well as the impact and success of such efforts, remains unknown. |
Other uncertainties related to the impact of the COVID-19 Pandemic as well as global geopolitical factors may exist that have not been identified or that are not specifically listed above, and could impact our future results of operations and financial position, the nature of which
39 | | |
Management's Discussion and Analysis
and the extent to which are currently unknown. Actions taken by OPEC+ in April and June 2020, including the agreement for management of crude oil supply in the hopes of contributing to market stabilization (the "Oil Production Cuts"), as well as the U.S. Federal Government's passage and/or enactment of additional stimulus and relief measures, as well as their future actions may impact the extent to which the risk underlying these uncertainties are realized. To the extent these uncertainties have been identified and are believed to have an impact on our current period results of operations or financial position based on the requirements for assessing such financial statement impact under U.S. Generally Accepted Accounting Principles ("GAAP"), we have considered them in the preparation of our unaudited financial statements as of and for the six months ended June 30, 2020, which are included in Item 1, of this Quarterly Report on Form 10-Q.
In addition, management continues to actively respond to the impact of the COVID-19 Pandemic and the OPEC Production Disputes on our business. Such efforts include (but are not limited to) the following:
• | Reviewing planned production throughputs at our refineries and planning for the possibility of reductions; |
• | Coordinating planned maintenance activities with possible downtime as a result of possible reductions in throughputs; |
• | Searching for additional storage capacity if needed to store potential builds in crude oil or refined product inventories; |
• | Reducing planned capital expenditures for 2020; |
• | Suspending the share repurchase program until our internal parameters are met for resuming such repurchases; |
• | Taking advantage of the income and payroll tax relief afforded to us by the CARES Act; |
• | Implementing remote work measures and safety protocols at our refineries and other locations; |
• | Reviewing dividend strategy to align with market changes and current economic conditions; |
• | Identifying alternative financing solutions to enhance our access to sources of liquidity; and |
• | Enacting cost reduction measures across the organization, including reducing contract services, reducing overtime and other employee related costs and reducing or eliminating non-critical travel which serves the dual purpose of also complying with recommendations made by the state and federal governments because of the COVID-19 Pandemic. |
The extent to which our future results are affected by the COVID-19 Pandemic will depend on various factors and consequences beyond our control, such as the duration and scope of the Pandemic; additional actions by businesses and governments in response to the Pandemic, and the speed and effectiveness of responses to combat the virus. The COVID-19 Pandemic, and the volatile regional and global economic conditions stemming from the Pandemic, could also exacerbate the risk factors identified in our Annual Report on Form 10-K for the fiscal year ended December 31, 2019 and in this Form 10-Q. The COVID-19 Pandemic may also materially adversely affect our results in a manner that is either not currently known or that we do not currently consider to be a significant risk to our business.
See also 'Risk Factors' in Part II, Item 1A. of this Quarterly Report on Form 10-Q for further discussion of risks associated with the COVID-19 Pandemic and the OPEC Production Disputes.
Pursuant to the provisions of the CARES Act, we recognized $16.8 million of current federal income tax benefit for the three and six months ended June 30, 2020, attributable to anticipated tax refunds from net operating loss carryback to prior 35% tax rate years. Additionally, we recorded an income tax receivable totaling $193 million as of June 30, 2020 related to the net operating loss carryback, which we expect to collect in the first half of 2021. Finally, we deferred $4.4 million of payroll tax payments under the provisions of the CARES Act during the six months ended June 30, 2020, which will be payable in equal installments in December 2021 and December 2022.
40 | | |
Management's Discussion and Analysis
Refining Overview |
The refining segment processes crude oil and other feedstocks for the manufacture of transportation motor fuels, including various grades of gasoline, diesel fuel and aviation fuel, asphalt and other petroleum-based products that are distributed through owned and third-party product terminals. The refining segment has a combined nameplate capacity of 302,000 barrels per day as of June 30, 2020. A high-level summary of the refinery activities is presented below:
Tyler, Texas refinery (the "Tyler refinery") | El Dorado, Arkansas refinery (the "El Dorado refinery") | Big Spring,Texas refinery (the "Big Spring refinery") | Krotz Springs, Louisiana refinery (the "Krotz Springs refinery") | |||||
Total Nameplate Capacity (barrels per day ("bpd")) | 75,000 | 80,000 | 73,000 | 74,000 | ||||
Primary Products | Gasoline, jet fuel, ultra-low-sulfur diesel, liquefied petroleum gases, propylene, petroleum coke and sulfur | Gasoline, ultra-low-sulfur diesel, liquefied petroleum gases, propylene, asphalt and sulfur | Gasoline, jet fuel, ultra-low-sulfur diesel, liquefied petroleum gases, propylene, aromatics and sulfur | Gasoline, jet fuel, high-sulfur diesel, light cycle oil, liquefied petroleum gases, propylene and ammonium thiosulfate | ||||
Relevant Crack Spread Benchmark (1) | Gulf Coast 5-3-2 | Gulf Coast 5-3-2 (2) | Gulf Coast 3-2-1 (3) | Gulf Coast 2-1-1 (4) | ||||
Marketing and Distribution | The refining segment's petroleum-based products are marketed primarily in the south central, southwestern and western regions of the United States, and the refining segment also ships and sells gasoline into wholesale markets in the southern and eastern United States. Motor fuels are sold under the Alon or Delek brand through various terminals to supply Alon or Delek branded retail sites. In addition, we sell motor fuels through our wholesale distribution network on an unbranded basis. | |||||||
(1) | The term "crack spread" is a measure of the difference between market prices for crude oil and refined products. |
(2) | While there is variability in the crude slate and the product output at the El Dorado refinery, we compare our per barrel refined product margin to the U.S. Gulf Coast ("Gulf Coast") 5-3-2 crack spread because we believe it to be the most closely aligned benchmark. |
(3) | Our Big Spring refinery is capable of processing substantial volumes of sour crude oil, which has historically cost less than intermediate, and/or substantial volumes of sweet crude oil, and therefore the West Texas Intermediate ("WTI") Cushing/ West Texas Sour ("WTS") price differential, taking into account differences in production yield, is an important measure for helping us make strategic, market-respondent production decisions. |
(4) | The Krotz Springs refinery has the capability to process substantial volumes of light sweet crude oil to produce a high percentage of refined light products |
Our refining segment also owns and operates three biodiesel facilities involved in the production of biodiesel fuels and related activities, located in Crossett, Arkansas, Cleburne, Texas, and New Albany, Mississippi.
Logistics Overview |
Our logistics segment gathers, transports and stores crude oil and markets, distributes, transports and stores refined products in select regions of the southeastern United States and West Texas for our refining segment and third parties. It is comprised of the consolidated balance sheet and results of operations of Delek Logistics Partners, LP ("Delek Logistics", NYSE:DKL), where we owned a 69.1% interest (at June 30, 2020) in Delek Logistics and a 94.8% interest in the entity that owns the entire 2.0% general partner interest in Delek Logistics and all of the incentive distribution rights. Delek Logistics was formed by Delek in 2012 to own, operate, acquire and construct crude oil and refined products logistics and marketing assets. A substantial majority of Delek Logistics' assets are currently integral to our refining and marketing operations. The logistics segment's pipelines and transportation business owns or leases capacity on approximately 400 miles of crude oil transportation pipelines, approximately 450 miles of refined product pipelines, an approximately 700-mile crude oil gathering system and associated crude oil storage tanks with an aggregate of approximately 10.2 million barrels of active shell capacity. Our logistics segment owns and operates nine light product terminals and markets light products using third-party terminals. The logistics segment also has strategic investments in pipeline joint ventures that provide access to pipeline capacity as well as the potential for earnings from joint venture operations. Additionally, on March 31, 2020, the logistics segment acquired from another of our segments approximately 200 miles of gathering and ancillary assets located in Howard, Borden and Martin Counties, Texas. In May 2020, the logistics segment acquired from another of our segments certain leased and owned tractors and trailers and related assets. The logistics segment owns or leases 273 tractors and 324 trailers used to haul primarily crude oil and other products for related and third parties.
41 | | |
Management's Discussion and Analysis
Retail Overview |
Our retail segment at June 30, 2020 includes the operations of 253 owned and leased convenience store sites located primarily in Central and West Texas and New Mexico. Our convenience stores typically offer various grades of gasoline and diesel under the DK or Alon brand name and food products, food service, tobacco products, non-alcoholic and alcoholic beverages, general merchandise as well as money orders to the public, primarily under the 7-Eleven and DK or Alon brand names pursuant to a license agreement with 7-Eleven, Inc. In November 2018, we terminated the license agreement with 7-Eleven, Inc. This agreement was amended in April 2020 to extend date for the required removal of all 7-Eleven branding on a store-by-store basis from December 31, 2021 to December 31, 2022. As of June 30, 2020, we have removed the 7-Eleven brand name at 57 of our store locations. Merchandise sales at our convenience store sites will continue to be sold under the 7-Eleven brand name until 7-Eleven branding is removed pursuant to the termination. Substantially all of the motor fuel sold through our retail segment is supplied by our Big Spring refinery, which is transferred to the retail segment at prices substantially determined by reference to published commodity pricing information. In connection with our retail strategic initiatives, as of June 30, 2020, we have closed or sold 46 under-performing or non-strategic store locations of which one was closed during the six months ended June 30, 2020.
The cost to acquire the refined fuel products we sell to our wholesale customers in our logistics segment and at our convenience stores in our retail segment depends on numerous factors beyond our control, including the supply of, and demand for, crude oil, gasoline and other refined petroleum products which, in turn, depend on, among other factors, changes in domestic and foreign economies, weather conditions, domestic and foreign political affairs, production levels, the availability of imports, the marketing of competitive fuels and government regulation. Our retail merchandise sales are driven by convenience, customer service, competitive pricing and branding. Motor fuel margin is sales less the delivered cost of fuel and motor fuel taxes, measured on a cents per gallon basis. Our motor fuel margins are impacted by local supply, demand, weather, competitor pricing and product brand.
Corporate and Other Overview |
Our corporate activities, results of certain immaterial operating segments, including our asphalt terminal operations, our recently commenced wholesale crude operations, and intercompany eliminations are reported in corporate, other and eliminations in our segment disclosures. Additionally, our corporate activities include certain of our commodity and other hedging activities.
Strategic Overview |
The Company's overall strategy has been to take a disciplined approach that looks to balance returning cash to our shareholders and prudently investing in the business to support safe and reliable operations, while exploring opportunities for growth. Our goal has been to balance the different aspects of this program based on evaluations of each opportunity and how it matches our strategic goals for the company, while factoring in market conditions and expected cash generation.
In the face of the economic impact of the COVID-19 Pandemic and the OPEC Production Disputes, our overall strategy remains unchanged and continues to be focused on the following objectives:
I. Safety and wellness.
II. Reliability and integrity.
III. Systems and processes.
IV. Risk-based decision making.
V. Positioning for growth.
In addition to the above, it continues to be a strategic and operational objective to manage price and supply risk related to crude oil that is used in refinery production, and to develop strategic sourcing relationships. For that purpose, from a pricing perspective, we enter into commodity derivative contracts to manage our price exposure to our inventory positions, future purchases of crude oil and ethanol, future sales of refined products or to fix margins on future production. We also enter into future commitments to purchase or sell renewable identification numbers ("RINs") at fixed prices and quantities, which are used to manage the costs of our credits for commitments required by the U.S. Environmental Protection Agency ("EPA") to blend biofuels into fuel products ("RINs Obligation"). Additionally, from a sourcing perspective, we often enter into purchase and sale contracts with vendors and customers or take financial commodity positions for crude oil that may not be used immediately in production, but that may be used to manage the overall supply and availability of crude expected to ultimately be needed for production and/or to meet minimum requirements under strategic pipeline arrangements, and also to optimize and hedge availability risks associated with crude that we ultimately expect to use in production. Such transactions are inherently based on certain assumptions and judgments made about the current and possible future availability of crude. Therefore, when we take physical or financial positions for optimization purposes, our intent is generally to take offsetting positions in quantities and at prices that will advance these objectives while minimizing our positional and financial statement risk. However, because of the volatility of the market in terms of pricing and availability, it is possible that we may have material positions with timing differences or, more rarely, that we are unable to cover a position with an offsetting
42 | | |
Management's Discussion and Analysis
position as intended. Such differences could have a material impact on the classification of resulting gains/losses, assets or liabilities, and could also significantly impact net earnings.
With these objectives serving as our guiding principles, we are applying the short-term measures to mitigate the impact of the COVID-19 Pandemic and the OPEC Production Disputes described in the 'Business Overview' above. And with these objectives in mind, we have achieved the following successes to date in 2020:
2020 Developments
Transactions designed to maximize shareholder return
Dividend Declaration
On August 3, 2020, Delek's Board of Directors voted to declare a quarterly cash dividend of $0.31 per share, payable on September 3, 2020, to stockholders of record on August 19, 2020. Our previous quarterly cash dividend amounts ranged between $0.27 to $0.30 per share for dividends paid throughout 2019 and was $0.31 per share for the dividends paid during both the first and second quarters of 2020.
Share Repurchases
During the six months ended June 30, 2020, Delek repurchased 58,713 shares for an aggregate purchase price of $1.9 million under the most recent share repurchase plan which provided for repurchases of up to $500.0 million and was approved by the board on November 6, 2018. As of June 30, 2020, there remained $229.7 million available for repurchases under the most recent repurchase plan. In our efforts to conserve capital, for the time being we have suspended the repurchase of shares.
Transactions designed to maximize return on assets
Investment in Midstream Ventures
In July 2019, we acquired a 15% ownership interest in Wink to Webster Pipeline ("WWP"). WWP intends to construct and operate a crude oil pipeline system from Wink, Texas to Webster, Texas along with certain pipelines from Webster, Texas to other destinations in the Gulf Coast area. It is expected to span approximately 650 miles at completion. Under the agreements governing the joint venture, we must contribute our percentage interest of the applicable construction costs (including certain costs previously incurred by WWP), and it is anticipated that our capital contributions will total approximately $340 million to $380 million over the course of construction (expected to be two to three years).
On February 21, 2020, we, through our wholly-owned direct subsidiary Delek Energy, entered into the W2W Holdings LLC ("HoldCo") Agreement with MPLX Operations LLC ("MPLX") (collectively, with its wholly-owned subsidiaries, the "WWP Project Financing Joint Venture" or the "WWP Project Financing JV"). The WWP Project Financing JV was created for the specific purpose of obtaining financing, through its wholly-owned subsidiary, W2W Finance LLC, to fund the majority of our combined capital calls resulting from and occurring during the construction period of the pipeline system under the WWP Joint Venture, and to service that debt. In connection with the arrangement, both Delek Energy and MPLX contributed their respective 15% ownership interests to the WWP Project Financing JV as collateral for and in service of the related project financing. Accordingly, distributions received from WWP through the WWP Project Financing JV will first be applied in service of the related project financing debt, with excess distributions being made to the members of the WWP Project Financing JV as provided for in the W2W Holdings LLC Agreement and as allowed under the project financing debt. The obligations of the members under the W2W Holdings LLC Agreement are guaranteed by the parents of the members of the WWP Project Financing JV (i.e., for the Delek member, the guarantee is from Delek US Holdings, Inc.). Our investment is accounted for as an equity method investment.
See further discussion in Note 5 of our condensed consolidated financial statements included in Item 1, Financial Statements, of this Quarterly Report on Form 10-Q.
Increased Investment in Delek Logistics
Effective May 1, 2020, Delek through its wholly owned subsidiaries Lion Oil Company (“Lion Oil”) and Delek Refining, Ltd. (“Delek Refining”) contributed certain leased and owned tractors and trailers and related assets used in the provision of trucking and transportation services for crude oil, petroleum and certain other products throughout Arkansas, Oklahoma and Texas to Delek Trucking, LLC (“Delek Trucking”), a direct wholly owned subsidiary of Lion Oil. Following this contribution, Lion Oil sold all of the issued and outstanding membership interests in Delek Trucking (the “Acquisition”) to DKL Transportation, LLC (“DKL Transportation”), a wholly owned subsidiary of Delek Logistics. Promptly following the consummation of the Acquisition, Delek Trucking merged with and into DKL Transportation, with DKL Transportation continuing as the surviving entity. Total consideration for the Acquisition was approximately $48.0 million in cash, subject to certain post-closing adjustments, primarily financed with borrowings under Delek Logistics’ revolving credit facility.
Effective March 31, 2020, Delek Logistics, through its wholly-owned subsidiary DKL Permian Gathering, LLC, acquired the Big Spring Gathering System, located in Howard, Borden and Martin Counties, Texas, from Delek. Delek Logistics will operate and maintain the Big Spring Gathering System connecting our interests in and to certain crude oil production with the Delek Logistics' Big Spring, Texas terminal and provide gathering, transportation and other related services. The total consideration was subject to certain post-closing adjustments and was comprised of $100.0 million in cash and 5.0 million common units representing limited partner interest in Delek Logistics. The cash component of this dropdown
43 | | |
Management's Discussion and Analysis
was financed with borrowings on the Delek Logistics Credit Facility (as defined in Note 8 of our condensed consolidated financial statements included in Item 1, Financial Statements).
Additionally, in March 2020, we purchased 451,822 of Delek Logistics limited partner units from a public investor for approximately $5.0 million. As a result of these transactions, our ownership in Delek Logistics' common limited partner units was increased to 70.5%. These continued investments enhance our ability to maximize the value of our logistics assets.
See further discussion in Note 4 of our condensed consolidated financial statements included in Item 1, Financial Statements, of this Quarterly Report on Form 10-Q.
Sale of Bakersfield Non-Operating Refinery
On May 7, 2020, we sold our equity interests in Alon Bakersfield Property, Inc., an indirect wholly-owned subsidiary that owns our non-operating refinery located in Bakersfield, California, to a subsidiary of Global Clean Energy Holdings, Inc. (“GCE”) for total cash consideration of $40 million. As part of the transaction, GCE granted a call option to Delek to acquire up to a 33 1/3% interest in the acquiring subsidiary, GCE Acquisitions, exercisable by Delek through the 90th day after GCE demonstrates commercial operations, as contractually defined.
See Note 2 of our condensed consolidated financial statements included in Item 1, Financial Statements, of this Quarterly Report on Form 10-Q.
Transactions designed to minimize the cost of capital/manage financial risk exposures
2020 Amendments to Supply and Offtake Agreements
In January 2020, we amended our three Supply and Offtake Agreements with J. Aron which applies to the El Dorado refinery, the Big Spring refinery and the Krotz Springs refinery so that the repurchase of Baseline Volumes at the end of the Supply and Offtake Agreement term (representing the "Baseline Step-Out Liability" or, collectively, the "Baseline Step-Out Liabilities") will be based on market-indexed price subject to commodity price risk with corresponding changes to underlying market-based indices and certain differentials. The amendments resulted in Baseline Step-Out Liabilities for which the fair value is no longer subject to interest rate risk but is now subject to commodity price volatility.
In April 2020, we amended and restated our three Supply and Offtake Agreements to amend and extend the terms to December 30, 2022, with J. Aron having the sole discretion to further extend to May 30, 2025 by providing at least six months notice prior to the maturity date. As part of this amendment, there were changes to the underlying market index, annual fee, the crude purchase fee, crude roll fees and timing of cash settlements related to periodic price adjustments on the fixed differential component of the Baseline Volume Step-Out Liabilities. The amendments provide us dedicated financing for the barrels covered through at least December 2022, and certain specific market-indexed provisions improve our ability to manage our exposure to commodity price volatility during the term of the Agreements.
See further discussion in Note 7 of our condensed consolidated financial statements included in Item 1, Financial Statements, of this Quarterly Report on Form 10-Q.
2020 Amendment to the Term Loan Credit Facility
On May 19, 2020, we amended the Term Loan Credit Facility agreement (as defined in Note 8 of our condensed consolidated financial statements included in Item 1, Financial Statements) and borrowed $200.0 million in aggregate principal amount of incremental term loans (the “Third Incremental Term Loan”) at an original issue discount of 7.00%, requiring quarterly principal amortization payments of $0.5 million commencing with June 30, 2020. The Third Incremental Term Loan constitutes a separate class of term loans under the Term Loan Credit Facility from those initially borrowed in March 2018 and the incremental term loans borrowed in May 2019 and November 2019. There are no restrictions on the Company's use of the proceeds of the Third Incremental Term Loan, and the proceeds may be used (i) for general corporate purposes and (ii) to pay transaction fees and expenses associated with the Third Incremental Term Loan.
See further discussion in Note 8 of our condensed consolidated financial statements included in Item 1, Financial Statements, of this Quarterly Report on Form 10-Q.
44 | | |
Management's Discussion and Analysis
Market Trends
Commodity Prices |
Our results of operations are significantly affected by fluctuations in the prices of certain commodities, including, but not limited to, crude oil, gasoline, distillate fuel, biofuels, natural gas and electricity, among others. Historically, our profitability has been affected by commodity price volatility, specifically as it relates to the price of crude oil and refined products. We have significant sources of WTI Midland crude because of our gathering system, and so accordingly favorable pricing of WTI Midland crude compared to other WTI crude can favorably impact our cost of materials and other and therefore our margins compared to other refiners.
The table below reflects the quarterly average prices of WTI Midland and WTI Cushing crude oil for each of the quarterly periods in 2019 and for the two quarterly periods in 2020. As shown in the historical graph, WTI Midland crude prices have generally been favorable as compared to WTI Cushing, though that trend has reversed slightly in the fourth quarter 2019.

Crack Spreads |
Crack spreads are used as benchmarks for predicting and evaluating a refinery's product margins by measuring the difference between the market price of feedstocks and crude oil and refined products. Generally, crack spreads represent the approximate refining margin resulting from processing one barrel of crude oil into its outputs, generally gasoline and diesel fuel.
The table below reflects the quarterly average Gulf Coast 5-3-2 Ultra Low Sulfur Diesel ("ULSD"), 3-2-1 and 2-1-1 crack spreads for each of the quarterly periods in 2019 and for the two quarterly periods in 2020. As the chart illustrates, the 3-2-1 crack spread has consistently outperformed the 5-3-2 and the 2-1-1 crack spreads. In such conditions, things being equal (i.e., near-capacity throughputs and no significant outages), our Big Spring refinery, whose benchmark is the 3-2-1 crack spread, should outperform our other refineries in terms of refining margin.

45 | | |
Management's Discussion and Analysis
Refined Product Prices |
Our refineries produce the following products:
Tyler Refinery | El Dorado Refinery | Big Spring Refinery | Krotz Springs Refinery | |
Primary Products | Gasoline, jet fuel, ultra-low-sulfur diesel, liquefied petroleum gases, propylene, petroleum coke and sulfur | Gasoline, ultra-low-sulfur diesel, liquefied petroleum gases, propylene, asphalt and sulfur | Gasoline, jet fuel, ultra-low-sulfur diesel, liquefied petroleum gases, propylene, aromatics and sulfur | Gasoline, jet fuel, high-sulfur diesel, light cycle oil, liquefied petroleum gases, propylene and ammonium thiosulfate |
The charts below illustrate the quarterly average prices of Gulf Coast Gasoline, U.S. High Sulfur Diesel and U.S. Ultra Low Sulfur Diesel for each of the quarterly periods in 2019 and for the two quarterly periods in 2020.

Crude Pricing Differentials |
As U.S. crude oil production has increased over recent years, domestic producers have benefited from the discount for WTI Cushing compared to Brent, a global benchmark crude. This generally leads to higher margins in our refineries, as refined product prices are influenced by Brent crude prices and the majority of our crude supply is WTI-linked. Because of our positioning in the Permian basin, we are even further benefited by discounts in the WTI Midland/WTI Cushing differential. When these discounts shrink or become premiums, our reliance on WTI-linked crude pricing, and specifically WTI Midland crude can negatively impact our results. Conversely, as these price discounts increase, so does our competitive advantage, created by our access to WTI-linked crude oil pricing, and specifically WTI Midland crude sources through our gathering systems.
The chart below illustrates the differentials of both Brent crude oil and WTI Midland crude oil as compared to WTI Cushing crude oil as well as WTI Cushing as compared to Louisiana Light Sweet crude oil ("LLS") for each of the quarterly periods in 2019 and for the two quarterly periods in 2020.
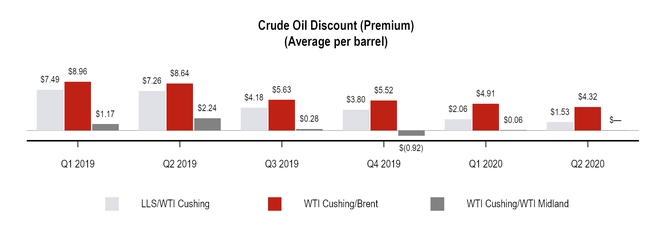
46 | | |
Management's Discussion and Analysis
RIN Volatility |
Environmental regulations continue to affect our margins in the form of volatility in the cost of RINs. On a consolidated basis, we work to balance the cost of our RINs Obligation in order to minimize the effect of RINs on our results. While we generate RINs in both our refining and logistics segments through our ethanol blending and biodiesel production, our refining segment needs to purchase additional RINs to satisfy its obligations. As a result, increases in the price of RINs generally adversely affect our results of operations. It is not possible at this time to predict with certainty what future volumes or costs may be, but given the volatile price of RINs, the cost of purchasing sufficient RINs could have an adverse impact on our results of operations if we are unable to recover those costs in the price of our refined products. The chart below illustrates the volatility in RINs prices over several quarterly periods, beginning with the first quarter of 2019 through the second quarter of 2020.

47 | | |
Management's Discussion and Analysis
Contractual Obligations
Information regarding our known contractual obligations and commercial commitments of the types described below as of June 30, 2020, is set forth in the following table (in millions):
Payments Due by Period | ||||||||||||||||||||
<1 Year | 1-3 Years | 3-5 Years | >5 Years | Total | ||||||||||||||||
Long term debt and notes payable obligations | $ | 33.4 | $ | 215.4 | $ | 2,240.5 | $ | — | $ | 2,489.3 | ||||||||||
Interest(1) | 85.2 | 164.2 | 97.5 | — | 346.9 | |||||||||||||||
Operating lease commitments(2) | 53.2 | 74.1 | 42.9 | 54.2 | 224.4 | |||||||||||||||
Purchase commitments(3) | 359.7 | — | — | — | 359.7 | |||||||||||||||
Transportation agreements(4) | 106.1 | 212.1 | 101.4 | 62.5 | 482.1 | |||||||||||||||
J. Aron supply and offtake obligations (5) | 15.5 | 238.3 | — | — | 253.8 | |||||||||||||||
Total | $ | 653.1 | $ | 904.1 | $ | 2,482.3 | $ | 116.7 | $ | 4,156.2 | ||||||||||
(1) Expected interest payments on debt outstanding at June 30, 2020. Floating interest rate debt is calculated using June 30, 2020 rates. For additional information, see Note 8 to of our condensed consolidated financial statements included in Item 1, Financial Statements, of this Quarterly Report on Form 10-Q.
(2) Amounts reflect future estimated lease payments under operating leases having remaining non-cancelable terms in excess of one year as of June 30, 2020.
(3) We have supply agreements to secure certain quantities of crude oil, finished product and other resources used in production at both fixed and market prices. We have estimated future payments under the market-based agreements using current market rates. Excludes purchase commitments in buy-sell transactions which have matching notional amounts with the same counterparty and are generally net settled.
(4) Balances consist of contractual obligations under agreements with third parties (not including Delek Logistics) for the transportation of crude oil to our refineries.
(5) Balances consists of contractual obligations under the J. Aron Supply and Offtake Agreements, including annual fees and principal obligation for the Baseline Volume Step-Out Liability. For additional information, see Note 7 to of our condensed consolidated financial statements included in Item 1, Financial Statements, of this Quarterly Report on Form 10-Q.
Critical Accounting Policies
The preparation of our consolidated financial statements requires us to make estimates and judgments that affect the reported amounts of assets, liabilities, revenues and expenses and related disclosure of contingent assets and liabilities. The SEC has defined critical accounting policies as those that are both most important to the portrayal of our financial condition and results of operations, and require our most difficult, subjective or complex judgments or estimates. Based on this definition and as further described in our 2019 Annual Report on Form 10-K, we believe our critical accounting policies include the following: (i) estimating our quarterly inventory adjustments using the last-in, first-out valuation method for the Tyler refinery, (ii) evaluating impairment for property, plant and equipment and definite life intangibles, (iii) evaluating potential impairment of goodwill, (iv) estimating environmental expenditures, and (v) estimating asset retirement obligations.
During the six months ended June 30, 2020, we updated our critical accounting policies to include accounting policies that have become critical as a result of new transactions. Accordingly, we are adding a critical accounting policy related to evaluating variable interest entities to reflect the significant judgment that is involved when determining whether an entity is a variable interest entity ("VIE") and evaluating whether we are the primary beneficiary in connection with our new investment in W2W Holdings LLC. See Note 5 of the condensed consolidated financial statements in Item 1, Financial Statements for discussion of our investment in W2W Holdings LLC and the related accounting treatment.
Evaluation of Variable Interest Entities
Our consolidated financial statements include the financial statements of our subsidiaries and VIEs, of which we are the primary beneficiary. We evaluate all legal entities in which we hold an ownership or other pecuniary interest to determine if the entity is a VIE. Variable interests can be contractual, ownership or other pecuniary interests in an entity that change with changes in the fair value of the VIE’s assets. If we are not the primary beneficiary, the general partner or another limited partner may consolidate the VIE, and we record the investment as an equity method investment. Significant judgment is exercised in determining that a legal entity is a VIE and in evaluating whether we are the primary beneficiary in a VIE. Generally, the primary beneficiary is the party that has both the power to direct the activities that most significantly impact the VIE’s economic performance and the right to receive benefits or obligation to absorb losses that could be potentially significant to the VIE. We evaluate the entity’s need for continuing financial support; the equity holder’s lack of a controlling financial interest; and/or if an equity holder’s voting interests are disproportionate to its obligation to absorb expected losses or receive residual returns. We evaluate our interests in a VIE to determine whether we are the primary beneficiary. We use a primarily qualitative analysis to determine if we are deemed to have a controlling financial interest in the VIE, either on a standalone basis or as part of a related party group. We continually monitor our interests in legal entities for changes in the design or activities of an entity and changes in our interests, including our status as the primary beneficiary to determine if the changes require us to revise our previous conclusions.
48 | | |
Management's Discussion and Analysis
Additionally, due to the economic and industry impact of the COVID-19 Pandemic and the OPEC Production Disputes, we also modified the application of certain of our critical accounting policies during and as of the six months ended June 30, 2020 as follows:
Goodwill and Potential Impairment
Our annual goodwill impairment analysis is performed during the fourth quarter of each year. Under Accounting Standards Codification ("ASC") ASC 350, Intangibles - Goodwill and Other, goodwill of a reporting unit shall be tested for impairment between annual tests if an event occurs or circumstances change that would more likely than not reduce the fair value of a reporting unit below its carrying amount.
During the six months ended June 30, 2020, we have identified two significant events that adversely affected the global economy and the oil and gas industry. These two events are the COVID-19 Pandemic and the OPEC Production Disputes (previously defined), both of which had the secondary effect of impacting prices of crude oil and refined products as well as supply and demand for crude oil and refined products, and triggered several identified uncertainties, as discussed in the 'Business Overview' section of Management's Discussion and Analysis. Our assessment was performed based on the events that had occurred through June 30, 2020 and excluded developments that occurred in the subsequent period, including but not limited to government-imposed temporary business closures and voluntary shelter-at-home directives as well as developments in production discussions between global oil producers, and the effect thereof. In order to determine whether these events, including the developments around such events that had occurred through June 30, 2020 and our assumptions about future periods based on those events and related developments, would more likely than not reduce the fair value of a reporting unit below its carrying amount, we performed certain analyses on the most significant inputs in our valuation model to evaluate the impact of these events on the fair value of our reporting units. This included sensitivity analysis and stress testing on certain of our inputs to our valuation model, including the weighted-average cost of capital, the throughput volume, and the crack spread, which is based on the crude and refined product markets. Based on our analyses, we determined that there is not an indicator that fair value is more likely than not to have declined below carrying value as of June 30, 2020.
Additionally, because conditions and events are rapidly changing, we continue to monitor developments with these events and their impact on our valuation. However, there is uncertainty in and around the impact of the COVID-19 Pandemic and the OPEC Production Disputes that have not yet occurred or for existing conditions and events that may have future ramifications that cannot yet be anticipated. Continued or sustained adverse change to these factors may result in potential future impairment of some or all of our goodwill balance.
Other than as described above, for all financial statement periods presented, there have been no material modifications to the application of these critical accounting policies or estimates since our most recently filed Annual Report on Form 10-K. See Note 1 of the condensed consolidated financial statements in Item 1, Financial Statements for discussion of updates to our accounting policies.
Non-GAAP Measures
Our management uses certain “non-GAAP” operational measures to evaluate our operating segment performance and non-GAAP financial measures to evaluate past performance and prospects for the future to supplement our GAAP financial information presented in accordance with U.S. GAAP. These financial and operational non-GAAP measures are important factors in assessing our operating results and profitability and include:
• | Refining margin - calculated as the difference between net refining revenues and total cost of materials and other; |
• | Refined product margin - calculated as the difference between net revenues attributable to refined products (produced and purchased) and related cost of materials and other (which is applicable to both the refining segment and the west Texas wholesale marketing activities within our logistics segment); and |
• | Refining margin per barrels sold - calculated as refining margin divided by our average refining sales in barrels per day (excluding purchased barrels) multiplied by 1,000 and multiplied by the number of days in the period. |
We believe these non-GAAP operational and financial measures are useful to investors, lenders, ratings agencies and analysts to assess our ongoing performance because, when reconciled to their most comparable GAAP financial measure, they provide improved comparability between periods through the exclusion of certain items that we believe are not indicative of our core operating performance and they may obscure our underlying results and trends.
Non-GAAP measures have important limitations as analytical tools, because they exclude some, but not all, items that affect net earnings and operating income. These measures should not be considered substitutes for their most directly comparable U.S. GAAP financial measures.
49 | | |
Management's Discussion and Analysis
Non-GAAP Reconciliations
The following table provides a reconciliation of refining margin to the most directly comparable U.S.GAAP measure, gross margin:
Reconciliation of refining margin to gross margin
Refining Segment | ||||||||||||||||
Three Months Ended June 30, | Six Months Ended June 30, | |||||||||||||||
2020 | 2019 | 2020 | 2019 | |||||||||||||
Net revenues | $ | 1,077.0 | $ | 2,367.8 | $ | 2,804.9 | $ | 4,459.8 | ||||||||
Cost of sales | 1,062.1 | 2,202.9 | 3,117.6 | 4,024.1 | ||||||||||||
Gross margin | 14.9 | 164.9 | (312.7 | ) | 435.7 | |||||||||||
Add back (items included in cost of sales): | ||||||||||||||||
Operating expenses (excluding depreciation and amortization) | 88.7 | 115.0 | 200.4 | 236.0 | ||||||||||||
Depreciation and amortization | 44.8 | 33.2 | 82.0 | 64.3 | ||||||||||||
Refining margin | $ | 148.4 | $ | 313.1 | $ | (30.3 | ) | $ | 736.0 | |||||||
Summary Financial and Other Information
The following table provides summary financial data for Delek:
Statement of Operations Data (in millions)
Consolidated | ||||||||||||||||
Three Months Ended June 30, | Six Months Ended June 30, | |||||||||||||||
2020 | 2019 | 2020 | 2019 | |||||||||||||
Net revenues | $ | 1,535.5 | $ | 2,480.3 | $ | 3,356.7 | $ | 4,680.2 | ||||||||
Total operating costs and expenses | 1,512.7 | 2,346.0 | 3,695.4 | 4,323.5 | ||||||||||||
Operating income (loss) | 22.8 | 134.3 | (338.7 | ) | 356.7 | |||||||||||
Total non-operating (income) expense, net | (39.8 | ) | 25.1 | (11.2 | ) | 47.3 | ||||||||||
Income (loss) before income tax (benefit) expense | 62.6 | 109.2 | (327.5 | ) | 309.4 | |||||||||||
Income tax (benefit) expense | (35.9 | ) | 24.6 | (119.0 | ) | 70.4 | ||||||||||
Income (loss) from continuing operations, net of tax | 98.5 | 84.6 | (208.5 | ) | 239.0 | |||||||||||
Loss from discontinued operations, net of tax | — | (0.8 | ) | — | (0.8 | ) | ||||||||||
Net income (loss) | 98.5 | 83.8 | (208.5 | ) | 238.2 | |||||||||||
Net income attributed to non-controlling interests | 10.8 | 6.5 | 18.2 | 11.6 | ||||||||||||
Net income (loss) attributable to Delek | $ | 87.7 | $ | 77.3 | $ | (226.7 | ) | $ | 226.6 | |||||||
We report operating results in three reportable segments:
• | Refining |
• | Logistics |
• | Retail |
Decisions concerning the allocation of resources and assessment of operating performance are made based on this segmentation. Management measures the operating performance of each of its reportable segments based on the segment contribution margin which is defined as net revenues less costs of materials and other and operating expenses, excluding depreciation and amortization.
50 | | |
Management's Discussion and Analysis
Results of Operations
Consolidated Results of Operations — Comparison of the Three and Six Months Ended June 30, 2020 versus the Three and Six Months Ended June 30, 2019
Net Loss
Q2 2020 vs. Q2 2019
Consolidated net income for the second quarter of 2020 was $98.5 million compared to $83.8 million for the second quarter of 2019. Consolidated net income attributable to Delek for the second quarter of June 30, 2020 was $87.7 million, or $1.19 per basic share, compared to $77.3 million, or $1.01 per basic share, for the second quarter 2019. Explanations for significant drivers impacting net income as compared to the comparable period of the prior year are discussed in the sections below.
YTD 2020 vs. YTD 2019
Consolidated net loss for the six months ended June 30, 2020 was $208.5 million compared to net income of $238.2 million for the six months ended June 30, 2019. Consolidated net loss attributable to Delek for the six months ended June 30, 2020 was $226.7 million, or $(3.08) per basic share, compared to net income of $226.6 million, or $2.94 per basic share, for the six months ended June 30, 2019. Explanations for significant drivers impacting net loss as compared to the comparable period of the prior year are discussed in the sections below.
Net Revenues
Q2 2020 vs. Q2 2019
In the second quarters of 2020 and 2019, we generated net revenues of $1,535.5 million and $2,480.3 million, respectively, a decrease of $944.8 million, or 38.1%. The decrease in net revenues was primarily driven by the following factors:
• | in our refining segment, decreases in the average price of U.S. Gulf Coast gasoline of 54.7%, ultra-low sulfur diesel of 53.1%, and high-sulfur diesel of 59.4% combined with a decrease in barrels sold (both refined and purchased) of 1.8 million barrels; |
• | in our retail segment, decreases in fuel sales volumes due to demand slowdown as a result of COVID-19 Pandemic and reduction in average number of stores, as well as a 31.7% decrease in average price charged per gallon; partially offset by increase in merchandise sales; and |
• | in our logistics segment, decreases in average price per gallon sold combined with decreases in sales volumes in our West Texas marketing operations; partially offset by increased revenues associated with agreements executed in connection with Big Spring Gathering System and Delek Trucking acquisitions. |
YTD 2020 vs. YTD 2019
For the six months ended June 30, 2020 and 2019, we generated net revenues of $3,356.7 million and $4,680.2 million, respectively, a decrease of $1,323.5 million, or 28.3%. The decrease in net revenues was primarily driven by the following factors:
• | in our refining segment, decreases in the average price of U.S. Gulf Coast gasoline of 38.5%, ultra-low sulfur diesel of 37.7%, and high-sulfur diesel of 41.5%; |
• | in our retail segment, decreases in fuel sales volumes due to demand slowdown as a result of COVID-19 Pandemic and reduction in average number of stores, as well as a 17.1% decrease in average price charged per gallon; partially offset by an increase in merchandise sales; and |
• | in our logistics segment, decreases in average price per gallon sold in our West Texas marketing operations; partially offset increased revenues associated with agreements executed in connection with Big Spring Gathering System and Delek Trucking acquisitions, and increased throughputs at our SALA gathering system and Magnolia pipeline. |
Cost of Materials and Other
Q2 2020 vs. Q2 2019
Cost of materials and other was $1,277.8 million for the second quarter of 2020 compared to $2,067.7 million for the second quarter of 2019, a decrease of $789.9 million, or 38.2%. The net decrease in cost of materials and other was primarily driven by the following:
• | a narrowing of crude oil differentials during the second quarter where the Midland WTI crude oil differential to Brent crude oil was an average discount of $3.58 per barrel compared to $10.88 per barrel in the prior-year period, and the WTI Midland to WTI Cushing discount averaged nearly zero in the second quarter 2020 compared to a discount of $2.24 per barrel in the prior-year period; |
51 | | |
Management's Discussion and Analysis
• | the net reversal (expense) benefit of $203.1 million related to inventory valuation reserves recognized during the second quarter of 2020 compared to $(0.6) million recognized during the second quarter of 2019, partially offset by a decrease in hedging gains to a loss of $154.4 million recognized during the second quarter of 2020 from a gain of $30.7 million recognized during the second quarter of 2019; |
• | decreases in cost of crude oil feedstocks at the refineries, including a decrease in the cost of WTI Cushing crude oil from an average of $59.80 per barrel to an average of $29.77; |
• | decreases in the diesel sales volumes and decreases in the average cost per gallon of gasoline and diesel purchased in the logistics segment; and |
• | a decrease in retail fuel cost of materials and other attributable to demand slowdown, a reduction in average number of stores and a decrease in average cost per gallon of $0.98. |
YTD 2020 vs. YTD 2019
Cost of materials and other was $3,188.4 million for the six months ended June 30, 2020 compared to $3,767.1 million for the six months ended June 30, 2019, a decrease of $578.7 million, or 15.4%. The net decrease in cost of materials and other was primarily driven by the following:
• | a narrowing of crude oil differentials during the six months ended June 30, 2020 where the Midland WTI crude oil differential to Brent crude oil was an average discount of $4.26 per barrel compared to $10.49 per barrel in the prior-year period, and the WTI Midland to WTI Cushing discount averaged $0.03 per barrel in the six months ended June 30, 2020 compared to a discount of $1.71 per barrel in the prior-year period; |
• | increases in ethanol RIN prices which averaged $0.34 per RIN in six months ended June 30, 2020 compared to $0.18 per RIN in the prior-year period; |
• | in the logistics segment, decreases in the diesel sales volumes and decreases in the average cost per gallon of gasoline and diesel purchased; and |
• | a decrease in retail fuel cost of materials and other attributable to demand slowdown, a reduction in number of stores and a decrease in average cost per gallon of $0.54. |
Such increases were partially offset by the following:
• | a decrease in hedging gains to a loss of $88.1 million recognized during the six months ended June 30, 2020 from a gain of $50.5 million recognized during the six months ended June 30, 2019. |
Operating Expenses
Q2 2020 vs. Q2 2019
Operating expenses were $127.8 million for the second quarter of 2020 compared to $162.3 million for the second quarter of 2019, a decrease of $34.5 million, or 21.3%. The decrease in operating expenses was primarily driven by the following:
• | decrease in outside service costs across all segments due to cost reduction measures; |
• | decreases in the refining segment related to catalyst and chemical costs, maintenance costs and cost reduction associated with the sale of our Bakersfield refinery during the quarter; and |
• | decrease in retail operating expenses due to reduction in number of stores. |
YTD 2020 vs. YTD 2019
Operating expenses were $282.3 million for the six months ended June 30, 2020 compared to $329.0 million for the six months ended June 30, 2019, an decrease of $46.7 million, or 14.2%. The decrease in operating expenses was primarily driven by the following:
• | decrease in outside service costs across all segments due to cost reduction measures; |
• | decreases in the refining segment related to lower employee, utilities, catalysts and maintenance costs; and |
• | decrease in retail operating expenses due to reduction in number of stores. |
General and Administrative Expenses
Q2 2020 vs. Q2 2019
General and administrative expenses were $61.7 million for the second quarter of 2020 compared to $69.5 million for the second quarter of 2019, a decrease of $7.8 million, or 11.2%. The decrease in general and administrative expense was primarily driven by the following:
52 | | |
Management's Discussion and Analysis
• | decrease in contract services due to cost reduction measures; and |
• | decrease in loss allowance on a note receivable. |
YTD 2020 vs. YTD 2019
General and administrative expenses were $127.4 million and $131.7 million for the six months ended June 30, 2020 and 2019, respectively, a decrease of $4.3 million, or 3.3%. The decrease in general and administrative expense was primarily driven by the following:
• | decrease in contract services due to cost reduction measures; and |
• | decrease in loss allowance on a note receivable. |
These decreases were partially offset by increases in salaried labor, including severance, partially offset by decrease in incentive accrual.
Depreciation and Amortization
Q2 2020 vs. Q2 2019
Depreciation and amortization (included in both cost of sales and other operating expenses) was $59.6 million for the second quarter of 2020 compared to $50.1 million for the second quarter of 2019, an increase of $9.5 million, or 19.0%, primarily due to depreciation associated with assets added during the Big Spring refinery turnaround in the first quarter of 2020, the El Dorado turnaround assets added in the second quarter of 2019 and the addition of the alkylation unit at our Krotz Springs refinery late in the second quarter of 2019.
YTD 2020 vs. YTD 2019
Depreciation and amortization (included in both cost of sales and other operating expenses) was $112.2 million compared to $96.9 million for the six months ended June 30, 2020 and 2019, respectively, a increase of $15.3 million, or 15.8%, primarily due to depreciation associated with assets added during the Big Spring refinery turnaround in the first quarter of 2020, the El Dorado turnaround assets added in the second quarter of 2019 and the addition of the alkylation unit at our Krotz Springs refinery late in the second quarter of 2019.
Other Operating Income, Net
Q2 2020 vs. Q2 2019
Other operating income, net increased by $10.6 million in the second quarter of 2020 to income of $14.2 million compared to $3.6 million in the second quarter of 2019.
YTD 2020 vs. YTD 2019
Other operating income, net increased by $13.7 million during the six months ended June 30, 2020 to $14.9 million compared to income of $1.2 million during the six months ended June 30, 2019.
Non-operating Expenses, Net
Interest Expense
Q2 2020 vs. Q2 2019
Interest expense decreased by $3.0 million, or 9.1%, to $29.8 million in the second quarter of 2020 compared to $32.8 million in the second quarter of 2019, primarily driven by the following:
• | a decrease in the average effective interest rate of 1.38% in the second quarter of 2020 compared to the second quarter of 2019 (where effective interest rate is calculated as interest expense divided by the net average borrowings/obligations outstanding), partially offset by an increase in net average borrowings outstanding (including the obligations under the Supply and Offtake Agreements which have an associated interest charge) of approximately $410.1 million in the second quarter of 2020 (calculated as a simple average of beginning borrowings/obligations and ending borrowings/obligations for the period) compared to the second quarter of 2019. |
YTD 2020 vs. YTD 2019
Interest expense increased by $4.6 million, or 7.5%, to $66.1 million during the six months ended June 30, 2020 compared to $61.5 million during the six months ended June 30, 2019, primarily driven by the following:
• | an increase in net average borrowings outstanding (including the obligations under the supply and offtake agreements which have an associated interest charge) of approximately $435.3 million during the six months ended June 30, 2020 (calculated as a simple average of beginning borrowings/obligations and ending borrowings/obligations for the period) compared to the six months ended June 30, 2019, partially offset by a decrease in the average effective interest rate of 0.56% during the six months ended June 30, 2020 compared to the |
53 | | |
Management's Discussion and Analysis
six months ended June 30, 2019 (where effective interest rate is calculated as interest expense divided by the net average borrowings/obligations outstanding).
Results from Equity Method Investments
Q2 2020 vs. Q2 2019
We recognized income of $10.7 million from equity method investments during the second quarter of 2020, compared to $9.3 million for the second quarter of 2019, an increase of $1.4 million.
YTD 2020 vs. YTD 2019
During the six months ended June 30, 2020, we recognized income of $15.8 million from equity method investments, compared to $11.9 million for the six months ended June 30, 2019, an increase of $3.9 million. This increase was primarily driven by the following:
• | the addition of the Red River Joint Venture in May 2019 which contributed income of $4.7 million in the six months ended June 30, 2020 compared to $2.3 million in the six months ended June 30, 2019; and |
• | an increase in income from our other logistics joint ventures from $4.1 million in the six months ended June 30, 2019 to $7.3 million in the six months ended June 30, 2020. |
Such increases were partially offset by losses attributable to our investment in WWP and the WWP Project Financing JV, which is still in the construction period.
Other
During the three and six months ended June 30, 2020, we recognized a gain of $56.9 million on the sale of our non-operating refinery located in Bakersfield, California. See Note 2 of the condensed consolidated financial statements in Item 1, Financial Statements, for additional information.
Q2 2020 vs. Q2 2019
Other income increased $6.4 million, to $1.5 million in second quarter of 2020 compared to a loss of $4.9 million in the second quarter of 2019.
YTD 2020 vs. YTD 2019
Other income increased $5.9 million, to $2.4 million in the six months ended June 30, 2020, compared to a loss of $3.5 million in the six months ended June 30, 2019.
Income Taxes
Q2 2020 vs. Q2 2019
Income tax expense decreased by $60.5 million in the second quarter of 2020 compared to the second quarter of 2019, primarily driven by the following:
• | pre-tax income of $62.6 million in the second quarter of 2020, as compared to $109.2 million for the second quarter of 2019; and |
• | a decrease in our effective tax rate which was (57.3)% for the second quarter of 2020, compared to 22.5% for the second quarter of 2019 primarily due to the following: |
◦ | projected 2020 federal net operating loss carryback to a prior 35% tax rate year creating a 14% rate benefit; and |
◦ | an increase in the estimated annual effective tax rate applied to year-to-date loss for the quarter. |
YTD 2020 vs. YTD 2019
Income tax expense decreased by $189.4 million during the six months ended June 30, 2020 compared to the same period for 2019, primarily driven by the following:
• | pre-tax loss of $327.5 million in the six months ended June 30, 2020, as compared to pre-tax income of $309.4 million for the six months ended June 30, 2019; and |
• | an increase in our effective tax rate which was 36.3% for the six months ended June 30, 2020, compared to 22.8% for the six months ended June 30, 2019 primarily due to the following: |
◦ | projected 2020 federal net operating loss carryback to a prior 35% tax rate year creating a 14% tax rate arbitrage; and |
◦ | reversal of a valuation allowance attributable to book-tax basis differences in partnership investments reported as a discrete benefit in the first quarter. |
54 | | |
Management's Discussion and Analysis
Refining Segment |
The tables and charts below set forth certain information concerning our refining segment operations ($ in millions, except per barrel amounts):
Refining Segment Margins | ||||||||||||||||
Three Months Ended June 30, | Six Months Ended June 30, | |||||||||||||||
2020 | 2019 | 2020 | 2019 | |||||||||||||
Net revenues | $ | 1,077.0 | $ | 2,367.8 | $ | 2,804.9 | $ | 4,459.8 | ||||||||
Cost of materials and other | 928.6 | 2,054.7 | 2,835.2 | 3,723.8 | ||||||||||||
Refining margin | 148.4 | 313.1 | (30.3 | ) | 736.0 | |||||||||||
Operating expenses (excluding depreciation and amortization) | 88.7 | 115.0 | 200.4 | 236.0 | ||||||||||||
Contribution margin | $ | 59.7 | $ | 198.1 | $ | (230.7 | ) | $ | 500.0 | |||||||
Factors Impacting Refining Profitability
Our profitability in the refining segment is substantially determined by the difference between the cost of the crude oil feedstocks we purchase and the price of the refined products we sell, referred to as the "crack spread", "refining margin" or "refined product margin". Refining margin is used as a metric to assess a refinery's product margins against market crack spread trends, where "crack spread" is a measure of the difference between market prices for crude oil and refined products and is a commonly used proxy within the industry to estimate or identify trends in refining margins.
The cost to acquire feedstocks and the price of the refined petroleum products we ultimately sell from our refineries depend on numerous factors beyond our control, including the supply of, and demand for, crude oil, gasoline and other refined petroleum products which, in turn, depend on, among other factors, changes in domestic and foreign economies, weather conditions such as hurricanes or tornadoes, local, domestic and foreign political affairs, global conflict, production levels, the availability of imports, the marketing of competitive fuels and government regulation. Other significant factors that influence our results in the refining segment include operating costs (particularly the cost of natural gas used for fuel and the cost of electricity), seasonal factors, refinery utilization rates and planned or unplanned maintenance activities or turnarounds. Moreover, while the fluctuations in the cost of crude oil are typically reflected in the prices of light refined products, such as gasoline and diesel fuel, the price of other residual products, such as asphalt, coke, carbon black oil and liquefied petroleum gas ("LPG") are less likely to move in parallel with crude cost. This could cause additional pressure on our realized margin during periods of rising or falling crude oil prices.
Additionally, our margins are impacted by the pricing differentials of the various types and sources of crude oil we use at our refineries and their relation to product pricing. Our crude slate is predominantly comprised of WTI crude oil. Therefore, favorable differentials of WTI compared to other crude will favorably impact our operating results, and vice versa. Additionally, because of our gathering system presence in the Midland area and the significant source of crude specifically from that region into our network, a widening of the WTI Cushing less WTI Midland spread will favorably influence the operating margin for our refineries. Alternatively, a narrowing of this differential will have an adverse effect on our operating margins. Global product prices are influenced by the price of Brent crude which is a global benchmark crude. Global product prices influence product prices in the U.S. As a result, our refineries are influenced by the spread between Brent crude and WTI Midland. The Brent less WTI Midland spread represents the differential between the average per barrel price of Brent crude oil and the average per barrel price of WTI Midland crude oil. A widening of the spread between Brent and WTI Midland will favorably influence our refineries' operating margins. Also, the Krotz Springs refinery is influenced by the spread between Brent crude and LLS. The Brent less LLS spread represents the differential between the average per barrel price of Brent crude oil and the average per barrel price of LLS crude oil. A discount in LLS relative to Brent will favorably influence the Krotz Springs refinery operating margin.
The cost to acquire the refined fuel products we sell to our wholesale customers in our logistics segment and at our convenience stores in our retail segment depends on numerous factors beyond our control, including the supply of, and demand for, crude oil, gasoline and other refined petroleum products which, in turn, depend on, among other factors, changes in domestic and foreign economies, weather conditions, domestic and foreign political affairs, production levels, the availability of imports, the marketing of competitive fuels and government regulation. Our retail merchandise sales are driven by convenience, customer service, competitive pricing and branding. Motor fuel margin is sales less the delivered cost of fuel and motor fuel taxes, measured on a cents per gallon basis. Our motor fuel margins are impacted by local supply, demand, weather, competitor pricing and product brand.
As part of our overall business strategy, we regularly evaluate opportunities to expand our portfolio of businesses and may at any time be discussing or negotiating a transaction that, if consummated, could have a material effect on our business, financial condition, liquidity or results of operations.
55 | | |
Management's Discussion and Analysis
Refinery Statistics | ||||||||||||||||
Three Months Ended June 30, | Six Months Ended June 30, | |||||||||||||||
2020 | 2019 | 2020 | 2019 | |||||||||||||
(Unaudited) | (Unaudited) | |||||||||||||||
Tyler, TX Refinery | ||||||||||||||||
Days in period | 91 | 91 | 182 | 181 | ||||||||||||
Total sales volume - refined product (average barrels per day)(1) | 69,746 | 77,657 | 72,364 | 73,863 | ||||||||||||
Products manufactured (average barrels per day): | ||||||||||||||||
Gasoline | 37,225 | 39,997 | 38,633 | 39,671 | ||||||||||||
Diesel/Jet | 27,897 | 31,505 | 27,650 | 29,455 | ||||||||||||
Petrochemicals, LPG, natural gas liquids ("NGLs") | 3,216 | 3,318 | 2,604 | 2,690 | ||||||||||||
Other | 1,319 | 1,654 | 1,281 | 1,411 | ||||||||||||
Total production | 69,657 | 76,474 | 70,168 | 73,227 | ||||||||||||
Throughput (average barrels per day): | ||||||||||||||||
Crude Oil | 64,408 | 71,918 | 65,187 | 68,219 | ||||||||||||
Other feedstocks | 5,848 | 5,106 | 5,648 | 5,785 | ||||||||||||
Total throughput | 70,256 | 77,024 | 70,835 | 74,004 | ||||||||||||
Per barrel of refined product sales: | ||||||||||||||||
Tyler refining margin (2) | $ | 32.72 | $ | 12.15 | 4.62 | $ | 16.84 | |||||||||
Direct operating expenses | $ | 3.00 | $ | 3.65 | 3.38 | $ | 4.15 | |||||||||
Crude Slate: (% based on amount received in period) | ||||||||||||||||
WTI crude oil | 94.2 | % | 87.7 | % | 93.3 | % | 89.3 | % | ||||||||
East Texas crude oil | 5.8 | % | 12.3 | % | 6.7 | % | 10.7 | % | ||||||||
El Dorado, AR Refinery | ||||||||||||||||
Days in period | 91 | 91 | 182 | 181 | ||||||||||||
Total sales volume - refined product (average barrels per day)(1) | 76,059 | 51,002 | 76,805 | 51,717 | ||||||||||||
Products manufactured (average barrels per day): | ||||||||||||||||
Gasoline | 34,346 | 21,821 | 35,376 | 21,159 | ||||||||||||
Diesel | 30,060 | 17,802 | 28,849 | 16,633 | ||||||||||||
Petrochemicals, LPG, NGLs | 2,063 | 551 | 2,062 | 678 | ||||||||||||
Asphalt | 6,049 | 6,961 | 6,345 | 5,899 | ||||||||||||
Other | 605 | 683 | 788 | 661 | ||||||||||||
Total production | 73,123 | 47,818 | 73,420 | 45,030 | ||||||||||||
Throughput (average barrels per day): | ||||||||||||||||
Crude Oil | 71,406 | 47,935 | 71,514 | 44,542 | ||||||||||||
Other feedstocks | 2,369 | 359 | 2,506 | 1,270 | ||||||||||||
Total throughput | 73,775 | 48,294 | 74,020 | 45,812 | ||||||||||||
Per barrel of refined product sales: | ||||||||||||||||
El Dorado refining margin | $ | 3.08 | $ | 8.93 | $ | (2.74 | ) | $ | 11.21 | |||||||
Direct operating expenses | $ | 3.53 | $ | 5.93 | $ | 3.98 | $ | 6.31 | ||||||||
Crude Slate: (% based on amount received in period) | ||||||||||||||||
WTI crude oil | 51.4 | % | 43.9 | % | 42.9 | % | 42.6 | % | ||||||||
Local Arkansas crude oil | 14.7 | % | 29.0 | % | 17.0 | % | 28.3 | % | ||||||||
Other | 33.9 | % | 27.1 | % | 40.1 | % | 29.1 | % | ||||||||
56 | | |
Management's Discussion and Analysis
Refinery Statistics (continued) | ||||||||||||||||
Three Months Ended June 30, | Six Months Ended June 30, | |||||||||||||||
2020 | 2019 | 2020 | 2019 | |||||||||||||
(Unaudited) | (Unaudited) | |||||||||||||||
Big Spring, TX Refinery | ||||||||||||||||
Days in period | 91 | 91 | 182 | 181 | ||||||||||||
Total sales volume - refined product (average barrels per day) (1) | 70,679 | 78,158 | 54,382 | 79,993 | ||||||||||||
Products manufactured (average barrels per day): | ||||||||||||||||
Gasoline | 35,789 | 36,428 | 25,198 | 37,657 | ||||||||||||
Diesel/Jet | 27,924 | 26,638 | 18,860 | 27,494 | ||||||||||||
Petrochemicals, LPG, NGLs | 3,563 | 3,679 | 2,472 | 3,763 | ||||||||||||
Asphalt | 2,055 | 1,900 | 1,452 | 1,707 | ||||||||||||
Other | 1,208 | 1,354 | 844 | 1,296 | ||||||||||||
Total production | 70,539 | 69,999 | 48,826 | 71,917 | ||||||||||||
Throughput (average barrels per day): | ||||||||||||||||
Crude oil | 70,327 | 72,965 | 50,116 | 72,649 | ||||||||||||
Other feedstocks | 1,483 | (581 | ) | 78 | 648 | |||||||||||
Total throughput | 71,810 | 72,384 | 50,194 | 73,297 | ||||||||||||
Per barrel of refined product sales: | ||||||||||||||||
Big Spring refining margin | $ | 7.88 | $ | 13.77 | $ | 0.71 | $ | 16.00 | ||||||||
Direct operating expenses | $ | 3.55 | $ | 3.69 | $ | 4.89 | $ | 3.75 | ||||||||
Crude Slate: (% based on amount received in period) | ||||||||||||||||
WTI crude oil | 83.9 | % | 73.3 | % | 75.1 | % | 76.3 | % | ||||||||
WTS crude oil | 16.1 | % | 26.7 | % | 24.9 | % | 23.7 | % | ||||||||
Krotz Springs, LA Refinery | ||||||||||||||||
Days in period | 91 | 91 | 182 | 181 | ||||||||||||
Total sales volume - refined product (average barrels per day) (1) | 61,441 | 75,283 | 71,229 | 76,749 | ||||||||||||
Products manufactured (average barrels per day): | ||||||||||||||||
Gasoline | 17,461 | 34,498 | 24,135 | 36,270 | ||||||||||||
Diesel/Jet | 21,742 | 29,776 | 26,337 | 30,082 | ||||||||||||
Heavy Oils | 215 | 1,110 | 473 | 1,100 | ||||||||||||
Petrochemicals, LPG, NGLs | 840 | 4,264 | 1,923 | 5,758 | ||||||||||||
Other | 18,871 | — | 14,704 | 52 | ||||||||||||
Total production | 59,129 | 69,648 | 67,572 | 73,262 | ||||||||||||
Throughput (average barrels per day): | ||||||||||||||||
Crude Oil | 59,468 | 70,162 | 65,975 | 71,240 | ||||||||||||
Other feedstocks | 1,114 | (1,327 | ) | 2,104 | 908 | |||||||||||
Total throughput | 60,582 | 68,835 | 68,079 | 72,148 | ||||||||||||
Per barrel of refined product sales: | ||||||||||||||||
Krotz Springs refining margin | $ | (0.64 | ) | $ | 9.69 | $ | (1.12 | ) | $ | 10.84 | ||||||
Direct operating expenses | $ | 3.53 | $ | 4.39 | $ | 3.47 | $ | 4.14 | ||||||||
Crude Slate: (% based on amount received in period) | ||||||||||||||||
WTI Crude | 69.7 | % | 61.0 | % | 67.7 | % | 62.0 | % | ||||||||
Gulf Coast Sweet Crude | 30.3 | % | 39.0 | % | 32.3 | % | 38.0 | % | ||||||||
(1) | Includes inter-refinery sales and sales to other segments which are eliminated in consolidation. See tables below. |
(2) | Tyler's refining margin per barrel and the adjusted refining margin per barrel for the second quarter 2020 both reflect the $111.0 million margin benefit of favorable fixed price crude cost transactions during the quarter, but exclude the offsetting realized hedging losses of approximately $(111.0) million. Giving effect to the related hedging losses, the refining margin per barrel would have decreased by $(17.49). Such margin impact was unusually large because of the historic volatility in the crude commodities market during the period. |
57 | | |
Management's Discussion and Analysis
Included in the refinery statistics above are the following inter-refinery and sales to other segments:
Inter-refinery Sales | |||||||||||
Three Months Ended June 30, | Six Months Ended June 30, | ||||||||||
(in barrels per day) | 2019 | 2018 | 2020 | 2019 | |||||||
(Unaudited) | (Unaudited) | ||||||||||
Tyler refined product sales to other Delek refineries | 2,190 | 914 | 1,477 | 557 | |||||||
El Dorado refined product sales to other Delek refineries | 1,074 | 988 | 446 | 1,886 | |||||||
Big Spring refined product sales to other Delek refineries | 1,269 | 653 | 1,147 | 903 | |||||||
Krotz Springs refined product sales to other Delek refineries | 197 | 10,211 | 245 | 5,530 | |||||||
Refinery Sales to Other Segments | |||||||||||
Three Months Ended June 30, | Six Months Ended June 30, | ||||||||||
(in barrels per day) | 2019 | 2018 | 2020 | 2019 | |||||||
(Unaudited) | (Unaudited) | ||||||||||
Tyler refined product sales to other Delek segments | 1,592 | 24 | 2,400 | 281 | |||||||
El Dorado refined product sales to other Delek segments | 11 | 58 | 169 | 155 | |||||||
Big Spring refined product sales to other Delek segments | 20,570 | 25,215 | 22,841 | 26,034 | |||||||
Pricing Statistics (average for the period presented) | ||||||||||||||||
Three Months Ended June 30, | Six Months Ended June 30, | |||||||||||||||
2020 | 2019 | 2020 | 2019 | |||||||||||||
(Unaudited) | (Unaudited) | |||||||||||||||
WTI — Cushing crude oil (per barrel) | $ | 29.77 | $ | 59.80 | $ | 37.93 | $ | 57.36 | ||||||||
WTI — Midland crude oil (per barrel) | $ | 29.77 | $ | 57.56 | $ | 37.90 | $ | 55.65 | ||||||||
WTS -- Midland crude oil (per barrel) (1) | $ | 29.61 | $ | 57.93 | $ | 37.69 | $ | 55.95 | ||||||||
LLS (per barrel) (1) | $ | 31.30 | $ | 67.06 | $ | 39.73 | $ | 64.73 | ||||||||
Brent crude oil (per barrel) | $ | 33.35 | $ | 68.44 | $ | 42.16 | $ | 66.14 | ||||||||
U.S. Gulf Coast 5-3-2 crack spread (per barrel) - utilizing HSD | $ | 3.66 | $ | 15.51 | $ | 6.28 | $ | 14.28 | ||||||||
U.S. Gulf Coast 5-3-2 crack spread (per barrel) (1) | $ | 6.67 | $ | 17.74 | $ | 8.74 | $ | 15.77 | ||||||||
U.S. Gulf Coast 3-2-1 crack spread (per barrel) (1) | $ | 7.08 | $ | 19.24 | $ | 9.32 | $ | 17.23 | ||||||||
U.S. Gulf Coast 2-1-1 crack spread (per barrel) (1) | $ | 2.35 | $ | 9.75 | $ | 5.35 | $ | 8.55 | ||||||||
U.S. Gulf Coast Unleaded Gasoline (per gallon) | $ | 0.81 | $ | 1.79 | $ | 1.02 | $ | 1.66 | ||||||||
Gulf Coast Ultra low sulfur diesel (per gallon) | $ | 0.91 | $ | 1.94 | $ | 1.19 | $ | 1.91 | ||||||||
U.S. Gulf Coast high sulfur diesel (per gallon) | $ | 0.73 | $ | 1.80 | $ | 1.04 | $ | 1.78 | ||||||||
Natural gas (per MMBTU) (2) | $ | 1.75 | $ | 2.51 | $ | 1.81 | $ | 2.69 | ||||||||
(1) | For our Tyler and El Dorado refineries, we compare our per barrel refining product margin to the Gulf Coast 5-3-2 crack spread consisting of WTI Cushing crude, U.S. Gulf Coast CBOB and U.S. Gulf Coast Pipeline No. 2 heating oil (ultra low sulfur diesel). For our Big Spring refinery, we compare our per barrel refined product margin to the Gulf Coast 3-2-1 crack spread consisting of WTI Cushing crude, Gulf Coast 87 Conventional gasoline and Gulf Coast ultra low sulfur diesel, and for our Krotz Springs refinery, we compare our per barrel refined product margin to the Gulf Coast 2-1-1 crack spread consisting of LLS crude oil, Gulf Coast 87 Conventional gasoline and U.S, Gulf Coast Pipeline No. 2 heating oil (high sulfur diesel). The Tyler refinery's crude oil input is primarily WTI Midland and east Texas, while the El Dorado refinery's crude input is primarily a combination of WTI Midland, local Arkansas and other domestic inland crude oil. The Big Spring refinery’s crude oil input is primarily comprised of WTS and WTI Midland. The Krotz Springs refinery’s crude oil input is primarily comprised of LLS and WTI Midland. |
(2) | One Million British Thermal Units ("MMBTU"). |
58 | | |
Management's Discussion and Analysis
Refining Segment Operational Comparison of the Three and Six Months Ended June 30, 2020 versus the Three and Six Months Ended June 30, 2019
Net Revenues
Q2 2020 vs. Q2 2019
Net revenues for the refining segment decreased by $1,290.8 million, or 54.5%, in the second quarter of 2020 compared to the second quarter of 2019, primarily driven by the following:
• | decreases in the average price of U.S. Gulf Coast gasoline of 54.7%, ULSD of 53.1%, and HSD of 59.4%; and |
• | decreases in sales volume of refined product totaling 0.1 million barrels and a 1.7 million barrel decrease in purchased product sales due to decreased demand, partially offset by increased sales volumes at our El Dorado refinery which was impacted by scheduled turnaround activities in the comparable prior year period. |
Net revenues included sales to our retail segment of $40.4 million and $101.7 million, sales to our logistics segment of $29.7 million and $73.2 million, and sales to our other segment of $5.0 million and $40.4 million for the three months ended June 30, 2020 and June 30, 2019, respectively. We eliminate this intercompany revenue in consolidation.
YTD 2020 vs. YTD 2019
Net revenues for the refining segment decreased by $1,654.9 million, or 37.1%, in the six months ended June 30, 2020 compared to the six months ended June 30, 2019, primarily driven by the following:
• | decreases in the average price of U.S. Gulf Coast gasoline of 38.5%, ULSD of 37.7%, and HSD of 41.5%; and |
• | decreases in sales volume of refined product totaling 0.9 million barrels partially due to scheduled turnaround activities at our Big Spring refinery, partially offset by increased sales volumes at our El Dorado refinery due to prior year scheduled turnaround activities, and a 2.5 million barrel decrease in purchased product sales due to decreased demand. |
Net revenues included sales to our retail segment of $109.0 million and $191.9 million, sales to our logistics segment of $110.5 million and $152.6 million and sales to our other segment of $14.3 million and $55.4 million for the six months ended June 30, 2020 and 2019, respectively. We eliminate this intercompany revenue in consolidation.


Cost of Materials and Other
Q2 2020 vs. Q2 2019
Cost of materials and other decreased by $1,126.1 million, or 54.8%, in the second quarter of 2020 compared to the second quarter of 2019, primarily driven by the following:
• | the net reversal benefit (expense) of $193.7 million related to inventory valuation reserves recognized during the second quarter of 2020 compared to $(0.6) million recognized during the second quarter of 2019; |
• | decreases in the cost of WTI Cushing crude oil, from an average of $59.80 per barrel to an average of $29.77, or (50.22)%; and |
• | decreases in the cost of WTI Midland crude oil, from an average of $57.56 per barrel to an average of $29.77, or (48.28)%. |
59 | | |
Management's Discussion and Analysis
These decreases were partially offset by the following:
• | a decrease in hedging gains to a loss of $146.8 million recognized during the second quarter of 2020 from a gain of $25.6 million recognized during the second quarter of 2019. |
YTD 2020 vs. YTD 2019
Cost of materials and other decreased by $888.6 million, or 23.9%, during the six months ended June 30, 2020 compared to the six months ended June 30, 2019, primarily driven by the following:
• | the net reversal (expense) benefit of $(75.3) million related to inventory valuation reserves recognized during the six months ended June 30, 2020 compared to $51.4 million recognized during the six months ended June 30, 2019; |
• | decreases in the cost of WTI Cushing crude oil, from an average of $57.36 per barrel to an average of $37.93, or (33.9)%; and |
• | decreases in the cost of WTI Midland crude oil, from an average of $55.65 per barrel to an average of $37.90, or (31.9)%. |
These decreases were partially offset by the following:
• | a decrease in hedging gains to a loss of $66.4 million recognized during the six months ended June 30, 2020 from a gain of $44.2 million recognized during the six months ended June 30, 2019; |


Our refining segment purchases finished product from our logistics segment and has multiple service agreements with our logistics segment which, among other things, require the refining segment to pay terminalling and storage fees based on the throughput volume of crude and finished product in the logistics segment pipelines and the volume of crude and finished product stored in the logistics segment storage tanks, subject to minimum volume commitments. These costs and fees were $81.4 million and $52.2 million during the second quarters of 2020 and 2019, respectively, and $178.1 million and $104.4 million during the six months ended June 30, 2020 and 2019, respectively. We eliminate these intercompany fees in consolidation.
Refining Margin
Q2 2020 vs. Q2 2019
Refining margin decreased by $164.7 million, or 52.6%, in the second quarter of 2020 compared to the second quarter of 2019, primarily driven by the following:
• | a narrowing of the average WTI Cushing crude oil differential to WTS crude oil to $0.16 per barrel during the second quarter of 2020 compared to $1.87 during the second quarter of 2019 and narrowing of the average WTI Midland crude oil differential to WTI Cushing crude oil to nearly zero during the second quarter of 2020 compared to $2.24 per barrel during the second quarter of 2019; |
• | a narrowing of the discount between WTI Midland crude oil and Brent crude oil where, during the second quarter of 2020, the WTI Midland crude oil differential to Brent crude oil was an average discount of $3.58 per barrel compared to $10.88 per barrel during the second quarter of 2019; |
• | a 75.9% decline in the average Gulf Coast 2-1-1 crack spread (the primary measure for the Krotz Springs refinery); |
• | a 76.4% decline in the 5-3-2 crack spread (the primary measure for the Tyler refinery and El Dorado refinery); |
60 | | |
Management's Discussion and Analysis
• | a 63.2% decline in the average Gulf Coast 3-2-1 crack spread (the primary measure for the Big Spring refinery); and |
• | a decrease in hedging gains to a loss of $146.8 million recognized during the second quarter of 2020 from a gain of $25.6 million recognized during the second quarter of 2019. |
These decreases were partially offset by the following:
• | an increase attributable to the reversal benefit of inventory valuation reserve totaling $193.7 million during the second quarter of 2020 compared to prior year period. |


61 | | |
Management's Discussion and Analysis
YTD 2020 vs. YTD 2019
Refining margin decreased by $766.3 million, or 104.1%, in the six months ended June 30, 2020 compared to the six months ended June 30, 2019, primarily driven by the following:
• | a narrowing of the average discount between WTI Midland crude oil compared to WTI Cushing where, during the six months of 2020, the average WTI Midland crude oil differential to WTI Cushing crude oil was $0.03 per barrel compared to $1.71 during the six months of 2019; |
• | a narrowing of the average discount between WTI Midland crude oil and Brent crude oil where, during the six months of 2020, the WTI Midland crude oil differential to Brent crude oil was an average discount of $4.26 per barrel compared to $10.49 per barrel during the same period of 2019; |
• | a narrowing of the average WTI Cushing crude oil differential to WTS crude oil to $0.24 per barrel during the six months of 2020 compared to $1.41 during the six months of 2019; |
• | a narrowing of the discount between WTI Cushing crude oil compared to Brent where, during the six months of 2020, the average WTI Cushing crude oil differential to Brent crude oil was $4.62 per barrel compared to $8.78 during the six months of 2019; |
• | a 56.0% decline in the 5-3-2 crack spread (the primary measure for the Tyler refinery and El Dorado refinery); |
• | a 45.9% decline in the average Gulf Coast 3-2-1 crack spread (the primary measure for the Big Spring refinery); |
• | a 37.4% decline in the average Gulf Coast 2-1-1 crack spread (the primary measure for the Krotz Springs refinery); and |
• | a decrease in hedging gains to $(66.4) million recognized during the six months of 2020 from $44.2 million recognized during the six months of 2019. |
These decreases were partially offset by the following:
• | an increase in reversal benefit of inventory valuation reserve of during the during the six months of 2020 compared to the prior year period. |

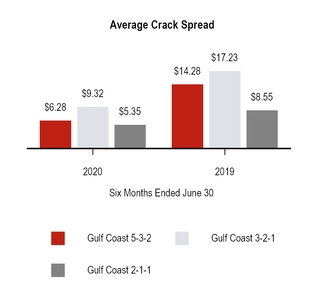
62 | | |
Management's Discussion and Analysis

Operating Expenses
Q2 2020 vs. Q2 2019
Operating expenses decreased by $26.3 million, or 22.9%, in the second quarter of 2020 compared to the second quarter of 2019, primarily driven by the following:
• | decreases in contractor and maintenance costs partially due to cost reduction measures taken in the second quarter of 2020; and |
• | decreases in catalyst and chemicals costs in the second quarter of 2020, primarily at our Krotz Springs refinery related to scheduled unit downtime; and |
• | reduced costs resulting from the sale of the Bakersfield refinery in May 2020. |
YTD 2020 vs. YTD 2019
Operating expenses decreased by $35.6 million, or 15.1%, during the six months ended June 30, 2020 compared to the six months ended June 30, 2019, primarily driven by the following:
• | decreases in employee related costs primarily related to decrease in incentive plan and workforce optimization to reduce overtime rates; |
• | decreases in utilities and catalyst costs, primarily at our Big Spring and Krotz Springs refineries related to reduced throughput due to turnaround and unit downtime, respectively; and |
• | decreases in contractor and maintenance costs partially due to cost reduction measures taken in the six months of 2020. |
Contribution Margin
Q2 2020 vs. Q2 2019
Contribution margin decreased by $138.4 million, or a 2.8% reduction in contribution margin percentage, in the second quarter of 2020 compared to the second quarter of 2019, primarily driven by the following:
• | the decline of the Midland WTI crude oil differential to Brent crude oil compared to the prior-year period; |
• | an overall decline in the average crack spreads; |
• | an increase in reversal benefit related to inventory valuation reserve of during the second quarter of 2020 compared to prior year period; and |
• | a narrowing of the discount between WTI Cushing and WTS crude oil compared to the second quarter of 2019. |
These decreases were partially offset by decreases in operating expenses across all refineries.
63 | | |
Management's Discussion and Analysis
YTD 2029 vs. YTD 2019
Contribution margin decreased by $730.7 million for the six months ended June 30, 2020 compared to the six months ended June 30, 2019, primarily driven by the following:
• | the decline of the Midland WTI crude oil differential to Brent crude oil compared to the prior-year period; |
• | reduced performance at our Big Spring refinery due to turnaround; |
• | an overall decline in the average crack spreads; ; |
• | an increase in reversal benefit related to inventory valuation reserves recognized during the six months of 2020 compared to the prior year period; and |
• | a narrowing of the discount between WTI Cushing and WTI crude oil compared to the prior-year period. |
These decreases were partially offset by decreases in operating expenses across all refineries.
64 | | |
Management's Discussion and Analysis
Logistics Segment |
The table below sets forth certain information concerning our logistics segment operations ($ in millions, except per barrel amounts):
Logistics Contribution Margin and Operating Information | ||||||||||||||||
Three Months Ended June 30, | Six Months Ended June 30, | |||||||||||||||
2020 | 2019 | 2020 | 2019 | |||||||||||||
Net revenues | $ | 117.7 | $ | 155.3 | $ | 281.1 | $ | 307.8 | ||||||||
Cost of materials and other | 43.9 | 93.8 | 145.2 | 190.1 | ||||||||||||
Operating expenses (excluding depreciation and amortization) | 12.4 | 17.3 | 27.2 | 33.4 | ||||||||||||
Contribution margin | $ | 61.4 | $ | 44.2 | $ | 108.7 | $ | 84.3 | ||||||||
Operating Information: | ||||||||||||||||
East Texas - Tyler Refinery sales volumes (average bpd) (1) | 65,028 | 71,123 | 68,839 | 69,857 | ||||||||||||
Big Spring wholesale marketing throughputs (average bpd) | 76,004 | 82,964 | 71,195 | 85,339 | ||||||||||||
West Texas wholesale marketing throughputs (average bpd) | 9,143 | 11,404 | 12,612 | 12,418 | ||||||||||||
West Texas wholesale marketing margin per barrel | $ | 0.64 | $ | 6.25 | $ | 1.96 | $ | 4.84 | ||||||||
Terminalling throughputs (average bpd) (2) | 138,593 | 156,922 | 136,961 | 154,643 | ||||||||||||
Throughputs (average bpd): | ||||||||||||||||
Lion Pipeline System: | ||||||||||||||||
Crude pipelines (non-gathered) | 79,066 | 37,625 | 75,995 | 33,179 | ||||||||||||
Refined products pipelines to Enterprise Systems | 56,093 | 29,893 | 55,110 | 26,511 | ||||||||||||
SALA Gathering System | 9,447 | 14,315 | 13,449 | 14,798 | ||||||||||||
East Texas Crude Logistics System | 10,275 | 19,550 | 12,224 | 18,835 | ||||||||||||
Big Spring Gathering Assets (3) | 105,162 | — | 105,162 | — | ||||||||||||
(1) | Excludes jet fuel and petroleum coke. |
(2) | Consists of terminalling throughputs at our Tyler, Big Spring, Big Sandy and Mount Pleasant, Texas, El Dorado and North Little Rock, Arkansas and Memphis and Nashville, Tennessee terminals. |
(3) | Throughputs for the Big Spring Gathering Assets are for the 91 days we owned the assets following the Big Spring Gathering Assets Acquisition effective March 31, 2020. |
Logistics Segment Operational Comparison of the Three and Six Months Ended June 30, 2020 versus the Three and Six Months Ended June 30, 2019
Net Revenues
Q2 2020 vs. Q2 2019
Net revenues decreased by $37.6 million, or 24.2%, in the second quarter of 2020 compared to the second quarter of 2019, primarily driven by the following:
• | decreases in the average volumes sold partially offset by decreases in the average sales prices per gallon of gasoline and diesel in our West Texas marketing operations: |
◦ | the average volumes of diesel sold decreased 10.2 million gallons, partially offset by a 1.1 million decrease of gasoline gallons sold. |
◦ | the average sales prices per gallon of diesel and gasoline sold decreased $1.11 per gallon and $1.09 per gallon, respectively. |
Such decrease was partially offset by the following:
• | Increased revenues associated with agreements executed in connection with Big Spring Gathering System and Delek Trucking acquisitions, which were effective April 1, 2020 and May 1, 2020, respectively. Refer to Note 4 of the condensed consolidated financial statements in Item 1, Financial Statements, for additional information. |
Net revenues included sales to our refining segment of $90.0 million and $61.1 million for the three months ended June 30, 2020 and June 30, 2019, respectively, and sales to our other segment of $0.4 million and $1.1 million for the three months ended June 30, 2020 and 2019, respectively. We eliminate this intercompany revenue in consolidation.
65 | | |
Management's Discussion and Analysis
YTD 2020 vs. YTD 2019
Net revenues decreased by $26.7 million, or 8.7%, in the six months ended June 30, 2020 compared to the six months ended June 30, 2019, primarily driven by the following:
• | decreases in the average sales prices per gallon and volumes of diesel gallon sold, partially offset by increases in the average sales volume of gasoline in our West Texas marketing operations: |
◦ | the average volumes of gasoline sold increased 14.4 million gallons, partially offset by a 11.5 million decrease of diesel gallons sold. |
◦ | the average sales prices per gallon of gasoline and diesel sold decreased $0.47 per gallon and $0.68 per gallon, respectively. |
Such decrease was partially offset by the following:
• | Increased revenues associated with agreements executed in connection with Big Spring Gathering System and Delek Trucking acquisitions, which were effective March 31, 2020 and May 1, 2020, respectively. Refer to Note 4 of the condensed consolidated financial statements in Item 1, Financial Statements, for additional information. |
• | increased revenues at our SALA Gathering System and Magnolia Pipeline as result of increased throughput during the six months ended June 30, 2020 when compared to the six months ended June 30, 2019. |
Net revenues included sales to our refining segment of $195.7 million and $122.1 million for the six months ended June 30, 2020 and 2019, respectively, and sales to our other segment of $1.2 million for the six months ended June 30, 2020 . We eliminate this intercompany revenue in consolidation.


Cost of Materials and Other
Q2 2020 vs. Q2 2019
Cost of materials and other for the logistics segment decreased $49.9 million, or 53.2%, in the second quarter of 2020 compared to the second quarter of 2019 primarily driven by the following:
• | decreases in the average diesel volumes sold and average cost per gallon of gasoline and diesel sold in our West Texas marketing operations: |
◦ | the average volumes of diesel sold decreased 10.2 million gallons, partially offset by 1.1 million increase of gasoline gallons sold. |
◦ | the average cost per gallon of gasoline and diesel sold decreased $0.96 per gallon and $1.03 per gallon, respectively. |
Our logistics segment purchased product from our refining segment of $29.7 million and $73.2 million for the three months ended June 30, 2020 and June 30, 2019, respectively. We eliminate these intercompany costs in consolidation.
YTD 2020 vs. YTD 2019
Cost of materials and other for the logistics segment decreased $44.9 million, or 23.6%, in the six months ended June 30, 2020 compared to the six months ended June 30, 2019 primarily driven by the following:
• | decrease in the average diesel volumes sold, partially offset by decreases in the average cost per gallon of gasoline and diesel sold in our West Texas marketing operations: |
66 | | |
Management's Discussion and Analysis
◦the average volumes of diesel sold decreased 11.5 million gallons, partially offset by a 14.4 million increase in gasoline gallons sold.
◦ | the average cost per gallon of gasoline and diesel sold decreased $0.41 per gallon and $0.61 per gallon, respectively. |
Our logistics segment purchased product from our refining segment of $110.5 million and $152.6 million for the six months ended June 30, 2020 and June 30, 2019, respectively. We eliminate these intercompany costs in consolidation.


Operating Expenses
Q2 2020 vs. Q2 2019
Operating expenses decreased by $4.9 million, or 28.3%, in the second quarter of 2020 compared to the second quarter of 2019, driven by the following:
• | decrease in employee and outside services costs due to measures implemented to respond to COVID-19 including delaying non-essential projects; and |
• | decrease in utilities and other variable expenses due to lower production. |
YTD 2020 vs. YTD 2019
Operating expenses decreased by $6.2 million, or 18.6%, in the six months ended June 30, 2020 compared to the six months ended June 30, 2019, driven by the following:
• | decrease in employee and outside services costs due to measures implemented to respond to COVID-19 including delaying non-essential projects; |
• | lower operating costs associated with allocated contract services pertaining to certain of our assets; and |
• | decreases in variable expenses such as utilities, maintenance and materials costs due to lower production. |
Contribution Margin
Q2 2020 vs. Q2 2019
Contribution margin increased by $17.2 million, or 38.9%, in the second quarter of 2020 compared to the second quarter of 2019, primarily driven by the following:
• | increases in revenues associated with agreements executed in connection with Big Spring Gathering System and Delek Trucking acquisitions; and |
• | decreases in operating expenses. |
Such increases were partially offset by the following:
• | decreases in the volumes combined with a decrease in gross margin of $5.61 per barrel in our West Texas marketing operations. |
67 | | |
Management's Discussion and Analysis
YTD 2020 vs. YTD 2019
Contribution margin increased by $24.4 million, or 28.9%, in the six months ended June 30, 2020 compared to the six months ended June 30, 2019, primarily driven by the following:
• | increases in revenues associated with agreements executed in connection with Big Spring Gathering System and Delek Trucking acquisitions, Magnolia Pipeline, and SALA Gathering system; and |
• | decreases in operating expenses. |
Such increases were partially offset by the following:
• | decreases in gross margin per barrel sold of $2.88 in our West Texas marketing operations. |
68 | | |
Management's Discussion and Analysis
Retail Segment |
The table below sets forth certain information concerning our retail segment operations (gross sales $ in millions):
Retail Contribution Margins | ||||||||||||||||
Three Months Ended June 30, | Six Months Ended June 30, | |||||||||||||||
2020 | 2019 | 2020 | 2019 | |||||||||||||
Net revenues | $ | 165.4 | $ | 224.5 | $ | 344.0 | $ | 421.7 | ||||||||
Cost of materials and other | 119.6 | 182.1 | 263.7 | 345.5 | ||||||||||||
Operating expenses (excluding depreciation and amortization) | 21.5 | 24.8 | 43.7 | 48.4 | ||||||||||||
Contribution margin | $ | 24.3 | $ | 17.6 | $ | 36.6 | $ | 27.8 | ||||||||
Operating Information | ||||||||||||||||
Number of stores (end of period) | 253 | 263 | 253 | 263 | ||||||||||||
Average number of stores | 253 | 277 | 253 | 279 | ||||||||||||
Average number of fuel stores | 248 | 268 | 248 | 270 | ||||||||||||
Retail fuel sales | $ | 75.9 | $ | 140.8 | $ | 182.9 | $ | 262.7 | ||||||||
Retail fuel sales (thousands of gallons) | 42,436 | 53,743 | 90,376 | 107,633 | ||||||||||||
Average retail gallons sold per average number of fuel stores (in thousands) | 171 | 201 | 365 | 399 | ||||||||||||
Average retail sales price per gallon sold | $ | 1.79 | $ | 2.62 | $ | 2.02 | $ | 2.44 | ||||||||
Retail fuel margin ($ per gallon) (1) | $ | 0.445 | $ | 0.292 | $ | 0.372 | $ | 0.246 | ||||||||
Merchandise sales (in millions) | $ | 89.4 | $ | 83.3 | $ | 161.1 | $ | 158.6 | ||||||||
Merchandise sales per average number of stores (in millions) | $ | 0.4 | $ | 0.3 | $ | 0.6 | $ | 0.6 | ||||||||
Merchandise margin % | 30.8 | % | 31.2 | % | 31.1 | % | 31.1 | % | ||||||||
Same-Store Comparison (2) | ||||||||||||
Three Months Ended June 30, | Six Months Ended June 30, | |||||||||||
2020 | 2019 | 2020 | 2019 | |||||||||
Change in same-store fuel gallons sold | (19.7 | )% | 1.7 | % | (13.9 | )% | 3.1 | % | ||||
Change in same-store merchandise sales | 13.1 | % | (2.5 | )% | 7.6 | % | (0.5 | )% | ||||
(1) | Retail fuel margin represents gross margin on fuel sales in the retail segment, and is calculated as retail fuel sales revenue less retail fuel cost of sales. The retail fuel margin per gallon calculation is derived by dividing retail fuel margin by the total retail fuel gallons sold for the period. |
(2) | Same-store comparisons include period-over-period increases or decreases in specified metrics for stores that were in service at both the beginning of the earliest period and the end of the most recent period used in the comparison. |
Retail Segment Operational Comparison of the Three and Six Months Ended June 30, 2020 versus the Three and Six Months Ended June 30, 2019
Net Revenue
Q2 2020 vs. Q2 2019
Net revenues for the retail segment decreased by $59.1 million, or 26.3%, in the second quarter of 2020 compared to the second quarter of 2019, primarily driven by the following:
• | total fuel sales were $75.9 million in the second quarter of 2020 compared to $140.8 million in the second quarter of 2019, attributable to the following: |
◦ | a decrease in total retail fuel gallons sold for the retail segment to 42,436 thousand gallons in the second quarter of 2020 compared to 53,743 thousand gallons in the second quarter of 2019 associated with the reduction in average number of stores period over period, and a same-store sales decrease in fuel volumes of 19.7% primarily due to demand slowdown as a result of the COVID-19 Pandemic; |
69 | | |
Management's Discussion and Analysis
◦ | a $0.83 decrease in average price charged per gallon; and |
◦ | $5.9 million decrease related to reduction in number of stores period over period. |
• | merchandise sales were $89.4 million in the second quarter of 2020 compared to $83.3 million in the second quarter of 2019 attributable to the following: |
◦ | same-store sales increase of 13.1% primarily due to strong sales growth for key categories such as beer, cigarettes and packaged beverages; and |
◦ | partially offset by a $4.6 million decrease related to reduction in number of stores. |
YTD 2020 vs. YTD 2019
Net revenues for the retail segment decreased by $77.7 million, or 18.4%, in the six months ended June 30, 2020 compared to the six months ended June 30, 2019, primarily driven by the following:
• | total fuel sales were $182.9 million in the six months of 2020 compared to $262.7 million in the six months of 2019, attributable to the following: |
◦ | a decrease in total retail fuel gallons sold of 90,376 thousand gallons in the six months of 2020 compared to 107,633 thousand gallons in the six months of 2019, attributable to a decrease in volumes associated with the reduction in average number of stores period over in addition to same-store sales decline in fuel volumes of 13.9% primarily due to demand slowdown in the second quarter of 2020 as a result of the COVID-19 Pandemic; |
◦ | a $0.42 decrease in average price charged per gallon; and |
◦ | $10.0 million decrease related to reduction in number of stores period over period. |
• | merchandise sales were $161.1 million in the six months of 2020 compared to $158.6 million in the six months of 2019 primarily driven by the following: |
◦ | a same-store sales increase of 7.6%; and |
◦ | partially offset by $10.4 million decrease related to reduction in number of stores period over period. |


70 | | |
Management's Discussion and Analysis


Cost of Materials and Other
Q2 2020 vs. Q2 2019
Cost of materials and other for the retail segment decreased by $62.5 million, or 34.3%, in the second quarter of 2020 compared to the second quarter of 2019, primarily driven by the following:
• | $7.7 million decrease due to reduction in number of stores period over period; and |
• | a decrease in average cost per gallon of $0.98 or 42.0% applied to fuel sales volumes that decreased period over period. |
Our retail segment purchased finished product from our refining segment of $40.4 million and $101.7 million for the three months ended June 30, 2020 and June 30, 2019. We eliminate this intercompany cost in consolidation.
YTD 2020 vs. YTD 2019
Cost of materials and other for the retail segment decreased by $81.8 million, or 23.7%, in the six months ended June 30, 2020 compared to the six months ended June 30, 2019, primarily driven by the following:
• | $16.0 million decrease due to reduction in number of stores period over period; and |
• | a decrease in average cost per gallon of $0.54 or 24.6% applied to fuel sales volumes that decreased slightly period over period. |
Our retail segment purchased finished product from our refining segment of $109.0 million and $191.9 million for the six months ended June 30, 2020 and June 30, 2019. We eliminate this intercompany cost in consolidation.
Operating Expenses
Q2 2020 vs. Q2 2019
Operating expenses for the retail segment decreased by $3.3 million, or 13.3% in the second quarter of 2020 compared to the second quarter of 2019. This decrease is primarily attributable to a decrease in operating costs associated with the reduction in the number of stores.
YTD 2020 vs. YTD 2019
Operating expenses for the retail segment decreased by $4.7 million, or 9.7% in the six months ended June 30, 2020 compared to the six months ended June 30, 2019. This decrease is primarily attributable to a decrease in operating costs associated with the reduction in the number of stores.
71 | | |
Management's Discussion and Analysis
Contribution Margin
Q2 2020 vs. Q2 2019
Contribution margin for the retail segment increased by $6.7 million, or 38.1%, in the second quarter of 2020 compared to the second quarter of 2019, primarily driven by a $0.153 per gallon improvement in the retail fuel margin and an increase in merchandise sales, offset by 0.4% decrease in merchandise margin.
YTD 2020 vs. YTD 2019
Contribution margin for the retail segment increased by $8.8 million, or 31.7%, in the six months ended June 30, 2020, compared to the six months ended June 30, 2019, primarily driven by a $0.126 per gallon improvement in the retail fuel margin and increase in merchandise sales.


72 | | |
Management's Discussion and Analysis
Liquidity and Capital Resources
Our primary sources of liquidity and capital resources are
• | cash generated from our operating activities; |
• | borrowings under our debt facilities; and |
• | potential issuances of additional equity and debt securities. |
Historically, we have generated adequate cash from operations to fund ongoing working capital requirements, pay quarterly cash dividends and operational capital expenditures and expect the same in the foreseeable future. Other funding sources including borrowings under existing credit agreements and issuance of equity and debt securities have been utilized to meet our funding requirements and support our growth capital projects and acquisitions. In addition we have historically been able to source funding at terms that reflect market conditions, our financial position and our credit ratings. We continue to monitor market conditions, our financial position and our credit ratings and expect future funding sources to be at terms that are sustainable and profitable for the Company. However, there can be no assurances regarding the availability of any future debt or equity financings or whether such financings can be made available on terms that are acceptable to us; any execution of such financing activities will be dependent on the contemporaneous availability of functioning debt or equity markets. Additionally, new debt financing activities will be subject to the satisfaction of any debt incurrence limitation covenants in our existing financing agreements. Our debt limitation covenants in our existing financing documents are usual and customary for credit agreements of our type and reflective of market conditions at the time of their execution. Additionally, our ability to satisfy working capital requirements, to service our debt obligations, to fund planned capital expenditures, or to pay dividends will depend upon future operating performance, which will be affected by prevailing economic conditions in the oil industry and other financial and business factors, including the current COVID-19 Pandemic and oil prices, some of which are beyond our control.
If market conditions were to change, for instance due to the significant decline in oil prices or uncertainty created by the COVID-19 Pandemic, and our revenue was reduced significantly or operating costs were to increase significantly, our cash flows and liquidity could be unfavorably impacted.
As of June 30, 2020, we were in compliance with all of our debt maintenance covenants, where the most significant long-term obligation subject to such covenants was the Delek Logistics Credit Facility (see Note 8 of the condensed consolidated financial statements in Item 1, Financial Statements). After considering the current effect of the significant decline in oil prices and uncertainty created by the COVID-19 Pandemic on our operations, we currently expect to remain in compliance with our existing debt maintenance covenants, though we can provide no assurances, particularly if conditions significantly worsen beyond our ability to predict. Additionally, we were in compliance with incurrence covenants during the quarter ended June 30, 2020 to the extent that any of our activities triggered these covenants. However, given the uncertainty around economic conditions arising from the COVID-19 Pandemic, it is at least reasonably possible that conditions could change significantly, and that such changes could adversely impact our ability to meet some of these incurrence covenants. Failure to meet the incurrence covenants could impose certain incremental restrictions on our ability to incur new debt and also may limit the extent to which we may pay dividends, as well as impose additional restrictions on our ability to repurchase our stock, make new investments and incur new liens (among others). Such restrictions would generally remain in place until such quarter that we return to compliance under the applicable incurrence based covenants. In the event that we are subject to these incremental restrictions, we believe that we have sufficient current and alternative sources of liquidity, including (but not limited to): available borrowings under our existing Wells Fargo Revolving Credit Facility (see Note 8 of the condensed consolidated financial statements in Item 1, Financial Statements); the option to incur an additional $200 million of secured debt under the Wells Fargo Term Loan Credit Facility (see Note 8 of the condensed consolidated financial statements in Item 1, Financial Statements); as well as the possibility of obtaining other secured and unsecured debt, raising capital through equity issuance, or taking advantage of transactional financing opportunities such as sale-leasebacks, as otherwise contemplated and allowed under incurrence covenants.
73 | | |
Cash Flows
The following table sets forth a summary of our consolidated cash flows (in millions):
Consolidated | ||||||||
Six Months Ended June 30, | ||||||||
2020 | 2019 | |||||||
Cash Flow Data: | ||||||||
Operating activities | $ | (323.1 | ) | $ | 235.4 | |||
Investing activities | (155.9 | ) | (329.4 | ) | ||||
Financing activities | 372.7 | (33.9 | ) | |||||
Net decrease | $ | (106.3 | ) | $ | (127.9 | ) | ||
Cash Flows from Operating Activities
Net cash used in operating activities was $323.1 million for the six months ended June 30, 2020, compared to cash provided by operating activities of $235.4 million for the comparable period of 2019. Cash receipts from customers and cash payments to suppliers and for salaries decreased resulting in a net $628.8 million decrease in cash from operating activities mainly due to a decline in the prices and volume of refined product sold. Additionally, cash paid for debt interest increased by $5.7 million. This decrease was partially offset by a $10.1 million increase in cash received for dividends and $65.9 million decrease in cash paid for taxes.
Cash Flows from Investing Activities
Net cash used in investing activities was $155.9 million for the first six months of 2020, compared to $329.4 million in the comparable period of 2019. The decrease in cash flows used in investing activities was primarily due to a $106.9 million decrease in equity method investment contributions primarily due to our obtaining a 33% membership interest in the Red River Pipeline Joint Venture in May 2019 for $124.7 million. During the six months ended June 30, 2020, we contributed $10.5 million related to our Red River Pipeline Joint Venture and $18.9 million related to our interest in WWP and WWP Project Financing JV which did not exist in the comparable prior year period. Additionally, we received distributions from our WWP Project Financing JV in the amount of $69.3 million for which there was no comparable activity in the prior year period. We also received proceeds of $39.9 million from the sale of our Bakersfield refinery in the six months ended June 30, 2020. These decreases in cash used investing activities were partially offset by an increase in cash purchases of property, plant and equipment which increased from $199.9 million in 2019, to $235.4 million in 2020 predominantly attributable to capital expenditures related to turnaround and other sustaining maintenance activities in our refining segment.
Cash Flows from Financing Activities
Net cash provided by financing activities was $372.7 million for the six months ended June 30, 2020, compared to net cash used of $33.9 million in the comparable 2019 period. This increase in cash provided was predominantly due to net proceeds received from long-term revolvers of $231.6 million during the six months ended June 30, 2020, compared to net payments of $85 million in the comparable 2019 period. Additionally contributing to this increase were a decrease in repurchases of common stock to $1.9 million for the six months ended June 30, 2020 compared to $104.8 million in the comparable 2019 period due to management suspending our share repurchase program, and an increase in net proceeds from inventory financing arrangements to $59.9 million for the six months ended June 30, 2020 compared to $4.2 million in the comparable 2019 period. Partially offsetting this increase was a decrease in net proceeds received from term debt to $153.8 million during the six months ended June 30, 2020, compared to $217.6 million in the comparable 2019 period.
Cash Position and Indebtedness
As of June 30, 2020, our total cash and cash equivalents were $849.0 million and we had total long-term indebtedness of approximately $2,454.9 million. The total long-term indebtedness is net of deferred financing costs and debt discount of $7.0 million and $27.4 million, respectively. Additionally, we had letters of credit issued of approximately $204.6 million. Total unused credit commitments or borrowing base availability, as applicable, under our revolving credit facilities was approximately $795.4 million. Our total long-term indebtedness consisted of the following:
• | an aggregate principal amount of $100.0 million under the Revolving Credit Facility, due on March 30, 2023, with average borrowing rate of 3.50%; |
• | an aggregate principal amount of $1,279.5 million under the Term Loan Credit Facility, due on March 30, 2025, with effective interest of 3.44%; |
• | an aggregate principal amount of $39.8 million in outstanding borrowings under the Delek Hapoalim Term Loan, due on December 31, 2022, with effective interest of 3.61%; |
74 | | |
• | an aggregate principal amount of $750.0 million under the Delek Logistics Credit Facility, due on September 28, 2023, with average borrowing rate of 2.78%; |
• | an aggregate principal amount of $250.0 million under the Delek Logistics Notes, due in 2025, with effective interest rate of 7.22%; |
• | an aggregate principal amount of $50.0 million under the Reliant Bank Revolver, due on June 30, 2022, with fixed interest rate of 4.50%; and |
• | an aggregate principal amount of $20.0 million under the Promissory Notes, due on January 04, 2021, with fixed interest rate of 5.50%. |
See Note 8 of the condensed consolidated financial statements in Item 1, Financial Statements, for additional information about our separate credit facilities.
Additionally, our obligation under the supply and offtake inventory financing agreements with J. Aron amounted to $314.0 million at June 30, 2020, $215.0 million of which is due on December 30, 2022, except that a portion (not to exceed $58.8 million) of this otherwise long-term component is subject to potential earlier payment under the Periodic Price Adjustment provision. See Note 7 of the condensed consolidated financial statements in Item 1, Financial Statements, for additional information about our supply and offtake facilities.
Capital Spending
A key component of our long-term strategy is our capital expenditure program. Our capital expenditures for the six months ended June 30, 2020 were $203.3 million, of which approximately $180.3 million was spent in our refining segment, $3.7 million in our logistics segment, $7.5 million in our retail segment and $11.8 million at the holding company level. The following table summarizes our actual capital expenditures for the six months ended June 30, 2020 and planned capital expenditures for the full year 2020 by operating segment and major category (in millions):
Full Year 2020 Forecast | Six Months Ended June 30, 2020 | |||||||
Refining | ||||||||
Sustaining maintenance, including turnaround activities | $ | 162.7 | $ | 138.6 | ||||
Regulatory | 42.8 | 41.5 | ||||||
Discretionary projects | 0.9 | 0.2 | ||||||
Refining segment total | 206.4 | 180.3 | ||||||
Logistics | ||||||||
Regulatory | 3.0 | 1.3 | ||||||
Sustaining maintenance | 2.7 | 0.5 | ||||||
Discretionary projects | 12.5 | 1.9 | ||||||
Logistics segment total | 18.2 | 3.7 | ||||||
Retail | ||||||||
Regulatory | 0.2 | 0.2 | ||||||
Sustaining maintenance | 2.2 | 1.0 | ||||||
Discretionary projects | 6.5 | 6.3 | ||||||
Retail segment total | 8.9 | 7.5 | ||||||
Other | ||||||||
Regulatory | 0.6 | 0.3 | ||||||
Sustaining maintenance | 0.8 | — | ||||||
Discretionary projects(1)(2) | 15.1 | 11.5 | ||||||
Other total | 16.5 | 11.8 | ||||||
Total capital spending | $ | 250.0 | $ | 203.3 | ||||
(1) The forecast excludes a $65 million discretionary project to complete a connector to the WWP pipeline, for which we have secured pre-approved committed financing from the WWP members.
(2) Excludes purchases of rights-of-way in the amount of $2.1 million in 2020.
75 | | |
Management's Discussion and Analysis
The amount of our capital expenditure budget is subject to change due to unanticipated increases in the cost, scope and completion time for our capital projects. For example, we may experience increases in the cost of and/or timing to obtain necessary equipment required for our continued compliance with government regulations or to complete improvement projects or scheduled maintenance activities. Additionally, the scope and cost of employee or contractor labor expense related to installation of that equipment could exceed our projections. Our capital expenditure budget may also be revised as management continues to evaluate projects for reliability or profitability. As a result of the uncertainties associated with the COVID-19 Pandemic, we have decreased our capital spending forecast for 2020 to $250.0 million, down from the prior forecast as reported in our Annual Report on Form 10-K for the year ended December 31, 2019, of $325.7 million. Projects that are not essential to maintaining the current operations have been suspended and are expected to resume in 2021. We continue to evaluate the adverse effects of the COVID -19 Pandemic, and may further revise our forecast as a result of changing circumstances.
We have no material off-balance sheet arrangements through the date of the filing of this Quarterly Report on Form 10-Q.
ITEM 3. QUANTITATIVE AND QUALITATIVE DISCLOSURES ABOUT MARKET RISK
These disclosures should be read in conjunction with the condensed consolidated financial statements, "Management's Discussion and Analysis of Financial Condition and Results of Operations," and other information presented herein, as well as in the "Quantitative and Qualitative Disclosures About Market Risk" section contained in our Annual Report on Form 10-K, as filed on February 28, 2020.
Price Risk Management Activities
At times, we enter into the following instruments/transactions in order to manage our market-indexed pricing risk: commodity derivative contracts which we use to manage our price exposure to our inventory positions, future purchases of crude oil and ethanol, future sales of refined products or to fix margins on future production; and future commitments to purchase or sell RINs at fixed prices and quantities, which are used to manage the costs associated with our RINs obligations and meet the definition of derivative instruments under ASC 815, Derivatives and Hedging ("ASC 815"). In accordance with ASC 815, all of these commodity contracts and future purchase commitments are recorded at fair value, and any change in fair value between periods has historically been recorded in the profit and loss section of our condensed consolidated financial statements. Occasionally, at inception, the Company will elect to designate the commodity derivative contracts as cash flow hedges under ASC 815. Gains or losses on commodity derivative contracts accounted for as cash flow hedges are recognized in other comprehensive income on the condensed consolidated balance sheets and, ultimately, when the forecasted transactions are completed, in net revenues or cost of materials and other in the condensed consolidated statements of income.
76 | | |
Management's Discussion and Analysis
The following table sets forth information relating to our open commodity derivative contracts as of June 30, 2020 ($ in millions):
Total Outstanding | Notional Contract Volume by Year of Maturity | ||||||||||||||||||
Contract Description | Fair Value | Notional Contract Volume | 2020 | 2021 | 2022 | 2023 | |||||||||||||
Contracts not designated as hedging instruments: | |||||||||||||||||||
Crude oil price swaps - long(1) | $ | 211.4 | 63,562,000 | 46,043,000 | 17,519,000 | — | — | ||||||||||||
Crude oil price swaps - short(1) | (187.2 | ) | 65,780,000 | 48,066,000 | 17,714,000 | — | — | ||||||||||||
Inventory, refined product and crack spread swaps - long(1) | 38.7 | 79,419,000 | 27,054,000 | 22,765,000 | 22,200,000 | 7,400,000 | |||||||||||||
Inventory, refined product and crack spread swaps - short(1) | (55.6 | ) | 78,967,000 | 26,602,000 | 22,765,000 | 22,200,000 | 7,400,000 | ||||||||||||
Natural gas swaps - long(2) | 16.9 | 19,927,500 | 19,927,500 | — | — | — | |||||||||||||
Natural gas swaps - short(2) | (27.7 | ) | 30,902,500 | 30,902,500 | — | — | — | ||||||||||||
RIN commitment contracts - long(3) | 3.5 | 44,900,000 | 44,900,000 | — | — | — | |||||||||||||
RIN commitment contracts - short(3) | (3.8 | ) | 58,500,000 | 58,500,000 | — | — | — | ||||||||||||
Total | $ | (3.8 | ) | 441,958,000 | 301,995,000 | 80,763,000 | 44,400,000 | 14,800,000 | |||||||||||
Contracts designated as cash flow hedging instruments: | |||||||||||||||||||
Crude oil price swaps - long(1) | $ | — | — | — | — | — | — | ||||||||||||
Crude oil price swaps - short(1) | — | — | — | — | — | — | |||||||||||||
Inventory, refined product and crack spread swaps - long(1) | (2.7 | ) | 90,000 | 90,000 | — | — | — | ||||||||||||
Inventory, refined product and crack spread swaps - short(1) | 4.5 | 90,000 | 90,000 | — | — | — | |||||||||||||
Total | $ | 1.8 | 180,000 | 180,000 | — | — | — | ||||||||||||
(1)Volume in barrels
(2)Volume in MMBTU
(3)Volume in RINs
Interest Risk Management Activities
We have market exposure to changes in interest rates relating to our outstanding floating rate borrowings, which totaled approximately $2,169.3 million as of June 30, 2020. The annualized impact of a hypothetical one percent change in interest rates on our floating rate debt as of June 30, 2020 would be to change interest expense by approximately $21.7 million.
Commodity Derivatives Trading Activities
In the first half of 2018, we began entering into active trading positions in a variety of commodity derivatives, which include forward physical contracts, swap contracts, and futures contracts. These contracts are classified as held for trading and are recognized at fair value with changes in fair value recognized in the income statement. These trading activities are undertaken by using a range of contract types in combination to create incremental gains by capitalizing on crude oil supply and pricing seasonality. These contracts had remaining durations of less than one year as of June 30, 2020.
77 | | |
Management's Discussion and Analysis
The following table sets forth information relating to commodity derivative contracts held for trading purposes as of June 30, 2020:
Contract Description | Less than 1 year | |||
Over the counter forward sales contracts | ||||
Notional contract volume (1) | 722,871 | |||
Weighted-average market price (per barrel) | $ | 29.25 | ||
Contractual volume at fair value (in millions) | $ | 21.1 | ||
Over the counter forward purchase contracts | ||||
Notional contract volume (1) | 566,083 | |||
Weighted-average market price (per barrel) | $ | 29.59 | ||
Contractual volume at fair value (in millions) | $ | 16.7 | ||
(1) | Volume in barrels |
ITEM 4. CONTROLS AND PROCEDURES
Our disclosure controls and procedures are designed to provide reasonable assurance that the information that we are required to disclose in reports we file under the Securities Exchange Act of 1934, as amended ("the Exchange Act"), is accumulated and appropriately communicated to management. We carried out an evaluation required by Rule 13a-15(b) of the Exchange Act, under the supervision and with the participation of our management, including the Chief Executive Officer and Chief Financial Officer, of the effectiveness of the design and operation of our disclosure controls and procedures at the end of the reporting period. Based on that evaluation, the Chief Executive Officer and Chief Financial Officer concluded that our disclosure controls and procedures were effective as of the end of the reporting period.
There have been no changes in our internal control over financial reporting identified in connection with the evaluation required by paragraph (d) of Exchange Act Rules 13a-15 or 15d-15 that occurred during the second quarter of 2020 that have materially affected, or are reasonably likely to materially affect, our internal control over financial reporting. Although most of our corporate employees have shifted to a remote working environment due to the COVID-19 pandemic, we have not experienced a material impact to our internal control over financial reporting. We are continually monitoring and assessing the COVID-19 situation to minimize the impact on the design and operating effectiveness of our internal controls.
78 | | |
Legal Proceedings, Risk Factors, Unregistered Sales of Equity Securities and Other Information
Part II - OTHER INFORMATION
ITEM 1. LEGAL PROCEEDINGS
In the ordinary conduct of our business, we are from time to time subject to lawsuits, investigations and claims, including, environmental claims and employee-related matters. Although we cannot predict with certainty the ultimate resolution of lawsuits, investigations and claims asserted against us, including civil penalties or other enforcement actions, we do not believe that any currently pending legal proceeding or proceedings to which we are a party will have a material adverse effect on our business, financial condition or results of operations. See Note 11 to our accompanying condensed consolidated financial statements, which is incorporated by reference in this Item1, for additional information. Aside from the disclosure in Note 11, there have been no material developments to the proceedings previously reported in our Annual Report on Form 10-K, as amended and filed on February 28, 2020.
ITEM 1A. RISK FACTORS
There were no material changes during the six months ended June 30, 2020 to the risk factors identified in the Company’s fiscal 2019 Annual Report on Form 10-K, except as noted below.
The current COVID-19 Pandemic and certain developments in the global oil markets have had, and may continue to have, an adverse impact on our business, our future results of operations and our overall financial performance.
The COVID-19 Pandemic could materially adversely affect our business and operations during 2020 and possibly beyond. In early 2020, global health care systems and economies began to experience strain from the spread of the COVID-19 coronavirus. As the virus spread, global economic activity began to slow and future economic activity was forecast to slow with a resulting forecast of a decline in oil and gas demand. The global pandemic has resulted in a dramatic reduction in airline flights and has reduced the number of cars on the road. Governmental actions in response to the COVID-19 Pandemic have resulted in significant business and operational disruptions, including business closures, supply chain disruptions, travel restrictions, stay-at-home orders, and limitations on the availability and effectiveness of the workforce. These impacts have negatively impacted and will likely continue to negatively impact worldwide economic and commercial activity, financial markets, and demand for and prices of oil and gas products for the foreseeable future. These impacts may also precipitate a prolonged economic slowdown and recession.
In response to the decline in demand, OPEC participating countries agreed to adjust downwards their overall production of crude oil through April 30, 2022, with the agreement to be reassessed in December 2021. These declines have been exacerbated by a production dispute between Russia and the members of OPEC, particularly Saudi Arabia, and the subsequent actions taken by such countries as a result thereof. A sustained reduction in crude oil production will potentially affect the global supply, prices of oil and refined products in our market. Additionally, a significant reduction or freeze in crude oil production in the United States will adversely affect our suppliers and source of crude oil.
Global economic growth drives demand for energy from all sources, including fossil fuels. Should the U.S. and global economies experience weakness, demand for energy may decline. Similarly, should growth in global energy production outstrip demand, excess supplies may arise. Declines in demand and excess supplies may result in accompanying declines in commodity prices and deterioration of our financial position along with our ability to operate profitably and our ability to obtain financing to support operations. With respect to our business, we have experienced periodic declines in demand thought to be associated with slowing economic growth in certain markets, including the effects of the COVID-19 Pandemic, coupled with new oil and gas supplies coming on line and other circumstances beyond our control that resulted in oil and gas supply exceeding global demand which, in turn, resulted in steep declines in prices of oil and natural gas. There can be no assurance as to how low the current price decline will persist or that a recurrence of price weakness will not arise in the future.
The COVID-19 Pandemic has resulted in modifications to our business practices, including limiting employee and contractor presence at certain work locations, limiting travel, and reducing capital expenditures for 2020. We may take further actions as required by government authorities or that we determine are in the best interests of our employees, contractors, customers, suppliers and communities. However, there is no assurance that such measures will be sufficient to mitigate the risks posed by the virus, and our ability to successfully execute our business operations could be adversely impacted. In addition, while we have had no COVID-related impairments to date, the continued effects of the COVID-19 Pandemic could result in impairments of long-lived or indefinite-lived assets, including goodwill, at some point in the future. Such impairment charges could be material.
The full impact of the COVID-19 Pandemic is unknown and is rapidly evolving. The ultimate extent of the impact of COVID-19 on our business, financial condition, results of operation and liquidity will depend largely on future developments, including the duration and spread of the virus outbreak, particularly within the geographic areas where we operate, actions taken by national, state, and local governments and health officials to contain the virus or treat its effects, and the related impact on overall economic activity, all of which are uncertain and cannot be predicted with certainty at this time. The ultimate extent of the impact of the volatile conditions in the oil and gas industry on our business, financial condition, results of operation and liquidity will also depend largely on future developments, including the extent and duration of any price reductions, any additional decisions by OPEC and disputes between the members of OPEC+.
79 | | |
To the extent COVID-19 and the developments in the global oil markets adversely affects our business, financial condition, results of operation and liquidity, they may also have the effect of heightening many of the other risks described in the “Risk Factors” section included in our Annual Report on Form 10-K for the year ended December 31, 2019 and in this Quarterly Report on Form 10-Q, as those risk factors are amended or supplemented by subsequent Quarterly Reports on Form 10-Q and other reports and documents we file with the SEC after the date hereof.
We are particularly vulnerable to disruptions to our refining operations because our refining operations are concentrated in four facilities.
Because all of our refining operations are concentrated in the Tyler, El Dorado, Big Spring and Krotz Springs refineries, significant disruptions at one of these facilities could have a material adverse effect on our consolidated financial results. Refining segment contribution margin comprised approximately 79.4%, 84.2% and 88.3% of our consolidated contribution margin for the 2019, 2018 and 2017 fiscal years, respectively.
Our refineries consist of many processing units, a number of which have been in operation for many years. These processing units undergo periodic shutdowns, known as turnarounds, during which routine maintenance is performed to restore the operation of the equipment to a higher level of performance. Depending on which units are affected, all or a portion of a refinery's production may be halted or disrupted during a maintenance turnaround. We completed a maintenance turnaround at our El Dorado refinery in 2014 and a shortened turnaround that allowed work to be completed on the majority of the process units in March 2019. In addition, we completed a maintenance turnaround at our Tyler refinery in 2015 and a maintenance turnaround for our Big Spring refinery which began January of 2020. We are also subject to unscheduled down time for unanticipated maintenance or repairs.
Refinery operations may also be disrupted by external factors, such as a suspension of feedstock deliveries, cyber-attacks, a global pandemic such as the recent outbreak of the novel coronavirus, or an interruption of electricity, natural gas, water treatment or other utilities. Other potentially disruptive factors include natural disasters, severe weather conditions, workplace or environmental accidents, interruptions of supply, work stoppages, losses of permits or authorizations or acts of terrorism.
The stockholder rights plan adopted by our Board may impair an attempt to acquire control of Delek.
On March 20, 2020, our Board of Directors adopted a stockholder rights plan and declared a dividend of one preferred share purchase right for each outstanding share of our common stock to stockholders of record on March 30, 2020. In the event that a person or group acquires beneficial ownership of 15% or more of our then-outstanding common stock, subject to certain exceptions, each right would entitle its holder (other than such person or members of such group) to purchase one one-thousandth of a share of Series A Junior Participating Preferred Stock. In addition, at any time after a person or group acquires 15% or more of our common stock (unless such person or group acquires 50% or more), the Board may exchange one share of our common stock for each outstanding right (other than rights owned by such person or group, which would have become void). The stockholder rights plan could make it more difficult for a third party to acquire control of Delek or a large block of our common stock without the approval of our Board of Directors. Unless extended by the Board prior to expiration, the rights will expire on March 19, 2021.
The periodic price adjustment settlements on the J. Aron Supply and Offtake Agreement may affect our liquidity position.
In April 2020, we amended and restated our three Supply and Offtake Agreements to renew and extend the terms to December 30, 2022, with J. Aron having the sole discretion to further extend to May 30, 2025 by providing at least six months prior notice to the current maturity date. As part of this amendment, there were changes to the underlying market index, annual fee, the crude purchase fee, crude roll fees and timing of cash settlements related to periodic price adjustments ("PPA") on the differentials.The PPA are calculated semi-annually on October 01 and May 01 ("re-pricing dates") and will result in cash settlements, (either payments to J. Aron or receipts of additional funds from J. Aron), based on the market value of the underlying commodity differential compared to the contractual differential, subject to a set threshold amount. In the event that the periodic price adjustments are triggered on the re-pricing dates, we may be required to make earlier cash payments within three months following the re-pricing date.
ITEM 2. UNREGISTERED SALES OF EQUITY SECURITIES AND USE OF PROCEEDS
On November 6, 2018, our Board of Directors authorized a share repurchase program for up to $500.0 million of Delek common stock. Any share repurchases under the repurchase program may be implemented through open market transactions or in privately negotiated transactions, in accordance with applicable securities laws. The timing, price, and size of repurchases will be made at the discretion of management and will depend on prevailing market prices, general economic and market conditions and other considerations. The repurchase program does not obligate us to acquire any particular amount of stock and does not expire. The following table sets forth information with respect to the purchase of shares of our common stock made during the three months ended June 30, 2020 by or on behalf of us or any “affiliated purchaser,” as defined by Rule 10b-18 of the Exchange Act (inclusive of all purchases that have settled as of June 30, 2020):
Period | Total Number of Shares Purchased | Average Price Paid per Share | Total Number of Shares Purchased as Part of Publicly Announced Plans or Programs | Approximate Dollar Value of Shares that May Yet Be Purchased Under the Plans or Programs | ||||||||||
April 1 - April 30, 2020 | — | $ | — | — | $ | 229,724,248 | ||||||||
May 1 - May 31, 2020 | — | — | — | 229,724,248 | ||||||||||
June 1 - June 30, 2020 | — | — | — | 229,724,248 | ||||||||||
Total | — | $ | — | — | N/A | |||||||||
80 | | |
ITEM 5. OTHER INFORMATION
Dividend Declaration
On August 3, 2020, our Board of Directors voted to declare a quarterly cash dividend of $0.31 per share of our common stock, payable on September 3, 2020 to shareholders of record on August 19, 2020.
Executive Employment Agreement
On August 1, 2020, the Company entered into an executive employment agreement with Reuven Spiegel (the "Employment Agreement"). The Employment Agreement amends and replaces the offer letter the Company entered into with Mr. Spiegel in April 2020 in connection with his appointment as Chief Financial Officer. The Employment Agreement has a term expiring December 31, 2023, and provides for the following: an annual base salary of $500,000; the $500,000 cash bonus opportunity set forth in Mr. Spiegel’s offer letter, payable in April 2021; beginning in 2021, an annual bonus opportunity with a target amount of 75% of base salary and a maximum payout opportunity of 200% of the target amount; and, beginning in 2021, annual grants under the Company’s 2016 Long-Term Incentive Plan in an amount of $800,000 per year split evenly between time-vesting restricted stock units (“RSUs”) and performance-based RSUs.
In the event Mr. Spiegel is terminated without cause (as defined in the Employment Agreement) or terminates his employment with good reason (as defined in the Employment Agreement), Mr. Spiegel would be entitled to (i) an amount equal to the sum of his then-current base salary and target annual bonus as in effect immediately before any notice of termination, (ii) the costs of continuing family health insurance coverage for 12 months following termination of employment, (iii) any annual bonus Mr. Spiegel would have otherwise been entitled to if his employment had continued through the end of the bonus year based upon the actual performance of the Company, prorated for the period of actual employment during the bonus year, and paid upon the payment of the annual bonuses to senior executives of the Company pursuant to the Company’s annual bonus programs, and (iv) the immediate vesting of all unvested equity awards as follows: (A) for unvested performance awards, on a prorated basis through the termination of employment based on actual results evaluated after the close of the applicable performance period and payable in a lump sum at the same time as performance awards are paid to executives of the Company generally and (B) for full value equity awards (e.g., restricted stock, restricted stock units and phantom units) and appreciation equity awards (e.g., non-qualified stock options and stock appreciation rights), only to the extent that such awards would have vested if Mr. Spiegel’s employment had continued during a period equal to the lesser of six months following termination of employment or the balance of the term of the Employment Agreement.
If Mr. Spiegel terminates his employment for any reason, other than with good reason or upon his death or disability, and provides at least three months’ advance written notice of termination, Mr. Spiegel would be entitled to an amount equal to 50% of his annual base salary at the time notice is delivered, plus the costs of continuing family health insurance coverage for 12 months following the termination of his employment.
If, within two years of a change in control of the Company (as defined in the Employment Agreement), Mr. Spiegel’s employment is terminated by the Company without cause or he terminates his employment for good reason, Mr. Spiegel would be entitled to receive (i) an amount equal to two times the sum of his then-current base salary and target annual bonus as in effect immediately before any notice of termination, (ii) the costs of continuing family health insurance coverage for 12 months following termination of employment, (iii) any annual bonus Mr. Spiegel would have otherwise been entitled if his employment had continued through the end of the bonus year based upon the actual performance of the Company, prorated for the period of actual employment during the bonus year, and paid upon the payment of the annual bonuses to senior executives of the Company pursuant to the Company’s annual bonus programs, and (iv) the immediate vesting of all unvested equity awards. In addition to the foregoing, Mr. Spiegel would receive an additional $500,000 cash bonus if the change in control occurs before March 10, 2021.
All payments to be made by the Company upon termination as described above are subject to Mr. Spiegel executing a release of claims in favor of the Company. In addition to benefits available to the Company’s senior executive officers generally, the Employment Agreement also provides reimbursement for the reasonable costs of professional preparation of his personal income tax returns, not to exceed $25,000 in any calendar year.
The Employment Agreement includes a noncompetition clause which provides that Mr. Spiegel will not compete with the Company, directly or indirectly, in the territory (as defined in the Employment Agreement) during the term of the Employment Agreement and for one year thereafter. The Employment Agreement also includes non-solicitation provisions with respect to the customers and employees of the Company during the term of the Employment Agreement and for one year thereafter.
The above description of the Employment Agreement does not purport to be complete and is qualified in its entirety by reference to the Employment Agreement itself, a copy of which is filed with this report as Exhibit 10.5 and is incorporated herein in its entirety by reference.
81 | | |
Exhibits
ITEM 6. EXHIBITS
Exhibit No. | Description | ||
# | |||
~ | |||
~# | |||
~# | |||
~# | |||
# | Certification of the Company’s Chief Executive Officer pursuant to Rule 13a-14(a)/15(d)-14(a) under the Securities Exchange Act of 1934, as amended. | ||
# | Certification of the Company’s Chief Financial Officer pursuant to Rule 13a-14(a)/15(d)-14(a) under the Securities Exchange Act of 1934, as amended. | ||
## | Certification of the Company’s Chief Executive Officer pursuant to 18 U.S.C. Section 1350, as adopted pursuant to Section 906 of the Sarbanes-Oxley Act of 2002. | ||
## | Certification of the Company’s Chief Financial Officer pursuant to 18 U.S.C. Section 1350, as adopted pursuant to Section 906 of the Sarbanes-Oxley Act of 2002. | ||
101 | The following materials from Delek US Holdings, Inc.’s Quarterly Report on Form 10-Q for the quarterly period ended June 30, 2020, formatted in Inline XBRL (eXtensible Business Reporting Language): (i) Condensed Consolidated Balance Sheets as of June 30, 2020 and December 31, 2019 (Unaudited), (ii) Condensed Consolidated Statements of Income for the three and six months ended June 30, 2020 and 2019 (Unaudited), (iii) Condensed Consolidated Statements of Comprehensive Income for the three and six months ended June 30, 2020 and 2019 (Unaudited), (iv) Condensed Consolidated Statements of Changes in Stockholders' Equity for the three and six months ended June 30, 2020 and 2019 (Unaudited), (v) Condensed Consolidated Statements of Cash Flows for the six months ended June 30, 2020 and 2019 (Unaudited), and (vi) Notes to Condensed Consolidated Financial Statements (Unaudited). | ||
104 | The cover page from Delek US Holdings, Inc.'s Quarterly Report on Form 10-Q for the quarter ended June 30, 2020, has been formatted in Inline XBRL. | ||
# | Filed herewith | |
## | Furnished herewith | |
~ | Certain information contained in these exhibits has been omitted because it is not material and would likely cause competitive harm to the Company if publicly disclosed. | |
82 | | |
SIGNATURES
Pursuant to the requirements of the Securities Exchange Act of 1934, the registrant has duly caused this report to be signed on its behalf by the undersigned, thereunto duly authorized.
Delek US Holdings, Inc. | |
By: | /s/ Ezra Uzi Yemin |
Ezra Uzi Yemin | |
Director (Chairman), President and Chief Executive Officer (Principal Executive Officer) | |
By: | /s/ Reuven Spiegel |
Reuven Spiegel | |
Executive Vice President and Chief Financial Officer (Principal Financial and Accounting Officer) | |
Dated: August 6, 2020
83 | | |