UNITED STATES
SECURITIES AND EXCHANGE COMMISSION
Washington, D.C. 20549
FORM
CURRENT REPORT
PURSUANT TO SECTION 13 OR 15(d) OF THE
SECURITIES EXCHANGE ACT OF 1934
Date of Report (Date of earliest event reported):
(Exact name of Registrant as specified in its charter)
|
| |||
(State or other jurisdiction of incorporation or organization) | (Commission file number) | (I.R.S. Employer Identification No.) | ||
(Address of principal executive offices) | (Zip Code) |
Registrant’s telephone number, including area code: (
Former name or former address, if changed since last report:
Check the appropriate box below if the Form 8-K filing is intended to simultaneously satisfy the filing obligation of the registrant under any of the following provisions (see General Instructions A.2.):
Securities registered pursuant to Section 12(b) of the Act:
Indicate by check mark whether the registrant is an emerging growth company as defined in Rule 405 of the Securities Act of 1933 (§230.405 of this chapter) or Rule 12b-2 of the Securities Exchange Act of 1934 (§240.12b-2 of this chapter).
Emerging growth company
If an emerging growth company, indicate by check mark if the registrant has elected not to use the extended transition period for complying with any new or revised financial accounting standards provided pursuant to Section 13(a) of the Exchange Act ☐
Item 2.02Results of Operations and Financial Condition
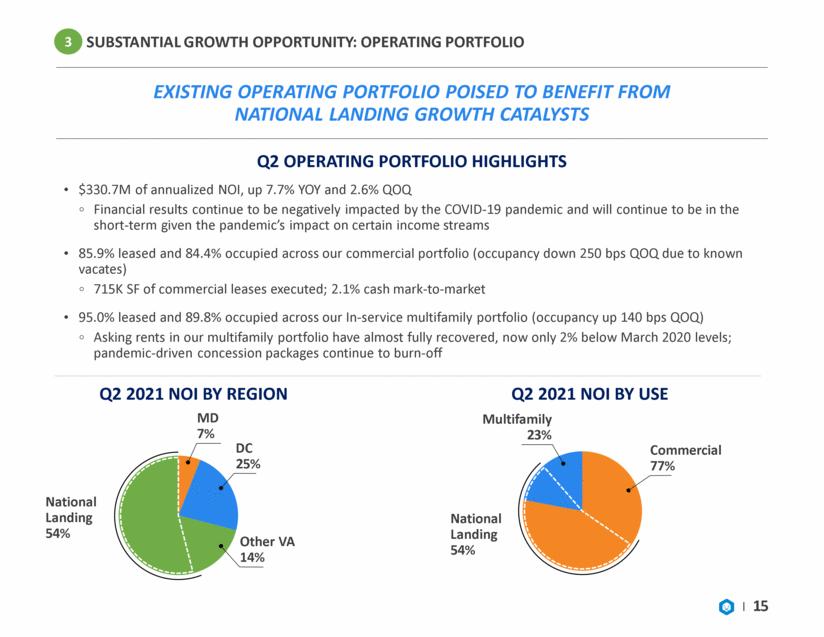
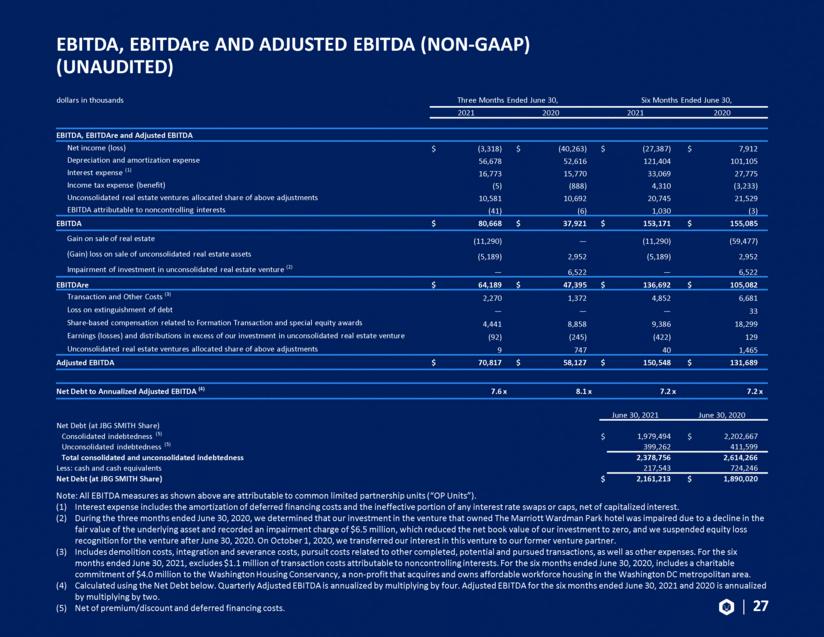
On August 3, 2021, JBG SMITH Properties (the “Company”) announced its financial results for the three and six months ended June 30, 2021. The Company also released a Quarterly Investor Package, which contains a letter to shareholders, the earnings press release and supplemental information. A copy of the Quarterly Investor Package is furnished as Exhibit 99.1 to this Current Report on Form 8-K.
Item 7.01Regulation FD Disclosure
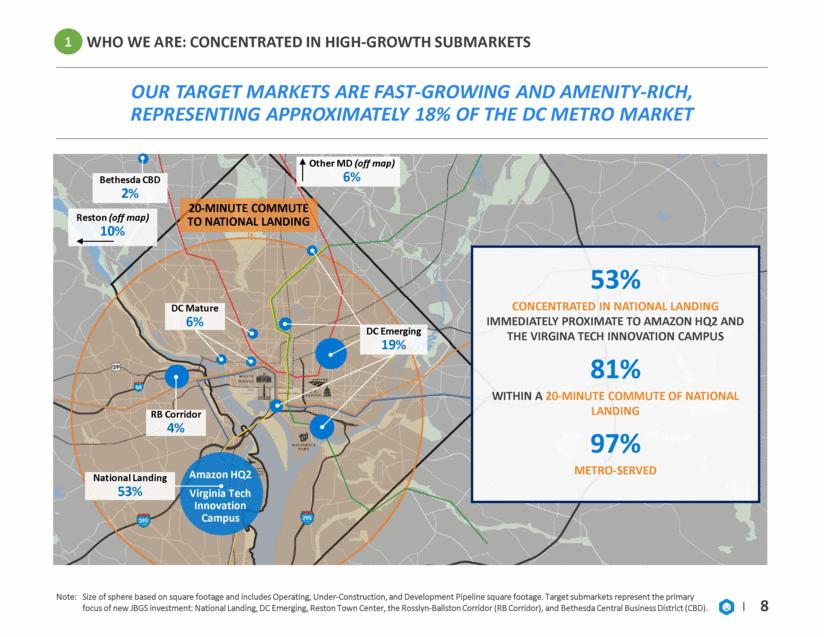
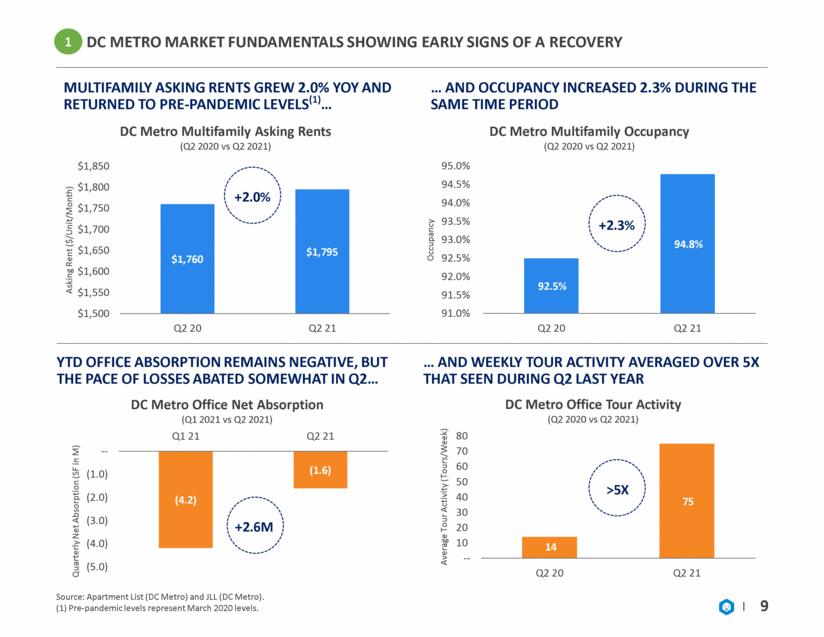
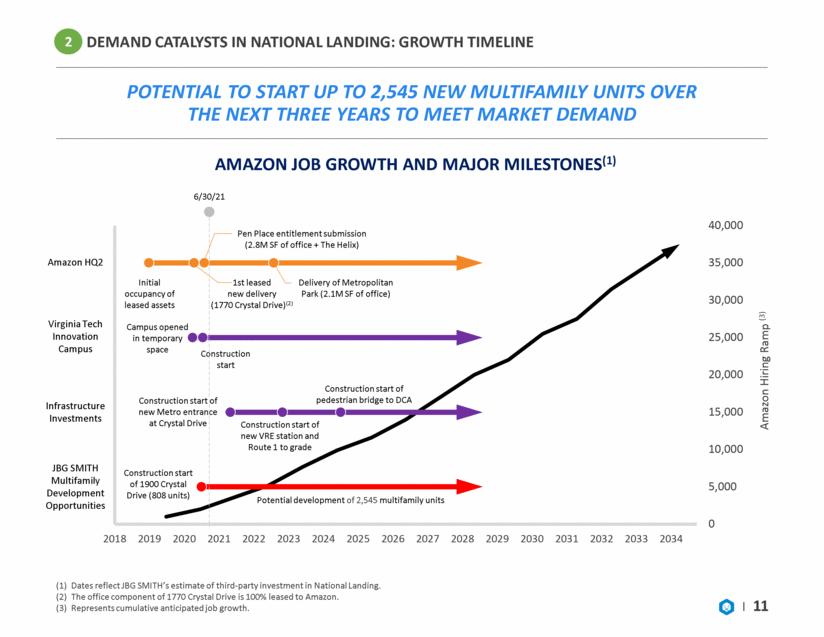
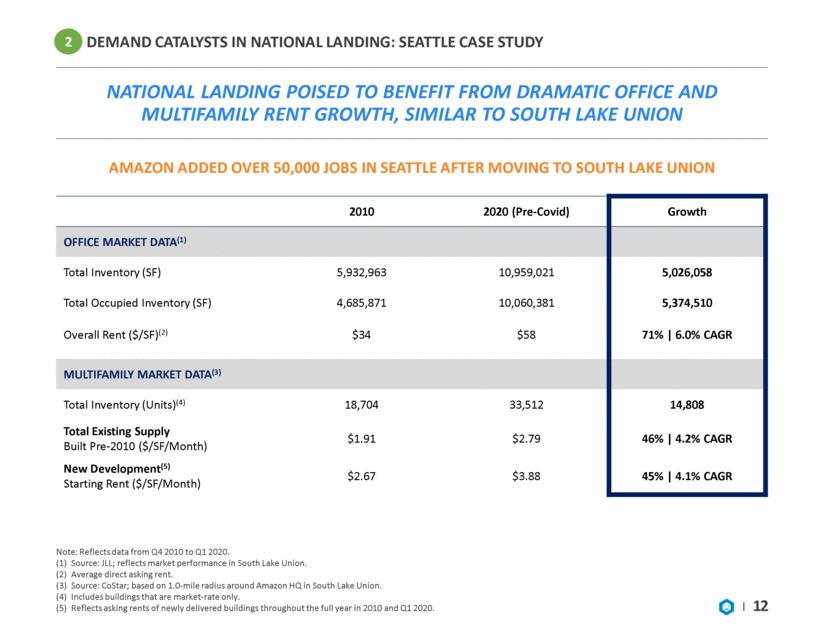
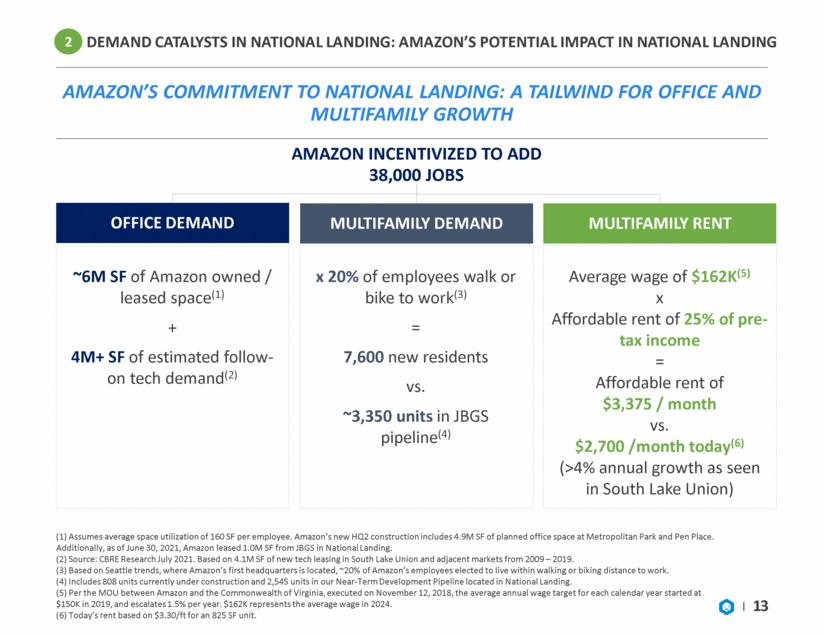
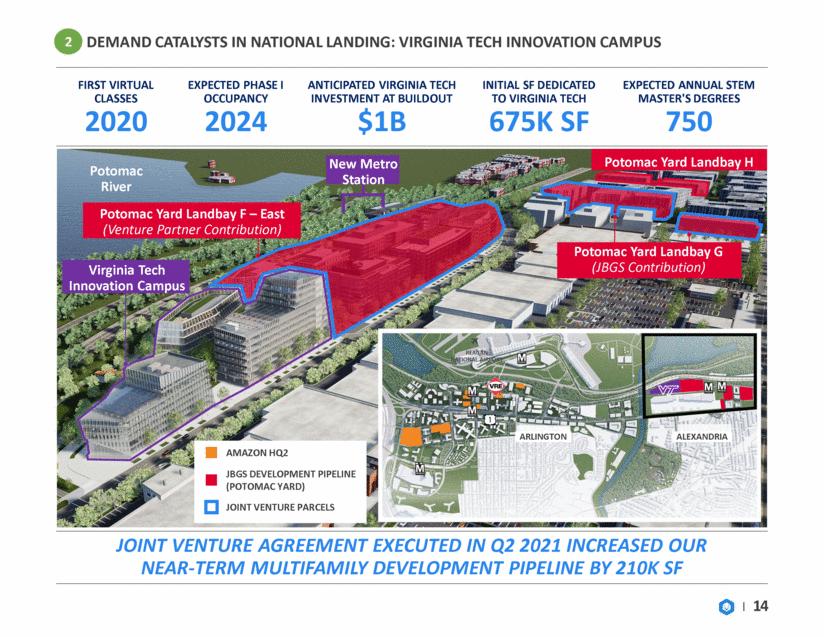
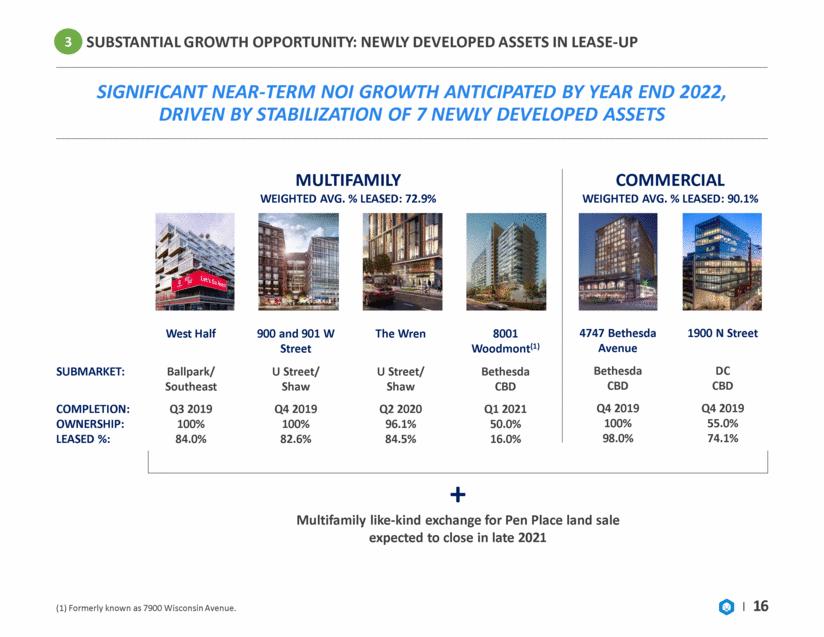
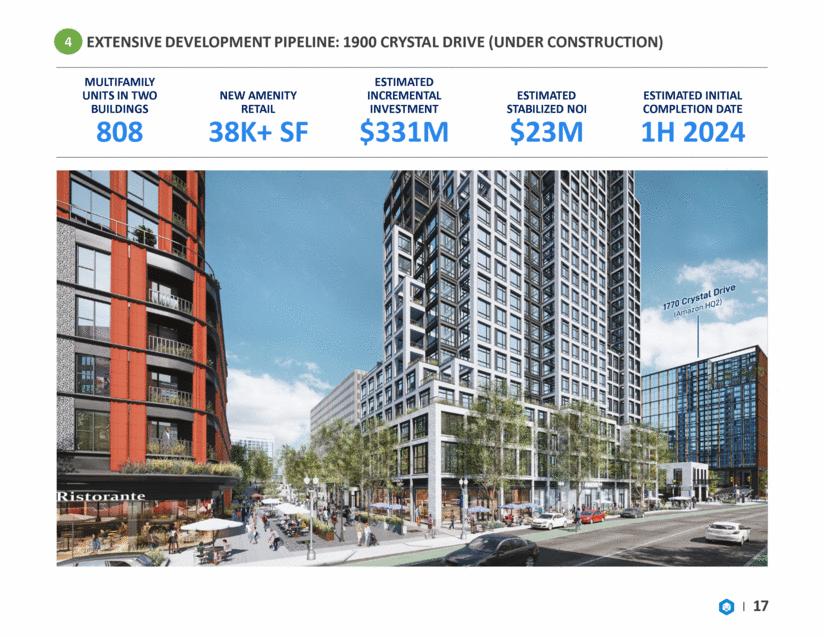
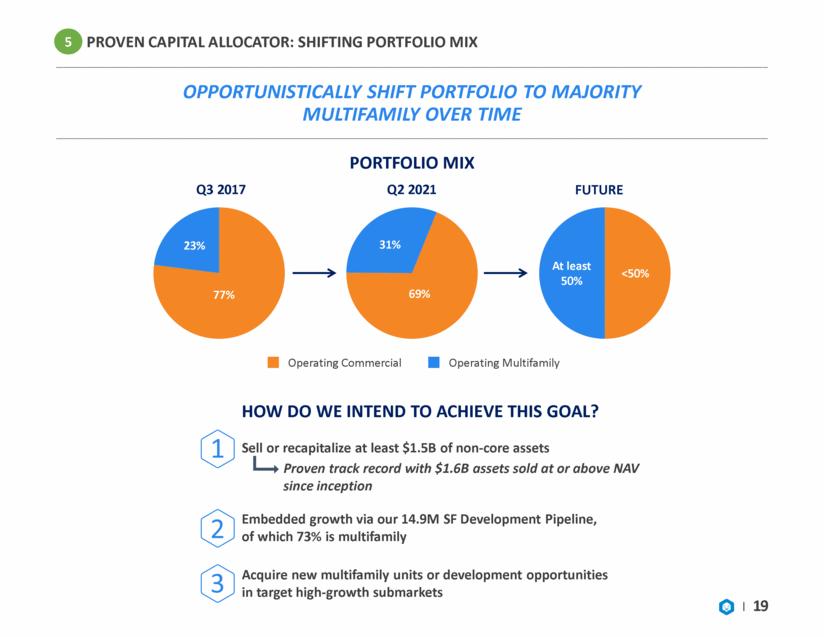
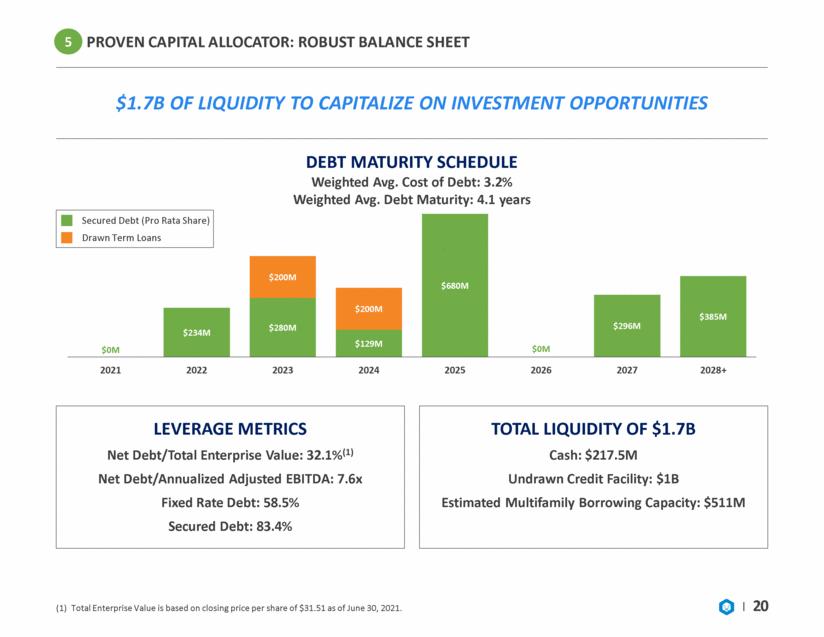
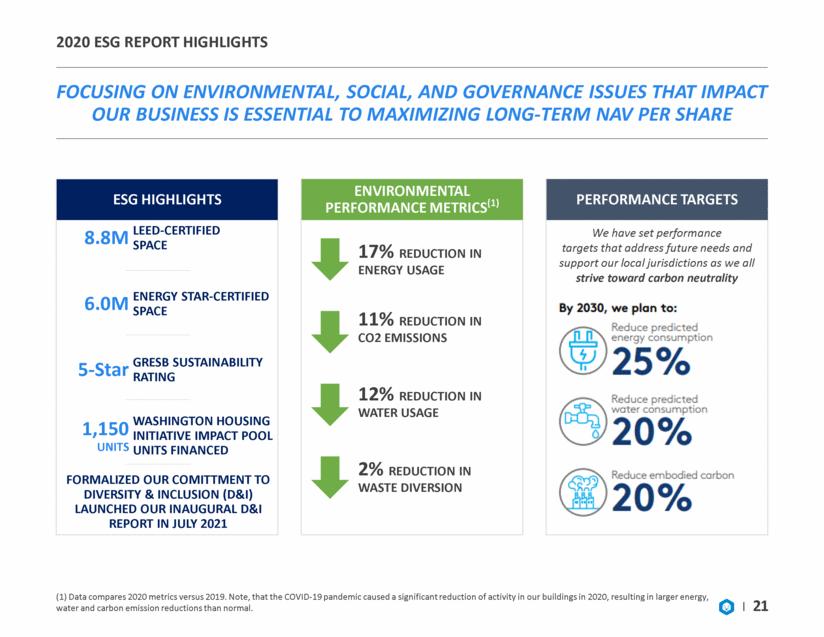
On August 3, 2021, the Company posted an investor presentation to its website at www.jbgsmith.com on the “Investor Relations” page. A copy of the investor presentation is furnished as Exhibit 99.2 to this Current Report on Form 8-K and is incorporated herein solely for purposes of this Item 7.01 disclosure.
The information contained in this Current Report on Form 8-K, including Exhibit 99.1 and Exhibit 99.2, shall not be deemed “filed” with the Securities and Exchange Commission for purposes of Section 18 of the Securities Exchange Act of 1934, as amended (the "Exchange Act"), or otherwise subject to liabilities of that section, nor incorporated by reference into any filing of the Company under the Securities Act of 1933, as amended, or the Exchange Act.
Item 9.01Financial Statements and Exhibits
(d) Exhibits
99.1 Quarterly Investor Package for the quarter ended June 30, 2021.
99.2JBG SMITH Properties Investor Presentation.
104 | Cover Page Interactive Data File (the cover page XBRL tags are embedded in the Inline XBRL document). |
SIGNATURE
Pursuant to the requirements of the Securities Exchange Act of 1934, the registrant has duly caused this report to be signed on its behalf by the undersigned hereunto duly authorized.
JBG SMITH PROPERTIES | ||||
August 3, 2021 | By: | /s/ M. Moina Banerjee | ||
M. Moina Banerjee | ||||
Chief Financial Officer | ||||
(Principal Financial Officer) |
Quarterly Investor Package
JBGS Divider
Management Letter
August 3, 2021
The pandemic continues to evolve daily, and while we are optimistic about the future, given the rapid rise of new COVID-19 infections and the prevalence of new variants, uncertainty and unpredictably persist. Fortunately, the DC metro area is approximately 60% fully vaccinated, and market fundamentals have improved significantly in the past few months. Most important, the demand tailwinds driving our performance have only strengthened, and our long-term growth trajectory remains very much on track.
Amazon’s accelerated hiring pace continues to be a significant growth catalyst in National Landing. To date, Amazon has made great strides on the job creation front in National Landing, hiring over 1,600 employees, and is on track to surpass its minimum commitment to the Commonwealth of Virginia of 3,544 new hires by year end 2021. We believe this robust hiring, coupled with Amazon’s recently announced return-to-work plan, which requires that all corporate employees be physically present in the office at least three days per week for 11 months of the year, bodes very well for the continued growth of National Landing. To accommodate this surge in hiring, in the second quarter, Amazon leased 167,000 square feet of additional short-term space in National Landing, bringing the total existing office space leased from JBG SMITH to 1.0 million square feet. This reflects not only their strong hiring pace, but also our expectation that they will occupy a combination of both owned and leased space as HQ2 continues to grow. We remain on pace with the under-construction 2.1 million square foot Metropolitan Park and continue to advance the entitlements of the planned Pen Place, which includes the iconic Helix building.
Virginia Tech continues to expand its commitment in National Landing, partnering with aircraft manufacturer Boeing, which has committed to provide Virginia Tech with $50 million to support the $1 billion Innovation Campus. Virginia Tech expects to commence in-person instruction in National Landing in the fall, which we believe will cement the Innovation Campus as a talent incubator for corporations looking to relocate to the submarket.
Fundamentals continue to improve within our commercial and multifamily portfolios. Tour activity in our commercial portfolio over the past several months has ranged from 50 to 75% of pre-pandemic levels, and we leased more space in June than in any month since the start of the pandemic, both strong indicators that the market is finally making a comeback. Asking rents in our multifamily portfolio have almost fully recovered, now only 2% below March 2020 levels.
Year-to-date we have commenced marketing over $400 million of non-core assets, and plan to launch additional assets for sale in the coming months. We are beginning to see early indications that the capital markets are open for business, with private institutions representing a new and significant driver of available capital. This should ultimately support asset values, but it’s still too early to tell where pricing will land.
100% of our 5.0 million square foot Near-Term Development Pipeline is either fully entitled or has been submitted for final entitlements. During the second quarter, we secured final entitlements for two multifamily buildings in National Landing, 2000 and 2001 South Bell Street. With these approvals, approximately 45% of our
1
5.0 million square foot Near-Term Development Pipeline is fully entitled, with the remaining 55% expected to receive final entitlement approval by the end of next year.
We partnered with AT&T and Arlington County to make National Landing the nation’s first 5G Smart City at scale. As a follow-on to our acquisition of CBRS spectrum licenses, the agreements we signed with AT&T and Arlington County are the first of several we plan to execute as part of our larger initiative to cement National Landing as one of the nation’s premier innovation districts with world-class tech infrastructure, corporate, and educational anchors. These initiatives are key differentiators that make National Landing a top contender for relocation of technology companies and other businesses, paving the way for substantial growth and superior tenant retention for years to come.
We provide more detail on each of these growth drivers below in our Q2 2021 and Recent Highlights section. We also encourage you to read our updated JBG SMITH Overview section.
JBG SMITH Overview
We own and operate urban mixed-use properties concentrated in what we believe are the highest growth submarkets of the historically recession-resilient Washington, DC metro area.
Our concentration in these submarkets, our substantial portfolio of operating and development opportunities, and our market-leading platform position us to capitalize on the significant growth anticipated in our target submarkets.
>50% of our holdings are in the National Landing submarket in Northern Virginia, directly across the Potomac River from Washington, DC, where Amazon’s new headquarters and Virginia Tech’s planned new $1 billion Innovation Campus are located.
The Commonwealth of Virginia has incentivized Amazon to bring up to 38,000 new jobs to National Landing, which, based on data from the National Landing Business Improvement District, would increase the daytime population in the submarket from approximately 50,000 people today to nearly 90,000 people in the future, representing dramatic growth of more than 70%. Amazon has publicly indicated its intention to bring people back to the office and recently announced its return-to-work plan, requiring all corporate employees be physically present in the office at least three days per week for 11 months of the year. In Seattle, where Amazon’s first headquarters is located, approximately 20% of Amazon’s employees have elected to live within walking or biking distance to work, and Amazon recently announced $350 monthly stipends for employees who bike to HQ2. Using Amazon’s Seattle employee patterns and preferences as a proxy for behaviors that might be expected at HQ2, 20% of employees, or up to 7,600 Amazonians, could be expected to live within the National Landing submarket. This potential influx of demand for additional multifamily units aligns well with our plans to deliver new multifamily supply to the submarket. In addition to the 808-units at 1900 Crystal Drive currently under construction, we have the potential to develop as many as 2,545 new multifamily units within our Near-Term Development Pipeline in National Landing.
While we control 77% of the existing office supply and 79% of the unencumbered development density in National Landing, the balance of our portfolio is concentrated in what we believe are the highest growth submarkets in the Washington, DC metro region, the majority of which are within a 20-minute commute of the growing technology ecosystem in National Landing.
We believe the strong technology sector tailwinds created by Amazon, the Virginia Tech Innovation Campus, and our National Landing Smart City initiative, including our recently announced 5G rollout and other connectivity enhancements with best-in-class partners, will drive substantial long-term NAV per share growth.
2
Our successful track record and well-established platform position us to maximize the value of our Development Pipeline and to access attractively priced capital through opportunistic land sales, ground leases, and/or recapitalizations with private investors.
As of the second quarter, we had one asset under construction – 1900 Crystal Drive, an 808-unit multifamily property located in the heart of National Landing. Upon stabilization, we expect this asset to generate approximately $23 million of annualized NOI, representing a 5.8% yield on cost. Since our formation in 2017, we have successfully delivered 2.8 million square feet of mixed-use development, with an estimated stabilized yield of 6.5% for multifamily assets and 7.0% for commercial assets.
Over the past year, we advanced the design and entitlement of approximately 75% of our Development Pipeline, of which 60% is in National Landing. Our 14.9 million square foot Development Pipeline, of which 73% is multifamily, includes both a 5.0 million square foot Near-Term Development Pipeline and a 9.9 million square foot Future Development Pipeline. Our Near-Term Development Pipeline comprises the most accretive and strategic development opportunities in our growth pipeline – those which have the potential to commence construction over the next 36 months, subject to receipt of final entitlements, completion of design, and market conditions. For assets in our Future Development Pipeline, we are actively advancing entitlement and design to bring these assets to a shovel-ready condition. We believe that advancing entitlement and design of these assets is the best way to maximize optionality and value, either through internal development, land sales, ground lease structures, and/or recapitalizations with third-party capital.
Our capital allocation strategy will shift our portfolio to majority multifamily.
We expect our shift to majority multifamily to occur through a combination of investing in multifamily assets and divesting of non-core office assets. In addition to the sale of $1.6 billion of non-core, primarily office assets since our formation in 2017, we intend to opportunistically sell at least another $1.5 billion of non-core assets, including office assets outside of National Landing as well as land sites, where ground lease or joint venture execution may represent the clearest path to maximizing value.
Q2 2021 and Recent Highlights
100% of our 5.0 million square foot Near-Term Development Pipeline is either fully entitled or has been submitted for final entitlements. We have successfully entitled approximately 45% of our Near-Term Development Pipeline, including 2000 and 2001 South Bell Street in National Landing which received final entitlement approvals in May. The design calls for 785 multifamily units across two buildings, with more than 29,000 square feet of ground floor retail, totaling approximately 718,000 square feet of new development. The planned buildings, which will include panoramic views of National Landing and the Washington DC monumental skyline, are located just one block from vibrant, new dining and retail amenities along Crystal Drive, the current Metro entrance, a planned new regional rail (VRE) station, and the planned pedestrian bridge to Reagan National Airport. Upon completion of final building designs, and subject to market conditions, we believe that these assets will be ready to commence construction as soon as the beginning of 2022.
We expect the remaining 55% of our Near-Term Development Pipeline to receive final entitlement approval by the end of next year. This includes approximately 1,525 multifamily units at 223 23rd Street and 2250 Crystal Drive located less than a half mile from Amazon HQ2, which we submitted for final entitlement in July. These opportunities will be subject to the same capital allocation discipline governing all of our new investment, including
3
diligently tracking construction pricing and closely monitoring market conditions to determine the optimal timeline for future construction starts.
Smart City Initiative
The arrival of Amazon’s new headquarters and the Virginia Tech Innovation Campus validate National Landing within the DC region as an ideal location for innovative companies, and we have been focused on further enhancing the submarket’s appeal to other high-growth organizations. Through our active tenant-cultivation efforts, our team conducted a deep dive into the priorities of high-tech tenants and found that, second only to talent, these organizations prioritize access to robust, reliable connectivity when making their real estate decisions. Our control of most of the real estate in National Landing allows JBG SMITH to serve as a “digital placemaker” – making investments to bring world-class digital infrastructure and service providers to the market. As a result, we are pursuing investments that enable the rapid deployment of next-generation digital infrastructure such as dense, redundant, and secure fiber networks, edge data centers, world-class 5G connectivity, and next-generation private networks, all delivered by best-in-class service providers.
We recently advanced this digital placemaking strategy through agreements with AT&T and Arlington County. In July, we entered into a letter of intent with AT&T to deploy in National Landing one of the most robust 5G wireless network infrastructures of any urban environment. The plan, which is expected to be economically accretive to both JBG SMITH and AT&T, features a 5G network spread across National Landing, powered by AT&T, with a combination of mmWave and sub-6 5G spectrum, enabled by a series of building side-mounts, street furniture, and underground network infrastructure controlled by JBG SMITH. While AT&T occupies an important role as a lead carrier, we believe this will be the first of many agreements with telecom and technology partners in National Landing. Following closely behind the AT&T LOI, we signed an agreement with Arlington County that provides JBG SMITH access to existing Arlington County-owned dark fiber and conduit assets in National Landing with the goal of advancing the rollout of the innovation district. The fiber and conduit are important components of the enhanced fiber network that we are building in National Landing to serve our tenants, and they also enable an expansive 5G wireless rollout. This agreement significantly accelerates and de-risks both of those goals. As part of this agreement, we have also strengthened our ties with Arlington Economic Development and will be jointly pursuing the kinds of high-growth, innovative tenants to whom these kinds of technology investments are particularly meaningful.
Financial and Operating Metrics
For the three months ended June 30, 2021, we reported a net loss attributable to common shareholders of $3.0 million or $0.03 per share and Core FFO attributable to common shareholders of $44.8 million or $0.34 per share. Same Store NOI for the quarter increased 0.4% year-over-year to $76.5 million. The increase is largely attributable to lower reserves and rent deferrals, partially offset by lower occupancy in our commercial portfolio and lower rents and higher concessions in our multifamily portfolio. Our operating portfolio ended the quarter at 87.7% leased and 85.0% occupied. For second generation leases, the rental rate mark-to-market was 2.1%. As we have mentioned before, our mark-to-market will vary from quarter to quarter depending on the leases signed. Rent collections across our portfolio remain stable and in line with prior quarters, and, accordingly, we have removed the detailed disclosures within our earnings release. To the extent there is a material change in our rent collections, we will reintroduce updates as necessary.
As of June 30, 2021, our Net Debt/Total Enterprise Value was 32.1%. While our Net Debt/Annualized Adjusted EBITDA was 7.6x in the second quarter, this multiple remains higher than historical levels primarily due to the impact of COVID-19 on certain income streams, as detailed in our earnings release. We also believe our leverage
4
levels will continue to be elevated in the short-term given the pandemic’s impact on these income streams. As income streams improve with an economic recovery, and our newly delivered assets lease-up and stabilize, we expect our leverage metrics to decrease, potentially offset by increases during active development.
Operating Portfolio
As vaccinations reached critical mass in the DC metro area and the region began to re-open, tour activity resumed in earnest – a trend we’ve seen not only in our own portfolio, but also in the market as a whole. JLL data shows that tour activity in the second quarter was more than 5x that of the second quarter last year. Internal leasing and external brokerage reports also show a significant uptick in leasing activity as this touring translates into leases. Additionally, in Northern Virginia where leasing has been flat through the second quarter, JLL points to several government contractor renewals as a positive while other brokerage firms like CBRE, report a significant uptick in leasing activity. While metrics typically vary between brokerage firms based on the portfolios surveyed and research methodologies employed, the overarching sentiment on leading demand indicators in the market is positive among most large brokerages’ published reports. Despite the positive sentiment around leading indicators, market fundamentals remained particularly challenged. For the second quarter, JLL reported negative 1.6 million square feet of absorption across the metro area, bringing the year-to-date total to 5.8 million square feet of negative net absorption. While this report shows that the rate of loss is slowing, it still speaks to the degree of vacancy in the market (20.9%) and the long road to full recovery. DC and Virginia are both the primary drivers of negative absorption with Maryland essentially remaining stagnant. Older office in both DC and Virginia remains the primary driver of losses, with JLL attributing more than 90% of losses to Class B in DC proper. About one quarter of that Class B negative absorption in the District is attributable to the GSA, suggesting that while government contraction is an important factor, it is far from the only one impacting this segment of the market.
In our own portfolio, we are seeing several strong indicators that our tenants are committed to in-person occupancy: (i) strong leasing with 1.1 million square feet of leases executed year-to-date, including 764,000 square feet of renewals; (ii) lease terms have predominately ranged between 5 and 7 years, with some deals in the 10- to 15-year range; and (iii) we have a number of leases executed where tenants not only renewed their lease, but expanded their footprints, including a lease signed with an existing government contractor that renewed its lease of approximately 25,000 square feet and simultaneously expanded by approximately 18,000 square feet for a 43,000 square foot total commitment. While leasing has rebounded, occupancy in our in-service commercial portfolio declined by 250 bps quarter-over-quarter due to known move-outs. Parking income remains below pre-pandemic levels although we are starting to see a steady increase in our daily physical occupancy levels, per Kastle Systems data. That same data shows that physical occupancy across the entire Washington, DC metro increased from just over 22% last quarter to 27.4% today, continuing to fare better than other gateway markets like New York and San Francisco at 21.9% and 19.3%, respectively.
Ultimately, these are all positive early indicators of some return to normalcy, but we remain cautious about the medium-term implications for office. Vacancy is still at record highs across the region and, as the physical occupancy data shows, most companies are still not back in the office. While most large private tenants have at least maintained their footprints, it’s unclear what impact hybrid work will have on space utilization and, ultimately, demand. Although some small companies who shed space during the pandemic may return to the office market, large companies may choose to contract or grow at a slower rate. This could lead to a slow climb out of the vacancy hole facing our market and further widen the pre-COVID-19 disparity between “have” and “have not” office markets and buildings. Ultimately, it will take more time to fully understand how the pandemic, and the changes it has brought, will impact the future of the office market.
5
Our multifamily portfolio performance continues to improve. Following a return to pre-pandemic occupancy levels in the first quarter, we saw a significant rebound in asking rents in the second quarter. Our in-service portfolio ended the quarter at 89.8% occupied, up over 140 basis points quarter-over-quarter, and 95.0% leased. Our new in-service multifamily assets (West Half, 901 W Street, and 900 W Street) ended the quarter at 74.2% occupied and 83.5% leased, versus 49.0% occupied and 61.3% leased in the prior quarter. Additionally, 8001 Woodmont (formerly known as 7900 Wisconsin Avenue) was moved into our Recently Delivered multifamily portfolio. After declining 15% from March 2020 to December 2020, our portfolio asking rents almost fully recovered and are now only 2% below pre-pandemic levels. We expect this recovery to continue into the fall as we are beginning to see a return to the urban environment by students and urban professionals in anticipation of return to campus and work post-Labor Day. Pandemic-driven concession packages continue to burn-off but vary submarket-to-submarket and, on average, remain elevated compared to pre-pandemic levels.
Like in our own portfolio, multifamily fundamentals improved in both DC and other gateway markets from 2Q 2020 to 2Q 2021. Metro-wide data from Apartment List shows that DC saw slightly higher rent growth of 2.0% than the 1.6%, on average, for New York, San Francisco, and Boston. DC saw a smaller increase in occupancy (2.3%) than those other markets did on average (3.5%) because occupancy levels during the pandemic did not dip as low in DC as they did in New York, San Francisco, and Boston, on average. At the end of 2Q 2021, Apartment List reported that DC and other gateway markets are hovering around 95% occupancy and are well-positioned for continued rent growth throughout the year as multifamily demand returns.
An increasingly positive outlook for multifamily demand and a re-start of projects put on hold during the pandemic has resulted in continued new construction starts through the second quarter according to data from CoStar and UrbanTurf. The same sources suggest that roughly 6,000 units have begun construction year-to-date through June in submarkets that we track. Almost three quarters of these units got underway in the first quarter, likely reflecting the pent-up demand for new construction starts from 2020 rather than a sustained period of new construction starts. While this is approximately double the level of starts we saw in the depth of the pandemic, we still estimate these starts, combined with projects already under construction, should result in deliveries of approximately 5,800 units per year on average from 2021 through 2023. This is far less than the more than 9,000 units that delivered, on average, every year from 2010 through 2019, and less than half of the peak we saw in 2014. Coupled with what seems like a renewed level of demand, we believe that the outlook for multifamily in our region remains favorable.
Retail Trends
With capacity restrictions lifted across our markets, and with life returning to normal, 95% of our current retail tenants are now open for business. Additionally, improved demand continues to boost retail sales volumes, with retailers who do provide sales data reporting sales volumes at approximately 80% of pre-pandemic levels on average. While the pandemic took its toll on certain operators, those that survived are back in full force and looking for opportunities to capitalize on ‘pent up’ demand. We have seen this in National Landing where, during the second quarter, we witnessed a continued resurgence in retail leasing activity with tour volume up almost 35% quarter-over-quarter.
We continue to make progress on our overall retail placemaking in National Landing. Our Crystal Drive retail repositioning, a project largely constructed and leased during the pandemic, is now 100% leased or committed with several tenants open for business. Additionally, in March, we received site plan approval for the redevelopment of the Water Park, an outdoor park where we intend to add several restaurant kiosks incubated by local small
6
businesses. Lastly, we continue to advance our Dining in the Park project – a unique, urban indoor/outdoor dining experience located immediately adjacent to the planned National Landing rail station and pedestrian bridge to Reagan National Airport. We view all these projects as important investments in our broader submarket repositioning strategy, serving as the foundation of anchor amenities from which future phases of placemaking development will emanate across the submarket. When combined with JBG SMITH’s and Amazon’s other planned retail deliveries in the submarket, the square footage of street-level retail in our National Landing portfolio will have approximately tripled.
Capital Allocation
Year-to-date, we have commenced marketing over $400 million of non-core assets. These primarily include non-core office assets outside of National Landing as well as select land assets where ground lease or joint venture execution may represent the clearest path to maximizing value. As we continue our price discovery, we believe that today’s expanded availability of debt capital, attractive financing costs, and depth of dry powder in private investment vehicles will ultimately drive robust pricing for our office asset sales. While we intend to pursue these recycling opportunities aggressively, we are fortunate that we have the balance sheet strength to be opportunistic, and only transact if and when we can source capital at attractive levels.
Additionally, to fulfill any like-kind exchange needs, such as the sale of the Pen Place land to Amazon, we continue to evaluate high-growth multifamily investment opportunities in target submarkets in which we are already concentrated and see strong rent growth potential.
While we anticipate the trade from office into multifamily will result in lower initial NOI and Adjusted EBITDA yields, after accounting for capital expenditures and leasing costs, we expect “economic” NOI and FAD yields to be neutral to positive. Over the medium to long term, as we transition into less capital intensive and higher growth multifamily, we expect both higher economic NOI and FAD as well as higher stabilized NOI and Adjusted EBITDA yields. As a point of comparison, our $1.6 billion of dispositions since our formation in 2017 would have generated a 3.5 - 4% average yield when factoring in go-forward estimates of capital needs, downtime, and carry costs on land. Even if we experience a correction in pricing, we feel confident that we will be able to replicate equivalent or higher long-term yields through a combination of acquiring and developing multifamily assets with greater durability and growth, as well as lower capital reinvestment needs. Additionally, as we trade out of land holdings that generate negative income, due to tax carry, we would expect to achieve immediate accretion upon trading into income producing multifamily acquisitions.
Environmental, Social, and Governance
In May, we released our environmental, social, and governance (ESG) report highlighting our accomplishments, key performance metrics, and our ESG management strategy. We believe that strong environmental sustainability, social responsibility, and corporate governance practices are essential to maximizing long-term NAV per share. We encourage you to access our annual sustainability report by visiting our website at https://www.jbgsmith.com/about/sustainability.
Additionally, in early July, we launched our inaugural Diversity & Inclusion (D&I) report, highlighting our comprehensive, multi-year D&I strategy, along with our accomplishments and milestones reached through year end 2020, a year marked by heightened racial tensions. We successfully formalized our commitment to diversity, equity, and inclusion and took pivotal steps toward building a more diverse and inclusive workplace – an issue of utmost importance to our employees, customers, investors, and the communities we serve. You can access this report by visiting our website at https://www.jbgsmith.com/about/diversity-inclusion.
7
And finally, in May, our Board of Trustees appointed Robert Stewart as Chairman of our Board. Mr. Stewart has a deep familiarity with JBG SMITH’s portfolio and operations, as well as extensive experience in all facets of commercial and residential real estate investment, development, and operations. He served as Executive Vice Chairman of our Board from the formation transaction through July 2020 and served as part of the leadership team of The JBG Companies after joining the firm in 1988. While Steven Roth stepped down from our Board, his 48 years of experience in commercial real estate, as well as his deep familiarity with the assets contributed by Vornado Realty Trust in connection with the formation of JBG SMITH, make him an invaluable resource. We look forward to Mr. Roth’s continued counsel as our Chairman Emeritus.
* * *
While we see rays of sunshine on the horizon, we are keeping our foul weather gear on for the moment. Vaccination rates, return-to-the-office plans and market fundamentals suggest that a strong recovery is under way, and we believe we are well-positioned to thrive as it unfolds. On the other hand, new variants, increasing cases and the re-imposition of certain safety protocols demand caution in our optimism and a continuation of careful and conservative planning in how we manage our way through the next phase of the pandemic. Whatever this next chapter has in store, we remain laser focused on capitalizing on the strong demand tailwinds of Amazon’s HQ2, the Virginia Tech Innovation Campus and the deployment of 5G and our Smart City plan in National Landing. The course we have charted withstood the last 18 months of this pandemic, and we are highly confident that it will position us to deliver strong NAV growth in the years ahead. Our team remains resilient, ready, focused and, as always, appreciative for your continued trust and confidence.
Thank you and stay healthy,
W. Matthew Kelly
Chief Executive Officer
8
Section Two – Earnings Release
FOR IMMEDIATE RELEASE |
|
| |
Earnings Release
CONTACT
Barbat Rodgers
Senior Vice President, Investor Relations
(240) 333-3805
brodgers@jbgsmith.com
JBG SMITH ANNOUNCES SECOND QUARTER 2021 RESULTS
Bethesda, MD (August 3, 2021) - JBG SMITH (NYSE: JBGS), a leading owner and developer of high-growth, mixed-use properties in the Washington, DC market, today filed its Form 10-Q for the quarter ended June 30, 2021 and reported its financial results.
Additional information regarding our results of operations, properties and tenants can be found in our Second Quarter 2021 Investor Package and Investor Presentation, which are posted in the Investor Relations section of our website at www.jbgsmith.com. We encourage investors to consider the information presented here with the information in those documents.
Second Quarter 2021 Highlights
● | For the three months ended June 30, 2021, net loss attributable to common shareholders of $0.03 per diluted share, Funds From Operations ("FFO") attributable to common shareholders of $0.29 per diluted share and Core Funds From Operations ("Core FFO") attributable to common shareholders of $0.34 per diluted share. |
| SECOND QUARTER COMPARISON | | |||||||||
| in millions, except per share amounts | | Three Months Ended | Three Months Ended | | ||||||
| | | June 30, 2021 | June 30, 2020 | | ||||||
| | | Amount | Per Diluted Share | Amount | Per Diluted Share | | ||||
| Net loss | | $ | (3.0) | $ | (0.03) | $ | (36.8) | $ | (0.28) | |
| FFO | | $ | 37.9 | $ | 0.29 | $ | 23.7 | $ | 0.18 | |
| Core FFO | | $ | 44.8 | $ | 0.34 | $ | 34.1 | $ | 0.26 | |
Note: All the above are attributable to common shareholders.
● | Annualized Net Operating Income ("NOI") for the three months ended June 30, 2021 was $330.7 million, compared to $322.2 million for the three months ended March 31, 2021, at our share. |
● | Same Store Net Operating Income ("SSNOI") at our share increased 0.4% year-over-year to $76.5 million for the three months ended June 30, 2021. |
2
o | The increase in SSNOI for the three months ended June 30, 2021 is largely attributable to lower reserves and rent deferrals, partially offset by lower occupancy in our commercial portfolio, and lower rents and higher concessions in our multifamily portfolio. |
● | SSNOI at our share decreased 4.6% year-over-year to $152.2 million for the six months ended June 30, 2021. |
o | We believe the decrease in SSNOI for the six months ended June 30, 2021 was substantially attributable to the COVID-19 pandemic, which commenced at the end of the first quarter of 2020, including (i) higher concessions, lower rents and higher operating costs in our multifamily portfolio and (ii) lower occupancy and a decline in parking revenue in our commercial portfolio. These declines were partially offset by the burn-off of rent abatement, a decrease in reserves and rent deferrals, and a decrease in cleaning expenses across our commercial portfolio. |
● | NOI for our operating portfolio increased 9.7% year-over-year to $83.0 million, and Adjusted EBITDA increased 21.8% year-over-year to $70.8 million for the three months ended June 30, 2021. |
o | We believe our financial results were negatively impacted by the COVID-19 pandemic and will continue to be in the short-term given the pandemic’s impact on certain income streams. |
◾ | We have entered into or are negotiating agreements with certain tenants, many of which have been placed on the cash basis of accounting, resulting in the reserve, deferral to future periods, or abatement of $2.5 million of rent that had been contractually due in the second quarter of 2021. Revenue related to these executed or pending rent deferrals is not included in our second quarter NOI, Adjusted EBITDA or Core FFO. With 95% of our retail tenants now open for business, we expect the need to enter into additional deferrals to decrease as we enter the fall, unless new restrictions are imposed. |
◾ | Although parking revenue remained relatively flat during the three months ended June 30, 2021 as compared to the same period in 2020, parking revenue in our commercial portfolio was approximately 50% of pre-pandemic levels of approximately $30 million annually. |
◾ | SSNOI for our multifamily portfolio remained depressed compared to Q2 2020. However, we continued to see an improvement in fundamentals, with the in-service portfolio increasing to 95.0% leased and asking rents almost fully recovered, ending the quarter only 2.0% below March 2020 rents. |
Operating Portfolio
● | The operating commercial portfolio was 85.9% leased and 84.4% occupied as of June 30, 2021, compared to 87.3% and 86.9% as of March 31, 2021, at our share. |
● | The operating multifamily portfolio was 91.6% leased and 86.3% occupied as of June 30, 2021, compared to 91.0% and 85.9% as of March 31, 2021, at our share. Our operating in-service multifamily portfolio was 95.0% leased and 89.8% occupied as of June 30, 2021, compared to 92.3% and 88.4% as of March 31, 2021, at our share. |
● | Executed approximately 715,000 square feet of office leases at our share during the three months ended June 30, 2021, comprising approximately 118,000 square feet of new leases and approximately 597,000 square feet of second-generation leases, which generated a 1.3% rental rate increase on a GAAP basis and a 2.1% rental rate increase on a cash basis. |
● | Executed approximately 1.1 million square feet of office leases at our share during the six months ended June 30, 2021, comprising approximately 142,000 square feet of new leases and approximately 917,000 square feet of second-generation leases, which generated a 3.8% rental rate increase on a GAAP basis and a 0.3% rental rate increase on a cash basis. |
3
Development Portfolio
Under-Construction
● | As of June 30, 2021, we had one multifamily asset under construction consisting of 808 units at our share. |
● | In the second quarter, 8001 Woodmont (formerly known as 7900 Wisconsin Avenue) was placed into the operating multifamily portfolio as recently delivered. |
Near-Term Development Pipeline
● | As of June 30, 2021, we had 11 near-term development pipeline assets consisting of 5.0 million square feet of estimated potential development density at our share. |
Future Development Pipeline
● | As of June 30, 2021, we had 26 future development pipeline assets consisting of 11.9 million square feet of estimated potential development density at our share, including the 2.1 million square feet held for sale to Amazon.com, Inc. ("Amazon"). |
Third-Party Asset Management and Real Estate Services Business
● | For the three months ended June 30, 2021, revenue from third-party real estate services, including reimbursements, was $26.7 million. Excluding reimbursements and service revenue from our interests in consolidated and unconsolidated real estate ventures, revenue from our third-party asset management and real estate services business was $14.1 million, primarily driven by $6.4 million of property and asset management fees, $4.4 million of development fees, $1.6 million of other service revenue and $1.4 million of leasing fees. |
Balance Sheet
● | As of June 30, 2021, our total enterprise value was approximately $6.7 billion, comprising 145.1 million common shares and units valued at $4.6 billion, and debt (net of premium / (discount) and deferred financing costs) at our share of $2.4 billion, less cash and cash equivalents at our share of $217.5 million. |
● | As of June 30, 2021, we had $201.2 million of cash and cash equivalents ($217.5 million of cash and cash equivalents at our share), and $998.5 million of capacity under our credit facility. |
● | Net debt to annualized Adjusted EBITDA at our share for the three months ended June 30, 2021 was 7.6x and our net debt / total enterprise value was 32.1% as of June 30, 2021. |
Investing and Financing Activities
● | As previously announced, in April, we entered into a real estate venture with an institutional investor advised by J.P. Morgan Global Alternatives to design, develop, manage and own approximately 2.0 million square feet of new mixed-use development (1.1 million square feet of office and 900,000 square feet of multifamily) located in Potomac Yard, the southern portion of National Landing. Our venture partner contributed a land site that is entitled for 1.3 million square feet of development it controlled at Potomac Yard Landbay F, while we contributed the adjacent land with over 700,000 square feet of estimated development capacity at Potomac Yard Landbay G. In addition to our 50.0% ownership in the venture, we will act as pre-developer, developer, property manager and leasing agent for all future commercial and residential properties on the site. As a result |
4
of this transaction, our at share ownership of development rights in Potomac Yard increased by over 285,000 square feet, increasing our economic ownership interest in this emerging-growth submarket to 79% of all unencumbered future development pipeline density. We recognized an $11.3 million gain on the land contributed to the real estate venture based on the cash received and the remeasurement of our retained interest in the asset. |
● | In May 2021, we recognized an aggregate gain of $5.2 million from the sale of various assets by our unconsolidated real estate ventures. |
Subsequent to June 30, 2021
● | In July 2021, we entered into a mortgage loan with a principal balance of $85.0 million, collateralized by 1225 S. Clark Street. The mortgage loan has a seven-year term and an interest rate of LIBOR plus 1.60% per annum. |
Dividends
● | On July 29, 2021, our Board of Trustees declared a quarterly dividend of $0.225 per common share, payable on August 27, 2021 to shareholders of record as of August 13, 2021. |
About JBG SMITH
JBG SMITH owns, operates, invests in and develops a dynamic portfolio of mixed-use properties in the high growth and high barrier-to-entry submarkets in and around Washington, DC. Through an intense focus on placemaking, JBG SMITH cultivates vibrant, amenity-rich, walkable neighborhoods throughout the Washington, DC metropolitan area. Over half of JBG SMITH’s holdings are in the National Landing submarket in Northern Virginia, where it serves as the exclusive developer for Amazon’s new headquarters, and where Virginia Tech’s planned new $1 billion Innovation Campus is located. JBG SMITH's portfolio currently comprises 17.2 million square feet of high-growth office, multifamily and retail assets at share, 98% of which are metro-served. It also maintains a development pipeline encompassing 17.0 million square feet of mixed-use development opportunities. For more information on JBG SMITH please visit www.jbgsmith.com.
Forward-Looking Statements
Certain statements contained herein may constitute "forward-looking statements" as such term is defined in Section 27A of the Securities Act of 1933, as amended, and Section 21E of the Securities Exchange Act of 1934, as amended. Forward-looking statements are not guarantees of performance. They represent our intentions, plans, expectations and beliefs and are subject to numerous assumptions, risks and uncertainties. Consequently, the future results of JBG SMITH Properties ("JBG SMITH", the "Company", "we", "us", "our" or similar terms) may differ materially from those expressed in these forward-looking statements. You can find many of these statements by looking for words such as "approximate", "hypothetical", "potential", "believes", "expects", "anticipates", "estimates", "intends", "plans", "would", "may" or similar expressions in this earnings release. One of the most significant factors that could cause actual outcomes to differ materially from our forward-looking statements is the adverse effect of the current pandemic of the novel coronavirus, or COVID-19, and the ensuing economic turmoil on the Company, our financial condition, results of operations, cash flows, performance, our tenants, the real estate market, and the global economy and financial markets. The extent to which COVID-19 continues to impact us and our tenants depends on future developments, many of which are highly uncertain and cannot be predicted with confidence.
5
These developments include: the continued severity, duration, transmission rate and geographic spread of COVID-19 in the United States, the speed of the vaccine distribution, the effectiveness and willingness of people to take COVID-19 vaccines, the duration of associated immunity and vaccine efficacy against variants of COVID-19, the extent and effectiveness of other containment measures taken, and the response of the overall economy, the financial markets and the population, particularly in areas in which we operate, once the current containment measures are lifted and whether the residential market in the Washington, DC area and any of our properties will be materially impacted by the various moratoriums on residential evictions, among others. Moreover, investors are cautioned to interpret many of the risks identified under the section titled "Risk Factors" in our Annual Report on Form 10-K for the fiscal year ended December 31, 2020 as being heightened as a result of the ongoing and numerous adverse impacts of the COVID-19 pandemic. We also note the following forward-looking statements: the impact of COVID-19 and the ensuing economic turmoil on our Company, NOI, SSNOI, net asset value, share price, occupancy rates, revenue from our multifamily and commercial portfolios, operating costs, deferrals of rent, uncollectable operating lease receivables, parking revenue, and burn-off of rent abatement; the impact of disruptions to the credit and capital markets on our ability to access capital, including refinancing maturing debt; changes to the amount and manner in which tenants use space; whether we incur additional costs or make additional concessions or offer other incentives to existing or prospective tenants to reconfigure space; whether the Washington, DC area will be more resilient than other parts of the country in any recession resulting from COVID-19; our annual dividend per share and dividend yield; annualized NOI; whether in the case of our under-construction and near-term development pipeline assets, estimated square feet, estimated number of units and in the case of our future development pipeline assets, estimated potential development density are accurate; expected key Amazon transaction terms and timeframes for closing any Amazon transactions not yet closed; planned infrastructure and educational improvements related to Amazon's additional headquarters and the Virginia Tech Innovation Campus; the economic impact, job growth, expansion of public transportation and related demand for multifamily and commercial properties of Amazon's additional headquarters on the DC area and National Landing and the speed with which such impact occurs and Amazon’s plans for accelerated hiring and in-person work requirements; the impact of our role as the exclusive developer, property manager and retail leasing agent in connection with Amazon's new headquarters; our development plans related to Amazon's additional headquarters; whether any of our tenants succeed in obtaining government assistance under the CARES Act and other programs and use any resulting proceeds to make lease payments owed to us; whether we can access agency debt secured by our currently unencumbered multifamily assets timely, on reasonable terms or at all; whether the delay in our planned 2020 discretionary operating asset capital expenditures had or will have any negative impact on our properties or our ability to generate revenue; and whether the allocation of capital to our share repurchase plan has any impact on our share price.
Many of the factors that will determine the outcome of these and our other forward-looking statements are beyond our ability to control or predict. These factors include, among others: adverse economic conditions in the Washington, DC metropolitan area, including in relation to COVID-19, the timing of and costs associated with development and property improvements, financing commitments, and general competitive factors. For further discussion of factors that could materially affect the outcome of our forward-looking statements and other risks and uncertainties, see "Risk Factors," "Management's Discussion and Analysis of Financial Condition and Results of Operations" and the Cautionary Statement Concerning Forward-Looking Statements in the Company's Annual Report on Form 10-K for the year ended December 31, 2020 and other periodic reports the Company files with the Securities and Exchange Commission. For these statements, we claim the protection of the safe harbor for forward-
6
looking statements contained in the Private Securities Litigation Reform Act of 1995. You are cautioned not to place undue reliance on our forward-looking statements. All subsequent written and oral forward-looking statements attributable to us or any person acting on our behalf are expressly qualified in their entirety by the cautionary statements contained or referred to in this section. We do not undertake any obligation to release publicly any revisions to our forward-looking statements to reflect events or circumstances occurring after the date hereof.
Pro Rata Information
We present certain financial information and metrics in this release "at JBG SMITH Share," which refers to our ownership percentage of consolidated and unconsolidated assets in real estate ventures (collectively, "real estate ventures") as applied to these financial measures and metrics. Financial information "at JBG SMITH Share" is calculated on an asset-by-asset basis by applying our percentage economic interest to each applicable line item of that asset's financial information. "At JBG SMITH Share" information, which we also refer to as being "at share," "our pro rata share" or "our share," is not, and is not intended to be, a presentation in accordance with GAAP. Given that a substantial portion of our assets are held through real estate ventures, we believe this form of presentation, which presents our economic interests in the partially owned entities, provides investors valuable information regarding a significant component of our portfolio, its composition, performance and capitalization.
We do not control the unconsolidated real estate ventures and do not have a legal claim to our co-venturers' share of assets, liabilities, revenue and expenses. The operating agreements of the unconsolidated real estate ventures generally allow each co-venturer to receive cash distributions to the extent there is available cash from operations. The amount of cash each investor receives is based upon specific provisions of each operating agreement and varies depending on certain factors including the amount of capital contributed by each investor and whether any investors are entitled to preferential distributions.
With respect to any such third-party arrangement, we would not be in a position to exercise sole decision-making authority regarding the property, real estate venture or other entity, and may, under certain circumstances, be exposed to economic risks not present were a third-party not involved. We and our respective co-venturers may each have the right to trigger a buy-sell or forced sale arrangement, which could cause us to sell our interest, or acquire our co-venturers' interests, or to sell the underlying asset, either on unfavorable terms or at a time when we otherwise would not have initiated such a transaction. Our real estate ventures may be subject to debt, and the repayment or refinancing of such debt may require equity capital calls. To the extent our co-venturers do not meet their obligations to us or our real estate ventures or they act inconsistent with the interests of the real estate venture, we may be adversely affected. Because of these limitations, the non-GAAP "at JBG SMITH Share" financial information should not be considered in isolation or as a substitute for our financial statements as reported under GAAP.
Non-GAAP Financial Measures
This release includes non-GAAP financial measures. For these measures, we have provided an explanation of how these non-GAAP measures are calculated and why JBG SMITH's management believes that the presentation of these measures provides useful information to investors regarding JBG SMITH's financial condition and results of operations. Reconciliations of certain non-GAAP measures to the most directly comparable GAAP financial measure are included in this earnings release. Our presentation of non-GAAP financial measures may not be
7
comparable to similar non-GAAP measures used by other companies. In addition to "at share" financial information, the following non-GAAP measures are included in this release:
Earnings Before Interest, Taxes, Depreciation and Amortization ("EBITDA"), EBITDA for Real Estate ("EBITDAre") and "Adjusted EBITDA" are non-GAAP financial measures. EBITDA and EBITDAre are used by management as supplemental operating performance measures, which we believe help investors and lenders meaningfully evaluate and compare our operating performance from period-to-period by removing from our operating results the impact of our capital structure (primarily interest charges from our outstanding debt and the impact of our interest rate swaps) and certain non-cash expenses (primarily depreciation and amortization on our assets). EBITDAre is computed in accordance with the definition established by the National Association of Real Estate Investment Trusts ("NAREIT"). NAREIT defines EBITDAre as GAAP net income (loss) adjusted to exclude interest expense, income taxes, depreciation and amortization expenses, gains and losses on sales of real estate and impairment write-downs of certain real estate assets and investments in entities when the impairment is directly attributable to decreases in the value of depreciable real estate held by the entity, including our share of such adjustments of unconsolidated real estate ventures. These supplemental measures may help investors and lenders understand our ability to incur and service debt and to make capital expenditures. EBITDA and EBITDAre are not substitutes for net income (loss) (computed in accordance with GAAP) and may not be comparable to similarly titled measures used by other companies.
Adjusted EBITDA represents EBITDAre adjusted for items we believe are not representative of ongoing operating results, such as Transaction and Other Costs, impairment write-downs of right-of-use assets associated with leases in which we are a lessee, gain (loss) on the extinguishment of debt, earnings (losses) and distributions in excess of our investment in unconsolidated real estate ventures, lease liability adjustments and share-based compensation expense related to the Formation Transaction and special equity awards. We believe that adjusting such items not considered part of our comparable operations, provides a meaningful measure to evaluate and compare our performance from period-to-period.
Because EBITDA, EBITDAre and Adjusted EBITDA have limitations as analytical tools, we use EBITDA, EBITDAre and Adjusted EBITDA to supplement GAAP financial measures. Additionally, we believe that users of these measures should consider EBITDA, EBITDAre and Adjusted EBITDA in conjunction with net income (loss) and other GAAP measures in understanding our operating results.
Funds from Operations ("FFO"), "Core FFO" and Funds Available for Distribution ("FAD") are non-GAAP financial measures. FFO is computed in accordance with the definition established by NAREIT in the NAREIT FFO White Paper - 2018 Restatement. NAREIT defines FFO as net income (loss) (computed in accordance with GAAP), excluding depreciation and amortization related to real estate, gains and losses from the sale of certain real estate assets, gains and losses from change in control and impairment write-downs of certain real estate assets and investments in entities when the impairment is directly attributable to decreases in the value of depreciable real estate held by the entity, including our share of such adjustments for unconsolidated real estate ventures.
Core FFO represents FFO adjusted to exclude items (net of tax) which we believe are not representative of ongoing operating results, such as Transaction and Other Costs, impairment write-downs of right-of-use assets associated with leases in which we are a lessee, gains (or losses) on extinguishment of debt, earnings (losses) and distributions in excess of our investment in unconsolidated real estate ventures, share-based compensation
8
expense related to the Formation Transaction and special equity awards, lease liability adjustments, amortization of the management contracts intangible and the mark-to-market of derivative instruments.
FAD represents Core FFO less recurring tenant improvements, leasing commissions and other capital expenditures, net deferred rent activity, third-party lease liability assumption payments, recurring share-based compensation expense, accretion of acquired below-market leases, net of amortization of acquired above-market leases, amortization of debt issuance costs and other non-cash income and charges. FAD is presented solely as a supplemental disclosure that management believes provides useful information as it relates to our ability to fund dividends.
We believe FFO, Core FFO and FAD are meaningful non-GAAP financial measures useful in comparing our levered operating performance from period-to-period and as compared to similar real estate companies because these non-GAAP measures exclude real estate depreciation and amortization expense and other non-comparable income and expenses, which implicitly assumes that the value of real estate diminishes predictably over time rather than fluctuating based on market conditions. FFO, Core FFO and FAD do not represent cash generated from operating activities and are not necessarily indicative of cash available to fund cash requirements and should not be considered as an alternative to net income (loss) (computed in accordance with GAAP) as a performance measure or cash flow as a liquidity measure. FFO, Core FFO and FAD may not be comparable to similarly titled measures used by other companies.
"Net Debt" is a non-GAAP financial measurement. Net Debt represents our total consolidated and unconsolidated indebtedness less cash and cash equivalents at our share. Net Debt is an important component in the calculations of Net Debt to Annualized Adjusted EBITDA and Net Debt / total enterprise value. We believe that Net Debt is a meaningful non-GAAP financial measure useful to investors because we review Net Debt as part of the management of our overall financial flexibility, capital structure and leverage. We may utilize a considerable portion of our cash and cash equivalents at any given time for purposes other than debt reduction. In addition, cash and cash equivalents at our share may not be solely controlled by us. The deduction of cash and cash equivalents at our share from consolidated and unconsolidated indebtedness in the calculation of Net Debt, therefore, should not be understood to mean that it is available exclusively for debt reduction at any given time.
Net Operating Income ("NOI") and "Annualized NOI" are non-GAAP financial measures management uses to assess a segment's performance. The most directly comparable GAAP measure is net income (loss) attributable to common shareholders. We use NOI internally as a performance measure and believe NOI provides useful information to investors regarding our financial condition and results of operations because it reflects only property related revenue (which includes base rent, tenant reimbursements and other operating revenue, net of Free Rent and payments associated with assumed lease liabilities) less operating expenses and ground rent, if applicable. NOI also excludes deferred rent, related party management fees, interest expense, and certain other non-cash adjustments, including the accretion of acquired below-market leases and the amortization of acquired above-market leases and below-market ground lease intangibles. Management uses NOI as a supplemental performance measure of our assets and believes it provides useful information to investors because it reflects only those revenue and expense items that are incurred at the asset level, excluding non-cash items. In addition, NOI is considered by many in the real estate industry to be a useful starting point for determining the value of a real estate asset or group of assets. However, because NOI excludes depreciation and amortization and captures neither the changes in the value of our assets that result from use or market conditions, nor the level of capital expenditures and capitalized
9
leasing commissions necessary to maintain the operating performance of our assets, all of which have real economic effect and could materially impact the financial performance of our assets, the utility of NOI as a measure of the operating performance of our assets is limited. NOI presented by us may not be comparable to NOI reported by other REITs that define these measures differently. We believe to facilitate a clear understanding of our operating results, NOI should be examined in conjunction with net income (loss) attributable to common shareholders as presented in our financial statements. NOI should not be considered as an alternative to net income (loss) attributable to common shareholders as an indication of our performance or to cash flows as a measure of liquidity or our ability to make distributions. Annualized NOI, for all assets except Crystal City Marriott, represents NOI for the three months ended June 30, 2021 multiplied by four. Due to seasonality in the hospitality business, Annualized NOI for Crystal City Marriott represents the trailing 12-month NOI as of June 30, 2021. Management believes Annualized NOI provides useful information in understanding our financial performance over a 12-month period, however, investors and other users are cautioned against attributing undue certainty to our calculation of Annualized NOI. Actual NOI for any 12-month period will depend on a number of factors beyond our ability to control or predict, including general capital markets and economic conditions, any bankruptcy, insolvency, default or other failure to pay rent by one or more of our tenants and the destruction of one or more of our assets due to terrorist attack, natural disaster or other casualty, among others. We do not undertake any obligation to update our calculation to reflect events or circumstances occurring after the date of this earnings release. There can be no assurance that the Annualized NOI shown will reflect our actual results of operations over any 12-month period.
"Non-Same Store" refers to all operating assets excluded from the same store pool.
"Same Store" refers to the pool of assets that were in-service for the entirety of both periods being compared, which excludes assets for which significant redevelopment, renovation, or repositioning occurred during either of the periods being compared.
Definitions
"GAAP" refers to accounting principles generally accepted in the United States of America.
"In-Service" refers to commercial or multifamily assets that are at or above 90% leased or have been operating and collecting rent for more than 12 months as of June 30, 2021.
"Formation Transaction" refers collectively to the spin-off on July 17, 2017 of substantially all of the assets and liabilities of Vornado Realty Trust's Washington, DC segment, which operated as Vornado / Charles E. Smith, and the acquisition of the management business and certain assets and liabilities of The JBG Companies.
10
CONDENSED CONSOLIDATED BALANCE SHEETS
(Unaudited)
| in thousands | | June 30, 2021 | | December 31, 2020 |
| ||
| | | | | | | |
|
| ASSETS | | | | | | |
|
| Real estate, at cost: |
| |
|
| |
| |
| Land and improvements | | $ | 1,357,904 | | $ | 1,391,472 | |
| Buildings and improvements | |
| 4,355,187 | |
| 4,341,103 | |
| Construction in progress, including land | |
| 273,542 | |
| 268,056 | |
| | |
| 5,986,633 | |
| 6,000,631 | |
| Less accumulated depreciation | |
| (1,297,406) | |
| (1,232,690) | |
| Real estate, net | |
| 4,689,227 | |
| 4,767,941 | |
| Cash and cash equivalents | |
| 201,150 | |
| 225,600 | |
| Restricted cash | |
| 37,543 | |
| 37,736 | |
| Tenant and other receivables | |
| 43,724 | |
| 55,903 | |
| Deferred rent receivable | |
| 182,565 | |
| 170,547 | |
| Investments in unconsolidated real estate ventures | |
| 497,770 | |
| 461,369 | |
| Other assets, net | |
| 282,356 | |
| 286,575 | |
| Assets held for sale | |
| 73,876 | |
| 73,876 | |
| TOTAL ASSETS | | $ | 6,008,211 | | $ | 6,079,547 | |
| | | | | | | | |
| LIABILITIES, REDEEMABLE NONCONTROLLING INTERESTS AND EQUITY | |
|
| |
|
| |
| Liabilities: | |
|
| |
|
| |
| Mortgages payable, net | | $ | 1,591,143 | | $ | 1,593,738 | |
| Revolving credit facility | |
| — | |
| — | |
| Unsecured term loans, net | |
| 398,322 | |
| 397,979 | |
| Accounts payable and accrued expenses | |
| 99,310 | |
| 103,102 | |
| Other liabilities, net | |
| 201,556 | |
| 247,774 | |
| Total liabilities | |
| 2,290,331 | |
| 2,342,593 | |
| Commitments and contingencies | |
|
| |
|
| |
| Redeemable noncontrolling interests | |
| 544,639 | |
| 530,748 | |
| Total equity | |
| 3,173,241 | |
| 3,206,206 | |
| TOTAL LIABILITIES, REDEEMABLE NONCONTROLLING INTERESTS AND EQUITY | | $ | 6,008,211 | | $ | 6,079,547 | |
Note: For complete financial statements, please refer to our Quarterly Report on Form 10-Q for the quarter ended June 30, 2021.
11
CONDENSED CONSOLIDATED STATEMENTS OF OPERATIONS
(Unaudited)
in thousands, except per share data | | Three Months Ended June 30, | | Six Months Ended June 30, | ||||||||
| | 2021 | | 2020 | | 2021 | | 2020 | ||||
REVENUE | | | | | | | | | | | | |
Property rental |
| $ | 122,819 |
| $ | 115,459 | | $ | 245,060 |
| $ | 235,839 |
Third-party real estate services, including reimbursements | |
| 26,745 | |
| 27,167 | |
| 64,852 | |
| 56,883 |
Other revenue | |
| 5,080 | |
| 2,326 | |
| 10,021 | |
| 10,337 |
Total revenue | |
| 154,644 | |
| 144,952 | |
| 319,933 | |
| 303,059 |
EXPENSES | |
|
| |
|
| |
|
| |
|
|
Depreciation and amortization | |
| 56,678 | |
| 52,616 | |
| 121,404 | |
| 101,105 |
Property operating | |
| 35,000 | |
| 33,792 | |
| 69,731 | |
| 68,295 |
Real estate taxes | |
| 18,558 | |
| 17,869 | |
| 36,868 | |
| 36,068 |
General and administrative: | |
|
| |
|
| |
| | |
|
|
Corporate and other | |
| 13,895 | |
| 13,216 | |
| 26,370 | |
| 26,392 |
Third-party real estate services | |
| 25,557 | |
| 29,239 | |
| 54,493 | |
| 58,053 |
Share-based compensation related to Formation Transaction and special equity awards | |
| 4,441 | |
| 8,858 | |
| 9,386 | |
| 18,299 |
Transaction and Other Costs | |
| 2,270 | |
| 1,372 | |
| 5,960 | |
| 6,681 |
Total expenses | |
| 156,399 | |
| 156,962 | |
| 324,212 | |
| 314,893 |
OTHER INCOME (EXPENSE) | |
|
| |
|
| |
|
| |
|
|
Income (loss) from unconsolidated real estate ventures, net | |
| 3,953 | |
| (13,485) | |
| 3,010 | |
| (16,177) |
Interest and other income (loss), net | |
| (38) | |
| 114 | |
| (29) | |
| 1,021 |
Interest expense | |
| (16,773) | |
| (15,770) | |
| (33,069) | |
| (27,775) |
Gain on sale of real estate | |
| 11,290 | |
| — | |
| 11,290 | |
| 59,477 |
Loss on extinguishment of debt | |
| — | |
| — | |
| — | |
| (33) |
Total other income (expense) | |
| (1,568) | |
| (29,141) | |
| (18,798) | |
| 16,513 |
INCOME (LOSS) BEFORE INCOME TAX (EXPENSE) BENEFIT | |
| (3,323) | |
| (41,151) | |
| (23,077) | |
| 4,679 |
Income tax (expense) benefit | |
| 5 | |
| 888 | |
| (4,310) | |
| 3,233 |
NET INCOME (LOSS) | |
| (3,318) | |
| (40,263) | |
| (27,387) | |
| 7,912 |
Net (income) loss attributable to redeemable noncontrolling interests | |
| 345 | |
| 3,483 | |
| 2,575 | |
| (1,767) |
Net loss attributable to noncontrolling interests | | | — | |
| — | | | 1,108 | | | — |
NET INCOME (LOSS) ATTRIBUTABLE TO COMMON SHAREHOLDERS | | $ | (2,973) | | $ | (36,780) | | $ | (23,704) | | $ | 6,145 |
EARNINGS (LOSS) PER COMMON SHARE - BASIC AND DILUTED | | $ | (0.03) | | $ | (0.28) | | $ | (0.19) | | $ | 0.04 |
WEIGHTED AVERAGE NUMBER OF COMMON SHARES OUTSTANDING - BASIC AND DILUTED | |
| 131,480 | |
| 133,613 | |
| 131,510 | |
| 134,078 |
Note: For complete financial statements, please refer to our Quarterly Report on Form 10-Q for the quarter ended June 30, 2021.
12
EBITDA, EBITDAre AND ADJUSTED EBITDA (NON-GAAP)
(Unaudited)
| dollars in thousands |
| Three Months Ended June 30, | | Six Months Ended June 30, |
| ||||||||
| | | 2021 | | 2020 | | 2021 | | 2020 |
| ||||
| | | | | | | | | | | | | |
|
| EBITDA, EBITDAre and Adjusted EBITDA |
| | | | | | | |
| | |
| |
| Net income (loss) | | $ | (3,318) | | $ | (40,263) | | $ | (27,387) | | $ | 7,912 | |
| Depreciation and amortization expense | | | 56,678 | | | 52,616 | | | 121,404 | | | 101,105 | |
| Interest expense (1) | | | 16,773 | | | 15,770 | | | 33,069 | | | 27,775 | |
| Income tax expense (benefit) | | | (5) | | | (888) | | | 4,310 | | | (3,233) | |
| Unconsolidated real estate ventures allocated share of above adjustments | | | 10,581 | | | 10,692 | | | 20,745 | | | 21,529 | |
| EBITDA attributable to noncontrolling interests | | | (41) | | | (6) | | | 1,030 | | | (3) | |
| EBITDA | | $ | 80,668 | | $ | 37,921 | | $ | 153,171 | | $ | 155,085 | |
| Gain on sale of real estate | | | (11,290) | | | — | | | (11,290) | | | (59,477) | |
| (Gain) loss on sale of unconsolidated real estate assets | | | (5,189) | | | 2,952 | | | (5,189) | | | 2,952 | |
| Impairment of investment in unconsolidated real estate venture (2) | | | — | | | 6,522 | | | — | | | 6,522 | |
| | | | | | | | | | | | | | |
| EBITDAre | | $ | 64,189 | | $ | 47,395 | | $ | 136,692 | | $ | 105,082 | |
| Transaction and Other Costs (3) | | | 2,270 | | | 1,372 | | | 4,852 | | | 6,681 | |
| Loss on extinguishment of debt | | | — | | | — | | | — | | | 33 | |
| Share-based compensation related to Formation Transaction and special equity awards | | | 4,441 | | | 8,858 | | | 9,386 | | | 18,299 | |
| Earnings (losses) and distributions in excess of our investment in unconsolidated real estate venture | | | (92) | | | (245) | | | (422) | | | 129 | |
| Unconsolidated real estate ventures allocated share of above adjustments | | | 9 | | | 747 | | | 40 | | | 1,465 | |
| | | | | | | | | | | | | | |
| Adjusted EBITDA | | $ | 70,817 | | $ | 58,127 | | $ | 150,548 | | $ | 131,689 | |
| | | | | | | | | | | | | | |
| Net Debt to Annualized Adjusted EBITDA (4) | | | 7.6 | x | | 8.1 | x | | 7.2 | x | | 7.2 | x |
| | | | | | | | | | | | | | |
| | | | | | | | | June 30, 2021 | | June 30, 2020 | | ||
| Net Debt (at JBG SMITH Share) | | | | | | | | |
| | |
| |
| Consolidated indebtedness (5) | | | | | | | | $ | 1,979,494 | | $ | 2,202,667 | |
| Unconsolidated indebtedness (5) | | | | | | | | | 399,262 | | | 411,599 | |
| Total consolidated and unconsolidated indebtedness | | | | | | | | | 2,378,756 | | | 2,614,266 | |
| Less: cash and cash equivalents | | | | | | | | | 217,543 | | | 724,246 | |
| Net Debt (at JBG SMITH Share) | | | | | | | | $ | 2,161,213 | | $ | 1,890,020 | |
Note: All EBITDA measures as shown above are attributable to common limited partnership units ("OP Units").
(1) | Interest expense includes the amortization of deferred financing costs and the ineffective portion of any interest rate swaps or caps, net of capitalized interest. |
(2) | During the second quarter of 2020, we determined that our investment in the venture that owned The Marriott Wardman Park hotel was impaired due to a decline in the fair value of the underlying asset and recorded an impairment loss of $6.5 million, which reduced the net book value of our investment to zero, and we suspended equity loss recognition for the venture after June 30, 2020. On October 1, 2020, we transferred our interest in this venture to our former venture partner. |
(3) | Includes demolition costs, integration and severance costs, pursuit costs related to other completed, potential and pursued transactions, as well as other expenses. For the six months ended June 30, 2021, excludes $1.1 million of transaction costs attributable to noncontrolling interests. For the six months ended June 30, 2020, includes a charitable commitment of $4.0 million to the Washington Housing Conservancy, a non-profit that acquires and owns affordable workforce housing in the Washington, DC metropolitan area. |
(4) | Calculated using the Net Debt below. Quarterly Adjusted EBITDA is annualized by multiplying by four. Adjusted EBITDA for the six months ended June 30, 2021 and 2020 is annualized by multiplying by two. |
(5) | Net of premium/discount and deferred financing costs. |
13
FFO, CORE FFO AND FAD (NON-GAAP)
(Unaudited)
| in thousands, except per share data | | Three Months Ended June 30, | | Six Months Ended June 30, |
| ||||||||
| |
| 2021 |
| 2020 | | 2021 |
| 2020 | | ||||
| | | | | | | | | | | | | | |
| FFO and Core FFO | | | | | | | | | | | | | |
| Net income (loss) attributable to common shareholders | | $ | (2,973) |
| $ | (36,780) | | $ | (23,704) |
| $ | 6,145 | |
| Net income (loss) attributable to redeemable noncontrolling interests | |
| (345) |
| | (3,483) | |
| (2,575) |
| | 1,767 | |
| Net loss attributable to noncontrolling interests | |
| — |
| | — | |
| (1,108) |
| | — | |
| Net income (loss) | |
| (3,318) |
| | (40,263) | |
| (27,387) |
| | 7,912 | |
| Gain on sale of real estate | |
| (11,290) |
| | — | |
| (11,290) |
| | (59,477) | |
| (Gain) loss on sale from unconsolidated real estate ventures | |
| (5,189) |
| | 2,952 | |
| (5,189) |
| | 2,952 | |
| Real estate depreciation and amortization | |
| 54,475 |
| | 49,924 | |
| 116,975 |
| | 95,586 | |
| Impairment of investment in unconsolidated real estate venture (1) | | | — | | | 6,522 | | | — | | | 6,522 | |
| Pro rata share of real estate depreciation and amortization from unconsolidated real estate ventures | |
| 7,277 |
| | 7,498 | |
| 14,588 |
| | 14,380 | |
| FFO attributable to noncontrolling interests | |
| (41) |
| | (6) | |
| 1,030 |
| | (3) | |
| FFO Attributable to OP Units | | $ | 41,914 |
| $ | 26,627 | | $ | 88,727 |
| $ | 67,872 | |
| FFO attributable to redeemable noncontrolling interests | |
| (4,054) |
| | (2,911) | |
| (8,539) |
| | (7,408) | |
| FFO attributable to common shareholders | | $ | 37,860 |
| $ | 23,716 | | $ | 80,188 |
| $ | 60,464 | |
| | | | | | | | | | | | | | |
| FFO attributable to OP Units | | $ | 41,914 |
| $ | 26,627 | | $ | 88,727 |
| $ | 67,872 | |
| Transaction and Other Costs, net of tax (2) | |
| 2,241 |
| | 1,212 | |
| 4,793 |
| | 6,378 | |
| (Gain) loss from mark-to-market on derivative instruments | |
| 46 |
| | 17 | |
| (87) |
| | (30) | |
| Loss on extinguishment of debt | |
| — |
| | — | |
| — |
| | 33 | |
| Earnings (losses) and distributions in excess of our investment in unconsolidated real estate venture | |
| (92) |
| | (245) | |
| (422) |
| | 129 | |
| Share-based compensation related to Formation Transaction and special equity awards | |
| 4,441 |
| | 8,858 | |
| 9,386 |
| | 18,299 | |
| Amortization of management contracts intangible, net of tax | |
| 1,073 |
| | 1,073 | |
| 2,145 |
| | 2,216 | |
| Unconsolidated real estate ventures allocated share of above adjustments | |
| 6 |
| | 727 | |
| (4) |
| | 1,903 | |
| Core FFO Attributable to OP Units | | $ | 49,629 |
| $ | 38,269 | | $ | 104,538 |
| $ | 96,800 | |
| Core FFO attributable to redeemable noncontrolling interests | |
| (4,800) |
| | (4,184) | |
| (10,060) |
| | (10,566) | |
| Core FFO attributable to common shareholders | | $ | 44,829 |
| $ | 34,085 | | $ | 94,478 |
| $ | 86,234 | |
| FFO per common share - diluted | | $ | 0.29 |
| $ | 0.18 | | $ | 0.61 |
| $ | 0.45 | |
| Core FFO per common share - diluted | | $ | 0.34 |
| $ | 0.26 | | $ | 0.72 |
| $ | 0.64 | |
| Weighted average shares - diluted (FFO and Core FFO) | |
| 131,485 |
| | 133,613 | |
| 131,513 |
| | 134,078 | |
See footnotes on page 14.
14
FFO, CORE FFO AND FAD (NON-GAAP)
(Unaudited)
| in thousands, except per share data | | Three Months Ended June 30, | | Six Months Ended June 30, |
| ||||||||
| |
| 2021 |
| 2020 | | 2021 |
| 2020 | | ||||
| | | | | | | | | | | | | | |
| FAD | | | | | | | | | | | | | |
| Core FFO attributable to OP Units |
| $ | 49,629 |
| $ | 38,269 | | $ | 104,538 |
| $ | 96,800 | |
| Recurring capital expenditures and second-generation tenant improvements and leasing commissions (3) | |
| (12,226) | |
| (12,889) | |
| (22,657) | |
| (22,694) | |
| Straight-line and other rent adjustments (4) | |
| (4,088) | |
| (1,418) | |
| (8,853) | |
| (4,963) | |
| Third-party lease liability assumption payments | |
| (703) | |
| (780) | |
| (1,381) | |
| (2,240) | |
| Share-based compensation expense | |
| 9,045 | |
| 11,757 | |
| 17,115 | |
| 19,487 | |
| Amortization of debt issuance costs | |
| 1,096 | |
| 673 | |
| 2,201 | |
| 1,295 | |
| Unconsolidated real estate ventures allocated share of above adjustments | |
| (1,333) | |
| (695) | |
| (2,659) | |
| (2,193) | |
| Non-real estate depreciation and amortization | |
| 727 | |
| 1,215 | |
| 1,477 | |
| 2,469 | |
| FAD available to OP Units (A) | | $ | 42,147 | | $ | 36,132 | | $ | 89,781 | | $ | 87,961 | |
| Distributions to common shareholders and unitholders (B) | | $ | 33,511 | | $ | 33,970 | | $ | 68,946 | | $ | 67,981 | |
| FAD Payout Ratio (B÷A) (5) | |
| 79.5 | % |
| 94.0 | % |
| 76.8 | % |
| 77.3 | % |
| | | | | | | | | | | | | | |
| Capital Expenditures | | | | | | | | | | | | | |
| Maintenance and recurring capital expenditures | | $ | 4,376 | | $ | 6,541 | | $ | 8,302 | | $ | 9,099 | |
| Share of maintenance and recurring capital expenditures from unconsolidated real estate ventures | |
| 324 | |
| 360 | |
| 371 | |
| 509 | |
| Second-generation tenant improvements and leasing commissions | |
| 7,454 | |
| 5,613 | |
| 13,518 | |
| 12,556 | |
| Share of second-generation tenant improvements and leasing commissions from unconsolidated real estate ventures | |
| 72 | |
| 375 | |
| 466 | |
| 530 | |
| Recurring capital expenditures and second-generation tenant improvements and leasing commissions | |
| 12,226 | |
| 12,889 | |
| 22,657 | |
| 22,694 | |
| Non-recurring capital expenditures | |
| 4,352 | |
| 6,240 | |
| 7,188 | |
| 12,427 | |
| Share of non-recurring capital expenditures from unconsolidated real estate ventures | |
| 56 | |
| 238 | |
| 107 | |
| 340 | |
| First-generation tenant improvements and leasing commissions | |
| 1,703 | |
| 11,853 | |
| 2,538 | |
| 23,700 | |
| Share of first-generation tenant improvements and leasing commissions from unconsolidated real estate ventures | |
| 199 | |
| 217 | |
| 1,391 | |
| 987 | |
| Non-recurring capital expenditures | |
| 6,310 | |
| 18,548 | |
| 11,224 | |
| 37,454 | |
| Total JBG SMITH Share of Capital Expenditures | | $ | 18,536 | | $ | 31,437 | | $ | 33,881 | | $ | 60,148 | |
(1) | During the second quarter of 2020, we determined that our investment in the venture that owned The Marriott Wardman Park hotel was impaired due to a decline in the fair value of the underlying asset and recorded an impairment loss of $6.5 million, which reduced the net book value of our investment to zero, and we suspended equity loss recognition for the venture after June 30, 2020. On October 1, 2020, we transferred our interest in this venture to our former venture partner. |
(2) | Includes demolition costs, integration and severance costs, pursuit costs related to other completed, potential and pursued transactions, as well as other expenses. For the six months ended June 30, 2021, excludes $1.1 million of transaction costs attributable to noncontrolling interests. For the six months ended June 30, 2020, includes a charitable commitment of $4.0 million to the Washington Housing Conservancy, a non-profit that acquires and owns affordable workforce housing in the Washington, DC metropolitan area. |
(3) | Includes amounts, at JBG SMITH Share, related to unconsolidated real estate ventures. |
(4) | Includes straight-line rent, above/below market lease amortization and lease incentive amortization. |
(5) | The quarterly FAD payout ratio is not necessarily indicative of an amount for the full year due to fluctuation in timing of capital expenditures, the commencement of new leases and the seasonality of our operations. |
15
NOI RECONCILIATIONS (NON-GAAP)
(Unaudited)
| dollars in thousands | | Three Months Ended June 30, | | Six Months Ended June 30, |
| ||||||||
| | | 2021 | | 2020 | | 2021 | | 2020 | | ||||
| | | | | | | | | | | | | | |
| Net income (loss) attributable to common shareholders |
| $ | (2,973) |
| $ | (36,780) | | $ | (23,704) |
| $ | 6,145 | |
| Add: | |
|
| |
|
| |
|
| |
|
| |
| Depreciation and amortization expense | |
| 56,678 | |
| 52,616 | |
| 121,404 | |
| 101,105 | |
| General and administrative expense: | |
|
| |
|
| |
|
| |
|
| |
| Corporate and other | |
| 13,895 | |
| 13,216 | |
| 26,370 | |
| 26,392 | |
| Third-party real estate services | |
| 25,557 | |
| 29,239 | |
| 54,493 | |
| 58,053 | |
| Share-based compensation related to Formation Transaction and special equity awards | |
| 4,441 | |
| 8,858 | |
| 9,386 | |
| 18,299 | |
| Transaction and Other Costs | |
| 2,270 | |
| 1,372 | |
| 5,960 | |
| 6,681 | |
| Interest expense | |
| 16,773 | |
| 15,770 | |
| 33,069 | |
| 27,775 | |
| Loss on extinguishment of debt | |
| — | |
| — | |
| — | |
| 33 | |
| Income tax expense (benefit) | |
| (5) | |
| (888) | |
| 4,310 | |
| (3,233) | |
| Net income (loss) attributable to redeemable noncontrolling interests | |
| (345) | |
| (3,483) | |
| (2,575) | |
| 1,767 | |
| Net loss attributable to noncontrolling interests | | | — | |
| — | | | (1,108) | | | — | |
| Less: | |
|
| |
|
| |
|
| |
|
| |
| Third-party real estate services, including reimbursements revenue | |
| 26,745 | |
| 27,167 | |
| 64,852 | |
| 56,883 | |
| Other revenue | |
| 1,904 | |
| 1,516 | |
| 4,090 | |
| 3,146 | |
| Income (loss) from unconsolidated real estate ventures, net | |
| 3,953 | |
| (13,485) | |
| 3,010 | |
| (16,177) | |
| Interest and other income (loss), net | |
| (38) | |
| 114 | |
| (29) | |
| 1,021 | |
| Gain on sale of real estate | |
| 11,290 | |
| — | |
| 11,290 | |
| 59,477 | |
| | | | | | | | | | | | | | |
| Consolidated NOI | |
| 72,437 | |
| 64,608 | |
| 144,392 | |
| 138,667 | |
| NOI attributable to unconsolidated real estate ventures at our share | |
| 8,109 | |
| 7,495 | |
| 15,613 | |
| 16,073 | |
| Non-cash rent adjustments (1) | |
| (4,088) | |
| (1,419) | |
| (8,853) | |
| (4,964) | |
| Other adjustments (2) | |
| 5,191 | |
| 3,516 | |
| 9,933 | |
| 6,330 | |
| Total adjustments | |
| 9,212 | |
| 9,592 | |
| 16,693 | |
| 17,439 | |
| NOI | | $ | 81,649 | | $ | 74,200 | | $ | 161,085 | | $ | 156,106 | |
| Less: out-of-service NOI loss (3) | |
| (1,329) | |
| (1,475) | |
| (2,619) | |
| (2,857) | |
| Operating Portfolio NOI | | $ | 82,978 | | $ | 75,675 | | $ | 163,704 | | $ | 158,963 | |
| Non-Same Store NOI (4) | |
| 6,527 | |
| (440) | |
| 11,490 | |
| (567) | |
| Same Store NOI (5) | | $ | 76,451 | | $ | 76,115 | | $ | 152,214 | | $ | 159,530 | |
| | | | | | | | | | | | | | |
| Change in Same Store NOI | | | 0.4 | % | | | |
| (4.6) | % |
| | |
| Number of properties in Same Store pool | | | 56 | | | | |
| 56 | |
|
| |
(1) | Adjustment to exclude straight-line rent, above/below market lease amortization and lease incentive amortization. |
(2) | Adjustment to include other revenue and payments associated with assumed lease liabilities related to operating properties and to exclude commercial lease termination revenue and allocated corporate general and administrative expenses to operating properties. |
(3) | Includes the results of our Under-Construction assets, and Near-Term and Future Development Pipelines. |
(4) | Includes the results of properties that were not In-Service for the entirety of both periods being compared and properties for which significant redevelopment, renovation or repositioning occurred during either of the periods being compared. |
(5) | Includes the results of the properties that are owned, operated and In-Service for the entirety of both periods being compared. |
16
TABLE OF CONTENTS | JUNE 30, 2021 |
Table of Contents
| Page |
Overview | |
3-5 | |
6 | |
7 | |
8-9 | |
10 | |
Financial Information | |
11 | |
12 | |
Unconsolidated Real Estate Ventures - Balance Sheet and Operating Information | 13 |
14 | |
15 | |
16-17 | |
Third-Party Asset Management and Real Estate Services Business (Non-GAAP) | 18 |
Pro Rata Adjusted General and Administrative Expenses (Non-GAAP) | 19 |
20 | |
21-22 | |
23 | |
24 | |
25 | |
26 | |
Leasing Activity | |
27 | |
28 | |
29 | |
30 | |
31 | |
32 | |
Property Data | |
33 | |
Property Tables: | |
34-36 | |
37-39 | |
40 | |
41 | |
42 | |
43 | |
Debt | |
44 | |
45-46 | |
Real Estate Ventures | |
47 | |
48-49 | |
50-53 | |
Appendices – Transaction and Other Costs, and Reconciliations of Non-GAAP Financial Measures | 54-58 |
| Page 2 |
Disclosures
Certain statements contained herein may constitute "forward-looking statements" as such term is defined in Section 27A of the Securities Act of 1933, as amended, and Section 21E of the Securities Exchange Act of 1934, as amended. Forward-looking statements are not guarantees of performance. They represent our intentions, plans, expectations and beliefs and are subject to numerous assumptions, risks and uncertainties. Consequently, the future results of JBG SMITH Properties ("JBG SMITH", the "Company", "we", "us", "our" or similar terms) may differ materially from those expressed in these forward-looking statements. You can find many of these statements by looking for words such as "approximate", "hypothetical", "potential", "believes", "expects", "anticipates", "estimates", "intends", "plans", "would", "may" or similar expressions in this Investor Package. One of the most significant factors that could cause actual outcomes to differ materially from our forward-looking statements is the adverse effect of the current pandemic of the novel coronavirus, or COVID-19, and the ensuing economic turmoil on the Company, our financial condition, results of operations, cash flows, performance, our tenants, the real estate market, and the global economy and financial markets. The extent to which COVID-19 continues to impact us and our tenants depends on future developments, many of which are highly uncertain and cannot be predicted with confidence. These developments include: the continued severity, duration, transmission rate and geographic spread of COVID-19 in the United States, the speed of the vaccine distribution, the effectiveness and willingness of people to take COVID-19 vaccines, the duration of associated immunity and vaccine efficacy against variants of COVID-19, the extent and effectiveness of other containment measures taken, and the response of the overall economy, the financial markets and the population, particularly in areas in which we operate, once the current containment measures are lifted and whether the residential market in the Washington, DC area and any of our properties will be materially impacted by the various moratoriums on residential evictions, among others. Moreover, investors are cautioned to interpret many of the risks identified under the section titled "Risk Factors" in our Annual Report on Form 10-K for the fiscal year ended December 31, 2020 as being heightened as a result of the ongoing and numerous adverse impacts of the COVID-19 pandemic. We also note the following forward-looking statements: the impact of COVID-19 and the ensuing economic turmoil on our Company, Net Operating Income, Same Store Net Operating Income, net asset value, share price, liquidity, occupancy rates, property rental revenue, operating costs, deferrals of rent, uncollectable operating lease receivables, parking revenue, burn-off of rent abatement, construction costs, the timing of disposition of assets in the JBG Legacy Funds, demand for new office space and potential bias of multifamily leasing to renewals; the impact of disruptions to the credit and capital markets on our ability to access capital, including refinancing maturing debt; potential Net Operating Income growth and the assumptions on which such growth is premised, our estimated future leverage (Net Debt/Adjusted EBITDA and Net Debt/Total Enterprise Value) profile, the economic impact, job growth, expansion of public transportation and related demand for multifamily and commercial properties of Amazon.com, Inc.’s ("Amazon") additional headquarters on the Washington, DC metropolitan area and National Landing and the speed with which such impact occurs and Amazon’s plans for accelerated hiring and in-person work requirements; changes to the amount and manner in which tenants use space; whether we incur additional costs or make additional concessions or offer other incentives to existing or prospective tenants to reconfigure space; long-term trends in demand for housing (including multifamily) within major urban employment centers; whether the Washington, DC area will be more resilient than other parts of the country in any recession resulting from COVID-19; potential countercyclical growth caused by the concentration in the Washington, DC area of Amazon, the federal government, government contractors, and the Virginia Tech Innovation campus; whether we will be successful in negotiating definitive documentation with AT&T; the economic impact of DC's diversification into technology; our anticipated acquisitions and dispositions and the ability to identify associated like-kind exchanges; our annual dividend per share and dividend yield; annualized Net Operating Income; adjusted annualized Net Operating Income; expected key Amazon transaction terms and timeframes for closing any Amazon transactions not yet closed; planned infrastructure and educational improvements related to Amazon's additional headquarters; the impact of our role as the exclusive developer, property manager and retail leasing agent in connection with Amazon's new headquarters; our development plans related to Amazon's additional headquarters; the impact on our net asset value of the Amazon transactions; in the case of any further Amazon lease transactions and our new development opportunities in National Landing, the total square feet to be leased to Amazon and the expected net effective rent; the impact of increases in government spending on increases in agency and contractor spending locally; whether we can access agency debt secured by our currently unencumbered multifamily assets timely, on reasonable terms or at all; whether the delay in our planned 2020 discretionary operating asset capital expenditures will have any negative impact on our properties or our ability to generate revenue; whether the allocation of capital to our share repurchase plan has any impact on our share price; whether in the case of our Under-Construction and Near-Term Development Pipeline assets, estimated square feet, estimated number of units, estimated construction start, occupancy stabilization dates, the estimated completion date, estimated stabilization date, Estimated Incremental Investment, Estimated Total Investment, Projected NOI Yield, weighted average Projected NOI Yield, NOI yield or Estimated Total Project Cost, estimated total NOI weighted average completion date, weighted average stabilization date, intended type of asset use and potential tenants, and Estimated Stabilized NOI are accurate; whether our Under-Construction assets will deliver the Annualized NOI that we anticipate; long-term trends regarding teleworking; whether the federal government will increase local spending when controlled by a single party; and in the case of our Future Development Pipeline opportunities, estimated commercial SF/multifamily units to be replaced, estimated remaining acquisition cost, estimated capitalized cost, Estimated Total Investment, Estimated Potential Development Density and the potential for delays in the entitlement process.
Many of the factors that will determine the outcome of these and our other forward-looking statements are beyond our ability to control or predict. These factors include, among others: adverse economic conditions in the Washington, DC metropolitan area, including in relation to COVID-19, the timing of and costs associated with development and property improvements, financing commitments, and general competitive factors. For further discussion of factors that could materially affect the outcome of our forward-looking statements and other risks and uncertainties, see "Risk Factors," "Management's Discussion and Analysis of Financial Condition and Results of Operations" and the Cautionary Statement Concerning Forward-Looking
| Page 3 |
Statements in the Company's Annual Report on Form 10-K for the year ended December 31, 2020 and other periodic reports the Company files with the Securities and Exchange Commission. For these statements, we claim the protection of the safe harbor for forward-looking statements contained in the Private Securities Litigation Reform Act of 1995. You are cautioned not to place undue reliance on our forward-looking statements. All subsequent written and oral forward-looking statements attributable to us or any person acting on our behalf are expressly qualified in their entirety by the cautionary statements contained or referred to in this section. We do not undertake any obligation to release publicly any revisions to our forward-looking statements to reflect events or circumstances occurring after the date hereof.
Organization and Basis of Presentation
JBG SMITH Properties ("JBG SMITH") was organized as a Maryland real estate investment trust ("REIT") for the purpose of receiving, via the spin-off on July 17, 2017 (the "Separation"), substantially all of the assets and liabilities of Vornado Realty Trust's Washington, DC segment. On July 18, 2017, JBG SMITH acquired the management business and certain assets and liabilities of The JBG Companies ("JBG") (the "Combination"). The Separation and the Combination are collectively referred to as the "Formation Transaction."
The information contained in this Investor Package does not purport to disclose all items required by the accounting principles generally accepted in the United States of America ("GAAP") and is unaudited information, unless otherwise indicated.
Pro Rata Information
We present certain financial information and metrics in this Investor Package "at JBG SMITH Share," which refers to our ownership percentage of consolidated and unconsolidated assets in real estate ventures (collectively, "real estate ventures") as applied to these financial measures and metrics. Financial information "at JBG SMITH Share" is calculated on an asset-by-asset basis by applying our percentage economic interest to each applicable line item of that asset's financial information. "At JBG SMITH Share" information, which we also refer to as being "at share," "our pro rata share" or "our share," is not, and is not intended to be, a presentation in accordance with GAAP. Given that a substantial portion of our assets are held through real estate ventures, we believe this form of presentation, which presents our economic interests in the partially owned entities, provides investors valuable information regarding a significant component of our portfolio, its composition, performance and capitalization.
We do not control the unconsolidated real estate ventures and do not have a legal claim to our co-venturers' share of assets, liabilities, revenue and expenses. The operating agreements of the unconsolidated real estate ventures generally allow each co-venturer to receive cash distributions to the extent there is available cash from operations. The amount of cash each investor receives is based upon specific provisions of each operating agreement and varies depending on certain factors including the amount of capital contributed by each investor and whether any investors are entitled to preferential distributions.
With respect to any such third-party arrangement, we would not be in a position to exercise sole decision-making authority regarding the property, real estate venture or other entity, and may, under certain circumstances, be exposed to economic risks not present were a third-party not involved. We and our respective co-venturers may each have the right to trigger a buy-sell or forced sale arrangement, which could cause us to sell our interest, or acquire our co-venturers' interests, or to sell the underlying asset, either on unfavorable terms or at a time when we otherwise would not have initiated such a transaction. Our real estate ventures may be subject to debt, and the repayment or refinancing of such debt may require equity capital calls. To the extent our co-venturers do not meet their obligations to us or our real estate ventures or they act inconsistent with the interests of the real estate venture, we may be adversely affected. Because of these limitations, the non-GAAP "at JBG SMITH Share" financial information should not be considered in isolation or as a substitute for our financial statements as reported under GAAP.
Definitions
See pages 50-54 for definitions of terms used in this Investor Package.
Information herein with respect to the proposed transactions with Amazon is based on executed leases and purchase and sale agreements between us and Amazon. Closing under these agreements is subject to customary closing conditions.
| Page 4 |
Non-GAAP Measures
This Investor Package includes non-GAAP measures. For these measures, we have provided an explanation of how these non-GAAP measures are calculated and why our management believes that the presentation of these measures provides useful information to investors regarding our financial condition and results of operations. Reconciliations of certain non-GAAP measures to the most directly comparable GAAP financial measure are included in this Investor Package. Our presentation of non-GAAP financial measures may not be comparable to similar non-GAAP measures used by other companies.
In addition to "at share" financial information, the following non-GAAP measures are included in this Investor Package:
● | Earnings Before Interest, Taxes, Depreciation and Amortization ("EBITDA") |
● | EBITDA for Real Estate ("EBITDAre") |
● | Adjusted EBITDA |
● | Funds from Operations ("FFO") |
● | Core FFO |
● | Funds Available for Distribution ("FAD") |
● | Third-Party Asset Management and Real Estate Services Business |
● | Net Operating Income ("NOI") |
● | Annualized NOI |
● | Estimated Stabilized NOI |
● | Projected NOI Yield |
● | Same Store NOI |
● | Consolidated and Unconsolidated Indebtedness |
● | Net Debt |
● | Pro Rata Adjusted General and Administrative Expenses |
| Page 5 |
COMPANY PROFILE | JUNE 30, 2021 |
|
Executive Officers | | Company Snapshot as of June 30, 2021 | |||||||
| | | | | | | | | |
W. Matthew Kelly |
| Chief Executive Officer and Trustee |
| | Exchange/ticker |
| | NYSE: JBGS | |
David P. Paul |
| President and Chief Operating Officer |
| | Indicated annual dividend per share | | $ | 0.90 | |
M. Moina Banerjee |
| Chief Financial Officer |
| | Dividend yield | |
| 2.9 | % |
Kevin P. Reynolds |
| Chief Development Officer |
| |
| |
|
| |
George L. Xanders | | Chief Investment Officer |
| | Total Enterprise Value (dollars in billions, except share price) | |
|
| |
Steven A. Museles |
| Chief Legal Officer |
| | Common share price | | $ | 31.51 | |
| | |
| | Common shares and common limited partnership units ("OP Units") outstanding (in millions) | |
| 145.08 | |
| | |
| | Total market capitalization | | $ | 4.57 | |
| | |
| | Total consolidated and unconsolidated indebtedness at JBG SMITH Share | |
| 2.38 | |
| | |
| | Less: cash and cash equivalents at JBG SMITH Share | |
| (0.22) | |
| | |
| | Net debt | | $ | 2.16 | |
| | |
| | Total Enterprise Value | | $ | 6.73 | |
| | | | | | | | | |
|
|
|
| | Net Debt / Total Enterprise Value | |
| 32.1 | % |
| | | | | | | | | |
| Page 6 |
FINANCIAL HIGHLIGHTS | JUNE 30, 2021 |
| dollars in thousands, except per share data |
| Three Months Ended | | | Six Months Ended | | ||
| | | June 30, 2021 | | | June 30, 2021 | | ||
| | | | | | | | | |
| Summary Financial Results | | | | | | | | |
| Total revenue | | $ | 154,644 | | | $ | 319,933 | |
| Net loss attributable to common shareholders | | $ | (2,973) | | | $ | (23,704) | |
| Per diluted common share | | $ | (0.03) | | | $ | (0.19) | |
| Operating portfolio NOI | | $ | 82,978 | | | $ | 163,704 | |
| FFO (1) | | $ | 41,914 | | | $ | 88,727 | |
| Per OP Unit | | $ | 0.29 | | | $ | 0.61 | |
| Core FFO (1) | | $ | 49,629 | | | $ | 104,538 | |
| Per OP Unit | | $ | 0.34 | | | $ | 0.72 | |
| FAD (1) | | $ | 42,147 | | | $ | 89,781 | |
| FAD payout ratio | |
| 79.5 | % | |
| 76.8 | % |
| EBITDA (1) | | $ | 80,668 | | | $ | 153,171 | |
| EBITDAre (1) | | $ | 64,189 | | | $ | 136,692 | |
| Adjusted EBITDA (1) | | $ | 70,817 | | | $ | 150,548 | |
| Net debt / total enterprise value | |
| 32.1 | % | |
| 32.1 | % |
| Net debt to annualized Adjusted EBITDA | |
| 7.6 | x | |
| 7.2 | x |
| | | | | | | | | |
| | | | | | | June 30, 2021 | | |
| | | | | | | | | |
| Debt Summary and Key Ratios (at JBG SMITH Share) | | | | | |
|
| |
| Total consolidated indebtedness (2) | | | | | | $ | 1,979,494 | |
| Total consolidated and unconsolidated indebtedness (2) | | | | | | $ | 2,378,756 | |
| Weighted average interest rates: | | | | | |
|
| |
| Variable rate debt | | | | | |
| 2.24 | % |
| Fixed rate debt | | | | | |
| 3.82 | % |
| Total debt | | | | | |
| 3.17 | % |
| Cash and cash equivalents | | | | | | $ | 217,543 | |
(1) | Attributable to OP Units, which include units owned by JBG SMITH. |
(2) | Net of premium/discount and deferred financing costs. |
| Page 7 |
FINANCIAL HIGHLIGHTS – TRENDS | JUNE 30, 2021 |
| | | Three Months Ended |
| |||||||||||||
| dollars in thousands, except per share data, at JBG SMITH Share |
| Q2 2021 |
| Q1 2021 |
| Q4 2020 |
| Q3 2020 |
| Q2 2020 | | |||||
| Commercial NOI | | $ | 64,334 | | $ | 63,026 | | $ | 57,652 | | $ | 56,897 | | $ | 56,594 | |
| Multifamily NOI | |
| 18,644 | |
| 17,775 | |
| 14,151 | |
| 15,452 | |
| 19,081 | |
| Operating portfolio NOI | | $ | 82,978 | | $ | 80,801 | | $ | 71,803 | | $ | 72,349 | | $ | 75,675 | |
| Total Annualized NOI | | $ | 330,682 | | $ | 322,241 | | $ | 288,230 | | $ | 291,119 | | $ | 306,984 | |
| | | | | | | | | | | | | | | | | |
| Net loss attributable to common shareholders | | $ | (2,973) | | $ | (20,731) | | $ | (45,655) | | $ | (22,793) | | $ | (36,780) | |
| Per diluted common share | | $ | (0.03) | | $ | (0.16) | | $ | (0.36) | | $ | (0.18) | | $ | (0.28) | |
| FFO (1) | | $ | 41,914 | | $ | 46,813 | | $ | 25,893 | | $ | 36,345 | | $ | 26,627 | |
| Per OP Unit | | $ | 0.29 | | $ | 0.32 | | $ | 0.17 | | $ | 0.24 | | $ | 0.18 | |
| Core FFO (1) | | $ | 49,629 | | $ | 54,909 | | $ | 36,634 | | $ | 45,060 | | $ | 38,269 | |
| Per OP Unit | | $ | 0.34 | | $ | 0.38 | | $ | 0.25 | | $ | 0.30 | | $ | 0.26 | |
| FAD (1) | | $ | 42,147 | | $ | 47,634 | | $ | 45,596 | | $ | 35,732 | | $ | 36,132 | |
| FAD payout ratio | |
| 79.5 | % |
| 74.4 | % |
| 73.2 | % |
| 94.4 | % |
| 94.0 | % |
| EBITDA (1) | | $ | 80,668 | | $ | 72,503 | | $ | 41,189 | | $ | 57,856 | | $ | 37,921 | |
| EBITDAre (1) | | $ | 64,189 | | $ | 72,503 | | $ | 48,168 | | $ | 57,856 | | $ | 47,395 | |
| Adjusted EBITDA (1) | | $ | 70,817 | | $ | 79,731 | | $ | 57,952 | | $ | 65,398 | | $ | 58,127 | |
| Net debt / total enterprise value | |
| 32.1 | % |
| 31.9 | % |
| 32.0 | % |
| 33.9 | % |
| 30.2 | % |
| Net debt to annualized Adjusted EBITDA | |
| 7.6 | x |
| 6.8 | x |
| 9.2 | x |
| 7.7 | x |
| 8.1 | x |
| | | | | | | | | | | | | | | | | |
| | | Q2 2021 | | Q1 2021 | | Q4 2020 | | Q3 2020 | | Q2 2020 | | |||||
| | | | | | | | | | | | | | | | | |
| Number of Operating Assets | |
|
| |
|
| |
|
| |
|
| |
|
| |
| Commercial | |
| 43 | |
| 42 | |
| 41 | |
| 43 | |
| 43 | |
| Multifamily | |
| 21 | |
| 21 | |
| 21 | |
| 21 | |
| 20 | |
| Total | |
| 64 | |
| 63 | |
| 62 | |
| 64 | |
| 63 | |
| | | | | | | | | | | | | | | | | |
| Operating Portfolio % Leased | |
|
| |
|
| |
|
| |
|
| |
|
| |
| Commercial (2) | |
| 85.9 | % |
| 87.3 | % |
| 88.1 | % |
| 88.4 | % |
| 90.4 | % |
| Multifamily (3) | |
| 91.6 | % |
| 91.0 | % |
| 86.5 | % |
| 83.0 | % |
| 85.8 | % |
| Weighted Average | |
| 87.7 | % |
| 88.5 | % |
| 87.6 | % |
| 86.7 | % |
| 89.0 | % |
| | | | | | | | | | | | | | | | | |
| Operating Portfolio % Occupied (4) | |
|
| |
|
| |
|
| |
|
| |
|
| |
| Commercial (2) | |
| 84.4 | % |
| 86.9 | % |
| 87.7 | % |
| 85.3 | % |
| 88.1 | % |
| Multifamily (3) | |
| 86.3 | % |
| 85.9 | % |
| 81.1 | % |
| 76.6 | % |
| 82.3 | % |
| Weighted Average | |
| 85.0 | % |
| 86.6 | % |
| 85.6 | % |
| 82.5 | % |
| 86.3 | % |
See footnotes on page 9.
| Page 8 |
FINANCIAL HIGHLIGHTS – TRENDS | JUNE 30, 2021 |
Footnotes
Note: See appendices for reconciliations of non-GAAP financial measures to their respective comparable GAAP financial measures.
(1) | Attributable to OP Units, which include units owned by JBG SMITH. |
(2) | Crystal City Marriott and 1700 M Street (for which we are the ground lessor) are excluded from the Percent Leased and the Percent Occupied metrics. |
(3) | Includes Recently Delivered assets. In-Service assets were 95.0% leased and 89.8% occupied as of Q2 2021, 92.3% leased and 88.4% occupied as of Q1 2021, 91.3% leased and 87.8% as of Q4 2020, 92.8% leased and 88.1% occupied as of Q3 2020, and 93.3% leased and 90.2% occupied as of Q2 2020. |
(4) | Percent Occupied excludes occupied retail SF. |
| Page 9 |
PORTFOLIO OVERVIEW | JUNE 30, 2021 |
| | | | | 100% Share | | At JBG SMITH Share |
| |||||||||||||
| | | | | | | | | | | | | | | Annualized | | | |
| ||
| | | | | | | | | | | | | | | Rent per | | | | | ||
| | | | | | | | | | | | | Annualized | | Square Foot/ | | |
| |||
| | | Number of | | Square Feet/ | | Square Feet/ | | % | | | | Rent | | Monthly Rent | | Annualized NOI | | |||
| | | Assets | | Units | | Units | | Leased | | % Occupied (1) | | (in thousands) | | Per Unit (2) | | (in thousands) |
| |||
| | | | | | | | | | | | | | | | | | | | | |
| Operating | | | | | | | | | | | | | | | | | | | | |
| Commercial (3) | | | | | | | | | | | | | | | | | | | | |
| In-Service |
| 43 |
| 13,295,585 |
| 11,418,696 |
| 85.9 | % | 84.4 | % | $ | 433,996 |
| $ | 46.86 |
| $ | 256,106 | |
| Multifamily |
|
|
|
|
|
|
|
|
|
| |
|
| |
|
| |
|
| |
| In-Service |
| 19 |
| 7,021 |
| 5,548 |
| 95.0 | % | 89.8 | % | $ | 135,141 | | $ | 2,084 | | $ | 70,520 | |
| Recently Delivered |
| 2 |
| 755 |
| 577 |
| 59.9 | % | 51.9 | % |
| 9,470 | |
| 2,203 | |
| 4,056 | |
| Total / weighted average |
| 21 |
| 7,776 |
| 6,125 |
| 91.6 | % | 86.3 | % | $ | 144,611 | | $ | 2,091 | | $ | 74,576 | |
| | | | | | | | | | | | | | | | | | | | | |
| Operating - In-Service |
| 62 |
| 13,295,585 SF/ |
| 11,418,696 SF/ |
| 88.6 | % | 86.0 | % | $ | 569,137 | | | $46.86 per SF/ | | $ | 326,626 | |
| |
| | | | | | | | | | | | | | | | | | | |
| Operating - Recently Delivered |
| 2 |
| 755 Units |
| 577 Units |
| 59.9 | % | 51.9 | % | $ | 9,470 | | | $2,203 per unit | | $ | 4,056 | |
| |
| | | | | | | | | | | | | | | | | | | |
| Operating - Total / Weighted Average |
| 64 |
| 13,295,585 SF/ 7,776 Units |
| 11,418,696 SF/ 6,125 Units |
| 87.7 | % | 85.0 | % | $ | 578,607 | | | $46.86 per SF/ | | $ | 330,682 | |
| | | | | | | | | | | | | | | | | | | | | |
| Development (4) |
|
|
|
|
|
|
|
|
|
| |
|
| |
|
| |
|
| |
| | | | | | | | | | | | | | | | | | | | | |
| Under-Construction |
| 1 |
| 808 Units |
| 808 Units |
| | |
| |
| | |
| | |
|
| |
| | | | | | | | | | | | | | | | | | | | | |
| Near-Term Development |
| 11 |
| 5,236,600 |
| 5,027,000 |
|
|
|
| |
|
| |
| | |
|
| |
| | | | | | | | | | | | | | | | | | | | | |
| Future Development |
| 26 |
| 14,678,100 |
| 11,947,600 |
|
|
|
| |
|
| |
| | |
|
| |
(1) | Percent Occupied excludes retail SF. |
(2) | For commercial assets, represents annualized office rent divided by occupied office SF; annualized retail rent and retail SF are excluded from this metric. For multifamily assets, represents monthly multifamily rent divided by occupied units; retail rent is excluded from this metric. Annualized Rent and Annualized Rent per Square Foot exclude percentage rent and the square footage of office tenants that only pay percentage rent. Occupied square footage may differ from leased square footage because leased square footage includes space for leases that have been signed but the tenant has not yet taken occupancy. |
(3) | Crystal City Marriott and 1700 M Street (for which we are the ground lessor) are excluded from Percent Leased, Percent Occupied, Annualized Rent and Annualized Rent per Square Foot metrics. |
(4) | Refer to pages 40-42 for detail on Under-Construction assets, and Near-Term and Future Development Pipelines. |
| Page 10 |
CONDENSED CONSOLIDATED BALANCE SHEETS | JUNE 30, 2021 |
Condensed Consolidated Balance Sheets
| in thousands | | June 30, 2021 | | December 31, 2020 |
| ||
| | | | | | | |
|
| ASSETS | | | | | | | |
| Real estate, at cost: |
| |
|
| |
| |
| Land and improvements | | $ | 1,357,904 | | $ | 1,391,472 | |
| Buildings and improvements | |
| 4,355,187 | |
| 4,341,103 | |
| Construction in progress, including land | |
| 273,542 | |
| 268,056 | |
| | |
| 5,986,633 | |
| 6,000,631 | |
| Less accumulated depreciation | |
| (1,297,406) | |
| (1,232,690) | |
| Real estate, net | |
| 4,689,227 | |
| 4,767,941 | |
| Cash and cash equivalents | |
| 201,150 | |
| 225,600 | |
| Restricted cash | |
| 37,543 | |
| 37,736 | |
| Tenant and other receivables | |
| 43,724 | |
| 55,903 | |
| Deferred rent receivable | |
| 182,565 | |
| 170,547 | |
| Investments in unconsolidated real estate ventures | |
| 497,770 | |
| 461,369 | |
| Other assets, net | |
| 282,356 | |
| 286,575 | |
| Assets held for sale | |
| 73,876 | |
| 73,876 | |
| TOTAL ASSETS | | $ | 6,008,211 | | $ | 6,079,547 | |
| | | | | | | | |
| LIABILITIES, REDEEMABLE NONCONTROLLING INTERESTS AND EQUITY | |
|
| |
|
| |
| Liabilities: | |
|
| |
|
| |
| Mortgages payable, net | | $ | 1,591,143 | | $ | 1,593,738 | |
| Revolving credit facility | |
| — | |
| — | |
| Unsecured term loans, net | |
| 398,322 | |
| 397,979 | |
| Accounts payable and accrued expenses | |
| 99,310 | |
| 103,102 | |
| Other liabilities, net | |
| 201,556 | |
| 247,774 | |
| Total liabilities | |
| 2,290,331 | |
| 2,342,593 | |
| Commitments and contingencies | |
|
| |
|
| |
| Redeemable noncontrolling interests | |
| 544,639 | |
| 530,748 | |
| Total equity | |
| 3,173,241 | |
| 3,206,206 | |
| TOTAL LIABILITIES, REDEEMABLE NONCONTROLLING INTERESTS AND EQUITY | | $ | 6,008,211 | | $ | 6,079,547 | |
Note: For complete financial statements, please refer to our Quarterly Report on Form 10-Q for the quarter ended June 30, 2021.
| Page 11 |
CONDENSED CONSOLIDATED STATEMENTS OF OPERATIONS | JUNE 30, 2021 |
Condensed Consolidated Statements of Operations
| in thousands, except per share data | | Three Months Ended June 30, | | Six Months Ended June 30, |
| ||||||||
| | | 2021 | | 2020 | | 2021 | | 2020 |
| ||||
| REVENUE | | | | | | | | | | | | | |
| Property rental |
| $ | 122,819 |
| $ | 115,459 | | $ | 245,060 |
| $ | 235,839 | |
| Third-party real estate services, including reimbursements | |
| 26,745 | |
| 27,167 | |
| 64,852 | |
| 56,883 | |
| Other revenue | |
| 5,080 | |
| 2,326 | |
| 10,021 | |
| 10,337 | |
| Total revenue | |
| 154,644 | |
| 144,952 | |
| 319,933 | |
| 303,059 | |
| EXPENSES | |
|
| |
|
| |
|
| |
|
| |
| Depreciation and amortization | |
| 56,678 | |
| 52,616 | |
| 121,404 | |
| 101,105 | |
| Property operating | |
| 35,000 | |
| 33,792 | |
| 69,731 | |
| 68,295 | |
| Real estate taxes | |
| 18,558 | |
| 17,869 | |
| 36,868 | |
| 36,068 | |
| General and administrative: | |
| | |
| | |
| | |
| | |
| Corporate and other | |
| 13,895 | |
| 13,216 | |
| 26,370 | |
| 26,392 | |
| Third-party real estate services | |
| 25,557 | |
| 29,239 | |
| 54,493 | |
| 58,053 | |
| Share-based compensation related to Formation Transaction and special equity awards | |
| 4,441 | |
| 8,858 | |
| 9,386 | |
| 18,299 | |
| Transaction and Other Costs | |
| 2,270 | |
| 1,372 | |
| 5,960 | |
| 6,681 | |
| Total expenses | |
| 156,399 | |
| 156,962 | |
| 324,212 | |
| 314,893 | |
| OTHER INCOME (EXPENSE) | |
|
| |
|
| |
|
| |
|
| |
| Income (loss) from unconsolidated real estate ventures, net | |
| 3,953 | |
| (13,485) | |
| 3,010 | |
| (16,177) | |
| Interest and other income (loss), net | |
| (38) | |
| 114 | |
| (29) | |
| 1,021 | |
| Interest expense | |
| (16,773) | |
| (15,770) | |
| (33,069) | |
| (27,775) | |
| Gain on sale of real estate | |
| 11,290 | |
| — | |
| 11,290 | |
| 59,477 | |
| Loss on extinguishment of debt | |
| — | |
| — | |
| — | |
| (33) | |
| Total other income (expense) | |
| (1,568) | |
| (29,141) | |
| (18,798) | |
| 16,513 | |
| INCOME (LOSS) BEFORE INCOME TAX (EXPENSE) BENEFIT | |
| (3,323) | |
| (41,151) | |
| (23,077) | |
| 4,679 | |
| Income tax (expense) benefit | |
| 5 | |
| 888 | |
| (4,310) | |
| 3,233 | |
| NET INCOME (LOSS) | |
| (3,318) | |
| (40,263) | |
| (27,387) | |
| 7,912 | |
| Net (income) loss attributable to redeemable noncontrolling interests | |
| 345 | |
| 3,483 | |
| 2,575 | |
| (1,767) | |
| Net loss attributable to noncontrolling interests | | | — | | | — | | | 1,108 | |
| — | |
| NET INCOME (LOSS) ATTRIBUTABLE TO COMMON SHAREHOLDERS | | $ | (2,973) | | $ | (36,780) | | $ | (23,704) | | $ | 6,145 | |
| EARNINGS (LOSS) PER COMMON SHARE - BASIC AND DILUTED | | $ | (0.03) | | $ | (0.28) | | $ | (0.19) | | $ | 0.04 | |
| WEIGHTED AVERAGE NUMBER OF COMMON SHARES OUTSTANDING - BASIC AND DILUTED | |
| 131,480 | |
| 133,613 | |
| 131,510 | |
| 134,078 | |
Note: For complete financial statements, please refer to our Quarterly Report on Form 10-Q for the quarter ended June 30, 2021.
| Page 12 |
nconsolidated Real Estate Ventures
| in thousands, at JBG SMITH Share |
| | |
|
| BALANCE SHEET INFORMATION | | June 30, 2021 |
| |
| | | | | |
| Total real estate, at cost | | $ | 892,816 | |
| Less accumulated depreciation | |
| (68,629) | |
| Real estate, net | |
| 824,187 | |
| Cash and cash equivalents | |
| 16,489 | |
| Other assets, net | |
| 87,643 | |
| Total assets | | $ | 928,319 | |
| Borrowings, net | | $ | 399,262 | |
| Other liabilities, net | |
| 51,286 | |
| Total liabilities | | $ | 450,548 | |
| |
| Three Months Ended | | Six Months Ended |
| ||
| OPERATING INFORMATION | | June 30, 2021 | | June 30, 2021 |
| ||
| Total revenue | | $ | 16,865 | | $ | 33,566 | |
| Expenses: | |
|
| |
|
| |
| Depreciation and amortization | |
| 7,209 | |
| 14,680 | |
| Property operating | |
| 4,907 | |
| 10,135 | |
| Real estate taxes | |
| 2,793 | |
| 5,537 | |
| Total expenses | |
| 14,909 | |
| 30,352 | |
| Other income (expense): | |
|
| |
|
| |
| Interest expense | |
| (3,304) | |
| (6,152) | |
| Gain on the sale of real estate | |
| 5,189 | |
| 5,189 | |
| Interest and other income, net | |
| 184 | |
| 184 | |
| | | | | | | | |
| Net income | | $ | 4,025 | | $ | 2,435 | |
| Earnings and distributions in excess of our investment in unconsolidated real estate venture | |
| 92 | |
| 422 | |
| Other | |
| (164) | |
| 153 | |
| Income from unconsolidated real estate ventures, net | | $ | 3,953 | | $ | 3,010 | |
| Page 13 |
OTHER TANGIBLE ASSETS AND LIABILITIES | JUNE 30, 2021 |
Other Tangible Assets and Liabilities
| in thousands, at JBG SMITH Share |
| June 30, 2021 |
| |
| | | | | |
| Other Tangible Assets, Net (1) (2) | | | | |
| Restricted cash | | $ | 39,424 | |
| Tenant and other receivables, net | |
| 46,938 | |
| Other assets, net | |
| 52,424 | |
| Total Other Tangible Assets, Net | | $ | 138,786 | |
| | | | | |
| Other Tangible Liabilities, Net (2) (3) | |
|
| |
| Accounts payable and accrued liabilities | | $ | 114,158 | |
| Other liabilities, net | |
| 169,922 | |
| Total Other Tangible Liabilities, Net | | $ | 284,080 | |
(1) | Excludes cash and cash equivalents. |
(2) | Excludes assets held for sale. |
(3) | Excludes debt. |
| Page 14 |
EBITDA, EBITDAre AND ADJUSTED EBITDA (NON-GAAP) | JUNE 30, 2021 |
EBITDA, EBITDAre and Adjusted EBITDA
| dollars in thousands |
| Three Months Ended June 30, | | Six Months Ended June 30, |
| ||||||||
| | | 2021 | | 2020 | | 2021 | | 2020 |
| ||||
| | | | | | | | | | | | | |
|
| EBITDA, EBITDAre and Adjusted EBITDA |
| | | | | | | |
| | |
| |
| Net income (loss) | | $ | (3,318) | | $ | (40,263) | | $ | (27,387) | | $ | 7,912 | |
| Depreciation and amortization expense | | | 56,678 | | | 52,616 | | | 121,404 | | | 101,105 | |
| Interest expense (1) | | | 16,773 | | | 15,770 | | | 33,069 | | | 27,775 | |
| Income tax expense (benefit) | | | (5) | | | (888) | | | 4,310 | | | (3,233) | |
| Unconsolidated real estate ventures allocated share of above adjustments | | | 10,581 | | | 10,692 | | | 20,745 | | | 21,529 | |
| EBITDA attributable to noncontrolling interests | | | (41) | | | (6) | | | 1,030 | | | (3) | |
| EBITDA | | $ | 80,668 | | $ | 37,921 | | $ | 153,171 | | $ | 155,085 | |
| Gain on sale of real estate | | | (11,290) | | | — | | | (11,290) | | | (59,477) | |
| (Gain) loss on sale of unconsolidated real estate assets | | | (5,189) | | | 2,952 | | | (5,189) | | | 2,952 | |
| Impairment of investment in unconsolidated real estate venture (2) | | | — | | | 6,522 | | | — | | | 6,522 | |
| | | | | | | | | | | | | | |
| EBITDAre | | $ | 64,189 | | $ | 47,395 | | $ | 136,692 | | $ | 105,082 | |
| Transaction and Other Costs (3) | | | 2,270 | | | 1,372 | | | 4,852 | | | 6,681 | |
| Loss on extinguishment of debt | | | — | | | — | | | — | | | 33 | |
| Share-based compensation related to Formation Transaction and special equity awards | | | 4,441 | | | 8,858 | | | 9,386 | | | 18,299 | |
| Earnings (losses) and distributions in excess of our investment in unconsolidated real estate venture | | | (92) | | | (245) | | | (422) | | | 129 | |
| Unconsolidated real estate ventures allocated share of above adjustments | | | 9 | | | 747 | | | 40 | | | 1,465 | |
| | | | | | | | | | | | | | |
| Adjusted EBITDA | | $ | 70,817 | | $ | 58,127 | | $ | 150,548 | | $ | 131,689 | |
| | | | | | | | | | | | | | |
| Net Debt to Annualized Adjusted EBITDA (4) | | | 7.6 | x | | 8.1 | x | | 7.2 | x | | 7.2 | x |
| | | | | | | | | | | | | | |
| | | | | | | | | June 30, 2021 | | June 30, 2020 | | ||
| Net Debt (at JBG SMITH Share) | | | | | | | | |
| | |
| |
| Consolidated indebtedness (5) | | | | | | | | $ | 1,979,494 | | $ | 2,202,667 | |
| Unconsolidated indebtedness (5) | | | | | | | | | 399,262 | | | 411,599 | |
| Total consolidated and unconsolidated indebtedness | | | | | | | | | 2,378,756 | | | 2,614,266 | |
| Less: cash and cash equivalents | | | | | | | | | 217,543 | | | 724,246 | |
| Net Debt (at JBG SMITH Share) | | | | | | | | $ | 2,161,213 | | $ | 1,890,020 | |
Note: All EBITDA measures as shown above are attributable to OP Units.
(1) | Interest expense includes the amortization of deferred financing costs and the ineffective portion of any interest rate swaps or caps, net of capitalized interest. |
(2) | During the second quarter of 2020, we determined that our investment in the venture that owned The Marriott Wardman Park hotel was impaired due to a decline in the fair value of the underlying asset and recorded an impairment loss of $6.5 million, which reduced the net book value of our investment to zero, and we suspended equity loss recognition for the venture after June 30, 2020. On October 1, 2020, we transferred our interest in this venture to our former venture partner. |
(3) | See page 55 for the components of Transaction and Other Costs. For the six months ended June 30, 2021, excludes $1.1 million of transaction costs attributable to noncontrolling interests. |
(4) | Calculated using the Net Debt below. Quarterly Adjusted EBITDA is annualized by multiplying by four. Adjusted EBITDA for the six months ended June 30, 2021 and 2020 is annualized by multiplying by two. |
(5) | Net of premium/discount and deferred financing costs. |
| Page 15 |
FFO, CORE FFO AND FAD (NON-GAAP) | JUNE 30, 2021 |
| in thousands, except per share data | | Three Months Ended June 30, | | Six Months Ended June 30, | | ||||||||
| |
| 2021 |
| 2020 | | 2021 |
| 2020 | | ||||
| | | | | | | | | | | | | |
|
| FFO and Core FFO | | | | | | | | | | | | | |
| Net income (loss) attributable to common shareholders | | $ | (2,973) |
| $ | (36,780) | | $ | (23,704) |
| $ | 6,145 | |
| Net income (loss) attributable to redeemable noncontrolling interests | |
| (345) |
| | (3,483) | |
| (2,575) |
| | 1,767 | |
| Net loss attributable to noncontrolling interests | |
| — |
| | — | |
| (1,108) |
| | — | |
| Net income (loss) | |
| (3,318) |
| | (40,263) | |
| (27,387) |
| | 7,912 | |
| Gain on sale of real estate | |
| (11,290) |
| | — | |
| (11,290) |
| | (59,477) | |
| (Gain) loss on sale from unconsolidated real estate ventures | |
| (5,189) |
| | 2,952 | |
| (5,189) |
| | 2,952 | |
| Real estate depreciation and amortization | |
| 54,475 |
| | 49,924 | |
| 116,975 |
| | 95,586 | |
| Impairment of investment in unconsolidated real estate venture (1) | | | — |
| | 6,522 | |
| — |
| | 6,522 | |
| Pro rata share of real estate depreciation and amortization from unconsolidated real estate ventures | |
| 7,277 |
| | 7,498 | |
| 14,588 |
| | 14,380 | |
| FFO attributable to noncontrolling interests | |
| (41) |
| | (6) | |
| 1,030 |
| | (3) | |
| FFO Attributable to OP Units | | $ | 41,914 |
| $ | 26,627 | | $ | 88,727 |
| $ | 67,872 | |
| FFO attributable to redeemable noncontrolling interests | |
| (4,054) |
| | (2,911) | |
| (8,539) |
| | (7,408) | |
| FFO attributable to common shareholders | | $ | 37,860 |
| $ | 23,716 | | $ | 80,188 |
| $ | 60,464 | |
| | | | | | | | | | | | | | |
| FFO attributable to OP Units | | $ | 41,914 |
| $ | 26,627 | | $ | 88,727 |
| $ | 67,872 | |
| Transaction and Other Costs, net of tax (2) | |
| 2,241 |
| | 1,212 | |
| 4,793 |
| | 6,378 | |
| (Gain) loss from mark-to-market on derivative instruments | |
| 46 |
| | 17 | |
| (87) |
| | (30) | |
| Loss on extinguishment of debt | |
| — |
| | — | |
| — |
| | 33 | |
| Earnings (losses) and distributions in excess of our investment in unconsolidated real estate venture | |
| (92) |
| | (245) | |
| (422) |
| | 129 | |
| Share-based compensation related to Formation Transaction and special equity awards | |
| 4,441 |
| | 8,858 | |
| 9,386 |
| | 18,299 | |
| Amortization of management contracts intangible, net of tax | |
| 1,073 |
| | 1,073 | |
| 2,145 |
| | 2,216 | |
| Unconsolidated real estate ventures allocated share of above adjustments | |
| 6 |
| | 727 | |
| (4) |
| | 1,903 | |
| Core FFO Attributable to OP Units | | $ | 49,629 |
| $ | 38,269 | | $ | 104,538 |
| $ | 96,800 | |
| Core FFO attributable to redeemable noncontrolling interests | |
| (4,800) |
| | (4,184) | |
| (10,060) |
| | (10,566) | |
| Core FFO attributable to common shareholders | | $ | 44,829 |
| $ | 34,085 | | $ | 94,478 |
| $ | 86,234 | |
| FFO per common share - diluted | | $ | 0.29 |
| | 0.18 | | $ | 0.61 |
| | 0.45 | |
| Core FFO per common share - diluted | | $ | 0.34 |
| | 0.26 | | $ | 0.72 |
| | 0.64 | |
| Weighted average shares - diluted (FFO and Core FFO) | |
| 131,485 |
| | 133,613 | |
| 131,513 |
| | 134,078 | |
| FAD | | | | | | | | | | | | | |
| Core FFO attributable to OP Units |
| $ | 49,629 |
| $ | 38,269 | | $ | 104,538 |
| $ | 96,800 | |
| Recurring capital expenditures and second-generation tenant improvements and leasing commissions (3) | |
| (12,226) | |
| (12,889) | |
| (22,657) | |
| (22,694) | |
| Straight-line and other rent adjustments (4) | |
| (4,088) | |
| (1,418) | |
| (8,853) | |
| (4,963) | |
| Third-party lease liability assumption payments | |
| (703) | |
| (780) | |
| (1,381) | |
| (2,240) | |
| Share-based compensation expense | |
| 9,045 | |
| 11,757 | |
| 17,115 | |
| 19,487 | |
| Amortization of debt issuance costs | |
| 1,096 | |
| 673 | |
| 2,201 | |
| 1,295 | |
| Unconsolidated real estate ventures allocated share of above adjustments | |
| (1,333) | |
| (695) | |
| (2,659) | |
| (2,193) | |
| Non-real estate depreciation and amortization | |
| 727 | |
| 1,215 | |
| 1,477 | |
| 2,469 | |
| FAD available to OP Units (A) | | $ | 42,147 | | $ | 36,132 | | $ | 89,781 | | $ | 87,961 | |
| Distributions to common shareholders and unitholders (B) | | $ | 33,511 | | $ | 33,970 | | $ | 68,946 | | $ | 67,981 | |
| FAD Payout Ratio (B÷A) (5) | |
| 79.5 | % |
| 94.0 | % |
| 76.8 | % |
| 77.3 | % |
See footnotes on page 17.
| Page 16 |
FFO, CORE FFO AND FAD (NON-GAAP) | JUNE 30, 2021 |
| in thousands, except per share data | | Three Months Ended June 30, | | Six Months Ended June 30, |
| ||||||||
| | | 2021 | | 2020 | | 2021 | | 2020 | | ||||
| | | | | | | | | | | | | | |
| Capital Expenditures | | | | | | | | | | | | | |
| Maintenance and recurring capital expenditures | | $ | 4,376 | | $ | 6,541 | | $ | 8,302 | | $ | 9,099 | |
| Share of maintenance and recurring capital expenditures from unconsolidated real estate ventures | |
| 324 | |
| 360 | |
| 371 | |
| 509 | |
| Second-generation tenant improvements and leasing commissions | |
| 7,454 | |
| 5,613 | |
| 13,518 | |
| 12,556 | |
| Share of second-generation tenant improvements and leasing commissions from unconsolidated real estate ventures | |
| 72 | |
| 375 | |
| 466 | |
| 530 | |
| Recurring capital expenditures and second-generation tenant improvements and leasing commissions | |
| 12,226 | |
| 12,889 | |
| 22,657 | |
| 22,694 | |
| Non-recurring capital expenditures | |
| 4,352 | |
| 6,240 | |
| 7,188 | |
| 12,427 | |
| Share of non-recurring capital expenditures from unconsolidated real estate ventures | |
| 56 | |
| 238 | |
| 107 | |
| 340 | |
| First-generation tenant improvements and leasing commissions | |
| 1,703 | |
| 11,853 | |
| 2,538 | |
| 23,700 | |
| Share of first-generation tenant improvements and leasing commissions from unconsolidated real estate ventures | |
| 199 | |
| 217 | |
| 1,391 | |
| 987 | |
| Non-recurring capital expenditures | |
| 6,310 | |
| 18,548 | |
| 11,224 | |
| 37,454 | |
| Total JBG SMITH Share of Capital Expenditures | | $ | 18,536 | | $ | 31,437 | | $ | 33,881 | | $ | 60,148 | |
(1) | During the second quarter of 2020, we determined that our investment in the venture that owned The Marriott Wardman Park hotel was impaired due to a decline in the fair value of the underlying asset and recorded an impairment loss of $6.5 million, which reduced the net book value of our investment to zero, and we suspended equity loss recognition for the venture after June 30, 2020. On October 1, 2020, we transferred our interest in this venture to our former venture partner. |
(2) | See page 55 for the components of Transaction and Other Costs. For the six months ended June 30, 2021, excludes $1.1 million of transaction costs attributable to noncontrolling interests. |
(3) | Includes amounts, at JBG SMITH Share, related to unconsolidated real estate ventures. |
(4) | Includes straight-line rent, above/below market lease amortization and lease incentive amortization. |
(5) | The quarterly FAD payout ratio is not necessarily indicative of an amount for the full year due to fluctuation in timing of capital expenditures, the commencement of new leases and the seasonality of our operations. |
| Page 17 |
THIRD-PARTY ASSET MANAGEMENT AND REAL ESTATE SERVICES BUSINESS (NON-GAAP) | JUNE 30, 2021 |
Third-Party Asset Mgmt and Real Estate Services Business
| in thousands, at JBG SMITH Share | | Three Months Ended June 30, 2021 |
| ||||||||||
| | | Source of Revenue | | | |
| |||||||
| | | Third-Party | | JBG SMITH | | JBG Legacy | | | |
| |||
| | | Management | | JV Partner (1) | | Funds | | Total |
| ||||
| | | | | | | | | | | | | | |
| Service Revenue | | | | | | | | | | | | | |
| Property management fees |
| $ | 2,584 |
| $ | 1,086 |
| $ | 617 |
| $ | 4,287 | |
| Asset management fees | |
| — | |
| 500 | |
| 1,651 | |
| 2,151 | |
| Development fees | |
| 3,669 | |
| 89 | |
| 634 | |
| 4,392 | |
| Leasing fees | |
| 1,179 | |
| 73 | |
| 174 | |
| 1,426 | |
| Construction management fees | |
| 154 | |
| 80 | |
| (1) | |
| 233 | |
| Other service revenue | |
| 1,035 | |
| 421 | |
| 129 | |
| 1,585 | |
| Total Revenue (2) | | $ | 8,621 | | $ | 2,249 | | $ | 3,204 | | $ | 14,074 | |
| Pro rata adjusted general and administrative expense: third-party real estate services (3) | |
| | |
|
| |
|
| |
| (12,572) | |
| Total Services Revenue Less Allocated General and Administrative Expenses (4) | | | | |
| | |
| | | $ | 1,502 | |
(1) | Service revenues from joint ventures are calculated on an asset-by-asset basis by applying our real estate venture partners' respective economic interests to the fees we earned from each consolidated and unconsolidated real estate venture. |
(2) | Included in "Third-party real estate services, including reimbursements" in our consolidated statement of operations are $11.9 million of reimbursement revenue and $0.8 million of service revenue from our economic interest in consolidated and unconsolidated real estate ventures that are excluded from this table. |
(3) | Our personnel perform services for wholly owned properties and properties we manage on behalf of third parties, real estate ventures and JBG Legacy Funds. |
We allocate personnel and other costs to wholly owned properties (included in "Property operating expenses" and "General and administrative expense: corporate and other" in our consolidated statement of operations) and to properties owned by the third parties, real estate ventures and JBG Legacy Funds (included in "General and administrative expense: third-party real estate services" in our consolidated statement of operations) using estimates of the time spent performing services related to properties in the respective portfolios and other allocation methodologies.
Allocated general and administrative expenses related to real estate ventures are calculated on an asset-by-asset basis by applying our real estate venture partners' respective economic interests to the total general and administrative expenses allocated to each asset. See "Pro Rata Adjusted General and Administrative Expenses" on the next page for a reconciliation of "General and administrative expenses: third-party real estate services" to "Pro Rata Adjusted General and Administrative Expenses."
(4) | Services revenue, excluding reimbursement revenue and service revenue from our economic interest in consolidated and unconsolidated real estate ventures, less allocated general and administrative expenses. Management uses this measure as a supplemental performance measure for its third-party asset management and real estate services business and believes it provides useful information to investors because it reflects only those revenue and expense items incurred by us and can be used to assess the profitability of the third-party asset management and real estate services business. |
| Page 18 |
PRO RATA ADJUSTED GENERAL AND ADMINISTRATIVE EXPENSES | JUNE 30, 2021 |
| in thousands | | Three Months Ended June 30, 2021 |
| |||||||||||||
| | | | | | Adjustments (1) | | | |
| |||||||
| | | Per Statement | | | | | | | | | | | Pro Rata |
| ||
| | | of Operations | | A | | B | | C | | Adjusted |
| |||||
| | | | | | | | | | | | | | | | | |
| General and Administrative Expenses | | | | | | | | | | | | | | | | |
| Corporate and other |
| $ | 13,895 |
| $ | — |
| $ | — |
| $ | 1,085 |
| $ | 14,980 | |
| Third-party real estate services | |
| 25,557 | |
| — | |
| (11,900) | |
| (1,085) | |
| 12,572 | |
| Share-based compensation related to Formation Transaction and special equity awards | |
| 4,441 | |
| (4,441) | |
| — | |
| — | |
| — | |
| | | | | | | | | | | | | | | | | |
| Total | | $ | 43,893 | | $ | (4,441) | | $ | (11,900) | | $ | — | | $ | 27,552 | |
(1) | Adjustments: |
A - Removes share-based compensation related to the Formation Transaction and special equity awards.
B - Removes $11.9 million of general and administrative expenses reimbursed by third-party owners of real estate we manage related to revenue which has been excluded from Service Revenue on page 18. Revenue from reimbursements is included in "Third-party real estate services, including reimbursements" in our consolidated statement of operations.
C - Reflects an adjustment to allocate our share of general and administrative expenses of unconsolidated real estate ventures from "Third-party real estate services" to "Corporate and other" and our consolidated real estate venture partners' share of general and administrative expenses from "Corporate and other" to "Third-party real estate services."
| Page 19 |
OPERATING ASSETS | JUNE 30, 2021 |
| dollars in thousands, at JBG SMITH Share |
| |
| | | |
| | |
| Plus: Signed |
| Plus: Incremental |
| | |
| ||
| | | | | | Q2 2021 | | | | | But Not Yet | | NOI from Assets | | Adjusted |
| ||||
| | | | | | Operating | | Annualized | | Commenced | | in Initial | | Annualized |
| |||||
| | | % Occupied | | | Portfolio NOI | | NOI | | Leases | | Lease-up (1) | | NOI |
| |||||
| | | | | | | | | | | | | | | | | | | | |
| Commercial (2) | | | | | | | | | | | | | | | | | | | |
| DC |
| 77.0 | % | | $ | 11,767 | | $ | 47,068 | | $ | 48 | | $ | 4,340 | | $ | 51,456 | |
| VA |
| 86.6 | % | |
| 48,115 | |
| 191,230 | |
| 9,012 | |
| 196 | |
| 200,438 | |
| MD |
| 80.4 | % | |
| 4,452 | |
| 17,808 | |
| 2,004 | |
| 4,664 | |
| 24,476 | |
| Total / weighted average |
| 84.4 | % | | $ | 64,334 | | $ | 256,106 | | $ | 11,064 | | $ | 9,200 | | $ | 276,370 | |
| | | | | | | | | | | | | | | | | | | | |
| Multifamily |
|
| | |
|
| |
|
| |
|
| |
|
| |
|
| |
| DC |
| 84.8 | % | | $ | 8,428 | | $ | 33,712 | | $ | 160 | | $ | 5,229 | | $ | 39,101 | |
| VA |
| 90.8 | % | |
| 8,724 | |
| 34,896 | |
| — | |
| — | |
| 34,896 | |
| MD |
| 72.3 | % | |
| 1,492 | |
| 5,968 | |
| 500 | |
| 3,902 | |
| 10,370 | |
| Total / weighted average |
| 86.3 | % | | $ | 18,644 | | $ | 74,576 | | $ | 660 | | $ | 9,131 | | $ | 84,367 | |
| | | | | | | | | | | | | | | | | | | | |
| Total / Weighted Average |
| 85.0 | % | | $ | 82,978 | | $ | 330,682 | | $ | 11,724 | | $ | 18,331 | | $ | 360,737 | |
(1) | Incremental revenue from commercial assets represents the burn-off of Free Rent and is calculated as Free Rent incurred at assets in their initial lease-up for the three months ended June 30, 2021 multiplied by four. Incremental revenue from multifamily assets in their initial lease-up is calculated as the product of units available for occupancy up to 95.0% occupancy and the weighted average monthly in-place rent per unit as of June 30, 2021, multiplied by 12, and assumes no rent growth. Excludes potential revenue from vacant retail space in multifamily assets in their initial lease-up and 900 W Street. We believe the monthly in-place rents per unit for the In-Service multifamily assets continue to be negatively impacted by the COVID-19 pandemic. See page 38 for more detail. As of June 30, 2021, 8001 Woodmont was 4.0% occupied which equates to 13 units, 8 of which are classified as moderately priced dwelling units (“MPDU”) in which rents are restricted to preserve affordability; MPDUs represent 15% of all units at this asset. |
(2) | Crystal City Marriott and 1700 M Street (for which we are the ground lessor) are excluded from the Percent Occupied metric. |
| Page 20 |
SUMMARY & SAME STORE NOI (NON-GAAP) | JUNE 30, 2021 |
| dollars in thousands | | | | 100% Share | | At JBG SMITH Share | | ||||||||||||
| | | | | | | | | | | | | NOI for the Three Months Ended June 30, |
| ||||||
| | | Number of | | Square Feet/ | | Square Feet/ | | % | | % | | | | | | | | | |
| | | Assets | | Units | | Units | | Leased (1) | | Occupied (1) | | 2021 | | 2020 | | % Change | | ||
| Same Store (2) | | | | | | | | | | | | | | | | | | | |
| DC |
| 17 |
| 2,741,524 SF/ |
| 1,918,683 SF/ |
| 86.5 | % | 83.8 | % | $ | 18,105 |
| $ | 19,394 |
| (6.6) | % |
| VA |
| 32 |
| 9,229,441 SF/ |
| 8,296,459 SF/ |
| 89.5 | % | 87.6 | % |
| 54,528 | |
| 52,786 |
| 3.3 | % |
| MD |
| 7 |
| 481,427 SF/ |
| 481,427 SF/ |
| 85.6 | % | 82.5 | % |
| 3,818 | |
| 3,935 |
| (3.0) | % |
| Total / weighted average |
| 56 |
| 12,452,392 SF/ |
| 10,696,569 SF/ |
| 88.6 | % | 86.5 | % | $ | 76,451 | | $ | 76,115 |
| 0.4 | % |
| | | | | | | | | | | | | | | | | | | | |
| Non-Same Store |
|
|
| |
|
|
|
|
|
| |
|
| |
|
|
|
| |
| DC |
| 5 |
| 269,035 SF/ |
| 147,969 SF/ |
| 82.5 | % | 73.7 | % | $ | 2,090 | | $ | (414) |
| 604.8 | % |
| VA |
| 1 |
| 273,650 SF |
| 273,650 SF |
| 98.4 | % | 100.0 | % |
| 2,311 | |
| 52 |
| N/A | |
| MD |
| 2 |
| 300,508 SF/ |
| 300,508 SF/ |
| 67.3 | % | 60.0 | % |
| 2,126 | |
| (568) |
| 474.3 | % |
| Total / weighted average |
| 8 |
| 843,193 SF/ |
| 722,127 SF/ |
| 80.9 | % | 74.1 | % | $ | 6,527 | | $ | (930) |
| 801.8 | % |
| | | | | | | | | | | | | | | | | | | | |
| Total Operating Portfolio |
|
|
| |
|
|
|
|
|
| |
|
| |
|
|
|
| |
| DC |
| 22 |
| 3,010,559 SF/ |
| 2,066,652 SF/ |
| 85.5 | % | 81.3 | % | $ | 20,195 | | $ | 18,980 |
| 6.4 | % |
| VA |
| 33 |
| 9,503,091 SF/ |
| 8,570,109 SF/ |
| 89.7 | % | 87.9 | % |
| 56,839 | |
| 52,838 |
| 7.6 | % |
| MD |
| 9 |
| 781,935 SF/ |
| 781,935 SF/ |
| 79.1 | % | 74.7 | % |
| 5,944 | |
| 3,367 |
| 76.5 | % |
| Operating Portfolio - |
| 64 |
| 13,295,585 SF/ |
| 11,418,696 SF/ |
| 87.7 | % | 85.0 | % | $ | 82,978 | | $ | 75,185 |
| 10.4 | % |
(1) | Crystal City Marriott and 1700 M Street (for which we are the ground lessor) are excluded from the Percent Leased and Percent Occupied metrics. |
(2) | Same Store refers to the pool of assets that were In-Service for the entirety of both periods being compared, which excludes assets for which significant redevelopment, renovation, or repositioning occurred during either of the periods being compared. The Crystal City Marriott generated a $0.1 million loss for the three months ended June 30, 2021 compared to a $0.9 million loss for the three months ended June 30, 2020. |
| Page 21 |
SUMMARY & SAME STORE NOI (NON-GAAP) | JUNE 30, 2021 |
| dollars in thousands | | | | 100% Share | | At JBG SMITH Share | | ||||||||||||
| | | | | | | | | | | | | NOI for the Six Months Ended June 30, |
| ||||||
| | | Number of | | Square Feet/ | | Square Feet/ | | % | | % | | | | | | | | | |
| | | Assets | | Units | | Units | | Leased (1) | | Occupied (1) | | 2021 | | 2020 | | % Change | | ||
| Same Store (2) | | | | | | | | | | | | | | | | | | | |
| DC |
| 17 |
| 2,741,524 SF/ |
| 1,918,683 SF/ |
| 86.5 | % | 83.8 | % | $ | 35,752 |
| $ | 40,694 |
| (12.1) | % |
| VA |
| 32 |
| 9,229,441 SF/ |
| 8,296,459 SF/ |
| 89.5 | % | 87.6 | % |
| 109,349 | |
| 110,571 |
| (1.1) | % |
| MD |
| 7 |
| 481,427 SF/ |
| 481,427 SF/ |
| 85.6 | % | 82.5 | % |
| 7,113 | |
| 8,265 |
| (13.9) | % |
| Total / weighted average |
| 56 |
| 12,452,392 SF/ |
| 10,696,569 SF/ |
| 88.6 | % | 86.5 | % | $ | 152,214 | | $ | 159,530 |
| (4.6) | % |
| | | | | | | | | | | | | | | | | | | | |
| Non-Same Store |
|
|
| |
|
|
|
|
|
| |
|
| |
|
|
|
| |
| DC |
| 5 |
| 269,035 SF/ |
| 147,969 SF/ |
| 82.5 | % | 73.7 | % | $ | 3,175 | | $ | (864) |
| 467.5 | % |
| VA |
| 1 |
| 273,650 SF |
| 273,650 SF |
| 98.4 | % | 100.0 | % |
| 4,481 | |
| 154 |
| N/A | |
| MD |
| 2 |
| 300,508 SF/ |
| 300,508 SF/ |
| 67.3 | % | 60.0 | % |
| 3,834 | |
| (1,097) |
| 449.5 | % |
| Total / weighted average |
| 8 |
| 843,193 SF/ |
| 722,127 SF/ |
| 80.9 | % | 74.1 | % | $ | 11,490 | | $ | (1,807) |
| 735.9 | % |
| | | | | | | | | | | | | | | | | | | | |
| Total Operating Portfolio |
|
|
| |
|
|
|
|
|
| |
|
| |
|
|
|
| |
| DC |
| 22 |
| 3,010,559 SF/ |
| 2,066,652 SF/ |
| 85.5 | % | 81.3 | % | $ | 38,927 | | $ | 39,830 |
| (2.3) | % |
| VA |
| 33 |
| 9,503,091 SF/ |
| 8,570,109 SF/ |
| 89.7 | % | 87.9 | % |
| 113,830 | |
| 110,725 |
| 2.8 | % |
| MD |
| 9 |
| 781,935 SF/ |
| 781,935 SF/ |
| 79.1 | % | 74.7 | % |
| 10,947 | |
| 7,168 |
| 52.7 | % |
| Operating Portfolio - |
| 64 |
| 13,295,585 SF/ |
| 11,418,696 SF/ |
| 87.7 | % | 85.0 | % | $ | 163,704 | | $ | 157,723 |
| 3.8 | % |
| Page 22 |
SUMMARY NOI (NON-GAAP) | JUNE 30, 2021 |
| dollars in thousands | | NOI for the Three Months Ended June 30, 2021 at JBG SMITH Share |
| |||||||||||||
| | | Consolidated | | Unconsolidated | | Commercial | | Multifamily | | Total |
| |||||
| Number of operating assets |
| | 47 |
| | 17 |
| | 43 |
| | 21 |
| | 64 | |
| Property rental (1) | | $ | 107,642 | | $ | 13,579 | | $ | 89,772 | | $ | 31,449 | | $ | 121,221 | |
| Tenant expense reimbursement |
|
| 6,662 |
|
| 758 |
|
| 6,747 |
|
| 673 |
|
| 7,420 | |
| Other revenue (2) | |
| 11,029 | |
| 571 | |
| 8,245 | |
| 3,355 | |
| 11,600 | |
| Total revenue | |
| 125,333 | |
| 14,908 | |
| 104,764 | |
| 35,477 | |
| 140,241 | |
| | | | | | | | | | | | | | | | | |
| Operating expenses | |
| (49,627) | |
| (6,621) | |
| (39,421) | |
| (16,827) | |
| (56,248) | |
| Ground rent expense | |
| (971) | |
| (44) | |
| (1,009) | |
| (6) | |
| (1,015) | |
| Total expenses | |
| (50,598) | |
| (6,665) | |
| (40,430) | |
| (16,833) | |
| (57,263) | |
| | | | | | | | | | | | | | | | | |
| Operating Portfolio NOI (3) | | $ | 74,735 | | $ | 8,243 | | $ | 64,334 | | $ | 18,644 | | $ | 82,978 | |
| | | | | | | | | | | | | | | | | |
| Annualized NOI | | $ | 297,710 | | $ | 32,972 | | $ | 256,106 | | $ | 74,576 | | $ | 330,682 | |
| Additional Information | |
|
| |
|
| |
|
| |
|
| |
|
| |
| Free Rent (at 100% share) | | $ | 8,593 | | $ | 3,248 | | $ | 8,771 | | $ | 3,070 | | $ | 11,841 | |
| Free Rent (at JBG SMITH Share) | | $ | 8,584 | | $ | 1,568 | | $ | 7,352 | | $ | 2,800 | | $ | 10,152 | |
| Annualized Free Rent (at JBG SMITH Share) (4) | | $ | 34,336 | | $ | 6,272 | | $ | 29,408 | | $ | 11,200 | | $ | 40,608 | |
| Payments associated with assumed lease liabilities (at 100% share) | | $ | 703 | | $ | — | | $ | 703 | | $ | — | | $ | 703 | |
| Payments associated with assumed lease liabilities (at JBG SMITH Share) | | $ | 703 | | $ | — | | $ | 703 | | $ | — | | $ | 703 | |
| Annualized payments associated with assumed lease liabilities (at JBG SMITH Share) (5) | | $ | 2,812 | | $ | — | | $ | 2,812 | | $ | — | | $ | 2,812 | |
| % occupied (at JBG SMITH Share) (6) | |
| 85.3 | % |
| 81.7 | % |
| 84.4 | % |
| 86.3 | % |
| 85.0 | % |
| Annualized base rent of signed leases, not commenced (at 100% share) (7) | | $ | 11,076 | | $ | 1,296 | | $ | 11,212 | | $ | 1,160 | | $ | 12,372 | |
| Annualized base rent of signed leases, not commenced (at JBG SMITH Share) (7) | | $ | 11,076 | | $ | 648 | | $ | 11,064 | | $ | 660 | | $ | 11,724 | |
(1) | Property rental revenue excludes straight-line rent adjustments and other GAAP adjustments, and includes payments associated with assumed lease liabilities. |
(2) | Includes $5.2 million of parking revenue at JBG SMITH share. |
(3) | Our National Landing assets generated $45.4 million of NOI for the three months ended June 30, 2021. NOI excludes approximately $4.4 million of related party management fees at JBG SMITH share. See definition of NOI on page 52. |
(4) | Represents JBG SMITH's share of Free Rent for the three months ended June 30, 2021 multiplied by four. |
(5) | Represents JBG SMITH's share of payments associated with assumed lease liabilities for the three months ended June 30, 2021 multiplied by four. |
(6) | Crystal City Marriott and 1700 M Street (for which we are the ground lessor) are excluded from the Percent Occupied metric. |
(7) | Represents monthly base rent before Free Rent and straight-line rent adjustments, plus estimated tenant reimbursements for the month in which the lease commences, multiplied by 12. Includes only leases for office and retail spaces for which rent had not yet commenced as of June 30, 2021. |
| Page 23 |
SUMMARY NOI - COMMERCIAL (NON-GAAP) | JUNE 30, 2021 |
| dollars in thousands | | NOI for the Three Months Ended June 30, 2021 at JBG SMITH Share |
| ||||||||||||||||
| |
| Consolidated |
| Unconsolidated |
| DC |
| VA |
| MD |
| Total |
| ||||||
| Number of operating assets |
| | 32 |
| | 11 |
| | 11 |
| | 29 |
| | 3 |
| | 43 | |
| Property rental (1) | | $ | 78,099 | | $ | 11,673 | | $ | 18,365 | | $ | 64,788 | | $ | 6,619 | | $ | 89,772 | |
| Tenant expense reimbursement | |
| 6,035 | |
| 712 | |
| 2,444 | |
| 4,201 | |
| 102 | |
| 6,747 | |
| Other revenue (2) | |
| 7,699 | |
| 546 | |
| 1,010 | |
| 6,520 | |
| 715 | |
| 8,245 | |
| Total revenue | |
| 91,833 | |
| 12,931 | |
| 21,819 | |
| 75,509 | |
| 7,436 | |
| 104,764 | |
| | | | | | | | | | | | | | | | | | | | |
| Operating expenses | |
| (33,785) | |
| (5,636) | |
| (10,014) | |
| (26,668) | |
| (2,739) | |
| (39,421) | |
| Ground rent expense | |
| (971) | |
| (38) | |
| (38) | |
| (726) | |
| (245) | |
| (1,009) | |
| Total expenses | |
| (34,756) | |
| (5,674) | |
| (10,052) | |
| (27,394) | |
| (2,984) | |
| (40,430) | |
| | | | | | | | | | | | | | | | | | | | |
| Operating Portfolio NOI (3) | | $ | 57,077 | | $ | 7,257 | | $ | 11,767 | | $ | 48,115 | | $ | 4,452 | | $ | 64,334 | |
| | | | | | | | | | | | | | | | | | | | |
| Annualized NOI | | $ | 227,078 | | $ | 29,028 | | $ | 47,068 | | $ | 191,230 | | $ | 17,808 | | $ | 256,106 | |
| Additional Information | |
|
| |
|
| |
|
| |
|
| |
|
| |
|
| |
| Free Rent (at 100% share) | | $ | 5,884 | | $ | 2,887 | | $ | 3,135 | | $ | 4,363 | | $ | 1,273 | | $ | 8,771 | |
| Free Rent (at JBG SMITH Share) | | $ | 5,884 | | $ | 1,468 | | $ | 1,785 | | $ | 4,294 | | $ | 1,273 | | $ | 7,352 | |
| Annualized Free Rent (at JBG SMITH Share) (4) | | $ | 23,536 | | $ | 5,872 | | $ | 7,140 | | $ | 17,176 | | $ | 5,092 | | $ | 29,408 | |
| Payments associated with assumed lease liabilities (at 100% share) | | $ | 703 | | $ | — | | $ | — | | $ | 703 | | $ | — | | $ | 703 | |
| Payments associated with assumed lease liabilities (at JBG SMITH Share) | | $ | 703 | | $ | — | | $ | — | | $ | 703 | | $ | — | | $ | 703 | |
| Annualized payments associated with assumed lease liabilities (at JBG SMITH Share) (5) | | $ | 2,812 | | $ | — | | $ | — | | $ | 2,812 | | $ | — | | $ | 2,812 | |
| % occupied (at JBG SMITH Share) (6) | |
| 83.9 | % |
| 89.3 | % |
| 77.0 | % |
| 86.6 | % |
| 80.4 | % |
| 84.4 | % |
| Annualized base rent of signed leases, not commenced (at 100% share) (7) | | $ | 10,916 | | $ | 296 | | $ | 84 | | $ | 9,124 | | $ | 2,004 | | $ | 11,212 | |
| Annualized base rent of signed leases, not commenced (at JBG SMITH Share) (7) | | $ | 10,916 | | $ | 148 | | $ | 48 | | $ | 9,012 | | $ | 2,004 | | $ | 11,064 | |
(1) | Property rental revenue excludes straight-line rent adjustments and other GAAP adjustments, and includes payments associated with assumed lease liabilities. |
(2) | Includes $3.9 million of parking revenue at JBG SMITH share. |
(3) | Our National Landing assets generated $36.7 million of NOI for the three months ended June 30, 2021. NOI excludes approximately $3.2 million of related party management fees at JBG SMITH share. See definition of NOI on page 52. |
(4) | Represents JBG SMITH's share of Free Rent for the three months ended June 30, 2021 multiplied by four. |
(5) | Represents JBG SMITH's share of payments associated with assumed lease liabilities for the three months ended June 30, 2021 multiplied by four. |
(6) | Crystal City Marriott and 1700 M Street (for which we are the ground lessor) are excluded from the Percent Occupied metric. |
(7) | Represents monthly base rent before Free Rent and straight-line rent adjustments, plus estimated tenant reimbursements for the month in which the lease commences, multiplied by 12. Includes only leases for office and retail spaces for which rent had not yet commenced as of June 30, 2021. |
| Page 24 |
SUMMARY NOI - MULTIFAMILY (NON-GAAP) | JUNE 30, 2021 |
| dollars in thousands | | NOI for the Three Months Ended June 30, 2021 at JBG SMITH Share |
| ||||||||||||||||
| |
| Consolidated |
| Unconsolidated |
| DC |
| VA |
| MD |
| Total |
| ||||||
| Number of operating assets |
| | 15 |
| | 6 |
| | 11 |
| | 4 |
| | 6 |
| | 21 | |
| Property rental (1) | | $ | 29,543 | | $ | 1,906 | | $ | 14,609 | | $ | 14,554 | | $ | 2,286 | | $ | 31,449 | |
| Tenant expense reimbursement | |
| 627 | |
| 46 | |
| 639 | |
| 24 | |
| 10 | |
| 673 | |
| Other revenue (2) | |
| 3,330 | |
| 25 | |
| 1,407 | |
| 1,696 | |
| 252 | |
| 3,355 | |
| Total revenue | |
| 33,500 | |
| 1,977 | |
| 16,655 | |
| 16,274 | |
| 2,548 | |
| 35,477 | |
| | | | | | | | | | | | | | | | | | | | |
| Operating expenses | |
| (15,842) | |
| (985) | |
| (8,227) | |
| (7,550) | |
| (1,050) | |
| (16,827) | |
| Ground rent expense | |
| — | |
| (6) | |
| — | |
| — | |
| (6) | |
| (6) | |
| Total expenses | |
| (15,842) | |
| (991) | |
| (8,227) | |
| (7,550) | |
| (1,056) | |
| (16,833) | |
| | | | | | | | | | | | | | | | | | | | |
| Operating Portfolio NOI (3) | | $ | 17,658 | | $ | 986 | | $ | 8,428 | | $ | 8,724 | | $ | 1,492 | | $ | 18,644 | |
| | | | | | | | | | | | | | | | | | | | |
| Annualized NOI | | $ | 70,632 | | $ | 3,944 | | $ | 33,712 | | $ | 34,896 | | $ | 5,968 | | $ | 74,576 | |
| Additional Information | |
|
| |
|
| |
|
| |
|
| |
|
| |
|
| |
| Free Rent (at 100% share) | | $ | 2,709 | | $ | 361 | | $ | 1,522 | | $ | 1,400 | | $ | 148 | | $ | 3,070 | |
| Free Rent (at JBG SMITH Share) | | $ | 2,700 | | $ | 100 | | $ | 1,341 | | $ | 1,395 | | $ | 64 | | $ | 2,800 | |
| Annualized Free Rent (at JBG SMITH Share) (4) | | $ | 10,800 | | $ | 400 | | $ | 5,364 | | $ | 5,580 | | $ | 256 | | $ | 11,200 | |
| % occupied (at JBG SMITH Share) | |
| 88.2 | % |
| 61.8 | % |
| 84.8 | % |
| 90.8 | % |
| 72.3 | % |
| 86.3 | % |
| Annualized base rent of signed leases, not commenced (at 100% share) (5) | | $ | 160 | | $ | 1,000 | | $ | 160 | | $ | — | | $ | 1,000 | | $ | 1,160 | |
| Annualized base rent of signed leases, not commenced (at JBG SMITH Share) (5) | | $ | 160 | | $ | 500 | | $ | 160 | | $ | — | | $ | 500 | | $ | 660 | |
(1) | Property rental revenue excludes straight-line rent adjustments and other GAAP adjustments, and includes payments associated with assumed lease liabilities. |
(2) | Includes $1.3 million of parking revenue at JBG SMITH share |
(3) | Our National Landing assets generated $8.7 million of NOI for the three months ended June 30, 2021. NOI excludes approximately $1.2 million of related party management fees at JBG SMITH share. See definition of NOI on page 52. |
(4) | Represents JBG SMITH's share of Free Rent for the three months ended June 30, 2021 multiplied by four. |
(5) | Represents monthly base rent before Free Rent and straight-line rent adjustments, plus estimated tenant reimbursements for the month in which the lease commences, multiplied by 12. Includes only leases for office and retail spaces for which rent had not yet commenced as of June 30, 2021. |
| Page 25 |
NOI RECONCILIATIONS (NON-GAAP) | JUNE 30, 2021 |
| dollars in thousands | | Three Months Ended June 30, | | Six Months Ended June 30, |
| ||||||||
| |
| 2021 |
| 2020 | | 2021 |
| 2020 | | ||||
| Net income (loss) attributable to common shareholders | | $ | (2,973) | | $ | (36,780) | | $ | (23,704) | | $ | 6,145 | |
| Add: | | |
| | |
| | |
| | |
| |
| Depreciation and amortization expense | | | 56,678 | | | 52,616 | | | 121,404 | | | 101,105 | |
| General and administrative expense: | | |
| | |
| | |
| | |
| |
| Corporate and other | | | 13,895 | | | 13,216 | | | 26,370 | | | 26,392 | |
| Third-party real estate services | | | 25,557 | | | 29,239 | | | 54,493 | | | 58,053 | |
| Share-based compensation related to Formation Transaction and special equity awards | | | 4,441 | | | 8,858 | | | 9,386 | | | 18,299 | |
| Transaction and Other Costs | | | 2,270 | | | 1,372 | | | 5,960 | | | 6,681 | |
| Interest expense | | | 16,773 | | | 15,770 | | | 33,069 | | | 27,775 | |
| Loss on extinguishment of debt | | | — | | | — | | | — | | | 33 | |
| Income tax expense (benefit) | | | (5) | | | (888) | | | 4,310 | | | (3,233) | |
| Net income (loss) attributable to redeemable noncontrolling interests | | | (345) | | | (3,483) | | | (2,575) | | | 1,767 | |
| Net loss attributable to noncontrolling interests | | | — | | | — | | | (1,108) | | | — | |
| Less: | | |
| | |
| | |
| | |
| |
| Third-party real estate services, including reimbursements revenue | | | 26,745 | | | 27,167 | | | 64,852 | | | 56,883 | |
| Other revenue | | | 1,904 | | | 1,516 | | | 4,090 | | | 3,146 | |
| Income (loss) from unconsolidated real estate ventures, net | | | 3,953 | | | (13,485) | | | 3,010 | | | (16,177) | |
| Interest and other income (loss), net | | | (38) | | | 114 | | | (29) | | | 1,021 | |
| Gain on sale of real estate | | | 11,290 | | | — | | | 11,290 | | | 59,477 | |
| Consolidated NOI | | | 72,437 | | | 64,608 | | | 144,392 | | | 138,667 | |
| NOI attributable to unconsolidated real estate ventures at our share | | | 8,109 | | | 7,495 | | | 15,613 | | | 16,073 | |
| Non-cash rent adjustments (1) | | | (4,088) | | | (1,419) | | | (8,853) | | | (4,964) | |
| Other adjustments (2) | | | 5,191 | | | 3,516 | | | 9,933 | | | 6,330 | |
| Total adjustments | | | 9,212 | | | 9,592 | | | 16,693 | | | 17,439 | |
| NOI | | $ | 81,649 | | $ | 74,200 | | $ | 161,085 | | $ | 156,106 | |
| Less: out-of-service NOI loss (3) | | | (1,329) | | | (1,475) | | | (2,619) | | | (2,857) | |
| Operating Portfolio NOI | | $ | 82,978 | | $ | 75,675 | | $ | 163,704 | | $ | 158,963 | |
| Non-Same Store NOI (4) | | | 6,527 | | | (440) | | | 11,490 | | | (567) | |
| Same Store NOI (5) | | $ | 76,451 | | $ | 76,115 | | $ | 152,214 | | $ | 159,530 | |
| | | | | | | | | | | | | | |
| Change in Same Store NOI | | | 0.4 | % | | | | | (4.6) | % | | | |
| Number of properties in Same Store pool | | | 56 | | | | | | 56 | | | | |
(1) | Adjustment to exclude straight-line rent, above/below market lease amortization and lease incentive amortization. |
(2) | Adjustment to include other revenue and payments associated with assumed lease liabilities related to operating properties and to exclude commercial lease termination revenue and allocated corporate general and administrative expenses to operating properties. |
(3) | Includes the results of our Under-Construction assets, and Near-Term and Future Development Pipelines. |
(4) | Includes the results of properties that were not In-Service for the entirety of both periods being compared and properties for which significant redevelopment, renovation or repositioning occurred during either of the periods being compared. |
(5) | Includes the results of the assets that are owned, operated and In-Service for the entirety of both periods being compared. |
| Page 26 |
LEASING ACTIVITY - OFFICE | JUNE 30, 2021 |
| square feet in thousands |
| Three Months Ended | | | Six Months Ended |
| ||
| | | June 30, 2021 | | | June 30, 2021 |
| ||
| Square feet leased: |
| | | | | |
| |
| At 100% share |
| | 722 | | | | 1,088 | |
| At JBG SMITH Share |
| | 715 | | | | 1,059 | |
| Initial rent (1) | | $ | 44.96 | | | $ | 46.19 | |
| Straight-line rent (2) | | $ | 43.98 | | | $ | 45.38 | |
| Weighted average lease term (years) | |
| 4.2 | | |
| 4.3 | |
| Weighted average Free Rent period (months) | |
| 5.4 | | |
| 5.5 | |
| Second-generation space: | |
| | | |
| | |
| Square feet | |
| 597 | | |
| 917 | |
| Cash basis: | |
|
| | |
|
| |
| Initial rent (1) | | $ | 44.75 | | | $ | 45.82 | |
| Prior escalated rent | | $ | 43.82 | | | $ | 45.70 | |
| % change | |
| 2.1 | % | |
| 0.3 | % |
| GAAP basis: | |
|
| | |
|
| |
| Straight-line rent (2) | | $ | 43.52 | | | $ | 44.76 | |
| Prior straight-line rent | | $ | 42.96 | | | $ | 43.14 | |
| % change | |
| 1.3 | % | |
| 3.8 | % |
| Tenant improvements: | |
|
| | |
|
| |
| Per square foot | | $ | 23.65 | | | $ | 21.92 | |
| Per square foot per annum | | $ | 5.60 | | | $ | 5.16 | |
| % of initial rent | |
| 12.5 | % | |
| 11.2 | % |
| Leasing commissions: | |
|
| | |
|
| |
| Per square foot | | $ | 6.05 | | | $ | 6.63 | |
| Per square foot per annum | | $ | 1.43 | | | $ | 1.56 | |
| % of initial rent | |
| 3.2 | % | |
| 3.4 | % |
Note: At JBG SMITH Share, unless otherwise indicated. The leasing activity and related statistics are based on leases signed during the period and are not intended to coincide with the commencement of property rental revenue in accordance with GAAP. Second-generation space represents square footage that was vacant for less than nine months. Weighted average data is weighted by SF.
(1) | Represents the cash basis weighted average starting rent per square foot, which is generally indicative of market rents. Triple net leases are converted to a gross basis by adding estimated tenant reimbursements to monthly base rent. Most leases include Free Rent and periodic step-ups in rent which are not included in the initial cash basis rent per square foot but are included in the GAAP basis rent per square foot. |
(2) | Represents the GAAP basis weighted average rent per square foot that is recognized over the term of the respective leases, including the effect of Free Rent and fixed step-ups in rent. |
| Page 27 |
NET EFFECTIVE RENT - OFFICE | JUNE 30, 2021 |
| square feet in thousands, dollars per square feet, at JBG SMITH Share | | Three Months Ended |
| ||||||||||||||||
| |
| Five Quarter |
| June 30, 2021 |
| March 31, 2021 |
| December 31, 2020 |
| September 30, 2020 |
| June 30, 2020 |
| ||||||
| Square feet |
| | 314 |
| | 715 |
| | 344 |
| | 209 |
| | 98 |
| | 206 | |
| Weighted average lease term (years) |
| | 4.3 |
| | 4.2 |
| | 4.3 |
| | 4.2 |
| | 5.2 |
| | 4.1 | |
| Initial rent (1) | | $ | 46.32 | | $ | 44.96 | | $ | 48.73 | | $ | 44.50 | | $ | 49.51 | | $ | 47.34 | |
| Base rent per annum (2) | | $ | 50.59 | | $ | 50.38 | | $ | 53.75 | | $ | 45.09 | | $ | 56.78 | | $ | 48.71 | |
| Tenant improvements per annum | |
| (5.19) | |
| (5.60) | |
| (4.26) | |
| (4.14) | |
| (7.90) | |
| (5.11) | |
| Leasing commissions per annum | |
| (1.54) | |
| (1.43) | |
| (1.82) | |
| (1.59) | |
| (1.88) | |
| (1.21) | |
| Free Rent per annum | |
| (4.23) | |
| (4.79) | |
| (5.24) | |
| (2.18) | |
| (4.23) | |
| (2.63) | |
| Net Effective Rent | | $ | 39.64 | | $ | 38.56 | | $ | 42.43 | | $ | 37.18 | | $ | 42.77 | | $ | 39.76 | |
| | | | | | | | | | | | | | | | | | | | |
| | | | | | | | | | | | | | | | | | | | |
| DC | |
|
| |
|
| |
|
| |
|
| |
|
| |
|
| |
| Square feet | |
| 25 | |
| 45 | |
| 22 | |
| 11 | |
| 28 | |
| 21 | |
| Initial rent (1) | | $ | 59.04 | | $ | 62.54 | | $ | 60.21 | | $ | 58.34 | | $ | 60.12 | | $ | 49.12 | |
| Net effective rent | | $ | 49.63 | | $ | 51.57 | | $ | 54.77 | | $ | 52.44 | | $ | 45.97 | | $ | 43.36 | |
| | | | | | | | | | | | | | | | | | | | |
| VA | |
|
| |
|
| |
|
| |
|
| |
|
| |
|
| |
| Square feet | |
| 275 | |
| 651 | |
| 284 | |
| 198 | |
| 70 | |
| 172 | |
| Initial rent (1) | | $ | 44.80 | | $ | 43.53 | | $ | 47.28 | | $ | 43.72 | | $ | 45.29 | | $ | 46.53 | |
| Net effective rent | | $ | 37.15 | | $ | 35.77 | | $ | 39.60 | | $ | 36.77 | | $ | 38.30 | | $ | 38.30 | |
| | | | | | | | | | | | | | | | | | | | |
| MD | |
|
| |
|
| |
|
| |
|
| |
|
| |
|
| |
| Square feet | |
| 14 | |
| 19 | |
| 38 | |
| — | |
| — | |
| 14 | |
| Initial rent (1) | | $ | 53.24 | | $ | 52.57 | | $ | 52.96 | | $ | — | | $ | — | | $ | 54.97 | |
| Net effective rent | | $ | 47.07 | | $ | 40.17 | | $ | 49.40 | | $ | — | | $ | — | | $ | 50.31 | |
Note: Leasing activity and related statistics are based on leases signed during the period and are not intended to coincide with the recognition of property rental revenue in accordance with GAAP. Weighted average data is weighted by SF.
(1) | Represents the cash basis weighted average starting rent per square foot, which is generally indicative of market rents. Triple net leases are converted to a gross basis by adding estimated tenant reimbursements to monthly base rent. Most leases include Free Rent and periodic step-ups in rent which are not included in the initial cash basis rent per square foot. |
(2) | Represents the weighted average base rent before Free Rent, plus estimated tenant reimbursements recognized over the term of the respective leases, including the effect of fixed step-ups in rent, divided by SF, and divided by years of lease term. Triple net leases are converted to a gross basis by adding estimated tenant reimbursements to base rent. Tenant reimbursements are estimated by escalating tenant reimbursements as of the respective reporting period, or management's estimate thereof, by 2.75% annually through the lease expiration year. |
| Page 28 |
LEASE EXPIRATIONS | JUNE 30, 2021 |
| | | | | At JBG SMITH Share | | |||||||||||||
| |
| |
| |
| |
| | |
| |
| | |
| Estimated |
| |
| | | | | | | | | | | | % of | | | | | Annualized |
| |
| | | | | | | % of | | Annualized | | Total | | Annualized | | Rent Per |
| |||
| | | Number | | | | Total | | Rent (1) | | Annualized | | Rent Per | | Square Foot at |
| |||
| Year of Lease Expiration | | of Leases | | Square Feet | | Square Feet | | (in thousands) | | Rent | | Square Foot (1) | | Expiration (1) (2) |
| |||
| Month-to-Month |
| 50 |
| 94,617 |
| 1.0 | % | $ | 1,749 |
| 0.4 | % | $ | 18.48 | | $ | 18.48 | |
| 2021 |
| 64 |
| 489,978 |
| 5.0 | % |
| 21,289 |
| 4.8 | % |
| 47.47 | |
| 47.97 | |
| 2022 |
| 106 |
| 1,008,128 |
| 10.3 | % |
| 43,736 |
| 9.8 | % |
| 43.38 | |
| 43.91 | |
| 2023 |
| 119 |
| 828,417 |
| 8.5 | % |
| 36,138 |
| 8.1 | % |
| 43.62 | |
| 45.60 | |
| 2024 |
| 108 |
| 1,537,667 |
| 15.7 | % |
| 71,937 |
| 16.1 | % |
| 46.78 | |
| 49.17 | |
| 2025 |
| 90 |
| 947,961 |
| 9.7 | % |
| 42,104 |
| 9.4 | % |
| 44.42 | |
| 48.03 | |
| 2026 |
| 73 |
| 411,725 |
| 4.2 | % |
| 18,786 |
| 4.2 | % |
| 45.63 | |
| 51.94 | |
| 2027 |
| 51 |
| 607,209 |
| 6.2 | % |
| 27,961 |
| 6.3 | % |
| 46.05 | |
| 52.03 | |
| 2028 |
| 52 |
| 429,802 |
| 4.4 | % |
| 20,351 |
| 4.6 | % |
| 47.35 | |
| 55.55 | |
| 2029 |
| 38 |
| 441,927 |
| 4.5 | % |
| 23,008 |
| 5.2 | % |
| 52.06 | |
| 60.99 | |
| Thereafter |
| 122 |
| 2,976,693 |
| 30.5 | % |
| 138,988 |
| 31.1 | % |
| 47.31 | |
| 61.33 | |
| Total / Weighted Average |
| 873 |
| 9,774,124 |
| 100.0 | % | $ | 446,047 |
| 100.0 | % | $ | 46.02 | | $ | 52.66 | |
Note: Includes all in-place leases as of June 30, 2021 for office and retail space within our operating portfolio and assuming no exercise of renewal options or early termination rights. The weighted average remaining lease term for the entire portfolio is 6.1 years.
(1) | Annualized Rent and Annualized Rent per Square Foot exclude percentage rent and the square footage of tenants that only pay percentage rent. |
(2) | Represents monthly base rent before Free Rent, plus tenant reimbursements, as of lease expiration multiplied by 12 and divided by SF. Triple net leases are converted to a gross basis by adding tenant reimbursements to monthly base rent. Tenant reimbursements at lease expiration are estimated by escalating tenant reimbursements as of June 30, 2021, or management’s estimate thereof, by 2.75% annually through the lease expiration year. |
| Page 29 |
SIGNED BUT NOT YET COMMENCED LEASES | JUNE 30, 2021 |
Signed But Not Yet Commenced Leases
| in thousands, at JBG SMITH Share | | Total | | | | | | | | | | | | | | | | | | |
| |||
| | | | | Annualized | | | | | | | | | | | | | | | | | | | | |
| | | | | Estimated | | Estimated Rent (1) for the Quarter Ending | | |||||||||||||||||
| Assets |
| C/U (2) |
| Rent (3) |
| September 30, 2021 |
| December 31, 2021 |
| March 31, 2022 |
| June 30, 2022 |
| September 30, 2022 |
| December 31, 2022 |
| |||||||
| | | | | | | | | | | | | | | | | | | | | | | | |
|
| Commercial |
|
|
| |
|
| |
|
| |
|
| |
|
| |
|
| |
|
| |
| |
| Operating |
| C | | $ | 10,916 | | $ | 210 | | $ | 417 | | $ | 1,330 | | $ | 1,969 | | $ | 2,694 | | $ | 2,729 | |
| Operating |
| U | |
| 148 | |
| 24 | |
| 37 | |
| 37 | |
| 37 | |
| 37 | |
| 37 | |
| Total | | | | $ | 11,064 | | $ | 234 | | $ | 454 | | $ | 1,367 | | $ | 2,006 | | $ | 2,731 | | $ | 2,766 | |
| | | | | | | | | | | | | | | | | | | | | | | | | |
| Multifamily | |
| |
|
| |
|
| |
|
| |
|
| |
|
| |
|
| |
|
| |
| Operating | | C | | $ | 160 | | $ | 26 | | $ | 40 | | $ | 40 | | $ | 40 | | $ | 40 | | $ | 40 | |
| Operating | | U | |
| 500 | |
| — | |
| — | |
| 76 | |
| 125 | |
| 125 | |
| 125 | |
| Total | | | | $ | 660 | | $ | 26 | | $ | 40 | | $ | 116 | | $ | 165 | | $ | 165 | | $ | 165 | |
| | | | | | | | | | | | | | | | | | | | | | | | | |
| Total | | | | $ | 11,724 | | $ | 260 | | $ | 494 | | $ | 1,483 | | $ | 2,171 | | $ | 2,896 | | $ | 2,931 | |
Note: Includes only leases for office and retail spaces for which rent had not yet commenced as of June 30, 2021.
(1) | Represents contractual monthly base rent before Free Rent, plus estimated tenant reimbursements for the month in which the lease is estimated to commence, multiplied by the applicable number of months for each quarter based on the lease's estimated commencement date. |
(2) | "C" denotes a consolidated interest. "U" denotes an unconsolidated interest. |
(3) | Represents contractual monthly base rent before Free Rent, plus estimated tenant reimbursements for the month in which the lease is expected to commence, multiplied by 12. |
| Page 30 |
TENANT CONCENTRATION | JUNE 30, 2021 |
dollars in thousands |
|
|
| At JBG SMITH Share |
| |||||||||
| | Tenant | | Number of Leases | | Square Feet | | % of Total Square Feet | | Annualized | | % of Total Annualized Rent |
| |
1 | | U.S. Government (GSA) | | 60 | | 2,256,549 | | 23.1 | % | $ | 91,258 | | 20.5 | % |
2 |
| Amazon | | 5 | | 858,177 |
| 8.8 | % | | 37,443 |
| 8.4 | % |
3 |
| Gartner, Inc | | 1 | | 174,424 |
| 1.8 | % | | 12,331 |
| 2.8 | % |
4 |
| Family Health International | | 3 | | 220,670 |
| 2.3 | % | | 12,142 |
| 2.7 | % |
5 |
| Lockheed Martin Corporation | | 2 | | 232,598 |
| 2.4 | % | | 11,216 |
| 2.5 | % |
6 |
| Arlington County | | 2 | | 235,779 |
| 2.4 | % | | 10,282 |
| 2.3 | % |
7 |
| Booz Allen Hamilton Inc | | 3 | | 159,610 |
| 1.6 | % | | 7,566 |
| 1.7 | % |
8 |
| Greenberg Traurig LLP | | 1 | | 101,602 |
| 1.0 | % | | 7,226 |
| 1.6 | % |
9 |
| Accenture LLP | | 2 | | 116,736 |
| 1.2 | % | | 7,188 |
| 1.6 | % |
10 |
| Public Broadcasting Service | | 1 | | 120,328 |
| 1.2 | % | | 4,575 |
| 1.0 | % |
11 |
| Evolent Health LLC | | 1 | | 90,905 |
| 0.9 | % | | 4,547 |
| 1.0 | % |
12 |
| Goodwin Procter LLP | | 1 | | 51,296 |
| 0.5 | % | | 4,199 |
| 0.9 | % |
13 | | The International Justice Mission | | 1 | | 74,833 | | 0.8 | % | | 4,171 | | 0.9 | % |
14 |
| Conservation International Foundation | | 1 | | 86,981 |
| 0.9 | % | | 4,144 |
| 0.9 | % |
15 |
| Cushman & Wakefield U.S. Inc | | 1 | | 58,641 |
| 0.6 | % | | 4,043 |
| 0.9 | % |
16 |
| The Urban Institute | | 1 | | 68,620 |
| 0.7 | % | | 3,946 |
| 0.9 | % |
17 |
| Host Hotels & Resorts LP | | 1 | | 55,009 |
| 0.6 | % | | 3,862 |
| 0.9 | % |
18 |
| Chemonics International | | 2 | | 82,330 |
| 0.8 | % | | 3,623 |
| 0.8 | % |
19 |
| U.S. Green Building Council | | 1 | | 54,675 |
| 0.6 | % | | 3,535 |
| 0.8 | % |
20 |
| American Diabetes Association | | 1 | | 80,998 |
| 0.8 | % | | 3,489 |
| 0.8 | % |
|
| Other (1) | | 782 | | 4,593,363 |
| 47.0 | % | | 205,261 |
| 46.1 | % |
|
| Total | | 873 | | 9,774,124 |
| 100.0 | % | $ | 446,047 |
| 100.0 | % |
Note: Includes all leases as of June 30, 2021 for which a tenant has taken occupancy for office and retail space within our operating portfolio.
(1) | Includes JBG SMITH's lease for approximately 84,400 SF at 4747 Bethesda Avenue. |
| Page 31 |
INDUSTRY DIVERSITY | JUNE 30, 2021 |
dollars in thousands | | | | At JBG SMITH Share |
| |||||||||
|
| |
| Number of |
| |
| % of Total |
| Annualized |
| % of Total |
| |
| | Industry | | Leases | | Square Feet | | Square Feet | | Rent | | Annualized Rent |
| |
1 |
| Government |
| 71 |
| 2,561,897 |
| 26.2 | % | $ | 104,811 |
| 23.5 | % |
2 |
| Business Services |
| 114 |
| 1,846,871 |
| 18.9 | % |
| 89,415 |
| 20.0 | % |
3 |
| Government Contractors |
| 69 |
| 1,417,313 |
| 14.5 | % |
| 66,298 |
| 14.9 | % |
4 |
| Member Organizations |
| 69 |
| 885,029 |
| 9.1 | % |
| 44,054 |
| 9.9 | % |
5 |
| Real Estate |
| 48 |
| 600,423 |
| 6.1 | % |
| 27,151 |
| 6.1 | % |
6 |
| Legal Services |
| 39 |
| 321,633 |
| 3.3 | % |
| 19,777 |
| 4.4 | % |
7 |
| Health Services |
| 42 |
| 376,453 |
| 3.9 | % |
| 16,035 |
| 3.6 | % |
8 |
| Food and Beverage |
| 115 |
| 249,358 |
| 2.6 | % |
| 14,546 |
| 3.3 | % |
9 |
| Communications |
| 9 |
| 152,502 |
| 1.6 | % |
| 5,962 |
| 1.3 | % |
10 |
| Educational Services |
| 12 |
| 81,562 |
| 0.8 | % |
| 3,613 |
| 0.8 | % |
|
| Other |
| 285 |
| 1,281,083 |
| 13.0 | % |
| 54,385 |
| 12.2 | % |
|
| Total |
| 873 |
| 9,774,124 |
| 100.0 | % | $ | 446,047 |
| 100.0 | % |
Note: Includes all in-place leases as of June 30, 2021 for office and retail space within our operating portfolio.
| Page 32 |
PORTFOLIO SUMMARY | JUNE 30, 2021 |
| | | | | | | | | Potential |
|
| | | Number | | Rentable | | Number of | | Development |
|
| | | of Assets | | Square Feet | | Units (1) | | Density (2) |
|
| | | | | | | | | | |
| Wholly Owned |
|
|
|
|
|
|
|
| |
| Operating |
| 46 |
| 14,702,054 |
| 5,259 |
| — | |
| Under-Construction (3) |
| 1 |
| 633,985 |
| 808 |
| — | |
| Near-Term Development | | 9 | | — | | — | | 4,817,200 | |
| Future Development |
| 15 |
| — |
| — |
| 10,628,100 | |
| Total |
| 71 |
| 15,336,039 |
| 6,067 |
| 15,445,300 | |
| | | | | | | | | | |
| Real Estate Ventures |
|
|
|
|
|
|
|
| |
| Operating |
| 18 |
| 5,295,153 |
| 2,517 |
| — | |
| Near-Term Development |
| 2 |
| — |
| — |
| 419,400 | |
| Future Development |
| 11 |
| — |
| — |
| 4,050,000 | |
| Total |
| 31 |
| 5,295,153 |
| 2,517 |
| 4,469,400 | |
| | | | | | | | | | |
| Total Portfolio | | 102 |
| 20,631,192 |
| 8,584 |
| 19,914,700 | |
| | | | | | | | | | |
| Total Portfolio (at JBG SMITH Share) | | 102 |
| 17,235,093 |
| 6,933 |
| 16,974,600 | |
Note: At 100% share, unless otherwise indicated.
(1) | For Under-Construction assets, represents estimated number of units based on current design plans. |
(2) | Includes estimated potential office, multifamily and retail development density. |
(3) | See footnote (3) on page 40. |
| Page 33 |
PROPERTY TABLE - COMMERCIAL | JUNE 30, 2021 |
|
| |
| |
| |
| |
| |
| |
| |
| |
| |
| |
| |
| | |
| Office |
| | |
| |
| | | | | | | | | | | | | | | | | | | | | | | | | | | Annualized | | Retail |
| ||
| | | | | | | | Same Store (2): | | | | | | | | | | | | | | | | Annualized | | Rent Per | | Annualized |
| |||
| | | | % | | | Q2 2020‑2021 / | | Year Built / | | Total | | Office | | Retail | | % | | Office % | | Retail % | | Rent | | Square | | Rent Per |
| ||||
Commercial Assets | | Submarket | | Ownership | | C/U (1) | | YTD 2020 - 2021 | | Renovated | | Square Feet | | Square Feet | | Square Feet | | Leased | | Occupied | | Occupied | | (in thousands) | | Foot (3) | | Square Foot (4) |
| |||
| | | | | | | | | | | | | | | | | | | | | | | | | | | | | | | | |
DC |
|
|
|
|
|
|
|
|
|
|
|
|
|
|
|
|
|
|
|
|
|
|
| |
|
| |
|
| |
| |
Universal Buildings |
| Uptown |
| 100.0 | % | C |
| Y / Y |
| 1956 / 1999 |
| 659,459 |
| 568,351 | | 91,108 | | 64.7% | | 59.1% | | 99.6% | | $ | 23,447 | | $ | 53.82 | | $ | 59.11 | |
2101 L Street |
| CBD |
| 100.0 | % | C |
| Y / Y |
| 1975 / 2007 |
| 378,400 |
| 347,080 | | 31,320 | | 82.4% | | 81.4% | | 92.6% | |
| 20,781 | |
| 67.63 | |
| 57.46 | |
1730 M Street (5) |
| CBD |
| 100.0 | % | C |
| Y / Y |
| 1964 / 1998 |
| 204,838 |
| 196,820 | | 8,018 | | 86.1% | | 85.5% | | 100.0% | |
| 8,721 | |
| 49.39 | |
| 51.12 | |
1700 M Street |
| CBD |
| 100.0 | % | C |
| Y / Y |
| N/A |
| 34,000 |
| — | | — | | — | | — | | — | |
| — | |
| — | |
| — | |
L’Enfant Plaza Office-East (5) |
| Southwest |
| 49.0 | % | U |
| Y / Y |
| 1972 / 2012 |
| 397,057 |
| 397,057 | | — | | 87.9% | | 87.9% | | — | |
| 18,220 | |
| 52.22 | |
| — | |
L’Enfant Plaza Office-North |
| Southwest |
| 49.0 | % | U |
| Y / Y |
| 1969 / 2014 |
| 298,666 |
| 277,342 | | 21,324 | | 89.9% | | 90.2% | | 87.1% | |
| 12,368 | |
| 47.81 | |
| 22.23 | |
500 L’Enfant Plaza | | Southwest | | 49.0 | % | U | | Y / Y | | 2019 / N/A | | 215,218 | | 215,218 | | — | | 96.1% | | 96.1% | | — | | | 12,267 | | | 59.30 | | | — | |
L’Enfant Plaza Retail (5) |
| Southwest |
| 49.0 | % | U |
| Y / Y |
| 1968 / 2014 |
| 119,291 |
| 16,596 | | 102,695 | | 74.7% | | 100.0% | | 70.6% | |
| 4,972 | |
| 47.17 | |
| 57.77 | |
1900 N Street (5) | | CBD | | 55.0 | % | U | | N / N | | 2019 / N/A | | 269,035 | | 260,742 | | 8,293 | | 74.1% | | 76.4% | | — | | | 13,640 | | | 68.44 | | | — | |
The Foundry |
| Georgetown |
| 9.9 | % | U |
| Y / Y |
| 1973 / 2017 |
| 225,683 |
| 218,829 | | 6,854 | | 89.6% | | 89.3% | | 100.0% | |
| 10,045 | |
| 49.95 | |
| 41.29 | |
1101 17th Street |
| CBD |
| 55.0 | % | U |
| Y / Y |
| 1964 / 1999 |
| 208,912 |
| 199,158 | | 9,754 | | 84.6% | | 83.8% | | 100.0% | |
| 9,647 | |
| 53.64 | |
| 71.14 | |
| | | | | | | | | | | | | | | | | | | | | | | | | | | | | | | | |
VA |
|
|
|
|
|
|
|
|
| |
| |
| | | | | | | | | | |
| | |
| | |
| | |
Courthouse Plaza 1 and 2 (5) |
| Clarendon/Courthouse |
| 100.0 | % | C |
| Y / Y |
| 1989 / 2013 |
| 630,111 |
| 572,918 | | 57,193 | | 82.3% | | 80.3% | | 95.5% | | $ | 22,372 | | $ | 44.77 | | $ | 32.28 | |
1550 Crystal Drive (6) | | National Landing |
| 100.0 | % | C |
| Y / Y |
| 1980 / 2020 |
| 547,565 |
| 449,310 | | 98,255 | | 89.2% | | 90.0% | | 82.5% | |
| 20,481 | |
| 41.15 | |
| 47.48 | |
2121 Crystal Drive |
| National Landing |
| 100.0 | % | C |
| Y / Y |
| 1985 / 2006 |
| 505,349 |
| 505,349 | | — | | 71.3% | | 71.3% | | — | |
| 16,839 | |
| 46.73 | |
| — | |
2345 Crystal Drive |
| National Landing |
| 100.0 | % | C |
| Y / Y |
| 1988 / 2019 |
| 500,256 |
| 492,364 | | 7,892 | | 88.4% | | 77.0% | | 100.0% | |
| 18,260 | |
| 47.80 | |
| 16.17 | |
RTC-West (6) |
| Reston |
| 100.0 | % | C |
| Y / Y |
| 1988 / 2014 |
| 470,055 |
| 430,582 | | 39,473 | | 87.0% | | 86.4% | | 84.8% | |
| 15,758 | |
| 40.89 | |
| 66.82 | |
2231 Crystal Drive |
| National Landing |
| 100.0 | % | C |
| Y / Y |
| 1987 / 2009 |
| 468,200 |
| 416,273 | | 51,927 | | 82.2% | | 79.2% | | 97.4% | |
| 16,983 | |
| 45.71 | |
| 37.89 | |
2011 Crystal Drive |
| National Landing |
| 100.0 | % | C |
| Y / Y |
| 1984 / 2006 |
| 441,184 |
| 434,422 | | 6,762 | | 68.0% | | 63.3% | | 100.0% | |
| 13,475 | |
| 48.52 | |
| 19.23 | |
2451 Crystal Drive |
| National Landing |
| 100.0 | % | C |
| Y / Y |
| 1990 / 2019 |
| 401,902 |
| 389,845 | | 12,057 | | 78.9% | | 78.4% | | 92.6% | |
| 12,779 | |
| 46.32 | |
| 38.23 | |
1235 S. Clark Street |
| National Landing |
| 100.0 | % | C |
| Y / Y |
| 1981 / 2007 |
| 384,445 |
| 336,099 | | 48,346 | | 95.3% | | 94.6% | | 100.0% | |
| 14,823 | |
| 43.10 | |
| 23.10 | |
241 18th Street S. (6) |
| National Landing |
| 100.0 | % | C |
| Y / Y |
| 1977 / 2013 |
| 360,687 |
| 333,604 | | 27,083 | | 96.5% | | 88.8% | | 83.8% | |
| 12,360 | |
| 40.18 | |
| 20.35 | |
251 18th Street S. (6) |
| National Landing |
| 100.0 | % | C |
| Y / Y |
| 1975 / 2013 |
| 337,471 |
| 293,403 | | 44,068 | | 93.9% | | 99.0% | | 60.0% | |
| 13,360 | |
| 43.58 | |
| 26.70 | |
1215 S. Clark Street |
| National Landing |
| 100.0 | % | C |
| Y / Y |
| 1983 / 2016 |
| 336,159 |
| 333,546 | | 2,613 | | 100.0% | | 100.0% | | 100.0% | |
| 11,028 | |
| 32.79 | |
| 35.11 | |
201 12th Street S. |
| National Landing |
| 100.0 | % | C |
| Y / Y |
| 1987 / 2014 |
| 329,607 |
| 318,482 | | 11,125 | | 99.8% | | 99.8% | | 100.0% | |
| 11,926 | |
| 36.07 | |
| 41.90 | |
800 North Glebe Road |
| Ballston |
| 100.0 | % | C |
| Y / Y |
| 2012 / N/A |
| 303,644 |
| 277,397 | | 26,247 | | 98.5% | | 100.0% | | 82.3% | |
| 16,095 | |
| 54.45 | |
| 45.93 | |
2200 Crystal Drive |
| National Landing |
| 100.0 | % | C |
| Y / Y |
| 1968 / 2006 |
| 283,608 |
| 283,608 | | — | | 82.8% | | 82.8% | | — | |
| 10,335 | |
| 44.01 | |
| — | |
1901 South Bell Street (6) |
| National Landing |
| 100.0 | % | C |
| Y / Y |
| 1968 / 2008 |
| 275,037 |
| 275,037 | | — | | 92.1% | | 92.1% | | — | |
| 10,379 | |
| 40.96 | |
| — | |
1225 S. Clark Street |
| National Landing |
| 100.0 | % | C |
| Y / Y |
| 1982 / 2013 |
| 276,594 |
| 263,744 | | 12,850 | | 94.3% | | 94.1% | | 100.0% | |
| 9,889 | |
| 38.69 | |
| 22.53 | |
1770 Crystal Drive | | National Landing | | 100.0 | % | C | | N / N | | 2020 / N/A | | 273,650 | | 259,651 | | 13,999 | | 98.4% | | 100.0% | | 68.5% | | | 11,862 | | | 43.46 | | | 60.36 | |
Crystal City Marriott (345 Rooms) |
| National Landing |
| 100.0 | % | C |
| Y / Y |
| 1968 / 2013 |
| 266,000 |
| — | | — | | — | | — | | — | |
| — | |
| — | |
| — | |
2100 Crystal Drive |
| National Landing |
| 100.0 | % | C |
| Y / Y |
| 1968 / 2006 |
| 253,437 |
| 253,437 | | — | | 100.0% | | 100.0% | | — | |
| 11,404 | |
| 45.00 | |
| — | |
| Page 34 |
PROPERTY TABLE - COMMERCIAL | JUNE 30, 2021 |
|
| |
| |
| |
| |
| |
| |
| |
| |
| |
| |
| |
| | |
| | Office |
| | |
|
| | | | | | | | | | | | | | | | | | | | | | | | | | | | Annualized | | | Retail |
|
| | | | | | | | Same Store (2): | | | | | | | | | | | | | | | | | Annualized | | | Rent Per | | | Annualized |
|
| | | | % | | | | Q2 2020‑2021 / | | Year Built / | | Total | | Office | | Retail | | % | | Office % | | Retail % | | | Rent | | | Square | | | Rent Per |
|
Commercial Assets | | Submarket | | Ownership | | C/U (1) | | YTD 2020 - 2021 | | Renovated | | Square Feet | | Square Feet | | Square Feet | | Leased | | Occupied | | Occupied | | | (in thousands) | | | Foot (3) | | | Square Foot (4) |
|
1800 South Bell Street |
| National Landing |
| 100.0 | % | C |
| Y / Y |
| 1969 / 2019 |
| 206,186 |
| 190,984 | | 15,202 | | 99.2% | | 100.0% | | 88.8% | | $ | 8,215 | | $ | 42.69 | | $ | 4.51 | |
200 12th Street S. |
| National Landing |
| 100.0 | % | C |
| Y / Y |
| 1985 / 2013 |
| 202,708 |
| 202,708 | | — | | 82.6% | | 82.6% | | — | |
| 7,813 | |
| 46.68 | |
| — | |
Crystal Drive Retail |
| National Landing |
| 100.0 | % | C |
| Y / Y |
| 2003 / 2004 |
| 56,965 |
| — | | 56,965 | | 87.9% | | — | | 87.9% | |
| 3,104 | |
| — | |
| 62.00 | |
Crystal City Shops at 2100 (6) |
| National Landing |
| 100.0 | % | C |
| Y / Y |
| 1968 / 2006 |
| 53,174 |
| — | | 53,174 | | 90.4% | | — | | 90.4% | |
| 541 | |
| — | |
| 11.26 | |
2221 S. Clark Street-Office (7) | | National Landing | | 100.0 | % | C |
| Y / Y | | 1964 / 2016 | | 35,182 | | 26,238 | | 8,944 | | — | | — | | — | | | — | | | — | | | — | |
Central Place Tower (5) |
| Rosslyn |
| 50.0 | % | U |
| Y / Y |
| 2018 / N/A |
| 551,794 |
| 524,516 | | 27,278 | | 98.1% | | 98.0% | | 100.0% | |
| 36,340 | |
| 69.13 | |
| 29.02 | |
Stonebridge at Potomac Town |
| Prince William County |
| 10.0 | % | U |
| Y / Y |
| 2012 / N/A |
| 504,327 |
| — | | 504,327 | | 93.7% | | — | | 93.6% | |
| 15,613 | |
| — | |
| 33.08 | |
Rosslyn Gateway-North |
| Rosslyn |
| 18.0 | % | U |
| Y / Y |
| 1996 / 2014 |
| 145,003 |
| 132,249 | | 12,754 | | 75.2% | | 75.5% | | 72.3% | |
| 4,655 | |
| 43.52 | |
| 33.80 | |
Rosslyn Gateway-South |
| Rosslyn |
| 18.0 | % | U |
| Y / Y |
| 1961 / N/A |
| 102,791 |
| 95,207 | | 7,584 | | 75.9% | | 78.7% | | 40.4% | |
| 2,031 | |
| 25.22 | |
| 45.63 | |
| | | | | | | | | | | | | | | | | | | | | | | | | | | | | | | | |
MD |
|
|
|
|
|
|
|
|
| |
| |
| | | | | | | | | | |
| | |
| | |
| | |
4747 Bethesda Avenue (9) | | Bethesda CBD | | 100.0 | % | C | | N / N | | 2019 / N/A | | 300,508 | | 286,199 | | 14,309 | | 98.0% | | 93.2% | | 55.9% | | $ | 18,438 | | $ | 63.80 | | $ | 178.13 | |
7200 Wisconsin Avenue |
| Bethesda CBD |
| 100.0 | % | C |
| Y / Y |
| 1986 / 2015 |
| 268,533 |
| 257,567 | | 10,966 | | 65.7% | | 60.8% | | 100.0% | | | 8,332 | | | 48.38 | | | 69.34 | |
One Democracy Plaza (5) (8) |
| Bethesda- Rock Spring |
| 100.0 | % | C |
| Y / Y |
| 1987 / 2013 |
| 212,894 |
| 210,756 | | 2,138 | | 87.1% | | 87.0% | | 100.0% | |
| 6,029 | |
| 32.50 | |
| 31.81 | |
| | | | | | | | | | | | | | | | | | | | | | | | | | | | | | | | |
Operating - Total / Weighted Average |
|
|
|
|
|
|
|
|
| 13,295,585 |
| 11,542,688 |
| 1,452,897 |
| 86.3% | | 84.9% | | 88.1% | | $ | 515,627 | | $ | 47.83 | | $ | 39.82 | | ||
| | | | | | | | | | | | | | | | | | | | | | | | | | | | | | | | |
| | | | | | | | | | | | | | | | | | | | | | | | | | | | | | | | |
Totals at JBG SMITH Share |
|
|
|
|
|
|
|
|
|
|
|
|
|
|
|
|
|
|
|
|
|
|
| |
|
| |
|
| |
| |
Operating assets |
|
|
|
|
|
|
|
|
|
|
| 11,418,696 |
| 10,227,562 | | 891,134 | | 85.9% | | 84.4% | | 87.0% | | $ | 433,996 | | $ | 46.86 | | $ | 42.91 | |
| Number of Assets and Total Square Feet Reconciliation | | | | |
| ||
| |
| Number of |
| At 100% Share |
| At JBG SMITH Share |
|
| Operating Assets | | Assets | | Square Feet | | Square Feet |
|
| Q1 2021 |
| 42 |
| 13,263,928 |
| 11,387,653 | |
| Placed into service |
| — |
| — |
| — | |
| Dispositions |
| — |
| — |
| — | |
| Out-of-service adjustment |
| — |
| (1,924) |
| (1,924) | |
| Portfolio reclassification (7) | | 1 | | 35,182 | | 35,182 | |
| Building re-measurements |
| — |
| (1,601) |
| (2,215) | |
| | | | | | | | |
| Q2 2021 |
| 43 |
| 13,295,585 |
| 11,418,696 | |
See footnotes on page 36.
| Page 35 |
PROPERTY TABLE - COMMERCIAL | JUNE 30, 2021 |
Footnotes
Note: At 100% share, unless otherwise noted. Excludes our 10% subordinated interest in one commercial building held through a real estate venture in which we have no economic interest.
(1) | "C" denotes a consolidated interest. "U" denotes an unconsolidated interest. |
(2) | "Y" denotes an asset as Same Store and "N" denotes an asset as Non-Same Store. |
(3) | Represents annualized office rent divided by occupied office SF; annualized retail rent and retail SF are excluded from this metric. Annualized Rent and Annualized Rent per Square Foot exclude percentage rent and the square footage of tenants that only pay percentage rent. Occupied office square footage may differ from leased office square footage because leased office square footage includes space for leases that have been signed but the tenant has not yet taken occupancy. |
(4) | Represents annualized retail rent divided by occupied retail SF. Occupied retail square footage may differ from leased retail square footage because leased retail square footage includes space for leases that have been signed but the tenant has not yet taken occupancy. |
(5) | The following assets are subject to ground leases: |
| |
| Ground Lease | |
| Commercial Asset | | Expiration Date |
|
| 1730 M Street (a) |
| 12/31/2118 | |
| L’Enfant Plaza Office - East |
| 11/23/2064 | |
| L’Enfant Plaza Retail |
| 11/23/2064 | |
| 1900 N Street (b) |
| 5/31/2106 | |
| Courthouse Plaza 1 and 2 |
| 1/19/2062 | |
| Central Place Tower (a) (c) |
| 6/2/2102 | |
| One Democracy Plaza |
| 11/17/2084 | |
| | | | |
(a) | The ground lease is recorded as a financing lease for accounting purposes; therefore, any expense is recorded as interest expense and excluded from NOI. |
(b) | Only a portion of the asset is subject to a ground lease. |
(c) | We have an option to purchase the ground lease at a fixed price. |
(6) | The following assets contain space that is held for development or not otherwise available for lease. This out-of-service square footage is excluded from area, leased and occupancy metrics. |
| | | | | Not Available | |
| Commercial Asset |
| In-Service |
| for Lease |
|
| 1550 Crystal Drive | | 547,565 | | 1,721 | |
| RTC - West | | 470,055 | | 17,988 | |
| 241 18th Street S. | | 360,687 | | 2,420 | |
| 251 18th Street S. | | 337,471 | | 1,480 | |
| 1901 South Bell Street | | 275,037 | | 1,924 | |
| Crystal City Shops at 2100 | | 53,174 | | 19,041 | |
(7) | The commercial portion of 2221 S. Clark Street was bifurcated from the operating multifamily portfolio to the operating commercial portfolio during Q2 2021. |
(8) | Not Metro-Served. |
(9) | Includes JBG SMITH's lease for approximately 84,400 SF. |
| Page 36 |
PROPERTY TABLE - MULTIFAMILY | JUNE 30, 2021 |
|
| |
| |
| |
| |
| |
| |
| |
| |
| |
| |
| |
| |
| | |
| | |
| | |
| | | | | | | | | | | | | | | | | | | | | | | | | | | | | | Monthly | | | Monthly |
| | | | | | | | Same Store (2): | | | | Number | | Total | | Multifamily | | Retail | | | | Multifamily | | Retail | | | Annualized | | | Rent | | | Rent Per |
| | | | % | | | | Q2 2020‑2021 / | | Year Built / | | of | | Square | | Square | | Square | | | | % | | % | | | Rent | | | Per | | | Square |
Multifamily Assets | | Submarket | | Ownership | | C/U (1) | | YTD 2020 - 2021 | | Renovated | | Units | | Feet | | Feet | | Feet | | % Leased | | Occupied | | Occupied | | | (in thousands) | | | Unit (3) (4) | | | Foot (4) (5) |
| | | | | | | | | | | | | | | | | | | | | | | | | | | | | | | | | |
DC | |
|
|
|
|
|
|
|
|
|
|
|
|
|
|
|
|
|
|
|
|
|
|
|
| |
|
| |
|
| |
|
West Half |
| Ballpark |
| 100.0 | % | C |
| N / N |
| 2019 / N/A |
| 465 |
| 384,976 |
| 343,089 |
| 41,887 |
| 84.0% | | 77.6% | | 65.6% | | $ | 11,417 | | $ | 2,274 | | $ | 3.35 |
Fort Totten Square |
| Brookland/Fort Totten |
| 100.0 | % | C |
| Y / Y |
| 2015 / N/A |
| 345 |
| 384,956 |
| 254,292 |
| 130,664 |
| 99.6% | | 98.0% | | 100.0% | | | 8,950 | | | 1,755 | | | 2.38 |
WestEnd25 |
| West End |
| 100.0 | % | C |
| Y / Y |
| 2009 / N/A |
| 283 |
| 273,264 |
| 273,264 |
| — |
| 96.8% | | 88.3% | | — | |
| 9,860 | |
| 3,287 | |
| 3.39 |
F1RST Residences |
| Ballpark |
| 100.0 | % | C |
| Y / Y |
| 2017 / N/A |
| 325 |
| 270,928 |
| 249,456 |
| 21,472 |
| 95.8% | | 94.8% | | 72.4% | |
| 9,448 | |
| 2,244 | |
| 2.91 |
1221 Van Street |
| Ballpark |
| 100.0 | % | C |
| Y / Y |
| 2018 / N/A |
| 291 |
| 225,530 |
| 202,715 |
| 22,815 |
| 98.1% | | 94.8% | | 100.0% | |
| 8,315 | |
| 2,142 | |
| 3.07 |
901 W Street | | U Street/Shaw | | 100.0 | % | C | | N / N | | 2019 / N/A | | 161 | | 157,767 | | 135,499 | | 22,268 | | 90.3% | | 88.2% | | 52.4% | | | 4,968 | | | 2,460 | | | 2.96 |
900 W Street | | U Street/Shaw | | 100.0 | % | C | | N / N | | 2019 / N/A | | 95 | | 69,183 | | 69,183 | | — | | 65.3% | | 33.7% | | — | | | 1,707 | | | 4,446 | | | 5.67 |
North End Retail |
| U Street/Shaw |
| 100.0 | % | C |
| Y / Y |
| 2015 / N/A |
| — |
| 27,355 |
| — |
| 27,355 |
| 96.0% | | — | | 96.0% | |
| 1,438 | |
| — | |
| — |
The Gale Eckington |
| Union Market/NoMa/H Street |
| 5.0 | % | U |
| Y / Y |
| 2013/ N/A |
| 603 |
| 466,716 |
| 465,516 |
| 1,200 |
| 96.7% | | 89.6% | | 100.0% | |
| 12,849 | |
| 1,976 | |
| 2.55 |
Atlantic Plumbing |
| U Street/Shaw |
| 64.0 | % | U |
| Y / Y |
| 2015 / N/A |
| 310 |
| 245,527 |
| 221,788 |
| 23,739 |
| 96.8% | | 93.9% | | 97.4% | |
| 9,495 | |
| 2,379 | |
| 3.29 |
| | | | | | | | | | | | | | | | | | | | | | | | | | | | | | | | | |
VA |
|
|
|
|
|
|
|
|
|
|
| |
| |
| |
| |
| | | | | | |
| | |
| | |
| |
RiverHouse Apartments |
| National Landing |
| 100.0 | % | C |
| Y / Y |
| 1960 / 2014 |
| 1,676 |
| 1,327,551 |
| 1,324,889 |
| 2,662 |
| 97.6% | | 94.1% | | 100.0% | | $ | 31,449 | | $ | 1,658 | | $ | 2.10 |
The Bartlett |
| National Landing |
| 100.0 | % | C |
| Y / Y |
| 2016 / N/A |
| 699 |
| 619,372 |
| 577,295 |
| 42,077 |
| 98.0% | | 95.3% | | 100.0% | |
| 21,663 | |
| 2,527 | |
| 3.06 |
220 20th Street |
| National Landing |
| 100.0 | % | C |
| Y / Y |
| 2009 / N/A |
| 265 |
| 271,476 |
| 269,913 |
| 1,563 |
| 98.9% | | 96.2% | | 100.0% | |
| 7,765 | |
| 2,519 | |
| 2.47 |
2221 S. Clark Street- |
| National Landing |
| 100.0 | % | C |
| Y / Y |
| 1964 / 2016 |
| 216 |
| 96,948 |
| 96,948 |
| — |
| 50.5% | | 44.4% | | — | |
| 2,422 | |
| 2,102 | |
| 4.36 |
| | | | | | | | | | | | | | | | | | | | | | | | | | | | | | | | | |
MD |
|
|
|
|
|
|
|
|
|
|
| |
| |
| |
| |
| | | | | | |
| | |
| | |
| |
Falkland Chase-South & West |
| Downtown Silver Spring |
| 100.0 | % | C |
| Y / Y |
| 1938 / 2011 |
| 268 |
| 222,754 |
| 222,754 |
| — |
| 98.1% | | 94.8% | | — | | $ | 5,005 | | $ | 1,642 | | $ | 1.98 |
Falkland Chase-North |
| Downtown Silver Spring |
| 100.0 | % | C |
| Y / Y |
| 1938 / 1986 |
| 170 |
| 112,186 |
| 112,186 |
| — |
| 98.8% | | 92.9% | | — | |
| 2,619 | |
| 1,381 | |
| 2.11 |
Galvan |
| Rockville Pike Corridor |
| 1.8 | % | U |
| Y / Y |
| 2015 / N/A |
| 356 |
| 390,293 |
| 295,033 |
| 95,260 |
| 98.9% | | 97.8% | | 97.1% | |
| 11,138 | |
| 1,780 | |
| 2.15 |
The Alaire (7) |
| Rockville Pike Corridor |
| 18.0 | % | U |
| Y / Y |
| 2010 / N/A |
| 279 |
| 266,673 |
| 251,691 |
| 14,982 |
| 97.4% | | 96.1% | | 90.0% | |
| 6,171 | |
| 1,760 | |
| 1.95 |
The Terano (7) |
| Rockville Pike Corridor |
| 1.8 | % | U |
| Y / Y |
| 2015 / N/A |
| 214 |
| 196,921 |
| 183,496 |
| 13,425 |
| 97.9% | | 96.7% | | 88.8% | |
| 4,670 | |
| 1,723 | |
| 2.01 |
| | | | | | | | | | | | | | | | | | | | | | | | | | | | | | | | | |
Total / Weighted Average |
|
|
|
|
|
|
|
|
|
|
| 7,021 |
| 6,010,376 |
| 5,549,007 |
| 461,369 |
| 95.6% | | 90.7% | | 91.7% | | $ | 171,349 | | $ | 2,041 | | $ | 2.57 |
| | | | | | | | | | | | | | | | | | | | | | | | | | | | | | | | | |
Recently Delivered |
|
|
|
|
|
|
|
|
|
|
|
|
|
|
|
|
|
|
|
|
|
| |
| |
|
| |
|
| |
|
|
| | | | | | | | | | | | | | | | | | | | | | | | | | | | | | | | | |
DC |
|
|
|
|
|
|
|
|
|
|
|
|
|
|
|
|
|
|
|
|
|
| |
| |
|
| |
|
| |
|
|
The Wren (8) | | U Street/Shaw | | 96.1 | % | C | | N / N | | 2020 / N/A | | 433 | | 332,682 | | 289,686 | | 42,996 | | 84.5% | | 70.4% | | 100.0% | | $ | 9,340 | | $ | 2,203 | | $ | 3.36 |
| | | | | | | | | | | | | | | | | | | | | | | | | | | | | | | | | |
MD | | | | | | | | | | | | | | | | | | | | | | | | | | | | | | | | | |
8001 Woodmont (9) | | Bethesda CBD | | 50.0 | % | U | | N/N | | 2021 / N/A | | 322 | | 358,564 | | 338,990 | | 19,574 | | 16.0% | | 4.0% | | 69.7% | | $ | 980 | | $ | 2,220 | | $ | 2.30 |
| | | | | | | | | | | | | | | | | | | | | | | | | | | | | | | | | |
Total / Weighted Average | | |
|
|
|
|
|
|
| 755 |
| 691,246 |
| 628,676 |
| 62,570 | | 49.0% | | 42.1% | | 90.5% | | $ | 10,320 | | $ | 2,204 | | $ | 3.30 | ||
| | | | | | | | | | | | | | | | | | | | | | | | | | | | | | | | | |
Operating - Total / Weighted Average |
|
|
|
|
|
|
|
|
| 7,776 |
| 6,701,622 |
| 6,177,683 |
| 523,939 |
| 90.8% | | 86.0% | | 91.5% | | $ | 181,669 | | $ | 2,049 | | $ | 2.60 | ||
| | | | | | | | | | | | | | | | | | | | | | | | | | | | | | | | | |
Under-Construction |
|
|
|
|
|
|
|
|
|
|
|
|
|
|
|
|
|
|
|
|
|
|
|
| |
|
| |
|
| |
|
|
| | | | | | | | | | | | | | | | | | | | | | | | | | | | | | | | | |
VA |
|
|
|
|
|
|
|
|
|
|
|
|
|
|
|
|
|
| | | | | | | | | | | | | | | |
1900 Crystal Drive (10) |
| National Landing |
| — | | C |
|
|
|
|
| 808 |
| 633,985 |
| 595,315 |
| 38,670 | | | | | | | | | | | | | | | |
| | | | | | | | | | | | | | | | | | | | | | | | | | | | | | | | | |
Total |
|
|
|
|
|
|
|
|
|
|
| 8,584 |
| 7,335,607 |
| 6,772,998 |
| 562,609 |
|
|
|
|
|
|
| |
|
| |
|
| |
|
PROPERTY TABLE - MULTIFAMILY | JUNE 30, 2021 |
|
| |
| |
| |
| |
| |
| |
| |
| |
| |
| |
| |
| |
| | |
| | |
| | |
| | | | | | | | | | | | | | | | | | | | | | | | | | | | | Monthly | | Monthly | ||
| | | | | | | | Same Store (2): | | | | Number | | Total | | Multifamily | | Retail | | | | Multifamily | | Retail | | Annualized | | Rent | | Rent Per | |||
| | | | % | | | | Q2 2020‑2021 / | | Year Built / | | of | | Square | | Square | | Square | | | | % | | % | | Rent | | Per | | Square | |||
Multifamily Assets | | Submarket | | Ownership | | C/U (1) | | YTD 2020 - 2021 | | Renovated | | Units | | Feet | | Feet | | Feet | | % Leased | | Occupied | | Occupied | | (in thousands) | | Unit (3) (4) | | Foot (4) (5) | |||
| | | | | | | | | | | | | | | | | | | | | | | | | | | | | | | | | |
| | | | | | | | | | | | | | | | | | | | | | | | | | | | | | | | | |
Totals at JBG SMITH Share |
|
|
|
|
|
|
|
|
|
|
|
|
|
|
|
|
|
|
|
|
|
|
|
|
| |
|
| |
|
| |
|
| | | | | | | | | | | | | | | | | | | | | | | | | | | | | | | | | |
New In-Service assets (11) | | | | | | | | | | | | 721 | | 611,926 | | 547,771 | | 64,155 | | 83.5% | | 74.2% | | 61.0% | | $ | 18,092 | | $ | 2,453 | | $ | 3.38 |
Other In-Service assets | | | | | | | | | | | | 4,827 | | 4,071,364 | | 3,802,850 | | 268,514 | | 96.7% | | 92.2% | | 97.1% | | | 117,049 | | | 2,039 | | | 2.56 |
In-Service assets |
|
|
|
|
|
|
|
|
|
|
| 5,548 |
| 4,683,290 |
| 4,350,621 |
| 332,669 |
| 95.0% | | 89.8% | | 90.2% | | $ | 135,141 | | $ | 2,084 | | $ | 2.64 |
Recently Delivered assets |
|
|
|
|
|
|
|
|
|
|
| 577 |
| 499,122 |
| 447,999 |
| 51,123 |
| 59.9% | | 51.9% | | 94.2% | |
| 9,470 | |
| 2,203 | |
| 3.32 |
Operating assets |
|
|
|
|
|
|
|
|
|
|
| 6,125 |
| 5,182,412 |
| 4,798,620 |
| 383,792 |
| 91.6% | | 86.3% | | 90.7% | | $ | 144,611 | | $ | 2,091 | | $ | 2.68 |
Under-Construction assets |
|
|
|
|
|
|
|
|
|
|
| 808 |
| 633,985 |
| 595,315 |
| 38,670 |
|
|
|
|
|
| |
|
| |
|
| |
|
|
| Number of Assets and Total Square Feet/Units Reconciliation |
| ||||||
| | | Number of | | At 100% Share | | At JBG SMITH Share |
|
| Operating Assets |
| Assets |
| Square Feet/Units |
| Square Feet/Units |
|
| Q1 2021 |
| 21 |
| 6,781,703 SF/ |
| 5,108,010 SF/ | |
| Acquisitions |
| — |
| — |
| — | |
| Placed into service (9) |
| 1 |
| 358,564 SF/ |
| 179,282 SF/ | |
| Dispositions (12) | | (1) | | (370,850) SF/ | | (37,085) SF/ | |
| Out-of-service adjustment | | — |
| — |
| — | |
| Portfolio reclassification (6) | | — | | (35,182) SF | | (35,182) SF | |
| Building re-measurements | | — |
| (32,613) SF |
| (32,613) SF | |
| | | | | | | | |
| Q2 2021 |
| 21 |
| 6,701,622 SF/ |
| 5,182,412 SF/ | |
Quarterly Rental Revenue and Occupancy Changes - Same Store Multifamily Assets | | | | | | | | | | | | | | | | | | |
| ||||||||
|
|
|
|
|
| Monthly Rent Per Unit (3) |
| Multifamily % Occupied |
| Annualized Rent (in thousands) |
| ||||||||||||||||
| | Number of Assets | | Number of Units | | | Q2 2021 | | | Q2 2020 | | % Change | | Q2 2021 | | Q2 2020 | | % Change | | | Q2 2021 | | | Q2 2020 | | % Change |
|
DC | | 6 |
| 1,473 | | $ | 2,305 | | $ | 2,488 |
| (7.3)% | | 94.1% | | 87.7% | | 6.4% | | $ | 38,323 | | $ | 38,540 |
| (0.6)% | |
VA |
| 3 |
| 2,640 | |
| 1,978 | |
| 2,145 |
| (7.8)% | | 94.6% | | 90.2% | | 4.4% | |
| 59,288 | |
| 61,282 |
| (3.3)% | |
MD |
| 5 |
| 498 | |
| 1,569 | |
| 1,617 |
| (3.0)% | | 94.3% | | 93.2% | | 1.1% | |
| 8,853 | |
| 9,018 |
| (1.8)% | |
Total / Weighted Average |
| 14 |
| 4,611 | | $ | 2,038 | | $ | 2,193 |
| (7.1)% | | 94.4% | | 89.7% | | 4.7% | | $ | 106,464 | | $ | 108,840 |
| (2.2)% | |
Note: At JBG SMITH Share. Includes assets placed In-Service prior to April 1, 2020. Excludes North End Retail and 2221 S. Clark-Residential.
See footnotes on page 39.
PROPERTY TABLE - MULTIFAMILY | JUNE 30, 2021 |
Footnotes
Note: At 100% share, unless otherwise noted.
(1) | "C" denotes a consolidated interest. "U" denotes an unconsolidated interest. |
(2) | "Y" denotes an asset as Same Store and "N" denotes an asset as Non-Same Store. |
(3) | Represents multifamily rent divided by occupied multifamily units; retail rent is excluded from this metric. Occupied units may differ from leased units because leased units include leases that have been signed but have not yet commenced. |
(4) | Excludes North End Retail. |
(5) | Represents multifamily rent divided by occupied multifamily SF; retail rent and retail SF are excluded from this metric. Occupied multifamily square footage may differ from leased multifamily square footage because leased multifamily square footage includes space for leases that have been signed but the tenant has not yet taken occupancy. |
(6) | The commercial portion of 2221 S. Clark Street was bifurcated from the operating multifamily portfolio to the operating commercial portfolio during Q2 2021. |
(7) | The following assets are subject to ground leases: |
|
| Ground Lease |
Multifamily Asset | | Expiration Date |
The Alaire |
| 3/27/2107 |
The Terano |
| 8/5/2112 |
(8) | Ownership percentage reflects expected dilution of JBG SMITH's real estate venture partner as contributions are funded. As of June 30, 2021, our ownership interest was 96.0%. |
(9) | In Q1 2021, we delivered 7900 Wisconsin Avenue. It was rebranded as 8001 Woodmont and placed into service in Q2 2021. |
(10) | See footnote (3) on page 40. |
(11) | New In-Service assets include West Half, 901 W Street and 900 W Street. |
(12) | In May 2021, our unconsolidated real estate venture sold Fairway Apartments for $93.0 million. |
PROPERTY TABLE – UNDER-CONSTRUCTION | JUNE 30, 2021 |
Property Table – Under Construction
| dollars in thousands, except per square foot data | | | | | | | | | | | | | | | | | | | | |
| ||||
| | | | | | | | | | | Schedule (1) | | At JBG SMITH Share | | ||||||||||||
| | | | | | | Estimated | | Estimated | | | | Estimated | | | | | | | Estimated | | Estimated |
| |||
| | | | | % | | Square | | Number of | | Construction | | Completion | | Estimated | | Historical | | Incremental | | Total |
| ||||
| Asset |
| Submarket |
| Ownership | | Feet | | Units | | Start Date | | Date | | Stabilization Date |
| Cost (2) | | Investment | | Investment | | ||||
| | | | | | | | | | | | | | | | | | | | | | | | | | |
| Multifamily | | | | | | | | | | | | | | | | | | | | | | | | | |
| VA |
|
|
|
|
|
|
|
|
|
|
| |
|
|
| |
|
| |
|
| |
|
| |
| 1900 Crystal Drive (3) |
| National Landing |
| — | | 633,985 |
| 808 |
| Q1 2021 |
| | Q1 2024 - Q3 2024 |
| Q1 2026 | | $ | 91,480 | | $ | 330,711 | | $ | 422,191 | |
| | | | | | | | | | | | | | | | | | | | | | | | | | |
| Under-Construction - Total / Weighted Average at JBG SMITH Share | 633,985 |
| 808 |
| Q1 2021 | | | Q1 2024 - Q3 2024 | | Q1 2026 | | $ | 91,480 | | $ | 330,711 | | $ | 422,191 | |
Weighted average Projected NOI Yield at JBG SMITH Share: |
| Multifamily |
| |
Estimated Total Investment (4) |
| | 5.5 | % |
Estimated Incremental Investment |
| | 7.0 | % |
Estimated Stabilized NOI at JBG SMITH Share (dollars in millions) | | $ | 23.1 | |
Note: At 100% share, unless otherwise noted.
(1) | Average dates are weighted by JBG SMITH Share of estimated SF. |
(2) | Historical Cost excludes certain GAAP adjustments, interest and ground lease costs. See definition of Historical Cost on page 52. |
(3) | Through the structuring of the 1900 Crystal Drive transaction, we have the ability to facilitate an exchange out of a non-core asset into 1900 Crystal Drive. We leased the land underlying 1900 Crystal Drive to a lessee, which plans to construct a multifamily asset comprising two towers with ground floor retail. The ground lessee has engaged us to be the development manager for the construction of 1900 Crystal Drive, and separately, we are the lessee in a master lease of the asset. We have an option to acquire the asset until a specified period after completion. In March 2021, the ground lessee entered into a mortgage loan collateralized by the leasehold interest with a maximum principal balance of $227.0 million and an interest rate of LIBOR plus 3.0% per annum. As of June 30, 2021, no proceeds had been received from the mortgage loan. The ground lessee was obligated to invest $17.5 million of equity funding, all of which was funded, and JBG SMITH is obligated to provide the additional project funding through a mezzanine loan to the ground lessee. We determined that 1900 Crystal Drive is a variable interest entity ("VIE") and that we are the primary beneficiary of the VIE. Accordingly, we consolidated the VIE with the lessee's ownership interest shown as "Noncontrolling interests" in our balance sheet as of June 30, 2021. The ground lease, the mezzanine loan and the master lease described above are eliminated in consolidation. 1900 Crystal Drive’s full cost, debt balance and other metrics are included at 100% in the at JBG SMITH Share metrics presented within this Investor Package. |
(4) | Historical Cost of 1900 Crystal Drive includes $22.6 million of design costs, the majority of which were incurred prior to the Formation Transaction, that are not related to the current planned development. Excluding these costs, 1900 Crystal Drive’s Projected NOI Yield on Estimated Total Investment would be 5.8%. |
Property Table – Near-Term Development
| dollars in thousands, except per square foot data | | | | | | | | | |
| ||||||||||
| | | | | | | | | | | | | | | | | | | | |
|
| | | | | | | Earliest | | | | | | | | | | | | | |
|
| | | | | | | Potential | | | | | | | | | | Estimated | | At JBG SMITH Share | | |
| | | | | % | | Construction | | Estimated Potential Development Density (SF) | | Number of | | Historical | | |||||||
| Asset |
| Submarket | | Ownership | | Start Date | | Total |
| Office |
| Multifamily |
| Retail | | Units | | Cost (1) |
| |
| | | | | | | | | | | | | | | | | | | | | |
| DC |
|
|
| | | | |
|
|
|
|
|
|
|
| | |
|
| |
| 5 M Street Southwest |
| Ballpark | | 100.0% | | 2022 | | 705,400 | | — | | 675,400 | | 30,000 | | 615 | | $ | 23,116 | |
| Gallaudet Parcel 1-3 (2) | | Union Market/NoMa/H Street |
| 100.0% | | 2022 | | 818,000 |
| — |
| 756,400 |
| 61,600 |
| 840 | | | 16,509 | |
| VA |
|
|
| | | | | |
|
|
|
|
|
|
| | |
|
| |
| 2000 South Bell Street |
| National Landing |
| 100.0% | | 2022 | | 394,400 |
| — |
| 375,900 |
| 18,500 |
| 365 | |
| 13,143 | |
| 2001 South Bell Street | | National Landing | | 100.0% | | 2022 | | 323,900 | | — | | 312,800 | | 11,100 | | 420 | | | 11,022 | |
| Potomac Yard Landbay F - Block 15 (3) | | National Landing | | 50.0% | | 2022 | | 181,300 | | — | | 164,300 | | 17,000 | | 210 | | | 4,967 | |
| Potomac Yard Landbay F - Block 19 (3) | | National Landing | | 50.0% | | 2022 | | 238,100 | | — | | 214,800 | | 23,300 | | 260 | | | 6,146 | |
| 2250 Crystal Drive | | National Landing | | 100.0% | | 2023 | | 677,100 | | — | | 677,100 | | — | | 825 | | | 18,221 | |
| 223 23rd Street | | National Landing | | 100.0% | | 2023 | | 512,800 | | — | | 512,800 | | — | | 700 | | | 15,631 | |
| 2525 Crystal Drive (4) | | National Landing | | 100.0% | | Pre-lease Dependent | | 750,000 | | 750,000 | | — | | — | | — | | | 11,438 | |
| 101 12th Street | | National Landing | | 100.0% | | Pre-lease Dependent | | 239,600 | | 234,400 | | — | | 5,200 | | — | | | 10,578 | |
| RTC - West Trophy Office | | Reston | | 100.0% | | Pre-lease Dependent | | 396,000 | | 380,000 | | — | | 16,000 | | — | | | 11,502 | |
| | | | | | | | | | | | | | | | | | | | | |
| Total |
| |
| | | | | 5,236,600 |
| 1,364,400 |
| 3,689,500 |
| 182,700 |
| 4,235 | | | | |
| Total at JBG SMITH Share | | | | | | 5,027,000 | | 1,364,400 | | 3,500,000 | | 162,600 | | 4,000 | | $ | 142,273 | | ||
| | | | | | | | | | | | | | | | | | | | | |
| | | | | | | | | | | | | | | | | | | | | |
Note: Represents select assets that have the potential to commence construction over the next three years, subject to receipt of full entitlements, completion of design and market conditions.
(1) | Historical Cost includes certain intangible assets, such as option and transferable density rights values recorded as part of the Formation Transaction; and excludes certain GAAP adjustments, such as capitalized interest and ground lease costs. See definition of Historical Cost on page 52. |
(2) | Controlled through an option to acquire a leasehold interest. As of June 30, 2021, the weighted average remaining term for the option is 2.3 years. |
(3) | In April 2021, we entered into a real estate venture with an institutional investor advised by J.P. Morgan Global Alternatives to design, develop, manage and own approximately 2.0 million SF of new mixed-use development (1.1 million SF of office and 900,000 SF of multifamily) located in Potomac Yard, the southern portion of National Landing. Our venture partner contributed a land site that is entitled for 1.3 million SF of development it controlled at Potomac Yard Landbay F, while we contributed the adjacent land with over 700,000 SF of estimated development capacity at Potomac Yard Landbay G. In addition to our 50.0% ownership in the venture, we will act as pre-developer, developer, property manager and leasing agent for all future commercial and residential properties on the site. As a result of this transaction, our at share ownership of development rights in Potomac Yardi increased by over 285,000 SF, increasing our economic ownership interest in this emerging-growth submarket to 79% of all unencumbered Future Development Pipeline density. We recognized an $11.3 million gain on the land contributed to the real estate venture based on the cash received and the remeasurement of our retained interest in the asset. |
(4) | Estimated Potential Development Density (SF) use is subject to change based on market demand and entitlement. |
PROPERTY TABLE - FUTURE DEVELOPMENT | JUNE 30, 2021 |
Property Table – Future Development
| dollars in thousands, except per square foot data, at JBG SMITH Share | | | | | | Estimated | | | | | | | | Estimated | | Estimated | | | | | | |
| ||||||||
| | | | | | | | | | | | | Commercial | | | | | Estimated | | Capitalized | | Capitalized | | | | | Estimated |
| ||||
| | | | | | | | | | | | | SF / Multifamily | | | | | Remaining | | Cost of SF / | | Cost of | | Estimated | | Total | | |||||
| | | Number of | | Estimated Potential Development Density (SF) | | Units to be | | Historical | | Acquisition | | Units to Be | | Ground Rent | | Total | | Investment | | ||||||||||||
| Region |
| Assets | | Total |
| Office |
| Multifamily |
| Retail | | Replaced (1) | | Cost (2) | | Cost (3) | | Replaced (4) | | Payments (5) | | Investment | | per SF |
| ||||||
| | | | | | | | | | | | | | | | | | | | | | | | | | | | | | | | |
| Owned | | | | | | | | | | | | | | | | | | | | | | | | | | | | | | | |
| DC | | | | | | | | | | | | | | | | | | | | | | | | | | | | | | | |
| DC |
| 6 |
| 1,024,400 |
| 312,100 |
| 703,300 |
| 9,000 |
| — | | $ | 79,889 |
| | N/A | | $ | — | | $ | — | | $ | 79,889 | | $ | 77.99 | |
| VA |
|
|
| |
|
|
|
|
|
|
|
| |
|
|
| |
| |
|
| |
|
| |
|
| |
|
| |
| National Landing (6) |
| 8 |
| 4,141,500 |
| 1,610,800 | | 2,433,000 | | 97,700 |
| 206,186 SF | |
| 172,930 |
| | N/A | |
| 103,000 | |
| — | |
| 275,930 | |
| 66.63 | |
| Reston |
| 3 |
| 2,140,600 |
| 544,800 | | 1,409,800 | | 186,000 |
| — | |
| 67,315 |
| | N/A | |
| — | |
| — | |
| 67,315 | |
| 31.45 | |
| Other VA |
| 3 |
| 148,000 |
| 88,200 | | 54,000 | | 5,800 |
| 21,675 SF | |
| 1,496 |
| | N/A | |
| 3,045 | |
| — | |
| 4,541 | |
| 30.68 | |
| |
| 14 |
| 6,430,100 |
| 2,243,800 |
| 3,896,800 |
| 289,500 |
| 227,861 SF | |
| 241,741 |
| | N/A | |
| 106,045 | |
| — | |
| 347,786 | |
| 54.09 | |
| MD |
|
|
|
|
|
|
|
|
|
|
|
| |
|
|
| |
| |
|
| |
|
| |
|
| |
|
| |
| Silver Spring |
| 1 |
| 1,276,300 |
| — |
| 1,156,300 |
| 120,000 |
| 170 units | |
| 15,128 |
| | N/A | |
| 33,600 | |
| — | |
| 48,728 | |
| 38.18 | |
| Greater Rockville |
| 1 |
| 1,200 |
| — |
| — |
| 1,200 |
| — | |
| 19 |
| | N/A | |
| — | |
| — | |
| 19 | |
| 15.83 | |
| |
| 2 |
| 1,277,500 |
| — |
| 1,156,300 |
| 121,200 |
| 170 units | |
| 15,147 |
| | N/A | |
| 33,600 | |
| — | |
| 48,747 | |
| 38.16 | |
| Total / weighted average |
| 22 |
| 8,732,000 |
| 2,555,900 |
| 5,756,400 |
| 419,700 |
| 227,861 SF / 170 units | | $ | 336,777 |
| | N/A | | $ | 139,645 | | $ | — | | $ | 476,422 | | $ | 54.56 | |
| | | | | | | | | | | | | | | | | | | | | | | | | | | | | | | | |
| Optioned (7) |
|
|
|
|
|
|
|
|
|
|
|
| |
|
|
| |
| |
|
| |
|
| |
|
| |
|
| |
| DC |
|
|
|
|
|
|
|
|
|
|
|
| |
|
|
| |
| |
|
| |
|
| |
|
| |
|
| |
| DC |
| 3 |
| 1,133,600 |
| — |
| 1,013,900 |
| 119,700 |
| — | | $ | 9,039 | | $ | 21,850 | | $ | — | | $ | 29,434 | | $ | 60,323 | | $ | 53.21 | |
| | | | | | | | | | | | | | | | | | | | | | | | | | | | | | | | |
| Held for Sale |
|
|
|
|
|
|
|
|
|
|
|
| |
|
| |
|
| |
|
| |
|
| |
|
| |
|
| |
| VA |
|
|
|
|
|
|
|
|
|
|
|
| |
|
| |
|
| |
|
| |
|
| |
|
| |
|
| |
| National Landing (8) |
| 1 |
| 2,082,000 |
| 2,082,000 |
| — |
| — |
| — | | $ | 76,089 | | | N/A | | $ | — | | $ | — | | $ | 76,089 | | $ | 36.55 | |
| | | | | | | | | | | | | | | | | | | | | | | | | | | | | | | | |
| Total / Weighted Average |
| 26 |
| 11,947,600 |
| 4,637,900 |
| 6,770,300 |
| 539,400 |
| 227,861 SF / 170 units | | $ | 421,905 | | $ | 21,850 | | $ | 139,645 | | $ | 29,434 | | $ | 612,834 | | $ | 51.29 | |
| | | | | | | | | | | | | | | | | | | | | | | | | | | | | | | | |
(1) | Represents management's estimate of the total office and/or retail rentable SF and multifamily units that would need to be redeveloped to access some of the Estimated Potential Development Density. |
(2) | Historical Cost includes certain intangible assets, such as option and transferable density rights values recorded as part of the Formation Transaction; and excludes certain GAAP adjustments, such as capitalized interest and ground lease costs. See definition of Historical Cost on page 52. |
(3) | Represents management's estimate of remaining deposits, option payments, and option strike prices as of June 30, 2021. |
(4) | Capitalized value of estimated commercial SF / multifamily units to be replaced, which generated approximately $2.1 million of NOI for the three months ended June 30, 2021 (included in the NOI of the applicable operating segment), at a 6.0% capitalization rate. |
(5) | Capitalized value of stabilized annual ground rent payments associated with leasehold assets at a 5.0% capitalization rate. One owned parcel and one optioned parcel are leasehold interests with estimated annual stabilized ground rent payments totaling $1.5 million. |
(6) | See footnote (3) on page 41. |
(7) | As of June 30, 2021, the weighted average remaining term for the optioned Future Development Pipeline assets is 3.7 years. |
(8) | Represents the Estimated Potential Development Density that we have under contract for sale to Amazon pursuant to an executed purchase and sale agreement. In March 2019, we entered into an agreement for the sale of Pen Place, a land site with an Estimated Potential Development Density of approximately 2.1 million SF, for approximately $149.9 million. |
DISPOSITION ACTIVITY | JUNE 30, 2021 |
| dollars in thousands, at JBG SMITH Share | | | | | | | | | | | | | | | | | | | | |
|
| | | | | | | | | | | | Total Square Feet/ | | | | | | | | | |
|
| | | | | | | | | | | | Estimated Potential | | | | | | | | | |
|
| | | | | | | | | | |
| Development | | | | | | | | | | |
| | | Ownership | | | | | | | | | Density | | Gross Sales | | Net Cash | | | | | ||
| Assets | | Percentage | | Asset Type | | Location | | Date Disposed | | (Square Feet) | | Price | | Proceeds | | Book Gain |
| ||||
| | | | | | | | | | | | | | | | | | | | | | |
| Q1 2021 | | | | | | | | | | | | | | | | | | | | | |
| None |
| | | |
| | | | |
| | | $ | — | | $ | — | | $ | — | |
| | | | | | | | | | | | | | | | | | | | | | |
| Q2 2021 | | | | | | | | | | | | | | | | | | | | | |
| Fairway Apartments/Fairway Land | | 10.0% | | Multifamily / Future Development | | Reston, VA | | | May 3, 2021 | | 37,085 / 52,620 | | | 9,300 | | | 4,583 | | | 2,094 | |
| Courthouse Metro Land/Courthouse Metro Land – Option | | 18.0% | | Future Development | | Arlington, VA | | | May 19, 2021 | | 62,820 | | | 540 | | | 624 | | | 2,352 | |
| 5615 Fishers Lane | | 18.0% | | Future Development | | Rockville, MD | | | May 27, 2021 | | 19,170 | | | 1,170 | | | 1,099 | | | 743 | |
| | | | | | | | | | | | | | | | | | | | | | |
| Total |
|
|
|
|
|
| |
|
|
| 37,085 / 134,610 | | $ | 11,010 | | $ | 6,306 | | $ | 5,189 | |
Note: As of June 30, 2021, Pen Place was classified as held for sale in our condensed consolidated balance sheet. In March 2019, we entered into an agreement for the sale of Pen Place, a land site with an Estimated Potential Development Density of approximately 2.1 million SF.
DEBT SUMMARY | JUNE 30, 2021 |
| dollars in thousands, at JBG SMITH Share |
| 2021 |
| 2022 |
| 2023 |
| 2024 |
| 2025 |
| Thereafter |
| Total |
| |||||||
| | | | | | | | | | | | | | | | | | | | | | | |
| Consolidated and Unconsolidated Principal Balance | | | | | | | | | | | | | | | | | | | | | | |
| Unsecured Debt: | | | | | | | | | | | | | | | | | | | | | | |
| Revolving credit facility ($1 billion commitment) | | $ | — | | $ | — | | $ | — | | $ | — | | $ | — | | $ | — | | $ | — | |
| Term loans ($400 million commitment) | |
| — | |
| — | |
| 200,000 | |
| 200,000 | |
| — | |
| — | |
| 400,000 | |
| Total unsecured debt | |
| — | |
| — | |
| 200,000 | |
| 200,000 | |
| — | |
| — | |
| 400,000 | |
| Secured Debt: | |
|
| |
|
| |
|
| |
|
| |
|
| |
|
| |
|
| |
| Consolidated principal balance (1) | |
| — | |
| 107,500 | |
| 169,954 | |
| 129,297 | |
| 555,829 | |
| 637,946 | |
| 1,600,526 | |
| Unconsolidated principal balance | |
| — | |
| 126,103 | |
| 109,738 | |
| — | |
| 123,791 | |
| 42,787 | |
| 402,419 | |
| Total secured debt (1) | |
| — | |
| 233,603 | |
| 279,692 | |
| 129,297 | |
| 679,620 | |
| 680,733 | |
| 2,002,945 | |
| | | | | | | | | | | | | | | | | | | | | | | |
| Total Consolidated and Unconsolidated Principal Balance (1) | | $ | — | | $ | 233,603 | | $ | 479,692 | | $ | 329,297 | | $ | 679,620 | | $ | 680,733 | | $ | 2,402,945 | |
| | | | | | | | | | | | | | | | | | | | | | | |
| % of total debt maturing | |
| — | |
| 9.7 | % |
| 20.0 | % |
| 13.7 | % |
| 28.3 | % |
| 28.3 | % |
| 100.0 | % |
| % floating rate (2) | |
| — | |
| 51.6 | % |
| 22.9 | % |
| — | |
| 30.5 | % |
| 82.3 | % |
| 41.5 | % |
| % fixed rate (3) | |
| — | |
| 48.4 | % |
| 77.1 | % |
| 100.0 | % |
| 69.5 | % |
| 17.7 | % |
| 58.5 | % |
| | | | | | | | | | | | | | | | | | | | | | | |
| Weighted Average Interest Rates | |
|
| |
|
| |
|
| |
|
| |
|
| |
|
| |
|
| |
| Variable rate | |
| — | |
| 1.72 | % |
| 3.75 | % |
| — | |
| 1.72 | % |
| 2.25 | % |
| 2.24 | % |
| Fixed rate | |
| — | |
| 3.60 | % |
| 3.75 | % |
| 3.07 | % |
| 4.35 | % |
| 4.25 | % |
| 3.82 | % |
| Total Weighted Average Interest Rates | |
| — | |
| 2.63 | % |
| 3.75 | % |
| 3.07 | % |
| 3.55 | % |
| 2.60 | % |
| 3.17 | % |
| | Credit Facility | |||||||||||
|
| Revolving |
| | |
| | |
| | |
| |
| | Credit | | Tranche A‑1 | | Tranche A‑2 | | Total/Weighted | | ||||
| | Facility | | Term Loan | | Term Loan | | Average | | ||||
Credit limit | | $ | 1,000,000 | | $ | 200,000 | | $ | 200,000 | | $ | 1,400,000 | |
Outstanding principal balance | | $ | — | | $ | 200,000 | | $ | 200,000 | | $ | 400,000 | |
Letters of credit | | $ | 1,466 | | $ | — | | $ | — | | $ | 1,466 | |
Undrawn capacity | | $ | 998,534 | | $ | — | | $ | — | | $ | 998,534 | |
Interest rate spread (4) | |
| 1.05 | % |
| 1.20 | % |
| 1.15 | % |
| 1.18 | % |
All-In interest rate (5) | |
| 1.15 | % |
| 2.59 | % |
| 2.49 | % |
| 2.54 | % |
Initial maturity date | |
| Jan‑25 | |
| Jan‑23 | |
| Jul‑24 | |
| — | |
(1) | In July 2021, we entered into a mortgage loan with a principal balance of $85.0 million, collateralized by 1225 S. Clark Street. The mortgage loan has a seven-year term and an interest rate of L + 1.60% per annum. |
(2) | Floating rate debt includes floating rate loans with interest rate caps. |
(3) | Fixed rate debt includes floating rate loans with interest rate swaps. |
(4) | The interest rate for the revolving credit facility excludes a 0.15% facility fee. |
(5) | The all-in interest rate is inclusive of interest rate swaps. As of June 30, 2021, we had interest rates swaps for the Tranche A-1 Term Loan and the Tranche A-2 Term Loan. |
DEBT BY INSTRUMENT | JUNE 30, 2021 |
| dollars in thousands | | | | | | | Stated | | Interest | | Current | | Initial | | Extended | |
| | | | | Principal | | Interest | | Rate | | Annual | | Maturity | | Maturity |
| |
| Asset | | % Ownership | | Balance | | Rate | | Hedge |
| Interest Rate (1) | | Date | | Date (2) | | |
| | | | | | | | | | | | | | | | |
|
| Consolidated | | | | | | | | | | | | | | | | |
| Credit Facility - Tranche A‑1 Term Loan |
| 100.0 | % |
| 200,000 |
| L + 1.20 | % | Swap |
| 2.59 | % | 01/18/23 |
| 01/18/23 | |
| 2121 Crystal Drive |
| 100.0 | % |
| 131,535 |
| 5.51 | % | Fixed |
| 5.51 | % | 03/01/23 |
| 03/01/23 | |
| Falkland Chase - South & West |
| 100.0 | % |
| 38,419 |
| 3.78 | % | Fixed |
| 3.78 | % | 06/01/23 |
| 06/01/23 | |
| 800 North Glebe Road |
| 100.0 | % |
| 107,500 |
| L + 1.60 | % | Swap |
| 3.60 | % | 06/30/22 |
| 06/30/24 | |
| Credit Facility - Tranche A‑2 Term Loan |
| 100.0 | % |
| 200,000 |
| L + 1.15 | % | Swap |
| 2.49 | % | 07/18/24 |
| 07/18/24 | |
| 2101 L Street |
| 100.0 | % |
| 129,297 |
| 3.97 | % | Fixed |
| 3.97 | % | 08/15/24 |
| 08/15/24 | |
| 201 12th Street S., 200 12th Street S., and 251 18th Street S. |
| 100.0 | % |
| 83,319 |
| 7.94 | % | Fixed |
| 7.94 | % | 01/01/25 |
| 01/01/25 | |
| Credit Facility - Revolving Credit Facility |
| 100.0 | % |
| — |
| L + 1.05 | % | — |
| 1.15 | % | 01/07/25 |
| 01/07/25 | |
| RiverHouse Apartments |
| 100.0 | % |
| 307,710 |
| L + 1.28 | % | Swap |
| 3.47 | % | 04/01/25 |
| 04/01/25 | |
| 1730 M Street |
| 100.0 | % |
| 47,500 |
| L + 1.25 | % | Swap |
| 3.92 | % | 12/21/25 |
| 12/21/25 | |
| 1900 Crystal Drive (3) (4) | | — | | | — | | L + 3.00 | % | — | | 3.25 | % | 04/25/26 | | 04/25/26 | |
| 4747 Bethesda Avenue | | 100.0 | % | | 175,000 | | L + 1.35 | % | Cap | | 1.45 | % | 02/20/27 | | 02/20/27 | |
| RTC - West (4) | | 100.0 | % | | 117,300 | | L + 1.40 | % | — | | 1.65 | % | 04/22/25 | | 04/22/27 | |
| 1235 S. Clark Street |
| 100.0 | % |
| 78,000 |
| 3.94 | % | Fixed |
| 3.94 | % | 11/01/27 |
| 11/01/27 | |
| 1221 Van Street | | 100.0 | % | | 87,253 | | L + 2.51 | % | Cap | | 2.61 | % | 08/01/30 | | 08/01/30 | |
| 220 20th Street | | 100.0 | % | | 80,240 | | L + 2.51 | % | Cap | | 2.61 | % | 08/01/30 | | 08/01/30 | |
| The Bartlett | | 100.0 | % | | 217,453 | | L + 2.51 | % | Cap | | 2.61 | % | 08/01/30 | | 08/01/30 | |
| Total Consolidated Principal Balance (5) |
| | |
| 2,000,526 |
|
|
|
|
|
|
|
|
|
| |
| Premium / (discount) recognized as a result of the Formation Transaction |
| | |
| 739 |
|
|
|
|
|
|
|
|
|
| |
| Deferred financing costs - mortgage loans (6) |
| | |
| (14,268) | | |
|
|
|
|
|
|
|
| |
| Deferred financing costs - credit facility (6) |
| | |
| (7,503) | | |
|
|
|
|
|
|
|
| |
| Total Consolidated Indebtedness (5) | | | | $ | 1,979,494 | | |
|
|
|
|
|
|
|
| |
| | | | | | | | | | | | | | | | | |
| Total Consolidated Indebtedness (net of premium / (discount) and deferred financing costs) | |
|
|
|
|
|
|
|
|
|
|
|
| | ||
| Mortgages payable (5) | | | | $ | 1,591,143 |
|
|
|
|
|
|
|
|
|
| |
| Revolving credit facility | | | |
| — |
| |
|
|
|
|
|
|
|
| |
| Deferred financing costs, net (included in other assets) (6) | | | |
| (9,971) |
|
|
|
|
|
|
|
|
|
| |
| Unsecured term loan | | | |
| 398,322 |
|
|
|
|
|
|
|
|
|
| |
| Total Consolidated Indebtedness (5) | | | | $ | 1,979,494 |
|
|
|
|
|
|
|
|
|
| |
DEBT BY INSTRUMENT | JUNE 30, 2021 |
| dollars in thousands | | | | | | | Stated | | Interest | | Current | | Initial | | Extended | |
| | | | | Principal | | Interest | | Rate | | Annual | | Maturity | | Maturity | | |
| Asset | | % Ownership | | Balance | | Rate | | Hedge |
| Interest Rate (1) | | Date | | Date (2) |
| |
| | | | | | | | | | | | | | | | | |
| Unconsolidated | | | | | | | | | | | | | | | | |
| Atlantic Plumbing | | 64.0 | % |
| 100,000 | | L + 1.50 | % | — |
| 1.60 | % | 11/08/22 | | 11/08/22 | |
| Stonebridge at Potomac Town Center (4) | | 10.0 | % |
| 84,600 | | L + 3.50 | % | — |
| 3.75 | % | 12/10/22 | | 12/10/22 | |
| Galvan | | 1.8 | % |
| 89,500 | | L + 2.20 | % | — |
| 2.30 | % | 03/03/23 | | 03/03/23 | |
| L’Enfant Plaza Office - North, L’Enfant Plaza Office - East, L’Enfant Plaza Retail (7) | | 49.0 | % | $ | 208,984 | | L + 3.65 | % | Cap |
| 3.90 | % | 05/09/23 | | 05/09/24 | |
| Rosslyn Gateway - North, Rosslyn Gateway - South | | 18.0 | % |
| 49,479 | | L + 2.00 | % | Cap |
| 2.10 | % | 08/29/22 | | 08/29/24 | |
| 500 L’Enfant Plaza | | 49.0 | % |
| 80,000 | | L + 1.30 | % | Cap |
| 1.40 | % | 10/25/22 | | 10/25/24 | |
| The Foundry | | 9.9 | % |
| 58,000 | | L + 1.40 | % | Cap |
| 1.50 | % | 12/12/23 | | 12/12/24 | |
| The Alaire | | 18.0 | % |
| 46,568 | | L + 1.82 | % | Cap |
| 1.92 | % | 03/01/25 | | 03/01/25 | |
| 1101 17th Street | | 55.0 | % |
| 60,000 | | L + 1.25 | % | Swap |
| 4.13 | % | 06/13/25 | | 06/13/25 | |
| The Gale Eckington | | 5.0 | % |
| 110,813 | | L + 1.60 | % | Swap |
| 3.56 | % | 07/31/22 | | 07/31/25 | |
| The Terano | | 1.8 | % |
| 34,000 | | L + 1.35 | % | Swap |
| 4.45 | % | 11/09/25 | | 11/09/25 | |
| 8001 Woodmont | | 50.0 | % |
| 85,573 | | 4.82 | % | Fixed |
| 4.82 | % | 01/15/27 | | 01/15/27 | |
| 1900 N Street | | 55.0 | % | | 148,722 | | L + 1.70 | % | Cap | | 1.80 | % | 04/30/25 | | 04/30/27 | |
| Total Unconsolidated Principal Balance | | | |
| 1,156,239 | | |
|
|
|
|
|
|
|
| |
| Deferred financing costs |
| | | | (6,650) | | |
|
|
|
|
|
|
|
| |
| Total Unconsolidated Indebtedness | | | | $ | 1,149,589 | | | | | | | | | | | |
| | | | | | | | | | | | | | | | | |
| Principal Balance at JBG SMITH Share | | | |
|
|
|
|
|
|
|
|
|
|
|
| |
| Consolidated principal balance at JBG SMITH Share (5) |
| | | $ | 2,000,526 |
|
|
|
|
|
|
|
|
|
| |
| Unconsolidated principal balance at JBG SMITH Share | | | |
| 402,419 |
| |
|
|
| |
|
|
|
| |
| Total Consolidated and Unconsolidated Principal Balance at JBG SMITH Share (5) | | | | $ | 2,402,945 |
|
|
|
|
|
|
|
|
|
| |
| | | | | | | | | | | | | | | | | |
| Indebtedness at JBG SMITH Share (net of premium / (discount) and deferred financing costs) |
|
|
|
|
|
|
|
|
|
| | |||||
| Consolidated indebtedness at JBG SMITH Share (5) |
| | | $ | 1,979,494 |
|
|
|
|
|
|
|
|
|
| |
| Unconsolidated indebtedness at JBG SMITH Share | | | | | 399,262 | | | | | | | | | | | |
| Total Consolidated and Unconsolidated Indebtedness at JBG SMITH Share (5) | | | | $ | 2,378,756 | | | | | | | | | | | |
(1) | June 30, 2021 one-month LIBOR of 0.10% applied to loans which are denoted as floating (no swap) or floating with a cap, except as otherwise noted. |
(2) | Represents the maturity date based on execution of all extension options. Many of these extensions are subject to lender covenant tests. |
(3) | In March 2021, we leased the land associated with 1900 Crystal Drive to a lessee which will construct the asset. In March 2021, the ground lessee entered into a mortgage loan collateralized by the asset with a maximum principal balance of $227.0 million. See footnote (3) on page 40 for additional information. |
(4) | The base rate for this loan was 0.25% as of June 30, 2021. |
(5) | In July 2021, we entered into a mortgage loan with a principal balance of $85.0 million, collateralized by 1225 S. Clark Street. The mortgage loan has a seven-year term and an interest rate of L + 1.60% per annum. |
(6) | As of June 30, 2021, net deferred financing costs related to an unfunded mortgage loan totaling $4.2 million and the revolving credit facility totaling $5.8 million were included in "Other assets, net" in our condensed consolidated balance sheet. |
(7) | The base rate for this loan is three-month LIBOR, which was 0.25% as of June 30, 2021. |
CONSOLIDATED REAL ESTATE VENTURES | JUNE 30, 2021 |
Consolidated Real Estate Ventures
| |
| Asset Type |
| City |
| Submarket |
| % Ownership |
| Total Square Feet |
|
| MRP Realty | | | | | | | | | | | |
| The Wren (1) |
| Multifamily |
| Washington, DC |
| U Street/Shaw |
| 96.1 | % | 332,682 | |
| | | | | | | | | | | | |
| Total Consolidated Real Estate Ventures | | | | | | | | |
| 332,682 | |
Note: Total SF at 100% share.
(1) | Ownership percentage reflects expected dilution of JBG SMITH's real estate venture partner as contributions are funded. As of June 30, 2021, JBG SMITH's ownership interest was 96.0%. |
UNCONSOLIDATED REAL ESTATE VENTURES | JUNE 30, 2021 |
Estate Ventures
| |
| Asset Type |
| City |
| Submarket |
| % Ownership |
| Total Square Feet |
|
| Landmark |
|
|
|
|
|
|
|
|
|
| |
| L’Enfant Plaza Office - East |
| Commercial |
| Washington, DC |
| Southwest |
| 49.0 | % | 397,057 | |
| L’Enfant Plaza Office - North |
| Commercial |
| Washington, DC |
| Southwest |
| 49.0 | % | 298,666 | |
| 500 L’Enfant Plaza |
| Commercial |
| Washington, DC |
| Southwest |
| 49.0 | % | 215,218 | |
| L’Enfant Plaza Retail |
| Commercial |
| Washington, DC |
| Southwest |
| 49.0 | % | 119,291 | |
| Rosslyn Gateway - North |
| Commercial |
| Arlington, VA |
| Rosslyn |
| 18.0 | % | 145,003 | |
| Rosslyn Gateway - South |
| Commercial |
| Arlington, VA |
| Rosslyn |
| 18.0 | % | 102,791 | |
| Galvan |
| Multifamily |
| Rockville, MD |
| Rockville Pike Corridor |
| 1.8 | % | 390,293 | |
| The Alaire |
| Multifamily |
| Rockville, MD |
| Rockville Pike Corridor |
| 18.0 | % | 266,673 | |
| The Terano |
| Multifamily |
| Rockville, MD |
| Rockville Pike Corridor |
| 1.8 | % | 196,921 | |
| Rosslyn Gateway - South Land |
| Future Development |
| Arlington, VA |
| Rosslyn |
| 18.0 | % | 498,500 | |
| Rosslyn Gateway - North Land |
| Future Development |
| Arlington, VA |
| Rosslyn |
| 18.0 | % | 311,000 | |
| L’Enfant Plaza Office - Center |
| Future Development |
| Washington, DC |
| Southwest |
| 49.0 | % | 350,000 | |
| 12511 Parklawn Drive |
| Future Development |
| Rockville, MD |
| Rockville Pike Corridor |
| 18.0 | % | 6,500 | |
| | | | | | | | | | | 3,297,913 | |
| | | | | | | | | | | | |
| J.P. Morgan Global Alternatives (1) | | | | | | | | | | | |
| Potomac Yard Landbay F - Block 15 | | Multifamily | | Alexandria, VA | | National Landing | | 50.0 | % | 181,300 | |
| Potomac Yard Landbay F - Block 19 | | Multifamily | | Alexandria, VA | | National Landing | | 50.0 | % | 238,100 | |
| Potomac Yard Landbay G | | Future Development | | Alexandria, VA | | National Landing | | 50.0 | % | 712,000 | |
| Potomac Yard Landbay F | | Future Development | | Alexandria, VA | | National Landing | | 50.0 | % | 901,000 | |
| |
| | | | | | | | | 2,032,400 | |
| | | | | | | | | | | | |
| CBREI Venture |
|
|
|
|
|
|
|
|
|
| |
| Stonebridge at Potomac Town Center |
| Commercial |
| Woodbridge, VA |
| Prince William County |
| 10.0 | % | 504,327 | |
| The Foundry |
| Commercial |
| Washington, DC |
| Georgetown |
| 9.9 | % | 225,683 | |
| The Gale Eckington |
| Multifamily |
| Washington, DC |
| Union Market / NoMa / H Street |
| 5.0 | % | 466,716 | |
| Atlantic Plumbing |
| Multifamily |
| Washington, DC |
| U Street/Shaw |
| 64.0 | % | 245,527 | |
| Stonebridge at Potomac Town Center - Land |
| Future Development |
| Woodbridge, VA |
| Prince William County |
| 10.0 | % | 22,900 | |
| |
| | | | | | | | | 1,465,153 | |
UNCONSOLIDATED REAL ESTATE VENTURES | JUNE 30, 2021 |
| | Asset Type |
| City |
| Submarket |
| % Ownership |
| Total Square Feet |
| | | | | | | | | | |
Canadian Pension Plan Investment Board |
|
|
|
|
|
|
|
|
|
|
1900 N Street |
| Commercial |
| Washington, DC |
| CBD |
| 55.0 | % | 269,035 |
1101 17th Street |
| Commercial |
| Washington, DC |
| CBD |
| 55.0 | % | 208,912 |
|
| | | | | | | | | 477,947 |
| | | | | | | | | | |
Bresler / Brookfield |
|
|
|
|
|
|
|
|
|
|
Waterfront Station |
| Future Development |
| Washington, DC |
| Southwest |
| 2.5 | % | 662,600 |
| | | | | | | | | | |
Brandywine |
|
|
|
|
|
|
|
|
|
|
1250 1st Street |
| Future Development |
| Washington, DC |
| Union Market / NoMa / H Street |
| 30.0 | % | 265,800 |
51 N Street |
| Future Development |
| Washington, DC |
| Union Market / NoMa / H Street |
| 30.0 | % | 177,500 |
50 Patterson Street |
| Future Development |
| Washington, DC |
| Union Market / NoMa / H Street |
| 30.0 | % | 142,200 |
|
| | | | | | | | | 585,500 |
| | | | | | | | | | |
Prudential Global Investment Management |
|
|
|
|
|
|
|
|
|
|
Central Place Tower |
| Commercial |
| Arlington, VA |
| Rosslyn |
| 50.0 | % | 551,794 |
| | | | | | | | | | |
Berkshire Group |
|
|
|
|
|
|
|
|
|
|
8001 Woodmont |
| Multifamily |
| Bethesda, MD |
| Bethesda CBD |
| 50.0 | % | 358,564 |
| | | | | | | | | | |
Total Unconsolidated Real Estate Ventures |
| |
|
|
|
|
|
|
| 9,431,871 |
(1) | J.P. Morgan Global Alternatives is the advisor for an institutional investor. |
DEFINITIONS | JUNE 30, 2021 |
"Annualized Rent" is defined as (i) for commercial assets, or the retail component of a mixed-use asset, the in-place monthly base rent before Free Rent, plus tenant reimbursements as of June 30, 2021, multiplied by 12, and (ii) for multifamily assets, or the multifamily component of a mixed-use asset, the in-place monthly base rent before Free Rent as of June 30, 2021, multiplied by 12. Annualized Rent excludes rent from leases that have been signed but the tenant has not yet taken occupancy. The in-place monthly base rent does not take into consideration temporary rent relief arrangements.
"Annualized Rent per Square Foot" is defined as (i) for commercial assets, annualized office rent divided by occupied office square feet and annualized retail rent divided by occupied retail square feet; and (ii) for multifamily assets, monthly multifamily rent divided by occupied multifamily square feet; annualized retail rent and retail square feet are excluded from this metric. Occupied square footage may differ from leased square footage because leased square footage includes leases that have been signed but have not yet commenced.
"Development Pipeline" refers to the Near-Term Development and Future Development Pipelines.
Earnings Before Interest, Taxes, Depreciation and Amortization ("EBITDA"), EBITDA for Real Estate ("EBITDAre") and "Adjusted EBITDA" are non-GAAP financial measures. EBITDA and EBITDAre are used by management as supplemental operating performance measures, which we believe help investors and lenders meaningfully evaluate and compare our operating performance from period-to-period by removing from our operating results the impact of our capital structure (primarily interest charges from our outstanding debt and the impact of our interest rate swaps) and certain non-cash expenses (primarily depreciation and amortization on our assets). EBITDAre is computed in accordance with the definition established by NAREIT. NAREIT defines EBITDAre as GAAP net income (loss) adjusted to exclude interest expense, income taxes, depreciation and amortization expenses, gains and losses on sales of real estate and impairment write-downs of certain real estate assets and investments in entities when the impairment is directly attributable to decreases in the value of depreciable real estate held by the entity, including our share of such adjustments of unconsolidated real estate ventures. These supplemental measures may help investors and lenders understand our ability to incur and service debt and to make capital expenditures. EBITDA and EBITDAre are not substitutes for net income (loss) (computed in accordance with GAAP) and may not be comparable to similarly titled measures used by other companies.
Adjusted EBITDA represents EBITDAre adjusted for items we believe are not representative of ongoing operating results, such as Transaction and Other Costs, impairment write-downs of right-of-use assets associated with leases in which we are a lessee, gain (loss) on the extinguishment of debt, earnings (losses) and distributions in excess of our investment in unconsolidated real estate ventures, lease liability adjustments and share-based compensation expense related to the Formation Transaction and special equity awards. We believe that adjusting such items not considered part of our comparable operations, provides a meaningful measure to evaluate and compare our performance from period-to-period.
Because EBITDA, EBITDAre and Adjusted EBITDA have limitations as analytical tools, we use EBITDA, EBITDAre and Adjusted EBITDA to supplement GAAP financial measures. Additionally, we believe that users of these measures should consider EBITDA, EBITDAre and Adjusted EBITDA in conjunction with net income (loss) and other GAAP measures in understanding our operating results. A reconciliation of net income (loss) to EBITDA, EBITDAre and Adjusted EBITDA is presented on page 15.
"Estimated Incremental Investment" means management's estimate of the remaining cost to be incurred in connection with the development of an asset as of June 30, 2021, including all remaining acquisition costs, hard costs, soft costs, tenant improvements (excluding Free Rent converted to tenant improvement allowances), leasing costs and other similar costs to develop and stabilize the asset but excluding any financing costs and ground rent expenses. Actual incremental investment may differ substantially from our estimates due to numerous factors, including unanticipated expenses, delays in the estimated start and/or completion date, changes in design and other contingencies.
"Estimated Potential Development Density" reflects management's estimate of developable gross square feet based on our current business plans with respect to real estate owned or controlled as of June 30, 2021. Our current business plans may contemplate development of less than the maximum potential development density for individual assets. As market conditions change, our business plans, and therefore, the Estimated Potential Development Density, could change accordingly. Given timing, zoning requirements and other factors, we make no assurance that Estimated Potential Development Density amounts will become actual density to the extent we complete development of assets for which we have made such estimates.
DEFINITIONS | JUNE 30, 2021 |
"Estimated Total Investment" means, with respect to the development of an asset, the sum of the Historical Cost in such asset and the Estimated Incremental Investment for such asset. Actual total investment may differ substantially from our estimates due to numerous factors, including unanticipated expenses, delays in the estimated start and/or completion date, changes in design and other contingencies.
"Formation Transaction" refers collectively to the spin-off on July 17, 2017 of substantially all of the assets and liabilities of Vornado Realty Trust's Washington, DC segment, which operated as Vornado / Charles E. Smith, and the acquisition of the management business and certain assets and liabilities of The JBG Companies.
"Free Rent" means the amount of base rent and tenant reimbursements that are abated according to the applicable lease agreement(s).
Funds from Operations ("FFO"), "Core FFO" and Funds Available for Distribution ("FAD") are non-GAAP financial measures. FFO is computed in accordance with the definition established by NAREIT in the NAREIT FFO White Paper - 2018 Restatement. NAREIT defines FFO as net income (loss) (computed in accordance with GAAP), excluding depreciation and amortization related to real estate, gains and losses from the sale of certain real estate assets, gains and losses from change in control and impairment write-downs of certain real estate assets and investments in entities when the impairment is directly attributable to decreases in the value of depreciable real estate held by the entity, including our share of such adjustments for unconsolidated real estate ventures.
Core FFO represents FFO adjusted to exclude items (net of tax) which we believe are not representative of ongoing operating results, such as Transaction and Other Costs, impairment write-downs of right-of-use assets associated with leases in which we are a lessee, gains (or losses) on extinguishment of debt, earnings (losses) and distributions in excess of our investment in unconsolidated real estate ventures, share-based compensation expense related to the Formation Transaction and special equity awards, lease liability adjustments, amortization of the management contracts intangible and the mark-to-market of derivative instruments.
FAD represents Core FFO less recurring tenant improvements, leasing commissions and other capital expenditures, net deferred rent activity, third-party lease liability assumption payments, recurring share-based compensation expense, accretion of acquired below-market leases, net of amortization of acquired above-market leases, amortization of debt issuance costs and other non-cash income and charges. FAD is presented solely as a supplemental disclosure that management believes provides useful information as it relates to our ability to fund dividends.
We believe FFO, Core FFO and FAD are meaningful non-GAAP financial measures useful in comparing our levered operating performance from period-to-period and as compared to similar real estate companies because these non-GAAP measures exclude real estate depreciation and amortization expense and other non-comparable income and expenses, which implicitly assumes that the value of real estate diminishes predictably over time rather than fluctuating based on market conditions. FFO, Core FFO and FAD do not represent cash generated from operating activities and are not necessarily indicative of cash available to fund cash requirements and should not be considered as an alternative to net income (loss) (computed in accordance with GAAP) as a performance measure or cash flow as a liquidity measure. FFO, Core FFO and FAD may not be comparable to similarly titled measures used by other companies. A reconciliation of net income (loss) to FFO, Core FFO and FAD is presented on pages 16-17.
"Future Development Pipeline" refers to assets that are development opportunities on which we do not intend to commence construction within the next three years where we (i) own land or control the land through a ground lease or (ii) are under a long-term conditional contract to purchase, or enter into, a leasehold interest with respect to land.
"GAAP" means accounting principles generally accepted in the United States.
"Historical Cost" is a non-GAAP measure which includes the total Historical Cost incurred by JBG SMITH with respect to the development of an asset, including any acquisition costs, hard costs, soft costs, tenant improvements (excluding Free Rent converted to tenant improvement allowances), leasing costs and other similar costs, but excluding any financing costs and ground rent expenses incurred as of June 30, 2021.
"In-Service" refers to commercial or multifamily assets that are at or above 90% leased or have been operating and collecting rent for more than 12 months as of June 30, 2021.
DEFINITIONS | JUNE 30, 2021 |
"JBG SMITH Share" refers to our ownership percentage of consolidated and unconsolidated assets in real estate ventures.
"Metro-Served" means locations, submarkets or assets that are within 0.5 miles of an existing or planned Metro station.
"Monthly Rent Per Unit" represents multifamily rent for the month ended June 30, 2021 divided by occupied units; retail rent is excluded from this metric.
"Near-Term Development Pipeline" refers to select assets that have the potential to commence construction over the next three years, subject to receipt of full entitlements, completion of design and market conditions.
"Net Debt" is a non-GAAP financial measurement. Net Debt represents our total consolidated and unconsolidated indebtedness less cash and cash equivalents at our share. Net Debt is an important component in the calculations of Net Debt to Annualized Adjusted EBITDA and Net Debt / total enterprise value. We believe that Net Debt is a meaningful non-GAAP financial measure useful to investors because we review Net Debt as part of the management of our overall financial flexibility, capital structure and leverage. We may utilize a considerable portion of our cash and cash equivalents at any given time for purposes other than debt reduction. In addition, cash and cash equivalents at our share may not be solely controlled by us. The deduction of cash and cash equivalents at our share from consolidated and unconsolidated indebtedness in the calculation of Net Debt, therefore, should not be understood to mean that it is available exclusively for debt reduction at any given time.
Net Operating Income ("NOI"), "Annualized NOI", "Estimated Stabilized NOI" and "Projected NOI Yield" are non-GAAP financial measures management uses to assess a segment's performance. The most directly comparable GAAP measure is net income (loss) attributable to common shareholders. We use NOI internally as a performance measure and believe NOI provides useful information to investors regarding our financial condition and results of operations because it reflects only property related revenue (which includes base rent, tenant reimbursements and other operating revenue, net of Free Rent and payments associated with assumed lease liabilities) less operating expenses and ground rent, if applicable. NOI also excludes deferred rent, related party management fees, interest expense, and certain other non-cash adjustments, including the accretion of acquired below-market leases and the amortization of acquired above-market leases and below-market ground lease intangibles. Management uses NOI as a supplemental performance measure of our assets and believes it provides useful information to investors because it reflects only those revenue and expense items that are incurred at the asset level, excluding non-cash items. In addition, NOI is considered by many in the real estate industry to be a useful starting point for determining the value of a real estate asset or group of assets. However, because NOI excludes depreciation and amortization and captures neither the changes in the value of our assets that result from use or market conditions, nor the level of capital expenditures and capitalized leasing commissions necessary to maintain the operating performance of our assets, all of which have real economic effect and could materially impact the financial performance of our assets, the utility of NOI as a measure of the operating performance of our assets is limited. NOI presented by us may not be comparable to NOI reported by other REITs that define these measures differently. We believe to facilitate a clear understanding of our operating results, NOI should be examined in conjunction with net income (loss) attributable to common shareholders as presented in our financial statements. NOI should not be considered as an alternative to net income (loss) attributable to common shareholders as an indication of our performance or to cash flows as a measure of liquidity or our ability to make distributions. Annualized NOI, for all assets except Crystal City Marriott, represents NOI for the three months ended June 30, 2021 multiplied by four. Due to seasonality in the hospitality business, Annualized NOI for Crystal City Marriott represents the trailing 12-month NOI as of June 30, 2021. Management believes Annualized NOI provides useful information in understanding our financial performance over a 12-month period, however, investors and other users are cautioned against attributing undue certainty to our calculation of Annualized NOI. Actual NOI for any 12-month period will depend on a number of factors beyond our ability to control or predict, including general capital markets and economic conditions, any bankruptcy, insolvency, default or other failure to pay rent by one or more of our tenants and the destruction of one or more of our assets due to terrorist attack, natural disaster or other casualty, among others. We do not undertake any obligation to update our calculation to reflect events or circumstances occurring after the date of this earnings release. There can be no assurance that the Annualized NOI shown will reflect our actual results of operations over any 12-month period.
This Investor Package also contains management's estimate of stabilized NOI and projections of NOI yield for Under-Construction and Near-Term Development Pipeline assets, which are based on management's estimates of property-related revenue and operating expenses for each asset. These estimates are inherently uncertain and represent management's plans, expectations and beliefs and are subject to numerous assumptions, risks and uncertainties. The property-related revenues and operating expenses for our assets may differ materially from the estimates included in this Investor Package. Management's projections of NOI yield are not projections of our overall financial performance or cash flow, and there can be no assurance that the Projected NOI Yield set forth in this Investor Package will be achieved.
DEFINITIONS | JUNE 30, 2021 |
Projected NOI Yield means our Estimated Stabilized NOI reported as a percentage of (i) Estimated Total Investment and (ii) Estimated Incremental Investment. Actual initial full year stabilized NOI yield may vary from the Projected NOI Yield based on the actual incremental investment to complete the asset and its actual initial full year stabilized NOI, and there can be no assurance that we will achieve the Projected NOI Yields described in this Investor Package.
We do not provide reconciliations for non-GAAP estimates on a future basis, including Estimated Stabilized NOI because we are unable to provide a meaningful or accurate calculation or estimate of reconciling items and the information is not available without unreasonable effort. This inability is due to the inherent difficulty of forecasting the timing and/or amounts of various items that would impact net income (loss). Additionally, no reconciliation of Projected NOI Yield to the most directly comparable GAAP measure is included in this Investor Package because we are unable to quantify certain amounts that would be required to be included in the comparable GAAP financial measures without unreasonable efforts because such data is not currently available or cannot be currently estimated with confidence. Accordingly, we believe such reconciliations would imply a degree of precision that would be confusing or misleading to investors.
"Non-Same Store" refers to all operating assets excluded from the Same Store pool.
"Percent Leased" is based on leases signed as of June 30, 2021, and is calculated as total rentable square feet less rentable square feet available for lease divided by total rentable square feet expressed as a percentage. Out-of-service square feet are excluded from this calculation.
"Percent Occupied" is based on occupied rentable square feet/units as of June 30, 2021, and is calculated as (i) for office and retail space, total rentable square feet less unoccupied square feet divided by total rentable square feet, (ii) for multifamily space, total units less unoccupied units divided by total units, expressed as a percentage. Out-of-service square feet and units are excluded from this calculation.
"Pro Rata Adjusted General and Administrative Expenses", a non-GAAP financial measure, represents general and administrative expenses adjusted for share-based compensation expense related to the Formation Transaction and special equity awards and the general and administrative expenses of our third-party asset management and real estate services business that are directly reimbursed. We believe that adjusting such items not considered part of our comparable operations provides a meaningful measure to assess our general and administrative expenses as compared to similar real estate companies and in general.
"Recently Delivered" refers to commercial and multifamily assets that are below 90% leased and have been delivered within the 12 months ended June 30, 2021.
"Same Store" refers to the pool of assets that were In-Service for the entirety of both periods being compared, except for assets for which significant redevelopment, renovation, or repositioning occurred during either of the periods being compared.
"Second-Generation Lease" is a lease on space that had been vacant for less than nine months.
"Signed But Not Yet Commenced Leases" means leases that, as of June 30, 2021, have been executed but for which rent has not commenced.
"Square Feet" or "SF" refers to the area that can be rented to tenants, defined as (i) for commercial assets, rentable square footage defined in the current lease and for vacant space the rentable square footage defined in the previous lease for that space, (ii) for multifamily assets, management's estimate of approximate rentable square feet, (iii) for Under-Construction assets, management's estimate of approximate rentable square feet based on current design plans as of June 30, 2021, and (iv) for Near-Term and Future Development Pipeline assets, management's estimate of developable gross square feet based on its current business plans with respect to real estate owned or controlled as of June 30, 2021.
"Transaction and Other Costs" include demolition costs, integration and severance costs, pursuit costs related to other completed, potential and pursued transactions, as well as other expenses.
"Under-Construction" refers to assets that were under construction during the three months ended June 30, 2021.
APPENDIX – TRANSACTION AND OTHER COSTS | JUNE 30, 2021 |
| | | Three Months Ended | | |||||||||||||
| dollars in thousands |
| Q2 2021 |
| Q1 2021 |
| Q4 2020 |
| Q3 2020 |
| Q2 2020 | | |||||
| | | | | | | | | | | | | | | | | |
| Transaction and Other Costs |
| |
|
| |
| | |
| | |
| | |
| |
| Demolition costs (1) | | $ | 439 | | $ | 1,008 | | $ | 503 | | $ | 179 | | $ | — | |
| Integration and severance costs | |
| 222 | |
| 240 | |
| 628 | |
| 406 | |
| 1,351 | |
| Completed, potential and pursued transaction expenses (2) | |
| 1,609 | |
| 2,442 | |
| 13 | |
| 260 | |
| 21 | |
| Total | | $ | 2,270 | | $ | 3,690 | | $ | 1,144 | | $ | 845 | | $ | 1,372 | |
(1) | For Q2 2021 and Q1 2021 related to 2000 South Bell Street and 2001 South Bell Street. For Q4 2020 and Q3 2020 related to 223 23rd Street and 2250 Crystal Drive. |
(2) | For Q1 2021, includes $1.1 million of costs incurred in connection with the 1900 Crystal Drive transaction attributable to noncontrolling interests. |
APPENDIX - EBITDA, EBITDAre AND ADJUSTED EBITDA (NON-GAAP) | JUNE 30, 2021 |
Are Appendix – EBITDAAre and Adjusted EBITDA
| | | Three Months Ended | | |||||||||||||
| dollars in thousands |
| Q2 2021 |
| Q1 2021 |
| Q4 2020 |
| Q3 2020 |
| Q2 2020 |
| |||||
| | | | | | | | | | | | | | | | | |
| EBITDA, EBITDAre and Adjusted EBITDA |
| |
|
| |
| | |
| | |
| | |
| |
| Net income (loss) | | $ | (3,318) | | $ | (24,069) | | $ | (50,168) | | $ | (25,005) | | $ | (40,263) | |
| Depreciation and amortization expense | |
| 56,678 | |
| 64,726 | |
| 64,170 | |
| 56,481 | |
| 52,616 | |
| Interest expense (1) | |
| 16,773 | |
| 16,296 | |
| 17,661 | |
| 16,885 | |
| 15,770 | |
| Income tax expense (benefit) | |
| (5) | |
| 4,315 | |
| (544) | |
| (488) | |
| (888) | |
| Unconsolidated real estate ventures allocated share of above adjustments | |
| 10,581 | |
| 10,164 | |
| 10,072 | |
| 9,987 | |
| 10,692 | |
| EBITDA attributable to noncontrolling interests | |
| (41) | |
| 1,071 | |
| (2) | |
| (4) | |
| (6) | |
| EBITDA | | $ | 80,668 | | $ | 72,503 | | $ | 41,189 | | $ | 57,856 | | $ | 37,921 | |
| Gain on sale of real estate | |
| (11,290) | |
| — | |
| — | |
| — | |
| — | |
| (Gain) loss on sale from unconsolidated real estate ventures | |
| (5,189) | |
| — | |
| (826) | |
| — | |
| 2,952 | |
| Real estate impairment loss (2) | | | — | | | — | | | 7,805 | | | — | | | — | |
| Impairment of investment in unconsolidated real estate venture (3) | | | — | | | — | | | — | | | — | | | 6,522 | |
| EBITDAre | | $ | 64,189 | | $ | 72,503 | | $ | 48,168 | | $ | 57,856 | | $ | 47,395 | |
| Transaction and Other Costs (4) | |
| 2,270 | |
| 2,582 | |
| 1,144 | |
| 845 | |
| 1,372 | |
| Impairment loss (2) | | | — | | | — | | | 2,427 | | | — | | | — | |
| Loss on extinguishment of debt | |
| — | |
| — | |
| 29 | |
| — | |
| — | |
| Share-based compensation related to Formation Transaction and special equity awards | |
| 4,441 | |
| 4,945 | |
| 6,246 | |
| 7,133 | |
| 8,858 | |
| Earnings (losses) and distributions in excess of our investment in unconsolidated real estate venture | |
| (92) | |
| (330) | |
| (152) | |
| (436) | |
| (245) | |
| Unconsolidated real estate ventures allocated share of above adjustments | |
| 9 | |
| 31 | |
| 90 | |
| — | |
| 747 | |
| | | | | | | | | | | | | | | | | |
| Adjusted EBITDA | | $ | 70,817 | | $ | 79,731 | | $ | 57,952 | | $ | 65,398 | | $ | 58,127 | |
| | | | | | | | | | | | | | | | | |
| Net Debt to Annualized Adjusted EBITDA (5) | | | 7.6 | x |
| 6.8 | x |
| 9.2 | x |
| 7.7 | x |
| 8.1 | x |
| |
| June 30, 2021 |
| March 31, 2021 |
| December 31, 2020 |
| September 30, 2020 |
| June 30, 2020 |
| |||||
| Net Debt (at JBG SMITH Share) | |
| | |
| | |
| | |
| | |
| |
|
| Consolidated indebtedness (6) | | $ | 1,979,494 | | $ | 1,979,208 | | $ | 1,985,061 | | $ | 2,081,456 | | $ | 2,202,667 | |
| Unconsolidated indebtedness (6) | |
| 399,262 | |
| 401,389 | |
| 395,550 | |
| 393,398 | |
| 411,599 | |
| Total consolidated and unconsolidated indebtedness | |
| 2,378,756 | |
| 2,380,597 | |
| 2,380,611 | |
| 2,474,854 | |
| 2,614,266 | |
| Less: cash and cash equivalents | |
| 217,543 | |
| 223,142 | |
| 241,066 | |
| 465,532 | |
| 724,246 | |
| Net Debt (at JBG SMITH Share) | | $ | 2,161,213 | | $ | 2,157,455 | | $ | 2,139,545 | | $ | 2,009,322 | | $ | 1,890,020 | |
Note: All EBITDA measures as shown above are attributable to OP Units.
(1) | Interest expense includes the amortization of deferred financing costs and the ineffective portion of any interest rate swaps or caps, net of capitalized interest. |
(2) | During Q4 2020, we determined that a commercial asset was impaired due to a decline in the fair value of the asset and recorded an impairment loss of $10.2 million, of which $7.8 million related to real estate. The remaining $2.4 million of the impairment loss was attributable to the right-of-use asset associated with the property’s ground lease. |
(3) | During Q2 2020, we determined that our investment in the venture that owned The Marriott Wardman Park hotel was impaired due to a decline in the fair value of the underlying asset and recorded an impairment loss of $6.5 million, which reduced the net book value of our investment to zero, and we suspended equity loss recognition for the venture after Q2 2020. In Q3 2020, we transferred our interest in this venture to our former venture partner. |
(4) | See page 55 for the components of Transaction and Other Costs. For Q1 2021, excludes $1.1 million of transaction costs attributable to noncontrolling interests. |
(5) | Calculated using the Net Debt below. Adjusted EBITDA is annualized by multiplying by four. |
(6) | Net of premium/discount and deferred financing costs. |
APPENDIX - FFO, CORE FFO AND FAD (NON-GAAP) | JUNE 30, 2021 |
Appendix – FFO, Core FFO and FAD
| |
| Three Months Ended |
| |||||||||||||
| in thousands, except per share data |
| Q2 2021 |
| Q1 2021 |
| Q4 2020 |
| Q3 2020 |
| Q2 2020 |
| |||||
| | | | | | | | | | | | | | | | | |
| FFO and Core FFO | | |
|
| |
|
| |
|
| |
|
| |
| |
| Net income (loss) attributable to common shareholders | | $ | (2,973) | | $ | (20,731) | | $ | (45,655) | | $ | (22,793) | | $ | (36,780) | |
| Net income (loss) attributable to redeemable noncontrolling interests | |
| (345) | |
| (2,230) | |
| (4,513) | |
| (2,212) | |
| (3,483) | |
| Net loss attributable to noncontrolling interests | |
| — | |
| (1,108) | |
| — | |
| — | |
| — | |
| Net income (loss) | |
| (3,318) | |
| (24,069) | |
| (50,168) | |
| (25,005) | |
| (40,263) | |
| Gain on sale of real estate | |
| (11,290) | |
| — | |
| — | |
| — | |
| — | |
| (Gain) loss on sale from unconsolidated real estate ventures | |
| (5,189) | |
| — | |
| (826) | |
| — | |
| 2,952 | |
| Real estate depreciation and amortization | |
| 54,475 | |
| 62,500 | |
| 61,865 | |
| 54,004 | |
| 49,924 | |
| Real estate impairment loss (1) | | | — | | | — | | | 7,805 | | | — | | | — | |
| Impairment of investment in unconsolidated real estate venture (2) | | | — | | | — | | | — | | | — | | | 6,522 | |
| Pro rata share of real estate depreciation and amortization from unconsolidated real estate ventures | |
| 7,277 | |
| 7,311 | |
| 7,219 | |
| 7,350 | |
| 7,498 | |
| FFO attributable to noncontrolling interests | |
| (41) | |
| 1,071 | |
| (2) | |
| (4) | |
| (6) | |
| FFO Attributable to OP Units | | $ | 41,914 | | $ | 46,813 | | $ | 25,893 | | $ | 36,345 | | $ | 26,627 | |
| FFO attributable to redeemable noncontrolling interests | |
| (4,054) | |
| (4,485) | |
| (2,810) | |
| (3,945) | |
| (2,911) | |
| FFO attributable to common shareholders | | $ | 37,860 | | $ | 42,328 | | $ | 23,083 | | $ | 32,400 | | $ | 23,716 | |
| | | | | | | | | | | | | | | | | |
| FFO attributable to OP Units | | $ | 41,914 | | $ | 46,813 | | $ | 25,893 | | $ | 36,345 | | $ | 26,627 | |
| Transaction and Other Costs, net of tax (3) | |
| 2,241 | |
| 2,552 | |
| 1,071 | |
| 798 | |
| 1,212 | |
| Impairment loss (1) | | | — | | | — | | | 2,427 | | | — | | | — | |
| (Gain) loss from mark-to-market on derivative instruments | |
| 46 | |
| (133) | |
| 11 | |
| 203 | |
| 17 | |
| Loss on extinguishment of debt | |
| — | |
| — | |
| 29 | |
| — | |
| — | |
| Earnings (losses) and distributions in excess of our investment in unconsolidated real estate venture | |
| (92) | |
| (330) | |
| (152) | |
| (436) | |
| (245) | |
| Share-based compensation related to Formation Transaction and special equity awards | |
| 4,441 | |
| 4,945 | |
| 6,246 | |
| 7,133 | |
| 8,858 | |
| Amortization of management contracts intangible, net of tax | |
| 1,073 | |
| 1,072 | |
| 1,073 | |
| 1,072 | |
| 1,073 | |
| Unconsolidated real estate ventures allocated share of above adjustments | |
| 6 | |
| (10) | |
| 36 | |
| (55) | |
| 727 | |
| Core FFO Attributable to OP Units | | $ | 49,629 | | $ | 54,909 | | $ | 36,634 | | $ | 45,060 | | $ | 38,269 | |
| Core FFO attributable to redeemable noncontrolling interests | |
| (4,800) | |
| (5,260) | |
| (3,976) | |
| (4,891) | |
| (4,184) | |
| Core FFO attributable to common shareholders | | $ | 44,829 | | $ | 49,649 | | $ | 32,658 | | $ | 40,169 | | $ | 34,085 | |
| FFO per diluted common share | | $ | 0.29 | | $ | 0.32 | | $ | 0.17 | | $ | 0.24 | | $ | 0.18 | |
| Core FFO per diluted common share | | $ | 0.34 | | $ | 0.38 | | $ | 0.25 | | $ | 0.30 | | $ | 0.26 | |
| Weighted average shares - diluted (FFO and Core FFO) | |
| 131,485 | |
| 131,542 | |
| 132,628 | |
| 133,880 | |
| 133,613 | |
See footnotes on page 58.
APPENDIX - FFO, CORE FFO AND FAD (NON-GAAP) | JUNE 30, 2021 |
| in thousands, except per share data |
| Three Months Ended |
| |||||||||||||
| |
| Q2 2021 |
| Q1 2021 |
| Q4 2020 |
| Q3 2020 |
| Q2 2020 |
| |||||
| | | | | | | | | | | | | | | | | |
| FAD | | |
|
| |
|
| |
|
| |
|
| |
| |
| Core FFO attributable to OP Units | | $ | 49,629 | | $ | 54,909 | | $ | 36,634 | | $ | 45,060 | | $ | 38,269 | |
| Recurring capital expenditures and second-generation tenant improvements and leasing commissions (4) | |
| (12,226) | |
| (10,431) | |
| (15,284) | |
| (11,395) | |
| (12,889) | |
| Straight-line and other rent adjustments (5) | |
| (4,088) | |
| (4,765) | |
| 15,433 | |
| (4,935) | |
| (1,418) | |
| Third-party lease liability assumption payments | |
| (703) | |
| (678) | |
| (836) | |
| (784) | |
| (780) | |
| Share-based compensation expense | |
| 9,045 | |
| 8,070 | |
| 6,496 | |
| 7,642 | |
| 11,757 | |
| Amortization of debt issuance costs | |
| 1,096 | |
| 1,105 | |
| 1,059 | |
| 829 | |
| 673 | |
| Unconsolidated real estate ventures allocated share of above adjustments | |
| (1,333) | |
| (1,326) | |
| 1,265 | |
| (1,687) | |
| (695) | |
| Non-real estate depreciation and amortization | |
| 727 | |
| 750 | |
| 829 | |
| 1,002 | |
| 1,215 | |
| FAD available to OP Units (A) | | $ | 42,147 | | $ | 47,634 | | $ | 45,596 | | $ | 35,732 | | $ | 36,132 | |
| Distributions to common shareholders and unitholders (B) | | $ | 33,511 | | $ | 35,435 | | $ | 33,362 | | $ | 33,743 | | $ | 33,970 | |
| FAD Payout Ratio (B÷A) (6) | | | 79.5 | % |
| 74.4 | % |
| 73.2 | % |
| 94.4 | % |
| 94.0 | % |
| | | | | | | | | | | | | | | | | |
| Capital Expenditures | |
|
| |
|
| |
|
| |
|
| |
|
| |
| Maintenance and recurring capital expenditures | | $ | 4,376 | | $ | 3,926 | | $ | 6,325 | | $ | 3,096 | | $ | 6,541 | |
| Share of maintenance and recurring capital expenditures from unconsolidated real estate ventures | |
| 324 | |
| 47 | |
| 186 | |
| 327 | |
| 360 | |
| Second-generation tenant improvements and leasing commissions | |
| 7,454 | |
| 6,064 | |
| 8,773 | |
| 6,779 | |
| 5,613 | |
| Share of second-generation tenant improvements and leasing commissions from unconsolidated real estate ventures | |
| 72 | |
| 394 | |
| — | |
| 1,193 | |
| 375 | |
| Recurring capital expenditures and second-generation tenant improvements and leasing commissions | |
| 12,226 | |
| 10,431 | |
| 15,284 | |
| 11,395 | |
| 12,889 | |
| Non-recurring capital expenditures | |
| 4,352 | |
| 2,836 | |
| 6,380 | |
| 4,840 | |
| 6,240 | |
| Share of non-recurring capital expenditures from unconsolidated real estate ventures | |
| 56 | |
| 51 | |
| 160 | |
| 54 | |
| 238 | |
| First-generation tenant improvements and leasing commissions | |
| 1,703 | |
| 835 | |
| 8,910 | |
| 4,033 | |
| 11,853 | |
| Share of first-generation tenant improvements and leasing commissions from unconsolidated real estate ventures | |
| 199 | |
| 1,192 | |
| 747 | |
| 674 | |
| 217 | |
| Non-recurring capital expenditures | |
| 6,310 | |
| 4,914 | |
| 16,197 | |
| 9,601 | |
| 18,548 | |
| Total JBG SMITH Share of Capital Expenditures | | $ | 18,536 | | $ | 15,345 | | $ | 31,481 | | $ | 20,996 | | $ | 31,437 | |
(1) | During Q4 2020, we determined that a commercial asset was impaired due to a decline in the fair value of the asset and recorded an impairment loss of $10.2 million, of which $7.8 million related to real estate. The remaining $2.4 million of the impairment loss was attributable to the right-of-use asset associated with the property’s ground lease. |
(2) | During Q2 2020, we determined that our investment in the venture that owned The Marriott Wardman Park hotel was impaired due to a decline in the fair value of the underlying asset and we recorded an impairment loss of $6.5 million, which reduced the net book value of our investment to zero, and we suspended equity loss recognition for the venture after Q2 2020. In Q3 2020, we transferred our interest in this venture to our former venture partner. |
(3) | See page 55 for the components of Transaction and Other Costs. For Q1 2021, excludes $1.1 million of transaction costs attributable to noncontrolling interests. |
(4) | Includes amounts, at JBG SMITH Share, related to unconsolidated real estate ventures. |
(5) | Includes straight-line rent, above/below market lease amortization and lease incentive amortization. |
(6) | The quarterly FAD payout ratio is not necessarily indicative of an amount for the full year due to fluctuation in timing of capital expenditures, the commencement of new leases and the seasonality of our operations. |
APPENDIX - NOI RECONCILIATIONS (NON-GAAP) | JUNE 30, 2021 |
Appendix – NOI Reconciliations
| in thousands |
| Three Months Ended |
| |||||||||||||
| |
| Q2 2021 |
| Q1 2021 |
| Q4 2020 |
| Q3 2020 |
| Q2 2020 |
| |||||
| Net income (loss) attributable to common shareholders | | $ | (2,973) | | $ | (20,731) | | $ | (45,655) | | $ | (22,793) | | $ | (36,780) | |
| Add: | |
|
| |
|
| |
|
| |
|
| |
|
| |
| Depreciation and amortization expense | |
| 56,678 | |
| 64,726 | |
| 64,170 | |
| 56,481 | |
| 52,616 | |
| General and administrative expense: | |
|
| |
|
| |
|
| |
|
| |
|
| |
| Corporate and other | |
| 13,895 | |
| 12,475 | |
| 9,156 | |
| 11,086 | |
| 13,216 | |
| Third-party real estate services | |
| 25,557 | |
| 28,936 | |
| 28,569 | |
| 28,207 | |
| 29,239 | |
| Share-based compensation related to Formation Transaction and special equity awards | |
| 4,441 | |
| 4,945 | |
| 6,246 | |
| 7,133 | |
| 8,858 | |
| Transaction and Other Costs | |
| 2,270 | |
| 3,690 | |
| 1,144 | |
| 845 | |
| 1,372 | |
| Interest expense | |
| 16,773 | |
| 16,296 | |
| 17,661 | |
| 16,885 | |
| 15,770 | |
| Loss on extinguishment of debt | |
| — | |
| — | |
| 29 | |
| — | |
| — | |
| Impairment loss | | | — | | | — | | | 10,232 | | | — | | | — | |
| Income tax expense (benefit) | |
| (5) | |
| 4,315 | |
| (544) | |
| (488) | |
| (888) | |
| Net income (loss) attributable to redeemable noncontrolling interests | |
| (345) | |
| (2,230) | |
| (4,513) | |
| (2,212) | |
| (3,483) | |
| Net loss attributable to noncontrolling interests | | | — | | | (1,108) | | | — | | | — | | | — | |
| Less: | |
|
| |
|
| |
|
| |
|
| |
|
| |
| Third-party real estate services, including reimbursements revenue | |
| 26,745 | |
| 38,107 | |
| 30,069 | |
| 26,987 | |
| 27,167 | |
| Other income | |
| 1,904 | |
| 2,186 | |
| 9,934 | |
| 2,292 | |
| 1,516 | |
| Income (loss) from unconsolidated real estate ventures, net | |
| 3,953 | |
| (943) | |
| (3,194) | |
| (965) | |
| (13,485) | |
| Interest and other income (loss), net | |
| (38) | |
| 9 | |
| (1,646) | |
| — | |
| 114 | |
| Gain on sale of real estate | |
| 11,290 | |
| — | |
| — | |
| — | |
| — | |
| | | | | | | | | | | | | | | | | |
| Consolidated NOI | |
| 72,437 | |
| 71,955 | |
| 51,332 | |
| 66,830 | |
| 64,608 | |
| NOI attributable to unconsolidated real estate ventures at our share | |
| 8,109 | |
| 7,512 | |
| 7,521 | |
| 7,130 | |
| 7,495 | |
| Non-cash rent adjustments (1) | |
| (4,088) | |
| (4,765) | |
| 15,433 | |
| (4,934) | |
| (1,419) | |
| Other adjustments (2) | |
| 5,191 | |
| 4,738 | |
| (3,284) | |
| 2,881 | |
| 3,516 | |
| Total adjustments | |
| 9,212 | |
| 7,485 | |
| 19,670 | |
| 5,077 | |
| 9,592 | |
| NOI | | $ | 81,649 | | $ | 79,440 | | $ | 71,002 | | $ | 71,907 | | $ | 74,200 | |
| Less: out-of-service NOI loss (3) | |
| (1,329) | |
| (1,361) | | | (801) | | | (442) | | | (1,475) | |
| Operating portfolio NOI | | $ | 82,978 | | $ | 80,801 | | $ | 71,803 | | $ | 72,349 | | $ | 75,675 | |
Note: NOI, Non-Same Store NOI and Same Store NOI are presented as originally reported in the respective quarter.
(1) | Adjustment to exclude straight-line rent, above/below market lease amortization and lease incentive amortization. |
(2) | Adjustment to include other revenue and payments associated with assumed lease liabilities related to operating properties and to exclude commercial lease termination revenue and allocated corporate general and administrative expenses to operating properties. |
(3) | Includes the results of our Under-Construction assets and Near-Term and Future Development Pipelines. |
JBGS Divider
Exhibit 99.2
Investor presentation August 2021 2001 South Bell Street Rendering |
disclosures Forward-Looking Statements Certain statements contained herein may constitute “forward-looking statements” as such term is defined in Section 27A of the Securities Act of 1933, as amended, and Section 21E of the Securities Exchange Act of 1934, as amended. Forward-looking statements are not guarantees of performance. They represent our intentions, plans, expectations and beliefs and are subject to numerous assumptions, risks and uncertainties. Consequently, the future results of JBG SMITH Properties (“JBG SMITH”, the “Company”, “we”, “us”, “our” or similar terms) may differ materially from those expressed in these forward-looking statements. You can find many of these statements by looking for words such as “approximate”, “hypothetical”, “potential”, “believes”, “expects”, “anticipates”, “estimates”, “intends”, “plans”, “would”, “may” or similar expressions in this Investor Presentation. Currently, one of the most significant factors that could cause actual outcomes to differ materially from our forward-looking statements is the adverse effect of the current pandemic of the novel coronavirus, or COVID-19, on our financial condition, results of operations, cash flows, liquidity, performance, tenants, the real estate market and the global economy and financial markets. The extent to which the COVID-19 pandemic continues to impact us and our tenants depends on future developments, many of which are highly uncertain and cannot be predicted with confidence, including the scope, severity, and duration of the pandemic, the actions taken to contain the pandemic or mitigate its impact, the direct and indirect economic effects of the pandemic and containment measures, and whether the residential market in the Washington, DC region and any of our properties will be materially impacted by the expiration of various moratoriums on residential evictions, among others. Moreover, investors are cautioned to interpret many of the risks identified under the section titled “Risk Factors” in our Annual Report on Form 10-K for the fiscal year ended December 31, 2020 as being heightened as a result of the ongoing and numerous adverse impacts of the COVID-19 pandemic. We also note the following may impact our forward-looking statements: the impact of COVID-19 and the ensuing economic turmoil on our Company, net operating income, same store net operating income, net asset value, stock price, occupancy rates, revenue from our multifamily and commercial portfolios, operating costs, deferrals of rent, uncollectable operating lease receivables, parking revenue, and burn-off of rent abatement; the impact of disruptions to the credit and capital markets on our ability to access capital, including refinancing maturing debt; changes to the amount and manner in which tenants use space; whether we will harvest the anticipated value of our development pipeline; whether we incur additional costs or make additional concessions or offer other incentives to existing or prospective tenants to reconfigure space; whether the Washington, DC region will be more resilient than other parts of the country in any recession resulting from COVID-19 and whether DC metro asking rents will be more resilient than those in other gateway markets; our annual dividend per share and dividend yield; annualized net operating income; whether our future capital recycling efforts will be successful and will be at or above NAV; whether in the case of our under-construction assets, estimated square feet, estimated number of units and in the case of our near-term and future development assets, estimated potential development density are accurate; expected key Amazon.com, Inc. (“Amazon“) transaction terms and timeframes for closing any Amazon transactions not yet closed; the amount and timing of planned infrastructure and educational improvements related to Amazon’s additional headquarters and the Virginia Tech Innovation Campus; the economic impact, job growth and related demand for multifamily and commercial properties of Amazon’s additional headquarters on the DC region and National Landing and the speed with which such impact occurs and Amazon’s plans for accelerated hiring and in-person work requirements; the impact of our role as the exclusive developer, property manager and retail leasing agent in connection with Amazon’s new headquarters; our development plans related to Amazon’s additional headquarters; whether our plans related to our investment in 5G wireless spectrum across National Landing will be a significant demand catalyst; whether we will be successful in negotiating definitive documentation with AT&T; whether our target markets continue to be fast-growing; whether future supply or construction delays will inhibit our ability to time new multifamily deliveries to meet market demand; whether Amazon will have a similar growth impact on National Landing as in Seattle; whether National Landing will experience the “Major Milestones“ on the timing discussed or at all; whether anticipated near-term net operating income contributions, anticipated resiliency of the DC area and our contemplated shift to multifamily will be realized and, if realized, will have a positive impact on our stock price; whether any of our tenants succeed in obtaining government assistance under the CARES Act and other programs and use any resulting proceeds to make lease payments owed to us; whether we can access agency debt secured by our currently unencumbered multifamily assets in a timely manner, in the amounts we estimate, on reasonable terms or at all; whether estimates of the amounts management believes to be the impact of COVID-19 on our NOI and Adjusted EBITDA are correct; whether the delay in our planned 2020 discretionary operating asset capital expenditures will have any negative impact on our properties or our ability to generate revenue; and whether the allocation of capital to our share repurchase plan has any impact on our share price. Many of the factors that will determine the outcome of these and our other forward-looking statements are beyond our ability to control or predict. These factors include, among others: adverse economic conditions in the Washington, DC metropolitan area, including in relation to COVID-19, the timing of and costs associated with development and property improvements, financing commitments, and general competitive factors. For further discussion of factors that could materially affect the outcome of our forward-looking statements and other risks and uncertainties, see “Risk Factors,” “Management’s Discussion and Analysis of Financial Condition and Results of Operations” and the Cautionary Statement Concerning Forward-Looking Statements in the Company’s Annual Report on Form 10-K for the year ended December 31, 2020 and other periodic reports the Company files with the Securities and Exchange Commission. For these statements, we claim the protection of the safe harbor for forward-looking statements contained in the Private Securities Litigation Reform Act of 1995. You are cautioned not to place undue reliance on our forward-looking statements. All subsequent written and oral forward-looking statements attributable to us or any person acting on our behalf are expressly qualified in their entirety by the cautionary statements contained or referred to in this section. We do not undertake any obligation to release publicly any revisions to our forward-looking statements to reflect events or circumstances occurring after the date hereof. 2 |
disclosures Pro Rata Information We present certain financial information and metrics in this release "at JBG SMITH Share," which refers to our ownership percentage of consolidated and unconsolidated assets in real estate ventures (collectively, "real estate ventures") as applied to these financial measures and metrics. Financial information "at JBG SMITH Share" is calculated on an asset-by-asset basis by applying our percentage economic interest to each applicable line item of that asset's financial information. "At JBG SMITH Share" information, which we also refer to as being "at share," "our pro rata share" or "our share," is not, and is not intended to be, a presentation in accordance with GAAP. Given that a substantial portion of our assets are held through real estate ventures, we believe this form of presentation, which presents our economic interests in the partially owned entities, provides investors valuable information regarding a significant component of our portfolio, its composition, performance and capitalization. We do not control the unconsolidated real estate ventures and do not have a legal claim to our co-venturers' share of assets, liabilities, revenue and expenses. The operating agreements of the unconsolidated real estate ventures generally allow each co-venturer to receive cash distributions to the extent there is available cash from operations. The amount of cash each investor receives is based upon specific provisions of each operating agreement and varies depending on certain factors including the amount of capital contributed by each investor and whether any investors are entitled to preferential distributions. With respect to any such third-party arrangement, we would not be in a position to exercise sole decision-making authority regarding the property, real estate venture or other entity, and may, under certain circumstances, be exposed to economic risks not present were a third-party not involved. We and our respective co-venturers may each have the right to trigger a buy-sell or forced sale arrangement, which could cause us to sell our interest, or acquire our co-venturers' interests, or to sell the underlying asset, either on unfavorable terms or at a time when we otherwise would not have initiated such a transaction. Our real estate ventures may be subject to debt, and the repayment or refinancing of such debt may require equity capital calls. To the extent our co-venturers do not meet their obligations to us or our real estate ventures or they act inconsistent with the interests of the real estate venture, we may be adversely affected. Because of these limitations, the non-GAAP "at JBG SMITH Share" financial information should not be considered in isolation or as a substitute for our financial statements as reported under GAAP. Market Data Market data and industry forecasts are used in this Investor Presentation, including data obtained from publicly available sources. These sources generally state that the information they provide has been obtained from sources believed to be reliable, but the accuracy and completeness of the information is not assured. We have not independently verified any such information. Amazon In November 2018, Amazon announced it had selected sites that we own in National Landing as the location of an additional headquarters. In connection with Amazon's new headquarters in National Landing, in February 2019 the Commonwealth of Virginia enacted an incentives bill, which provides tax incentives to Amazon to create a minimum of 25,000 new full-time jobs and potentially 37,850 full-time jobs with average annual wage targets for each calendar year, starting with $150,000 in 2019, and escalating 1.5% per year, in National Landing. Led by state and local governments, we expect more than $5.6 billion of infrastructure and education investments directly benefitting National Landing. These investments include: two new Metro entrances (Crystal Drive and Potomac Yard); a pedestrian bridge to Reagan National Airport; a new commuter rail station located between two of our Crystal Drive office assets; lowering of elevated sections of US Route 1 that currently divide parts of National Landing to create better multimodal access and walkability; and funding for an innovation campus anchored by Virginia Tech. In addition to government infrastructure investments, we expect at least an additional $6.8 billion of investments, including investments by Amazon, JBG SMITH, and Virginia Tech. To date, we have executed leases with Amazon totaling approximately 1.0 million square feet at six office buildings in our National Landing portfolio. In March 2019, we executed purchase and sale agreements with Amazon for two of our National Landing development sites, Metropolitan Park and Pen Place, which will serve as the initial phase of new construction associated with Amazon's new headquarters at National Landing. Subject to customary closing conditions, Amazon contracted to acquire these two development sites for an estimated aggregate $293.9 million, or $72.00 per square foot, based on their combined estimated potential development density xxx 3 |
disclosures of up to approximately 4.1 million square feet. In December 2019, Arlington County approved the plans submitted by Amazon to construct two new office buildings, totaling 2.1 million square feet, inclusive of over 50,000 square feet of street-level retail with new shops and restaurants, on the Metropolitan Park land sites. In January 2020, we sold Metropolitan Park to Amazon for $155.0 million, which represented an $11.0 million increase over our previously estimated contract value resulting from an increase in the approved development density on the site. In February 2021, Amazon submitted for entitlement approvals the second phase of its new headquarters at Pen Place (2.8 million square feet of office, along with an iconic structure, known as The Helix). We are the developer, property manager and retail leasing agent for Amazon's new headquarters at National Landing. In September 2020, Amazon purchased the Residence Inn by Marriott in Pentagon City, immediately adjacent to Pen Place in National Landing from a third party. We include certain statistics in the following slides as outlined in the Memorandum of Understanding (MOU) between Amazon and the Commonwealth of Virginia, executed on November 12, 2018, and that identify the proximity of our portfolio to National Landing: specifically, 81% of our portfolio is within a 20-minute commute of National Landing, as calculated on a pre-COVID-19 Monday morning. Approximately 2.1 million square feet of estimated potential development density at Pen Place has been excluded from our portfolio statistics included in this presentation. JOINT VENTURE IN POTOMAC YARD In April 2021, we entered into a real estate venture with institutional investors advised by J.P. Morgan Global Alternatives to design, develop, manage and own approximately 2.0 million square feet of new mixed-use development (1.1 million square feet of office and 900,000 square feet of multifamily) located in Potomac Yard, the southern portion of National Landing. Our venture partner contributed a land site that is entitled for 1.3 million square feet of development it controlled at Potomac Yard Landbay F, while we contributed the adjacent land with over 700,000 square feet of estimated development capacity at Potomac Yard Landbay G. In addition to our 50.0% ownership in the venture, we will act as pre-developer, developer, property manager and leasing agent for all future commercial and residential properties on the site. As a result of this transaction, we increased our at share ownership of development rights in the southern portion of National Landing by over 285,000 square feet, increasing our economic ownership interest in this emerging-growth submarket to approximately 79%. We have updated portfolio statistics in this presentation to reflect the impact of this transaction. Definitions and Reconciliations For certain definitions and reconciliations see pages 23–28. IMPACT OF COVID-19 ON OUR NOI AND ADJUSTED EBITDA This presentation includes estimates of the amounts management believes are attributable to the impact of COVID-19 on our NOI and Adjusted EBITDA. Though certain elements of such estimates are quantifiable, these estimates are inherently subjective and we can provide no assurance that such estimates reflect the actual impact of COVID-19 on the measures or that these measures, after such adjustments, reflect what our actual results would have been in the absence of COVID-19. 4 |
JBG SMITH AT A GLANCE (1) Total Enterprise Value is based on the closing price per share of $31.51 as of June 30, 2021. 5 OPERATING PORTFOLIO COMMERCIAL SF MULTIFAMILY UNITS 11.4M 6,125 Q2 2021 ANNUALIZED NOI $330.7M LEASED IN-SERVICE PORTFOLIO 88.6% WEIGHTED AVERAGE LEASE TERM (Portfolio Wide) 6.1 YEARS DEVELOPMENT PIPELINE UNDER-CONSTRUCTION 808 UNITS NEAR-TERM DEVELOPMENT PIPELINE 1.4M FUTURE DEVELOPMENT PIPELINE 9.9M SF BALANCE SHEET TOTAL ENTERPRISE VALUE(1) $6.7B NET DEBT/TOTAL ENTERPRISE VALUE(1) 32.1% NET DEBT/ANNUALIZED ADJUSTED EBITDA 7.6x 1900 N Street WEIGHTED AVERAGE LEASE TERM (National Landing) 5.2 YEARS 4,000 COMMERCIAL SF MULTIFAMILY UNITS |
PARTNERS FIBER OUTDOOR 5G INDOOR 5G EDGE DATA CENTERS CBRS SPECTRUM q2 2021 and recent highlights 6 FURTHERED ENTITLEMENTS OF NEAR-TERM DEVELOPMENT PIPELINE ADVANCED SMART CITY INITIATIVE THROUGH STRATEGIC PARTNERSHIPS 100% of our 5.0M SF Near-Term Development Pipeline is either fully entitled or has been submitted for final entitlements Received final entitlement approvals for 2000 and 2001 South Bell Street (785 multifamily units & 29K+ SF of retail) Submitted 223 23rd Street and 2250 Crystal Drive, approximately 1,525 multifamily units, for final entitlements AMAZON HQ2 2000/2001 SOUTH BELL STREET 223 23RD STREET and 2250 CRYSTAL DRIVE Secured two critical partnerships to accelerate the deployment of 5G and redundant, high-capacity fiber layers of the National Landing Smart City plan + 2 1 1 2 Completed In-Progress Initial Partnership Status + |
Why jbg smith? jbg smith is well positioned to maximize long-term nav per share growth 7 HIGH-GROWTH, AMENITY-RICH SUBMARKETS IN DC METRO MARKET Our target markets are fast-growing and amenity-rich, representing approximately 18% of the DC metro market SIGNIFICANT DEMAND CATALYSTS IN NATIONAL LANDING 53% concentrated in National Landing; 81% within a 20-minute commute Home to Amazon’s 5M+ SF HQ2 and Virginia Tech's $1B Innovation Campus Amazon incentivized to create up to 38K new jobs, increasing daytime population by 70% Creating first U.S. 5G-Smart City at scale in National Landing with best-in-class partners SUBSTANTIAL NEAR-TERM NOI GROWTH Lease-up of In-service operating portfolio (88.6% leased as of Q2 2021) Considerable near-term incremental NOI growth from seven newly developed assets Exchange into multifamily asset with proceeds from Pen Place sale to Amazon EXTENSIVE DEVELOPMENT PIPELINE 5.0M SF Near-Term and 9.9M SF Future Development Pipelines Harvest value through development, asset sales, ground leases, or recapitalizations 2.8M SF of development completed since 2017, with estimated stabilized yields of 6.5% for multifamily assets and 7.0% for commercial assets PROVEN CAPITAL ALLOCATOR WITH ROBUST BALANCE SHEET Planned portfolio shift to majority multifamily $1.7B of liquidity to execute on growth pipeline $1.5B of planned recycling of non-core assets 1 2 3 4 5 |
Other MD (off map) 6% Bethesda CBD 2% Reston (off map) 10% RB Corridor 4% DC Mature 6% National Landing 53% 20-MINUTE COMMUTE TO NATIONAL LANDING WHO WE ARE: CONCENTRATED IN HIGH-GROWTH SUBMARKETS OUR TARGET MARKETS ARE FAST-GROWING AND AMENITY-RICH, REPRESENTING APPROXIMATELY 18% OF THE DC METRO MARKET Note: Size of sphere based on square footage and includes Operating, Under-Construction, and Development Pipeline square footage. Target submarkets represent the primary focus of new JBGS investment: National Landing, DC Emerging, Reston Town Center, the Rosslyn-Ballston Corridor (RB Corridor), and Bethesda Central Business District (CBD). 8 53% CONCENTRATED IN NATIONAL LANDING IMMEDIATELY PROXIMATE TO AMAZON HQ2 AND THE VIRGINA TECH INNOVATION CAMPUS 81% WITHIN A 20-MINUTE COMMUTE OF NATIONAL LANDING 97% METRO-SERVED 1 Amazon HQ2 Virginia Tech Innovation Campus DC Emerging 19% |
dc metro market fundamentals SHOWING EARLY SIGNS OF A RECOVERY Source: Apartment List (DC Metro) and JLL (DC Metro). (1) Pre-pandemic levels represent March 2020 levels. 9 1 MULTIFAMILY ASKING RENTS GREW 2.0% YOY AND RETURNED TO PRE-PANDEMIC LEVELS(1) AND OCCUPANCY INCREASED 2.3% DURING THE SAME TIME PERIOD YTD OFFICE ABSORPTION REMAINS NEGATIVE, BUT THE PACE OF LOSSES ABATED SOMEWHAT IN Q2 +2.0% +2.3% +2.6M AND WEEKLY TOUR ACTIVITY AVERAGED OVER 5X THAT SEEN DURING Q2 LAST YEAR >5X (4.2) (1.6) (5.0) (4.0) (3.0) (2.0) (1.0) -- Q1 21 Q2 21 Quarterly Net Absorption (SF in M) DC Metro Office Net Absorption (Q1 2021 vs Q2 2021) 92.5% 94.8% 91.0% 91.5% 92.0% 92.5% 93.0% 93.5% 94.0% 94.5% 95.0% Q2 20 Q2 21 Occupancy DC Metro Multifamily Occupancy (Q2 2020 vs Q2 2021) $1,760 $1,795 $1,500 $1,550 $1,600 $1,650 $1,700 $1,750 $1,800 $1,850 Q2 20 Q2 21 Asking Rent ($/Unit/Month) DC Metro Multifamily Asking Rents (Q2 2020 vs Q2 2021) 14 75 -- 10 20 30 40 50 60 70 80 Q2 20 Q2 21 Average Tour Activity (Tours/Week) DC Metro Office Tour Activity (Q2 2020 vs Q2 2021) |
DEMAND CATALYSTS IN NATIONAL LANDING: AMAZON HQ2 AND VIRGINIA TECH AMAZON HIRING INCENTIVES 38K JOBS EXPECTED INCREASE IN DAYTIME POPULATION 70% TOTAL PUBLIC AND PRIVATE INVESTMENT $12B JBGS DEVELOPMENT PIPELINE 7.2M SF 10 AMAZON HQ2 JBGS OPERATING JBGS DEVELOPMENT PIPELINE INFRASTRUCTURE/EDUCATION (STATE- AND LOCAL-FUNDED) WASHINGTON HOUSING CONSERVANCY + AMAZON ARLINGTON Route 1 to Grade ALEXANDRIA Virginia Tech Innovation Campus New Metro Station New Rail Station and Airport Pedestrian Bridge REAGAN NATIONAL AIRPORT New Metro Station NATIONAL LANDING 2 |
DEMAND CATALYSTS IN NATIONAL LANDING: GROWTH TIMELINE Potential to start up to 2,545 new multifamily units over the next three years to meet market demand (1) Dates reflect JBG SMITH’s estimate of third-party investment in National Landing. (2) The office component of 1770 Crystal Drive is 100% leased to Amazon. (3) Represents cumulative anticipated job growth. 11 AMAZON JOB GROWTH AND MAJOR MILESTONES(1) Construction start of new VRE station and Route 1 to grade Potential development of 2,545 multifamily units Construction start of 1900 Crystal Drive (808 units) Construction start of pedestrian bridge to DCA Construction start of new Metro entrance at Crystal Drive Construction start Campus opened in temporary space Initial occupancy of leased assets 1st leased new delivery (1770 Crystal Drive)(2) Delivery of Metropolitan Park (2.1M SF of office) Pen Place entitlement submission (2.8M SF of office + The Helix) 6/30/21 Amazon Hiring Ramp (3) Amazon HQ2 Virginia Tech Innovation Campus Infrastructure Investments JBG SMITH Multifamily Development Opportunities 2 |
DEMAND CATALYSTS IN NATIONAL LANDING: SEATTLE CASE STUDY National Landing poised to benefit from dramatic office and multifamily rent growth, similar to South Lake Union Note: Reflects data from Q4 2010 to Q1 2020. (1) Source: JLL; reflects market performance in South Lake Union. (2) Average direct asking rent. (3) Source: CoStar; based on 1.0-mile radius around Amazon HQ in South Lake Union. (4) Includes buildings that are market-rate only. (5) Reflects asking rents of newly delivered buildings throughout the full year in 2010 and Q1 2020. 12 2010 2020 (Pre-Covid) Growth OFFICE MARKET DATA(1) Total Inventory (SF) 5,932,963 10,959,021 5,026,058 Total Occupied Inventory (SF) 4,685,871 10,060,381 5,374,510 Overall Rent ($/SF)(2) $34 $58 71% 6.0% CAGR MULTIFAMILY MARKET DATA(3) Total Inventory (Units)(4) 18,704 33,512 14,808 Total Existing Supply Built Pre-2010 ($/SF/Month) $1.91 $2.79 46% 4.2% CAGR New Development(5) Starting Rent ($/SF/Month) $2.67 $3.88 45% 4.1% CAGR AMAZON ADDED OVER 50,000 JOBS IN SEATTLE AFTER MOVING TO SOUTH LAKE UNION 2 |
~6M SF of Amazon owned / leased space(1) + 4M+ SF of estimated follow-on tech demand(2) x 20% of employees walk or bike to work(3) = 7,600 new residents vs. ~3,350 units in JBGS pipeline(4) Average wage of $162K(5) x Affordable rent of 25% of pre-tax income = Affordable rent of $3,375 / month vs. $2,700 /month today(6) (>4% annual growth as seen in South Lake Union) DEMAND CATALYSTS IN NATIONAL LANDING: Amazon’s potential impact in national landing Amazon’s commitment to national landing: a tailwind for office and multifamily growth (1) Assumes average space utilization of 160 SF per employee. Amazon’s new HQ2 construction includes 4.9M SF of planned office space at Metropolitan Park and Pen Place. Additionally, as of June 30, 2021, Amazon leased 1.0M SF from JBGS in National Landing. (2) Source: CBRE Research July 2021. Based on 4.1M SF of new tech leasing in South Lake Union and adjacent markets from 2009 – 2019. (3) Based on Seattle trends, where Amazon’s first headquarters is located, ~20% of Amazon’s employees elected to live within walking or biking distance to work. (4) Includes 808 units currently under construction and 2,545 units in our Near-Term Development Pipeline located in National Landing. (5) Per the MOU between Amazon and the Commonwealth of Virginia, executed on November 12, 2018, the average annual wage target for each calendar year started at $150K in 2019, and escalates 1.5% per year. $162K represents the average wage in 2024. (6) Today’s rent based on $3.30/ft for an 825 SF unit. 13 2 OFFICE DEMAND MULTIFAMILY RENT AMAZON INCENTIVIZED TO ADD 38,000 JOBS MULTIFAMILY DEMAND |
DEMAND CATALYSTS IN NATIONAL LANDING: VIRGINIA TECH INNOVATION Campus FIRST VIRTUAL CLASSES 2020 EXPECTED PHASE I OCCUPANCY 2024 ANTICIPATED VIRGINIA TECH INVESTMENT AT BUILDOUT $1B INITIAL SF DEDICATED TO VIRGINIA TECH 675K SF EXPECTED ANNUAL STEM MASTER'S DEGREES 750 14 2 JOINT VENTURE AGREEMENT EXECUTED IN Q2 2021 INCREASED OUR NEAR-TERM MULTIFAMILY DEVELOPMENT PIPELINE BY 210K SF ARLINGTON ALEXANDRIA REAGAN NATIONAL AIRPORT AMAZON HQ2 JBGS DEVELOPMENT PIPELINE (POTOMAC YARD) Potomac River Potomac Yard Landbay F – East (Venture Partner Contribution) Virginia Tech Innovation Campus Potomac Yard Landbay G (JBGS Contribution) New Metro Station Potomac Yard Landbay H JOINT VENTURE PARCELS |
SUBSTANTIAL GROWTH OPPORTUNITY: OPERATING PORTFOLIO EXISTING OPERATING PORTFOLIO poised TO BENEFIT FROM national landing growth catalysts 15 MD 7% DC 25% Other VA 14% National Landing 54% National Landing 54% Commercial 77% Multifamily 23% Q2 2021 NOI BY REGION Q2 2021 NOI BY USE 3 Q2 OPERATING PORTFOLIO HIGHLIGHTS $330.7M of annualized NOI, up 7.7% YOY and 2.6% QOQ Financial results continue to be negatively impacted by the COVID-19 pandemic and will continue to be in the short-term given the pandemic’s impact on certain income streams 85.9% leased and 84.4% occupied across our commercial portfolio (occupancy down 250 bps QOQ due to known vacates) 715K SF of commercial leases executed; 2.1% cash mark-to-market 95.0% leased and 89.8% occupied across our In-service multifamily portfolio (occupancy up 140 bps QOQ) Asking rents in our multifamily portfolio have almost fully recovered, now only 2% below March 2020 levels; pandemic-driven concession packages continue to burn-off |
SUBSTANTIAL GROWTH OPPORTUNITY: NEWLY DEVELOPED ASSETS IN LEASE-UP SIGNIFICANT NEAR-TERM NOI GROWTH ANTICIPATED BY Year end 2022, DRIVEN BY STABILIZATION OF 7 NEWLY DEVELOPED ASSETS (1) Formerly known as 7900 Wisconsin Avenue. 16 MULTIFAMILY WEIGHTED AVG. % LEASED: 72.9% West Half 900 and 901 W Street The Wren 8001 Woodmont(1) SUBMARKET: Ballpark/ Southeast U Street/ Shaw U Street/ Shaw Bethesda CBD COMPLETION: OWNERSHIP: LEASED %: Q3 2019 100% 84.0% Q4 2019 100% 82.6% Q2 2020 96.1% 84.5% Q1 2021 50.0% 16.0% COMMERCIAL WEIGHTED AVG. % LEASED: 90.1% 4747 Bethesda Avenue 1900 N Street Bethesda CBD DC CBD Q4 2019 100% 98.0% Q4 2019 55.0% 74.1% + Multifamily like-kind exchange for Pen Place land sale expected to close in late 2021 3 |
EXTENSIVE DEVELOPMENT PIPELINE: 1900 CRYSTAL DRIVE (UNDER CONSTRUCTION) 17 MULTIFAMILY UNITS IN TWO BUILDINGS NEW AMENITY RETAIL ESTIMATED INCREMENTAL INVESTMENT ESTIMATED STABILIZED NOI ESTIMATED INITIAL COMPLETION DATE 808 38K+ SF $331M $23M 1H 2024 4 |
EXTENSIVE DEVELOPMENT PIPELINE EXTENSIVE 14.9M SF DEVELOPMENT PIPELINE — 73% MULTIFAMILY 18 IN ADDITION TO DEVELOPMENT, WE MAY UNLOCK VALUE THROUGH OPPORTUNISTIC ASSET SALES, GROUND LEASES, AND RECAPITALIZATIONS DEVELOPMENT PIPELINE COMPOSITION HOW ARE WE HARVESTING VALUE? 5.0M SF Near-Term Development Pipeline could commence construction in the next three years 100% fully entitled or has been submitted for final entitlements 2,545 multifamily units in National Landing sequenced to meet Amazon and Virginia Tech-driven demand 9.9M SF Future Development Pipeline, for which we are actively advancing entitlements Near-Term Development 5.0M SF Office 27% Multifamily 73% 4 |
PROVEN CAPITAL ALLOCATOR: SHIFTING PORTFOLIO MIX Opportunistically shift portfolio to majority Multifamily over time 19 Sell or recapitalize at least $1.5B of non-core assets Proven track record with $1.6B assets sold at or above NAV since inception Embedded growth via our 14.9M SF Development Pipeline, of which 73% is multifamily Acquire new multifamily units or development opportunities in target high-growth submarkets At least 50% <50% 69% 31% 77% 23% Q3 2017 Q2 2021 FUTURE Operating Commercial Operating Multifamily HOW DO WE INTEND TO ACHIEVE THIS GOAL? 1 2 3 PORTFOLIO MIX 5 |
PROVEN CAPITAL ALLOCATOR: ROBUST BALANCE SHEET $1.7B of liquidity TO CAPITALIZE ON INVESTMENT OPPORTUNITIES (1) Total Enterprise Value is based on closing price per share of $31.51 as of June 30, 2021. 20 DEBT MATURITY SCHEDULE Weighted Avg. Cost of Debt: 3.2% Weighted Avg. Debt Maturity: 4.1 years LEVERAGE METRICS Net Debt/Total Enterprise Value: 32.1%(1) Net Debt/Annualized Adjusted EBITDA: 7.6x Fixed Rate Debt: 58.5% Secured Debt: 83.4% TOTAL LIQUIDITY OF $1.7B Cash: $217.5M Undrawn Credit Facility: $1B Estimated Multifamily Borrowing Capacity: $511M Drawn Term Loans Secured Debt (Pro Rata Share) 5 $0M $234M $280M $129M $680M $0M $296M $385M $200M $200M 2021 2022 2023 2024 2025 2026 2027 2028+ |
2020 Esg report highlights focusing on environmental, social, and governance issues that impact our business IS ESSENTIAL TO maximizing long-term NAV per share (1) Data compares 2020 metrics versus 2019. Note, that the COVID-19 pandemic caused a significant reduction of activity in our buildings in 2020, resulting in larger energy, water and carbon emission reductions than normal. 21 17% REDUCTION IN ENERGY USAGE 11% REDUCTION IN CO2 EMISSIONS 12% REDUCTION IN WATER USAGE 2% REDUCTION IN WASTE DIVERSION ESG HIGHLIGHTS 8.8M LEED-CERTIFIED SPACE 6.0M ENERGY STAR-CERTIFIED SPACE 5-Star GRESB SUSTAINABILITY RATING 1,150 UNITS WASHINGTON HOUSING INITIATIVE IMPACT POOL UNITS FINANCED FORMALIZED OUR COMITTMENT TO DIVERSITY & INCLUSION (D&I) LAUNCHED OUR INAUGURAL D&I REPORT IN JULY 2021 BOARD COMPOSITION ENVIRONMENTAL PERFORMANCE METRICS(1) PERFORMANCE TARGETS We have set performance targets that address future needs and support our local jurisdictions as we all strive toward carbon neutrality |
Appendix |
definitions Development pipeline "Development Pipeline" refers to the Near-Term Development and Future Development Pipelines. EARNINGS BEFORE INTEREST, TAXES, DEPRECIATION AND AMORTIZATION ("EBITDA"), EBITDA FOR REAL ESTATE ("EBITDAre") AND "ADJUSTED EBITDA" EBITDA and EBITDAre are used by management as supplemental operating performance measures, which we believe help investors and lenders meaningfully evaluate and compare our operating performance from period-to-period by removing from our operating results the impact of our capital structure (primarily interest charges from our outstanding debt and the impact of our interest rate swaps) and certain non-cash expenses (primarily depreciation and amortization on our assets). EBITDAre is computed in accordance with the definition established by NAREIT. NAREIT defines EBITDAre as GAAP net income (loss) adjusted to exclude interest expense, income taxes, depreciation and amortization expenses, gains and losses on sales of real estate and impairment write-downs of certain real estate assets and investments in entities when the impairment is directly attributable to decreases in the value of depreciable real estate held by the entity, including our share of such adjustments of unconsolidated real estate ventures. These supplemental measures may help investors and lenders understand our ability to incur and service debt and to make capital expenditures. EBITDA and EBITDAre are not substitutes for net income (loss) (computed in accordance with GAAP) and may not be comparable to similarly titled measures used by other companies. Adjusted EBITDA represents EBITDAre adjusted for items we believe are not representative of ongoing operating results, such as Transaction and Other Costs, impairment write-downs of right-of-use assets associated with leases in which we are a lessee, gain (loss) on the extinguishment of debt, earnings (losses) and distributions in excess of our investment in unconsolidated real estate ventures, lease liability adjustments and share-based compensation expense related to the Formation Transaction and special equity awards. We believe that adjusting such items not considered part of our comparable operations, provides a meaningful measure to evaluate and compare our performance from period-to-period. Because EBITDA, EBITDAre and Adjusted EBITDA have limitations as analytical tools, we use EBITDA, EBITDAre and Adjusted EBITDA to supplement GAAP financial measures. Additionally, we believe that users of these measures should consider EBITDA, EBITDAre and Adjusted EBITDA in conjunction with net income (loss) and other GAAP measures in understanding our operating results. A reconciliation of net income (loss) to EBITDA, EBITDAre and Adjusted EBITDA is presented on page 15 in our Q2 2021 Investor Package. ESTIMATED INCREMENTAL INVESTMENT "Estimated incremental investment" means management's estimate of the remaining cost to be incurred in connection with the development of an asset as of June 30, 2021, including all remaining acquisition costs, hard costs, soft costs, tenant improvements (excluding Free Rent converted to tenant improvement allowances), leasing costs and other similar costs to develop and stabilize the asset but excluding any financing costs and ground rent expenses. Actual incremental investment may differ substantially from our estimates due to numerous factors, including unanticipated expenses, delays in the estimated start and/or completion date, changes in design and other contingencies. Estimated potential development density "Estimated potential development density" reflects management's estimate of developable gross square feet based on our current business plans with respect to real estate owned or controlled as of June 30, 2021. Our current business plans may contemplate development of less than the maximum potential development density for individual assets. As market conditions change, our business plans, and therefore, the Estimated Potential Development Density, could change accordingly. Given timing, zoning requirements and other factors, we make no assurance that Estimated Potential Development Density amounts will become actual density to the extent we complete development of assets for which we have made such estimates. ESTIMATED TOTAL INVESTMENT "Estimated total investment" means, with respect to the development of an asset, the sum of the Historical Cost in such asset and the Estimated Incremental Investment for such asset. Actual total investment may differ substantially from our estimates due to numerous factors, including unanticipated expenses, delays in the estimated start and/or completion date, changes in design and other contingencies. 23 |
definitions Formation Transaction "Formation Transaction" refers collectively to the spin-off on July 17, 2017 of substantially all of the assets and liabilities of Vornado Realty Trust's Washington, DC segment, which operated as Vornado / Charles E. Smith, and the acquisition of the management business and certain assets and liabilities of The JBG Companies. Free rent "Free rent" means the amount of base rent and tenant reimbursements that are abated according to the applicable lease agreement(s). Future development pipeline "Future Development Pipeline" refers to assets that are development opportunities on which we do not intend to commence construction within the next three years where we (i) own land or control the land through a ground lease or (ii) are under a long-term conditional contract to purchase, or enter into a leasehold interest with respect to land. GAAP "GAAP" means accounting principles generally accepted in the United States. HISTORICAL COST "Historical cost" is a non-GAAP measure which includes the total Historical Cost incurred by JBG SMITH with respect to the development of an asset, including any acquisition costs, hard costs, soft costs, tenant improvements (excluding Free Rent converted to tenant improvement allowances), leasing costs and other similar costs, but excluding any financing costs and ground rent expenses incurred as of June 30, 2021. In-service "In-service" refers to commercial or multifamily assets that are at or above 90% leased or have been operating and collecting rent for more than 12 months as of June 30, 2021. JBG SMITH share "JBG SMITH Share" refers to our ownership percentage of consolidated and unconsolidated assets in real estate ventures. LIQUIDITY "liquidity” refers to the sum of cash, undrawn amounts available under our credit facility and management’s estimated borrowing capacity on our unencumbered multifamily assets. We can provide no assurance that we would be successful in securing the proceeds of such potential borrowing capacity on attractive terms or at all. The way we calculate liquidity is not comparable to the liquidity measures presented by other companies. Metro-served "Metro-served" means locations, submarkets or assets that are within 0.5 miles of an existing or planned Metro station. Near-term development pipeline "Near-term Development Pipeline" refers to select assets that have the potential to commence construction over the next three years, subject to receipt of full entitlements, completion of design and market conditions. NET DEBT "Net Debt" is a non-GAAP financial measurement. Net Debt represents our total consolidated and unconsolidated indebtedness less cash and cash equivalents at our share. Net Debt is an important component in the calculations of Net Debt to Annualized Adjusted EBITDA and Net Debt / total enterprise value. We believe that Net Debt is a meaningful non-GAAP financial measure useful to investors because we review Net Debt as part of our management of our overall financial flexibility, capital structure and leverage. We may utilize a considerable portion of our cash and cash equivalents at any given time for purposes other than debt reduction. In addition, cash and cash equivalents at our share may not be solely controlled by us. The deduction of cash and cash equivalents at our share from consolidated and unconsolidated indebtedness in the calculation of Net Debt therefore should not be understood to mean that it is available exclusively for debt reduction at any given time. 24 |
definitions NET OPERATING INCOME ("NOI"), "ANNUALIZED NOI", "ESTIMATED STABILIZED NOI" AND "PROJECTED NOI YIELD" Net Operating Income ("NOI"), "Annualized NOI", "Estimated Stabilized NOI" and "Projected NOI Yield" are non-GAAP financial measures management uses to assess a segment's performance. The most directly comparable GAAP measure is net income (loss) attributable to common shareholders. We use NOI internally as a performance measure and believe NOI provides useful information to investors regarding our financial condition and results of operations because it reflects only property related revenue (which includes base rent, tenant reimbursements and other operating revenue, net of Free Rent and payments associated with assumed lease liabilities) less operating expenses and ground rent, if applicable. NOI also excludes deferred rent, related party management fees, interest expense, and certain other non-cash adjustments, including the accretion of acquired below-market leases and the amortization of acquired above-market leases and below-market ground lease intangibles. Management uses NOI as a supplemental performance measure of our assets and believes it provides useful information to investors because it reflects only those revenue and expense items that are incurred at the asset level, excluding non-cash items. In addition, NOI is considered by many in the real estate industry to be a useful starting point for determining the value of a real estate asset or group of assets. However, because NOI excludes depreciation and amortization and captures neither the changes in the value of our assets that result from use or market conditions, nor the level of capital expenditures and capitalized leasing commissions necessary to maintain the operating performance of our assets, all of which have real economic effect and could materially impact the financial performance of our assets, the utility of NOI as a measure of the operating performance of our assets is limited. NOI presented by us may not be comparable to NOI reported by other REITs that define these measures differently. We believe to facilitate a clear understanding of our operating results, NOI should be examined in conjunction with net income (loss) attributable to common shareholders as presented in our financial statements. NOI should not be considered as an alternative to net income (loss) attributable to common shareholders as an indication of our performance or to cash flows as a measure of liquidity or our ability to make distributions. Annualized NOI, for all assets except Crystal City Marriott, represents NOI for the three months ended June 30, 2021 multiplied by four. Due to seasonality in the hospitality business, Annualized NOI for Crystal City Marriott represents the trailing 12 month NOI as of June 30, 2021. Management believes Annualized NOI provides useful information in understanding our financial performance over a 12 month period, however, investors and other users are cautioned against attributing undue certainty to our calculation of Annualized NOI. Actual NOI for any 12 month period will depend on a number of factors beyond our ability to control or predict, including general capital markets and economic conditions, any bankruptcy, insolvency, default or other failure to pay rent by one or more of our tenants and the destruction of one or more of our assets due to terrorist attack, natural disaster or other casualty, among others. We do not undertake any obligation to update our calculation to reflect events or circumstances occurring after the date of this earnings release. There can be no assurance that the Annualized NOI shown will reflect our actual results of operations over any 12 month period. This Investor Presentation also contains management's estimate of stabilized NOI and projections of NOI yield for Under-Construction and Near-Term Development Pipeline assets, which are based on management's estimates of property-related revenue and operating expenses for each asset. These estimates are inherently uncertain and represent management's plans, expectations and beliefs and are subject to numerous assumptions, risks and uncertainties. The property-related revenues and operating expenses for our assets may differ materially from the estimates included in this Investor Presentation. Management's projections of NOI yield are not projections of our overall financial performance or cash flow, and there can be no assurance that the Projected NOI Yield set forth in this Investor Presentation will be achieved. Projected NOI Yield means our Estimated Stabilized NOI reported as a percentage of (i) Estimated Total Investment and (ii) Estimated Incremental Investment. Actual initial full year stabilized NOI yield may vary from the Projected NOI Yield based on the actual incremental investment to complete the asset and its actual initial full year stabilized NOI, and there can be no assurance that we will achieve the Projected NOI Yields described in this Investor Presentation. We do not provide reconciliations for non-GAAP estimates on a future basis, including Estimated Stabilized NOI because we are unable to provide a meaningful or accurate calculation or estimate of reconciling items and the information is not available without unreasonable effort. This inability is due to the inherent difficulty of forecasting the timing and/or amounts of various items that would impact net income (loss). Additionally, no reconciliation of Projected NOI Yield to the most directly comparable GAAP measure is included in this Investor Presentation because we are unable to quantify certain amounts that would be required to be included in the comparable GAAP financial measures without unreasonable efforts because such data is not currently available or cannot be currently estimated with confidence. Accordingly, we believe such reconciliations would imply a degree of precision that would be confusing or misleading to investors. 25 |
definitions Non-same store “Non-same store” refers to all operating assets excluded from the same store pool. Percent leased "Percent leased" is based on leases signed as of June 30, 2021, and is calculated as total rentable square feet less rentable square feet available for lease divided by total rentable square feet expressed as a percentage. Out-of-service square feet are excluded from this calculation. Percent occupied "Percent occupied" is based on occupied rentable square feet/units as of June 30, 2021, and is calculated as (i) for office and retail space, total rentable square feet less unoccupied square feet divided by total rentable square feet, (ii) for multifamily space, total units less unoccupied units divided by total units, expressed as a percentage. Out-of-service square feet and units are excluded from this calculation. Recently delivered "Recently delivered" refers to commercial and multifamily assets that are below 90% leased and have been delivered within the 12 months ended June 30, 2021. Same store "Same store" refers to the pool of assets that were In-Service for the entirety of both periods being compared, except for assets for which significant redevelopment, renovation, or repositioning occurred during either of the periods being compared. Square feet or "SF" "Square feet" or "SF" refers to the area that can be rented to tenants, defined as (i) for commercial assets, rentable square footage defined in the current lease and for vacant space the rentable square footage defined in the previous lease for that space, (ii) for multifamily assets, management's estimate of approximate rentable square feet, (iii) for Under-Construction assets, management's estimate of approximate rentable square feet based on current design plans as of June 30, 2021, and (iv) for Near-Term and Future Development Pipeline assets, management's estimate of developable gross square feet based on its current business plans with respect to real estate owned or controlled as of June 30, 2021. Transaction and other costs "Transaction and other costs" include demolition costs, integration and severance costs, pursuit costs related to other completed, potential and pursued transactions, as well as other expenses. Under-construction "Under-construction" refers to assets that were under construction during the three months ended June 30, 2021. 26 |
EBITDA, EBITDAre AND ADJUSTED EBITDA (NON-GAAP) (Unaudited) Note: All EBITDA measures as shown above are attributable to common limited partnership units (“OP Units”). Interest expense includes the amortization of deferred financing costs and the ineffective portion of any interest rate swaps or caps, net of capitalized interest. During the three months ended June 30, 2020, we determined that our investment in the venture that owned The Marriott Wardman Park hotel was impaired due to a decline in the fair value of the underlying asset and recorded an impairment charge of $6.5 million, which reduced the net book value of our investment to zero, and we suspended equity loss recognition for the venture after June 30, 2020. On October 1, 2020, we transferred our interest in this venture to our former venture partner. Includes demolition costs, integration and severance costs, pursuit costs related to other completed, potential and pursued transactions, as well as other expenses. For the six months ended June 30, 2021, excludes $1.1 million of transaction costs attributable to noncontrolling interests. For the six months ended June 30, 2020, includes a charitable commitment of $4.0 million to the Washington Housing Conservancy, a non-profit that acquires and owns affordable workforce housing in the Washington DC metropolitan area. Calculated using the Net Debt below. Quarterly Adjusted EBITDA is annualized by multiplying by four. Adjusted EBITDA for the six months ended June 30, 2021 and 2020 is annualized by multiplying by two. Net of premium/discount and deferred financing costs. 27 dollars in thousands Three Months Ended June 30, Six Months Ended June 30, 2021 2020 2021 2020 EBITDA, EBITDAre and Adjusted EBITDA Net income (loss) $ (3,318) $ (40,263) $ (27,387) $ 7,912 Depreciation and amortization expense 56,678 52,616 121,404 101,105 Interest expense (1) 16,773 15,770 33,069 27,775 Income tax expense (benefit) (5) (888) 4,310 (3,233) Unconsolidated real estate ventures allocated share of above adjustments 10,581 10,692 20,745 21,529 EBITDA attributable to noncontrolling interests (41) (6) 1,030 (3) EBITDA $ 80,668 $ 37,921 $ 153,171 $ 155,085 Gain on sale of real estate (11,290) — (11,290) (59,477) (Gain) loss on sale of unconsolidated real estate assets (5,189) 2,952 (5,189) 2,952 Impairment of investment in unconsolidated real estate venture (2) — 6,522 — 6,522 EBITDAre $ 64,189 $ 47,395 $ 136,692 $ 105,082 Transaction and Other Costs (3) 2,270 1,372 4,852 6,681 Loss on extinguishment of debt — — — 33 Share-based compensation related to Formation Transaction and special equity awards 4,441 8,858 9,386 18,299 Earnings (losses) and distributions in excess of our investment in unconsolidated real estate venture (92) (245) (422) 129 Unconsolidated real estate ventures allocated share of above adjustments 9 747 40 1,465 Adjusted EBITDA $ 70,817 $ 58,127 $ 150,548 $ 131,689 Net Debt to Annualized Adjusted EBITDA (4) 7.6 x 8.1 x 7.2 x 7.2 x June 30, 2021 June 30, 2020 Net Debt (at JBG SMITH Share) Consolidated indebtedness (5) $ 1,979,494 $ 2,202,667 Unconsolidated indebtedness (5) 399,262 411,599 Total consolidated and unconsolidated indebtedness 2,378,756 2,614,266 Less: cash and cash equivalents 217,543 724,246 Net Debt (at JBG SMITH Share) $ 2,161,213 $ 1,890,020 |
NOI RECONCILIATIONS (NON-GAAP) (Unaudited) Adjustment to exclude straight-line rent, above/below market lease amortization and lease incentive amortization. Adjustment to include other revenue and payments associated with assumed lease liabilities related to operating properties and to exclude commercial lease termination revenue and allocated corporate general and administrative expenses to operating properties. Includes the results of our Under-Construction assets, and Near-Term and Future Development Pipelines. Includes the results of properties that were not In-service for the entirety of both periods being compared and properties for which significant redevelopment, renovation or repositioning occurred during either of the periods being compared. Includes the results of the properties that are owned, operated and In-service for the entirety of both periods being compared. 28 dollars in thousands Three Months Ended June 30, Six Months Ended June 30, 2021 2020 2021 2020 Net income (loss) attributable to common shareholders $ (2,973) $ (36,780) $ (23,704) $ 6,145 Add: Depreciation and amortization expense 56,678 52,616 121,404 101,105 General and administrative expense: Corporate and other 13,895 13,216 26,370 26,392 Third-party real estate services 25,557 29,239 54,493 58,053 Share-based compensation related to Formation Transaction and special equity awards 4,441 8,858 9,386 18,299 Transaction and Other Costs 2,270 1,372 5,960 6,681 Interest expense 16,773 15,770 33,069 27,775 Loss on extinguishment of debt — — — 33 Income tax expense (benefit) (5) (888) 4,310 (3,233) Net income (loss) attributable to redeemable noncontrolling interests (345) (3,483) (2,575) 1,767 Net loss attributable to noncontrolling interests — — (1,108) — Less: Third-party real estate services, including reimbursements revenue 26,745 27,167 64,852 56,883 Other revenue 1,904 1,516 4,090 3,146 Income (loss) from unconsolidated real estate ventures, net 3,953 (13,485) 3,010 (16,177) Interest and other income (loss), net (38) 114 (29) 1,021 Gain on sale of real estate 11,290 — 11,290 59,477 Consolidated NOI 72,437 64,608 144,392 138,667 NOI attributable to unconsolidated real estate ventures at our share 8,109 7,495 15,613 16,073 Non-cash rent adjustments (1) (4,088) (1,419) (8,853) (4,964) Other adjustments (2) 5,191 3,516 9,933 6,330 Total adjustments 9,212 9,592 16,693 17,439 NOI $ 81,649 $ 74,200 $ 161,085 $ 156,106 Less: out-of-service NOI loss (3) (1,329) (1,475) (2,619) (2,857) Operating Portfolio NOI $ 82,978 $ 75,675 $ 163,704 $ 158,963 Non-Same Store NOI (4) 6,527 (440) 11,490 (567) Same Store NOI (5) $ 76,451 $ 76,115 $ 152,214 $ 159,530 Change in same store NOI 0.4 % (4.6) % Number of properties in same store pool 56 56 |
[LOGO] |
QFTUT%HHX[44/05@HHYHI@%%%%%@"BBB@ %+110 4444@"EQ12]J0" 4444
MQBTE+FB@!*2G4AH$*.E&*!FGJ.*0Q *<, 4A--R: '\=:0\]*3.0!1]*0PP3
M3PO%-%.Q#TCS3R@%/5?E%3 *>M9N5C1(JD8[4PJ23*3Y8HP?$'@G0;C2KF46QC<+D;37.W_P '
M[&YLX7M+A S1AL.OMZUZ%J[8T:XSZ5-$P-I;_P#7-?Y5/(FS3VC2/G[Q!\)-
M1TBVENXT&R,%BZ/T%6=(4R>!%+NS;3@L>M>P^+',?A/4L,>837C6B2S?\(45
M3&PMSGZU+@HR03GS0N=E\+$ U X;
\E.3TB3N[=A7
M *9IYY+VZ.ZYF.6/]T=A5F^OI->U WK_ /'M%D6\8/;^]49R6''.<5Y]6HIO
M38ZX0Y%YBQ1M-,(U[_>/8#UJI?2I)-Y<( B3@$?Q>]6[V7[';_9(R/M$G,K#
M^$>E8%Y="W7RX^7/Z5Y]:I?1';1IO=D=]>; 88C\WM.P7"(93Y1R>,5=M[<6Z[CS*WZ4MK!]GB#,,R
MMR/:I"0RG@=#5:[!VC@UV]#-7N*.<$;>WTKMO#RAM
M*O>/^7IOYFN+^&8QXJ(Q_#U/TKNO#";M*O?^OIOYFN*3_>&T5>F79+>/8Q(X
MQTK+@C!\8O\ ]>ZXK?ECRA'M61;K_P 5E(,8Q;+6LI$PC8W#'E 1UKS_ .)T
M6/#B\#(F4YKT,9VUP'Q1.?#?08\U