false2023FY0001681622http://fasb.org/us-gaap/2023#AccountingStandardsUpdate202006MemberP3YP2Yhttp://fasb.org/us-gaap/2023#PropertyPlantAndEquipmentAndFinanceLeaseRightOfUseAssetAfterAccumulatedDepreciationAndAmortizationhttp://fasb.org/us-gaap/2023#PropertyPlantAndEquipmentAndFinanceLeaseRightOfUseAssetAfterAccumulatedDepreciationAndAmortizationhttp://fasb.org/us-gaap/2023#AccruedLiabilitiesCurrenthttp://fasb.org/us-gaap/2023#AccruedLiabilitiesCurrenthttp://fasb.org/us-gaap/2023#OtherLiabilitiesNoncurrenthttp://fasb.org/us-gaap/2023#OtherLiabilitiesNoncurrenthttp://fasb.org/us-gaap/2023#OtherLiabilitiesNoncurrenthttp://fasb.org/us-gaap/2023#OtherLiabilitiesNoncurrent0.048084http://fasb.org/us-gaap/2023#Assetshttp://fasb.org/us-gaap/2023#Assetshttp://fasb.org/us-gaap/2023#Liabilitieshttp://fasb.org/us-gaap/2023#Liabilitieshttp://fasb.org/us-gaap/2023#Assetshttp://fasb.org/us-gaap/2023#Liabilities00016816222022-10-012023-09-2900016816222023-03-31iso4217:USD00016816222023-11-08xbrli:shares00016816222023-07-012023-09-2900016816222023-09-2900016816222021-10-022022-09-3000016816222020-10-032021-10-01iso4217:USDxbrli:shares00016816222022-09-300001681622us-gaap:CommonStockMember2020-10-020001681622us-gaap:AdditionalPaidInCapitalMember2020-10-020001681622us-gaap:AccumulatedOtherComprehensiveIncomeMember2020-10-020001681622us-gaap:RetainedEarningsMember2020-10-020001681622us-gaap:ParentMember2020-10-020001681622us-gaap:NoncontrollingInterestMember2020-10-0200016816222020-10-020001681622us-gaap:RetainedEarningsMember2020-10-032021-10-010001681622us-gaap:ParentMember2020-10-032021-10-010001681622us-gaap:NoncontrollingInterestMember2020-10-032021-10-010001681622us-gaap:CommonStockMember2020-10-032021-10-010001681622us-gaap:AdditionalPaidInCapitalMember2020-10-032021-10-010001681622us-gaap:AccumulatedOtherComprehensiveIncomeMember2020-10-032021-10-010001681622us-gaap:CommonStockMember2021-10-010001681622us-gaap:AdditionalPaidInCapitalMember2021-10-010001681622us-gaap:AccumulatedOtherComprehensiveIncomeMember2021-10-010001681622us-gaap:RetainedEarningsMember2021-10-010001681622us-gaap:ParentMember2021-10-010001681622us-gaap:NoncontrollingInterestMember2021-10-0100016816222021-10-010001681622us-gaap:RetainedEarningsMember2021-10-022022-09-300001681622us-gaap:ParentMember2021-10-022022-09-300001681622us-gaap:NoncontrollingInterestMember2021-10-022022-09-300001681622us-gaap:CommonStockMember2021-10-022022-09-300001681622us-gaap:AdditionalPaidInCapitalMember2021-10-022022-09-300001681622us-gaap:AccumulatedOtherComprehensiveIncomeMember2021-10-022022-09-300001681622us-gaap:CommonStockMember2022-09-300001681622us-gaap:AdditionalPaidInCapitalMember2022-09-300001681622us-gaap:AccumulatedOtherComprehensiveIncomeMember2022-09-300001681622us-gaap:RetainedEarningsMember2022-09-300001681622us-gaap:ParentMember2022-09-300001681622us-gaap:NoncontrollingInterestMember2022-09-300001681622us-gaap:RetainedEarningsMember2022-10-012023-09-290001681622us-gaap:ParentMember2022-10-012023-09-290001681622us-gaap:NoncontrollingInterestMember2022-10-012023-09-290001681622srt:CumulativeEffectPeriodOfAdoptionAdjustmentMemberus-gaap:AdditionalPaidInCapitalMember2022-09-300001681622us-gaap:RetainedEarningsMembersrt:CumulativeEffectPeriodOfAdoptionAdjustmentMember2022-09-300001681622srt:CumulativeEffectPeriodOfAdoptionAdjustmentMemberus-gaap:ParentMember2022-09-300001681622srt:CumulativeEffectPeriodOfAdoptionAdjustmentMember2022-09-300001681622us-gaap:AdditionalPaidInCapitalMember2022-10-012023-09-290001681622us-gaap:CommonStockMember2022-10-012023-09-290001681622us-gaap:AccumulatedOtherComprehensiveIncomeMember2022-10-012023-09-290001681622us-gaap:CommonStockMember2023-09-290001681622us-gaap:AdditionalPaidInCapitalMember2023-09-290001681622us-gaap:AccumulatedOtherComprehensiveIncomeMember2023-09-290001681622us-gaap:RetainedEarningsMember2023-09-290001681622us-gaap:ParentMember2023-09-290001681622us-gaap:NoncontrollingInterestMember2023-09-29vrex:segmentvrex:entity0001681622us-gaap:RevenueFromContractWithCustomerMemberus-gaap:CustomerConcentrationRiskMembervrex:CanonMedicalSystemsCorporationFormerlyToshibaMedicalSystemsMember2022-10-012023-09-29xbrli:pure0001681622us-gaap:RevenueFromContractWithCustomerMemberus-gaap:CustomerConcentrationRiskMembervrex:CanonMedicalSystemsCorporationFormerlyToshibaMedicalSystemsMember2021-10-022022-09-300001681622us-gaap:RevenueFromContractWithCustomerMemberus-gaap:CustomerConcentrationRiskMembervrex:CanonMedicalSystemsCorporationFormerlyToshibaMedicalSystemsMember2020-10-032021-10-010001681622us-gaap:AccountsReceivableMemberus-gaap:CustomerConcentrationRiskMembervrex:CanonMedicalSystemsCorporationFormerlyToshibaMedicalSystemsMember2022-10-012023-09-290001681622us-gaap:AccountsReceivableMemberus-gaap:CustomerConcentrationRiskMembervrex:CanonMedicalSystemsCorporationFormerlyToshibaMedicalSystemsMember2021-10-022022-09-300001681622us-gaap:LandImprovementsMember2023-09-290001681622us-gaap:BuildingMember2023-09-290001681622srt:MinimumMemberus-gaap:MachineryAndEquipmentMember2023-09-290001681622us-gaap:MachineryAndEquipmentMembersrt:MaximumMember2023-09-290001681622us-gaap:LandMember2023-09-290001681622us-gaap:LandMember2022-09-300001681622vrex:BuildingsandLeaseholdImprovementsMember2023-09-290001681622vrex:BuildingsandLeaseholdImprovementsMember2022-09-300001681622us-gaap:MachineryAndEquipmentMember2023-09-290001681622us-gaap:MachineryAndEquipmentMember2022-09-300001681622us-gaap:ConstructionInProgressMember2023-09-290001681622us-gaap:ConstructionInProgressMember2022-09-300001681622us-gaap:EstimateOfFairValueFairValueDisclosureMembervrex:DpiXHoldingMember2023-07-010001681622us-gaap:CarryingReportedAmountFairValueDisclosureMembervrex:DpiXHoldingMember2023-07-010001681622srt:MinimumMember2023-09-290001681622srt:MaximumMember2023-09-29vrex:unit0001681622srt:MinimumMember2022-10-012023-09-290001681622srt:MaximumMember2022-10-012023-09-290001681622us-gaap:AccountingStandardsUpdate202006Member2022-10-010001681622us-gaap:ConvertibleDebtMembervrex:ConvertibleNotesMember2020-06-090001681622us-gaap:EquityMethodInvesteeMembervrex:DpiXHoldingMember2023-09-290001681622vrex:DpiXLLCMemberus-gaap:EquityMethodInvesteeMembervrex:DpiXHoldingMember2023-09-290001681622us-gaap:EquityMethodInvesteeMembervrex:DpiXHoldingMember2022-10-012023-09-290001681622us-gaap:EquityMethodInvesteeMembervrex:DpiXHoldingMember2021-10-022022-09-300001681622us-gaap:EquityMethodInvesteeMembervrex:DpiXHoldingMember2020-10-032021-10-010001681622us-gaap:EquityMethodInvesteeMembervrex:DpiXHoldingMember2022-09-300001681622vrex:PurchasesMembervrex:DpiXHoldingMember2022-10-012023-09-290001681622vrex:PurchasesMembervrex:DpiXHoldingMember2021-10-022022-09-300001681622vrex:PurchasesMembervrex:DpiXHoldingMember2020-10-032021-10-010001681622us-gaap:EquityMethodInvesteeMember2013-10-012013-10-300001681622vrex:DpiXHoldingMembersrt:ScenarioForecastMembervrex:FixedCostCommitmentsMember2023-01-012023-12-310001681622srt:ScenarioForecastMembervrex:FixedCostCommitmentsMemberus-gaap:EquityMethodInvesteeMembervrex:DpiXHoldingMember2023-01-012023-12-310001681622us-gaap:EquityMethodInvesteeMembervrex:VECImagingGmbHCo.KGMember2022-10-012023-09-290001681622us-gaap:EquityMethodInvesteeMembervrex:VECImagingGmbHCo.KGMember2021-10-022022-09-300001681622us-gaap:EquityMethodInvesteeMembervrex:VECImagingGmbHCo.KGMember2020-10-032021-10-010001681622us-gaap:EquityMethodInvesteeMembervrex:VECImagingGmbHCo.KGMember2023-09-290001681622us-gaap:EquityMethodInvesteeMembervrex:VECImagingGmbHCo.KGMember2022-09-300001681622vrex:MedicalSegmentMember2022-10-012023-09-290001681622vrex:MedicalSegmentMember2021-10-022022-09-300001681622vrex:MedicalSegmentMember2020-10-032021-10-010001681622us-gaap:RestrictedStockMember2022-10-012023-09-290001681622us-gaap:RestrictedStockMember2021-10-022022-09-300001681622us-gaap:RestrictedStockMember2020-10-032021-10-010001681622us-gaap:WarrantMember2022-10-012023-09-290001681622us-gaap:WarrantMember2021-10-022022-09-300001681622us-gaap:WarrantMember2020-10-032021-10-010001681622us-gaap:ConvertibleDebtMembervrex:ConvertibleNotesMember2020-06-042020-06-050001681622us-gaap:DesignatedAsHedgingInstrumentMemberus-gaap:CrossCurrencyInterestRateContractMemberus-gaap:NetInvestmentHedgingMember2022-10-012022-12-30vrex:instrument0001681622us-gaap:DesignatedAsHedgingInstrumentMemberus-gaap:CrossCurrencyInterestRateContractMemberus-gaap:NetInvestmentHedgingMember2023-09-290001681622us-gaap:CrossCurrencyInterestRateContractMember2022-10-012023-09-290001681622us-gaap:CrossCurrencyInterestRateContractMember2021-10-022022-09-300001681622us-gaap:CrossCurrencyInterestRateContractMember2020-10-032021-10-010001681622us-gaap:InterestExpenseMemberus-gaap:CrossCurrencyInterestRateContractMember2022-10-012023-09-290001681622us-gaap:InterestExpenseMemberus-gaap:CrossCurrencyInterestRateContractMember2021-10-022022-09-300001681622us-gaap:InterestExpenseMemberus-gaap:CrossCurrencyInterestRateContractMember2020-10-032021-10-010001681622us-gaap:DesignatedAsHedgingInstrumentMemberus-gaap:CrossCurrencyInterestRateContractMemberus-gaap:OtherCurrentAssetsMemberus-gaap:NetInvestmentHedgingMember2023-09-290001681622us-gaap:DesignatedAsHedgingInstrumentMemberus-gaap:CrossCurrencyInterestRateContractMemberus-gaap:OtherCurrentAssetsMemberus-gaap:NetInvestmentHedgingMember2022-09-300001681622us-gaap:DesignatedAsHedgingInstrumentMemberus-gaap:CrossCurrencyInterestRateContractMemberus-gaap:OtherNoncurrentAssetsMemberus-gaap:NetInvestmentHedgingMember2023-09-290001681622us-gaap:DesignatedAsHedgingInstrumentMemberus-gaap:CrossCurrencyInterestRateContractMemberus-gaap:OtherNoncurrentAssetsMemberus-gaap:NetInvestmentHedgingMember2022-09-300001681622us-gaap:DesignatedAsHedgingInstrumentMemberus-gaap:CrossCurrencyInterestRateContractMemberus-gaap:OtherNoncurrentLiabilitiesMemberus-gaap:NetInvestmentHedgingMember2023-09-290001681622us-gaap:DesignatedAsHedgingInstrumentMemberus-gaap:CrossCurrencyInterestRateContractMemberus-gaap:OtherNoncurrentLiabilitiesMemberus-gaap:NetInvestmentHedgingMember2022-09-300001681622us-gaap:ShortMemberus-gaap:ForeignExchangeContractMembercurrency:AUD2023-09-290001681622us-gaap:ShortMemberus-gaap:ForeignExchangeContractMembercurrency:CNY2023-09-290001681622currency:EURus-gaap:ShortMemberus-gaap:ForeignExchangeContractMember2023-09-290001681622currency:INRus-gaap:ShortMemberus-gaap:ForeignExchangeContractMember2023-09-290001681622us-gaap:ShortMemberus-gaap:ForeignExchangeContractMember2023-09-290001681622us-gaap:OtherDebtSecuritiesMember2023-09-290001681622us-gaap:OtherDebtSecuritiesMember2022-09-300001681622us-gaap:OtherDebtSecuritiesMember2022-10-012023-09-290001681622us-gaap:ConvertibleDebtMember2023-09-290001681622us-gaap:ConvertibleDebtMember2022-10-012023-09-290001681622us-gaap:ConvertibleDebtMember2022-09-300001681622us-gaap:ConvertibleDebtMember2021-10-022022-09-300001681622us-gaap:SecuredDebtMembervrex:SeniorSecuredNotesMember2023-09-290001681622us-gaap:SecuredDebtMembervrex:SeniorSecuredNotesMember2022-10-012023-09-290001681622us-gaap:SecuredDebtMembervrex:SeniorSecuredNotesMember2022-09-300001681622us-gaap:SecuredDebtMembervrex:SeniorSecuredNotesMember2021-10-022022-09-300001681622us-gaap:SecuredDebtMember2023-09-290001681622us-gaap:SecuredDebtMember2022-09-300001681622us-gaap:SecuredDebtMember2022-10-012023-09-290001681622us-gaap:ConvertibleDebtMembervrex:ConvertibleNotesMember2020-06-092020-06-090001681622us-gaap:ConvertibleDebtMembervrex:ConvertibleNotesMembersrt:MaximumMember2020-06-092020-06-090001681622us-gaap:ConvertibleDebtMembervrex:ConvertibleNotesMember2020-06-0500016816222020-06-050001681622us-gaap:ConvertibleDebtMembervrex:ConvertibleNotesMember2022-10-012023-09-290001681622us-gaap:SecuredDebtMembervrex:SeniorSecuredNotesMember2020-09-300001681622us-gaap:SecuredDebtMembervrex:SeniorSecuredNotesMember2021-07-150001681622us-gaap:SecuredDebtMembervrex:SeniorSecuredNotesMember2021-07-152021-07-150001681622us-gaap:SecuredDebtMembervrex:SeniorSecuredNotesMember2022-03-180001681622us-gaap:SecuredDebtMembervrex:SeniorSecuredNotesMember2022-03-182022-03-180001681622us-gaap:RevolvingCreditFacilityMemberus-gaap:SecuredDebtMembervrex:AssetBasedLoanRevolvingCreditFacilityMember2020-09-300001681622srt:MinimumMemberus-gaap:RevolvingCreditFacilityMemberus-gaap:SecuredDebtMembervrex:AssetBasedLoanRevolvingCreditFacilityMember2020-09-302022-03-090001681622us-gaap:RevolvingCreditFacilityMemberus-gaap:SecuredDebtMembervrex:AssetBasedLoanRevolvingCreditFacilityMembersrt:MaximumMember2020-09-302022-03-090001681622srt:MinimumMemberus-gaap:RevolvingCreditFacilityMemberus-gaap:SecuredDebtMembervrex:AssetBasedLoanRevolvingCreditFacilityMember2022-03-092022-03-090001681622us-gaap:RevolvingCreditFacilityMembervrex:ApplicableMarginRateMemberus-gaap:SecuredDebtMembervrex:AssetBasedLoanRevolvingCreditFacilityMember2022-03-092022-03-090001681622srt:MinimumMemberus-gaap:RevolvingCreditFacilityMemberus-gaap:SecuredDebtMembervrex:AssetBasedLoanRevolvingCreditFacilityMember2022-03-080001681622srt:MinimumMemberus-gaap:RevolvingCreditFacilityMemberus-gaap:SecuredDebtMembervrex:AssetBasedLoanRevolvingCreditFacilityMember2022-03-090001681622us-gaap:RevolvingCreditFacilityMemberus-gaap:SecuredDebtMembervrex:AssetBasedLoanRevolvingCreditFacilityMember2023-09-290001681622us-gaap:RevolvingCreditFacilityMemberus-gaap:SecuredDebtMembervrex:AssetBasedLoanRevolvingCreditFacilityMember2022-10-012023-09-290001681622us-gaap:ConvertibleDebtMemberus-gaap:FairValueInputsLevel1Member2023-09-290001681622us-gaap:FairValueInputsLevel1Memberus-gaap:SecuredDebtMember2023-09-290001681622us-gaap:ConvertibleDebtMemberus-gaap:FairValueInputsLevel1Member2022-09-300001681622us-gaap:FairValueInputsLevel1Memberus-gaap:SecuredDebtMember2022-09-300001681622us-gaap:FairValueInputsLevel1Memberus-gaap:FairValueMeasurementsRecurringMember2023-09-290001681622us-gaap:FairValueInputsLevel2Memberus-gaap:FairValueMeasurementsRecurringMember2023-09-290001681622us-gaap:FairValueMeasurementsRecurringMemberus-gaap:FairValueInputsLevel3Member2023-09-290001681622us-gaap:FairValueMeasurementsRecurringMember2023-09-290001681622us-gaap:FairValueInputsLevel1Memberus-gaap:FairValueMeasurementsRecurringMember2022-09-300001681622us-gaap:FairValueInputsLevel2Memberus-gaap:FairValueMeasurementsRecurringMember2022-09-300001681622us-gaap:FairValueMeasurementsRecurringMemberus-gaap:FairValueInputsLevel3Member2022-09-300001681622us-gaap:FairValueMeasurementsRecurringMember2022-09-300001681622us-gaap:CommercialPaperMember2023-09-290001681622us-gaap:CorporateBondSecuritiesMember2023-09-290001681622us-gaap:USTreasuryBillSecuritiesMember2023-09-290001681622us-gaap:USGovernmentAgenciesDebtSecuritiesMember2023-09-290001681622us-gaap:CommercialPaperMember2022-09-300001681622us-gaap:CorporateBondSecuritiesMember2022-09-300001681622us-gaap:USTreasuryBillSecuritiesMember2022-09-300001681622us-gaap:USGovernmentAgenciesDebtSecuritiesMember2022-09-300001681622us-gaap:CashAndCashEquivalentsMemberus-gaap:CommercialPaperMember2023-09-290001681622us-gaap:CashAndCashEquivalentsMemberus-gaap:CorporateBondSecuritiesMember2023-09-290001681622us-gaap:CashAndCashEquivalentsMemberus-gaap:USGovernmentAgenciesDebtSecuritiesMember2023-09-290001681622us-gaap:CashAndCashEquivalentsMemberus-gaap:USTreasuryBillSecuritiesMember2023-09-290001681622us-gaap:CashAndCashEquivalentsMember2023-09-290001681622us-gaap:PrepaidExpensesAndOtherCurrentAssetsMemberus-gaap:CommercialPaperMember2023-09-290001681622us-gaap:CorporateBondSecuritiesMemberus-gaap:PrepaidExpensesAndOtherCurrentAssetsMember2023-09-290001681622us-gaap:USGovernmentAgenciesDebtSecuritiesMemberus-gaap:PrepaidExpensesAndOtherCurrentAssetsMember2023-09-290001681622us-gaap:PrepaidExpensesAndOtherCurrentAssetsMemberus-gaap:USTreasuryBillSecuritiesMember2023-09-290001681622us-gaap:PrepaidExpensesAndOtherCurrentAssetsMember2023-09-290001681622us-gaap:CashAndCashEquivalentsMemberus-gaap:CommercialPaperMember2022-09-300001681622us-gaap:CashAndCashEquivalentsMemberus-gaap:CorporateBondSecuritiesMember2022-09-300001681622us-gaap:CashAndCashEquivalentsMemberus-gaap:USGovernmentAgenciesDebtSecuritiesMember2022-09-300001681622us-gaap:CashAndCashEquivalentsMemberus-gaap:USTreasuryBillSecuritiesMember2022-09-300001681622us-gaap:CashAndCashEquivalentsMember2022-09-300001681622us-gaap:PrepaidExpensesAndOtherCurrentAssetsMemberus-gaap:CommercialPaperMember2022-09-300001681622us-gaap:CorporateBondSecuritiesMemberus-gaap:PrepaidExpensesAndOtherCurrentAssetsMember2022-09-300001681622us-gaap:USGovernmentAgenciesDebtSecuritiesMemberus-gaap:PrepaidExpensesAndOtherCurrentAssetsMember2022-09-300001681622us-gaap:PrepaidExpensesAndOtherCurrentAssetsMemberus-gaap:USTreasuryBillSecuritiesMember2022-09-300001681622us-gaap:PrepaidExpensesAndOtherCurrentAssetsMember2022-09-300001681622us-gaap:OtherAssetsMemberus-gaap:CommercialPaperMember2022-09-300001681622us-gaap:OtherAssetsMemberus-gaap:CorporateBondSecuritiesMember2022-09-300001681622us-gaap:OtherAssetsMemberus-gaap:USGovernmentAgenciesDebtSecuritiesMember2022-09-300001681622us-gaap:OtherAssetsMemberus-gaap:USTreasuryBillSecuritiesMember2022-09-300001681622us-gaap:OtherAssetsMember2022-09-300001681622vrex:MedicalSegmentMember2022-09-300001681622vrex:IndustrialSegmentMember2022-09-300001681622vrex:IndustrialSegmentMember2022-10-012023-09-290001681622vrex:MedicalSegmentMember2023-09-290001681622vrex:IndustrialSegmentMember2023-09-290001681622us-gaap:DevelopedTechnologyRightsMember2023-09-290001681622us-gaap:DevelopedTechnologyRightsMember2022-09-300001681622us-gaap:IntellectualPropertyMember2023-09-290001681622us-gaap:IntellectualPropertyMember2022-09-300001681622vrex:CustomerContractsandSupplierRelationshipsMember2023-09-290001681622vrex:CustomerContractsandSupplierRelationshipsMember2022-09-300001681622vrex:JointVentureInSaudiArabiaMember2018-09-300001681622vrex:MeVisMedicalSolutionsAGMeVisMember2015-04-300001681622vrex:MeVisMedicalSolutionsAGMeVisMember2015-10-012015-10-31iso4217:EURxbrli:shares0001681622vrex:MeVisMedicalSolutionsAGMeVisMember2015-10-310001681622vrex:MeVisMedicalSolutionsAGMeVisMember2018-09-282018-09-280001681622vrex:MeVisMedicalSolutionsAGMeVisMember2017-09-292017-09-290001681622vrex:MeVisMedicalSolutionsAGMeVisMember2018-12-310001681622vrex:MeVisMedicalSolutionsAGMeVisMember2023-09-290001681622vrex:MeVisMedicalSolutionsAGMeVisMembervrex:MeVisMedicalSolutionsAGMeVisMember2023-09-290001681622vrex:A2017ESPPMemberus-gaap:EmployeeStockMember2017-01-012017-01-310001681622vrex:A2017ESPPMemberus-gaap:EmployeeStockMember2021-10-022022-09-300001681622vrex:A2017ESPPMemberus-gaap:EmployeeStockMember2023-09-290001681622us-gaap:CostOfSalesMember2022-10-012023-09-290001681622us-gaap:CostOfSalesMember2021-10-022022-09-300001681622us-gaap:CostOfSalesMember2020-10-032021-10-010001681622us-gaap:ResearchAndDevelopmentExpenseMember2022-10-012023-09-290001681622us-gaap:ResearchAndDevelopmentExpenseMember2021-10-022022-09-300001681622us-gaap:ResearchAndDevelopmentExpenseMember2020-10-032021-10-010001681622us-gaap:SellingGeneralAndAdministrativeExpensesMember2022-10-012023-09-290001681622us-gaap:SellingGeneralAndAdministrativeExpensesMember2021-10-022022-09-300001681622us-gaap:SellingGeneralAndAdministrativeExpensesMember2020-10-032021-10-010001681622us-gaap:EmployeeStockOptionMember2023-09-290001681622us-gaap:EmployeeStockOptionMember2022-10-012023-09-290001681622vrex:A2020OmnibusStockPlanMemberus-gaap:EmployeeStockOptionMember2023-09-290001681622vrex:A2017ESPPMemberus-gaap:EmployeeStockOptionMember2023-09-290001681622us-gaap:EmployeeStockOptionMember2021-10-022022-09-300001681622us-gaap:EmployeeStockOptionMember2020-10-032021-10-010001681622us-gaap:EmployeeStockMember2022-10-012023-09-290001681622us-gaap:EmployeeStockMember2021-10-022022-09-300001681622us-gaap:EmployeeStockMember2020-10-032021-10-010001681622vrex:A2017ESPPMemberus-gaap:EmployeeStockMember2022-10-012023-09-290001681622srt:MinimumMember2022-09-300001681622srt:MaximumMember2022-09-300001681622us-gaap:ForeignCountryMember2023-09-290001681622vrex:IndustrialSegmentMember2021-10-022022-09-300001681622vrex:IndustrialSegmentMember2020-10-032021-10-010001681622srt:AmericasMember2022-10-012023-09-290001681622srt:AmericasMember2021-10-022022-09-300001681622srt:AmericasMember2020-10-032021-10-010001681622srt:AmericasMember2023-09-290001681622srt:AmericasMember2022-09-300001681622us-gaap:EMEAMember2022-10-012023-09-290001681622us-gaap:EMEAMember2021-10-022022-09-300001681622us-gaap:EMEAMember2020-10-032021-10-010001681622us-gaap:EMEAMember2023-09-290001681622us-gaap:EMEAMember2022-09-300001681622srt:AsiaPacificMember2022-10-012023-09-290001681622srt:AsiaPacificMember2021-10-022022-09-300001681622srt:AsiaPacificMember2020-10-032021-10-010001681622srt:AsiaPacificMember2023-09-290001681622srt:AsiaPacificMember2022-09-300001681622country:US2022-10-012023-09-290001681622country:US2021-10-022022-09-300001681622country:US2020-10-032021-10-010001681622us-gaap:AccumulatedGainLossCashFlowHedgeIncludingNoncontrollingInterestMember2021-10-010001681622us-gaap:AccumulatedDefinedBenefitPlansAdjustmentIncludingPortionAttributableToNoncontrollingInterestMember2021-10-010001681622us-gaap:AccumulatedForeignCurrencyAdjustmentIncludingPortionAttributableToNoncontrollingInterestMember2021-10-010001681622us-gaap:AccumulatedNetInvestmentGainLossIncludingPortionAttributableToNoncontrollingInterestMember2021-10-010001681622us-gaap:AociIncludingPortionAttributableToNoncontrollingInterestMember2021-10-010001681622us-gaap:AccumulatedGainLossCashFlowHedgeIncludingNoncontrollingInterestMember2021-10-022022-09-300001681622us-gaap:AccumulatedDefinedBenefitPlansAdjustmentIncludingPortionAttributableToNoncontrollingInterestMember2021-10-022022-09-300001681622us-gaap:AccumulatedForeignCurrencyAdjustmentIncludingPortionAttributableToNoncontrollingInterestMember2021-10-022022-09-300001681622us-gaap:AccumulatedNetInvestmentGainLossIncludingPortionAttributableToNoncontrollingInterestMember2021-10-022022-09-300001681622us-gaap:AccumulatedGainLossCashFlowHedgeIncludingNoncontrollingInterestMember2022-09-300001681622us-gaap:AccumulatedDefinedBenefitPlansAdjustmentIncludingPortionAttributableToNoncontrollingInterestMember2022-09-300001681622us-gaap:AccumulatedForeignCurrencyAdjustmentIncludingPortionAttributableToNoncontrollingInterestMember2022-09-300001681622us-gaap:AccumulatedNetInvestmentGainLossIncludingPortionAttributableToNoncontrollingInterestMember2022-09-300001681622us-gaap:AociIncludingPortionAttributableToNoncontrollingInterestMember2022-09-300001681622us-gaap:AccumulatedGainLossCashFlowHedgeIncludingNoncontrollingInterestMember2022-10-012023-09-290001681622us-gaap:AccumulatedDefinedBenefitPlansAdjustmentIncludingPortionAttributableToNoncontrollingInterestMember2022-10-012023-09-290001681622us-gaap:AccumulatedForeignCurrencyAdjustmentIncludingPortionAttributableToNoncontrollingInterestMember2022-10-012023-09-290001681622us-gaap:AccumulatedNetInvestmentGainLossIncludingPortionAttributableToNoncontrollingInterestMember2022-10-012023-09-290001681622us-gaap:AccumulatedGainLossCashFlowHedgeIncludingNoncontrollingInterestMember2023-09-290001681622us-gaap:AccumulatedDefinedBenefitPlansAdjustmentIncludingPortionAttributableToNoncontrollingInterestMember2023-09-290001681622us-gaap:AccumulatedForeignCurrencyAdjustmentIncludingPortionAttributableToNoncontrollingInterestMember2023-09-290001681622us-gaap:AccumulatedNetInvestmentGainLossIncludingPortionAttributableToNoncontrollingInterestMember2023-09-290001681622us-gaap:AociIncludingPortionAttributableToNoncontrollingInterestMember2023-09-29
UNITED STATES
SECURITIES AND EXCHANGE COMMISSION
Washington, D.C. 20549
____________________________________________________________
FORM 10-K
____________________________________________________________
| | | | | |
☒ | ANNUAL REPORT PURSUANT TO SECTION 13 or 15(d) OF THE SECURITIES EXCHANGE ACT OF 1934 |
For the fiscal year ended September 29, 2023
or
| | | | | |
☐ | TRANSITION REPORT PURSUANT TO SECTION 13 or 15(d) OF THE SECURITIES EXCHANGE ACT OF 1934 |
For the transition period from to
Commission File Number 001-37860
____________________________________________________________
VAREX IMAGING CORPORATION
(Exact name of registrant as specified in its charter)
| | | | | | | | | | | |
Delaware | | | 81-3434516 |
(State or other jurisdiction of incorporation or organization) | | | (I.R.S. Employer Identification No.) |
| | | |
1678 S. Pioneer Road, Salt Lake City, Utah | | | 84104 |
(Address of principal executive offices) | | | (Zip Code) |
(801) 972-5000
(Registrant’s telephone number, including area code)
____________________________________________________________
Securities registered pursuant to Section 12(b) of the Act:
| | | | | | | | |
Title of each class | Trading Symbol(s) | Name of each exchange on which registered |
Common Stock | VREX | The Nasdaq Global Select Market |
Securities registered pursuant to Section 12(g) of the Act: None
Indicate by check mark if the registrant is a well-known seasoned issuer, as defined in Rule 405 of the Securities Act. Yes ¨ No ý
Indicate by check mark if the registrant is not required to file reports pursuant to Section 13 or Section 15(d) of the Exchange Act. Yes ¨ No ý
Indicate by check mark whether the registrant: (1) has filed all reports required to be filed by Section 13 or 15(d) of the Securities Exchange Act of 1934 during the preceding 12 months (or for such shorter period that the registrant was required to file such reports), and (2) has been subject to such filing requirements for the past 90 days. Yes ý No ¨
Indicate by check mark whether the registrant has submitted electronically every Interactive Data File required to be submitted pursuant to Rule 405 of Regulation S-T (§232.405 of this chapter) during the preceding 12 months (or for such shorter period that the registrant was required to submit such files). Yes ý No ¨
Indicate by check mark whether the registrant is a large accelerated filer, an accelerated filer, a non-accelerated filer, a smaller reporting company, or an emerging growth company. See the definitions of “large accelerated filer,” “accelerated filer,” “smaller reporting company,” and “emerging growth company” in Rule 12b-2 of the Exchange Act.
| | | | | | | | | | | | | | | | | | | | |
|
| | | | | | |
Large Accelerated filer | | ☒ | | Accelerated filer | | ☐ |
| | | | | | |
Non-Accelerated filer | | ☐ | | Smaller reporting company | | ☐ |
| | | | | | |
| | | | Emerging growth company | | ☐ |
| | | | | | |
If an emerging growth company, indicate by check mark if the registrant has elected not to use the extended transition period for complying with any new or revised financial accounting standards provided pursuant to Section 13(a) of the Exchange Act. | | ☐ |
Indicate by check mark whether the registrant has filed a report on and attestation to its management’s assessment of the effectiveness of its internal control over financial reporting under Section 404(b) of the Sarbanes-Oxley Act (15 U.S.C. 7262(b)) by the registered public accounting firm that prepared or issued its audit report. ☒
If securities are registered pursuant to Section 12(b) of the Act, indicate by check mark whether the financial statements of the registrant included in the filing reflect the correction of an error to previously issued financial statements. ☐
Indicate by check mark whether any of those corrections are restatements that required a recovery analysis of incentive-based compensation received by any of the registrant’s executive officers during the relevant recovery period pursuant to §240.10D-1(b). ☐
Indicate by check mark whether the registrant is a shell company (as defined in Rule 12b-2 of the Exchange Act). Yes ☐ No ☒
As of March 31, 2023, the last business day of the registrant’s most recently completed second fiscal quarter, the aggregate market value of shares of the registrant’s common stock held by non-affiliates of the registrant (based upon the closing sale price of such shares on the NASDAQ Global Select Market on March 31, 2023) was approximately $728.7 million.
As of November 8, 2023, there were 40.5 million shares of the registrant’s common stock outstanding.
Documents Incorporated by Reference
Portions of registrant’s proxy statement relating to registrant’s 2024 annual meeting of stockholders are incorporated by reference in Part III of this annual report on Form 10-K.
VAREX IMAGING CORPORATION
INDEX
Forward-Looking Statements
This Annual Report on Form 10-K (this “Annual Report”), including the section entitled “Management’s Discussion and Analysis of Financial Condition and Results of Operations” (“MD&A”) contains “forward-looking” statements within the meaning of the Private Securities Litigation Reform Act of 1995, which provides a "safe harbor" for statements about future events, products and financial performance that are based on the beliefs of, estimates made by, and information currently available to the management of Varex Imaging Corporation (“we,” “our,” “us,” the “Company,” or “Varex,”). Actual results and the outcome or timing of certain events described in these forward-looking statements are subject to risk and uncertainties and may differ significantly from those projected in these forward-looking statements. Important factors that could cause our actual results and financial condition to differ significantly from those projections or expectations include, among other things, include the following:
•reduction in or loss of business of one or more of our limited original equipment manufacturing (“OEM”) customers;
•loss of business to, and an inability to effectively compete with, competitors;
•pricing pressures and other factors that could result in margin erosion;
•failure to meet customers’ needs and demands;
•global, regional, and country-specific economic instability, shifting political environments, changing tax treatment, reactionary import/export regulatory regimes, and other risks associated with international manufacturing, operations, and sales;
•supply chain disruptions resulting in delayed product delivery, and increased costs as a result of reliance on a limited number of suppliers for certain key components;
•inability to maintain or defend our intellectual property rights, and high cost of protecting our intellectual property and defending against infringement claims;
•disruption of critical information systems or material breaches in the security of our systems;
•noncompliance with regulations applicable to marketing, manufacturing, labeling, and distributing our products and delays in obtaining regulatory clearances or approvals;
•and other factors cited in Risk Factors listed under Item 1A of this Annual Report, Business and MD&A and other factors describe from time to time in our other filing with the U.S. Securities and Exchange Commission (“SEC”), or other reasons.
Statements concerning supply chain and logistics challenges; cost increases and expense management; changes in U.S. and worldwide economic conditions, such as the impact of inflation, and fluctuations in foreign currency exchange rates; geopolitical tensions; industry or market segment outlook; market acceptance of or transition to new products or technology such as advanced X-ray tube and digital flat panel detector products; growth drivers; future orders, revenues, backlog, earnings or other financial results; and any statements using the terms “believe,” “expect,” “anticipate,” “can,” “should,” “would,” “could,” “estimate,” “may,” “intend,” “potential,” and “possible” or similar statements are forward-looking statements that involve risks and uncertainties that could cause our actual results and the outcome and timing of certain events to differ materially from those projected or management’s current expectations.
Any forward-looking statement made in this Annual Report (including in any exhibits or documents incorporated by reference) is based only on information currently available to Varex and its management and speaks only as of the date on which it is made. We have not assumed any obligation to, and you should not expect us to, update or revise those statements because of new information, future events or otherwise.
PART I
Item 1. Business
Overview
Varex Imaging Corporation is a leading innovator, designer and manufacturer of X-ray imaging components including X-ray tubes, flat panel and photon counting detectors and accessories, linear accelerators, image software processing solutions and stand-alone X-ray based systems in select application areas. Our components are used in medical diagnostic imaging, security inspection systems, and industrial quality inspection systems, as well as for analysis and measurement applications in industrial manufacturing applications. Global OEMs incorporate our X-ray imaging components into their systems to detect, diagnose, protect, irradiate and inspect. Varex has approximately 2,400 full-time equivalent employees, located at engineering, manufacturing and service center sites in North America, Europe, and Asia.
Our products are sold in three geographic regions: the Americas, EMEA, and APAC. The Americas includes North America (primarily the United States) and Latin America. EMEA includes Europe, the Middle East, India and Africa. APAC includes Asia (other than India) and Australia. Revenues by region are based on the known final destination of products sold.
Our success depends, among other things, on our ability to anticipate and respond to changes in our markets, the direction of technological innovation and the demand from our customers. We continually invest in research and development and employ approximately 400 individuals in product development related activities. Our focus on innovation and product performance along with strong and long-term customer relationships allows us to collaborate with our customers to bring industry-leading products to the X-ray imaging market. We continue to work to improve the life and quality of our imaging components and leverage our scale as one of the largest independent X-ray imaging component suppliers to provide cost-effective solutions for our customers.
Operating Segments and Products
We have two reportable operating segments: Medical and Industrial. The segments align our products and service offerings with customer use in medical and industrial markets.
Medical
In our Medical segment, we design, manufacture, sell and service X-ray imaging components, including X-ray tubes, flat panel and photon counting detectors and accessories, high voltage connectors, image-processing software and workstations, 3D reconstruction software, computer-aided diagnostic software, collimators, automatic exposure control devices, generators, and coolers. These components are used in a range of medical imaging applications including CT, mammography, oncology, cardiac, surgery, dental, fluoroscopy, and other diagnostic radiography uses.
Our X-ray imaging components are primarily sold to OEM customers. These OEM customers then design-in our products to their X-ray imaging systems for a variety of medical modalities. A substantial majority of medical X-ray imaging OEMs globally are our customers, and many of these have been our customers for over 35 years. We believe one of the reasons for customer loyalty is that our hardware and software products are tightly integrated with our customers' systems. We work very closely with our customers to create custom built components for their systems based on technology platforms that we have developed. Because our products are often customized for our customers' specific equipment, it can be costly and complex for our customers to switch to another provider. Once our components are designed into our customers' equipment, our customers will typically continue to buy from us for any replacement components and for service and support for that equipment. Some of our products are also included in product registrations for our customers' equipment that require regulatory approval to change. In addition to sales to OEM customers, we sell our products to independent service companies and distributors as well as directly to end-users for replacement purposes.
We are one of the largest independent global manufacturers of X-ray imaging components, and each year, we produce over 27,000 X-ray tubes and 20,000 X-ray detectors. We estimate that our world-wide installed base of products includes more than 160,000 X-ray tubes, 170,000 X-ray detectors, 600,000 connect and control components and 16,500 software instances. Replacement and service of our existing installed base makes up a significant portion of our revenue. Many of our components need to be replaced regularly depending upon usage and other factors. For example, CT X-ray tubes generally need to be replaced every 2 to 6 years, in comparison to a general radiography tube which can last up to 10 years, depending on utilization. In China, the replacement cycle for CT X-ray tubes currently can be as frequent as every 10 to 20 months due to high utilization of imaging equipment. Other products such as X-ray detectors have a useful life of as much as 7 years or more, but can require more frequent service and repairs during their useful life. In addition, our detector customers often elect to upgrade products to newer technology before the end of a current product’s useful life. X-ray imaging software is a relatively small part of our business and includes maintenance revenue for software licenses.
In China, the government is broadening the availability of healthcare services. As a result, the number of diagnostic X-ray imaging systems, including CT, has grown significantly. We are developing CT X-ray tubes and related subsystems for Chinese OEMs as they introduce new systems in China. Over the long-term, our objective is to become the partner of choice both for OEMs and in the replacement market as CT systems become more widely adopted throughout the Chinese market.
In recent years our business in China has been impacted by the trade war with the United States in three principal ways: (1) importing raw materials from China to the United States has become more expensive, (2) importing raw materials and sub-assemblies from the United States to China has become more expensive, and (3) importing finished United States manufactured products into China has become more difficult and expensive. While the governments of both the United States and China have granted tariff exclusions that temporarily eliminate the additional duties payable for specific commodities, providing partial relief, these exclusions are temporary and/or must be solicited and approved on a shipment-by-shipment basis. There is no guarantee that such exclusions will be granted or extended by either government, and the U.S. tariff exclusions are set to expire on December 31, 2023 unless extended. In order to mitigate the impact of tariffs on materials imported from China, we have implemented changes to secure more non-China sources of materials used to manufacture our X-ray imaging products. To help mitigate the impact of tariffs on materials imported to China, and to be closer to our global customer base, we continue to expand manufacturing capabilities at our facilities in China, Germany, the Netherlands and the Philippines. We have also implemented local sourcing strategies to offer local content. This local-for-local strategy has been well received by both our local customers as well as global OEMs, and acts as a natural hedge against trade wars and other potential supply chain disruptions. Our mitigation efforts could prove less effective than anticipated if rising tensions between China and Taiwan lead to worsening trade relations between China and the United States.
Industrial
In our Industrial segment, we design, develop, manufacture, sell and service X-ray imaging products for use in a number of markets, including security applications for cargo screening at ports and borders, baggage screening at airports, and nondestructive testing, irradiation, and inspection applications used in a number of other vertical markets. Our industrial products include Linatron® X-ray linear accelerators, X-ray tubes, flat panel and photon counting detectors, computed radiography scanners, high voltage connectors, and coolers. In addition, we license proprietary image-processing and detection software designed to work with other Varex products to provide packaged sub-assembly solutions to our industrial customers. Our Industrial business benefits from the research and development investment and manufacturing economies of scale on the Medical side of our business, as we continue to find new applications for our technology. Along with more favorable pricing dynamics, this allows us to generally achieve higher gross profit for industrial products relative to our Medical business. In addition, our Industrial business benefits from our long-term service agreements for our Linatron® products.
The security market primarily consists of cargo security for the screening of trucks, trains, and cargo containers at ports and borders as well as airport security for checked baggage and palletized cargo. The end customers for border protection systems are typically government agencies, many of which are in oil-based economies and war zones where there can be significant variation in buying patterns.
Non-destructive testing and inspection verticals utilize X-ray imaging to scan items for inspection of manufacturing defects and product integrity in a wide range of industries including aerospace, automotive, electronics, oil and gas, food packaging, metal castings and additive manufacturing. In addition, new applications for X-ray sources are being developed, such as sterilization of food and its packaging. We provide X-ray sources, digital detectors, high voltage connectors and image processing software to OEM customers, system integrators, and manufacturers in a variety of these verticals. We believe that the non-destructive testing market represents a significant growth opportunity for our business, and we are actively pursuing new potential applications for our products.
Customers
Our customers are primarily large OEMs. Our top five customers, measured by revenue, are Canon Medical Systems Corporation (“Canon”), United Imaging Healthcare, General Electric Company, Siemens Healthineers AG, and Elekta AB, which collectively accounted for approximately 39% of total revenue in fiscal year 2023. Our largest customer, Canon, accounted for approximately 17%, 17% and 18% of our total revenue for fiscal years 2023, 2022, and 2021, respectively, while our ten largest customers as a group accounted for approximately 51%, 52% and 51% of our revenue for fiscal years 2023, 2022 and 2021, respectively.
Competition
The imaging components market is highly competitive. OEMs may choose to develop and manufacture X-ray imaging components in-house or they may choose to out-source to a supplier such as Varex or our competitors. Our success depends upon our ability to anticipate changes in our markets, the direction of technological innovation and the demand from our customers. To remain competitive, we must continually invest in research and development focused on innovation, improve product performance and quality, and continue to reduce the cost of our imaging components. Significant capital investment is required to manufacture imaging components. We believe we have sufficient manufacturing scale to leverage our high volume to reduce overall costs by spreading fixed costs over more units.
Medical
We often compete with the in-house X-ray tube manufacturing operations of major diagnostic imaging systems companies, which are the primary OEM customers for our Medical products. To effectively compete with these in-house capabilities, we must have a competitive advantage in one or more significant areas, such as innovative technology and greater product performance, better product quality, better product availability, or lower product price. We sell a significant volume of our X-ray tubes to OEM customers that have in-house X-ray tube production capability. In addition, we compete with some OEM customers, such as Canon, Philips Healthcare and other companies who sell X-ray tubes to smaller OEMs and other manufacturers, such as Industria Applicazioni Elettroniche S.p.A, as well as emerging X-ray tube manufacturers in China. High capital costs and mastery of complex manufacturing processes that drive production yield and product life are significant characteristics of the X-ray tube business.
The market for digital detectors is highly competitive. We sell our digital detectors to a number of OEM customers that incorporate our detectors into their medical diagnostic, oncology, 3D dental and veterinary imaging systems. Our amorphous silicon based digital detector technology, our photon counting technology, and our complementary metal-oxide-semiconductor technology compete with other detector technologies, such as amorphous selenium, charge-coupled devices, and variations of amorphous silicon scintillators. We believe that our products provide a competitive advantage due to product quality and performance and lower total cost of ownership over the product lifecycle. In the digital flat panel detector market, we primarily compete against Trixell S.A.S., Canon, Vieworks Co., Ltd., Hamamatsu Corporation, iRay Technology (Shanghai) Limited, and Jiangsu CareRay Medical Systems Co., Ltd.
Industrial
In the low-energy market of the Industrial segment, we compete with other OEM suppliers, such as iRay, Teledyne, and Comet AG. While there are other manufacturers of low-energy X-ray tubes and digital detectors for specialized and niche industrial applications, our products are designed for a broad range of applications in inspection, analysis, and non-destructive testing. In the high-energy market, we compete against technologies from Nuctech Company Limited, Siemens AG, ETM Electromatic Inc., and PMB Alcen, whose X-ray sources are used in applications that include cargo and container scanning, border security, aerospace applications, castings, and pressure vessel inspections.
Customer Services and Support
We generally warrant our products for 12 to 24 months. In certain cases, the warranty is specified by usage metrics such as number of scans. We provide technical advice and consultation to major OEM customers from our U.S. offices in Utah, California, Nevada, New York, Texas, and Illinois; and internationally in the Philippines, China, the Netherlands, Germany, France, Sweden, Switzerland, Finland, the United Kingdom, Italy, and Japan. Our application specialists and engineers make recommendations to meet the customer’s technical requirements within the customer’s budgetary constraints. We often develop specifications for a unique product that will be designed and manufactured to meet a specific customer’s requirements.
Manufacturing and Supplies
We manufacture our products at facilities in Salt Lake City, Utah; Las Vegas, Nevada; Liverpool, New York; Franklin Park, Illinois; Houston, Texas; Borden, United Kingdom; Doetinchem, the Netherlands; Walluf and Bremen, Germany; Espoo, Finland; Calamba City, Philippines; and Wuxi, China. These facilities employ state-of-the-art manufacturing techniques and several have been recognized by the press, governments, and trade organizations for their commitment to quality improvement. Each of these manufacturing facilities are certified by the International Standards Organization (“ISO”) under ISO 9001 (for industrial products) or ISO 13485 (for medical devices). In addition, we have a regional service center in Willich, Germany. The combined medical and industrial manufacturing infrastructure enables us to leverage production scale to achieve productivity and low cost advantage as well as research and development synergies.
Manufacturing processes at our various facilities include machining, fabrication, subassembly, system assembly, and final testing. We have invested in various automated and semi-automated equipment for the fabrication and machining of the parts and assemblies that we incorporate into our products. We may, from time to time, invest further in such equipment. Our quality assurance program includes various quality control measures from inspection of raw materials, purchased parts, and assemblies through in-line inspection. In some cases, we outsource the manufacturing of sub-assemblies while still performing system design, final assembly, and testing in-house. In such cases, we believe outsourcing enables us to reduce or maintain fixed costs and capital expenditures, while also providing the flexibility to increase production capacity. We purchase material and components from various suppliers that are either standard products or customized to our specifications. Some of the components included in our products may be sourced from a limited group of suppliers or from a single source supplier, such as transistor arrays and cesium iodide coatings for digital detectors and specialized integrated circuits, X-ray tube targets, housings, bearings, and various other components. We require certain raw materials, such as copper, nickel, silver, gold, lead, tungsten, iridium, rhenium, molybdenum, rhodium, niobium, zirconium, beryllium, and various high grades of steel alloy for X-ray tubes and industrial products. Worldwide demand, availability and pricing of these raw materials have been volatile, and we expect that availability and pricing will continue to fluctuate in the future.
Research and Development
Innovation and developing products, systems, and services based on advanced technology is essential to our ability to compete effectively in the marketplace. We maintain a research and development and engineering staff responsible for product design and engineering.
Research and development are primarily conducted domestically at our facilities in Salt Lake City, Utah; San Jose, California; Las Vegas, Nevada; Liverpool, New York; and Franklin Park, Illinois and internationally at our facilities in the Netherlands, UK, Sweden, Finland and Germany. Our research and development activities are primarily focused on developing and improving imaging component technology. Current X-ray source development areas include smaller footprint linear accelerators, improvements to tube life and tube stability, reductions of tube noise, and tube designs that will enable OEMs to continue to reduce dose delivered and improve image resolution, cost effectively. Research in digital detector imaging technology is aimed at developing new panel technologies (such as photon counting) with better dose utilization, improved image quality and materials discrimination, lower product costs, and new image processing tools for advanced applications.
Industrial products share some of the same base technology competencies and platforms as medical products and our medical and industrial development teams are therefore co-located in Salt Lake City, Utah; San Jose, California; Doetinchem, Netherlands; Danderyd, Sweden; Espoo, Finland; and Walluf, Germany. One of our competitive advantages is that some of the foundational technologies and software components developed for medical applications may also be applicable in industrial components, and vice versa. In addition to these product development synergies, we are also able to realize sourcing, production, service center, and logistics synergies across the different products and market sectors.
Product and Other Liabilities
Our business exposes us to potential product liability claims that are inherent in the manufacture, sale, installation, servicing and support of X-ray imaging devices, related software and other devices that contain hazardous material or deliver radiation. Because our products are involved in the intentional delivery of radiation to the human body and other situations where people may come in contact with radiation (for example, when our Industrial products are being used to scan cargo) as well as the detection, planning, and treatment of medical problems, the possibility for significant injury or death exists if our products fail to work or are not used properly. We may face substantial liability to patients, our customers and others for damages resulting from the faulty, or allegedly faulty, design, manufacture, installation, servicing, support, testing, or interoperability of our products and our customers’ products, or their misuse or failure. We may also be subject to claims for property damages or economic loss related to or resulting from any errors or defects in our products, or the installation, servicing, and support of our products. Any accident or mistreatment could subject us to legal costs, litigation, adverse publicity, and damage to our reputation, whether or not our products or services were a factor. In addition, if a product we design or manufacture were defective (whether due to design, labeling or manufacturing defects, improper use of the product, or other reasons), or found to be so by a regulatory authority, we may be required to correct or recall the product and notify other regulatory authorities. We maintain limited product liability, professional liability, and omissions liability insurance coverage.
Government Regulation
U.S. Regulations
Laws governing marketing of medical devices. In the United States, as a manufacturer and seller of medical devices and devices emitting radiation or utilizing radioactive by-product material, we and some of our suppliers and distributors are subject to extensive regulation by federal governmental authorities, such as the U.S. Food and Drug Administration (the “FDA”), the Nuclear Regulatory Commission (“NRC”), and state and local regulatory agencies, to ensure the devices are safe and effective and comply with laws governing products that emit, produce, or control radiation. Similar international regulations apply overseas. These regulations, which include the U.S. Food, Drug and Cosmetic Act (the “FDC Act”) and regulations promulgated by the FDA, govern, among other things, the design, development, testing, manufacturing, packaging, labeling, distribution, import/export, sale and marketing and disposal of medical devices, post market surveillance, and reporting of serious injuries and death, repairs, replacements, recalls, and other matters relating to medical devices, radiation emitting devices, and devices utilizing radioactive by-product material. State regulations are extensive and vary from state to state. Our X-ray tube products, imaging workstations, and flat panel detectors are considered medical devices. Under the FDC Act, each medical device manufacturer must comply with quality system regulations that are strictly enforced by the FDA.
Unless an exception applies, the FDA requires that the manufacturer of a new medical device or a new indication for use of, or other significant change in, an existing currently marketed medical device obtain 510(k) pre-market notification clearance before it can market or sell those products in the United States. The 510(k) clearance process is applicable when the device introduced into commercial distribution is substantially equivalent to a legally marketed device. Obtaining the 510(k) clearance generally takes at least six months from the date an application is filed, but could take significantly longer, and generally requires submitting supporting testing data. After a product receives 510(k) clearance, any modifications or enhancements to a product that could significantly affect its safety or effectiveness, or that would constitute a major change in the intended use of the device, technology, materials, labeling, packaging, or manufacturing process may require a new 510(k) clearance. The FDA requires each manufacturer to make this determination in the first instance, but the FDA can review any such decision. If the FDA disagrees with the manufacturer’s decision, it may retroactively require the manufacturer to submit a request for 510(k) pre-market notification clearance and may require the manufacturer to cease marketing and recall the product until 510(k) clearance is obtained. The FDA adopted guidance in September 2019 that we expect will increase the number and frequency of clearances for changes made to legally marketed devices. Most of our products are non-classified or Class I medical devices, which do not require 510(k) clearance.
Quality systems. Our manufacturing operations for medical devices, and those of our third-party manufacturers, are required to comply with the FDA’s Quality System Regulation (“QSR”), which addresses a company’s responsibility for product design, testing, and manufacturing quality assurance, and the maintenance of records and documentation. The QSR requires that each manufacturer establish a quality systems program by which the manufacturer monitors the manufacturing process and maintains records that show compliance with FDA regulations and the manufacturer’s written specifications and procedures relating to the devices. QSR compliance is necessary to receive and maintain FDA clearance or approval to market new and existing products. The FDA makes announced and unannounced periodic and ongoing inspections of medical device manufacturers to determine compliance with the QSR. If in connection with these inspections the FDA believes the manufacturer has failed to comply with applicable regulations and/or procedures, it may issue observations that would necessitate prompt corrective action. If FDA inspection observations are not addressed and/or corrective action is not taken in a timely manner and to the FDA’s satisfaction, the FDA may issue a warning letter (which would similarly necessitate prompt corrective action) and/or proceed directly to other forms of
enforcement action. Failure to respond timely to FDA inspection observations, a warning letter, or other notice of noncompliance and to promptly come into compliance could result in the FDA bringing enforcement action against us, which could include the total shutdown of our production facilities, denial of importation rights to the United States for products manufactured in overseas locations, and denial of export rights for U.S. products and criminal and civil fines.
The FDA and the Federal Trade Commission (the “FTC”) regulate advertising and promotion of our products to ensure that the claims we make are consistent with our regulatory clearances, that we have adequate and reasonable scientific data to substantiate our claims and that our promotional labeling and advertising is neither false nor misleading. We may not promote or advertise our products for uses not within the scope of our intended use statement in our clearances or approvals or make unsupported safety and effectiveness claims.
It is also important that our products comply with electrical safety and environmental standards, such as those of Underwriters Laboratories (“UL”), the Canadian Standards Association (“CSA”), and the International Electrotechnical Commission (“IEC”). In addition, the manufacture and distribution of medical devices utilizing radioactive material requires a specific radioactive material license. For the United States, manufacture and distribution of these radioactive sources and devices also must be in accordance with a model-specific certificate issued by either the NRC or by an Agreement State. In essentially every country and state, installation and service of these products must be in accordance with a specific radioactive materials license issued by the applicable radiation control agency. Service of these products must be in accordance with a specific radioactive materials license. We are also subject to a variety of additional environmental laws regulating our manufacturing operations and the handling, storage, transport and disposal of hazardous substances, and which impose liability for the cleanup of any contamination from these substances.
Other applicable U.S. regulations. As a participant in the healthcare industry, we are also subject to extensive laws and regulations protecting the privacy and integrity of patient medical information that we receive, including the Health Insurance Portability and Accountability Act of 1996 (“HIPAA”), new state privacy laws, “fraud and abuse” laws and regulations, including physician self-referral prohibitions, and false claims laws. From time to time, these laws and regulations may be revised or interpreted in ways that could make it more difficult for our customers to conduct their businesses, such as recent proposed revisions to the laws prohibiting physician self-referrals, and such revisions could have an adverse effect on the demand for our products, and therefore our business and results of operations. We also must comply with numerous federal, state and local laws of more general applicability relating to such matters as environmental protection, safe working conditions, manufacturing practices, fire hazard control and other matters.
The laws and regulations and their enforcement are constantly undergoing change, and we cannot predict what effect, if any, changes to these laws and regulations may have on our business. For example, national and state laws regulate privacy and may regulate our use of data. Furthermore, HIPAA was amended by the Health Information Technology for Economic and Clinical Health Act to provide that business associates who have access to patient health information provided by hospitals and healthcare providers are now directly subject to HIPAA, including the associated enforcement scheme and inspection requirements.
Medicare and Medicaid Reimbursement
The federal and state governments of the United States establish guidelines and pay reimbursements to hospitals and free-standing clinics for diagnostic examinations and therapeutic procedures under Medicare at the federal level and Medicaid at the state level. Private insurers often establish payment levels and policies based on reimbursement rates and guidelines established by the government.
The federal government and Congress review and adjust rates annually, and from time to time consider various Medicare and other healthcare reform proposals that could significantly affect both private and public reimbursement for healthcare services in hospitals and free-standing clinics. In the past, we have seen demand for our customers’ systems (in which our products are incorporated) negatively impacted by the uncertainties surrounding reimbursement rates in the United States. State government reimbursement for services is determined pursuant to each state’s Medicaid plan, which is established by state law and regulations, subject to requirements of federal law and regulations.
Various healthcare reform proposals have also emerged at the state level, and we are unable to predict which, if any, of these proposals will be enacted. In addition, it is possible that changes in federal health care law and policy could result in additional proposals and/or changes to health care system legislation which could have a material adverse effect on our business. Uncertainty created by healthcare reform complicates our customers’ decision-making process and, therefore, may impact our business.
The sale of medical devices, the referral of patients for diagnostic examinations and treatments utilizing such devices, and the submission of claims to third-party payors (including Medicare and Medicaid) seeking reimbursement for such services, are subject to various federal and state laws pertaining to healthcare “fraud and abuse.” Anti-kickback laws make it illegal to solicit, induce, offer, receive or pay any remuneration in exchange for the referral of business, including the purchase of medical devices from a particular manufacturer or the referral of patients to a particular supplier of diagnostic services utilizing such devices. False claims laws prohibit
anyone from knowingly and willfully presenting, or causing to be presented, claims for payment to third-party payors (including Medicare and Medicaid) that are false or fraudulent, for services not provided as claimed, or for medically unnecessary services. The Office of the Inspector General prosecutes violations of fraud and abuse laws and any violation may result in criminal and/or civil sanctions, including, in some instances, imprisonment and exclusion from participation in federal healthcare programs such as Medicare and Medicaid, which may negatively impact the demand for our products.
Foreign Regulations
Our operations, sales and service of our products outside the United States are subject to regulatory requirements that vary from country to country and may differ significantly from those in the United States. In general, our products are regulated outside the United States as medical devices by foreign governmental agencies similar to the FDA.
Marketing a medical device internationally. For us to market our products internationally, we must obtain clearances or approvals for products and product modifications. We are required to affix the CE mark to our products to sell them in member countries of the European Union (“EU”). The CE mark is an international symbol of adherence to certain essential principles of safety and effectiveness, which once affixed enables a product to be sold in member countries of the European Economic Area ("EEA"). The CE mark is also recognized in many countries outside the EU and can assist in the clearance process. To receive permission to affix the CE mark to our medical device products, we must obtain approvals and Quality System certification, e.g., ISO 13485, through an accredited Notified Body and must otherwise have a quality management system that complies with the EU Medical Device Directive, which was superseded by the EU MDR-Medical Device Regulations in May 2021. The ISO promulgates standards for certification of quality assurance operations. We are certified as complying with the ISO 9001 for our security and inspection products and ISO 13485 for our medical devices. Several Asian countries, including Japan and China, have adopted regulatory schemes that are comparable, and in some cases more stringent, than the EU scheme. To import medical devices into Japan, the requirements of the Japanese Pharmaceutical and Medical Device Act must be met and an approval to sell medical products in Japan, must be obtained. Similarly, a registration certification issued by the National Medical Products Administration and a China Compulsory Certification mark for certain products are required to sell medical devices in China. Obtaining such certifications on our products can be time-consuming and can cause us to delay marketing or sales of certain products in such countries. Similarly, prior to selling a device in Canada, manufacturers of Class II devices must obtain a medical device license from Health Canada. Additionally, many countries have laws and regulations relating to radiation and radiation safety that apply to our products. In most countries, radiological regulatory agencies require some form of licensing or registration by the facility prior to acquisition and operation of an X-ray generating device or a radiation source. The handling, transportation and recycling of radioactive metals and source materials are also highly regulated.
A number of countries, including the members of the EU, have implemented or are implementing regulations that would require manufacturers to dispose, or bear certain disposal costs, of products at the end of a product’s useful life and restrict the use of some hazardous substances in certain products sold in those countries. While these regulations could impose a future cost on the Company, compliance programs are in place to anticipate or establish best estimates of what the potential exposure of such costs could be should they arise.
Manufacturing and selling a device internationally. We are subject to laws and regulations outside the United States applicable to manufacturers of radiation-producing devices and products utilizing radioactive materials, and laws and regulations of general applicability relating to matters such as environmental protection, safe working conditions, manufacturing practices and other matters, in each case that are often comparable to, if not more stringent than, regulations in the United States. In addition, our sales of products in foreign countries are subject to regulation of matters such as product standards, packaging requirements, labeling requirements, import restrictions, environmental and product recycling requirements, tariff regulations, and duties and tax requirements. In some countries, we rely on our foreign distributors and agents to assist us in complying with foreign regulatory requirements.
Other applicable international regulations. In addition to the U.S. laws regarding the privacy and integrity of patient medical information, we are subject to similar or stricter laws and regulations in foreign countries covering data privacy and other protection of health and employee information. Particularly within Europe, data protection legislation is comprehensive and complex and there has been a recent trend toward more stringent enforcement of requirements regarding protection and confidentiality of personal data, as well as enactment of stricter legislation. We are also subject to international “fraud and abuse” laws and regulations, as well as false claims and misleading advertisement laws. We also must comply with numerous international laws of more general applicability relating to such matters as environmental protection, safe working conditions, manufacturing practices, fire hazard control and other matters.
Anti-Corruption Laws and Regulations
We are subject to the U.S. Foreign Corrupt Practices Act and anti-corruption laws, and similar laws in foreign countries, such as the U.K. Bribery Act of 2010 and the law “On the Fundamentals of Health Protection in the Russian Federation”. In general, there
is a worldwide trend to strengthen anti-corruption laws and their enforcement, and the healthcare industry and medical equipment manufacturers have been particular targets of these investigation and enforcement efforts. Any violation of these laws by us or our agents or distributors could create substantial liability for us, subject our officers and directors to personal liability and also cause a loss of reputation in the market.
Transparency International’s 2022 Corruption Perceptions Index measured the degree to which public sector corruption is perceived to exist in 180 countries/territories around the world and found that two-thirds of the countries in the index, including many that we consider to be high-growth areas for our products, such as China and India, scored below 50, on a scale from 100 (very clean) to 0 (highly corrupt). We currently operate in many countries where the public sector is perceived as being more or highly corrupt and our strategic business plans include expanding our business in regions and countries that are rated as higher risk for corruption activity by Transparency International.
Increased business in higher-risk countries could subject us and our officers and directors to increased scrutiny and increased liability. In addition, becoming familiar with and implementing the infrastructure necessary to comply with laws, rules and regulations applicable to new business activities and mitigating and protecting against corruption risks could be quite costly. Failure by us or our agents or distributors to comply with these laws, rules and regulations could delay our expansion into high-growth markets and could materially and adversely affect our business.
Competition and Trade Compliance Laws
We are subject to various competition and trade compliance laws in the jurisdictions where we operate. Regulatory or government authorities where we operate may have enforcement powers that can subject us to sanctions and can impose changes or conditions in the way we conduct our business. For example, local authorities may disagree with how we classify our products, and we may be required to change our classifications, which could increase our operating costs or subject us to increased taxes or fines and penalties. In addition, an increasing number of jurisdictions also provide private rights of action for competitors or consumers to seek damages asserting claims of anti-competitive conduct. Increased government scrutiny of our actions or enforcement or private rights of action could materially and adversely affect our business or damage our reputation. In addition, we may conduct, or we may be required to conduct, internal investigations or face audits or investigations by one or more domestic or foreign governments or regulatory agencies, which could be costly and time-consuming, and could divert our management and key personnel from our business operations. An adverse outcome under any such investigation or audit could subject us to increased costs, fines or criminal or other penalties, which could materially and adversely affect our business and financial results. Furthermore, competition laws may prohibit or increase the cost of future acquisitions that we may desire to undertake.
International sales of certain of our Linatron® X-ray accelerators are subject to U.S. export licenses that are issued at the discretion of the U.S. government. Orders and revenues for our security and inspection products have been and may continue to be unpredictable as governmental agencies may place large orders with us or with our customers over a short period of time and then may not place additional orders until complete deployment and installation of previously ordered products. Furthermore, tender awards in this business may be subject to challenge by third parties, as we have previously encountered, which can make the conversion of orders to revenues unpredictable for some security and inspection products. The market for border protection systems improved in fiscal year 2023 with increased sales during fiscal year 2023 and additional tenders for fiscal year 2024.
Intellectual Property
We place considerable importance on obtaining and maintaining patent, copyright and trade secret protection for significant new technologies, products and processes, because of the length of time and expense associated with bringing new products through the development process and to the marketplace.
We generally rely on a combination of patents, copyrights, trademarks, trade secret and other laws, and contractual restrictions on disclosure, copying and transferring title, including confidentiality agreements with vendors, strategic partners, co-developers, employees, consultants and other third parties, to protect our proprietary rights in the developments, improvements and inventions that we have originated and which are incorporated in our products or that fall within our fields of interest. As of September 29, 2023, we own approximately 250 patents issued in the United States, approximately 380 patents issued throughout the rest of the world and have approximately 150 patent applications pending with various patent agencies worldwide. The patents issued expire between 2023 and 2042. We intend to file additional patent applications as appropriate. We have trademarks, both registered and unregistered, that are maintained and enforced to provide customer recognition for our products in the marketplace. We also have agreements with third parties that provide for licensing of patented or proprietary technology, including royalty-bearing licenses and technology cross-licenses. These licenses generally can only be terminated for breach. See Item 1A. “Risk Factors - Risks Relating to our Intellectual Property and Information Systems.”
In conjunction with the January 2017 separation from Varian Medical Systems, Inc. ("Varian"), we entered into an Intellectual Property Matters Agreement with Varian, pursuant to which, among other things, we each granted the other licenses to use certain intellectual property. Varian was subsequently acquired by Siemens in April of 2021.
Environmental Matters
Our operations and facilities, past and present, are subject to environmental laws, including laws that regulate the handling, storage, transport and disposal of hazardous substances. Certain of those laws impose cleanup liabilities under certain circumstances. In connection with those laws and certain of our past and present operations and facilities, we are obligated to indemnify Varian for 20% of the cleanup liabilities related to prior corporate restructuring activities while a division of Varian and fully indemnify Varian for other liabilities arising from the operations of the business transferred to it as part of those activities. Those include facilities sold as part of Varian’s electron devices business in 1995 and thin film systems business in 1997. The U.S. Environmental Protection Agency (“EPA”) or third parties have named Varian as a potentially responsible party under the amended Comprehensive Environmental Response Compensation and Liability Act of 1980 (“CERCLA”), at sites to which Varian or the facilities of the businesses sold in 1995 and 1997 were alleged to have shipped waste for recycling or disposal (the “CERCLA sites”). We anticipate that we will be obligated to reimburse Varian for 20% of the liabilities of Varian related to these CERCLA sites (after adjusting for any insurance proceeds). As of September 29, 2023, we had an existing environmental liability of approximately $2.8 million, net of expected insurance proceeds, related to the CERCLA sites.
Working Capital
Our working capital needs and our credit practices are comparable to those of other companies manufacturing and selling similar products in similar markets. We endeavor to carry sufficient levels of inventory to meet the product delivery needs of our customers. We also provide payment terms to customers in the normal course of business. The product warranty obligations contained in our standard terms and conditions typically range from 12 to 24 months, depending on the product.
Human Capital Resources
Talent Management
To remain a leading innovator, designer, and manufacturer of critical components of X-ray based diagnostic equipment, it is crucial that we continue to attract and retain exceptional talent. Our business results depend on our ability to successfully manage our human capital resources, including attracting, identifying, and retaining key talent. Factors that may affect our ability to attract and retain qualified employees include employee morale, our reputation, competition from other employers, wage inflation, and availability of qualified individuals.
As of September 29, 2023, we had approximately 2,400 full-time equivalent employees worldwide. None of our employees based in the United States are unionized or subject to collective bargaining agreements. Employees based in some foreign countries may, from time to time, be represented by works councils or unions or subject to collective bargaining agreements. We consider our relations with our employees to be good.
As part of our people management strategy, we monitor employee morale and our market reputation. To better understand how to measure the effectiveness of our people management strategy, and to establish a baseline understanding of employee loyalty and retention, we solicit feedback from our employees through employee satisfaction and other surveys. The results of these surveys are analyzed, and we hold meetings with employees to share and discuss areas of improvement. We believe this is a useful process to inform how future decisions are made in order to improve employee morale and engagement.
Total Rewards
We invest in our workforce by offering a competitive total rewards package that includes a combination of salaries and wages, health and wellness benefits, equity incentives, retirement benefits, and educational benefits. We strive to offer a total rewards package that is responsive to local markets. In the United States, where our largest employee base resides, our benefits for eligible employees have included:
•Health insurance coverage available to full-time employees;
•Tuition reimbursement up to a specified dollar amount on an annual basis;
•Matching contributions to a tax-qualified defined contribution savings ("401(k)") plan, on a dollar-for-dollar basis up to four percent of the employee’s base compensation;
•An employee assistance program; and
•Training and development programs designed to help employees improve workplace performance.
Approximately 91% of our eligible employees participate in our 401(k) plan. In addition, in an effort to further align the interests of eligible employees with our stockholders, we have an equity-based incentive plan that provides for the grant of nonqualified stock options and restricted stock units to directors, officers and other eligible employees. Additionally, to create performance incentives and to encourage share ownership by our employees, we have implemented an employee stock purchase plan, which enables eligible employees to purchase our common stock at a discount through payroll contributions.
Safety and Wellness
The health and safety of our workforce is fundamental to the success of our business. We provide our employees upfront and ongoing safety training to ensure that safety policies and procedures are effectively communicated and implemented. Personal protective equipment is provided to those employees where needed for the employee to safely perform their job function. We have experienced personnel on site at each of our manufacturing locations that are tasked with environmental, health and personal safety education and compliance and, in Salt Lake City, we have an onsite nurse practitioner available to our employees for medical needs.
Diversity and Inclusion
As one of our values states, “we embrace equality,” and we are committed to a diverse and inclusive workplace that is respectful to all. Some of our initiatives include providing educational scholarships to traditionally underrepresented classes and for science, technology, engineering, and mathematics ("STEM") programs, regularly analyzing pay equity, and engaging in on-campus events that increase our exposure to diverse populations to promote diversity in our hiring. We do not tolerate discrimination and harassment, and we expect our teams to conduct themselves ethically at all times in accordance with Varex’s Code of Conduct.
Information Available to Investors
The SEC maintains an internet site, www.sec.gov, that contains reports, proxy and information statements, and other information regarding the Company and other issuers that file electronically with the SEC. As soon as reasonably practicable after filing with or furnishing to the SEC, we also make the following reports and information available free of charge on the Investors page of our website www.vareximaging.com:
•our annual reports on Form 10-K;
•quarterly reports on Form 10-Q;
•current reports on Form 8-K (including any amendments to those reports);
•proxy statements; and
•Section 16 ownership reports.
Additionally, our Code of Conduct, Corporate Governance Guidelines, Human Rights Policy, and the charters of the Audit Committee, Compensation and Human Capital Management Committee, and Nominating and Corporate Governance Committee are also available on the Investors page of our website. Investors and others should note that we announce material financial and operational information to our investors using our investor relations website (https://www.vareximaging.com/investor-relations/), press releases, SEC filings and public conference calls and webcasts. Please note that information on, or that can be accessed through, our website is not deemed “filed” with the SEC and is not to be incorporated by reference into any of our filings under the Securities Act of 1933, as amended (the “Securities Act”), or the Securities Exchange Act of 1934, as amended (the “Exchange Act”).
Information about our Executive Officers
The biographical summaries of our executive officers are as follows:
Sunny S. Sanyal, 59, has served as President, Chief Executive Officer, and Director since January 2017. Prior to the separation of Varex from Varian, Sunny served as senior vice president and president of Varian’s Imaging Components business for Varian since February 2014. Prior to joining Varian in 2014, Sunny was chief executive officer of T-System, a privately held company providing information technology solutions and services to hospitals and urgent care facilities. He also served as president of McKesson Provider Technologies, where he led the company to significant market expansion with its clinical software, medical imaging technology, and services solutions. Sunny has held executive positions at GE Healthcare, Accenture, and IDX Systems. He received a Master of Business Administration ("MBA") from Harvard Business School, a Master of Science in industrial engineering from Louisiana State University, and a Bachelor of Engineering in electrical engineering from the University of Bombay.
Shubham Maheshwari, 52, has served as Chief Financial Officer ("CFO") since July 2020. Shubham (Sam) joined Varex from SiFive, Inc., a leading provider of hardware and software solutions for developing RISC-V based processors and semiconductor chips, where he served as CFO. Before SiFive, Sam served for six years as CFO, and later as CFO and COO, of Veeco Instruments Inc. (Nasdaq: VECO), a manufacturer of semiconductor process equipment. Previous notable positions include Senior Vice President, Finance for semiconductor company Spansion, Inc., where he helped lead the company through its restructuring and IPO in 2010, and
more than 10 years in various senior positions, including Vice President of M&A and Corporate Controller, at KLA-Tencor Corp., a global semiconductor equipment company. Sam holds an MBA in Finance from Wharton, and a bachelor’s degree in chemical engineering from the Indian Institute of Technology, Delhi.
Kimberley E. Honeysett, 52, has served as Chief Legal Officer since February 2022 and as Senior Vice President, General Counsel, and Corporate Secretary since January 2017. Prior to the separation of Varex from Varian, Kim served as vice president and assistant general counsel and assistant corporate secretary for Varian, where she advised Varian’s Board of Directors, executive management and corporate functions, including business development, investor relations, human resources, information technology and was responsible for corporate governance, general compliance matters, litigation and global subsidiary governance. Prior to joining Varian in 2005, Kim served as group director, legal affairs at Siebel Systems, Inc., an enterprise software company, and as an associate with the law firm Brobeck, Phleger & Harrison LLP. Kim holds a juris doctor degree from Cornell Law School and a bachelor’s degree in communications from the University of California, Los Angeles.
Andrew Hartmann, 61, has served as Senior Vice President and General Manager - Detectors since April 2023 and previously as Senior Vice President, Medical Sales & Marketing since July 2018. Prior to joining Varex he worked for a number of leading OEMs in various leadership roles, most recently as General Manager of the X-ray and Ultrasound Business for Carestream Health, Inc., a worldwide provider of X-ray imaging systems, from April 2012 to June 2018. Prior to Carestream, Andrew worked for Siemens Medical Solutions USA, Inc. (Siemens Healthineers), a leading medical technology company, in sales and marketing roles both domestically in the United States and internationally for Siemens’ ultrasound business. Prior to Siemens, he held leadership roles at Acuson Corp. (subsequently acquired by Siemens), including General Manager for Acuson’s Australia and New Zealand business. Andrew received a Master of Business Administration (“EMBA”) from Ashridge Business School in London, United Kingdom, and received a diploma in electronics from Sydney Technical College in Australia.
Mark S. Jonaitis, 62, has served as Senior Vice President and General Manager - X-Ray Sources since January 2017. Prior to the separation of Varex from Varian, Mark served in various management positions at Varian, including most recently as vice president and general manager, X-ray Tube Products and global manufacturing. Mark joined Varian’s predecessor, Varian Associates, in 1983, where he served in various product and engineering positions. Mark received his Bachelor of Science in physics from the University of Utah.
Item 1A. Risk Factors
Investing in Varex Imaging Corporation common stock involves risks and the following risk factors and other information included in this Annual Report on Form 10-K under Item 1 "Business", Item 7 "Management’s Discussion and Analysis of Financial Condition and Results of Operations" and Item 7A "Quantitative and Qualitative Disclosures about Market Risk" should be carefully considered. Although the risk factors described below are the ones management deems significant, additional risks and uncertainties not presently known to us or that are presently known to us that we presently deem not material may also adversely affect our business operations.
Risks Relating to Our Business
We sell our products and services to a limited number of original equipment manufacturer ("OEM") customers, many of which are also our competitors, and a reduction in or loss of business of one or more of these customers may materially reduce our sales.
We had one customer during fiscal year 2023 that accounted for 17% of our revenue. Our ten largest customers as a group accounted for approximately 51%, 52% and 51% of our revenue for fiscal years 2023, 2022 and 2021, respectively. Because we often take significant time to replace lost business, it is likely that our operating results would be materially and adversely affected if one or more of our major OEM customers were to cancel, delay, or reduce orders in the future.
Furthermore, we generate significant accounts receivables from the sale of our products and the provision of services directly to our major customers. We had one customer that accounted for 13.8% of our accounts receivables as of September 29, 2023. If one or more of these customers were to cancel a product order or service contract, become insolvent, or otherwise be unable or fail to pay for our products and/or services in a timely manner, our operating results and financial condition could be materially and adversely affected.
We may not be able to accurately predict the demand or delivery schedules for our products.
End-user product demand, economic uncertainties, the impact of pandemic diseases, natural disasters, armed conflict, geopolitical tensions, government actions (for example, the Chinese government initiated anti-corruption investigation related to its healthcare industry), and other matters beyond our control, make it difficult for our customers to accurately forecast and plan future business activities, which makes it difficult for us to accurately predict demand for our products. Because the manufacture of our products requires some lead-time, changes in customer purchasing forecasts have previously resulted in excess inventory and slowdowns in sales, which are likely to occur again in the future. Changes to customer forecasts can occur on short notice, as our customers face inherent competitive issues, new product introduction delays, and market and regulatory risks. Our agreements for imaging components contain purchasing estimates that are typically based on our customers’ forward-looking forecasts rather than firm commitments, and actual purchasing volumes under the agreements may vary significantly from these estimates. The variation from forecasted purchasing volume may be due, in part, to the increasing life of X-ray tubes, which can result in reduced demand for replacement X-ray tubes in ways we may not be able to accurately forecast. Reductions in purchasing patterns have in the past, and may in the future, materially and adversely affect our operating results.
We compete in highly competitive markets, and we are subject to pricing pressures and other factors that could result in margin erosion.
We compete in markets characterized by rapidly-evolving technology, intense competition and pricing pressure. We often compete with companies that have greater financial, marketing and other resources than us. Some of the major diagnostic imaging systems companies, which are the primary OEM customers for our X-ray imaging components, also manufacture X-ray imaging components, including X-ray tubes, for use in their own imaging systems products. If these customers manufacture a greater percentage of their components in-house or otherwise decrease purchases from external sources, we could experience reductions in purchasing volume by, or loss of, one or more of these customers, which may have a material and adverse effect on our business. In addition, we compete against other stand-alone, independent X-ray tube manufacturers for both the OEM business of major diagnostic imaging equipment manufacturers and the independent servicing business for X-ray tubes.
The market for flat panel detectors is also very competitive, and we face intense competition from over a dozen smaller competitors. We have in the past made price and other concessions to maintain existing customers and attract new customers, and may have to make additional price concessions in the future.
In our Industrial segment, we compete with other OEM suppliers primarily outside of the United States. Some of our competitors outside of the United States may have resources and support from their governments that we do not, such as preferences for local manufacturers, and may not be subject to the same trade compliance regulations as us.
Our competitors are not all subject to the same standards, regulatory and/or other legal requirements to which we are subject and, therefore, they could have a competitive advantage in developing, manufacturing, and marketing products and services.
Any inability to develop, gain regulatory approval for, and supply commercial quantities of competitive products to the market as quickly and effectively as our competitors could limit market acceptance of our products and negatively and materially affect our pricing, sales, revenues, market share, and gross margins and our ability to maintain or increase our operating margins.
Our success depends on meeting our customers' needs and demands.
To be successful, we must anticipate our customers’ needs and demands, as well as potential shifts in market preferences. If we are unable to anticipate these needs and demands, or the mix of products requested by our customers changes from what we expect, our revenue, margins, and financial results could be adversely affected. When the U.S. Dollar is strong compared to the operating currencies of our international customers, our ability to meet such customers’ pricing expectations is particularly challenging and may result in erosion of revenues, product margin, and/or market share or other concessions on business terms.
In addition, certain costs, including installation and warranty costs, associated with new products may be proportionately greater than the costs associated with other products and may therefore disproportionately, materially, and adversely affect our gross and operating margins. We may also experience lower margins due to increased commodities prices, and inadequate transfer pricing favoring sales to third parties over internal sales. If we are unable to lower these costs over time, our operating results could be materially and adversely affected. Some of the electronic components and integrated circuits used in our flat panel detectors are susceptible to discontinuance and obsolescence risks, which may force us to incorporate newer generations of these components, resulting in unplanned additional R&D expenses, delays in the launch of new products, supply disruptions, or inventory write-downs. Further, using aging production equipment might hamper our capacity to innovate to meet customers’ needs and demands and stay competitive. Failure to develop and adopt artificial intelligence ("AI") technology could also hinder competitiveness and growth potential in a rapidly evolving market. We may also experience challenges in developing and implementing effective market strategies, leading to missed opportunities and customer dissatisfaction.
We may not be able to successfully develop, manufacture, or introduce new products or enhancements to existing products, the roll-out of which involves compliance with complex quality assurance processes, including the Quality System Regulation (“QSR”) of the U.S. Food and Drug Administration (“FDA”). Failure to complete these processes timely and efficiently could result in delays that could affect our ability to attract and retain customers or cause customers to delay or cancel orders, which would materially and adversely affect our revenues and operating results.
More than half of our revenue is generated from customers located outside the United States, and is subject to global, regional, and country-specific economic instability, shifting political environments, changing tax treatment, and other risks associated with international manufacturing, operations and sales.
Revenues generated from customers located outside the United States accounted for approximately 69%, 69%, and 68% of our total revenues during fiscal years 2023, 2022, and 2021, respectively. We intend to continue to expand our presence in international markets and expect to expend significant resources in doing so. Our future results could be impacted by a variety of factors, including:
•currency fluctuations, and in particular the strength of the U.S. Dollar (which is our functional and reporting currency);
•political and economic instability, including the possibility of civil unrest, terrorism, mass violence or armed conflict, which may among other things, impact our operations and business access;
•difficulties in staffing and managing employee relations in foreign operations, particularly in attracting and retaining personnel qualified to design, test, sell and support our products;
•difficulties in coordinating our operations globally and in maintaining uniform standards, controls, procedures, and policies across our operations;
•the longer payment cycles associated with many customers located outside the United States;
•difficulties in interpreting or enforcing agreements and collecting receivables through many foreign countries’ legal systems;
•imposition of burdensome governmental regulations, including changing laws and regulations with respect to collection and maintenance of personally identifiable data;
•the imposition by governments of additional taxes, tariffs, global economic sanctions programs, or other restrictions on foreign trade; and
•compliance with export laws and requirements.
Our international locations expose us to higher security risks compared to our United States locations, which could result in both harm to our employees and contractors or substantial costs. Some of our services are performed in or adjacent to high-risk locations where the country or location and surrounding area is suffering from political, social, or economic turmoil, war or civil unrest, or has a high level of criminal or terrorist activity. In those locations where we have employees or operations, we may incur substantial costs to maintain the safety of our personnel, and we may suffer the loss of employees and contractors, which could harm our business reputation and operating results.
We may be unable to complete future acquisitions or realize expected benefits from acquisitions of or investments in new businesses, products, or technologies, which could harm our business.
Our ability to identify and take advantage of attractive acquisitions or other business development opportunities is an important component in implementing our overall business strategy. Such transactions involve a number of risks, including the following:
•we may incur substantial costs, including advisory fees and diversion of management attention, in evaluating a potential transaction;
•we may be unable to achieve the anticipated benefits from the transaction, including a return on our investment;
•we may have difficulty integrating organizations, products, technologies, or employees of an acquired business into our operations and may have difficulty retaining the key personnel of the acquired business;
•we may find that we need to restructure or divest acquired businesses or assets of the acquired business; and
•if we fail to achieve the anticipated growth from an acquisition, or if we decide to sell assets or a business, we may be required to recognize an impairment loss on the write-down of our assets and goodwill.
Legal proceedings may materially and adversely affect our business, results of operations, or cash flows.
From time to time, we are a party to or otherwise involved in legal proceedings, claims, government inspections, audits or investigations, and other legal matters, both inside and outside the United States, arising in the ordinary course of our business or otherwise. Such proceedings are often lengthy, subject to significant uncertainty and may be expensive, time consuming, and disruptive to our operations. For these and other reasons, we may choose to settle legal proceedings and claims, regardless of their actual merit. If a legal proceeding were ultimately resolved against us, we may be required to pay damages or fines, some of which may be in excess of our insurance coverage, or may require us to change our business practices, which could materially and adversely impact our business, results of operations, or cash flows.
Our subsidiary Varex Imaging Deutschland AG holds a 50% interest in VEC Imaging GmbH & Co. KG, (“VEC”) a joint venture formed to develop technology for use in X-ray imaging components. In August 2023, the partners to the VEC joint venture filed judicial proceedings in Germany against one another disputing the validity of shareholder resolutions passed in January 2023. Each party is seeking to have the other party’s managing director(s) removed and to exclude the other party from the joint venture. If either party is successful, the prevailing party would be required to purchase the non-prevailing party’s interest in the joint venture for an amount equal to 75% of the fair market value thereof, which amount is in dispute.
Product defects or misuse may result in material product or other liability or professional errors and omissions claims, litigation, investigation by regulatory authorities, or product recalls.
Our business exposes us to potential product and other liability claims that are inherent in the manufacture, sale, installation, servicing, and support of components that are used in medical devices and other devices that deliver radiation. Because our products, through incorporation into OEMs’ systems, are involved in the intentional delivery of radiation to the human body and other situations where people may come into contact with radiation, the possibility for significant personal injury or loss of life exists. Furthermore, if our x-ray inspection systems fail to detect the presence of bombs, explosives, weapons, contraband, or other threats to personal safety, this may lead to personal injury, loss of life, and extensive property damage. We may also be subject to warranty and damage claims for property damage, personal injury, or economic loss related to or resulting from any errors or defects in our products or the installation, servicing, or support of our products. Any accident or mistreatment could subject us to legal costs, litigation, adverse publicity, and damage to our reputation, whether or not our products or services were a factor. We are currently a party to certain products liability litigation which, if adversely determined, could have an adverse material impact on our financial results. If a product we design or manufacture were defective, we may be required to correct or recall the product and notify regulatory authorities.
We may choose to settle product liability claims against us regardless of their actual merit. A product liability action determined against us could result in adverse publicity or significant damages, including the possibility of punitive damages, and our combined financial position, results of operations, or cash flows could be materially and adversely affected.
We maintain limited product liability insurance coverage. Our product liability insurance policies are expensive and have high deductible amounts and self-insured retentions. Our insurance coverage may prove to be inadequate, and future policies may not be available on acceptable terms or in sufficient amounts, if at all. If a material claim is not insured or is in excess of our insurance coverage, we could have to pay substantial damages, which could have a material and adverse effect on our financial position and/or results of operations.
Risks Relating to the Manufacture of our Products
Supply chain disruptions, including the loss of a supplier, and any inability to obtain raw materials or supplies of important components due to inflation have impacted our ability to manufacture products, have caused delays in our ability to deliver products, and have increased our costs and may continue to do so.
Inflation and supply chain disruptions have had, are currently having, and could continue to have, an impact on our ability to manufacture certain products. Inflation has the potential to increase our overall cost structure, and sustained inflation has resulted in, and may continue to result in, higher interest rates and capital costs, increased shipping costs, supply shortages, increased costs of labor, weakening exchange rates, and other similar effects.
Material shortages and delays due to inflation and other market constraints have caused, and could in the future cause, us to temporarily stop production of certain products or miss opportunities to pursue additional sales of some products. We require certain raw materials, such as copper, nickel, silver, gold, lead, tungsten, iridium, rhenium, molybdenum, rhodium, niobium, zirconium, beryllium, and various high grades of steel alloy for X-ray tubes and industrial products. Worldwide demand, availability, and pricing of these raw materials have been volatile. If we are unable to obtain the materials necessary to make certain products without unreasonable delay, those customers may seek alternative suppliers or decide to in-source certain products or if we must pay more for certain materials, it could reduce our profit margin or otherwise have a material adverse effect on our business and financial results. Further, our competitors with greater financial resources may be better able to restructure their manufacturing and supply chains in response to geopolitical and economic trends and thereby have a competitive advantage over us.
We obtain some of the components included in our products from a limited group of suppliers or from sole-source suppliers, such as transistor arrays, cesium iodide coatings and specialized integrated circuits for flat panel detectors, X-ray tube targets, housings, glass frames, high-voltage cable, bearings, and various other components. If current suppliers cease producing these or other components, fail to provide products on our delivery timelines, or become insufficiently solvent to continue operations, there can be no assurance that the components will be available from other suppliers on reasonable terms or at all, and this could materially and adversely affect our business and financial results.
Furthermore, we may be required to obtain and qualify one or more replacement suppliers or to manufacture the components internally. Such an event (1) may then also require us to redesign or modify our products to incorporate new parts and/or further require us to obtain clearance, qualification, or certification of these products, including by the FDA, or obtain other applicable regulatory approvals in other countries, (2) could significantly increase costs for the affected products, (3) cause material delays in delivery of affected and other related products, or (4) could prevent us from meeting our delivery obligations to our customers.
If we are not able to match our manufacturing capacity with demand for our products, our financial results may suffer.
Many of our products have a long production cycle, and we must anticipate demand for our products to ensure adequate manufacturing and testing capacity. If we are unable to anticipate demand, and our manufacturing or testing capacity does not keep pace with product demand, we will not be able to fulfill orders in a timely manner, which may negatively impact our financial results and overall business. Conversely, if demand for our products decreases, the fixed costs associated with excess manufacturing capacity may harm our financial results, including by decreasing gross margins and increasing research and development costs as a percentage of revenue.
Delivery schedules for our security, industrial, and inspection products tend to be unpredictable.
The demand for our security and inspection products is heavily influenced by United States and foreign governmental policies on national and homeland security, border protection, and customs activities, which depend upon government budgets and appropriations that are subject to economic conditions, as well as political changes and oil prices. As economic growth remains sluggish in various jurisdictions and appears to be deteriorating in others, and as concerns about levels of government employment and government debt continue, this could cause volatility in our revenues and earnings.
Our operations are vulnerable to interruption or loss due to natural or other disasters, the effects of climate change, power loss, strikes, and other events beyond our control.
We conduct some of our activities, including manufacturing, research and development, administration, and data processing at facilities located in areas that have in the past experienced or may in the future experience natural disasters. A major disaster (such as a major fire, hurricane, earthquake, flood, tsunami, volcanic eruption, or terrorist attack) or a climate change-related event affecting our facilities, or those of our suppliers, could significantly disrupt our operations and delay or prevent product manufacture and shipment during the time required to repair, rebuild, or replace our or our suppliers’ damaged manufacturing facilities. These delays could be lengthy and costly. If any of our customers’ facilities are adversely affected by such a disaster or event, shipments of our products could be delayed. Additionally, customers may delay purchases of our products until our or their operations return to normal. Even if our suppliers or customers are able to quickly respond to such a disaster or event, the ongoing effects could create some uncertainty in the operations of our business. In addition, concerns about terrorism, the effects of a terrorist attack, political turmoil, or an outbreak of epidemic diseases have in the past had, and could in the future have, a negative effect on our business operations, those of our suppliers and customers, and the ability to travel, resulting in adverse consequences on our revenues and financial performance.
Risks Relating to our Intellectual Property and Information Systems
Our competitive position would be harmed if we are not able to maintain or defend our intellectual property rights, and protecting our intellectual property and defending against infringement claims can be costly.
We file applications as appropriate for patents covering new products and manufacturing processes. We cannot be sure, however, that patents will be issued from any of our pending or future patent applications or that our current patents, the claims allowed under our current patents, or patents for technologies licensed to us will be sufficiently broad to protect our technology position against competitors. We also jointly develop intellectual property with third parties and seek to protect our rights to such intellectual property through licenses and other contractual arrangements.
We also rely on a combination of copyright, trade secret, and other laws, and contractual restrictions on disclosure, copying and transferring title (including confidentiality agreements with vendors, strategic partners, co-developers, employees, consultants, and other third parties), to protect our proprietary, and other confidential rights. Our trade secrets may become known to or be independently developed by others, including as a result of misappropriation by unauthorized access to our technology systems, and our business and financial results could be materially and adversely impacted. We have trademarks, both registered and unregistered, that are maintained and enforced to provide customer recognition for our products in the marketplace, but unauthorized parties may still use them. We also license certain patented or proprietary technologies from others. In some cases, products with substantial revenues may depend on these license rights. If we were to lose the rights to license these technologies, or our costs to license these technologies were to materially increase, our business would suffer.
There is a substantial amount of litigation over patent and other intellectual property rights in the industries in which we compete. Our competitors, like companies in many high technology businesses, continually review other companies’ activities for possible conflicts with their own intellectual property rights. In addition, non-practicing entities may review our activities for conflicts with their patent rights. From time to time, we have received notices from parties asserting infringement, and we have been subject to lawsuits alleging infringement of patent or other intellectual property rights. In addition, from time to time we have, and in the future may, enter into agreements that require us to indemnify our customers for intellectual property infringement, which agreements could subject us to liability. One of our subsidiary's customers has been named as a defendant in a lawsuit alleging that the customer’s system (which incorporates our subsidiary’s products) infringes upon the plaintiff’s patent. Under the contract with the customer, our subsidiary has an obligation to indemnify the customer for damages resulting from that lawsuit, which if determined adversely could have a negative impact of our results of operations. Legal disputes relating to intellectual property have occurred, are occurring, and may occur in the future. Any dispute regarding patents or other intellectual property, including with respect to breaches of licensing agreements or other contractual arrangements, could be costly and time consuming and could divert our management and key personnel from our business operations. We may not prevail in a dispute. We do not maintain insurance for intellectual property infringement, so costs of defense, whether or not we are successful in defending an infringement claim, will be borne by us and could be significant. If we are unsuccessful in defending or appealing an infringement claim or claims alleging other contractual breaches, we may be subject to significant damages, and our combined financial position, results of operations, or cash flows could be materially and adversely affected. We may also be subject to injunctions against development and sale of our products, the effect of which could be to materially reduce our revenues.
As we expand our manufacturing capabilities outside of the United States, more of our intellectual property may be held in jurisdictions that do not have robust intellectual property protections, which may make it harder for us to adequately protect our intellectual property.
Disruption of critical information systems or material breaches in the security of our systems may materially and adversely affect our business and customer relations.
Information technology (including technology from third-party providers) helps us operate efficiently, interface with and support our customers, maintain financial accuracy and efficiency, and produce our financial statements. In the ordinary course of our business, we collect, process, and store sensitive data, including intellectual property, proprietary business information, and information of customers, suppliers, and business partners, third parties accessing our website, patient data, and personally identifiable information of customers and employees, in our data centers and on our networks, as well as in third-party off-site data centers. Despite security measures, there is an increasing threat of information security attacks, including from computer viruses or other malicious codes, unauthorized access attempts, and cyber-attacks that pose risks to companies, including us. Because the techniques used to obtain unauthorized access, or to sabotage systems, change frequently, have become increasingly sophisticated, and generally are not recognized until launched against a target, we may be unable to anticipate these techniques or to implement adequate preventative measures, which could result in data leaks or otherwise compromise our confidential or proprietary information and materially disrupt our operations. Such security breaches could expose us to a risk of loss of information and intellectual property, litigation, and possible liability to employees, customers, shareholders, and/or regulatory authorities. If our data management systems do not effectively collect, secure, store, process, and report relevant data for the operation of our business, whether due to equipment malfunction or constraints, software deficiencies, or human error, our ability to effectively plan, forecast, and execute our business plan and comply with applicable laws and regulations will be impaired, perhaps materially. Any such impairment could materially and adversely affect our financial condition, results of operations, cash flows, and the timeliness with which we report our operating results internally and externally.
We use certain cloud-based software. A security breach, whether of our products, of our customers’ network security and systems, or of third-party hosting services could disrupt access to our customers’ stored information and could lead to the loss of, damage to, or public disclosure of our customers’ stored information, including patient health information. Such an event could have serious negative consequences, including possible patient injury, regulatory action, fines, penalties and damages, reduced demand for our solutions, an unwillingness of our customers to use our solutions, harm to our reputation and brand, and time-consuming and expensive litigation, any of which could have a material and adverse effect on our financial results.
Risks Relating to Our Legal and Regulatory Environment
Changes in import/export regulatory regimes, tariffs, and national policies could continue to negatively impact our business.
As a component manufacturer, our products are integrated into the systems and products of our OEM customers. If the United States, China or other countries levy tariffs, import restrictions, duties or other additional taxes or restrictions on our customer’s products, the demand for such products, and our components included in such products, could decrease, which could have a material adverse effect on our business. Uncertainty over tariffs and trade wars could also cause our customers to delay or cancel orders for our products.
In the past, the United States has imposed tariffs on items imported from China and other countries that are incorporated into our products. Tariffs on these items have increased our costs and prices and lowered gross margins on some of our products, thereby having a direct adverse impact on our business and results of operations. China has also imposed retaliatory tariffs that impact a number of our products, including United States origin X-ray tubes, heat exchange units, and certain flat panel detectors. These tariffs have increased our customers’ costs for products imported into China, which has caused us to make price concessions on some products and has caused some customers to stop purchasing our products.
Tariffs could limit our ability to compete for increased market share in China, which could cause our long-term prospects in China to suffer. The imposition of additional tariffs by the United States could result in the adoption of additional tariffs by China and other countries, as well as further retaliatory actions by any affected country, which could negatively impact the global market for imaging equipment and could have a significant adverse effect on our business.
Both the governments of the United States and China have granted tariff exclusions that temporarily eliminate duties payable for specific commodities, providing partial relief from such tariffs, but they must be solicited and approved on a shipment-by-shipment basis. There is no guarantee that such exclusions will be granted or extended by either government, and the United States tariff exclusions are set to expire on December 31, 2023, unless extended.
In addition to tariffs, China’s stated policy of reducing its dependence on foreign manufacturers and technology companies may result in reduced demand for our products in China, which could have a material adverse impact on our business, results of operations and financial position. There are risks that the Chinese government may, among other things, require the use of local suppliers, compel companies that do business in China to partner with local companies to conduct business, or provide incentives to government-backed local customers to buy from local suppliers rather than companies like ours, all of which could adversely impact our business, results of operations and financial position.
The Chinese government recently initiated investigations into corruption in its healthcare industry. This has had a broad-based impact on the healthcare industry in China and slowed sales of healthcare products there. As a result, our sales in China have also slowed. We expect the investigations to continue into fiscal year 2024, and this could continue to adversely impact revenues in our China business.
Increasing tensions between China and Taiwan may cause the United States and/or China to impose higher tariffs, commence trade wars, move more quickly to reduce their dependence on each other’s goods, or enact boycotts against each other’s goods, and this could cause significant disruptions in the markets and industries we serve, and in our supply chain, decrease demand from customers for the ultimate products using our solutions, and materially harm our business, financial condition and results of operations.
In response to Russia's ongoing aggression against Ukraine, as substantially enabled by Belarus, the United States Department of Commerce strengthened its existing sanctions under the Export Administration Regulations against Russia and Belarus. The enhanced sanctions would require Bureau of Industry and Security export licenses in order to export our products, including for medical, health and safety, or humanitarian purposes, to Russia and Belarus. Applications for the export of products to Russia or Belarus will be reviewed under a policy of denial and reviewed on a case-by-case basis. If licenses for the export of our product are denied, it could adversely affect our business and results of operations.
A change in the percentage of our total earnings from international sales or additional changes in tax laws could increase our effective tax rate.
Earnings from our international subsidiaries are generally taxed at rates that differ from United States rates. A change in the percentage of our total earnings from our international subsidiaries, a change in the mix of particular tax jurisdictions between our international subsidiaries, or a change in currency exchange rates could cause our effective tax rate to increase. Furthermore, while United States tax reform imposed a current tax on cumulative undistributed earnings, these earnings could also become subject to incremental foreign withholding or United States state taxes should they actually be remitted to the United States, in which case our financial results could be materially and adversely affected.
Statutory changes included in proposed United States legislation, if passed, including interpretive guidance, could have a material impact on income tax expense, the effective tax rate, or the value of deferred tax assets and liabilities. Changes in the valuation of our deferred tax assets or liabilities, additional changes in tax laws or rates, changes in the interpretation of tax laws in other jurisdictions, or other changes beyond our control could materially and adversely affect our financial position and results of operations.
We have entities in certain jurisdictions with cumulative net operating losses for which no income tax benefit can be recorded due to full valuation allowance positions. There could be additional future losses in these and other jurisdictions that would negatively impact our effective tax rate.
Compliance with foreign laws and regulations applicable to the marketing, manufacturing, and distribution of our products may be costly, and failure to comply may result in unfavorable legal proceedings, in significant penalties and other harm to our business.
Outside the United States, some of our products are regulated as medical devices by foreign governmental agencies similar to the FDA.
For us to market our products internationally, we must obtain clearances or approvals for products and product modifications, which can be time consuming, expensive, uncertain, and which can delay our ability to market products. Delays in the receipt of or failure to receive regulatory approvals, the inclusion of significant limitations on the indicated uses of a product, the loss of previously obtained approvals or failure to comply with existing or future regulatory requirements could restrict or prevent us from doing business in a country or subject us to a variety of enforcement actions and civil or criminal penalties, which would materially and adversely affect our business. In addition, compliance with changing regulatory schemes may add additional complexity, cost, and delays in marketing, or selling our products.
Within the European Union ("EU") and the European Economic Area ("EEA"), we must obtain, and in turn affix, a CE mark certification, that indicates that a product meets the essential requirements of the EU’s Medical Device Directive (“MDD”) and the EU Medical Device Regulations. By affixing the CE mark to our product, we are certifying that our products comply with the laws and regulations required by the EU/EEA countries, thereby allowing the free movement of our products within these countries and others that accept CE mark standards. If we cannot support our performance claims and demonstrate compliance with the applicable European laws and the MDD, we would lose our right to affix the CE mark to our products, which would prevent us from selling our products within the EU/EEA/Switzerland territory and in other countries that recognize the CE mark.
We are also subject to international laws and regulations of general applicability relating to matters such as environmental protection, safe working conditions, and manufacturing practices, as well as others. These are often comparable to, if not more stringent than, the equivalent regulations in the United States. Sales overseas are also affected by regulation of matters such as product standards, packaging, labeling, environmental and product recycling requirements, import and export restrictions, tariffs, duties, and taxes.
In addition, we are required to timely file various reports with international regulatory authorities similar to the reports we are required to timely file with United States regulatory authorities, including reports required by international adverse event reporting regulations. If these reports are not timely filed, regulators may impose sanctions, including temporarily suspending our market authorizations or CE mark, and sales of our products may suffer.
As we enter new businesses or pursue new business opportunities internationally, or as regulatory schemes change, we may become subject to additional laws, rules, and regulations, and compliance can be costly. The failure by us or our agents to comply with these laws, rules, and regulations could delay the introduction of new products, cause reputational harm, or result in investigations, fines, injunctions, civil penalties, criminal prosecution, or an inability to sell our products in or to import our products into certain countries, which could materially and adversely affect our business.
Compliance with United States laws and regulations applicable to the marketing, manufacturing, and distribution of our products may be costly, and failure or delays in obtaining regulatory clearances or approvals, or failure to comply with applicable laws and regulations could harm our business.
If we or any of our suppliers, distributors, agents, or customers fail to comply with FDA, Federal Trade Commission, or other applicable United States regulatory requirements or are perceived to have failed to comply with regulations, we may face:
•adverse publicity affecting both us and our customers;
•increased pressures from competitors;
•investigations by governmental authorities;
•fines, injunctions, civil penalties, and criminal prosecution;
•partial suspension or total shutdown of production facilities or the imposition of operating restrictions;
•increased difficulty in obtaining required clearances or approvals or losses of clearances or approvals already granted;
•seizures or recalls of our products or those of our customers;
•delays in purchasing decisions by customers or cancellation of existing orders;
•the inability to sell our products; and
•difficulty in obtaining product liability or operating insurance at a reasonable cost, or at all.
Generally, our manufacturing operations for medical devices, and those of our third-party manufacturers, are required to comply with the QSR of the FDA, as well as other federal and state regulations for medical devices and radiation-emitting products. Failure to respond in a timely manner to a warning letter or any other notice of noncompliance with applicable regulations and/or procedures and to promptly come into compliance could result in the FDA bringing an enforcement action, which could include the total shutdown of our production facilities, denial of importation rights to the United States for products manufactured in overseas locations, adverse publicity, and criminal and civil fines. The expense and costs of any corrective actions that we may take, which may include product recalls, correction and removal of products from customer sites, or changes to our product manufacturing and quality systems, could materially and adversely impact our financial results and may also divert management resources, attention, and time. Additionally, if a warning letter were issued, customers could delay purchasing decisions or cancel orders, and we could face increased pressure from our competitors, who could use the warning letter against us in competitive sales situations, either of which could materially and adversely affect our reputation, business, and stock price.
Our OEM customers are responsible for obtaining 510(k) pre-market notification clearance on their systems that integrate our products. A substantial majority of our products are “Class I” devices that do not require 510(k) clearance, but we do produce software that is classified as a Class II device subject to 510(k) clearance. Unless an exception applies, we may be required by FDA regulations to obtain a 510(k) pre-market notification clearance in connection with the manufacture of a new medical device or a new indication for use of, or other significant change in, an existing currently marketed medical device before we can market or sell those products in the United States or in connection with modifications or enhancements to a product that could significantly affect its safety or effectiveness, or that would constitute a major change in the intended use of the device, technology, materials, labeling, packaging, or manufacturing process. We cannot ensure that the FDA will agree with our decisions not to seek additional approvals or clearances for particular modifications to our products or that we will be successful in obtaining new 510(k) clearances for modifications. Obtaining clearances or approvals is time consuming, expensive, and uncertain. Furthermore, even if we are granted regulatory clearances or approvals, they may include significant limitations on the indicated uses of the product, which may limit the market for the product. If we are unable to obtain required FDA clearance or approval for a product or are unduly delayed in doing so, or the uses of that product were limited, our business could suffer.
We are required to timely file various reports with the FDA, including reports required by the medical device reporting regulations (“MDRs”), that require we report to regulatory authorities if our devices may have caused or contributed to a death or serious injury, or malfunctioned in a way that would likely cause or contribute to a death or serious injury if the malfunction were to recur. If we initiate a correction or removal of a device to reduce a risk to health posed by the device, we would be required to submit a publicly-available correction and removal report to the FDA and, in many cases, similar reports to other regulatory agencies. This report could be classified by the FDA as a device recall, which could lead to increased scrutiny by the FDA, other international regulatory agencies, and our customers regarding the quality and safety of our devices. If these MDRs or correction and removal reports are not filed on a timely basis, regulators may impose sanctions, sales of our products may suffer, and we may be subject to product liability or regulatory enforcement actions, all of which could harm our business.
Government regulation may also cause significant delays or prevent the marketing and full commercialization of future products or services that we may develop and/or may impose costly requirements on our business. As we enter new businesses or pursue new business opportunities, we will become subject to additional laws, rules, and regulations, including FDA and foreign rules and regulations and compliance can be costly. Failure to comply with these laws, rules and regulations could delay the introduction of new products and could materially and adversely affect our business.
We are also subject to federal and state laws and regulations of general applicability relating to matters such as environmental protection, safe working conditions, manufacturing practices, and other matters. Insurance coverage is not commercially available for violations of law, including the fines, penalties, or investigatory costs that we may incur as the consequence of regulatory violations. Consequently, we do not have insurance that would cover this type of liability.
We sell certain X-ray tube products as replacements which are subject to medical device certification and product registration laws and regulations, which vary by country and are subject to change, and we may be unable to receive registration approval or renewal of existing registrations.
We market and distribute certain X-ray tubes through distributors and third-party/multi-vendor service organizations that are used as equivalent replacements for specific OEM tubes. We are subject to medical device certification and product registration laws, which vary by country and are subject to periodic reviews and changes by regulatory authorities in those countries. Certain of these local laws and regulations have the effect of serving as a barrier to trade and can be difficult to navigate predictably.
In addition, certain countries in which our products are sold require products to undergo re-registration if the product is altered in any significant way.
These registration processes can be costly and time consuming, and customers may decide to purchase products from our competitors that do not have to be involved in a re-registration process. In addition, our inability to receive or renew product registrations may prevent us from marketing and/or distributing those particular products for replacement applications in the specific country.
Existing and future healthcare reforms and changes to reimbursement rates, may indirectly have a material adverse effect on our business and results of operations.
Sales of our products to OEMs in the medical sector indirectly depend on whether adequate reimbursement is available for our customers’ products from a variety of sources, such as government healthcare insurance programs, including U.S. Medicare and Medicaid programs, foreign government programs, private insurance plans, health maintenance organizations, and preferred provider organizations. Without adequate reimbursement, the demand for our customers’ products, and therefore indirectly our products, may be limited, which could harm our business, results of operations, financial condition, and prospects.
Healthcare reform proposals and medical cost containment measures in the United States and in many foreign countries could limit the use of both ours and our customers’ products, reduce reimbursement available for such use, further tax the sale or use of our products, and further increase the administrative and financial burden of compliance. Any changes that lower reimbursements for us or our customers’ products and/or procedures using these products, including, for example, existing reimbursement incentives to convert from analog to digital X-ray systems, or changes that reduce medical procedure volumes or increase cost containment pressures on us or others in the healthcare sector could materially and adversely affect our business and results of operations.
We are subject to federal, state, and foreign laws governing our business practices which, if violated, could result in substantial penalties. Additionally, challenges to or investigations into our practices could cause adverse publicity and be costly to respond to and thus could harm our business.
Anti-corruption laws and regulations. We are subject to the U.S. Foreign Corrupt Practices Act and anti-corruption laws, as well as similar laws in foreign countries, such as the U.K. Bribery Act. Any violation of these laws by us or our agents or distributors could create substantial liability for us, subject our officers and directors to personal liability, and cause a loss of reputation in the market. We operate in many countries, including India and China, where the public sector is perceived as being corrupt. Our strategic business plans include expanding our business in regions and countries that are rated as higher risk for corruption activity by Transparency International e.V., an international non-profit that publishes an annual corruption perception index, which could subject us and our officers and directors to increased scrutiny and increased liability from our business operations. Becoming familiar with and implementing the infrastructure necessary to comply with laws, rules, and regulations applicable to new business activities and mitigating and protecting against corruption risks could be costly. Failure by us or our agents or distributors to comply with these laws, rules, and regulations could delay our expansion into high-growth markets and could materially and adversely affect our business.
Competition and trade compliance laws. We are subject to various competition and trade compliance laws in the jurisdictions where we operate throughout the world. Regulatory authorities in those jurisdictions may have the power to subject us to sanctions and impose changes or conditions in the way we conduct our business. An increasing number of jurisdictions provide private rights of action for competitors or consumers to assert claims of anti-competitive conduct and seek damages. Increased government scrutiny of our actions or enforcement or private rights of action could materially and adversely affect our business or damage our reputation. We may be required to conduct internal investigations or face audits or investigations by one or more domestic or foreign government agencies, which could be costly and time consuming and could divert our management and key personnel from our business operations. An adverse outcome under any such investigation or audit could subject us to fines and criminal or other penalties, which could materially and adversely affect our business and financial results. Furthermore, competition laws may prohibit or increase the cost of future acquisitions that we may desire to undertake.
Laws and ethical rules governing interactions with healthcare providers. We may occasionally sell our products to healthcare providers through distributors or otherwise engage healthcare providers to provide services. The U.S. Medicare and Medicaid “anti-kickback” laws, and similar state laws, prohibit payments or other remuneration that is intended to induce hospitals, physicians, or others either to refer patients or to purchase, lease, or order, or to arrange for or recommend the purchase, lease, or order of healthcare products or services for which payment may be made under federal and state healthcare programs, such as Medicare and Medicaid. These laws affect our sales, marketing, and other promotional activities by limiting the kinds of financial arrangements we may have with hospitals, physicians, or other potential purchasers of our products. They particularly impact how we structure our sales offerings, including discount practices, customer support, education and training programs, physician consulting, research grants, and other fee-for-service arrangements. These laws are broadly written, and it is often difficult to determine precisely how these laws will be applied to specific circumstances.
Federal and state “false claims” laws generally prohibit knowingly presenting, or causing to be presented, claims for payment from Medicare, Medicaid, or other government payors that are false or fraudulent, or for items or services that were not provided as claimed. Although we do not submit claims directly to payors, manufacturers can be, and have been, held liable under these laws if they are deemed to “cause” the submission of false or fraudulent claims by providing inaccurate billing or coding information to customers or through certain other activities, including promoting products for uses not approved or cleared by the FDA, which is called off-label promotion. Violating “anti-kickback” and “false claims” laws can result in civil and criminal penalties, which can be substantial, as well as potential mandatory or discretionary exclusion from healthcare programs for noncompliance. Even an unsuccessful challenge or investigation into our practices could cause adverse publicity and be costly to defend and thus could harm our business and results of operations. Additionally, several recently-enacted state and federal laws, including laws in Massachusetts and Vermont, and the federal Physician Payment Sunshine Act, now require, among other things, extensive tracking and maintenance of databases regarding the disclosure of equity ownership and payments to physicians, healthcare providers, and hospitals. These laws may require us to implement the necessary and costly infrastructure to track and report certain payments to healthcare providers. Failure to comply with these tracking and reporting laws could subject us to significant civil monetary penalties.
Other Laws. We are subject to other laws in foreign countries where we conduct business. For example, within the EU, the control of unlawful marketing activities is a matter of national law in each of the member states. The member states of the EU closely monitor perceived unlawful marketing activity by companies. We could face civil, criminal, and administrative sanctions if any member state determines that we have breached our obligations under such state’s national laws. Industry associations also closely monitor the activities of member companies. If these organizations or authorities name us as having breached our obligations under their regulations, rules, or standards, our reputation would suffer, and our business and financial condition could be materially and adversely affected.
Certain of our products are subject to regulations relating to use of radioactive material, compliance with which may be costly, and a failure to comply with these regulations may materially and adversely affect our business.
As a manufacturer and seller of medical devices and devices emitting radiation or utilizing radioactive by-product material, we and some of our suppliers and distributors are subject to extensive regulation by United States governmental authorities, such as the FDA, the Nuclear Regulatory Commission (“NRC”), and state and local regulatory agencies, which is intended to ensure the devices are safe and effective and comply with laws governing products which emit, produce, or control radiation. These regulations govern, among other things, the design, development, testing, manufacturing, packaging, labeling, distribution, import/export, sale, marketing, and disposal of our products. We are also subject to international laws and regulations that apply to manufacturers of radiation-emitting devices and products utilizing radioactive materials. These are often comparable to, if not more stringent than, the equivalent regulations in the United States.
Our industrial and medical devices utilizing radioactive material are subject to NRC clearance and approval requirements, and the manufacture and sale of these products are subject to extensive federal and state regulation that varies from state to state and among regions. Our manufacture, distribution, installation, service, and removal of industrial devices utilizing radioactive material or emitting radiation also requires us to obtain a number of licenses and certifications for these devices and materials. Service of these products must also be performed in accordance with specific radioactive materials licenses. Obtaining licenses and certifications may be time consuming, expensive, and uncertain.
The handling and disposal of radioactive materials resulting from the manufacture, use, or disposal of our products may impose significant costs and requirements. Disposal sites for the lawful disposal of materials generated by the manufacture, use, or decommissioning of our products may no longer accept these substances in the future or may accept them on unfavorable terms.
Environmental laws impose compliance costs on our business and may also result in liability.
Environmental laws regulate many aspects of our operations, including our handling, storage, transport, and disposal of hazardous substances, such as the chemicals and materials that we use in the course of our manufacturing operations. They can also impose cleanup liabilities, including with respect to discontinued operations. Like other businesses, we may mishandle or inadequately manage hazardous substances used in our manufacturing operations and can never completely eliminate the risk of contamination or injury from certain materials that we use in our business and, therefore, we cannot completely eliminate the prospect of resulting claims and damage payments. We may also be assessed fines and/or other penalties for failure to comply with environmental laws and regulations. Insurance has provided coverage for portions of cleanup costs resulting from historical occurrences, but we do not expect to maintain insurance coverage for costs or claims that might result from any future contamination.
Pursuant to the Separation and Distribution Agreement we entered into with Varian when we spun off from Varian, we are obligated to indemnify Varian for 20% of the cleanup liabilities related to prior corporate restructuring activities undertaken while we were a division of Varian. This includes facilities sold as part of Varian’s electron devices business in 1995 and thin film systems business in 1997. The U.S. Environmental Protection Agency (“EPA”) or third parties have named Varian as a potentially responsible party under the amended Comprehensive Environmental Response Compensation and Liability Act of 1980 (“CERCLA”), at sites to which Varian or the facilities of the businesses sold in 1995 and 1997 were alleged to have shipped waste for recycling or disposal (the “CERCLA sites”). We anticipate that we will be obligated to reimburse Varian for 20% of the liabilities of Varian related to these CERCLA sites (after adjusting for any insurance proceeds or tax benefits received by Varian). We assess this indemnification obligation quarterly with Varian and make accruals accordingly. These accruals have historically been small, but can sometimes fluctuate significantly from period to period. For example, during the second quarter of fiscal year 2023, Varian informed us of an adjustment to their estimate of their liability, which resulted in an increase in our liability of approximately $2.9 million, net of expected insurance proceeds.
Future changes in environmental laws could also increase our costs of doing business, perhaps significantly. Several countries, including some in the EU, now require medical equipment manufacturers to bear certain disposal costs of products at the end of the product’s useful life, thereby increasing its costs. The EU has also adopted directives that may lead to restrictions on the use of certain hazardous substances or other regulated substances in some of our products sold there. These directives, along with another that requires substance information to be provided upon request, could increase our operating costs in order to maintain our access to certain markets. All of these costs, and any future violations or liabilities under environmental laws or regulations, could have a material adverse effect on our business.
Environmental, Social, Governance Risks
Our business is subject to evolving Environmental, Social, and Governance (“ESG”) requirements and stakeholder expectations that could expose us to numerous risks.
Regulators, customers, investors, and other stakeholders are increasingly focusing on ESG issues and related disclosures. Changing ESG requirements and stakeholder expectations have resulted in, and are likely to continue to result in, increased general and administrative expenses and increased management time and attention spent complying with or meeting such regulations and expectations. We may also communicate certain ESG initiatives and goals in our SEC filings or in other public disclosures. If our ESG-related data, processes, and reporting are incomplete or inaccurate, or if we fail to achieve progress with respect to our ESG goals on a timely basis, or at all, our reputation, business, financial performance, and growth could be adversely affected.
In addition, our customers have adopted, and may continue to adopt, procurement policies that require us to comply with social and environmental provisions. An increasing number of investors have adopted, and may continue to adopt, ESG policies for their portfolio companies, and various voluntary sustainability initiatives and organizations have promulgated different social and environmental and sustainability guidelines. These practices, policies, provisions, and initiatives are under active development, subject to change, can be unpredictable and conflicting, and may prove difficult and expensive for us to comply with and could negatively affect our reputation, business, or financial condition.
If we are unable to retain, attract, expand, integrate, and train our management team and other key personnel, we may not be able to maintain or expand our business.
Our future success depends on our ability to retain, attract, expand, integrate, and train our management team and other key personnel, such as qualified engineering, service, sales, marketing, manufacturing, and other staff. We compete for key personnel with other medical equipment and software manufacturers and technology companies, as well as universities and research institutions. We have observed an overall tightening and increasingly competitive labor market over the past years, which has resulted in increased wages offered by other employers and voluntary attrition of employees in the industry, making it more difficult to recruit, hire, and retain talent. Because competition is intense, particularly in Utah, where unemployment rates are relatively low, compensation-related costs have increased and could continue to increase, significantly. Additionally, our United States-based employees, including our senior management team, work for us on an at-will basis, and there is no assurance that any such employees will remain with us. Replacing key employees may take an extended period of time, and to the extent we hire employees from competitors, we also may be subject to allegations that they have been improperly solicited or divulged proprietary or other confidential information. Freezing new positions or terminating existing ones could hinder our ability to execute our strategic plan and achieve growth targets, resulting in long-term sacrifices for short-term gains. Further, potential employee turnover resulting from work from home policy changes, limited growth opportunities and competitive market conditions could lead to knowledge loss and decreased productivity. If we are unable to retain or hire and train qualified personnel, we may not be able to maintain or expand our business. Similarly, if we fail to adequately invest in leadership training and career development resources this could limit employee growth, lead to shortages of skilled personnel, hinder effective management and decision making, and hamper overall organizational success.
Risks Relating to Our Indebtedness
The ABL Facility and the indenture governing our Senior Secured Notes impose significant operating and financial restrictions that may limit our current and future operating flexibility, particularly our ability to respond to changes in the economy or our industry or to take certain actions, which could harm our long-term interests and may limit our ability to make payments on the notes.
As of September 29, 2023, our total combined indebtedness was approximately $448.0 million of principal, including our 4.00% Convertible Senior Unsecured Notes due 2025 (the "Convertible Notes") and our 7.875% Senior Secured Notes due 2027 (the “Senior Secured Notes”). For more information regarding our borrowings, see Note 9, Borrowings of the Notes to Consolidated Financial Statements of this report.
Our $100 million revolving credit facility (the “Asset-Based Loan,” or "ABL Facility") and the indenture governing our Senior Secured Notes impose significant operational and financial restrictions on us that include, but are not limited to our ability to:
•incur, assume, or permit to exist additional indebtedness (including guarantees thereof);
•pay dividends or certain other distributions on our capital stock or repurchase our capital stock or prepay subordinated indebtedness;
•prepay, redeem, or repurchase certain debt;
•issue certain preferred stock or similar equity securities;
•incur liens on assets;
•make certain loans, investments, or other restricted payments;
•allow to exist certain restrictions on the ability of our restricted subsidiaries to pay dividends or make other payments to us;
•engage in transactions with affiliates;
•alter the business that we conduct; and
•sell certain assets or merge or consolidate with or into other companies.
As a result of these restrictions, we may be:
•limited in how we conduct our business;
•unable to raise additional debt or equity financing to operate during general economic or business downturns;
•limited in our ability to borrow additional funds as needed or increasing the cost of such borrowing;
•challenged in satisfying our obligations, including our debt obligations;
•vulnerable to adverse economic and general industry conditions, including interest rate fluctuations, because a portion of our borrowings are and will continue to be at variable rates of interest;
•required to dedicate a substantial portion of our cash flow from operations to payments on our debt, which would reduce the availability of our cash flow from operations to fund working capital, capital expenditures, or other general corporate purposes;
•at a disadvantage compared to competitors that may have proportionately less debt; or
•unable to compete effectively or to take advantage of new business opportunities.
A breach of the covenants under the indenture governing our Senior Secured Notes or the ABL Facility could result in an event of default under the applicable indebtedness. Such a default, if not cured or waived, may allow the creditors to accelerate the related debt, may result in the acceleration of any other debt that is subject to an applicable cross-acceleration or cross-default provision, and would permit the lenders under the ABL Facility to terminate all commitments to extend further credit under the ABL Facility. Furthermore, if we were unable to repay the amounts due and payable under the ABL Facility, those lenders could proceed against the collateral securing such indebtedness. In the event our lenders or holders of the notes accelerate the repayment of our borrowings, we and our subsidiaries may not have sufficient assets to repay that indebtedness.
If our cash requirements in the future are greater than expected, our cash flow from operations may not be sufficient to repay all of the outstanding debt as it becomes due, and we may not be able to borrow money, sell assets, or otherwise raise funds on acceptable terms, or at all, to refinance our debt. Any future refinancing of our indebtedness could be at higher interest rates and may require us to comply with more onerous covenants which could further restrict our business operations. Additionally, the indentures relating to our notes limit the use of the proceeds from any disposition of our assets. As a result, the indentures may prevent us from using the proceeds from such dispositions to satisfy our debt service obligations.
Our ability to continue to have the necessary liquidity to operate our business may be adversely impacted by a number of factors, and a deterioration of our results of operations and cash flow resulting from decreases in consumer spending, could, among other things, impact our ability to comply with the fixed charge coverage ratio contained in our ABL Facility.
Our historical sources of liquidity to fund ongoing cash requirements include cash flows from operations, cash and cash equivalents, borrowings through our previous credit facility, and debt offerings. The sufficiency and availability of credit may be adversely affected by a variety of factors, including, without limitation, the tightening of the credit markets, including lending by financial institutions who are sources of credit for our borrowing and liquidity; an increase in the cost of capital; the reduced availability of credit; our ability to execute our strategy; the level of our cash flows, which will be impacted by customer demand for our products; compliance with a fixed charge coverage ratio that is included in our ABL Facility; and interest rate fluctuations. We cannot predict the future level of interest rates or the effect of any increase in interest rates on the availability or aggregate cost of our borrowings. We cannot be certain that any additional required financing, whether debt or equity, will be available in amounts needed or on terms acceptable to us, if at all.
The ABL Facility contains a minimum Fixed Charge Coverage Ratio of 1.00 to 1.00 that is tested when excess availability under the ABL is less than the greater of (i) 10.0% of the Loan Cap (the lesser of (a) the aggregate commitments under the ABL Facility and (b) the aggregate borrowing base) and (ii) $7.5 million. Adverse developments in the economy in the past have led and in the future could lead to reduced spending by our customers and end-users which could adversely impact our net sales and cash flow, which could affect our ability to comply with the fixed charge coverage ratio.
We entered into certain hedging positions that may affect the value of the Convertible Notes and the volatility and value of our common stock.
In connection with the issuance of the Convertible Notes, we entered into certain convertible note hedge transactions. These hedge transactions are expected generally to reduce potential dilution of our common stock on any conversion of the Convertible Notes or offset any cash payments we are required to make in excess of the principal amount of such converted Convertible Notes, as the case may be, with such reduction or offset subject to a cap. The counterparties to these hedging positions or their respective affiliates may modify their hedge positions by entering into or unwinding various derivatives with respect to our common stock or purchasing or selling our common stock in secondary market transactions prior to the maturity of the Convertible Notes (and are likely to do so during any observation period related to a conversion of Convertible Notes or following any repurchase of Convertible Notes by us on any fundamental change repurchase date or otherwise) which could cause or avoid an increase or a decrease in the market price of our common stock or the Convertible Notes and could adversely affect the value of our common stock.
Risks Relating to Our Common Stock
The conditional conversion feature of the Convertible Notes, if triggered, may adversely affect our financial condition and operating results.
In the event the conditions for optional conversion of the Convertible Notes by holders are met before the close of business on the business day immediately preceding June 1, 2025, holders of the Convertible Notes will be entitled to convert the Convertible Notes at any time during specified periods at their option. If we elect to satisfy our conversion obligation by settling all or a portion of our conversion obligation in cash, it could adversely affect our liquidity. In addition, even if holders do not elect to convert their Convertible Notes, we could be required under applicable accounting rules to reclassify all or a portion of the outstanding principal of the Convertible Notes as a current rather than long-term liability, which would result in a material reduction of our net working capital and may seriously harm our business. If we elect to settle our conversion obligation in shares of common stock or a combination of cash and shares of common stock, any sales of our common stock issuable on such conversion could adversely affect prevailing market prices of our common stock. In addition, the existence of the Convertible Notes may encourage short selling by market participants because the conversion of the Convertible Notes could be used to satisfy short positions, or anticipated conversion of the Convertible Notes into shares of our common stock, any of which could depress the market price of our common stock.
Risks Relating to Our Spin-Off
Liabilities related to our operations when we were part of Varian, or liabilities associated with the spin-off from Varian, could materially and adversely affect our business, financial condition, results of operations, and cash flows.
We entered into a Separation and Distribution Agreement when we spun off from Varian. This agreement provides for, among other things, indemnification obligations designed to make Varex financially responsible for information contained in our registration statement that describes Varex, our separation from Varian, the transactions contemplated by the Separation and Distribution Agreement, and liabilities that were allocable to Varex before the spin-off. We may be subject to substantial liabilities if we were required to indemnify Varian or if Varian were required, but unable, to indemnify us. Either of these could negatively affect our business, financial position, results of operations, and/or cash flows.
General Risks
Failure to maintain effective internal controls and procedures could negatively impact us.
In the past, we have not always been successful in maintaining effective internal controls and procedures. Internal control over financial reporting is complex and may be revised over time to adapt to changes in our business or changes in applicable accounting rules. We cannot assure that our internal control over financial reporting will be effective in the future or that material weaknesses will not be discovered with respect to a prior period for which we had previously believed that internal controls were effective. If our internal controls and procedures are not effective, our financial statements may not accurately reflect the results of our business and operations. In addition, there could also be a negative reaction in the financial markets due to a loss of investor confidence in us and the reliability of our financial statements, which could affect our stock price.
Item 1B. Unresolved Staff Comments
None.
Item 2. Properties
Our corporate headquarters is located in Salt Lake City, Utah, where we own approximately 37 acres of land and approximately 494,000 square feet of space used for manufacturing, administrative functions, and research and development for both our Medical and Industrial segments. We also own or lease 29 other facilities throughout North America, Europe, and Asia that comprise over 800,000 square feet of manufacturing facilities, warehouses, sales and service, research and development, and office space, which are used for our Medical and/or Industrial segments, depending on the location.
In addition to our location in Salt Lake City, Utah, our other primary owned facilities are located in Las Vegas, Nevada; Franklin Park, Illinois; and Doetinchem, the Netherlands. Our Las Vegas, Nevada facility has approximately 5 acres of land and 94,000 square feet of space used for manufacturing, administrative functions, and research and development for our Industrial segment. Our Franklin Park, Illinois facility has approximately 3 acres of land and approximately 61,000 square feet of space used for manufacturing, administrative functions, and research and development for both our Medical and Industrial segments. Our
Doetinchem, Netherlands facility is approximately 4 acres and approximately 100,000 square feet of space used for manufacturing, engineering, administrative functions, and research and development for our Medical and Industrial segments.
Primary leased facilities include approximately 288,000 square feet in Laguna, Philippines, approximately 46,000 square feet in Wuxi, China, approximately 34,000 square feet in Bremen, Germany, approximately 34,000 of square feet in Walluf, Germany, and approximately 26,000 square feet in San Jose, California, all of which are used for manufacturing, research and development, or administrative functions for our Medical and Industrial segments.
We believe our current facilities are well-maintained and adequate to meet our current and reasonably anticipated future needs. We believe we will be able to renew leases, as needed, on acceptable terms or that we will be able to find suitable alternatives.
Item 3. Legal Proceedings
We are subject to various claims, complaints and legal actions in the normal course of business from time to time. The resolution of such claims, complaints and legal actions is subject to significant uncertainty and may be expensive, time consuming, and disruptive to our operations. At the present time, we do not believe we have any current or pending litigation for which the outcome could have a material adverse effect on our operations or financial position.
Item 4. Mine Safety Disclosures
Not applicable.
PART II
Item 5. Market for the Registrant’s Common Equity, Related Stockholder Matters and Issuer Purchases of Equity Securities
Varex's common stock is traded on the Nasdaq Global Select Market (the “NASDAQ”) under the symbol “VREX.”
Since our inception, we have not paid any cash dividends and have no current plan to pay cash dividends on Varex common stock. As of November 8, 2023, there were approximately 1,310 holders of record of Varex common stock. This number does not include beneficial owners holding shares in "nominee" or "street" name.
This graph shows the total return on VREX common stock for the five years ended September 29, 2023, with comparative total returns for the Russell 2000 Index (“RUT”) and the Dow Jones Medical Equipment Index (“DJUSAM”). The graph below assumes that $100.00 was invested on September 29, 2018 in our common stock and the companies listed in the RUT and the DJUSAM, as well as a reinvestment of dividends paid on such investments throughout the period.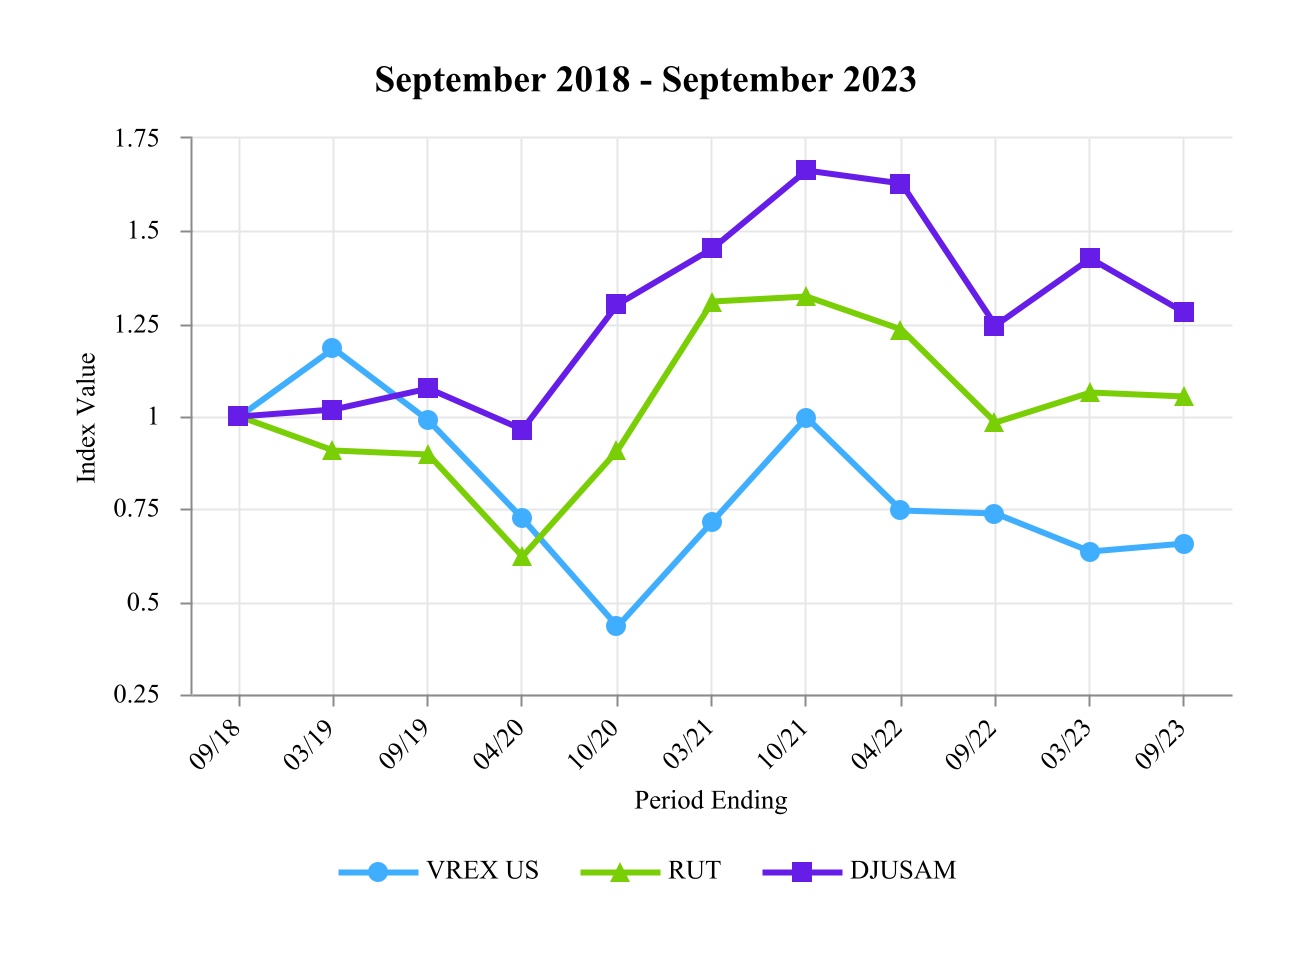
Item 6. [Reserved]
Item 7. Management’s Discussion and Analysis of Financial Condition and Results of Operations
The following discussion and analysis contains forward-looking statements relating to future events or our future financial or operating performance that involve risks and uncertainties, as set forth above under "Forward-Looking Statements." Our actual results could differ materially from those anticipated in these forward-looking statements as a result of certain factors described in this Annual Report on Form 10-K.
Our Business
Varex Imaging Corporation is a leading innovator, designer, and manufacturer of X-ray imaging components including X-ray tubes, flat panel and photon counting detectors and accessories, linear accelerators, and other image software processing solutions, which are critical components of a variety of X-ray based imaging equipment. Our success depends, among other things, on our ability to anticipate and respond to changes in our markets, the direction of technological innovation, and the demand from our customers. For additional information on our business, see Item 1 "Business".
Impact of General Economic Environment
While there was some improvement in the general economic environment during the year, we remain cautious as many factors remain dynamic and unpredictable. The uncertain economic environment, supply chain and logistic challenges, and geopolitical tensions have contributed to, and may continue to contribute to, inflation, higher interest rates and capital costs, increased shipping costs, supply shortages, increased costs of labor and materials, exchange rate volatility, and other similar effects.
During 2023, we experienced some supply chain, manufacturing, and logistics challenges. Currently, we anticipate such challenges to have less of an impact in fiscal year 2024. Shortages of certain materials have caused, and may continue to cause, delays in manufacturing products for our customers. In some cases, raw material shortages and delivery delays from our suppliers have caused operational and customer order fulfillment challenges. In addition, in late 2023 our Medical business was negatively impacted by the China government initiated anti-corruption measures related to the healthcare industry. We expect these actions to continue into fiscal year 2024, which could impact revenues in our China business.
For additional information on risks related to supply chain and logistics challenges, cost increases, changes in U.S. and worldwide economic conditions, geopolitical tensions and other risks that could impact our results, see Item 1A "Risk Factors".
Fiscal Year
Our fiscal year is the 52- or 53-week period ending on the Friday nearest September 30. Fiscal year 2023 was the 52-week period that ended September 29, 2023, fiscal year 2022 was the 52-week period that ended September 30, 2022, and fiscal year 2021 was the 52-week period that ended October 1, 2021.
Results of Operations
For a discussion and analysis of our year-over-year changes, financial condition, and results of operations for the fiscal years ended September 30, 2022 and October 1, 2021 refer to Item 7 "Management's Discussion and Analysis of Financial Condition and Results of Operations" of our annual report on Form 10-K for the fiscal year ended September 30, 2022, filed with the SEC on November 18, 2022. Our year-over-year changes, financial condition, and results of operations for the fiscal years ended September 29, 2023 and September 30, 2022 are set forth below.
Comparison of Results of Operations for Fiscal Years 2023 and 2022
Revenues, net
| | | | | | | | | | | | | | | | | | | | | | | | | | | | | |
| (In millions) | 2023 | | % Change | | 2022 | | % Change | | 2021 |
| Medical | $ | 673.3 | | | —% | | $ | 674.7 | | | 5% | | $ | 643.8 | |
| Industrial | 220.1 | | | 19% | | 184.7 | | | 6% | | 174.3 | |
| Total revenues, net | $ | 893.4 | | | 4% | | $ | 859.4 | | | 5% | | $ | 818.1 | |
| Medical as a percentage of total revenues | 75.4 | % | | | | 78.5 | % | | | | 78.7 | % |
| Industrial as a percentage of total revenues | 24.6 | % | | | | 21.5 | % | | | | 21.3 | % |
Medical revenues decreased $1.4 million in fiscal year 2023 compared to 2022 primarily due to lower sales in our China business, as well as decreased sales of digital detectors for oncology and dental applications partially offset by increased sales in X-ray tubes for CT and mammography applications.
Industrial revenues increased $35.4 million due to increased sales of security inspection products and digital detectors for inspection applications.
Revenues by Region
| | | | | | | | | | | | | | | | | | | | | | | | | | | | | |
| (In millions) | 2023 | | % Change | | 2022 | | % Change | | 2021 |
| Americas | $ | 281.8 | | | 3% | | $ | 273.3 | | | 2% | | $ | 268.5 | |
| EMEA | 290.7 | | | 4% | | 280.8 | | | 2% | | 276.3 | |
| APAC | 320.9 | | | 5% | | 305.3 | | | 12% | | 273.3 | |
| Total revenues, net | $ | 893.4 | | | 4% | | $ | 859.4 | | | 5% | | $ | 818.1 | |
| Americas as a percentage of total revenues | 31.5 | % | | | | 31.8 | % | | | | 32.8 | % |
| EMEA as a percentage of total revenues | 32.5 | % | | | | 32.7 | % | | | | 33.8 | % |
| APAC as a percentage of total revenues | 35.9 | % | | | | 35.5 | % | | | | 33.4 | % |
The Americas revenues increased $8.5 million in fiscal year 2023 compared to 2022 primarily due to increased sales of security inspection products, digital detectors and X-ray tubes. EMEA revenues increased $9.9 million primarily due to increased sales of security inspection products and X-ray tubes, partially offset by decreased sales in digital detectors for oncology and dental applications. APAC revenues increased $15.6 million primarily due to increased sales of X-ray tubes partially offset by a decrease in sales of digital detectors.
Gross Profit
| | | | | | | | | | | | | | | | | | | | | | | | | | | | | |
| (In millions) | 2023 | | % Change | | 2022 | | % Change | | 2021 |
| Medical | $ | 205.5 | | | (2)% | | $ | 210.5 | | | 4% | | $ | 203.2 | |
| Industrial | 84.8 | | | 16% | | 73.0 | | | 7% | | 68.3 | |
| Total gross profit | $ | 290.3 | | | 2% | | $ | 283.5 | | | 4% | | $ | 271.5 | |
| Medical gross margin | 30.5 | % | | | | 31.2 | % | | | | 31.6 | % |
| Industrial gross margin | 38.5 | % | | | | 39.5 | % | | | | 39.2 | % |
| Total gross margin | 32.5 | % | | | | 33.0 | % | | | | 33.2 | % |
The Medical segment gross profit decreased $5.0 million in fiscal year 2023 compared to 2022 primarily due to an increase in material costs associated with digital detectors.
The Industrial segment gross profit increased $11.8 million in fiscal year 2023 compared to 2022 primarily as a result of increased sales of security inspection products and X-ray tubes.
Operating Expenses
| | | | | | | | | | | | | | | | | | | | | | | | | | | | | |
| (In millions) | 2023 | | % Change | | 2022 | | % Change | | 2021 |
| Research and development | $ | 84.8 | | | 10% | | $ | 77.0 | | | 7% | | $ | 71.9 | |
| As a percentage of total revenues | 9.5 | % | | | | 9.0 | % | | | | 8.8 | % |
| Selling, general and administrative | $ | 128.4 | | | 9% | | $ | 118.3 | | | (6)% | | $ | 125.5 | |
| As a percentage of total revenues | 14.4 | % | | | | 13.8 | % | | | | 15.3 | % |
| | | | | | | | | |
| | | | | | | | | |
| Operating expenses | $ | 213.2 | | | 9% | | $ | 195.3 | | | (1)% | | $ | 197.4 | |
| As a percentage of total revenues | 23.9 | % | | | | 22.7 | % | | | | 24.1 | % |
Research and Development
Research and development costs for fiscal year 2023 increased to 9.5% of revenues primarily due to increased spending on material costs supporting research and development initiatives and includes $2 million in costs related to a development agreement entered into during fiscal year 2022 with a third-party company. See Note 12, Commitments and Contingencies, included in the accompanying Notes to Consolidated Financial Statements. We are committed to investing in research and development efforts to support long-term growth objectives by bringing new and innovative products to market for our customers.
Selling, General and Administrative
Selling, general and administrative expenses as a percentage of total revenues increased to 14.4% for fiscal year 2023 from 13.8% for fiscal year 2022 primarily due to increased compensation costs, with additional increases in external service and environmental remediation costs.
Interest and Other Expense, Net
The following table summarizes our interest and other expense, net:
| | | | | | | | | | | | | | | | | | | | | | | | | | | | | |
| (In millions) | 2023 | | % Change | | 2022 | | % Change | | 2021 |
| Interest income | $ | 3.7 | | | 825% | | $ | 0.4 | | | 300% | | $ | 0.1 | |
| Interest expense | (29.3) | | | (26)% | | (39.8) | | | (5)% | | (42.1) | |
| Other expense, net | (20.2) | | | 370% | | (4.3) | | | 23% | | (3.5) | |
| Interest and other expenses, net | $ | (45.8) | | | 5% | | $ | (43.7) | | | (4)% | | $ | (45.5) | |
Interest income increased in fiscal year 2023 compared to fiscal year 2022 primarily due to an increase in investments in marketable debt securities and other bank deposits.
Interest expense decreased in fiscal year 2023 compared to fiscal year 2022 primarily due to the redemption of $27 million of our Senior Secured Notes in March 2022, reduced fees on the ABL Facility, and reduced interest expense due to the adoption of ASU 2020-06. See Note 1, Summary of Significant Accounting Policies, "Recently Adopted Accounting Pronouncements" for further details concerning the adoption of ASU 2020-06.
Other expense, net increased in fiscal year 2023 compared to fiscal year 2022 primarily due to the impairment of an equity method investment, partially offset by decreased foreign exchange expense.
Taxes on Income
| | | | | | | | | | | |
| Fiscal Years |
| 2023 | | 2022 |
| Effective tax rate | (55.6) | % | | 30.8 | % |
We had an income tax benefit of $17.4 million and an income tax expense of $13.7 million, for effective rates of (55.6)% and 30.8%, for fiscal years 2023 and 2022, respectively.
During fiscal year 2023, our effective tax rate varied from the U.S. federal statutory rate of 21% primarily due to the favorable impact of the release of the U.S. valuation allowance, U.S. tax reform regarding international provisions, R&D credits, and return to provision adjustments. These favorable items were partially offset by the unfavorable impact of profit in foreign jurisdictions with statutory tax rates greater than 21%.
During fiscal year 2022, our effective tax rate varied from the U.S. federal statutory rate of 21% primarily due to the unfavorable impact of profit in foreign jurisdictions with statutory tax rates greater than 21% and also U.S. deferred tax attributes and losses in certain foreign jurisdictions for which a valuation allowance is provided. These unfavorable items were partially offset by the favorable impact of U.S. tax reform regarding international provisions, return to provision adjustments, and R&D tax credits.
We estimated the fiscal year 2023 GILTI (global intangible low-taxed income), BEAT (base-erosion anti-abuse tax), FDII (foreign-derived intangible income), limitations on interest expense deductions, and other components of U.S. tax reform, and have included these amounts in the calculation of the fiscal year 2023 tax provision. We made an accounting policy election, as allowed by the SEC and FASB, to recognize the impact of GILTI as a period cost if and when incurred.
Liquidity and Capital Resources
We assess our liquidity in terms of our ability to generate cash to fund our operations, including working capital and investing activities. We believe that our operating cash flow, cash on our balance sheet and availability under our ABL Facility are sufficient to meet our anticipated operating cash needs for at least the next 12 months and will be sufficient to allow us to continue to invest in our existing businesses, consummate strategic acquisitions and manage our capital structure on a short and long-term basis. We are currently not aware of any trends or demands, commitments, events, or uncertainties that will result in or that are reasonably likely to result in a material change to our liquidity needs during or beyond the next 12 months. See Item 1A. “Risk Factors” for a further discussion. The maximum availability under our ABL Facility was $100.0 million as of September 29, 2023; however, the
borrowing base under the ABL Facility fluctuates from month-to-month depending primarily on the amount of eligible accounts receivable, inventory, and real estate. As of September 29, 2023 the amount available under our ABL Facility was $88.7 million, and the ABL Facility remains undrawn. At September 29, 2023 we had total debt of $442.6 million, net of discounts and deferred issuance costs of $5.4 million.
Cash and Cash Equivalents, Certificates of Deposit, and Marketable Debt Securities
The following table summarizes our cash and cash equivalents, certificates of deposit, and marketable debt securities:
| | | | | | | | | | | | | | | | | | | | | | | |
| (In millions) | September 29, 2023 | | September 30, 2022 | | $ Change | | % Change |
| Cash and cash equivalents | $ | 152.6 | | | $ | 89.4 | | | $ | 63.2 | | | 70.7 | % |
| Certificates of deposit not included in cash and cash equivalents | 1.0 | | | 7.2 | | | (6.2) | | | (86.1) | % |
| Marketable debt securities not included in cash and cash equivalents | 41.3 | | | 16.7 | | | 24.6 | | | 147.3 | % |
| Total | $ | 194.9 | | | $ | 113.3 | | | $ | 81.6 | | | 72.0 | % |
Borrowings
The following table summarizes the changes in our debt outstanding:
| | | | | | | | | | | | | | | | | | | | | | | |
| (In millions, except for percentages) | September 29, 2023 | | September 30, 2022 | | $ Change | | % Change |
| Current maturities of long-term debt | | | | | | | |
| | | | | | | |
| Current portion of other debt | $ | 1.5 | | | $ | 2.1 | | | $ | (0.6) | | | (28.6) | % |
| | | | | | | |
| | | | | | | |
| | | | | | | |
| Non-current maturities of long-term debt: | | | | | | | |
| | | | | | | |
| | | | | | | |
| Convertible Senior Unsecured Notes | $ | 200.0 | | | $ | 200.0 | | | $ | — | | | — | % |
| Senior Secured Notes | 243.0 | | | 243.0 | | | — | | | — | % |
| Other debt | 3.5 | | | 4.6 | | | (1.1) | | | (23.9) | % |
| Total non-current maturities of long-term debt: | $ | 446.5 | | | $ | 447.6 | | | $ | (1.1) | | | (0.2) | % |
| | | | | | | |
| Unamortized issuance costs and debt discounts | | | | | | | |
Unamortized discount - Convertible Notes(1) | $ | — | | | $ | (28.7) | | | $ | 28.7 | | | (100.0) | % |
Unamortized issuance costs - Convertible Notes(1) | (2.5) | | | (3.1) | | | 0.6 | | | (19.4) | % |
| Debt issuance costs - Senior Secured Notes | (2.9) | | | (3.5) | | | 0.6 | | | (17.1) | % |
| Total | $ | (5.4) | | | $ | (35.3) | | | $ | 29.9 | | | (84.7) | % |
| Total debt outstanding, net | $ | 442.6 | | | $ | 414.4 | | | $ | 28.2 | | | 6.8 | % |
(1) In connection with the adoption of ASU 2020-06, the unamortized discount and equity component related to the Convertible Notes were derecognized and the carrying value of the issuance costs was adjusted in the first quarter of fiscal year 2023. Refer to Note 1, Summary of Significant Accounting Policies for further details.
Cash Flows | | | | | | | | | | | | | | | | | |
| Fiscal Years |
| (In millions) | 2023 | | 2022 | | 2021 |
| Net cash flow provided by (used in): | | | | | |
| Operating activities | $ | 108.4 | | | $ | 16.9 | | | $ | 92.6 | |
| Investing activities | (44.9) | | | (48.4) | | | (16.2) | |
| Financing activities | (0.2) | | | (23.8) | | | (32.3) | |
| Effects of exchange rate changes on cash and cash equivalents and restricted cash | 0.1 | | | (0.2) | | | (0.1) | |
| Net increase (decrease) in cash and cash equivalents and restricted cash | $ | 63.4 | | | $ | (55.5) | | | $ | 44.0 | |
Net cash provided by operating activities. Net cash provided by operating activities was $108.4 million and $16.9 million for the fiscal years 2023 and 2022, respectively. The increase in cash provided by operating activities was primarily due to a reduction in
cash outflows for inventory and an increased collections from accounts receivable, partially offset by increased payments for accounts payable during fiscal year 2023.
Net cash used in investing activities. Cash used in investing activities was $44.9 million and $48.4 million for the fiscal years 2023 and 2022, respectively. The decrease in cash used in investing activities was primarily due to cash receipts related to the settlement of net investment hedges and decreased purchases of property, plant, and equipment, partially offset by increased purchasing of marketable equity and debt securities.
Net cash used in financing activities. Net cash used in financing activities was $0.2 million and $23.8 million for the fiscal years 2023 and 2022, respectively. The decrease in cash used in financing activities was primarily due to the partial redemption of our Senior Secured Notes during the fiscal year 2022.
Days Sales Outstanding
Trade accounts receivable days sales outstanding (“DSO”) was 65 days and 68 days at September 29, 2023 and September 30, 2022, respectively. Our accounts receivable and DSO are impacted by a number of factors, including the timing of product shipments, collections performance, payment terms, the mix of revenues from different regions, and the effects of economic instability.
Material Contractual Obligations
The following table summarizes, as of September 29, 2023, the total amount of future payments due in various future periods:
| | | | | | | | | | | | | | | | | | | | | | | | | | | | | |
| Payments Due by Period |
| (In millions) | Total | | Fiscal Year 2024 | | Fiscal Years 2025-2026 | | Fiscal Years 2027-2028 | | Beyond |
| Lease obligations | $ | 38.0 | | | $ | 5.7 | | | $ | 10.1 | | | $ | 7.5 | | | $ | 14.7 | |
| Principal payments on borrowings | 448.0 | | | 1.5 | | | 202.8 | | | 243.7 | | | — | |
| dpiX fixed cost commitment | 3.3 | | | 3.3 | | | — | | | — | | | — | |
| Dividends to MeVis noncontrolling interest | 2.5 | | | 0.5 | | | 1.0 | | | 1.0 | | | — | |
| Development and share purchase commitments | 2.0 | | | 2.0 | | | — | | | — | | | — | |
| Non-cancellable supplier purchase obligations | 7.3 | | | 4.3 | | | 3.0 | | | — | | | — | |
| Total | $ | 501.1 | | | $ | 17.3 | | | $ | 216.9 | | | $ | 252.2 | | | $ | 14.7 | |
We lease office space under non-cancelable operating leases. For further information on our operating leases, see Note 3, Leases, included in the accompanying Notes to Consolidated Financial Statements.
For further discussion regarding our borrowings, see Note 9, Borrowings, included in the accompanying Notes to Consolidated Financial Statements.
In October 2013, we entered into an amended agreement with dpiX and other parties that, among other things, provides us with the right to 50% of dpiX’s total manufacturing capacity produced after January 1, 2014. The amended agreement requires us to pay for 50% of the fixed costs (as defined in the amended agreement), as determined at the beginning of each calendar year. For the remainder of calendar year 2023, we estimate that we have fixed cost commitments of $3.3 million related to this amended agreement. The fixed cost commitment for future periods will be determined and approved by the dpiX board of directors at the beginning of each calendar year. The amended agreement will continue unless the ownership structure of dpiX changes (as defined in the amended agreement).
In October 2015, pursuant to a Domination and Profit and Loss Transfer Agreement (the “MeVis Agreement”), we committed to grant the noncontrolling shareholders of MeVis: (1) an annual recurring net compensation of €0.95 per MeVis share; and, (2) a put right for their MeVis shares at €19.77 per MeVis share. The annual net payment will continue for the life of the MeVis Agreement, which we anticipate will continue for as long as we remain as the controlling shareholder of MeVis. As of September 29, 2023, noncontrolling shareholders together held approximately 0.5 million shares of MeVis, representing 26.3% of the outstanding shares.
In the fourth quarter of fiscal year 2022, we entered into a development agreement and a share purchase agreement with a third-party company. For more information about these agreements, see Note 12, Commitments and Contingencies, included in the accompanying Notes to Consolidated Financial Statements.
The Company enters into purchase agreements with its suppliers in the ordinary course of its business for the purchase of goods and services. Some of these purchase agreements are non-cancellable and thus contractually obligate us to future cash payments.
Our operations and facilities, past and present, are subject to environmental laws, including laws that regulate the handling, storage, transport and disposal of hazardous substances. Certain of those laws impose cleanup liabilities under certain circumstances. In connection with those laws and certain of our past and present operations and facilities, we are obligated to indemnify Varian for the cleanup liabilities related to prior corporate restructuring activities. As of September 29, 2023, our estimated environmental liability for these sites is $2.8 million, net of expected insurance proceeds. For further discussion regarding our environmental obligation, see Note 1, Summary of Significant Accounting Policies, included in the accompanying Notes to Consolidated Financial Statements.
Contingencies
From time to time, we are a party to or otherwise involved in legal proceedings, government inspections, investigations, customs and duty audits, and other claims and contingency matters, both inside and outside the United States, arising in the ordinary course of our business or otherwise. We accrue amounts for probable losses, to the extent they can be reasonably estimated, that we believe are adequate to address any liabilities related to legal proceedings as well as other loss contingencies that we believe will result in a probable loss (including, among other things, probable settlement value). A loss or a range of loss is disclosed when it is reasonably possible that a material loss will be incurred and can be estimated or when it is reasonably possible that the amount of a loss, when material, will exceed the recorded provision. We did not have any material contingent liabilities as of September 29, 2023 and September 30, 2022. Legal expenses are expensed as incurred.
See Item 3 "Legal Proceedings" of this Annual Report for additional information regarding legal proceedings and Note 12, Commitments and Contingencies, in the Notes to Consolidated Financial Statements for further information regarding certain of our contractual obligations and contingencies, which discussion is incorporated herein by reference.
Critical Accounting Estimates
The preparation of our consolidated financial statements and related disclosures in conformity with GAAP requires us to make estimates and assumptions that affect the reported amounts of assets, liabilities, revenues, and expenses. These estimates and assumptions are based on historical experience and on various other factors that we believe are reasonable under the circumstances. Our critical accounting policies that are affected by accounting estimates require us to use judgments, often as a result of the need to make estimates and assumptions regarding matters that are inherently uncertain, and actual results could differ materially from these estimates.
We periodically review our accounting policies, estimates, and assumptions and make adjustments when facts and circumstances dictate. Such accounting policies require us to use judgments, often as a result of the need to make estimates and assumptions regarding matters that are inherently uncertain, and actual results could differ materially from these estimates. Our critical accounting policies that are affected by accounting estimates include valuation of inventories, assessment of recoverability of goodwill and intangible assets, and income taxes. Note 1, Summary of Significant Accounting Policies, of the Notes to Consolidated Financial Statements, Item 8 "Financial Statements and Supplementary Data" describes the significant accounting policies and methods used in the preparation of the Company’s consolidated financial statements. For a discussion of how these estimates and other factors may affect our business, see Item 1A. “Risk Factors.”
Inventories, net
Inventory is valued at the lower of cost or net realizable value. Costs include materials, labor, external service and manufacturing overhead and is computed using standard cost, which approximates actual cost, on a first-in-first-out basis. We review inventory quantities on hand and record provisions for estimated excess, slow moving, and obsolete inventory. The evaluation of the carrying value of our inventories takes into consideration such factors as historical and anticipated future sales compared to quantities on hand and the prices we expect to obtain for products in our various markets. We adjust excess and obsolete inventories to net realizable value, and write-downs of excess and obsolete inventories are recorded as a component of cost of revenues. See Note 1, Summary of Significant Accounting Policies, "Inventories, net" for further details.
Goodwill and Intangible Assets
Goodwill is initially recorded when the purchase price paid for a business acquisition exceeds the estimated fair value of the net identified tangible and intangible assets acquired. Our future operating performance will be impacted by the future amortization of these acquired intangible assets and potential impairment charges related to these intangibles or to goodwill if indicators of impairment
exist. The allocation of the purchase price from business acquisitions to goodwill and intangible assets could have a material impact on our future operating results. In addition, the allocation of the purchase price of the acquired businesses to goodwill and intangible assets requires us to make significant estimates and assumptions, including estimates of future cash flows expected to be generated by the acquired assets and the appropriate discount rate for those cash flows. Should conditions differ from management’s estimates at the time of the acquisition, material write-downs of intangible assets and/or goodwill may be required, which would adversely affect our operating results.
We evaluate goodwill for impairment at least annually or whenever an event occurs or circumstances change that would more likely than not reduce the fair value of a reporting unit below its carrying amount. The evaluation includes consideration of qualitative factors including industry and market considerations, overall financial performance, and other relevant events and factors affecting the reporting unit. If we determine that a quantitative analysis is necessary, we perform a quantitative analysis that consists of a comparison of the fair value of a reporting unit against its carrying amount, including the goodwill allocated to each reporting unit.
In fiscal years 2023, 2022 and 2021, we performed the annual goodwill qualitative impairment test for our two reporting units and determined that, at those times, it was not more likely than not that the fair values of the reporting units were less than their carrying amounts and accordingly recorded no impairment. We performed the annual goodwill analysis as of the first day of the fourth quarter of each fiscal year (using balances as of the end of the third quarter of that fiscal year). Significant changes in our projections of our operating results or other factors could cause us to make interim assessments of impairment in any quarter that could result in some or all of the goodwill being impaired. A future impairment charge for goodwill could have a material effect on the Company's consolidated financial position and results of operations.
Taxes on Income
We calculate income taxes based on the tax statutes, regulations, and case law of the various jurisdictions in which we operate. Significant judgment is required in determining the timing and amounts of deductible and creditable items. The benefits of uncertain tax positions are recorded in our financial statements only after determining it is more likely than not that the uncertain tax positions would withstand challenge by taxing authorities. We periodically reassess our positions and record any changes in the financial statements as appropriate. Gross uncertain tax positions, exclusive of interest and penalties, were $1.4 million and $1.2 million as of September 29, 2023, and September 30, 2022, respectively. We believe the resolution of these matters will not materially affect our consolidated financial statements. Income taxes are described further in Note 15, Taxes on Income, of our consolidated financial statements.
The assessment regarding whether a valuation allowance is required or should be adjusted is based on an evaluation of possible sources of taxable income and also considers all available positive and negative evidence factors. Our accounting for the valuation of deferred tax assets represents our best estimate of future events. Changes in our current estimates, due to unanticipated market conditions, governmental legislative actions or events, could have a material effect on our ability to utilize deferred tax assets. Refer to Note 15, Taxes on Income, of our consolidated financial statements for additional information on the composition of valuation allowances.
Recent Accounting Standards or Updates Not Yet Effective
See Note 1, Summary of Significant Accounting Policies, of the Notes to Consolidated Financial Statements for a description of recent accounting standards, including the expected dates of adoption and the estimated effects on our consolidated financial statements.
Backlog
Backlog is the accumulation of all orders for which revenues have not been recognized and are still considered valid. Backlog also includes a small portion of billed service contracts that are included in deferred revenue. Our estimated total backlog at September 29, 2023 was approximately $335 million.
Orders may be revised or canceled, either according to their terms or as customers' needs change. Consequently, it is difficult to predict with certainty the amount of backlog that will result in revenues. We perform a quarterly review to verify that outstanding orders in the backlog remain valid. Aged orders that are not expected to be converted to revenues are deemed dormant and are reflected as a reduction in the backlog amounts in the period identified.
In addition to orders for which revenues have not been recognized and are still considered valid, we have pricing agreements with many of our established customers that span multi-year periods. These pricing agreements include volume ranges under which orders are placed.
Item 7A. Quantitative and Qualitative Disclosures about Market Risks
We are exposed to four primary types of market risks: foreign currency exchange rate risk, credit and counterparty risk, interest rate risk and commodity price risk.
Risks
Foreign Currency Exchange Rate Risk
A significant portion of our customers are outside the United States, while our financial statements are denominated, and our products are generally priced in U.S. Dollars. A strong U.S. Dollar may result in pricing pressure for our customers that are located outside the United States and that conduct their businesses in currencies other than the U.S. Dollar. Such pricing pressure has caused, and could continue to cause, some of our customers to ask for discounted prices, delay purchasing decisions, or consider moving to in-sourcing supply of components or migrating to lower cost alternatives. In addition, because our business is global and some payments may be made in local currency, fluctuations in foreign currency exchange rates can impact our revenues and expenses and/or the profitability in U.S. Dollars of products and services that we provide or purchase in foreign markets.
We may enter into foreign currency forward and option contracts with financial institutions to protect against foreign exchange risks associated with certain existing assets and liabilities, net investments in foreign subsidiaries, and forecast purchases denominated in foreign currencies. We may hedge portions of forecasted foreign currency exposure, typically for one to three months. In addition, we hold cross-currency swaps between the Euro and U.S. Dollar as a net investment hedge of our acquisition of Direct Conversion. Depending on the spot rate between the Euro and U.S. Dollar at the time of settlement and whether we have sufficient Euros available, we may have to borrow incrementally in U.S. Dollars to settle this obligation. Additionally, we may choose not to hedge certain foreign exchange exposures for a variety of reasons including, but not limited to, accounting considerations, the prohibitive economic cost of hedging particular exposures, or due to natural offsets among the different exposures.
Credit and Counterparty Risk
We use a centralized approach to manage substantially all of our cash and to finance our operations. Our cash and cash equivalents and marketable securities may be exposed to a concentration of credit risk, and we may also be exposed to credit risk and interest rate risk to the extent that we enter into credit facilities.
We perform ongoing credit evaluations of our customers and we maintain what we believe to be strong credit controls in evaluating and granting customer credit, including performing ongoing evaluations of our customers’ financial condition and creditworthiness and often using letters of credit or requiring certain customers to provide a down payment.
Interest Rate Risk
Borrowings under our ABL Facility bear interest at floating interest rates. At September 29, 2023, we had no borrowings subject to floating interest rates. See Note 9, Borrowings, of the Notes to Consolidated Financial Statements for further information.
Our exposure to interest rate risk also relates to our interest-bearing assets, primarily our cash and cash equivalents and marketable securities. Fixed rate securities may have their market value adversely affected due to a rise in interest rates, while floating rate securities may produce less income than expected if interest rates fall. Due in part to these factors, our future investment income may fluctuate due to changes in interest rates or we may suffer losses in principal if we are forced to sell securities that decline in market value due to changes in interest rates.
Commodity Price Risk
We are exposed to market risks related to volatility in the prices of raw materials used in our products. The prices of these raw materials fluctuate in response to changes in supply and demand fundamentals and our product margins and level of profitability tend to fluctuate with changes in these raw materials prices. We try to protect against such volatility through various business strategies. During the fiscal year ended September 29, 2023, we did not have any commodity derivative instruments in place to manage our exposure to price changes.
Sensitivity Analysis
The following table sets forth the potential loss in future earnings, fair value, or cash flows resulting from hypothetical changes in relevant market rates or prices as of September 29, 2023.
| | | | | | | | | | | |
| Market Risk Category | Hypothetical Change | Estimated Impact
(In millions) | Impact Category |
| Foreign Currency - Revenue | 10% decrease in foreign exchange rates | $ | 18.2 | | Earnings |
| Interest Rate - Marketable Securities | 100 basis point decrease in interest rate of underlying investments | 1.6 | | Earnings |
| Commodity Price | 10% increase in commodity prices | $ | 3.6 | | Earnings |
Item 8. Financial Statements and Supplementary Data.
The Consolidated Financial Statements and Schedules listed in the Index to Consolidated Financial Statements, Schedules and Exhibits on page F-1 are filed as part of this Annual Report and incorporated in this Item 8 by reference.
Item 9. Changes in and Disagreements with Accountants on Accounting and Financial Disclosure.
None.
Item 9A. Controls and Procedures.
Evaluation of Disclosure Controls and Procedures
Our disclosure controls and procedures, as defined in Rules 13a-15(e) and 15d-15(e) under the Exchange Act are designed to provide reasonable assurance that information required to be disclosed in our periodic reports that we file or submit under the Exchange Act are recorded, processed, summarized, and reported within the time periods specified in the rules and forms of the SEC and that such information is accumulated and communicated to our management, including our principal executive and financial officers, as appropriate to allow timely decisions regarding required disclosure. Management recognizes that any controls and procedures, no matter how well designed, and operated, can provide only reasonable assurance of achieving their objectives and management necessarily applies its judgment in evaluating the cost-benefit relationship of possible controls and procedures. Based on this evaluation, the Chief Executive Officer ("CEO") and Chief Financial Officer ("CFO") have concluded that our disclosure controls and procedures were effective as of September 29, 2023.
Management's Annual Report on Internal Control Over Financial Reporting
Management, under the supervision of our CEO and CFO, is responsible for establishing and maintaining adequate internal control over our financial reporting as defined in Rules 13a-15(f) and 15d-15(f) under the Exchange Act. Our internal control over financial reporting is designed to provide reasonable assurance regarding the reliability of financial reporting and the preparation of financial statements for external purposes in accordance with generally accepted accounting principles. Our management evaluated the design and operating effectiveness of our internal control over financial reporting based on the criteria established in the Internal Control-Integrated Framework (2013) issued by the Committee of Sponsoring Organizations of the Treadway Commission (the "COSO framework" (2013)). All internal control systems, no matter how well designed, have inherent limitations. Accordingly, even effective internal controls and procedures can provide only reasonable assurance with respect to financial statement preparation and presentation.
Under the supervision and with the participation of our management, we conducted an evaluation of the effectiveness of our internal control over financial reporting as of September 29, 2023. Based on this evaluation, our management concluded that we maintained effective internal control over financial reporting as of September 29, 2023.
The effectiveness of our internal control over financial reporting as of September 29, 2023 has been audited by Deloitte & Touche LLP, an independent registered public accounting firm, as stated in their attestation report, which appears below in this Item 9A.
Changes in Internal Control Over Financial Reporting
There were no changes to our internal control over financial reporting during the quarter ended September 29, 2023, that have materially affected, or are reasonably likely to materially affect, our internal control over financial reporting (as defined in Exchange Act Rules 13a-15(f) and 15d-15(f) under the Exchange Act).
REPORT OF INDEPENDENT REGISTERED PUBLIC ACCOUNTING FIRM
To the Stockholders and the Board of Directors of Varex Imaging Corporation
Opinion on Internal Control over Financial Reporting
We have audited the internal control over financial reporting of Varex Imaging Corporation and subsidiaries (the “Company”) as of September 29, 2023, based on criteria established in Internal Control — Integrated Framework (2013) issued by the Committee of Sponsoring Organizations of the Treadway Commission ("COSO"). In our opinion, the Company maintained, in all material respects, effective internal control over financial reporting as of September 29, 2023, based on criteria established in Internal Control — Integrated Framework (2013) issued by COSO.
We have also audited, in accordance with the standards of the Public Company Accounting Oversight Board (United States) ("PCAOB"), the consolidated financial statements as of and for the year ended September 29, 2023, of the Company and our report dated November 16, 2023, expressed an unqualified opinion on those financial statements and included an explanatory paragraph regarding the Company’s adoption of a new accounting standard.
Basis for Opinion
The Company’s management is responsible for maintaining effective internal control over financial reporting and for its assessment of the effectiveness of internal control over financial reporting, included in the accompanying Management's Annual Report on Internal Control Over Financial Reporting. Our responsibility is to express an opinion on the Company’s internal control over financial reporting based on our audit. We are a public accounting firm registered with the PCAOB and are required to be independent with respect to the Company in accordance with the U.S. federal securities laws and the applicable rules and regulations of the Securities and Exchange Commission and the PCAOB.
We conducted our audit in accordance with the standards of the PCAOB. Those standards require that we plan and perform the audit to obtain reasonable assurance about whether effective internal control over financial reporting was maintained in all material respects. Our audit included obtaining an understanding of internal control over financial reporting, assessing the risk that a material weakness exists, testing and evaluating the design and operating effectiveness of internal control based on the assessed risk, and performing such other procedures as we considered necessary in the circumstances. We believe that our audit provides a reasonable basis for our opinion.
Definition and Limitations of Internal Control over Financial Reporting
A company’s internal control over financial reporting is a process designed to provide reasonable assurance regarding the reliability of financial reporting and the preparation of financial statements for external purposes in accordance with generally accepted accounting principles. A company’s internal control over financial reporting includes those policies and procedures that (1) pertain to the maintenance of records that, in reasonable detail, accurately and fairly reflect the transactions and dispositions of the assets of the company; (2) provide reasonable assurance that transactions are recorded as necessary to permit preparation of financial statements in accordance with generally accepted accounting principles, and that receipts and expenditures of the company are being made only in accordance with authorizations of management and directors of the company; and (3) provide reasonable assurance regarding prevention or timely detection of unauthorized acquisition, use, or disposition of the company’s assets that could have a material effect on the financial statements.
Because of its inherent limitations, internal control over financial reporting may not prevent or detect misstatements. Also, projections of any evaluation of effectiveness to future periods are subject to the risk that controls may become inadequate because of changes in conditions, or that the degree of compliance with the policies or procedures may deteriorate.
/s/ Deloitte & Touche LLP
Salt Lake City, Utah
November 16, 2023
Item 9B. Other Information
During the three months ended September 29, 2023, none of our directors or officers informed us of the adoption or termination of a “Rule 10b5-1 trading arrangement” or “non-Rule 10b5-1 trading arrangement,” as those terms are defined in Regulation S-K, Item 408.
Item 9C. Disclosures Regarding Foreign Jurisdictions that Prevent Inspections.
Not applicable.
PART III
Except as otherwise disclosed below, the information required by Items 10, 11, 12, 13 and 14 is incorporated by reference from our definitive proxy statement for the 2024 Annual Meeting of Stockholders. Our definitive proxy statement for the 2024 Annual Meeting of Stockholders ("Proxy Statement") will be filed with the SEC no later than 120 days after September 29, 2023.
Item 10. Directors, Executive Officers and Corporate Governance.
Directors and Executive Officers
The information required by this Item 10 with respect to our executive officers is set forth in Item 1 "Business" of this Annual Report on Form 10-K and information relating to the availability of our code of conduct for executive officers and directors is set out below.
Code of Conduct
We have adopted a Code of Conduct that applies to all our executive officers and directors. The Code of Conduct is available on our website at http://www.vareximaging.com.
We intend to comply with the disclosure requirements of Item 5.05(c) of Form 8-K regarding an amendment to, or waiver from, a provision of the Code of Conduct that applies to our principal executive officer, principal financial officer, principal accounting officer or persons performing similar functions by posting such information on our website, specified above.
We will provide disclosure of delinquent Section 16(a) reports, if any, in our Proxy Statement, and such disclosure, if any, is incorporated herein by reference.
Item 11. Executive Compensation
The information required by this Item 11 is incorporated by reference from our Proxy Statement under the caption “Executive Compensation.”
Item 12. Security Ownership of Certain Beneficial Owners and Management and Related Stockholder Matters.
Equity Compensation Plan Information
The following table provides information as of September 29, 2023 with respect to the shares of our common stock that may be issued under our existing equity compensation plans.
| | | | | | | | | | | | | | | | | | | | |
| Plan Category (amounts in thousands except per share data) | | Number of securities to be issued upon exercise of outstanding options, warrants and rights (1) (a) | | Weighted average exercise price of outstanding options, warrants, and rights (2) (b) | | Number of securities remaining available for future issuance under equity compensation plans (3) (excluding securities reflected in columns (a) and (b)) |
| Equity compensation plans approved by security holders | | 4,140 | | $ | 28.08 | | | 2,778 |
| Equity compensation plans not approved by security holders | | — | | — | | | — |
| Total | | 4,140 | | $ | 28.08 | | | 2,778 |
(1) Consists of stock options, restricted stock units ("RSUs"), and deferred stock units ("DSUs") granted under the Varex Imaging Corporation 2017 Omnibus Stock Plan and the 2020 Stock Plan. Excludes purchase rights under the ESPP.
(2) The weighted average exercise price does not take into account the shares issuable upon vesting of outstanding RSUs and DSUs, which have no exercise price.
(3) Includes 2,211 thousand shares available for future issuance under the 2020 Stock Plan, and also includes 567 thousand shares available for future issuance under the ESPP. Shares available for issuance under the ESPP, including shares subject to purchase during the current purchase period, which commenced on August 28, 2023 (the exact number of which will not be known until the purchase date on February 23, 2024). Subject to the number of shares remaining in the share reserve, the maximum number of shares purchasable by any participant on any one purchase date for any purchase period, including the current purchase period, may not exceed 2,000 shares.
The information required by this Item 12 with respect to the security ownership of certain beneficial owners and the security ownership of directors and executive officers is incorporated by reference from our Proxy Statement under the caption “Stock Ownership—Beneficial Ownership of Certain Stockholders, Directors and Executive Officers.”
Item 13. Certain Relationships and Related Transactions and Director Independence.
The information required by this Item 13 with respect to certain relationships and related transactions is incorporated by reference from our Proxy Statement under the caption “Certain Relationships and Related Transactions.” The information required by this item with respect to director and committee member independence is incorporated by reference from our Proxy Statement under the caption “Proposal - Election of Directors.”
Item 14. Principal Accountant Fees and Services.
The information required by this Item 14 is incorporated by reference from our Proxy Statement under the caption “Proposal - Ratification of the Appointment of Our Independent Registered Public Accounting Firm.”
PART IV
Item 15. Exhibit and Financial Statement Schedules.
Documents filed as part of this annual report include:
| | | | | |
| 2. | Financial Statement Schedules and Other. All financial statement schedules have been omitted because they are not applicable, or not material or the required information is shown in the consolidated financial statements or the notes thereto. |
| | | | | |
| 3. | Exhibits. The exhibits listed below are filed as part of this annual report on Form 10-K. |
| | | | | | | | |
| Exhibit Number | | Description |
| 2.1* | | |
| | |
| 3.1* | | |
| | |
| 3.2* | | |
| | |
| 4.1 | | |
| | |
| 4.2* | | |
| | |
| 4.3* | | |
| | |
| 10.1* | | |
| | |
| 10.2* | | |
| | |
| 10.3* | | |
| | |
| 10.4*† | | |
| | |
| 10.5*† | | |
| | |
| 10.6*† | | |
| | |
| 10.7*† | | |
| | |
| 10.8*† | | |
| | |
| | | | | | | | |
| 10.9† | | |
| | |
| 10.10*† | | |
| | |
| 10.11*† | | |
| | |
| 10.12*† | | |
| | |
| 10.13*† | | |
| | |
| 10.14*† | | |
| | |
| 10.15*† | | |
| | |
| 10.16* | | |
| | |
| 10.17* | | |
| | |
| 10.18* | | |
| | |
| 10.19* | | |
| | |
| 10.20* | | |
| | |
| 10.21* | | LIBOR Transition Amendment, dated as of March 9, 2022, among Varex Imaging Corporation, Varex Imaging West, LLC, Varex Imaging Deutschland AG, the other Loan Parties, the Lenders, Issuing Banks and Swing Line Lender, and BANK OF AMERICA, N.A., as administrative agent and collateral agent. |
| | |
| 10.22*† | | |
| | |
| 21.1 | | |
| | |
| 23.1 | | |
| | |
| 31.1 | | |
| | |
| 31.2 | | |
| | |
| 32.1 | | |
| | |
| 32.2 | | |
| | |
| 101.INS | | XBRL Instance Document - the instance document does not appear in the Interactive Data File because its XBRL tags are embedded within the Inline XBRL document. |
| | |
| | | | | | | | |
| 101.SCH | | XBRL Taxonomy Extension Schema Document |
| | |
| 101.CAL | | XBRL Taxonomy Extension Calculation Linkbase Document |
| | |
| 101.DEF | | XBRL Taxonomy Extension Definition Linkbase Document |
| | |
| 101.LAB | | XBRL Taxonomy Extension Label Linkbase Document |
| | |
| 101.PRE | | XBRL Taxonomy Extension Presentation Linkbase Document |
| | |
| 104 | | Cover Page Interactive Data File (formatted as inline XBRL and contained in Exhibits 101). |
| | |
| * | | Incorporated herein by reference |
| | |
| † | | Management contract or compensatory agreement. |
| | |
| | |
Item 16. Form 10-K Summary
None
SIGNATURES
Pursuant to the requirements of Section 13 or 15(d) of the Securities Exchange Act of 1934, the Registrant has duly caused this report to be signed on its behalf by the undersigned thereunto duly authorized.
| | | | | | | | | | | |
| | | VAREX IMAGING CORPORATION |
| | | |
| | | |
Date: | November 16, 2023 | By: | /s/ Shubham Maheshwari |
| | | Shubham Maheshwari |
| | | Chief Financial Officer |
| | | (Duly Authorized Officer and Principal Financial Officer) |
Pursuant to the requirements of the Securities Exchange Act of 1934, this report has been signed below by the following persons on behalf of the registrant and in the capacities and on the dates indicated.
| | | | | | | | | | | | | | |
| Signature | | Capacity | | Date |
| /s/ SUNNY S. SANYAL | | President and Chief Executive Officer and Director (Principal Executive Officer) | | November 16, 2023 |
| Sunny S. Sanyal | | | | |
| | | | |
| /s/ SHUBHAM MAHESHWARI | | Chief Financial Officer (Principal Financial and Accounting Officer) | | November 16, 2023 |
| Shubham Maheshwari | | | | |
| | | | |
| | | | |
| | | | |
| | | | |
| /s/ WALTER M ROSEBROUGH, JR. | | Chairman of the Board | | November 16, 2023 |
| Walter M Rosebrough, Jr. | | | | |
| | | | |
| /s/ KATHLEEN L. BARDWELL | | Director | | November 16, 2023 |
| Kathleen L. Bardwell | | | | |
| | | | |
| /s/ JOCELYN D. CHERTOFF | | Director | | November 16, 2023 |
| Jocelyn D. Chertoff | | | | |
| | | | |
| /s/ TIMOTHY E. GUERTIN | | Director | | November 16, 2023 |
| Timothy E. Guertin | | | | |
| | | | |
| /s/ JAY K. KUNKEL | | Director | | November 16, 2023 |
| Jay K. Kunkel | | | | |
| | | | |
| /s/ CHRISTINE A. TSINGOS | | Director | | November 16, 2023 |
| Christine A. Tsingos | | | | |
| | | | |
| | | | |
| | | | |
INDEX TO CONSOLIDATED FINANCIAL STATEMENTS
REPORT OF INDEPENDENT REGISTERED PUBLIC ACCOUNTING FIRM
To the Stockholders and the Board of Directors of Varex Imaging Corporation
Opinion on the Financial Statements
We have audited the accompanying consolidated balance sheets of Varex Imaging Corporation and subsidiaries (the "Company") as of September 29, 2023 and September 30, 2022, the related consolidated statements of operations, comprehensive income, stockholders’ equity, and cash flows for each of the three years in the period ended September 29, 2023, and the related notes (collectively referred to as the "financial statements"). In our opinion, the financial statements present fairly, in all material respects, the financial position of the Company as of September 29, 2023 and September 30, 2022, and the results of its operations and its cash flows for each of the three years in the period ended September 29, 2023, in conformity with accounting principles generally accepted in the United States of America.
We have also audited, in accordance with the standards of the Public Company Accounting Oversight Board (United States) (PCAOB), the Company's internal control over financial reporting as of September 29, 2023, based on criteria established in Internal Control — Integrated Framework (2013) issued by the Committee of Sponsoring Organizations of the Treadway Commission and our report dated November 16, 2023, expressed an unqualified opinion on the Company's internal control over financial reporting.
Change in Accounting Principle
As discussed in Note 1 to the financial statements, the Company has changed its method of accounting for Convertible Notes effective October 1, 2022, due to the adoption of Accounting Standards Update, 2020-06, Debt — Debt With Conversion and Other Options (Subtopic 470-20) and Derivatives and Hedging — Contracts in Entity’s Own Equity (Subtopic 815-40): Accounting for Convertible Instruments and Contracts in an Entity’s Own Equity, using the modified retrospective approach.
Basis for Opinion
These financial statements are the responsibility of the Company's management. Our responsibility is to express an opinion on the Company's financial statements based on our audits. We are a public accounting firm registered with the PCAOB and are required to be independent with respect to the Company in accordance with the U.S. federal securities laws and the applicable rules and regulations of the Securities and Exchange Commission and the PCAOB.
We conducted our audits in accordance with the standards of the PCAOB. Those standards require that we plan and perform the audit to obtain reasonable assurance about whether the financial statements are free of material misstatement, whether due to error or fraud. Our audits included performing procedures to assess the risks of material misstatement of the financial statements, whether due to error or fraud, and performing procedures that respond to those risks. Such procedures included examining, on a test basis, evidence regarding the amounts and disclosures in the financial statements. Our audits also included evaluating the accounting principles used and significant estimates made by management, as well as evaluating the overall presentation of the financial statements. We believe that our audits provide a reasonable basis for our opinion.
Critical Audit Matters
The critical audit matters communicated below are matters arising from the current-period audit of the financial statements that were communicated or required to be communicated to the audit committee and that (1) relate to accounts or disclosures that are material to the financial statements and (2) involved our especially challenging, subjective, or complex judgments. The communication of critical audit matters does not alter in any way our opinion on the financial statements, taken as a whole, and we are not, by communicating the critical audit matters below, providing separate opinions on the critical audit matters or on the accounts or disclosures to which they relate.
Inventories – Valuation of Excess and Obsolete Inventories — Refer to Note 1 to the financial statements
Critical Audit Matter Description
Inventories are valued at the lower of cost or net realizable value. The Company evaluates the carrying value of its inventories taking into consideration such factors as historical sales and anticipated future sales compared to quantities on hand and the prices the Company expects to obtain for products in its various markets. The Company adjusts excess and obsolete inventories to net realizable value, and write-downs of excess and obsolete inventories are recorded as a component of cost of revenues. As of September 29, 2023, the Company’s inventories, net, were $277.5 million. For the year ended September 29, 2023, inventory write-downs were $5.6 million. Estimating the amount of excess and obsolete inventories involves significant judgment and estimates.
We identified the valuation of excess and obsolete inventories as a critical audit matter because of management’s significant judgment related to its estimates of anticipated future sales in determining the valuation of excess and obsolete inventories. This required a high degree of auditor judgment and an increased extent of effort.
How the Critical Audit Matter Was Addressed in the Audit
Our audit procedures related to management’s estimates of the valuation of excess and obsolete inventories included the following, among others:
•We tested the effectiveness of controls over the valuation of excess and obsolete inventories. The controls we tested included those over the calculation, accuracy and completeness of underlying data used in the calculation, including historical sales and anticipated future sales by product, product quantities on hand, and applicable prices.
•We evaluated management’s ability to accurately estimate the valuation of excess and obsolete inventories by comparing actual inventory write-downs to management’s historical estimates.
•We performed procedures to evaluate the reasonableness of management’s methods, assumptions, and judgments used in developing their estimate of the valuation of excess and obsolete inventories, which included consideration of historical sales, anticipated future sales, and information obtained from production planning and supply chain employees.
•We tested the accuracy and completeness of the underlying data used in the Company’s calculations of the valuation of excess and obsolete inventories, including historical usage, anticipated future sales, quantities on hand, and pricing.
•We assessed the reasonableness of the assumptions used in estimating the valuation of excess and obsolete inventories, which included consideration of anticipated future sales and information obtained from production planning and supply chain employees, and developing an independent expectation and comparing our independent expectation to the results of the Company’s calculations.
•We tested the mathematical accuracy of the Company’s calculations of excess and obsolete inventories.
Investments in Privately-Held Companies – Impairment of Equity Method Investment — Refer to Notes 1, 4, 6, and 10 to the financial statements
Critical Audit Matter Description
The Company accounts for its equity investments in privately-held companies under the equity method of accounting if the Company has the ability to exercise significant influence in, but not control, these investments. The Company records impairment losses on its equity method investments if an impairment exists and is deemed to be other-than-temporary. To determine the fair value of the equity method investment, the Company equally weights an income approach based on discounted cash flows and a market approach based on comparable publicly traded companies in similar lines of business. During the year ended September 29, 2023, the Company assessed its equity method investment in dpiX Holding LLC (“dpiX Holding”) for impairment and concluded that the carrying value of the investment was greater than its fair value and that the loss in value was other than temporary. The Company recorded an impairment charge totaling $16.4 million. The Company’s estimate of the fair value of the equity method investment included a discounted cash flow technique which included estimates of a discount rate and future revenues of dpiX Holding.
We identified the valuation of dpiX Holding as a critical audit matter because of the significant judgments and estimates management makes to determine the fair value of the equity method investment to record the impairment charge. This required a high degree of auditor judgment and an increased extent of effort when performing audit procedures to evaluate the reasonableness of management’s estimates and assumptions related to selection of the discount rate and forecasts of future revenues used in determining the impairment charge, including the need to involve our valuation specialists.
How the Critical Audit Matter Was Addressed in the Audit
Our audit procedures related to management’s estimates and assumptions related to selection of the discount rate and forecasts of future revenues in determining the impairment of dpiX Holding included the following, among others:
•We tested the effectiveness of controls over management’s impairment charge calculation, including those over the determination of the fair value of the equity method investment, such as controls related to management’s estimates and assumptions related to selection of the discount rate and forecasts of future revenues.
•We evaluated the reasonableness of management’s revenue forecast estimates by comparing key assumptions to historical results, communications and contractual agreements between the Company and dpiX Holding, and information obtained from sales and marketing personnel of the Company.
•With the assistance of fair value specialists, we evaluated the reasonableness of the discount rate by:
◦Testing the source information underlying the determination of the discount rate and mathematical accuracy of the calculation.
◦Developing a range of independent estimates and comparing those to the discount rate selected by management.
•We evaluated whether the revenue forecast estimates were consistent with evidence obtained in other areas of the audit.
/s/ Deloitte & Touche LLP
Salt Lake City, Utah
November 16, 2023
We have served as the Company’s auditor since 2021.
VAREX IMAGING CORPORATION
CONSOLIDATED STATEMENTS OF OPERATIONS
| | | | | | | | | | | | | | | | | |
| Fiscal Years |
| (In millions, except per share amounts) | 2023 | | 2022 | | 2021 |
Revenues, net | $ | 893.4 | | | $ | 859.4 | | | $ | 818.1 | |
Cost of revenues | 603.1 | | | 575.9 | | | 546.6 | |
| Gross profit | 290.3 | | | 283.5 | | | 271.5 | |
Operating expenses: | | | | | |
Research and development | 84.8 | | | 77.0 | | | 71.9 | |
Selling, general and administrative | 128.4 | | | 118.3 | | | 125.5 | |
Total operating expenses | 213.2 | | | 195.3 | | | 197.4 | |
| Operating income | 77.1 | | | 88.2 | | | 74.1 | |
Interest income | 3.7 | | | 0.4 | | | 0.1 | |
Interest expense | (29.3) | | | (39.8) | | | (42.1) | |
| Other expense, net | (20.2) | | | (4.3) | | | (3.5) | |
| Interest and other expense, net | (45.8) | | | (43.7) | | | (45.5) | |
| Income before taxes | 31.3 | | | 44.5 | | | 28.6 | |
| Income tax (benefit) expense | (17.4) | | | 13.7 | | | 10.7 | |
| Net income | 48.7 | | | 30.8 | | | 17.9 | |
| Less: Net income attributable to noncontrolling interests | 0.5 | | | 0.5 | | | 0.5 | |
| Net income attributable to Varex | $ | 48.2 | | | $ | 30.3 | | | $ | 17.4 | |
| Net income per common share attributable to Varex | | | | | |
| Basic | $ | 1.20 | | | $ | 0.76 | | | $ | 0.44 | |
| Diluted | $ | 1.08 | | | $ | 0.73 | | | $ | 0.43 | |
| Weighted average common shares outstanding | | | | | |
| Basic | 40.3 | | | 39.8 | | | 39.3 | |
| Diluted | 50.3 | | | 41.6 | | | 40.3 | |
See accompanying Notes to Consolidated Financial Statements.
VAREX IMAGING CORPORATION
CONSOLIDATED STATEMENTS OF COMPREHENSIVE INCOME
| | | | | | | | | | | | | | | | | |
| Fiscal Years |
| (In millions) | 2023 | | 2022 | | 2021 |
| Net income | $ | 48.7 | | | $ | 30.8 | | | $ | 17.9 | |
| Other comprehensive (loss) income, net of tax | | | | | |
| | | | | |
| Unrealized (loss) gain on defined benefit obligations | (1.0) | | | 1.4 | | | (0.1) | |
| | | | | |
| Income (loss) on forward contracts | 0.1 | | | (0.6) | | | — | |
| Unrealized income (loss) on available-for-sale securities | 0.1 | | | (0.1) | | | — | |
| Foreign currency translation adjustments | (0.5) | | | (0.6) | | | (0.7) | |
| | | | | |
| Total comprehensive income | 47.4 | | | 30.9 | | | 17.1 | |
| Less: Comprehensive income attributable to noncontrolling interests | 0.5 | | | 0.5 | | | 0.5 | |
| Comprehensive income attributable to Varex | $ | 46.9 | | | $ | 30.4 | | | $ | 16.6 | |
See accompanying Notes to Consolidated Financial Statements.
VAREX IMAGING CORPORATION
CONSOLIDATED BALANCE SHEETS
| | | | | | | | | | | |
(In millions, except share amounts) | September 29, 2023 | | September 30, 2022 |
Assets | | | |
Current assets: | | | |
Cash and cash equivalents | $ | 152.6 | | | $ | 89.4 | |
Accounts receivable, net of allowance for credit losses of $0.6 million and $0.6 million at September 29, 2023 and September 30, 2022, respectively | 163.6 | | | 173.3 | |
Inventories, net | 277.5 | | | 303.2 | |
Prepaid expenses and other current assets | 64.6 | | | 44.0 | |
Total current assets | 658.3 | | | 609.9 | |
Property, plant and equipment, net | 143.6 | | | 141.3 | |
Goodwill | 288.5 | | | 284.5 | |
Intangible assets, net | 22.4 | | | 33.6 | |
Investments in privately-held companies | 29.0 | | | 46.4 | |
Deferred tax assets | 41.3 | | | 2.3 | |
Operating lease assets | 29.0 | | | 23.2 | |
Other assets | 37.5 | | | 43.2 | |
Total assets | $ | 1,249.6 | | | $ | 1,184.4 | |
Liabilities and stockholders' equity | | | |
Current liabilities: | | | |
Accounts payable | $ | 64.7 | | | $ | 78.2 | |
Accrued liabilities and other current liabilities | 82.6 | | | 81.4 | |
Current operating lease liabilities | 3.8 | | | 4.0 | |
Current maturities of long-term debt | 1.5 | | | 2.1 | |
Deferred revenues | 10.2 | | | 7.4 | |
Total current liabilities | 162.8 | | | 173.1 | |
Long-term debt, net | 441.1 | | | 412.3 | |
Deferred tax liabilities | — | | | 0.5 | |
Operating lease liabilities | 23.1 | | | 18.0 | |
Other long-term liabilities | 41.6 | | | 33.8 | |
Total liabilities | 668.6 | | | 637.7 | |
Commitments and contingencies (Note 12) |
| |
|
Stockholders' equity: | | | |
Preferred stock, $0.01 par value: 20,000,000 shares authorized, none issued | — | | | — | |
Common stock, $0.01 par value: 150,000,000 shares authorized | | | |
Shares issued and outstanding: 40,529,573 and 40,085,126 at September 29, 2023 and September 30, 2022, respectively | 0.4 | | | 0.4 | |
| | | |
Additional paid-in capital | 450.4 | | | 469.1 | |
| Accumulated other comprehensive (loss) income | (1.2) | | | 0.1 | |
Retained earnings | 118.1 | | | 63.8 | |
Total Varex stockholders' equity | 567.7 | | | 533.4 | |
Noncontrolling interests | 13.3 | | | 13.3 | |
Total stockholders' equity | 581.0 | | | 546.7 | |
Total liabilities and stockholders' equity | $ | 1,249.6 | | | $ | 1,184.4 | |
See accompanying Notes to Consolidated Financial Statements.
VAREX IMAGING CORPORATION
CONSOLIDATED STATEMENTS OF STOCKHOLDERS' EQUITY
| | | | | | | | | | | | | | | | | | | | | | | | | | | | | | | | | | | | | | | | | | | | | | | | | |
| Common Stock | | Additional Paid-in Capital | | | | Accumulated Other Comprehensive Income | | Retained Earnings | | Total Varex Equity | | Noncontrolling Interests | | Total Stockholders' Equity |
| (In millions) | Shares | | Amount | | | | | | | |
| October 2, 2020 | 39.1 | | | $ | 0.4 | | | $ | 434.4 | | | | | $ | 0.8 | | | $ | 16.1 | | | $ | 451.7 | | | $ | 14.1 | | | $ | 465.8 | |
| Net income | — | | | — | | | — | | | | | — | | | 17.4 | | | 17.4 | | | 0.5 | | | 17.9 | |
| Common stock issued upon vesting of restricted shares | 0.2 | | | — | | | — | | | | | — | | | — | | | — | | | — | | | — | |
| Shares withheld on vesting of restricted stock | (0.1) | | | — | | | (1.5) | | | | | — | | | — | | | (1.5) | | | — | | | (1.5) | |
| Common stock issued under employee stock purchase plan | 0.2 | | | — | | | 2.8 | | | | | — | | | — | | | 2.8 | | | — | | | 2.8 | |
| Share-based compensation | — | | | — | | | 13.9 | | | | | — | | | — | | | 13.9 | | | — | | | 13.9 | |
| Unrealized loss on defined benefit obligations, net of tax | — | | | — | | | — | | | | | (0.1) | | | — | | | (0.1) | | | — | | | (0.1) | |
| Foreign currency translation adjustments | — | | | — | | | — | | | | | (0.7) | | | — | | | (0.7) | | | — | | | (0.7) | |
| Other | — | | | — | | | (0.2) | | | | | — | | | — | | | (0.2) | | | (1.4) | | | (1.6) | |
| October 1, 2021 | 39.4 | | | $ | 0.4 | | | $ | 449.4 | | | | | $ | — | | | $ | 33.5 | | | $ | 483.3 | | | $ | 13.2 | | | $ | 496.5 | |
| Net income | — | | | — | | | — | | | | | — | | | 30.3 | | | 30.3 | | | 0.5 | | | 30.8 | |
| Exercise of stock options | 0.1 | | | — | | | 3.8 | | | | | — | | | — | | | 3.8 | | | — | | | 3.8 | |
| Common stock issued upon vesting of restricted shares | 0.4 | | | — | | | — | | | | | — | | | — | | | — | | | — | | | — | |
| Shares withheld on vesting of restricted stock | (0.1) | | | — | | | (2.8) | | | | | — | | | — | | | (2.8) | | | — | | | (2.8) | |
| Common stock issued under employee stock purchase plan | 0.3 | | | — | | | 4.9 | | | | | — | | | — | | | 4.9 | | | — | | | 4.9 | |
| Share-based compensation | — | | | — | | | 14.0 | | | | | — | | | — | | | 14.0 | | | — | | | 14.0 | |
| Unrealized loss on forward contracts | — | | | — | | | — | | | | | (0.6) | | | — | | | (0.6) | | | — | | | (0.6) | |
| Unrealized loss on change in fair value of available-for-sale securities | — | | | — | | | — | | | | | (0.1) | | | — | | | (0.1) | | | — | | | (0.1) | |
| Unrealized gain on defined benefit obligations, net of tax | — | | | — | | | — | | | | | 1.4 | | | — | | | 1.4 | | | — | | | 1.4 | |
| Foreign currency translation adjustments | — | | | — | | | — | | | | | (0.6) | | | — | | | (0.6) | | | — | | | (0.6) | |
| Other | — | | | — | | | (0.2) | | | | | — | | | — | | | (0.2) | | | (0.4) | | | (0.6) | |
| September 30, 2022 | 40.1 | | | $ | 0.4 | | | $ | 469.1 | | | | | $ | 0.1 | | | $ | 63.8 | | | $ | 533.4 | | | $ | 13.3 | | | $ | 546.7 | |
| Net income | — | | | — | | | — | | | | | — | | | 48.2 | | | 48.2 | | | 0.5 | | | 48.7 | |
| Cumulative effect of accounting change | — | | | — | | | (34.6) | | | | | — | | | 6.1 | | | (28.5) | | | — | | | (28.5) | |
| Exercise of stock options | — | | | — | | | 0.2 | | | | | — | | | — | | | 0.2 | | | — | | | 0.2 | |
| Common stock issued upon vesting of restricted shares | 0.2 | | | — | | | — | | | | | — | | | — | | | — | | | — | | | — | |
| Shares withheld on vesting of restricted stock | (0.1) | | | — | | | (1.4) | | | | | — | | | — | | | (1.4) | | | — | | | (1.4) | |
| Common stock issued under employee stock purchase plan | 0.3 | | | — | | | 3.9 | | | | | — | | | — | | | 3.9 | | | — | | | 3.9 | |
| Share-based compensation | — | | | — | | | 13.5 | | | | | — | | | — | | | 13.5 | | | — | | | 13.5 | |
| Realized gain on forward contracts | — | | | — | | | — | | | | | 0.1 | | | — | | | 0.1 | | | — | | | 0.1 | |
| Unrealized gain on change in fair value of available-for-sale securities | — | | | — | | | — | | | | | 0.1 | | | — | | | 0.1 | | | — | | | 0.1 | |
| Unrealized loss on defined benefit obligations, net of tax | — | | | — | | | — | | | | | (1.0) | | | — | | | (1.0) | | | — | | | (1.0) | |
| | | | | | | | | | | | | | | | | |
| | | | | | | | | | | | | | | | | |
| Foreign currency translation adjustments | — | | | — | | | — | | | | | (0.5) | | | — | | | (0.5) | | | — | | | (0.5) | |
| Other | — | | | — | | | (0.3) | | | | | — | | | — | | | (0.3) | | | (0.5) | | | (0.8) | |
| September 29, 2023 | 40.5 | | | $ | 0.4 | | | $ | 450.4 | | | | | $ | (1.2) | | | $ | 118.1 | | | $ | 567.7 | | | $ | 13.3 | | | $ | 581.0 | |
See accompanying Notes to Consolidated Financial Statements.
VAREX IMAGING CORPORATION
CONSOLIDATED STATEMENTS OF CASH FLOWS
| | | | | | | | | | | | | | | | | |
| Fiscal Years |
| (In millions) | 2023 | | 2022 | | 2021 |
| Cash flows from operating activities: | | | | | |
| Net income | $ | 48.7 | | | $ | 30.8 | | | $ | 17.9 | |
| Adjustments to reconcile net income to net cash provided by operating activities: | | | | | |
| Share-based compensation expense | 13.5 | | | 14.0 | | | 13.9 | |
| | | | | |
| Depreciation | 19.5 | | | 19.0 | | | 20.5 | |
| Amortization of intangible assets | 13.7 | | | 14.6 | | | 16.8 | |
| Deferred taxes | (39.5) | | | 0.6 | | | (3.0) | |
| Loss from equity method investments | 1.6 | | | 2.6 | | | 3.0 | |
| Impairment of equity method investment | 16.4 | | | — | | | — | |
| Amortization of deferred loan costs | 2.6 | | | 10.9 | | | 10.0 | |
| | | | | |
| | | | | |
| Other assets impairment charges | — | | | — | | | 0.5 | |
| Inventory write-down | 5.6 | | | 6.4 | | | 3.5 | |
| Loss on operating lease abandonment | — | | | 1.9 | | | — | |
| Other, net | 3.0 | | | 4.1 | | | 1.3 | |
| Changes in assets and liabilities: | | | | | |
| Accounts receivable | 9.8 | | | (18.1) | | | (32.9) | |
| Inventories | 20.2 | | | (85.0) | | | 42.8 | |
| Prepaid expenses and other assets | 7.0 | | | 10.3 | | | (0.9) | |
| Accounts payable | (15.0) | | | 19.7 | | | (13.6) | |
| Accrued liabilities and other current and long-term liabilities | (1.0) | | | (14.9) | | | 12.2 | |
| Deferred revenues | 2.3 | | | — | | | 0.6 | |
| | | | | |
| Net cash provided by operating activities | 108.4 | | | 16.9 | | | 92.6 | |
| Cash flows from investing activities: | | | | | |
| Purchases of property, plant and equipment | (20.7) | | | (21.3) | | | (15.1) | |
| Loss on settlement of cash flow hedge | (0.2) | | | (0.5) | | | — | |
| | | | | |
| Proceeds from maturities of marketable debt securities | 28.3 | | | 2.0 | | | — | |
| Purchase of marketable debt securities | (52.2) | | | (18.7) | | | — | |
| Purchase of marketable equity securities | (2.7) | | | (2.4) | | | — | |
| Purchase of certificates of deposit | (1.0) | | | (7.2) | | | — | |
| Acquisitions of businesses and assets | (1.0) | | | — | | | — | |
| Settlement of net investment hedge | 7.0 | | | — | | | — | |
| Proceeds from sales of business and assets | — | | | 1.7 | | | — | |
| Investments in and loans to privately-held companies | — | | | (0.6) | | | (1.4) | |
| Other | (2.4) | | | (1.4) | | | 0.3 | |
| Net cash used in investing activities | (44.9) | | | (48.4) | | | (16.2) | |
| Cash flows from financing activities: | | | | | |
| | | | | |
| Proceeds from issuance of debt | — | | | — | | | 1.5 | |
| Repayments of borrowings | (2.4) | | | (29.4) | | | (33.1) | |
| | | | | |
| | | | | |
| | | | | |
| Proceeds from shares issued under employee stock purchase plan | 3.9 | | | 4.9 | | | 2.8 | |
| Proceeds from exercise of stock options | 0.2 | | | 3.8 | | | — | |
| | | | | |
| Taxes related to net share settlement of equity awards | (1.4) | | | (2.8) | | | (1.5) | |
| | | | | |
| Other financing activities | (0.5) | | | (0.3) | | | (2.0) | |
| Net cash used in financing activities | (0.2) | | | (23.8) | | | (32.3) | |
| Effects of exchange rate changes on cash and cash equivalents and restricted cash | 0.1 | | | (0.2) | | | (0.1) | |
| Net increase (decrease) in cash and cash equivalents and restricted cash | 63.4 | | | (55.5) | | | 44.0 | |
| Cash and cash equivalents and restricted cash at beginning of period | 90.6 | | | 146.1 | | | 102.1 | |
| Cash and cash equivalents and restricted cash at end of period | $ | 154.0 | | | $ | 90.6 | | | $ | 146.1 | |
| Supplemental cash flow information: | | | | | |
| Cash paid for interest | $ | 27.4 | | | $ | 29.5 | | | $ | 21.6 | |
| Cash paid for income tax, net of refunds | 16.7 | | | 2.2 | | | 14.1 | |
| Supplemental non-cash activities: | | | | | |
| Purchases of property, plant and equipment financed through accounts payable | $ | 2.7 | | | $ | 1.5 | | | $ | 1.5 | |
| | | | | |
| | | | | |
See accompanying Notes to Consolidated Financial Statements.
VAREX IMAGING CORPORATION
NOTES TO CONSOLIDATED FINANCIAL STATEMENTS
1. SUMMARY OF SIGNIFICANT ACCOUNTING POLICIES
Description of Business
Varex Imaging Corporation (the “Company” or “Varex”) designs, manufactures, sells, and services a broad range of medical products, which include X-ray imaging components including X-ray tubes, flat panel and photon counting detectors and accessories, ionization chambers, high voltage connectors, image processing software and workstations, 3D reconstruction software, computer-aided diagnostic software, collimators, automatic exposure control devices, generators, and heat exchangers. The Company sells its products to imaging system original equipment manufacturer (“OEM”) customers for incorporation into new medical diagnostic, radiation therapy, dental, and veterinary equipment, as well as to independent service companies and distributors, and directly to end-users for replacement purposes.
The Company also designs, manufactures, sells and services industrial products, which include Linatron® X-ray linear accelerators, X-ray tubes, digital detectors, high voltage connectors, coolers, imaging processing software and image detection products for security and inspection purposes, such as cargo screening at ports and borders and nondestructive examination in a variety of applications. The Company generally sells security and inspection products to OEM customers who incorporate Varex’s products into their inspection or irradiation systems and processes. The Company conducts an active research and development program to focus on new technology and applications in both the medical and industrial X-ray imaging markets.
Basis of Presentation
The accompanying consolidated financial statements have been prepared by the Company pursuant to the rules and regulations of the Securities and Exchange Commission ("SEC") and in accordance with accounting principles generally accepted in the United States ("GAAP"). The Company has consolidated all its majority owned subsidiaries and entities over which it has control. All intercompany balances and transactions have been eliminated in consolidation.
Reclassification of Prior Period Presentation
Certain prior period amounts in the Notes to the Consolidated Financial Statements have had a change in presentation to conform to current period presentation. This change does not affect previously reported results.
Segment Reporting
The Company has two reportable operating segments; (i) Medical and (ii) Industrial. See Note 16, Segment Information, included in this report, for further information on the Company’s segments.
Fiscal Year
The fiscal years of the Company as reported are the 52 or 53-week period ending on the Friday nearest September 30. Fiscal year 2023 was the 52-week period that ended September 29, 2023, fiscal year 2022 was the 52-week period that ended September 30, 2022, and fiscal year 2021 was the 52-week period that ended October 1, 2021.
Variable Interest Entities
For entities in which the Company has variable interests, the Company focuses on identifying which entity has the power to direct the activities that most significantly impact the variable interest entity’s economic performance and which entity has the obligation to absorb losses or the right to receive residual returns from the variable interest entity. If the Company is the primary beneficiary of a variable interest entity, the assets, liabilities, and results of operations of the variable interest entity will be included in the Company’s consolidated financial statements. As of September 29, 2023, the Company had variable interests in two entities, neither of which were consolidated by the Company.
Use of Estimates
The preparation of financial statements in conformity with GAAP requires management to make estimates and assumptions that affect the reported amounts of assets and liabilities and disclosure of contingent assets and liabilities at the date of the consolidated financial statements and the reported amounts of revenues and expenses during the reporting periods. Such estimates include the valuation of inventories, valuation of goodwill and intangible assets, receivables, warranties, refund liabilities, long-lived
asset valuations, impairment of investments, valuation of financial instruments, and taxes on income. Actual results could differ from these estimates.
Cash and Cash Equivalents
The Company considers unrestricted currency on hand, demand deposits, time deposits, and all highly-liquid investments with an original maturity of three months or less at the date of purchase to be cash and cash equivalents.
Restricted Cash
Restricted cash primarily consists of cash collateral related to certain leases and inventory arrangements. Restricted cash is included in other assets on the Company's Consolidated Balance Sheets. Cash and cash equivalents and restricted cash as reported within the Consolidated Statements of Cash Flows consisted of the following:
| | | | | | | | | | | | | | | | | | | | | | | |
| Twelve Months Ended September 29, 2023 | | Twelve Months Ended September 30, 2022 |
| (In millions) | Beginning of Period | | End of Period | | Beginning of Period | | End of Period |
| Cash and cash equivalents | $ | 89.4 | | | $ | 152.6 | | | $ | 144.6 | | | $ | 89.4 | |
| Restricted cash | 1.2 | | | 1.4 | | | 1.5 | | | 1.2 | |
| Total as presented in the Consolidated Statements of Cash Flows | $ | 90.6 | | | $ | 154.0 | | | $ | 146.1 | | | $ | 90.6 | |
Fair Value
Fair value is defined as the exchange price that would be received for an asset or paid to transfer a liability (an exit price) in the principal or most advantageous market for the asset or liability in an orderly transaction between market participants at the measurement date. There is a three-level fair value hierarchy that prioritizes the inputs used to measure fair value. This hierarchy requires entities to maximize the use of observable inputs and minimize the use of unobservable inputs. The three levels of inputs used to measure fair value are as follows:
Level 1—Quoted prices in active markets for identical assets or liabilities.
Level 2—Observable inputs other than quoted prices included in Level 1, such as quoted prices for similar assets and liabilities in active markets; quoted prices for identical or similar assets and liabilities in markets that are not active; or, other inputs that are observable or can be corroborated by observable market data.
Level 3—Unobservable inputs that are supported by little or no market activity and that are significant to the fair value of the assets or liabilities.
Derivative Instruments and Hedging Activities
The Company records all derivatives on the Consolidated Balance Sheets at fair value as of the reporting date. For derivative instruments that are designated and qualify as cash flow hedges, the gain or loss on the derivative is reported as a component of other comprehensive income or loss and reclassified from accumulated other comprehensive (loss) income ("OCI") into earnings when the hedged transaction affects earnings. For derivatives that are designated and qualify as net investment hedges, the gain or loss on the derivative is reported as a component of other comprehensive income or loss until the hedged item is sold. The portion of the change in fair value of the Company's net investment hedges (or cross currency swaps) related to the cross-currency basis spread is an excluded component in the assessment of the effectiveness of these net investment hedges (or cross currency swaps). A qualitative assessment of hedge effectiveness is performed on a quarterly basis, unless facts and circumstances indicate the hedge may no longer be highly effective, in which case, a quantitative assessment of hedge effectiveness is performed.
Concentration of Risk
Financial instruments that potentially expose the Company to concentrations of credit risk consist principally of cash, cash equivalents, marketable securities, certificates of deposit, and trade accounts receivable. Cash held with financial institutions may exceed the Federal Deposit Insurance Corporation insurance limits or similar limits in foreign jurisdictions. To date, the Company has not realized any losses on its deposits of cash and cash equivalents. The Company performs ongoing credit evaluations of its customers and, except for government tenders, group purchases, and orders with a letter of credit, its industrial customers often provide a down payment. The Company maintains an allowance for credit losses based upon the expected collectability of all accounts receivable. The Company obtains some of the components in its products from a limited group of suppliers or from a single-source supplier. When these suppliers are unable to meet the Company's supply needs, the Company's production is negatively impacted.
Credit is extended to customers based on an evaluation of the customer’s financial condition, and collateral is not required. In certain circumstances, a customer may be required to prepay all or a portion of the contract price prior to transfer of control. During the periods presented, one of the Company's customers accounted for a significant portion of revenues, as set forth below:
| | | | | | | | | | | | | | | | | |
| Fiscal Year |
| 2023 | | 2022 | | 2021 |
Canon Medical Systems Corporation | 16.5 | % | | 17.2 | % | | 17.9 | % |
Canon Medical Systems Corporation accounted for 13.8% and 10.3% of the Company’s accounts receivable as of September 29, 2023 and September 30, 2022, respectively.
Inventories, net
Inventory is valued at the lower of cost or net realizable value. Costs include materials, labor, external service, and manufacturing overhead and is computed on a first-in-first-out basis. The Company evaluates the carrying value of its inventories taking into consideration such factors as historical and anticipated future sales compared to quantities on hand and the prices the Company expects to obtain for products in its various markets. The Company adjusts excess and obsolete inventories to net realizable value and write-downs of excess and obsolete inventories are recorded as a component of cost of revenues.
The following table summarizes the Company’s inventories, net:
| | | | | | | | | | | |
| (In millions) | September 29, 2023 | | September 30, 2022 |
| Raw materials and parts | $ | 217.5 | | | $ | 240.3 | |
| Work-in-process | 20.0 | | | 23.2 | |
| Finished goods | 40.0 | | | 39.7 | |
| Total inventories | $ | 277.5 | | | $ | 303.2 | |
The Company recorded inventory write-downs of $5.6 million, $6.4 million and $3.5 million for the twelve months ended September 29, 2023, September 30, 2022, and October 1, 2021, respectively.
Property, Plant and Equipment, net
Property, plant and equipment are stated at cost, net of accumulated depreciation. Major improvements are capitalized, while repairs and maintenance are expensed as incurred. Depreciation is computed using the straight-line method over the estimated useful lives of the assets or remaining lease term. Land is not subject to depreciation, but land improvements are depreciated over fifteen years. Land leasehold rights and leasehold improvements are depreciated over the lesser of their estimated useful lives or remaining lease terms. Buildings are depreciated up to thirty years. Machinery and equipment are depreciated over a range from three to seven years. Assets subject to lease are depreciated over the lesser of their estimated useful lives or remaining lease terms. Estimated useful lives are periodically reviewed and, when appropriate, changes are made prospectively. When certain events or changes in operating conditions occur, asset lives may be adjusted, and an impairment assessment may be performed on the recoverability of the carrying amounts. When assets are retired or otherwise disposed of, the assets and related accumulated depreciation are removed from the accounts.
The following table summarizes the Company’s property, plant and equipment, net:
| | | | | | | | | | | |
| (In millions) | September 29, 2023 | | September 30, 2022 |
| Land | $ | 8.3 | | | $ | 8.3 | |
| Buildings and leasehold improvements | 159.1 | | | 149.2 | |
| Machinery and equipment | 194.9 | | | 182.9 | |
| Construction in progress | 20.8 | | | 29.1 | |
| Gross property, plant and equipment | 383.1 | | | 369.5 | |
| Accumulated depreciation and amortization | (239.5) | | | (228.2) | |
| Total property, plant and equipment, net | $ | 143.6 | | | $ | 141.3 | |
The Company recorded depreciation expense of $19.5 million, $19.0 million, and $20.5 million in fiscal years 2023, 2022 and 2021, respectively.
Equity Method Investments
The Company accounts for its equity investments in privately-held companies under the equity method of accounting if the Company has the ability to exercise significant influence in, but not control, these investments. The Company records impairment losses on its equity method investments if an impairment exists and is deemed to be other-than-temporary, which is based on various factors, including but not limited to, the length of time the fair value of the investment is below the carrying value, the absence of an ability to recover the carrying amount of the investment, and the inability of the investee to sustain an earnings capacity that would justify the carrying amount of the investment. In the fourth quarter of fiscal year 2023, the Company assessed its equity method investment in dpiX Holding LLC (“dpiX Holding”) for impairment and engaged an external service firm to perform a valuation of its ownership interest in dpiX Holding as of July 1, 2023. The fair value of the Company's equity interest in dpiX Holding as of the valuation date was determined to be $27.6 million. The Company's carrying value of its investment as of July 1, 2023 was $44.0 million. The Company concluded the loss in value of the investment was other than temporary and was primarily due to reductions in forecasted glass purchases by Varex, as the Company is one of dpiX LLC's (“dpiX”) largest customers. See Note 4, Related-Party Transactions, for details on the Company's investment in dpiX Holding. As a result, the Company recorded a before-tax impairment charge totaling $16.4 million, which is included in other expense, net in the Company's Consolidated Statements of Operations. There were no impairments recorded during fiscal year 2022 or 2021.
Marketable Securities
The Company's marketable securities consist primarily of financial instruments such as United States treasury securities, United States agency obligations, corporate bonds, commercial paper, money market funds, and equity securities.
Marketable Debt Securities
The Company's marketable debt securities are classified as available-for-sale. Classification of marketable debt securities is determined at the time of purchase, and the Company reevaluates such classification as of each balance sheet date. Marketable debt securities are recorded at estimated fair value and included in cash and cash equivalents, prepaid expenses and other current assets, and other assets within the Consolidated Balance Sheets. Any unrealized gains or losses are included in accumulated other comprehensive (loss) income within the Consolidated Balance Sheets. When the fair value of a marketable debt security declines below its amortized cost basis, any portion of that decline attributable to credit losses, to the extent expected to be nonrecoverable before the sale of the security, is recognized in the Consolidated Statements of Operations. When the fair value of a marketable debt security declines below its amortized cost basis due to changes in interest rates, such amounts are recorded in accumulated other comprehensive (loss) income, and are recognized in the Consolidated Statements of Operations only if the Company sells or intends to sell the security before recovery of its cost basis. There were no impairments related to marketable debt securities recorded during the twelve months ended September 29, 2023.
Marketable Equity Securities
Marketable equity securities are stated at fair value as determined by the most recently traded price of each security at the balance sheet date and included in other assets within the Consolidated Balance Sheets. All unrealized gains and losses on marketable equity securities are recorded as part of other expense, net in the Company's Consolidated Statements of Operations. See Note 10, Fair Value, for further details.
Goodwill and Intangible Assets
Goodwill is recorded when the purchase price of an acquisition exceeds the fair value of the net identified tangible and intangible assets acquired. Purchased intangible assets are carried at cost, net of accumulated amortization, and are included in intangible assets, net in the Company's Consolidated Balance Sheets. Intangible assets with finite lives are amortized over their estimated useful lives of primarily two to seven years using the straight-line method.
Impairment of Long-lived Assets, Intangible Assets, and Goodwill
The Company reviews long-lived assets and identifiable intangible assets with finite lives for impairment whenever events or changes in circumstances indicate that the carrying amount of these assets may not be recoverable. The Company assesses these assets for impairment based on their estimated undiscounted future cash flows. If the carrying value of the assets exceeds the estimated future undiscounted cash flows, the Company recognizes an impairment loss based on the excess of the carrying amount over the fair value of the assets.
The Company evaluates goodwill for impairment at least annually at the beginning of the fourth quarter of each fiscal year or whenever an event occurs or circumstances change that would more likely than not reduce the fair value of a reporting unit below its carrying amount. The evaluation includes consideration of qualitative factors including industry and market considerations, overall
financial performance, and other relevant events and factors affecting the reporting unit. If the Company determines that a quantitative analysis is necessary, the Company performs a step one analysis, which consists of a comparison of the fair value of a reporting unit against its carrying amount, including the goodwill allocated to each reporting unit. In fiscal years 2023, 2022, and 2021, the Company performed the annual goodwill qualitative impairment test for our two reporting units and determined that, at those dates, it was not more likely than not that the fair values of the reporting units were less than their carrying amount and accordingly recorded no impairment.
Loss Contingencies
From time to time, the Company is involved in legal proceedings, claims and government inspections or investigations, customs and duties audits, other contingency matters, both inside and outside the United States, arising in the ordinary course of its business or otherwise. The Company accrues amounts for probable losses, to the extent they can be reasonably estimated, that it believes are adequate to address any liabilities related to legal proceedings and other loss contingencies that the Company believes will result in a probable loss (including, among other things, probable settlement value). A loss or a range of loss is disclosed when it is reasonably possible that a material loss will be incurred and can be estimated or when it is reasonably possible that the amount of a loss, when material, will exceed the recorded provision. When a loss contingency is probable but not reasonably estimable the nature of the contingency and the fact that an estimate cannot be made is disclosed. See Note 12, Commitments and Contingencies, for further information regarding certain of our contractual obligations and contingencies.
Environmental Obligations
The Company's operations and facilities, past and present, are subject to environmental laws, including laws that regulate the handling, storage, transport, and disposal of hazardous substances. Certain of those laws impose cleanup liabilities under certain circumstances. In connection with those laws and certain of our past and present operations and facilities, the Company is obligated to indemnify Varian for the cleanup liabilities related to prior corporate restructuring activities. The Company anticipates that it will be obligated to reimburse Varian for 20% of the liabilities of Varian related to these sites (after adjusting for any insurance proceeds or tax benefits received by Varian). As of September 29, 2023 and September 30, 2022, the Company's estimated liability for these sites was $2.8 million and $1.1 million, net of expected insurance proceeds, respectively.
Product Warranty
The Company warrants most of its products for a specific period of time, usually 12 to 24 months from delivery or acceptance, against material defects. The Company provides for the estimated future costs of warranty obligations in cost of revenues when the related revenues are recognized. The accrued warranty costs represent the best estimate at the time of sale of the total costs that the Company will incur to repair or replace product parts that fail while still under warranty.
The amount of the accrued estimated warranty costs obligation for established products is primarily based on historical experience as to product failures adjusted for current information on repair costs. For new products, estimates include the historical experience of similar products, as well as a reasonable allowance for warranty expenses associated with new products. On a quarterly basis, the Company reviews the accrued warranty costs and updates the historical warranty cost trends, if required.
The following table reflects the changes in the Company’s accrued product warranty:
| | | | | | | | | | | |
| Fiscal Years Ended |
| (In millions) | September 29, 2023 | | September 30, 2022 |
| Accrued product warranty, at beginning of period | $ | 7.9 | | | $ | 8.5 | |
| New accruals charged to cost of revenues | 12.7 | | | 11.3 | |
| Product warranty expenditures | (12.9) | | | (11.9) | |
| Accrued product warranty, at end of period | $ | 7.7 | | | $ | 7.9 | |
Leases
The Company determines if an arrangement is or contains a lease at the inception of an arrangement. The Company's operating lease right-of-use ("ROU") assets represent the right to use an underlying asset over the lease term and lease liabilities represent its obligation to make lease payments arising from the lease. ROU assets may also include initial direct costs incurred and prepaid lease payments, less lease incentives. Lease liabilities and their corresponding ROU assets are recognized based on the present value of lease payments over the lease term, discounted using the Company's incremental borrowing rate. The Company recognizes operating leases with lease terms of more than twelve months in operating lease assets, current operating lease liabilities, and
operating lease liabilities on its Consolidated Balance Sheets. The Company recognizes finance leases with lease terms of more than twelve months in property, plant and equipment, net, accrued liabilities and other current liabilities, and other long-term liabilities on its Consolidated Balance Sheets. For purposes of calculating lease liabilities and the corresponding ROU assets, the Company's lease term may include options to extend or terminate the lease when it is reasonably certain that it will exercise that option.
Revenue Recognition
The Company’s revenues are derived primarily from the sale of hardware and services. The Company recognizes its revenues net of any value-added or sales tax and net of sales discounts.
The Company sells a high proportion of its X-ray products to a limited number of OEM customers. X-ray imaging components including X-ray tubes, digital detectors and image-processing tools and security and inspection products are generally sold on a stand-alone basis. However, the Company occasionally sells its digital detectors, X-ray tubes and imaging processing tools as a package that is optimized for digital X-ray imaging and sells its Linatron® X-ray linear accelerators together with its image processing software and image detection products to OEM customers that incorporate them into their inspection or irradiation systems and processes. Service contracts are often sold with certain security and inspection products and computer-aided detection products.
The Company determines revenue recognition through the following steps:
•Identification of the contract, or contracts, with a customer
•Identification of the performance obligations in the contract
•Determination of the transaction price
•Allocation of the transaction price to the performance obligations in the contract
•Recognition of revenue when, or as, a performance obligation is satisfied
Contracts and Performance Obligations
The Company accounts for a contract with a customer when there is an approval and commitment from both parties, the rights of the parties are identified, payment terms are identified, the contract has commercial substance and collectability of the consideration is probable. The Company's performance obligations consist mainly of transferring control of products and services identified in the contracts or purchase orders. For each contract, the Company considers the obligation to transfer products and services to the customer, which are distinct, to be performance obligations.
Transaction Price and Allocation to Performance Obligations
Transaction prices of products or services are typically based on contracted rates. To the extent that the transaction price includes variable consideration, the Company estimates the amount of variable consideration that should be included in the transaction price utilizing the expected value method when there is a large number of transactions with similar characteristics or the most likely amount method when there are two possible outcomes, depending on the circumstances of the transaction, to which the Company expects to be entitled. Variable consideration is included in the transaction price if, in the Company’s judgment, it is probable that a significant future reversal of cumulative revenue under the contract will not occur. Estimates of variable consideration and determination of whether to include estimated amounts in the transaction price are based largely on an assessment of the Company’s anticipated performance and all information (historical, current, and forecasted) that is reasonably available.
The Company allows customers to return specific parts of purchased X-ray tubes for a partial refund credit, which is identified as variable consideration. For sales with a right of return, revenue is reduced and a liability is recorded for expected returns, and an asset is recorded for the right to recover products from customers on settling the liability. The Company recognizes a reduction to revenue and cost of sales at the time of sale and a corresponding refund liability and right of return asset. The Company records this estimate based on the historical volume of product returns and adjusts the estimate on a quarterly basis based on the current quarter sales and current quarter returns.
If a contract contains a single performance obligation, the entire transaction price is allocated to the single performance obligation. Contracts that contain multiple performance obligations require an allocation of the transaction price based on the estimated relative standalone selling prices of the promised products or services underlying each performance obligation. The Company determines standalone selling prices based on the price at which the performance obligation could be sold separately.
Recognition of Revenue
Revenue is recognized when, or as, obligations under the terms of a contract are satisfied, which occurs when control of the promised products or services is transferred to customers. Revenue is measured as the amount of consideration the Company expects to receive in exchange for transferring products or services to a customer.
Product revenue is generally recognized when the customer obtains control of the Company’s product, which occurs at a point in time, and may be upon shipment or upon delivery based on the contractual shipping terms of a contract.
Service revenue is generally recognized over the term of the service contract. Services are expected to be transferred to the customer throughout the term of the contract, and the Company believes recognizing revenue ratably over the term of the contract best depicts the transfer of value to the customer.
Disaggregation of Revenue
Revenue is disaggregated from contracts between geography and by reportable operating segment, which the Company believes best depicts how the nature, amount, timing, and uncertainty of revenues and cash flows are affected by economic factors. Refer to Note 16, Segment Information, included in this report, for the disaggregation of the Company’s revenue based on reportable operating segments and disaggregated by geographic region.
Contract Balances
Contract liabilities are included within the deferred revenues, and other long-term liabilities balances in the Consolidated Balance Sheets. The Company does not have any material contract assets.
Deferred revenue represents the Company's obligation to transfer goods or services to its customers for which it has already received consideration (or the amount is due) from the customer. The Company's deferred revenue balance primarily relates to contract advances and billings for warranty contracts.
Deferred revenue that is estimated to be recognized during the following twelve-month period is recorded as deferred revenues and the remaining portion is recorded as other long-term liabilities in the Consolidated Balance Sheets.
Costs to Obtain or Fulfill a Customer Contract
The Company has certain costs to obtain and fulfill a customer contract, such as commissions and shipping costs. The Company recognizes the incremental costs of obtaining contracts as an expense when incurred if the amortization period of the assets that the Company otherwise would have recognized is one year or less. Incremental costs of obtaining contracts that would be recognized over greater than one year are not material. The Company accounts for shipping and handling activities related to contracts with customers as costs to fulfill the promise to transfer the associated products. These costs are included as a component of cost of revenues.
Allowance for Credit Losses
The Company evaluates the creditworthiness of customers prior to authorizing shipment for all major sale transactions. On a quarterly basis, the Company considers historical trends, current information and any reasonable and supportable forecasts to determine if an amount should be included in the allowance for credit losses. The Company had an allowance for credit losses of $0.6 million and $0.6 million as of September 29, 2023 and September 30, 2022, respectively.
Share-Based Compensation Expense
The Company has an equity-based incentive plan that provides for the grant of nonqualified stock options and restricted stock units to directors, officers, and other employees. The Company also permits employees to purchase shares under the Varex employee stock purchase plan.
The Company values stock options granted and the option component of the shares of common stock purchased under the equity-based incentive plans and stock purchased under the employee stock purchase plan using the Black-Scholes option-pricing model. Share-based compensation expense for restricted stock units is measured using the fair value of the Company’s stock on the date of grant and is amortized over the award’s respective service period. The Black-Scholes option-pricing model requires the input of certain assumptions, and changes in the assumptions can materially affect the fair value estimates of share-based payment awards.
The Company measures and recognizes expense for all share-based payment awards based on their fair values. Share-based compensation expense recognized in the Consolidated Statements of Operations includes compensation expense for the share-based payment awards based on the grant date fair value estimated in accordance with the guidance on share-based compensation. The Company records forfeitures as they occur. The Company attributes the value of share-based compensation to expense using the straight-line method. The Company considers only the direct tax impacts of share-based compensation awards when calculating the amount of tax windfalls or shortfalls. For additional information, see Note 14, Employee Stock Plans, included in this report.
Software Development Costs
Costs for the development of new software products and substantial enhancements to existing software products are expensed as incurred until technological feasibility has been established, at which time any additional costs would be capitalized. No costs associated with the development of software have been capitalized as the Company believes its current software development process is essentially completed concurrent with the establishment of technological feasibility.
Research and Development
Research and development costs are expensed as incurred. These costs primarily include employees’ compensation, consulting fees, and material costs.
Taxes on Income
Current income tax expense or benefit is the amount of income taxes expected to be payable or receivable for the current year. Deferred income tax liabilities or assets are established for the expected future tax consequences resulting from the differences in financial reporting and tax bases of assets and liabilities. Future changes in tax regulation can have a material impact, including tax rate changes or the realization of deferred tax assets. A valuation allowance is provided if it is more likely than not that some or all of the deferred tax assets will not be realized. Also, net operating loss carryforwards in jurisdictions with current losses provide uncertainty for realization. In addition, we provide reserves for uncertain tax positions when such tax positions do not meet the recognition thresholds or measurement standards prescribed by the authoritative guidance for accounting for income taxes. A portion of the U.S. general business tax credits for research outside of the financial statement line for research and development ("R&D") have a small degree of uncertainty. A reasonable reserve is maintained on the uncertain portion until either the Internal Revenue Service chooses to audit or the statute of limitation expires. A reserve for R&D is typical for companies that calculate and utilize this general business credit. Amounts for uncertain tax positions are adjusted in periods when new information becomes available or when positions are effectively settled. Interest and penalties related to uncertain tax positions are recognized as a component of income tax expense.
We regularly evaluate the realizability of our deferred tax assets based on the weight of all available evidence, both positive and negative, including the history of recent earnings and expected future taxable income on a jurisdictional basis and our ability to generate sufficient taxable income in the future to realize the net deferred tax assets. As of September 29, 2023, based on our assessment of the realizability of our net deferred tax assets, we reached the conclusion that it was more likely than not that the U.S. federal deferred tax assets are realizable due to cumulative income in recent years and the expectation of sustained profitability in future periods. As a result, we released the valuation allowance against all of the U.S. federal deferred tax assets. We continue to maintain a valuation allowance against U.S. state R&D credit carryforwards and a partial valuation allowance against state net operating losses that are not expected to be realizable. We also maintain full valuation allowances against the net deferred tax assets in Sweden, Finland, and Saudi Arabia, due to their recent historical losses and the uncertainty of their future taxable income to realize their net operating losses.
The 2017 Tax Cuts and Jobs Act ("TCJA") included a provision requiring research and development expenditures to be capitalized for tax years beginning after December 31, 2021, which was effective for the Company starting in fiscal year 2023. Because the Company has a significant amount of research and development expenditures, U.S. taxable income and cash taxes are expected to be significantly higher over the next several years.
Foreign Currency Remeasurement and Translation
The Company uses the U.S. Dollar predominately as the functional currency of its foreign operations. Gains and losses from remeasurement of foreign currency balances into U.S. Dollars are included in the Consolidated Statements of Operations in other expense, net. For the foreign subsidiaries where the local currency is the functional currency, translation adjustments of foreign currency financial statements into U.S. Dollars are recorded to a separate component of accumulated other comprehensive (loss) income.
Recently Adopted Accounting Pronouncements
In August 2020, the Financial Accounting Standards Board issued Accounting Standard Update ("ASU") 2020-06, Accounting for Convertible Instruments and Contracts in an Entity’s Own Equity. The standard removed certain separation models in ASC 470-20 for convertible instruments, and, as a result, embedded conversion features are no longer separated from the host contract for convertible instruments with conversion features that are not required to be accounted for as derivatives under ASC 815. These convertible debt instruments are accounted for as a single liability measured at amortized cost. This results in the interest expense recognized for convertible debt instruments to be typically closer to the coupon interest rate. Further, the ASU made amendments to
the earnings per share (“EPS”) guidance in Topic 260 for convertible instruments, the most significant impact of which was requiring the use of the if-converted method for diluted EPS calculation, and no longer allowing the net share settlement method. The Company adopted this ASU on October 1, 2022, using the modified retrospective method. On the date of adoption, the Company recorded an entry to reduce additional paid-in capital by $34.6 million, increase long-term debt, net by $28.0 million, decrease deferred tax assets by $0.5 million, and increase retained earnings by $6.1 million for the after-tax impact of previously recognized amortization of the debt discount associated with the Company’s Convertible Notes (as defined herein). The unamortized discount on the Company's Convertible Notes (see Note 9, Borrowings) was derecognized in the first quarter of fiscal year 2023, which removed the amortization of the debt discount, and brought the effective interest rate closer to the coupon rate of 4.00%. The impact that the adoption of ASU 2020-06 has on the Company's net income per diluted share will depend on the amount of earnings in each period and could result in additional dilution.
2. REVENUE RECOGNITION
Right of Return Assets and Refund Liabilities
Right of return assets are included within the prepaid expenses and other current assets, and other assets in the Consolidated Balance Sheets. Refund liabilities are included within the accrued liabilities and other current liabilities and other long-term liabilities in the Consolidated Balance Sheets. The following tables summarize the changes in the right of return assets and refund liabilities for the twelve months ended September 29, 2023 and September 30, 2022:
| | | | | | | | |
| (In millions) | Right of Return Assets | | | |
| Balance at October 1, 2021 | $ | 24.3 | | | | |
| Costs recovered from product returns during the period | (5.4) | | | | |
| Right of return assets from shipments of products, subject to return during the period | 7.1 | | | | |
| Adjustment for actual vs. reserved product returns | (0.6) | | | | |
| Balance at September 30, 2022 | $ | 25.4 | | | | |
| Costs recovered from product returns during the period | (5.1) | | | | |
| Right of return assets from shipments of products, subject to return during the period | 6.8 | | | | |
| Adjustment for actual vs. reserved product returns | (1.1) | | | | |
| Balance at September 29, 2023 | $ | 26.0 | | | | |
| | | | |
| | | | | | | | |
| (In millions) | Refund Liabilities | | | |
| Balance at October 1, 2021 | $ | 27.0 | | | | |
| Release of refund liability included in beginning of year refund liability | (6.1) | | | | |
| Additions to refund liabilities | 7.9 | | | | |
| Adjustment for actual vs. reserved product returns | (0.6) | | | | |
| Balance at September 30, 2022 | $ | 28.2 | | | | |
| Release of refund liability included in beginning of year refund liability | (5.6) | | | | |
| Additions to refund liabilities | 7.5 | | | | |
| Adjustment for actual vs. reserved product returns | (1.2) | | | | |
| Balance at September 29, 2023 | $ | 28.9 | | | | |
During fiscal year 2023, the Company recognized revenue of $6.7 million related to deferred revenue which existed at September 30, 2022. During fiscal year 2022, the Company recognized revenue of $6.7 million related to deferred revenue which existed at October 1, 2021.
Remaining Performance Obligations
Remaining performance obligations represent the transaction price of firm orders for which revenue has not yet been recognized, which are primarily related to contracts where control will be transferred to customers over the next 12 months. See Note 1, Summary of Significant Accounting Policies, for details on the nature of the remaining performance obligations within these contracts and how they will be resolved.
3. LEASES
The Company has operating and finance leases for office space, warehouse and manufacturing space, vehicles, and certain equipment. The Company's lease agreements do not contain any material residual value guarantees, variable lease costs, bargain purchase options or restrictive covenants. The Company does not have any lease transactions with related parties. Leases with an initial term of 12 months or less are generally not recorded on the balance sheet and expense for these leases is recognized on a straight-line basis over the lease term. The Company's leases have remaining lease terms of less than one year to approximately ninety-five years, some of which may include options to extend the leases for up to five years and some include options to terminate early. These options have been included in the determination of the lease liability when it is reasonably certain that the option will be exercised.
Right-of-use assets represent the Company's right to use an underlying asset for the lease term, and lease liabilities represent the Company's obligation to make lease payments arising from the lease contract. Operating lease liabilities and their corresponding right-of-use assets are recorded based on the present value of fixed lease payments over the expected lease term. The interest rate implicit in lease contracts is typically not readily determinable. As such, the Company's incremental borrowing rate is based on a credit-adjusted risk-free rate, which best approximates a secured rate over a similar term of lease.
During the twelve months ended September 30, 2022, the Company recorded a loss due to abandonment of $1.9 million, which is included in selling, general and administrative on the Consolidated Statements of Operations.
The following table presents supplemental balance sheet information related to the Company's operating and finance leases:
| | | | | | | | | | | | | | | | | |
| | | |
| (In millions) | Balance Sheet Location | | September 29, 2023 | | September 30, 2022 |
| Assets | | | | | |
| Operating lease right-of-use assets | Operating lease assets | | $ | 29.0 | | | $ | 23.2 | |
| Finance lease right-of-use assets | Property, plant and equipment, net | | 0.3 | | | 0.3 | |
| Liabilities | | | | | |
| Operating lease liabilities (current) | Current operating lease liabilities | | 3.8 | | | 4.0 | |
| Finance lease liabilities (current) | Accrued liabilities and other current liabilities | | 0.1 | | | 0.2 | |
| Operating lease liabilities (non-current) | Operating lease liabilities | | 23.1 | | | 18.0 | |
| Finance lease liabilities (non-current) | Other long-term liabilities | | $ | 0.2 | | | $ | 0.1 | |
The following table presents the weighted average remaining lease term and discount rate information related to the Company's operating and finance leases:
| | | | | | | | | | | |
| September 29, 2023 | | September 30, 2022 |
| Operating lease weighted average remaining lease term (in years) | 7.8 | | 6.4 |
| Operating lease weighted average discount rate | 7.9 | % | | 5.6 | % |
| Finance lease weighted average remaining lease term (in years) | 3.6 | | 2.0 |
| Finance lease weighted average discount rate | 4.7 | % | | 3.6 | % |
The following table provides information related to the Company’s operating and finance leases:
| | | | | | | | | | | | | | | | | |
| (In millions) | 2023 | | 2022 | | 2021 |
Total operating lease costs(1) | $ | 5.8 | | | $ | 6.4 | | | $ | 8.1 | |
| | | | | |
| Total finance lease costs | $ | 0.2 | | | $ | 0.2 | | | $ | 0.3 | |
| | | | | |
| Operating cash flows from operating leases | $ | 7.8 | | | $ | 7.3 | | | $ | 7.9 | |
| Financing cash flows from finance leases | 0.3 | | | 0.2 | | | 0.2 | |
| Total cash paid for amounts included in the measurement of lease liabilities | $ | 8.1 | | | $ | 7.5 | | | $ | 8.1 | |
| | | | | |
| Noncash operating right-of-use assets obtained in exchange for new lease liabilities | $ | 10.6 | | | $ | 5.4 | | | $ | 5.6 | |
| Noncash finance right-of-use assets obtained in exchange for new lease liabilities | 0.2 | | | 0.1 | | | 0.2 | |
| Total right-of-use assets obtained in exchange for new lease liabilities | $ | 10.8 | | | $ | 5.5 | | | $ | 5.8 | |
| | | | | |
| | | | | |
(1) Includes variable and short-term lease expense, which were immaterial for fiscal years 2023, 2022, and 2021.
As of September 29, 2023, maturities of operating lease and finance lease liabilities for each of the following five years and a total thereafter were as follows:
| | | | | | | | | | | |
| (In millions) | | | |
| Fiscal years: | Operating Leases | | Finance Leases |
| 2024 | $ | 5.6 | | | $ | 0.1 | |
| 2025 | 5.5 | | | 0.1 | |
| 2026 | 4.4 | | | 0.1 | |
| 2027 | 4.2 | | | — | |
| 2028 | 3.3 | | | — | |
| Thereafter | 14.7 | | | — | |
| Total future lease payments | $ | 37.7 | | | $ | 0.3 | |
| Less: imputed interest | (10.8) | | | — | |
| Present value of lease liabilities | $ | 26.9 | | | $ | 0.3 | |
As of September 29, 2023, the Company had not entered into any material leases that have not yet commenced.
4. RELATED-PARTY TRANSACTIONS
Investment in Privately-Held Companies
The Company has a 40% ownership interest in dpiX Holding, a holding company that has a 100% ownership interest in dpiX, a supplier of amorphous silicon-based thin film transistor arrays for flat panels used in the Company's digital image detectors. In accordance with the dpiX Holding operating agreement, net profits or losses are allocated to the members in accordance with their ownership interests.
The investment in dpiX Holding is accounted for under the equity method of accounting. When the Company recognizes its share of net profits or losses of dpiX Holding, profits or losses in inventory purchased from dpiX are eliminated. In fiscal years 2023, 2022, and 2021, the Company recorded loss on the equity investment in dpiX Holding of $0.2 million, $2.6 million, and $2.3 million, respectively. The loss on the equity investment in dpiX Holding is included in other expense, net in the Consolidated Statements of Operations. The carrying value of the equity investment in dpiX Holding was $25.8 million and $42.4 million at September 29, 2023 and September 30, 2022, respectively.
The Company recorded an impairment of its investment in dpiX Holding of $16.4 million in the fourth quarter of 2023. See Note 1, Summary of Significant Accounting Policies, for details on the nature of the impairment. There were no impairments recorded during fiscal year 2022 or 2021.
In fiscal years 2023, 2022 and 2021, the Company purchased glass transistor arrays from dpiX totaling $18.7 million, $21.0 million and $18.5 million, respectively. These purchases of glass transistor arrays are included as a component of inventories, net on the Consolidated Balance Sheets or cost of revenues in the Consolidated Statements of Operations.
As of September 29, 2023 and September 30, 2022, the Company had accounts payable to dpiX totaling $2.7 million and $3.1 million, respectively.
In October 2013, the Company entered into an amended agreement with dpiX and other parties that, among other things, provides it with the right to 50% of dpiX’s total manufacturing capacity. In addition, the Company is required to pay for 50% of dpiX's fixed costs, as determined at the beginning of each calendar year. In January 2023, the fixed cost commitment was determined and approved by the dpiX board of directors to be $13.1 million for calendar year 2023. As of September 29, 2023, the Company estimated it has fixed cost commitments of $3.3 million related to the amended agreement through the remainder of calendar year 2023. The amended agreement will continue unless the ownership structure of dpiX changes (as defined in the amended agreement).
The Company has determined that dpiX Holding is a variable interest entity because the at-risk equity holders, as a group, lack the characteristics of a controlling financial interest. Majority votes are required to direct the manufacturing activities, legal operations and other activities that most significantly affect dpiX’s economic performance. The Company does not have majority voting rights and no power to unilaterally direct the activities of dpiX Holding, and therefore, is not the primary beneficiary of dpiX Holding. The Company’s exposure to loss as a result of its involvement with dpiX Holding is limited to the carrying value of the Company’s investment of $25.8 million and fixed cost commitments.
In November 2018, the Company (through one of its wholly-owned subsidiaries) and CETTEEN GmbH (“CETTEEN”), formed a German limited liability company that governs the affairs and conduct of the business of VEC Imaging GmbH & Co. KG (“VEC”), a joint venture formed to develop technology for use in X-ray imaging components. In accordance with the VEC agreement, net profits or losses are allocated to the members in accordance with their ownership interest. The Company's investment in VEC is accounted for under the equity method of accounting. The Company has determined that VEC is a variable interest entity.
In fiscal years 2023, 2022, and 2021, the Company recorded a loss on the equity investment in VEC of $0.4 million, $0.8 million, and $1.1 million respectively. The Company's investment in VEC was $2.1 million and $2.5 million as of September 29, 2023 and September 30, 2022, respectively. In fiscal years 2023 and 2022, the Company had loans and other receivables from VEC of $0.7 million and $0.9 million, respectively, which are recorded in prepaid expenses and other current assets in the Consolidated Balance Sheets.
5. RESTRUCTURING
In July 2018, the Company committed to relocate the production of amorphous silicon glass for digital detectors from its Santa Clara facility to the dpiX fabrication facility in Colorado. In July 2019, the Company committed to close its Santa Clara facility and to relocate the remaining production to its other existing facilities. The Company ceased all operations at the Santa Clara facility as of October 2, 2020, and all activities related to the closure of the facility were completed by the end of December 2020.
Cash outflows associated with these restructuring charges are limited to employee termination expenses, facility closure and equipment sales and disposals. Below is a detail of restructuring charges incurred during the 2023, 2022 and 2021 fiscal years, which predominately relate to the Company's Medical segment:
| | | | | | | | | | | | | | | | | | | | | | | |
| (In millions) | Location of Restructuring Charges in Consolidated Statements of Operations | | 2023 | | 2022 | | 2021 |
| Other assets impairment charges | Selling, general and administrative | | $ | — | | | $ | 1.8 | | | $ | — | |
| | | | | | | |
| | | | | | | |
| Accelerated depreciation | Cost of revenues | | — | | | — | | | 0.2 | |
| Severance costs | Selling, general and administrative | | — | | | — | | | 0.6 | |
| Facility closure costs | Selling, general and administrative | | — | | | — | | | 0.2 | |
| Total restructuring charges | | | $ | — | | | $ | 1.8 | | | $ | 1.0 | |
6. OTHER FINANCIAL INFORMATION
The following table summarizes the Company’s accrued liabilities and other current liabilities:
| | | | | | | | | | | |
| (In millions) | September 29, 2023 | | September 30, 2022 |
| Accrued compensation and benefits | $ | 33.4 | | | $ | 36.7 | |
| Product warranty | 7.7 | | | 7.9 | |
| Taxes payable | 13.3 | | | 11.3 | |
| | | |
| Refund liability | 7.2 | | | 6.8 | |
| | | |
| Accrued interest | 11.6 | | | 11.7 | |
| Other | 9.4 | | | 7.0 | |
| Total accrued liabilities and other current liabilities | $ | 82.6 | | | $ | 81.4 | |
The following table summarizes the Company’s other long-term liabilities:
| | | | | | | | | | | |
| (In millions) | September 29, 2023 | | September 30, 2022 |
| Long-term income tax payable | $ | 4.6 | | | $ | 4.3 | |
| Environmental liabilities | 1.9 | | | 1.3 | |
| Defined benefit obligation liability | 5.2 | | | 3.3 | |
| Long-term refund liability | 21.7 | | | 21.4 | |
| Derivative liability | 4.9 | | | — | |
| Long-term other | 3.3 | | | 3.5 | |
| Total other long-term liabilities | $ | 41.6 | | | $ | 33.8 | |
The following table summarizes the Company’s other expense, net:
| | | | | | | | | | | | | | | | | |
| Fiscal Years |
| (In millions) | 2023 | | 2022 | | 2021 |
| Loss from equity method investments | $ | (1.4) | | | $ | (3.0) | | | $ | (3.4) | |
| | | | | |
| Impairment of equity method investment | (16.4) | | | — | | | — | |
| Realized losses on foreign currencies, net | (1.0) | | | (1.5) | | | (0.2) | |
| Other | (1.4) | | | 0.2 | | | 0.1 | |
| Total other expense, net | $ | (20.2) | | | $ | (4.3) | | | $ | (3.5) | |
7. NET INCOME PER SHARE
Basic net income per common share is computed by dividing the net income for the period by the weighted average number of shares of common stock outstanding during the reporting period. Diluted net income per common share reflects the effects of potentially dilutive securities, which is computed by dividing the sum of net income and any adjustments to net income by the sum of the weighted average number of common shares outstanding and dilutive common shares.
A reconciliation of the numerator and denominator used in the calculation of basic and diluted net income per common share is as follows:
| | | | | | | | | | | | | | | | | |
| Fiscal Year |
(In millions, except per share amounts) | 2023 | | 2022 | | 2021 |
| Net income per share - basic | | | | | |
| Net income attributable to Varex | $ | 48.2 | | | $ | 30.3 | | | $ | 17.4 | |
Basic weighted average shares outstanding | 40.3 | | | 39.8 | | | 39.3 | |
| Basic net income per share attributable to Varex | $ | 1.20 | | | $ | 0.76 | | | $ | 0.44 | |
| | | | | |
| Net income per share - diluted | | | | | |
| Net income attributable to Varex | $ | 48.2 | | | $ | 30.3 | | | $ | 17.4 | |
| Interest expense on Convertible Notes, net of tax | 6.2 | | | — | | | — | |
| Diluted net income | 54.4 | | | 30.3 | | | 17.4 |
| | | | | |
| Basic weighted average shares outstanding | 40.3 | | | 39.8 | | | 39.3 | |
| Dilutive effect of Convertible Senior Notes | 9.6 | | | 1.3 | | | 0.6 | |
Dilutive effect of share-based awards and other | 0.4 | | | 0.5 | | | 0.4 | |
| | | | | |
Diluted weighted average shares outstanding | 50.3 | | | 41.6 | | | 40.3 | |
| Diluted net income per share attributable to Varex | $ | 1.08 | | | $ | 0.73 | | | $ | 0.43 | |
| | | | | |
| Anti-dilutive share summary | | | | | |
Share-based awards and other | 2.7 | | 3.0 | | 2.8 |
| | | | | |
| Warrants | 9.6 | | — | | — |
| Total anti-dilutive shares | 12.3 | | 3.0 | | 2.8 |
Potentially dilutive shares, which are based on the weighted-average shares of common stock underlying stock options, unvested stock awards, purchase rights granted under the employee stock purchase plan, warrants, and Convertible Notes using the treasury stock method or the if-converted method, as applicable, are included when calculating diluted net income per share attributable to Varex when their effect is dilutive. As of October 1, 2022, the Company adopted ASU 2020-06 using the modified retrospective method. The standard requires the Company to apply the if-converted method in relation to the Convertible Notes, which requires the Company to assume that the Convertible Notes would have been converted using only share settlement at the beginning of the period, resulting in an additional 9.6 shares outstanding. Using this method, the numerator is affected by adding back the after-tax interest expense and the denominator is affected by including the effect of potential share settlement, if the effect is dilutive. Prior to the adoption of ASU 2020-06, the Convertible Notes were accounted for using the treasury stock method for purposes of net income per share. See Note 1, Summary of Significant Accounting Policies, "Recently Adopted Accounting Pronouncements" for further details concerning the adoption of ASU 2020-06. Furthermore, in connection with the offering of the Convertible Notes, the Company entered into convertible note hedges and warrants (see Note 9, Borrowings). However, the Company's convertible note hedges are not included when calculating potentially dilutive shares since their effect is always anti-dilutive.
8. FINANCIAL DERIVATIVES AND HEDGING ACTIVITIES
As part of the Company’s overall risk management practices, the Company enters into financial derivatives to manage its financial exposures to foreign currency exchange rates and interest rates.
The Company records all derivatives on the Consolidated Balance Sheets at fair value. The accounting for changes in the fair value of derivatives depends on the intended use of the derivative, whether the Company has elected to designate a derivative in a hedging relationship and apply hedge accounting, and whether the hedging relationship has satisfied the criteria necessary to apply hedge accounting. A qualitative assessment of hedge effectiveness is performed on a quarterly basis, unless facts and circumstances indicate the hedge may no longer be highly effective, in which case the Company would test for effectiveness on a more frequent basis. The changes in fair value for all trades that are not designated for hedge accounting are recognized in current period income. The Company does not offset fair value amounts recognized for derivative instruments in its Consolidated Balance Sheets for presentation purposes.
Credit risk related to derivative transactions reflects the risk that a party to the transaction could fail to meet its obligation under the derivative contracts. Therefore, the Company’s exposure to the counterparty’s credit risk is generally limited to the amounts, if any, by which the counterparty’s obligations to the Company exceed the Company’s obligations to the counterparty. The Company’s policy is to enter into contracts only with financial institutions that meet certain minimum credit ratings to help mitigate counterparty credit risk.
Derivatives Designated as Hedging Instruments - Net Investment Hedges
The Company uses cross currency swap contracts as net investment hedges to manage its risk of variability in foreign currency-denominated net investments in majority-owned international operations. All changes in fair value of the derivatives designated as net investment hedges are reported in accumulated other comprehensive (loss) income along with the foreign currency translation adjustments on those investments. During the first quarter of fiscal year 2023, the Company terminated all three of its previously outstanding cross currency swap contracts which resulted in cash received upon settlement of $7.3 million. The gain on the cross currency swap contracts was recorded in accumulated other comprehensive (loss) income where it will remain until such time that substantial liquidation of the international operations should occur. Concurrent with the termination of the previous cross currency swap contracts, the Company entered into two new cross currency swap contracts which have been designated as net investment hedges.
As of September 29, 2023, the Company had the following outstanding derivatives designated as net investment hedging instruments:
| | | | | | | | | | | |
(In millions, except for number of instruments) | Number of Instruments | | Notional Value |
Cross currency swap contracts | 2 | | $ | 58.7 | |
The following table summarizes the amount of pre-tax gain (loss) recognized from derivative instruments for the periods indicated and the line items in the accompanying statements of operations where the results are recorded for net investment hedges:
| | | | | | | | | | | | | | | | | | | | | | | | | | | | | | | | | | | | | | | | | |
| Amount of (Loss) or Gain Recognized in OCI on Derivatives
Fiscal Year Ended | | Location of Gain or (Loss) Recognized in Income on Derivative (Amount Excluded from Effectiveness Testing) | | Amount of Gain Recognized in Income on Derivative (Amount Excluded from Effectiveness Testing) |
(In millions) | 2023 | | 2022 | | 2021 | | | 2023 | | 2022 | | 2021 |
Cross currency swap contracts | $ | (4.4) | | | $ | 8.7 | | | $ | (0.3) | | | Interest expense | | $ | 0.9 | | | $ | 1.2 | | | $ | 1.3 | |
These derivative instruments are subject to master netting agreements giving effect to rights of offset with each counterparty. None of the balances were eligible for netting. The following table summarizes the gross fair values of derivative instruments as of the periods indicated and the line items in the accompanying Consolidated Balance Sheets where the instruments are recorded:
| | | | | | | | | | | | | | | | | | | | |
(In millions) | | | | Derivative Assets and Liabilities |
Derivatives Designated as Net Investment Hedges | | Balance Sheet Location | | 2023 | | 2022 |
Cross currency swap contracts | | Prepaid expenses and other current assets | | $ | 0.7 | | | $ | 1.2 | |
| Cross currency swap contracts | | Other assets | | — | | | 6.3 | |
| | | | | | |
| Cross currency swap contracts | | Other long-term liabilities | | $ | 4.9 | | | $ | — | |
Balance Sheet Hedges
The Company also enters into foreign currency forward contracts to hedge fluctuations associated with foreign currency-denominated monetary assets and liabilities, primarily cash, lease contracts, third-party accounts receivable and payable, and intercompany accounts receivable and payables. These forward contracts are generally entered into at the end of one fiscal period and expire by the end of the next fiscal period. These forward contracts are not designated for hedge accounting treatment; therefore, the change in fair value of these derivatives is recorded as a component of other expense, net in the Consolidated Statements of Operations and offsets the change in fair value of the foreign currency-denominated assets and liabilities, which are also recorded as a component of other expense, net. The Company has not and does not intend to use derivative financial instruments for speculative or trading purposes.
The following table shows the notional amounts of outstanding foreign currency contracts as of September 29, 2023: | | | | | | | |
| | | Notional Value of Derivatives not Designated as Hedging Instruments: |
| (In millions of equivalent USD) | | | Sell contracts |
| Australian Dollar | | | $ | 3.9 | |
| Chinese Renminbi | | | 8.6 | |
| Euro | | | 15.9 | |
| Indian Rupee | | | 6.3 | |
| | | |
| Total notional value | | | $ | 34.7 | |
9. BORROWINGS
The following table summarizes the Company's short-term and long-term debt:
| | | | | | | | | | | | | | | | | | | | | | | | | | | | | |
| September 29, 2023 | | September 30, 2022 | | |
| (In millions, except for percentages) | Amount | | Weighted-Avg Effective Interest Rate | | Amount | | Weighted-Avg Effective Interest Rate | | $ Change |
| Current maturities of long-term debt | | | | | | | | | |
| | | | | | | | | |
| Other debt | $ | 1.5 | | | | | $ | 2.1 | | | | | $ | (0.6) | |
| | | | | | | | | |
| | | | | | | | | |
| Non-current maturities of long-term debt: | | | | | | | | | |
| | | | | | | | | |
| | | | | | | | | |
| | | | | | | | | |
| Convertible Senior Unsecured Notes | $ | 200.0 | | | 4.8% | | $ | 200.0 | | | 10.9% | | $ | — | |
| Senior Secured Notes | 243.0 | | | 8.2% | | 243.0 | | | 8.2% | | — | |
| Other debt | 3.5 | | | | | 4.6 | | | | | (1.1) | |
| Total non-current maturities of long-term debt: | $ | 446.5 | | | | | $ | 447.6 | | | | | $ | (1.1) | |
| | | | | | | | | |
| Unamortized issuance costs and debt discounts | | | | | | | | | |
Unamortized discount - Convertible Notes(1) | $ | — | | | | | $ | (28.7) | | | | | $ | 28.7 | |
Unamortized issuance costs - Convertible Notes(1) | (2.5) | | | | | (3.1) | | | | | 0.6 | |
| Debt issuance costs - Senior Secured Notes | (2.9) | | | | | (3.5) | | | | | 0.6 | |
| Total | $ | (5.4) | | | | | $ | (35.3) | | | | | $ | 29.9 | |
| Total debt outstanding, net | $ | 442.6 | | | | | $ | 414.4 | | | | | $ | 28.2 | |
| | | | | | | | | |
Equity component of Convertible Senior Unsecured Notes(1)(2) | $ | — | | | | | $ | 49.7 | | | | | $ | (49.7) | |
(1) In connection with the adoption of ASU 2020-06, the unamortized discount and equity component related to the Convertible Notes were derecognized and the carrying value of the issuance costs was adjusted in the first quarter of fiscal year 2023. Refer to Note 1, Summary of Significant Accounting Policies for further details.
(2) Included in additional paid-in capital on the Consolidated Balance Sheets.
Future principal payments of long-term debt outstanding as of September 29, 2023 are as follows:
| | | | | |
| (In millions) | |
| Fiscal years: | |
| 2024 | $ | 1.5 | |
| 2025 | 201.5 | |
| 2026 | 1.3 | |
| 2027 | 243.7 | |
| 2028 | — | |
| Thereafter | — | |
| Total debt outstanding | $ | 448.0 | |
| Less: current maturities of long-term debt | (1.5) | |
| Non-current portion of long-term debt | $ | 446.5 | |
The following table summarizes the Company's interest expense:
| | | | | | | | | | | | | | | | | |
| Twelve Months Ended |
| September 29, 2023 | | September 30, 2022 | | October 1, 2021 |
| Contractual interest coupon and other | $ | 26.7 | | | $ | 27.6 | | | $ | 30.7 | |
| Amortization/extinguishment of debt issuance costs | 2.6 | | | 3.4 | | | 3.5 | |
| Amortization of debt discounts | — | | | 8.8 | | | 7.9 | |
| Total interest expense | $ | 29.3 | | | $ | 39.8 | | | $ | 42.1 | |
Convertible Senior Unsecured Notes
On June 9, 2020, Varex issued $200.0 million in aggregate principal amount of 4.00% convertible senior unsecured notes due 2025 (“Convertible Notes”). The net proceeds from the issuance of the Convertible Notes, after deducting transaction fees and offering expense payable by the Company, were approximately $193.1 million. The Convertible Notes bear interest at the annual rate of 4.00%, payable semiannually on June 1 and December 1 of each year, beginning on December 1, 2020, and will mature on June 1, 2025, unless earlier converted or repurchased by Varex.
The Convertible Notes are convertible into cash, shares of Varex common stock or a combination thereof, at Varex’s election, at an initial conversion rate of 48.048 shares of common stock per $1,000 principal amount of Convertible Notes, which is equivalent to an initial conversion price of approximately $20.81 per share, subject to adjustment pursuant to the terms of the indenture governing the Convertible Notes. The Convertible Notes may be converted at any time after, and including, December 15, 2024, until the close of business on the second scheduled trading day immediately before the maturity date. The maximum number of shares issuable upon conversion of the Convertible Notes is 9.6 million.
Call Spread
On June 4, 2020 and June 5, 2020, in connection with the offering of the Convertible Notes, Varex entered into privately negotiated convertible note hedge transactions (collectively, the “Hedge Transactions”). The Hedge Transactions cover, subject to customary anti-dilution adjustments, the number of shares of Varex common stock that initially underlie the Convertible Notes. The Hedge Transactions are expected generally to reduce the potential dilution and/or offset any cash payments Varex is required to make in excess of the principal amount due upon conversion of the Convertible Notes in the event that the market price of Varex common stock is greater than the strike price of the Hedge Transactions, which was initially $20.81 per share (subject to adjustment under the terms of the Hedge Transactions). The strike price of $20.81 corresponds to the initial conversion price of the Convertible Notes. The number of shares underlying the Hedge Transactions is 9.6 million.
On June 4, 2020 and June 5, 2020, Varex also entered into privately negotiated warrant transactions (collectively, the “Warrant Transactions” and, together with the Hedge Transactions, the “Call Spread Transactions”), whereby the Company sold warrants at a higher strike price relating to the same number of shares of Varex common stock that initially underlie the Convertible Notes, subject to customary anti-dilution adjustments. The initial strike price of the warrants is $24.975 per share (subject to adjustment under the terms of the Warrant Transactions), which is 50% above the last reported sale price of Varex common stock on June 4, 2020. The Warrant Transactions could have a dilutive effect to the Company's stockholders to the extent that the market price per share of Varex common stock, as measured under the terms of the Warrant Transactions, exceeds the applicable strike price of the
warrants. The number of shares underlying the Warrant Transactions is 9.6 million. The number of warrants outstanding as of September 29, 2023, was 9.6 million.
Senior Secured Notes
Varex issued $300.0 million aggregate principal amount of 7.875% Senior Secured Notes due 2027 (the "Senior Secured Notes") pursuant to an indenture dated September 30, 2020, among Varex, certain of its direct or indirect wholly-owned subsidiaries as guarantors, and Wells Fargo Bank, National Association as trustee and collateral agent. Interest payments are paid semiannually on April 15 and October 15 of each year, beginning on April 15, 2021.
The Senior Secured Notes are secured by a first priority lien on substantially all of the assets of Varex and the assets and capital stock of its subsidiary guarantors (subject to exceptions), except for assets for which a first priority security interest is pledged for the ABL Facility (defined below), in which the Senior Secured Notes will have a second lien security interest. The Senior Secured Notes include negative covenants, subject to certain exceptions, restricting or limiting Varex's ability and the ability of its restricted subsidiaries to, among other things, incur liens on collateral; sell certain assets; incur additional indebtedness; pay dividends; issue preferred shares; consolidate, merge, or sell all or substantially all of its assets; and enter into certain transactions with their affiliates.
On July 15, 2021, the Company redeemed $30 million of Senior Secured Notes, in accordance with the terms and conditions of the governing indenture, by paying cash of $31.5 million, inclusive of the redemption premium and accrued interest, and recognized a $1.4 million loss related to the redemption premium and the write-off of previously recorded debt issuance costs. The redemption price of the redeemed notes was 103% of the principal amount, plus accrued and unpaid interest from, and including, April 15, 2021 to, but excluding, the redemption date of July 15, 2021.
On March 18, 2022, the Company redeemed $27 million of Senior Secured Notes, in accordance with the terms and conditions of the governing indenture, by paying cash of $28.7 million, inclusive of the redemption premium and accrued interest, and recognized a $1.2 million loss related to the redemption premium and the write-off of previously recorded debt issuance costs. The redemption price of the redeemed notes was 103% of the principal amount, plus accrued and unpaid interest from, and including, October 15, 2021 to, but excluding, the redemption date of March 18, 2022. As of September 29, 2023, the aggregate principal amount of the outstanding Senior Secured Notes was $243.0 million.
Asset-Based Loan
On September 30, 2020, the Company entered into a revolving credit agreement consisting of a $100.0 million asset-based loan revolving credit facility (the “Asset-Based Loan”, or "ABL Facility").
From September 30, 2020 through March 9, 2022, borrowings under the Asset-Based Loan bore interest at floating rates based on the London Interbank Offered Rate ("LIBOR"), or a comparable rate, or a base rate, and an applicable margin based on Average Daily Excess Availability (as defined in the Asset-Based Loan Agreement). In addition, the Company was required to pay a quarterly commitment fee of 0.375% to 0.5% annualized, based on the aggregate unused commitments under the Asset-Based Loan.
On March 9, 2022, the ABL Facility was amended to transition the reference rate for certain dollar denominated advances to the Secured Overnight Financing Rate ("SOFR") from LIBOR and the quarterly commitment fee was amended to 0.25% annualized, based on the aggregate unused commitments under the Asset-Based Loan. Additionally, the applicable margin rates were reduced by 75 basis points and the interest rate floor was reduced from 50 basis points to 0 basis points.
The ABL Facility matures on the earlier of September 30, 2025 or 91 days prior to the maturity of the Convertible Notes, at which time all outstanding amounts under the ABL Facility will be due and payable. The maximum availability under our ABL Facility is $100.0 million; however, the borrowing base under the ABL fluctuates from month-to-month depending on the amount of eligible accounts receivable, inventory, and real estate. As of September 29, 2023, the amount available under our ABL Facility was $88.7 million, and the ABL Facility remains undrawn.
The ABL Facility includes various restrictive covenants that limit our ability to engage in certain transactions, including the incurrence of debt, payment of dividends and other restrictive payments, existence of restrictions affecting subsidiaries, sales of stock and assets, certain affiliate transactions, modifications of debt documents and organizational documents, changes to line of business and fiscal year, incurrence of liens, making fundamental changes, prepayments of junior indebtedness, and certain other transactions.
The ABL Facility contains a minimum Fixed Charge Coverage Ratio of 1.00 to 1.00 that is tested when excess availability under the ABL is less than the greater of (i) 10.0% of the Loan Cap (the lesser of (a) the aggregate commitments under the ABL Facility and (b) the aggregate borrowing base) and (ii) $7.5 million. As of September 29, 2023, the Company is compliant with the ABL Facility covenants.
The ABL Facility has a first lien security interest on accounts receivable, cash, and inventory as well as certain real estate and holds second lien security interest on all other assets.
10. FAIR VALUE
Assets/Liabilities Measured at Fair Value on a Recurring Basis
The fair values of certain of the Company’s financial instruments, including bank deposits included in cash and cash equivalents, accounts receivable, net and accounts payable, approximate their fair values due to their short maturities. As of September 29, 2023, the fair value of the Company's Convertible Notes and Senior Secured Notes, as defined in Note 9, Borrowings and measured using Level 1 inputs, were $228.4 million and $243.6 million, respectively. As of September 30, 2022, the fair values of the Company's Convertible Notes and Senior Secured Notes, measured using Level 1 inputs, were $250.2 million and $241.3 million, respectively. The Company has elected to use the income approach to value its derivative instruments using standard valuation techniques and Level 2 inputs, such as currency spot rates, forward points and credit default swap spreads.
In the tables below, the Company has segregated all assets and liabilities that are measured at fair value on a recurring basis into the most appropriate level within the fair value hierarchy based on the inputs used to determine the fair value at the measurement date.
| | | | | | | | | | | | | | | | | | | | | | | |
| Fair Value Measurements at September 29, 2023 |
(In millions) | Quoted Prices in Active Markets
(Level 1) | | Significant Other
Observable Inputs
(Level 2) | | Significant Unobservable Inputs
(Level 3) | | Total |
Assets: | | | | | | | |
| Money market funds | $ | — | | | $ | 45.4 | | | $ | — | | | $ | 45.4 | |
| Commercial paper | — | | | 6.0 | | | — | | | 6.0 | |
| Corporate notes/bonds | — | | | 8.3 | | | — | | | 8.3 | |
| Government agencies | — | | | 6.6 | | | — | | | 6.6 | |
| US Treasury bills | — | | | 28.6 | | | — | | | 28.6 | |
Derivative assets | — | | | 0.7 | | | — | | | 0.7 | |
Deferred compensation plan(1) | 6.3 | | | — | | | — | | | 6.3 | |
| Marketable equity securities | 4.1 | | | — | | | — | | | 4.1 | |
| Total assets measured at fair value | $ | 10.4 | | | $ | 95.6 | | | $ | — | | | $ | 106.0 | |
| | | | | | | |
Liabilities: | | | | | | | |
Derivative liabilities | $ | — | | | $ | 4.9 | | | $ | — | | | $ | 4.9 | |
| | | | | | | |
| Total liabilities measured at fair value | $ | — | | | $ | 4.9 | | | $ | — | | | $ | 4.9 | |
(1) The assets held under the Company’s deferred compensation plan are classified in Level 1 as they relate primarily to publicly traded mutual funds for which there are observable market prices in active markets.
| | | | | | | | | | | | | | | | | | | | | | | |
| Fair Value Measurements at September 30, 2022 |
(In millions) | Quoted Prices in Active Markets (Level 1) | | Significant Other Observable Inputs (Level 2) | | Significant Unobservable Inputs (Level 3) | | Total |
Assets: | | | | | | | |
| Money market funds | $ | — | | | $ | 36.6 | | | $ | — | | | $ | 36.6 | |
| Commercial paper | — | | | 5.9 | | | — | | | 5.9 | |
| Corporate notes/bonds | — | | | 3.6 | | | — | | | 3.6 | |
| Government agencies | — | | | 0.3 | | | — | | | 0.3 | |
| US Treasury bills | — | | | 10.2 | | | — | | | 10.2 | |
| Derivative assets | — | | | 7.5 | | | — | | | 7.5 | |
Deferred compensation plan(1) | 5.4 | | | — | | | — | | | 5.4 | |
| Marketable equity securities | 2.5 | | | — | | | — | | | 2.5 | |
| Total assets measured at fair value | $ | 7.9 | | | $ | 64.1 | | | $ | — | | | $ | 72.0 | |
| | | | | | | |
Liabilities: | | | | | | | |
| Derivative liabilities | $ | — | | | $ | 0.3 | | | $ | — | | | $ | 0.3 | |
| | | | | | | |
| Total liabilities measured at fair value | $ | — | | | $ | 0.3 | | | $ | — | | | $ | 0.3 | |
(1) The assets held under the Company’s deferred compensation plan are classified in Level 1 as they relate primarily to publicly traded mutual funds for which there are observable market prices in active markets.
Nonrecurring Fair Value Measurements
In the fourth quarter of fiscal year 2023, the Company assessed its equity method investment in dpiX Holding for impairment and concluded that the carrying value of the investment was greater than its fair value. The nonrecurring fair value measurements used by the Company to impair its equity method investment in dpiX Holding was calculated by equal weighting of the income approach based on estimated discounted future cash flows and the market approach based on comparable publicly traded companies in similar lines of businesses. Under the income approach, fair value is determined based on a discounted cash flow technique that uses estimates of cash flows discounted to present value using rates commensurate with the risks associated with those cash flows. Under the market approach, a market-based value is derived by relating multiples for earnings and cash flow measures for a group of comparable public companies to the same measure for each reporting unit to estimate fair value. This valuation resulted in a Level 3 nonrecurring fair value measurement. See Note 1, Summary of Significant Accounting Policies, for details on the nature of the impairment.
Marketable Debt Securities
The following is a summary of marketable debt securities, which are included within the cash and cash equivalents, prepaid expenses and other current assets, and other assets balances on the Consolidated Balance Sheets.
| | | | | | | | | | | | | | | | | | | |
| September 29, 2023 |
| (In millions) | Amortized Costs | | | | Unrealized Losses | | Fair Value |
| | | | | | | |
| Commercial paper | $ | 6.0 | | | | | $ | — | | | $ | 6.0 | |
| Corporate notes/bonds | 8.3 | | | | | — | | | 8.3 | |
| US Treasury bills | 28.6 | | | | | — | | | 28.6 | |
| Government agencies | 6.6 | | | | | — | | | 6.6 | |
| | | | | | | |
| | | | | | | |
| | | | | | | |
| Total marketable debt securities | $ | 49.5 | | | | | $ | — | | | $ | 49.5 | |
The following table summarizes the marketable debt securities on the Consolidated Balance Sheets as of September 30, 2022.
| | | | | | | | | | | | | | | | | | | |
| September 30, 2022 |
| (In millions) | Amortized Costs | | | | Unrealized Losses | | Fair Value |
| | | | | | | |
| Commercial paper | $ | 5.9 | | | | | $ | — | | | $ | 5.9 | |
| Corporate notes/bonds | 3.7 | | | | | (0.1) | | | 3.6 | |
| US Treasury bills | 10.2 | | | | | — | | | 10.2 | |
| Government agencies | 0.3 | | | | | — | | | 0.3 | |
| | | | | | | |
| | | | | | | |
| | | | | | | |
| Total marketable debt securities | $ | 20.1 | | | | | $ | (0.1) | | | $ | 20.0 | |
The contractual maturities of marketable debt securities as of September 29, 2023, are shown in the table below. Actual maturities may differ from contractual maturities because borrowers may have the right to call or prepay obligations.
| | | | | | | | | | | |
| September 29, 2023 |
| (In millions) | Amortized Costs | | Fair Value |
| Contractual maturities: | | | |
| Due within one year | $ | 49.5 | | | $ | 49.5 | |
| Due after one year through five years | — | | | — | |
| | | |
| | | |
| | | |
| | | |
| Total marketable debt securities | $ | 49.5 | | | $ | 49.5 | |
During the twelve months ended September 29, 2023, there were no gross realized gains or losses from the sale of certain marketable debt securities that were reclassified out of accumulated other comprehensive (loss) income.
The following tables summarizes the balance sheet locations for marketable debt securities:
| | | | | | | | | | | | | | | | | | | | | | | | | | | | | |
| September 29, 2023 |
| (In millions) | Commercial paper | | Corporate notes/bonds | | Government agencies | | Treasury Bills | | Total |
| Cash and cash equivalents | $ | 6.0 | | | $ | — | | | $ | — | | | $ | 2.2 | | | $ | 8.2 | |
| Prepaid expenses and other current assets | — | | | 8.3 | | | 6.6 | | | 26.4 | | | 41.3 | |
| | | | | | | | | |
| | | | | | | | | |
| | | | | | | | | |
| | | | | | | | | |
| | | | | | | | | |
| Total marketable debt securities | $ | 6.0 | | | $ | 8.3 | | | $ | 6.6 | | | $ | 28.6 | | | $ | 49.5 | |
| | | | | | | | | | | | | | | | | | | | | | | | | | | | | |
| September 30, 2022 |
| (In millions) | Commercial paper | | Corporate notes/bonds | | Government agencies | | Treasury Bills | | Total |
| Cash and cash equivalents | $ | — | | | $ | — | | | $ | — | | | $ | 3.3 | | | $ | 3.3 | |
| Prepaid expenses and other current assets | 5.9 | | | 1.9 | | | 0.3 | | | 6.4 | | | 14.5 | |
| Other assets | — | | | 1.7 | | | — | | | 0.5 | | | 2.2 | |
| | | | | | | | | |
| | | | | | | | | |
| | | | | | | | | |
| | | | | | | | | |
| Total marketable debt securities | $ | 5.9 | | | $ | 3.6 | | | $ | 0.3 | | | $ | 10.2 | | | $ | 20.0 | |
11. GOODWILL AND INTANGIBLE ASSETS
The following table reflects goodwill by reportable segment:
| | | | | | | | | | | | | | | | | |
(In millions) | Medical | | Industrial | | Total |
| Balance at September 30, 2022 | $ | 169.4 | | | $ | 115.1 | | | $ | 284.5 | |
Business combination | — | | | 0.5 | | | 0.5 | |
Foreign currency translation adjustments | 2.1 | | | 1.4 | | | 3.5 | |
| Balance at September 29, 2023 | $ | 171.5 | | | $ | 117.0 | | | $ | 288.5 | |
The following table reflects the gross carrying amount and accumulated amortization of the Company’s finite-lived intangible assets included in other assets in the Consolidated Balance Sheets:
| | | | | | | | | | | | | | | | | | | | | | | | | | | | | | | | | | | |
| September 29, 2023 | | September 30, 2022 |
(In millions) | Gross Carrying Amount | | Accumulated Amortization | | Net Carrying Amount | | Gross Carrying Amount | | Accumulated Amortization | | Net Carrying Amount |
Acquired existing technology | $ | 72.3 | | | $ | (57.8) | | | $ | 14.5 | | | $ | 70.0 | | | $ | (49.9) | | | $ | 20.1 | |
Patents, licenses and other | 12.5 | | | (12.2) | | | 0.3 | | | 12.3 | | | (11.6) | | | 0.7 | |
Customer contracts and supplier relationship | 50.3 | | | (42.7) | | | 7.6 | | | 49.6 | | | (36.8) | | | 12.8 | |
| | | | | | | | | | | |
| | | | | | | | | | | |
Total intangible assets | $ | 135.1 | | | $ | (112.7) | | | $ | 22.4 | | | $ | 131.9 | | | $ | (98.3) | | | $ | 33.6 | |
| | | | |
Amortization expense for intangible assets was $13.7 million, $14.6 million and $16.8 million in fiscal years 2023, 2022 and 2021, respectively.
As of September 29, 2023, the estimated future amortization expense of intangible assets with finite lives is as follows:
| | | | | |
| (In millions) | |
| Fiscal years: | |
| 2024 | $ | 9.1 | |
| 2025 | 3.1 | |
| 2026 | 3.0 | |
| 2027 | 2.8 | |
| 2028 | 2.7 | |
| Thereafter | 1.7 | |
| Total | $ | 22.4 | |
12. COMMITMENTS AND CONTINGENCIES
Lease Commitments
See Note 3, Leases, included in this report, for additional information about the Company's lease commitments.
Other Commitments
See Note 4, Related-Party Transactions, included in this report, for additional information about the Company’s commitments to dpiX.
See Note 13, Noncontrolling Interests, included in this report, for additional information about the Company’s commitment to the noncontrolling shareholders of MeVis.
The Company has an environmental liability of approximately $2.8 million as of September 29, 2023. See Note 1, Summary of Significant Accounting Policies, included in the accompanying Notes to Consolidated Financial Statements for additional information.
In fiscal year 2022, the Company entered into several agreements with a third-party company, whose stock is publicly traded on a foreign exchange. Under these agreements, the Company will make certain milestone payments of up to $5 million upon achievement of specified milestones. During fiscal years 2022 and 2023, the Company paid $1 million and $2 million, respectively, to the third-party company, which was recorded in research and development in the Consolidated Statements of Operations. The remaining milestones are expected to be achieved in fiscal year 2024.
The Company enters into purchase agreements with its suppliers in the ordinary course of its business for the purchase of goods and services. Some of these purchase agreements are non-cancellable and thus contractually obligate the Company to future cash payments. The Company has non-cancellable supplier purchase obligations of approximately $7.3 million as of September 29, 2023.
Contingencies
The Company did not have any material contingent liabilities as of September 29, 2023 and September 30, 2022. Legal expenses are expensed as incurred.
13. NONCONTROLLING INTERESTS
In September 2018, the Company entered into a partnership in Saudi Arabia. The Company has majority voting rights with an approximate 75% interest. Accordingly, the Company has consolidated the operations of the Saudi Arabia partnership in the Company's consolidated financial statements and recorded the noncontrolling interests. The noncontrolling interest related to the partner’s 25% interest in the joint venture is included in noncontrolling interests in the equity section of the Company’s Consolidated Balance Sheets. Income representing the noncontrolling partner's share of income from operations is included in the Company's Consolidated Statements of Operations.
In April 2015, the Company completed the acquisition of 73.5% of the then outstanding shares of MeVis Medical Solutions AG (“MeVis”), a public company based in Bremen, Germany that provides image processing software and services for cancer screening. In August 2015, the Company, through one of its German subsidiaries, entered into a Domination and Profit and Loss Transfer Agreement (the “DPLTA”) with MeVis. In October 2015, the DPLTA became effective upon its registration at the local court of Bremen, Germany. Under the DPLTA, MeVis subordinates its management to the Company and undertakes to transfer all of its annual profits and losses to the Company. In return, the DPLTA grants the noncontrolling shareholders of MeVis: (1) an annual recurring net compensation of €0.95 per MeVis share starting from January 1, 2015 and (2) a put right for their MeVis shares at €19.77 per MeVis share. In fiscal years 2017 and 2018, the Company purchased an immaterial number of MeVis' shares for an additional 0.2% of outstanding shares under the put right such that the Company now owns 73.7% of the outstanding shares of common stock of MeVis. During the fourth quarter of fiscal year 2020, the put right granted to the noncontrolling shareholders of MeVis under the DPLTA expired unexercised, which resulted in the redeemable noncontrolling interests being reclassified to permanent equity as noncontrolling interest in the Consolidated Balance Sheets. As of September 29, 2023, noncontrolling shareholders together held approximately 0.5 million shares of MeVis, representing 26.3% of the outstanding shares.
Changes in noncontrolling interests were as follows:
| | | | | | | | | | | | | | | | | |
| | | Fiscal Years |
| | | 2023 | | | 2022 |
| (In millions) | | | Noncontrolling
Interests | | | | Noncontrolling Interest |
| Balance at beginning of period | | | $ | 13.3 | | | | | $ | 13.2 | |
| Net income attributable to noncontrolling interests | | | 0.5 | | | | | 0.5 | |
| | | | | | | |
| | | | | | | |
| | | | | | | |
| Other, including foreign currency remeasurement | | | (0.5) | | | | | (0.4) | |
| Balance at end of period | | | $ | 13.3 | | | | | $ | 13.3 | |
14. EMPLOYEE STOCK PLANS
Employee Stock Plans
Certain of the Company's employees participate in the Varex Imaging Corporation 2020 Omnibus Stock Plan (the “2020 Stock Plan”), the 2017 Omnibus Stock Plan (the “2017 Stock Plan”), and the Varex Imaging Corporation 2017 Employee Stock Purchase Plan (the “2017 ESPP”) which allow the grants of stock options, restricted stock units and performance shares among other types of awards to eligible employees.
In January 2017, Varex stockholders approved the 2017 ESPP, which provides eligible employees with an opportunity to purchase shares of Varex common stock at 85% of the lower of its fair market value at the start and end of a six-month purchase period. During the fiscal year 2022, the Company's Board of Directors approved an increase in the number of shares available for issuance under the 2017 ESPP of 0.8 million shares. As of September 29, 2023 the 2017 ESPP provides for the purchase of up to 1.8 million shares of Varex common stock.
Share-Based Compensation Expense
Share-based compensation expense recognized in the Consolidated Statements of Operations is based on awards ultimately expected to vest. Share-based compensation expense includes expenses related to the Company’s direct employees.
The table below summarizes the effect of recording share-based compensation expense and the option value of the employee stock purchase plan shares:
| | | | | | | | | | | | | | | | | |
| Fiscal Year |
(In millions) | 2023 | | 2022 | | 2021 |
Cost of revenues | $ | 1.7 | | | $ | 1.6 | | | $ | 1.4 | |
Research and development | 3.3 | | | 3.1 | | | 3.0 | |
Selling, general and administrative | 8.5 | | | 9.3 | | | 9.5 | |
Total share-based compensation expense | $ | 13.5 | | | $ | 14.0 | | | $ | 13.9 | |
The unrecognized share-based compensation cost as of September 29, 2023 was $23.1 million, and is expected to be recognized over a weighted average period of 2.5 fiscal years. As of September 29, 2023, there were approximately 2.2 million and 0.6 million shares of common stock available for future issuances under the 2020 Stock Plan and the 2017 ESPP, respectively.
The Company utilized the Black-Scholes valuation model for estimating the fair value of stock options granted and the option component of ESPP grants. The Company calculated the fair value of option grants and option component of ESPP grants on the respective dates of grant using the following weighted average assumptions:
| | | | | | | | | | | | | | | | | | | | | | | | | | | | | | | | | | | |
| Employee Stock Option Plan | | Employee Stock Purchase Plans |
| Fiscal Year | | Fiscal Year |
| 2023 | | 2022 | | 2021 | | 2023 | | 2022 | | 2021 |
Expected term (in years) | 6.9 | | 7.0 | | 7.0 | | 0.5 | | 0.4 | | 0.5 |
Risk-free interest rate | 3.6 | % | | 1.4 | % | | 1.0 | % | | 4.8 | % | | 1.6 | % | | 0.1 | % |
Expected volatility | 43.9 | % | | 42.7 | % | | 41.5 | % | | 34.8 | % | | 33.6 | % | | 68.4 | % |
Expected dividend | — | % | | — | % | | — | % | | — | % | | — | % | | — | % |
Weighted average fair value at grant date | $9.75 | | $12.07 | | $9.37 | | $4.96 | | $5.41 | | $5.90 |
Option valuation methods, including Black-Scholes, require the input of subjective assumptions, which are discussed below.
Risk-Free Interest Rate
The interest rates used are based on the implied yield currently available on U.S. Treasury zero-coupon issues with an equivalent remaining term equal to the expected life of the award.
Expected Term
Options granted generally vest over a period of 36 to 48 months and expire 7 to 10 years from date of grant. Employee stock purchase plan offering periods are typically 6 months and provides eligible employees with an opportunity to purchase shares of Varex common stock at 85% of the lower of its fair market value at the start or end of a six-month purchase period. The Company has elected to use the simplified method in calculating the expected term of its options due to a lack of sufficient historical information.
Expected Dividend Yield
The dividend rate used is zero as the Company has never paid any cash dividends on its common stock and does not anticipate doing so in the foreseeable future. The Company is also restricted from paying dividends on common stock under its debt facilities.
Expected Volatility
Authoritative accounting guidance on stock-based compensation indicates that companies should consider volatility over a period generally commensurate with the expected or contractual term of the stock option. Adequate Company-specific data does not exist for this time period as the Company began trading in January 2017. The volatility variable used is a blended approach by using the Company's historic data for the years it has been publicly traded and a benchmark of other comparable companies’ volatility rates for the prior years.
Stock Option Activity
The following table summarizes the activity for stock options under Varex’s employee incentive plans for the Company’s employees:
| | | | | | | | | | | | | | | | | | | | | | | | | | | | | |
(In thousands, except per share amounts and the remaining term) | Options | | Price range | | Weighted Average
Exercise Price | | Weighted Average Remaining Term (in years) | | Aggregate Intrinsic Value (1) |
| Outstanding at September 30, 2022 | 2,902 | | | $13.61 - $37.60 | | $ | 28.97 | | | 4.5 | | $ | 1,361.4 | |
Granted | 415 | | | $22.13 - $24.55 | | 22.31 | | | | | |
Canceled, expired or forfeited | (442) | | $22.13 - $37.10 | | 28.92 | | | | | |
Exercised | (13) | | $13.61 - $13.61 | | 13.61 | | | | | |
| Outstanding at September 29, 2023 | 2,862 | | $13.61 - $37.60 | | $ | 28.08 | | | 4.8 | | $ | 871.4 | |
| Exercisable at September 29, 2023 | 2,080 | | $13.61 - $37.60 | | $ | 29.44 | | | 3.4 | | $ | 642.6 | |
(1) The aggregate intrinsic value represents the total pre-tax intrinsic value, which is computed based on the difference between the exercise price and the closing price of Varex common stock of $18.79 as of September 29, 2023, the last trading date of the Company's respective fiscal years, and which represents the amount that would have been received by the option holders had all option holders exercised their options and sold the shares received upon exercise as of that date.
The grant-date fair value of options granted during fiscal years 2023, 2022 and 2021 was $4.0 million, $3.9 million and $3.7 million, respectively. The total intrinsic value of the options exercised during the years ended September 29, 2023, September 30, 2022 and October 1, 2021 was $0.1 million, $0.5 million and $0.0 million, respectively.
Restricted Stock Units, Restricted Stock Awards and Deferred Stock Units
The following table summarizes the activity for restricted stock units, restricted stock awards and deferred stock units under the 2020 Stock Plan:
| | | | | | | | | | | |
(In thousands, except per share amounts) | Number of Shares | | Weighted Average
Grant-Date Fair
Value |
| Balance at September 30, 2022 | 1,045 | | | $ | 24.35 | |
Granted | 566 | | | 20.00 | |
Vested | (255) | | | 24.71 | |
Canceled, expired or forfeited | (79) | | | 23.75 | |
| Balance at September 29, 2023 | 1,277 | | | $ | 22.30 | |
The total grant-date fair value of shares granted was $11.3 million, $10.8 million and $8.9 million for fiscal years 2023, 2022 and 2021, respectively. Shares outstanding at September 29, 2023, September 30, 2022 and October 1, 2021 had an estimated market value of $24.0 million, $22.1 million and $30.9 million, respectively.
15. TAXES ON INCOME
Income tax expense or benefit is based on reported income or loss before income taxes. Deferred income taxes reflect the effect of temporary differences between asset and liability amounts that are recognized for financial reporting purposes and the amounts that are recognized for income tax purposes. These deferred taxes are measured by applying currently enacted tax laws. Valuation allowances are recognized to reduce deferred tax assets to the amount that is more likely than not to be realized.
Income tax (benefit) expense was as follows:
| | | | | | | | | | | | | | | | | |
| Fiscal Years |
| (In millions) | 2023 | | 2022 | | 2021 |
| Current income tax expense | | | | | |
Federal | $ | 9.8 | | | $ | 3.7 | | | $ | 5.4 | |
State and local | 0.3 | | | 0.2 | | | 1.4 | |
Foreign | 12.6 | | | 10.3 | | | 6.8 | |
Total current | $ | 22.7 | | | $ | 14.2 | | | $ | 13.6 | |
Deferred income tax (benefit) expense: | | | | | |
Federal | $ | (38.0) | | | $ | 0.4 | | | $ | 1.8 | |
State and local | (0.2) | | | (0.9) | | | (1.3) | |
Foreign | (1.9) | | | — | | | (3.4) | |
Total deferred | (40.1) | | | (0.5) | | | (2.9) | |
| Income tax (benefit) expense | $ | (17.4) | | | $ | 13.7 | | | $ | 10.7 | |
Income before taxes are generated from the following geographic areas:
| | | | | | | | | | | | | | | | | |
| Fiscal Years |
| (In millions) | 2023 | | 2022 | | 2021 |
| United States | $ | (6.2) | | | $ | 16.4 | | | $ | (4.1) | |
| Foreign | 37.5 | | | 28.1 | | | 32.7 | |
| Income before taxes | $ | 31.3 | | | $ | 44.5 | | | $ | 28.6 | |
The effective tax rate differs from the U.S. federal statutory tax rate as a result of the following:
| | | | | | | | | | | | | | | | | |
| Fiscal Years |
| 2023 | | 2022 | | 2021 |
Federal statutory income tax rate | 21.0 | % | | 21.0 | % | | 21.0 | % |
State and local taxes, net of federal tax benefit | 0.3 | | | (1.4) | | | 0.3 | |
| | | | | |
| Statutory rate change impact on prior year deferreds | — | | | 1.1 | | | — | |
| Return to provision | (4.7) | | | (2.1) | | | 4.2 | |
Research and development credit | (8.4) | | | (0.9) | | | (4.2) | |
| | | | | |
| Prior year research and development credit | — | | | — | | | (0.3) | |
| | | | | |
| Foreign rate difference | 6.3 | | | 6.5 | | | 1.7 | |
| Foreign research innovation box | — | | | — | | | (3.8) | |
| Change in valuation allowance | (65.7) | | | 6.3 | | | 8.4 | |
| U.S. tax reform - international provisions | (9.2) | | | (4.6) | | | (0.7) | |
| U.S. net operating loss carryback | — | | | — | | | 5.2 | |
| Other | 4.8 | | | 4.9 | | | 5.6 | |
Effective tax rate | (55.6) | % | | 30.8 | % | | 37.4 | % |
| | | | | |
| | | | | |
During fiscal year 2023, the Company's effective tax rate varied from the U.S. federal statutory rate of 21% primarily due to the favorable impact of the release of the U.S. valuation allowance, U.S. tax reform regarding international provisions, R&D credits, and return to provision adjustments. These favorable items were partially offset by the unfavorable impact of profit in foreign jurisdictions with statutory tax rates greater than 21%.
During fiscal year 2022, the Company’s effective tax rate varied from the U.S. federal statutory rate of 21% primarily due to the unfavorable impact of profit in foreign jurisdictions with statutory tax rates greater than 21% and also U.S. deferred tax attributes and losses in certain foreign jurisdictions for which a valuation allowance is provided. These unfavorable items are partially offset by the favorable impact of U.S. tax reform international provisions, return to provision adjustments, and R&D tax credits.
During fiscal year 2021, the Company’s effective tax rate varied from the U.S. federal statutory rate of 21% primarily because of the unfavorable impact of U.S. deferred tax attributes and losses in certain foreign jurisdictions for which a valuation allowance is provided and a reduction in benefit for U.S. net operating losses carried back to prior years. These unfavorable items are partially offset by the favorable impact of R&D tax credits and U.S. tax reform international provisions.
The Company has estimated its fiscal year 2023 GILTI (global intangible low-taxed income), BEAT (base-erosion anti-abuse tax), FDII (foreign-derived intangible income), limitations on interest expense deductions, and other components of U.S. tax reform, and have included these amounts in the calculation of the fiscal year 2023 tax provision. The Company has made an accounting policy election, as allowed by the SEC and FASB, to recognize the impact of GILTI as a period cost if and when incurred.
Significant components of deferred tax assets and liabilities are as follows:
| | | | | | | | | | | |
| (In millions) | September 29, 2023 | | September 30, 2022 |
| Deferred tax assets: | | | |
| Inventory adjustments | $ | 5.9 | | | $ | 6.4 | |
| Share-based compensation | 6.7 | | | 6.3 | |
| Product warranty | 1.5 | | | 1.4 | |
| Unrealized exchange gain | 2.5 | | | 2.6 | |
| Deferred compensation | 1.4 | | | 1.3 | |
| Net operating loss carryforwards | 19.4 | | | 19.7 | |
| Accrued vacation | 0.3 | | | 0.9 | |
| Accrued incentives | 2.0 | | | 2.8 | |
| Credit carryforwards | 2.7 | | | 2.5 | |
| Deferred financing fees | 5.7 | | | 2.4 | |
| Interest expense limitation | — | | | 3.9 | |
| Capitalized interest | 1.1 | | | 0.9 | |
| Lease liabilities | 6.1 | | | 5.4 | |
| Investments in privately held companies | 3.2 | | | — | |
| Research and experimentation capitalization | 17.6 | | | — | |
| Other | 4.1 | | | 2.5 | |
| $ | 80.2 | | | $ | 59.0 | |
| Valuation allowance | (18.7) | | | (32.2) | |
| Total deferred tax assets | $ | 61.5 | | | $ | 26.8 | |
| Deferred tax liabilities: | | | |
| Acquired intangibles | $ | (5.3) | | | $ | (7.9) | |
| Property, plant and equipment | (8.0) | | | (8.8) | |
| Investments in privately held companies | — | | | (1.4) | |
| Operating lease assets | (6.0) | | | (5.6) | |
| Other | (0.9) | | | (1.3) | |
| Total deferred tax liabilities | (20.2) | | | (25.0) | |
| Net deferred tax assets | $ | 41.3 | | | $ | 1.8 | |
| Reported As: | | | |
| Deferred tax assets | $ | 61.5 | | | $ | 26.8 | |
| Deferred tax liabilities | (20.2) | | | (25.0) | |
| Net deferred tax assets | $ | 41.3 | | | $ | 1.8 | |
| | | |
| | | |
| | | |
| | | |
| | | |
| | | |
| | | |
| | | |
| | | |
| | | |
| | | |
| | | |
| | | |
The Company is maintaining its reinvestment assertion with respect to foreign earnings for the year ended September 29, 2023, which is that all earnings prior to fiscal year 2018 are permanently reinvested for all countries, and that all earnings for Direct Conversion, located primarily in Sweden and Finland, are also indefinitely reinvested in those countries, but post fiscal year 2017 earnings in all other countries are not permanently reinvested. Due to the level of earnings available for repatriation, the treaty benefits applicable to jurisdictions in which those earnings are located, and the now favorable U.S. tax treatment of repatriated foreign earnings, the amount of deferred tax liability recorded related to the potential repatriation is approximately $0.1 million. This estimated liability is for U.S. state income taxes and foreign withholding taxes that would apply if the foreign earnings were repatriated in the form of a dividend.
As of September 29, 2023, the Company had foreign net operating loss carryforwards ("NOL") of approximately $19.3 million with $0.8 million expiring between 2023 and 2034 and $18.5 million carried forward indefinitely.
The valuation allowance relates primarily to net operating losses in certain foreign jurisdictions and other deferred tax attributes where, based on the weight of available evidence, it is more likely than not that the tax benefit will not be realized. The valuation allowance decreased by $13.5 million during fiscal year 2023 and increased by $2.0 million during fiscal year 2022. The decrease during the current year was primarily related to the release of the valuation allowance against U.S. deferred tax attributes.
Changes in the Company's valuation allowance for deferred tax assets were as follows:
| | | | | | | | | | | | | | | | | |
| Fiscal Years |
| (In millions) | 2023 | | 2022 | | 2021 |
| Valuation allowance balance–beginning of fiscal year | $ | 32.2 | | | $ | 30.2 | | | $ | 28.7 | |
| | | | | |
| Other increases | — | | | 6.9 | | | 5.4 | |
| Other decreases | (13.5) | | | (4.9) | | | (3.9) | |
| Valuation allowance balance—end of fiscal year | $ | 18.7 | | | $ | 32.2 | | | $ | 30.2 | |
The Company accounts for uncertainty in income taxes following a two-step approach for recognizing and measuring uncertain tax positions. The first step is to evaluate the tax position for recognition by determining whether the weight of available evidence indicates that it is more likely than not that, based on the technical merits, the position will be sustained on audit, including resolution of related appeals or litigation processes, if any. The second step is to measure the tax benefit as the largest amount that is more than 50% likely of being realized upon settlement.
Changes in the Company’s unrecognized tax benefits were as follows:
| | | | | | | | | | | | | |
| Fiscal Years |
| (In millions) | 2023 | | 2022 | | |
| Unrecognized tax benefits balance–beginning of fiscal year | $ | 1.2 | | | $ | 1.1 | | | |
| Additions based on tax positions related to a prior year | — | | | 0.1 | | | |
| Additions based on tax positions related to the current year | 0.2 | | | — | | | |
| | | | | |
| | | | | |
| Unrecognized tax benefits balance—end of fiscal year | $ | 1.4 | | | $ | 1.2 | | | |
As of September 29, 2023 and September 30, 2022, the total amount of gross unrecognized tax benefits was $1.4 million and $1.2 million, respectively, all of which would affect the effective tax rate if recognized.
The Company includes interest and penalties related to income taxes within income tax expense (benefit) on the Consolidated Statements of Operations. For the year ended September 29, 2023, $0.2 million interest and penalties have been included for this period. For the year ended September 30, 2022, $0.2 million interest and penalties have been included for this period. For the year ended October 1, 2021, $0.2 million interest and penalties have been included for this period.
The Company files U.S. federal and state income tax returns and non-U.S. income tax returns in various jurisdictions. All of these returns are subject to examination by their respective taxing jurisdictions from the date of filing through each applicable statute of limitation period. Other periods for entities acquired are still open and subject to examination. Generally, periods prior to 2012 are no longer subject to examination.
During fiscal year 2021, the New York Department of Finance and Taxation and the Utah State Tax Commission commenced examinations of Varex’s tax returns for the years 2017, 2018, and 2019, which were closed as of September 29, 2023 with no significant adjustments.
16. SEGMENT INFORMATION
The Company has two reportable operating segments: Medical and Industrial, which aligns with how its CEO, who is the Company's Chief Operating Decision Maker (“CODM”), reviews the Company’s performance. The segments align the Company’s products and service offerings with customer use in medical and industrial markets and are consistent with how the Company’s CEO evaluates the business for the allocation of resources. The CODM allocates resources to and evaluates the financial performance of each operating segment primarily based on revenues and gross profit. The operating and reportable segment structure provides alignment between business strategies and operating results.
Description of Segments
The Medical segment designs, manufactures, sells and services X-ray imaging components, including X-ray tubes, digital detectors and accessories, ionization chambers, high voltage connectors, image-processing software and workstations, 3D reconstruction software, computer-aided diagnostic software, collimators, automatic exposure control devices, generators, and heat exchangers. These components are used in a range of medical imaging applications including CT, mammography, oncology, cardiac, surgery, dental, and other diagnostic radiography uses.
The Industrial segment designs, develops, manufactures, sells and services X-ray imaging products for use in a number of markets, including security applications for cargo screening at ports and borders and baggage screening at airports, and nondestructive testing, irradiation, and inspection applications used in a number of other vertical markets. The Company's industrial products include Linatron® X-ray linear accelerators, X-ray tubes, digital detectors, high voltage connectors, and coolers. In addition, the Company licenses proprietary image-processing and detection software designed to work with other Varex products to provide packaged sub-assembly solutions to industrial customers.
Accordingly, the following information is provided for purposes of achieving an understanding of operations, but it may not be indicative of the financial results of the reported segments were they independent organizations. In addition, comparisons of the Company’s operations to similar operations of other companies may not be meaningful.
Information related to the Company’s segments is as follows:
| | | | | | | | | | | | | | | | | |
| Fiscal Year |
(In millions) | 2023 | | 2022 | | 2021 |
Revenues | | | | | |
Medical | $ | 673.3 | | | $ | 674.7 | | | $ | 643.8 | |
Industrial | 220.1 | | | 184.7 | | | 174.3 | |
Total revenues | 893.4 | | | 859.4 | | | 818.1 | |
Gross profit | | | | | |
Medical | 205.5 | | | 210.5 | | | 203.2 | |
Industrial | 84.8 | | | 73.0 | | | 68.3 | |
Total gross profit | 290.3 | | | 283.5 | | | 271.5 | |
Total operating expenses | 213.2 | | | 195.3 | | | 197.4 | |
| Interest and other expense, net | (45.8) | | | (43.7) | | | (45.5) | |
| Income before taxes | 31.3 | | | 44.5 | | | 28.6 | |
| Income tax (benefit) expense | (17.4) | | | 13.7 | | | 10.7 | |
| Net income | 48.7 | | | 30.8 | | | 17.9 | |
| Less: Net income attributable to noncontrolling interests | 0.5 | | | 0.5 | | | 0.5 | |
| Net income attributable to Varex | $ | 48.2 | | | $ | 30.3 | | | $ | 17.4 | |
| | | | | |
| | | | | |
| | | | | |
| | | | | |
| | | | | |
| | | | | |
| | | | | |
| | | | | |
| | | | | |
| | | | | |
| | | | | |
| | | | | |
| | | | | |
| | | | | |
| | | | | |
| | | | | |
| | | | | |
| | | | | |
| | | | | |
The Company does not disclose total assets by segment as this information is not provided to the CODM.
Geographic Information
| | | | | | | | | | | | | | | | | | | | | | | | | | | | | |
| Revenues | | Long-Lived Assets |
| Fiscal Years | | Fiscal Years |
| (In millions) | 2023 | | 2022 | | 2021 | | 2023 | | 2022 |
| Americas | $ | 281.8 | | | $ | 273.3 | | | $ | 268.5 | | | $ | 101.8 | | | $ | 99.8 | |
| EMEA | 290.7 | | | 280.8 | | | 276.3 | | | 22.8 | | | 23.2 | |
| APAC | 320.9 | | | 305.3 | | | 273.3 | | | 19.0 | | | 18.3 | |
Total company | $ | 893.4 | | | $ | 859.4 | | | $ | 818.1 | | | $ | 143.6 | | | $ | 141.3 | |
Revenue in the United States of America was $275.1 million, $263.7 million and $262.3 million in fiscal years 2023, 2022 and 2021, respectively.
The Company operates various manufacturing and marketing operations outside the United States. Americas includes North and South America. EMEA includes Europe, Russia, the Middle East, India and Africa. APAC includes Asia and Australia. Revenues by region are based on the known final destination of products sold.
17. EMPLOYEE BENEFIT PLANS
Varex’s 401(k) plan is intended to be qualified under Section 401(a) of the Code with the 401(k) plan’s related trust intended to be tax exempt under Section 501(a) of the Code and intended for all full-time employees in the United States. This plan allows employees to contribute a portion of their pretax salary up to the maximum dollar limitation prescribed by the Internal Revenue Service. The Company made matching contributions to the plan totaling $4.9 million, $4.4 million and $2.8 million in fiscal years 2023, 2022 and 2021, respectively.
The Company also maintains defined benefit plans for certain employees located outside the United States. The net pension liability is included in other long-term liabilities on the Company's Consolidated Balance Sheets and totaled $5.2 million and $3.3 million as of September 29, 2023 and September 30, 2022, respectively. The Company’s net periodic benefit costs for the Company’s defined benefit plans were not material for fiscal years 2023, 2022, and 2021.
18. ACCUMULATED OTHER COMPREHENSIVE (LOSS) INCOME
The following tables present the changes in the accumulated balances for each component of other comprehensive (loss) income:
| | | | | | | | | | | | | | | | | | | | | | | | | | | | | |
| (In millions) | (Loss) Income on Forward Contracts | | Unrealized (Loss) Gain on Defined Benefit Obligations | | CTA, Including Impact of Net Investment Hedge | | Unrealized (Loss) Income on Available-For-Sale Securities | | Accumulated Other Comprehensive Income (Loss) |
| | | | | | | | | |
| | | | | | | | | |
| | | | | | | | | |
| | | | | | | | | |
| | | | | | | | | |
| | | | | | | | | |
| | | | | | | | | |
| | | | | | | | | |
| | | | | | | | | |
| | | | | | | | | |
| Balance at October 01, 2021 | $ | — | | | $ | (0.8) | | | $ | 0.8 | | | $ | — | | | $ | — | |
Other comprehensive (loss) income before reclassifications | (0.8) | | | 2.0 | | | 8.7 | | | (0.1) | | | 9.8 | |
| | | | | | | | | |
| | | | | | | | | |
Income tax impact | 0.2 | | | (0.6) | | | (0.4) | | | — | | | (0.8) | |
Foreign currency translation adjustment | — | | | — | | | (8.9) | | | — | | | (8.9) | |
| Balance at September 30, 2022 | $ | (0.6) | | | $ | 0.6 | | | $ | 0.2 | | | $ | (0.1) | | | $ | 0.1 | |
Other comprehensive (loss) income before reclassifications | 0.1 | | | (1.2) | | | (4.4) | | | 0.1 | | | (5.4) | |
Income tax impact | — | | | 0.2 | | | — | | | — | | | 0.2 | |
Foreign currency translation adjustment | — | | | — | | | 3.9 | | | — | | | 3.9 | |
| Balance at September 29, 2023 | $ | (0.5) | | | $ | (0.4) | | | $ | (0.3) | | | $ | — | | | $ | (1.2) | |