UNITED
STATES SECURITIES AND EXCHANGE COMMISSION
Washington,
D.C. 20549
FORM
10-K/A
Amendment No. 1
(Mark One)
☑ ANNUAL
REPORT PURSUANT TO SECTION 13 OR 15(d) OF THE SECURITIES EXCHANGE
ACT OF 1934
For
the fiscal year ended December 31, 2018
or
☐
TRANSITION REPORT PURSUANT TO
SECTION 13 OR 15(d) OF THE SECURITIES EXCHANGE ACT OF
1934
For
the transition period from _________ to _____________
Commission
file number: 001-38273 0
ACM
Research, Inc.
(Exact Name of Registrant as Specified in Its Charter)
|
Delaware
|
|
94-3290283
|
|
(State
or Other Jurisdiction of Incorporation or
Organization)
|
|
(I.R.S.
Employee Identification No.)
|
|
|
|
|
|
42307
Osgood Road, Suite I
Fremont,
California
|
|
94539
|
|
(Address of Principal Executive Offices)
|
|
(Zip Code)
|
Registrant’s
telephone number, including area code: (510)
445-3700
Securities
registered pursuant to Section 12(b) of the Act:
|
Title of Each
Class
|
|
Trading Symbol(s)
|
|
Name of Each Exchange
on which Registered
|
|
Class A Common
Stock, $0.0001 par value
|
|
ACMR
|
|
Nasdaq Global
Market
|
Securities
registered pursuant to Section 12(g) of the Act: None.
Indicate by check
mark if the registrant is a well-known seasoned issuer, as defined
in Rule 405 of the Securities Act. Yes ☐ No
☑
Indicate by check mark if the registrant is not
required to file reports pursuant to Section 13 or Section 15(d) of
the Act. Yes ☐
No ☑
Indicate by check
mark whether the registrant (1) has filed all reports required to
be filed by Section 13 or 15(d) of the Securities Exchange Act of
1934 during the preceding 12 months (or for such shorter period
that the registrant was required to file such reports), and (2) has
been subject to such filing requirements for the past 90 days.
Yes ☑ No ☐
Indicate by check
mark whether the registrant has submitted electronically, if any,
every Interactive Data file required to be submitted pursuant to
Rule 405 of Regulation S-T (§232.405 of this chapter) during
the preceding 12 months (or for such shorter period that the
registrant was required to submit such files). Yes ☑ No
☐
Indicate by check
mark whether the registrant is a large accelerated filer, an
accelerated filer, a non-accelerated filer, or a smaller reporting
company. See definitions of “large accelerated filer,”
“accelerated filer” and “smaller reporting
company” in Rule 12b-2 of the Exchange Act.
|
Large accelerated
filer
☐
|
Accelerated filer
☐
|
|
Non-accelerated
file
☐
|
Smaller reporting
company ☑
|
|
|
Emerging growth
company ☑
|
If an emerging growth company, indicate by check
mark if the registrant has elected not to use the extended
transition period for complying with any new or revised financial
accounting standards provided pursuant to Section 13(a) of the
Exchange Act. ☑
Indicate by check mark whether the registrant is a
shell company (as defined in Rule 12b-2 of the Exchange
Act). Yes ☐ No ☑
The aggregate
market value on June 30, 2018 (the last business day
of the registrant’s most recently completed second quarter),
of the voting common equity held by non-affiliates of the
registrant, computed by reference to the closing price of the stock
on that date, was $10.78. The registrant does not have non-voting
common equity outstanding.
Indicate the number
of shares outstanding of each of the registrant’s classes of
common stock, as of the latest practicable date.
|
Class
|
|
Number of Shares
Outstanding
|
|
Class
A Common Stock, $0.0001 par value
|
|
14,176,690
shares outstanding as of March 8, 2019
|
|
Class
B Common Stock, $0.0001 par value
|
|
1,898,423
shares outstanding as of March 8, 2019
|
Documents
Incorporated By Reference
The registrant
files a proxy statement pursuant to Regulation 14A within 120 days
of the end of the fiscal year ended December 31, 2018. Portions of
such proxy statement are incorporated by reference into Part III of
this Amendment No. 1 on Form 10-K/A.
EXPLANATORY
NOTE
This Amendment No.
1 on Form 10-K/A includes certain exhibits inadvertently omitted
from the registrant’s Annual Report on Form 10-K for the
fiscal year ended December 31, 2018 filed with the Securities and
Exchange Commission on March 14, 2019. This Amendment No. 1 does
not otherwise reflect any changes to the previously filed Annual
Report on Form 10-K (including in the consolidated financial
statements included therein), other than modifications to the
facing and signature pages.
TABLE
OF CONTENTS
|
PART I
|
|||
|
Item
1
|
Business
|
|
3
|
|
Item
1A
|
Risk
Factors
|
|
14
|
|
Item
2
|
Properties
|
|
37
|
|
Item
3
|
Legal
Proceedings
|
|
38
|
|
PART II
|
|||
|
Item
5
|
Market
for Registrant’s Common Equity, Related Stockholder Matters
and
|
|
|
|
|
Issuer
Purchases of Equity Securities
|
|
39
|
|
Item
7
|
Management’s
Discussion and Analysis of Financial Condition and Results of
Operations
|
|
40
|
|
Item
8
|
Financial
Statements and Supplementary Data
|
|
63
|
|
Item
9A
|
Controls
and Procedures
|
|
98
|
|
PART III
|
|||
|
Item
10
|
Directors,
Executive Officers and Corporate Governance
|
|
99
|
|
Item
11
|
Executive
Compensation
|
|
99
|
|
Item
12
|
Security
Ownership of Certain Beneficial Owners and Management
and
|
|
|
|
|
Related
Stockholder Matters
|
|
99
|
|
Item
13
|
Certain
Relationships and Related Transactions, and Director
Independence
|
|
99
|
|
Item
14
|
Principal
Accountant Fees and Services
|
|
99
|
|
PART IV
|
|||
|
Item
15
|
Exhibits
and Financial Statement Schedules
|
|
100
|
|
Signatures
|
|
|
102
|
We conduct our business operations principally through ACM Research
(Shanghai), Inc., or ACM Shanghai, a subsidiary of ACM Research,
Inc., or ACM Research. Unless the context requires otherwise,
references in this report to “our company,”
“our,” “us,” “we” and similar
terms refer to ACM Research, Inc. (including its predecessor prior
to its redomestication from California to Delaware in November
2016) and its subsidiaries, including ACM Shanghai,
collectively.
SAPS, TEBO and ULTRA C are our trademarks. For convenience, these
trademarks appear in this report without ™ symbols, but that
practice does not mean that we will not assert, to the fullest
extent under applicable law, our rights to the trademarks. This
report also contains other companies’ trademarks, registered
marks and trade names, which are the property of those
companies.
FORWARD-LOOKING
STATEMENTS AND STATISTICAL DATA
This report
contains statements reflecting our views about our future
performance that constitute “forward-looking
statements” within the meaning of the Private Securities
Litigation Reform Act of 1995. These forward-looking statements are
generally identified through the inclusion of words such as
“anticipate,” “believe,”
“contemplate,” “estimate,”
“expect,” “forecast,” “intend,”
“may,” “objective,” “outlook,”
“plan,” “potential,” “project,”
“seek,” “should,” “strategy,”
“target” or “will” or variations of such
words or similar expressions. All statements addressing our future
operating performance, and statements addressing events and
developments that we expect or anticipate will occur in the future,
are forward-looking statements within the meaning of the Private
Securities Litigation Reform Act of 1995. Forward-looking
statements are based upon currently available information,
operating plans, and projections about future events and trends.
This report also contains statistical data and estimates based on
independent industry publications or other publicly available
information, as well as other information based on our internal
sources. Forward-looking statements and statistical estimates
inherently involve risks and uncertainties that could cause actual
results to differ materially from those predicted or expressed in
this report. These risks and uncertainties include those described
below in “Item 1A. Risk Factors.” Investors are
cautioned not to place undue reliance on any forward-looking
statements or statistical estimates, which speak only as of the
date they are made. We undertake no obligation to update any
forward-looking statement or statistical estimate, whether as a
result of new information, future events or otherwise.
2
PART
I
Item
1.
Business
Overview
We supply advanced,
innovative capital equipment developed for the global semiconductor
industry. Fabricators of advanced integrated circuits, or chips,
can use our single-wafer wet-cleaning tools in numerous steps to
improve product yield, even at increasingly advanced process nodes.
We have designed these tools for use in fabricating foundry, logic
and memory chips, including dynamic random-access memory (or DRAM)
and 3D NAND-flash memory chips. We also develop, manufacture and
sell a range of advanced packaging tools to wafer assembly and
packaging customers.
Selling prices for
our single-wafer wet-cleaning tools range from $2 million to more
than $5 million. Revenue from single-wafer wet-cleaning tools
totaled $68.5 million, or 92% of total revenue, in 2018 and $27.1
million, or 74% of total revenue, in 2017. Our customers for
single-wafer wet-cleaning tools include Semiconductor Manufacturing
International Corporation, Shanghai Huali Microelectronics
Corporation, SK Hynix Inc. and Yangtze Memory Technologies Co.,
Ltd.
We focus our
selling efforts on establishing a referenceable base of leading
foundry, logic and memory chip makers, whose use of our products
can influence decisions by other manufacturers. We believe this
customer base will help us penetrate the mature chip manufacturing
markets and build credibility with additional industry leaders.
Using a “demo-to-sales” process, we have placed
evaluation equipment, or “first tools,” with a number
of selected customers. Since 2009 we have delivered more than 55
single-wafer wet cleaning tools, more than 50 of which have been
accepted by customers and thereby generated revenue to us and the
balance of which are awaiting customer acceptance should
contractual conditions be met.
Since our formation
in 1998, we have focused on building a strategic portfolio of
intellectual property to support and protect our key innovations.
Our wet-cleaning equipment has been developed using our key
proprietary technologies:
●
Space Alternated Phase Shift, or SAPS,
technology for flat and patterned wafer surfaces. Introduced
in 2009, SAPS technology employs alternating phases of megasonic
waves to deliver megasonic energy in a highly uniform manner on a
microscopic level. We have shown SAPS technology to be more
effective than conventional megasonic and jet spray technologies in
removing random defects across an entire wafer as node sizes shrink
from 300nm to 20nm and lower.
●
Timely Energized Bubble Oscillation, or TEBO,
technology for patterned wafer surfaces at advanced process
nodes. Introduced in March 2016, TEBO technology has been
developed to provide effective, damage-free cleaning for 2D and 3D
patterned wafers with fine feature sizes. We have demonstrated the
damage-free cleaning capabilities of TEBO technology on patterned
wafers for feature nodes as small as 1xnm (16nm to 19nm), and we
have shown TEBO technology can be applied in manufacturing
processes for patterned chips with 3D architectures having aspect
ratios as high as 60-to-1.
●
Tahoe technology for cost and environmental
savings. Introduced in August 2018, Tahoe technology
delivers high cleaning performance using significantly less
sulfuric acid and hydrogen peroxide than is typically consumed by
conventional high-temperature single-wafer cleaning
tools.
We have been issued
more than 220 patents in the United States, the People’s
Republic of China or PRC, Japan, Korea, Singapore and
Taiwan.
We conduct
substantially all of our product development, manufacturing,
support and services in the PRC. All of our tools are built to
order at our manufacturing facilities in Shanghai, which encompass
86,000 square feet of floor space for production capacity. Our
experience has shown that chip manufacturers in the PRC and
throughout Asia demand equipment meeting their specific technical
requirements and prefer building relationships with local
suppliers. We will continue to seek to leverage our local presence
to address the growing market for semiconductor manufacturing
equipment in the region by working closely with regional chip
manufacturers to understand their specific requirements, encourage
them to adopt our SAPS, TEBO and Tahoe technologies, and enable us
to design innovative products and solutions to address their
needs.
3
Our
Technology and Product Offerings
Single Wafer Wet Cleaning Equipment for Front End Production
Processes
Chip fabricators
can use our single-wafer wet-cleaning tools in numerous steps to
improve product yield during the front-end production process,
during which individual devices are patterned in the chip prior to
being interconnected on the wafer. Based on our review of
third-party reports and other information, we estimate that the
global market for single wafer wet cleaning tools will increase
from $3.1 billion in 2018 to $4.3 billion in 2023, representing a
compound annual growth rate of 6.8%. We estimate our Ultra-C SAPS,
TEBO and Tahoe product offerings address approximately 50% of this
market.
Our wet-cleaning
equipment has been developed using our proprietary SAPS, TEBO and
Tahoe technologies, which allow our tools to remove random defects
from a wafer surface effectively, without damaging a wafer or its
features, even at an increasingly advanced process nodes (the
minimum line widths on a chip) of 22 nanometers, or nm, or
less. We use a modular configuration that enables us to create a
wet-cleaning tool meeting the specific requirements of a customer,
while using pre-existing designs for chamber, electrical, chemical
delivery and other modules. Our modular approach supports a wide
range of customer needs and facilitates the adaptation of our model
tools for use with the optimal chemicals selected to meet a
customer’s requirements. Our tools are offered principally
for use in manufacturing chips from 300mm silicon wafers, but we
also offer solutions for 150mm and 200mm wafers and for nonstandard
substrates, including compound semiconductor, quartz, sapphire,
glass, and plastics.
SAPS
Technology, Applications and Equipment
SAPS Technology
SAPS technology
delivers megasonic energy uniformly to every point on an entire
wafer by alternating phases of megasonic waves in the gap between a
megasonic transducer and the wafer. Radicals for removing random
defects are generated in dilute solution, and the radical
generation is promoted by megasonic energy. Unlike
“stationary” megasonic transducers used by conventional
megasonic cleaning methods, SAPS technology moves or tilts a
transducer while a wafer rotates, enabling megasonic energy to be
delivered uniformly across all points on the wafer, even if the
wafer is warped. The mechanical force of cavitations generated by
megasonic energy enhances the mass transfer rate of dislodged
random defects and improves particle removal
efficiency.
By delivering
megasonic energy in a highly uniform manner on a microscopic level,
SAPS technology can precisely control the intensity of megasonic
energy and can effectively remove random defects of all sizes
across the entire wafer in less total cleaning time than
conventional megasonic cleaning products, without loss of material
or roughing of wafer surfaces. We have conducted trials
demonstrating SAPS technology to be more effective than
conventional megasonic and jet spray cleaning technologies as
defect sizes shrink from 300nm to 20nm and below. These trials show
that SAPS technology has an even greater relative advantage over
conventional jet spray technology for cleaning defects between 50
and 65nm in size, and we expect the relative benefits of SAPS will
continue to apply in cleaning even smaller defect
sizes.
SAPS Applications
SAPS megasonic
cleaning technology can be applied during the chip fabrication
process to clean wafer surfaces and interconnects. It also can be
used to clean, and lengthen the lifetime of recycled test
wafers.
Wafer Surfaces. SAPS technology can
enhance removal of random defects following planarization and
deposition, which are among the most important, and most repeated,
steps in the fabrication process:
●
Post CMP: Chemical mechanical
planarization, or CMP, uses an abrasive chemical slurry following
other fabrication processes, such as deposition and etching, in
order to achieve a smooth wafer surface in preparation for
subsequent processing steps. SAPS technology can be applied
following each CMP process to remove residual random defects
deposited or formed during CMP.
●
Post Hard Mask Deposition: As part of
the photolithographical patterning process, a mask is applied with
each deposition of a material layer to prevent etching of material
intended to be retained. Hard masks have been developed to etch
high aspect-ratio features of advanced chips that traditional masks
cannot tolerate. SAPS technology can be applied following each
deposition step involving hard masks that use nitride, oxide or
carbon based materials to achieve higher etch selectivity and
resolution.
4
For these purposes,
SAPS technology uses environmentally-friendly dilute chemicals,
reducing chemical consumption. Chemical types include dilute
solutions of chemicals used in RCA cleaning, such as dilute
hydrofluoric acid and RCA SC-1 solutions, and, for higher quality
wafer cleaning, functional de-ionized water produced by dissolving
hydrogen, nitrogen or carbon dioxide in water containing a small
amount of chemicals, such as ammonia. Functional water removes
random defects by generating radicals, and megasonic excitation can
be used in conjunction with functional water to further increase
the generation of radicals. Functional water has a lower cost and
environmental impact than RCA solutions, and using functional water
is more efficient in eliminating random defects than using dilute
chemicals or de-ionized water alone. We have shown that SAPS
megasonic technology using functional water exhibits high
efficiency in removing random defects, especially particles smaller
than 65nm, with minimal damage to structures.
Interconnects and Barrier Metals. Each
successive advanced process node has led to finer feature sizes of
interconnects such as contacts, which form electrical pathways
between a transistor and the first metal layer, and vias, which
form electrical pathways between two metal layers. Advanced nodes
have also resulted in higher aspect ratios for interconnect
structures, with thinner, redesigned metal barriers being used to
prevent diffusion. SAPS technology can improve the removal of
residues and other random defects from interconnects during the
chip fabrication process:
●
Post Contact/Via Etch: Wet etching
processes are commonly used to create patterns of high-density
contacts and vias. SAPS technology can be applied after each such
etching process to remove random defects that could otherwise lead
to electrical shorts.
●
Pre Barrier Metal Deposition: Copper
wiring requires metal diffusion barriers at the top of via holes to
prevent electrical leakage. SAPS technology can be applied prior to
deposition of barrier metal to remove residual oxidized copper,
which otherwise would adhere poorly to the barrier and impair
performance.
For these
applications, SAPS technology uses environmentally friendly dilute
chemicals such as dilute hydrofluoric acid, RCA SC-1 solution,
ozonated de-ionized water and functional de-ionized water with
dissolved hydrogen. These chemical solutions take the place of
piranha solution, a high-temperature mixture of sulfuric acid and
hydrogen peroxide used by conventional wet wafer cleaning
processes. We have shown that SAPS technology exhibits greater
efficiency in removing random defects, and lower levels of material
loss, than conventional processes, and our chemical solutions are
less expensive and more environmentally conscious than piranha
solution.
Recycled Test Wafers. In addition to
using silicon wafers for chip production, chip manufacturers
routinely process wafers through a limited portion of the front-end
fabrication steps in order to evaluate the health, performance and
reliability of those steps. Manufacturers also use wafers for
non-product purposes such as inline monitoring. Wafers used for
purposes other than manufacturing revenue products are known as
test wafers, and it is typical for twenty to thirty percent of the
wafers circulating in a fab to be test wafers. In light of the
significant cost of wafers, manufacturers seek to re-use a test
wafer for more than one test. As test wafers are recycled, surface
roughness and other defects progressively impair the ability of a
wafer to complete tests accurately. SAPS technology can be applied
to reduce random defect levels of a recycled wafer, enabling the
test wafer to be reclaimed for use in additional testing processes.
For these purposes, SAPS technology includes improved fan filter
units that balances intake and exhaust flows, precise temperature
and concentration controls that ensure better handling of
concentrated acid processes, and two-chemical recycle capability
that reduces chemical consumption.
SAPS Equipment
 |
We currently offer
two principal models of wet wafer cleaning equipment based on our
SAPS technology, Ultra C SAPS II and Ultra C SAPS V. Each of these
models is a single-wafer, serial-processing tool that can be
configured to customer specifications and, in conjunction with
appropriate dilute chemicals, used to remove random defects from
wafer surfaces or interconnects and barrier metals as part of the
chip front-end fabrication process or for recycling test wafers. By
combining our megasonic and chemical cleaning technologies, we have
designed these tools to remove random defects with greater efficacy
and efficiency than conventional wafer cleaning processes, with
enhanced process flexibility and reduced quantities of chemicals.
Each of our SAPS models was initially built to meet specific
requirements of a key customer. The sales prices of our SAPS tools
generally range between $2.5 million and $5.0 million, although the
sales price of a particular tool will vary depending upon the
required specifications.
|
5
SAPS II (released in 2011). Highlights
of our SAPS II equipment include:
 |
● compact design,
with footprint of 2.65m x 4.10m x 2.85m (WxDxH), requiring limited
clean room floor space;
● up to 8 chambers,
providing throughput of up to 225 wafers per hour;
● double-sided
cleaning capability, with up to 5 cleaning chemicals for process
flexibility;
● 2-chemical
recycling capability for reduced chemical consumption;
● image wafer
detection method for lowering wafer breakage rates;
and
● chemical delivery
module for delivery of dilute hydrofluoric acid, RCA SC-1 solution,
functional de-ionized water and carbon dioxide to each of the
chambers.
|
SAPS V (released in 2014). SAPS V includes SAPS II features with
the following upgrades:
 |
● compact design,
with footprint of 2.55m x 5.1m x 2.85m (WxDxH);
● up to 12 chambers,
providing throughput of up to 375 wafers per hour;
● chemical supply
system integrated into mainframe;
● inline mixing
method replaces tank auto-changing, reducing process time;
and
● improved drying
technology using hot isopropyl alcohol and de-ionized
water.
|
|
|
|
 |
TEBO Technology,
Applications and Equipment
|
TEBO Technology
We developed TEBO
technology for application in wet wafer cleaning during the
fabrication of 2D and 3D wafers with fine feature sizes. TEBO
technology facilitates effective cleaning even with patterned
features too small or fragile to be addressed by conventional jet
spray and megasonic cleaning technologies.
TEBO technology
solves the problems created by transient cavitation in conventional
megasonic cleaning processes. Cavitation is the formation of
bubbles in a liquid, and transient cavitation is a process in which
a bubble in fluid implodes or collapses. In conventional megasonic
cleaning processes, megasonic energy forms bubbles and then causes
those bubbles to implode or collapse, blasting destructive
high-pressure, high-temperature micro jets toward the wafer
surface. Our internal testing has confirmed that at any level of
megasonic energy capable of removing random defects, the sonic
energy and mechanical force generated by transient cavitation are
sufficiently strong to damage fragile patterned structures with
features less than 70nm.
6
TEBO technology
provides multi-parameter control of cavitation by using a sequence
of rapid changes in pressure to force a bubble in liquid to
oscillate at controlled sizes, shapes and temperatures, rather than
implode or collapse. As a result, cavitation remains stable during
TEBO megasonic cleaning processes, and a chip fabricator can, using
TEBO technology, apply the level of megasonic energy needed to
remove random defects without incurring the pattern damage created
by transient cavitation in conventional megasonic
cleaning.
We have
demonstrated the damage-free cleaning capabilities of TEBO
technology on customers’ patterned wafers as small as 1xnm
(16nm to 19nm), and we believe TEBO technology will be applicable
in even smaller fabrication process nodes. TEBO technology can be
applied in manufacturing processes for conventional 2D chips with
fine features and advanced chips with 3D structures, including Fin
Field Effect Transistors or FinFET, DRAM, 3D NAND and 3D cross
point memory, and we expect it will be applicable to other 3D
architectures developed in the future, such as carbon nanotubes and
quantum devices. As a result of the thorough, controlled nature of
TEBO processes, cleaning time for TEBO-based solutions may take
longer than conventional megasonic cleaning processes. Conventional
processes have proven ineffective, however, for process nodes of
20nm or less, and we believe the increased yield that can be
achieved by using TEBO technology for nodes up to 70nm can more
than offset the cost of the additional time in utilizing TEBO
technology.
TEBO Applications
At process nodes of
28nm and less, chip makers face escalating challenges in
eliminating nanometric particles and maintaining the condition of
inside pattern surfaces. In order to maintain chip quality and
avoid yield loss, cleaning technologies must control random defects
of diminishing killer defect sizes, without roughing or otherwise
damaging surfaces of transistors, interconnects or other wafer
features. TEBO technology can be applied in numerous steps
throughout the manufacturing process flow for effective,
damage-free cleaning:
●
Memory Chips: We estimate that TEBO
technology can be applied in as many as 50 steps in the fabrication
of a DRAM chip, consisting of up to 10 steps in cleaning ISO
structures, 20 steps in cleaning buried gates, and 20 steps in
cleaning high aspect-ratio storage nodes and stacked
films.
●
Logic Chips: In the fabrication process
for a logic chip with a FinFET structure, we estimate that TEBO
technology can be used in 15 or more cleaning steps.
For purposes of
solving inside pattern surface conditions for memory or logic
chips, TEBO technology uses environmentally friendly dilute
chemicals such as RCA SC-1 and hydrogen gas doped functional
water.
TEBO Equipment
We currently offer
two models of wet wafer cleaning equipment based on our TEBO
technology, Ultra C TEBO II and Ultra C TEBO V. Each
of these models is a single-wafer, serial-processing tool that can
be configured to customer specifications and, in conjunction with
appropriate dilute chemicals, used at numerous manufacturing
processing steps for effective, damage-free cleaning of chips at
process nodes 28nm or less. TEBO equipment solves the problem of
pattern damage caused by transient cavitation in conventional jet
spray and megasonic cleaning processes, providing better particle
removal efficiency with limited material loss or roughing. TEBO
equipment currently is being evaluated by a select group of leading
memory and logic chip customers, some of which recently have
indicated an intent to move to production. The sales prices of our
TEBO tools generally range between $3.5 million and $6.5 million,
although the sales price of a particular tool will vary depending
upon the required specifications.
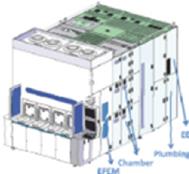
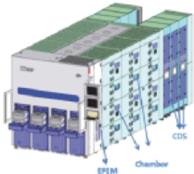
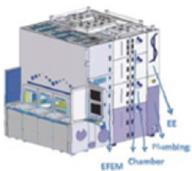
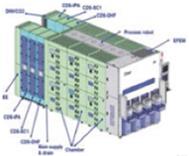
Each model of TEBO
equipment includes:
 |
● an equipment
front-end module, or EFEM, which moves wafers from chamber to
chamber;
● one or more chamber
modules, each equipped with a TEBO megasonic generator
system;
● an electrical
module to provide power for the tool; and
● a chemical delivery
module.
|
7
Ultra C TEBO II (released in
2016). Highlights:
 |
● compact
design, with footprint of 2.25m x 2.25m x 2.85m
(WxDxH);
● up to
8 chambers with an upgraded transport system and optimized robotic
scheduler, providing throughput of up to 300 wafers per
hour;
● EFEM
module consisting of 4 load ports, transfer robot and 1 process
robot; and
● focus
on dilute chemicals contributes to environmental sustainability and
lower cost of ownership.
|
Ultra C TEBO V (released in 2016).
Highlights of our Ultra C TEBO V equipment
include:
 |
● footprint
of 2.45m x 5.30m x 2.85m (WxDxH);
● up to
12 chamber modules, providing throughput of up to 300 wafers per
hour;
● EFEM
module consisting of 4 load ports, 1 transfer robot and
1 process robot; and
● chemical
delivery module for delivery of isopropyl alcohol, dilute
hydrofluoric acid, RCA SC-1 solution, functional de-ionized water
and carbon dioxide to each of the chambers.
|
Tahoe
Overview
Our Ultra-C Tahoe
wafer cleaning tool can deliver high cleaning performance using
significantly less sulfuric acid and hydrogen peroxide than is
typically consumed by conventional high-temperature single-wafer
cleaning tools. During normal single-wafer cleaning processes, only
a fraction of the acid reacts with the wafer surface, while the
majority is wasted as acid spins off the wafer and cannot be
recycled. In addition to providing cost savings resulting from
vastly reduced acid consumption, Ultra-C Tahoe meets the needs of
customers who face increased environmental regulations and demand
new, more environmentally-friendly tools. We announced our first
purchase order for an Ultra C Tahoe tool in August 2018, and we
delivered the tool to a strategic customer in January of
2019.
Single-Wafer Tools for Back-End Assembly and Packaging
We leverage our
technology and expertise to provide a range of single-wafer tools
for back-end wafer assembly and packaging factories. We develop,
manufacture and sell a wide range of advanced packaging tools, such
as coaters, developers, photoresist strippers, scrubbers, wet
etchers and copper-plating tools. We focus on providing
custom-made, differentiated equipment that incorporates
customer-requested features at a competitive price. Selling prices
for these tools range from approximately $500,000 to more than
$2 million.
 |
For example, our
Ultra C Coater is used in applying photoresist, a light-sensitive
material used in photolithography to transfer a pattern from a mask
onto a wafer. Coaters typically provide input and output elevators,
shuttle systems and other devices to handle and transport wafers
during the coating process. Unlike most coaters, the Ultra C Coater
is fully automated. Based on requests from customers, we developed
and incorporated the special function of chamber auto-clean module
into the Ultra C Coater, which further differentiates it from other
products in the market. The Ultra C Coater is designed to deliver
improved throughput and more efficient tool utilization while
eliminating particle generation.
|
8
Our other advanced
packaging tools include: Ultra C Developer, which applies
liquid developer to selected parts of photoresist to resolve an
image; Ultra C PR Megasonic-Assisted Stripper, which removes
photoresist; Ultra C Scrubber, which scrubs and cleans wafers;
and Ultra C Thin Wafer Scrubber, which addresses a sub-market
of cleaning very thin wafers for certain Asian assembly factories;
and Ultra C Wet Etcher, which etches silicon wafers and copper
and titanium interconnects.
Our
Customers
As of December 31, 2018, chip fabricators
had purchased and deployed more than 55 of our single-wafer wet
cleaning tools. To date, all of our sales of single-wafer wet
cleaning equipment for front-end manufacturing have been to
customers located in Asia, and we anticipate that a substantial
majority of our revenue from these products will continue to come
from customers located in this region for the near future. We have
increased our efforts to penetrate the markets in North America and
Western Europe, and we believe we are well positioned to begin
generating sales in those regions.
We generate most of
our revenue from a limited number of customers as the result of our
strategy of initially placing single-wafer wet cleaning equipment
with a small number of leading chip manufacturers that are driving
technology trends and key capability implementation. In 2018, 85.7%
of our revenue was derived from three customers: Yangtze Memory
Technologies Co., Ltd., a leading PRC memory chip company, together
with one of its subsidiaries, accounted for 38.8% of our revenue;
Shanghai Huali Microelectronics Corporation, a leading PRC foundry,
accounted for 23.6% of our revenue; and SK Hynix Inc., a leading
Korean memory chip company, accounted for 23.3% of our revenue. In
2017, 55.2% of our revenue was derived from four customers: SK
Hynix Inc. accounted for 18.1% of our revenue; Shanghai Integrated
Circuit Research and Development Center Ltd., a public research
consortia for the Chinese semiconductor industry, accounted for
14.1% of our revenue; JiangYin ChangDian Advanced Packaging Co.
Ltd., a leading PRC foundry, accounted for 12.8% of our revenue;
and Yangtze Memory Technologies Co., Ltd., together with one of its
subsidiaries, accounted for 10.2% of our revenue.
Based on our market
experience, we believe that implementation of our single-wafer wet
cleaning equipment by one of our selected chip manufacturers will
attract and encourage other manufacturers to evaluate our
equipment, because the leading company’s implementation will
serve as validation of our equipment and could enable the other
manufacturers to shorten their evaluation processes. We placed our
first SAPS tool in 2009 as a prototype. We worked closely with the
customer for two years in debugging and modifying the tool, and the
customer then spent two more years of qualification and running
pilot production before beginning volume manufacturing. Our revenue
in 2015 included sales of SAPS tools following the customer’s
completion of its qualification process. We believe that the period
from new product introduction to high volume manufacturing could
range from one to several years.
For our back-end
wafer assembly and packaging customers, we focus on providing
custom-made, differentiated single wafer wet cleaning equipment
that incorporates a customer’s requested features at a
competitive price. Our primary customers of these products in 2018
included: Deca Technologies, a wafer-level interconnect foundry
with headquarters in Arizona and manufacturing in the Phillipines
that is a majority-owned, independent subsidiary of Cypress
Semiconductor Corp.; JiangYin ChangDian Advanced Packaging Co.
Ltd., a leading PRC foundry that is also one of the largest
customers of our front end of line equipment; Nantong Tongfu
Microelectronics Co., Ltd., a PRC-based chip assembly and testing
company that is a subsidiary of Nantong Fujitsu Microelectronics
Co., Ltd.; and Wafer Works Corporation, a leading wafer supplier
based in the PRC.
Sales
and Marketing
We market and sell
our products worldwide using a combination of our direct sales
force and third-party representatives. We employ direct sales teams
in Asia, Europe and North America, and have located these teams
near our customers, primarily in the PRC, Korea, Taiwan and the
United States. Each sales person has specific local market
expertise. We also employ field application engineers, who are
typically co-located with our direct sales teams, to provide
technical pre- and post-sale support tours and other assistance to
existing and potential customers throughout the customers’
fab planning and production line qualification and fab expansion
phases. Our field application engineers are organized by end
markets as well as core competencies in hardware, control system,
software and process development to support our
customers.
9
To supplement our
direct sales teams, we have contacts with several independent sales
representatives in the PRC, Taiwan and Korea. We select these
independent representatives based on their ability to provide
effective field sales, marketing forecast and technical support for
our products. In the case of representatives, our customers place
purchase orders with us directly rather than with the
representatives.
Our sales have
historically been made using purchase orders with agreed technical
specifications. Our sales terms and conditions are generally
consistent with industry practice, but may vary from customer to
customer. We seek to obtain a purchase order two to four months
ahead of the customer’s desired delivery date. For some
customers, we receive a letter of intent three weeks ahead,
followed by the corresponding purchase order five weeks ahead, of
the customer’s desired delivery date. Consistent with
industry practice, we allow customers to reschedule or cancel
orders on relatively short notice. Because of our relatively short
delivery period and our practice of permitting rescheduling or
cancellation, we believe that backlog is not a reliable indicator
of our future revenue.
Our marketing team
focuses on our product strategy and technology road maps, product
marketing, new product introduction processes, demand assessment
and competitive analysis, customer requirement communication and
public relations. Our marketing team also has the responsibility to
conduct environmental scans, study industry trends and arrange our
participation at major trade shows.
Manufacturing
All of our products
are built to order at our Shanghai facilities. Our first
manufacturing facility has a total of 36,000 square feet, with
8,000 square feet of class 10,000 clean room space for product
assembly and testing, plus 800 square feet of class 1 clean room
space for product demonstration purposes. The rest of the area is
used for product sub-assembly, component inventory and
manufacturing related offices. A class designation for a clean room
denotes the number of particles of size 0.5mm or larger permitted
per cubic foot of air. Our manufacturing facility is ISO-9000
certified, and we have implemented certain manufacturing
science-based factory practices such as constraint management,
statistical process control and failure mode and effect analysis
methodology.
In September 2018,
we began production at our second factory, located ten miles from
our Shanghai headquarters. The new facility provides an additional
50,000 square feet of floor space for production capacity. We plan
to shift an increasing portion of our future production to this
factory based on its modernized capabilities.
We purchase some of
the components and assemblies that we include in our products from
single source suppliers. We believe that we could obtain and
qualify alternative sources to supply these components.
Nevertheless, any prolonged inability to obtain these components
could have an adverse effect on our operating results and could
unfavorably impact our customer relationships. Please see
“Item 1A. Risk Factors—Risks Related to Our Business
and Our Industry—We depend on a limited number of suppliers,
including single source suppliers, for critical components and
assemblies, and our business could be disrupted if they are unable
to meet our needs.”
Research
and Development
We believe that our
success depends in part on our ability to develop and deliver
breakthrough technologies and capabilities to meet our
customers’ ever-more challenging technical requirements. For
this reason, we devote significant financial and personnel
resources to research and development. Our research and development
team is comprised of highly skilled engineers and technologists
with extensive experience in megasonic technology, cleaning
processes and chemistry, mechanical design, and control system
design. To supplement our internal expertise, we also collaborated
with external research and development entities such as
International SEMATECH, a global consortium of computer chip
manufacturers, on specific areas of interests and retain, as
technical advisors, several experts in semiconductor
technology.
10
For the foreseeable
future we are focusing on enhancing our Ultra C SAPS, TEBO and
Tahoe tools and integrating additional capabilities to meet and
anticipate requirements from our existing and potential customers.
Our particular areas of focus include development of the
following:
●
new cleaning steps
for Ultra C SAPS cleaners for application in logic chips and
for DRAM, 3D NAND and 3D cross point memory
technologies;
●
new cleaning steps
for Ultra C TEBO cleaners for FinFET in logic chips, gates in
DRAM, and deep vias in both 3D NAND and 3D cross point memory
technologies;
●
new hardware,
including new system platforms, new and additional chamber
structures and new chemical blending systems; and
●
new software to
integrate new functionalities to improve tool
performance.
Longer term, we are
working on new proprietary process capabilities based on our
existing tool hardware platforms. We are also working to integrate
our tools with third-party tools in adjacent process areas in the
chip manufacturing flow. Our research and development expense
totaled $10.4 million, or 13.9% of revenue in 2018 and
$5.1 million, or 14.1% of revenue in 2017. We intend to
continue to invest in research and development to support and
enhance our existing cleaning products and to develop future
product offerings to build and maintain our technology leadership
position.
Intellectual
Property
Our success and
future revenue growth depend, in part, on our ability to protect
our intellectual property. We control access to and use of our
proprietary technologies, software and other confidential
information through the use of internal and external controls,
including contractual protections with employees, consultants,
advisors, customers, partners and suppliers. We rely primarily on
patent, copyright, trademark and trade secret laws, as well as
confidentiality procedures, to protect our proprietary technologies
and processes. All employees and consultants are required to
execute confidentiality agreements in connection with their
employment and consulting relationships with us. We also require
them to agree to disclose and assign to us all inventions conceived
or made in connection with the employment or consulting
relationship.
We have
aggressively pursued intellectual property since our founding in
1998. We focus our patent efforts in the United States, and, when
justified by cost and strategic importance, we file corresponding
foreign patent applications in strategic jurisdictions such as the
European Union, the PRC, Japan, Korea, Singapore, and Taiwan. Our
patent strategy is designed to provide a balance between the need
for coverage in our strategic markets and the need to maintain
costs at a reasonable level.
As of December 31,
2018, we had 20 issued patents, and 20 patents pending, in the
United States. These patents carry expiration dates from 2022
through 2038. Many of the US patents and applications have also
been filed internationally, in one or more of the European Union,
PRC, Japan, Korea, Singapore and Taiwan. Specifically, we own
patents in wafer cleaning, electro-polishing and plating, wafer
preparation, and other semiconductor processing technologies. We
have been issued more than 220 patents in the United States, the
People’s Republic of China or PRC, Japan, Korea, Singapore
and Taiwan.
We currently
manufacture advanced single-wafer cleaning systems equipped with
our SAPS, TEBO and Tahoe technologies. Our wafer cleaning
technologies are protected by US Patent Numbers 8580042, 8671961,
9070723 and 9281177, as well as their corresponding international
patents. We have 31 patents granted internationally protecting our
SAPS technologies. We also have filed 9 international patent
applications for key TEBO technologies, and 2 for Tahoe, in
accordance with the Patent Cooperation Treaty, in anticipation of
filing in the U.S. national phase.
In addition to the
above core technologies, we have technologies for stress-free
polishing, or SFP, and electrochemical plating, or ECP, that are
used in certain of our tools. SFP is an integral part of the
electro polishing process. Our technology was a breakthrough in
electro-chemical-copper-planarization technology when it was first
introduced, because it can polish, stress-free, copper layers used
in copper low-K interconnects. Our innovations in SFP and ECP are
reflected in US Patent Numbers 6638863 and 8518224, and their
corresponding international counterparts.
11
We also have
technologies in other semiconductor processing areas, such as wafer
preparation and some specific processing steps. The wafer
preparation technology is covered by US Patent Numbers 8383429 and
9295167. The specific processing steps includes US Patent Number
8598039 titled “Barrier layer removal method and
apparatus.”
To date we have not
granted licenses to third parties under the patents described
above. Not all of these patents have been implemented in products.
We may enter into licensing or cross-licensing arrangements with
other companies in the future.
We cannot assure
you that any patents will issue from any of our pending
applications. Any rights granted under any of our existing or
future patents may not provide meaningful protection or any
commercial advantage to us. With respect to our other proprietary
rights, it may be possible for third parties to copy or otherwise
obtain and use our proprietary technology or marks without
authorization or to develop similar technology
independently.
The semiconductor
equipment industry is characterized by vigorous protection and
pursuit of intellectual property rights or positions, which have
resulted in often protracted and expensive litigation. We may in
the future initiate claims or litigation against third parties to
determine the validity and scope of proprietary rights of others.
In addition, we may in the future initiate litigation to enforce
our intellectual property rights or the rights of our customers or
to protect our trade secrets.
Our customers could
become the target of litigation relating to the patent or other
intellectual property rights of others. This could trigger
technical support and indemnification obligations in some of our
customer agreements. These obligations could result in substantial
expenses, including the payment by us of costs and damages related
to claims of patent infringement. In addition to the time and
expense required for us to provide support or indemnification to
our customers, any such litigation could disrupt the businesses of
our customers, which in turn could hurt our relations with our
customers and cause the sale of our products to decrease. We do not
have any insurance coverage for intellectual property infringement
claims for which we may be obligated to provide
indemnification.
Additional
information about the risks relating to our intellectual property
is provided under “Item 1A. Risk Factors—Risks Relating
to Our Intellectual Property.”
Competition
The chip equipment
industry is characterized by rapid change and is highly competitive
throughout the world. We compete with semiconductor equipment
companies located around the world, and we may also face
competition from new and emerging companies, including new
competitors from the PRC. We consider our principal competitors to
be those companies that provide single-wafer cleaning products to
the market, including Beijing Sevenstar Science &
Technology Co., Ltd., DNS Electronics LLC, Lam Research Corp.,
Mujin Electronics Co., Ltd., SEMES Co. Ltd. and Tokyo Electron
Ltd.
Compared to our
company, our current and potential competitors may
have:
●
better established
credibility and market reputations, longer operating histories, and
broader product offerings;
●
significantly
greater financial, technical, marketing and other resources, which
may allow them to pursue design, development, manufacturing, sales,
marketing, distribution and service support of their
products;
●
more extensive
customer and partner relationships, which may position them to
identify and respond more successfully to market developments and
changes in customer demands; and
●
multiple product
offerings, which may enable them to offer bundled discounts for
customers purchasing multiple products or other incentives that we
cannot match or offer.
The principal
competitive factors in our market include:
●
performance of
products, including particle removal efficiency, rate of damage to
wafer structures, high temperature chemistry, throughput, tool
uptime and reliability, safety, chemical waste treatment, and
environmental impact;
●
service support
capability and spare parts delivery time; innovation and
development of functionality and features that are must-haves for
advanced fabrication nodes;
12
●
ability to
anticipate customer requirements, especially for advanced process
nodes of less than 45nm; ability to identify new process
applications;
●
brand recognition
and reputation; and
●
skill and
capability of personnel, including design engineers, manufacturing
engineers and technicians, application engineers, and service
engineers.
In addition,
semiconductor manufacturers must make a substantial investment to
qualify and integrate new equipment into semiconductor production
lines. Some manufacturers began fabricating chips for the 10nm node
in 2017 and the 7nm node in 2018, and we have one customer that
currently is evaluating implementation of our equipment at these
nodes. Once a semiconductor manufacturer has selected a particular
supplier’s equipment and qualified it for production, the
manufacturer generally maintains that selection for that specific
production application and technology node as long as the
supplier’s products demonstrate performance to specification
in the installed base. Accordingly, we may experience difficulty in
selling to a given manufacturer if that manufacturer has qualified
a competitor’s equipment. If, however, that cleaning
equipment constrains chip yield, we expect, based on our experience
to date, that the manufacturer will evaluate implementing new
equipment that cleans more effectively.
We focus on the
high-end fabrication market with advanced nodes, and we believe we
compete favorably with respect to the factors described above. Most
of our competitors offer single-wafer cleaning products using jet
spray technology, which has relatively poor particle removal
efficiency for random defects less than 30nm in size and presents
increased risk of damage to the fragile patterned architectures of
wafers at advanced process nodes. Certain of our competitors offer
single-wafer cleaning products with megasonic cleaning capability,
but we believe these products, which use conventional megasonic
technology, are unable to maintain energy dose uniformity on the
entire wafer and often lack the ability to repeat the requisite
uniform energy dose wafer to wafer in production, resulting in poor
efficiency in removing random defects, longer processing time and
greater loss of material. In addition, these conventional megasonic
products generate transient cavitation, which results in more
incidents of damage to wafer structures with feature sizes of 70nm
or less. We design our cleaning tools equipped with our proprietary
SAPS, TEBO and Tahoe technologies, which we believe offer better
performance, much less chemical consumption, and lower cost of
consumables, including at advanced process nodes of 22nm or
less.
Employees
As of December 31,
2018, we had 273 full-time equivalent employees, of whom 22 were in
administration, 84 were in manufacturing, 96 were in research and
development, and 71 were in sales and marketing and
customer services. Of these employees, 253 were located in the
mainland China and Taiwan, 17 were located in Korea and 3 were
based in the United States. We have never had a work stoppage, and
none of our employees are represented by a labor organization or
subject to any collective bargaining arrangements. We consider our
employee relations to be good.
Available
Information
We are required to
file annual, quarterly and current reports, proxy statements and
other information with the SEC. The SEC maintains a website at
www.sec.gov that contains reports, proxy and information
statements, and other information regarding issuers that file
electronically with the SEC.
Our Annual Reports
on Form 10-K, Quarterly Reports on Form 10-Q, Current Reports on
Form 8-K, proxy statements and amendments to those documents filed
or furnished pursuant to Section 13(a) or 15(d) of the Securities
Exchange Act of 1934, or the Exchange Act, are also available free
of charge on our website at www.americanrenal.com as soon as
reasonably practicable after such reports are electronically filed
with or furnished to the SEC.
Investors should
note that we currently announce material information to our
investors and others using filings with the SEC, press releases,
public conference calls, webcasts or our website (www.acmrcsh.com),
including news and announcements regarding our financial
performance, key personnel, our brands and our business strategy.
Information that we post on our corporate website could be deemed
material to investors. We encourage investors to review the
information we post on these channels. We may from time to time
update the list of channels we will use to communicate information
that could be deemed material and will post information about any
such change on www.acmrcsh.com. The information on our website is
not, and shall not be deemed to be, a part hereof or incorporated
into this or any of our other filings with the SEC.
13
Item
1A.
Risk
Factors
Investing in Class A common stock involves a high degree of risk.
You should consider and read carefully all of the risks and
uncertainties described below, as well as other information
contained in this report, including the consolidated financial
statements and related notes set forth in “Item 1. Financial
Statements” of Part I above, before making an investment
decision. The occurrence of any of the following risks or
additional risks and uncertainties not presently known to us or
that we currently believe to be immaterial could materially and
adversely affect our business, financial condition, results of
operations or cash flows. In any such case, the trading price of
Class A common stock could decline, and you may lose all or part of
your investment. This report also contains forward-looking
statements and estimates that involve risks and uncertainties. Our
actual results could differ materially from those anticipated in
the forward-looking statements as a result of specific factors,
including the risks and uncertainties described below.
Risks
Related to Our Business and Our Industry
We have incurred significant losses since our inception and we are
uncertain about our future profitability.
We have incurred
significant losses since our inception in 1998, and as of December
31, 2018 we had an accumulated deficit of $3.4 million. We may not
be able to generate sufficient revenue to achieve and sustain
profitability. We expect our costs to increase in future periods,
which could negatively affect our future operating results if our
revenue does not increase. In particular, we expect to continue to
expend substantial financial and other resources on:
●
research and
development, including continued investments in our research and
development team;
●
sales and
marketing, including a significant expansion of our sales
organization, both domestically and internationally, building our
brand, and providing our single-wafer wet cleaning equipment and
other capital equipment, or tools, for evaluation by
customers;
●
the cost of goods
being manufactured and sold for our installed base;
●
expansion of field
service; and
●
general and
administrative expenses, including legal and accounting expenses
related to being a public company.
These investments
may not result in increased revenue or growth in our business. If
we are unable to increase our revenue at a rate sufficient to
offset the expected increase in our costs, then our business,
financial position and results of operations will be harmed and we
may not be able to achieve or maintain profitability over the long
term. Additionally, we may encounter unforeseen operating expenses,
difficulties, complications, delays and other factors that may
result in losses in future periods. If our revenue growth does not
meet our expectations in future periods, our financial performance
may be harmed and we may not achieve or maintain profitability in
the future.
We currently have limited revenue and may not be able to regain or
maintain profitability.
To date we have
only generated limited revenue from sales of our products. Our
revenue totaled $74.6 million in 2018 and $36.5 million in 2017. In
2018 we generated net income of $6.6 million, as compared to an
operating loss of $872,000 in 2017. Our ability to generate
significant revenue and operate profitably depends upon our ability
to commercialize our Ultra C single-wafer wet cleaning equipment.
Our ability to generate significant product revenue from our
current tools or future tool candidates also depends on a number of
additional factors, including our ability to:
●
achieve market
acceptance of Ultra C equipment based on SAPS, TEBO and Tahoe
technology;
●
increase our
customer base, including the establishment of relationships with
companies in the United States;
●
continue to expand
our supplier relationships with third parties; and
●
establish and
maintain our reputation for providing efficient on-time delivery of
high quality products.
If we fail to
regain and sustain profitability on a continuing basis, we may be
unable to continue our operations at planned levels and be forced
to reduce our operations or even shut down.
14
We may require additional capital in the future and we cannot give
any assurance that such capital will be available at all or
available on terms acceptable to us and, if it is available,
additional capital raised by us may dilute holders of Class A
common stock.
We may need to
raise funds in the future, depending on many factors,
including:
●
our sales
growth;
●
the costs of
applying our existing technologies to new or enhanced
products;
●
the costs of
developing new technologies and introducing new
products;
●
the costs
associated with protecting our intellectual property;
●
the costs
associated with our expansion, including capital expenditures,
increasing our sales and marketing and service and support efforts,
and expanding our geographic operations;
●
our ability to
continue to obtain governmental subsidies for developmental
projects in the future;
●
future debt
repayment obligations; and
●
the number and
timing of any future acquisitions.
To the extent that
our existing sources of cash, together with any cash generated from
operations, are insufficient to fund our activities, we may need to
raise additional funds through public or private financings,
strategic relationships, or other arrangements. Additional funding
may not be available to us on acceptable terms or at all. If
adequate funding is not available, we may be required to reduce
expenditures, including curtailing our growth strategies and
reducing our product development efforts, or to forego acquisition
opportunities.
If we succeed in
raising additional funds through the issuance of equity or
convertible securities, then the issuance could result in
substantial dilution to existing stockholders. Furthermore, the
holders of these new securities or debt may have rights,
preferences and privileges senior to those of the holders of Class
A common stock. In addition, any preferred equity issuance or debt
financing that we may obtain in the future could have restrictive
covenants relating to our capital raising activities and other
financial and operational matters, which may make it more difficult
for us to obtain additional capital and to pursue business
opportunities, including potential acquisitions.
Our quarterly operating results can be difficult to predict and can
fluctuate substantially, which could result in volatility in the
price of Class A common stock.
Our quarterly
revenue and other operating results have varied in the past and are
likely to continue to vary significantly from quarter to quarter.
Accordingly, you should not rely upon our past quarterly financial
results as indicators of future performance. Any variations in our
quarter-to-quarter performance may cause our stock price to
fluctuate. Our financial results in any given quarter can be
influenced by a variety of factors, including:
●
the cyclicality of
the semiconductor industry and the related impact on the purchase
of equipment used in the manufacture of integrated circuits, or
chips;
●
the timing of
purchases of our tools by chip fabricators, which order types of
tools based on multi-year capital plans under which the number and
dollar amount of tool purchases can vary significantly from year to
year;
●
the relatively high
average selling price of our tools and our dependence on a limited
number of customers for a substantial portion of our revenue in any
period, whereby the timing and volume of purchase orders or
cancellations from our customers could significantly reduce our
revenue for that period;
●
the significant
expenditures required to customize our products often exceed the
deposits received from our customers;
●
the lead time
required to manufacture our tools;
●
the timing of
recognizing revenue due to the timing of shipment and acceptance of
our tools;
●
our ability to sell
additional tools to existing customers;
●
the changes in
customer specifications or requirements;
●
the length of our
product sales cycle;
●
changes in our
product mix, including the mix of systems, upgrades, spare parts
and service;
●
the timing of our
product releases or upgrades or announcements of product releases
or upgrades by us or our competitors, including changes in customer
orders in anticipation of new products or product
enhancements;
15
●
our ability to
enhance our tools with new and better functionality that meet
customer requirements and changing industry trends;
●
constraints on our
suppliers’ capacity;
●
the timing of
investments in research and development related to releasing new
applications of our technologies and new products;
●
delays in the
development and manufacture of our new products and upgraded
versions of our products and the market acceptance of these
products when introduced;
●
our ability to
control costs, including operating expenses and the costs of the
components and subassemblies used in our products;
●
the costs related
to the acquisition and integration of product lines, technologies
or businesses; and
●
the costs
associated with protecting our intellectual property, including
defending our intellectual property against third-party claims or
litigation.
Seasonality has
played an increasingly important role in the market for chip
manufacturing tools. The period of November through February has
been a particularly weak period historically for manufacturers of
chip tools, in part because capital equipment needed to support
manufacturing of chips for the December holidays usually needs to
be in the supply chain by no later than October and chip makers in
Asia often wait until after Chinese New Year, which occurs in
January or February, before implementing their capital acquisition
plans. The timing of new product releases also has an impact on
seasonality, with the acquisition of manufacturing equipment
occurring six to nine months before a new release.
Many of these
factors are beyond our control, and the occurrence of one or more
of them could cause our operating results to vary widely. As a
result, it is difficult for us to forecast our quarterly revenue
accurately. Our results of operations for any quarter may not be
indicative of results for future quarters and quarter-to-quarter
comparisons of our operating results are not necessarily
meaningful. Variability in our periodic operating results could
lead to volatility in our stock price. Because a substantial
proportion of our expenses are relatively fixed in the short term,
our results of operations will suffer if revenue falls below our
expectations in a particular quarter, which could cause the price
of Class A common stock to decline. Moreover, as a result of any of
the foregoing factors, our operating results might not meet our
announced guidance or expectations of public market analysts or
investors, in which case the price of Class A common stock could
decrease significantly.
Cyclicality in the semiconductor industry is likely to lead to
substantial variations in demand for our products, and as a result
our operating results could be adversely affected.
The chip industry
has historically been cyclic and is characterized by wide
fluctuations in product supply and demand. From time to time, this
industry has experienced significant downturns, often in connection
with, or in anticipation of, maturing product and technology
cycles, excess inventories and declines in general economic
conditions. This cyclicality could cause our operating results to
decline dramatically from one period to the next.
Our business
depends upon the capital spending of chip manufacturers, which, in
turn, depends upon the current and anticipated market demand for
chips. During industry downturns, chip manufacturers often have
excess manufacturing capacity and may experience reductions in
profitability due to lower sales and increased pricing pressure for
their products. As a result, chip manufacturers generally sharply
curtail their spending during industry downturns and historically
have lowered their spending more than the decline in their
revenues. If we are unable to control our expenses adequately in
response to lower revenue from our customers, our operating results
will suffer and we could experience operating losses.
Conversely, during
industry upturns we must successfully increase production output to
meet expected customer demand. This may require us or our
suppliers, including third-party contractors, to order additional
inventory, hire additional employees and expand manufacturing
capacity. If we are unable to respond to a rapid increase in demand
for our tools on a timely basis, or if we misjudge the timing,
duration or magnitude of such an increase in demand, we may lose
business to our competitors or incur increased costs
disproportionate to any gains in revenue, which could have a
material adverse effect on our business, results of operations,
financial condition or cash flows.
16
The PRC government
is implementing focused policies, including state-led investment
initiatives, that aim to create and support an independent domestic
semiconductor supply chain spanning from design to final system
production. If these policies, which include loans and subsidies,
result in lower demand for equipment than is expected by equipment
manufacturers, the resulting overcapacity in the chip manufacturing
equipment market could lead to excess inventory and price
discounting that could have a material adverse effect on our
business and operating results.
Our success will depend on industry chip manufacturers adopting our
SAPS, TEBO and Tahoe technologies.
To date our
strategy for commercializing our tools has been to place them with
selected industry leaders in the manufacturing of memory and logic
chips, the two largest chip categories, to enable those leading
manufacturers to evaluate our technologies, and then leverage our
reputation to gain broader market acceptance. In order for these
industry leaders to adopt our tools, we need to establish our
credibility by demonstrating the differentiated, innovative nature
of our SAPS, TEBO and Tahoe technologies. Our SAPS technology has
been tested and purchased by industry leaders, but has not
achieved, and may never achieve, widespread market acceptance. We
have initiated a similar commercialization process for our TEBO
technology with a selected group of industry leaders. If these
leading manufacturers do not agree that our technologies add
significant value over conventional technologies or do not
otherwise accept and use our tools, we may need to spend a
significant amount of time and resources to enhance our
technologies or develop new technologies. Even if these leading
manufacturers adopt our technologies, other manufacturers may not
choose to accept and adopt our tools and our products may not
achieve widespread adoption. Any of the above factors would have a
material adverse effect on our business, results of operations and
financial condition.
If our SAPS, TEBO and Tahoe technologies do not achieve widespread
market acceptance, we will not be able to compete
effectively.
The commercial
success of our tools will depend, in part, on gaining substantial
market acceptance by chip manufacturers. Our ability to gain
acceptance for our products will depend upon a number of factors,
including:
●
our ability to
demonstrate the differentiated, innovative nature of our SAPS, TEBO
and Tahoe technologies and the advantages of our tools over those
of our competitors;
●
compatibility of
our tools with existing or potential customers’ manufacturing
processes and products;
●
the level of
customer service available to support our products;
and
●
the experiences our
customers have with our products.
In addition,
obtaining orders from new customers may be difficult because many
chip manufacturers have pre-existing relationships with our
competitors. Chip manufacturers must make a substantial investment
to qualify and integrate wet processing equipment into a chip
production line. Due, in part, to the cost of manufacturing
equipment and the investment necessary to integrate a particular
manufacturing process, a chip manufacturer that has selected a
particular supplier’s equipment and qualified that equipment
for production typically continues to use that equipment for the
specific production application and process node, which is the
minimum line width on a chip, as long as that equipment continues
to meet performance specifications. Some of our potential and
existing customers may prefer larger, more established vendors from
which they can purchase equipment for a wider variety of process
steps than our tools address. Further, because the cleaning process
with our TEBO equipment can be up to five times longer than
cleaning processes based on other technologies, we must convince
chip manufacturers of the innovative, differentiated nature of our
technologies and the benefits associated with using our tools. If
we are unable to obtain new customers and continue to achieve
widespread market acceptance of our tools, then our business,
operations, financial results and growth prospects will be
materially and adversely affected.
17
If we do not continue to enhance our existing single-wafer wet
cleaning tools and achieve market acceptance, we will not be able
to compete effectively.
We operate in an
industry that is subject to evolving standards, rapid technological
changes and changes in customer demands. Additionally, if process
nodes continue to shrink to ever-smaller dimensions and
conventional two-dimensional chips reach their critical performance
limitations, the technology associated with manufacturing chips may
advance to a point where our Ultra C equipment based on SAPS, TEBO
and Tahoe technologies becomes obsolete. Accordingly, the future of
our business will depend in large part upon the continuing
relevance of our technological capabilities, our ability to
interpret customer and market requirements in advance of tool
deliveries, and our ability to introduce in a timely manner new
tools that address chip makers’ requirements for
cost-effective cleaning solutions. We expect to spend a significant
amount of time and resources developing new tools and enhancing
existing tools. Our ability to introduce and market successfully
any new or enhanced cleaning equipment is subject to a wide variety
of challenges during the tool’s development, including the
following:
●
accurate
anticipation of market requirements, changes in technology and
evolving standards;
●
the availability of
qualified product designers and technologies needed to solve
difficult design challenges in a cost-effective, reliable
manner;
●
our ability to
design products that meet chip manufacturers’ cost, size,
acceptance and specification criteria, and performance
requirements;
●
the ability and
availability of suppliers and third-party manufacturers to
manufacture and deliver the critical components and subassemblies
of our tools in a timely manner;
●
market acceptance
of our customers’ products, and the lifecycle of those
products; and
●
our ability to
deliver products in a timely manner within our customers’
product planning and deployment cycle.
Certain
enhancements to our Ultra C equipment in future periods may reduce
demand for our pre-existing tools. As we introduce new or enhanced
cleaning tools, we must manage the transition from older tools in
order to minimize disruptions in customers’ ordering
patterns, avoid excessive levels of older tool inventories and
ensure timely delivery of sufficient supplies of new tools to meet
customer demand. Furthermore, product introductions could delay
purchases by customers awaiting arrival of our new products, which
could cause us to fail to meet our expected level of production
orders for pre-existing tools.
Our success will depend on our ability to identify and enter new
product markets.
We expect to spend
a significant amount of time and resources identifying new product
markets in addition to the market for cleaning solutions and in
developing new products for entry into these markets. Our TEBO
technology took eight years to develop, and development of any new
technology could require a similar, or even longer, period of time.
Product development requires significant investments in engineering
hours, third-party development costs, prototypes and sample
materials, as well as sales and marketing expenses, which will not
be recouped if the product launch is unsuccessful. We may fail to
predict the needs of other markets accurately or develop new,
innovative technologies to address those needs. Further, we may not
be able to design and introduce new products in a timely or
cost-efficient manner, and our new products may be more costly to
develop, may fail to meet the requirements of the market, or may be
adopted slower than we expect. If we are not able to introduce new
products successfully, our inability to gain market share in new
product markets could adversely affect our ability to sustain our
revenue growth or maintain our current revenue levels.
If we fail to establish and maintain a reputation for credibility
and product quality, our ability to expand our customer base
will be impaired and our operating results may suffer.
We must develop and
maintain a market reputation for innovative, differentiated
technologies and high quality, reliable products in order to
attract new customers and achieve widespread market acceptance of
our products. Our market reputation is critical because we compete
against several larger, more established competitors, many of which
supply equipment for a larger number of process steps than we do to
a broader customer base in an industry with a limited number of
customers. In these circumstances, traditional marketing and
branding efforts are of limited value, and our success depends on
our ability to provide customers with reliable and technically
sophisticated products. If the limited customer base does not
perceive our products and services to be of high quality and
effectiveness, our reputation could be harmed, which could
adversely impact our ability to achieve our targeted
growth.
18
We operate in a highly competitive industry and many of our
competitors are larger, better-established, and have significantly
greater operating and financial resources than we
have.
The chip equipment
industry is highly competitive, and we face substantial competition
throughout the world in each of the markets we serve. Many of our
current and potential competitors have, among other
things:
●
greater financial,
technical, sales and marketing, manufacturing, distribution and
other resources;
●
established
credibility and market reputations;
●
longer operating
histories;
●
broader product
offerings;
●
more extensive
service offerings, including the ability to have large inventories
of spare parts available near, or even at, customer
locations;
●
local sales forces;
and
●
more extensive
geographic coverage.
These competitors
may also have the ability to offer their products at lower prices
by subsidizing their losses in wet cleaning with profits from other
lines of business in order to retain current or obtain new
customers. Among other things, some competitors have the ability to
offer bundled discounts for customers purchasing multiple products.
Many of our competitors have more extensive customer and partner
relationships than we do and may therefore be in a better position
to identify and respond to market developments and changes in
customer demands. Potential customers may prefer to purchase from
their existing suppliers rather than a new supplier, regardless of
product performance or features. If we are not able to compete
successfully against existing or new competitors, our business,
operating results and financial condition will be negatively
affected.
We depend on a small number of customers for a substantial portion
of our revenue, and the loss of, or a significant reduction in
orders from, one of our major customers could have a material
adverse effect on our revenue and operating results. There are also
a limited number of potential customers for our
products.
The chip
manufacturing industry is highly concentrated, and we derive most
of our revenue from a limited number of customers. In 2018, 85.7%
of our revenue was derived from three customers: Yangtze Memory
Technologies Co., Ltd., a leading PRC memory chip company, together
with one of its subsidiaries, accounted for 38.8% of our revenue;
Shanghai Huali Microelectronics Corporation, a leading PRC foundry,
accounted for 23.6% of our revenue; and SK Hynix Inc., a leading
Korean memory chip company, accounted for 23.3% of our revenue. In
2017, 55.2% of our revenue was derived from four customers: SK
Hynix Inc. accounted for 18.1% of our revenue; Shanghai Integrated
Circuit Research and Development Center Ltd., a public research
consortia for the Chinese semiconductor industry, accounted for
14.1% of our revenue; JiangYin ChangDian Advanced Packaging Co.
Ltd., a leading PRC foundry, accounted for 12.8% of our revenue;
and Yangtze Memory Technologies Co., Ltd., together with one of its
subsidiaries, accounted for 10.2% of our revenue.
As a consequence of
the concentrated nature of our customer base, our revenue and
results of operations may fluctuate from quarter to quarter and are
difficult to estimate, and any cancellation of orders or any
acceleration or delay in anticipated product purchases or the
acceptance of shipped products by our larger customers could
materially affect our revenue and results of operations in any
quarterly period.
We may be unable to
sustain or increase our revenue from our larger customers or offset
the discontinuation of concentrated purchases by our larger
customers with purchases by new or existing customers. We expect a
small number of customers will continue to account for a high
percentage of our revenue for the foreseeable future and that our
results of operations may fluctuate materially as a result of such
larger customers’ buying patterns. Thus, our business success
depends on our ability to maintain strong relationships with our
customers. The loss of any of our key customers for any reason, or
a change in our relationship with any of our key customers,
including a significant delay or reduction in their purchases, may
cause a significant decrease in our revenue, which we may not be
able to recapture due to the limited number of potential
customers.
We have seen, and
may see in the future, consolidation of our customer base. Industry
consolidation generally has negative implications for equipment
suppliers, including a reduction in the number of potential
customers, a decrease in aggregate capital spending and greater
pricing leverage on the part of consumers over equipment suppliers.
Continued consolidation of the chip industry could make it more
difficult for us to grow our customer base, increase sales of our
products and maintain adequate gross margins.
19
Our customers do not enter into long-term purchase commitments, and
they may decrease, cancel or delay their projected purchases at any
time.
In accordance with
industry practice, our sales are on a purchase order basis, which
we seek to obtain three to four months in advance of the expected
product delivery date. Until a purchase order is received, we do
not have a binding purchase commitment. Our SAPS and TEBO customers
to date have provided us with non-binding one- to two-year
forecasts of their anticipated demands, but those forecasts can be
changed at any time, without any required notice to us. Because the
lead-time needed to produce a tool customized to a customer’s
specifications can extend up to six months, we may need to begin
production of tools based on non-binding forecasts, rather than
waiting to receive a binding purchase order. No assurance can be
made that a customer’s forecast will result in a firm
purchase order within the time period we expect, or at
all.
If we do not
accurately predict the amount and timing of a customer’s
future purchases, we risk expending time and resources on producing
a customized tool that is not purchased by a particular customer,
which may result in excess or unwanted inventory, or we may be
unable to fulfill an order on the schedule required by a purchase
order, which would result in foregone sales. Customers may place
purchase orders that exceed forecasted amounts, which could result
in delays in our delivery time and harm our reputation. In the
future a customer may decide not to purchase our tools at all, may
purchase fewer tools than it did in the past or may otherwise alter
its purchasing patterns, and the impact of any such actions may be
intensified given our dependence on a small number of large
customers. Our customers make major purchases periodically as they
add capacity or otherwise implement technology upgrades. If any
significant customers cancel, delay or reduce orders, our operating
results could suffer.
We may incur significant expenses long before we can recognize
revenue from new products, if at all, due to the costs and length
of research, development, manufacturing and customer evaluation
process cycles.
We often incur
significant research and development costs for products that are
purchased by our customers only after much, or all, of the cost has
been incurred or that may never be purchased. We allow some new
customers, or existing customers considering new products, to
evaluate products without any payment becoming due unless the
product is ultimately accepted, which means we may invest $1.0 to
$4.0 million in manufacturing a tool that may never be accepted and
purchased or may be purchased months or even years after
production. In the past we have borrowed money in order to fund
first-time purchase order equipment and next-generation evaluation
equipment. When we deliver evaluation equipment, or a “first
tool,” we may not recognize revenue or receive payment for
the tool for 24 months or longer. Even returning customers may take
as long as six months to make any payments. If our sales efforts
are unsuccessful after expending significant resources, or if we
experience delays in completing sales, our future cash flow,
revenue and profitability may fluctuate or be materially adversely
affected.
Our sales cycle is long and unpredictable, which results in
variability of our financial performance and may require us to
incur high sales and marketing expenses with no assurance that a
sale will result, all of which could adversely affect our
profitability.
Our results of
operations may fluctuate, in part, because of the
resource-intensive nature of our sales efforts and the length and
variability of our sales cycle. A sales cycle is the period between
initial contact with a prospective customer and any sale of our
tools. Our sales process involves educating customers about our
tools, participating in extended tool evaluations and configuring
our tools to customer-specific needs, after which customers may
evaluate the tools. The length of our sales cycle, from initial
contact with a customer to the execution of a purchase order, is
generally 6 to 24 months. During the sales cycle, we expend
significant time and money on sales and marketing activities and
make investments in evaluation equipment, all of which lower our
operating margins, particularly if no sale occurs or if the sale is
delayed as a result of extended qualification processes or delays
from our customers’ customers.
The duration or
ultimate success of our sales cycle depends on factors such
as:
●
efforts by our
sales force;
●
the complexity of
our customers’ manufacturing processes and the compatibility
of our tools with those processes;
●
our
customers’ internal technical capabilities and
sophistication; and
20
●
our
customers’ capital spending plans and processes, including
budgetary constraints, internal approvals, extended negotiations or
administrative delays.
It is difficult to
predict exactly when, or even if, we will make a sale to a
potential customer or if we can increase sales to our existing
customers. As a result, we may not recognize revenue from our sales
efforts for extended periods of time, or at all. The loss or delay
of one or more large transactions in a quarter could impact our
results of operations for that quarter and any future quarters for
which revenue from that transaction is lost or delayed. In
addition, we believe that the length of the sales cycle and
intensity of the evaluation process may increase for those current
and potential customers that centralize their purchasing
decisions.
Difficulties in forecasting demand for our tools may lead to
periodic inventory shortages or excess spending on inventory items
that may not be used.
We need to manage
our inventory of components and production of tools effectively to
meet changing customer requirements. Accurately forecasting
customers’ needs is difficult. Our tool demand forecasts are
based on multiple assumptions, including non-binding forecasts
received from our customers years in advance, each of which may
introduce error into our estimates. Inventory levels for components
necessary to build our tools in excess of customer demand may
result in inventory write-downs and could have an adverse effect on
our operating results and financial condition. Conversely, if we
underestimate demand for our tools or if our manufacturing partners
fail to supply components we require at the time we need them, we
may experience inventory shortages. Such shortages might delay
production or shipments to customers and may cause us to lose
sales. These shortages may also harm our credibility, diminish the
loyalty of our channel partners or customers.
A failure to
prevent inventory shortages or accurately predict customers’
needs could result in decreased revenue and gross margins and harm
our business.
Some of our
products and supplies may become obsolete or be deemed excess while
in inventory due to rapidly changing customer specifications,
changes in product structure, components or bills of material as a
result of engineering changes, or a decrease in customer demand. We
also have exposure to contractual liabilities to our contract
manufacturers for inventories purchased by them on our behalf,
based on our forecasted requirements, which may become excess or
obsolete. Our inventory balances also represent an investment of
cash. To the extent our inventory turns are slower than we
anticipate based on historical practice, our cash conversion cycle
extends and more of our cash remains invested in working capital.
If we are not able to manage our inventory effectively, we may need
to write down the value of some of our existing inventory or write
off non-saleable or obsolete inventory. Any such charges we incur
in future periods could materially and adversely affect our results
of operations.
The difficulty in
forecasting demand also makes it difficult to estimate our future
results of operations and financial condition from period to
period. A failure to accurately predict the level of demand for our
products could adversely affect our net revenue and net income, and
we are unlikely to forecast such effects with any certainty in
advance.
If our tools contain defects or do not meet customer
specifications, we could lose customers and revenue.
Highly complex
tools such as our may develop defects during the manufacturing and
assembly process. We may also experience difficulties in
customizing our tools to meet customer specifications or detecting
defects during the development and manufacturing of our tools. Some
of these failures may not be discovered until we have expended
significant resources in customizing our tools, or until our tools
have been installed in our customers’ production facilities.
These quality problems could harm our reputation as well as our
customer relationships in the following ways:
●
our customers may
delay or reject acceptance of our tools that contain defects or
fail to meet their specifications;
●
we may suffer
customer dissatisfaction, negative publicity and reputational
damage, resulting in reduced orders or otherwise damaging our
ability to retain existing customers and attract new
customers;
●
we may incur
substantial costs as a result of warranty claims or service
obligations or in order to enhance the reliability of our
tools;
21
●
the attention of
our technical and management resources may be
diverted;
●
we may be required
to replace defective systems or invest significant capital to
resolve these problems; and
●
we may be required
to write off inventory and other assets related to our
tools.
In addition,
defects in our tools or our inability to meet the needs of our
customers could cause damage to our customers’ products or
manufacturing facilities, which could result in claims for product
liability, tort or breach of warranty, including claims from our
customers. The cost of defending such a lawsuit, regardless of its
merit, could be substantial and could divert management’s
attention from our ongoing operations. In addition, if our business
liability insurance coverage proves inadequate with respect to a
claim or future coverage is unavailable on acceptable terms or at
all, we may be liable for payment of substantial damages. Any or
all of these potential consequences could have an adverse impact on
our operating results and financial condition.
Warranty claims in excess of our estimates could adversely affect
our business.
We have provided
warranties against manufacturing defects of our tools that range
from 12 to 36 months in duration. Our product warranty requires us
to provide labor and parts necessary to repair defects. As of
December 31, 2018, we had accrued $1.7 million in liability
contingency for potential warranty claims. Warranty claims
substantially in excess of our expectations, or significant
unexpected costs associated with warranty claims, could harm our
reputation and could cause customers to decline to place new or
additional orders, which could have a material adverse effect on
our business, results of operations and financial
condition.
We rely on third parties to manufacture significant portions of our
tools and our failure to manage our relationships with these
parties could harm our relationships with our customers, increase
our costs, decrease our sales and limit our growth.
Our tools are
complex and require components and subassemblies having a high
degree of reliability, accuracy and performance. We rely on third
parties to manufacture most of the subassemblies and supply most of
the components used in our tools. Accordingly, we cannot directly
control our delivery schedules and quality assurance. This lack of
control could result in shortages or quality assurance problems.
These issues could delay shipments of our tools, increase our
testing costs or lead to costly failure claims.
We do not have
long-term supply contracts with some of our suppliers, and those
suppliers are not obligated to perform services or supply products
to us for any specific period, in any specific quantities or at any
specific price, except as may be provided in a particular purchase
order. In addition, we attempt to maintain relatively low
inventories and acquire subassemblies and components only as
needed. There are significant risks associated with our reliance on
these third-party suppliers, including:
●
potential price
increases;
●
capacity shortages
or other inability to meet any increase in demand for our
products;
●
reduced control
over manufacturing process for components and subassemblies and
delivery schedules;
●
limited ability of
some suppliers to manufacture and sell subassemblies or parts in
the volumes we require and at acceptable quality levels and prices,
due to the suppliers’ relatively small operations and limited
manufacturing resources;
●
increased exposure
to potential misappropriation of our intellectual property;
and
●
limited warranties
on subassemblies and components supplied to us.
Any delays in the
shipment of our products due to our reliance on third-party
suppliers could harm our relationships with our customers. In
addition, any increase in costs due to our suppliers increasing the
price they charge us for subassemblies and components or arising
from our need to replace our current suppliers that we are unable
to pass on to our customers could negatively affect our operating
results.
22
Any shortage of components or subassemblies could result in delayed
delivery of products to us or in increased costs to us, which could
harm our business.
The ability of our
manufacturers to supply our tools is dependent, in part, upon the
availability certain components and subassemblies. Our
manufacturers may experience shortages in the availability of such
components or subassemblies, which could result in delayed delivery
of products to us or in increased costs to us. Any shortage of
components or subassemblies or any inability to control costs
associated with manufacturing could increase the costs for our
products or impair our ability to ship orders in a timely
cost-efficient manner. As a result, we could experience
cancellation of orders, refusal to accept deliveries or a reduction
in our prices and margins, any of which could harm our financial
performance and results of operations.
We depend on a limited number of suppliers, including single source
suppliers, for critical components and subassemblies, and our
business could be disrupted if they are unable to meet our
needs.
We depend on a
limited number of suppliers for components and subassemblies used
in our tools. Certain components and subassemblies of our tools
have only been purchased from our current suppliers to date and
changing the source of those components and subassemblies may
result in disruptions during the transition process and entail
significant delay and expense. We rely on Product Systems, Inc., or
ProSys, as the sole supplier of megasonic transducers, a key
subassembly used in our single-wafer cleaning equipment. We also
rely on Ninebell Co., Ltd., or Ninebell, which is the principal
supplier of robotic delivery system subassemblies used in our
single-wafer cleaning equipment. An adverse change to our
relationship with ProSys or Ninebell would disrupt our production
of single-wafer cleaning equipment and could cause substantial harm
to our business.
With some of these
suppliers, we do not have long-term agreements and instead purchase
components and subassemblies through a purchase order process. As a
result, these suppliers may stop supplying us components and
subassemblies, limit the allocation of supply and equipment to us
due to increased industry demand or significantly increase their
prices at any time with little or no advance notice. Our reliance
on a limited number of suppliers could also result in delivery
problems, reduced control over product pricing and quality, and our
inability to identify and qualify another supplier in a timely
manner.
Moreover, some of
our suppliers may experience financial difficulties that could
prevent them from supplying us with components or subassemblies
used in the design and manufacture of our products. In addition,
our suppliers, including our sole supplier ProSys, may experience
manufacturing delays or shut downs due to circumstances beyond
their control, such as labor issues, political unrest or natural
disasters. Any supply deficiencies could materially and adversely
affect our ability to fulfill customer orders and our results of
operations. We have in the past and may in the future, experience
delays or reductions in supply shipments, which could reduce our
revenue and profitability. If key components or materials are
unavailable, our costs would increase and our revenue would
decline.
We have depended on PRC governmental subsidies to help fund our
technology development since 2008, and our failure to obtain
additional subsidies may impede our development of new technologies
and may increase our cost of capital, either of which could make it
difficult for us to expand our product base.
We received
subsidies from local and central governmental authorities in the
PRC in 2008, 2009, 2014 and 2018. These grants have provided a
majority of the funding for our development and commercialization
of stress-free polishing and electro copper-plating technologies.
If we are unable to obtain similar governmental subsidies for
development projects in the future, we may need to raise additional
funds through public or private financings, strategic
relationships, or other arrangements, which could force us to
reduce our efforts to develop technologies beyond SAPS, TEBO and
Tahoe. To the extent that we receive a lower level of, or no,
governmental subsidies in the future, we may need to raise
additional funds through public or private financings, strategic
relationships, or other arrangements.
23
The success of our business will depend on our ability to manage
any future growth.
We have experienced
rapid growth in our business recently due, in part, to an expansion
of our product offerings and an increase in the number of customers
that we serve. For example, our headcount grew by 28% during 2017
and by an additional 35% during 2018. We will seek to continue to
expand our operations in the future, including by adding new
offices, locations and employees. Managing our growth has placed
and could continue to place a significant strain on our management,
other personnel and our infrastructure. If we are unable to manage
our growth effectively, we may not be able to take advantage of
market opportunities, develop new products, enhance our
technological capabilities, satisfy customer requirements, respond
to competitive pressures or otherwise execute our business plan. In
addition, any inability to manage our growth effectively could
result in operating inefficiencies that could impair our
competitive position and increase our costs disproportionately to
the amount of growth we achieve. To manage our growth, we believe
we must effectively:
●
hire, train,
integrate and manage additional qualified engineers for research
and development activities, sales and marketing personnel, service
and support personnel and financial and information technology
personnel;
●
manage multiple
relationships with our customers, suppliers and other third
parties; and
●
continue to enhance
our information technology infrastructure, systems and
controls.
Our organizational
structure has become more complex, and we will need to continue to
scale and adapt our operational, financial and management controls,
as well as our reporting systems and procedures. The continued
expansion of our infrastructure will require us to commit
substantial financial, operational and management resources before
our revenue increases and without any assurances that our revenue
will increase.
We are highly dependent on our Chief Executive Officer and
President and other senior management and key employees, and we
currently do not have a permanent Chief Financial
Officer.
Our success largely
depends on the skills, experience and continued efforts of our
management, technical and sales personnel, including in particular
Dr. David H. Wang, our Chair of the Board, Chief Executive Officer,
President and founder. In January 2018 we notified our former Chief
Financial Officer of the termination of his employment effective
January 24, 2018. Our Chief Accounting Officer, who joined us
effective January 24, 2018, currently is serving as our interim
Chief Financial Officer. We are uncertain as to when we will be
able to identify and hire a successor Chief Financial Officer, and
we may incur significant expense in recruiting and hiring such a
successor. If one or more of our other senior management were
unable or unwilling to continue their employment with us, we may
not be able to replace them in a timely manner. We may incur
additional expenses to recruit and retain qualified replacements.
We do not currently maintain key person life insurance policies on
any of our employees. Our business may be severely disrupted and
our financial condition and results of operations may be materially
and adversely affected. In addition, our senior management may join
a competitor or form a competing company. All of our senior
management are at-will employees, which means either we or the
employee may terminate their employment at any time. The loss of
Dr. Wang or other key management personnel, including our former
Chief Financial Officer, could significantly delay or prevent the
achievement of our business objectives.
Failure to attract and retain qualified personnel could put us at a
competitive disadvantage and prevent us from effectively growing
our business.
Our future success
depends, in part, on our ability to continue to attract and retain
highly skilled personnel. There is substantial competition for
experienced management, technical and sales personnel in the chip
equipment industry. If qualified personnel become scarce or
difficult to attract or retain for compensation-related or other
reasons, we could experience higher labor, recruiting or training
costs. New hires may require significant training and time before
they achieve full productivity and may not become as productive as
we expect. If we are unable to retain and motivate our existing
employees and attract qualified personnel to fill key positions, we
may experience inadequate levels of staffing to develop and market
our products and perform services for our customers, which could
have a negative effect on our operating results.
24
Our ability to utilize certain U.S. and state net operating loss
carryforwards may be limited under applicable tax
laws.
As of December 31,
2018, we had net operating loss carryforward amounts, or NOLs, of
$17 million for U.S. federal income tax purposes and $714,000 for
U.S. state income tax purposes. The federal and state NOLs will
expire at various dates beginning in 2019.
Utilization of
these NOLs could be subject to a substantial annual limitation if
the ownership change limitations under U.S. Internal Revenue Code
Sections 382 and 383 and similar U.S. state provisions are
triggered by changes in the ownership of our capital stock. Such an
annual limitation would result in the expiration of the NOLs before
utilization. Our existing NOLs may be subject to limitations
arising from previous ownership changes, including in connection
with our initial public offering and concurrent private placement
in November 2017 and any future follow-on public offerings. Future
changes in our stock ownership, some of which are outside of our
control, could result in an ownership change. Regulatory changes,
such as suspensions on the use of NOLs, or other unforeseen
reasons, may cause our existing NOLs to expire or otherwise become
unavailable to offset future income tax liabilities. Additionally,
U.S. state NOLs generated in one state cannot be used to offset
income generated in another U.S. state. For these reasons, we may
be limited in our ability to realize tax benefits from the use of
our NOLs, even if our profitability would otherwise allow for
it.
Acquisitions that we pursue in the future, whether or not
consummated, could result in other operating and financial
difficulties.
In the future we
may seek to acquire additional product lines, technologies or
businesses in an effort to increase our growth, enhance our ability
to compete, complement our product offerings, enter new and
adjacent markets, obtain access to additional technical resources,
enhance our intellectual property rights or pursue other
competitive opportunities. We may also make investments in certain
key suppliers to align our interests with such suppliers. If we
seek acquisitions, we may not be able to identify suitable
acquisition candidates at prices we consider appropriate. We cannot
readily predict the timing or size of our future acquisitions, or
the success of any future acquisitions.
To the extent that
we consummate acquisitions or investments, we may face financial
risks as a result, including increased costs associated with merged
or acquired operations, increased indebtedness, economic dilution
to gross and operating profit and earnings per share, or
unanticipated costs and liabilities. Acquisitions may involve
additional risks, including:
●
the acquired
product lines, technologies or businesses may not improve our
financial and strategic position as planned;
●
we may determine we
have overpaid for the product lines, technologies or businesses, or
that the economic conditions underlying our acquisition have
changed;
●
we may have
difficulty integrating the operations and personnel of the acquired
company;
●
we may have
difficulty retaining the employees with the technical skills needed
to enhance and provide services with respect to the acquired
product lines or technologies;
●
the acquisition may
be viewed negatively by customers, employees, suppliers, financial
markets or investors;
●
we may have
difficulty incorporating the acquired product lines or technologies
with our existing technologies;
●
we may encounter a
competitive response, including price competition or intellectual
property litigation;
●
we may become a
party to product liability or intellectual property infringement
claims as a result of our sale of the acquired company’s
products;
●
we may incur
one-time write-offs, such as acquired in-process research and
development costs, and restructuring charges;
●
we may acquire
goodwill and other intangible assets that are subject to impairment
tests, which could result in future impairment
charges;
●
our ongoing
business and management’s attention may be disrupted or
diverted by transition or integration issues and the complexity of
managing geographically or culturally diverse enterprises;
and
●
our due diligence
process may fail to identify significant existing issues with the
target business.
25
From time to time,
we may enter into negotiations for acquisitions or investments that
are not ultimately consummated. These negotiations could result in
significant diversion of management time, as well as substantial
out-of-pocket costs, any of which could have a material adverse
effect on our business, operating results and financial
condition.
Future declines in the semiconductor industry, and the overall
world economic conditions on which the industry is significantly
dependent, could have a material adverse impact on our results of
operations and financial condition.
Our business
depends on the capital equipment expenditures of chip
manufacturers, which in turn depend on the current and anticipated
market demand for integrated circuits. With the consolidation of
customers within the industry, the chip capital equipment market
may experience rapid changes in demand driven both by changes in
the market generally and the plans and requirements of particular
customers. Global economic and business conditions, which are often
unpredictable, have historically impacted customer demand for our
products and normal commercial relationships with our customers,
suppliers and creditors. Additionally, in times of economic
uncertainty our customers’ budgets for our tools, or their
ability to access credit to purchase them, could be adversely
affected. This would limit their ability to purchase our products
and services. As a result, economic downturns could cause material
adverse changes to our results of operations and financial
condition including:
●
a decline in demand
for our products;
●
an increase in
reserves on accounts receivable due to our customers’
inability to pay us;
●
an increase in
reserves on inventory balances due to excess or obsolete inventory
as a result of our inability to sell such inventory;
●
valuation
allowances on deferred tax assets;
●
restructuring
charges;
●
asset impairments
including the potential impairment of goodwill and other intangible
assets;
●
a decline in the
value of our investments;
●
exposure to claims
from our suppliers for payment on inventory that is ordered in
anticipation of customer purchases that do not come to
fruition;
●
a decline in the
value of certain facilities we lease to less than our residual
value guarantee with the lessor; and
●
challenges
maintaining reliable and uninterrupted sources of
supply.
Fluctuating levels
of investment by chip manufacturers may materially affect our
aggregate shipments, revenue, operating results and earnings. Where
appropriate, we will attempt to respond to these fluctuations with
cost management programs aimed at aligning our expenditures with
anticipated revenue streams, which could result in restructuring
charges. Even during periods of reduced revenues, we must continue
to invest in research and development and maintain extensive
ongoing worldwide customer service and support capabilities to
remain competitive, which may temporarily harm our profitability
and other financial results.
We conduct substantially all of our operations outside the United
States and face risks associated with conducting business in
foreign markets.
All of our sales in
2017 and 2018 were made to customers outside the United States. Our
manufacturing center has been located in Shanghai since 2006 and
substantially all of our operations are located in the PRC. We
expect that all of our significant activities will remain outside
the United States in the future. We are subject to a number of
risks associated with our international business activities,
including:
●
imposition of, or
adverse changes in, foreign laws or regulatory
requirements;
●
the need to comply
with the import laws and regulations of various foreign
jurisdictions, including a range of U.S. import laws;
●
potentially adverse
tax consequences, including withholding tax rules that may limit
the repatriation of our earnings, and higher effective income tax
rates in foreign countries where we conduct business;
●
competition from
local suppliers with which potential customers may prefer to do
business;
●
seasonal reduction
in business activity, such as during Chinese, or Lunar, New Year in
parts of Asia and in other periods in various individual
countries;
●
increased exposure
to foreign currency exchange rates;
●
reduced protection
for intellectual property;
26
●
longer sales cycles
and reliance on indirect sales in certain regions;
●
increased length of
time for shipping and acceptance of our products;
●
greater difficulty
in responding to customer requests for maintenance and spare parts
on a timely basis;
●
greater difficulty
in enforcing contracts and accounts receivable collection and
longer collection periods;
●
difficulties in
staffing and managing foreign operations and the increased travel,
infrastructure and legal and compliance costs associated with
multiple international locations;
●
heightened risk of
unfair or corrupt business practices in certain geographies and of
improper or fraudulent sales arrangements that may impact financial
results and result in restatements of, or irregularities in, our
consolidated financial statements; and
●
general economic
conditions, geopolitical events or natural disasters in countries
where we conduct our operations or where our customers are located,
including political unrest, war, acts of terrorism or responses to
such events.
In particular, the
Asian market is extremely competitive, and chip manufacturers may
be aggressive in seeking price concessions from suppliers,
including chip equipment manufacturers.
We may not be
successful in developing and implementing policies and strategies
that will be effective in managing these risks in each country in
which we do business. Our failure to manage these risks
successfully could adversely affect our business, operating results
and financial condition.
Fluctuation in foreign currency exchange rates may adversely affect
our results of operations and financial position.
Our results of
operations and financial position could be adversely affected as a
result of fluctuations in foreign currency exchange rates. Although
our financial statements are denominated in U.S. dollars, a sizable
portion of our costs are denominated in other currencies,
principally the Chinese Renminbi and, to a lesser extent, the
Korean Won. Because many of our raw material purchases are
denominated in Renminbi while the majority of the purchase orders
we receive are denominated in U.S. dollars, exchange rates have a
significant effect on our gross margin. We have not engaged in any
foreign currency exchange hedging transactions to date, and any
strategies that we may use in the future to reduce the adverse
impact of fluctuations in foreign currency exchange rates may not
be successful. Our foreign currency exposure with respect to assets
and liabilities for which we do not have hedging arrangements could
have a material impact on our results of operations in periods when
the U.S. dollar significantly fluctuates in relation to unhedged
non-U.S. currencies in which we transact business.
Changes in government trade policies could limit the
demand for our tools and increase the cost of our tools or
adversely impact our supply chain.
General trade
tensions between the U.S. and PRC escalated in 2018. In each of
July, August and September 2018, the U.S. government imposed a
round of new or higher tariffs on specified imported products
originating from the PRC in response to what the U.S. government
characterizes as unfair trade practices. The PRC government
responded to each of these three rounds of U.S. tariff
changes by imposing new or higher tariffs on specified
products imported from the United States. Higher duties on existing
tariffs and further rounds of tariffs have been announced or
threatened by U.S. and PRC leaders.
The imposition of
tariffs by the U.S. and PRC governments and the surrounding
economic uncertainty may negatively impact the semiconductor
industry, including reducing the demand of fabricators for capital
equipment such as our tools. Further changes in trade policy,
tariffs, additional taxes, restrictions on exports or other trade
barriers, or restrictions on supplies, equipment, and raw materials
including rare earth minerals, may limit the ability of our
customers to manufacture or sell semiconductors or to make the
manufacture or sale of semiconductors more expensive and less
profitable, which could lead those customers to fabricate fewer
semiconductors and to invest less in capital equipment such as our
tools. In addition, if the PRC were to impose additional tariffs on
raw materials, subsystems or other supplies that we source from the
United States, our cost for those supplies would increase. As a
result of any of the foregoing events, the imposition or new or
additional tariffs may limit our ability to manufacture tools,
increase our selling and/or manufacturing costs, decrease margins,
or inhibit our ability to sell tools or to purchase necessary
equipment and supplies, which could have a material adverse effect
on our business, results of operations, or financial
conditions.
27
Changes in political and economic policies of the PRC government
may materially and adversely affect our business, financial
condition and results of operations and may result in our inability
to sustain our growth and expansion strategies.
Substantially all
of our operations are conducted in the PRC, and a substantial
majority of our revenue is sourced from the PRC. Accordingly, our
financial condition and results of operations are affected to a
significant extent by economics, political and legal developments
in the PRC.
The Chinese economy
differs from the economies of most developed countries in many
respects, including the extent of government involvement, level of
development, growth rate, and control of foreign exchange and
allocation of resources. Although the PRC government has
implemented measures emphasizing the utilization of market forces
for economic reform, the reduction of state ownership of productive
assets and the establishment of improved corporate governance in
business enterprises, a substantial portion of productive assets in
the PRC are still owned by the government. In addition, the PRC
government continues to play a significant role in regulating
industry development by imposing industrial policies. The PRC
government also exercises significant control over economic growth
in the PRC by allocating resources, controlling payment of foreign
currency-denominated obligations, setting monetary policy,
regulating financial services and institutions, and providing
preferential treatment to particular industries or
companies.
While the PRC
economy has experienced significant growth in the past three
decades, growth has been uneven, both geographically and among
various sectors of the economy. The PRC government has implemented
various measures to encourage economic growth and guide the
allocation of resources. Some of these measures may benefit the
overall PRC economy, but may also have a negative effect on us. Our
financial condition and results of operation could be materially
and adversely affected by government control over capital
investments or changes in tax regulations that are applicable to
us. In the past the PRC government has implemented measures to
control the pace of economic growth, and similar measures in the
future may cause decreased economic activity, which in turn could
lead to a reduction in demand for our products and consequently
have a material adverse effect on our businesses, financial
condition and results of operations.
Although the PRC
government has been implementing policies to develop an independent
domestic semiconductor industry supply chain, there is no
guaranteed time frame in which these initiatives will be
implemented. We cannot guarantee that the implementation of these
policies will result in additional revenue to us or that our
presence in the PRC will result in support from the PRC government.
To the extent that any capital investment or other assistance from
the PRC government is not provided to us, it could be used to
promote the products and technologies of our competitors, which
could adversely affect our business, operating results and
financial condition.
We are subject to government regulation, including import, export,
economic sanctions, and anti-corruption laws and regulations, that
may limit our sales opportunities, expose us to liability and
increase our costs.
Our products are
subject to import and export controls in jurisdictions in which we
distribute or sell our products. Import and exports control and
economic sanctions laws and regulations include restrictions and
prohibitions on the sale or supply of certain products and on our
transfer of parts, components, and related technical information
and know-how to certain countries, regions, governments, persons
and entities.
Various countries
regulate the importation of certain products through import
permitting and licensing requirements and have enacted laws that
could limit our ability to distribute our products. The
exportation, re-exportation, transfers within foreign countries and
importation of our products, including by our partners, must comply
with these laws and regulations, and any violations may result in
reputational harm, government investigations and penalties, and a
denial or curtailment of exporting. Complying with export control
and sanctions laws for a particular sale may be time consuming, may
increase our costs, and may result in the delay or loss of sales
opportunities. If we are found to be in violation of U.S. sanctions
or export control laws, or similar laws in other jurisdictions, we
and the individuals working for us could incur substantial fines
and penalties. Changes in export, sanctions or import laws or
regulations may delay the introduction and sale of our products in
international markets, require us to spend resources to seek
necessary government authorizations or to develop different
versions of our products, or, in some cases, prevent the export or
import of our products to certain countries, regions, governments,
persons or entities, which could adversely affect our business,
financial condition and operating results.
28
We are subject to
various domestic and international anti-corruption laws, such as
the U.S. Foreign Corrupt Practices Act, as well as similar
anti-bribery and anti-kickback laws and regulations. These laws and
regulations generally prohibit companies and their intermediaries
from offering or making improper payments to non-U.S. officials for
the purpose of obtaining, retaining or directing business. Our
exposure for violating these laws and regulations increases as our
international presence expands and as we increase sales and
operations in foreign jurisdictions.
Breaches of our cybersecurity systems could degrade our ability to
conduct our business operations and deliver products to our
customers, result in data losses and the theft of our intellectual
property, damage our reputation, and require us to incur
significant additional costs to maintain the security of our
networks and data.
We increasingly
depend upon our information technology systems to conduct our
business operations, ranging from our internal operations and
product development and manufacturing activities to our marketing
and sales efforts and communications with our customers and
business partners. Computer programmers may attempt to penetrate
our network security, or that of our website, and misappropriate
our proprietary information or cause interruptions of our service.
Because the techniques used by such computer programmers to access
or sabotage networks change frequently and may not be recognized
until launched against a target, we may be unable to anticipate
these techniques. We have also outsourced a number of our business
functions to third-party contractors, including our manufacturers,
and our business operations also depend, in part, on the success of
our contractors’ own cybersecurity measures. Accordingly, if
our cybersecurity systems and those of our contractors fail to
protect against unauthorized access, sophisticated cyberattacks and
the mishandling of data by our employees and contractors, our
ability to conduct our business effectively could be damaged in a
number of ways, including sensitive data regarding our employees or
business, including intellectual property and other proprietary
data, could be stolen. Should this occur, we could be subject to
significant claims for liability from our customers and regulatory
actions from governmental agencies. In addition, our ability to
protect our intellectual property rights could be compromised and
our reputation and competitive position could be significantly
harmed. Consequently, our financial performance and results of
operations could be adversely affected.
Our production facilities could be damaged or disrupted by a
natural disaster, war, terrorist attacks or other catastrophic
events.
Our manufacturing
facilities are subject to risks associated with natural disasters,
such as earthquakes, fires, floods tsunami, typhoons and volcanic
activity, environmental disasters, health epidemics, and other
events beyond our control such as power loss, telecommunications
failures, and uncertainties arising out of armed conflicts or
terrorist attacks. A substantial majority of our facilities as well
as our research and development personnel are located in the PRC.
Any catastrophic loss or significant damage to any of our
facilities would likely disrupt our operations, delay production,
and adversely affect our product development schedules, shipments
and revenue. In addition, any such catastrophic loss or significant
damage could result in significant expense to repair or replace the
facility and could significantly curtail our research and
development efforts in a particular product area or primary market,
which could have a material adverse effect on our operations and
operating results.
In connection with the audit of our consolidated financial
statements for 2017, our management and auditors identified a
material weakness in our internal control over financial reporting
that, even after remediation, could cause investors to lose
confidence in our reported financial information and have a
negative effect on the trading price of our stock.
Neither we nor BDO
China Shu Lun Pan Certified Public Accountants LLP, or BDO China,
our independent registered public accounting firm, has performed a
comprehensive assessment of our internal control over financial
reporting, as defined by the American Institute of Certified Public
Accountants, for purposes of identifying and reporting material
weaknesses and other control deficiencies. We are not currently
required to comply with Section 404 of the Sarbanes-Oxley Act
and therefore are not required to assess the effectiveness of our
internal control over financial reporting. Further, BDO China has
not been engaged to express, nor has it expressed, an opinion on
the effectiveness of our internal control over financial
reporting.
29
In connection with
its audit of our consolidated financial statements as of, and for
the year ended, December 31, 2016, BDO China informed us that it
had identified a material weakness in our internal control over
financial reporting relating to our lack of sufficient qualified
financial reporting and accounting personnel with an appropriate
level of expertise to properly address complex accounting issues
under accounting principles generally accepted in the United
States, or GAAP, and to prepare and review our consolidated
financial statements and related disclosures to fulfill GAAP and
SEC financial reporting requirements. During the nine months ended
September 30, 2018, we took remedial measures to improve the
effectiveness of our controls, including by hiring additional
accounting and finance personnel and by engaging outside consulting
firms, which our management considered, as of September 30, 2018,
to have fully remediated the identified material
weakness.
The existence of
material weaknesses is an indication that there is a more than
remote likelihood that a material misstatement of our financial
statements will not be prevented or detected in a future period,
and the process of designing and implementing effective internal
controls and procedures will be a continual effort that may require
us to expend significant resources to establish and maintain a
system of controls that is adequate to satisfy our reporting
obligations as a public company. We cannot assure you that we will
implement and maintain adequate controls over our financial
processes and reporting in the future in order to avoid additional
material weaknesses or controlled deficiencies in our internal
control over financing reporting. If other material weaknesses or
control deficiencies occur in the future, we may be unable to
report our financial results accurately or on a timely basis, which
could cause our reported financial results to be materially
misstated and result in the loss of investor confidence and cause
the trading price of Class A common stock to decline. Moreover,
ineffective controls could significantly hinder our ability to
prevent fraud.
Our auditor, as a registered public accounting firm operating in
the PRC, is not permitted to be inspected by the Public Company
Accounting Oversight Board, and consequently investors may be
deprived of the benefits of such inspections.
BDO China is the
independent registered public accounting firm that issued the audit
report included in this report in connection with our consolidated
financial statements as of, and for the years ended, December 31,
2018 and 2017. BDO China, as an auditor of companies that are
traded publicly in the United States and a firm registered with the
U.S. Public Company Accounting Oversight Board, or PCAOB, is
required by the laws of the United States to undergo regular
inspections by the PCAOB to assess its compliance with the laws of
the United States and applicable professional standards. BDO China
is located in the PRC. The PCAOB is currently unable to conduct
inspections on auditors in the PRC without the approval of PRC
authorities, and therefore BDO China, like other independent
registered public accounting firms operating in the PRC, is
currently not inspected by the PCAOB.
In May 2013 the
PCAOB announced that it had entered into a Memorandum of
Understanding on Enforcement Cooperation with the China Securities
Regulatory Commission and the Ministry of Finance of China pursuant
to which the Ministry of Finance established a cooperative
framework between the parties for the production and exchange of
audit documents relevant to investigations in both the PRC and the
United States. More specifically, the Memorandum of Understanding
provides a mechanism for the parties to request and receive from
each other assistance in obtaining documents and information in
furtherance of their investigative duties. In addition the PCAOB is
engaged in continuing discussions with the China Securities
Regulatory Commission and the Ministry of Finance to permit joint
inspections in the PRC of audit firms that are registered with the
PCAOB and to audit PRC companies whose securities are listed on
U.S. stock exchanges.
The PCAOB’s
inspections of firms outside of the PRC have identified
deficiencies in audit procedures and quality control procedures,
and such deficiencies may be addressed as part of the inspection
process to improve future audit quality. The inability of the PCAOB
to conduct inspections of BDO China with respect to its audit of
our consolidated financial statements may make it more difficult
for investors to evaluate BDO China’s audit procedures and
quality control procedures by depriving investors of potential
benefits from improvements that could have been facilitated by
PCAOB inspections.
30
Risks
Relating to Our Intellectual Property
Our success depends on our ability to protect our intellectual
property, including our SAPS, TEBO and Tahoe
technologies.
Our commercial
success depends in part on our ability to obtain and maintain
patent and trade secret protection for our intellectual property,
including our SAPS, TEBO and Tahoe technologies and the design of
our Ultra C equipment, as well as our ability to operate without
infringing upon the proprietary rights of others. There can be no
assurance that our patent applications will result in additional
patents being issued or that issued patents will afford sufficient
protection against competitors with similar technology, nor can
there be any assurance that the patents issued will not be
infringed, designed around, or invalidated by third parties. Even
issued patents may later be found unenforceable or may be modified
or revoked in proceedings instituted by third parties before
various patent offices or in courts. The degree of future
protection for our intellectual property is uncertain. Only limited
protection may be available and may not adequately protect our
rights or permit us to gain or keep any competitive advantage. This
failure to properly protect the intellectual property rights
relating to our products and technologies could have a material
adverse effect on our financial condition and results of
operations.
The patent
application process is subject to numerous risks and uncertainties,
and there can be no assurance that we or any of our future
development partners will be successful in protecting our product
candidates by obtaining and defending patents. These risks and
uncertainties include the following:
●
The U.S. Patent and
Trademark Office and various foreign governmental patent agencies
require compliance with a number of procedural, documentary, fee
payment and other provisions during the patent process. There are
situations in which noncompliance can result in abandonment or
lapse of a patent or patent application, resulting in partial or
complete loss of patent rights in the relevant jurisdiction. In
such an event, competitors might be able to enter the market
earlier than would otherwise have been the case.
●
Patent applications
may not result in any patents being issued.
●
Patents that may be
issued may be challenged, invalidated, modified, revoked,
circumvented, found to be unenforceable or otherwise may not
provide any competitive advantage.
●
Our competitors may
seek or may have already obtained patents that will limit,
interfere with, or eliminate our ability to make, use and sell our
potential product candidates.
●
The PRC and other
countries other than the United States may have patent laws less
favorable to patentees than those upheld by U.S. courts, allowing
foreign competitors a better opportunity to create, develop and
market competing product candidates.
In addition, we
rely on the protection of our trade secrets and know-how. Although
we have taken steps to protect our trade secrets and unpatented
know-how, including entering into confidentiality and
non-disclosure agreements with third parties and confidential
information and inventions agreements with key employees, customers
and suppliers, other parties may still obtain this information or
may come upon this information independently. If any of these
events occurs or if we otherwise lose protection for our trade
secrets or proprietary know-how, the value of this information may
be greatly reduced.
We may be involved in lawsuits to protect or enforce our patents,
which could be expensive, time consuming and
unsuccessful.
Competitors may
infringe upon our patents. If our technologies are adopted, we
believe that competitors may try to match our technologies and
tools in order to compete. To counter infringement or unauthorized
use, we may be required to file infringement claims, which can be
expensive and time consuming. An adverse result in any litigation
or defense proceedings, including our current suits, could put one
or more of our patents at risk of being invalidated, found to be
unenforceable or interpreted narrowly and could put our patent
applications at risk of not issuing. Furthermore, because of the
substantial amount of discovery required in connection with
intellectual property litigation, there is a risk that some of our
confidential information could be compromised by disclosure during
litigation. In addition, any future patent litigation, interference
or other administrative proceedings will result in additional
expense and distraction of our personnel. Most of our competitors
are larger than we are and have substantially greater resources,
and they therefore are likely to be able to sustain the costs of
complex patent litigation longer than we could. An adverse outcome
in such litigation or proceedings may expose us to loss of our
proprietary position.
31
We may not be able to protect our intellectual property rights
throughout the world, which could materially, negatively affect our
business.
Filing, prosecuting
and defending patents on our products or proprietary technologies
in all countries throughout the world would be prohibitively
expensive, and our intellectual property rights in some countries
outside the United States, including the PRC, can be less extensive
than those in the United States. In addition, the laws of some
foreign countries do not protect intellectual property rights to
the same extent as federal and state laws in the United States.
Consequently, competitors may use our technologies in jurisdictions
where we have not obtained patent protection to develop their own
products and may export otherwise infringing products to
territories where we have patent protection but enforcement is not
as strong as that in the United States. These products may compete
with our products, and our patents or other intellectual property
rights may not be effective or sufficient to prevent them from
competing.
Many companies have
encountered significant problems in protecting and defending
intellectual property rights in foreign jurisdictions. The legal
systems of certain countries, particularly certain developing
countries, do not favor the enforcement of patents and other
intellectual property protection, which could make it difficult for
us to stop the infringement of our patents or marketing of
competing products in violation of our proprietary rights
generally. Proceedings to enforce our patent rights in foreign
jurisdictions could result in substantial costs and divert our
efforts and attention from other aspects of our business, could put
our patents at risk of being invalidated or interpreted narrowly
and our patent applications at risk of not issuing, and could
provoke third parties to assert claims against us. We may not
prevail in any lawsuits that we initiate, and the damages or other
remedies awarded, if any, may not be commercially meaningful.
Accordingly, our efforts to enforce our intellectual property
rights around the world may be inadequate to obtain a significant
commercial advantage from the intellectual property that we develop
or license and may adversely affect our business.
If we are sued for infringing intellectual property rights of third
parties, it will be costly and time consuming, and an unfavorable
outcome in that litigation could have a material adverse effect on
our business.
Our success depends
on our ability to develop, manufacture, market and sell our
products without infringing upon the proprietary rights of third
parties. Numerous U.S. and foreign-issued patents and pending
patent applications owned by third parties exist in the fields in
which we are developing products, some of which may contain claims
that overlap with the subject matter of our intellectual property.
A third party has claimed in the past, and others may claim in the
future, that our technology or products infringe their intellectual
property. In some instances third parties may initiate litigation
against us in an effort to prevent us from using our technology in
alleged violation of their intellectual property rights. The risk
of such a lawsuit will likely increase as our size and the number
and scope of our products increase and as our geographic presence
and market share expand.
Any potential
intellectual property claims or litigation commenced against us
could:
●
be time consuming
and expensive to defend, whether or not meritorious;
●
force us to stop
selling products or using technology that allegedly infringes the
third party’s intellectual property rights;
●
delay shipments of
our products;
●
require us to pay
damages or settlement fees to the party claiming
infringement;
●
require us to
attempt to obtain a license to the relevant intellectual property,
which may not be available on reasonable terms or at
all;
●
force us to attempt
to redesign products that contain the allegedly infringing
technology, which could be expensive or which we may be unable to
do;
●
require us to
indemnify our customers, suppliers or other third parties for any
loss caused by their use of our technology that allegedly infringes
the third party’s intellectual property rights;
or
●
divert the
attention of our technical and managerial resources.
Because patent
applications can take many years to issue, there may be currently
pending applications, unknown to us, that may later result in
issued patents upon which our products or technologies may
infringe. Similarly, there may be issued patents relevant to our
products of which we are not aware.
32
Risks
Related to Ownership of Class A Common Stock
The market price of Class A
common stock has been and may continue
to be volatile, which could result in substantial losses for
investors purchasing our shares
Class A common
stock only commenced trading on the Nasdaq Global Market, or
Nasdaq, on November 3, 2017, and the market price of Class A
common stock has been, and could continue to be, subject to
significant fluctuations. The market price of Class A common stock
may fluctuate significantly in response to numerous factors, many
of which are beyond our control, including:
●
actual or
anticipated fluctuations in our revenue and other operating
results;
●
the financial
projections we may provide to the public, any changes in these
projections or our failure to meet these projections;
●
actions of
securities analysts who initiate or maintain coverage of us,
changes in financial estimates by any securities analysts who
follow our company, or our failure to meet these estimates or the
expectations of investors;
●
changes in
projections for the chips or chip equipment industries or in the
operating performance or expectations and stock market valuations
of chip companies, chip equipment companies or technology companies
in general;
●
changes in
operating results;
●
any changes in the
financial projections we may provide to the public, our failure to
meet these projections, or changes in recommendations by any
securities analysts that elect to follow Class A common
stock;
●
additional shares
of Class A common stock being sold into the market by us or our
existing stockholders or the anticipation of such
sales;
●
price and volume
fluctuations in the overall stock market, including as a result of
trends in the economy as a whole;
●
lawsuits threatened
or filed against us;
●
litigation and
other developments relating to our patents or other proprietary
rights or those of our competitors;
●
developments in new
legislation and pending lawsuits or regulatory actions, including
interim or final rulings by judicial or regulatory bodies;
and
●
general economic
trends, including changes in the demand for electronics or
information technology or geopolitical events such as war or acts
of terrorism, or any responses to such events.
In recent years,
the stock market in general, and Nasdaq in particular, has
experienced extreme price and volume fluctuations that have often
been unrelated or disproportionate to changes in the operating
performance of the companies whose stock is experiencing those
price and volume fluctuations.
As a newly public company, our stock price may be volatile, and
securities class action litigation has often been instituted
against companies following periods of volatility of their stock
price. Any such litigation, if instituted against us, could result
in substantial costs and a diversion of our management’s
attention and resources.
In the past,
following periods of volatility in the overall market and the
market price of a particular company’s securities, securities
class action litigation has often been instituted against these
companies. This litigation, if instituted against us, could result
in substantial costs and a diversion of our management’s
attention and resources.
An active trading market for Class A common stock may not be
sustained.
Class A common
stock has been listed on Nasdaq only since November 3, 2017,
and we cannot assure you that an active trading market for Class A
common stock will be sustained or maintained. The lack of an active
market may impair your ability to sell your shares at the time you
wish to sell them or at a price that you consider reasonable. The
lack of an active market may also reduce the fair market value of
your shares. There can be no assurance that we will be able to
successfully develop or maintain a liquid market for Class A common
stock.
33
If securities or industry analysts do not publish research or
reports about us, our business or our market, or if they publish
negative evaluations of Class A common stock or the stock of other
companies in our industry, the price of our stock and trading
volume could decline.
The trading market
for Class A common stock will depend in part on the research and
reports that securities or industry analysts publish about us or
our business. If one or more of the analysts who cover us downgrade
the Class A common stock or publish inaccurate or unfavorable
research about our business, the Class A common stock price would
likely decline. In addition, if one or more of these analysts
ceases coverage of the Class A common stock or fails to publish
reports about the Class A common stock on a regular basis, we could
lose visibility in the financial markets, which in turn could cause
the Class A common stock price or trading volume to
decline.
Requirements associated with being a public reporting company
involve significant ongoing costs and can divert significant
company resources and management attention.
We are subject to
the reporting requirements of the Securities Exchange Act, the
Sarbanes-Oxley Act, the Dodd-Frank Wall Street Reform and Consumer
Protection Act, the listing requirements of Nasdaq, and other rules
and regulations of the SEC. We are working with our legal,
independent accounting and financial advisors to identify those
areas in which changes should be made to our financial and
management control systems to manage our growth and our obligations
as a public reporting company. These areas include corporate
governance, corporate control, disclosure controls and procedures,
and financial reporting and accounting systems. We have made, and
will continue to make, changes in these and other areas. Compliance
with the various reporting and other requirements applicable to
public reporting companies will require considerable time,
attention of management and financial resources. In addition, the
changes we make may not be sufficient to allow us to satisfy our
obligations as a public reporting company on a timely
basis.
The listing
requirements of Nasdaq require that we satisfy certain corporate
governance requirements relating to director independence,
distributing annual and interim reports, stockholder meetings,
approvals and voting, soliciting proxies, conflicts of interest and
a code of conduct. Our management and other personnel will need to
devote a substantial amount of time to ensure that we comply with
all of these requirements. The reporting requirements, rules and
regulations will increase our legal and financial compliance costs
and will make some activities more time-consuming and costly. These
reporting requirements, rules and regulations, coupled with the
increase in potential litigation exposure associated with being a
public company, could also make it more difficult for us to attract
and retain qualified persons to serve as our directors or executive
officers, or to obtain certain types of insurance, including
director and officer liability insurance, on acceptable
terms.
We have never paid and do not intend to pay cash dividends and,
consequently, your ability to achieve a return on your investment
will depend on appreciation in the price of Class A common
stock.
We have never
declared or paid cash dividends on our capital stock. We currently
intend to retain any future earnings to finance the operation and
expansion of our business, and we do not expect to declare or pay
any dividends in the foreseeable future. Accordingly, you may only
receive a return on your investment in Class A common stock if the
market price of Class A common stock increases.
Our ability to pay
dividends on Class A common stock depends significantly on our
receiving distributions of funds from our subsidiaries in the PRC.
PRC statutory laws and regulations permit payments of dividends by
those subsidiaries only out of their retained earnings, which are
determined in accordance with PRC accounting standards and
regulations that differ from U.S. generally accepted accounting
principles. The PRC regulations and our subsidiaries’
articles of association require annual appropriations of 10% of net
after-tax profits to be set aside, prior to payment of dividends,
as a reserve or surplus fund, which restricts our
subsidiaries’ ability to transfer a portion of their net
assets to us. In addition, our subsidiaries’ short-term bank
loans restrict their ability to pay dividends to us.
34
The dual class structure of Class A common stock has the effect of
concentrating voting control with our executive officers and
directors, including our Chief Executive Officer and President,
which will limit or preclude your ability to influence corporate
matters.
Class B common
stock has twenty votes per share and Class A common stock has one
vote per share. As of March 8, 2019, stockholders who hold shares
of Class B common stock, who consist principally of our executive
officers, employees, directors and their respective affiliates,
collectively held 72.8% of the voting power of our outstanding
capital stock. Because of the twenty-to-one voting ratio between
Class B and Class A common stock, holders of Class B common stock
collectively will continue to control a majority of the combined
voting power of Class A common stock and therefore be able to
control all matters submitted to our stockholders for approval so
long as the shares of Class B common stock represent at least 4.8%
of all outstanding shares of Class A and Class B common stock. This
concentrated control will limit or preclude your ability to
influence corporate matters for the foreseeable future. This
concentrated control could also discourage a potential investor
from acquiring Class A common stock due to the limited voting power
of such stock relative to the Class B common stock and might harm
the market price of Class A common stock.
Future transfers by
holders of Class B common stock will result in those shares
converting to Class A common stock, subject to limited exceptions.
The conversion of Class B common stock to Class A common stock will
have the effect, over time, of increasing the relative voting power
of those holders of Class B common stock who retain their shares in
the long term.
Delaware law and provisions in our charter and bylaws could make a
merger, tender offer or proxy contest difficult, thereby depressing
the trading price of Class A common stock.
Our status as a
Delaware corporation and the anti-takeover provisions of the
Delaware General Corporation Law may discourage, delay, or prevent
a change in control by prohibiting us from engaging in a business
combination with an interested stockholder for a period of three
years after the person becomes an interested stockholder, even if a
change of control would be beneficial to our existing stockholders.
Our charter and bylaws contain provisions that may make the
acquisition of our company more difficult, including the
following:
●
our dual class
common stock structure provides holders of Class B common stock
with the ability to control the outcome of matters requiring
stockholder approval, even if they own significantly less than a
majority of the total number of outstanding shares of Class A and
Class B common stock;
●
when the
outstanding shares of Class B common stock represent less than a
majority of the combined voting power of common stock;
●
amendments to our
charter or bylaws will require the approval of two-thirds of the
combined vote of our then-outstanding shares of Class A and Class B
common stock;
●
vacancies on the
board of directors will be able to be filled only by the board and
not by stockholders;
●
the board, which
currently is not staggered, will be automatically separated into
three classes with staggered three-year terms;
●
directors will only
be able to be removed from office for cause; and
●
our stockholders
will only be able to take action at a meeting and not by written
consent;
●
only our chair, our
chief executive officer or a majority of our directors is
authorized to call a special meeting of stockholders;
●
advance notice
procedures apply for stockholders to nominate candidates for
election as directors or to bring matters before an annual meeting
of stockholders;
●
our charter
authorizes undesignated preferred stock, the terms of which may be
established, and shares of which may be issued, without stockholder
approval; and
●
cumulative voting
in the election of directors is prohibited.
As a Delaware
corporation, we are also subject to provisions of Delaware law,
including Section 203 of the Delaware General Corporation Law,
which limits the ability of stockholders holding more than 15% of
our outstanding voting stock from engaging in certain business
combinations with us. Any provision of our charter or bylaws or
Delaware law that has the effect of delaying or deterring a change
in control could limit the opportunity for our stockholders to
receive a premium for their shares of Class A common stock, and
could also affect the price that some investors are willing to pay
for Class A common stock.
35
Our charter designates the Court of Chancery of the State of
Delaware as the sole and exclusive forum for certain litigation
that may be initiated by our stockholders, which could limit our
stockholders’ ability to obtain a favorable judicial forum
for disputes with us or our directors, officers or
stockholders.
Our charter
provides that the Court of Chancery of the State of Delaware will,
to the fullest extent permitted by law, be the sole and exclusive
forum for:
●
any derivative
action or proceeding brought on our behalf;
●
any action
asserting a claim of breach of a fiduciary duty owed to us, our
stockholders, creditors or other constituents by any of our
directors, officers, other employees, agents or
stockholders;
●
any action
asserting a claim arising under the Delaware General Corporation
Law, our charter or bylaws, or as to which the Delaware General
Corporation Law confers jurisdiction on the Court of Chancery of
the State of Delaware; or
●
any action
asserting a claim that is governed by the internal affairs
doctrine.
By becoming a
stockholder in our company, you will be deemed to have notice of
and have consented to the provisions of our charter related to
choice of forum. The choice of forum provision in our charter may
limit our stockholders’ ability to obtain a favorable
judicial forum for disputes with us or any of our directors,
officers, other employees, agents or stockholders, which may
discourage lawsuits with respect to such claims. Alternatively, if
a court were to find the choice of forum provision contained in our
charter to be inapplicable or unenforceable in an action, we may
incur additional costs associated with resolving such action in
other jurisdictions, which could harm our business, results of
operations and financial condition.
Our management team has limited experience managing a public
company.
The experience of
the current members of our management team in managing a publicly
traded company, interacting with public company investors and
complying with the increasingly complex laws pertaining to public
companies is limited to their experience with our company since our
initial public offering in November 2017. Our management team may
not successfully or efficiently manage our transition to being a
public company subject to significant regulatory oversight and
reporting obligations under the federal securities laws and the
scrutiny of securities analysts and investors. These new
obligations and constituents will require significant attention
from our management team and could divert their attention away from
the day-to-day management of our business, which could materially
adversely affect our business, financial condition and operating
results.
We are currently an “emerging growth company,” and the
reduced disclosure requirements applicable to emerging growth
companies may make Class A common stock less attractive to
investors.
We are currently an
“emerging growth company,” as defined in the Jumpstart
Our Business Startups Act. For so long as we remain an emerging
growth company, we are permitted, and intend, to rely on exemptions
from certain disclosure requirements that are applicable to other
public companies that are not emerging growth companies. These
exemptions include reduced disclosure obligations regarding
executive compensation and exemptions from the requirements of
holding a non-binding advisory vote on executive compensation and
stockholder approval of any golden parachute payments not
previously approved, not being required to comply with the auditor
attestation requirements of Section 404 of the Sarbanes-Oxley Act
and not being required to comply with any requirement that may be
adopted by the PCAOB regarding mandatory audit firm rotation or a
supplement to the auditor’s report providing additional
information about the audit and the financial statements. We cannot
predict whether investors will find the Class A common stock less
attractive if we rely on these exemptions. If some investors find
the Class A common stock less attractive as a result, there may be
a less active trading market, and more volatile trading price, for
Class A common stock.
36
We will incur increased costs and demands upon management as a
result of complying with the laws and regulations affecting public
companies, particularly after we are no longer an “emerging
growth company,” which could adversely affect our business,
operating results and financial condition.
As a public
company, and particularly after we cease to be an “emerging
growth company,” we will continue to incur significant legal,
accounting and other expenses. We are subject to the reporting
requirements of the Securities and Exchange Act, the Sarbanes-Oxley
Act, the Dodd-Frank Wall Street Reform and Consumer Protection Act,
and the rules and regulations of Nasdaq. These requirements have
increased and will continue to increase our legal, accounting and
financial compliance costs and have made and will continue to make
some activities more time consuming and costly. For example, we
expect these rules and regulations to make it more difficult and
more expensive for us to obtain director and officer liability
insurance, and we may be required to accept reduced policy limits
and coverage or incur substantially higher costs to maintain the
same or similar coverage. As a result, it may be more difficult for
us to attract and retain qualified individuals to serve as our
executive officers or on the board of directors, particularly to
serve on the audit and compensation committees.
The Sarbanes-Oxley
Act requires, among other things, that we assess the effectiveness
of our internal control over financial reporting annually and the
effectiveness of our disclosure controls and procedures quarterly.
In particular, beginning with respect to the year ending December
31, 2018, Section 404 of the Sarbanes-Oxley Act, or Section 404,
will require our management to perform system and process
evaluation and testing to allow it to report on the effectiveness
of our internal control over financial reporting.
We are currently
evaluating our internal controls, identifying and remediating
deficiencies in those internal controls and documenting the results
of our evaluation, testing and remediation. Please see
“—Our management and auditors identified a material
weakness in our internal control over financial reporting that, if
not properly remediated, could result in material misstatements in
our consolidated financial statements that could cause investors to
lose confidence in our reported financial information and have a
negative effect on the trading price of our
stock.”
Investor
perceptions of our company may suffer if deficiencies are found,
which could cause a decline in the market price of our stock.
Irrespective of compliance with Section 404, any failure of our
internal control over financial reporting could have a material
adverse effect on our stated operating results and harm our
reputation. If we are unable to implement these requirements
effectively or efficiently, it could harm our operations, financial
reporting, or financial results and could result in an adverse
opinion on our internal controls from our independent registered
public accounting firm.
In addition,
changing laws, regulations and standards relating to corporate
governance and public disclosure are creating uncertainty for
public companies, increasing legal and financial compliance costs
and making some activities more time consuming. These laws,
regulations and standards are subject to varying interpretations,
in many cases due to their lack of specificity, and, as a result,
their application in practice may evolve over time as new guidance
is provided by regulatory and governing bodies. This could result
in continuing uncertainty regarding compliance matters and higher
costs necessitated by ongoing revisions to disclosure and
governance practices. We intend to invest resources to comply with
evolving laws, regulations and standards, and this investment may
result in increased general and administrative expense and a
diversion of management’s time and attention from
revenue-generating activities to compliance activities. If our
efforts to comply with new laws, regulations and standards differ
from the activities intended by regulatory or governing bodies,
regulatory authorities may initiate legal proceedings against us
and our business may be harmed.
Item 2:
Properties
We have occupied
our current corporate headquarters in Fremont, California, since
February 2008, under a lease that, as amended in February 2019,
extends through March 2021.
We conduct research
and development, service support operations, and a portion of
manufacturing in our ACM Shanghai headquarters. This facility
consists of 60,000 square feet, of which 36,000 square feet are
allocated for manufacturing, and is located in the Zhangjiang Hi
Tech Park in Shanghai. We have leased this facility since 2007. The
lease terms and its payment terms are subject to modification and
extension with Zhangjiang Group from time to time. We extended the
lease for a 60-month term from January 1, 2018 until January 1,
2022.
37
In January 2018,
ACM Shanghai entered into an operating lease for a second
manufacturing space located in Shanghai, ten miles from its
headquarters. The lease covers a total of 103,318 square feet, of
which 50,000 square feet are allocated for production. The lease
term is five years and expires on January 15, 2022.
In addition, we
provide sales support and customer service operations from leased
office space in Jiangying and Wuxi in the PRC, and Icheon in
Korea.
Item 3:
Legal Proceedings
From time to time
we may become involved in legal proceedings or may be subject to
claims arising in the ordinary course of our business. Although the
results of litigation and claims cannot be predicted with
certainty, we currently believe that the final outcome of these
ordinary course matters will not have a material adverse effect on
our business, operating results, financial condition or cash flows.
Regardless of the outcome, litigation can have an adverse impact on
us because of defense and settlement costs, diversion of management
resources and other factors.
38
PART
II
Item 5.
Market
for Registrant’s Common Equity, Related Stockholder Matters
and Issuer Purchases of Equity Securities
Information
Regarding the Trading of Common Stock
The Class A common
stock has traded on NASDAQ Global Market under the symbol
“ACMR” since November 3, 2017. Prior to that time,
there was no public market for the Class A common stock. The Class
B common stock is not listed or traded on any stock
exchange.
Holders
of Common Stock
As of March 8,
2019, there were 14,176,690 holders of record of shares of Class A
common stock and 1,898,423 holders of record of shares of
Class B common stock. The actual number of holders of Class A
common stock is substantially greater and includes stockholders who
are beneficial owners and whose shares are held of record by banks,
brokers, and other financial institutions.
Securities
Authorized for Issuance Under Equity Compensation
Plans
The information
required by this item will be set forth in the definitive proxy
statement we will file in connection with our 2019 Annual Meeting
of Stockholders and is incorporated by reference
herein.
Sales
of Unregistered Securities
Set forth below is
information regarding shares of capital stock we issued in 2018
that were not registered under the Securities Act of
1933:
(1)
We issued an
aggregate of 94,694 shares of Class A common stock pursuant to the
exercise of stock options at per share exercise prices ranging from
$0.75 to $3.00 per share.
(2)
In March 2018 we
issued 397,502 shares of Class A common stock pursuant to an
exercise of a warrant issued in March 2017 in exchange for a senior
secured promissory note in the principal amount of approximately $3
million.
The offer, sale and
issuance of the securities described in paragraph (1) were exempt
from registration under the Securities Act of 1933 by virtue of
Section 4(a)(2) thereof (or Regulation D promulgated thereunder)
because the issuance of securities to the recipients did not
involve a public offering, or in reliance on Rule 701 because the
transaction was pursuant to a contract relating to compensation as
provided under such rule. The offer, sale and issuance of the
security described in paragraph (2) was deemed to be exempt from
registration under the Securities Act in reliance on
Section 4(a)(2) of the Securities Act in that the issuance of
the securities to the accredited investors did not involve a public
offering. The recipients of the securities in the transactions
under paragraphs (1) and (2) acquired the securities for investment
only and not with a view to or for sale in connection with any
distribution thereof, and appropriate legends were affixed to the
securities issued in these transactions. The recipients of the
securities in these transactions were accredited investors under
Rule 501 of Regulation D.
Transfer
Agent
The transfer agent
and registrar for the Class A common stock and the Class B common
stock is Computershare Trust Company, N.A.
39
Item 7.
Management’s
Discussion and Analysis of Financial Condition and Results of
Operations
The following discussion and analysis should be read in conjunction
with the audited consolidated financial statements and related
notes included in this report. In addition to historical
information, the following discussion contains forward-looking
statements that involves risks, uncertainties and assumptions. See
“Forward-Looking Statements and Statistical Data” at
page 2 of this report. Please read “Item1A. Risk
Factors” for a discussion of factors that could cause our
actual results to differ materially from our
expectations
Overview
We supply advanced,
innovative capital equipment developed for the global semiconductor
industry. Fabricators of advanced integrated circuits, or chips,
can use our single-wafer wet-cleaning tools in numerous steps to
improve product yield, even at increasingly advanced process nodes.
We have designed these tools for use in fabricating foundry, logic
and memory chips, including dynamic random-access memory (or DRAM)
and 3D NAND-flash memory chips. We also develop, manufacture and
sell a range of advanced packaging tools to wafer assembly and
packaging customers.
Selling prices for
our single-wafer wet-cleaning tools range from $2 million to more
than $5 million. Revenue from single-wafer wet-cleaning tools
totaled $68.5 million, or 92% of total revenue, in 2018 and $27.1
million, or 74% of total revenue, in 2017. Our customers for
single-wafer wet-cleaning tools include Semiconductor Manufacturing
International Corporation, Shanghai Huali Microelectronics
Corporation, SK Hynix Inc. and Yangtze Memory Technologies Co.,
Ltd.
We focus our
selling efforts on establishing a referenceable base of leading
foundry, logic and memory chip makers, whose use of our products
can influence decisions by other manufacturers. We believe this
customer base will help us penetrate the mature chip manufacturing
markets and build credibility with additional industry leaders.
Using a “demo-to-sales” process, we have placed
evaluation equipment, or “first tools,” with a number
of selected customers. Since 2009 we have delivered more than 55
single-wafer wet cleaning tools, more than 50 of which have been
accepted by customers and thereby generated revenue to us and the
balance of which are awaiting customer acceptance should
contractual conditions be met.
Since our formation
in 1998, we have focused on building a strategic portfolio of
intellectual property to support and protect our key innovations.
Our wet-cleaning equipment has been developed using our key
proprietary technologies:
●
Space Alternated
Phase Shift, or SAPS, technology for flat and patterned wafer
surfaces, which employs alternating phases of megasonic waves to
deliver megasonic energy in a highly uniform manner on a
microscopic level;
●
Timely Energized
Bubble Oscillation, or TEBO, technology for patterned wafer
surfaces at advanced process nodes, which provides effective,
damage-free cleaning for 2D and 3D patterned wafers with fine
feature sizes; and
●
Tahoe technology
for cost and environmental savings, which delivers high cleaning
performance using significantly less sulfuric acid and hydrogen
peroxide than is typically consumed by conventional
high-temperature single-wafer cleaning tools.
We have been issued
more than 220 patents in the United States, the People’s
Republic of China or PRC, Japan, Korea, Singapore and
Taiwan.
We conduct
substantially all of our product development, manufacturing,
support and services in the PRC. All of our tools are built to
order at our manufacturing facilities in Shanghai, which encompass
86,000 square feet of floor space for production capacity. Our
experience has shown that chip manufacturers in the PRC and
throughout Asia demand equipment meeting their specific technical
requirements and prefer building relationships with local
suppliers. We will continue to seek to leverage our local presence
to address the growing market for semiconductor manufacturing
equipment in the region by working closely with regional chip
manufacturers to understand their specific requirements, encourage
them to adopt our SAPS, TEBO and Tahoe technologies, and enable us
to design innovative products and solutions to address their
needs.
40
Corporate
Background
ACM Research was
incorporated in California in 1998 and redomesticated in Delaware
in 2016. We perform strategic planning, marketing, and financial
activities at our global corporate headquarters in Fremont,
California.
Initially we
focused on developing tools for chip manufacturing process steps
involving the integration of ultra-low-K materials and copper. In
the early 2000s we sold tools based on stress-free copper polishing
technology.
To help us
establish and build relationships with chip manufacturers in the
PRC, in 2006 we moved our operational center to Shanghai and began
to conduct our business through our subsidiary ACM Shanghai. In
2007 we began to focus our development efforts on single-wafer
wet-cleaning solutions for the front-end chip fabrication
process.
In 2009 we
introduced SAPS megasonic technology, which can be applied in wet
wafer cleaning at numerous steps during the chip fabrication
process. In 2016 we introduced TEBO technology, which can be
applied at numerous steps during the fabrication of small node
conventional two-dimensional and three-dimensional patterned
wafers. In August 2018, we introduced the Ultra-C Tahoe wafer
cleaning tool, which delivers high cleaning performance with
significantly less sulfuric acid than typically consumed by
conventional high temperature single-wafer cleaning
tools.
In December 2017 we
formed a wholly owned subsidiary in the Republic of Korea, ACM
Research Korea CO., LTD., to serve our customers based in the
Republic of Korea and perform sales, marketing, and research and
development activities. We currently conduct the majority of our
product development, support and services, and substantially all of
our manufacturing at ACM Shanghai. Our Shanghai operations position
us to be near many of our current and potential new customers in
the PR (including Taiwan), Korea and throughout Asia, providing
convenient access and reduced shipping and manufacturing
costs.
In 2011 ACM
Shanghai formed a wholly owned subsidiary in the PRC, ACM Research
(Wuxi), Inc., to manage sales and service operations. In June 2017
we formed a wholly owned subsidiary in Hong Kong, CleanChip
Technologies Limited, to act on our behalf in Asian markets outside
the PRC by, for example, serving as a trading partner between ACM
Shanghai and its customers, procuring raw materials and components,
performing sales and marketing activities, and making strategic
investments.
In September 2018,
we announced the opening of a second factory in the Pudong region
of Shanghai. The new facility has a total of 50,000 square feet of
available floor space for production capacity. This is in addition
to our first factory in the Pudong Region of Shanghai, which has a
total of 36,000 square feet of available floor space.
Recent
Equity Transactions
Issuance and Subsequent Exercise of Warrant
In December 2016
Shengxin (Shanghai) Management Consulting Limited Partnership, or
SMC, paid 20,123,500 RMB ($3.0 million as of the date of funding)
to ACM Shanghai for investment pursuant to terms to be subsequently
negotiated. SMC is a PRC limited partnership owned by Jian Wang and
other employees of our subsidiary ACM Shanghai. Jian Wang, who is
the general partner of SMC, is our Vice President, Research and
Development and the brother of David H. Wang, who is our Chief
Executive Officer, President and Chair of the Board. In connection
with that investment, we issued to SMC in March 2017 a warrant
exercisable to purchase 397,502 shares of Class A common stock at a
price of $7.50 per share, for a total exercise price of $3.0
million. The warrant was exercisable for cash or on a cashless
basis, at the option of SMC, at any time on or before May 17, 2023
to acquire all, but not less than all, of the shares of Class A
common stock subject to the warrant. In March 2018 we entered into
a warrant exercise agreement with ACM Shanghai and SMC pursuant to
which SMC exercised the SMC warrant in full by issuance to us of a
senior secured promissory note in the principal amount of $3.0
million. We transferred the SMC note to ACM Shanghai, in exchange
for an intercompany promissory note issued by ACM Shanghai to us in
the principal amount of $3.0 million. Each of the two notes bears
interest at a rate of 3.01% per annum and matures on August 17,
2023. As security for its performance of its obligations under its
note, SMC granted to ACM Shanghai a security interest in the
397,502 shares of Class A common stock issued to SMC upon its
exercise of the warrant.
41
Strategic Investment in Key Supplier
Ninebell Co., Ltd.,
or Ninebell, which is located in Seoul, Korea, is the principal
supplier of robotic delivery system subassemblies used in our
single-wafer cleaning equipment. On September 6, 2017 we and
Ninebell entered into:
●
an ordinary share
purchase agreement, effective as of September 11, 2017, pursuant to
which, contemporaneously with signing, Ninebell issued to us, for a
purchase price of $1.2 million, ordinary shares representing 20% of
Ninebell’s post-closing equity; and
●
a common stock
purchase agreement, effective as of September 11, 2017, pursuant to
which, contemporaneously with signing, we issued 133,334 shares of
Class A common stock to Ninebell for a purchase price of $7.50 per
share, or an aggregate purchase price of $1.0 million.
In addition, under
the ordinary share purchase agreement, Ninebell granted us a
preemptive right for all future issuances of equity-related
securities by Ninebell and the founder of Ninebell, who is the only
other equity holder of Ninebell, granted us a right of first
refusal with respect to any future sales of his equity
securities.
IPO and Concurrent Private Placements
In November 2017 we
issued 2,233,000 shares of Class A common stock and received net
proceeds of $11.7 million from our initial public offering, or the
IPO, and concurrently we issued an additional 1,333,334 shares of
Class A common stock through a private placement for net proceeds
of $7.1 million.
Acquisition of Outstanding Minority Interests in ACM
Shanghai
Until August 31,
2017, ACM Research owned 62.87% of the outstanding equity interests
in ACM Shanghai and three PRC-based third-party investors held the
remaining 37.13% of equity interests, which were reflected as
“non-controlling interests” in our consolidated balance
sheets and related notes. In 2017 we took the following actions in
order to enable ACM Research to acquire, consistent with
requirements of arrangements previously entered into in connection
with the investors’ acquisition of ACM Shanghai equity
interests, the outstanding non-controlling interests in ACM
Shanghai:
●
In March 2017 we
entered into a securities purchase agreement with Shanghai Science
and Technology Venture Capital Co., Ltd., or SSTVC, which held
18.77% of the ACM Shanghai equity interests. Pursuant to that
agreement, effective as of August 31, 2017, we (a) acquired, for a
purchase price of $5.8 million, SSTVC’s equity interests in
ACM Shanghai and (b) issued to SSTVC, for a purchase price of $5.8
million, shares of Series E preferred stock that has converted,
upon the closing of the IPO, into 1,666,170 shares of Class A
common stock, at an effective purchase price of $3.48 per
share.
●
In August 2017 we
entered into a securities purchase agreement with Shanghai Pudong
High-Tech Investment Co., Ltd., or PDHTI, and its subsidiary Pudong
Science and Technology (Cayman) Co., Ltd., or PST, pursuant to
which we (a) submitted the winning bid, in an auction process
mandated by PRC regulations, to purchase PDHTI’s 10.78%
equity interests in ACM Shanghai, which we completed on November 8,
2017, and (b) issued to PST, on September 8, 2017, 1,119,576 shares
of Class A common stock for a purchase price of $7.50 per share,
representing an aggregate purchase price of $8.4
million.
●
In August 2017 we
entered into a securities purchase agreement with Shanghai
Zhangjiang Science & Technology Venture Capital Co., Ltd., or
ZSTVC, and its subsidiary Zhangjiang AJ Company Limited, or ZJAJ,
pursuant to which we (a) submitted the winning bid, in an auction
process mandated by PRC regulations, to purchase ZSTVC’s
7.58% equity interests in ACM Shanghai, which we completed on
November 8, 2017, and (b) issued to ZJAJ, on September 8, 2017,
787,098 shares of Class A common stock for a purchase price of
$7.50 per share, or an aggregate purchase price of $5.9
million.
Since November 8,
2017, ACM Research has owned all of the outstanding equity
interests in ACM Shanghai.
42
Key
Components of Results of Operations
Revenue
We develop,
manufacture and sell single-wafer wet cleaning equipment and
custom-made wafer assembly and packaging equipment. Because we
currently sell tools to a small number of customers and we
customize those tools to fulfill the customers’ specific
requirements, our revenue generation fluctuates, depending on the
length of the sales, development and evaluation
phases:
●
Sales and Development. During the sale
process we may, depending on a prospective customer’s
specifications and requirements, need to perform additional
research, development and testing to establish that a tool can meet
the prospective customer’s requirements. We then host an
in-house demonstration of the customized tool prototype. Sales
cycles for orders that require limited customization and do not
require that we develop new technology usually take from 6 to 12
months, while the product life cycle, including the initial design,
demonstration and final assembly phases, for orders requiring
development and testing of new technologies can take as long as 2
to 4 years. As we expand our customer base, we expect to gain more
repeat purchase orders for tools that we have already developed and
tested, which will eliminate the need for a demonstration phase and
shorten the development cycle.
●
Evaluation Periods. When a chip
manufacturer proposes to purchase a particular type of tool from us
for the first time, we offer the manufacturer an opportunity to
evaluate the tool for a period that can extend for 24 months or
longer. We do not receive any payment on first-time purchases until
the tool is accepted. As a result, we may spend between $1.0 and
$2.0 million to produce a tool without receiving payment for
more than 24 months or, if the tool is not accepted, without
receiving any payment. Please see “Item 1A. Risk
Factors—Risks Related to Our Business and Our
Industry—We may incur significant expenses long before we can
recognize revenue from new products, if at all, due to the costs
and length of research, development, manufacturing and customer
evaluation process cycles.”
●
Purchase Orders. In accordance with
industry practice, sales of our tools are made pursuant to purchase
orders. Each purchase order from a customer for one of our tools
contains specific technical requirements intended to ensure, among
other things, that the tool will be compatible with the
customer’s manufacturing process line. Until a purchase order
is received, we do not have a binding purchase commitment. Our SAPS
and TEBO customers to date have provided us with non-binding one-
to two-year forecasts of their anticipated demands, and we expect
future customers to furnish similar non-binding forecasts for
planning purposes. Any of those forecasts would be subject to
change, however, by the customer at any time, without notice to
us.
●
Fulfillment. We seek to obtain a
purchase order for a tool from three to four months in advance of
the expected delivery date. Depending upon the nature of a
customer’s specifications, the lead time for production of a
tool generally will extend from two to four months. The
lead-time can be as long as six months, however, and in some cases
we may need to begin producing a tool based on a customer’s
non-binding forecast, rather than waiting to receive a binding
purchase order.
We expect our sales
prices generally to range from $2 million to more than $5 million
for our single-wafer wet cleaning tools. The sales price of a
particular tool will vary depending upon the required
specifications. We have designed equipment models using a modular
configuration that we customize to meet customers’ technical
specifications. For example, our Ultra C models for SAPS, TEBO and
Tahoe solutions use common modular configurations that enable us to
create a wet-cleaning tool meeting a customer’s specific
requirements, while using pre-existing designs for chamber,
electrical, chemical delivery and other modules.
Because of the
relatively large purchase prices of our tools, customers generally
pay in installments. For a customer’s repeat purchase of a
particular type of tool, the specific payment terms are negotiated
in connection with acceptance milestones of a purchase order. Based
on our limited experience with repeat sales of our tools, we expect
that we will receive an initial payment upon delivery of a tool in
connection with a repeat purchase, with the balance being paid once
the tool has been tested and accepted by the customer. Our sales
arrangements for repeat purchases do not include a general right of
return.
43
Based on our market
experience, we believe that implementation of our equipment by one
of our selected leading companies will attract and encourage other
manufacturers to evaluate our equipment, because the leading
company’s implementation will serve as validation of our
equipment and will enable the other manufacturers to shorten their
evaluation processes. We placed our first SAPS-based tool in 2009
as a prototype. We worked closely with the customer for two years
in debugging and modifying the tool, and the customer then spent
two more years of qualification and running pilot production before
beginning volume manufacturing. We expect that the period from new
product introduction to high volume manufacturing will be three
years or less in the future. Please see “Item 1A. Risk
Factors—Business—We depend on a small number of
customers for a substantial portion of our revenue, and the loss
of, or a significant reduction in orders from, one or more of our
major customers could have a material adverse effect on our revenue
and operating results. There are also a limited number of potential
customers for our products.”
All of our sales in
2018 and 2017 were to customers located in Asia, and we anticipate
that a substantial majority of our revenue will continue to come
from customers located in this region for the near future. We have
increased our sales efforts to penetrate the markets in North
America and Western Europe.
We utilize the
guidance set forth in Accounting Standards Update, or ASU, No.
2014-09, Revenue from Contracts
with Customers (Topic 606), of the Financial Accounting
Standards Board, or FASB, regarding the recognition, presentation
and disclosure of revenue in our financial statements as described
below under “—Critical Accounting Policies and
Significant Judgments and Estimates—Revenue
Recognition.”
We offer extended
maintenance service contracts to provide services such as
trouble-shooting or fine-tuning tools, and installing spare parts,
following expiration of applicable initial warranty coverage
periods, which for sales to date have extended from 12 to
36 months as described under “—Critical Accounting
Policies and Significant Judgments and
Estimates—Warranty.” A limited number of the
single-wafer wet cleaning tools we have sold to date are no longer
covered by their initial warranties. In 2018 and 2017, we received
payments for parts and labor for service activities provided from
time to time, but as of December 31, 2018 we had not yet entered
into extended maintenance service contracts with respect to any of
the tools for which initial warranty coverage had expired. We
expect to enter into extended maintenance service contracts with
customers as additional initial warranties expire, but we do not
expect revenue from extended maintenance service contracts to
represent a material portion of our revenue in the
future.
The loss or delay
of one or more large sale transactions in a quarter could impact
our results of operations for that quarter and any future quarters
for which revenue from that transaction is lost or delayed, as
described under “Item 1A. Risk Factors—Risks Related to
Our Business and Our Industry—Our quarterly operating results
can be difficult to predict and can fluctuate substantially, which
could result in volatility in the price of Class A common
stock.” It is difficult to predict accurately when, or even
if, we can complete a sale of a tool to a potential customer or to
increase sales to any existing customer. Our tool demand forecasts
are based on multiple assumptions, including non-binding forecasts
received from customers years in advance, each of which may
introduce error into our estimates. Difficulties in forecasting
demand for our tools make it difficult for us to project future
operating results and may lead to periodic inventory shortages or
excess spending on inventory or on tools that may not be purchased,
as further described in “Item 1A. Risk Factors—Risks
Related to Our Business and Our Industry—Difficulties in
forecasting demand for our tools may lead to periodic inventory
shortages or excess spending on inventory items that may not be
used.”
Cost of Revenue
Cost of revenue for
capital equipment consists primarily of:
●
direct costs, which
consist principally of costs of tool components and subassemblies
purchased from third-party vendors;
●
compensation of
personnel associated with our manufacturing operations, including
stock-based compensation;
●
depreciation of
manufacturing equipment;
●
amortization of
costs of software used for manufacturing purposes;
●
other expenses
attributable to our manufacturing department; and
●
allocated overhead
for rent and utilities.
44
We are not party to
any long-term purchasing agreements with suppliers. Please see
“Item 1A. Risk Factors—Risks Related to Our Business
and Our Industry—Our customers do not enter into long-term
purchase commitments, and they may decrease, cancel or delay their
projected purchases at any time.”
As our customer
base and tool installations continue to grow, we will need to hire
additional manufacturing personnel. The rates at which we add
customers and install tools will affect the level and time of this
spending. In addition, because we often import components and spare
parts from the United States, we have experienced, and expect to
continue to experience, the effect of the dollar’s growth on
our cost of revenue.
Gross Margin
Our gross margin
was 46.2% in 2018 and 47.2% in 2017. Gross margin may vary from
period to period, primarily related to the level of utilization and
the timing and mix of purchase orders. We expect gross margin to
range between 40% and 45% for the foreseeable future, with direct
manufacturing costs approximating 50% to 55% of revenue and
overhead costs totaling approximately 5% of revenue.
We seek to maintain
our gross margin by continuing to develop proprietary technologies
that avoid pricing pressure for our wet cleaning equipment. We
actively manage our operations through principles of operational
excellence designed to ensure continuing improvement in the
efficiency and quality of our manufacturing operations by, for
example, implementing factory constraint management and change
control and inventory management systems. In addition, our
purchasing department actively seeks to identify and negotiate
supply contracts with improved pricing to reduce cost of
revenue.
A significant
portion of our raw materials are denominated in Renminbi, or RMB,
while the majority of our purchase orders are denominated in U.S.
dollars. As a result, currency exchange rates may have a
significant effect on our gross margin.
Operating Expenses
We have
experienced, and expect to continue to experience, growth in the
dollar amount of our operating expenses, as we make investments to
support the anticipated growth of our customer base and the
continued development of proprietary technologies. As we continue
to grow our business, we expect operating expenses to increase in
absolute dollars.
Sales
and Marketing
Sales and marketing
expense accounted for 12.9% of our revenue in 2018 and 15.1% of our
revenue in 2017. Sales and marketing expense consists primarily
of:
●
compensation of
personnel associated with pre- and after-sales support and other
sales and marketing activities, including stock-based
compensation;
●
sales commissions
paid to independent sales representatives;
●
fees paid to sales
consultants;
●
shipping and
handling costs for transportation of products to
customers;
●
cost of trade
shows;
●
travel and
entertainment; and
●
allocated overhead
for rent and utilities.
Sales and marketing
expense can be significant and may fluctuate, in part because of
the resource-intensive nature of our sales efforts and the length
and variability of our sales cycle. The length of our sales cycle,
from initial contact with a customer to the execution of a purchase
order, is generally 6 to 24 months.
During the sales
cycle, we expend significant time and money on sales and marketing
activities, including educating customers about our tools,
participating in extended tool evaluations and configuring our
tools to customer-specific needs. Sales and marketing expense in a
given period can be particularly affected by the increase in travel
and entertainment expenses associated with the finalization of
purchase orders or the installation of tools.
45
We expect that, for
the foreseeable future, sales and marketing expense will increase
in absolute dollars, as we continue to invest in sales and
marketing by hiring additional employees and expanding marketing
programs in existing or new markets. We must invest in sales and
marketing processes in order to develop and maintain close
relationships with customers. We are making dollar-based
investments in dollars in order to support growth of our customer
base in the United States, and the relative strength of the dollar
could have a significant effect on our sales and marketing
expense.
Research
and Development
Research and
development expense accounted for 13.9% of our revenue in 2018 and
14.1% of our revenue in 2017. Research and development expense
relates to the development of new products and processes and
encompasses our research, development and customer support
activities. Research and development expense consists primarily
of:
●
compensation of
personnel associated with our research and development activities,
including stock-based compensation;
●
costs of components
and other research and development supplies;
●
travel expense
associated with customer support;
●
amortization of
costs of software used for research and development purposes;
and
●
allocated overhead
for rent and utilities.
Some of our
research and development has been funded by grants from the PRC
government, as described in “—PRC Government Research
and Development Funding” below.
We expect that, for
the foreseeable future, research and development expense will
increase in absolute dollars and will range between 18% and 22% of
revenue, as we continue to invest in research and development to
advance our technologies. We intend to continue to invest in
research and development to support and enhance our existing
single-wafer wet cleaning products and to develop future product
offerings to build and maintain our technology leadership
position.
General
and Administrative
General and
administrative expense accounted for 10.7% of our revenue in 2018
and 16.1% of our revenue in 2017. General and administrative
expense consists primarily of:
●
compensation of
executive, accounting and finance, human resources, information
technology, and other administrative personnel, including
stock-based compensation;
●
professional fees,
including accounting and legal fees;
●
other corporate
expenses; and
●
allocated overhead
for rent and utilities.
We expect that, for
the foreseeable future, general and administrative expense will
increase in absolute dollars, as we incur additional costs
associated with growing our business and operating as a public
company, but will continue to decrease as a percentage of our total
revenue.
Stock-Based
Compensation Expense
We grant stock
options to employees and non-employee consultants and directors,
and we accounts for those stock-based awards in accordance with
Accounting Standards Codification, or ASC, Topic 718, Compensation—Stock Compensation
and ASC Subtopic 505-50, Equity-Based Payments to Non-Employees,
each as adopted by the FASB.
●
Stock-based awards
granted to employees are measured at the fair value of the awards
on the grant date and are recognized as expenses either
(a) immediately on grant, if no vesting conditions are
required, or (b) using the graded vesting method, net of
estimated forfeitures, over the requisite service period. The fair
value of stock options is determined using the Black-Scholes
valuation model. Stock-based compensation expense, when recognized,
is charged to cost of revenue or to the category of operating
expense corresponding to the employee’s service
function.
●
Stock-based awards
granted to non-employees are accounted for at the fair value of the
awards at the earlier of (a) the date at which a commitment
for performance by the non-employee to earn the awards is reached
and (b) the date at which the non-employee’s performance
is complete. The fair value of such non-employee awards is
re-measured at each reporting date using the fair value at each
period end until the vesting date. Changes in fair value between
the reporting dates are recognized by the graded vesting
method.
46
Cost of revenue and
operating expenses during the periods presented below have included
stock-based compensation as follows:
|
|
Year Ended
December 31,
|
|
|
|
2018
|
2017
|
|
|
(in thousands)
|
|
|
Stock-Based
Compensation Expense:
|
|
|
|
Cost of
revenue
|
$71
|
$21
|
|
Sales and marketing
expense
|
120
|
53
|
|
Research and
development expense
|
255
|
50
|
|
General and
administrative expense
|
2,917
|
1,499
|
|
|
$3,363
|
$1,623
|
We recognized
stock-based compensation expense to employees of $0.7 million in 2018 and $0.3 million in
2017. As of December 31, 2018 and 2017, we had $2.4 million
and $0.7 million of total unrecognized employee share-based
compensation expense, net of estimated forfeitures, related to
unvested share-based awards. These are expected to be recognized
over a weighted-average period of 1.62 years and 1.77 years,
respectively.
We recognized
stock-based compensation expense to non-employees of $2.7 million
in 2018 and $1.4 million in 2017. The fair value of each option
granted to a non-employee is re-measured at each period end until
the vesting date.
PRC Government Research and Development Funding
ACM Shanghai has
received four grants from local and central governmental
authorities in the PRC. The first grant, which was awarded in 2008,
relates to the development and commercialization of 65nm to 45nm
stress-free polishing technology. The second grant was awarded in
2009 to fund interest expense on short-term borrowings. The third
grant was made in 2014 and relates to the development of electro
copper-plating technology. The fourth grant was made in June 2018
and related to development of polytetrafluoroethylene. PRC
governmental authorities provide the majority of the funding,
although ACM Shanghai is also required to invest certain amounts in
the projects.
The PRC
governmental grants contain certain operating conditions, and we
are required to go through a government due diligence process once
the project is complete. The grants therefore are recorded as
long-term liabilities upon receipt, although we are not required to
return any funds we receive. Grant amounts are recognized in our
statements of operations and comprehensive income as
follows:
●
Government
subsidies relating to current expenses are reflected as reductions
of those expenses in the periods in which they are reported. Those
reductions totaled $1.5 million in 2018 and $3.4 million in
2017.
●
Government grants
used to acquire depreciable assets are transferred from long-term
liabilities to property, plant and equipment when the assets are
acquired and then the recorded amounts of the assets are credited
to other income over the useful lives of the assets. Related
government subsidies recognized as other income totaled $0.1
million in 2018 and in 2017.
Net Income Attributable to Non-Controlling Interests
From
January 1, 2015 to August 31, 2017, ACM Research owned
62.87% of the equity interests of ACM Shanghai, with three
non-controlling, unrelated investors holding the remainder. ACM
Research acquired all of the non-controlling interests from
minority investors in several transactions during 2017. Following
these transactions, ACM Research owned 100% of the ACM Shanghai
subsidiary.
47
How
We Evaluate Our Operations
We present
information below with respect to four measures of financial
performance:
●
We define
“shipments” of tools to include (a) a
“repeat” delivery to a customer of a type of tool that
the customer has previously accepted, for which we recognize
revenue upon delivery, and (b) a “first-time”
delivery of a “first tool” to a customer on an approval
basis, for which we may recognize revenue in the future if
contractual conditions are met and customer acceptance is
received.
●
We define
“adjusted EBITDA” as our net income excluding interest
expense (net), income tax benefit (expense), depreciation and
amortization, and stock-based compensation. We define adjusted
EBITDA to also exclude restructuring costs, although we have not
incurred any such costs to date.
●
We define
“free cash flow” as net cash provided by operating
activities less purchases of property and equipment (net of
proceeds from disposals) and of intangible assets.
●
We define
“adjusted operating income (loss)” as our income (loss)
from operations excluding stock-based compensation.
These financial
measures are not based on any standardized methodologies prescribed
by accounting principles generally accepted in the United States,
or GAAP, and are not necessarily comparable to similarly titled
measures presented by other companies.
We have presented
shipments, adjusted EBITDA, free cash flow and adjusted operating
income (loss) because they are key measures used by our management
and board of directors to understand and evaluate our operating
performance, to establish budgets and to develop operational goals
for managing our business. We believe that these financial measures
help identify underlying trends in our business that could
otherwise be masked by the effect of the expenses that we exclude.
In particular, we believe that the exclusion of the expenses
eliminated in calculating adjusted EBITDA and adjusted operating
income (loss) can provide useful measures for period-to-period
comparisons of our core operating performance and that the
exclusion of property and equipment purchases from operating cash
flow can provide a usual means to gauge our capability to generate
cash. Accordingly, we believe that these financial measures provide
useful information to investors and others in understanding and
evaluating our operating results, enhancing the overall
understanding of our past performance and future prospects, and
allowing for greater transparency with respect to key financial
metrics used by our management in its financial and operational
decision-making.
Shipments, adjusted
EBITDA, free cash flow and adjusted operating income (loss) are not
prepared in accordance with GAAP, and should not be considered in
isolation of, or as an alternative to, measures prepared in
accordance with GAAP.
Shipments
Shipments consist
of two components:
●
a shipment to a
customer of a type of tool that the customer has
previously-accepted, for which we recognize revenue when the tool
is delivered; and
●
a shipment to a
customer of a type of tool that the customer is receiving and
evaluating for the first time, in each case a “first
tool,” for which we may recognize revenue at a later date,
subject to the customer’s acceptance of the tool upon the
tool’s satisfaction of applicable contractual
requirements.
“First
tool” shipments can be made to either an existing customer
that not previously accepted that specific type of tool in the past
─ for example, a delivery of SAPS V tool to a customer that
previously had received only SAPS II tools ─ or to a new
customer that has never purchased any tool from us.
Shipments for the
year ended December 31, 2018 totaled $95.1 million, as compared to
$40.1 million of shipments in the year ended December 31,
2017.
48
The dollar amount
attributed to a “first tool” shipment is equal to the
consideration we expect to receive if any and all contractual
requirements are satisfied and the customer accepts the tool. There
are a number of limitations related to the use of shipments in
evaluating our business, including that customers have significant
discretion in determining whether to accept our tools and their
decision not to accept delivered tools is likely to result in our
inability to recognize revenue from the delivered
tools.
Adjusted EBITDA
There are a number
of limitations related to the use of adjusted EBITDA rather than
net income (loss), which is the nearest GAAP equivalent. Some of
these limitations are:
●
adjusted EBITDA
excludes depreciation and amortization and, although these are
non-cash expenses, the assets being depreciated or amortized may
have to be replaced in the future;
●
we exclude
stock-based compensation expense from adjusted EBITDA and adjusted
operating income (loss), although (a) it has been, and will
continue to be for the foreseeable future, a significant recurring
expense for our business and an important part of our compensation
strategy and (b) if we did not pay out a portion of our
compensation in the form of stock-based compensation, the cash
salary expense included in operating expenses would be higher,
which would affect our cash position;
●
the expenses and
other items that we exclude in our calculation of adjusted EBITDA
may differ from the expenses and other items, if any, that other
companies may exclude from adjusted EBITDA when they report their
operating results;
●
adjusted EBITDA
does not reflect changes in, or cash requirements for, working
capital needs;
●
adjusted EBITDA
does not reflect interest expense, or the requirements necessary to
service interest or principal payments on debt;
●
adjusted EBITDA
does not reflect income tax expense (benefit) or the cash
requirements to pay taxes;
●
adjusted EBITDA
does not reflect historical cash expenditures or future
requirements for capital expenditures or contractual
commitments;
●
although
depreciation and amortization charges are non-cash charges, the
assets being depreciated and amortized will often have to be
replaced in the future, and adjusted EBITDA does not reflect any
cash requirements for such replacements; and
●
adjusted EBITDA
includes expense reductions and non-operating other income
attributable to PRC governmental grants, which may mask the effect
of underlying developments in net income (loss), including trends
in current expenses and interest expense, and free cash flow
includes the PRC governmental grants, the amount and timing of
which can be difficult to predict and are outside our
control.
The following table
reconciles net income (loss), the most directly comparable GAAP
financial measure, to adjusted EBITDA:
|
|
Year
Ended December 31,
|
|
|
|
2018
|
2017
|
|
|
(in thousands)
|
|
|
Adjusted EBITDA Data:
|
|
|
|
Net
income (loss) attributable to ACM Research, Inc.
|
$6,574
|
$(318)
|
|
Interest
expense, net
|
469
|
268
|
|
Income
tax expense
|
806
|
547
|
|
Depreciation
and amortization
|
417
|
271
|
|
Stock-based
compensation
|
3,363
|
1,622
|
|
Adjusted
EBITDA
|
$11,629
|
$2,390
|
Adjusted EBITDA in
2018, as compared to $2.4 million in 2017 reflected principally an
increase of $6.9 million in net income and $1.7 million increase in
stock-based compensation. We do not exclude from adjusted EBITDA
expense reductions and non-operating other income attributable to
PRC governmental grants because we consider and incorporate the
expected amounts and timing of those grants in incurring expenses
and capital expenditures. If we did not receive the grants,
our cash expenses therefore would be lower, and our cash position
would not be affected, to the extent we have accurately anticipated
the amounts of the grants. For additional information regarding our
PRC grants, please see “—Key Components of Results of
Operations—PRC Government Research and Development
Funding.”
49
Free Cash Flow
The following table
reconciles net cash provided by operating activities, the most
directly comparable GAAP financial measure, to free cash
flow:
|
|
Year
Ended December 31,
|
|
|
|
2018
|
2017
|
|
|
(in thousands)
|
|
|
Free Cash Flow Data:
|
|
|
|
Net
cash provided by (used in) operating activities
|
$6,909
|
$(8,101)
|
|
Purchase
of property and equipment
|
(1,830)
|
(651)
|
|
Purchase
of intangible assets
|
(241)
|
(115)
|
|
Free
cash flow
|
$4,839
|
$(8,867)
|
Free cash flow in
2018, as compared to 2017, reflected the factors driving net cash
provided by (used in) operating activities, principally increase in
net income, accounts payable, advance from customers, and offset by
increase in inventories, prepaid expenses. Consistent with our
methodology for calculating adjusted EBITDA, we do not adjust free
cash flow for the effects of PRC government subsidies, because we
take those subsidies into account in incurring expenses and capital
expenditures.
Adjusted Operating Income
Adjusted operating
income excludes stock-based compensation from income (loss) from
operations. Although stock-based compensation is an important
aspect of the compensation of our employees and executives,
determining the fair value of certain of the stock-based
instruments we utilize involves a high degree of judgment and
estimation and the expense recorded may bear little resemblance to
the actual value realized upon the vesting or future exercise of
the related stock-based awards. Furthermore, unlike cash
compensation, the value of stock options, which is an element of
our ongoing stock-based compensation expense, is determined using a
complex formula that incorporates factors, such as market
volatility, that are beyond our control. Management believes it is
useful to exclude stock-based compensation in order to better
understand the long-term performance of our core business and to
facilitate comparison of our results to those of peer companies.
The use of non-GAAP financial measures excluding stock-based
compensation has limitations, however. If we did not pay out a
portion of our compensation in the form of stock-based
compensation, the cash salary expense included in operating
expenses would be higher and our cash holdings would be less. The
following tables reflect the exclusion of stock-based compensation,
or SBC, from line items comprising income (loss) from
operations:
|
|
Year
Ended December 31,
|
|||||
|
|
2018
|
2017
|
||||
|
|
Actual
(GAAP)
|
SBC
|
Adjusted
(Non-GAAP)
|
Actual
(GAAP)
|
SBC
|
Adjusted
(Non-GAAP)
|
|
|
(in thousands)
|
|||||
|
Adjusted Operating Income:
|
|
|
|
|
|
|
|
Revenue
|
$74,643
|
$-
|
$74,643
|
$36,506
|
$-
|
$36,506
|
|
Cost
of revenue
|
(40,194)
|
(71)
|
(40,123)
|
(19,281)
|
(21)
|
(19,260)
|
|
Gross
profit
|
34,449
|
(71)
|
34,520
|
17,225
|
(21)
|
17,246
|
|
Operating
expenses:
|
|
|
|
|
|
|
|
Sales
and marketing
|
(9,611)
|
(120)
|
(9,491)
|
(5,500)
|
(53)
|
(5,447)
|
|
Research
and development
|
(10,380)
|
(255)
|
(10,125)
|
(5,138)
|
(50)
|
(5,088)
|
|
General
and administrative
|
(7,987)
|
(2,917)
|
(5,070)
|
(5,887)
|
(1,499)
|
(4,388)
|
|
Income
(loss) from operations
|
$6,471
|
$(3,363)
|
$9,834
|
$700
|
$(1,623)
|
$2,323
|
50
Adjusted operating
income in 2018, as compared to 2017 reflected increases in
operating income of $5.8 million and stock-based compensation of
$1.7 million.
Critical
Accounting Policies and Significant Judgments and
Estimates
The preparation of
our consolidated financial statements in conformity with GAAP
requires management to make estimates and assumptions in applying
our accounting policies that affect the reported amounts of assets,
liabilities, revenue and expenses, and related disclosures of
contingent assets and liabilities. We base these estimates and
assumptions on historical experience, and evaluate them on an
on-going basis to ensure that they remain reasonable under current
conditions. Actual results could differ from those estimates. The
accounting policies that reflect our more significant estimates,
judgments and assumptions and that we believe are the most critical
to aid in fully understanding and evaluating our reported financial
results include the following:
Revenue Recognition
In May 2014, the
FASB issued ASU No. 2014-09, Revenue from Contracts with Customers (Topic
606), or ASU 2014-09, which amended the existing
accounting standards for revenue recognition. ASU 2014-09
establishes principles for recognizing revenue upon the transfer of
promised goods or services to customers, in an amount that reflects
the expected consideration received in exchange for those goods or
services. ASU 2014-09 and its related clarifying ASUs are effective
for annual reporting periods beginning after December 15, 2017 and
interim periods within those annual periods.
On January 1, 2018,
we adopted ASC Topic 606, Revenue from Contracts with Customers,
and all the related amendments, or the New Revenue Standard, to all
contracts that were not completed as of January 1, 2018 using the
modified retrospective method. We do not have open contracts that
may result in any changes to revenues applying the New Revenue
Standard.
We derive revenue
principally from the sale of single-wafer wet cleaning equipment.
Revenue from contracts with customers is recognized using the
following five steps pursuant to the New Revenue
Standard:
1.
identify the
contract(s) with a customer;
2.
identify the
performance obligations in the contract;
3.
determine the
transaction price;
4.
allocate the
transaction price to the performance obligations in the contract;
and
5.
recognize revenue
when (or as) the entity satisfies a performance
obligation.
A contract contains
a promise (or promises) to transfer goods or services to a
customer. A performance obligation is a promise (or a group of
promises) that is distinct. The transaction price is the amount of
consideration a company expects to be entitled from a customer in
exchange for providing the goods or services.
The unit of account
for revenue recognition is a performance obligation (a good or
service). A contract may contain one or more performance
obligations. Performance obligations are accounted for separately
if they are distinct. A good or service is distinct if the customer
can benefit from the good or service either on its own or together
with other resources that are readily available to the customer,
and the good or service is distinct in the context of the contract.
Otherwise performance obligations are combined with other promised
goods or services until we identify a bundle of goods or services
that is distinct. Promises in contracts which do not result in the
transfer of a good or service are not performance obligations, as
well as those promises that are administrative in nature, or are
immaterial in the context of the contract. We have addressed
whether various goods and services promised to the customer
represent distinct performance obligations. We applied the guidance
of ASC Topic 606-10-25-16 through 18 in order to verify which
promises should be assessed for classification as distinct
performance obligations. Our contracts with customers include more
than one performance obligation. For example, the delivery of a
piece of equipment generally includes the promise to install the
equipment in the customer’s facility. Our performance
obligations in connection with a sale of equipment generally
include production, delivery and installation, together with the
provision of a warranty.
51
The transaction
price is allocated to all the separate performance obligations in
an arrangement. It reflects the amount of consideration to which we
expect to be entitled in exchange for transferring goods or
services, which may include an estimate of variable consideration
to the extent that it is probable of not being subject to
significant reversals in the future based on our experience with
similar arrangements. The transaction price excludes amounts
collected on behalf of third parties, such as sales taxes. This is
done on a relative selling price basis using standalone selling
prices, or SSP. The SSP represents the price at which we would sell
that good or service on a standalone basis at the inception of the
contract. Given the requirement for establishing SSP for all
performance obligations, if the SSP is directly observable through
standalone sales, then such sales should be considered in the
establishment of the SSP for the performance obligation. All of our
products were sold in stand-alone arrangements, we do not have
observable SSPs for most performance obligations as they are not
regularly sold on a standalone basis. Production, delivery and
installation of a product, together with provision of a warranty,
are a single unit of accounting.
We recognize
revenue when we satisfy each performance obligation by transferring
control of the promised goods or services to the customer. Goods or
services can transfer at a point in time (upon the acceptance of
the products or upon the arrival at the destination as stipulated
in the shipment terms) in a sale arrangement. In general, we
recognize revenue when a tool has been demonstrated to meet the
customer’s predetermined specifications and is accepted by
the customer. If terms of the sale provide for a lapsing customer
acceptance period, we recognize revenue as of the earlier of the
expiration of the lapsing acceptance period and customer
acceptance. In the following circumstances, however, we recognize
revenue upon shipment or delivery, when legal title to the tool is
passed to a customer as follows:
●
when the customer
has previously accepted the same tool with the same specifications
and we can objectively demonstrate that the tool meets all of the
required acceptance criteria;
●
when the sales
contract or purchase order contains no acceptance agreement or
lapsing acceptance provision and we can objectively demonstrate
that the tool meets all of the required acceptance
criteria;
●
when the customer
withholds acceptance due to issues unrelated to product
performance, in which case revenue is recognized when the system is
performing as intended and meets predetermined specifications;
or
●
when our sales
arrangements do not include a general right of return.
We offer
post-warranty period services, which consist principally of the
installation and replacement of parts and small-scale modifications
to the equipment. The related revenue and costs of revenue are
recognized when parts have been delivered and installed, risk of
loss has passed to the customer, and collection is probable. We do
not expect revenue from extended maintenance service contracts to
represent a material portion of its revenue in the future. As such,
we have concluded that its revenue recognition under the adoption
of the New Revenue Standard will remain the same as previously
reported and will not have material impacts to its consolidated
financial statements.
We incur costs
related to the acquisition of its contracts with customers in the
form of sales commissions. Sales commissions are paid to third
party representatives and distributors. Contractual agreements with
these parties outline commission structures and rates to be paid.
Generally speaking, the contracts are all individual procurement
decisions by the customers and are not for significant periods of
time, nor do they include renewal provisions. As such, all
contracts have an economic life of significantly less than a year.
Accordingly, we expense sales commissions when incurred in
accordance with the practical expedient in the New Revenue Standard
when the underlying contract asset is less than one year. These
costs are recorded within sales and marketing
expenses.
Generally, all
contracts have expected durations of one year or less. Accordingly,
we apply the practical expedient allowed in the New Revenue
Standard and does not disclose information about remaining
performance obligations that have original expected durations of
one year or less.
We do not incur any
costs to fulfill the contracts with customers that are not already
reported in compliance with another applicable standard (for
example, inventory or plant, property and equipment).
52
Stock-Based Compensation
We account for
grants of stock options based on their grant date fair value and
recognize compensation expense over the vesting periods. We
estimate the fair value of stock options as of the date of grant
using the Black-Scholes option pricing model. Stock options granted
to non-employees are subject to periodic revaluation over their
vesting terms.
Stock-based
compensation expense represents the cost of the grant date fair
value of employee stock option grants recognized over the requisite
service period of the awards (usually the vesting period) on a
straight-line basis, net of estimated forfeitures. We estimate the
fair value of stock option grants using the Black-Scholes option
pricing model, which requires the input of highly subjective
assumptions, including (a) the risk-free interest rate,
(b) the expected volatility of our stock, (c) the
expected term of the award and (d) the expected dividend
yield.
●
Prior to our
initial public offering in November 2017, or the IPO, the board of
directors considered a number of objective and subjective factors
to determine the best estimate of the fair value of our common
stock. The factors included: contemporaneous third-party valuations
of our common stock; the prices, rights, preferences and privileges
of our preferred stock relative to the common stock; the prices of
convertible preferred stock sold by us to third-party investors;
our operating and financial results; the lack of marketability of
our common stock; the U.S. and global economic and capital market
conditions and outlook; and the likelihood of achieving a liquidity
event for the shares of common stock underlying these stock
options, such as an initial public offering or sale of our company,
given prevailing market conditions. Since the IPO, we have used the
market closing price for the Class A common stock as reported on
the Nasdaq Global Market to determine the fair value of the Class A
common stock.
●
The risk-free
interest rates for periods within the expected life of the option
are based on the yields of zero-coupon U.S. Treasury
securities.
●
Due to a lack of
company-specific historical and implied volatility data, we have
based our estimate of expected volatility on the historical
volatility of a group of similar companies that are publicly
traded. For these analyses, we have selected companies with
comparable characteristics to ours including enterprise value, risk
profile, position within the industry, and with historical share
price information sufficient to meet the expected life of the
stock-based awards. We compute the historical volatility data using
the daily closing prices for the selected companies’ shares
during the equivalent period of the calculated expected term of our
stock-based awards. We will continue to apply this process until a
sufficient amount of historical information regarding the
volatility of our own stock price becomes available.
●
The expected term
represents the period of time that options are expected to be
outstanding. The expected term of stock options is based on the
average between the vesting period and the contractual term for
each grant according to Staff Accounting Bulletin No.
110.
●
The expected
dividend yield is assumed to be 0%, based on the fact that we have
never paid cash dividends and have no present intention to pay cash
dividends.
For employee stock
option grants made during the years ended December 31, 2018 and
2017, the weighted-average assumptions used in the Black-Scholes
option pricing model to determine the fair value of those grants
were as follows:
|
|
Year
Ended December 31,
|
||
|
|
2018
|
|
2017
|
|
Risk-free
interest rate
|
2.55%-2.96%
|
|
2.21%-2.22%
|
|
Expected
volatility
|
39.14%-43.00%
|
|
28.62%-29.18%
|
|
Expected
term (in years)
|
6.25
|
|
6.25
|
|
Expected
dividend yield
|
0%
|
|
0%
|
53
For non-employee
stock option grants made during the years ended December 31, 2018
and 2017, the weighted-average assumptions used in the
Black-Scholes option pricing model to determine the fair value of
those grants were as follows:
|
|
Year
Ended December 31,
|
||
|
|
2018
|
|
2017
|
|
Risk-free interest
rate
|
2.39%-2.94%
|
|
1.62%-2.43%
|
|
Expected
volatility
|
40.24%-45.48%
|
|
28.71% - 29.41%
|
|
Expected
term ( in years)
|
2.58-5.36
|
|
3.58-6.25
|
|
Expected
dividend yield
|
0%
|
|
0%
|
The following table
summarizes by grant date the number of shares of common stock
underlying stock options granted since January 1, 2017, as
well as the associated per share exercise price and the estimated
fair value per share of common stock on the grant
date:
|
Grant
Dates
|
Number
of Common Shares Underlying Options Granted
|
Exercise
Price per Common Share
|
Estimated
Fair Value per Common Share
|
|
May
1, 2015
|
783,338
|
$1.50
|
$1.50
|
|
September
8, 2015
|
263,335
|
1.50
|
1.50
|
|
December
28, 2016
|
1,424,596
|
3.00
|
2.28
|
|
March
9, 2017
|
33,334
|
7.50
|
7.50
|
|
May
9, 2017
|
183,335
|
7.50
|
7.50
|
|
November
2, 2017
|
120,002
|
5.60
|
5.60
|
|
January
25, 2018
|
500,000
|
5.31
|
5.31
|
|
August
1, 2018
|
245,700
|
13.85
|
13.85
|
As of
December 31, 2018, the unrecognized compensation cost related
to outstanding options was $2.4 million and is expected to be
recognized as expense over a weighted-average of 1.62 years. As of
December 31, 2017, the unrecognized compensation cost related to
outstanding options was $729,000 and is expected to be recognized
as expense over a weighted-average of 1.77 years.
As of December 31,
2018, we had outstanding stock options to acquire an aggregate of
3,715,779 shares of Class A common stock with an intrinsic
value of $27.1 million. Of those outstanding options,
(a) 2,273,880 shares had vested as of December 31, 2018,
representing an intrinsic value of $20.0 million and
(b) 1,441,899 shares were unvested, representing an intrinsic
value of $7.1 million.
Inventory
Inventories consist
of finished goods, raw materials, work-in-process and consumable
materials. Finished goods are comprised of direct materials, direct
labor, depreciation and manufacturing overhead. Inventory is stated
at the lower of cost and net recognizable value of the inventory at
December 31, 2018 and 2017. The cost of a general inventory item is
determined using the weighted average method. The cost of an
inventory item purchased specifically for a customized tool is
determined using the specific identification method. Market value
is determined as the lower of replacement cost and net realizable
value, which is the estimated selling price, in the ordinary course
of business, less estimated costs to complete or
dispose.
We assess the
recoverability of all inventories quarterly to determine if any
adjustments are required. We write down excess or obsolete
tool-related inventory based on management’s analysis of
inventory levels and forecasted 12-month demand and technological
obsolescence and spare parts inventory based on forecasted usage.
These factors are affected by market and economic conditions,
technology changes, new product introductions and changes in
strategic direction, and they require estimates that may include
uncertain elements. Actual demand may differ from forecasted
demand, and those differences may have a material effect on
recorded inventory values.
54
Our manufacturing
overhead standards for product costs are calculated assuming full
absorption of forecasted spending over projected volumes, adjusted
for excess capacity. Abnormal inventory costs such as costs of idle
facilities, excess freight and handling costs, and spoilage are
recognized as current period charges.
Allowance for Doubtful Accounts
Accounts receivable
are reflected in our consolidated balance sheets at their estimated
collectible amounts. A substantial majority of our accounts
receivable are derived from sales to large multinational
semiconductor manufacturers in Asia. We follow the allowance method
of recognizing uncollectible accounts receivable, pursuant to which
we regularly assess our ability to collect outstanding customer
invoices and make estimates of the collectability of accounts
receivable. We provide an allowance for doubtful accounts when we
determine that the collection of an outstanding customer receivable
is not probable. The allowance for doubtful accounts is reviewed on
a quarterly basis to assess the adequacy of the allowance. We take
into consideration (a) accounts receivable and historical bad
debts experience, (b) any circumstances of which we are aware
of a customer’s inability to meet its financial obligations,
(c) changes in our customer payment history, and (d) our
judgments as to prevailing economic conditions in the industry and
the impact of those conditions on our customers. If circumstances
change, such that the financial conditions of our customers are
adversely affected and they are unable to meet their financial
obligations to us, we may need to record additional allowances,
which would result in a reduction of our net income.
Property, Plant and Equipment
Assets comprising
property, plant and equipment are recorded at cost. Depreciation is
recorded on a straight-line basis over the estimated useful lives
of the assets and begins when the assets are placed in service.
Betterments or renewals are capitalized when incurred. Maintenance
and repairs with respect to an asset are expensed as incurred if
they neither materially add to the value of the asset nor
appreciably prolong its life. Assets comprising plant, property and
equipment are reviewed each year to determine whether any events or
circumstances indicate that the carrying amount of the asset may
not be recoverable.
Intangible Assets
Intangible assets
represent the fair value of separately recognizable intangible
assets acquired in connection with our business operations. We
evaluate intangibles for impairment on an annual basis or whenever
events or circumstances indicate that an impairment may have
occurred.
Valuation of Long-Lived Assets
Long-lived assets
are evaluated for impairment whenever events or changes in
circumstance indicate that the carrying value of an asset may not
be fully recoverable or that the useful life is shorter than we had
originally estimated. When these events or changes occur, we
evaluate the impairment of the long-lived assets by comparing the
carrying value of the assets to an estimate of future undiscounted
cash flows expected to be generated from the use of the assets and
their eventual disposition. If the sum of the expected future
undiscounted cash flow is less than the carrying value of the
assets, we recognize an impairment loss based on the excess of the
carrying value over the fair value. No impairment charge was
recognized in 2018 and 2017.
Income Taxes
Income taxes are
accounted for using the liability method. Under this method,
deferred income tax assets and liabilities are recognized for the
future tax consequences attributable to temporary differences
between the financial statement carrying amounts of existing assets
and liabilities and their respective tax bases. Deferred income tax
assets and liabilities are measured using enacted tax rates
expected to apply to taxable income in the years in which these
temporary differences are expected to be recovered or settled. The
effect on deferred tax assets and liabilities of a change in tax
rates is recognized in income in the period that includes the
enactment date. A valuation allowance would be provided for the
deferred tax assets if it is more likely than not that the related
benefit will not be realized.
55
On a quarterly
basis, we provide income tax provisions based upon an estimated
annual effective income tax rate. The effective tax rate is highly
dependent upon the geographic composition of worldwide earnings,
tax regulations governing each region, availability of tax credits
and the effectiveness of our tax planning strategies. We carefully
monitor the changes in many factors and adjust our effective income
tax rate on a timely basis. If actual results differ from these
estimates, this could have a material effect on our financial
condition and results of operations.
We maintained a
partial valuation allowance as of December 31, 2018 with
respect to certain net deferred tax assets based on our estimates
of recoverability. We determined that the partial valuation
allowance was appropriate given our historical operating losses and
uncertainty with respect to our ability to generate profits from
our business model sufficient to take advantage of the deferred tax
assets in all applicable tax jurisdictions.
The calculation of
our tax liabilities involves dealing with uncertainties in the
application of complex tax regulations. In accordance with the
authoritative guidance on accounting for uncertainty in income
taxes, we recognize liabilities for uncertain tax positions based
on the two-step process. The first step is to evaluate the tax
position for recognition by determining if the weight of available
evidence indicates that it is more likely than not that the
position will be sustained in audit, including resolution of
related appeals or litigation processes, if any. The second step is
to measure the tax benefit as the largest amount that is more than
fifty-percent likely of being realized upon ultimate settlement. We
reevaluate these uncertain tax positions on a quarterly basis. This
evaluation is based on factors including changes in facts or
circumstances, changes in tax law, effectively settled issues under
audit and new audit activity. Any change in these factors could
result in the recognition of a tax benefit or an additional charge
to the tax provision.
Interest and
penalties related to uncertain tax positions are recorded in the
provision for income tax expense on the consolidated statements of
operations.
Foreign Currency Translation
Our consolidated
financial statements are presented in U.S. dollars, which is our
reporting currency, while the functional currency of our
subsidiaries in the PRC is RMB, and the functional currency of our
subsidiary in Korea is the Korean Won. Transactions in foreign
currencies are initially recorded at the functional currency rate
prevailing at the date of the transactions. Any difference between
the initially recorded amount and the settlement amount is recorded
as a gain or loss on foreign currency transaction in our
consolidated statements of operations. Monetary assets and
liabilities denominated in a foreign currency are translated at the
functional currency rate of exchange as of the date of a
consolidated balance sheet. Any difference is recorded as a gain or
loss on foreign currency translation in the appropriate
consolidated statement of operations. In accordance with the
FASB’s ASC Topic 830, Foreign Currency Matters, we translate
the assets and liabilities into U.S. dollars from RMB using the
rate of exchange prevailing at the applicable balance sheet date
and the consolidated statements of operations and cash flows are
translated at an average rate during the reporting period.
Adjustments resulting from the translation are recorded in
stockholders’ equity as part of accumulated other
comprehensive income.
The PRC government
imposes significant exchange restrictions on fund transfers out of
the PRC that are not related to business operations. To date these
restrictions have not had a material impact on us because we have
not engaged in any significant transactions that are subject to the
restrictions.
Warranty
We have provided
warranty coverage on our tools for 12 to 36 months, covering labor
and parts necessary to repair a tool during the warranty period. We
account for the estimated warranty cost as sales and marketing
expense at the time revenue is recognized. Warranty obligations are
affected by historical failure rates and associated replacement
costs. Utilizing historical warranty cost records, we calculate a
rate of warranty expenses to revenue to determine the estimated
warranty charge. We update these estimated charges on a regular
basis. The actual product performance and field expense profiles
may differ, and in those cases we adjust our warranty accruals
accordingly.
56
Recent
Accounting Pronouncements
For a discussion of
recent accounting pronouncements impacting our company, see Note 2
in the Notes to Consolidated Financial Statements include herein
under “Item 8. Financial Statements and Supplementary
Data.”
Results
of Operations
The following table
sets forth our results of operations for the periods presented, as
percentages of revenue.
|
|
Year
Ended December 31,
|
|
|
|
2018
|
2017
|
|
Revenue
|
100.0%
|
100.0%
|
|
Cost of revenue
|
53.8
|
52.8
|
|
Gross margin
|
46.2
|
47.2
|
|
Operating expenses:
|
|
|
|
Sales and marketing
|
12.9
|
15.1
|
|
Research and development
|
13.9
|
14.1
|
|
General and administrative
|
10.7
|
16.1
|
|
Total operating expenses, net
|
37.5
|
45.3
|
|
Income (loss) from operations
|
8.7
|
1.9
|
|
Interest expense, net
|
(0.6)
|
(0.7)
|
|
Other income (expense), net
|
1.7
|
(2.4)
|
|
Equity
income in net income of affiliates
|
0.2
|
-
|
|
Income (loss) before income taxes
|
9.9
|
(1.1)
|
|
Income tax expense
|
(1.1)
|
(1.5)
|
|
Net
income (loss)
|
8.8
|
(2.6)
|
|
Less: Net income (loss) attributable to noncontrolling interests
|
-
|
(1.5)
|
|
Net
income( loss) attributable to ACM Research, Inc.
|
8.8%
|
(1.1)%
|
Comparison of Year Ended December 31, 2018 and 2017
Revenue
|
|
Year
Ended
December
31,
|
% Change
|
|
|
|
2018
|
2017
|
2018 v 2017
|
|
|
(in thousands)
|
|
|
|
Revenue
|
$74,643
|
$36,506
|
104%
|
Revenue
for the year ended December 31, 2018 compared to the year ended
December 31, 2017 increased by $38.1 million. The increase was due
to a $41.4 million increase in revenue from single-wafer wet
cleaning tools to our front-end customers, offset in part by a $3.2
million decline in revenue of tools to our back-end customers. Our
revenue for 2018 compared to 2017 reflected significant growth for
three of our large front-end customers, partly offset by a decline
at one front-end and one back-end customer.
57
Cost
of Revenue and Gross Margin
|
|
Year
Ended
December
31,
|
% Change
|
|
|
|
2018
|
2017
|
2018 v 2017
|
|
|
(in thousands)
|
|
|
|
Cost of
revenue
|
$40,194
|
$19,281
|
108%
|
|
Gross
profit
|
$34,449
|
$17,225
|
100
|
|
Gross
margin
|
46.2%
|
47.2%
|
(1.0)%
|
Cost of revenue
increased $20.9 million, and gross profit increased $17.2 million,
for the year ended December 31, 2018 compared to 2017,
reflecting the growth in sales. Gross margin decreased by 100 basis
points primarily due to sales of relatively lower-margin tools to
new customers for the year ended December 31, 2018. The higher
margin in 2017 was primarily due to one system manufactured under
the government subsidies (see “—Key Components of
Results of Operations—PRC Government Research and Development
Funding”), which were sold for the amounts of $1.6 million
for the years ended December 31, 2017. Costs associated with these
systems were recorded as research and development expenses as the
relevant product development on these systems was applied to future
systems.
Operating
Expenses
|
|
Year Ended December
31,
|
% Change
|
|
|
|
2018
|
2017
|
2018 v 2017
|
|
|
(in thousands)
|
|
|
|
Sales and marketing
expense
|
$9,611
|
$5,500
|
75%
|
|
Research and
development expense
|
10,380
|
5,138
|
102
|
|
General and
administrative expense
|
7,987
|
5,887
|
36
|
|
Total operating
expenses, net
|
$27,978
|
$16,525
|
69%
|
Sales and marketing expense increased
$4.1 million for the year ended December 31, 2018 as compared in
2017, primarily due to an increase in employee count, salaries and
sales commissions.
Research and development expense
increased $5.2 million for the year ended December 31, 2018 as
compared to 2017, primarily due to an increase in employee count,
salaries and research and development parts. Research and
development expense represented 13.9% and 14.1% of our revenue in
2018 and 2017, respectively. Without reduction by grant amounts
received from PRC governmental authorities (see “—Key
Components of Results of Operations—PRC Government Research
and Development Funding”), gross research and development
expense totaled $11.9 million, or 15.9% of revenue, in 2018 and
$8.6 million, or 23.4% of revenue, in 2017.
General and administrative expense
increased $2.1 million for the year ended December 31, 2018 as
compared to 2017, principally resulting from increases of $1.4
million in stock-based compensation expense and $523,000 in
personnel-related costs.
58
Other
Income and Expenses
|
|
Year
Ended
December
31,
|
% Change
|
|
|
|
2018
|
2017
|
2018 v 2017
|
|
|
(in thousands)
|
|
|
|
Interest expense,
net
|
$(469)
|
$(268)
|
75%
|
|
Other income
(expense), net
|
1,255
|
(794)
|
(258)%
|
Interest expense
consists of interest incurred from outstanding short-term
borrowings. Interest expense increased to $469,000 in 2018 from
$268,000 in 2017, principally as a result of increased borrowings
under short-term bank loans. We earn interest income from
depositary accounts. Interest income was nominal in 2018 and
2017.
Other income
(expense), net primarily reflects (a) gains or losses recognized
from the effect of exchange rates on our foreign
currency-denominated asset and liability balances and (b)
depreciation of assets acquired with government subsidies, as
described under “—Key Components of Results of
Operations—PRC Government Research and Development
Funding” above. Our other income was $1.3 million in 2018 due
primarily to a weaker RMB to U.S. dollar exchange rate, compared to
a $794,000 loss in 2017 due to a stronger RMB to U.S. dollar
exchange rate.
Income
Tax Expense Benefit
The following
presents components of income tax (expense) for the indicated
periods:
|
|
Year Ended
December 31,
|
|
|
|
2018
|
2017
|
|
|
(in thousands)
|
|
|
Current:
|
|
|
|
U.S.
federal
|
$-
|
$-
|
|
U.S.
state
|
|
-
|
|
Foreign
|
(1,149)
|
-
|
|
Total
current income tax expense
|
(1,149)
|
-
|
|
Deferred:
|
|
|
|
U.S.
federal
|
-
|
-
|
|
U.S.
state
|
|
|
|
Foreign
|
343
|
(547)
|
|
Total
deferred income (expense) benefit
|
343
|
(547)
|
|
Total
current income tax expense
|
$(806)
|
$(547)
|
On December 22,
2017, the Tax Cuts and Jobs Act, or the Tax Act, was enacted into
law. The new legislation contains several key tax provisions that
affect us, including a one-time mandatory transition tax on
accumulated foreign earnings and a reduction of the corporate
income tax rate to 21% effective January 1, 2018. Due to the timing
of the enactment and the complexity involved in applying the
provisions of the Tax Act, we made reasonable estimates of the
effects and recorded provisional amounts in our financial
statements as of December 31, 2017.
As we collect and
prepare necessary data, and interpret the Tax Act and any
additional guidance issued by the U.S. Treasury Department, the
Internal Revenue Service, and other standard-setting bodies, we may
make adjustments to the provisional amounts. Those adjustments may
materially affect our provision for income taxes and effective tax
rate in the period in which the adjustments are made. There were no
adjustments made in 2018.
Our effective tax
rate differs from statutory rates of 21% for U.S. federal income
tax purposes and 15% to 25% for PRC income tax purposes due to the
effects of the valuation allowance and certain permanent
differences as it pertains to book-tax differences in the value of
client equity securities received for services. Our two PRC
subsidiaries, ACM Shanghai and ACM Wuxi, are liable for PRC
corporate income taxes at the rates of 15% and 25%, respectively.
Pursuant to the Corporate Income Tax Law of the PRC, our PRC
subsidiaries generally would be liable for PRC corporate income
taxes as a rate of 25%. According to Guoshuihan 2009 No. 203, an
entity certified as an “advanced and new technology
enterprise” is entitled to a preferential income tax rate of
15%. ACM Shanghai was certified as an “advanced and new
technology enterprise” in 2012 and again in 2016, with an
effective period of three years.
59
We file income tax
returns in the United States and state and foreign jurisdictions.
Those federal, state and foreign income tax returns are under the
statute of limitations subject to tax examinations for 2009 through
2016. To the extent we have tax attribute carryforwards, the tax
years in which the attribute was generated may still be adjusted
upon examination by the Internal Revenue Service or state or
foreign tax authorities to the extent utilized in a future
period.
Liquidity
and Capital Resources
During the year
ended December 31, 2018, we funded our technology development and
operations principally through issuance of an additional series of
convertible preferred stock, short-term borrowings by ACM Shanghai
from local financial institutions, and application of proceeds of
the IPO and concurrent private placements in November 2017. During
the year ended December 31, 2018, we funded our technology
development and operations principally through application of
proceeds of the IPO and concurrent private placements, operating
cash flow, and short-term borrowings by ACM Shanghai from local
financial institutions.
We believe our
existing cash and cash equivalents, our cash flow from operating
activities, and short-term bank borrowings by ACM Shanghai will be
sufficient to meet our anticipated cash needs for at least the next
twelve months from the issuance date of financial statement. We do
not expect that our anticipated cash needs for the next twelve
months will require our receipt of any PRC government subsidies.
Our future working capital needs will depend on many factors,
including the rate of our business and revenue growth, the payment
schedules of our customers, and the timing of investment in our
research and development as well as sales and marketing. To the
extent our cash and cash equivalents, cash flow from operating
activities and short-term bank borrowings are insufficient to fund
our future activities in accordance with our strategic plan, we may
determine to raise additional funds through public or private debt
or equity financings or additional bank credit arrangements. We
also may need to raise additional funds in the event we determine
in the future to effect one or more acquisitions of businesses,
technologies and products. If additional funding is necessary or
desirable, we may not be able to obtain bank credit arrangements or
to affect an equity or debt financing on terms acceptable to us or
at all.
Sources of Funds
Cash Flow from Operating Activities.
Our operations provided cash flow of $6.9 million in 2018. Our cash
flow from operating activities is influenced by (a) the amount of
cash we invest in personnel and technology development to support
anticipated future growth in our business, (b) increases in the
number of customers using our products, and (c) the amount and
timing of payments by customers.
|
Lender
|
|
Agreement
Date
|
|
Maturity
Date
|
|
Annual
Interest Rate
|
|
Maximum
Borrowing Amount(1)
|
|
Amount
Outstanding at December 31, 2018
|
|
|
|
|
|
|
|
|
|
(in thousands)
|
||
|
Bank of China Pudong Branch
|
|
August 2018
|
|
August 2019
|
|
5.22%
|
|
RMB30,000
|
|
RMB30,000
|
|
|
|
|
|
|
|
|
|
$4,372
|
|
$4,372
|
|
Bank of Shanghai Pudong Branch
|
|
February 2018
|
|
January 2019
|
|
5.15%
|
|
RMB50,000
|
|
RMB24,836
|
|
|
|
|
|
|
|
|
|
$7,800
|
|
$3,618
|
|
Shanghai Rural
Commercial Bank
|
|
January 2018
|
|
January
2019
|
|
5.44%
|
|
RMB10,000
|
|
RMB10,000
|
|
|
|
|
|
|
|
|
|
$1,457
|
|
$1,457
|
|
|
|
|
|
|
|
|
|
RMB90,000
|
|
RMB64,836
|
|
|
|
|
|
|
|
|
|
$13,629
|
|
$9,447
|
Equity and Equity-Related Securities.
During year ended on December 31, 2018, we received proceeds of
$528,000 from sales of common stock pursuant to option
exercises.
(1)
Converted from RMB
to dollars as of December 31, 2018
60
All of the amounts
owing under the line of credit with Bank of China Pudong Branch are
secured by ACM Shanghai’s intellectual property and
guaranteed by Dr. David Wang (“Dr. Wang”), our Chair of
the Board, Chief Executive Officer, President and Chair of the
Board. All of the amounts owing under the lines of credit with Bank
of Shanghai Pudong Branch are guaranteed by Dr. Wang. All of the
amounts owing under the line of credit with Shanghai Rural
Commercial Bank are secured by accounts receivable and guaranteed
by Dr. Wang.
Government Research
and Development Grants. As described under “—Key
Components of Results of Operations—PRC Government Research
and Development Funding,” ACM Shanghai has received research
and development grants from local and central PRC governmental
authorities. ACM Shanghai received $200,000 of such grants in 2018
as compared to $2.5 million of such grants in 2017. Not all grant
amounts are received in the year in which a grant is awarded.
Because of the nature and terms of the grants, the amounts and
timing of payments under the grants are difficult to predict and
vary from period to period. In addition, we expect to apply for
additional grants when available in the future, but the grant
application process can extend for a significant period of time and
we cannot predict whether, or when, we will determine to apply for
any such grants.
Working Capital
The following table
sets forth selected working capital information:
|
|
December
31,
2018
|
|
|
(in thousands)
|
|
Cash
and cash equivalents
|
$27,124
|
|
Accounts
receivable, less allowance for doubtful amounts
|
24,608
|
|
Inventory
|
38,764
|
|
Total
|
$90,496
|
Our cash and cash
equivalents at December 31, 2018 were unrestricted and held for
working capital purposes. ACM Shanghai, our only direct PRC
subsidiary, is, however, subject to PRC restrictions on
distributions to equity holders. We currently intend for ACM
Shanghai to retain all available funds any future earnings for use
in the operation of its business and do not anticipate its paying
any cash dividends. We have not entered into, and do not expect to
enter into, investments for trading or speculative purposes. Our
accounts receivable balance fluctuates from period to period, which
affects our cash flow from operating activities. Fluctuations vary
depending on cash collections, client mix, and the timing of
shipment and acceptance of our tools.
We have never
declared or paid cash dividends on our capital stock. We intend to
retain all available funds and any future earnings to support the
operation of and to finance the growth and development of our
business and do not anticipate paying any cash dividends in the
foreseeable future.
Uses of Funds
Capital Expenditures. We incurred $2.1
million capital expenditures in 2018.
Effects
of Inflation
Inflation and
changing prices have not had a material effect on our business, and
we do not expect that they will materially affect our business in
the foreseeable future. Any impact of inflation on cost of revenue
and operating expenses, especially employee compensation costs, may
not be readily recoverable in the price of our product
offerings.
Off-Balance
Sheet Arrangements
As of December 31,
2018 and 2017, we did not have any significant off-balance sheet
arrangements, as defined in Item 303(a)(4)(ii) of Regulation
S-K of the Securities and Exchange Commission, except the lease commitment described in above
“Contractual Obligations and
Requirements.”
61
Emerging
Growth Company Status
We are an
“emerging growth company” as defined in the Jumpstart
Our Business Startups Act, or JOBS Act, and may take advantage of
provisions that reduce our reporting and other obligations from
those otherwise generally applicable to public companies. We may
take advantage of these provisions until the earliest of December
31, 2022 or such time that we have annual revenue greater than $1.0
billion, the market value of our capital stock held by
non-affiliates exceeds $700 million or we have issued more than
$1.0 billion of non-convertible debt in a three-year period. We
have chosen to take advantage of some of these provisions, and as a
result we may not provide stockholders with all of the information
that is provided by other public companies. We have, however,
irrevocably elected not to avail ourselves, as would have been
permitted by Section 107 of the JOBS Act, of the extended
transition period provided in Section 7(a)(2)(B) of the Securities
Act of 1933 for complying with new or revised accounting standards,
and we therefore will be subject to the same new or revised
accounting standards as public companies that are not emerging
growth companies.
62
Item
8.
Financial
Statements
INDEX
TO CONSOLIDATED FINANCIAL STATEMENTS
|
|
Page
|
|
Consolidated
Financial Statements
|
63
|
|
|
|
|
Report
of Independent Registered Public Accounting Firm
|
64
|
|
|
|
|
Consolidated
Balance Sheets as of December 31, 2018 and 2017
|
66
|
|
|
|
|
Consolidated
Statements of Operations and Comprehensive Income (Loss) for the
Years ended December 31, 2018 and 2017
|
67
|
|
|
|
|
Consolidated
Statements of Changes in Redeemable Convertible Preferred Stock and
Stockholders’ Equity (Deficit) for the Years ended December
31, 2018 and 2017
|
68
|
|
|
|
|
Consolidated
Statements of Cash Flows for the Years ended December 31, 2018 and
2017
|
69
|
|
|
|
|
Notes
to Consolidated Financial Statements
|
70
|
63
Report
of Independent Registered Public Accounting
Firm
Shareholders
and Board of Directors
ACM
Research, Inc.
Opinion on the Consolidated Financial Statements
We have audited the accompanying consolidated
balance sheets of ACM Research, Inc. (the “Company”)
and subsidiaries as of December 31, 2018 and 2017, the related
consolidated statements of operations and comprehensive income
(loss), changes in redeemable convertible preferred stock and
stockholders’ equity (deficit), and cash flows for each of
the two years in the period ended December 31, 2018, and the
related notes (collectively referred to as the “consolidated
financial statements”). In our opinion, the consolidated
financial statements present fairly, in all material respects, the
financial position of the Company and subsidiaries at December 31,
2018 and 2017, and the results of their operations and their cash
flows for each of the two years in the period ended December 31,
2018,
in conformity with accounting
principles generally accepted in the United States of
America.
Basis for Opinion
These
consolidated financial statements are the responsibility of the
Company’s management. Our responsibility is to express an
opinion on the Company’s consolidated financial statements
based on our audits. We are a public accounting firm registered
with the Public Company Accounting Oversight Board (United States)
(“PCAOB”) and are required to be independent with
respect to the Company in accordance with the U.S. federal
securities laws and the applicable rules and regulations of the
Securities and Exchange Commission and the PCAOB.
We
conducted our audits in accordance with the standards of the PCAOB.
Those standards require that we plan and perform the audit to
obtain reasonable assurance about whether the consolidated
financial statements are free of material misstatement, whether due
to error or fraud. The Company is not required to have, nor were we
engaged to perform, an audit of its internal control over financial
reporting. As part of our audits we are required to obtain an
understanding of internal control over financial reporting but not
for the purpose of expressing an opinion on the effectiveness of
the Company’s internal control over financial reporting.
Accordingly, we express no such opinion.
64
Our
audits included performing procedures to assess the risks of
material misstatement of the consolidated financial statements,
whether due to error or fraud, and performing procedures that
respond to those risks. Such procedures included examining, on a
test basis, evidence regarding the amounts and disclosures in the
consolidated financial statements. Our audits also included
evaluating the accounting principles used and significant estimates
made by management, as well as evaluating the overall presentation
of the consolidated financial statements. We believe that our
audits provide a reasonable basis for our opinion.
BDO
China Shu Lun Pan Certified Public Accountants LLP
We
have served as the Company's auditor since 2015.
Shenzhen,
The People’s Republic of China
March
14, 2019
65
ACM
RESEARCH, INC.
Consolidated
Balance Sheets
|
|
December
31,
|
|
|
|
2018
|
2017
|
|
|
(in thousands, except share and per share data)
|
|
|
Assets
|
|
|
|
Current
assets:
|
|
|
|
Cash
and cash equivalents
|
$27,124
|
$17,681
|
|
Accounts
receivable, less allowance for doubtful accounts of $0 and $0 as of
December 31, 2018 and 2017, respectively (note 3)
|
24,608
|
26,762
|
|
Other
receivables
|
3,547
|
2,491
|
|
Inventories
(note 4)
|
38,764
|
15,388
|
|
Prepaid
expenses
|
1,985
|
546
|
|
Other
current assets
|
-
|
46
|
|
Total
current assets
|
96,028
|
62,914
|
|
Property,
plant and equipment, net (note 5)
|
3,708
|
2,340
|
|
Intangible
assets, net
|
274
|
106
|
|
Deferred
tax assets (note 15)
|
1,637
|
1,294
|
|
Investment
in affiliates, equity method (note 10)
|
1,360
|
1,237
|
|
Other
long-term assets
|
40
|
-
|
|
Total
assets
|
103,047
|
67,891
|
|
Liabilities and Stockholders’ Equity
|
|
|
|
Current
liabilities:
|
|
|
|
Short-term
borrowings (note 6)
|
9,447
|
5,095
|
|
Warrant
liability (note 8)
|
-
|
3,079
|
|
Accounts
payable
|
16,673
|
7,419
|
|
Advances
from customers
|
8,417
|
143
|
|
Income
taxes payable
|
1,193
|
44
|
|
Other
payables and accrued expenses (note 7)
|
10,410
|
6,037
|
|
Total
current liabilities
|
46,140
|
21,817
|
|
Other
long-term liabilities (note 9)
|
4,583
|
6,217
|
|
Total
liabilities
|
50,723
|
28,034
|
|
Commitments and contingencies (note 16)
|
|
|
|
Stockholders’
equity:
|
|
|
|
Common
stock – Class A, par value $0.0001: 100,000,000 shares
authorized as of December 31, 2018 and 2017. 14,110,315 shares
issued and outstanding as of December 31, 2018 and 12,935,546
shares issued and outstanding as of December 31, 2017 (note
13)
|
1
|
1
|
|
Common
stock–Class B, par value $0.0001: 7,303,533 shares authorized
as of December 31, 2018 and 2017. 1,898,423 shares issued and
outstanding as of December 31, 2018 and 2,409,738 shares issued and
outstanding as of December 31, 2017 (note 13)
|
-
|
-
|
|
Additional
paid in capital
|
56,567
|
49,695
|
|
Accumulated
deficit
|
(3,387)
|
(9,961)
|
|
Accumulated
other comprehensive income (loss)
|
(857)
|
122
|
|
Total
stockholders’ equity
|
52,324
|
39,857
|
|
Total
liabilities and stockholders’ equity
|
$103,047
|
$67,891
|
The accompanying
notes are an integral part of these consolidated financial
statements.
66
ACM RESEARCH, INC.
Consolidated
Statements of Operations and Comprehensive Income
(Loss)
|
|
Year
Ended December 31,
|
|
|
|
2018
|
2017
|
|
|
( In thousands, except share and per share data)
|
|
|
Revenue
|
$74,643
|
$36,506
|
|
Cost of revenue
|
40,194
|
19,281
|
|
Gross profit
|
34,449
|
17,225
|
|
Operating expenses:
|
|
|
|
Sales and marketing
|
9,611
|
5,500
|
|
Research and development
|
10,380
|
5,138
|
|
General and administrative
|
7,987
|
5,887
|
|
Total operating expenses, net
|
27,978
|
16,525
|
|
Income from operations
|
6,471
|
700
|
|
Interest income
|
29
|
9
|
|
Interest expense
|
(498)
|
(277)
|
|
Other income
(expense), net
|
1,255
|
(794)
|
|
Equity income in net income of affiliates
|
123
|
37
|
|
Income (Loss) before income taxes
|
7,380
|
(325)
|
|
Income tax expense (note 15)
|
(806)
|
(547)
|
|
Net income (loss)
|
6,574
|
(872)
|
|
Less: Net loss attributable to non-controlling interests
|
-
|
(554)
|
|
Net income
(loss) attributable to ACM Research, Inc.
|
$6,574
|
$(318)
|
|
Comprehensive income
(loss)
|
|
|
|
Net income
(loss)
|
6,574
|
(872)
|
|
Foreign currency translation adjustment
|
(979)
|
472
|
|
Comprehensive income (loss)
|
5,595
|
(400)
|
|
Less: Comprehensive loss attributable to non-controlling interests
|
-
|
(369)
|
|
Total comprehensive income
(loss) attributable to ACM Research, Inc. (note 2)
|
$5,595
|
$(31)
|
|
|
|
|
|
Net income
(loss) attributable to ACM, Inc.
per common share (note 2):
|
|
|
|
Basic
|
$0.42
|
(0.05)
|
|
Diluted
|
$0.37
|
$(0.05)
|
|
|
|
|
|
Weighted
average common shares outstanding used in computing
per share amounts (note 2):
|
|
|
|
Basic
|
15,788,460
|
6,865,390
|
|
Diluted
|
17,912,105
|
6,865,390
|
The accompanying
notes are an integral part of these consolidated financial
statements.
67
ACM
RESEARCH, INC.
Consolidated
Statement of Changes in Redeemable Convertible Preferred Stock and
Stockholders’ Equity (Deficit)
|
|
Redeemable Convertible Preferred Stock
|
|
|
|
|
|
|
|
|
|
||||||||||||
|
|
Series A
|
Series B
|
Series C
|
Series D
|
Series E
|
Series F
|
|
Common
Stock Class A
|
Common
Stock Class B
|
|
|
|
|
|
||||||||
|
|
shares
|
Amount
|
Shares
|
Amount
|
Shares
|
Amount
|
Shares
|
Amount
|
Shares
|
Amount
|
Shares
|
Amount
|
Total Amount
|
Shares
|
Amount
|
Shares
|
Amount
|
Additional Paid-in
Capital
|
Accumulated Income (Deficit)
|
Accumulated
Other
Comprehensive
Income (Loss)
|
Non-controlling
Interest
|
Total Stockholders’ Equity (Deficit)
|
|
|
|
|
|
|
|
|
|
|
|
|
|
|
|
|
|
|
|
|
|
|
|
|
|
Balance at December 31, 2016
|
385,000
|
$288
|
1,572,000
|
$1,572
|
1,360,962
|
$2,041
|
1,326,642
|
$4,975
|
—
|
$—
|
3,663,254
|
$9,158
|
$18,034
|
2,228,740
|
$1
|
2,409,738
|
$1
|
$7,620
|
$(9,643)
|
$(413)
|
$4,919
|
$2,485
|
|
Net
loss
|
—
|
—
|
—
|
—
|
—
|
—
|
—
|
—
|
—
|
—
|
—
|
—
|
—
|
—
|
—
|
—
|
—
|
—
|
(318)
|
—
|
(554)
|
(872)
|
|
Foreign
currency translation adjustment
|
—
|
—
|
—
|
—
|
—
|
—
|
—
|
—
|
—
|
—
|
—
|
—
|
—
|
—
|
—
|
—
|
—
|
—
|
—
|
535
|
185
|
720
|
|
Exercise
of stock option
|
—
|
—
|
—
|
—
|
—
|
—
|
—
|
—
|
—
|
—
|
—
|
—
|
—
|
472,887
|
—
|
—
|
—
|
396
|
—
|
—
|
—
|
396
|
|
Stock-based
compensation
|
—
|
—
|
—
|
—
|
—
|
—
|
—
|
—
|
—
|
—
|
—
|
—
|
—
|
—
|
—
|
—
|
—
|
1,622
|
—
|
—
|
—
|
1,622
|
|
Purchase
of non-controlling interest
|
—
|
—
|
—
|
—
|
—
|
—
|
—
|
—
|
—
|
—
|
—
|
—
|
—
|
—
|
—
|
—
|
—
|
(16,258)
|
—
|
—
|
(4,550)
|
(20,808)
|
|
Issuance
of Series E Preferred Stock
|
—
|
—
|
—
|
—
|
—
|
—
|
—
|
—
|
4,998,508
|
$5,800
|
—
|
—
|
5,800
|
—
|
—
|
—
|
—
|
—
|
—
|
—
|
—
|
—
|
|
Issuance
of Common Stock to Ninebell
|
—
|
—
|
—
|
—
|
—
|
—
|
—
|
—
|
—
|
—
|
—
|
—
|
—
|
133,334
|
—
|
—
|
—
|
1,000
|
—
|
—
|
—
|
1,000
|
|
Issuance
of Common Stock to Shanghai and Pudong VC
|
—
|
—
|
—
|
—
|
—
|
—
|
—
|
—
|
—
|
—
|
—
|
—
|
—
|
1,906,674
|
—
|
—
|
—
|
14,299
|
—
|
—
|
—
|
14,299
|
|
Convertible
preferred shares converted to common shares in connection with
initial public offering
|
(385,000)
|
(288)
|
(1,572,000)
|
(1,572)
|
(1,360,962)
|
(2,041)
|
(1,326,642)
|
(4,975)
|
(4,998,508)
|
(5,800)
|
(3,663,254)
|
(9,158)
|
(23,834)
|
4,627,577
|
—
|
—
|
—
|
23,834
|
—
|
—
|
—
|
23,834
|
|
Proceeds
from initial public, net of capitalized IPO cost and issuance costs
of $2,791
|
—
|
—
|
—
|
—
|
—
|
—
|
—
|
—
|
—
|
—
|
—
|
—
|
—
|
3,566,334
|
—
|
—
|
—
|
17,181
|
—
|
—
|
—
|
17,181
|
|
Reclassification
of reverse split par value
|
—
|
—
|
—
|
—
|
—
|
—
|
—
|
—
|
—
|
—
|
—
|
—
|
—
|
—
|
—
|
—
|
(1)
|
1
|
—
|
—
|
—
|
—
|
|
|
|
|
|
|
|
|
|
|
|
|
|
|
|
|
|
|
|
|
|
|
|
|
|
Balance at December 31, 2017
|
-
|
$-
|
-
|
$-
|
-
|
$-
|
-
|
$-
|
-
|
$-
|
-
|
$-
|
$-
|
12,935,546
|
$1
|
2,409,738
|
$-
|
$49,695
|
$(9,961)
|
$122
|
$-
|
$39,857
|
|
Net
income
|
—
|
—
|
—
|
—
|
—
|
—
|
—
|
—
|
—
|
—
|
—
|
—
|
—
|
—
|
—
|
—
|
—
|
—
|
6,574
|
—
|
—
|
6,574
|
|
Foreign
currency translation adjustment
|
—
|
—
|
—
|
—
|
—
|
—
|
—
|
—
|
—
|
—
|
—
|
—
|
—
|
—
|
—
|
—
|
—
|
—
|
—
|
(979)
|
—
|
(979)
|
|
Exercise
of stock option
|
—
|
—
|
—
|
—
|
—
|
—
|
—
|
—
|
—
|
—
|
—
|
—
|
—
|
265,952
|
—
|
—
|
—
|
528
|
—
|
—
|
—
|
528
|
|
Stock-based
compensation
|
—
|
—
|
—
|
—
|
—
|
—
|
—
|
—
|
—
|
—
|
—
|
—
|
—
|
—
|
—
|
—
|
—
|
3,363
|
—
|
—
|
—
|
3,363
|
|
Conversion
of class B common shares to Class A common shares
|
—
|
—
|
—
|
—
|
—
|
—
|
—
|
—
|
—
|
—
|
—
|
—
|
—
|
511,315
|
—
|
(511,315)
|
—
|
—
|
—
|
—
|
—
|
—
|
|
Exercise
of common stock warrant issued to SMC
|
—
|
—
|
—
|
—
|
—
|
—
|
—
|
—
|
—
|
—
|
—
|
—
|
—
|
397,502
|
—
|
—
|
—
|
2,981
|
—
|
—
|
—
|
2,981
|
|
Balance at December 31, 2018
|
-
|
$-
|
-
|
$-
|
-
|
$-
|
-
|
$-
|
-
|
$-
|
-
|
$-
|
$-
|
14,110,315
|
$1
|
1,898,423
|
$-
|
$56,567
|
$(3,387)
|
$(857)
|
$-
|
$52,324
|
The accompanying
notes are an integral part of these
consolidated financial statements.
68
ACM
RESEARCH, INC.
Consolidated
Statements of Cash Flows
|
|
Year
Ended December 31,
|
|
|
|
2018
|
2017
|
|
|
(in thousands)
|
|
|
Cash flows from operating activities:
|
|
|
|
Net
income (loss)
|
$6,574
|
$(872)
|
|
Adjustments
to reconcile net loss from operations to net cash provided by
operating activities
|
|
|
|
Depreciation
and amortization
|
417
|
271
|
|
Equity
income in net income of affiliates
|
(123)
|
(37)
|
|
Deferred
income taxes
|
(405)
|
659
|
|
Stock-based
compensation
|
3,363
|
1,622
|
|
Loss
on disposals of fixed assets, intangible assets and other long-term
assets
|
-
|
1
|
|
Net
changes in operating assets and liabilities:
|
|
|
|
Accounts
receivable
|
883
|
(9,757)
|
|
Other
receivables
|
(1,171)
|
332
|
|
Inventory
|
(24,083)
|
(3,073)
|
|
Prepaid
expenses
|
(1,494)
|
256
|
|
Other
current assets
|
44
|
8
|
|
Accounts
payable
|
9,825
|
1,905
|
|
Advances
from customers
|
8,316
|
(127)
|
|
Income
tax payable
|
1,149
|
-
|
|
Other
payables and accrued expenses
|
4,954
|
1,789
|
|
Other
long-term liabilities
|
(1,340)
|
(1,078)
|
|
Net cash provided by (used in) operating activities
|
6,909
|
(8,101)
|
|
|
|
|
|
Cash flows from investing activities:
|
|
|
|
Purchase
of property and equipment
|
(1,830)
|
(651)
|
|
Purchase
of intangible assets
|
(241)
|
(115)
|
|
Loan
to related party
|
-
|
(946)
|
|
Purchase
of non-controlling interest
|
-
|
(20,808)
|
|
Investments
in unconsolidated equity method affiliates
|
-
|
(1,200)
|
|
Net cash used in investing activities
|
(2,071)
|
(23,720)
|
|
|
|
|
|
Cash flows from financing activities:
|
|
|
|
Proceeds
from short-term borrowings
|
17,726
|
11,154
|
|
Repayments
of short-term borrowings
|
(13,131)
|
(11,110)
|
|
Proceeds
from stock option exercise to common stock
|
528
|
396
|
|
Proceeds
from issuance of Series E convertible preferred stock
|
-
|
5,800
|
|
Proceeds
from issuance of common stock in connection with initial public
offering and concurrent private placement
|
-
|
18,717
|
|
Payment
of initial public offering expenses
|
-
|
(1,537)
|
|
Investment
in affiliates
|
-
|
1,000
|
|
Proceeds
from issuance of common stock for non-controlling interest
purchase
|
-
|
14,300
|
|
Net cash provided by financing activities
|
5,123
|
38,720
|
|
|
|
|
|
Effect of exchange rate changes on cash and cash
equivalent
|
$(518)
|
$663
|
|
Net
increase in cash and cash equivalent
|
$9,443
|
$7,562
|
|
|
|
|
|
Cash
and cash equivalents at beginning of period
|
17,681
|
10,119
|
|
Cash and cash equivalents at end of period
|
$27,124
|
$17,681
|
|
|
|
|
|
Supplemental disclosure of cash flow information:
|
|
|
|
Interest
paid
|
$498
|
$277
|
|
Non-cash financing activities:
|
|
|
|
Preferred
stock conversion to common stock in connection with initial public
offering
|
$-
|
$23,834
|
|
Warrant
conversion to common stock
|
$3,079
|
-
|
The accompanying
notes are an integral part of these consolidated financial
statements.
69
ACM
RESEARCH, INC.
Notes
to Consolidated Financial Statements
(in thousands, except share and per share data)
NOTE
1 – DESCRIPTION OF BUSINESS
ACM Research, Inc.
(“ACM”) and its subsidiaries (collectively with ACM,
the “Company”) develop, manufacture and sell
single-wafer wet cleaning equipment used to improve the
manufacturing process and yield for advanced integrated chips. The
Company markets and sells its single-wafer wet-cleaning equipment,
under the brand name “Ultra C,” based on the
Company’s proprietary Space Alternated Phase Shift
(“SAPS”) and Timely Energized Bubble Oscillation
(“TEBO”) technologies. These tools are designed to
remove random defects from a wafer surface efficiently, without
damaging the wafer or its features, even at increasingly advanced
process nodes.
ACM was
incorporated in California in 1998, and it initially focused on
developing tools for manufacturing process steps involving the
integration of ultra low-K materials and copper. The
Company’s early efforts focused on stress-free
copper-polishing technology, and it sold tools based on that
technology in the early 2000s.
In 2006 the Company
established its operational center in Shanghai in the
People’s Republic of China (the “PRC”), where it
operates through ACM’s subsidiary ACM Research (Shanghai),
Inc. (“ACM Shanghai”). ACM Shanghai was formed to help
establish and build relationships with integrated circuit
manufacturers in the PRC, and the Company initially financed its
Shanghai operations in part through sales of non-controlling equity
interests in ACM Shanghai.
In 2007 the Company
began to focus its development efforts on single-wafer wet-cleaning
solutions for the front-end chip fabrication process. The Company
introduced its SAPS megasonic technology, which can be applied in
wet wafer cleaning at numerous steps during the chip fabrication
process, in 2009. It introduced its TEBO technology, which can be
applied at numerous steps during the fabrication of small node
two-dimensional conventional and three-dimensional patterned
wafers, in March 2016. The Company has designed its equipment
models for SAPS and TEBO solutions using a modular configuration
that enables it to create a wet-cleaning tool meeting the specific
requirements of a customer, while using pre-existing designs for
chamber, electrical, chemical delivery and other modules. In August
2018, the Company introduced its Ultra-C Tahoe wafer cleaning tool,
which can deliver high cleaning performance with significantly less
sulfuric acid than typically consumed by conventional
high-temperature single-wafer cleaning tools. The Company also
offers a range of custom-made equipment, including cleaners,
coaters and developers, to back-end wafer assembly and packaging
factories, principally in the PRC.
In 2011 ACM
Shanghai formed a wholly owned subsidiary in the PRC, ACM Research
(Wuxi), Inc. (“ACM Wuxi”), to manage sales and service
operations.
In November 2016
ACM redomesticated from California to Delaware pursuant to a merger
in which ACM Research, Inc., a California corporation, was merged
into a newly formed, wholly owned Delaware subsidiary, also named
ACM Research, Inc.
In June 2017 ACM
formed a wholly owned subsidiary in Hong Kong, CleanChip
Technologies Limited (“CleanChip”), to act on the
Company’s behalf in Asian markets outside the PRC by, for
example, serving as a trading partner between ACM Shanghai and its
customers, procuring raw materials and components, performing sales
and marketing activities, and making strategic
investments.
In August 2017 ACM
purchased 18.77% of ACM Shanghai’s equity interests held by
Shanghai Science and Technology Venture Capital Co., Ltd. On
November 8, 2017, ACM purchased the remaining 18.36% of ACM
Shanghai’s equity interest held by third parties, Shanghai
Pudong High-Tech Investment Co., Ltd. (“PDHTI”) and
Shanghai Zhangjiang Science & Technology Venture Capital Co.,
Ltd. (“ZSTVC”). At December 31, 2017, ACM owned all of
the outstanding equity interests of ACM Shanghai, and indirectly
through ACM Shanghai, owned all of the outstanding equity interests
of ACM Wuxi.
70
On September 13,
2017, ACM effectuated a 1-for-3 reverse stock split of Class A and
Class B common stock. Unless otherwise indicated, all share
numbers, per share amount, share prices, exercise prices and
conversion rates set forth in these notes and the accompanying
condensed consolidated financial statements have been adjusted
retrospectively to reflect the reverse stock split.
On November 2,
2017, the Registration Statement on Form S-1 (File No. 333- 220451)
for ACM’s initial public offering of Class A common stock
(the “IPO”) was declared effective by the U.S.
Securities and Exchange Commission. Shares of Class A common stock
began trading on the Nasdaq Global Market on November 3, 2017, and
the closing for the IPO was held on November 7, 2017.
In December 2017
ACM formed a wholly owned subsidiary in the Republic of Korea, ACM
Research Korea CO., LTD. (“ACM Korea”), to serve
customers based in Republic of Korea and perform sales, marketing,
research and development activities for new products and
solutions.
NOTE
2 – SUMMARY OF SIGNIFICANT ACCOUNTING
POLICIES
Basis of Presentation and Principles of Consolidation
The accompanying
consolidated financial statements of the Company have been prepared
in accordance with accounting principles generally accepted in the
United States of America (“GAAP”). The consolidated
accounts include ACM and its subsidiaries, ACM Shanghai, ACM Wuxi,
CleanChip and ACM Korea. Subsidiaries are those entities in which
ACM, directly and indirectly, controls more than one half of the
voting power. All significant intercompany transactions and
balances have been eliminated upon consolidation.
Use of Estimates
The preparation of
consolidated financial statements in conformity with GAAP requires
management to make estimates and assumptions that affect the
reported amounts of assets and liabilities and disclosure of
contingent assets and liabilities at the balance sheet date and the
reported revenues and expenses during the reported period in the
consolidated financial statements and accompanying notes. The
Company’s significant accounting estimates and assumptions
include, but are not limited to, those used for the valuation and
recognition of stock-based compensation arrangements and warrant
liability, realization of deferred tax assets, assessment for
impairment of long-lived assets, allowance for doubtful accounts,
inventory valuation for excess and obsolete inventories, lower of
cost and market value or net realizable value of inventories,
depreciable lives of property and equipment, accrued warranty, and
useful life of intangible assets.
Management
evaluates these estimates and assumptions on a regular basis.
Actual results could differ from those estimates and
assumptions.
Cash and Cash Equivalents
Cash and cash
equivalents consist of cash on hand, bank deposits that are
unrestricted as to withdrawal and use, and highly liquid
investments with an original maturity date of three months or less
at the date of purchase. At times, cash deposits may exceed
government-insured limits.
Accounts Receivable
Accounts receivable
are presented net of an allowance for doubtful accounts. The
Company reviews its accounts receivable on a periodic basis and
makes general and specific allowances when there is doubt as to the
collectability of individual balances. In evaluating the
collectability of individual receivable balances, the Company
considers many factors, including the age of the balance, a
customer’s historical payment history and credit worthiness,
and current economic trends. Accounts are written off after all
collection efforts have been exhausted. At December 31, 2018 and
2017, the Company, based on a review of its outstanding balances
and its customers, determined the allowance for doubtful accounts
in the amount of $0 and $0 respectively.
71
Inventory
Inventory consists
of raw materials and related goods, work-in-progress, finished
goods, and other consumable materials such as spare parts. Finished
goods typically are shipped from the Company’s warehouse
within one month of completion.
Inventory was
recorded at the lower of cost or net realizable value at December
31, 2018 and 2017.
●
The cost of a
general inventory item is determined using the weighted moving
average method. Under the weighted moving average method, the
Company calculates the new average price of all items of a
particular inventory stock each time one or more items of that
stock are purchased. The then-current average price of the stock is
used for purposes of determining cost of inventory or cost of
revenue. The cost of an inventory item purchased specifically for a
customized product is determined using the specific identification
method. Low-cost consumable materials and packaging materials are
expensed as incurred.
●
Market value is
determined as the lower of replacement cost or net realizable
value.
●
Net realizable
value is the estimated selling price, in the ordinary course of
business, less estimated costs to complete or dispose.
The Company
assesses the recoverability of all inventories quarterly to
determine if any adjustments are required. Potential excess or
obsolete inventory is written off based on management’s
analysis of inventory levels and estimates of future 12-month
demand and market conditions.
Property, Plant and Equipment, Net
Property, plant and
equipment are recorded at cost less accumulated depreciation and
any provision for impairment in value. Depreciation begins when the
asset is placed in service and is calculated by using the
straight-line method over the estimated useful life of an asset
(or, if shorter, over the lease term). Betterments or renewals are
capitalized when incurred. Plant, property and equipment is
reviewed each year to determine whether any events or circumstances
indicate that the carrying amount of the assets may not be
recoverable.
Estimated useful
lives of assets in the United States are as follows:
|
Computer and office
equipment
|
3 to 5
years
|
|
Furniture and
fixtures
|
5
years
|
|
Leasehold
improvements
|
shorter of lease term or estimated
useful life
|
ACM’s
subsidiaries follow regulations for depreciation of fixed assets
implemented under the PRC’s Enterprise Income Tax Law, which
state that the minimum useful lives used for calculating
depreciation for fixed assets are as follows:
|
Manufacturing
equipment
|
for small to
medium-sized equipment, 5 years; for large equipment,
estimated by
purchasing department at time of acceptance
|
|
Furniture and
fixtures
|
5
years
|
|
Transportation
equipment
|
4 to 5
years
|
|
Electronic
equipment
|
3
years
|
|
Leasehold
improvements
|
remaining lease
term for improvements on leased fixed assets or,
for large
improvements, estimated useful life;
not less than 3
years for non-fixed asset repairs
|
Expenditures for
maintenance and repairs that neither materially add to the value of
the property nor appreciably prolong the life of the property are
charged to expense as incurred. Upon retirement or sale of an
asset, the cost of the asset and the related accumulated
depreciation are eliminated from the accounts and any resulting
gain or loss is credited or charged to income.
72
Intangible Assets, Net
Intangible assets
consist of software used for finance, manufacturing, and research
and development purposes. Assets are valued at cost at the time of
acquisition and are amortized over their beneficial periods. If a
contract specifies a beneficial period, then the intangible asset
is amortized over a term not exceeding the beneficial period. If
the contract does not specify a beneficial period, then the
intangible asset is amortized over a term not exceeding the valid
period specified by local law. If neither the contract nor local
law specifies a beneficial period, then the intangible asset is
amortized over a period of up to 10 years. Currently, the software
that the Company uses is amortized over a two-year period in
accordance with the policy described above.
Valuation of Long-Lived Assets
Long-lived assets
are evaluated for impairment whenever events or changes in
circumstance indicate that the carrying value of the assets may not
be fully recoverable or that the useful life of the assets is
shorter than the Company had originally estimated. When these
events or changes occur, the Company evaluates the impairment of
the long-lived assets by comparing the carrying value of the assets
to an estimate of future undiscounted cash flows expected to be
generated from the use of the assets and their eventual
disposition. If the sum of the expected future undiscounted cash
flow is less than the carrying value of the assets, the Company
recognizes an impairment loss based on the excess of the carrying
value over the fair value. No impairment charge was recognized for
either of the periods presented.
Leases
Each lease is
classified at the inception date as either a capital lease or an
operating lease. For the lessee, a lease is a capital lease if any
of the following conditions exist: (a) ownership is
transferred to the lessee by the end of the lease term;
(b) there is a bargain purchase option; (c) the lease
term is at least 75% of the property’s estimated remaining
economic life; or (d) the present value of the minimum lease
payments at the beginning of the lease term is 90% or more of the
fair value of the leased property to the leasor at the inception
date. A capital lease is accounted for as if there was an
acquisition of an asset and an incurrence of an obligation at the
inception of the lease. All other leases are accounted for as
operating leases. Payments made under operating leases are charged
to the consolidated statements of operations and comprehensive
income on a straight-line basis over the terms of the underlying
lease. The Company had no capital lease for either of the periods
presented.
Redeemable Convertible Preferred Stock
The Company
recorded each series of convertible preferred stock at fair value
on the date of issuance, net of issuance costs. The convertible
preferred stock is recorded outside of stockholders’ equity
(deficit) because, in the event of certain deemed liquidation
events considered not solely within the Company’s control
(such as a merger, acquisition, or sale of all or substantially all
of the Company’s assets), the convertible preferred stock
will become redeemable at the option of the holders. The Company
has not adjusted the carrying value of any series of convertible
preferred stock to the liquidation preference of such series
because it is uncertain whether or when an event would occur that
would obligate the Company to pay the liquidation preferences to
holders of convertible preferred stock. Subsequent adjustments to
the carrying values to the liquidation preferences will be made
only when it becomes probable that such a liquidation event will
occur.
Revenue Recognition
On January 1, 2018,
the Company adopted ASC Topic 606, Revenue from Contracts with Customers,
and all the related amendments (the “New Revenue
Standard”) to all contracts which were not completed as of
January 1, 2018 using the modified retrospective method. The
Company does not have open contracts that may result in any changes
to revenues applying the New Revenue Standard.
73
The Company derives
revenue principally from the sale of single-wafer wet cleaning
equipment. Revenue from contracts with customers is recognized
using the following five steps pursuant to the New Revenue
Standard:
1. Identify
the contract(s) with a customer;
2. Identify
the performance obligations in the contract;
3. Determine
the transaction price;
4. Allocate
the transaction price to the performance obligations in the
contract; and
5. Recognize
revenue when (or as) the entity satisfies a performance
obligation.
A contract contains
a promise (or promises) to transfer goods or services to a
customer. A performance obligation is a promise (or a group of
promises) that is distinct. The transaction price is the amount of
consideration a company expects to be entitled from a customer in
exchange for providing the goods or services.
The unit of account
for revenue recognition is a performance obligation (a good or
service). A contract may contain one or more performance
obligations. Performance obligations are accounted for separately
if they are distinct. A good or service is distinct if the customer
can benefit from the good or service either on its own or together
with other resources that are readily available to the customer,
and the good or service is distinct in the context of the contract.
Otherwise performance obligations are combined with other promised
goods or services until the Company identifies a bundle of goods or
services that is distinct. Promises in contracts which do not
result in the transfer of a good or service are not performance
obligations, as well as those promises that are administrative in
nature, or are immaterial in the context of the contract. The
Company has addressed whether various goods and services promised
to the customer represent distinct performance obligations. The
Company applied the guidance of ASC Topic 606-10-25-16 through 18
in order to verify which promises should be assessed for
classification as distinct performance obligations. The
Company’s contracts with customers include more than one
performance obligation. For example, the delivery of a piece of
equipment generally includes the promise to install the equipment
in the customer’s facility. The Company’s performance
obligations in connection with a sale of equipment generally
include production, delivery and installation, together with the
provision of a warranty.
The transaction
price is allocated to all the separate performance obligations in
an arrangement. It reflects the amount of consideration to which
the Company expects to be entitled in exchange for transferring
goods or services, which may include an estimate of variable
consideration to the extent that it is probable of not being
subject to significant reversals in the future based on the
Company’s experience with similar arrangements. The
transaction price excludes amounts collected on behalf of third
parties, such as sales taxes. This is done on a relative selling
price basis using standalone selling prices (“SSP”).
The SSP represents the price at which the Company would sell that
good or service on a standalone basis at the inception of the
contract. Given the requirement for establishing SSP for all
performance obligations, if the SSP is directly observable through
standalone sales, then such sales should be considered in the
establishment of the SSP for the performance obligation. All of the
Company’s products were sold in stand-alone arrangements. The
Company does not have observable SSPs for most performance
obligations as the obligations are not regularly sold on a
standalone basis. Production, delivery and installation of a
product, together with provision of a warranty, are a single unit
of accounting.
Revenue is
recognized when the Company satisfies each performance obligation
by transferring control of the promised goods or services to the
customer. Goods or services can transfer at a point in time (upon
the acceptance of the products or upon the arrival at the
destination as stipulated in the shipment terms) in a sale
arrangement. In general, the Company recognizes revenue when a tool
has been demonstrated to meet the customer’s predetermined
specifications and is accepted by the customer. If terms of the
sale provide for a lapsing customer acceptance period, the Company
recognizes revenue as of the earlier of the expiration of the
lapsing acceptance period and customer acceptance. In the following
circumstances, however, the Company recognizes revenue upon
shipment or delivery, when legal title to the tool is passed to a
customer as follows:
●
When the customer
has previously accepted the same tool with the same specifications
and the Company can objectively demonstrate that the tool meets all
of the required acceptance criteria;
74
●
When the sales
contract or purchase order contains no acceptance agreement or
lapsing acceptance provision and the Company can objectively
demonstrate that the tool meets all of the required acceptance
criteria;
●
When the customer
withholds acceptance due to issues unrelated to product
performance, in which case revenue is recognized when the system is
performing as intended and meets predetermined specifications;
or
●
When the
Company’s sales arrangements do not include a general right
of return.
The Company offers
post-warranty period services, which consist principally of the
installation and replacement of parts and small-scale modifications
to the equipment. The related revenue and costs of revenue are
recognized when parts have been delivered and installed, risk of
loss has passed to the customer, and collection is probable. The
Company does not expect revenue from extended maintenance service
contracts to represent a material portion of its revenue in the
future. As such, the Company has concluded that its revenue
recognition under the adoption of the New Revenue Standard will
remain the same as previously reported and will not have material
impacts to its consolidated financial statements.
The Company incurs
costs related to the acquisition of its contracts with customers in
the form of sales commissions. Sales commissions are paid to third
party representatives and distributors. Contractual agreements with
these parties outline commission structures and rates to be paid.
Generally speaking, the contracts are all individual procurement
decisions by the customers and are not for significant periods of
time, nor do they include renewal provisions. As such, all
contracts have an economic life of significantly less than a year.
Accordingly, the Company expenses sales commissions when incurred
in accordance with the practical expedient in the New Revenue
Standard when the underlying contract asset is less than one year.
These costs are recorded within sales and marketing
expenses.
Generally, all
contracts have expected durations of one year or less. Accordingly,
the Company applies the practical expedient allowed in the New
Revenue Standard and does not disclose information about remaining
performance obligations that have original expected durations of
one year or less.
The Company does
not incur any costs to fulfill the contracts with customers that
are not already reported in compliance with another applicable
standard (for example, inventory or plant, property and
equipment).
Cost of Revenue
Cost of revenue
primarily consists of: direct materials, comprised principally of
parts used in assembling equipment, together with crating and
shipping costs; direct labor, including salaries and other labor
related expenses attributable to the Company’s manufacturing
department; and allocated overhead cost, such as personnel cost,
depreciation expense, and allocated administrative costs associated
with supply chain management and quality assurance activities, as
well as shipping insurance premiums.
Research and Development Costs
Research and
development costs relating to the development of new products and
processes, including significant improvements and refinements to
existing products or to the process of supporting customer
evaluations of tools, including the development of new tools for
evaluation by customers during the product demonstration process,
are expensed as incurred.
Shipping and Handling Costs
Shipping and
handling costs, which relate to transportation of products to
customer locations, are charged to selling and marketing expense.
For the year ended December 31, 2018 and 2017, shipping and
handling costs included in sales and marketing expenses were $146
and $139 respectively.
75
Borrowing Costs
Borrowing costs
attributable directly to the acquisition, construction or
production of qualifying assets that require a substantial period
of time to be ready for their intended use or sale are capitalized
as part of the cost of those assets. Income earned on temporary
investments of specific borrowings pending their expenditure on
those assets is deducted from borrowing costs capitalized. All
other borrowing costs are recognized in interest expenses in the
consolidated statements of operations and comprehensive income in
the period in which they are incurred. No borrowing costs were
capitalized for the year ended December 31, 2018 or
2017.
Warranty
For each of its
products, the Company generally provides a warranty ranging from 12
to 36 months and covering replacement of the product during the
warranty period. The Company accounts for the estimated warranty
costs as sales and marketing expenses at the time revenue is
recognized. Warranty obligations are affected by historical failure
rates and associated replacement costs. Utilizing historical
warranty cost records, the Company calculates a rate of warranty
expenses to revenue to determine the estimated warranty charge. The
Company updates these estimated charges on a regular basis. The
following table shows changes in the Company’s warranty
obligations for the year ended December 31, 2018 and 2017,
respectively.
|
|
Year
Ended December 31,
|
|
|
|
2018
|
2017
|
|
Balance
at beginning of period
|
$839
|
$290
|
|
Additions
|
1,412
|
736
|
|
Utilized
|
(541)
|
(187)
|
|
Balance
at end of period
|
$1,710
|
$839
|
Government Subsidies
ACM Shanghai has
been awarded four subsidies from local and central governmental
authorities in the PRC. The first subsidy, which was awarded in
October 2008, relates to the development and commercialization of
65-45 nanometer Stress Free Polishing technology. The second
subsidy was awarded in April 2009 to fund interest expenses for
short-term borrowings. The third subsidy was awarded in January
2014 and relates to the development of Electro Copper Plating
technology. The fourth subsidy was awarded in June of 2018, and
related to development of Polytetrafluoroethylene. The PRC
governmental authorities will provide the majority of the funding,
although ACM Shanghai is also required to invest certain amounts in
the projects.
The government
subsidies contain certain operating conditions and therefore are
recorded as long-term liabilities upon receipt. The grant amounts
are recognized in the statements of operations and comprehensive
income:
●
Government
subsidies relating to current expenses are recorded as reductions
of those expenses in the periods in which the current expenses are
recorded. For the years ended December 31, 2018 and 2017,
related government subsidies recognized as reductions of relevant
expenses in the consolidated statements of operations and
comprehensive income were $1,486 and $3,421
respectively.
●
Government
subsidies related to depreciable assets are credited to income over
the useful lives of the related assets for which the grant was
received. For the years ended December 31, 2018 and 2017,
related government subsidies recognized as other income in the
consolidated statements of operations and comprehensive income were
$144 and $135, respectively.
Unearned government
subsidies received are deferred for recognition and recorded as
other long-term liabilities (note 9) in the balance sheet until the
criteria for such recognition are satisfied.
76
Stock-based Compensation
ACM grants stock
options to employees and non-employee consultants and directors and
accounts for those stock-based awards in accordance with FASB ASC
Topic 718, Compensation – Stock Compensation, and FASB ASC
Subtopic 505-50, Equity-Based Payments to
Non-Employees.
Stock-based awards
granted to employees are measured at the fair value of the awards
on the grant date and are recognized as expenses either
(a) immediately on grant, if no vesting conditions are
required or (b) using the graded vesting method, net of
estimated forfeitures, over the requisite service period. The fair
value of stock options is determined using the Black-Scholes
valuation model. Stock-based compensation expense, when recognized,
is charged to the category of operating expense corresponding to
the employee’s service function.
Stock-based awards
granted to non-employees are accounted for at the fair value of the
awards at the earlier of (a) the date at which a commitment
for performance by the non-employee to earn the awards is reached
and (b) the date at which the non-employee’s performance
is complete. The fair value of such non-employee awards is
re-measured at each reporting date using the fair value at each
period end until the vesting date. Changes in fair value between
the reporting dates are recognized by the graded vesting
method.
Operating and Financial Risks
Concentration of Credit Risk
Financial
instruments that potentially subject the Company to credit risk
consist principally of cash and cash equivalents and accounts
receivable. The Company deposits and invests its cash with
financial institutions that management believes are
creditworthy.
The Company is
potentially subject to concentrations of credit risks in its
accounts receivable. Three customers individually accounted for
greater than ten percent of the Company’s revenue for the
year ended 2018 and two of those customers individually accounted
for greater than ten percent of the Company’s revenue in
2017:
|
|
Year
Ended December 31
|
|
|
|
2018
|
2017
|
|
Customer
A
|
24.17%
|
*
|
|
Customer
B
|
23.83
|
18.10
|
|
Customer
C
|
*
|
12.77
|
|
Customer
D
|
*
|
14.12
|
|
Customer
E
|
39.63
|
10.23
|
*
Customer accounted
for less than 10% of revenue in the period.
Interest Rate Risk
As of December 31,
2018 and 2017, the balance of bank borrowings (note 6) was
short-term in nature, matured at various dates within the following
year and did not expose the Company to interest rate
risk.
Liquidity Risk
The Company’s
working capital at December 31, 2018 and 2017 was sufficient to
meet its then-current requirements. The Company may, however,
require additional cash due to changing business conditions or
other future developments, including any investments or
acquisitions the Company decides to pursue. In the long run, the
Company intends to rely primarily on cash flows from operations and
additional borrowings from financial institutions in order to meet
its cash needs. If those sources are insufficient to meet cash
requirements, the Company may seek to issue additional debt or
equity.
77
Country Risk
The Company has
significant investments in the PRC. The operating results of the
Company may be adversely affected by changes in the political and
social conditions in the PRC and by changes in Chinese government
policies with respect to laws and regulations, anti-inflationary
measures, currency conversion and remittance abroad, and rates and
methods of taxation, among other things.
Foreign Currency Risk and Translation
The Company’s
consolidated financial statements are presented in U.S. dollars,
which is the Company’s reporting currency, while the
functional currency of ACM’s subsidiaries is the Chinese
Renminbi (“RMB”), and the Korean Won. Changes in the
relative values of U.S. dollars and Chinese RMB affect the
Company’s reported levels of revenues and profitability as
the results of its operations are translated from RMB into U.S.
dollars for reporting purposes. Because the Company has not engaged
in any hedging activities, it cannot predict the impact of future
exchange rate fluctuations on the results of its operations and it
may experience economic losses as a result of foreign currency
exchange rate fluctuations.
Transactions of
ACM’s subsidiaries involving foreign currencies are recorded
in functional currency according to the rate of exchange prevailing
on the date when the transaction occurs. The ending balances of the
Company’s foreign currency accounts are converted into
functional currency using the rate of exchange prevailing at the
end of each reporting period. Net gains and losses resulting from
foreign exchange transactions are included in the consolidated
statements of operations and comprehensive income. Total exchange
gain (loss) was ($979) and $1,052 for the years ended
December 31, 2018 and 2017.
In accordance with
FASB ASC Topic 830, Foreign
Currency Matters, the Company translates assets and
liabilities into U.S. dollars from RMB or Korean Won using the rate
of exchange prevailing at the applicable balance sheet date and the
consolidated statements of operations and comprehensive income and
consolidated statements of cash flows are translated at an average
rate during the reporting period. Adjustments resulting from the
translation are recorded in stockholders’ (deficit) equity as
part of accumulated other comprehensive income (loss). Any
differences between the initially recorded amount and the
settlement amount are recorded as a gain or loss on foreign
currency transaction in the consolidated statements of operations
and comprehensive income.
Translations of
amounts from RMB and Korean Won into U.S. dollars were made at the
following exchange rates for the respective dates and
periods:
|
Consolidated balance sheets:
|
|
|
At December 31,
2018
|
RMB 6.8634 to
$1.00
|
|
At December 31,
2017
|
RMB 6.5359 to
$1.00
|
|
At December 31,
2018
|
KRW 1,114.83 to
$1.00
|
|
At December 31,
2017
|
No transactions in
Korean Won
|
|
|
|
|
Consolidated statements of operations and comprehensive
income:
|
|
|
Year ended December
31, 2018
|
RMB 6.6181 to
$1.00
|
|
Year ended December
31, 2017
|
RMB 6.7522 to
$1.00
|
|
Year ended December
31, 2018
|
KRW 1,100.11
to $1.00
|
|
Year ended December
31, 2017
|
No transactions in
Korean Won
|
78
Income Taxes
The Company
accounts for income taxes using the liability method whereby
deferred tax asset and liability account balances are determined
based on differences between the financial reporting and tax bases
of assets and liabilities and are measured using the enacted tax
rates and laws that will be in effect when the differences are
expected to reverse. The Company provides a valuation allowance, if
necessary, to reduce deferred tax assets to their estimated
realizable values.
In evaluating the
ability to recover its deferred income tax assets, the Company
considers all available positive and negative evidence, including
its operating results, ongoing tax planning and forecasts of future
taxable income on a jurisdiction-by-jurisdiction basis. In the
event the Company determines that it would be able to realize its
deferred income tax assets in the future in excess of their net
recorded amount, it would make an adjustment to the valuation
allowance that would reduce the provision for income taxes.
Conversely, in the event that all or part of the net deferred tax
assets are determined not to be realizable in the future, an
adjustment to the valuation allowance would be charged to earnings
in the period such determination is made.
Tax benefits
related to uncertain tax positions are recognized when it is more
likely than not that a tax position will be sustained during an
audit. Interest and penalties related to unrecognized tax benefits
are included within the provision for income tax.
Basic and Diluted Net Income (Loss) per Common Share
Basic and diluted
net income (loss) per common share is calculated as
follows:
|
|
For the Year Ended
December 31
|
|
|
|
2018
|
2017
|
|
Numerator:
|
|
|
|
Net
income (loss)
|
$6,574
|
$(872)
|
|
Net
loss attributable to non-controlling interest
|
-
|
(554)
|
|
Net income (loss)
attributable to ACM, basic and diluted
|
6,574
|
$(318)
|
|
Denominator:
|
|
|
|
Weighted
average shares outstanding, basic
|
15,788,460
|
6,865,390
|
|
Effect
of dilutive securities
|
2,123,645
|
-
|
|
Weighted
average shares outstanding, diluted
|
17,912,105
|
6,865,390
|
|
Net
income (loss) attributable to ACM per common share:
|
|
|
|
Basic
|
$0.42
|
$(0.05)
|
|
Diluted
|
$0.37
|
$(0.05)
|
Basic and diluted
net income (loss) per common share is presented using the two-class
method, which allocates undistributed earnings to common stock and
any participating securities according to dividend rights and
participation rights on a proportionate basis. Under the two-class
method, basic net income (loss) per common share is computed by
dividing the sum of distributed and undistributed earnings
attributable to common stockholders by the weighted average number
of shares of common stock outstanding during the period. Shares of
ACM’s Series A, B, C, D, E and F convertible preferred stock
are participating securities, as the holders are entitled to
participate in and receive the same dividends as may be declared
for common stockholders on a pro-rata, if-converted
basis.
ACM has been
authorized to issue Class A and Class B common stock since
redomesticating in Delaware in November 2016. The two classes of
common stock are substantially identical in all material respects,
except for voting rights. Since ACM did not declare any dividends
during the years ended December 31, 2018 and 2017, the net income
(loss) per common share attributable to each class is the same
under the “two-class” method. As such, the two classes
of common stock have been presented on a combined basis in the
consolidated statements of operations and comprehensive income
(loss) and in the above computation of net income (loss) per common
share.
79
Diluted net income
(loss) per common share reflects the potential dilution from
securities that could share in ACM’s earnings. All potential
dilutive securities, including potentially dilutive convertible
preferred stocks and stock options, if any, were excluded from the
computation of dilutive net loss per common share for the years
ended December 31, 2018 and 2017, as their effects are antidilutive
due to our net loss for those periods. The potentially dilutive
securities that were not included in the calculation of diluted net
income per share in the periods presented where their inclusion
would be anti-dilutive are as follows:
|
|
Year
Ended December 31
|
|
|
|
2018
|
2017
|
|
Stock
options
|
3,715,779
|
3,372,292
|
|
Warrant
|
80,000
|
477,502
|
|
|
3,795,779
|
3,849,794
|
Comprehensive Income (Loss) Attributable to the
Company
The Company applies
FASB ASC Topic 220, Comprehensive Income, which establishes
standards for the reporting and display of comprehensive income or
loss, requiring its components to be reported in a financial
statement with the same prominence as other financial statements.
The comprehensive income (loss) attributable to the Company was
$5,595 and $(31) for the years ended December 31, 2018 and 2017,
respectively.
Appropriated Retained Earnings
The income of
ACM’s PRC subsidiaries is distributable to their shareholders
after transfers to reserves as required under relevant PRC laws and
regulations and the subsidiaries’ Articles of Association. As
stipulated by the relevant laws and regulations in the PRC, the PRC
subsidiaries are required to maintain reserves, including reserves
for statutory surpluses and public welfare funds that are not
distributable to shareholders. A PRC subsidiary’s
appropriations to the reserves are approved by its board of
directors. At least 10% of annual statutory after-tax profits, as
determined in accordance with PRC accounting standards and
regulations, is required to be allocated to the statutory surplus
reserves. If the cumulative total of the statutory surplus reserves
reaches 50% of a PRC subsidiary’s registered capital, any
further appropriation is optional.
Statutory surplus
reserves may be used to offset accumulated losses or to increase
the registered capital of a PRC subsidiary, subject to approval
from the relevant PRC authorities, and are not available for
dividend distribution to the subsidiary’s shareholders. The
PRC subsidiaries are prohibited from distributing dividends unless
any losses from prior years have been offset. Except for offsetting
prior years’ losses, however, statutory surplus reserves must
be maintained at a minimum of 25% of share capital after such
usage. No retained earnings of either PRC subsidiary had been
appropriated to statutory surplus reserves as the PRC subsidiaries
recorded accumulated losses as of December 31, 2018 and
2017.
Fair Value of Financial Instruments
Under the
FASB’s authoritative guidance on fair value measurements,
fair value is the price that would be received to sell an asset or
paid to transfer a liability in an orderly transaction between
market participants at the measurement date. In determining the
fair value, the Company uses various methods including market,
income and cost approaches. Based on these approaches, the Company
often utilizes certain assumptions that market participants would
use in pricing the asset or liability, including assumptions about
risk and the risks inherent in the inputs to the valuation
technique. These inputs can be readily observable, market
corroborated or generally unobservable inputs. The Company uses
valuation techniques that maximize the use of observable inputs and
minimize the use of unobservable inputs. Based on observability of
the inputs used in the valuation techniques, the Company is
required to provide the following information according to the fair
value hierarchy. The fair value hierarchy ranks the quality and
reliability of the information used to determine fair values.
Financial assets and liabilities carried at fair value are
classified and disclosed in one of the following three
categories:
80
Level 1: Valuations
for assets and liabilities traded in active exchange markets.
Valuations are obtained from readily available pricing sources for
market transactions involving identical assets or
liabilities.
Level 2: Valuations
for assets and liabilities traded in less active dealer or broker
markets. Valuations are obtained from third party pricing services
for identical or similar assets or liabilities.
Level 3: Valuations
for assets and liabilities that are derived from other valuation
methodologies, including option pricing models, discounted cash
flow models and similar techniques, and not based on market
exchange, dealer or broker traded transactions. Level 3 valuations
incorporate certain unobservable assumptions and projections in
determining the fair value assigned to such assets.
All transfers
between fair value hierarchy levels are recognized by the Company
at the end of each reporting period. In certain cases, the inputs
used to measure fair value may fall into different levels of the
fair value hierarchy. In such cases, an investment’s level
within the fair value hierarchy is based on the lowest level of
input that is significant to the fair value measurement in its
entirety requires judgment, and considers factors specific to the
investment. The inputs or methodology used for valuing financial
instruments are not necessarily an indication of the risks
associated with investment in those instruments.
Fair Value Measured or Disclosed on a Recurring Basis
Short-term borrowings—Interest
rates under the borrowing agreements with the lending parties were
determined based on the prevailing interest rates in the market.
The Company classifies the valuation techniques that use these
inputs as Level 2 fair value measurement.
Warrant liability—The fair value
of the warrant liability derives from the Black-Scholes valuation
model which incorporates certain unobservable assumptions (Note 8).
The Company classifies the valuation techniques that use these
inputs as Level 3 fair value measurement.
Other financial items for disclosure
purpose—The fair value of other financial items of the
Company for disclosure purpose, including cash and cash
equivalents, accounts receivable, other receivables, other current
assets, accounts payable, advances from customers, and other
payables and accrued expenses, approximate their carrying value due
to their short-term nature.
As of December 31,
2018 and 2017, information about inputs into the fair value
measurement of the Company’s liabilities that are measured
and recorded at fair value on a recurring basis in periods
subsequent to their initial recognition is as follows:
|
|
Fair
Value Measurement at Reporting Date Using
|
|||
|
|
Quoted
Prices in Active Markets for Identical Liabilities (Level
1)
|
Significant
Other Observable Inputs (Level 2)
|
Significant
Unobservable Inputs (Level 3)
|
Total
|
|
|
(in thousands)
|
|
||
|
As of December 31, 2018:
|
|
|
|
|
|
Liabilities:
|
|
|
|
|
|
Short-term
borrowings
|
$-
|
$9,447
|
$-
|
$9,447
|
|
|
$-
|
$9,447
|
$-
|
$9,447
|
|
|
|
|
|
|
|
As of December 31, 2017:
|
|
|
|
|
|
Liabilities:
|
|
|
|
|
|
Short-term
borrowings
|
$-
|
$5,095
|
$-
|
$5,095
|
|
Warrant
liability
|
-
|
-
|
3,079
|
3,079
|
|
|
$-
|
$5,095
|
$3,079
|
$8,174
|
81
Fair Value Measured on a Non-Recurring Basis
The Company reviews
long-lived assets for impairment annually or more frequently if
events or changes in circumstances indicate the possibility of
impairment. Long-lived assets are measured at fair value on a
nonrecurring basis when there is an indicator of impairment, and
they are recorded at fair value only when impairment is recognized.
In determining the fair value, the Company used projections of cash
flows directly associated with, and which are expected to arise as
a direct result of, the use and eventual disposition of the assets.
This approach required significant judgments including the
Company’s projected net cash flows, which were derived using
the most recent available estimate for the reporting unit
containing the assets tested. Several key assumptions included
periods of operation, projections of product pricing, production
levels, product costs, market supply and demand, and
inflation.
Reclassification of Accounts
Certain prior
year’s amounts have been reclassified to conform to current
year presentations. There was no change to previously reported
stockholders’ deficit or net income.
Recently Adopted Accounting Pronouncements
In May 2017, the
Financial
Accounting Standards Board (“FASB”) issued
Accounting Standards Update (“ASU”) No. 2017-09,
Compensation—Stock
Compensation (Topic 718): Scope of Modification Accounting
(“ASU 2017-09”),
which provides guidance on determining which changes to the terms
and conditions of share-based payment awards require an entity to
apply modification accounting under Topic 718. The amendments in
this ASU are effective for all entities for annual periods, and
interim periods within those annual periods, beginning after
December 15, 2017. Early adoption is permitted, including adoption
in any interim period, for (1) public business entities for
reporting periods for which financial statements have not yet been
issued and (2) all other entities for reporting periods for which
financial statements have not yet been made available for issuance.
The amendments in this ASU should be applied prospectively to an
award modified on or after the adoption date. The adoption of ASU
2017-09 did not have a material impact on the Company’s
consolidated financial statements.
In February 2017,
the FASB issued ASU No. 2017-05, Other Income—Gains and Losses from the
Derecognition of Nonfinancial Assets (Subtopic 610-20): Clarifying
the Scope of Asset Derecognition Guidance and Accounting for
Partial Sales of Nonfinancial Assets (“ASU 2017-05”), which
clarifies the scope of nonfinancial asset guidance in Subtopic
610-20. This ASU also clarifies that derecognition of all
businesses and nonprofit activities (except those related to
conveyances of oil and gas mineral rights or contracts with
customers) should be accounted for in accordance with the
derecognition and deconsolidation guidance in Subtopic 810-10. The
amendments in this ASU also provide guidance on the accounting for
so-called “partial sales” of nonfinancial assets within
the scope of Subtopic 610-20 and contributions of nonfinancial
assets to a joint venture or other noncontrolled investee. The
amendments in this ASU are effective for annual reporting reports
beginning after December 15, 2017, including interim reporting
periods within that reporting period. The adoption of ASU 2017-05
did not have a material impact on the Company’s consolidated
financial statements.
In November 2016,
the FASB issued ASU No. 2016-18, Statement of Cash Flows (Topic 230):
Restricted Cash (“ASU
2016-18”), which requires that a statement of cash
flows explain the change during the period in the total of cash,
cash equivalents, and amounts generally described as restricted
cash or restricted cash equivalents. Therefore, amounts generally
described as restricted cash and restricted cash equivalents should
be included with cash and cash equivalents when reconciling the
beginning-of-period and end-of-period total amounts shown on the
statement of cash flows. The amendments in this ASU do not provide
a definition of restricted cash or restricted cash equivalents. The
amendments in this ASU are effective for public business entities
for fiscal years beginning after December 15, 2017, and interim
periods within those fiscal years. Early adoption is permitted,
including adoption in an interim period. The adoption of ASU
2016-18 did not have a material impact on the Company’s
consolidated financial statements.
82
In August 2016, the
FASB issued ASU No. 2016-15, Statement of Cash Flows (Topic 230):
Classification of Certain Cash Receipts and Cash Payments
(“ASU 2016-15”),
which addresses the following cash flow issues: (1) debt
prepayment or debt extinguishment costs; (2) settlement of
zero-coupon debt instruments or other debt instruments with coupon
interest rates that are insignificant in relation to the effective
interest rate of the borrowing; (3) contingent consideration
payments made after a business combination; (4) proceeds from the
settlement of insurance claims; (5) proceeds from the settlement of
corporate-owned life insurance policies, including bank-owned life
insurance policies; (6) distributions received from equity method
investees; (7) beneficial interests in securitization transactions;
and (8) separately identifiable cash flows and application of the
predominance principle. The amendments in this ASU are effective
for public business entities for fiscal years beginning after
December 15, 2017 and interim periods within those fiscal years and
are effective for all other entities for fiscal years beginning
after December 15, 2018 and interim periods within fiscal years
beginning after December 15, 2019. Early adoption is permitted,
including adoption in an interim period. The adoption of ASU
2016-15 did not have material impact on the Company’s
consolidated financial statements.
In January 2016,
the FASB issued ASU No. 2016-01, “Financial Instruments – Overall
(Subtopic 825-10): Recognition and Measurement of Financial Assets
and Financial Liabilities” (“ASU
2016-01”). The amendments in this update require all equity
investments to be measured at fair value with changes in the fair
value recognized through net income (other than those accounted for
under the equity method of accounting or those that result in
consolidation of the investee). The amendments in this update also
require an entity to present separately in other comprehensive
income the portion of the total change in the fair value of a
liability resulting from a change in the instrument-specific credit
risk when the entity has elected to measure the liability at fair
value in accordance with the fair value option for financial
instruments. In addition, the amendments in this update eliminate
the requirement to disclose the method(s) and significant
assumptions used to estimate the fair value that is required to be
disclosed for financial instruments measured at amortized cost on
the balance sheet for public entities. For public business
entities, the amendments in ASU 2016-01 are effective for fiscal
years beginning after December 15, 2017, including interim periods
within those fiscal years. Except for the early application
guidance discussed in ASU 2016-01, early adoption of the amendments
in this update is not permitted. The adoption of the ASU 2016-01
did not have a material impact on the Company’s consolidated
financial statements.
In May 2014, the
FASB issued ASU No. 2014-09, Revenue from Contracts with Customers (Topic
606) (“ASU 2014-09”), which amended the
existing accounting standards for revenue recognition. ASU 2014-09
establishes principles for recognizing revenue upon the transfer of
promised goods or services to customers, in an amount that reflects
the expected consideration received in exchange for those goods or
services. ASU 2014-09 and its related clarifying ASUs are effective
for annual reporting periods beginning after December 15, 2017 and
interim periods within those annual periods.
On January 1, 2018,
the Company adopted ASC Topic 606, Revenue from Contracts with Customers,
and all the related amendments (the “New Revenue
Standard”) to all contracts which were not completed as of
January 1, 2018 using the modified retrospective method. The
Company does not have open contracts that may result in any changes
to revenues applying the New Revenue Standard.
Recent Accounting
Pronouncements Not Yet Adopted
In June 2018, the
FASB issued ASU 2018-07, Compensation — Stock Compensation (Topic
718) — Improvements to Nonemployee Share-Based Payment
Accounting (“ASU 2018-07”), which simplifies
several aspects of the accounting for nonemployee share-based
payment transactions resulting from expanding the scope of Topic
718, Compensation--Stock Compensation, to include share-based
payment transactions for acquiring goods and services from
nonemployees. Some of the areas for simplification apply only to
nonpublic entities. ASU 2018-07 specifies that Topic 718
applies to all share-based payment transactions in which a grantor
acquires goods or services to be used or consumed in a
grantor’s own operations by issuing share-based payment
awards. ASU 2018-07 also clarify that Topic 718 does not apply to
share-based payments used to effectively provide (1) financing
to the issuer or (2) awards granted in conjunction with selling
goods or services to customers as part of a contract accounted for
under the New Revenue Standard. ASU 2018-07 is effective for
public business entities for fiscal years beginning after December
15, 2018, including interim periods within that fiscal year. Early
adoption is permitted. The Company does not expect the adoption of
ASU 2018-07 to have a material impact on its consolidated
financial statements and related disclosures.
83
In February 2018, the FASB issued
ASU No. 2018-02, Income
Statement—Reporting Comprehensive Income (Topic 220):
Reclassification of Certain Tax Effects from Accumulated Other
Comprehensive Income (“ASU 2018-02”), which
provides financial statement preparers with an option to reclassify
stranded tax effects within accumulated other comprehensive income
to retained earnings in each period in which the effect of the
change in the U.S. federal corporate income tax rate in the Tax
Cuts and Jobs Act (or portion thereof) is recorded. The amendments
in ASU 2018-02 are effective for all entities for fiscal years
beginning after December 15, 2018, and interim periods within those
fiscal years. Early adoption of ASU 2018-02 is permitted, including
adoption in any interim period for the public business entities for
reporting periods for which financial statements have not yet been
issued. The amendments in ASU 2018-02 should be applied either
in the period of adoption or retrospectively to each period (or
periods) in which the effect of the change in the U.S. federal
corporate income tax rate in the Tax Cuts and Jobs Act is
recognized. The Company does not expect the adoption of ASU 2018-02
to have a material impact on its consolidated financial
statements.
In July 2017, the
FASB issued ASU No. 2017-11, Earnings Per Share (Topic 260); Distinguishing
Liabilities from Equity (Topic 480); Derivatives and Hedging (Topic
815): (Part I) Accounting for Certain Financial Instruments with
Down Round Features, (Part II) Replacement of the Indefinite
Deferral for Mandatorily Redeemable Financial Instruments of
Certain Nonpublic Entities and Certain Mandatorily Redeemable
Noncontrolling Interests with a Scope Exception (“ASU 2017-11”), which
addresses the complexity of accounting for certain financial
instruments with down round features. Down round features are
features of certain equity-linked instruments (or embedded
features) that result in the strike price being reduced on the
basis of the pricing of future equity offerings. Current accounting
guidance creates cost and complexity for entities that issue
financial instruments (such as warrants and convertible
instruments) with down round features that require fair value
measurement of the entire instrument or conversion option. For
public business entities, the amendments in Part I of ASU 2017-11 are effective for fiscal
years, and interim periods within those fiscal years, beginning
after December 15, 2018. For all other entities, the
amendments in Part I of ASU 2017-11 are effective for fiscal
years beginning after December 15, 2019, and interim periods within
fiscal years beginning after December 15, 2020. The Company is
evaluating the impact of the adoption of ASU 2017-11 on its
consolidated financial statements.
In January 2017,
the FASB issued ASU No. 2017-04, Intangibles—Goodwill and Other (Topic
350): Simplifying the Test for Goodwill Impairment
(“ASU 2017-04”),
which removes Step 2 from the goodwill impairment test. An entity
will apply a one-step quantitative test and record the amount of
goodwill impairment as the excess of a reporting unit’s
carrying amount over its fair value, not to exceed the total amount
of goodwill allocated to the reporting unit. ASU 2017-04 does not amend the optional
qualitative assessment of goodwill impairment. A business entity
that is an SEC filer must adopt the amendments in ASU 2017-04 for its annual or any interim
goodwill impairment test in fiscal years beginning after December
15, 2019. Early adoption is permitted for interim or annual
goodwill impairment tests performed on testing dates after January
1, 2017. The Company is evaluating the impact of the adoption of
ASU 2017-04 on its consolidated financial statements.
In February 2016,
the FASB issued ASU No. 2016-02, Leases (Topic 842) (“ASU 2016-02”). The
amendments in ASU 2016-02
create Topic 842, Leases,
and supersede the leases requirements in Topic 840, Leases. Topic 842 specifies the
accounting for leases. The objective of Topic 842 is to establish
the principles that lessees and lessors shall apply to report
useful information to users of financial statements about the
amount, timing, and uncertainty of cash flows arising from a lease.
The main difference between Topic 842 and Topic 840 is the
recognition of lease assets and lease liabilities for those leases
classified as operating leases under Topic 840. Topic 842 retains a
distinction between finance leases and operating leases. The
classification criteria for distinguishing between finance leases
and operating leases are substantially similar to the
classification criteria for distinguishing between capital leases
and operating leases in the previous lease guidance. The result of
retaining a distinction between finance leases and operating leases
is that under the lessee accounting model in Topic 842, the effect
of leases in the statement of comprehensive income and the
statement of cash flows is largely unchanged from previous GAAP.
The amendments in ASU No. 2016-02 are effective for fiscal years
beginning after December 15, 2018, including interim periods within
those fiscal years for public business entities. Early application
of the amendments in ASU No. 2016-02 is permitted. We will
adopt Topic 842 effective January 1, 2019 using a modified
retrospective method and will not restate comparative periods. As
permitted under the transition guidance, we will carry forward the
assessment of whether our contracts contain or are leases,
classification of our leases and remaining lease terms. Based on
our portfolio of leases as of December 31, 2018, approximately $5
million of lease assets and liabilities will be recognized on our
balance sheet upon adoption, primarily relating to real estate. We
are substantially complete with our implementation
efforts.
84
NOTE
3 – ACCOUNTS RECEIVABLE
At December 31,
2018 and 2017, accounts receivable consisted of the
following:
|
|
December
31,
|
|
|
|
2018
|
2017
|
|
Accounts
receivable
|
$24,608
|
$26,762
|
|
Less:
Allowance for doubtful accounts
|
-
|
|
|
Total
|
$24,608
|
$26,762
|
The Company reviews
accounts receivable on a periodic basis and makes general and
specific allowances when there is doubt as to the collectability of
individual balances. No allowance for doubtful accounts was
considered necessary at December 31, 2018 and 2017. At December 31,
2018 and 2017, accounts receivable of $1,457 (RMB 10,000) and
$1,805 (RMB 11,800), respectively, were pledged as collateral for
borrowings from financial institutions (note 6).
NOTE 4 –
INVENTORY
At December 31,
2018 and 2017, inventory consisted of the
following:
|
|
December
31,
|
|
|
|
2018
|
2017
|
|
Raw
materials
|
$12,646
|
$6,181
|
|
Work
in process
|
9,631
|
4,328
|
|
Finished
goods
|
16,487
|
4,879
|
|
Total
inventory, gross
|
38,764
|
15,388
|
|
Inventory
reserve
|
-
|
-
|
|
Total
inventory, net
|
$38,764
|
$15,388
|
The Company did not
set up any inventory reserve as of December 31, 2018 or 2017
and no inventory was pledged as collateral for borrowings from
financial institutions. System shipments of first-tools to an
existing or prospective customer, for which ownership does not
transfer until customer acceptance, are classified as finished
goods inventory and carried at cost until ownership is
transferred.
NOTE
5 – PROPERTY, PLANT AND EQUIPMENT, NET
At
December 31, 2018 and 2017, property, plant and equipment
consisted of the following:
|
|
December
31,
|
|
|
|
2018
|
2017
|
|
Manufacturing
equipment
|
$9,703
|
$9,660
|
|
Office
equipment
|
512
|
463
|
|
Transportation
equipment
|
184
|
203
|
|
Leasehold
improvement
|
1,379
|
277
|
|
Total
cost
|
11,778
|
10,603
|
|
Less:
Total accumulated depreciation
|
(8,102)
|
(8,263)
|
|
Construction
in progress
|
32
|
-
|
|
Total
property, plant and equipment, net
|
$3,708
|
$2,340
|
Depreciation
expense was $350 and $243 for the years ended December 31,
2018 and 2017, respectively.
85
NOTE 6 –
SHORT-TERM BORROWINGS
At December 31,
2018 and 2017, short-term borrowings consisted of the
following:
|
|
December
31,
|
|
|
|
2018
|
2017
|
|
Line of credit up
to RMB 30,000 from Bank of China Pudong Branch, due on March 5,
2018 with annual interest rate of 5.69%, secured by certain of the
Company’s intellectual property and fully repaid on March 5,
2018 .
|
$-
|
$2,219
|
|
Line of credit up
to RMB 25,000 from Bank of Shanghai Pudong Branch, due on Various
dates of October 2018 with an annual interest rate of 5.66%,
guaranteed by the Company’s CEO and fully repaid on May 8,
2018.
|
-
|
2,111
|
|
Line of credit up
to RMB 50,000 from Bank of Shanghai Pudong Branch, due on April 17,
2019 with an annual interest rate of 4.99%, guaranteed by the
Company’s CEO.
|
3,133
|
-
|
|
Line of credit up
to RMB 50,000 from Bank of Shanghai Pudong Branch, due on February
14, 2019 with an annual interest rate of 5.15%, guaranteed by the
Company’s CEO.
|
485
|
-
|
|
Line of credit up
to RMB 5,000 from Shanghai Rural Commercial Bank, due on November
21, 2018 with an annual interest rate of 5.44%, guaranteed by the
Company’s CEO and pledged by accounts receivable (Note
3).
|
-
|
765
|
|
Line of credit up
to RMB 10,000 from Shanghai Rural Commercial Bank, due on January
23, 2019 with an annual interest rate of 5.44%, guaranteed by the
Company’s CEO and pledged by accounts receivable (Note
3).
|
1,457
|
-
|
|
Line of credit up
to RMB 30,000 from Bank of China Pudong Branch, due on June 6, 2019
with annual interest rate of 5.22%, secured by certain of the
Company’s intellectual property and the Company’s
CEO.
|
2,186
|
-
|
|
Line of credit up
to RMB 30,000 from Bank of China Pudong Branch, due on June 13,
2019 with annual interest rate of 5.22%, secured by certain of the
Company’s intellectual property and the Company’s
CEO.
|
2,186
|
|
|
Total
|
$9,447
|
$5,095
|
For the years ended
December 31, 2018 and 2017, interest expense related to
short-term borrowings amounted to $498 and $272
respectively.
NOTE 7 –
OTHER PAYABLE AND ACCRUED EXPENSES
At
December 31, 2018 and 2017, other payable and accrued expenses
consisted of the following:
|
|
December
31,
|
|
|
|
2018
|
2017
|
|
Lease
expenses and payable for leasehold improvement due to a related
party (note 11)
|
$53
|
$2,024
|
|
Accrued
commissions
|
2,931
|
836
|
|
Accrued
warranty
|
1,710
|
839
|
|
Accrued
payroll
|
626
|
745
|
|
Accrued
professional fees
|
64
|
60
|
|
Accrued
machine testing fees
|
3,076
|
684
|
|
Others
|
1,950
|
849
|
|
Total
|
$10,410
|
$6,037
|
86
NOTE 8 –
WARRANT LIABILITY
On December 9,
2016, Shengxin (Shanghai) Management Consulting Limited Partnership
(“SMC”), a related party (note 11), delivered RMB
20,124 (approximately $2,981 as of the close of business on such
date) in cash (the “SMC Investment”) to ACM Shanghai
for potential investment pursuant to terms to be subsequently
negotiated
On March 14, 2017,
ACM, ACM Shanghai and SMC entered into a securities purchase
agreement (the “SMC Agreement”) pursuant to which, in
exchange for the SMC Investment, ACM issued to SMC a warrant
exercisable, for cash or on a cashless basis, to purchase, at any
time on or before May 17, 2023, all, but not less than all, of
397,502 shares of Class A common stock at a price of $7.50 per
share.
The warrant issued
to SMC, while outstanding as of December 31, 2017, was classified
as a liability as it was conditionally puttable in accordance with
FASB ASC 480, Distinguishing Liabilities from Equity. The fair
value of the warrant was adjusted for changes in fair value at each
reporting period but could not be lower than the proceeds of the
SMC Investment. The corresponding non-cash gain or loss of the
changes in fair value was recorded in earnings. The methodology
used to value the warrant was the Black-Scholes valuation
model.
On March 30, 2018,
ACM entered into a warrant exercise agreement with ACM Shanghai and
SMC pursuant to which SMC exercised its warrant in full by issuing
to ACM a senior secured promissory note in the principal amount of
approximately $3,000. ACM then transferred the SMC note to ACM
Shanghai in exchange for an intercompany promissory note of ACM
Shanghai in the principal amount of approximately $3,000. Each of
the two notes bears interest at a rate of 3.01% per annum and
matures on August 17, 2023. As security for its performance of its
obligations under its note, SMC granted to ACM Shanghai a security
interest in the 397,502 shares of Class A common stock issued to
SMC upon its exercise of the warrant. Upon the issuance of 397,502
shares of Class A common stock to SMC, the senior secured
promissory note issued to AMC by SMC was offset against the SMC
investment.
NOTE 9–
OTHER LONG-TERM LIABILITIES
Other long-term
liabilities represent government subsidies received from PRC
governmental authorities for development and commercialization of
certain technology but not yet recognized (note 2). As of December
31, 2018 and 2017, other long-term liabilities consisted of the
following unearned government subsidies:
|
|
December
31
|
|
|
|
2018
|
2017
|
|
Subsidies
to Stress Free Polishing project, commenced in 2008 and
2017
|
$1,483
|
$1,952
|
|
Subsidies
to Electro Copper Plating project, commenced in 2014
|
2,860
|
4,265
|
|
Subsidies
to Polytetrafluoroethylene, commenced in 2018
|
178
|
-
|
|
Other
|
62
|
-
|
|
Total
|
$4,583
|
$6,217
|
NOTE
10 – EQUITY METHOD INVESTMENT
On September 6,
2017, ACM and Ninebell Co., Ltd. (“Ninebell”), a Korean
company that is one of the Company’s principal materials
suppliers, entered into an ordinary share purchase agreement,
effective as of September 11, 2017, pursuant to which Ninebell
issued to ACM ordinary shares representing 20% of Ninebell’s
post-closing equity for a purchase price of $1,200, and a common
stock purchase agreement, effective as of September 11, 2017,
pursuant to which ACM issued 133,334 shares of Class A common stock
to Ninebell for a purchase price of $1,000 at $7.50 per share. The
investment in Ninebell is accounted for under the equity method.
Undistributed earnings attributable to ACM’s equity method
investment represented $123 and $37 of the consolidated retained
earnings at December 31, 2018 and 2017, respectively.
87
NOTE
11 – RELATED PARTY BALANCES AND TRANSACTIONS
On August 18, 2017,
ACM and Ninebell, its equity method investment affiliate (note 10),
entered into a loan agreement pursuant to which ACM made an
interest-free loan of $946 to Ninebell, payable in 180 days or
automatically extended another 180 days if in default. The loan was
secured by a pledge of Ninebell’s accounts receivable due
from ACM and all money that Ninebell received from ACM. Ninebell
repaid the loan in March 2018. ACM purchased materials from
Ninebell amounting to $7,785 and $3,704 during the years ended
December 31, 2018 and 2017, respectively. As of December 31, 2018
and 2017, accounts payable due to Ninebell were $1,477 and $2,118,
respectively, and prepaid to Ninebell for material purchases were
$572 and $229, respectively.
In 2007 ACM
Shanghai entered into an operating lease agreement with Shanghai
Zhangjiang Group Co., Ltd. (“Zhangjiang Group”) to
lease manufacturing and office space located in Shanghai, China. An
affiliate of Zhangjiang Group holds 787,098 shares of Class A
common stock that it acquired in September 2017 for $5,903.
Pursuant to the lease agreement, Zhangjiang Group provided $771 to
ACM Shanghai for leasehold improvements. In September 2016 the
lease agreement was amended to modify payment terms and extend the
lease through December 31, 2017. From January 1 to April 25, 2018,
ACM Shanghai leased the property on a month-to-month basis. On
April 26, 2018, ACM Shanghai entered into a renewed lease with
Zhangjiang Group for the period from January 1, 2018 through
December 31, 2022. Under the lease, ACM Shanghai would pay a
monthly rental fee of approximately RMB 366 (equivalent to $55).
The required security deposit is RMB 1,077 (equivalent to $163).
The Company incurred leasing expenses under the lease agreement of
$620 and $638 during the years ended December 31, 2018 and 2017,
respectively. As of December 31, 2018 and 2017, payables to
Zhangjiang Group for lease expenses and leasehold improvements
recorded as other payables and accrued expenses amounted to $53 and
$2,024, respectively (note 7).
On December 9,
2016, ACM Shanghai received the SMC Investment from SMC for
potential investment pursuant to terms to be subsequently
negotiated (note 8). SMC is a limited partnership incorporated in
the PRC, whose partners consist of employees of ACM Shanghai. On
March 14, 2017, ACM, ACM Shanghai and SMC entered into a securities
purchase agreement (the “SMC Agreement”) pursuant to
which, in exchange for the SMC Investment, ACM issued to SMC a
warrant exercisable, for cash or on a cashless basis, to purchase,
at any time on or before May 17, 2023, all, but not less than all,
of 397,502 shares of Class A common stock at a price of $7.50 per
share, for a total exercise price of $2,981. On March 30, 2018, SMC
exercised the warrant and purchased 397,502 shares of Class A
common stock (note 8).
NOTE
12 – LEASES
ACM entered into a
two-year lease agreement in March 2015 for office and warehouse
space of approximately 3,000 square feet for its headquarters in
Fremont, California, at a rate of $2 per month. On February 4,
2019, ACM amended the lease agreement to extend the lease term
through March 31, 2020 and increase the base rent to $3.3 per month
from April 1, 2019 to March 31, 2020 and $3.4 per month from April
1, 2020 to March 31, 2021.
ACM Shanghai
entered into an operating lease agreement with Zhangjiang Group (a
related party, see Note 11) in 2007 for manufacturing and office
space of approximately 63,510 square feet in Shanghai, China. The
lease terms and its payment terms are subject to modification and
extension with Zhangjiang Group from time to time. The lease with
Zhangjiang Group expired on December 31, 2017 and from January 1,
2018 to April 25, 2018 we leased the property on a month-to-month
basis. On April 26, 2018, ACM Shanghai entered into a renewed lease
with Zhangjiang Group for the period from January 1, 2018 through
December 31, 2022. Under the lease, ACM Shanghai would pay a
monthly rental fee of approximately RMB 366 (equivalent to $55).
The required security deposit is RMB 1,077 (equivalent to
$163).
ACM Wuxi leases
office space in Wuxi, China, at a rate of less than $1 per
month.
88
In January 2018,
ACM Shanghai entered into an operating lease agreement for the
second factory in the Pudong region of Shanghai from January 2018
to January 2023. The new facility has a total of 50,000 square feet
of available floor space. The monthly rent varies during the term
of the lease.
ACM leases its
administrative, research and development and manufacturing
facilities under various operating leases. Future minimum lease
payments under non-cancelable lease agreements as of December 31,
2018 were as follows:
|
|
December
31,
2018
|
|
2019
|
$1,391
|
|
2020
|
1,371
|
|
2021
|
1,403
|
|
2022
|
1,441
|
|
Total
|
$5,606
|
Rent expense was
$1867 and $670 for the years ended December 31, 2018 and 2017,
respectively.
NOTE
13 – COMMON STOCK
ACM is authorized
to issue 100,000,000 shares of Class A common stock and 7,303,533
shares of Class B common stock, each with a par value of $0.0001.
Each share of Class A common stock is entitled to one vote, and
each share of Class B common stock is entitled to twenty votes and
is convertible at any time into one share of Class A common
stock. Shares of Class A common stock and Class B common stock are
treated equally, identically and ratably with respect to any
dividends declared by the Board of Directors unless the Board of
Directors declares different dividends to the Class A common stock
and Class B common stock by getting approval from a majority of
common stock holders.
In August 2017 ACM
entered into a securities purchase agreement with PDHTI and its
subsidiary Pudong Science and Technology (Cayman) Co., Ltd.
(“PST”), in which ACM agreed to bid, in an auction
process mandated by PRC regulations, to purchase PDHTI’s
10.78% equity interest in ACM Shanghai and to sell shares of Class
A common stock to PST. On September 8, 2017, ACM issued 1,119,576
shares of Class A common stock to PST for a purchase price of $7.50
per share, representing an aggregate purchase price of
$8,397.
In August 2017 ACM
entered into a securities purchase agreement with ZSTVC and its
subsidiary Zhangjiang AJ Company Limited (“ZJAJ”), in
which ACM agreed to bid, in an auction process mandated by PRC
regulations, to purchase ZSTVC’s 7.58% equity interest in ACM
Shanghai and to sell shares of Class A common stock to ZJAJ. On
September 8, 2017, ACM issued 787,098 shares of Class A common
stock to ZJAJ for a purchase price of $7.50 per share, or an
aggregate purchase price of $5,903.
In September 2017
ACM issued 133,334 shares of Class A common stock to Ninebell for a
purchase price of $7.50 per share, or an aggregate purchase price
of $1,000 (note 10).
In November 2017
ACM issued 2,233,000 shares of Class A common stock and received
net proceeds of $11,664 from the IPO and concurrently ACM issued an
additional 1,333,334 shares of Class A common stock in a private
placement for net proceeds of $7,053.
Upon the completion
of the IPO on November 2, 2017, the Company issued a five-year
warrant (the “Underwriter's Warrant”) to Roth Capital
Partners, LLC, the lead underwriter of the IPO, for the purchase of
up to 80,000 shares of Class A common stock at an exercise price of
$6.16 per share. The Underwriter’s Warrant was immediately
exercisable and expires on November 1, 2022. The Underwriter's
Warrant is equity classified and its fair value was $137 at the IPO
closing date, using the Black Scholes model with the following
assumptions: volatility of 28.26%, a dividend rate of 0%, and a
risk-free discount rate of 2%.
89
In September 2017
ACM issued 133,334 shares of Class A common stock to Ninebell for a
purchase price of $7.50 per share, or an aggregate purchase price
of $1,000 (note 10).
At various dates
during 2017, ACM issued 472,889 shares of Class A common stock upon
options exercises by certain employees and non-employees. During
the year ended December 31, 2018, the Company issued 265,952 shares
of Class A common stock upon options exercises by certain employees
and non-employees.
On March 30, 2018,
SMC exercised its warrant (note 8) and purchased 397,502 shares of
Class A common stock.
At December 31,
2018 and 2017, the number of shares of Class A common stock issued
and outstanding was 14,110,315 and 12,935,546, respectively. At
December 31, 2018 and 2017, the number of shares of Class B common
stock issued and outstanding was 1,898,423 and 2,409,738,
respectively. During the year ended December 31, 2018, 511,315
shares of Class B common stock were converted into Class A common
stock.
NOTE
14 – STOCK-BASED COMPENSATION
On April 29, 1998,
ACM adopted the 1998 Stock Option Plan (the “1998
Plan”). The options issued under the Plan consisted of
incentive stock options (“ISOs”) and nonstatutory stock
options (“NSOs”) that should be determined at the time
of grant. ISOs could be granted only to employees. NSOs could be
granted to employees, directors and consultants. The option price
of each ISO and each NSO could not be less than 100% or less than
85% of the fair market value of stock price at the time of grant,
respectively. The vesting period was to be determined by the Board
of Directors for each grant. The total number of shares of common
stock reserved under the 1998 Plan, as amended, was 766,667. If any
option granted under the 1998 Plan expires or otherwise terminates
without having been exercised in full, the shares of common stock
subject to that option would become available for re-grant. At
March 3, 2014, the 1998 Plan terminated and no further grants
under the 1998 Plan could be made thereunder, although certain
previously granted options remained outstanding in accordance with
their terms.
On
December 28, 2016, ACM adopted the 2016 Omnibus Incentive
Plan (the “2016 Plan”). Under the 2016 Plan, the
aggregate number of shares of Class A common stock that may be
issued shall equal the sum of (a) 2,333,334 and (b) an
annual increase on the first day of each year beginning in 2018 and
ending in 2026 equal to the lesser of (i) 4% of the shares of
Class A and Class B common stock outstanding (on an as-converted
basis) on the last day of the immediately preceding year and
(ii) such smaller number of shares as may be determined by the
Board. A maximum of 2,333,334 shares is available for issuance as
ISOs under the 2016 Plan. Besides the stock options, the 2016 Plan
also authorizes issuance of stock appreciation rights, restricted
stock, restricted stock units, and other share-based and cash
awards. The 2016 Plan will terminate on December 27,
2026.
Employee Awards
The following table
summarizes the Company’s employee share option activities
during the year ended December 31, 2018:
|
|
Number
of Option Shares
|
Weighted
Average Grant Date Fair Value
|
Weighted
Average Exercise Price
|
Weighted
Average Remaining Contractual Term
|
|
Outstanding
at December 31, 2016
|
2,100,377
|
$0.54
|
$2.03
|
7.83
years
|
|
Granted
|
140,002
|
2.28
|
6.75
|
|
|
Exercised
|
(174,334)
|
0.45
|
0.75
|
|
|
Expired
|
(3,752)
|
0.54
|
3.00
|
|
|
Forfeited
|
(16,677)
|
0.54
|
3.00
|
|
|
Outstanding
at December 31, 2017
|
2,045,616
|
0.66
|
2.46
|
7.57
years
|
|
Granted
|
745,700
|
1.52
|
8.12
|
|
|
Exercised
|
(151,650)
|
0.53
|
2.06
|
|
|
Expired
|
(4,622)
|
0.55
|
3.00
|
|
|
Forfeited
|
(131,639)
|
0.97
|
3.87
|
|
|
Outstanding
at December 31, 2018
|
2,503,405
|
0.91
|
4.09
|
7.30
years
|
|
Vested
and exercisable at December 31, 2018
|
1,327,189
|
|
|
|
90
During the years
ended December 31, 2018 and 2017, ACM recognized employee
stock-based compensation expense of $712 and $271, respectively. As
of December 31, 2018 and 2017, $2,424 and $729, respectively, of
total unrecognized employee stock-based compensation expense, net
of estimated forfeitures, related to stock-based awards were
expected to be recognized over a weighted-average period of 1.62
years and 1.77 years, respectively. Total unrecognized compensation
cost may be adjusted for future changes in estimated
forfeitures.
The fair value of
each option granted to employee is estimated on the grant date
using the Black-Scholes valuation model with the following
assumptions.
|
|
December
31,
|
||
|
|
2018
|
|
2017
|
|
Fair
value of common share(1)
|
$5.31-13.85
|
|
$5.60-7.59
|
|
Expected
term in years(2)
|
6.25
|
|
6.25
|
|
Volatility(3)
|
39.14%
-43.00%
|
|
28.62%
-29.18%
|
|
Risk-free
interest rate(4)
|
2.55%-2.96%
|
|
2.21%-2.22%
|
|
Expected
dividend(5)
|
0%
|
|
0%
|
(1)
Common stock value was the close market value on December 31,
2018.
(2)
Expected term of
share options is based on the average of the vesting period and the
contractual term for each grant according to Staff Accounting
Bulletin 110.
(3)
Volatility is
calculated based on the historical volatility of ACM’s
comparable companies in the period equal to the expected term of
each grant.
(4)
Risk-free interest
rate is based on the yields of U.S. Treasury securities with
maturities similar to the expected term of the share options in
effect at the time of grant.
(5)
Expected dividend
is assumed to be 0% as ACM has no history or expectation of paying
a dividend on its common stock.
Non-employee Awards
The following table
summarizes the Company’s non-employee share option activities
during the year ended December 31, 2018:
|
|
Number
of Option Shares
|
Weighted
Average Grant Date Fair Value
|
Weighted
Average Exercise Price
|
Weighted
Average Remaining Contractual Term
|
|
Outstanding
at December 31, 2016
|
1,578,565
|
$0.51
|
$1.58
|
6.81
years
|
|
Granted
|
196,669
|
2.25
|
6.90
|
|
|
Exercised
|
(298,555)
|
0.39
|
0.93
|
|
|
Expired
|
(133,336)
|
0.45
|
0.75
|
|
|
Forfeited
|
(16,667)
|
2.58
|
7.50
|
|
|
Outstanding
at December 31, 2017
|
1,326,676
|
0.78
|
2.52
|
7.54
years
|
|
Granted
|
-
|
-
|
-
|
-
|
|
Exercised
|
(114,302)
|
0.43
|
1.92
|
-
|
|
Expired
|
-
|
-
|
-
|
-
|
|
Forfeited
|
-
|
-
|
-
|
-
|
|
Outstanding
at December 31, 2018
|
1,212,374
|
$0.78
|
2.57
|
6.66 years
|
|
Vested
and exercisable at December 31, 2018
|
946,691
|
|
|
|
During the
years ended December 31, 2018 and 2017, the Company recognized
non-employee stock-based compensation expense of $2,651 and $1,351,
respectively.
91
The fair value of
each option granted to non-employees is re-measured at each period
end until the vesting date using the Black-Scholes valuation model
with the following assumptions:
|
|
December
31,
|
||
|
|
2018
|
|
2017
|
|
Fair
value of common share(1)
|
$10.88
|
|
$5.25-7.59
|
|
Expected
term in years(2)
|
2.58-5.36
|
|
3.58-6.25
|
|
Volatility(3)
|
40.24%-45.48%
|
|
28.71-29.41
%
|
|
Risk-free
interest rate(4)
|
2.39%-2.94%
|
|
1.62%-2.43
%
|
|
Expected
dividend(5)
|
0%
|
|
0%
|
(1)
Common stock value was the close market value on December 31,
2018.
(2)
Expected term of
share options is based on the average of the vesting period and the
contractual term for each grant according to Staff Accounting
Bulletin 110.
(3)
Volatility is
calculated based on the historical volatility of ACM’s
comparable companies in the period equal to the expected term of
each grant.
(4)
Risk-free interest
rate is based on the yields of U.S. Treasury securities with
maturities similar to the expected term of the share options in
effect at the time of grant.
(5)
Expected dividend
is assumed to be 0% as ACM has no history or expectation of paying
a dividend on its common stock.
NOTE
15 – INCOME TAXES
The following
represent components of the income tax expense (benefit) for the
years ended December 31, 2018 and 2017:
|
|
Year
Ended December 31,
|
|
|
|
2018
|
2017
|
|
Current:
|
|
|
|
U.S.
federal
|
$-
|
$-
|
|
U.S.
state
|
-
|
-
|
|
Foreign
|
(1,149)
|
-
|
|
Total
current tax expense
|
(1,149)
|
-
|
|
Deferred:
|
|
|
|
U.S.
federal
|
-
|
-
|
|
U.S.
state
|
-
|
-
|
|
Foreign
|
343
|
(547)
|
|
Total
deferred tax income (expense)
|
343
|
(547)
|
|
Total
income tax expense
|
$(806)
|
$(547)
|
92
Tax effects of
temporary differences that give rise to significant portions of the
Company’s deferred tax assets at December 31, 2018 and 2017
are presented below:
|
|
December
31,
|
|
|
|
2018
|
2017
|
|
Deferred
tax assets:
|
|
|
|
Net
operating loss carry forwards (offshore)
|
$16
|
$4,418
|
|
Net
operating loss carry forwards (U.S.) and credit
|
4,105
|
683
|
|
Deferred
revenue (offshore)
|
558
|
656
|
|
Accruals
(U.S.)
|
11
|
18
|
|
Reserves
and other (offshore)
|
1,080
|
495
|
|
Stock-based
compensation (U.S.)
|
1,021
|
453
|
|
Property
and equipment (U.S.)
|
1
|
2
|
|
Total
gross deferred tax assets
|
6,792
|
6,725
|
|
Less:
valuation allowance
|
(5,155)
|
(5,431)
|
|
Total
deferred tax assets
|
1,637
|
1,294
|
|
Total
deferred tax liabilities
|
-
|
-
|
|
Translation
difference
|
-
|
-
|
|
Deferred
tax assets, net
|
$1,637
|
$1,294
|
The Company
considers all available evidence to determine whether it is more
likely than not that some portion or all of the deferred tax assets
will be realized. The ultimate realization of deferred tax assets
is dependent upon the generation of future taxable income during
the periods in which those temporary differences become realizable.
Management considers the scheduled reversal of deferred tax
liabilities (including the impact of available carryback and
carry-forward periods), and projected taxable income in assessing
the realizability of deferred tax assets. In making such judgments,
significant weight is given to evidence that can be objectively
verified. Based on all available evidence, a partial valuation
allowance has been established against some net deferred tax assets
as of December 31, 2018 and 2017, based on estimates of
recoverability. While the Company has optimistic plans for its
business strategy, it determined that such a valuation allowance
was necessary given its historical losses and the uncertainty with
respect to its ability to generate sufficient profits from its
business model from all tax jurisdictions. In order to fully
realize the U.S. deferred tax assets, the Company must generate
sufficient taxable income in future periods before the expiration
of the deferred tax assets governed by the tax code. The valuation
allowance in the U.S. decreased by $278 for the year ended December
31, 2018 and increased $760 for the year ended December 31, 2017.
The valuation allowance in China decreased by $2 and decreased by
$58 during the years ended December 31, 2018 and 2017,
respectively.
The Company did not
have any significant temporary differences relating to deferred tax
liabilities as of December 31, 2018 or 2017.
As of December 31,
2018 and 2017, the Company had net operating loss carry-forwards of
respectively, $15,867 and $20,116 for U.S federal purposes, $714
and $536 for U.S. state purposes and $6,411 for Chinese income tax
purposes. Such losses are set to expire in 2019, 2032, and 2019 for
U.S. federal, U.S. state and Chinese income tax purposes,
respectively.
As of December 31,
2018 and 2017, the Company had research credit carry-forwards of
$606 for U.S. federal purposes, and $377 for U.S. state purposes.
Such credits are set to expire in 2025 for U.S. federal
carry-forwards. There is no expiration date for U.S. state
carry-forwards.
A limitation may
apply to the use of the U.S. net operating loss and credit
carry-forwards, under provisions of the U.S. Internal Revenue Code
that would be applicable if ACM experiences an “ownership
change.” Should these limitations apply, the carry-forwards
would be subject to an annual limitation, resulting in a
substantial reduction in the gross deferred tax assets before
considering the valuation allowance. As of December 31, 2018 and
2017, the Company had not performed an analysis to determine if its
net operating loss and credit carry-forwards would be subject to
such limitations.
93
The Company’s
effective tax rate differs from statutory rates of 21% for U.S.
federal income tax purposes and 15%-25% for Chinese income tax
purpose due to the effects of the valuation allowance and certain
permanent differences as it pertains to book-tax differences in the
value of client shares received for services. Pursuant to the
Corporate Income Tax Law of the PRC, all of the Company’s PRC
subsidiaries are liable to PRC Corporate Income Taxes at a rate of
25% except for ACM Shanghai. According to Guoshuihan 2009
No. 203, if an entity is certified as an “advanced and
new technology enterprise,” it is entitled to a preferential
income tax rate of 15%. ACM Shanghai obtained the certificate of
“advanced and new technology enterprise” in 2012 and
again in 2016 with an effective period of three years, and the
provision for PRC corporate income tax for ACM Shanghai is
calculated by applying the income tax rate of 15% for the years
ended December 31, 2018 and 2017.
Income tax expense
(benefit) for the years ended December 31, 2018 and 2017
differed from the amounts computed by applying the statutory
federal income tax rate of 21% and 34%, respectively, to pretax
income (loss) as a result of the following:
|
|
Year
Ended
December
31,
|
|
|
|
2018
|
2017
|
|
Effective
tax rate reconciliation:
|
|
|
|
Income
tax provision at statutory rate
|
21.00%
|
34.00%
|
|
State
taxes, net of Federal benefit
|
-
|
-
|
|
Foreign
rate differential
|
(20.88)
|
6.80
|
|
Other
permanent difference
|
15.59
|
197.7
|
|
Effect
of tax reform
|
-
|
(757)
|
|
Change
in valuation allowance
|
(4.78)
|
349.9
|
|
Total
income tax expense (benefit)
|
(10.93%)
|
(168.65%)
|
Tax positions are
evaluated in a two-step process. The Company first determines
whether it is more likely than not that a tax position will be
sustained upon examination. If a tax position meets the
more-likely-than-not recognition threshold it is then measured to
determine the amount of benefit to recognize in the financial
statements. The tax position is measured as the largest amount of
benefit that is greater than 50% likely of being realized
upon ultimate settlement. The aggregate changes in the balance
of gross unrecognized tax benefits, which excludes interest and
penalties, for the years ended December 31, 2018 and
2017, are as follows:
|
|
December 31,
|
|
|
|
2018
|
2017
|
|
Beginning
balance
|
$44
|
$44
|
|
Increase/(Decrease)
of unrecognized tax benefits taken in prior years
|
-
|
-
|
|
Increase/(Decrease)
of unrecognized tax benefits related to current year
|
-
|
-
|
|
Increase/(Decreases)
of unrecognized tax benefits related to settlements
|
-
|
-
|
|
Reductions
to unrecognized tax benefits related to lapsing statute of
limitations
|
-
|
-
|
|
Ending
balance
|
$44
|
$44
|
The Company files
income tax returns in the United States, and state and foreign
jurisdictions. The federal, state and foreign income tax returns
are under the statute of limitations subject to tax examinations
for the tax years ended December 31, 2009 through December 31,
2017. To the extent the Company has tax attribute carry-forwards,
the tax years in which the attribute was generated may still be
adjusted upon examination by the U.S. Internal Revenue Service,
state or foreign tax authorities to the extent utilized in a future
period.
The Company had $44
of unrecognized tax benefits as of December 31, 2018 and
2017.
94
The Company
recognizes interest and penalties related to uncertain tax
positions in income tax expense. As of December 31, 2018 and 2017,
the Company had $44 of accrued penalties and $44 of accrued
penalties related to uncertain tax positions, none of which has
been recognized in the Company’s consolidated statements of
operations and comprehensive income for the years ended
December 31, 2018 and 2017. There were no ongoing examinations
by taxing authorities as of December 31, 2018 and
2017.
The Company intends
to indefinitely reinvest the PRC earnings outside of the U.S. as of
December 31, 2018 and 2017. Thus, deferred taxes are not provided
in the U.S. for unremitted earnings in the PRC.
On December 22,
2017, the 2017 Tax Cuts and Jobs Act was enacted into law and the
new legislation contains several key tax provisions that affect us,
including a one-time mandatory transition tax on accumulated
foreign earnings and a reduction of the corporate income tax rate
to 21% effective January 1, 2018, among others. We are required to
recognize the effect of the tax law changes in the period of
enactment, such as determining the transition tax, remeasuring our
U.S. deferred tax assets and liabilities as well as reassessing the
net realizability of our deferred tax assets and
liabilities.
NOTE
16 – COMMITMENTS AND CONTINGENCIES
The Company leases
offices under non-cancelable operating lease agreements. The rental
expenses were $1,867 and $670 for the years ended December 31, 2018
and 2017, respectively. See note 12 for future minimum lease
payments under non-cancelable operating lease agreements with
initial terms of one year or more.
The Company did not
have any capital commitments during the reported
periods.
From time to time
the Company is subject to legal proceedings, including claims in
the ordinary course of business and claims with respect to patent
infringements.
NOTE
17 – RESTRICTED NET ASSETS
In accordance with
the PRC’s Foreign Enterprise Law, ACM Shanghai and ACM Wuxi
are required to make contributions to a statutory surplus reserve
(note 2).
As a result of PRC
laws and regulations that require annual appropriations of 10% of
net after-tax profits to be set aside prior to payment of dividends
as a general reserve fund or statutory surplus fund, ACM Shanghai
is restricted in its ability to transfer a portion of its net
assets to ACM (including any assets received as distributions from
ACM Wuxi). Amounts restricted included paid-in capital and
statutory reserve funds, as determined pursuant to PRC accounting
standards and regulations, were $32,076 and $29,927 as of
December 31, 2018 and 2017.
NOTE
18 – PARENT COMPANY ONLY CONDENSED FINANCIAL
INFORMATION
The Company
performed a test on the restricted net assets of consolidated
subsidiaries in accordance with Rule 4-08(e)(3) of Regulation
S-X of the SEC and concluded that it was applicable for the Company
to disclose the financial information for ACM only. Certain
information and footnote disclosures generally included in
financial statements prepared in accordance with GAAP have been
condensed or omitted. The footnote disclosure contains supplemental
information relating to the operations of ACM
separately.
ACM’s
subsidiaries did not pay any dividends to ACM during the periods
presented.
ACM did not have
significant capital or other commitments, long-term obligations, or
guarantees as of December 31, 2018 and 2017.
95
The following
represents condensed unconsolidated financial information of ACM
only as of and for the years ended December 31, 2018 and
2017:
CONDENSED
BALANCE SHEET
|
|
December 31,
|
|
|
|
2018
|
2017
|
|
Assets
|
|
|
|
Current
assets:
|
|
|
|
Cash
and cash equivalents
|
$13,161
|
$10,874
|
|
Accounts
Receivable
|
983
|
118
|
|
Inventory
|
720
|
565
|
|
Due
from intercompany
|
14,494
|
12,669
|
|
Other
receivable
|
175
|
50
|
|
Total
current assets
|
29,533
|
24,276
|
|
Investment
in unconsolidated subsidiaries
|
26,861
|
15,476
|
|
Due
from related party
|
-
|
946
|
|
Total
assets
|
56,394
|
40,698
|
|
Liabilities and
Stockholders’ Equity
|
|
|
|
Notes
payable
|
-
|
11
|
|
Accounts
payable
|
2,818
|
739
|
|
Other
payable
|
58
|
47
|
|
Income
taxes payable
|
1,193
|
44
|
|
Total
liabilities
|
4,069
|
841
|
|
Total
redeemable convertible preferred stocks
|
-
|
-
|
|
Total
stockholders’ equity
|
52,325
|
39,857
|
|
Total
liabilities and stockholders’ equity
|
$56,394
|
$40,698
|
CONDENSED
STATEMENT OF OPERATIONS
|
|
Year
Ended December 31,
|
|
|
|
2018
|
2017
|
|
Revenue
|
$25,506
|
$6,985
|
|
Cost
of revenue
|
(23,927)
|
(6,394)
|
|
Gross
profit
|
1,579
|
591
|
|
Operating
expenses:
|
|
|
|
Sales
and marketing expenses
|
(301)
|
(368)
|
|
General
and administrative expenses
|
(5,083)
|
(3,961)
|
|
Research
and development expenses
|
(255)
|
(50)
|
|
Loss
from operations
|
(4,060)
|
(3,788)
|
|
Equity
in earnings of unconsolidated subsidiaries
|
10,360
|
3,475
|
|
Other
income (expense), net
|
108
|
-
|
|
Interest
expense, net
|
166
|
(5)
|
|
Income
(loss) before income taxes
|
6,574
|
(318)
|
|
Income
tax expense (benefit)
|
-
|
-
|
|
Net
income (loss)
|
$6,574
|
$(318)
|
96
CONDENSED
STATEMENT OF CASH FLOWS
|
|
Year
Ended December 31,
|
|
|
|
2018
|
2017
|
|
Net
cash used in operating activities
|
$(1,189)
|
$(13,848)
|
|
Net
cash provided by (used in) investing activities
|
946
|
(21,754)
|
|
Net
cash provided by financing activities
|
3,510
|
38,676
|
|
Net
increase in cash and cash equivalents
|
3,267
|
3,074
|
|
Cash
and cash equivalents, beginning of year
|
10,874
|
7,264
|
|
Effect
of exchange rate changes on cash and cash equivalents
|
(980)
|
536
|
|
Cash
and cash equivalents, end of year
|
$13,161
|
$10,874
|
97
Item
9A. Controls and Procedures
Evaluation of Disclosure Controls and Procedures
Our management,
with the participation of our Chief Executive Officer and Chief
Accounting Officer, evaluated the effectiveness of our disclosure
controls and procedures pursuant to Rule 13a-15 under the
Securities Exchange Act of 1934, or the Exchange Act, as of
December 31, 2018. The evaluation included certain internal control
areas in which we have made and are continuing to make changes to
improve and enhance controls. In designing and evaluating the
disclosure controls and procedures, management recognized that any
controls and procedures, no matter how well designed and operated,
can provide only reasonable assurance of achieving the desired
control objectives. In addition, the design of disclosure controls
and procedures must reflect the fact that there are resource
constraints and that management is required to apply its judgment
in evaluating the benefits of possible controls and procedures
relative to their costs.
Based on that
evaluation, our Chief Executive Officer and Chief Accounting
Officer concluded that our disclosure controls and procedures are
effective to provide reasonable assurance that information we are
required to disclose in reports that we file or submit under the
Exchange Act is recorded, processed, summarized and reported within
the time periods specified in Securities and Exchange Commission
rules and forms, and that such information is accumulated and
communicated to our management, including our Chief Executive
Officer and Chief Accounting Officer, as appropriate, to allow
timely decisions regarding required disclosure.
Management’s Report on Internal Control Over Financial
Reporting
Management is
responsible for establishing and maintaining adequate internal
control over financial reporting as defined in Rules 13a-15(f) and
15d-15(f) under the Exchange Act. Our internal control over
financial reporting is a process designed to provide reasonable
assurance regarding the reliability of financial reporting and the
preparation of financial statements for external purposes in
accordance with general accepted accounting principles. Because of
its inherent limitations, internal control over financial reporting
may not prevent or detect misstatements. Projections of any
evaluation of effectiveness to future periods are subject to the
risk that controls may become inadequate because of changes in
conditions, or that the degree of compliance with the policies or
procedures may deteriorate.
Our management,
with the participation of our Chief Executive Officer and Chief
Accounting Officer, assessed the effectiveness of our internal
control over financial reporting as of December 31, 2018. In
making this assessment, our management used the criteria set forth
in the Internal Control-Integrated Framework
(2013) issued by the Committee of Sponsoring Organizations of
the Treadway Commission. Based on its assessment, management
concluded that our internal control over financial reporting was
effective as of December 31, 2018.
This report does
not include an attestation report of our independent registered
public accounting firm due to a transition period established by
rules of the Securities and Exchange Commission for “emerging
growth companies.”
Changes in Internal Control over Financial Reporting and
Remediation Efforts
During year ended
December 31, 2018, no changes, other than those in conjunction with
certain remediation efforts described below, were identified to our
internal control over financial reporting that materially affected,
or were reasonably likely to materially affect, our internal
control over financial reporting.
In connection with
its audits of our consolidated financial statements as of, and for
the year ended, December 31, 2017, BDO China Shu Lun Pan Certified
Public Accountants LLP informed us that it had identified a
material weakness in our internal control over financial reporting
relating to our lack of sufficient qualified financial reporting
and accounting personnel with an appropriate level of expertise to
properly address complex accounting issues under GAAP and to
prepare and review our consolidated financial statements and
related disclosures to fulfill GAAP and Securities and Exchange
Commission financial reporting requirements.
98
In the nine months
ended September 30, 2018, we hired additional accounting and
finance personnel and engaged outside consulting firms in order to
improve our internal control over the financial reporting
process.
We will continue to
monitor the effectiveness of our internal control over financial
reporting and will seek to employ any additional tools and
resources deemed necessary to enhance our internal control over
financial reporting.
PART
III
Item
10. Directors, Executive Officers and Corporate
Governance
Information
responsive to this item is incorporated herein by reference to our
definitive proxy statement with respect to our 2019 Annual Meeting
of Stockholders to be filed with the SEC within 120 days after the
end of the fiscal year covered by this report.
Item
11. Executive Compensation
Information
responsive to this item is incorporated herein by reference to our
definitive proxy statement with respect to our 2019 Annual Meeting
of Stockholders to be filed with the SEC within 120 days after the
end of the fiscal year covered by this report.
Item
12. Security Ownership of Certain Beneficial Owners and Management
and Related Stockholder Matters
Information
responsive to this item is incorporated herein by reference to our
definitive proxy statement with respect to our 2019 Annual Meeting
of Stockholders to be filed with the SEC within 120 days after the
end of the fiscal year covered by this report.
Item
13. Certain Relationships and Related Transactions, and Director
Independence
Information
responsive to this item is incorporated herein by reference to our
definitive proxy statement with respect to our 2019 Annual Meeting
of Stockholders to be filed with the SEC within 120 days after the
end of the fiscal year covered by this report.
Item
14. Principal Accounting Fees and Services
Information
responsive to this item is incorporated herein by reference to our
definitive proxy statement with respect to our 2019 Annual Meeting
of Stockholders to be filed with the SEC within 120 days after the
end of the fiscal year covered by this report.
99
PART
IV
Item
15. Exhibits and Financial Statement Schedules
(a)
See “Item 8.
Financial Statements and Supplementary Data – Index to
Consolidated Financial Statements” above and “Exhibit
Index” below.
(b)
Exhibits.
|
Exhibit
No.
|
|
Description
|
|
|
Restated
Certificate of Incorporation of ACM Research, Inc.
|
|
|
|
Restated Bylaws of
ACM Research, Inc.
|
|
|
|
Form of Warrant
dated November 2, 2017 issued to the underwriters of ACM Research,
Inc.'s initial public offering exercisable for an aggregate of
80,000 shares of Class A common stock
|
|
|
|
Senior Secured
Promissory Note dated March 30, 2018 issued by Shengxin (Shanghai)
Management Consulting Limited Partnership to ACM Research
(Shanghai), Inc.
|
|
|
|
Intercompany
Promissory Note dated March 30, 2018 issued by ACM Research
(Shanghai), Inc. to ACM Research, Inc.
|
|
|
|
Lease dated March
22, 2017 between ACM Research, Inc. and D&J Construction,
Inc.
|
|
|
|
Lease Amendment
dated February 28, 2018 between ACM Research, Inc. and D&J
Construction, Inc.
|
|
|
|
Lease Amendment
dated February 4, 2019 between ACM Research, Inc. and D&J
Construction, Inc.
|
|
|
|
Lease Agreement
dated April 26, 2018 between ACM Research (Shanghai), Inc. and
Shanghai Zhangjiang Group Co., Ltd.
|
|
|
|
Lease Agreement
dated January 18, 2018 between ACM Research (Shanghai), Inc. and
Shanghai Shengyu Culture Development Co., Ltd.
|
|
|
|
Securities Purchase
Agreement dated March 14, 2017 by and among ACM Research,
Inc., Shengxin (Shanghai) Management Consulting Limited Partnership
and ACM Research (Shanghai), Inc.
|
|
|
|
Securities Purchase
Agreement dated March 23, 2017 between ACM Research, Inc. and
Shanghai Science and Technology Venture Capital Co., Ltd., as
amended
|
|
|
|
Securities Purchase
Agreement dated August 31, 2017 by and among ACM Research, Inc.,
Shanghai Pudong High-Tech Investment Co., Ltd. and Pudong Science
and Technology (Cayman) Co., Ltd.
|
|
|
|
Securities Purchase
Agreement dated August 31, 2017 by and among ACM Research, Inc.,
Shanghai Zhangjiang Science & Technology Venture Capital Co.,
Ltd. and Zhangjiang AJ Company Limited
|
|
|
|
Ordinary Share
Purchase Agreement dated September 6, 2017 by and among
ACM Research, Inc., Ninebell Co., Ltd. and Moon-Soo
Choi
|
|
|
|
Class A Common
Stock Purchase Agreement dated September 6, 2017 by and among
ACM Research, Inc., Ninebell Co., Ltd. and Moon-Soo
Choi
|
|
|
|
Form of Second
Amended and Restated Registration Rights Agreement to be entered
into between ACM Research, Inc. and certain of its
stockholders
|
|
|
|
Stock Purchase
Agreement, dated October 11, 2017, by and among ACM Research, Inc.,
Xunxin (Shanghai) Capital Co., Limited, Xinxin (Hongkong) Capital
Co., Limited and David H. Wang
|
|
|
|
Stock Purchase
Agreement, dated October 16, 2017, by and between ACM Research,
Inc. and Victorious Way Limited
|
|
|
|
Nomination and
Voting Agreement, dated October 11, 2017, by and among Xinxin
(Hongkong) Capital Co., Limited, ACM Research, Inc., David H. Wang,
and the individuals named therein
|
|
|
|
Voting Agreement,
dated March 23, 2017, by and among Shanghai Technology Venture
Capital Co., Ltd. (also known as Shanghai Science and Technology
Venture Capital Co., Ltd.) and ACM Research, Inc.
|
|
|
|
2016 Omnibus
Incentive Plan of ACM Research, Inc.
|
100
|
Exhibit
No.
|
|
Description
|
|
|
Form of Incentive
Stock Option Grant Notice and Agreement under 2016 Omnibus
Incentive Plan
|
|
|
|
Form of
Non-qualified Stock Option Grant Notice and Agreement under 2016
Omnibus Incentive Plan
|
|
|
|
Form of Restricted
Stock Unit Grant Notice and Agreement under 2016 Omnibus Incentive
Plan
|
|
|
|
Form of
Nonstatutory Stock Option Agreement of ACM Research,
Inc.
|
|
|
|
1998 Stock Option
Plan of ACM Research, Inc.
|
|
|
|
Form of Incentive
Stock Option Agreement under 1998 Stock Option Plan
|
|
|
|
Form of
Non-statutory Stock Option Agreement under 1998 Stock Option
Plan
|
|
|
|
Form of
Indemnification Agreement entered into between ACM Research, Inc.
and certain of its directors and officers
|
|
|
|
Executive Retention
Agreement dated November 14, 2016 between ACM Research, Inc.
and Min Xu
|
|
|
|
Advisory Board
Agreement dated May 1, 2016 by and between ACM Research, Inc. and
Chenming Hu
|
|
|
|
Line of Credit
Agreement dated January 19, 2018 between ACM Research (Shanghai),
Inc. and Shanghai Rural Commercial Bank
|
|
|
|
Line of Credit
Agreement dated February 2, 2018 between ACM Research (Shanghai),
Inc. and Bank of Shanghai Pudong Branch
|
|
|
|
Line of Credit
Agreement dated August 24, 2018 between ACM Research (Shanghai),
Inc. and Bank of China Shanghai Pudong Branch
|
|
|
|
Warrant Exercise
Agreement dated March 30, 2018 by and among ACM Research, Inc., ACM
Research (Shanghai), Inc., and Shengxin (Shanghai) Management
Consulting Limited Partnership
|
|
|
|
List of
Subsidiaries of ACM Research, Inc.
|
|
|
|
Consent of BDO
China Shu Lan Pan Certified Public Accountants LLP
|
|
|
|
Certification of
Principal Executive Officer Pursuant to Rules 13a-14(a) and
15d-14(a) under the Securities Exchange Act of 1934, as Adopted
Pursuant to Section 302 of the Sarbanes-Oxley Act of
2002
|
|
|
|
Certification of
Principal Financial Officer Pursuant to Rules 13a-14(a) and
15d-14(a) under the Securities Exchange Act of 1934, as Adopted
Pursuant to Section 302 of the Sarbanes-Oxley Act of
2002
|
|
|
|
Certification of
Principal Executive Officer and Principal Financial Officer
Pursuant to 18 U.S.C. Section 1350, as Adopted Pursuant to Section
906 of the Sarbanes-Oxley Act of 2002
|
|
|
101.INS
|
|
XBRL Instance
Document
|
|
101.SCH
|
|
XBRL Taxonomy
Extension Schema Document
|
|
101.CAL
|
|
XBRL Taxonomy
Extension Calculation Linkbase Document
|
|
101.DEF
|
|
XBRL Taxonomy
Extension Definition Linkbase Document
|
|
101.LAB
|
|
XBRL Taxonomy
Extension Label Linkbase Document
|
|
101.PRE
|
|
XBRL Taxonomy
Extension Presentation Linkbase Document
|
____________________
+
Indicates
management contract or compensatory plan.
101
SIGNATURES
Pursuant to the
requirements of Section 13 or 15(d) of the Securities Act of 1934,
the registrant has duly caused this report to be signed on its
behalf by the undersigned, thereunto duly authorized, as of
May 24, 2019.
|
|
ACM
RESEARCH, INC.
|
|
|
|
|
|
|
|
|
|
By:
|
/s/ David H.
Wang
|
|
|
|
|
David H.
Wang
|
|
|
|
|
Chief Executive
Officer and President
|
|
Pursuant to the
requirements of the Securities Act of 1934, this report has been
signed below by the following persons in the capacities indicated
on May 24, 2019:
|
Signature
|
|
Title
|
|
|
|
|
|
/s/ David H.
Wang
|
|
|
|
David H.
Wang
|
|
Chief Executive
Officer, President and Director
(Principal Executive
Officer)
|
|
|
|
|
|
/s/ Lisa
Feng
|
|
|
|
Lisa
Feng
|
|
Interim Chief
Financial Officer, Chief Accounting Officer and
Treasurer
(Principal Accounting
Officer)
|
|
|
|
|
|
/s/ Haiping
Dun
|
|
|
|
Haiping
Dun
|
|
Director
|
|
|
|
|
|
/s/ Chenming
Hu
|
|
|
|
Chenming
Hu
|
|
Director
|
|
|
|
|
|
/s/ Tracy
Liu
|
|
|
|
Tracy
Liu
|
|
Director
|
|
|
|
|
|
|
|
|
|
Yinan
Xiang
|
|
Director
|
|
|
|
|
|
|
|
|
|
Zhengfan
Yang
|
|
Director
|
|
|
|
|
102