Document
| | |
| Cautionary Statement Regarding Forward-Looking Statements |
|
This presentation may contain forward-looking statements within the meaning of the federal securities laws. Forward-looking statements relate to expectations, beliefs, projections, future plans and strategies, anticipated events or trends and similar expressions concerning matters that are not historical facts. In some cases, you can identify forward-looking statements by the use of forward-looking terminology such as “may,” “will,” “should,” “expects,” “intends,” “plans,” “anticipates,” “believes,” “estimates,” “predicts,” or “potential” or the negative of these words and phrases or similar words or phrases which are predictions of or indicate future events or trends and which do not relate solely to historical matters. You can also identify forward-looking statements by discussions of strategy, plans or intentions.
Forward-looking statements involve known and unknown risks, uncertainties, assumptions and contingencies, many of which are beyond the Company’s control, and may cause the Company’s actual results to differ significantly from those expressed in any forward-looking statement. Factors that might cause such a difference include, without limitation, the duration and severity of the current novel coronavirus (COVID-19) pandemic, the impact of the COVID-19 pandemic on the global market, economic and environmental conditions generally and in the digital and communications technology and investment management sectors; the effect of COVID-19 on the Company's operating cash flows, debt service obligations and covenants, liquidity position and valuations of its real estate investments, as well as the increased risk of claims, litigation and regulatory proceedings and uncertainty that may adversely affect the Company; our status as an owner, operator and investment manager of digital infrastructure and real estate and our ability to manage any related conflicts of interest; our ability to obtain and maintain financing arrangements, including securitizations, on favorable or comparable terms or at all; the impact of initiatives related to our digital transformation, including the strategic investment by Wafra and the formation of certain other investment management platforms, on our growth and earnings profile and our REIT status; whether we will realize any of the anticipated benefits of our strategic partnership with Wafra, including whether Wafra will make additional investments in our Digital IM and Digital Operating segments; our ability to integrate and maintain consistent standards and controls, including our ability to manage our acquisitions in the digital industry effectively; the impact to our business operations and financial condition of realized or anticipated compensation and administrative savings through cost reduction programs; whether the sale of our Wellness Infrastructure business currently under contract will close on time or at all; whether we will be able to effectively deploy the capital we have committed to capital expenditures and greenfield investments; our ability to redeploy the proceeds received from the sale of our non-digital legacy assets within the timeframe and manner contemplated or at all; our business and investment strategy, including the ability of the businesses in which we have a significant investment (such as Brightspire Capital, Inc. (NYSE: BRSP)) to execute their business strategies; the trading price of BRSP shares and its impact on the carrying value of the Company's investment in BRSP, including whether the Company will recognize further other-than-temporary impairment on its investment in BRSP; performance of our investments relative to our expectations and the impact on our actual return on invested equity, as well as the cash provided by these investments and available for distribution; our ability to grow our business by raising capital for the companies that we manage; our ability to deploy capital into new investments consistent with our digital business strategies, including the earnings profile of such new investments; the availability of, and competition for, attractive investment opportunities; our ability to achieve any of the anticipated benefits of certain joint ventures, including any ability for such ventures to create and/or distribute new investment products; our ability to satisfy and manage our capital requirements; our expected hold period for our assets and the impact of any changes in our expectations on the carrying value of such assets; the general volatility of the securities markets in which we participate; changes in interest rates and the market value of our assets; interest rate mismatches between our assets and any borrowings used to fund such assets; effects of hedging instruments on our assets; the impact of economic conditions on third parties on which we rely; any litigation and contractual claims against us and our affiliates, including potential settlement and litigation of such claims; our levels of leverage; adverse domestic or international economic conditions, including those resulting from the COVID-19 pandemic the impact of legislative, regulatory and competitive changes; whether we will elect to maintain our qualification as a real estate investment trust for U.S. federal income tax purposes and our ability to do so; our ability to maintain our exemption from registration as an investment company under the Investment Company Act of 1940, as amended; changes in our board of directors or management team, and availability of qualified personnel; our ability to make or maintain distributions to our stockholders; our understanding of our competition; and other risks and uncertainties, including those detailed in the Company’s Annual Report on Form 10-K for the fiscal year ended December 31, 2020 and Quarterly Report on Form 10-Q for the quarters ended March 31, 2021, June 30,2021, and September 30, 2021, each under the heading “Risk Factors,” as such factors may be updated from time to time in the Company’s subsequent periodic filings with the U.S. Securities and Exchange Commission (“SEC”). All forward-looking statements reflect the Company’s good faith beliefs, assumptions and expectations, but they are not guarantees of future performance. Additional information about these and other factors can be found in the Company’s reports filed from time to time with the SEC.
The Company cautions investors not to unduly rely on any forward-looking statements. The forward-looking statements speak only as of the date of this presentation. The Company is under no duty to update any of these forward-looking statements after the date of this presentation, nor to conform prior statements to actual results or revised expectations, and the Company does not intend to do so. The Wellness infrastructure sale is anticipated to close by end of February 2022 and is subject to customary closing conditions. We can provide no assurance that it will close on the timing anticipated or at all.
This presentation is for informational purposes only and does not constitute an offer to sell or a solicitation of an offer to buy any securities of the Company. This information is not intended to be indicative of future results. Actual performance of the Company may vary materially.
The appendices herein contain important information that is material to an understanding of this presentation and you should read this presentation only with and in context of the
appendices.
| | | | | | | | |
DigitalBridge | Supplemental Financial Report | | |
| | |
| Important Note Regarding Non-GAAP Financial Measures |
|
This supplemental package includes certain “non-GAAP” supplemental measures that are not defined by generally accepted accounting principles, or GAAP, including the financial metrics defined below, of which the calculations may differ from methodologies utilized by other REITs for similar performance measurements, and accordingly, may not be comparable to those of other REITs.
Adjusted Earnings before Interest, Taxes, Depreciation and Amortization (Adjusted EBITDA): The Company calculates Adjusted EBITDA by adjusting Core FFO to exclude cash interest expense, preferred dividends, tax expense or benefit, earnings from equity method investments, placement fees, realized carried interest and incentive fees and revenues and corresponding costs related to installation services. The Company uses Adjusted EBITDA as a supplemental measure of our performance because they eliminate depreciation, amortization, and the impact of the capital structure from its operating results. However, because Adjusted EBITDA is calculated before recurring cash charges including interest expense and taxes and are not adjusted for capital expenditures or other recurring cash requirements, their utilization as a cash flow measurement is limited.
FFO, Core FFO and AFFO:
The Company calculates funds from operations (FFO) in accordance with standards established by the National Association of Real Estate Investment Trusts, which defines FFO as net income or loss calculated in accordance with GAAP, excluding (i) real estate-related depreciation and amortization; (ii) impairment of depreciable real estate and impairment of investments in unconsolidated ventures directly attributable to decrease in value of depreciable real estate held by the venture; (iii) gain from sale of depreciable real estate; (iv) gain or loss from a change in control in connection with interests in depreciable real estate or in-substance real estate; and (v) adjustments to reflect the Company's share of FFO from investments in unconsolidated ventures. Included in FFO are gains and losses from sales of assets which are not depreciable real estate such as loans receivable, equity investments, and debt securities, as applicable.
The Company computes core funds from operations (Core FFO) by adjusting FFO for the following items, including the Company’s share of these items recognized by its unconsolidated partnerships and joint ventures: (i) equity-based compensation expense; (ii) effects of straight-line rent revenue and expense; (iii) amortization of acquired above- and below-market lease values; (iv) debt prepayment penalties and amortization of deferred financing costs and debt premiums and discounts; (v) non-real estate depreciation, amortization and impairment; (vi) restructuring and transaction-related charges; (vii) non-real estate loss (gain), fair value loss (gain) on interest rate and foreign currency hedges, and foreign currency remeasurements except realized gain and loss from digital assets within the Corporate and Other segment; (viii) net unrealized carried interest; and (ix) tax effect on certain of the foregoing adjustments. The Company’s Core FFO from its interest in BrightSpire Capital, Inc. (NYSE: BRSP) represented the cash dividends declared in the reported period. The Company excluded results from discontinued operations in its calculation of Core FFO and applied this exclusion to prior periods.
The Company computes adjusted funds from operations (AFFO) by adjusting Core FFO for recurring capital expenditures necessary to maintain the operating performance of its properties.
The Company uses FFO, Core FFO and AFFO as supplemental performance measures because, in excluding real estate depreciation and amortization and gains and losses, it provides a performance measure that captures trends in occupancy rates, rental rates, and operating costs, and such a measure is useful to investors as it excludes periodic gains and losses from sales of investments that are not representative of its ongoing operations and assesses the Company's ability to meet distribution requirements. The Company also believes that, as widely recognized measures of the performance of REITs, FFO, Core FFO and AFFO will be used by investors as a basis to compare its operating performance and ability to meet distribution requirements with that of other REITs. However, because FFO, Core FFO and AFFO exclude depreciation and amortization and do not capture changes in the value of the Company’s properties that resulted from use or market conditions, which have real economic effect and could materially impact the Company’s results from operations, the utility of FFO, Core FFO and AFFO as measures of the Company’s performance is limited.
FFO, Core FFO and AFFO should not be considered alternatives to GAAP net income as indications of operating performance, or to cash flows from operating activities as measures of liquidity, nor as indications of the availability of funds for our cash needs, including funds available to make distributions. FFO, Core FFO and AFFO should be considered only as supplements to GAAP net income as measures of the Company’s performance and to cash flows from operating activities computed in accordance with GAAP. Additionally, Core FFO and AFFO exclude the impact of certain fair value fluctuations, which, if they were to be realized, could have a material impact on the Company’s operating performance.
| | | | | | | | |
DigitalBridge | Supplemental Financial Report | | |
| | |
| Important Note Regarding Non-GAAP Financial Measures |
|
Digital Operating Earnings before Interest, Taxes, Depreciation and Amortization for Real Estate (EBITDAre) and Adjusted EBITDA: The Company calculates EBITDAre in accordance with the standards established by the National Association of Real Estate Investment Trusts, which defines EBITDAre as net income or loss calculated in accordance with GAAP, excluding interest, taxes, depreciation and amortization, gains or losses from the sale of depreciated property, and impairment of depreciated property. The Company calculates Adjusted EBITDA by adjusting EBITDAre for the effects of straight-line rental income/expense adjustments and amortization of acquired above- and below-market lease adjustments to rental income, revenues and corresponding costs related to the delivery of installation services, equity-based compensation expense, restructuring and transaction related costs, the impact of other impairment charges, gains or losses from sales of undepreciated land, gains or losses from foreign currency remeasurements, and gains or losses on early extinguishment of debt and hedging instruments. The Company uses EBITDAre and Adjusted EBITDA as supplemental measures of our performance because they eliminate depreciation, amortization, and the impact of the capital structure from its operating results. EBITDAre represents a widely known supplemental measure of performance, EBITDA, but for real estate entities, which we believe is particularly helpful for generalist investors in REITs. EBITDAre depicts the operating performance of a real estate business independent of its capital structure, leverage and non-cash items, which allows for comparability across real estate entities with different capital structure, tax rates and depreciation or amortization policies. Additionally, exclusion of gains on disposition and impairment of depreciated real estate, similar to FFO, also provides a reflection of ongoing operating performance and allows for period-over-period comparability. However, because EBITDAre and Adjusted EBITDA are calculated before recurring cash charges including interest expense and taxes and are not adjusted for capital expenditures or other recurring cash requirements, their utilization as a cash flow measurement is limited.
Digital Investment Management Fee Related Earnings (FRE): The Company calculates FRE for its investment management business within the digital segment as base management fees, other service fee income, and other income inclusive of cost reimbursements, less compensation expense excluding equity-based compensation, carried interest and incentive compensation, administrative expenses (excluding fund raising placement agent fee expenses), and other operating expenses related to the investment management business. The Company uses FRE as a supplemental performance measure as it may provide additional insight into the profitability of the overall digital investment management business.
In evaluating the information presented throughout this financial supplemental report see the appendices to this presentation for definitions and reconciliations of non-GAAP financial measures to GAAP measures. For purposes of comparability, historical data in this presentation may include certain adjustments from prior reported data at the historical period.
| | | | | | | | |
DigitalBridge | Supplemental Financial Report | | |
| | |
| Note Regarding DBRG Reportable Segments / Consolidated and OP Share of Consolidated Amounts |
|
This presentation includes supplemental financial information for the following segments:
Digital Investment Management (Digital IM)
This business encompasses the investment and stewardship of third party capital in digital infrastructure and real estate. The Company's flagship opportunistic strategy is conducted through DBP I, DBP II and separately capitalized vehicles while other strategies, including digital credit and public equities, will be or are conducted through other investment vehicles. The Company earns management fees, generally based on the amount of assets or capital managed in investment vehicles, and has the potential to earn carried interest and incentive fees based on the performance of such investment vehicles subject to achievement of minimum return hurdles.
Digital Operating
This business is composed of balance sheet equity interests in digital infrastructure and real estate operating companies, which generally earns rental income from providing use of space and/or capacity in or on digital assets through leases, services and other agreements. The Company currently owns interests in two companies, DataBank's enterprise data centers, including zColo, and Vantage stabilized hyperscale data centers, which are also portfolio companies under Digital IM for the equity interests owned by third party capital.
Corporate and Other
This segment is composed of the Company's remaining non-core activities and corporate level activities.
Non-core activities are composed of the Company's equity interests in: (i) digital investment vehicles, the largest of which is the Company’s investments and commitments to DBP flagship funds, and seed investments in various strategies such as digital liquid and digital credit; and (ii) remaining non-digital investments, primarily the Company’s interest in BrightSpire Capital, Inc. (BRSP), that are expected to be monetized over an extended period beyond the near term. These non-core activities generate largely equity method earnings or losses and to a lesser extent, revenues in the form of interest income or dividend income from warehoused investments and consolidated investment vehicles. Effective the third quarter of 2021, non-core activities are no longer presented separately as the Digital Other and Other segments, which is consistent with and reflects management's focus on its core digital operations and overall simplification of the Company's business.
Corporate level activities include corporate level cash and corresponding interest income, corporate level financing and related interest expense and preferred dividends, corporate level transaction costs, costs in connection with unconsummated investments, costs incurred as manager of the Company's investment vehicles and income for reimbursement of these costs, fixed assets for administrative use, compensation expense not directly attributable to reportable segments, corporate level administrative and overhead costs, and adjustments to eliminate intercompany fees. Costs which are directly attributable, or otherwise can be subjected to a reasonable and systematic allocation, have been allocated to each of the reportable segments. Elimination adjustment pertains to fee income earned by the Digital Investment Management segment from third party capital in investment vehicles managed by the Company and consolidated within the Digital Operating segment and in Corporate and Other.
Discontinued Operations
Following the successful exit of its hotel business and a substantial majority of the Company's other equity and debt investments and its non-digital investment management business, the Company is now in the final stage of monetizing the remainder of its non-digital businesses to complete its digital transformation. This includes the Company's Wellness Infrastructure business, which resided in the Other segment. The completed and pending dispositions of the Company’s hotel business, other equity and debt investments, other IM business, and Wellness Infrastructure represent strategic shifts in the Company's business that have or are expected to have a significant effect on the Company’s operations and financial results, and accordingly, have met the criteria as discontinued operations. For all current and prior periods presented, the related assets and liabilities, to the extent they have not been disposed at the respective balance sheet dates, are presented as assets and liabilities held for disposition on the consolidated balance sheets and the related operating results are presented as income (loss) from discontinued operations on the consolidated statements of operations.
Throughout this presentation, consolidated figures represent the interest of both the Company (and its subsidiary DigitalBridge Operating Company, LLC or the “DBRG OP”) and noncontrolling interests. Figures labeled as DBRG OP share represent the Company’s pro-rata share.
| | | | | | | | |
DigitalBridge | Supplemental Financial Report | | |
| | | | | | | | | | | |
| | | Page |
| I. | Financial Overview | |
| | | |
| a. | | 6 |
| II. | Financial Results | |
| a. | | 7 |
| b. | | 8 |
| c. | | 9 |
| d. | | 10-11 |
| III. | Capitalization | |
| a. | Debt Summary | 12 |
| b. | Secured Fund Fee Revenue Notes and Variable Funding Notes | 13 |
| c. | Convertible/Exchangeable Notes & Perpetual Preferred Stock | 14 |
| d. | Organization Structure | 15 |
| IV. | Assets Under Management | 16 |
| V. | Digital Investment Management | 17 |
| VI. | Digital Operating | 18-20 |
| VII. | Corporate and Other | 21 |
| | | |
| Appendices | |
| Reconciliations of Digital IM FRE/Adjusted EBITDA and Digital Operating Adjusted EBITDA to Net Income (Loss) | 23 |
| Reconciliations of Core FFO, AFFO and Adjusted EBITDA to Net Income (Loss) | 24-25 |
| Definitions | 26 |
| | | | | | | | | | | |
DigitalBridge | Supplemental Financial Report | | 5 | |
| | |
| Ia. Summary Financial Metrics |
|
| | | | | | | | | | | | | | | | | | | | | | | | | | |
| ($ and shares in thousands, except per share data and as noted) (Unaudited) |
| 12/31/2021 - 4Q21 | 9/30/2021 - 3Q21 | 6/30/2021 - 2Q21 | 3/31/2021 - 1Q21 | 12/31/2020 - 4Q20 | 9/30/2020- 3Q20 | 6/30/2020 - 2Q20 | 3/31/2020 - 1Q20 |
| Financial Data | | | | | | | | |
| Net income (loss) attributable to common stockholders | $ | (20,686) | $ | 41,036 | $ | (141,260) | $ | (264,806) | $ | (140,575) | $ | (205,784) | $ | (2,042,790) | $ | (361,633) |
| Net income (loss) attributable to common stockholders per basic share | (0.04) | 0.08 | (0.29) | (0.56) | (0.30) | (0.44) | (4.33) | (0.76) |
| Core FFO | (4,255) | 2,049 | (4,814) | (9,987) | (25,140) | (30,710) | (29,250) | (31,679) |
| Core FFO per basic share | (0.01) | — | (0.01) | (0.02) | (0.05) | (0.06) | (0.05) | (0.06) |
| AFFO | (5,352) | 700 | (5,578) | (10,213) | (25,373) | (31,010) | (29,470) | (31,954) |
| AFFO per basic share | (0.01) | — | (0.01) | (0.02) | (0.05) | (0.06) | (0.05) | (0.06) |
| Adjusted EBITDA | 20,957 | 17,622 | 15,377 | 12,538 | (2,444) | (5,519) | (5,236) | (14,588) |
| | | | | | | | |
| Balance Sheet, Capitalization and Trading Statistics | | | | | | | | |
| Total consolidated assets | $ | 14,197,816 | $ | 15,442,981 | $ | 15,921,346 | $ | 16,625,250 | $ | 20,200,560 | $ | 19,043,050 | $ | 16,183,534 | $ | 19,160,062 |
| DBRG OP share of consolidated assets | 6,233,158 | 6,086,259 | 6,929,390 | 7,324,784 | 10,119,834 | 10,087,808 | 10,622,322 | 13,149,318 |
Total consolidated debt(1) | 4,922,722 | 4,621,240 | 3,919,255 | 7,023,226 | 7,931,458 | 7,165,859 | 9,612,525 | 9,862,223 |
DBRG OP share of consolidated debt(1) | 1,366,528 | 1,391,943 | 1,073,609 | 3,392,620 | 3,853,642 | 3,683,660 | 7,147,356 | 7,365,939 |
Basic shares and OP units outstanding(2) | 620,553 | 547,162 | 545,815 | 538,908 | 535,217 | 535,473 | 535,201 | 534,113 |
| Liquidation preference of perpetual preferred equity | 883,500 | 947,500 | 1,033,750 | 1,033,750 | 1,033,750 | 1,033,750 | 1,033,750 | 1,033,750 |
| Insider ownership of shares and OP units | 3.5% | 4.0% | 4.0% | 9.4% | 9.4% | 10.0% | 9.9% | 9.6% |
| Digital Assets Under Management ("AUM") (in billions) | $ | 45.3 | $ | 37.8 | $ | 34.9 | $ | 32.0 | $ | 30.0 | $ | 23.3 | $ | 21.6 | $ | 20.6 |
| | | | | | | | |
| Digital Fee Earning Equity Under Management ("FEEUM") (in billions) | $ | 18.3 | $ | 16.5 | $ | 14.5 | $ | 12.9 | $ | 12.8 | $ | 8.6 | $ | 7.7 | $ | 7.7 |
| | | | | | | | |
Notes:
(1) Represents principal balance and excludes debt issuance costs, discounts and premiums.
(2) Includes common shares and OP units outstanding, vested and unvested restricted stock and vested director share units. Based on the performance of the Company's class A common stock price during the three months ended December 31, 2021 and the results of certain Company-specific metrics as of December 31, 2021, excluded are class A common shares that are contingently issuable in relation to performance stock units and unvested shares related to LTIP units of 10.0 million and net settlement for the exercise of warrants held by Wafra of 12.0 million. Also excluded are class A shares issuable in relation to an assumed exchange of the Company's remaining 5.75% senior notes of 60.3 million.
| | | | | | | | | | | |
DigitalBridge | Supplemental Financial Report | | 6 | |
| | |
| IIa. Financial Results - Balance Sheet |
|
| | | | | | | | | | | | | | |
| ($ in thousands, except per share data) (unaudited) | | As of December 31, 2021 |
| | Consolidated | | Non Controlling Interests' Share |
| Assets | | | | |
| Cash and cash equivalents | | $ | 1,602,102 | | | $ | 386,585 | |
| Restricted cash | | 99,121 | | | 78,585 | |
| Real estate, net | | 4,972,284 | | | 4,190,239 | |
| Loans receivable | | 173,921 | | | 3,458 | |
| Equity and debt investments | | 935,153 | | | 278,301 | |
| Goodwill | | 761,368 | | | 456,477 | |
| Deferred leasing costs and intangible assets, net | | 1,187,627 | | | 1,020,358 | |
| Assets held for disposition | | 3,676,615 | | | 1,012,933 | |
| Other assets | | 740,395 | | | 524,837 | |
| Due from affiliates | | 49,230 | | | 12,885 | |
| Total assets | | $ | 14,197,816 | | | $ | 7,964,658 | |
| Liabilities | | | | |
| Debt, net | | $ | 4,860,402 | | | $ | 3,516,134 | |
| Accrued and other liabilities | | 928,042 | | | 598,863 | |
| Intangible liabilities, net | | 33,301 | | | 28,292 | |
| Liabilities related to assets held for disposition | | 3,088,699 | | | 808,973 | |
| | | | |
| Dividends and distributions payable | | 15,759 | | | — | |
| | | | |
| Total liabilities | | 8,926,203 | | | 4,952,262 | |
| Commitments and contingencies | | | | |
| Redeemable noncontrolling interests | | 359,223 | | | 359,223 | |
| Equity | | | | |
| Stockholders’ equity: | | | | |
| Preferred stock, $0.01 par value per share; $883,500 liquidation preference; 250,000 shares authorized; 35,340 shares issued and outstanding | | 854,232 | | | — | |
| Common stock, $0.01 par value per share | | | | |
| Class A, 949,000 shares authorized; 568,577 shares issued and outstanding | | 5,685 | | | — | |
| Class B, 1,000 shares authorized; 666 shares issued and outstanding | | 7 | | | — | |
| Additional paid-in capital | | 7,820,807 | | | — | |
| Accumulated deficit | | (6,576,180) | | | — | |
| Accumulated other comprehensive income | | 42,383 | | | — | |
| Total stockholders’ equity | | 2,146,934 | | | — | |
| Noncontrolling interests in investment entities | | 2,653,173 | | | 2,653,173 | |
| Noncontrolling interests in Operating Company | | 112,283 | | | — | |
| Total equity | | 4,912,390 | | | 2,653,173 | |
| Total liabilities, redeemable noncontrolling interests and equity | | $ | 14,197,816 | | | $ | 7,964,658 | |
| | | | | | | | | | | |
DigitalBridge | Supplemental Financial Report | | 7 | |
| | |
| IIb. Financial Results - Consolidated Segment Operating Results |
|
| | | | | | | | | | | | | | | | | | | | | | | | | | | | | |
| Three Months Ended December 31, 2021 |
| ($ in thousands) (unaudited) | Digital Investment Management | | Digital Operating | | Corporate and Other | | Discontinued Operations | | Total |
| Revenues | | | | | | | | | |
| Property operating income | $ | — | | | $ | 189,909 | | | $ | — | | | $ | — | | | $ | 189,909 | |
| Interest income | 3 | | | 29 | | | 3,500 | | | — | | | 3,532 | |
| Fee income | 57,652 | | | — | | | (1,652) | | | — | | | 56,000 | |
| Other income | 2,238 | | | — | | | 4,178 | | | — | | | 6,416 | |
| Total revenues | 59,893 | | | 189,938 | | | 6,026 | | | — | | | 255,857 | |
| Expenses | | | | | | | | | |
| Property operating expense | — | | | 78,950 | | | — | | | — | | | 78,950 | |
| Interest expense | 2,516 | | | 35,144 | | | 31,676 | | | — | | | 69,336 | |
| Investment expense | 1,953 | | | 5,141 | | | 1,136 | | | — | | | 8,230 | |
| Transaction-related costs | — | | | 12 | | | 3,151 | | | — | | | 3,163 | |
| | | | | | | | | |
| Depreciation and amortization | 5,928 | | | 126,436 | | | 491 | | | — | | | 132,855 | |
| | | | | | | | | |
| Compensation expense | | | | | | | | | |
| Cash and equity-based compensation | 20,802 | | | 20,181 | | | 12,084 | | | — | | | 53,067 | |
| Carried interest and incentive fee compensation | 25,921 | | | — | | | — | | | — | | | 25,921 | |
| Administrative expenses | 4,387 | | | 8,698 | | | 21,171 | | | — | | | 34,256 | |
| Total expenses | 61,507 | | | 274,562 | | | 69,709 | | | — | | | 405,778 | |
| Other income (loss) | | | | | | | | | |
| | | | | | | | | |
| Other gain (loss), net | 52 | | | (1,226) | | | 11,496 | | | — | | | 10,322 | |
| Equity method earnings (loss) | 1,730 | | | — | | | 83,489 | | | — | | | 85,219 | |
| Equity method earnings (loss) - carried interest | 29,878 | | | — | | | — | | | — | | | 29,878 | |
| Income (loss) before income taxes | 30,046 | | | (85,850) | | | 31,302 | | | — | | | (24,502) | |
| Income tax benefit (expense) | (1,852) | | | 1,941 | | | (8,959) | | | — | | | (8,870) | |
| Income (loss) from continuing operations | 28,194 | | | (83,909) | | | 22,343 | | | — | | | (33,372) | |
| Income (loss) from discontinued operations | — | | | — | | | — | | | (9,493) | | | (9,493) | |
| Net income (loss) | 28,194 | | | (83,909) | | | 22,343 | | | (9,493) | | | (42,865) | |
| Net income (loss) attributable to noncontrolling interests: | | | | | | | | | |
| Redeemable noncontrolling interests | 10,585 | | | — | | | 8,349 | | | — | | | 18,934 | |
| Investment entities | 372 | | | (68,480) | | | 2,155 | | | 8,520 | | | (57,433) | |
| Operating Company | 1,555 | | | (1,357) | | | (553) | | | (1,591) | | | (1,946) | |
| Net income (loss) attributable to DigitalBridge Group, Inc. | 15,682 | | | (14,072) | | | 12,392 | | | (16,422) | | | (2,420) | |
| Preferred stock redemption | — | | | — | | | 2,127 | | | — | | | 2,127 | |
| Preferred stock dividends | — | | | — | | | 16,139 | | | — | | | 16,139 | |
| Net income (loss) attributable to common stockholders | $ | 15,682 | | | $ | (14,072) | | | $ | (5,874) | | | $ | (16,422) | | | $ | (20,686) | |
| | | | | | | | | | | |
DigitalBridge | Supplemental Financial Report | | 8 | |
| | |
| IIc. Financial Results - Noncontrolling Interests’ Share Segment Operating Results |
|
| | | | | | | | | | | | | | | | | | | | | | | | | | | | | |
| Three Months Ended December 31, 2021 |
| ($ in thousands) (unaudited) | Digital Investment Management | | Digital Operating | | Corporate and Other | | Discontinued Operations | | Total |
| Revenues | | | | | | | | | |
| Property operating income | $ | — | | | $ | 157,451 | | | $ | — | | | $ | — | | | $ | 157,451 | |
| Interest income | — | | | 23 | | | 16 | | | — | | | 39 | |
| Fee income | 19,256 | | | — | | | — | | | — | | | 19,256 | |
| Other income | 700 | | | — | | | 529 | | | — | | | 1,229 | |
| Total revenues | 19,956 | | | 157,474 | | | 545 | | | — | | | 177,975 | |
| Expenses | | | | | | | | | |
| Property operating expense | — | | | 65,199 | | | — | | | — | | | 65,199 | |
| Interest expense | — | | | 28,608 | | | 74 | | | — | | | 28,682 | |
| Investment expense | 615 | | | 4,405 | | | 6 | | | — | | | 5,026 | |
| | | | | | | | | |
| Depreciation and amortization | 1,864 | | | 105,177 | | | — | | | — | | | 107,041 | |
| | | | | | | | | |
| Compensation expense | | | | | | | | | |
| Cash and equity-based compensation | 4,942 | | | 16,144 | | | — | | | — | | | 21,086 | |
| Carried interest and incentive fee compensation | 8,533 | | | — | | | — | | | — | | | 8,533 | |
| Administrative expenses | 1,076 | | | 6,912 | | | 377 | | | — | | | 8,365 | |
| Total expenses | 17,030 | | | 226,445 | | | 457 | | | — | | | 243,932 | |
| Other income (loss) | | | | | | | | | |
| | | | | | | | | |
| Other gain (loss), net | 2 | | | (988) | | | 8,260 | | | — | | | 7,274 | |
| Equity method earnings (loss) | 643 | | | — | | | 2,156 | | | — | | | 2,799 | |
| Equity method earnings (loss) - carried interest | 13,024 | | | — | | | — | | | — | | | 13,024 | |
| Income (loss) before income taxes | 16,595 | | | (69,959) | | | 10,504 | | | — | | | (42,860) | |
| Income tax benefit (expense) | (43) | | | 1,552 | | | — | | | — | | | 1,509 | |
| Net income (loss) | 16,552 | | | (68,407) | | | 10,504 | | | — | | | (41,351) | |
| Income (loss) from discontinued operations | — | | | — | | | — | | | 8,520 | | | 8,520 | |
| Non-pro rata allocation of income (loss) to NCI | (5,595) | | | (73) | | | — | | | — | | | (5,668) | |
| Net income (loss) attributable to noncontrolling interests | $ | 10,957 | | | $ | (68,480) | | | $ | 10,504 | | | $ | 8,520 | | | $ | (38,499) | |
| | | | | | | | | | | |
DigitalBridge | Supplemental Financial Report | | 9 | |
| | | | | | | | | | | | | | | | | | | | | | | | | | | | | | | | | | | | | | | | | |
| OP pro rata share by segment | | Amounts
attributable to
noncontrolling interests | | DBRG consolidated as reported |
| ($ in thousands; for the three months ended December 31, 2021; and unaudited) | Digital IM | | Digital Operating | | Corporate and Other | | Discontinued Operations | | Total OP pro rata share | | |
| Net income (loss) attributable to common stockholders | $ | 15,682 | | | $ | (14,072) | | | $ | (5,874) | | | $ | (16,422) | | | $ | (20,686) | | | $ | — | | | $ | (20,686) | |
| Net income (loss) attributable to noncontrolling common interests in Operating Company | 1,555 | | | (1,357) | | | (553) | | | (1,591) | | | (1,946) | | | — | | | (1,946) | |
| Net income (loss) attributable to common interests in Operating Company and common stockholders | 17,237 | | | (15,429) | | | (6,427) | | | (18,013) | | | (22,632) | | | — | | | (22,632) | |
| | | | | | | | | | | | | |
| Adjustments for FFO: | | | | | | | | | | | | | |
| Real estate depreciation and amortization | — | | | 20,216 | | | 2,106 | | | 8,225 | | | 30,547 | | | 103,266 | | | 133,813 | |
| Impairment of real estate | — | | | — | | | — | | | (27,193) | | | (27,193) | | | (13,539) | | | (40,732) | |
| Gain from sales of real estate | — | | | — | | | — | | | (197) | | | (197) | | | — | | | (197) | |
| Less: Adjustments attributable to noncontrolling interests in investment entities | — | | | — | | | — | | | — | | | — | | | (89,727) | | | (89,727) | |
| FFO | $ | 17,237 | | | $ | 4,787 | | | $ | (4,321) | | | $ | (37,178) | | | $ | (19,475) | | | $ | — | | | $ | (19,475) | |
| | | | | | | | | | | | | |
| Additional adjustments for Core FFO: | | | | | | | | | | | | | |
| Adjustment to BRSP cash dividend | — | | | — | | | (26,422) | | | (1,821) | | | (28,243) | | | — | | | (28,243) | |
| Equity-based compensation expense | 1,596 | | | 384 | | | 3,837 | | | 11,651 | | | 17,468 | | | 1,948 | | | 19,416 | |
| Straight-line rent revenue and expense | 51 | | | 158 | | | (1,195) | | | (359) | | | (1,345) | | | (641) | | | (1,986) | |
| Amortization of acquired above- and below-market lease values, net | — | | | 60 | | | — | | | (566) | | | (506) | | | 173 | | | (333) | |
| Debt prepayment penalties and amortization of deferred financing costs and debt premiums and discounts | 309 | | | 1,030 | | | 25,652 | | | 4,016 | | | 31,007 | | | 5,678 | | | 36,685 | |
| Non-real estate fixed asset depreciation, amortization and impairment | 40 | | | 1,043 | | | 491 | | | 1,630 | | | 3,204 | | | 10,120 | | | 13,324 | |
Restructuring and transaction-related charges(1) | 2,354 | | | 16 | | | 17,379 | | | 10,069 | | | 29,818 | | | 159 | | | 29,977 | |
| Non-real estate (gains) losses, excluding realized gains or losses of digital assets within the Corporate and Other segment | (1,119) | | | 238 | | | (57,032) | | | 1,091 | | | (56,822) | | | 4,211 | | | (52,611) | |
| Net unrealized carried interest | (2,702) | | | — | | | — | | | — | | | (2,702) | | | (4,673) | | | (7,375) | |
| Preferred share redemption loss | — | | | — | | | 2,127 | | | — | | | 2,127 | | | — | | | 2,127 | |
| Deferred taxes and tax effect on certain of the foregoing adjustments | (259) | | | (389) | | | 10,395 | | | — | | | 9,747 | | | (1,552) | | | 8,195 | |
| Less: Adjustments attributable to noncontrolling interests in investment entities | — | | | — | | | — | | | — | | | — | | | (15,423) | | | (15,423) | |
| Less: Core FFO from discontinued operations | — | | | — | | | — | | | 11,467 | | | 11,467 | | | — | | | 11,467 | |
| Core FFO | $ | 17,507 | | | $ | 7,327 | | | $ | (29,089) | | | $ | — | | | $ | (4,255) | | | $ | — | | | $ | (4,255) | |
| | | | | | | | | | | | | |
| Additional adjustments for AFFO: | | | | | | | | | | | | | |
| Recurring capital expenditures | — | | | (1,097) | | | — | | | — | | | (1,097) | | | — | | | (1,097) | |
| AFFO | $ | 17,507 | | | $ | 6,230 | | | $ | (29,089) | | | $ | — | | | $ | (5,352) | | | $ | — | | | $ | (5,352) | |
Notes:
(1) Restructuring and non-recurring items primarily represent costs and charges incurred as a result of corporate restructuring and reorganization to implement the digital evolution. These costs and charges include severance, retention, relocation, transition, shareholder settlement and other related restructuring costs, which are not reflective of the Company’s core operating performance.
| | | | | | | | | | | |
DigitalBridge | Supplemental Financial Report | | 10 | |
| | | | | | | | | | | | | | | | | | | | | | | | | | | | | | | | |
| OP pro rata share by segment | |
| ($ in thousands; for the three months ended December 31, 2021; and unaudited) | Digital IM | | Digital Operating | | Corporate and Other | | Discontinued Operations | | Total OP pro rata share | |
| Core FFO | $ | 17,507 | | | $ | 7,327 | | | $ | (29,089) | | | $ | — | | | $ | (4,255) | | |
| Less: Earnings of equity method investments | (18) | | | — | | | (6,423) | | | — | | | (6,441) | | |
| Plus: Preferred dividends | — | | | — | | | 16,139 | | | — | | | 16,139 | | |
Plus: Core interest expense(1) | 2,193 | | | 5,506 | | | 6,076 | | | — | | | 13,775 | | |
Plus: Core tax expense(1) | 2,068 | | | — | | | (1,437) | | | — | | | 631 | | |
| Plus: Non pro-rata allocation of income (loss) to NCI | 231 | | | — | | | — | | | — | | | 231 | | |
| Plus: Placement fees | 603 | | | — | | | — | | | — | | | 603 | | |
| Less: Net realized carried interest, incentive fees, and other adjustments to Fee Related Earnings | (1,092) | | | — | | | — | | | — | | | (1,092) | | |
| Plus: Digital Operating installation services, transaction, investment and servicing costs | — | | | 1,366 | | | — | | | — | | | 1,366 | | |
| Adjusted EBITDA (DBRG OP Share) | $ | 21,492 | | | $ | 14,199 | | | $ | (14,734) | | | $ | — | | | $ | 20,957 | | |
Notes:
(1) Excludes components that are included in adjustments for Core FFO.
| | | | | | | | | | | |
DigitalBridge | Supplemental Financial Report | | 11 | |
| | |
| IIIa. Capitalization - Debt Summary |
|
| | | | | | | | | | | | | | | | | | | | | | | | | | | | | | | | | | | | | | | | | | | | |
| ($ in thousands; as of December 31, 2021) | | | | | | | | | | | | | | |
| Consolidated debt | Payments due by period(1) | | | |
| 2022 | | 2023 | | 2024 | | 2025 | | 2026 and after | | Total | | | |
| Investment-level debt: | | | | | | | | | | | | | | |
| Digital Operating - Fixed | $ | 6,230 | | | $ | 219,793 | | | $ | 600,753 | | | $ | 700,000 | | | $ | 2,119,690 | | | $ | 3,646,466 | | | | |
| Digital Operating - Variable | — | | | 9,000 | | | 15,750 | | | 446,267 | | | 100,000 | | | $ | 571,017 | | | | |
| Total Digital Operating | 6,230 | | | 228,793 | | | 616,503 | | | 1,146,267 | | | 2,219,690 | | | 4,217,483 | | | | |
| Corporate and Other debt: | | | | | | | | | | | | | | |
| 2021-1, A-1 Variable Funding Notes | — | | | — | | | — | | | — | | | — | | | — | | | | |
| 2021-1, Class A-2 Term Notes | — | | | — | | | — | | | — | | | 300,000 | | | 300,000 | | | | |
Other (2) | — | | | 66,500 | | | — | | | — | | | — | | | 66,500 | | | | |
| Convertible/exchangeable senior notes | — | | | 200,000 | | | — | | | 138,739 | | | — | | | 338,739 | | | | |
Total consolidated debt (3) | $ | 6,230 | | | $ | 495,293 | | | $ | 616,503 | | | $ | 1,285,006 | | | $ | 2,519,690 | | | $ | 4,922,722 | | | | |
| | | | | | | | | | | | | | |
| | | | | | | | | | | | Fixed/Variable | WA Interest Rate | WA Remaining Term |
| DBRG OP share of debt | Payments due by period(1) |
| 2022 | | 2023 | | 2024 | | 2025 | | 2026 and after | | Total |
| Investment-level debt: | | | | | | | | | | | | | | |
| Digital Operating - Fixed | $ | 818 | | | $ | 28,859 | | | $ | 78,879 | | | $ | 91,910 | | | $ | 346,505 | | | $ | 546,971 | | Fixed | 2.4% | 4.1 |
| Digital Operating - Variable | — | | | 1,802 | | | 3,153 | | | 89,343 | | | 20,020 | | | $ | 114,318 | | Variable | 5.7% | 4.0 |
| Total Digital Operating | 818 | | | 30,661 | | | 82,032 | | | 181,253 | | | 366,525 | | | 661,289 | | | 3.0% | 4.1 |
| Corporate and Other debt: | | | | | | | | | | | | | | |
| 2021-1, A-1 Variable Funding Notes | — | | | — | | | — | | | — | | | — | | | — | | Variable | N/A | 4.7 |
| 2021-1, Class A-2 Term Notes | — | | | — | | | — | | | — | | | 300,000 | | | 300,000 | | Fixed | 3.9% | 4.7 |
Other (2) | — | | | 66,500 | | | — | | | — | | | — | | | 66,500 | | Variable | 1.3% | 1.6 |
| Convertible/exchangeable senior notes | — | | | 200,000 | | | — | | | 138,739 | | | — | | | 338,739 | | Fixed | 5.3% | 2.2 |
Total DBRG share of debt (3) | $ | 818 | | | $ | 297,161 | | | $ | 82,032 | | | $ | 319,992 | | | $ | 666,525 | | | $ | 1,366,528 | | | | |
Notes:
(1) Maturity dates are based on initial maturity dates or extended maturity dates, where applicable, the extension option is at the Company’s discretion and if the criteria to extend have been met as of the reporting date.
(2) In the third quarter of 2021, the Company entered into a credit facility to fund the acquisition of loans that are warehoused for a future securitization vehicle. At December 31, 2021, $83.5 million was available to be drawn from this facility.
(3) Excluded from above presentation is debt of assets which are presented under discontinued operations.
| | | | | | | | | | | |
DigitalBridge | Supplemental Financial Report | | 12 | |
| | |
| IIIb. Capitalization - DBRG Series 2021-1 |
|
| | | | | | | | |
| ($ in thousands, as of December 31, 2021) | | |
| Class A-2 Term Notes | | |
| Amount outstanding | | $ | 300,000 | |
| Interest rate | | 3.933 | % |
| Anticipated Repayment Date (ARD) | | September 25, 2026 |
| Kroll Rating | | BBB |
| | |
| Class A-1 Variable Funding Notes | | |
| Maximum Available | | $ | 200,000 | |
| Amount outstanding | | $ | — | |
| Interest Rate | | 3M LIBOR + 3.00% |
Fully extended Anticipated Repayment Date (ARD)(1) | | September 25, 2026 |
| | |
| Financial covenants: | | Covenant level |
Debt Service Coverage Ratio(2) | | Minimum 1.75x |
Loan to Value Ratio(3) | | Less than 35.0% |
Investment Management Expense Ratio(4) | | Less than 60.0% |
| Company status: As of February 23, 2022, DBRG is meeting all required covenant threshold levels. |
Notes:
(1) Anticipated Repayment Date is September 25, 2026 including two 1-year extension options subject to 1) either rating agency confirmation and consent of VFN noteholders are obtained or DSCR exceeding 1.75x, 2) term notes rating not less than BBB- 3) the payment of a 0.05% extension fee and 4) other customary conditions.
(2) Debt service coverage ratio covenant thresholds: minimum of 1.75x for ability to borrow from the VFN; below 1.75x to 1.50x = 50% cash trap; below 1.50x to 1.20x = 100% cash trap; and below 1.20x = cash sweep.
(3) 100% cash sweep until LTV is less than 35%.
(4) 50% cash sweep until ratio is less than 60%.
| | | | | | | | | | | |
DigitalBridge | Supplemental Financial Report | | 13 | |
| | |
| IIIc. Capitalization - Convertible/Exchangeable Notes & Perpetual Preferred Stock |
|
| | | | | | | | | | | | | | | | | | | | | | | | | | | | | | | | | | | | | | |
| ($ in thousands; except per share data; as of December 31, 2021) |
| Convertible/exchangeable debt | | | | | | | | | | | | |
| Description | | Outstanding principal | | Final due date(1) | | Interest rate | | Conversion price (per share of common stock) | | Conversion ratio | | Conversion shares |
| 5.75% Exchangeable senior notes | | $ | 138,739 | | | July 15, 2025 | | 5.75% fixed | | $ | 2.30 | | | 434.7826 | | | 60,321 | |
| 5.0% Convertible senior notes | | 200,000 | | | April 15, 2023 | | 5.00% fixed | | 15.76 | | | 63.4700 | | | 12,694 | |
| Total convertible debt | | $ | 338,739 | | | | | | | | | | | |
| | | | | | | | | | | | | | | | | | | | |
| Perpetual preferred stock | | | | | | |
| Description | | Liquidation
preference | | Shares outstanding (In thousands) | | Callable period |
| Series H 7.125% cumulative redeemable perpetual preferred stock | | 223,500 | | | 8,940 | | | Callable |
| Series I 7.15% cumulative redeemable perpetual preferred stock | | 345,000 | | | 13,800 | | | On or after June 5, 2022 |
| Series J 7.125% cumulative redeemable perpetual preferred stock | | 315,000 | | | 12,600 | | | On or after September 22, 2022 |
| Total preferred stock | | $ | 883,500 | | | 35,340 | | | |
Notes:
(1) Callable at principal amount only if DBRG common stock has traded at least 130% of the conversion price for 20 of 30 consecutive trading days: on or after July 21, 2023, for the 5.75% exchangeable senior notes and on or after April 22, 2020, for the 5.0% convertible senior notes.
| | | | | | | | | | | |
DigitalBridge | Supplemental Financial Report | | 14 | |
| | |
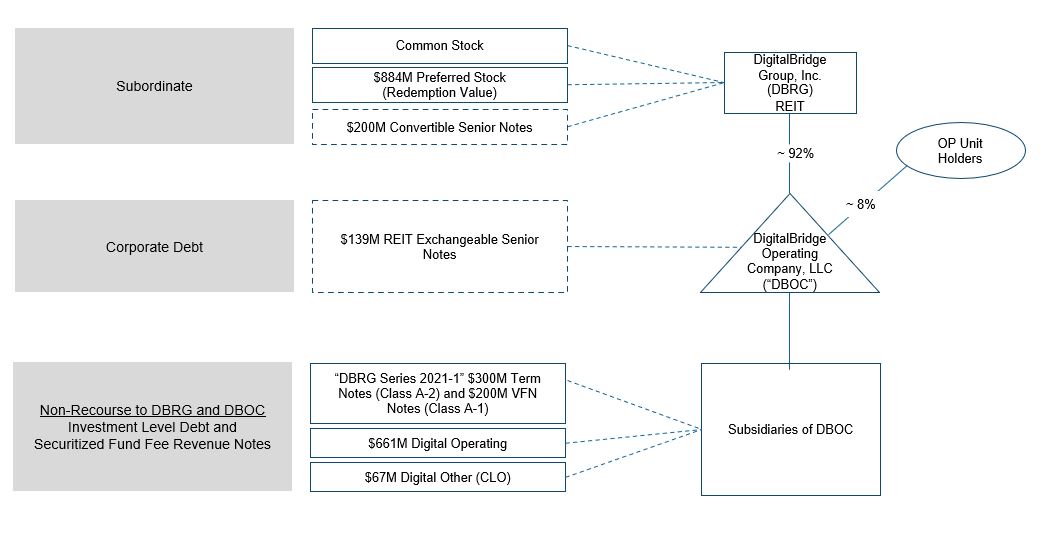
| IIId. Capitalization - Organization Structure |
|
| | | | | | | | | | | |
DigitalBridge | Supplemental Financial Report | | 15 | |
| | |
| IV. Assets Under Management |
|
| | | | | | | | | | | | | | | | | | | | | | | | | | | | | |
| ($ in millions) | | DBRG OP Share |
| Segment | | 12/31/21 | 9/30/21 | 6/30/21 | 3/31/21 | 12/31/20 | 9/30/20 | 6/30/20 | 3/31/20 |
| | | | | | | | | |
| Digital Investment Management | | $ | 43,619 | | $ | 36,337 | | $ | 33,551 | | $ | 30,711 | | $ | 28,577 | | $ | 22,237 | | $ | 21,015 | | $ | 20,107 | |
| Digital Operating | | 1,233 | | 1,157 | | 1,093 | | 1,073 | | 1,087 | | 724 | | 300 | | 290 | |
| | | | | | | | | |
Corporate and Other Assets(1) | | 6,427 | | 11,880 | | 13,790 | | 14,397 | | 22,300 | | 23,853 | | 24,392 | | 27,715 | |
| | | | | | | | | |
| Total AUM | | $ | 51,279 | | $ | 49,374 | | $ | 48,434 | | $ | 46,181 | | $ | 51,964 | | $ | 46,814 | | $ | 45,707 | | $ | 48,112 | |
| | | | | | | | | |
Notes:
(1) December 31, 2021 includes $5.4 billion of assets held for disposition on the consolidated balance sheet with related operating results presented as income (loss) from discontinued operations on the consolidated statement of operations of the Company.
| | | | | | | | | | | |
DigitalBridge | Supplemental Financial Report | | 16 | |
| | |
| V. Digital Investment Management |
|
| | | | | | | | | | | | | | | | | | | | | | | | | | | | | | |
| ($ in millions) | | | | | | | | | | |
| AUM DBRG OP Share | | | 12/31/21 | 9/30/21 | 6/30/21 | 3/31/21 | 12/31/20 | 9/30/20 | 6/30/20 | 3/31/20 |
| DigitalBridge Partners I | | | $ | 6,180 | | $ | 6,180 | | $ | 6,003 | | $ | 5,931 | | $ | 6,089 | | $ | 5,686 | | $ | 5,665 | | $ | 5,526 | |
| DigitalBridge Partners II | | | 10,430 | | 8,005 | | 6,431 | | 4,775 | | 3,241 | | — | | — | | — | |
| Separately Capitalized Portfolio Companies | | | 6,882 | | 10,147 | | 10,254 | | 9,893 | | 8,947 | | 8,273 | | 9,556 | | 8,990 | |
| Co-Investment (Sidecar) Capital | | | 19,311 | | 11,417 | | 10,273 | | 9,591 | | 9,857 | | 8,181 | | 5,692 | | 5,477 | |
| Liquid Strategies | | | 816 | | 588 | | 590 | | 521 | | 443 | | 97 | | 102 | | 114 | |
| Digital IM AUM | | | $ | 43,619 | | $ | 36,337 | | $ | 33,551 | | $ | 30,711 | | $ | 28,577 | | $ | 22,237 | | $ | 21,015 | | $ | 20,107 | |
| | | | | | | | | | |
| FEEUM DBRG OP Share | | | 12/31/21 | 9/30/21 | 6/30/21 | 3/31/21 | 12/31/20 | 9/30/20 | 6/30/20 | 3/31/20 |
| DigitalBridge Partners I | | | $ | 3,215 | | $ | 3,040 | | $ | 3,081 | | $ | 3,179 | | $ | 3,756 | | $ | 3,756 | | $ | 3,756 | | $ | 3,756 | |
| DigitalBridge Partners II | | | 8,001 | | 7,146 | | 5,519 | | 3,964 | | 3,217 | | — | | — | | — | |
| Separately Capitalized Portfolio Companies | | | 2,148 | | 2,576 | | 2,576 | | 2,534 | | 2,777 | | 2,603 | | 3,019 | | 3,017 | |
| Co-Investment (Sidecar) Capital | | | 4,105 | | 3,184 | | 2,817 | | 2,744 | | 2,655 | | 2,042 | | 841 | | 841 | |
| Liquid Strategies | | | 786 | | 510 | | 512 | | 432 | | 437 | | 153 | | 127 | | 128 | |
| Digital IM FEEUM (12/31/21 Annual IM Fee Rate = 0.96%) | | | $ | 18,255 | | $ | 16,456 | | $ | 14,505 | | $ | 12,853 | | $ | 12,842 | | $ | 8,554 | | $ | 7,743 | | $ | 7,742 | |
| | | | | | | | | | |
| ($ in thousands) | | | | | | | | | | |
| Digital IM FRE / Adjusted EBITDA | | | 4Q21 | 3Q21 | 2Q21 | 1Q21 | 4Q20 | 3Q20 | 2Q20 | 1Q20 |
| Fee income | | | $ | 43,145 | | $ | 37,751 | | $ | 33,304 | | $ | 28,917 | | $ | 24,191 | | $ | 19,172 | | $ | 18,987 | | $ | 18,068 | |
Fee income, other (1) | | | 8,787 | | 12,809 | | 8,996 | | 2,148 | | 862 | | 876 | | 1,306 | | 876 | |
| Other income | | | 273 | | 483 | | 84 | | 54 | | 183 | | 87 | | 552 | | 197 | |
| Compensation expense—cash | | | (16,275) | | (16,933) | | (14,426) | | (10,852) | | (18,353) | | (9,414) | | (9,208) | | (6,964) | |
| Administrative expenses | | | (3,446) | | (2,675) | | (2,337) | | (2,067) | | (2,310) | | (1,832) | | (2,330) | | (2,127) | |
Digital IM FRE / Adjusted EBITDA (2) | | | $ | 32,484 | | $ | 31,435 | | $ | 25,621 | | $ | 18,200 | | $ | 4,573 | | $ | 8,889 | | $ | 9,307 | | $ | 10,050 | |
| | | | | | | | | | |
DBRG OP share of Digital IM FRE / Adjusted EBITDA(3) | | | $ | 21,492 | | $ | 20,736 | | $ | 17,449 | | $ | 11,645 | | $ | 2,051 | | $ | 6,306 | | $ | 9,307 | | $ | 10,050 | |
Notes:
(1) Includes service fee income and one time catch-up fees earned, which are customary fees paid on newly raised 3rd party capital as if it were raised on the first closing date.
(2) For reconciliations of net income / (loss) to FRE / Adjusted EBITDA, please refer to the Appendices section of this presentation.
(3) In July 2020, the Company closed on a strategic investment from Wafra for a 31.5% ownership stake in the Digital Investment Management business. Represents the Company interest after deducting Wafra's 31.5% interest.
| | | | | | | | | | | |
DigitalBridge | Supplemental Financial Report | | 17 | |
| | | | | | | | | | | | | | | | | | | | | | | | | | | | | |
| ($ in millions, unless otherwise noted) | | | | | | | | | |
| Portfolio Overview | | 12/31/21 | 9/30/21 | 6/30/21 | 3/31/21 | 12/31/20 | 9/30/20 | 6/30/20 | 3/31/20 |
| Consolidated amount | | | | | | | | | |
Asset(1) | | $ | 7,624 | | $ | 7,211 | | $ | 6,736 | | $ | 6,633 | | $ | 6,248 | | $ | 4,925 | | $ | 1,496 | | $ | 1,448 | |
Debt(2)(3) | | (4,217) | | (3,817) | | (3,374) | | (3,369) | | (3,227) | | (2,546) | | (515) | | (516) | |
| Net Carrying Value - Consolidated | | $ | 3,407 | | $ | 3,394 | | $ | 3,362 | | $ | 3,264 | | $ | 3,021 | | $ | 2,379 | | $ | 981 | | $ | 932 | |
| | | | | | | | | |
| DBRG OP share of consolidated amount | | | | | | | | | |
Asset(1) | | $ | 1,233 | | $ | 1,157 | | $ | 1,093 | | $ | 1,073 | | $ | 1,087 | | $ | 724 | | $ | 300 | | $ | 290 | |
Debt(2)(3) | | (661) | | (588) | | (529) | | (528) | | (536) | | (355) | | (103) | | (103) | |
| Net Carrying Value - DBRG OP share | | $ | 572 | | $ | 569 | | $ | 564 | | $ | 545 | | $ | 551 | | $ | 369 | | $ | 197 | | $ | 187 | |
| | | | | | | | | |
| DBRG net carrying value % interest | | 17 | % | 17 | % | 17 | % | 17 | % | 18 | % | 16 | % | 20 | % | 20 | % |
| | | | | | | | | |
| ($ in millions, unless otherwise noted) | | | | | | | | | |
Operating Metrics (4) | | 12/31/2021 - 4Q21 | 9/30/2021 - 3Q21 | 6/30/2021 - 2Q21 | 3/31/2021 - 1Q21 | 12/31/2020 - 4Q20 | 9/30/2020- 3Q20 | 6/30/2020 - 2Q20 | 3/31/2020 - 1Q20 |
| Number of Data Centers | | 78 | 76 | 76 | 76 | 32 | 32 | 20 | 19 |
| Max Critical I.T. Square Feet | | 1,949,144 | 1,819,946 | 1,809,943 | 1,791,781 | 1,138,048 | 1,137,866 | 456,649 | 410,974 |
| Leased Square Feet | | 1,552,517 | 1,467,420 | 1,439,291 | 1,423,322 | 967,879 | 945,640 | 316,697 | 301,791 |
| % Utilization Rate | | 79.7% | 80.6% | 79.5% | 79.4% | 85.0% | 83.1% | 69.4% | 73.4% |
| MRR (Annualized) | | $ | 790.4 | $ | 773.1 | $ | 750.2 | $ | 743.0 | $ | 442.0 | $ | 374.0 | $ | 171.4 | $ | 171.2 |
| Bookings (Annualized) | | $ | 15.3 | $ | 16.6 | $ | 16.4 | $ | 23.0 | $ | 6.0 | $ | 9.4 | $ | 6.6 | $ | 7.4 |
| Quarterly Churn (% of Prior Quarter MRR) | | 1.9% | 1.3% | 1.3% | 1.3% | .8% | .8% | 1.7% | 2.7% |
Notes:
(1) Includes all components related to real estate assets, including tangible real estate and lease-related intangibles and cash.
(2) Represents unpaid principal balance.
(3) For the fourth quarter 2021, in addition to debt presented, the Digital Operating segment has $143 million consolidated, or $28 million DBRG OP share, of finance lease obligations, which represents the present value of payments on leases classified as finance leases, in the Other Liabilities line item on the Company’s Balance Sheet.
(4) Operating metrics presented include assets owned entirely during the presented period. Data of assets acquired within a quarter are included in the following quarter.
| | | | | | | | | | | |
DigitalBridge | Supplemental Financial Report | | 18 | |
| | | | | | | | | | | | | | | | | | | | | | | | | | | | | |
| ($ in thousands) | | | | | | | | | |
| Digital Operating Adjusted EBITDA | | 4Q21 | 3Q21 | 2Q21 | 1Q21 | 4Q20 | 3Q20 | 2Q20 | 1Q20 |
| Consolidated amount | | | | | | | | | |
| Total revenues | | $ | 189,938 | | $ | 194,966 | | $ | 189,093 | | $ | 189,202 | | $ | 127,546 | | $ | 98,549 | | $ | 42,021 | | $ | 45,167 | |
| Property operating expenses | | (78,950) | | (80,226) | | (77,140) | | (79,862) | | (47,224) | | (37,544) | | (18,055) | | (16,906) | |
| Compensation and administrative expenses | | (28,879) | | (29,766) | | (28,488) | | (25,947) | | (16,982) | | (11,863) | | (10,464) | | (12,656) | |
| Investment, servicing and commission expenses | | (5,153) | | (4,862) | | (5,255) | | (6,565) | | (3,329) | | (2,362) | | (696) | | (317) | |
| Other gain/loss, net | | (1,226) | | 285 | | (349) | | (3) | | (200) | | (45) | | — | | — | |
| EBITDAre: | | $ | 75,730 | | $ | 80,397 | | $ | 77,861 | | $ | 76,825 | | $ | 59,811 | | $ | 46,735 | | $ | 12,806 | | $ | 15,288 | |
| Straight-line rent expenses and amortization of above- and below-market lease intangibles | | 370 | | 482 | | (98) | | (399) | | (2,607) | | (2,106) | | 1,837 | | (338) | |
| Compensation expense—equity-based | | 1,918 | | 308 | | 308 | | 308 | | 728 | | 148 | | 296 | | — | |
| Installation services | | 2,097 | | (4,058) | | 576 | | 880 | | 429 | | (65) | | 493 | | 289 | |
| Transaction, restructuring & integration costs | | 3,188 | | 4,042 | | 2,999 | | 4,670 | | 1,155 | | 420 | | 1,021 | | 748 | |
| Other gain/loss, net | | 1,226 | | (285) | | 349 | | — | | 200 | | 46 | | — | | — | |
Digital Operating Adjusted EBITDA - Consolidated (1) | | $ | 84,529 | | $ | 80,886 | | $ | 81,995 | | $ | 82,284 | | $ | 59,716 | | $ | 45,178 | | $ | 16,453 | | $ | 15,987 | |
| | | | | | | | | |
| DBRG OP share of consolidated amount | | | | | | | | | |
| Total revenues | | $ | 32,464 | | $ | 33,771 | | $ | 32,624 | | $ | 32,741 | | $ | 21,013 | | $ | 15,600 | | $ | 8,413 | | $ | 9,042 | |
| Property operating expenses | | (13,740) | | (14,115) | | (13,690) | | (14,165) | | (7,911) | | (6,026) | | (3,615) | | (3,385) | |
| Compensation and administrative expenses | | (5,457) | | (5,615) | | (5,350) | | (4,888) | | (3,276) | | (2,310) | | (2,095) | | (2,534) | |
| Investment, servicing and commission expenses | | (732) | | (709) | | (819) | | (1,090) | | (433) | | (290) | | (139) | | (63) | |
| Other gain/loss, net | | (238) | | 61 | | (69) | | | (26) | | (6) | | — | | — | |
| EBITDAre: | | $ | 12,297 | | $ | 13,393 | | $ | 12,696 | | $ | 12,598 | | $ | 9,367 | | $ | 6,968 | | $ | 2,564 | | $ | 3,060 | |
| Straight-line rent expenses and amortization of above- and below-market lease intangibles | | 244 | | 295 | | 247 | | 192 | | (250) | | (154) | | 368 | | (68) | |
| Compensation expense—equity-based | | 384 | | 62 | | 62 | | 62 | | 146 | | 30 | | 59 | | — | |
| Installation services | | 419 | | (812) | | 115 | | 176 | | 86 | | (13) | | 99 | | 58 | |
| Transaction, restructuring & integration costs | | 618 | | 759 | | 587 | | 920 | | 245 | | 77 | | 204 | | 150 | |
| Other gain/loss, net | | 237 | | (60) | | 69 | | | 26 | | 6 | | — | | — | |
| Digital Operating Adjusted EBITDA - DBRG OP share | | $ | 14,199 | | $ | 13,637 | | $ | 13,776 | | $ | 13,948 | | $ | 9,620 | | $ | 6,914 | | $ | 3,294 | | $ | 3,200 | |
Notes:
(1) For reconciliations of net income/(loss) to Adjusted EBITDA, please refer to the Appendices section of this presentation.
| | | | | | | | | | | |
DigitalBridge | Supplemental Financial Report | | 19 | |
| | | | | | | | | | | | | | | | | | | | | | | | | | | | | |
| Capital Expenditures | | | | | | | | | |
| Consolidated amount | | 4Q21 | 3Q21 | 2Q21 | 1Q21 | 4Q20 | 3Q20 | 2Q20 | 1Q20 |
| Recurring capital expenditures | | $ | 6,410 | $ | 7,387 | $ | 4,423 | $ | 1,220 | $ | 1,416 | $ | 1,551 | $ | 1,101 | $ | 1,375 |
| Non-recurring capital expenditures | | 94,018 | 42,841 | 40,460 | 34,652 | 37,534 | 20,423 | 19,738 | 13,254 |
| Total capital expenditures | | $ | 100,428 | $ | 50,228 | $ | 44,883 | $ | 35,872 | $ | 38,950 | $ | 21,974 | $ | 20,839 | $ | 14,629 |
| | | | | | | | | |
| Leasing Commissions | | $ | 1,535 | $ | 1,233 | $ | 5,024 | $ | 775 | $ | 545 | $ | 539 | $ | 1,831 | $ | 475 |
| | | | | | | | | |
| DBRG OP share of consolidated amount | | | | | | | | | |
| Recurring capital expenditures | | $ | 1,097 | $ | 1,349 | $ | 764 | $ | 226 | $ | 233 | $ | 300 | $ | 220 | $ | 275 |
| Non-recurring capital expenditures | | 18,090 | 8,315 | 7,538 | 6,532 | 6,770 | 3,702 | 3,952 | 2,654 |
| Total capital expenditures | | $ | 19,187 | $ | 9,664 | $ | 8,302 | $ | 6,758 | $ | 7,003 | $ | 4,002 | $ | 4,172 | $ | 2,929 |
| | | | | | | | | |
| Leasing Commissions | | $ | 307 | $ | 213 | $ | 756 | $ | 155 | $ | 109 | $ | 108 | $ | 366 | $ | 95 |
| | | | | | | | | | | |
DigitalBridge | Supplemental Financial Report | | 20 | |
| | | | | | | | | | | | | | |
| ($ in thousands, as of December 31, 2021) | Consolidated amount | | DBRG OP share of
consolidated amount | |
| Other | | | | |
| DBRG's GP Co-investment in DBP I and II Investments | $ | 242,856 | | | $ | 183,612 | | |
Equity interests in digital investment vehicles, seed investments and CLOs | 290,113 | | | 174,566 | | |
| Other - digital assets net carrying value | $ | 532,969 | | | $ | 358,178 | | |
| | | | |
Other - held for investment assets net equity carrying value (primarily BRSP shares)(1) | $ | 384,180 | | | $ | 384,180 | | |
| | | | |
Discontinued operations net carrying value(1)(2) | 3,576,328 | | | 2,582,288 | | |
Investment-level non-recourse financing(3) | 2,668,326 | | | 1,913,764 | | |
| 5.375% Exchangeable senior notes and TruPS | 293,722 | | | 293,722 | | |
| Other - discontinued operations assets net equity carrying value | $ | 614,280 | | | $ | 374,802 | | |
| | | | |
| Corporate Net Assets | | | | |
| Cash and cash equivalents, restricted cash and other assets | $ | 981,748 | | | $ | 981,748 | | |
| Accrued and other liabilities and dividends payable | 112,509 | | | 112,509 | | |
| Net assets | $ | 869,239 | | | $ | 869,239 | | |
| | | | |
Notes:
(1) The Company currently holds a 27% equity ownership, or 35.0 million shares, in BRSP. In addition, 461,000 shares and 3.1 million units in BRSP are held by NRF Holdco which are included in assets held for disposition.
(2) Includes all components related to real estate assets, including tangible real estate and lease-related intangibles and cash of the investments presented under discontinued operations.
(3) Represents unpaid principal balance.
| | | | | | | | | | | |
DigitalBridge | Supplemental Financial Report | | 21 | |
Appendices
| | | | | | | | | | | |
DigitalBridge | Supplemental Financial Report | | 22 | |
| | |
| Reconciliations of Digital IM FRE/Adjusted EBITDA and Digital Operating Adjusted EBITDA to Net Income (Loss) |
|
| | | | | | | | | | | | | | | | | | | | | | | | | | | | | |
| ($ in thousand) | | 4Q21 | 3Q21 | 2Q21 | 1Q21 | 4Q20 | 3Q20 | 2Q20 | 1Q20 |
| Digital IM net income (loss) | | $ | 28,194 | | $ | 39,272 | | $ | 15,786 | | $ | 7,663 | | $ | 2,702 | | $ | 3,799 | | $ | 2,424 | | $ | 2,529 | |
| Adjustments: | | | | | | | | | |
| Interest expense (income) | | 2,499 | | 2,250 | | — | | (1) | | (1) | | (2) | | — | | (30) | |
| Investment and servicing expense (income) | | (12) | | — | | — | | 32 | | 204 | | — | | — | | — | |
| Depreciation and amortization | | 5,928 | | 8,242 | | 6,298 | | 8,912 | | 6,421 | | 10,259 | | 6,605 | | 6,603 | |
| Compensation expense—equity-based | | 4,527 | | 4,673 | | 1,837 | | 1,533 | | 655 | | 189 | | 682 | | 589 | |
| Compensation expense—carried interest and incentive | | 25,921 | | 31,736 | | 8,266 | | (33) | | 994 | | 912 | | — | | — | |
| Administrative expenses—straight-line rent | | 75 | | 74 | | 50 | | (2) | | (1) | | 14 | | 16 | | 16 | |
| Administrative expenses—placement agent fee | | 880 | | 3,069 | | 6,959 | | 59 | | 1,202 | | — | | — | | — | |
| Incentive/performance fee income | | (5,720) | | (1,313) | | (4,489) | | — | | — | | — | | — | | — | |
| Equity method (earnings) losses | | (31,608) | | (59,196) | | (11,203) | | 195 | | (6,744) | | (6,394) | | (277) | | (3) | |
| Other (gain) loss, net | | (52) | | (461) | | (119) | | (165) | | (102) | | (32) | | 8 | | (47) | |
| Income tax (benefit) expense | | 1,852 | | 3,089 | | 2,236 | | 7 | | (757) | | 144 | | (151) | | 393 | |
| Digital IM FRE / Adjusted EBITDA | | $ | 32,484 | | $ | 31,435 | | $ | 25,621 | | $ | 18,200 | | $ | 4,573 | | $ | 8,889 | | $ | 9,307 | | $ | 10,050 | |
| | | | | | | | | |
| | 4Q21 | 3Q21 | 2Q21 | 1Q21 | 4Q20 | 3Q20 | 2Q20 | 1Q20 |
| Digital Operating net income (loss) from continuing operations | | (83,909) | | (71,822) | | (10,850) | | (64,260) | | (53,591) | | (38,795) | | (21,262) | | (18,415) | |
| Adjustments: | | | | | | | | | |
| Interest expense | | 35,144 | | 29,839 | | 29,272 | | 31,133 | | 41,815 | | 18,589 | | 8,170 | | 9,402 | |
| Income tax (benefit) expense | | (1,941) | | 1,922 | | (66,788) | | (12,268) | | (6,967) | | (6,091) | | (2,673) | | (5,730) | |
| Depreciation and amortization | | 126,436 | | 120,458 | | 126,227 | | 122,220 | | 78,554 | | 73,032 | | 28,571 | | 30,031 | |
| EBITDAre: | | $ | 75,730 | | $ | 80,397 | | $ | 77,861 | | $ | 76,825 | | $ | 59,811 | | $ | 46,735 | | $ | 12,806 | | $ | 15,288 | |
| Straight-line rent expenses and amortization of above- and below-market lease intangibles | | 370 | | 482 | | (98) | | (399) | | (2,607) | | (2,106) | | 1,837 | | (338) | |
| Compensation expense—equity-based | | 1,918 | | 308 | | 308 | | 308 | | 728 | | 148 | | 296 | | — | |
| Installation services | | 2,097 | | (4,058) | | 576 | | 880 | | 429 | | (65) | | 493 | | 289 | |
| Transaction, restructuring & integration costs | | 3,188 | | 4,042 | | 2,999 | | 4,670 | | 1,155 | | 420 | | 1,021 | | 748 | |
| Other gain/loss, net | | 1,226 | | (285) | | 349 | | — | | 200 | | 46 | | — | | — | |
| Digital Operating Adjusted EBITDA | | $ | 84,529 | | $ | 80,886 | | $ | 81,995 | | $ | 82,284 | | $ | 59,716 | | $ | 45,178 | | $ | 16,453 | | $ | 15,987 | |
| | | | | | | | | | | |
DigitalBridge | Supplemental Financial Report | | 23 | |
| | |
| Reconciliations of Core FFO, AFFO and Adjusted EBITDA to Net Income (Loss) |
|
| | | | | | | | | | | | | | | | | | | | | | | | | | | | | |
| ($ in thousands) | | 4Q21 | 3Q21 | 2Q21 | 1Q21 | 4Q20 | 3Q20 | 2Q20 | 1Q20 |
| Net income (loss) attributable to common stockholders | | $ | (20,686) | | $ | 41,036 | | $ | (141,260) | | $ | (264,806) | | $ | (140,575) | | $ | (205,784) | | $ | (2,042,790) | | $ | (361,633) | |
| Net income (loss) attributable to noncontrolling common interests in Operating Company | | (1,946) | | 4,311 | | (14,980) | | (27,896) | | (15,411) | | (22,651) | | (225,057) | | (39,601) | |
| Net income (loss) attributable to common interests in Operating Company and common stockholders | | (22,632) | | 45,347 | | (156,240) | | (292,702) | | (155,986) | | (228,435) | | (2,267,847) | | (401,234) | |
| | | | | | | | | |
| Adjustments for FFO: | | | | | | | | | |
| Real estate depreciation and amortization | | 133,813 | | 126,494 | | 150,458 | | 184,762 | | 136,245 | | 162,705 | | 131,722 | | 130,523 | |
| Impairment of real estate | | (40,732) | | (8,210) | | 242,903 | | 106,077 | | 31,365 | | 142,767 | | 1,474,262 | | 308,268 | |
| Gain from sales of real estate | | (197) | | (514) | | (2,969) | | (38,102) | | (26,566) | | (12,332) | | 4,919 | | (7,933) | |
| Less: Adjustments attributable to noncontrolling interests in investment entities | | (89,727) | | (95,512) | | (162,021) | | (188,496) | | (79,874) | | (146,905) | | (329,601) | | (82,329) | |
| FFO | | $ | (19,475) | | $ | 67,605 | | $ | 72,131 | | $ | (228,461) | | $ | (94,816) | | $ | (82,200) | | $ | (986,545) | | $ | (52,705) | |
| | | | | | | | | |
| Additional adjustments for Core FFO: | | | | | | | | | |
| Adjustment to BRSP cash dividend | | (28,243) | | 9,478 | | (40,165) | | 55,648 | | (22,999) | | (18,207) | | 328,222 | | (86,213) | |
| Equity-based compensation expense | | 19,416 | | 9,038 | | 11,642 | | 19,299 | | 8,288 | | 7,879 | | 10,152 | | 8,732 | |
| Straight-line rent revenue and expense | | (1,986) | | (1,925) | | (2,309) | | 17,225 | | (6,403) | | (6,281) | | (5,240) | | (2,025) | |
| Amortization of acquired above- and below-market lease values, net | | (333) | | (172) | | (1,498) | | 6,005 | | (1,229) | | (1,440) | | (531) | | (3,519) | |
| Debt prepayment penalties and amortization of deferred financing costs and debt premiums and discounts | | 36,685 | | 7,651 | | 10,196 | | 45,627 | | 25,034 | | 4,296 | | 10,080 | | 15,049 | |
| Non-real estate fixed asset depreciation, amortization and impairment | | 13,324 | | 13,616 | | 19,996 | | 20,563 | | 4,885 | | 12,754 | | 13,390 | | 13,253 | |
| Restructuring and transaction-related charges | | 29,977 | | 19,501 | | 5,174 | | 34,482 | | 21,887 | | 13,044 | | 8,864 | | 15,568 | |
| Non-real estate (gains) losses, excluding realized gains or losses of digital assets within the Corporate and Other segment | | (52,611) | | 11,319 | | (151,773) | | 267,812 | | 193,948 | | 84,995 | | 740,038 | | 85,124 | |
| Net unrealized carried interest | | (7,375) | | (27,953) | | (6,485) | | 189 | | (5,734) | | (5,170) | | 801 | | 9,230 | |
| Preferred share redemption (gain) loss | | 2,127 | | 2,865 | | — | | — | | — | | — | | — | | — | |
| Deferred taxes and tax effect on certain of the foregoing adjustments | | 8,195 | | 1,663 | | (42,536) | | (17,657) | | (8,764) | | (7,917) | | (3,092) | | (6,062) | |
| Less: Adjustments attributable to noncontrolling interests in investment entities | | (15,423) | | 12,438 | | 146,687 | | (218,328) | | (143,262) | | (38,042) | | (182,607) | | 3,017 | |
| Less: Core FFO from discontinued operations | | 11,467 | | (123,075) | | (25,874) | | (12,391) | | 4,025 | | 5,579 | | 37,218 | | (31,128) | |
| Core FFO | | $ | (4,255) | | $ | 2,049 | | $ | (4,814) | | $ | (9,987) | | $ | (25,140) | | $ | (30,710) | | $ | (29,250) | | $ | (31,679) | |
| Recurring capital expenditures | | $ | (1,097) | | $ | (1,349) | | $ | (764) | | $ | (226) | | $ | (233) | | $ | (300) | | $ | (220) | | $ | (275) | |
| AFFO | | $ | (5,352) | | $ | 700 | | $ | (5,578) | | $ | (10,213) | | $ | (25,373) | | $ | (31,010) | | $ | (29,470) | | $ | (31,954) | |
| | | | | | | | | | | |
DigitalBridge | Supplemental Financial Report | | 24 | |
| | |
| Reconciliations of Core FFO, AFFO and Adjusted EBITDA to Net Income (Loss) |
|
| | | | | | | | | | | | | | | | | | | | | | | | | | | | | |
| ($ in thousands) | | 4Q21 | 3Q21 | 2Q21 | 1Q21 | 4Q20 | 3Q20 | 2Q20 | 1Q20 |
| Core FFO | | $ | (4,255) | | $ | 2,049 | | $ | (4,814) | | $ | (9,987) | | $ | (25,140) | | $ | (30,710) | | $ | (29,250) | | $ | (31,679) | |
| Less: Earnings of equity method investments | | (6,441) | | (5,784) | | (6,216) | | (4,440) | | — | | — | | — | | (13,320) | |
| Plus: Preferred dividends | | 16,139 | | 17,456 | | 18,516 | | 18,516 | | 18,516 | | 18,516 | | 18,516 | | 19,474 | |
Plus: Core interest expense(1) | | 13,775 | | 14,160 | | 11,834 | | 12,387 | | 11,972 | | 12,234 | | 12,625 | | 10,393 | |
Plus: Core tax expense(1) | | 631 | | (12,638) | | (8,224) | | (5,613) | | (9,974) | | (5,310) | | (6,536) | | 555 | |
| Plus: Non pro-rata allocation of income (loss) to NCI | | 231 | | 231 | | 223 | | 201 | | 201 | | (751) | | — | | — | |
| Plus: Placement fees | | 603 | | 2,102 | | 4,767 | | 40 | | 823 | | — | | — | | — | |
| Less: Net realized carried interest, incentive fees, and other adjustments to Fee Related Earnings | | (1,092) | | (7) | | (1,565) | | 11 | | 140 | | 248 | | (549) | | (173) | |
| Plus: Digital Operating installation services, transaction, investment and servicing costs | | 1,366 | | 53 | | 856 | | 1,423 | | 1,018 | | 254 | | (42) | | 162 | |
| Adjusted EBITDA (DBRG OP Share) | | $ | 20,957 | | $ | 17,622 | | $ | 15,377 | | $ | 12,538 | | $ | (2,444) | | $ | (5,519) | | $ | (5,236) | | $ | (14,588) | |
Notes:
(1) Excludes components that are included in adjustments for Core FFO.
| | | | | | | | | | | |
DigitalBridge | Supplemental Financial Report | | 25 | |
Assets Under Management (“AUM”)
Assets owned by the Company’s balance sheet and assets for which the Company and its affiliates provide investment management services, including assets for which the Company may or may not charge management fees and/or performance allocations. Balance sheet AUM is based on the undepreciated carrying value of digital investments and the impaired carrying value of non digital investments as of the report date. Investment management AUM is based on the cost basis of managed investments as reported by each underlying vehicle as of the report date. AUM further includes uncalled capital commitments, but excludes DBRG OP’s share of non wholly-owned real estate investment management platform’s AUM. The Company's calculations of AUM may differ from the calculations of other asset managers, and as a result, this measure may not be comparable to similar measures presented by other asset managers.
Contracted Revenue Growth (“Bookings”)
The Company defines Bookings as either (1) a new data center customer contract for new or additional services over and above any services already being provided as well as (2) an increase in contracted rates on the same services when a contract renews. In both instances a booking is considered to be generated when a new contract is signed with the recognition of new revenue to occur when the new contract begins billing.
Churn
The Company calculates Churn as the percentage of MRR lost during the period divided by the prior period’s MRR. Churn is intended to represent data center customer contracts which are terminated during the period and not renewed.
DigitalBridge Operating Company, LLC (“DBRG OP”)
The operating partnership through which the Company conducts all of its activities and holds substantially all of its assets and liabilities. DBRG OP share excludes noncontrolling interests in investment entities.
Fee-Earning Equity Under Management (“FEEUM”)
Equity for which the Company and its affiliates provides investment management services and derives management fees and/or performance allocations. FEEUM generally represents the basis used to derive fees, which may be based on invested equity, stockholders’ equity, or fair value pursuant to the terms of each underlying investment management agreement. The Company's calculations of FEEUM may differ materially from the calculations of other asset managers, and as a result, this measure may not be comparable to similar measures presented by other asset managers.
Recurring Capital Expenditures
Represents capitalized expenditures including recurring maintenance repairs and improvements necessary to preserve the value of and maintain the functionality of the property, which are not expected to generate incremental revenue.
Non-recurring Capital Expenditures
Represents capitalized expenditures including major capital improvements for expansions, transformations and incremental improvements to the operating portfolio intended to result in increased revenues and Adjusted EBITDA at the property.
Max Critical I.T. Square Feet
Amount of total rentable square footage.
Monthly Recurring Revenue (“MRR”)
The Company defines MRR as revenue from ongoing services that is generally fixed in price and contracted for longer than 30 days.
UPB: Unpaid Principal Balance
% Utilization Rate: Amount of leased square feet divided by max critical I.T. square feet.
| | | | | | | | | | | |
DigitalBridge | Supplemental Financial Report | | 26 | |