 | ||||||||
Exhibit 99.1
COLONY CAPITAL ANNOUNCES FIRST QUARTER 2021 FINANCIAL RESULTS
Boca Raton, May 6, 2021 - Colony Capital, Inc. (NYSE: CLNY) and subsidiaries (collectively, “Colony Capital,” or the “Company”) today announced financial results for the first quarter ended March 31, 2021. The Company reported first quarter 2021 total revenues of $316 million, GAAP net income attributable to common stockholders of $(265) million, or $(0.56) per share and Core FFO of $4.0 million, or $0.01 per share.
“During the first quarter we made significant progress towards our 2021 goals. Our digital portfolio companies continue to grow and generate strong performance and we are busy deploying fresh capital from DCP II, our new flagship equity offering, into exciting new digital platforms,” said Marc Ganzi, President and Chief Executive Officer. "The growth in our digital businesses combined with key legacy dispositions puts us at 70% rotated currently, already past our target for the year. Our business transformation dovetails with profound governance changes, with Nancy Curtin, our lead independent director, recently agreeing to step into the role of Chairperson and the addition of a new digital board member in Shaka Rasheed, earlier this week at our Annual Meeting."
Q1 2021 HIGHLIGHTS
Momentum at Digital Businesses
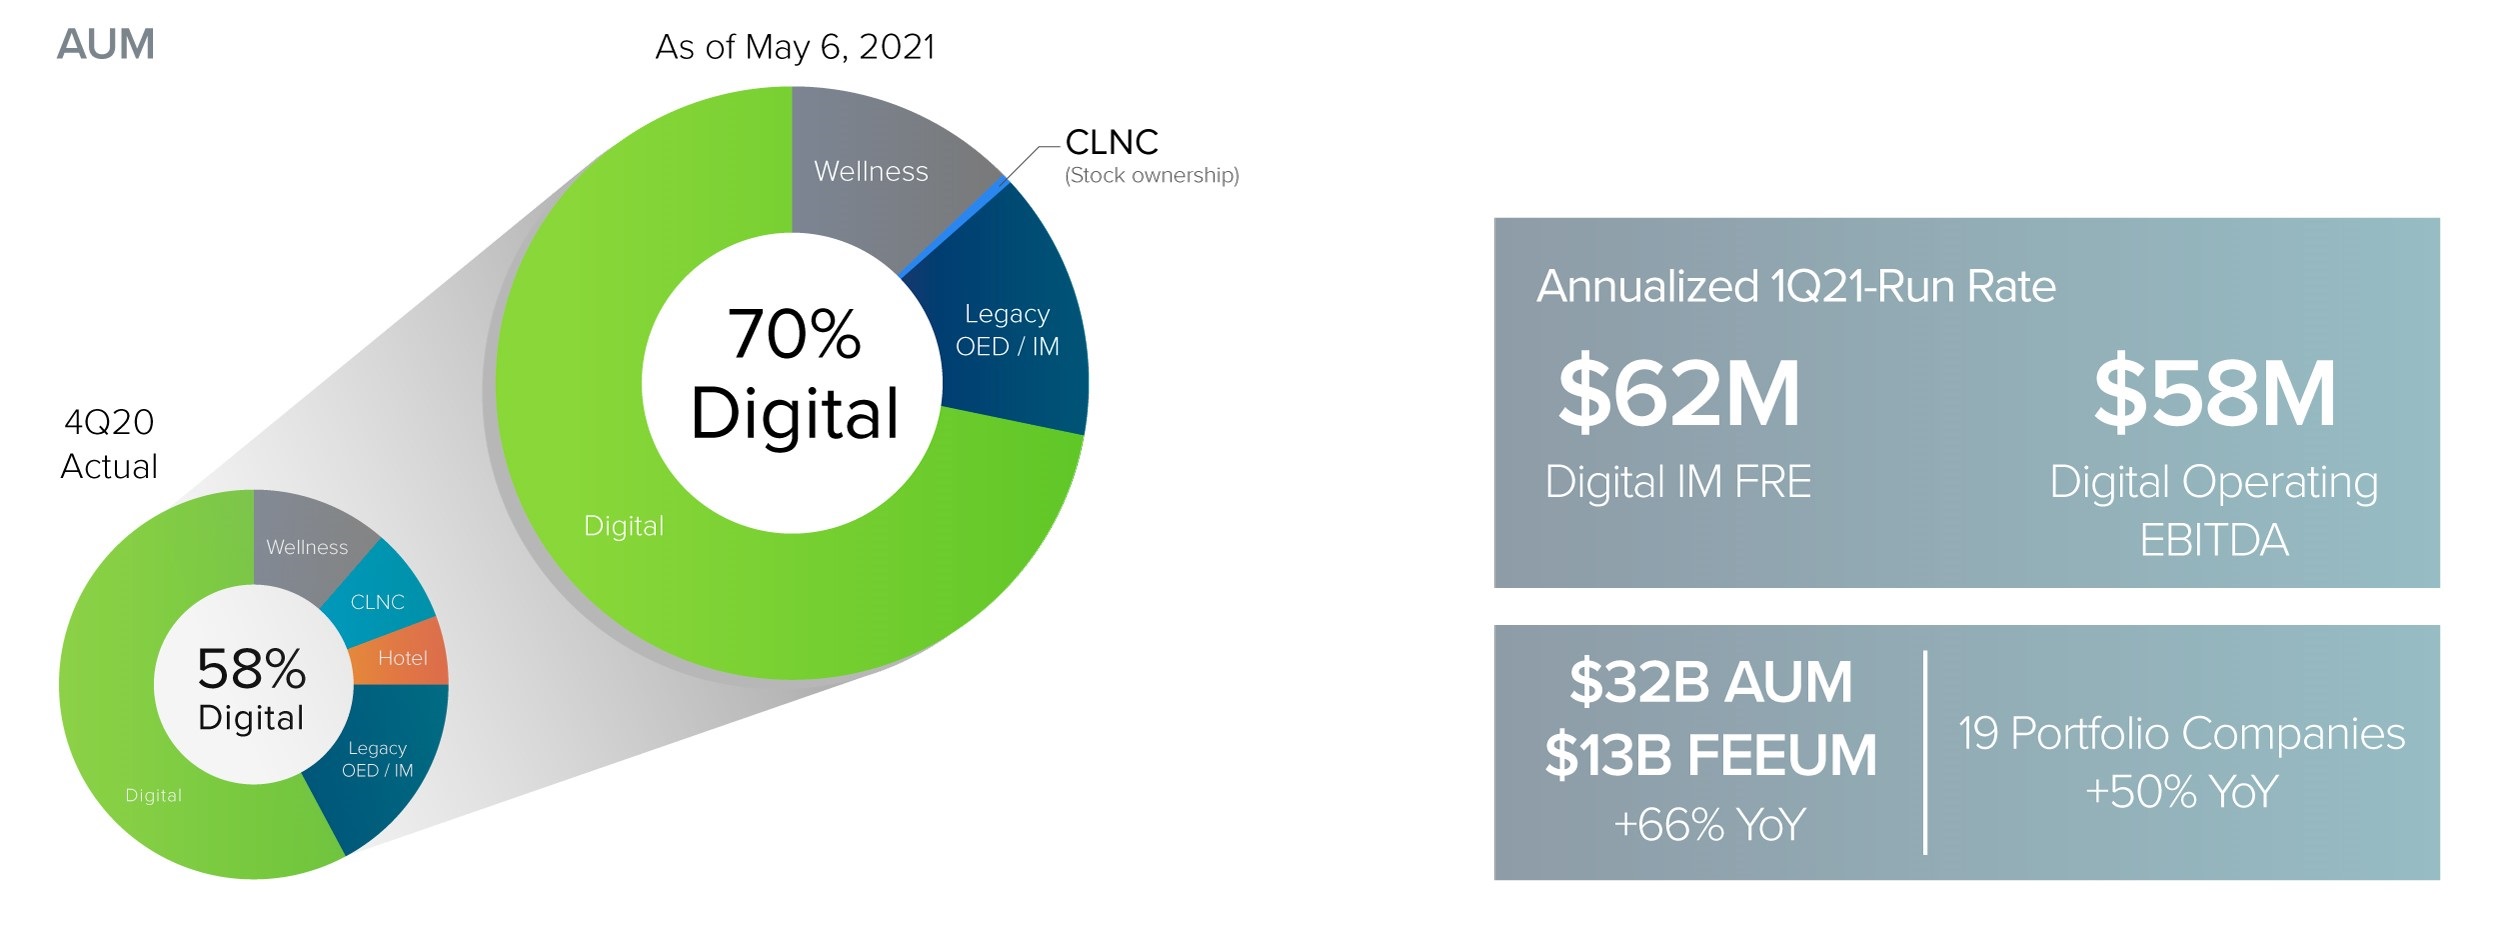
•Digital AUM rose to $32 billion, 70% of total AUM as of May 6, 2021.
•Capital formation at Digital Colony Partners II (DCP II) drove strong growth in the Digital IM segment, with revenues and FRE both up over 50% YoY.
•Organic growth and a strong contribution from DataBank’s expanded footprint drove higher revenue and EBITDA in the Digital Operating segment, which exceeded 2021 EBITDA guidance on a run-rate basis during the quarter.
•DataBank, supported by the Digital Colony capital markets team, completed a first-of-its-kind enterprise data center financing, raising over $650 million in securitized notes to extend its debt maturities and provide new capital to fund growth, while lowering its overall cost of debt by over 50%.
Generated Positive Core FFO
•Digital FRE increased by 54% to $15.5 million from $10.1 million in the prior year due to significant FEEUM growth of $5.1 billion in the last twelve months.
•Digital Operating EBITDA increased to $14.4 million from $3.2 million in the prior year led by substantial investments in high quality Digital Operating assets, namely Vantage SDC and DataBank's acquisition of zColo.
•Significant G&A savings through legacy asset sales and corporate cost rationalization efforts also contributed to the positive Core FFO outcome.
| Financial Summary | |||||||||||
| ($ in millions, except per share data and where noted) | |||||||||||
| Revenues | Q1 2021 | Q1 2020 | |||||||||
| Property operating income | $275 | $184 | |||||||||
| Interest income | 3 | 3 | |||||||||
| Fee income | 34 | 25 | |||||||||
| Other income | 4 | 6 | |||||||||
| Total revenues | $316 | $217 | |||||||||
| Adjusted EBITDA | $56 | $36 | |||||||||
| Net income to common stockholders | $(265) | $(362) | |||||||||
| Core FFO | $4 | $(12) | |||||||||
| Core FFO per share | $0.01 | $(0.02) | |||||||||
Digital Fee Related Earnings (“FRE”)(1) | $15 | $10 | |||||||||
| Digital Operating EBITDA | $14 | $3 | |||||||||
Digital Core FFO(2) | $16 | $11 | |||||||||
| Liquidity and Digital AUM | 03/31/21 | 12/31/20 | |||||||||
| Liquidity (cash & undrawn RCF) | $667 | $737 | |||||||||
| Digital AUM (in billions) | $32.0 | $30.0 | |||||||||
________________________________________________
Note: Revenues, Net Income, Adjusted EBITDA and Digital FRE are consolidated while Core FFO, Digital Core FFO, Digital Operating EBITDA, Liquidity and AUM are CLNY OP share.
(1) Reported 1Q21 FRE was $18.2 million, however, the figure above has been adjusted to exclude a $2.7 million benefit from reversing unused portions of the one-time incentive expense recorded in 4Q20.
(2) Includes Digital Investment Management and Digital Operating, excludes Digital Other.
1
| ||||||||
Harvest Legacy Assets
•Completed the sale of the Company's hospitality portfolios, generating an aggregate $67.5 million of gross proceeds on a consolidated basis. The sale resulted in the reduction of $2.7 billion in consolidated investment-level debt.
•Other Equity & Debt (OED) assets monetized year-to-date generated $131 million of net equity proceeds, including a sale in April of a 74% controlling interest in two high-quality office properties located in Dublin’s city center with $104 million in net equity proceeds to the Company.
•In April 2021, the Company completed the internalization transaction with Colony Credit Real Estate, Inc. (CLNC) and received a termination payment of $102 million, transferred 44 employees to CLNC and executed a transition services agreement to allow for a seamless transition of critical functions.
•In addition to funding future digital investments, these transactions advance the Company’s efforts to streamline the organization and simplify its business profile.
Significant Corporate Governance Advances
•Nancy Curtin, the Company’s lead independent director, was appointed to the position of Chairperson of the Board, effective April 1, 2021. The Company will benefit from Ms. Curtin’s extensive global investment and leadership experience, as well as a deep knowledge of the Company's business.
•On May 4, 2021, Sháka Rasheed was elected to the Company’s Board of Directors. Mr. Rasheed currently serves as an executive of the Microsoft Corporation. As an accomplished leader and advisor currently at the intersection of financial services and technology, Mr. Rasheed brings over 25 years of business development, sales, strategy, and leadership experience to the Board.
Investor Relations
•The Company will host an inaugural Virtual Investor Day on Tuesday, June 22, 2021 as part of its efforts to build greater awareness across the investor community around its strategic plan as it accelerates towards the completion of its digital transformation.
•The Company continues to prioritize simplification as it makes improvements to its financial reporting, most recently condensing its earnings release and supplemental financial reporting packages to reduce complexity and simplify analysis. The Company also expects to issue a new Corporate Overview document in connection with its upcoming investor day.
Digital Snapshot
Tracking to 2021 Guidance
2
| ||||||||
Common Stock and Operating Company Units
As of May 3, 2021, the Company had 487.2 million shares of Class A and B common stock outstanding and the Company’s operating partnership had 51.1 million operating company units outstanding and held by members other than the Company.
Preferred Dividends
On February 23, 2021, the Company’s Board declared cash dividends with respect to each series of the Company’s cumulative redeemable perpetual preferred stock in accordance with the terms of such series, as follows: with respect to each of the Series G preferred stock: $0.46875 per share; Series H preferred stock: $0.4453125 per share; Series I preferred stock: $0.446875 per share; and Series J preferred stock: $0.4453125 per share, such dividends were paid on April 15, 2021 to the respective stockholders of record on April 12, 2021.
On May 4, 2021, the Company’s Board declared cash dividends with respect to each series of the Company’s cumulative redeemable perpetual preferred stock in accordance with the terms of such series, as follows: with respect to each of the Series G preferred stock: $0.46875 per share; Series H preferred stock: $0.4453125 per share; Series I preferred stock: $0.446875 per share; and Series J preferred stock: $0.4453125 per share, such dividends will be paid on July 15, 2021 to the respective stockholders of record on July 9, 2021.
First Quarter 2021 Conference Call
The Company will conduct an earnings presentation and conference call to discuss the financial results on Thursday, May 6, 2021 at 10:00 a.m. ET. The earnings presentation will be broadcast live over the Internet and can be accessed on the Shareholders section of the Company’s website at ir.clny.com/events. A webcast of the presentation and conference call will be available for 90 days on the Company’s website. To participate in the event by telephone, please dial (877) 407-4018 ten minutes prior to the start time (to allow time for registration). International callers should dial (201) 689-8471.
For those unable to participate during the live call, a replay will be available starting May 6, 2021, at 1:00 p.m. ET, through May 13, 2021, at 11:59 p.m. ET. To access the replay, dial (844) 512-2921 (U.S.), and use passcode 13718365. International callers should dial (412) 317-6671 and enter the same conference ID number.
Earnings Presentation and Supplemental Financial Report
A First Quarter 2021 Earnings Presentation and Supplemental Financial Report is available in the Events & Presentations and Financial Information sections, respectively, of the Shareholders tab on the Company’s website at www.clny.com. This information has also been furnished to the U.S. Securities and Exchange Commission in a Current Report on Form 8-K.
About Colony Capital, Inc.
Colony Capital, Inc. (NYSE: CLNY) is a leading global investment firm with a heritage of identifying and capitalizing on key secular trends in real estate. The Company manages a $46 billion portfolio of real assets on behalf of its shareholders and limited partners, including $32 billion in digital real estate investments through Digital Colony, its digital infrastructure platform. Colony Capital, structured as a REIT, is headquartered in Boca Raton with key offices in Los Angeles, New York, London and Singapore. For more information on Colony Capital, visit www.clny.com.
Cautionary Statement Regarding Forward-Looking Statements
This press release may contain forward-looking statements within the meaning of the federal securities laws. Forward-looking statements relate to expectations, beliefs, projections, future plans and strategies, anticipated events or trends and similar expressions concerning matters that are not historical facts. In some cases, you can identify forward-looking statements by the use of forward-looking terminology such as “may,” “will,” “should,” “expects,” “intends,” “plans,” “anticipates,” “believes,” “estimates,” “predicts,” or “potential” or the negative of these words and phrases or similar words or phrases which are predictions of or indicate future events or trends and which do not relate solely to historical matters. You can also identify forward-looking statements by discussions of strategy, plans or intentions.
Forward-looking statements involve known and unknown risks, uncertainties, assumptions and contingencies, many of which are beyond the Company’s control, and may cause the Company’s actual results to differ significantly from those expressed in any forward-looking statement. Factors that might cause such a difference include, without limitation, the impact of COVID-19 on the global economy, including the Company’s businesses, whether the Company will capitalize on the powerful secular tailwinds supporting the continued growth and investment in digital infrastructure, whether the Company’s wellness infrastructure segment, including contractual rent collections, will continue to perform well despite ongoing impacts of COVID-19, the Company’s ability to continue driving strong growth in its digital business and accelerating its digital transformation, including whether the Company will continue to lower corporate expenses and achieve earnings rotation through divestment of legacy businesses and assets, the impact of the digital transformation on the Company’s earnings profile, the Company’s ability to collaborate with its partner companies and customers to build the next-generation networks connecting enterprises and consumers globally, whether the Company will realize the anticipated benefits of Wafra’s strategic investment in the Company’s digital investment management business, including whether the Wafra investment will become subject to redemption and the amount of commitments Wafra will make to the Company’s digital investment products, the Company’s ability to raise third party capital in its managed funds or co-investment structures and the pace of such fundraising (including as a result of the impact of COVID-19), whether the DCP II fund raising target will be met, in the amounts anticipated or at all, the performance of DataBank, including zColo, the success and
3
| ||||||||
performance of the Company’s future investment product offerings, including a digital credit investment vehicle, whether the Company will realize the anticipated benefits of its investment in Vantage SDC, including the performance and stability of its portfolio, the pace of growth in the Company’s digital investment management franchise, the Company’s ability to continue to make investments in digital assets onto the balance sheet and the quality and earnings profile of such investments, the resilience and growth in demand for digital infrastructure, whether the Company will realize the anticipated benefits of its securitization transactions, the Company’s ability to simplify its business and continue to monetize legacy businesses/OED assets, including the timing and amount of proceeds to be received by the Company in those monetizations and its impact on the Company’s liquidity, if any, whether warehoused investments will ultimately be transferred to a managed investment vehicle or at all, the impact of impairments, the level of expenses within the wellness infrastructure segment and the impact on performance for the segment, whether the Company will maintain or produce higher Core FFO per share in the coming quarters, or ever, the Company’s FRE and FEEUM and its ability to continue growth at the current pace or at all, whether the Company will continue to pay dividends on its preferred stock, the impact of changes to the Company’s management or board of directors, employee and organizational structure, the Company’s financial flexibility and liquidity, including borrowing capacity under its revolving credit facility (including as a result of the impact of COVID-19), whether the Company will further extend the term of its revolving credit facility, the use of sales proceeds and available liquidity, the performance of the Company’s investment in CLNC (including as a result of the impact of COVID-19), including the CLNC share price as compared to book value and how the Company evaluates the Company’s investment in CLNC, the impact of management changes at CLNC, the Company’s ability to minimize balance sheet commitments to its managed investment vehicles, customer demand for data centers, the Company's portfolio composition, the Company's expected taxable income and net cash flows, excluding the contribution of gains, the Company’s ability to pay or grow the dividend at all in the future, the impact of any changes to the Company’s management agreements with NorthStar Healthcare Income, Inc. and other managed investment vehicles, whether the Company will be able to maintain its qualification as a REIT for U.S. federal income tax purposes, the timing of and ability to deploy available capital, including whether any redeployment of capital will generate higher total returns, the Company’s ability to maintain inclusion and relative performance on the RMZ, the Company’s leverage, including the Company’s ability to reduce debt and the timing and amount of borrowings under its credit facility, increased interest rates and operating costs, adverse economic or real estate developments in the Company’s markets, the Company’s failure to successfully operate or lease acquired properties, decreased rental rates, increased vacancy rates or failure to renew or replace expiring leases, increased costs of capital expenditures, defaults on or non-renewal of leases by tenants, the impact of economic conditions (including the impact of COVID-19 on such conditions) on the borrowers of the Company’s commercial real estate debt investments and the commercial mortgage loans underlying its commercial mortgage backed securities, adverse general and local economic conditions, an unfavorable capital market environment, decreased leasing activity or lease renewals, and other risks and uncertainties, including those detailed in the Company’s Annual Report on Form 10-K for the fiscal year ended December 31, 2020 and Quarterly Report on Form 10-Q for the quarter ended March 31, 2021, each under the heading “Risk Factors,” as such factors may be updated from time to time in the Company’s subsequent periodic filings with the U.S. Securities and Exchange Commission (“SEC”). All forward-looking statements reflect the Company’s good faith beliefs, assumptions and expectations, but they are not guarantees of future performance. Additional information about these and other factors can be found in the Company’s reports filed from time to time with the SEC.
the Company cautions investors not to unduly rely on any forward-looking statements. The forward-looking statements speak only as of the date of this press release. The Company is under no duty to update any of these forward-looking statements after the date of this press release, nor to conform prior statements to actual results or revised expectations, and the Company does not intend to do so.
Source: Colony Capital, Inc.
Investor Contacts:
Severin White
Managing Director, Head of Public Investor Relations
212-547-2777
swhite@clny.com
4
| ||||||||
Non-GAAP Financial Measures and Definitions
Adjusted Earnings before Interest, Taxes, Depreciation and Amortization
The Company calculates Adjusted EBITDA by adjusting Core FFO to exclude interest expense, preferred dividends, tax expense or benefit, earnings from equity method investments, placement fees, and for the Digital Operating segment, restructuring, transaction and integration costs, and revenues and corresponding costs related to the delivery of services that are not ongoing, such as installation services. The Company uses Adjusted EBITDA as a supplemental measure of our performance because they eliminate depreciation, amortization, and the impact of the capital structure from its operating results. However, because Adjusted EBITDA is calculated before recurring cash charges including interest expense and taxes and are not adjusted for capital expenditures or other recurring cash requirements, their utilization as a cash flow measurement is limited.
Assets Under Management (AUM)
Assets owned by the Company’s balance sheet and assets for which the Company and its affiliates provide investment management services, including assets for which the Company may or may not charge management fees and/or performance allocations. Balance sheet AUM is based on the undepreciated carrying value of digital investments and the impaired carrying value of non digital investments as of the report date. Investment management AUM is based on the cost basis of managed investments as reported by each underlying vehicle as of the report date. AUM further includes uncalled capital commitments, but excludes CLNY OP’s share of non wholly-owned real estate investment management platform’s AUM. The Company's calculations of AUM may differ from the calculations of other asset managers, and as a result, this measure may not be comparable to similar measures presented by other asset managers.
CLNY Operating Partnership (CLNY OP)
The operating partnership through which the Company conducts all of its activities and holds substantially all of its assets and liabilities. The Company is the sole managing member of, and directly owns approximately 90% of the common units in, CLNY OP. The remaining common units in CLNY OP are held primarily by current and former employees of the Company. Each common unit is redeemable at the election of the holder for cash equal to the then fair value of one share of the Company’s Class A common stock or, at the Company’s option, one share of the Company’s Class A common stock. CLNY OP share excludes noncontrolling interests in investment entities. Throughout this presentation, consolidated figures represent the interest of both the Company (and its subsidiary Colony Capital Operating Company or the “CLNY OP”) and noncontrolling interests. Figures labeled as CLNY OP share represent the Company’s pro-rata share.
Digital Operating Earnings before Interest, Taxes, Depreciation and Amortization for Real Estate (EBITDAre) and Adjusted EBITDA
The Company calculates EBITDAre in accordance with the standards established by the National Association of Real Estate Investment Trusts, which defines EBITDAre as net income or loss calculated in accordance with GAAP, excluding interest, taxes, depreciation and amortization, gains or losses from the sale of depreciated property, and impairment of depreciated property. The Company calculates Adjusted EBITDA by adjusting EBITDAre for the effects of straight-line rental income/expense adjustments and amortization of acquired above- and below-market lease adjustments to rental income, equity-based compensation expense, restructuring and integration costs, transaction costs from unsuccessful deals and business combinations, litigation expense, the impact of other impairment charges, gains or losses from sales of undepreciated land, and gains or losses on early extinguishment of debt and hedging instruments. Revenues and corresponding costs related to the delivery of services that are not ongoing, such as installation services, are also excluded from Adjusted EBITDA. The Company uses EBITDAre and Adjusted EBITDA as supplemental measures of our performance because they eliminate depreciation, amortization, and the impact of the capital structure from its operating results. However, because EBITDAre and Adjusted EBITDA are calculated before recurring cash charges including interest expense and taxes and are not adjusted for capital expenditures or other recurring cash requirements, their utilization as a cash flow measurement is limited.
Fee-Earning Equity Under Management (FEEUM)
Equity for which the Company and its affiliates provides investment management services and derives management fees and/or performance allocations. FEEUM generally represents the basis used to derive fees, which may be based on invested equity, stockholders’ equity, or fair value pursuant to the terms of each underlying investment management agreement. The Company's calculations of FEEUM may differ materially from the calculations of other asset managers, and as a result, this measure may not be comparable to similar measures presented by other asset managers.
Fee Related Earnings (FRE)
The Company calculates FRE for its investment management business within the digital segment as base management fees, other service fee income, and other income inclusive of cost reimbursements, less compensation expense (excluding equity-based compensation), administrative expenses (excluding fund raising placement agent fee expenses), and other operating expenses related to the investment management business. The Company uses FRE as a supplemental performance measure as it may provide additional insight into the profitability of the overall digital investment management business. FRE is presented prior to the deduction for Wafra's 31.5% interest.
5
| ||||||||
Funds From Operations (FFO) and Core Funds From Operations (Core FFO)
The Company calculates funds from operations (FFO) in accordance with standards established by the National Association of Real Estate Investment Trusts, which defines FFO as net income or loss calculated in accordance with GAAP, excluding (i) extraordinary items, as defined by GAAP; (ii) gains and losses from sales of depreciable real estate; (iii) impairment write-downs associated with depreciable real estate; (iv) gains and losses from a change in control in connection with interests in depreciable real estate or in-substance real estate, plus (v) real estate-related depreciation and amortization; and (vi) including similar adjustments for equity method investments. Included in FFO are gains and losses from sales of assets which are not depreciable real estate such as loans receivable, equity method investments, as well as equity and debt securities, as applicable.
The Company computes core funds from operations (Core FFO) by adjusting FFO for the following items, including the Company’s share of these items recognized by its unconsolidated partnerships and joint ventures: (i) equity-based compensation expense; (ii) effects of straight-line rent revenue and expense; (iii) amortization of acquired above- and below-market lease values; (iv) debt prepayment penalties and amortization of deferred financing costs and debt premiums and discounts; (v) non-real estate depreciation, amortization and impairment; (vi) restructuring and transaction-related charges; (vii) non-real estate loss (gain), fair value loss (gain) on interest rate and foreign currency hedges, and foreign currency remeasurements except realized gain and loss from the Digital Other segment; (viii) net unrealized carried interest; and (ix) deferred taxes and the tax effect on certain of the foregoing adjustments. The Company’s Core FFO from its interest in Colony Credit Real Estate (NYSE: CLNC) represented the cash dividends declared in the reported period. The Company excluded results from discontinued operations in its calculation of Core FFO and applied this exclusion to prior periods. Beginning with the first quarter 2021, the Company revised the computation of Core FFO and applied this revised computation methodology to prior periods presented.
FFO and Core FFO should not be considered alternatives to GAAP net income as indications of operating performance, or to cash flows from operating activities as measures of liquidity, nor as indications of the availability of funds for our cash needs, including funds available to make distributions. FFO and Core FFO should not be used as supplements to or substitutes for cash flow from operating activities computed in accordance with GAAP.
The Company uses FFO and Core FFO as supplemental performance measures because, in excluding real estate depreciation and amortization and gains and losses, it provides a performance measure that captures trends in occupancy rates, rental rates, and operating costs, and such a measure is useful to investors as it excludes periodic gains and losses from sales of investments that are not representative of its ongoing operations. The Company also believes that, as widely recognized measures of the performance of REITs, FFO and Core FFO will be used by investors as a basis to compare its operating performance with that of other REITs. However, because FFO and Core FFO exclude depreciation and amortization and capture neither the changes in the value of the Company’s properties that resulted from use or market conditions nor the level of capital expenditures and leasing commissions necessary to maintain the operating performance of its properties, all of which have real economic effect and could materially impact the Company’s results from operations, the utility of FFO and Core FFO as measures of the Company’s performance is limited. FFO and Core FFO should be considered only as supplements to GAAP net income as a measure of the Company’s performance. Additionally, Core FFO excludes the impact of certain fair value fluctuations, which, if they were to be realized, could have a material impact on the Company’s operating performance.
Net Operating Income (NOI)
NOI for our real estate segments represents total property and related income less property operating expenses, adjusted for the effects of (i) straight-line rental income adjustments; (ii) amortization of acquired above- and below-market lease adjustments to rental income; and (iii) other items such as adjustments for the Company’s share of NOI of unconsolidated ventures.
The Company believes that NOI is a useful measure of operating performance of its respective real estate portfolios as it is more closely linked to the direct results of operations at the property level. NOI also reflects actual rents received during the period after adjusting for the effects of straight-line rents and amortization of above- and below- market leases; therefore, a comparison of NOI across periods better reflects the trend in occupancy rates and rental rates of the Company’s properties.
NOI excludes historical cost depreciation and amortization, which are based on different useful life estimates depending on the age of the properties, as well as adjust for the effects of real estate impairment and gains or losses on sales of depreciated properties, which eliminate differences arising from investment and disposition decisions. This allows for comparability of operating performance of the Company’s properties period over period and also against the results of other equity REITs in the same sectors. Additionally, by excluding corporate level expenses or benefits such as interest expense, any gain or loss on early extinguishment of debt and income taxes, which are incurred by the parent entity and are not directly linked to the operating performance of the Company’s properties, NOI provides a measure of operating performance independent of the Company’s capital structure and indebtedness. However, the exclusion of these items as well as others, such as capital expenditures and leasing costs, which are necessary to maintain the operating performance of the Company’s properties, and transaction costs and administrative costs, may limit the usefulness of NOI. NOI may fail to capture significant trends in these components of U.S. GAAP net income (loss) which further limits its usefulness.
NOI should not be considered as an alternative to net income (loss), determined in accordance with U.S. GAAP, as an indicator of operating performance. In addition, the Company’s methodology for calculating NOI involves subjective judgment and discretion and may differ from the methodologies used by other comparable companies, including other REITs, when calculating the same or similar supplemental financial measures and may not be comparable with other companies.
(FINANCIAL TABLES FOLLOW)
6
| ||||||||
CONSOLIDATED BALANCE SHEETS
(In thousands, except per share data)
| March 31, 2021 | December 31, 2020 | |||||||||||||
| (unaudited) | ||||||||||||||
Assets | ||||||||||||||
Cash and cash equivalents | $ | 788,361 | $ | 703,544 | ||||||||||
Restricted cash | 125,959 | 114,952 | ||||||||||||
Real estate, net | 7,702,711 | 7,809,964 | ||||||||||||
| Loans receivable | 85,272 | 84,030 | ||||||||||||
| Equity and debt investments | 777,819 | 876,703 | ||||||||||||
Goodwill | 761,368 | 761,368 | ||||||||||||
Deferred leasing costs and intangible assets, net | 1,392,528 | 1,467,725 | ||||||||||||
| Assets held for disposition | 4,094,657 | 7,426,268 | ||||||||||||
| Other assets | 834,318 | 886,817 | ||||||||||||
Due from affiliates | 62,257 | 69,189 | ||||||||||||
Total assets | $ | 16,625,250 | $ | 20,200,560 | ||||||||||
Liabilities | ||||||||||||||
| Debt, net | $ | 6,877,291 | $ | 6,872,350 | ||||||||||
| Accrued and other liabilities | 1,036,218 | 1,193,601 | ||||||||||||
Intangible liabilities, net | 89,915 | 93,852 | ||||||||||||
| Liabilities related to assets held for disposition | 1,936,643 | 4,731,772 | ||||||||||||
| Due to affiliates | 408 | 601 | ||||||||||||
Dividends and distributions payable | 18,516 | 18,516 | ||||||||||||
Total liabilities | 9,958,991 | 12,910,692 | ||||||||||||
| Commitments and contingencies | ||||||||||||||
Redeemable noncontrolling interests | 315,922 | 305,278 | ||||||||||||
Equity | ||||||||||||||
Stockholders’ equity: | ||||||||||||||
| Preferred stock, $0.01 par value per share; $1,033,750 liquidation preference; 250,000 shares authorized; 41,350 shares issued and outstanding | 999,490 | 999,490 | ||||||||||||
| Common stock, $0.01 par value per share | ||||||||||||||
| Class A, 949,000 shares authorized; 487,103 and 483,406 shares issued and outstanding, respectively | 4,871 | 4,834 | ||||||||||||
| Class B, 1,000 shares authorized; 734 shares issued and outstanding | 7 | 7 | ||||||||||||
Additional paid-in capital | 7,576,873 | 7,570,473 | ||||||||||||
Accumulated deficit | (6,460,262) | (6,195,456) | ||||||||||||
Accumulated other comprehensive income | 101,056 | 122,123 | ||||||||||||
Total stockholders’ equity | 2,222,035 | 2,501,471 | ||||||||||||
Noncontrolling interests in investment entities | 4,003,905 | 4,327,372 | ||||||||||||
Noncontrolling interests in Operating Company | 124,397 | 155,747 | ||||||||||||
Total equity | 6,350,337 | 6,984,590 | ||||||||||||
Total liabilities, redeemable noncontrolling interests and equity | $ | 16,625,250 | $ | 20,200,560 | ||||||||||
7
| ||||||||
CONSOLIDATED STATEMENTS OF OPERATIONS
(In thousands, except per share data)
| Three Months Ended March 31, | |||||||||||||||||
| 2021 | 2020 | ||||||||||||||||
| (unaudited) | |||||||||||||||||
| Revenues | |||||||||||||||||
| Property operating income | $ | 275,216 | $ | 183,953 | |||||||||||||
| Interest income | 2,676 | 2,607 | |||||||||||||||
| Fee income | 33,679 | 25,128 | |||||||||||||||
| Other income | 4,133 | 5,525 | |||||||||||||||
| Total revenues | 315,704 | 217,213 | |||||||||||||||
| Expenses | |||||||||||||||||
| Property operating expense | 132,264 | 83,477 | |||||||||||||||
| Interest expense | 72,485 | 63,441 | |||||||||||||||
| Investment and servicing expense | 8,108 | 5,732 | |||||||||||||||
| Transaction costs | 2,685 | 596 | |||||||||||||||
| Depreciation and amortization | 170,967 | 76,236 | |||||||||||||||
| Impairment loss | 15,232 | 48,532 | |||||||||||||||
| Compensation expense | |||||||||||||||||
| Cash and equity-based compensation | 83,419 | 42,737 | |||||||||||||||
| Carried interest and incentive fee compensation | (33) | — | |||||||||||||||
| Administrative expenses | 18,957 | 29,558 | |||||||||||||||
| Settlement loss | — | 5,090 | |||||||||||||||
| Total expenses | 504,084 | 355,399 | |||||||||||||||
| Other income (loss) | |||||||||||||||||
| Other gain (loss), net | (8,714) | (9,703) | |||||||||||||||
| Equity method earnings (losses) | (18,686) | (11,879) | |||||||||||||||
| Equity method earnings (losses) - carried interest | (222) | — | |||||||||||||||
| Income (loss) before income taxes | (216,002) | (159,768) | |||||||||||||||
| Income tax benefit (expense) | 25,825 | 5,569 | |||||||||||||||
| Income (loss) from continuing operations | (190,177) | (154,199) | |||||||||||||||
| Income (loss) from discontinued operations | (437,422) | (249,858) | |||||||||||||||
| Net income (loss) | (627,599) | (404,057) | |||||||||||||||
| Net income (loss) attributable to noncontrolling interests: | |||||||||||||||||
| Redeemable noncontrolling interests | 2,449 | (548) | |||||||||||||||
| Investment entities | (355,862) | (21,749) | |||||||||||||||
| Operating Company | (27,896) | (39,601) | |||||||||||||||
| Net income (loss) attributable to Colony Capital, Inc. | (246,290) | (342,159) | |||||||||||||||
| Preferred stock dividends | 18,516 | 19,474 | |||||||||||||||
| Net income (loss) attributable to common stockholders | $ | (264,806) | $ | (361,633) | |||||||||||||
| Loss per share—basic | |||||||||||||||||
| Loss from continuing operations per share—basic | $ | (0.30) | $ | (0.28) | |||||||||||||
| Net loss attributable to common stockholders per share—basic | $ | (0.56) | $ | (0.76) | |||||||||||||
| Loss per share—diluted | |||||||||||||||||
| Loss from continuing operations per share—diluted | $ | (0.30) | $ | (0.28) | |||||||||||||
| Net loss attributable to common stockholders per share—diluted | $ | (0.56) | $ | (0.76) | |||||||||||||
| Weighted average number of shares | |||||||||||||||||
| Basic | 474,899 | 479,106 | |||||||||||||||
| Diluted | 474,899 | 479,106 | |||||||||||||||
8
| ||||||||
FUNDS FROM OPERATIONS AND CORE FUNDS FROM OPERATIONS
(In thousands, except per share data, unaudited)
| Three Months Ended | ||||||||||||||
| March 31, 2021 | March 31, 2020 | |||||||||||||
| Net loss attributable to common stockholders | $ | (264,806) | $ | (361,633) | ||||||||||
| Adjustments for FFO attributable to common interests in Operating Company and common stockholders: | ||||||||||||||
| Net loss attributable to noncontrolling common interests in Operating Company | (27,896) | (39,601) | ||||||||||||
| Real estate depreciation and amortization | 184,762 | 130,523 | ||||||||||||
| Impairment of real estate | 106,077 | 308,268 | ||||||||||||
| Loss (gain) from sales of real estate | (38,102) | (7,933) | ||||||||||||
| Less: Adjustments attributable to noncontrolling interests in investment entities | (188,496) | (82,329) | ||||||||||||
| FFO attributable to common interests in Operating Company and common stockholders | (228,461) | (52,705) | ||||||||||||
| Additional adjustments for Core FFO attributable to common interests in Operating Company and common stockholders: | ||||||||||||||
| Adjustment to CLNC cash dividend | 55,648 | 42,112 | ||||||||||||
| Equity-based compensation expense | 19,299 | 8,732 | ||||||||||||
| Straight-line rent revenue and expense | 17,225 | (2,025) | ||||||||||||
| Amortization of acquired above- and below-market lease values, net | 6,005 | (3,519) | ||||||||||||
| Debt prepayment penalties and amortization of deferred financing costs and debt premiums and discounts | 45,627 | 15,049 | ||||||||||||
| Non-real estate fixed asset depreciation, amortization and impairment | 20,563 | 92,230 | ||||||||||||
Restructuring and transaction-related charges(1) | 34,482 | 15,568 | ||||||||||||
| Non-real estate (gains) losses, excluding realized gains or losses within the Digital Other segment | 267,812 | (117,739) | ||||||||||||
| Net unrealized carried interest | 189 | 9,230 | ||||||||||||
| Deferred taxes and tax effect on certain of the foregoing adjustments | (34,480) | (2,927) | ||||||||||||
| Less: Adjustments attributable to noncontrolling interests in investment entities | (217,706) | 3,786 | ||||||||||||
| Less: Core FFO from discontinued operations | 17,854 | (19,856) | ||||||||||||
| Core FFO attributable to common interests in Operating Company and common stockholders | $ | 4,057 | $ | (12,064) | ||||||||||
Core FFO per common share / common OP unit(2) | $ | 0.01 | $ | (0.02) | ||||||||||
Core FFO per common share / common OP unit—diluted(2)(3)(4) | $ | 0.01 | $ | (0.02) | ||||||||||
Weighted average number of common OP units outstanding used for Core FFO per common share and OP unit(2) | 537,033 | 540,441 | ||||||||||||
Weighted average number of common OP units outstanding used for Core FFO per common share and OP unit—diluted (2)(3)(4) | 555,141 | 540,441 | ||||||||||||
__________
(1) Transaction-related costs primarily represent costs and charges incurred as a result of corporate restructuring and reorganization to implement the digital evolution. These costs and charges include severance, retention, relocation, transition, shareholder settlement and other related restructuring costs, which are not reflective of the Company’s core operating performance.
(2) Calculated based on weighted average shares outstanding including participating securities and assuming the exchange of all common OP units outstanding for common shares.
(3) For the three ended March 31, 2021 and March 31, 2020, excluded from the calculations of diluted Core FFO per share is the effect of adding back interest expense associated with convertible senior notes and weighted average dilutive common share equivalents for the assumed conversion of the convertible senior notes as the effect of including such interest expense and common share equivalents would be antidilutive.
(4) For the three months ended March 31, 2021, included in the calculation of diluted Core FFO per share are 18.1 million weighted average performance stock units, performance based restricted stock units and Wafra’s warrants, of which the issuance and/or vesting are subject to the performance of the Company's stock price or the achievement of certain Company specific metrics.
9
| ||||||||
ADJUSTED EBITDA
(In thousands, unaudited)
| Three Months Ended March 31, 2021 | |||||
| Core FFO attributable to common interests in Operating Company and common stockholders | $ | 4,057 | |||
| Adjustments: | |||||
| Less: Earnings of equity method investments | (4,794) | ||||
| Plus: Preferred dividends | 18,516 | ||||
| Plus: Core interest expense | 34,351 | ||||
| Plus: Core tax expense | 2,048 | ||||
| Plus: Non pro-rata allocation of income (loss) to NCI | 1,415 | ||||
| Plus: Placement fees | 40 | ||||
| Digital Operating installation services, restructuring, integration, and transaction costs | 499 | ||||
| Adjusted EBITDA (CLNY OP Share) | $ | 56,132 | |||
RECONCILIATION OF NET INCOME (LOSS) TO DIGITAL OPERATING ADJUSTED EBITDA
| (In thousands) | Three Months Ended March 31, 2021 | ||||
| Net income (loss) from continuing operations (Digital Operating) | $ | (62,844) | |||
| Adjustments: | |||||
| Interest expense | 31,133 | ||||
| Income tax (benefit) expense | (12,269) | ||||
| Depreciation and amortization | 122,220 | ||||
| Other (gain) loss | 4 | ||||
| EBITDAre: | 78,244 | ||||
| Straight-line rent expenses and amortization of above- and below-market lease intangibles | (399) | ||||
| Compensation expense—equity-based | 308 | ||||
| Installation services | 880 | ||||
| Transaction, restructuring & integration costs | 1,767 | ||||
| Adjusted EBITDA: | $ | 80,800 | |||
| CLNY ownership | 17.9 | % | |||
| CLNY OP Share of Adjusted EBITDA: | $ | 14,440 | |||
The following table summarizes first quarter 2021 net income (loss) from continuing operations by segment:
| (In thousands) | Net Income (Loss) from Continuing Operations | ||||||||||
| Digital Investment Management | $ | 6,041 | |||||||||
| Digital Operating | (62,844) | ||||||||||
| Digital Other | 7,869 | ||||||||||
| Wellness Infrastructure | (41,210) | ||||||||||
| Other | (32,218) | ||||||||||
| Amounts Not Allocated to Segments | (67,815) | ||||||||||
| Total Consolidated | $ | (190,177) | |||||||||
10
| ||||||||
RECONCILIATION OF NET INCOME (LOSS) TO FRE
| (In thousands) | Three Months Ended March 31, 2021 | ||||
| Net income (loss) | 6,041 | ||||
| Adjustments: | |||||
| Interest income | (1) | ||||
| Fee income eliminated in the Company's consolidated Statement of Operations | 1,622 | ||||
| Investment and servicing expense | 32 | ||||
| Depreciation and amortization | 8,912 | ||||
| Compensation expense—equity-based | 1,533 | ||||
| Compensation expense—carried interest and incentive | (33) | ||||
| Administrative expenses—straight-line rent | (2) | ||||
| Administrative expenses—placement agent fee | 59 | ||||
| Equity method (earnings) losses | 195 | ||||
| Other (gain) loss, net | (165) | ||||
| Income tax (benefit) expense | 7 | ||||
FRE(1) | $ | 18,200 | |||
__________
(1) Includes a $2.7 million benefit from the unused portion of a one-time fourth quarter 2020 outperformance incentive expense.
11